


![Photosynthesis of oak trees [Quercus petraea (Matt.) Liebl.] during drought under field conditions: diurnal course of net CO2 assimilation and photochemical efficiency of photosystem](https://static.fdokumen.com/doc/165x107/6333bd5b7a687b71aa085ad1/photosynthesis-of-oak-trees-quercus-petraea-matt-liebl-during-drought-under.jpg)

Bahasa
Halaman
Hukum


Community Ecology
The effects of stand characteristics on the understorey vegetation in Quercus petraeaand Q. cerris dominated forests
--Manuscript Draft--
Manuscript Number:
Full Title: The effects of stand characteristics on the understorey vegetation in Quercus petraeaand Q. cerris dominated forests
Short Title: Understorey assemblages in oak forests
Article Type: Original Article
Keywords: forest herbs; seedlings; stand structure; regeneration; oak forests
Corresponding Author: Réka ÁdámMTA Centre for Ecological ResearchVácrátót, HUNGARY
Corresponding Author SecondaryInformation:
Corresponding Author's Institution: MTA Centre for Ecological Research
Corresponding Author's SecondaryInstitution:
First Author: Réka Ádám
First Author Secondary Information:
Order of Authors: Réka Ádám
Péter Ódor, PhD
János Bölöni, PhD
Order of Authors Secondary Information:
Abstract: The different types of forest use significantly changed the structure and the speciescomposition of European temperate forests. Herbaceous species and seedlings areimportant parts of the forest ecosystem, thus it is necessary to understand the effect ofthe stand characteristics on the species composition of the understorey. In our studywe assessed the main factors that affect the species composition of herb and treeseedling assemblages in Quercus petraea and Quercus cerris dominated 50-150 yearold forest stands in the Bükk-mountains, Hungary. The relationships between thestudied assemblages and explanatory variables (tree species composition, standstructure, canopy closure, and topography) were explored by Redundancy Analysis(RDA).The occurrence of herbaceous species was affected by canopy closure, tree size andtopography. Acidofrequent and xeric forest herbs were related to more open standswith sparsely distributed large trees, while mesic forest species were positively relatedto stand height and western exposure. Seedlings of trees and shrubs showed adispersal limited phenomenon. The composition of seedlings was significantlyinfluenced by the ratio of the two major oak species, the density of shrub layer and treespecies diversity. Sessile oak was able to regenerate almost only in that stands whereit was dominant in the overstorey, which has a significant relevance for themanagement of the species. Generally, forest management relate factors had asignificant effect on the understorey community through the species composition andthe structure of the overstorey.
Powered by Editorial Manager® and Preprint Manager® from Aries Systems Corporation

1
The effects of stand characteristics on the understorey vegetation in Quercus petraea and Q. cerris 1
dominated forests 2
Short title: Understorey assemblages in oak forests 3
4
Réka Ádám1,2
, Péter Ódor1, János Bölöni
1 5
1MTA Centre for Ecological Research, Institute of Ecology and Botany, H-2163 Vácrátót, Alkotmány u. 2-4., 6
Hungary 7
2corresponding author, email: [email protected]; telephone number: 0628-360-122/124; fax number: 8
0628-360-110; homepage address: http://www.obki.hu/nyito/mts.shtml 9
10
11
ManuscriptClick here to download Manuscript: text_Adam Reka.doc
1 2 3 4 5 6 7 8 9 10 11 12 13 14 15 16 17 18 19 20 21 22 23 24 25 26 27 28 29 30 31 32 33 34 35 36 37 38 39 40 41 42 43 44 45 46 47 48 49 50 51 52 53 54 55 56 57 58 59 60 61 62 63 64 65

2
Abstract 12
The different types of forest use significantly changed the structure and the species composition of 13
European temperate forests. Herbaceous species and seedlings are important parts of the forest ecosystem, thus 14
it is necessary to understand the effect of the stand characteristics on the species composition of the understorey. 15
In our study we assessed the main factors that affect the species composition of herb and tree seedling 16
assemblages in Quercus petraea and Quercus cerris dominated 50-150 year old forest stands in the Bükk-17
mountains, Hungary. The relationships between the studied assemblages and explanatory variables (tree species 18
composition, stand structure, canopy closure, and topography) were explored by Redundancy Analysis (RDA). 19
The occurrence of herbaceous species was affected by canopy closure, tree size and topography. 20
Acidofrequent and xeric forest herbs were related to more open stands with sparsely distributed large trees, 21
while mesic forest species were positively related to stand height and western exposure. Seedlings of trees and 22
shrubs showed a dispersal limited phenomenon. The composition of seedlings was significantly influenced by 23
the ratio of the two major oak species, the density of shrub layer and tree species diversity. Sessile oak was able 24
to regenerate almost only in that stands where it was dominant in the overstorey, which has a significant 25
relevance for the management of the species. Generally, forest management relate factors had a significant 26
effect on the understorey community through the species composition and the structure of the overstorey. 27
28
Keywords: forest herbs, seedlings, stand structure, regeneration, oak forests 29
Abbreviations: DBH – Diameter at breast height 30
Nomenclature: Tutin et al (1964-1993) 31
32
1 2 3 4 5 6 7 8 9 10 11 12 13 14 15 16 17 18 19 20 21 22 23 24 25 26 27 28 29 30 31 32 33 34 35 36 37 38 39 40 41 42 43 44 45 46 47 48 49 50 51 52 53 54 55 56 57 58 59 60 61 62 63 64 65

3
1. Introduction 33
From the roman age, human impact is growing in the European forests (Rackham 2000, Bengtsson et al 34
2000, Szabó 2005). The different types of forest use as harvesting, coppicing, fuel and litter collecting, grazing 35
and hunting significantly changed their species composition, structure, production and dynamics (Bengtsson et 36
al 2000, Rubio et al. 1999). Species adapted to the forest environment have to face the reduction and 37
fragmentation of their habitat and an altered disturbance regime. These conditions are more favourable for 38
generalist plants with good colonization ability than for forest dwelling specialist species characterised by low 39
reproduction and dispersal capacity (Bengtsson et al 2000, Hermy et al 1999). 40
The establishment and growth of seedlings, their composition, spatial and temporal pattern creates the 41
basis of forest dynamics and regeneration. Herbaceous layer have important role in forest ecosystems as well. It 42
notably contributes to species diversity, primer production, carbon storage, nutrient supply and ecological 43
stability; it can serve as habitat and food for other organism groups (Whigham 2004). In addition, herbaceous 44
species can react to the changed environmental conditions quickly, hereby they can be potential ecological 45
indicators (von Oheimb & Härdtle 2009, Standovár et al 2006). It is essential to understand the factors that 46
affect the species composition of the understorey assemblages (including herbs and seedlings). 47
The most important factors that affect directly the understorey vegetation are soil properties (such as 48
bedrock type, pH, nutrient content, soil moisture), the amount and pattern of light and propagule availabilty. The 49
shrub layer and the overstorey of forests have great impact on these stand characteristics (Van Calster et al 2008, 50
Rogers et al 2008). Tree species of the overstory serve as propagule source for the seedlings; the density and 51
structure of the canopy determine the light availability for the understorey (Barbier et al 2008, Barkman 1992, 52
Horn 1971, Tinya et al 2009). Finally the quality and quantity of litter affect the soil moisture, temperature, pH 53
and C:N ratio (Sharpe et al 1996, Graae & Heskjaer 1997). Different types of disturbances change the structure 54
and species composition of the vegetation layers both in direct and indirect ways. Several studies discussed the 55
impact of the disturbances such as forest management (Brunet et al 1996, Van Calster et al 2008, Decocq et al. 56
2004, 2005, von Oheimb & Härdtl 2009) and overhold game stock (Chytrý & Danihelka 1993, Kramer et al 57
2006, Rooney & Waller 2003) on the diversity of understorey. 58
In our paper we would like to explore the relationships between forest stands (tree species composition, 59
stand structure, topography) and the species composition of herbaceous and seedling assemblages. This study 60
tries to ascertain the most important factors influencing the composition of the understory. The relationship 61
between the overstorey and the understorey is better revealed in mesic forests (Burrascano et al 2011, Graae and 62
1 2 3 4 5 6 7 8 9 10 11 12 13 14 15 16 17 18 19 20 21 22 23 24 25 26 27 28 29 30 31 32 33 34 35 36 37 38 39 40 41 42 43 44 45 46 47 48 49 50 51 52 53 54 55 56 57 58 59 60 61 62 63 64 65

4
Heskajer 1997, Hardtle et al. 2003, Kelemen et al. 2012, Standovár et al. 2006), while in case of dry oak 63
dominated forests our knowledge is more incomplete. 64
65
2. Methods 66
2.1. Study area 67
The study was carried out in the southern part of the Bükk mountain range, in Hungary, on elevation 300 68
m – 600 m. In the oak dominated area of the Bükk mountain the average annual precipitation is 600-700 mm, 69
the average annual mean temperature is 8.5˚C (Mersich et al 2002), in January from -4.1 ˚C to -3.4˚C, while in 70
July from 17.7˚C to 19.2˚C (Mersich et al. 2002). In the studied area the bedrock is mainly limestone, but 71
dolomite, loess and sandstone also occur. The main soil types are brown forest soil and rendzina. 72
Pannonian-Balkanic turkey oak – sessile oak forests (91M0, Council 1992) dominated by Q. cerris and Q. 73
petraea create a climatic forest zone in Hungary between 200-600 m a.s.l. This forest type covers 120 000 ha in 74
Hungary, which is circa 6% of the forest cover (Bölöni et al 2008). Beside the two dominant oak species Acer 75
campestre, Sorbus torminalis and Fraxinus excelsior can occur with higher ratio, while Quercus pubescens and 76
Carpinus betulus are less frequent associate tree species. In the well developed shrub layer common species are 77
Cornus mas, Crataegus monogyna, Ligustrum vulgare, Prunus spinosa, Rosa canina s.l. and Acer campestre. 78
The presence of light-demanding and drought tolerant forest species are typical in the species-rich understorey. 79
Sedges (Carex michelii, C. montana, C. muricata) and grasses (Brachypodium sylvaticum, Dactylis glomerata, 80
Festuca heterophylla, Melica uniflora, Poa nemoralis) dominate the herb layer. The frequent herbs of the 81
understory are Tanacetum corymbosum, Campanula spp. Clinopodium vulgare, Galium schultesii, Geum 82
urbanum, Hieracium spp., Lathyrus spp., Symphytum tuberosum, Trifolium spp., Vicia spp. and Vincetoxicum 83
officinale. Quercus cerris and Quercus petraea dominated forests can be found on various bedrocks, on neutral, 84
or slightly acidic soil. In the past, these forests have been used intensely for grazing, masting and firewood 85
production (Kotroczó et al 2007), the main silvicultural system was coppicing in them. Nowdays they are high 86
forests managed by uniform shelterwood main silvicultural system with a 80-90 year long rotation period. 87
88
2. 2. Sampling 89
31 forest stands (compartments of forest management) were selected from the Database of Hungarian 90
Forest Stands (ÁESZ 2008) using stratified random sampling. The selected stands represented the same region, 91
forest type and elevation range. The selection was based on the age of the dominant tree layer, which was more 92
1 2 3 4 5 6 7 8 9 10 11 12 13 14 15 16 17 18 19 20 21 22 23 24 25 26 27 28 29 30 31 32 33 34 35 36 37 38 39 40 41 42 43 44 45 46 47 48 49 50 51 52 53 54 55 56 57 58 59 60 61 62 63 64 65

5
or less evenly distributed between 48 and 150 yr. Young (below 80 yr) and mature (80-120 yr) stands are 93
intensively managed by shelterwood management, while overmature (dominant layer older than 120 yr, not 94
managed for 40 yr) stands are abandoned forests for conservation purposes, they belong to forest reserves 95
(Kecskés-Galya Forest Reserve, Vár-hegy Forest Reserve, Horváth & Borhidi 2002, www.erdorezervatum.hu). 96
122 sampling plots were selected within the stands, their minimum distance to the roads, forest edges and other 97
plots was 40 m. The different forest age categories (young, mature, overmature) were evenly represented by the 98
plots. 99
The vegetation was sampled in four layers: (1) overstorey - trees larger than 5 cm in DBH (diameter at 100
breast height); (2) high shrub layer - woody plants higher than 130 cm, DBH smaller than 5 cm; (3) low shrub 101
layer - woody plants between 50 cm and 130 cm height; (4) understorey layer – woody plants (seedlings) lower 102
than 50 cm height and herbaceous species. The understorey layer was surveyed from June to August 2009, the 103
two shrub layers and the overstorey in the spring and autumn of 2009. The sampling design of the different 104
layers is shown on Fig. 1. The study of the overstorey was carried out in the whole circular sampling plots, 105
each is 500 m2 in size. For each tree the following variables were recorded: species, perimeter and physical 106
state (using healthy, stem damaged, crown damaged, stem and crown damaged and dead tree categories). In 107
case of each tree we recorded if its crown reaches the average canopy height (dominant tree) or it is lower 108
(suppressed tree). The volume of logs was estimated by line-intercept method using three 12.6 m long lines, 109
starting from the centre of the sampling plots to three directions (0, 120 and 240 degree, Stahl et al 2001, 110
Warren & Olsen 1964, van Wagner 1968). The canopy closure was measured by a spherical densiometer, at 111
5.6 m from the centre of the plot in the cardinal directions, face to north, east, south and west (Lemmon 1956). 112
We measured the height of 1-3 trees per sampling plots using Haglöf Vertex III height and distance meter, and 113
we noted down the exposure and slope at each sampling plot. In case of shrub layers, we counted the 114
individuals (abundance) of species (when we couldn’t determine the individuals accurately we counted the 115
main shoots). The low shrub layer were studied in four circular subplots, each were 7 m2 in size, to 5.6 m from 116
the centre, to the cardinal directions. In case of the high shrub layer one 100 m2 sized circular subplot was 117
studied in each sampling plot. Understorey layer was surveyed in 28 0.5 m2 sized circular subplots in each plot, 118
which were systematically arranged along 3 circles (with 4 m, 7 m and 11 m radius). Presence/absence of herb 119
and seedling species was recorded in all subplots. For species names, we followed the nomenclature of Tutin et 120
al (1964-1993). During the analysis the name of the species was abbreviated using the first three letters of the 121
genus and the species names (App. 1, 2). 122
1 2 3 4 5 6 7 8 9 10 11 12 13 14 15 16 17 18 19 20 21 22 23 24 25 26 27 28 29 30 31 32 33 34 35 36 37 38 39 40 41 42 43 44 45 46 47 48 49 50 51 52 53 54 55 56 57 58 59 60 61 62 63 64 65

6
123
2.3. Data analysis 124
The relationships between explanatory variables and studied assemblages were explored by Redundancy 125
Analysis; Principal Component Analysis and Detrended Correspondence Analyses were used as preliminary 126
analysis (Podani 2000, Ter Braak & Smilauer 2002). Herb and seedling assemblages were analysed separately, 127
the importance of species were expressed by their local frequency values. Rare (low frequent) species were 128
eliminated from the multivariate analyses, the frequency limit was 21 (17%) for herbs and 13 (11%) for 129
seedlings, therefore the analysis comprised 51 herbaceous and 22 seedling species. Table 1 describes the 130
derived explanatory variables based on the field survey. Before the analyses the collinearity of explanatory 131
variables were tested, highly correlated variables were excluded from the analysis. During the Redundancy 132
Analysis manual forward selection were used on the potential explanatory variables. The significances of their 133
conditional effects were tested by F statistics via Monta Carlo simulations with 1000 permutations, the limiting 134
p values were 0.05. After the selection procedure the significance of all canonical axes were tested by similar 135
way (Ter Braak and Smilauer 2002). Multivariate analyses were carried out with Canoco 4.5 program (Ter 136
Braak & Smilauer 2002). 137
138
3. Results 139
183 herbaceous and 31 seedling species were recorded in the understorey during the survey. The average 140
number of herbaceous species was 29 per plot, the minimum 7, the maximum was 56 species. In case of 141
seedlings the average number of species was 10, the minimum 2 and the maximum was 17 species. The most 142
frequent herbaceous species were Dactylis glomerata, Melica uniflora, Clinopodium vulgare, Galium schultesii, 143
Fragaria vesca, Geum urbanum, Veronica chamaedrys, Poa nemoralis, and Viola odorata (App. 1). The most 144
frequent seedling species were Acer campestre, Quercus cerris, Rosa canina, Cornus mas, Fraxinus excelsior 145
and Ligustrum vulgare (App. 2). 146
In both shrub layers the most frequent species were Ligustrum vulgare, Cornus mas, Rosa canina, Acer 147
campestre and Crataegus monogyna. The average low shrub density was approximately 12000 stems per 148
hectare, we recorded 0 stem in the least and 59000 stems in the densest plots. In case of the high shrub layer the 149
minimum was 0 as well, the average shrub density was approximately 2000 and the maximum was 8100 stems 150
per hectare (Table 1). 151
1 2 3 4 5 6 7 8 9 10 11 12 13 14 15 16 17 18 19 20 21 22 23 24 25 26 27 28 29 30 31 32 33 34 35 36 37 38 39 40 41 42 43 44 45 46 47 48 49 50 51 52 53 54 55 56 57 58 59 60 61 62 63 64 65

7
The dominant species of the overstorey were Quercus cerris and Quercus petraea, while the most frequent 152
associate tree species were Acer campestre, Sorbus torminalis, Quercus pubescens, Fraxinus excelsior and 153
Carpinus betulus. Average tree density was approximately 600 stems per hectare, and it varied between 125 and 154
2480 stems per hectare, while the stand height changed between 13 and 27 m, with a 21 m average value (Table 155
1). 156
157
3.1. Seedling species 158
The variance explained by the four axes of the Principal Component Analysis was 74.1 %, based on the 159
analysis the samples didn’t create groups. The length of the gradient of the Detrended Correspondence Analyses 160
was between 2 and 3 standard deviation unit. The variance covered by all of canonical axes of the Redundancy 161
Analysis was 43.2 % (the explained variance of the first four axes were 15.6 %, 11.7 %, 9.6 % and 3.4 %, 162
respectively). 163
Based on the Redundancy Analysis, the most important factors that affect the occurrence of the seedling 164
species were the high and low shrub density, the turkey/sessile oak ratio, the mean DBH of trees and the tree 165
species diversity (Table 2). Most of the seedling species (Crataegus monogyna, Cornus mas) - including 166
Quercus cerris - can be found in Quercus cerris dominated stands with high low and high shrub density (Fig. 167
2). The occurrence of Ligustrum vulgare seedlings was mostly correlated with the high shrub and low shrub 168
density, while Prunus spinosa seedlings preferred stands with diverse shrub layer, dense high shrub layer and 169
northern exposure. The seedlings of the two most frequent associate tree species – Acer campestre and Fraxinus 170
excelsior – preferred stands with high tree diversity, heterogeneous stand structure and southern exposure. 171
Sessile oak seedlings preferred Quercus petraea dominated stands with relatively large tree size, homogeneous 172
stand structure and low tree diversity.. 173
174
3.2. Herbaceous species 175
In case of herbaceous species the four axes of the Principal Component Analysis covered the 59.6 % of the 176
variance and the sampling units didn’t create groups as well. The length of the gradient of the Detrended 177
Correspondence Analyses was between 2 and 3 standard deviation unit. The explained variance of all canonical 178
RDA axes was 35.9 % (the variance covered by the first four axes were 19.5 %, 7.8 %, 2.6 % and 1.7 %, 179
respectively). The most important factors that affect the occurrence of herbaceous species were the average 180
1 2 3 4 5 6 7 8 9 10 11 12 13 14 15 16 17 18 19 20 21 22 23 24 25 26 27 28 29 30 31 32 33 34 35 36 37 38 39 40 41 42 43 44 45 46 47 48 49 50 51 52 53 54 55 56 57 58 59 60 61 62 63 64 65

8
DBH of all the trees, and the dominant trees, the deviation from east, the openness of the canopy, and the height 181
of the overstorey. (Table 3, Fig. 3). 182
Herbaceous species preferring dry oak forests and acidic forest sites were located on the positive side of 183
the first axis. They preferred stands, where the canopy was relatively open, mean DBH was large and the shrub 184
layer was slightly developed. For mesic and general forest species the second axis was determinant, they 185
correlated positively with it. These species preferred higher stands, where the average diameter of the dominant 186
trees is larger with well developed low shrub layer and western exposure. 187
188
4. Discussion 189
4.1. Seedling species 190
The occurrence of the seedling species was defined by the characteristics of the shrub layer and the species 191
composition and structure of the overstorey. Kirby (1988) also found that the change of the understorey is 192
mainly affected by the change of tree species composition and age structure. 193
Tree species composition is very important stand characteristic for Quercus petraea seedlings. Quercus 194
petraea seedlings can be found at those sampling points, where the tree species diversity and the Quercus cerris 195
ratio are both low, thus Quercus petraea dominates the overstorey. One explanation can be that Quercus petraea 196
seedlings can regenerate mainly in the proximity of the parent plants. This observation can be useful for forest 197
management, because the natural regeneration of this important species is often problematic. An other 198
explanation could be that the stressful conditions of these stands are more favourable to Quercus petraea 199
seedlings than to other species. Sessile oak dominated stands had lower tree density, the soil is shallow and 200
acidic. The pH of the soil and the amount of light reaching the understorey notably define the species 201
composition of the seedlings according to several researchers. The low nutrient content of the soil favour the 202
stress-tolerant species (Dzwonko & Gawroński 2002). Slightly successful regeneration of light-demanding oak 203
species was found in more closed stands, generating a realignment of tree species composition (von Oheimb & 204
Brunet 2007, Tinya et al 2009). In closed stands reduced Quercus robur regeneration was described by von 205
Oheimb & Brunet (2007), while Schumann et al (2003) shown stronger Quercus rubra regeneration in gaps. 206
According to Rogers et al (2008) the ratio of Quercus species (Q. rubra, Q. velutina, Q. alba) in the overstorey 207
decreased in the long run because of the closed canopy. 208
Quercus cerris – like several shrub species in this study – prefers less acidic, calcareous soil (Gencsi & 209
Vancsura 1992). Therefore it is understandable that Quercus cerris seedlings occur in stands with dense shrub 210
1 2 3 4 5 6 7 8 9 10 11 12 13 14 15 16 17 18 19 20 21 22 23 24 25 26 27 28 29 30 31 32 33 34 35 36 37 38 39 40 41 42 43 44 45 46 47 48 49 50 51 52 53 54 55 56 57 58 59 60 61 62 63 64 65

9
layer because of the similar habitat preference. The other important stand characteristic was the Quercus cerris 211
ratio of the overstorey, indicating the dispersal limitation for the regeneration of this oak species. 212
The seedlings of the two most frequent associate tree species –field maple (Acer campestre), and European 213
ash (Fraxinus excelsior) – can be found at those sampling plots, where tree species diversity is relatively high. 214
This phenomenon also indicates spatial limitation of propagules, because high tree species diversity is related to 215
their high proportion in the overstorey. It is controversial to the general expectations that for these anemochore 216
trees the regeneration is not related to the proximity of the parent plants. However, Hermy et al (1999) 217
concluded that dispersal is often a limiting factor for the establishment of anemochore forest species. 218
The seedlings of frequent shrub species were present in stands with high shrub density (at least in one of 219
the shrub layers). Most of them are not anemochore, thus it is understandable that propagule source was one of 220
the most important variable in case of their regeneration. Dense shrub layers were the most important stand 221
characteristics in case of Ligustrum vulgare seedlings. This clonal shrub can tolerate better the shaded 222
conditions under the closed shrub layer than light demanding herbs and seedlings. The species composition of 223
the overstorey had important impact on the species composition of seedlings of the shrub species as well. 224
Crataegus monogyna, Cornus mas and Ligustrum vulgare seedlings preferred stands where Quercus cerris 225
dominated the overstorey. Probably the characteristics of the soil and the type of the bedrock could cause the 226
observed oak ratio, and the occurrence of shrub seedlings. 227
Prunus spinosa seedlings – unlike the other three frequent shrub species – didn’t prefer the Quercus cerris 228
dominated areas with dense shrub layer. They occurred in stands where the stand structure was homogenous, the 229
stem density was low and Quercus petraea dominated the overstorey. Since Prunus spinosa is basically a light-230
demanding forest edge species it is fairly understandable that it preferred more open stands. 231
232
4.2. Herbaceous species 233
The close relation between the overstorey and understorey is basically accepted (Barbier et al 2008, 234
Tobisch & Standovár 2005). In our study acidofrequent plants (Hieracium laevigatum, Silene nutans etc.), and 235
species typical of xeric oak forests (Poa nemoralis, Clinopodium vulgare, Campanula persicifolia ect.) (Chytrý 236
& Tichý 2003) preferred the same stands. They occurred in stands, where shrub layers were scantly developed, 237
the canopy closure was low and mean DBH was relatively large. It seems that light availability is the most 238
influential factor for the occurrence and cover of this xeric forest species. The relation between the amount of 239
light reaching the herbs and seedlings and the species composition of the understorey is partly revealed. Based 240
1 2 3 4 5 6 7 8 9 10 11 12 13 14 15 16 17 18 19 20 21 22 23 24 25 26 27 28 29 30 31 32 33 34 35 36 37 38 39 40 41 42 43 44 45 46 47 48 49 50 51 52 53 54 55 56 57 58 59 60 61 62 63 64 65
10
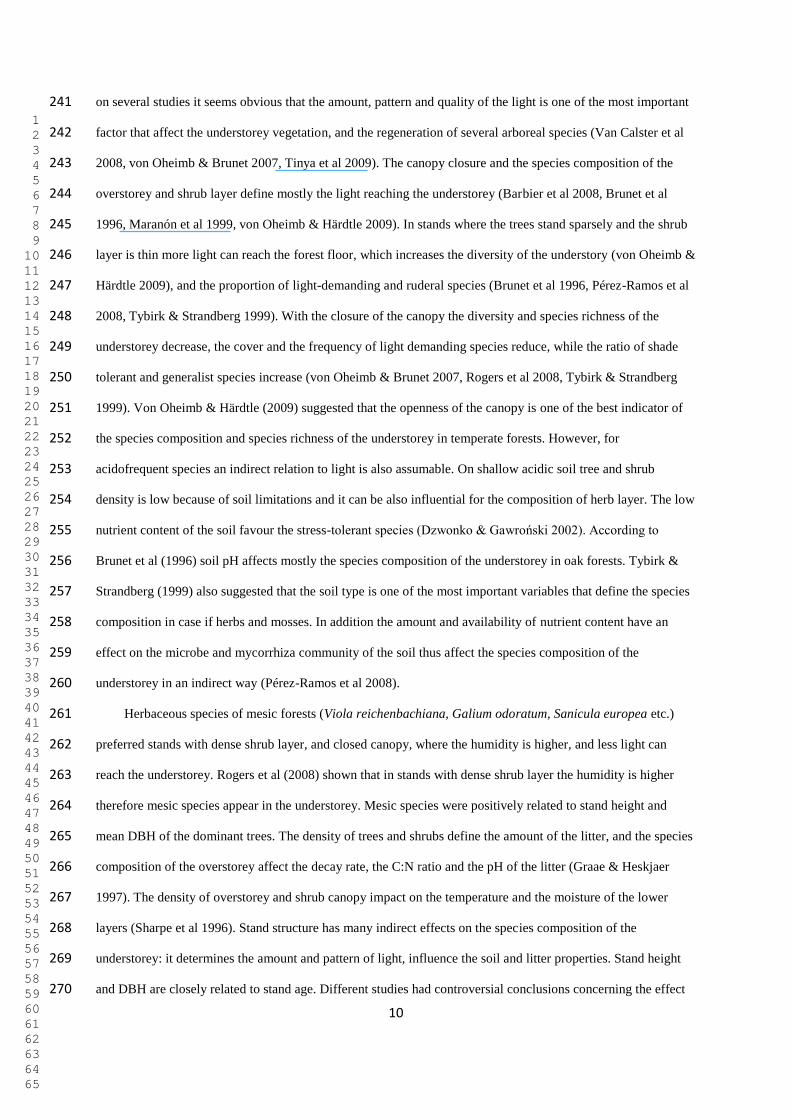
on several studies it seems obvious that the amount, pattern and quality of the light is one of the most important 241
factor that affect the understorey vegetation, and the regeneration of several arboreal species (Van Calster et al 242
2008, von Oheimb & Brunet 2007, Tinya et al 2009). The canopy closure and the species composition of the 243
overstorey and shrub layer define mostly the light reaching the understorey (Barbier et al 2008, Brunet et al 244
1996, Maranón et al 1999, von Oheimb & Härdtle 2009). In stands where the trees stand sparsely and the shrub 245
layer is thin more light can reach the forest floor, which increases the diversity of the understory (von Oheimb & 246
Härdtle 2009), and the proportion of light-demanding and ruderal species (Brunet et al 1996, Pérez-Ramos et al 247
2008, Tybirk & Strandberg 1999). With the closure of the canopy the diversity and species richness of the 248
understorey decrease, the cover and the frequency of light demanding species reduce, while the ratio of shade 249
tolerant and generalist species increase (von Oheimb & Brunet 2007, Rogers et al 2008, Tybirk & Strandberg 250
1999). Von Oheimb & Härdtle (2009) suggested that the openness of the canopy is one of the best indicator of 251
the species composition and species richness of the understorey in temperate forests. However, for 252
acidofrequent species an indirect relation to light is also assumable. On shallow acidic soil tree and shrub 253
density is low because of soil limitations and it can be also influential for the composition of herb layer. The low 254
nutrient content of the soil favour the stress-tolerant species (Dzwonko & Gawroński 2002). According to 255
Brunet et al (1996) soil pH affects mostly the species composition of the understorey in oak forests. Tybirk & 256
Strandberg (1999) also suggested that the soil type is one of the most important variables that define the species 257
composition in case if herbs and mosses. In addition the amount and availability of nutrient content have an 258
effect on the microbe and mycorrhiza community of the soil thus affect the species composition of the 259
understorey in an indirect way (Pérez-Ramos et al 2008). 260
Herbaceous species of mesic forests (Viola reichenbachiana, Galium odoratum, Sanicula europea etc.) 261
preferred stands with dense shrub layer, and closed canopy, where the humidity is higher, and less light can 262
reach the understorey. Rogers et al (2008) shown that in stands with dense shrub layer the humidity is higher 263
therefore mesic species appear in the understorey. Mesic species were positively related to stand height and 264
mean DBH of the dominant trees. The density of trees and shrubs define the amount of the litter, and the species 265
composition of the overstorey affect the decay rate, the C:N ratio and the pH of the litter (Graae & Heskjaer 266
1997). The density of overstorey and shrub canopy impact on the temperature and the moisture of the lower 267
layers (Sharpe et al 1996). Stand structure has many indirect effects on the species composition of the 268
understorey: it determines the amount and pattern of light, influence the soil and litter properties. Stand height 269
and DBH are closely related to stand age. Different studies had controversial conclusions concerning the effect 270
1 2 3 4 5 6 7 8 9 10 11 12 13 14 15 16 17 18 19 20 21 22 23 24 25 26 27 28 29 30 31 32 33 34 35 36 37 38 39 40 41 42 43 44 45 46 47 48 49 50 51 52 53 54 55 56 57 58 59 60 61 62 63 64 65

11
of stand age on understorey diversity. Decocq et al (2005) found it as an influential factor for understory 271
composition, many species need long time for the recolonization of a harvested area, species diversity decreases 272
by the ageing of the forest, but the ratio of real forest species – geophytes, shade-tolerant and moisture-273
demanding species – increases. The strong effect of forest management intensity and the time since last cutting 274
on the understorey species composition were shown by Fredericksen et al (1999). In older forest stands the 275
accumulated litter increases the quality of the site, where mesic herbaceous species can find appropriate habitat. 276
Forest age was shown as influencing the chemical and structural properties of soil and consequently understorey 277
vegetation (Honnay et al 1999). Brunet et al (1996) found that the organic matter content of the soil has great 278
impact on the understorey vegetation in oak forests. Contrary, according to Graae & Heskjaer (1997) the impact 279
of the stand age on the understorey vegetation is not influential in forests between 50 and 150 years. Ford et al 280
(2000) also did not find the effect of stand age significant on the species richness, diversity and evenness of the 281
understorey. Ito et al (2004) have found that the former land use overwrites the effect of the current stand 282
structure and the microtopography. In our study exposure was an influential characteristic for herb composition, 283
mesic species preferred west facing slopes. The explanation of this phenomenon can be that rains usually come 284
from the west direction, providing a more humid microclimate for these sites. 285
286
5. Conclusion 287
Summarizing our results we conclude that different factors affect the occurrence of herbaceous and 288
seedling species. The herb species composition of the understorey was mainly defined by canopy openness, 289
stand structure and shrub layer density therefore the most important factors seem to be related to light and 290
humidity conditions. The occurrence of the seedling species was defined by the species composition of the 291
overstorey and the shrub layer, thus in case of arboreal species the proximity of propagule source has great 292
importance. This phenomenon is particularly relevant in case of Quercus petraea, because it is an important 293
species for forest management, but difficult to regenerate. Based on our study the presence of Quercus petraea 294
is not sufficient for successful regeneration, it has to be dominant in the overstorey. More detailed investigation 295
of soil conditions could considerably contribute to the overview of the studied relationships. 296
297
6. Acknowledgements 298
1 2 3 4 5 6 7 8 9 10 11 12 13 14 15 16 17 18 19 20 21 22 23 24 25 26 27 28 29 30 31 32 33 34 35 36 37 38 39 40 41 42 43 44 45 46 47 48 49 50 51 52 53 54 55 56 57 58 59 60 61 62 63 64 65

12
Many thanks to Borbála Balázs, Ferenc Horváth, Péter Jeszenszky, Katalin Mázsa, Tamás Pásti, Tamás 299
Sigmond for their great assistance in the field work. The study was supported by the Hungarian Science 300
Foundation (OTKA 105896, 79158). 301
302
1 2 3 4 5 6 7 8 9 10 11 12 13 14 15 16 17 18 19 20 21 22 23 24 25 26 27 28 29 30 31 32 33 34 35 36 37 38 39 40 41 42 43 44 45 46 47 48 49 50 51 52 53 54 55 56 57 58 59 60 61 62 63 64 65

13
7. References 303
ÁESZ (Hungarian Forest Service). 2008. Magyarország erdőállományai, 2006. Hungarian Forest Service, 304
Budapest., http://www.nebih.gov.hu/erdeszet_cd/index.htm 305
Barbier, S., F. Gosselin and P. Balandrier. 2008. Influence of tree species on understory vegetation diversity and 306
mechanisms involved – A critical review for temperate and boreal forests. Forest Ecol. Manag. 254: 1-307
15. 308
Barkmann, J. J. 1992. Canopies and microclimate of tree species mixtures. In: Cannell, M. G. R., D. C. Malcolm 309
and P. A. Robertson (eds.) The ecology of mixed-species stands of trees. Blackwell Scientific 310
Publications. Oxford, pp. 181-188. 311
Bengtsson, J., S. G. Nilsson, A. Franc and P. Menozzi. 2000. Biodiversity, disturbances, ecosystem function and 312
management of European forests. Forest Ecol. Manag. 132: 39-50. 313
Bölöni, J., Zs. Molnár, M. Biró and F. Horváth. 2008. Distribution of the (semi-) natural habitats in Hungary II. 314
Woodlands and shrublands. Acta Botanica Hungarica 50 (suppl.): 107-148. 315
Brunet, J., U. Falkengren-Grerup and G. Tyler. 1996. Herb layer vegetation of south Swedish beech and oak 316
forests – effects of management and soil acidity during one decade. Forest Ecol. Manag. 88: 259-272. 317
Burrascano, S., F. M. Sabatini and C. Blasi. 2011. Testing indicators of sustainable forest management on 318
understorey composition and diversity in southern Italy through variation partitioning. Plant Ecol. 212: 319
829-841. 320
Carey, A B., J. Kershner, B. Biswell and L. D. de Toledo. 1999. Ecological scale and forest development: 321
Squirrels, dietary fungi, and vascular plants in managed and unmanaged forests. Wildlife Monogr. 142: 5-322
71. 323
Chytrý, M. and J. Danihelka. 1993. Long-term changes in the field layer of oak and oak-hornbeam forests under 324
the impact of deer and mouflon. Folia Geobotanica et Phytotaxonomica 28: 225-245. 325
Chytrý, M. and L. Tichý. 2003. Diagnostic, constant and dominant species of vegetation classes and alliances of 326
the Czech Republic: a statistical revision. Folia Facultatis Scientiarum Naturalium Universitatis 327
Masarykianae Brunensis 108: 1-231. 328
Dahlgren, R. A., M. J. Singer and X. Huang. 1997. Oak tree and grazing impacts on soil properties and nutrients 329
in a California oak woodland. Biogeochemistry 39: 45-64. 330
1 2 3 4 5 6 7 8 9 10 11 12 13 14 15 16 17 18 19 20 21 22 23 24 25 26 27 28 29 30 31 32 33 34 35 36 37 38 39 40 41 42 43 44 45 46 47 48 49 50 51 52 53 54 55 56 57 58 59 60 61 62 63 64 65

14
Decocq, G., M. Aubert, F. Dupont, D. Alard, R. Saguez, A. Wattez-Franger, B. De Foucault, A. Deleis-331
Dusollier and J. Bardat. 2004. Plant diversity in a managed temperate deciduous forest: understorey 332
response to two silvicultural system. J. Appl. Ecol. 41: 1065-1079. 333
Decocq, G., M. Aubert, F. Dupont, J. Bardat, A. Wattez-Franger, R. Saguez, B. De Foucault, D. Alard and A. 334
Deleis-Dusollier. 2005. Silviculture-driven vegetation change in a European temperate deciduous forest. 335
Ann. Forest Sci. 62: 313-323. 336
Dzwonko, Z. and S. Gawroński. 2002. Effect of litter removal on species richness and acidification of a mixed 337
oak-pine woodland. Biol. Conserv. 106: 389-398. 338
Ford, W. M., R. H. Odom, P. E. Hale and B. R. Chapman. 2000. Stand age, stand characteristics, and landform 339
effects on understory herbaceous communities in southern Appalachian cove-hardwoods. Biol. Conserv. 340
93: 237-246. 341
Fredericksen, T. S., B. D. Ross, W. Hoffman, M. L. Morrison, J. Beyea, B. N. Johnson, M. B. Lester and E. 342
Ross. 1999. Short-term understory plant community responses to timber-harvesting intensity on non-343
industrial private forestlands in Pennsylvania. Forest Ecol. Manag. 116: 129-139. 344
Gencsi, L. and R. Vancsura. 1992. Dendrológia. Mezőgazda Kiadó, Budapest. 345
Godefroid, S. and N. Koedam. 2004. Interspecific variation in soil compaction sensitivity among forest floor 346
species. Biol. Conserv. 119: 207–217. 347
Graae, B. J. and V. S. Heskjaer. 1997. A comparison of understorey vegetation between untouched and managed 348
deciduous forest in Denmark. Forest Ecol. Manag. 96: 111-123. 349
Hardtle, W., G. von Oheimb and C. Westphal. 2003. The effects of light and soil conditions on the species 350
richness of the ground vegetation of deciduous forests in northern Germany (Schleswig-Holstein). Forest 351
Ecol. Manag. 182: 327-338. 352
Hermy, M., O. Honnay, L. Firbank, C. Grashof-Bokdam and J. E. Lawesson. 1999. An ecological comparison 353
between ancient and other forest plant species of Europe, and the implications for forest conservation. 354
Biol. Conserv. 91: 9-22. 355
Honnay, O., M. Hermy and P. Coppin. 1999. Impact of habitat quality on forest plant species colonization. 356
Forest Ecol. Manag. 115: 157-170. 357
Horn, H. S. 1971. The adaptive geometry of trees. Princeton University Press, Princeton. 358
Horváth, F. and A. Borhidi (eds.) 2002. A hazai erdőrezervátum-kutatás célja, stratégiája és módszerei. A 359
KvVM Természetvédelmi Hivatalának tanulmánykötetei 8., TermészetBúvár, Budapest. 360
1 2 3 4 5 6 7 8 9 10 11 12 13 14 15 16 17 18 19 20 21 22 23 24 25 26 27 28 29 30 31 32 33 34 35 36 37 38 39 40 41 42 43 44 45 46 47 48 49 50 51 52 53 54 55 56 57 58 59 60 61 62 63 64 65

15
Ito, S., R. Nakayama and G. P. Buckley. 2004. Effects of previous land-use on plant species diversity in semi-361
natural and plantation forests in a warm-temperate region in southeastern Kyushu, Japan. Forest Ecol. 362
Manag. 196: 213-225. 363
Kelemen, K., B. Mihók, L. Gálhidy and T. Standovár. 2012. Dynamic response of herbaceous vegetation to gap 364
opening in a central European beech stand. Silva Fennica 46: 53-65. 365
Kirby, K. J. 1988. Changes in the ground flora under plantations on ancient woodland sites. Forestry 61: 317-366
338. 367
Kirby, K. J. 1990. Changes in the ground flora of a broadleaved wood within a clear fell, group fells and a 368
coppiced block. Forestry 63: 241-249. 369
Kotroczó, Zs., Zs. Krakomperger, G. Koncz, M. Papp, D. B. Richard and J. A. Tóth. 2007. A Síkfőkúti cseres-370
tölgyes fafaj-összetételének és struktúrájának hosszú távú változása. Természetvédelmi Közlemények 13: 371
93-100. 372
Kramer, K., G. W. T. A. G. Bruinderink and H. H. T. Prins. 2006. Spatial interactions between ungulate 373
herbivory and forest management. Forest Ecol. Manag. 226: 238-247. 374
Lemmon, R. E. 1956. A spherical densiometer for estimating forest overstorey density. Forest Sci. 2: 314-320. 375
Maranón, T., R. Ajbilou, F. Ojeda and J. Arroyo. 1999. Biodiversity of woody species in oak woodlands of 376
southern Spain and northern Morocco. Forest Ecol. Manag. 115: 147-156. 377
Mersich, I., T. Práger, P. Ambrózy, M. Hunkár and Z. Dunkel (eds.) 2002. Magyarország éghajlati atlasza. 378
Országos meteorológiai Szolgálat, Budapest. 379
Pérez-Ramos, I. M., M. A. Zavala, T. Maranón, M. D. Díaz-Villa and F. Valladares. 2008. Dynamics of 380
understorey herbaceous plant diversity following shrub clearing of cork oak forests: a five-year study. 381
Forest Ecol. Manag. 255: 3242-3253. 382
Podani, J. 2000. Introduction to the exploration of multivariate biological data. Backhuys Publishers, Leiden, 383
The Netherlands. ISBN 90-5782-067-6 384
Rackham, O. 2000. The histora of the countryside: the classic history of Britain’s landscape, flora and fauna. 385
Phoenix Press, New York. 386
Rogers, D. A., T. P. Rooney, D. Olson and D. M. Waller. 2008. Shifts in southern Wisconsin forest canopy and 387
understory richness, composition and heterogenity. Ecology 89 (9): 2482-2492. 388
Rooney, T. P. and D. M. Waller. 2003. Direct and indirect effects of white-tailed deer in forest ecosystems. 389
Forest Ecol. Manag. 181: 165-176. 390
1 2 3 4 5 6 7 8 9 10 11 12 13 14 15 16 17 18 19 20 21 22 23 24 25 26 27 28 29 30 31 32 33 34 35 36 37 38 39 40 41 42 43 44 45 46 47 48 49 50 51 52 53 54 55 56 57 58 59 60 61 62 63 64 65

16
Rubio, A., R. Gavilán and A. Escudero. 1999. Are soil characteristics and understorey composition controlled 391
by forest management? Forest Ecol. Manag. 113: 191-200. 392
Schumann, M. E., A. S. White and J. W. Witham. 2003. The effects of harvest-created gaps on plant species 393
diversity, composition and abundance in a Maine oak-pine forest. Forest Ecol. Manag. 176: 543-561. 394
Sharpe, F., D. C. Shaw, C. L. Rose, S. C. Sillett and A. B. Carey. 1996. The biologically significant attributes of 395
forest canopies to small birds. Northwest Sci. 70: 86-93. 396
Ståhl, G., A. Ringvall and J. Fridman. 2001. Assessment of coarse woody debris – a methodological overview. 397
Ecological Bulletins 49: 57-70. 398
Standovár, T., P. Ódor, R. Aszalós and L. Gálhidy. 2006. Sensitivity of ground layer vegetation diversity 399
descriptors in indicating forest naturalness. Community Ecol. 7(2):199-209 400
Szabó, P. 2005. Woodland and forests in medieval Hungary. Archaeopress, Oxford. 401
Ter Braak, C. J. F. and P. Šmilauer. 2002. CANOCO reference manual and CanoDraw for Windows user's 402
guide: software for canonical community ordination (version 4.5). Microcomputer Power, Ithaca, New 403
York, USA. 404
Tinya, F., S. Márialigeti, I. Király, B. Németh and P. Ódor. 2009. The effect of light conditions on herbs, 405
bryophytes and seedlings of temperate mixed forests in Őrség, Western Hungary. Plant Ecol. 204: 69-81. 406
Tobisch, T. and T. Standovár. 2005. A comparison of vegetation patterns in the tree and herb layers of a 407
hardwood forest. Community Ecol. 6 (1): 29-37. 408
Tutin, T. G., N. A. Burges, A. O. Chater, J. R. Edmondson, V. H. Heywood, D. M. Moore, D. H. Valentine, S. 409
M. Walters and D. A. Webb. 1964-1993. Flora Europaea. Vols. 1-5 and Vol.1, ed.2. Cambridge: 410
Cambridge University Press. 411
Tybirk, K. and B. Strandberg. 1999. Oak forest development as a result of historical land-use patterns and 412
present nitrogen deposition. Forest Ecol. Manag. 114: 97-106. 413
Van Calster, H., L. Baeten, K. Verheyen, D. L. Keersmaeker, S. Dekeyser, J. E. Rogister and M. Hermy. 2008. 414
Diverging effects of overstorey conversion scenarios on the understorey vegetation in a former coppice-415
with-standards forest. Forest Ecol. Manag. 256: 519-528. 416
Van Wagner, C. E. 1968. The line intersect method in forest fuel sampling. Forest Sci. 14: 20-26. 417
von Oheimb, G. and J. Brunet. 2007. Dalby Söderskog revisited: long-term vegetation changes in a south 418
Swedish deciduous forest. Acta Oecol. 31: 229-242. 419
1 2 3 4 5 6 7 8 9 10 11 12 13 14 15 16 17 18 19 20 21 22 23 24 25 26 27 28 29 30 31 32 33 34 35 36 37 38 39 40 41 42 43 44 45 46 47 48 49 50 51 52 53 54 55 56 57 58 59 60 61 62 63 64 65

17
von Oheimb, G. and W. Härdtle. 2009. Selection harvest in temperate deciduous forest: impact on herb layer 420
richness and composition. Biodivers. Conserv. 18: 271-287. 421
Warren, W. G. and P. F. Olsen. 1964. A line intersect technique for assessing logging waste. Forest Sci. 10:267-422
276. 423
Whigham, D. F. 2004. The ecology of woodland herbs in temperate deciduous forests. Annu. Rev. Ecol. Evol. S. 424
35: 583-621.425
1 2 3 4 5 6 7 8 9 10 11 12 13 14 15 16 17 18 19 20 21 22 23 24 25 26 27 28 29 30 31 32 33 34 35 36 37 38 39 40 41 42 43 44 45 46 47 48 49 50 51 52 53 54 55 56 57 58 59 60 61 62 63 64 65

18
Table 1 The abbrevations and descriptions of the explanatory variables. 426
427
Abbreviation Description of the Variable Unit Min Average Max
Slope Slope Degree 0 27 64
DNorth Deviation from North Degree 20 133 180
DEast Deviation from East Degree 0 77 180
Height Average stand height m 13 20 27
Openness Canopy openness percent 3.3 9.2 24.5
DBH Mean DBH of trees cm 11.2 23.0 48.1
DBHcv Coefficient of variation of DBH of the
trees
0.09 0.50 1.18
DomDBH DBH of dominant trees cm 13.4 33.6 55.6
DomDBHcv Coefficient of variation of the DBH of
dominant trees
0.02 0.18 0.57
SupRat Suppressed tree ratio percent 0 39 85
TreeDiv Tree species Shannon diversity 0 1.02 1.99
QuCeRat Quercus cerris ratio between the two
dominant oak species
percent 0 42 100
DisRat Diseased tree ratio percent 0 13 50
VolSnag Snag volume m3/ha 0 18.8 127.3
VolLog Log volume m3/ha 0 26.5 273.8
HShrub Density of high shrubs stem/ha 0 2043 8100
LShrub Density of low shrubs stem/ha 0 11938 59000
ShrubDiv Shrub species Shannon diversity 0 1.18 2.24
428
429
1 2 3 4 5 6 7 8 9 10 11 12 13 14 15 16 17 18 19 20 21 22 23 24 25 26 27 28 29 30 31 32 33 34 35 36 37 38 39 40 41 42 43 44 45 46 47 48 49 50 51 52 53 54 55 56 57 58 59 60 61 62 63 64 65

19
Table 2 Significant explanatory variables of the Redundancy Analyis that determine the composition of 430
seedlings. The explained variance of all canonical axes was 43.2 %. 431
Significance levels: *** <0.001; ** <0.01; * <0.05 432
433
Abbreviation Variable Explained variance F-value
LShrub Density of low shrubs 12 % 15.86***
QuCeRat Quercus cerris ratio between the two dominant oak species 9 % 14.70***
DBH Mean DBH of trees 7 % 10.96***
TreeDiv Tree species Shannon diversity 5 % 9.40***
HShrub Density of high shrubs 4 % 6.46***
DNorth Deviation from North 3 % 5.63***
DomDBHcv Coefficient of variation of the DBH of dominant trees 2 % 3.60**
ShrubDiv Shrub species Shannon diversity 1 % 2.90**
434
1 2 3 4 5 6 7 8 9 10 11 12 13 14 15 16 17 18 19 20 21 22 23 24 25 26 27 28 29 30 31 32 33 34 35 36 37 38 39 40 41 42 43 44 45 46 47 48 49 50 51 52 53 54 55 56 57 58 59 60 61 62 63 64 65

20
Table 3 Significant explanatory variables of the Redundancy Analyis that determine the composition of 435
herbaceous species. The explained variance of all canonical axes was 35.9 %. 436
Significance levels: *** <0.001; ** <0.01; * <0.05 437
438
Abbrevetion Variable Explained variance F-value
DBH Mean DBH of trees 14 % 19.42 ***
DEast Deviation from East 5 % 7.69 ***
DomDBH DBH of dominant trees 5 % 6.72 ***
Slope Slope 3 % 3.76***
Openness Canopy openness 2 % 4.38***
Height Average stand height 2 % 3.50***
ShrubDiv Shrub species Shannon diversity 2 % 3.34**
HShrub Density of high shrubs 2 % 2.49**
LShrub Density of low shrubs 1 % 3.40***
439
1 2 3 4 5 6 7 8 9 10 11 12 13 14 15 16 17 18 19 20 21 22 23 24 25 26 27 28 29 30 31 32 33 34 35 36 37 38 39 40 41 42 43 44 45 46 47 48 49 50 51 52 53 54 55 56 57 58 59 60 61 62 63 64 65

21
List of Figures 440
441
Fig. 1 Sampling arrangement 442
The circles symbolize the sampling units: major circle (r = 12.6 m) - overstorey; medium circle (r = 5.6 m) - 443
high shrub layer; 4 circles (r = 1.5 m) - low shrub layer; 28 small circles (r = 0.4 m) - understorey; four crosses - 444
sampling points of canopy closure. 445
446
447
1 2 3 4 5 6 7 8 9 10 11 12 13 14 15 16 17 18 19 20 21 22 23 24 25 26 27 28 29 30 31 32 33 34 35 36 37 38 39 40 41 42 43 44 45 46 47 48 49 50 51 52 53 54 55 56 57 58 59 60 61 62 63 64 65

22
Fig. 2 Explanatory variables and species biplot of the first (horizontal) and the second (vertical) axes of 448
the Redundancy Analysis of seedlings. Significant explanatory variables are represented by red lines, 449
their abbreviations are explained in Table 1, species (black) are abbreviated by the first three letter of the 450
genus and the species names (App. 2). Variance covered by the first axis is 15.6 %, by the second axis is 451
11.7 %. 452
453
454
1 2 3 4 5 6 7 8 9 10 11 12 13 14 15 16 17 18 19 20 21 22 23 24 25 26 27 28 29 30 31 32 33 34 35 36 37 38 39 40 41 42 43 44 45 46 47 48 49 50 51 52 53 54 55 56 57 58 59 60 61 62 63 64 65

23
Fig. 3 Explanatory variables and species biplot of the first (horizontal) and the second (vertical) axes of the 455
Redundancy Analysis of herbs. Significant explanatory variables are represented by red lines, their 456
abbreviations are explained in Table 1., species (black) are abreviated by the first three letter of the genus and 457
the species names (App. 1). Variance covered by the first axis and second axis were 19.5 % and 7.8 %, 458
respectively. 459
460
461
1 2 3 4 5 6 7 8 9 10 11 12 13 14 15 16 17 18 19 20 21 22 23 24 25 26 27 28 29 30 31 32 33 34 35 36 37 38 39 40 41 42 43 44 45 46 47 48 49 50 51 52 53 54 55 56 57 58 59 60 61 62 63 64 65

24
8. Appendix 462
App. 1 Abbreviations and frequency data of the herbaceous species463
Abbreviations Binomial name Frequency
(%)
astgly Astragalus
glycyphyllos 59.0
betoff Betonica officinalis 18.0
brarup Brachypodium
rupestre 31.1
brasyl Brachypodium
sylvaticum 25.4
broram Bromus ramosus 63.1
bugpur Buglossoides
purpureo-coerulea 37.7
camper Campanula
persicifolia 23.8
camrap Campanula
rapunculoides 51.6
carmic Carex michelii 54.1
carmur Carex muricata 58.2
chatem Chaerophyllum
temulum 41.0
clevit Clematis vitalba 45.9
clivul Clinopodium
vulgare 83.6
conmaj Convallaria majalis 29.5
crulae Cruciata laevipes 22.1
dacglo Dactylis glomerata 86.9
diggra Digitalis
grandiflora 19.7
eupcyp Euphorbia
cyparissias 31.1
faldum Fallopia
dumetorum 54.1
fraves Fragaria vesca 73.8
galmol Galium mollugo 29.5
galodo Galium odoratum 33.6
galsch Galium schultesii 77.9
geuurb Geum urbanum 73.0
glehir Glechoma hirsuta 29.5
hielae Hieracium
laevigatum 27.9
lapcom Lapsana communis 25.4
latnig Lathyrus niger 36.1
latver Lathyrus vernus 59.8
melcar Melittis carpatica 49.2
meluni Melica uniflora 85.2
orivul Origanum vulgare 19.7
poanem Poa nemoralis 69.7
polodo Polygonatum
odoratum 18.9
priver Primula veris 20.5
rubus Rubus sp. 20.5
saneur Sanicula europea 27.0
scualt Scutellaria altissima 33.6
silnut Silene nutans 28.7
stehol Stellaria holostea 32.8
symtub Symphytum
tuberosum 46.7
tancor Tanacetum
corymbosum 64.8
trialp Trifolium alpestre 18.9
trimed Trifolium medium 49.2
vercha Veronica
chamaedrys 71.3
veroff Veronica officinalis 17.2
vinoff Vincetoxicum
officinale 60.7
viohir Viola hirta 26.2
viomir Viola mirabilis 20.5
vioodo Viola odorata 68.0
viorei Viola
reichenbachiana 64.8
464
1 2 3 4 5 6 7 8 9 10 11 12 13 14 15 16 17 18 19 20 21 22 23 24 25 26 27 28 29 30 31 32 33 34 35 36 37 38 39 40 41 42 43 44 45 46 47 48 49 50 51 52 53 54 55 56 57 58 59 60 61 62 63 64 65

25
App. 2 Abbreviations and frequency data of the seedling species 465
466
Abbreviation Binomial name Frequency (%)
acecam Acer campestre 91.8
acepla Acer platanoides 27.0
acetat Acer tataricum 10.7
carbet Carpinus betulus 49.2
cormas Cornus mas 77.9
corsan Cornus sanguinea 14.8
cralae Crataegus laevigata 29.5
cramon Crataegus monogyna 63.1
euover Euonymus verrucosus 29.5
fraexc Fraxinus excelsior 77.9
ligvul Ligustrum vulgare 75.4
lonxyl Lonicera xylosteum 13.9
malsyl Malus sylvestris 16.4
pruavi Prunus avium 36.1
pruspi Prunus spinosa 68.0
pyrpyr Pyrus pyraster 16.4
quecer Quercus cerris 87.7
quepet Quercus petraea 69.7
roscan Rosa canina 85.2
sortor Sorbus torminalis 33.6
tilpla Tilia platyphyllos 13.1
viblan Viburnum lantana 13.9
467
1 2 3 4 5 6 7 8 9 10 11 12 13 14 15 16 17 18 19 20 21 22 23 24 25 26 27 28 29 30 31 32 33 34 35 36 37 38 39 40 41 42 43 44 45 46 47 48 49 50 51 52 53 54 55 56 57 58 59 60 61 62 63 64 65
Top Related
Copyright © 2022 FDOKUMEN

