


Bahasa
Halaman
Hukum

THE EFFECTS OF CONCEPTUAL APPROACH AND COMBINED READING STUDY STRATEGY ON STUDENTS’ ACHIEVEMENT AND ATTITUDES
TOWARDS PHYSICS
A THESIS SUBMITTED TO THE GRADUATE SCHOOL OF NATURAL AND APPLIED SCIENCES
OF MIDDLE EAST TECHNICAL UNIVERSITY
BY
ERDAL TAŞLIDERE
IN PARTIAL FULFILLMENT OF THE REQUIREMENTS FOR
THE DEGREE OF DOCTOR OF PHILOSOPHY IN
SECONDARY SCIENCE AND MATHEMATICS EDUCATION
JULY 2007
Approval of the Graduate School of Natural and Applied Sciences.
Prof. Dr. Canan ÖZGEN
Director
I certify that this thesis satisfies all the requirements as a thesis for the degree of
Doctor of Philosophy.
Prof. Dr. Ömer GEBAN
Head of Department
This is to certify that we have read this thesis and that in our opinion it is fully
adequate, in scope and quality, as a thesis for the degree of Doctor of philosophy.
Assist. Prof. Dr. Ali ERYILMAZ
Supervisor
Examining Committee Members
Assoc. Prof. Dr. A. Đlhan ŞEN (HU, SSME) ____________________
Assist. Prof. Dr. Ali ERYILMAZ (METU, SSME) ____________________
Assoc. Prof. Dr. Ceren TEKKAYA (METU, SSME) ____________________
Assist. Prof. Dr. Esen UZUNTĐRYAKĐ (METU, SSME) ____________________
Inst. Dr. Ömer Faruk ÖZDEMĐR (METU, SSME) ____________________
iii
I hereby declare that all information in this document has been obtained and
presented in accordance with academic rules and ethical conduct. I also declare
that, as required by these rules and conduct, I have fully cited and referenced
all material and results that are not original to this work.
Name, Last name : Erdal, TAŞLIDERE
Signature :
iv
ABSTRACT
THE EFFECTS OF CONCEPTUAL APPROACH AND COMBINED READING
STUDY STRATEGY ON STUDENTS’ ACHIEVEMENT AND ATTITUDES
TOWARDS PHYSICS
Taşlıdere, Erdal
Ph.D., Department of Secondary Science and Mathematics Education
Supervisor: Assist. Prof. Dr. Ali Eryılmaz
July 2007, 217 pages
The aim of this study is to investigate the effects of Conceptual Approach and
Combined Reading Study Strategy on 9th grade private high school students’
achievement and attitudes towards optics at Çankaya district of Ankara. For
Conceptual Approach, Conceptually Based Instruction was developed. Combined
Reading Study Strategy is the integration of reading strategies of the KWL and
SQ3R. For the study, two measuring tools; Physics Achievement Test, Physics
Attitude Scale and various Teaching/Leaning Materials were developed.
The study was conducted with 124 ninth grade private high school students in
Çankaya district in the spring semester 2006-2007.
v
The study was conducted with three teachers with their 6 classes. For the
study factorial design was used to investigate the partial and combined effects of
Conceptual Approach and Combined Reading Study Strategy. Physics Attitude Scale
and Physics Achievement Tests were administered as pre-test. Two classes instructed
by conceptual approach with combined reading study strategy, two classes instructed
by conceptual approach without combined reading study strategy and the left two
classes were instructed by traditional instruction with combined reading study
strategy. After two months treatments, Physics Attitude Scale and Physics
Achievement Test were administered as post-test.
The data obtained from the administration of post-tests were analyzed by
statistical techniques of Multivariate Analyses of Covariance (MANCOVA).
According to the results of this study the conceptual approach and combined reading
strategy methods have greater affect on the students’ achievement compared to other
conceptual approach without combined reading study strategy and traditional
instruction with combined reading study strategy.
Keywords: Physics Education, Conceptual Approach, Misconceptions, KWL, SQ3R,
Optics.
vi
ÖZ
KAVRAMSAL YAKLAŞIM VE BĐRLEŞTĐRĐLMĐŞ OKUMA ÇALIŞMA
STRATEJĐSĐNĐN ÖĞRENCĐLERĐN FĐZĐK BAŞARISINA VE FĐZĐGE KARŞI
OLAN TUTUMUNA ETKĐSĐ
Taşlıdere, Erdal
Doktora, Orta Öğretim Fen ve Matematik Alanları Eğitimi Bölümü
Tez Yöneticisi: Yrd. Doç. Dr. Ali Eryılmaz
Temmuz 2007, 217 Sayfa.
Bu çalışmanın amacı Kavramsal Yaklaşım ve Birleştirilmiş Okuma Çalışma
Stratejisinin Ankara ilinin Çankaya ilçesindeki 9.sınıf özel okul öğrencilerinin optik
konusundaki başarı ve tutumlarına etkisini araştırmaktır. Kavramsal yaklaşım için,
Kavramsal fizik dersi eğitimi geliştirildi. Birleştirilmiş Okuma Çalışma Stratejisi,
KWL ve SQ3R okuma stratejilerinin birleştirilmesi ile elde edildi. Bu çalışma için,
ölçüm araçları olarak, Fizik Tutum Ölçeği, Fizik Başarı Testi ve çeşitli
Öğretim/Öğrenim Materyalleri geliştirildi.
Çalışma 2006 – 2007 Eğitim Öğretim yılı bahar döneminde, Çankaya
ilçesinde iki özel okulda toplam 124 öğrenci ile gerçekleştirildi.
vii
Çalışma 3 Fizik öğretmeni ile birlikte, toplam 6 sınıfta gerçekleştirildi.
Çalışmada, Kavramsal Yaklaşım ve Birleştirilmiş Okuma Çalışma Stratejilerinin
kısmi ve birleştirilmiş etkilerini incelemek için faktörsel tasarım kullanıldı. Fizik
Tutum Ölçeği ve Fizik Başarı Testi ön test olarak uygulanıldı. Đki sınıfta kavramsal
yaklaşım öğretimi ile birlikte birleştirilmiş okuma çalışma stratejisi, diğer iki sınıfta
yalnızca kavramsal yaklaşım öğretimi, geriye kalan diğer iki sınıfta da geleneksel
öğretim metodu ile birlikte birleştirilmiş okuma çalışma stratejisi kullanıldı. Đki aylık
bir uygulama sürecinden sonra Fizik Tutum Ölçeği ve Fizik Başarı Testleri tekrar
son test olarak uygulanıldı.
Problemler çerçevesinde kurulan hipotezlerin test edilmesi için, son test
skorları MANCOVA istatistiksel tekniği kullanılarak analiz edildi. Đstatistiksel
sonuçlar kavramsal yaklaşım metodu ile birlikte birleştirilmiş okuma çalışma
stratejisinin öğrencilerin başarılarını yalnız kavramsal yaklaşım metodu, geleneksel
öğretim metodu ile birleştirilmiş okuma çalışma stratejisi metotlarına göre daha etkili
olduğunu gösterdi.
Anahtar Kelimeler: Fizik Eğitimi, Kavramsal Yaklaşım, Kavram Yanılgıları, KWL,
SQ3R, Optik.

viii
This thesis is dedicated to
my wife Ayşe and daughter Aynur
for their support, guidance and love.
ix
ACKNOWLEDGMENTS
I would like to express my gratitude to Assist. Prof. Dr. Ali ERYILMAZ. I owe
a special word of gratitude to him for his patient guidance, sound advice and
constructive criticism. He has been always there whenever I need him and helped me
in every stage of my work. He is more than a mere teacher to me, instead a pioneer, a
conductor, a valuable supervisor and a close friend. If he hadn’t accepted to me as his
students, the realization of this study would not have been possible.
Thanks are an inadequate expression of my gratitude for the support of my
family. They patiently and lovingly encouraged me to do my best. I would like to
dedicate this work to my wife Ayşe and my daughter Aynur.
Thanks and claps are to you – my father, my mother and my dear sister
Şevkiye for your supports.
Likewise I am also grateful to my colleagues and friends; especially,
M.BĐLGĐÇ, S.ERDEN and F. KORUR who gave assistance and support at the
certain stages of the study. And also thankful to students participated in this study.
I would like to extend my gratitude to examining committee; Assoc. Prof. Dr.
Ahmet Đlhan ŞEN, Assist. Prof. Dr. Ceren TEKKAYA, Assist. Prof. Dr. Esen
UZUNTĐRYAKĐ, Inst. Dr. Ömer Faruk ÖZDEMĐR for their helpful criticisms and
comments.
Thank you all very much indeed.

x
TABLE OF CONTENTS
ABSTRACT....…...…….…………………...…….………………………………....iv
ÖZ…………………………………………...…….………………………………....vi
ACKNOWLEDGEMENT ……………………….…….…………………………..ix
TABLE OF CONTENTS……....……………….…….……………………………....x
LIST OF TABLES...…………………………..………….…………………..….....xvi
LIST OF FIGURES………………………………….……….…………………...xviii
LIST OF SYMBOLS………………………………………..……...........................xix
CHAPTERS
1. INTRODUCTION…………………………………………………………………1
1.1 The Main Problem……………………………………………………………..7
1.1.1 The Sub Problems………………………………………………..............7
1.2 Hypotheses…………………………………………………………………….7
1.3 Definition of ImportantTerms………………………………………................9
1.4 Significance of the Study ................................................................................ 10
2. REVIEW OF THE LITERATURE........................................................................ 12
2.1 Importance of Physics ..................................................................................... 12
2.1.1 Understanding of Physics ....................................................................... 13
2.1.2 Mathematical Nature Of Physics............................................................. 14
2.1.3 Students’ Ineffective Reading Study Strategies ...................................... 15
2.2 Solutions to the Problems................................................................................ 16
2.2.1 Conceptual Physics.................................................................................. 17
2.2.1.1 Criteria Of Conceptual Physics ....................................................... 18
xi
2.2.1.1.1 To Teach Hardcore Physics..................................................... 18
2.2.1.1.2 To Shape Critical Thinking..................................................... 19
2.2.1.1.3 To Relate the Role of Physics and Techonology.................... 21
2.2.2 Benefits of Conceptual Physics ......................................................... 22
2.2.3 Successes of Coceptual Physics ......................................................... 23
2.3.1 KWL: The Instructional Strategy ....................................................... 27
2.3.1.1 Step K - What I Know?............................................................. 28
2.3.1.2 Step W - What Do I Want To Know?....................................... 29
2.3.1.3 Step L - What I Learned?.......................................................... 30
2.3.1.4 Successes of KWL.................................................................... 30
2.4.1 SQ3R: The Instructional Strategy..................................................... 34
2.4.1.1 Step S; Survey.......................................................................... 34
2.4.1.2 Step Q; Question...................................................................... 35
2.4.1.3 Step3R; Read - Recite - Review .............................................. 35
2.4.1.4 Benefits of SQ3R .................................................................... 36
2.5 Combined Reading Study Strategy (CRSS).................................................... 37
2.6 Studies Conducted Related with Optics………...……...…………………….42
2.7 Misconceptions in Optics………...…………………….…………………….51
2.8 Theoritical Framework of the Conceptual Approach...................................... 53
2.9 Summary of the Literature Review ................................................................. 54
3. METHODS............................................................................................................. 58
3.1 Population and Sample.................................................................................... 58
3.2 Variables.......................................................................................................... 62
3.2.1 Dependent Variables ............................................................................... 62
xii
3.2.2 Independent Variables ............................................................................. 62
3.3 Measuring Tools.............................................................................................. 63
3.3.1 Physics Achievement Test....................................................................... 63
3.3.2 Physics Attitude Scale ............................................................................. 64
3.3.3 Validity and Reliability of Measuring Tools........................................... 66
3.4 Teaching/Learning Materials .......................................................................... 67
3.4.1 Objective List and Table of Specification............................................... 68
3.4.2 Objective - Conceptual Physics Teaching Criteria Table........................ 69
3.4.3 The CA and CRSS Handbook for Teachers ............................................ 69
3.4.4 Conceptual Based Lecture Notes for Students and Teachers …............. 70
3.4.5 Demonstrations........................................................................................ 71
3.4.6 Activities… ............................................................................................. 71
3.4.7 Lesson Plans ............................................................................................ 71
3.4.8 Misconception - Activity Table............................................................... 72
3.4.9 The CRSS Table ...................................................................................... 72
3.4.10 A Guide Table about How to Fill CRSS Tables ................................... 73
3.4.11 Short Quizzes ........................................................................................ 73
3.4.12 Power Point Presentation to Describe the CRSS................................... 74
3.4.13 Power Point Presentations to follow CA Lessons ................................. 74
3.4.14 Self Evaluation - Observation Checklist For Teachers ........................ 74
3.5 Procedure......................................................................................................... 75
3.6 Treatment......................................................................................................... 79
3.6.1 Treatment in the CA with CRSS Group.................................................. 79
3.7 Analyses of Data ............................................................................................. 93
xiii
3.7.1 Descriptive Statistics ............................................................................... 93
3.7.2 Inferential Statistics ................................................................................. 93
3.8 Assumptions and Limitations .......................................................................... 95
4. RESULTS............................................................................................................... 96
4.1 Missing Data Analysis..................................................................................... 96
4.2 Descriptive and Inferential Statistics............................................................... 98
4.2.1 Descriptive Statistics ............................................................................... 98
4.2.2 Inferential Statistics ............................................................................... 107
4.2.2.1 Determination of Covariates ........................................................ 107
4.2.2.2 Assumptions of MANCOVA ....................................................... 112
4.2.2.3 MANCOVA Model ....................................................................... 115
4.2.2.4 Null Hypothesis 1 .......................................................................... 116
4.2.2.5 Null Hypothesis 1.1 ....................................................................... 119
4.2.2.6 Null Hypothesis 1.2 ....................................................................... 120
4.3 Change in the Classroom Environments During Treatments ........................ 122
4.4 The Results of the Self Evaluation - Observation Check Lists ..................... 124
4.5 The Results of the Short Quizzes .................................................................. 129
4.6 The Summary of Results ............................................................................... 131
5. CONCLUSIONS, DISCUSSION AND IMPLICATIONS.................................. 133
5.1 Discussion of the Results .............................................................................. 133
5.2 Internal and External Validities of the Study ................................................ 142
5.2.1 Internal Validity of the Study................................................................ 142
5.2.2 External validity of the Study................................................................ 144
5.3 Conclusions ................................................................................................... 145
xiv
5.4 Implications ................................................................................................... 147
5.5 Recommendations for Further Researh ......................................................... 149
REFERENCES......................................................................................................... 151
APPENDICES.......................................................................................................... 157
A. PHYSICS ACHIEVEMENT TEST ................................................................157
B. PHYSICS ATTITUDE SCALE ................................................................168
C. OBJECTIVE LIST ................................................................................................171
D. TABLE OF TEST SPECIFICATION ................................................................178
E. OBJECTIVE - CONCEPTUAL PHYSICS TEACHING CRITERIA
TABLE……………………………………………………………….
179
F. CONCEPTUAL APPROACH AND COMBINED READING
STUDY STRATEGY HANDBOOK FOR TEACHERS.…………...
184
G. CONCEPTUAL BASED LECTURE NOTES………………………
…………….……..…………………..At the back side of thesis bond
H. LESSON PLANS……..……………..At the back side of thesis bond
I. MISCONCEPTION - ACTIVITY TABLE…………………………. 201
J. THE CRSS TABLE…....……………………………………………. 204
K. A GUIDE TABLE ABOUT HOW TO FILL THE CRSS TABLE…. 206
L. SHORT QUIZZES………………………………………………....... 207
M. POWER POINT PRESENTATION TO DESCRIBE THE CRSS…..
…... ……….……………………....... At the back side of thesis bond

xv
N. POWER POINT PRESENTATION TO FOLLOW THE
CONCEPTUAL APPROACH LESSONS………………...................
…………………………………….....At the back side of thesis bond
O. SELF EVALUATION - OBSERVATION CHECKLIST……..……. 212
P. ANSWERS OF THE PHYSICS ACHIEVEMENT TEST………….. 213
Q. RAW DATA………………………………………………………… 214
VITA……………………………………………………………….........................217
xvi
LIST OF TABLES
TABLE
Table 2.1 The CRSS Table Distributed to Students.……………………... 38
Table 3.1 Total Number of Classes, Number of Classes Included in the
Study, Total Number of Students, and Number of Students
Included in the Study for Each Private High Schools whose
Teaching Languages are English in Science Lessons in
Çankaya.......................................................................................
59
Table 3.2 Numbers of Students in Each Group…….…………………...... 61
Table 3.3 Age Distribution of the Students Included in the Study……….. 61
Table 3.4 Identification of Variables……………………………………... 63
Table 3.5 Dimensions of the PATS………………………………………. 66
Table 3.6 MANCOVA Variable Set Composition and Statistical Model
Entry Order……………………………………………………..
94
Table 4.1 Missing Data versus Variables………………………………… 98
Table 4.2 Basic Descriptive Statistics Related to the Data of the Physics
Achievement Scores and Physics Attitude Scores……………..
100
Table 4.3 Basic Descriptive Statistics Related to the Data of the Physics
Achievement Scores For Male and Female in the Study
Groups……………………………………………………….…
102
Table 4.4 Basic Descriptive Statistics Related to the Data of the Physics
Attitude Scores For Male and Female in the Study Groups……
103
xvii
Table 4.5 Significance Test of Correlations between Dependent
Variables and Covariates.………………………………………
108
Table 4.6 Significance Test of Correlations between Dependent
Variables, and Dependent Variables and Independent
Variables Classified as Group membership……………………
110
Table 4.7 Significance Test of Correlations between covariates………… 111
Table 4.8 Results of Multivariate Regression Correlation (MRC)
Analysis of Homogeneity of Regression……………………….
113
Table 4.9 Box’s Test of Equality of Covariance Matrices……………….. 114
Table 4.10 Levene’s Test of Equality of Error Variances…………………. 115
Table 4.11 Multivariate Analysis of Covariance (MANCOVA) Test
Results………………………………………………………….
116
Table 4.12 Test of Between - Subjects Effect……………………………... 118
Table 4.13 The Pair wise Comparisons for the PSTACH…………………. 120
Table 4.14 Estimated Means for Variables Related to Null Hypothesis 1… 121
Table 4.15 Estimated Means for the Male and Female’s PSTACH and
PSTATT………………………………………………………..
122
Table 4.16 Physical Properties of Classroom……...………………………. 125
Table 4.17 Teacher Characteristics………………………………………... 126
Table 4.18 Students Characteristics……………………………………….. 127
Table 4.19 Method Related Characteristics……………………………….. 128
Table 4.20 Average Means of the Quizzes for Each Class and Each Group 130
xviii
LIST OF FIGURES
FIGURES
Figure 2.1 An example of Hewitt to enforce students think more than one
idea at a time ………………………………...………………...
20
Figure 2.2 The Complex shadow task used by Bendall, Galili and
Goldberg (1993)……………………………………………......
45
Figure 2.3 The Plane mirror task 1 and 2 used by Goldberg and
McDermott (1986)……………………………………………...
48
Figure 4.1 Histograms with normal curves related to the PSTACH for
Group 1 (CA with CRSS), Group 2 (CA without CRSS) and
Group 3 (TI with CRSS) on optics..……………………………
105
Figure 4.2 Histograms with normal curves related to the PSTATT for
Group 1 (CA with CRSS), Group 2 (CA without CRSS) and
Group 3 (TI with CRSS) on optics..……………………………
106
Figure 4.3 The scatter plots between the PREACH and PCGPA with the
PSTACH and that of the PREACH and PREATT with the
PSTATT…………..……………………………………………
109
xix
LIST OF SYMBOLS
SYMBOLS
CA: Conceptual Approach
CPT: Conceptual Physics Text
CBLN: Conceptual Based Lecture Notes
CRSS: Combined Reading Study Strategy
MOT: Methods of Teaching
PACT: Physics Achievement Test
PATS: Physics Attitude Scale
PCGPA: Students’ Previous Cumulative Grade Point Average
PPCG: Students’ Previous Physics Course Grades
PREACH: Students’ Physics Achievement Pre-Test Scores
PREATT: Students’ Physics Attitude Pre-Test Scores
PSTACH: Students’ Physics Achievement Post-Test Scores
PSTATT: Students’ Physics Attitude Post-Test Scores
TI: Traditional Instructional Method.

xx
TPT: Traditional Physics Text
NKWL: Without KWL
1
CHAPTER 1
INTRODUCTION
The science and technology is changing very rapidly. They have great
importance in the lives of human-life. Within this rapid change of science and
technology, physics takes important role. Because it is the fundamental of all other
sciences; its principals underlie phenomena studied in all other fields. (Bueche &
Jerde, 1995, pp. XV)
Physics is fundamental science; it should be learned very well. As Hewitt
states in his Conceptual Physic book, “Physics should be the part of the educational
mainstream for all students” (Hewitt, 1998, pp. XVI). In this aim, schools and
teachers have important responsibilities.
However, when we investigate the students’ physics achievements, we can
see that we are no so longer successful. Because of the mathematical nature of the
physics, students’ ineffective reading - study habits and other factors led to the low
achievement in physics. Hewitt (1972) reports that studying physics has been a
scientific advantage for most of the science students but unfortunately it has been an
incompressible, difficult course for most of the average non-science students.
Physics has been least popular and frustrating course for a long time (Hewitt,
1990). According to Hewitt the main reason to this is related with the mathematical
nature of physics. Vondracek (1999) states that mathematics is very important for
2
physics, it plays a key role; it enables students to see how variables are related to
each other in nature; It denotes the direct and indirect relationships in a way that
allow us to make predictions and solve daily life problems. Unfortunately, for most
of our students, especially, for non-science students, mathematics is a serious
problem. Since they are not equipped fully with mathematics, they can not translate
their academic language of mathematics into physics language and this affects their
physics achievement. When students become unsuccessful, they see physics as an
incomprehensible discipline. As Hewitt (1990) reports, physics courses have been
taught as applied mathematics for a long time rather than real physics; teachers
applied mathematical equation just to solve the problems before any concept
development and exploration. So, students chose to memorize formula and
manipulate the terms in equations. Their aims become just to solve the quantitative
problems, find the correct answers and pass the course at the end of the semester
without understanding real physics.
The solution to this problem was suggested by Paul G. Hewitt. He is a famous
physics teacher in U.S. He has been teaching at city college of San Francisco since
1964 and trying to solve this important problem with conceptual physics course.
According to Hewitt (1990), the first course should be conceptual physics; first the
ideas should be developed conceptually and then mathematical structure should be
applied to solve the problems. We know that the relations in physics are
mathematical. But initially we had better put it a side. If concepts are developed
before computations, students will understand the meaning of physics and life. At the
end, physics will be fascinating body of knowledge and exiting process.
3
What does conceptual physics mean? Hewitt (1983) describes it as “The
study of the concepts of physics qualitatively by emphasizing on mental imagery.
Studying physics by relating the concepts to the things, events that are familiar in the
everyday environment” (Hewitt, 1983, p. 305).
Hewitt (1972; 1983) reports that there are three main objectives while
teaching conceptual physics. These are; to teach hardcore physics with emphasis on
the everyday environment, to shape the critical thinking of students, and to relate the
role of physics and technology toward the positive future. As reported in the article
of Hewitt (1990) there are lots of success stories related to conceptual physics.
Another important reason to students’ low achievement is related with their
ineffective readings. Results of the studies and the experience of teachers denote that
students do not know how to read the reading materials strategically. They do not
know also how to read, and get maximum gain from the physics text. Hartlep and
Forsyth (2000) indicate that teachers generally suffer from the ineffective reading
and study habit of students. They usually complain that students remember little of
what they learn from their readings in textbooks. Most of them are not effective
readers.
Wang and Andre (1991) report that, according to Piagetian theory, new
experiences are understood by applying preexisting mental structures to the new
experiences. Wixson and Peter (as cited in Paris & Oka, 1989) define the reading as
constructing meaning using the ideas of text with the help of readers’ prior
knowledge, purpose, and available strategies. Romig and Allbee (2000) report that
students understand the material better and recall it for a longer time, if they react to
lecture or course material actively.
4
Paulson and Faust (2000) report that in active learning, students are enrolled
in any activity; physically or mentally rather than just listening to the teachers’
lecture. As Fritz (2002) denotes that active learning in classroom result in better
understanding and becoming a more interested to the subject, this increase the
students’ critical thinking ability. This situation also affects the student-teacher
interaction in positive manner. Ruddel (as cited in Headley and Dunston. 2000)
indicates that effective teachers help their student to be effective readers by teaching
text-processing strategies.
Ogle (1986) suggested an instructional strategy named as KWL to help
students to become effective learners and be mentally active during reading process.
It has three basic cognitive steps; accessing What I Know (K), determining What I
Want to Know (W) and recalling What I did Learn (L), as a result of reading process.
In order to conduct the study more concretely, he prepared a worksheet that enable
children to use during the thinking-reading process. According to Ogle (1986) the
first two steps of KWL are conducted by the oral discussions of teacher and student.
Students read the content and can either fill out the “What I learned” section as they
read or do so immediately following the completion of the content. Mandeville
(1994) reports that while using KWL, as a first step, students think and perform
brainstorming about the topic and write their remembering about the topic to the
“What I know” column. Then, they generate questions to be answered or to be
learned into the “What I Want to Know” column. After that, each reads the text and
fills the “What I Learned” column to answer their questions.
According to the most of the researchers, as an instructional strategy, KWL is
very effective. Bryan (1998) reports that, with the help of KWL, students learn to
5
develop suitable questions for the topic and they get used to organize their initial
knowledge about subject. According to Bonwell and Eison (1991), KWL encourages
students to engage in higher-order thinking such as analysis, synthesis and
evaluation; it is an active learning strategy. In the light of previous research, it was
pointed out that, KWL strategy has been an affective instructional activity. So, in
recent years it has been revised according to the educational needs.
There are many modifications of KWL. Sippola (1995) suggested KWLS, in
which S is the separate column for “What I still need to know”. Carr and Donna
(1987) developed KWL Plus. In order to promote reorganization and consolidation
of information, they added mapping and summarizing parts. Mandevilla (1994)
promoted the KWLA in which “A” indicates the fourth column, Affect. Bryan
(1994) offered KWWL as an extension to the KWL. The second “W” represents the
Where column.
Another strategy suggested to activate learning is the SQ3R which was
originated by Frances Robinson in 1941's. Robinson explains SQ3R as a system
constructed on survey (S), question (Q), read (R), recite (R), and review (R). Bakken,
Mastropieri and Scruggs (as cited in Huber, 2004) define SQ3R as “a package of
study strategies” The symbol “S” is the abbreviation of Search, “Q” is the
abbreviation of Question and ”3R” represents Reading, Recite and Review.
Roberts (2002) describes SQ3R as a system which helps students to
comprehend the technical information. He describes the steps briefly; in step Survey,
students first look through the chapter by reading its’ title, introduction and
summary. After that, they read the headings, subheadings, and words or phrases,
generally in bold print. Finally, students glance at the pictures, graphs, and charts. In
6
the second step, Question, students convert their chapter survey into questions;
generally they convert the titles into the question format. At the end of this process
students gain a purpose for reading and they start reading the text. During reading
process, their aim is to find out answer to the questions generated in second part. For
the next section Recite, students find out answers of questions by taking notes or, by
reading loudly. In the last section, Review, they go back to review. If students have
any suspicious about any point, they reread the content to get the clear answer.
Like KWL, there are different modifications of SQ3R. Forsyth and Forsyth
(cited in Hartlep, 2000) proposed SQ4R, in which the additional “R” refers to
“Reflect”. Sakta (1999) suggested SQRC strategy; State-Question-Read-Conclude.
Call (1991) suggests using both KWL and SQ3R strategies. According to
call, KWL and SQ3R complete each other and result in more powerful instructional
strategy. In our study as Call suggests, we combined two instructional strategies of
KWL and SQ3R to form a new Combined Reading Study Strategy (CRSS) and
investigated effect of this modified strategy on students’ achievement and attitudes
toward optics at the 9th grade.
Most of the previous studies investigated the effects of gender on high school
students’ achievement and attitudes towards physics. Wang and Andre (1991) report
that effectiveness of conceptual change text varied with gender. On the other hand,
Akyüz (2004), Chambers and Andre (1997) report insignificant interaction between
effectiveness of conceptual change text and gender.
In the light of these points, the purpose of this study is to investigate the
effects of Methods of Teaching (MOT), gender and their interactions on 9th grade
private high school students’ achievement and attitudes toward Optics. Methods of
7
teaching include three methods; Conceptual Approach with Combined Reading
Study Strategy (CA with CRSS), Conceptual Approach without Combined Reading
Study Strategy (CA without CRSS) and Traditional instruction with Combined
Reading Study Strategy (TI with CRSS).
1.1 The Main Problem
The main problem of this study is as follow;
What are the effects of the MOT, student gender and their interaction on 9th
grade private high school students’ achievement in and attitudes toward Optics at
Çankaya districts of Ankara?
1.1.1 Sub problems
The sub problem of this study is as follow;
What are the effects of the MOT, student gender and their interaction on 9th
grade private high school students’ achievement in Optics at Çankaya districts of
Ankara?
What are the effects of the MOT, student gender and their interaction on 9th
grade private high school students’ attitudes toward Optics at Çankaya districts of
Ankara?
1.2 Hypotheses
The problems stated above will be tested with the following hypotheses.
8
Null Hypothesis 1.
There will be no significant effects the MOT, student gender and their
interaction effects on the population mean of the collective dependent variables of 9th
grade private high school students’ physics achievement post-test scores and physics
attitude post-test scores when students’ age, physics achievement pre-test scores,
physics attitude pre-test scores, previous cumulative grade point average, and
previous physics course grades are controlled.
Null Hypothesis 1.1
There will be no significant effects of the MOT, student gender and their
interaction effects on the population mean of the collective dependent variable of 9th
grade private high school students’ physics achievement post-test scores when
students’ age, physics achievement pre-test scores, physics attitude pre-test scores,
previous cumulative grade point average, and previous physics course grades are
controlled.
Null Hypothesis 1.2
There will be no significant effects of the MOT, student gender and their
interaction effects on the population mean of the collective dependent variable of 9th
grade private high school students’ physics attitude post-test scores when students’
age, physics achievement pre-test scores, physics attitude pre-test scores, previous
cumulative grade point average, and previous physics course grades are controlled.
9
1.3 Definition of Important Terms
In the dictionary of COLLINS COBUILD, the term “Conceptual” is defined
as the means related to ideas and concepts formed in the mind. The word of
“Approach” is approaching a task, problem or situation in a particular way, dealing
with it or thinking about it in that way.
The CA is the instruction that based on the Conceptual Physics. It was
suggested by Paul G. Hewitt. According to Hewitt (1972) Conceptual Physics is;
studying physics by relating the concepts to the things, events that are familiar in the
everyday environment. It requires three main requirements; these are teaching
hardcore physics, shaping critical thinking and relating the role of physics to
technology in a positive future.
The CRSS is the integration of reading-study strategies of the KWL and
SQ3R.
MOT is the methods used in the study. There are three study groups and each
group is treated with different methods. These methods are; CA with CRSS, CA
without CRSS and TI with CRSS.
Physics Achievement Pre-Test Score (PREACH) is students’ achievement
score gathered from optics concept just before the study begin. Physics Achievement
Post-Test Score (PSTACH) is students’ physics achievement score on optics after the
study completed. The Previous Cumulative Grade Point Average (PCGPA) is the
students’ cumulative grade point average at the end of the first term in 2006-2007.
Students’ Previous Physics Course Grade (PPCG) is the students’ physics grades at
the end of the first term in 2006-2007. The Physics Attitude Pre-Test Score
(PREATT) is the students’ attitude score just before the study begin. The Physics
10
Attitude Post-Test Score (PSTATT) is the students’ attitude scores just after the
study completed, Physics Achievement Test (PACT) is an achievement test
developed on the concept of optics to determine the PREACH and PSTACH. Physics
Attitude Scale (PATS) is the attitude test which measures the attitudes of students
towards optics. It is used to determine the PREATT and PSTATT. Gender is the
answer of the students on the attitude scale given to the question of “what is your
gender”. Age is students’ age during the study in terms of month.
1.4 Significance of the Study
Physics is an important discipline, fundamental of other sciences. It should be
scientific bent for all students. However, because of its mathematical structure, it was
tough as an applied mathematics rather than physics. This led student became
unsuccessful and produces negative attitudes towards physics. Hewitt suggests
solving this problem with Conceptual Physics. Conceptual physics is beneficial for
all students. However, there is only a few study investigated quantitatively the effect
of conceptual approach, based on Hewitts’ idea, on students’ achievement and
attitudes towards optics.
The other point is that, students are not effective readers. In order to get
maximum gain and retain it for a long time, we have to interact with these sources.
For these aims, some strategies were suggested such as, the KWL, SQ3R and their
modification. The research studies conducted in abroad and Turkey generally
investigated the individual effects of these strategies individually. And also, there is
less number of quantitative data that supports the effectiveness of these strategies;
the articles published in these subject matters are about the instructional methods and
11
their instructional procedures. In this study, we combined strategies of KWL and
SQ3R into a new combined reading study strategy (CRSS) to investigate the effect of
it on students’ achievement and attitudes toward optics.
This study investigates the effects of the MOT, student gender and their
interactions on students’ physic achievement and attitudes towards optics. The main
and combined effects were investigated. The results provide insight into the effect of
the CA, CRSS and their interaction effects.
This study will inform teachers about the CA and CRSS. It enables teachers
to teach physics more effectively by stressing on the hardcore physics, shaping
students’ critical thinking and relating role of physics to the technology. The study
also helps students to be effective readers. They learned how to read and study the
physics concepts more effectively by checking what they know, what they want to
know, and what they have learned. The study is helpful for the physics book authors
about the organization of the contents; they should enforce students to activate their
previous knowledge and develop their interest to the content by stressing on more
conceptual ideas, enforcing students to think critically and relating physics to
technology.
12
CHAPTER 2
REVIEW OF THE LITERATURE
In order to be familiar with all of the relevant research that preceded the
present research; to integrate them with the current research; and to identify the
foundations of ideas and results on which the current research was built, the literature
relevant and necessary to understand the present study is given below.
2.1 Importance of Physics
Hewitt (1998) indicates the importance of physics with his valuable
comments, in his conceptual physics book, he reports:
You know you can not enjoy a game unless you know its rules
whether it’s a ball game, a computer game, or simply a party game.
Likewise, you cannot fully appreciate your surroundings until you
understand the rules of nature. Physics is about the rules of nature.
(Hewitt, 1998, pp. XV).
These sentences denote that, physics is very important for the human life. It
guides us to understand our surroundings and nature. With the help of physics, we
can understand the events happened around the earth, the game of life become more
meaningful.
13
Physics is the fundamental science; it is the base of chemistry, biology and
other science (Hewitt, 1998). It has important contributions to the development of
science and technology (Bilgiç, 1985).
2.1.1 Understanding of Physics
Hewitt (1972) reports that learning physics has been a scientific advantage
for most of the brilliant students, however it has been the worst and incompressible
discipline for most of average non-science students. There has been a common belief
among students that physics course allow only a few academically elite and
successful students and it despair other students.
Vondracek (1999) reports that students are generally weak in performing
algebraic manipulations. This can be serious problem for teacher who studies his
lesson non-conceptually. When teacher starts teaching their concept by solving
problems before concept development, then students are discouraged at the
beginning of the lesson, this leads disaster. Hewitt (1990) reports that in U.S. physics
courses have been the least popular courses for a long time. The situation is almost
same in Turkey also; most of the non science students see the study of physics as
boring, needless activity. What is the reason that physics course has been the least
popular science course? Where is the mistake? Who is responsible from this?
According to physicists, the mathematical nature of physics is responsible from this
result.
14
2.1.2 Mathematical Nature of Physics
The language of physics is mathematics (Hewitt, 1972). With the help of
mathematical equations, the physics and physical phenomena can easily be
expressed. The equations are meaningful guides; they indicate the relationship
between the physics term. Vondracek (1999) reports that mathematics enables
students to see how various quantities are related to each other in nature. By
considering these direct or indirect relations we can make various predictions to
solve everyday problems. If students can translate their academic language of
mathematics into physics language, then they can understand physics successfully.
But for a typical non-science student, mathematics is difficult task. “Unfortunately,
mathematical prerequisites often deter average non-science students from an
encounter with physics” (Hewitt, 1998, pp. XV). Hewitt (1990) indicates that physics
courses generally emphasize the final stage of learning cycle. When the physics
courses are introduced with this final stage, students are forced just to solve
mathematical problems at the beginning of lessons without exploring concepts.
Because of that “Physics has been a course taught as a course in applied mathematic
of the least popular kind-algebraic word problems” (Hewitt, 1990, p. 55). This kind
of approach forces students to manipulate terms in equations without understanding
the meanings. Most of them just try to solve mathematical problems without
learning, and understanding the subjects conceptually. As Hewitt (1983) indicates,
Just to solve mathematical problems without conceptual understanding is like trying
to memorize the poem without missing a word. This is not good. It does not supply
the students’ expectations. So physics course becomes an incompressible discipline,
and an unpopular course.
15
2.1.3 Students’ Ineffective Reading-Study Strategies
Sampson (2002) state that there exists lots of information sources such as,
magazines, videos, movies, internet and books. Among these sources, we still need to
the text-based sources. We learn most of our information from these written
materials. However, the research studies show that, our students are not effective
readers. They do not read and study their lessons strategically and effectively.
Hartlep and Fosyth (2000) indicate that teachers usually suffer from students’
ineffective readings and study habits. They claim that students remember little of
what they learn from textbooks and classroom lectures.
Similar situation is also valid for Turkish students; they are not effective
readers, they don’t know how to read and gather information effectively from written
materials or textbooks. The study conducted in 2001 by The International Evaluation
of Educational Achievement (IEA) supports the idea. The name of the study is,
Progress in International Reading Literacy Study (PIRLS). The study included 35
countries. Turkey enrolled into the study with 5390 students from 62 cities. The
results denote that Turkish students reading achievement found to be low; Moreover
Turkey was the 28th of 35 countries (as cited in Akyüz, 2004). Since students read
little, they could not grasp the meanings and improve themselves as effective readers.
Sweet (as cited in Marinak, Moore, Henk, Keepers, 1998) defines effective
reader as person who uses strategies to construct meaning before, during and after
reading the material. Pennsylvania Reading Assessment Advisory Committee
explains effective reading as a dynamic process. In order to construct meaning,
reader should interact with the text, activate their prior knowledge, and use reading
strategies. The results of laboratory studies indicate that, for a better retention of
16
material, there must be deeper levels of processing. For this, students’ previous
knowledge on any subject matter takes important role. Deeper level of processing
can be succeeded by extracting previous knowledge and connecting them to new
learning (Hartlep & Fosyth, 2000)
Wang and Andre (1991) underline the importance of previous knowledge on
new learning. They report that, according to Piagetian theory, new experiences are
understood by applying preexisting mental structures to the new experiences. Lord
(1980) supports Wang and Andre (1991); he states that how much students know
about something is the indicator of how easily and effectively the student will learn
and master it. Students’ life experiences, feelings and thoughts constitute their pre-
knowledge about any content. Based on these, in order to increase students’
effectiveness on reading and studying, the researchers suggest instructional strategies
of KWL, SQ3R and their extended versions. By using these methods, teachers can
bring active learning strategies into their classrooms and get successful results;
retention the knowledge for a long time, greater student teacher interaction and so on.
2.2 Solutions to the Problems
The mathematical nature of physics and students’ ineffective reading
strategies made physics as an incompressible and difficult discipline. What should be
the recipe that physics course become compressible, understandable and popular? As
a first step Hewitt (1972) suggests to depart from the beauty and elegance of
mathematical structure of physics. We know that relations in physics are
mathematical whether or not they are developed and expressed in symbolic form. If
the ideas are presented non-mathematically, exercises and problems are concerned
17
with qualitatively, than student will see the physics as compressible, understandable
and interesting discipline. It doesn’t matter the students are science or non-science
students. We should first teach our students to conceptualize, and then to
computation (Hewitt, 1983). The starting point is teaching conceptual physics.
The other point as a solution to students’ ineffective reading-study habits was
suggested by Ogle (1986) and Robinson (as cited in Robert, 2002). Ogle proposed
reading strategy of KWL and Robinson suggested study strategy of SQ3R. Since
they are adaptable, there exist also some modified versions according to the
educational needs.
2.2.1 Conceptual Physics
Hewitt (1983) describes the conceptual physics as the qualitative study of the
central concepts of physics with emphasis on mental imagery by relating the familiar
things events to the students’ everyday environment. In his another study Hewitt
(1990) identifies it as, studying physics by emphasizing on the central concepts
rather than mathematical derivations, and on critical thinking rather than numerical
computation. Hewitt (1983) also argue that he doesn’t mean to diminish the
importance of mathematical analysis and problem solving in physics instruction.
Mathematics is absolutely essential to mastering good physics. The important point
is first to develop conceptual understanding of concept than mathematical
applications to these concept.
18
2.2.1.1 Criteria of Conceptual Physics
Hewitt (1972; 1983) reports that there are three important objectives for
conceptual physics. These are; to teach hardcore physics on the everyday
environment, to shape the critical thinking of students, and to relate the role of
physics and technology toward future.
2.2.1.1.1 To Teach Hardcore Physics
Hewitt (1983) claims that physics is everywhere around us, our environment
is full of physics. The teacher’s role should be to bring it alive in the minds of
students. The important think is to get the main ideas and than improve it with good
real life examples. In the way of achieving hardcore physics, Hewitt (1972; 1983;
1990) suggests to perform activities, demonstrations, analogies, good drawings,
games, classroom discussions and as much as exemplifications from daily life
experiences. Especially, Hewitt (1983) underlines that classroom discussions are the
important part of teaching hardcore physics. He believes that as the ideas are
discussed, they are most probably being remembered. Hewitt (1983) explores
teaching hardcore physics by giving an example; teachers know that the forces occur
only in pairs, but least number of students know this fact. If one of the pair of forces
is obvious, the other pair perhaps escaped its notice. In order to make it clear,
teachers should present interesting stories. For example; “Suppose one day you get
angry and hit the wall with your fist. Your hand damaged. You bandage your hand
and a friend of you asked what happened. What you say? “Most probably, “I hit the
wall”. If you understand the conceptual physics you can say, “The wall hit my hand”.
19
2.2.1.1.2 To Shape Critical Thinking
Hewitt (1983) suggests three important points while shaping students’ critical
thinking. First, he suggests teacher to ask specific question of “how do we know that
such-and-such is valid? What evidence do we have for believing so? If we’re wrong,
how would we know?” He stresses on the Feyman’s idea of, naming the thing
doesn’t mean understanding the thing. The critical point is to distinguish what we
understand and what we don’t understand rather than memorizing new names and
labels (Hewitt, 1983).
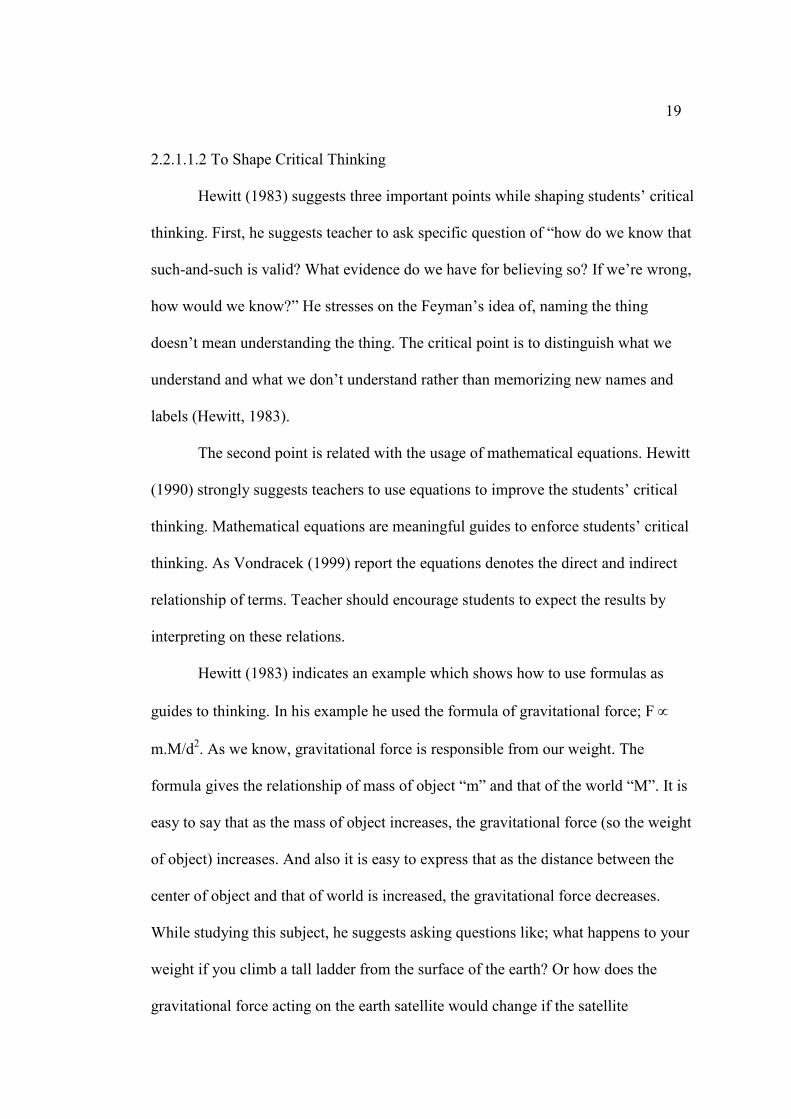
The second point is related with the usage of mathematical equations. Hewitt
(1990) strongly suggests teachers to use equations to improve the students’ critical
thinking. Mathematical equations are meaningful guides to enforce students’ critical
thinking. As Vondracek (1999) report the equations denotes the direct and indirect
relationship of terms. Teacher should encourage students to expect the results by
interpreting on these relations.
Hewitt (1983) indicates an example which shows how to use formulas as
guides to thinking. In his example he used the formula of gravitational force; F ∝
m.M/d2. As we know, gravitational force is responsible from our weight. The
formula gives the relationship of mass of object “m” and that of the world “M”. It is
easy to say that as the mass of object increases, the gravitational force (so the weight
of object) increases. And also it is easy to express that as the distance between the
center of object and that of world is increased, the gravitational force decreases.
While studying this subject, he suggests asking questions like; what happens to your
weight if you climb a tall ladder from the surface of the earth? Or how does the
gravitational force acting on the earth satellite would change if the satellite
20
temperature increased? These kinds of questions enforce students to think critically.
According to Hewitt (1983) if students learn to use the formula as a guide, they can
give the certain answer. For example, for the second question, students would learn
to give the answer such as; in the formula, there is no symbol for temperature, so the
gravitational force is independent of temperature.
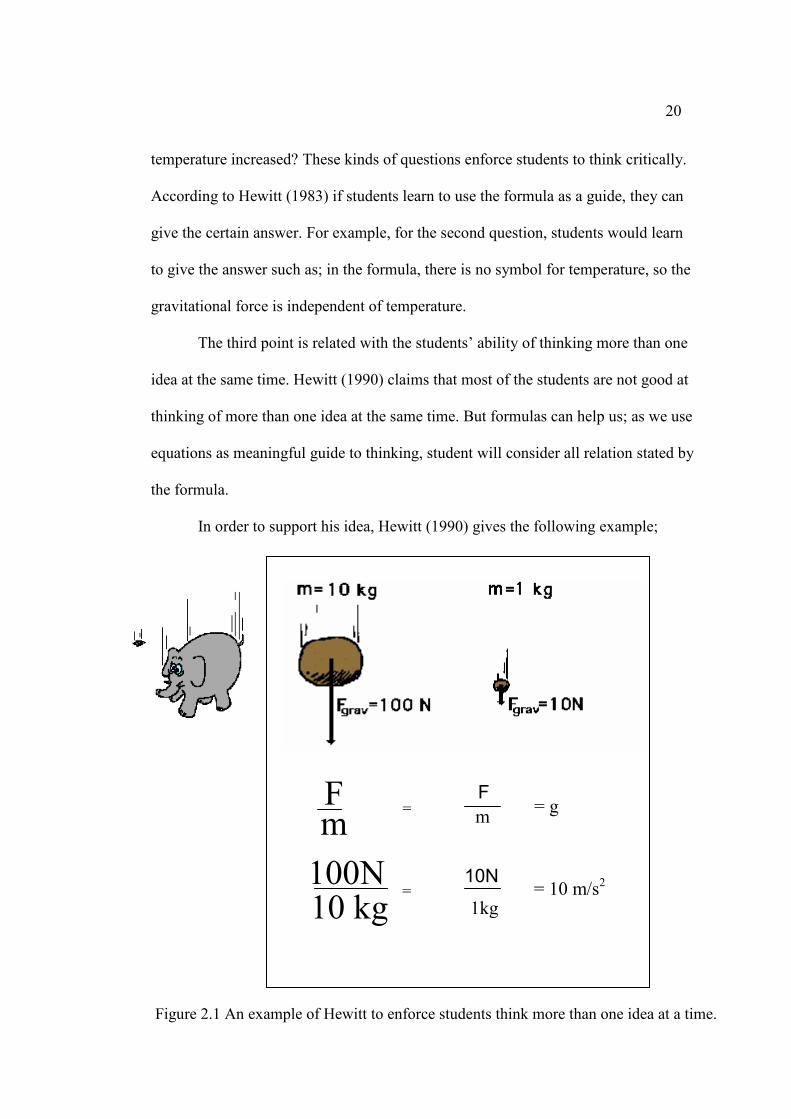
The third point is related with the students’ ability of thinking more than one
idea at the same time. Hewitt (1990) claims that most of the students are not good at
thinking of more than one idea at the same time. But formulas can help us; as we use
equations as meaningful guide to thinking, student will consider all relation stated by
the formula.
In order to support his idea, Hewitt (1990) gives the following example;
Figure 2.1 An example of Hewitt to enforce students think more than one idea at a time.
= g =
m F
m F
= 10 m/s2 =
10 kg 10N
1kg
100N
21
The Newton’s second law is expressed with the formula of F = m*a. It is the base
formula for computation. We can reorganize the formula as, a = F/m to explain why
a small stone and a big stone fall equally in the absence of air resistance. The
gravitational force acting on the big stone is larger, but it has a correspondingly
greater mass. So the ratio of force/mass, which is defined as the acceleration, is same
for both small and big stones. The gravitational force acting on small stone is small
but its’ mass also small, then the ratio of force to mass is same to that of big one. For
these situations the relative size of symbols are effective in establishing the
importance of the different magnitudes. In a similar situation, a small stone and an
elephant fall in equal time interval from the same height in the absence of air
resistance. When the students learn critical thinking in classroom, they will carry it to
the out of classrooms (Hewitt, 1990).
2.2.1.1.3 To Relate the Role of Physics and Technology
As stated, physics is the base of the technology. There is a close relationship
between physics and technology. According to Hewitt (1972) that most of the people
view the technological and scientific advances as stepping-stones to worst world.
They think that as the technology increase, the threats to the better world also
increase. The world becomes worst world. For example nuclear power plants are
effective for the production of energy. On the other hand, they are harmful to the
environment. The nuclear useless products and radiations lead to cancer and other
illnesses. There has been a negative attitude toward nuclear power plants. For
example, most of people are afraid of its’ usage and accidents. But, today the fossil
fuels are about to finish and today most of the energy requirements are met from
22
these plants. However, the science proved that the fossil fuels are much dangerous
than power plants.
According to Hewitt (1983) as a physics teacher we should balance the
negative vision of the future that is mostly resulted from misleading data, with more
accurate forecasts based on the correct and suitable information. Since physics is the
base of technology, we should construct the relationship between the subject and
technology and impart positive attitudes towards future. It should be noted that by
following the rules and steps carefully, we should eliminate the negative results of
the technology.
2.2.2 Benefits of Conceptual Physics
There are lots of benefits of Conceptual Approach on physics. Hewitt (1972)
indicates that conceptual physics saves the time; the main concern is to develop ideas
rather than solving heavy calculus-based problems.
Conceptual physics leads to the greater teacher satisfaction. Hewitt (1990)
reports that the goal of conceptual physics is not to filter the students for future
careers. The purpose of filtering of future researchers should be a function of some
other advanced courses. So, the aim is to equip the students with fundamental rules
or concepts. When all students are equipped with physics, teachers also feel
themselves happy.
Another important benefit of Conceptual Physics is that, it leads greater
student satisfaction. Brouwer (1984) indicates that conceptual understanding is
generalized to new situations. During the implementation of conceptual physics,
students become active, so they try to learn themselves, this enable themselves to test
23
out their own preconceptions about reality. In his lessons, Hewitt (1990) experiences
that conceptual physics leads to the greater student satisfaction. He added that
students studied the course of conceptual physics course feel good about themselves
and science in general. Because conceptual physics feeds other science courses also.
Unfortunately, Hewitt did not report any statistical data to support this idea in his
article.
2.2.3 Successes of the Conceptual Physics
Hewitt (1990) reports that using conceptual physics result in successful
achievements. The results of the conceptual physics studies were generally expressed
verbally, no statistical values were reported. Some of teachers using conceptual
physics expressed the success of conceptual approach verbally. Elaine Robinson,
Nancy Watson, Farmer and Paul Robinson are some of the teachers who started to
use conceptual physics in their lessons. They all report that, after using the
conceptual approach, the physics has been scientific bent for all students and the
enrollment to the physics lesson increased rapidly in the next years.
Hewitt (1990) presents that some teachers are afraid of the fact that
conceptual physics will put students at a disadvantage when they are required to take
exams need mathematical application for college entrance. The study of Paul
Hickman’s at Cold Spring Harbor High allayed their fears. He applied the New York
Regent Exam to his ninth and tenth grades conceptual physics class and that of his
twelfth graders as final exam. The result is impressive; the ninth and tenth graders
got higher scores than the twelfth graders on the exam.
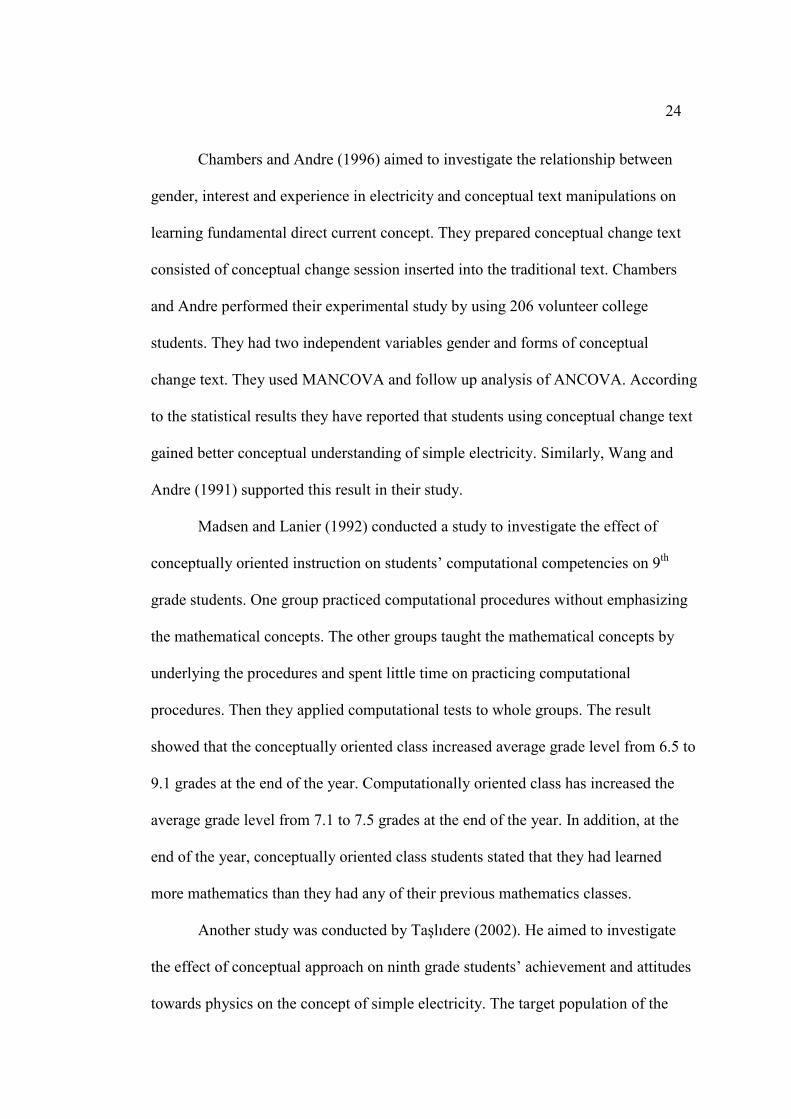
24
Chambers and Andre (1996) aimed to investigate the relationship between
gender, interest and experience in electricity and conceptual text manipulations on
learning fundamental direct current concept. They prepared conceptual change text
consisted of conceptual change session inserted into the traditional text. Chambers
and Andre performed their experimental study by using 206 volunteer college
students. They had two independent variables gender and forms of conceptual
change text. They used MANCOVA and follow up analysis of ANCOVA. According
to the statistical results they have reported that students using conceptual change text
gained better conceptual understanding of simple electricity. Similarly, Wang and
Andre (1991) supported this result in their study.
Madsen and Lanier (1992) conducted a study to investigate the effect of
conceptually oriented instruction on students’ computational competencies on 9th
grade students. One group practiced computational procedures without emphasizing
the mathematical concepts. The other groups taught the mathematical concepts by
underlying the procedures and spent little time on practicing computational
procedures. Then they applied computational tests to whole groups. The result
showed that the conceptually oriented class increased average grade level from 6.5 to
9.1 grades at the end of the year. Computationally oriented class has increased the
average grade level from 7.1 to 7.5 grades at the end of the year. In addition, at the
end of the year, conceptually oriented class students stated that they had learned
more mathematics than they had any of their previous mathematics classes.
Another study was conducted by Taşlıdere (2002). He aimed to investigate
the effect of conceptual approach on ninth grade students’ achievement and attitudes
towards physics on the concept of simple electricity. The target population of the
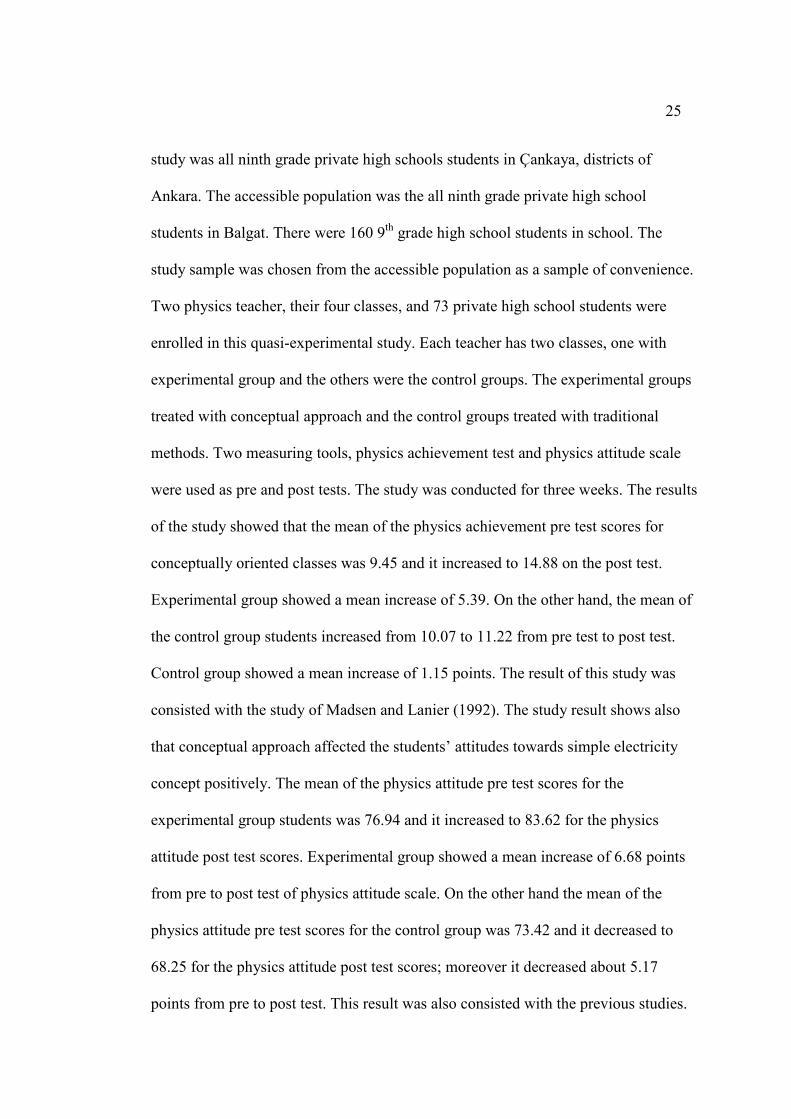
25
study was all ninth grade private high schools students in Çankaya, districts of
Ankara. The accessible population was the all ninth grade private high school
students in Balgat. There were 160 9th grade high school students in school. The
study sample was chosen from the accessible population as a sample of convenience.
Two physics teacher, their four classes, and 73 private high school students were
enrolled in this quasi-experimental study. Each teacher has two classes, one with
experimental group and the others were the control groups. The experimental groups
treated with conceptual approach and the control groups treated with traditional
methods. Two measuring tools, physics achievement test and physics attitude scale
were used as pre and post tests. The study was conducted for three weeks. The results
of the study showed that the mean of the physics achievement pre test scores for
conceptually oriented classes was 9.45 and it increased to 14.88 on the post test.
Experimental group showed a mean increase of 5.39. On the other hand, the mean of
the control group students increased from 10.07 to 11.22 from pre test to post test.
Control group showed a mean increase of 1.15 points. The result of this study was
consisted with the study of Madsen and Lanier (1992). The study result shows also
that conceptual approach affected the students’ attitudes towards simple electricity
concept positively. The mean of the physics attitude pre test scores for the
experimental group students was 76.94 and it increased to 83.62 for the physics
attitude post test scores. Experimental group showed a mean increase of 6.68 points
from pre to post test of physics attitude scale. On the other hand the mean of the
physics attitude pre test scores for the control group was 73.42 and it decreased to
68.25 for the physics attitude post test scores; moreover it decreased about 5.17
points from pre to post test. This result was also consisted with the previous studies.
26
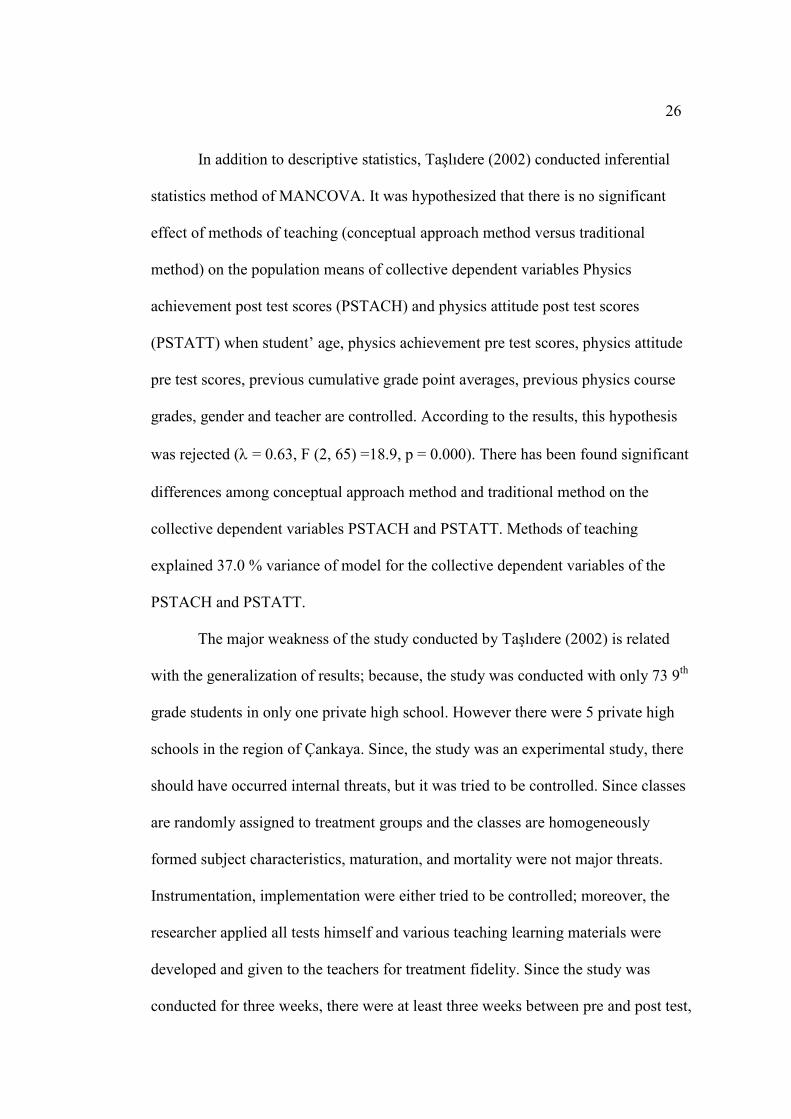
In addition to descriptive statistics, Taşlıdere (2002) conducted inferential
statistics method of MANCOVA. It was hypothesized that there is no significant
effect of methods of teaching (conceptual approach method versus traditional
method) on the population means of collective dependent variables Physics
achievement post test scores (PSTACH) and physics attitude post test scores
(PSTATT) when student’ age, physics achievement pre test scores, physics attitude
pre test scores, previous cumulative grade point averages, previous physics course
grades, gender and teacher are controlled. According to the results, this hypothesis
was rejected (λ = 0.63, F (2, 65) =18.9, p = 0.000). There has been found significant
differences among conceptual approach method and traditional method on the
collective dependent variables PSTACH and PSTATT. Methods of teaching
explained 37.0 % variance of model for the collective dependent variables of the
PSTACH and PSTATT.
The major weakness of the study conducted by Taşlıdere (2002) is related
with the generalization of results; because, the study was conducted with only 73 9th
grade students in only one private high school. However there were 5 private high
schools in the region of Çankaya. Since, the study was an experimental study, there
should have occurred internal threats, but it was tried to be controlled. Since classes
are randomly assigned to treatment groups and the classes are homogeneously
formed subject characteristics, maturation, and mortality were not major threats.
Instrumentation, implementation were either tried to be controlled; moreover, the
researcher applied all tests himself and various teaching learning materials were
developed and given to the teachers for treatment fidelity. Since the study was
conducted for three weeks, there were at least three weeks between pre and post test,
27
so testing was not a threat for the study. During the study, no important events
occurred, this means that history was not a threats.
2.3.1 KWL: The Instructional Strategy
Another important point is related with the students’ ineffective readings.
Results of the studies denote that students do not know how to read the texts
strategically. They do not know how to read, study and get maximum gain from the
physics text.
Ogle (1986) suggested an instructional strategy to make the students as
strategic and effective readers. The model helps teacher to determine what students
bring to classroom, just before reading and it enables teachers to become more
responsive to the students’ initial knowledge and interests. Ogle called his
instructional method as KWL and defines it as a three-step reading procedure. It
requires three basic cognitive steps; accessing what I know, determining What I
Want to Learn and recalling What I did Learn from the reading. In order to
implement the method more concretely, they developed a three column chart.
According to Ogle, the steps K and W are conducted with the oral discussions of
teacher and students in the classroom. Then, oral discussions are followed by the
students’ individual reading and responses to their worksheets.
Anderson (as in cited Ogle, 1986) states that students’ previous knowledge is
very important while reading and interpreting the text. But Durkins (1984) underlines
that unfortunately teachers generally do not regard the students’ initial knowledge
when teaching new content. Since the new learning couldn’t have been connected to
anywhere, they are lost in the brain of the students and after a while they remember
28
little from their reading. In order to comprehend the new information, students must
access the previous knowledge related to new information and then make
connections between previous and the new one. The KWL strongly helps students to
identify their previous knowledge to determine what they want or need to know.
During reading process students write the useful information to their sheets (Carr &
Ogle, 1987).
Fritz (2002) indicates that active learning has been very important in college
classrooms in the last years. According to her, through reading, writing, discussing
and/or problem solving, at each step, the KWL promotes active learning. Bonwell
and Eison (1991) support the idea of Fritz. They report that the KWL encourages
students to engage in higher order thinking such as analysis, synthesis and
evaluation. At each steps students are active both physically and mentally. Cantrell
(1997) reports that students, with the help of the KWL, understand the way of
reading text and investigating the problem from different perspectives.
2.3.1.1 Step K - What I Know
Ogle (1986) reports that the important think is to access the students’ prior
knowledge. This is achieved by having students brainstorm about the content. There
are two important purpose of brainstorming; first to extract what the students know
about the topic and second, to encourage students to think more general categories of
information. While conducting first purpose, the teachers’ role is to encourage
students to tell something about the content, meanwhile, the teacher observes and
records the reactions or responses of students on the board or overhead projector.
There is an important point here; Ogle (1986) suggests teachers to use a key concept
29
and then encourage students to discuss their prior knowledge. The key concept
should be enough specific that it should help students to extract their initial
knowledge.
Meanwhile, the teacher takes notes and writes them on the board or overhead
projector. After the students’ initial knowledge is determined, now it is time to
achieve the second purpose of brainstorming. At this step the teachers’ function is to
help and encourage students to categorize the information which were previously
written on the board. Ogle warns that at the beginnings of this process, students
would be unwillingness to categorize the knowledge because it could most probably
be confusing for most of them. At this stage, teacher should help them by being a
model; (s)he proposes one or two examples. Then the categorized information is
written below column K.
2.3.1.2 Step W- What do I Want to Learn?
At the end of the step K, students performed brainstorming on the topic.
Teacher determined what students brought to the class and what kinds of category of
information they have on the topic. For the second step, students generate their
questions to be answered about the topic. These questions are written into the What I
Want to Learn column. For this stage, Ogle (1986) defines the teachers’ role as to
help students to generate their questions; these questions should enforce students to
read and find out responses from the texts. According to Fritz (2002) this step allows
students to clarify their ideas and concepts in question form.
Ogle (1986) reports that with the help of this step, students gain a purpose for
reading; they read the text to find out answers to their questions. So, it would be
30
beneficial for each student to generate their own questions. It is advised to conduct
this step as a group activity. At the end of step W, each student develops their own
reasons to read the text.
2.3.1.3. Step L - What I Learned?
After steps K and W are completed, students read the text and fill the column
L with the answers of their questions. Ogle (1986) suggests teacher to ask students
whether they have found answer to their questions written on column W. Teacher
checks whether they have found answers to initially created questions. If they
couldn’t find out, teacher suggests further reading to find answers to their questions.
2.3.1.4 Successes of the KWL
Ogle (1986) reports that the KWL strategy really works for group instruction.
It helps children to become more interactive readers and they learn more from
reading. According to most of the teachers who applied this strategy, it really works.
Although their evaluations are informal and non quantitative, they state that students
mostly remember and recall the articles taught by the method of the KWL. Ogle
reports that one of the success stories comes from the principal of school. The
teachers from that school were trained about using this strategy, and they regularly
applied it. At the end of the term, principal interviewed students about the articles
studied during the term. The principal states that result was successful; students
recalled all of the articles taught by the KWL strategy. This result is consistent with
the idea of Romig and Allbee (2000). According to them students understand the
material better and retain it for longer time when they react to lecture or course
31
material. However, some of the teachers state that this method is time consuming.
Opposite to these teachers, the principal stresses that if we want our students to be
successful and learn something, it is not time consuming.
In his article Ogle (1986) reports another success story. One group of teacher
used this method, and kept the students’ worksheet from the beginning of the year
through the semester. They regularly observed, compared and evaluated the changes.
The result is valuable; students become more talented to extract their own prior
knowledge with experience and they started to use writing as beneficial adjunct. The
comparison results also denoted that with experience and guidance, students became
capable of making good categorization of information.
Fritz (2002) reports that students become more connected to the subject
matter when they learn actively. Practicing critical thinking, interacting with teacher
and their friends make them to provide positive attitudes towards lesson and school.
Some other teachers also report that, after a while students start to apply method
independently while studying lessons. It helps students to become independent
learners.
Another study was conducted by Akyüz (2004). The aim of his study was to
investigate the effect of textbook style and reading strategy on 9th grade students’
achievement and attitudes towards heat and temperature. Textbook style means
whether textbook written in conceptual physics format or in traditional format. The
reading strategy implies reading with the KWL versus reading with normal
traditional method. His target population was all ninth grade students in Ereğli
districts of Zonguldak and the accessible population was all ninth grade high school
students in government high school. The study was conducted with 123 students.
32
Half of them are male and the other half are female. The study sample was chosen
from accessible population as a sample of convenience. The researcher used factorial
design to investigate partial and combined effects of these instructional strategies.
The threats of subject characteristics, maturation were not problems, because all the
classes are approximately homogeneous and equal in size and equal in personality
characteristics. Since the researcher applied all tests himself, testing was not a
problem. The researcher also developed teaching learning materials for treatment
fidelity so implementation was not a major treats. The reliability and validity
evidences for measuring tools and other teaching learning materials were collected
and essential modification were done. The study conducted for one month of period.
Before the study, Physics achievement test and physics attitude scale were applied as
pre tests and then treatments were applied to study groups. After treatments were
finished, then post-tests applied. The data were collected by researcher, in similar
ways. The time was adequate for the completion of tests. The collected data were
analyzed by using the SPSS. The results showed that the KWL increased students’
achievement, conceptual physics text increased students’ physics attitude and their
combination increased students’ both physics achievement and attitudes towards
physics. The student’s achievements scores were evaluated out of 26. The mean of
the achievement test, for the group instructed by conceptual physics text (CPT) with
KWL increased from 4.58 to 17.19 from pre to post achievement and for the group
instructed by traditional physics text (TPT) with KWL, the mean increased from 5.53
to 15.73. The average mean also increased from 4.58 to 14.97 for the group treated
by CPT with non KWL and that of group treated by non CPT with non KWL
changed from 2.42 to 14.77. The students’ attitude scales were graded out of 100.
33
Similarly, the mean of the attitude test changed from 76.16 to 78.81 for the group
treated by the CPT with KWL, and it changed from 72.67 to 73.80 for the group
treated by the TPT with KWL. The mean of the attitude test for the group instructed
by the CPT with non KWL increased from 81.45 to 88.87 and it increased from
70.97 to 70.03 for the group instructed by the TPT with non KWL only.
Akyüz (2004) reports that there has been found significant main effects of
the CPT, KWL and their interaction on the population mean of collective dependent
variables of ninth grade students’ physics achievement and physics attitude toward
heat and temperature concept when student’ prior achievement, prior attitude, gender
and age are controlled, (for reading strategy; KWL or non KWL, λ = 0.795, p=.999
and for teaching text style; conceptual physics text or traditional physics text, λ =
0.894, p=.917 and for their interaction λ = 0.48 , p=.000). The product of CPT and
KWL increased the students’ achievement significantly (F (1, 117) = 111.3, p=.000).
It was also reported that there was no evidence that students treated with the CPT
have higher achievement than those treated with the TPT (F (1, 117) = 1.5, p=.223).
The students treated with the KWL have a greater achievement than those treated
with non KWL (F (1, 117) = 29.9, p=.000). Students treated with the CPT and KWL
at the same time have greater attitude than those treated with the TPT and non KWL
(F (1, 117) = 4.0, p=.049). The students treated with CPT have a greater attitude than
those treated with the non KWL (F (1, 117) = 11.4, p=.000). The KWL did not
change students’ attitude, moreover, there was no evidence that students treated with
the KWL have higher physics attitude than those treated with the non KWL (F (1,
117) = 1.0, p=.328).
34
2.4.1 SQ3R: The Instructional Strategy
The other solution to students ineffective reading study strategy is the SQ3R.
SQ3R is another instructional strategy suggested by Frances Robinson in 1940s.
Roberts (2002) defines the SQ3R as a study strategy standing on survey, question,
read recite and review. Lipson and Wixson (as cited in Huber, 2004) called it as “the
grand father of study strategies”. The SQ3R was developed to improve higher-order
learning from textbooks. Weinstein and Mayer (as cited in Feldt and Moore, 1999)
call it as comprehension-monitoring strategy.
Feldt and Moore (1999) explain the SQ3R briefly; during the study, students
survey to get an overview of the article, and then they work section by section to ask
questions. Following the questions, they start to read to find out answers of their
questions. Then, students recall their readings by reciting and finally they revive the
text by glancing their questions and answers.
2.4.1.1 Step S; Survey
In this step, students just look at the headings, diagrams, and topic sentences
to get an idea of what the text is about. Feldt and Moore (1999) suggest students read
the abstract first, and then survey to determine what the text is about by reading topic
sentences of introduction. This allows students to think about prior knowledge
related to topic. Bold face headings and italicized phrases are key concept to survey.
Roberts (2002) makes also similar suggestion; students should first preview the
chapter by reading its title, introduction and summary. Then they should read
headings, subheadings, words or phrases in bold face print. After all, it would be
better to glance at chapter pictures, graphs and charts.
35
2.4.1.2 Step Q; Question
In question section, Robert (2002) states that students convert their chapter
survey into questions in order to answer during reading process. The main purpose of
questioning is to stimulate curiosity and promote comprehension. The questions,
created by students, motivate students to read the text. With the help of this stage
students become mentally active.
2.4.1.3. Step 3R; Read - Recite - Review
Robinson (as cited in Feldt & Moore, 1999) indicates that students read the
material and try to answer their questions. During reading process, when students
come to related parts, they are advised to take notes for their questions.
For section, Recite, Robinson recommends to look away from the text and try
to recall the answer of each question. If there is any difficulty in recalling any
answer, then it would be better to write answer after reviewing the text.
In the last section, Review, Students go back to review and reread sections
that are unclear in order to verify their answer. They reexamine notes and try to
recall major points and sub points. Review is suggested to eliminate the forgetting.
Robert (2002) states that while conducting this strategy, students must be
conscious to the study. He makes suggestion; after students get used to apply this
model, teacher should have them stop and encourage themselves to ask how and
where their readings will be used or will be applied to somewhere else during
reading process.
36
2.4.1.4 Benefits of SQ3R
Feldt and Moore (1999) used this model to facilitate students’ learning from journal
of articles. They report that this systematic method helps students to become
independent learners. According to Huber (2004) with the help of the SQ3R, students
can be able to use a wide range of discrete comprehension skills such as selecting
main ideas, supporting details, using textbook features, identifying expository text
structure, self-questioning, summarizing, note-taking, and setting purpose for
reading.
However, Huber (2004) based some deficiencies of the SQ3R also. First,
there is overall lack of research with the SQ3R method. The research studies are
generally about on study strategies for higher-level informational text rather than on
the effectiveness of the SQ3R methods. The results are generally stated in verbal
format rather than quantitative proof.
Hartlep and Fosyth (2000) conducted a research. The research compared two
study methods, the SQ4R; survey, question, read, reflect, recite, review, and self
referencing method. The added term, Reflect, involves having students reflect about
how the reading materials relate to their life experiences. The self-referencing
instruction includes only Read and the Reflect portion of the SQ4R. In the study
three groups of college students were used. They studied a chapter from child
psychology text. One group used the SQ4R, the second group used self-referencing
and the control group did not use any special instruction. All students had an exam
just after studying the chapter and the same exam was administered again after two
weeks to the same groups. The result of the study showed that, the SQ4R and self-
referencing had almost the same effect on the result. According to the results of the
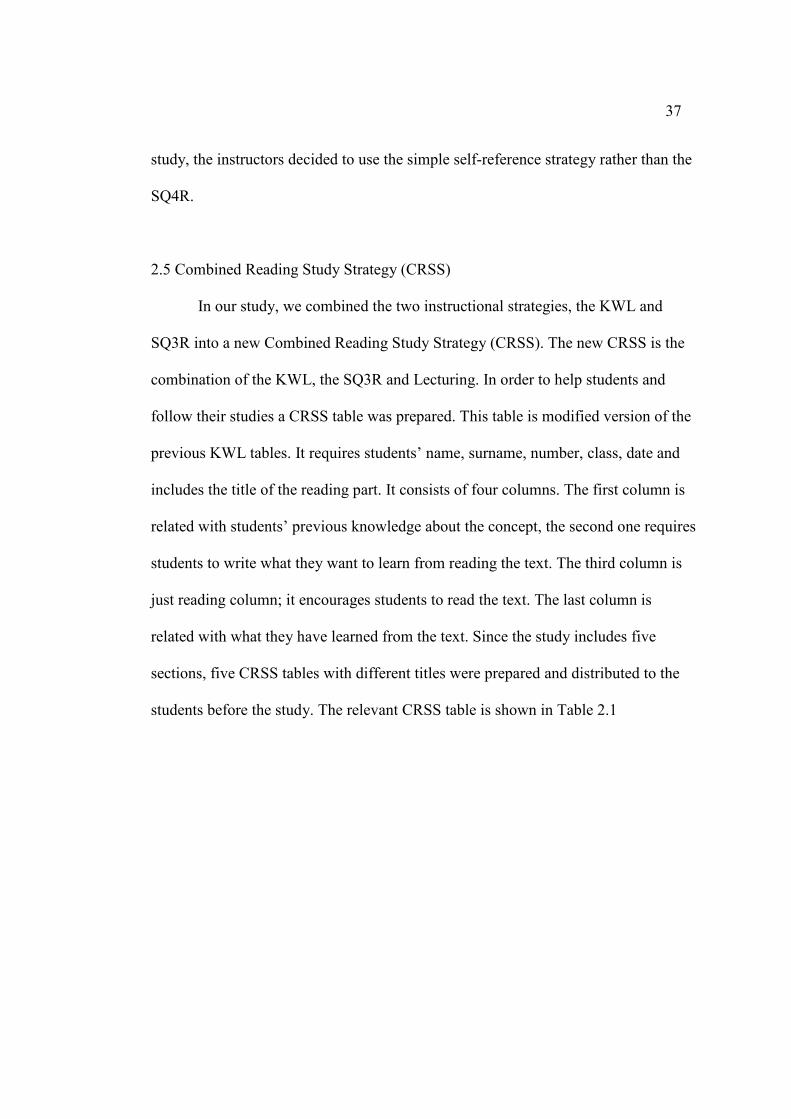
37
study, the instructors decided to use the simple self-reference strategy rather than the
SQ4R.
2.5 Combined Reading Study Strategy (CRSS)
In our study, we combined the two instructional strategies, the KWL and
SQ3R into a new Combined Reading Study Strategy (CRSS). The new CRSS is the
combination of the KWL, the SQ3R and Lecturing. In order to help students and
follow their studies a CRSS table was prepared. This table is modified version of the
previous KWL tables. It requires students’ name, surname, number, class, date and
includes the title of the reading part. It consists of four columns. The first column is
related with students’ previous knowledge about the concept, the second one requires
students to write what they want to learn from reading the text. The third column is
just reading column; it encourages students to read the text. The last column is
related with what they have learned from the text. Since the study includes five
sections, five CRSS tables with different titles were prepared and distributed to the
students before the study. The relevant CRSS table is shown in Table 2.1

38
Table 2.1 The CRSS Table Distributed to Students.
THE CRSS TABLE
Name, Surname:………………………No:………..Class:………… …./…./2007
Subject: Light and its’ properties, transparent, semi transparent and opaque materials
What I Know?
(Survey, Write)
What I Want to Know?
(Survey, Question, Write)
What I Learned?
(Recite, Review, Write)
Read
the
text
39
Fritz (2002) reports that active learning result in better understanding and by doing
so students become more interested to the subject matter, and it increases students’
critical thinking ability. Because of this reason, it was decided to start study at home
by students and continue it at school with students and teacher. The study consists of
five steps and each step also consists of some certain sub steps. The four steps which
are; writing what I know, determining what I want to know, reading the text and
writing what I learned, were conducted by students at home. The reason for this is to
save time and make students active during reading study period. The final step,
Lecture, was conducted at school by teacher and student – teacher interaction.
Ogle (1986) reports that students’ prior knowledge is important for the
implementation of new knowledge. The first step is extracting the students’ previous
knowledge about the concept and writes them into the “what I know” column of the
CRSS table. It includes two sub steps; survey (S) and write (W) what I Know. The
step “S” requires students just to look at the headings, sub-headings, diagrams, and
topic sentences. It is suggested that students should read the abstract first, and then
survey to determine what the text is about by reading topic sentences of introduction.
Bold face headings and italicized phrases are key concept to survey. It would be
better to glance at chapter pictures, graphs and charts. These activities help students
to activate their previous knowledge about the concept. The second sub step “W”
requires students to write their previous knowledge into the “what I know” column of
the table. At the end of this part, students’ previous knowledge is extracted and they
are ready to connect new knowledge into old ones.
The second step is to fill the “what I want to learn?” section. It consists of also two
sub steps; Question (Q) and write (W) What I want to know. For step “Q” student
40
converts their chapter survey into questions. The main purpose of questioning is to
stimulate curiosity and promote comprehension. Ogle (1986) reports that with the
help of this step, students gain a purpose for reading; they read the text to find out
answers to their questions. So, it would be beneficial for each student to generate
their own questions. In the second sub step “W”, each student writes their own
questions into “what I want to know” column of the table. The second step helps
students to develop their reasons to read the text.
The third step is Reading the text. Students read the text to answer their
initially developed own questions. During reading process, it is advised that when
students come to related parts, they should take notes for their questions. If the text is
not understood clearly, it is advised to reread the text
The fourth step is filling the “What I Learned Column?” It consists of three
sub steps; Recite (R), Review (R) and Write (W) what I learned. After reading the
text, students should recite; they try to recall the answer to each question without
looking at the text. If there is any difficulty in recalling any answer, students follow
the Review section. It is required that students go back to review and reread sections
that are unclear in order to verify their answers. They reexamine notes and try to
recall major points and sub points. Review is suggested to eliminate the forgetting.
After all, as a final step, students write what they have learned from the text in to
“what I learned column?”
Until this point, students follow the steps and fill the columns of the table
individually. At home, they must read the text and fill the CRSS tables. When
students come to lesson, at the beginning of the new sections, a short quiz is
administered to students. Students finish them approximately in four or five minutes.
41
Quizzes include simple conceptual questions from the reading sections. The reasons
for administering them are to help teacher to control whether students read the text
and to conclude whether they learned some certain concepts from reading and to
encourage them to read the texts for the following lessons. When students finish their
quizzes, teacher collect quiz papers and answers the questions briefly. After this step
teacher starts his instructional activity; for one or two minutes, teacher asks students
what they initially know about the concept before reading. Students’ responses are
important and teacher should be sensitive to their responses. During these, teacher
writes important general titles, statements or concepts on the left side of the
blackboard. This behavior helps students to remember what they initially know.
Then, teacher categorizes these general statements or titles and writes them on the
blackboard. For the next three or four minutes, teacher asks students before reading
the text what they would like to learn from the text? and have they been able to find
answers to their questions? And teacher asks “During the lesson what they would
like to learn further about the concept?”
Teacher takes consider the students’ responses and he can pass quickly over
the concepts which were learned well, and stress on the points which were
understood weakly. After studying the lesson, teacher again ask, whether they have
questions or points that couldn’t be understood well. If there is/are he should repeat
related part. If there still is/are weak point(s) he should recommend students further
readings from other sources.
42
2.6 Studies Conducted Related with Optics
Langley, Ronen and Eylon (1997) report that during the last two decades,
preinstruction learners’ conceptions, representations of light, sight, and common
optical phenomena have been the subject of several investigations. These researches
were conducted on different age groups. Generally, the researchers tried to elicit the
learners’ ideas during demonstrations of optical phenomena and verbal or
diagrammatic description of phenomena.
Langley, Ronen and Eylon (1997) conducted a study about geometrical optics
in the tenth grade. The purpose of the study was to elicit the conceptions, and
representations of light propagation, image formation, and sight typical to pre-
instruction learners. They used innovative instructional materials such as computer
simulation tasks and non traditional printed tasks. In order to analyze students’
conception, they formulated some questions related with light propagation, sight and
optical phenomena.
Langley, Ronen and Eylon (1997) used questionnaire. It consists of nine
questions which are related with common situations involving light and sight. The
questions required students to draw diagrams that describes and explain the
phenomena. These questionnaires were administered to 139 10th grade students in
five different schools. After the data were gathered, a frequency distribution was
performed for the ordinal values of each of the research variables in each of the
schools. They conducted Kruskal – Wallis test to these frequency distributions,
according to the results of this test, the interschool differences were found
insignificant at .05 level. Using students’ drawings, the researchers reached some
conclusions; the results showed that, students have different ideas about the light
43
propagations. About %26 of the students did not indicate light emerging from the
light source, about %11 of them indicated light emerging from the source for only
three of the four diagrams. The left, %8 of them showed that the light emanates from
the sources. It has also been observed that, students drew something around the light
source without any connection with the source. The students drew various graphics
to represent light such as, straight lines, dashes, curves, and filled-in areas. In order
to represent the light, % 40 of the students used straight lines, and approximately
%58 of them used a mixture of graphic objects. About % 78 of the students did not
show any direction only % 3 of them indicated the direction of light from both
luminous and non luminous objects to the eyes. About 5 % of the students indicated
the sight by something going from the eye to the object. These finding are consistent
with the results of the study conducted by Ramadas and Driver (1989) for the same
age group.
Ramadas and Driver (1989) report that % 50 of the students implied that there
is no sight without any light. The students also showed shadow formation with rays
streaming out of the source (the sun) radially or a beam of parallel to the sun – object
direction. The rays producing the shadow sometimes continued as far as object, but
mostly they stopped in the middle of the path. This shows that, students construct
very poor relationship between light propagation and shadow formation. While
explaining the question of “how can you see the image of object through the plane
mirror?”, most of the students used only one single continuous line from source to
the mirror, and then on to the observer. The students also explain plane mirror
observation as; the mirror reflects and so the person sees. Some of the students also
attribute the image production to the property of silvery mirror material rather than
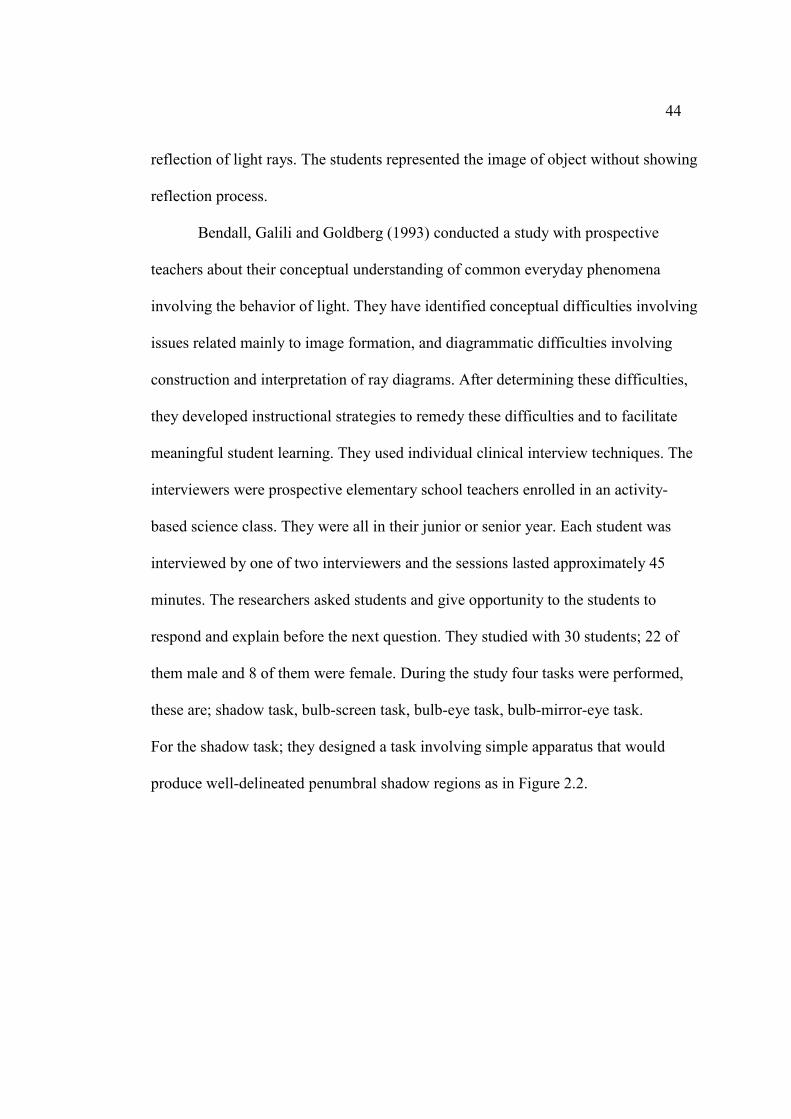
44
reflection of light rays. The students represented the image of object without showing
reflection process.
Bendall, Galili and Goldberg (1993) conducted a study with prospective
teachers about their conceptual understanding of common everyday phenomena
involving the behavior of light. They have identified conceptual difficulties involving
issues related mainly to image formation, and diagrammatic difficulties involving
construction and interpretation of ray diagrams. After determining these difficulties,
they developed instructional strategies to remedy these difficulties and to facilitate
meaningful student learning. They used individual clinical interview techniques. The
interviewers were prospective elementary school teachers enrolled in an activity-
based science class. They were all in their junior or senior year. Each student was
interviewed by one of two interviewers and the sessions lasted approximately 45
minutes. The researchers asked students and give opportunity to the students to
respond and explain before the next question. They studied with 30 students; 22 of
them male and 8 of them were female. During the study four tasks were performed,
these are; shadow task, bulb-screen task, bulb-eye task, bulb-mirror-eye task.
For the shadow task; they designed a task involving simple apparatus that would
produce well-delineated penumbral shadow regions as in Figure 2.2.
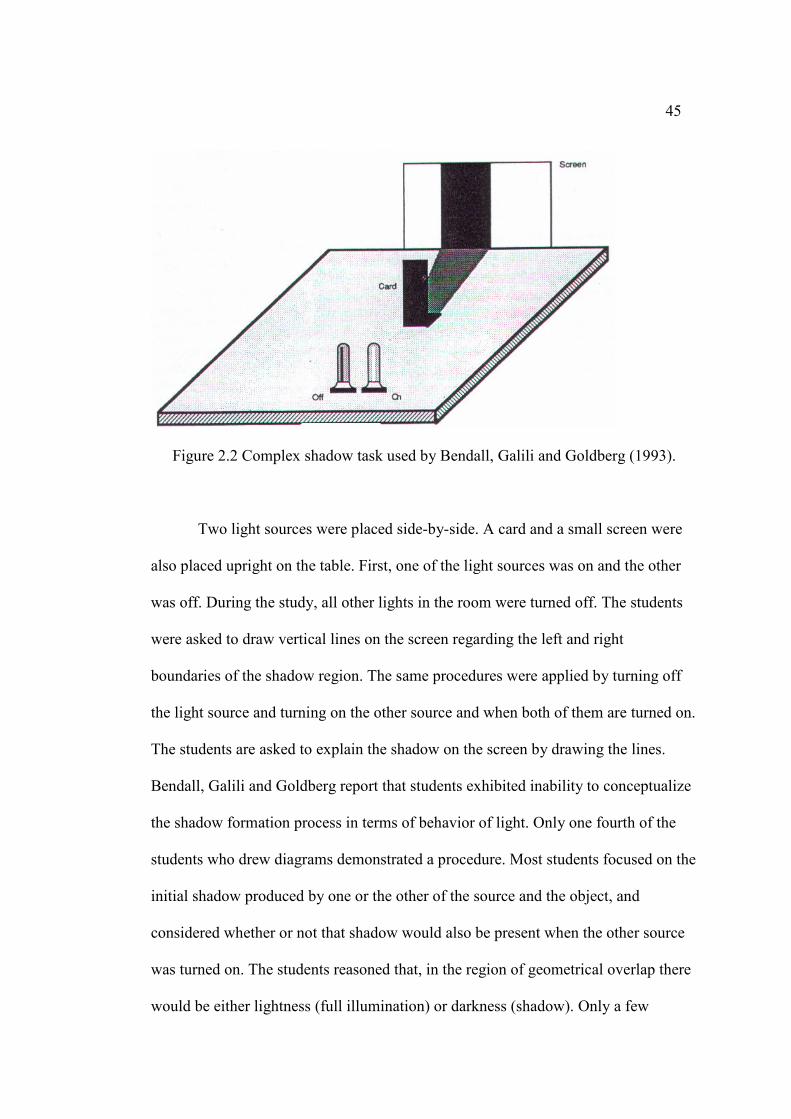
45
Figure 2.2 Complex shadow task used by Bendall, Galili and Goldberg (1993).
Two light sources were placed side-by-side. A card and a small screen were
also placed upright on the table. First, one of the light sources was on and the other
was off. During the study, all other lights in the room were turned off. The students
were asked to draw vertical lines on the screen regarding the left and right
boundaries of the shadow region. The same procedures were applied by turning off
the light source and turning on the other source and when both of them are turned on.
The students are asked to explain the shadow on the screen by drawing the lines.
Bendall, Galili and Goldberg report that students exhibited inability to conceptualize
the shadow formation process in terms of behavior of light. Only one fourth of the
students who drew diagrams demonstrated a procedure. Most students focused on the
initial shadow produced by one or the other of the source and the object, and
considered whether or not that shadow would also be present when the other source
was turned on. The students reasoned that, in the region of geometrical overlap there
would be either lightness (full illumination) or darkness (shadow). Only a few
46
students thought whether light from each source would reach each part of the screen.
Feher and Rice (1988) also noticed this tendency of students; the tendency to reason
in terms of presence of shadows, rather than in terms of the absence of light.
The remaining tasks were performed to elicit students’ ideas about: the spatial
and temporal nature of light, the role of light in seeing objects, the role of light in
image formation, and the diagrammatic representation of light. The results indicated
that, most of students have a lack of understanding of the idea that light from each
point on a source goes out in all directions. They thought that the light ray travels
only radial outward direction from the source. 8 out of 10 students stated that light
from a turned on light bulb must enter their eyes in order to see it, while only 1 of 9
thought the same for a turned off the light bulb. There has been found tendency
among the students to discuss their thinking about mirrors in terms of two separate
stages: the creation of the image and the observation of the image. About half of the
students thought that light was necessary for the image creation process, but none of
them provided a mechanism for the image formation. They implied that the image of
the object somehow went to the mirror. The students also believe that they just look
at the mirror and the image would be seen. But most of students believe that to see
the image there must be light, this light is background light, not the light coming
from mirror to the eyes. The study also denoted that most of the students interpret
“the reflection of light” as “the reflection of image”. They interpret the mirror as
making as reproducing or duplicating the objects.
Bendall, Galili and Goldberg (1993) determined students’ prior knowledge
about optics and then used conceptual change teaching. They used a number of
strategies to promote conceptual change with respect to verbal and diagrammatic
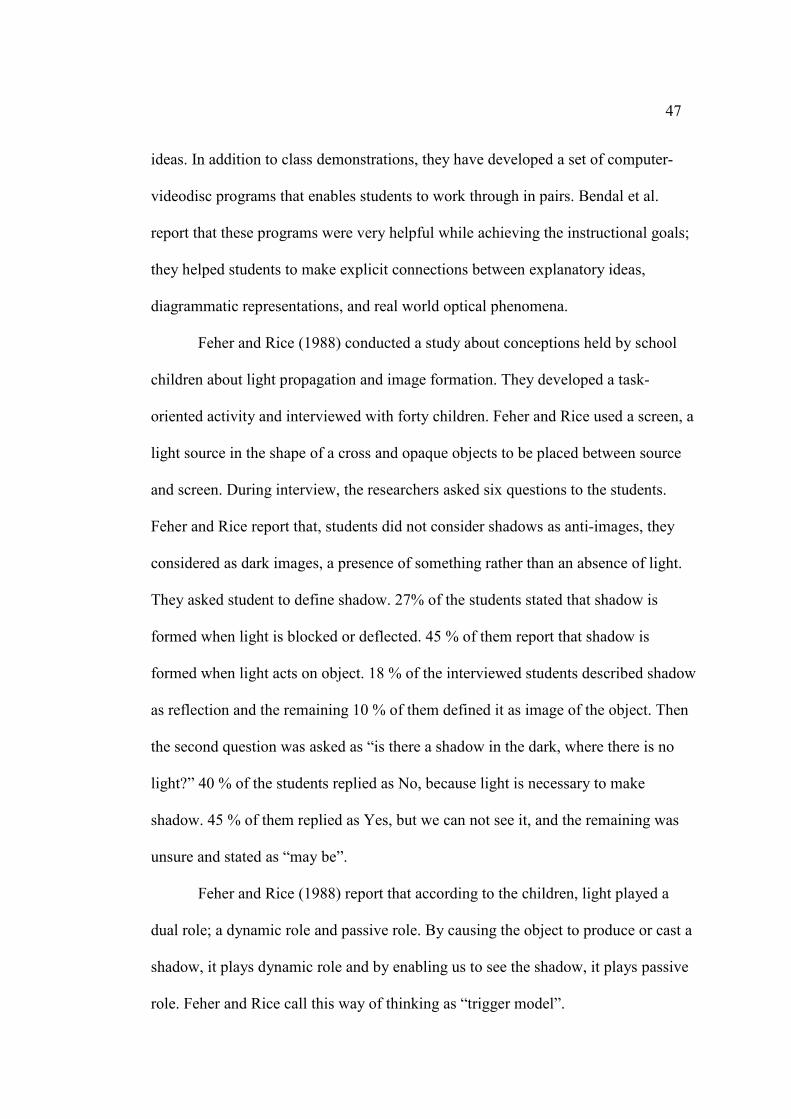
47
ideas. In addition to class demonstrations, they have developed a set of computer-
videodisc programs that enables students to work through in pairs. Bendal et al.
report that these programs were very helpful while achieving the instructional goals;
they helped students to make explicit connections between explanatory ideas,
diagrammatic representations, and real world optical phenomena.
Feher and Rice (1988) conducted a study about conceptions held by school
children about light propagation and image formation. They developed a task-
oriented activity and interviewed with forty children. Feher and Rice used a screen, a
light source in the shape of a cross and opaque objects to be placed between source
and screen. During interview, the researchers asked six questions to the students.
Feher and Rice report that, students did not consider shadows as anti-images, they
considered as dark images, a presence of something rather than an absence of light.
They asked student to define shadow. 27% of the students stated that shadow is
formed when light is blocked or deflected. 45 % of them report that shadow is
formed when light acts on object. 18 % of the interviewed students described shadow
as reflection and the remaining 10 % of them defined it as image of the object. Then
the second question was asked as “is there a shadow in the dark, where there is no
light?” 40 % of the students replied as No, because light is necessary to make
shadow. 45 % of them replied as Yes, but we can not see it, and the remaining was
unsure and stated as “may be”.
Feher and Rice (1988) report that according to the children, light played a
dual role; a dynamic role and passive role. By causing the object to produce or cast a
shadow, it plays dynamic role and by enabling us to see the shadow, it plays passive
role. Feher and Rice call this way of thinking as “trigger model”.
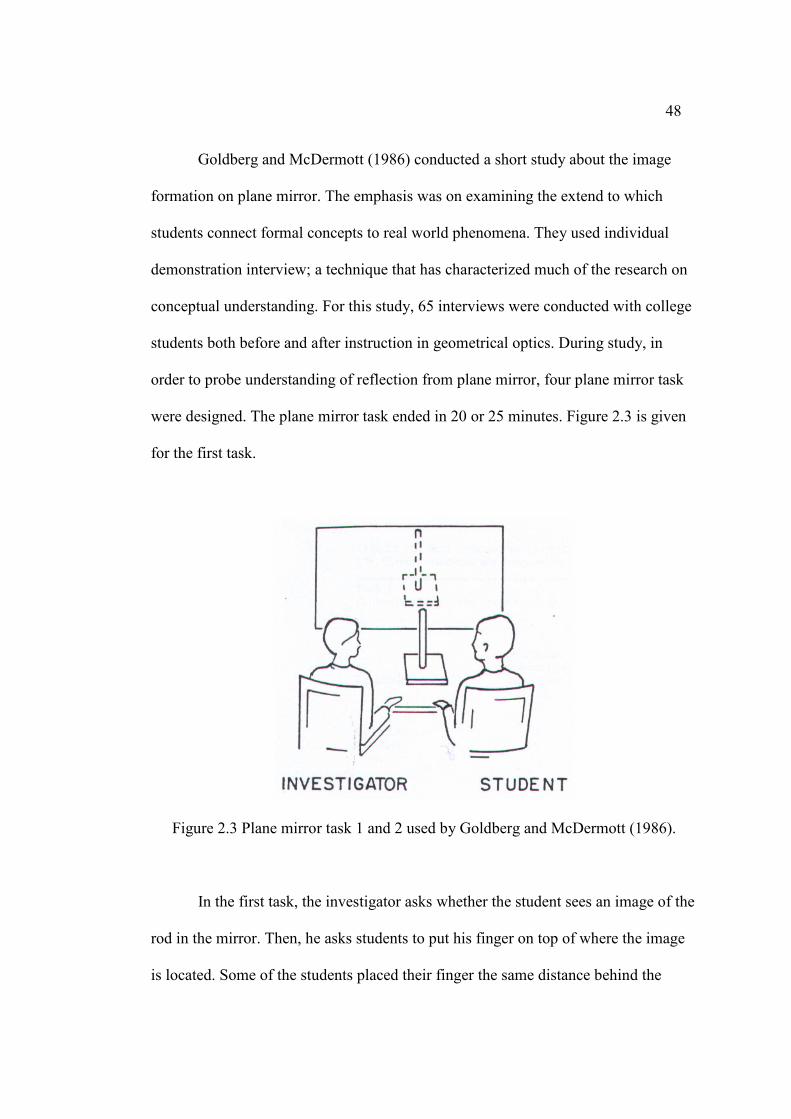
48
Goldberg and McDermott (1986) conducted a short study about the image
formation on plane mirror. The emphasis was on examining the extend to which
students connect formal concepts to real world phenomena. They used individual
demonstration interview; a technique that has characterized much of the research on
conceptual understanding. For this study, 65 interviews were conducted with college
students both before and after instruction in geometrical optics. During study, in
order to probe understanding of reflection from plane mirror, four plane mirror task
were designed. The plane mirror task ended in 20 or 25 minutes. Figure 2.3 is given
for the first task.
Figure 2.3 Plane mirror task 1 and 2 used by Goldberg and McDermott (1986).
In the first task, the investigator asks whether the student sees an image of the
rod in the mirror. Then, he asks students to put his finger on top of where the image
is located. Some of the students placed their finger the same distance behind the
49
mirror as the object was in front, some of them placed their finger on the mirror
surface.
In the second task, the student is asked to keep his finger in the same position
while considering the following questions: “If you change your place towards me,
would the image of the rod change compared to previous one? Student makes
predictions and encouraged to use of diagrams as an aid. Many students predicted
that if they were move left towards the investigator, they would have to move their
finger to the right to keep the place of image. They thought that as they move
towards left, the image of the rod moved towards right along the line of sight.
For the third task, the mirror was covered by cloth and both the student and
the rod are placed beyond the right edge of the mirror. The investigator asks the
student to predict whether the student can still see the image when both the student
and the rod are beyond the right edge of the mirror. The investigator asks student if
the mirror is uncovered, would he see the image of the rod? After the student
answered the question, instructor asks again, would I see the image of the rod? Most
of the students answered that both, they and the instructor would be able to see the
image of the rod. Students mistakenly decided that they would be able to see the
image because the image would be on their line of sight to the rod.
To remediate this misconception, Goldberg and McDermott (1986) suggest
applying the law of reflection correctly. Student can understand that an observer
would only see the image from points lying in the region bounded by reflected rays.
Goldberg and McDermott (1986) investigated the ability of students to
determine how much of an image can be seen in a mirror of given size? For this, they
used a small rectangular mirror and held it vertically about one meter in front of the
50
student. The mirror is held so that the top of the students’ head appears at the top
edge. The image of the students in the mirror would extend to about 20 cm below
neck level. Then, the instructor ask student as ”Is there anything that student could
do to see more of himself or herself” Goldberg and McDermott states that there is
nothing that can be done as long as the mirror is held fixed in vertical position. But
most of the students answered that they would see more of themselves by moving
back based on their previous experiences. Generally, students gave either one of two
explanations. They stated that when they are close to the mirror, only some of their
body would be seen, but when they move back their whole body would be within the
angle. Another half students believed that as they move back of the mirror, their
image becomes smaller and their images would be able to fit into the mirror.
Students believing this misconception neglect the corresponding decrease in the
apparent size of mirror. Because apparent decrease is proportional for mirror and
image, student always sees the same amount of his body regardless of distance from
the mirror.
Goldberg and McDermott (1986) suggest solving this problem by first
drawing the full image and then redrawing the image, when the student is far from
the mirror. It demonstrates that the extend of his image, that is visible to the mirror,
does not depend on the distance from the mirror, but only its size relative to the
observer. In real life experiences, when people wish to view their entire bodies, they
generally stand far and use a large mirror. By standing farther, they can see more of
their image with a minimum of eye movement. Students generally interpret this in
wrong manner.
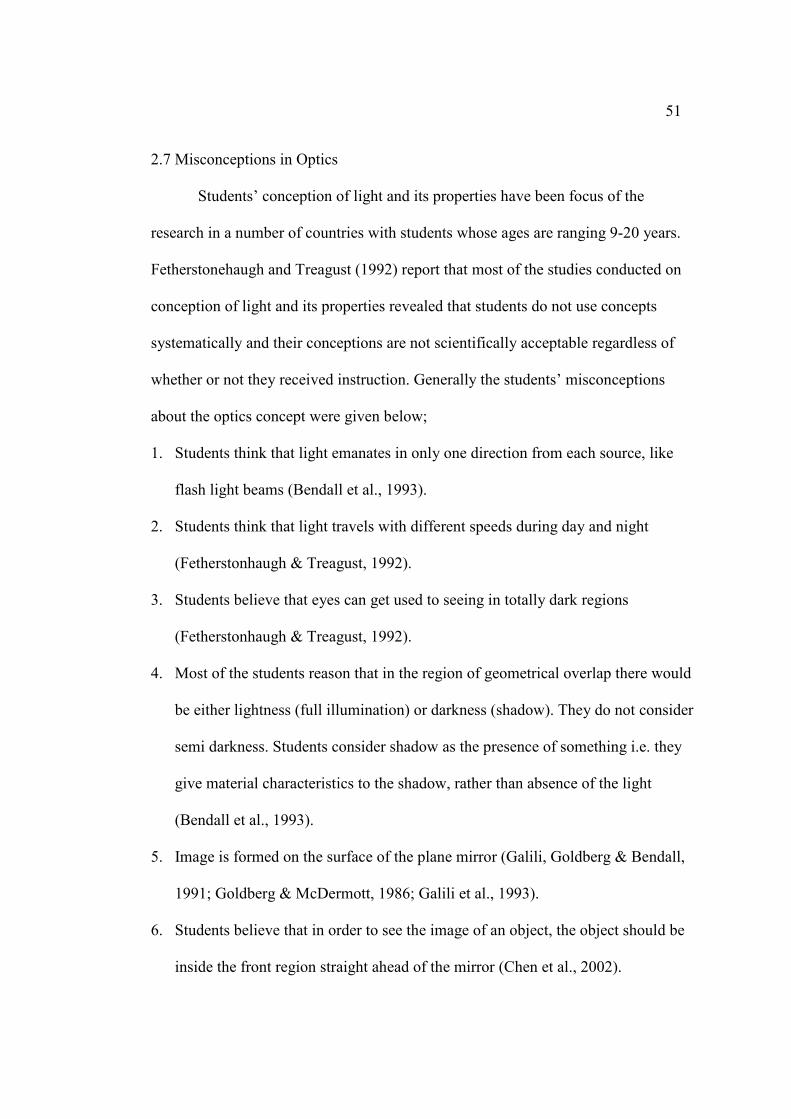
51
2.7 Misconceptions in Optics
Students’ conception of light and its properties have been focus of the
research in a number of countries with students whose ages are ranging 9-20 years.
Fetherstonehaugh and Treagust (1992) report that most of the studies conducted on
conception of light and its properties revealed that students do not use concepts
systematically and their conceptions are not scientifically acceptable regardless of
whether or not they received instruction. Generally the students’ misconceptions
about the optics concept were given below;
1. Students think that light emanates in only one direction from each source, like
flash light beams (Bendall et al., 1993).
2. Students think that light travels with different speeds during day and night
(Fetherstonhaugh & Treagust, 1992).
3. Students believe that eyes can get used to seeing in totally dark regions
(Fetherstonhaugh & Treagust, 1992).
4. Most of the students reason that in the region of geometrical overlap there would
be either lightness (full illumination) or darkness (shadow). They do not consider
semi darkness. Students consider shadow as the presence of something i.e. they
give material characteristics to the shadow, rather than absence of the light
(Bendall et al., 1993).
5. Image is formed on the surface of the plane mirror (Galili, Goldberg & Bendall,
1991; Goldberg & McDermott, 1986; Galili et al., 1993).
6. Students believe that in order to see the image of an object, the object should be
inside the front region straight ahead of the mirror (Chen et al., 2002).
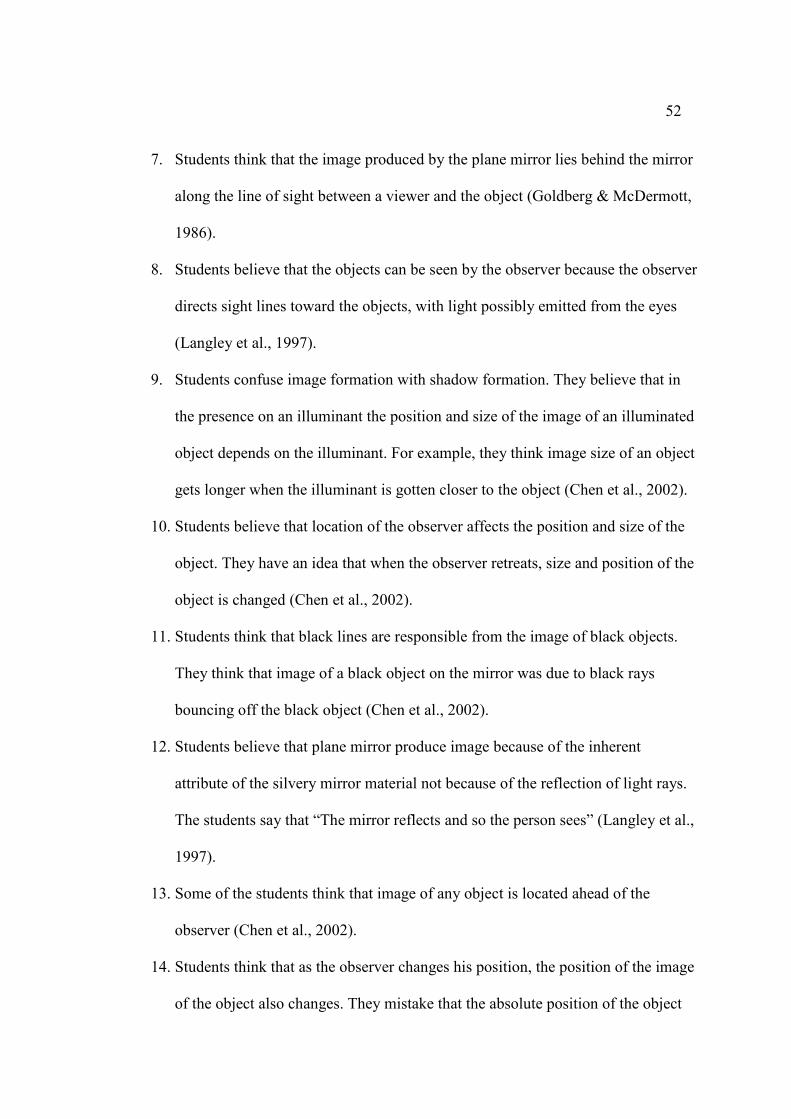
52
7. Students think that the image produced by the plane mirror lies behind the mirror
along the line of sight between a viewer and the object (Goldberg & McDermott,
1986).
8. Students believe that the objects can be seen by the observer because the observer
directs sight lines toward the objects, with light possibly emitted from the eyes
(Langley et al., 1997).
9. Students confuse image formation with shadow formation. They believe that in
the presence on an illuminant the position and size of the image of an illuminated
object depends on the illuminant. For example, they think image size of an object
gets longer when the illuminant is gotten closer to the object (Chen et al., 2002).
10. Students believe that location of the observer affects the position and size of the
object. They have an idea that when the observer retreats, size and position of the
object is changed (Chen et al., 2002).
11. Students think that black lines are responsible from the image of black objects.
They think that image of a black object on the mirror was due to black rays
bouncing off the black object (Chen et al., 2002).
12. Students believe that plane mirror produce image because of the inherent
attribute of the silvery mirror material not because of the reflection of light rays.
The students say that “The mirror reflects and so the person sees” (Langley et al.,
1997).
13. Some of the students think that image of any object is located ahead of the
observer (Chen et al., 2002).
14. Students think that as the observer changes his position, the position of the image
of the object also changes. They mistake that the absolute position of the object
53
remains the same as the observer moves. Only change is its apparent position
relative to the background (Goldberg & McDermott, 1986).
15. Students think that in a dark room if someone wants to see his/her body, he or she
should illuminate the mirror rather than himself or herself (Chen et al., 2002).
16. Student believes that they can see the light colored objects in the total darkness.
Because they emit light by themselves (Kutluay, 2002).
17. Students think that shadows of the objects are clearer when the bigger bulb is
used as a light source (Kutluay, 2002).
18. Student think that shadow is black color and light is white color. When they
overlap, they mix and form the grey color. In a similar way, they think when the
shadow and light overlap, the shadow reduce the brightness of the light (Kutluay,
2002).
2.8 Theoretical Framework of the Conceptual Approach One of the important learning theories is constructivism. Constructivism is a
philosophy of learning founded on the premise that, by reflecting on our experiences,
we construct our own understanding of the world we live in. Moreover, people
construct their own understanding and knowledge of the world, through experiencing
things and reflecting on those experiences. The Conceptual Approach is also defined
as the qualitative study of the concepts by relating them to the things, events that are
familiar in the everyday environment. With this point of view, we can put the
conceptual approach into the learning theory of constructivism.
The requirements of the conceptual physics are relevant to that of
constructivism. Within constructivist classrooms, student autonomy and initiative are
54
accepted and encouraged. The teacher asks open-ended questions and allows wait
time for responses. Students are engaged in dialogue with teacher and with their
friends and enrolled into the experiments that challenge hypotheses and encourage
discussions. By doing so, higher-level thinking is encouraged. In classrooms, raw
data, primary sources, physicals, and interactive materials are used. Constructivism
promotes social and communication skills by creating a classroom environment that
emphasizes collaboration and exchange of ideas. Conceptual physics also requires
three important goals; teaching hardcore physics, enforcing critical thinking and
relating role of physics to technology. It promotes to presents real life experiences,
analogies, demonstrations, experiments, drawing pictures and cartoons while
teaching the hardcore physics. It suggests asking conceptual questions and
conducting classroom discussions for higher-level learning and thinking. Besides
these, it requires to establish the relationship of physics and technology and impart
positive attitudes towards future. The fundamental equipments are nature, real life
experiences and events happening students’ everyday environment. So, with these
general characteristics, we could insert the conceptual approach into the
constructivism.
2.9 Summary of the Literature Review
1. Because of the nature of the course, physics has been taught as applied
mathematics course. So, it has been a least popular course in U.S. for a long
time (Hewitt, 1990, pp. 55).
2. The first course in physics should be conceptual physics. Conceptual physics
as the qualitative study of the central concepts of physics with emphasis on
55
mental imagery that relates the things events that are familiar in the everyday
environment. Teaching physics by stressing on the concepts rather than
derivations, and on critical thinking rather than computation (Hewitt, 1983;
Hewitt, 1990).
3. Studying conceptual physics require three main criteria. These are; to teach
hardcore physics on the everyday environment, to shape the critical thinking
of students, and to relate the role of physics and technology toward future
(Hewitt, 1972; Hewitt, 1983; Hewitt, 1990).
4. The important benefits of conceptual physics; time saving, teacher
satisfaction, student satisfaction (Hewitt, 1972; Hewitt, 1990).
5. Conceptual Approach is effective on the students’ computational
competencies (Madsen, & Lanier, 1992). It increases the students’ ability of
applying concepts to real situations (Rosenquist & McDermott, 1986).
6. Teachers generally suffer from the ineffective reading and study habit of
students. They usually complain that students remember little of what they
learn from their textbooks. Most of them are not affective readers (Hartlep &
Forsyth, 2000).
7. Ogle (1986) suggested an instructional strategy, which is called as KWL, to
make the students as strategic and effective readers. The model helps teacher
to determine what students bring to classroom, just before reading.
8. Ogle (1986) defines his instructional method, KWL, as a three-step
procedure; it requires three basic cognitive steps; accessing what I know (K),
determining What I Want to Learn (W) and recalling What I did Learn (L)
based on reading.
56
9. KWL encourage students to engage in higher order thinking such as analysis,
synthesis and evaluation. At each steps students are active both physically
and mentally (Bonwell & Eison, 1991).
10. SQ3R is as a study strategy standing on survey, question, read, recite and
review (Roberts, 2002).
11. With the help of the SQ3R, students can be able to use a wide range of
discrete comprehension skills such as selecting main ideas, supporting details,
using textbook features, identifying expository text structure, self-
questioning, summarizing, note-taking, and setting purpose for reading
(Huber, 2004).
12. In this study the two instructional strategies of the KWL and SQ3R were
integrated into a new Combined Reading Study Strategy (CRSS).
The summary obtained from all of these studies is that, physics should be
educational mainstream for all students. Hence, the CA is important while teaching
physics. So, the first course in physics should be conceptual physics. With the help of
conceptual physics, we can prepare more science-oriented students and make the
physics course as a popular course.
The literature review also denotes that, most of the students are not effective
readers and they do not study strategically. In this study, both instructional strategies
(the KWL & SQ3R) were combined into a new strategy named combined reading
study strategy (the CRSS).
These summary results propose that, there is a need for research to
accomplish some goals. These are;

57
1. To develop teaching/learning materials (objective list, table of specification,
table of test specification, objective-conceptual physics teaching criteria
table, the CA and CRSS handbook for teacher, conceptual based lecture notes
(CBLN) for teachers and for students, demonstrations, activities, lesson plans
(for the CA with CRSS group, the CA without CRSS group, the TI with
CRSS group), misconception activity table, the CRSS table, a guide table
about how to fill the CRSS table, short quizzes, power point presentation to
describe the CRSS, power point presentations to follow the CA lectures and
self evaluation-observation checklist).
2. To develop and validate measurement tools to asses the students’
achievement and attitudes toward optics.
3. To test partial and combined effects of the CA and CRSS on students’
achievement and attitudes toward optics in physics while controlling threats
to internal validity.
58
CHAPTER 3
METHOD
In the previous chapters, problems and hypotheses of the study were
presented, the related literature was reviewed accordingly and the essence of the
study was justified. In this chapter, population and sampling, description of variables,
development of measuring tools, procedure, and method to analyze data, assumptions
and limitations will be explained briefly.
3.1 Population and Sample
The target population of the study consists of all ninth grade private high
school students in Çankaya districts of Ankara. There are sixteen private high
schools in this region; one of them use France, twelve use Turkish, and left three
schools use English as teaching language in science lessons. The study was
conducted with two private high schools in Çankaya. The schools were selected by
convenience sampling. The accessible population is all ninth grade private high
school students from these two private high schools in Çankaya districts of Ankara.
There are approximately 227 ninth grade students whose teaching languages are
English in science lessons. This is the population for which the results of this study
are generalized. Table 3.1 gives information about the total number of classes,
number of classes included in the study, total number of students, and number of
students included in the study for the private high schools whose teaching languages
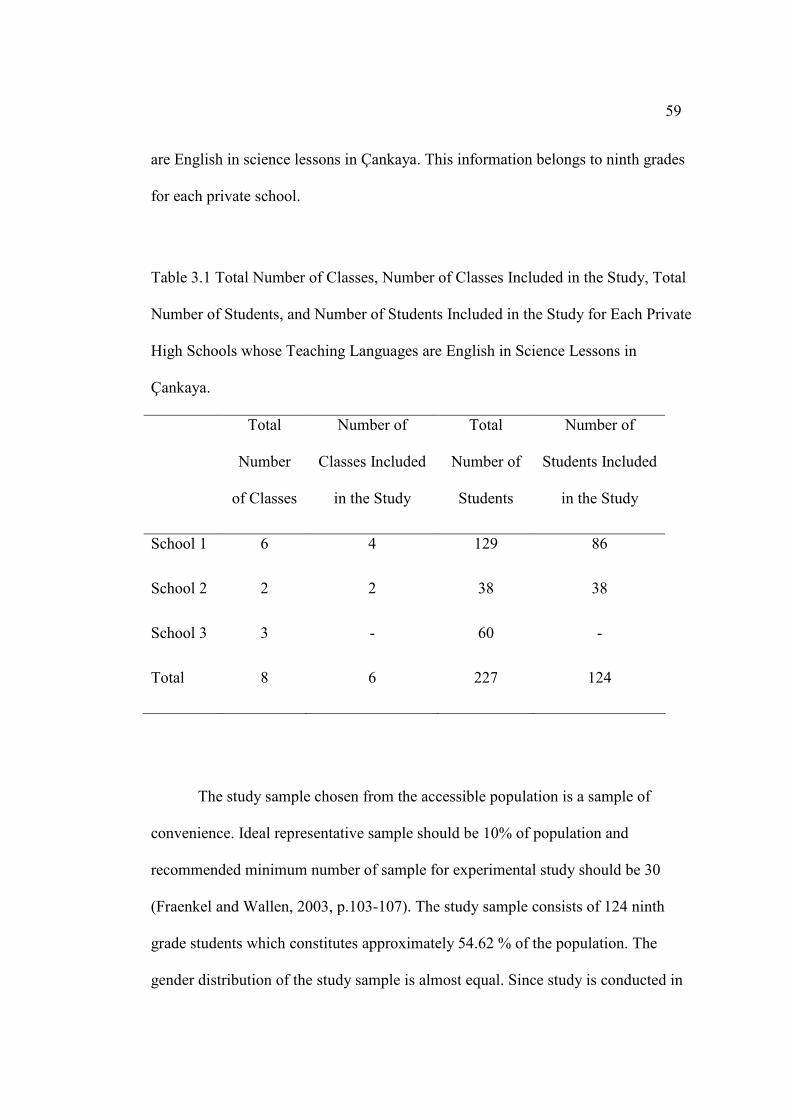
59
are English in science lessons in Çankaya. This information belongs to ninth grades
for each private school.
Table 3.1 Total Number of Classes, Number of Classes Included in the Study, Total
Number of Students, and Number of Students Included in the Study for Each Private
High Schools whose Teaching Languages are English in Science Lessons in
Çankaya.
Total
Number
of Classes
Number of
Classes Included
in the Study
Total
Number of
Students
Number of
Students Included
in the Study
School 1 6 4 129 86
School 2 2 2 38 38
School 3 3 - 60 -
Total 8 6 227 124
The study sample chosen from the accessible population is a sample of
convenience. Ideal representative sample should be 10% of population and
recommended minimum number of sample for experimental study should be 30
(Fraenkel and Wallen, 2003, p.103-107). The study sample consists of 124 ninth
grade students which constitutes approximately 54.62 % of the population. The
gender distribution of the study sample is almost equal. Since study is conducted in
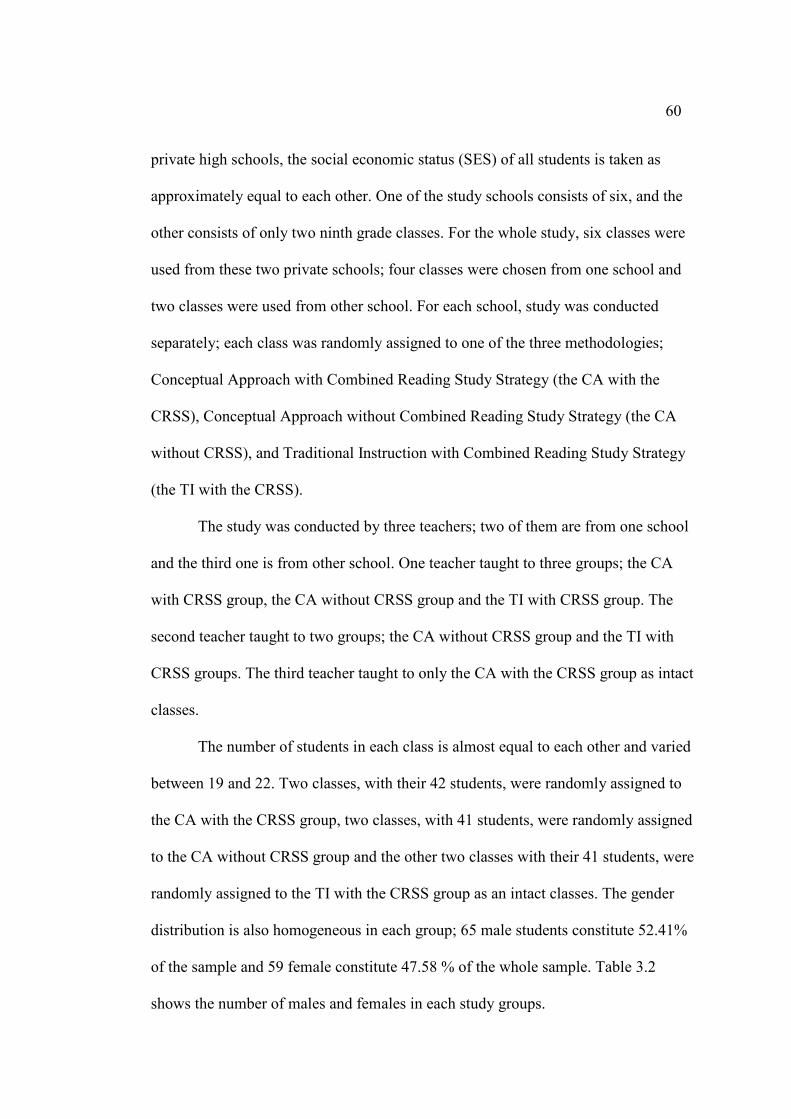
60
private high schools, the social economic status (SES) of all students is taken as
approximately equal to each other. One of the study schools consists of six, and the
other consists of only two ninth grade classes. For the whole study, six classes were
used from these two private schools; four classes were chosen from one school and
two classes were used from other school. For each school, study was conducted
separately; each class was randomly assigned to one of the three methodologies;
Conceptual Approach with Combined Reading Study Strategy (the CA with the
CRSS), Conceptual Approach without Combined Reading Study Strategy (the CA
without CRSS), and Traditional Instruction with Combined Reading Study Strategy
(the TI with the CRSS).
The study was conducted by three teachers; two of them are from one school
and the third one is from other school. One teacher taught to three groups; the CA
with CRSS group, the CA without CRSS group and the TI with CRSS group. The
second teacher taught to two groups; the CA without CRSS group and the TI with
CRSS groups. The third teacher taught to only the CA with the CRSS group as intact
classes.
The number of students in each class is almost equal to each other and varied
between 19 and 22. Two classes, with their 42 students, were randomly assigned to
the CA with the CRSS group, two classes, with 41 students, were randomly assigned
to the CA without CRSS group and the other two classes with their 41 students, were
randomly assigned to the TI with the CRSS group as an intact classes. The gender
distribution is also homogeneous in each group; 65 male students constitute 52.41%
of the sample and 59 female constitute 47.58 % of the whole sample. Table 3.2
shows the number of males and females in each study groups.
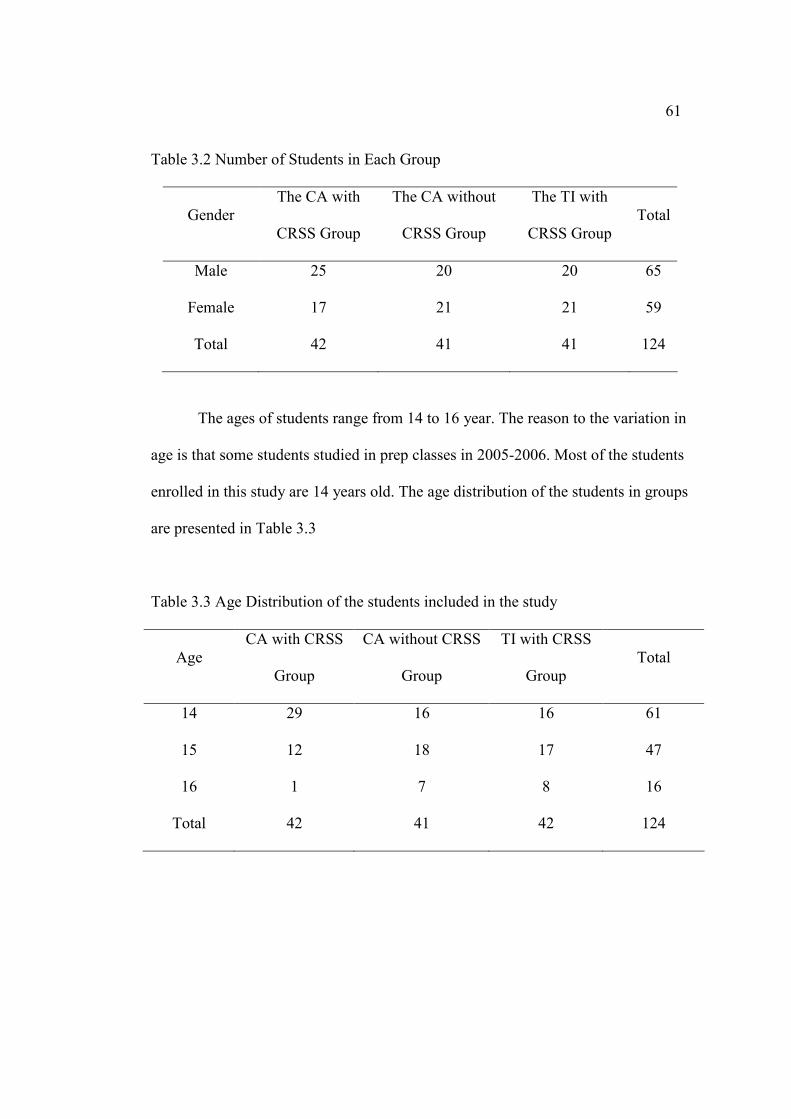
61
Table 3.2 Number of Students in Each Group
Gender The CA with
CRSS Group
The CA without
CRSS Group
The TI with
CRSS Group Total
Male 25 20 20 65
Female 17 21 21 59
Total 42 41 41 124
The ages of students range from 14 to 16 year. The reason to the variation in
age is that some students studied in prep classes in 2005-2006. Most of the students
enrolled in this study are 14 years old. The age distribution of the students in groups
are presented in Table 3.3
Table 3.3 Age Distribution of the students included in the study
Age CA with CRSS
Group
CA without CRSS
Group
TI with CRSS
Group Total
14 29 16 16 61
15 12 18 17 47
16 1 7 8 16
Total 42 41 42 124
62
3.2 Variables
There are two dependent variables and seven independent variables.
Independent variables are divided in two groups as covariates and group
membership. Table 3.4 indicates all the variables used in the study.
3.2.1 Dependent variables
The dependent variables of this particular design are Students’ Physics
Achievement Post Test Scores (PSTACH) and Students’ Physics Attitude Post Test
Scores (PSTATT). They are both continuous and interval variables in the study.
3.2.2 Independent variables
The independent variables of the present study are collected in two groups;
Set A and Set B. The Students’ age, Physics Achievement Pre-Test Scores
(PREACH), Physics Attitude Pre-Test Scores (PREATT), Previous Physics Course
Grades (PPCG), and Previous Cumulative Grade Point Averages (PCGPA) are
considered within Set A as covariates. Method of Teaching (MOT) and gender are
included in Set B as group memberships. The MOT includes three methods; the CA
with CRSS, the CA without CRSS, and the TI with CRSS. In Set A, students’ age,
the PREACH, PREATT, PCGPA, and PPCG are continues and interval variables. In
Set B, the MOT and gender variables are determined as discrete and nominal
variables.
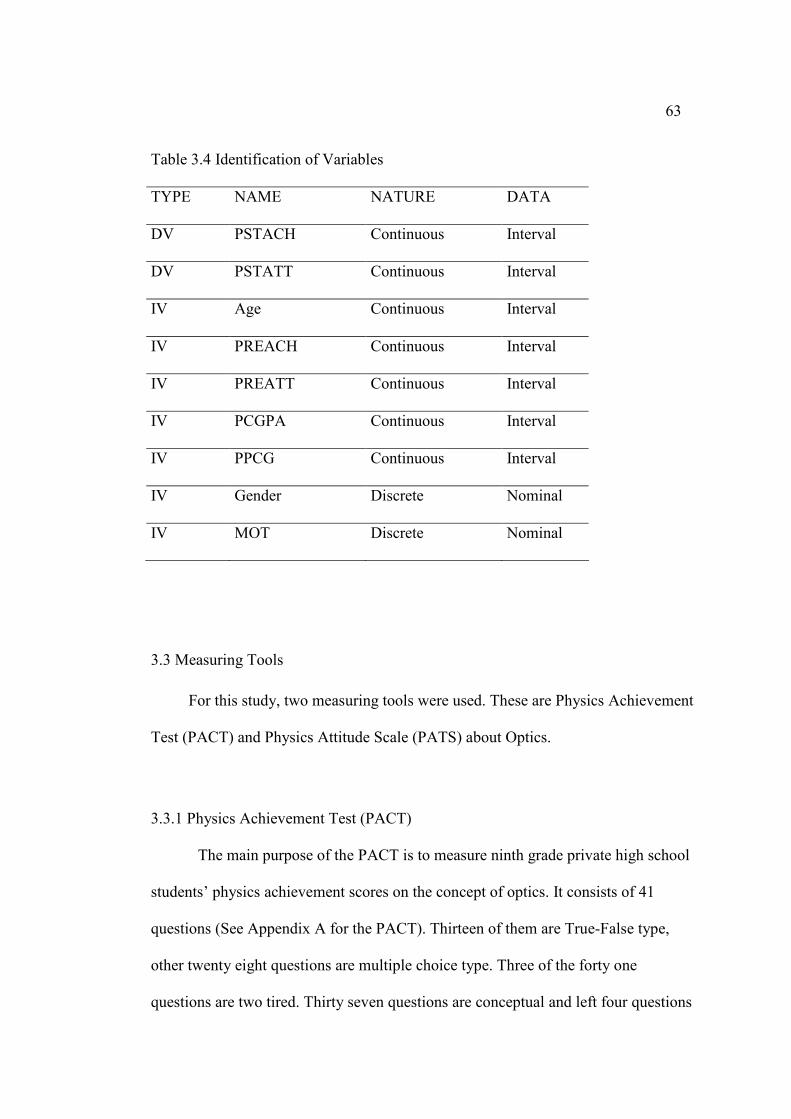
63
Table 3.4 Identification of Variables
TYPE NAME NATURE DATA
DV PSTACH Continuous Interval
DV PSTATT Continuous Interval
IV Age Continuous Interval
IV PREACH Continuous Interval
IV PREATT Continuous Interval
IV PCGPA Continuous Interval
IV PPCG Continuous Interval
IV Gender Discrete Nominal
IV MOT Discrete Nominal
3.3 Measuring Tools
For this study, two measuring tools were used. These are Physics Achievement
Test (PACT) and Physics Attitude Scale (PATS) about Optics.
3.3.1 Physics Achievement Test (PACT)
The main purpose of the PACT is to measure ninth grade private high school
students’ physics achievement scores on the concept of optics. It consists of 41
questions (See Appendix A for the PACT). Thirteen of them are True-False type,
other twenty eight questions are multiple choice type. Three of the forty one
questions are two tired. Thirty seven questions are conceptual and left four questions
64
are quantitative. Reason for preferring True-False and multiple-choice type items is
that it is easy and quick to administer, and it enables researcher to evaluate the results
objectively. Questions are selected from the various articles printed in the literature,
ÖSS exams (Öğrenci Seçme Sınavı), Conceptual Physics Books, and test banks.
Questions 14, 15, 17, 18, 29, 32, 34, and 35 are taken from the articles (Bendall,
Galili & Goldberg, 1993; Feher & Rice, 1988; Langley, Ronen & Eylon,1997;
Goldberg & McDermott, 1986) published in literature, questions 25, 28 and 39 are
asked questions in ÖSS 95, ÖSS 98 and ÖSS 93 (Kubilay, 2004; Polat & Arık,
2006). Questions 27, 33, 37, 38, and 41 are modifications of the questions asked in
ÖSS 89, ÖSS 99, ÖSS 2005, ÖSS 98, and ÖSS 2005 respectively. For these
questions, the modifications were conducted by the researcher. Questions 19-24 are
taken from Conceptual Physics and Conceptual Physics Laboratory Manual written
by Paul G. Hewitt, questions 16, 26, 30, 31, 36, and 40 are taken from Oran Physics
9, written by Rahim Polat and Ahmet Arık.
3.3.2 Physics Attitude Scale (PATS)
The main purpose of the PATS is to measure the ninth grade private high
school students’ attitudes towards concept of optics. For the study, the scale
developed by Taşlıdere (2002) was modified according to the concept of optics. It
consists of 24 questions (See Appendix B for the PATS). The questions were rated
on a 5-point likert type response format (absolutely disagree, disagree, neutral, agree,
and absolutely agree). Taşlıdere (2002) applied scale to 160 9th grade students and
conducted a reliability analysis by using SPSS. The value of Cronbach alpha (α) was
calculated as 0.944. Taşlıdere (2002) also conducted Varimax Rotated Factor
65
analysis and found five dimensions such as; Enjoyment, Self-Efficacy, Importance of
Physics, Achievement Motivation and Interest Related Behavior.
The researcher applied PATS to 124 ninth grade private high school students
and conducted reliability analysis and Varimax Rotated Factor analysis. The value of
Cronbach alpha (α) was calculated as 0.936. The results of the factor analysis also
denoted that there were five dimensions in the scale as in the study of Taşlıdere.
Enjoyment is students’ personal interest toward optics. Self-Efficacy is the belief in
one’s capabilities to organize and execute the sources of action required to manage
prospective situation. Importance of Physics deals with the importance of optics. It
measures to what degree optics is important for students. Achievement Motivation is
a combination of psychological forces, which initiate, direct, and sustain behavior
toward successful attainment of some goal, which provides a sense of significance.
Interest Related Behaviors respond to the question to what degree that students’ like
to do out of the class activities related to optics.
The dimensions and the related items of these dimensions are shown in Table
3.5.
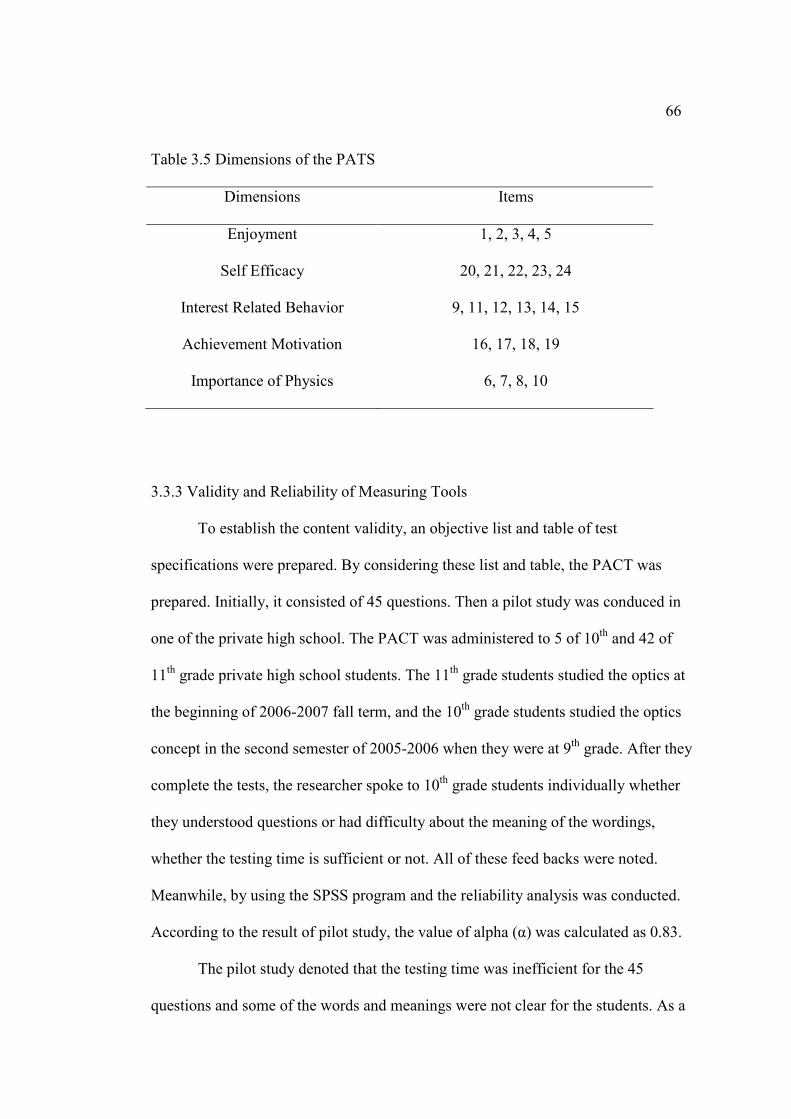
66
Table 3.5 Dimensions of the PATS
Dimensions Items
Enjoyment 1, 2, 3, 4, 5
Self Efficacy 20, 21, 22, 23, 24
Interest Related Behavior 9, 11, 12, 13, 14, 15
Achievement Motivation 16, 17, 18, 19
Importance of Physics 6, 7, 8, 10
3.3.3 Validity and Reliability of Measuring Tools
To establish the content validity, an objective list and table of test
specifications were prepared. By considering these list and table, the PACT was
prepared. Initially, it consisted of 45 questions. Then a pilot study was conduced in
one of the private high school. The PACT was administered to 5 of 10th and 42 of
11th grade private high school students. The 11th grade students studied the optics at
the beginning of 2006-2007 fall term, and the 10th grade students studied the optics
concept in the second semester of 2005-2006 when they were at 9th grade. After they
complete the tests, the researcher spoke to 10th grade students individually whether
they understood questions or had difficulty about the meaning of the wordings,
whether the testing time is sufficient or not. All of these feed backs were noted.
Meanwhile, by using the SPSS program and the reliability analysis was conducted.
According to the result of pilot study, the value of alpha (α) was calculated as 0.83.
The pilot study denoted that the testing time was inefficient for the 45
questions and some of the words and meanings were not clear for the students. As a
67
first step, the researcher determined the questions measuring the same objective.
Then, four of the forty-five questions were extracted from the PACT. The wordings
and meaning of the statements were reexamined and new modifications were
performed; the unclear statements were changed with clear and understandable
statements and words.
After these modifications, the PACT and PATS were given to one instructor,
one research assistance from the department of Science and Mathematics Education
at METU, four private high school physics teachers, and an English teacher from
U.S. These people were explained about the main purpose of the study. They
checked the PACT and PATS according to the content, format and appropriateness
of items to the grade level. They also gave feedbacks about the readability and
whether questions are understandable or not. By regarding their feedbacks, some of
the figures and pictures were redrawn, and some of the sentences were decreased and
became more understandable.
The final form of the PACT and PATS were given and they were
administered to 124 ninth grade students as pre-tests in two private high schools. The
data were collected, and by using SPSS, reliability analysis was performed. The
value of alpha (α) was calculated as 0.94 for the PREATT and 0.37 for the PREACH.
The value of alpha (α) was calculated as 0.94 for the PSTATT and 0.82 for the
PSTACH.
3.4 Teaching/Learning Materials
In order to supply treatment fidelity, various teaching learning materials were
prepared for the study. The main purposes of developing them are to supply
68
consistency between teachers and to conduct study as intended. These teaching
learning materials are; objective list, table of test specification, objective-conceptual
physics teaching criteria table, conceptual approach and combined reading study
strategy handbook for teacher, conceptual based lecture notes (CBLN) for teachers
and for students, demonstrations, activities, lesson plans (for the CA with the CRSS
group, the CA without CRSS group, and the TI with the CRSS group),
misconception-activity table, the CRSS table, a guide table about how to fill the
CRSS tables, short quizzes, power point presentation to describe the CRSS, power
point presentations to follow the CA lectures and self evaluation-observation
checklist.
3.4.1 Objective List and Table of Test Specification
In order to satisfy the content validity on the concept of optics, an objective
list, and table of test specification were prepared. The objective list includes four
main objectives and 105 specific objectives on the concepts of; light and its’
properties, shadows, colors, reflection and plane mirrors (See Appendix C for the
Objective List prepared for the concept of optics). Table of test specification also
includes the objectives of the lesson. These objectives were categorized according to
the Blooms’ Cognitive Domain of Taxonomy of Educational Objectives. The table
gives information about which objectives are measured by which questions of the
PACT. Only numbers denote the objective number and the numbers included in
parentheses shows the question number (See Appendix D for Table of Test
Specification prepared for the concept of optics).
69
3.4.2 Objective-Conceptual Physics Teaching Criteria Table
The CA requires three important conditions, these are mainly; teaching
hardcore physics, shaping students’ critical thinking and relating role of physics to
the technology. This table includes objectives versus conceptual physics conditions;
it guides teachers about which conceptual physics criteria are used while
implementing specific objectives. Teachers can easily understand which objectives
are taught by which conceptual physics teaching criteria when they look at the table.
Objective-Conceptual Physics Teaching Criteria Table is important for treatment
fidelity and it satisfies consistency between teachers while they are performing the
CA (See Appendix E for the Objective-Conceptual Physics Criteria Table prepared
for the concept of optics).
3.4.3 The Conceptual Approach and Combined Reading Study Strategy Handbook
for Teachers
In order to inform teachers about the CA and CRSS, a hand book was
prepared. The hand book gives information about Conceptual Physics and its’
conditions. Teachers can easily understand these conditions and how to achieve
them. The handbook also informs teachers about the CRSS. It first gives information
about the reading strategies of KWL and SQ3R, separately. After that, it explains our
CRSS and its’ steps. The handbook is important for treatment fidelity (See Appendix
F for the Conceptual Approach and Combined Reading Study Strategy Handbook for
Teachers).
70
3.4.4 Conceptual Based Lecture Notes for Students and Teachers
In this study, conceptual physics constitutes the base of the CA. In order to
study the lectures conceptually, two different CBLN were prepared; one is for
students and the other is for teachers. The CBLN were developed by making use of
wide range of sources (Booth, MCDuel & Sears, 1999; Hewitt, 1999; Hewitt, 1998;
Polat & Arık, 2000; Tolman, 1995; Yaz, Aksoy, Candan, Tekin, Özer, Kahraman,
Şahan, Teymur & Vardar, 1996). The CBLN includes four main sections; properties
of light, shadows, colors, reflection and plane mirrors. They were designed by
regarding the conceptual physics teaching criteria (teaching hardcore physics,
shaping critical thinking, and relating role of physics to the technology). The aim of
the CBLN is to explain the optics conceptually; they include lectures, figures,
pictures, cartoons, experimental activities, demonstrations, examples, questions,
home works, home projects, concept development practices, link to technology, link
to zoology, link to biology, doing physics, and think and explain parts. The main
purposes of these notes are to help student while teaching hardcore physics,
enforcing their critical thinking and relating role of physics to technological
developments. The difference between student copy and teacher copy is that, the
teacher copy includes the solutions and answers of the examples, problems, and
some special activities. There are also some important instructions and notes to be
stated while implementing the concept. These parts are included in parenthesis (See
Appendix G for the CBLN prepared for the concept of optics).
71
3.4.5 Demonstrations
Demonstrations are important part of conceptual teaching. Since the
equipments are fragile and expensive, most of them were performed by teachers.
Information related to demonstrations included in lesson plans; they inform teachers
when and how to conduct them.
3.4.6 Activities
Experimental activities are important part of the conceptual physics. They
help students while teaching hard core physics and improving their critical thinking.
The activities are included in lesson plans and CBLN. For whole study 12 activities
were prepared. Some of them were taken from laboratory manuals of conceptual
physics books and some of them were designed by the researcher.
3.4.7 Lesson Plans
In the study, there are three different study groups; the first group was
instructed by the CA with the CRSS, the second group was instructed by the CA
without CRSS, and the third group was instructed by the TI with the CRSS. In order
to standardize teachers’ way of teaching and prevent from any bias, three different
protocols were prepared for the teachers (See Appendix H for lesson plans prepared
for the CA with CRSS groups, the CA without CRSS groups and the TI with CRSS
groups). These protocols are important for treatment fidelity and they satisfy the
consistency between teachers, and enable them to implement methods as relevant to
their theories. They guide teachers how to act, when and what to do while achieving
their objectives.
72
3.4.8 Misconception - Activity Table
Most of the researches point out that generally students are having difficulties
while analyzing optics conceptually. In the light of literature review, various
misconceptions were determined and aimed to eliminate them while applying the
instructions. Misconception-Activity table consists of two columns. The first column
presents the misconceptions, and the second column denotes activity. It was aimed to
remedy the misconception by the activities given in the second column of the table.
Teachers can easily understand which misconception is eliminated by which activity
(See Appendix I for the Misconception-Activity Table).
3.4.9 The CRSS Table
One of the important legs of this study is students’ reading about the concepts
before coming to lessons. The reading activity must be done according to some
special criteria; they first reveal what they know about the concept initially by
surveying the text. They ask themselves what they would like to learn from the text
and prepare their questions. After these two steps, students gain aims to read the text,
and then they start reading. During reading process, students try to find out answers
to their initially created questions. As a last step, they write what they have learned
from the text. During the study five sections were studied. Hence, in order to help
and guide students on their reading, five CRSS tables were prepared. Each table
belongs to one section and the titles were written on each table by the researcher
before distributing them to the students. Each table also requires student to write
their names, surnames, classes and numbers on it. Reason to this is that, it helps
73
teachers to follow students’ positions and control whether students bring their tables
or not. The CRSS table includes four columns; What I Know, What I Want to Know,
Read the Text, and What I Learned columns. Students must fill the table before the
lessons. As examples, two tables were given in Appendix J. One of them is empty
and the other table is filled by students (See Appendix J for the empty and filled
CRSS tables in the study).
3.4.10 A Guide Table about How to Fill the CRSS Table
In order to help teacher and student, a guide table about how to fill the CRSS
table was prepared. It includes short instructions about what to do and how to fill the
table during the reading study process. It has four columns and short instructions
(See Appendix K for A Guide Table about How to Fill the CRSS Table).
3.4.11 Short Quizzes
In order to check students reading and enforce them for further readings five
different short quizzes were prepared by the researcher (See Appendix L for the
Short Quizzes). Each quiz belongs to different sections. They include short and easy
questions about the passages in the text. The main purposes of administering these
quizzes are to control whether students did read the text really or not? And to give
message of their readings are being controlled by the teachers. It was also aimed to
enforce students’ readings for the next sections as homework.
74
3.4.12 Power Point Presentation to Describe the CRSS
To apply the CRSS strategically, students must be aware of it. To achieve
this, a presentation was prepared by the researcher (See Appendix M for Power Point
Presentation Describing the CRSS). The presentation first gives information about
the KWL, SQ3R and then it explains the CRSS. It was aimed that, at the end of the
presentation, each students should have understand the method; its’ steps and their
responsibilities before reading, during reading and after reading.
3.4.13 Power Point Presentations to follow CA Lessons
Figures, animations, cartoons and classroom discussions are important parts
of the CA while teaching hardcore physics. In order to help teachers, four different
power point presentations were prepared. These are about; light and its properties,
shadows, colors, reflection, and plane mirror. The presentations were prepared
relevant to lesson plans and criteria of conceptual physics. It includes important
lecture notes, figures, animations, demonstrations, cartoons, classroom discussions
questions, normal questions, examples and homework problems. The lessons were
studied over these presentations in the study groups of the CA with the CRSS and the
CA without CRSS (See Appendix N for Power Point Presentations to Follow the CA
Lessons).
3.4.14 Self Evaluation - Observation Checklist
The self evaluation – observation checklist was prepared for the treatment
verification. It was not possible to follow the lesson in all groups at the same time, so
a checklist was prepared for teachers to evaluate themselves about their lessons (See
75
Appendix O for Self Evaluation - Observation Checklist). This list also used by the
researcher to evaluate the lessons. The checklist consists of four parts; the first part is
related with physical conditions of classroom, the second part is related with
teachers’ behaviors, their relations to students, and reinforcements given to students.
The third part is about the students’ behaviors; whether they are eager to participate
or not to the lessons? The final part is related with the application of the
methodology; it asks teacher whether is (s)he studied his lessons according to the
lesson plans or whether (s)he could apply methods strategically or not? The
questions were rated on a 3-point likert type response format (Yes, No or Partially).
3.5 Procedure
The study started with a detailed review of the literature. After determining
the keyword list, the databases of Educational Resources Information Center (ERIC),
International Dissertation Abstracts, Social Science Citation Index (SSCI),
Ebscohost, science direct and Internet (Goggle) were searched systematically.
Previous studies conducted in Turkey were also searched from the YOK, Hacettepe
Eğitim Dergisi, Eğitim ve Bilim, and Çağdaş Eğitim Dergisi. Photocopies of
obtainable documents were taken from METU library, library of Bilkent University
and TUBĐTAK Ulakbim. In case of new recent articles on the study topic, the
researcher continuously checked and followed the literature.
The PATS, PACT and all teaching/learning materials as mentioned in Section
3.3 and 3.4 were developed. These materials (objective list, table of test
specification, objective-conceptual physics teaching criteria table, the CA and CRSS
handbook for teacher, CBLN for teachers and for students, demonstrations, activities,
76
lesson plans, misconception-activity table, the CRSS table, a guide table about how
to fill the CRSS, short quizzes, power point presentation to describe the CRSS,
power point presentations to follow the CA lectures and self evaluation-observation
checklist for teachers) were checked by an instructor and one research assistance
from the department of secondary school science and mathematics education at
METU, and four physics teachers from two private high schools and an English
teacher from U.S. The needless and unclear statements were excluded from the
materials. The readability or understandability of the materials, and items in the
PACT and PATS were checked. In some places the order of the paragraphs and titles
were changed. The feedbacks about the power point presentations; such as number of
statements per page, the colors of the figures, order of the animations, were taken
into consideration and they were reconstructed. The tables and guiding handbooks
were reorganized relevant to feedbacks. All necessary changes and updates in all
teaching learning materials, tests and treatments were done before the final study.
Then a pilot study was conducted in one of the private high schools at the beginning
of February in 2007. The PACT was applied to a group of 10th grade and 11th grade
students by the researcher. After they complete the tests, the researcher spoke to
some of 10th grade students individually whether they understood questions or had
difficulty about the meaning of the wordings, whether the testing time is sufficient or
not. All of these feed backs were noted. The pilot study denoted that the testing time
was inefficient for the 45 questions and some of the words and meanings were not
clear in the questions for the students. Then, the researcher determined the questions
measuring the same objectives and four of the 45 questions were extracted from the
77
PACT. The wordings and meaning of the statements were reexamined; the unclear
statements were changed with clear and understandable statements and words.
A factorial design was used in final study because effects of more than one
variable were tested. In the study there are two factors; the CA and CRSS. They also
include two levels, theoretically we planned to get eight classes but unfortunately we
could reach 6 classes from two private schools. Fraenkel and Wallen (2006) report
that there are variations of factorial design which use two or more different treatment
groups and no control groups. So, the supervisor and the researcher decided to
exclude control groups (the TI without CRSS group).
Three week before the study begin, all teaching/learning materials were given
to the teachers who participated in the study. Teachers investigated the materials for
two week. During third week, just before the study, researcher and teachers came
together and they were trained by the researcher about the study, methods and
specific strategies while conducting the study. Teachers were informed about the
conceptual approach, conceptual physics, reading study strategies of the KWL,
SQ3R and the CRSS. They asked their questions and learned how to implement the
methods and instructions according to requirements. Teachers promised to
standardize the administration procedures and application of treatments and allowed
researcher to observe their classes.
Meanwhile, the researcher prepared power point presentation to describe the
CRSS. The reason for this is that, the groups instructed by the CRSS must learn their
responsibilities for the study; they must read the lecture notes and fill one of the
CRSS tables at the beginning of each section before the lesson. The table must be
filled according to some special strategies. This presentation was conducted by
78
researcher in one school, at the other school, physics teacher conducted it. There is
no doubt that students, instructed by the CRSS, understood what to do during study.
At the beginning of the second week of February the study started in all
groups. The physics achievement pre-test and physics attitude pre-tests were
administered to 124 ninth grade private high school students in two private schools.
In order to have students relaxed and comforted the researcher and the teachers read
the directions and made necessary explanations to the students. One class hour was
given students to complete the PACT and ten minutes for the PATS. The time was
adequate.
After pre-tests, the CBLN, the CRSS tables, traditional lecture notes were
distributed to the study groups. The required explanations were done and students
were informed about to reading parts and filling the first table for the next lesson.
Then the study began at the second week of the February. Two classes were
instructed by the CA with the CRSS instructional methods, two classes were
instructed by the TI with the CRSS methods and the other two classes studied the
lessons by the CA without the CRSS. During the study five sections were studied;
light and its properties, shadows, colors, reflection, and plane mirrors.
During the study, students included in the CA were instructed according to
the criteria of conceptual physics. The students’ readings included in the CRSS
groups were controlled systematically with the help of short quizzes and the CRSS
tables. No quiz was administered to the students instructed by the CA without CRSS.
The study was conducted relevant to lesson plans in all study groups (See Appendix
H for the lesson prepared for all groups).
79
The study continued for two months, and at the end of the first week of April,
the study was finished. The physics achievement post test and physics attitude post
tests were administered to all study groups. As in pre-tests, in order to have students
relaxed and comforted, the researcher and the teachers read the directions and made
necessary explanations to students. One class hour was given students to complete
the PACT and ten minutes for the PATS. The time was adequate. No problems were
encountered during the administration of the pre-tests and post-tests.
3.6 Treatment
In this study there were three treatment groups; the CA with the CRSS group,
the CA without the CRSS group and the TI with the CRSS group. For each group
different lesson plans were prepared (See Appendix H for the lesson plans prepared
for all study groups). Since the CA with the CRSS includes all method used in this
study, the basic steps and characteristics of it are given as an example in Section
3.6.1.
3.6.1 Treatment in the CA with the CRSS Group
The followings presents an example lesson plan used for the CA with the
CRSS groups. It gives the title of the subject, general and specific objectives, basic
steps and general characteristics of the CA with the CRSS method.
Subject : Light and its’ properties, transparent, semi transparent and opaque
materials.
80
General Objective
• Ability to explain light and its properties
Specific Objectives
1. To define optics.
2. To define light.
3. To state that light is a form of energy.
4. To denote the electromagnetic spectrum.
5. To discover that visible light is only small part of whole electromagnetic
spectrum.
6. To interpret on the electromagnetic spectrum.
7. To define light sources.
8. To define luminous and non luminous (dark) objects.
9. To give examples to luminous and dark objects.
10. To compare the speed of light with that of sound.
11. To interpret on the speed of the light when it is traveling within air.
12. To compare the speed of light within different mediums.
13. To generalize that speed of light is different within different mediums.
14. To define light ray.
15. To discover that light travels in straight lines.
16. To points out that the working principle of simple camera depends on the
property of light traveling in straight lines.
17. To infers that light rays leave the light source from each point to whole
direction.
18. To define transparent materials.
81
19. To comprehend transparency.
20. To define semi transparent materials.
21. To comprehend semi transparency.
22. To define opaque materials.
23. To comprehend the opaque materials.
24. To discover whether materials are transparent, semi transparent or opaque.
25. To conclude that the transparency depends on both the type and thickness of
material.
Procedure
Assuming that at the end of previous lesson, some homework was assigned to
the students for this lesson. When students come to school, they should have
o read the sections of Light, what is light, light sources, luminous
objects, non-luminous objects, speed of light, transparent, semi
transparent and opaque objects.
o studied Activity-1, Activity-2, Activity-3 and read the Link to
Technology section.
o filled the CRSS table before coming to lesson.
� At the beginning of the lesson collect the CRSS tables.
� Give the short quizzes (Quiz #1) for five minutes.
� When the time is up, collect the quiz papers and answer the questions
briefly.
� Check that whether students brought their CBLN or not, if there is (are),
tell him (them) to complete the CBLN and bring it for the next lessons.
82
� For five or six minutes, ask students;
o What they initially know about light?
o What is the nature of light and how does it propagate?
o What are the light sources?
o What do luminous, non luminous objects mean?
o Does the light travel fast when compared to everyday traveling
objects?
o How does the light leave the light bulb?
� According to students’ responses, write the general words or statements
on the left side of blackboard. This behavior will have students remember
what they know and how they completed the K columns of the CRSS
tables.
� Categorize these general words or statements and write them on the
blackboard.
� For the next three minutes, ask students;
o Before reading the text what they would like to learn from the text?
o Have they been able to find answers to their questions?
o How much they learned from reading?
o What they would like to learn further about the concept during the
lecture?
� Inform students that today and for the next lesson, we will study the
concept of light, its properties and the transparency of materials.
� Open computer and overhead projector. Open the power point slides
prepared for the Light and its properties. Study the lesson over these
83
slides.
� Frequently ask students whether they understood or not, if there exist any
misunderstood or weakly understood, please re explain again.
For Objective 1
� Define optics as the branch of physics concerning the behavior of light in
different media.
� State that optic is an important concept and used in very different areas.
For example, overhead projectors, microscopes, telescopes… lots of
technological devices use the basic principles of optics.
� Show pictures of microscope and telescope using the power point
presentation.
For Objective 2
� Define light as electromagnetic waves or photons.
� State that during the day the primary sources of the light is the sun. There
are also other sources of light such as flames, white-hot filaments in
lamps.
� Show pictures of flames, white-hot filaments in lamps using the power
point presentation.
For Objective 3
� Ask students whether light is mass or energy?
� Reinforce that light is a form of energy.
For Objective 4
� Use power point or overhead projector or card postal to show the
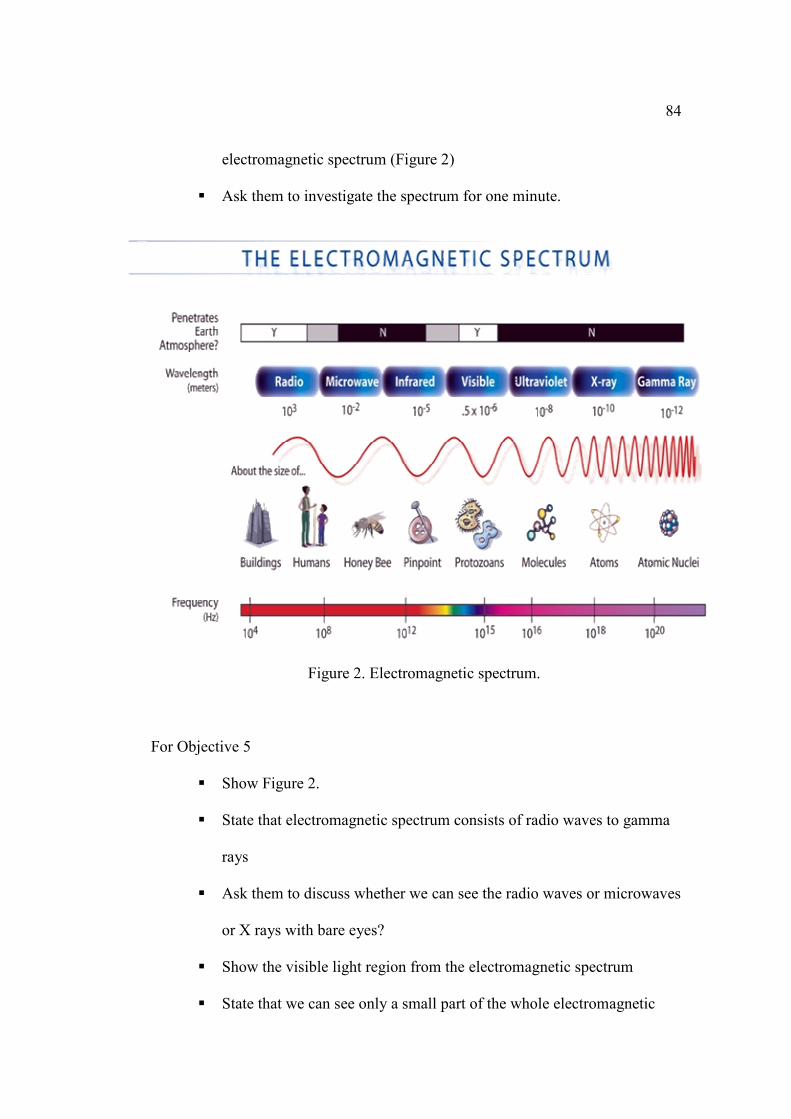
84
electromagnetic spectrum (Figure 2)
� Ask them to investigate the spectrum for one minute.
Figure 2. Electromagnetic spectrum.
For Objective 5
� Show Figure 2.
� State that electromagnetic spectrum consists of radio waves to gamma
rays
� Ask them to discuss whether we can see the radio waves or microwaves
or X rays with bare eyes?
� Show the visible light region from the electromagnetic spectrum
� State that we can see only a small part of the whole electromagnetic
85
spectrum. This small region is called as visible light; only the
electromagnetic waves within this region make sight sensation within the
human eyes. Because of those electromagnetic waves within this small
region is called as visible light.
� State that as you know physics also deals with X rays, gamma rays and
others. The X ray devices and gamma rays have lots of application in
technology.
For Objective 6
� Show Figure 2.
� Take their attention to the shape of waves from radio waves to gamma
rays
� In a simple case state that the distance between two wave crests or two
wave trough is called as wave length and the number of cycle per unit
time is called as frequency. The wavelength and frequency are inversely
related.
� Ask them how the wavelength changes from radio waves to Gamma rays.
� Summarize that the wavelength of radio waves are greater than that of
gamma rays.
� Ask them to discuss whether radio waves or X rays are more energetic?
� Summarize the frequency is directly proportional with the energy of
electromagnetic wave. Hence the radio waves are less energetic with
smaller frequency than X rays which have greater frequency.
For Objective 7
� State that in a dark region we can not see anything.
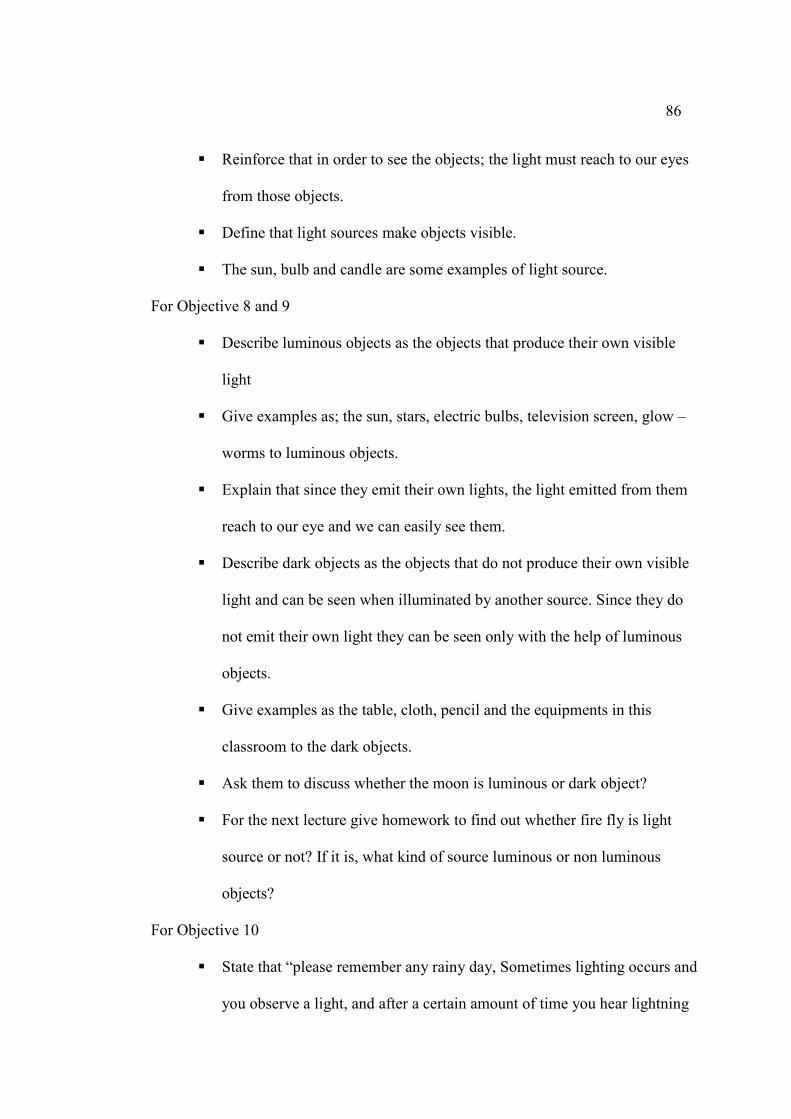
86
� Reinforce that in order to see the objects; the light must reach to our eyes
from those objects.
� Define that light sources make objects visible.
� The sun, bulb and candle are some examples of light source.
For Objective 8 and 9
� Describe luminous objects as the objects that produce their own visible
light
� Give examples as; the sun, stars, electric bulbs, television screen, glow –
worms to luminous objects.
� Explain that since they emit their own lights, the light emitted from them
reach to our eye and we can easily see them.
� Describe dark objects as the objects that do not produce their own visible
light and can be seen when illuminated by another source. Since they do
not emit their own light they can be seen only with the help of luminous
objects.
� Give examples as the table, cloth, pencil and the equipments in this
classroom to the dark objects.
� Ask them to discuss whether the moon is luminous or dark object?
� For the next lecture give homework to find out whether fire fly is light
source or not? If it is, what kind of source luminous or non luminous
objects?
For Objective 10
� State that “please remember any rainy day, Sometimes lighting occurs and
you observe a light, and after a certain amount of time you hear lightning
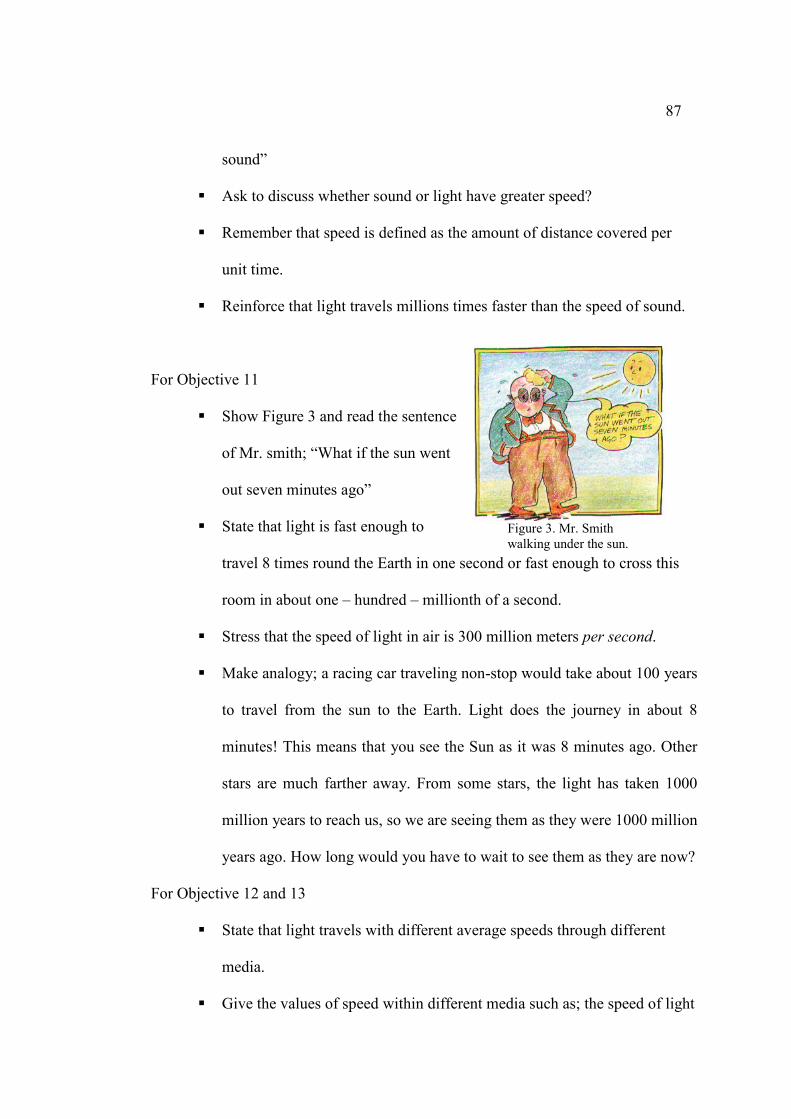
87
sound”
� Ask to discuss whether sound or light have greater speed?
� Remember that speed is defined as the amount of distance covered per
unit time.
� Reinforce that light travels millions times faster than the speed of sound.
For Objective 11
� Show Figure 3 and read the sentence
of Mr. smith; “What if the sun went
out seven minutes ago”
� State that light is fast enough to
travel 8 times round the Earth in one second or fast enough to cross this
room in about one – hundred – millionth of a second.
� Stress that the speed of light in air is 300 million meters per second.
� Make analogy; a racing car traveling non-stop would take about 100 years
to travel from the sun to the Earth. Light does the journey in about 8
minutes! This means that you see the Sun as it was 8 minutes ago. Other
stars are much farther away. From some stars, the light has taken 1000
million years to reach us, so we are seeing them as they were 1000 million
years ago. How long would you have to wait to see them as they are now?
For Objective 12 and 13
� State that light travels with different average speeds through different
media.
� Give the values of speed within different media such as; the speed of light
Figure 3. Mr. Smith walking under the sun.
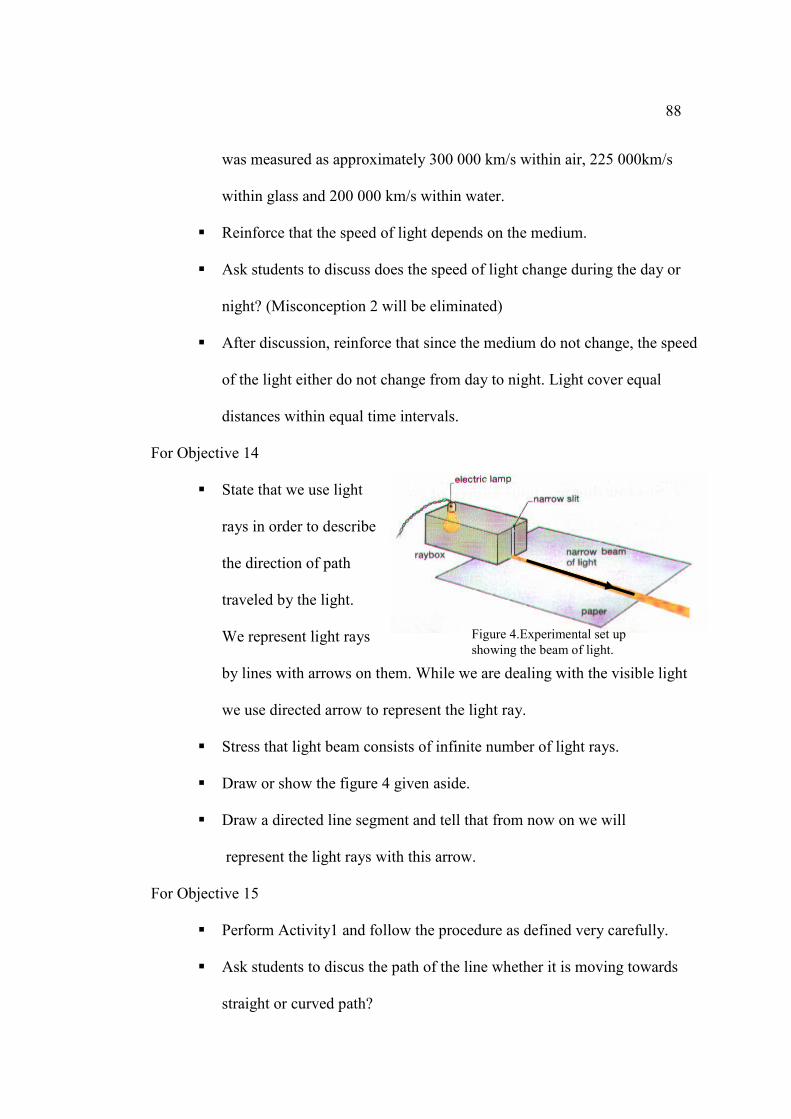
88
was measured as approximately 300 000 km/s within air, 225 000km/s
within glass and 200 000 km/s within water.
� Reinforce that the speed of light depends on the medium.
� Ask students to discuss does the speed of light change during the day or
night? (Misconception 2 will be eliminated)
� After discussion, reinforce that since the medium do not change, the speed
of the light either do not change from day to night. Light cover equal
distances within equal time intervals.
For Objective 14
� State that we use light
rays in order to describe
the direction of path
traveled by the light.
We represent light rays
by lines with arrows on them. While we are dealing with the visible light
we use directed arrow to represent the light ray.
� Stress that light beam consists of infinite number of light rays.
� Draw or show the figure 4 given aside.
� Draw a directed line segment and tell that from now on we will
represent the light rays with this arrow.
For Objective 15
� Perform Activity1 and follow the procedure as defined very carefully.
� Ask students to discus the path of the line whether it is moving towards
straight or curved path?
Figure 4.Experimental set up showing the beam of light.
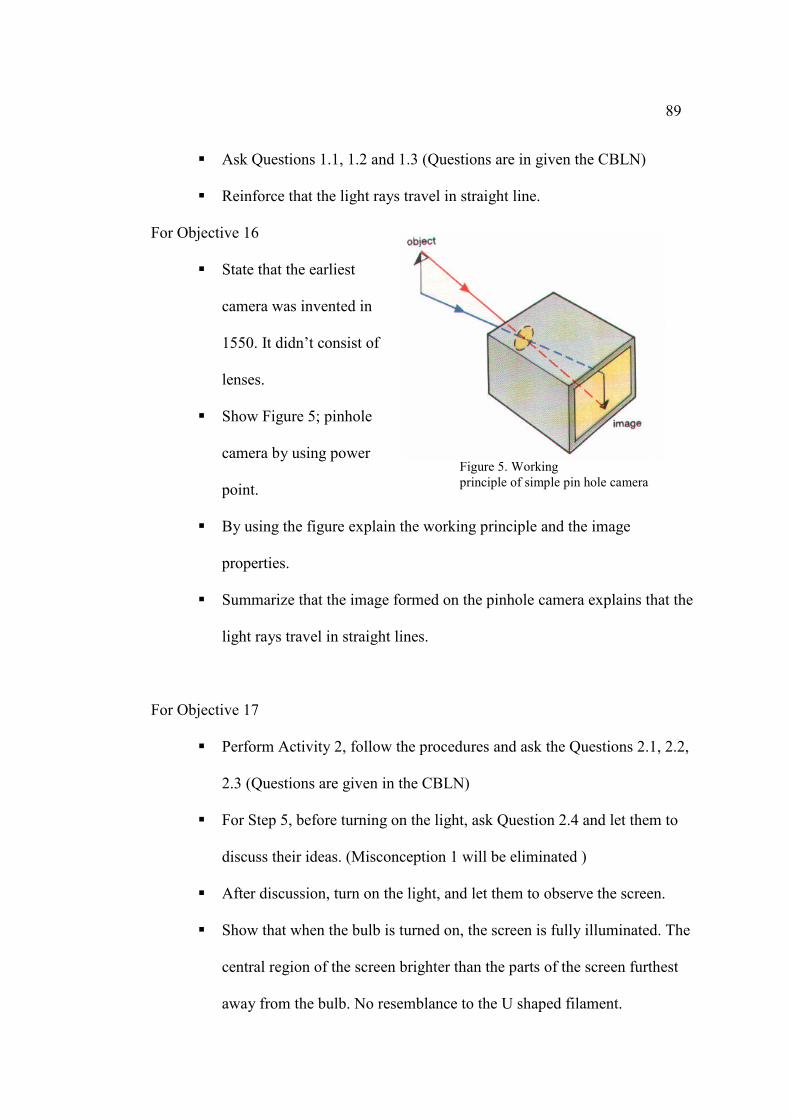
89
� Ask Questions 1.1, 1.2 and 1.3 (Questions are in given the CBLN)
� Reinforce that the light rays travel in straight line.
For Objective 16
� State that the earliest
camera was invented in
1550. It didn’t consist of
lenses.
� Show Figure 5; pinhole
camera by using power
point.
� By using the figure explain the working principle and the image
properties.
� Summarize that the image formed on the pinhole camera explains that the
light rays travel in straight lines.
For Objective 17
� Perform Activity 2, follow the procedures and ask the Questions 2.1, 2.2,
2.3 (Questions are given in the CBLN)
� For Step 5, before turning on the light, ask Question 2.4 and let them to
discuss their ideas. (Misconception 1 will be eliminated )
� After discussion, turn on the light, and let them to observe the screen.
� Show that when the bulb is turned on, the screen is fully illuminated. The
central region of the screen brighter than the parts of the screen furthest
away from the bulb. No resemblance to the U shaped filament.
Figure 5. Working principle of simple pin hole camera
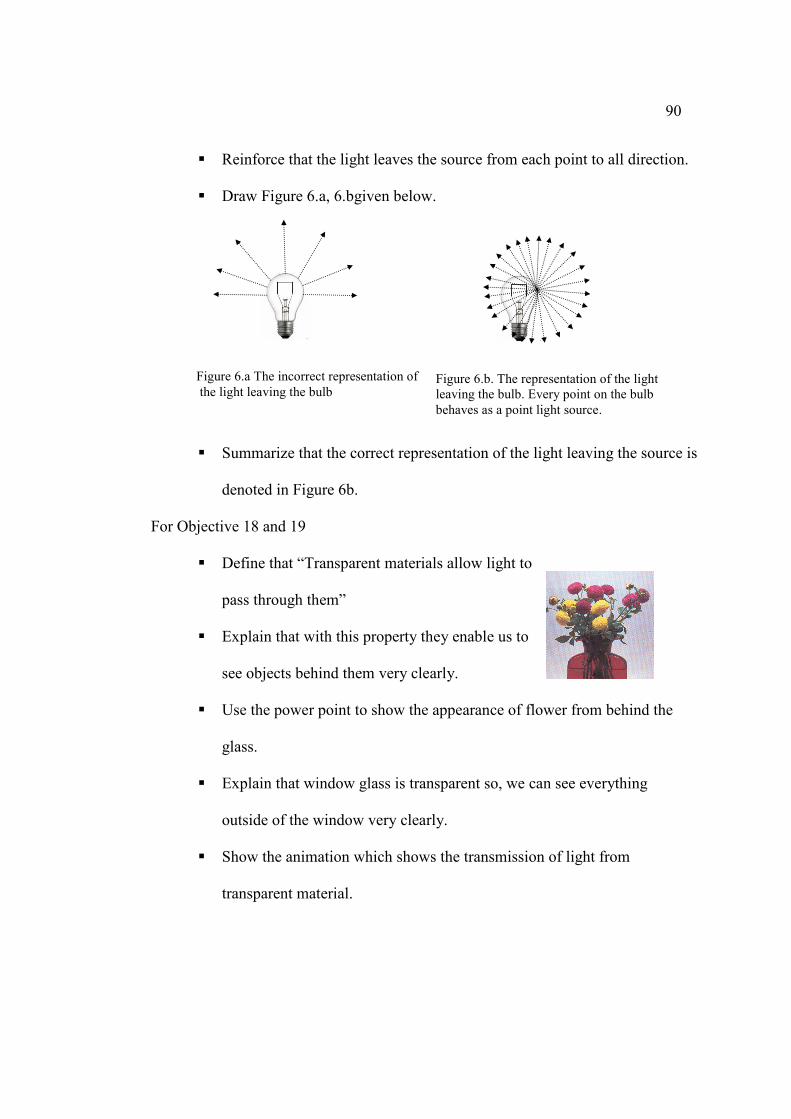
90
� Reinforce that the light leaves the source from each point to all direction.
� Draw Figure 6.a, 6.bgiven below.
� Summarize that the correct representation of the light leaving the source is
denoted in Figure 6b.
For Objective 18 and 19
� Define that “Transparent materials allow light to
pass through them”
� Explain that with this property they enable us to
see objects behind them very clearly.
� Use the power point to show the appearance of flower from behind the
glass.
� Explain that window glass is transparent so, we can see everything
outside of the window very clearly.
� Show the animation which shows the transmission of light from
transparent material.
Figure 6.a The incorrect representation of the light leaving the bulb
Figure 6.b. The representation of the light leaving the bulb. Every point on the bulb behaves as a point light source.
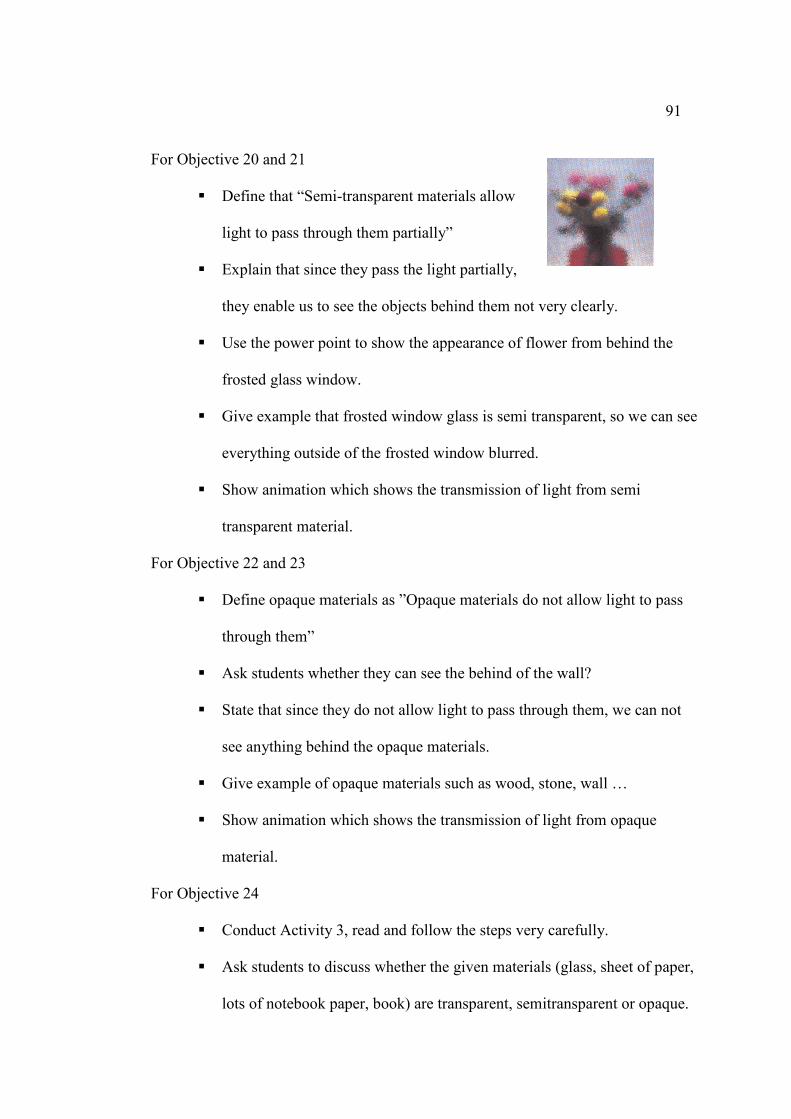
91
For Objective 20 and 21
� Define that “Semi-transparent materials allow
light to pass through them partially”
� Explain that since they pass the light partially,
they enable us to see the objects behind them not very clearly.
� Use the power point to show the appearance of flower from behind the
frosted glass window.
� Give example that frosted window glass is semi transparent, so we can see
everything outside of the frosted window blurred.
� Show animation which shows the transmission of light from semi
transparent material.
For Objective 22 and 23
� Define opaque materials as ”Opaque materials do not allow light to pass
through them”
� Ask students whether they can see the behind of the wall?
� State that since they do not allow light to pass through them, we can not
see anything behind the opaque materials.
� Give example of opaque materials such as wood, stone, wall …
� Show animation which shows the transmission of light from opaque
material.
For Objective 24
� Conduct Activity 3, read and follow the steps very carefully.
� Ask students to discuss whether the given materials (glass, sheet of paper,
lots of notebook paper, book) are transparent, semitransparent or opaque.
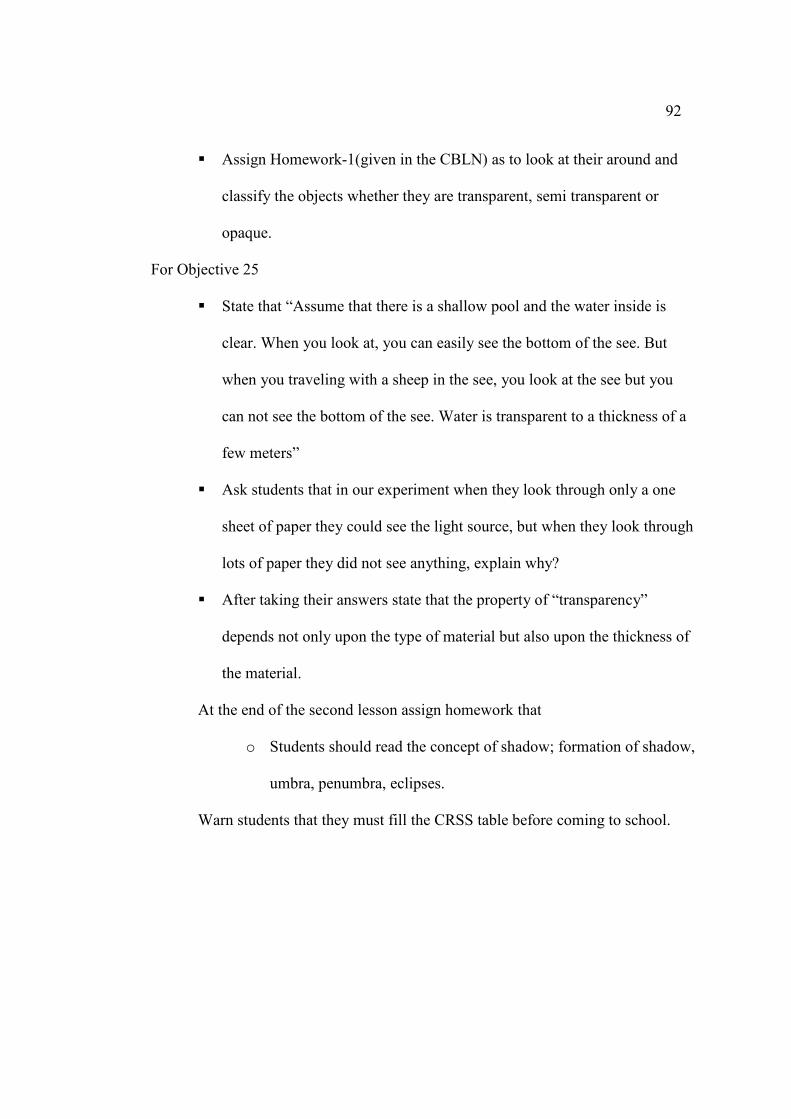
92
� Assign Homework-1(given in the CBLN) as to look at their around and
classify the objects whether they are transparent, semi transparent or
opaque.
For Objective 25
� State that “Assume that there is a shallow pool and the water inside is
clear. When you look at, you can easily see the bottom of the see. But
when you traveling with a sheep in the see, you look at the see but you
can not see the bottom of the see. Water is transparent to a thickness of a
few meters”
� Ask students that in our experiment when they look through only a one
sheet of paper they could see the light source, but when they look through
lots of paper they did not see anything, explain why?
� After taking their answers state that the property of “transparency”
depends not only upon the type of material but also upon the thickness of
the material.
At the end of the second lesson assign homework that
o Students should read the concept of shadow; formation of shadow,
umbra, penumbra, eclipses.
Warn students that they must fill the CRSS table before coming to school.
93
3.7 Analyses of Data
Data list; consisting of students’ gender, age, the PPCG, PGPA, PREATT,
PSTATT, PREACH, PSTACH, and MOT was prepared by using MS Excel in which
columns show variables and rows show students participating in the study. The
statistical analyses were conducted by using both Ms Excel and SPSS. The raw data
can be found in Appendix Q.
3.7.1 Descriptive Statistics
The mean, standard deviation, skewness, standard error for skewness,
kurtosis, standard error of kurtosis, range, minimum, maximum values were
presented for each group. The histograms were obtained for the PSTACH and
PSTATT for each study group.
3.7.2 Inferential Statistics
In order to test the null hypotheses, MANCOVA was used since there are two
dependent variables and it can both equate groups on one or more independent
variables. During analyses, the probability of rejecting true null hypothesis
(probability of making Type 1-error) was set to .05 as a priori to our hypothesis
testing, because it is mostly used value in educational studies. The effect size was set
to medium value (f 2 = 0.15 for variance and 0.5 for the mean difference). Cohen and
Cohen (1983) suggest setting the minimum power value to 0.80. So, the power of the
study was initially set to 0.80. According to Cohen and Cohen, the “L” value for the
eighteen independent variables was reported as 18.34 when α is equal to .05. By
considering these values the minimum value of sample size was calculated as 137.
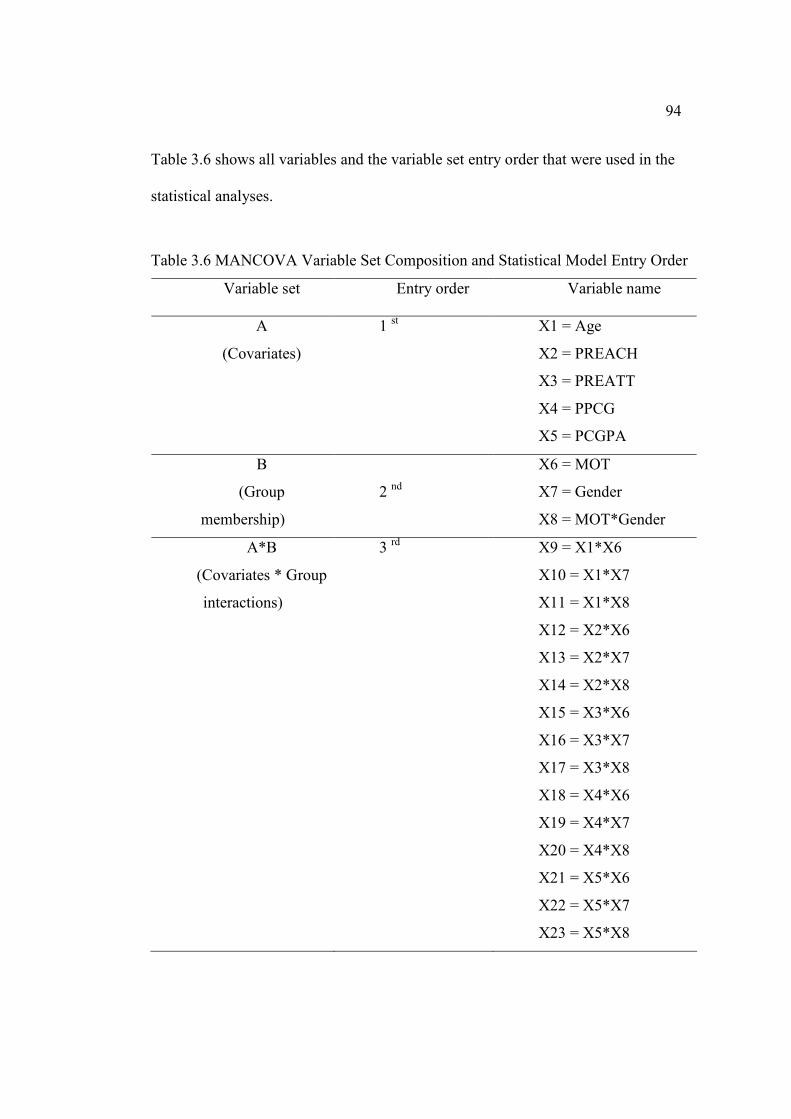
94
Table 3.6 shows all variables and the variable set entry order that were used in the
statistical analyses.
Table 3.6 MANCOVA Variable Set Composition and Statistical Model Entry Order
Variable set Entry order Variable name
A
(Covariates)
1 st X1 = Age
X2 = PREACH
X3 = PREATT
X4 = PPCG
X5 = PCGPA
B
(Group
membership)
2 nd
X6 = MOT
X7 = Gender
X8 = MOT*Gender
A*B
(Covariates * Group
interactions)
3 rd X9 = X1*X6
X10 = X1*X7
X11 = X1*X8
X12 = X2*X6
X13 = X2*X7
X14 = X2*X8
X15 = X3*X6
X16 = X3*X7
X17 = X3*X8
X18 = X4*X6
X19 = X4*X7
X20 = X4*X8
X21 = X5*X6
X22 = X5*X7
X23 = X5*X8
95
The power of this study was calculated as .85; therefore, the probability of
failing to reject a false null hypothesis (probability of making Type 2-error) was
found .15 (i.e., 1-0.85).
3.8 Assumptions and Limitations
The assumptions and the limitations of this study considered by the researcher
are given below;
1. The subjects of the study answered the items of the tests sincerely.
2. The teachers followed instructions, administered the methods relevant to their
theories, and there were no bias during the treatments.
3. The administration of the PACT and PATS were under standard conditions.
4. Students from different groups did not interact and did not share questions of the
PACT and PATS before or during the administration of the tests.
5. Independent of observation was satisfied for private high schools.
96
CHAPTER 4
RESULTS
The result of this study is explained in three different sections. First section
deals with missing data analysis. The second section presents descriptive statistics
and inferential statistics; it will present descriptive comparison of the CA with the
CRSS, the CA without the CRSS and the TI with the CRSS for students’ pre-test and
post-test scores will be presented. Finally, the last section presents the summary of
results.
4.1 Missing Data Analysis
The first step is related with missing data analysis. It was achieved before
descriptive statistics and inferential statistics due to the fact that all analysis will be
performed on the analyzed data. In the process of completing the data file, it was
observed that some students did not complete all questions in the PACT. For these
students, the researcher and advisor determined a cut off point and it was decided
that if the number of unmarked questions is equal or more than the 1.5 standard
deviation of the whole data for the post-achievement test, than this student will be
excluded from the statistical analysis. Post-achievement test was administered to 124
students but 3 of them did not do some of the questions. These three students
constitute 2 % of all students. Their unmarked questions were counted they were
found approximately equal to 1.5 standard deviation of post achievement scores of
97
whole data. So, these three students were completely excluded from the whole
analysis.
The same cut off point is valid for pre-tests also; but at this time it was
decided that if the number of unmarked questions is equal or more than the 1.5
standard deviation of the whole data, their achievement scores were accepted as
missing value. For the pre-achievement test, 11 students were detected whose
unmarked questions are equal or more than 1.5 standard deviation of their whole
data. These 11 students constitute 8.8 % of the whole students. Their total pre-
achievement scores were accepted as missing value rather than excluding them from
all analysis.
There were no missing items in student’s pre-attitude and post-attitude tests;
students answered all questions. Post-attitude test was administered to all 124
students but two students were absent on the date of pre-test application so, there
were two missing value for the pre attitude test. These two students constitute 1.6 %
of the whole data. Since the missing data in physics attitude pre-test is smaller than
3 % of the whole data, missing values were replaced with the series mean of the
entire subjects (SMEAN). However, there were 11 missing data in the physics pre-
achievement test and they are greater than 3 % of the whole data; so we conducted a
missing data analysis. A Dummy coded missing data variable, which we named it as
the MISPRE, was created. The missing total scores were coded as ‘1” and the other
scores were coded as ‘0’. Then, it was tested for significance. According to the result
of the analysis, there has been found significant differences between the mean scores
of post-achievement tests of students having missing data and those of having no
missing data, respectively. So, the missing values in variables were replaced with the
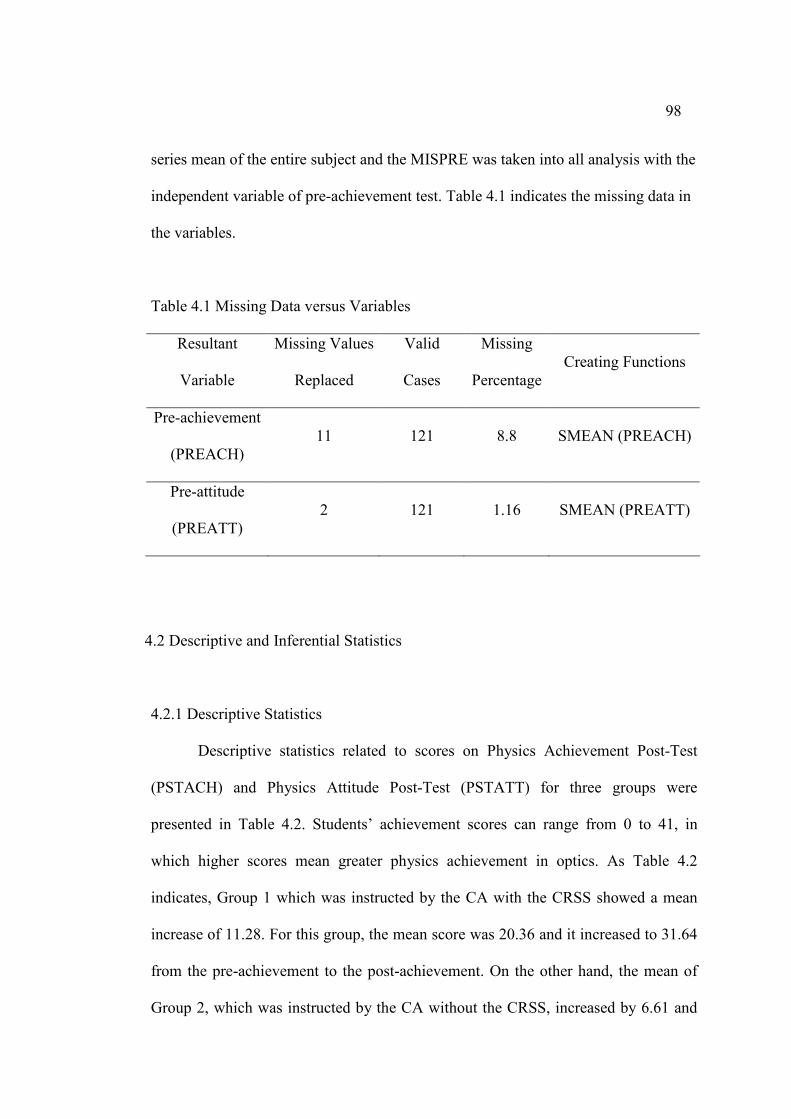
98
series mean of the entire subject and the MISPRE was taken into all analysis with the
independent variable of pre-achievement test. Table 4.1 indicates the missing data in
the variables.
Table 4.1 Missing Data versus Variables
Resultant
Variable
Missing Values
Replaced
Valid
Cases
Missing
Percentage Creating Functions
Pre-achievement
(PREACH) 11 121 8.8 SMEAN (PREACH)
Pre-attitude
(PREATT) 2 121 1.16 SMEAN (PREATT)
4.2 Descriptive and Inferential Statistics
4.2.1 Descriptive Statistics
Descriptive statistics related to scores on Physics Achievement Post-Test
(PSTACH) and Physics Attitude Post-Test (PSTATT) for three groups were
presented in Table 4.2. Students’ achievement scores can range from 0 to 41, in
which higher scores mean greater physics achievement in optics. As Table 4.2
indicates, Group 1 which was instructed by the CA with the CRSS showed a mean
increase of 11.28. For this group, the mean score was 20.36 and it increased to 31.64
from the pre-achievement to the post-achievement. On the other hand, the mean of
Group 2, which was instructed by the CA without the CRSS, increased by 6.61 and
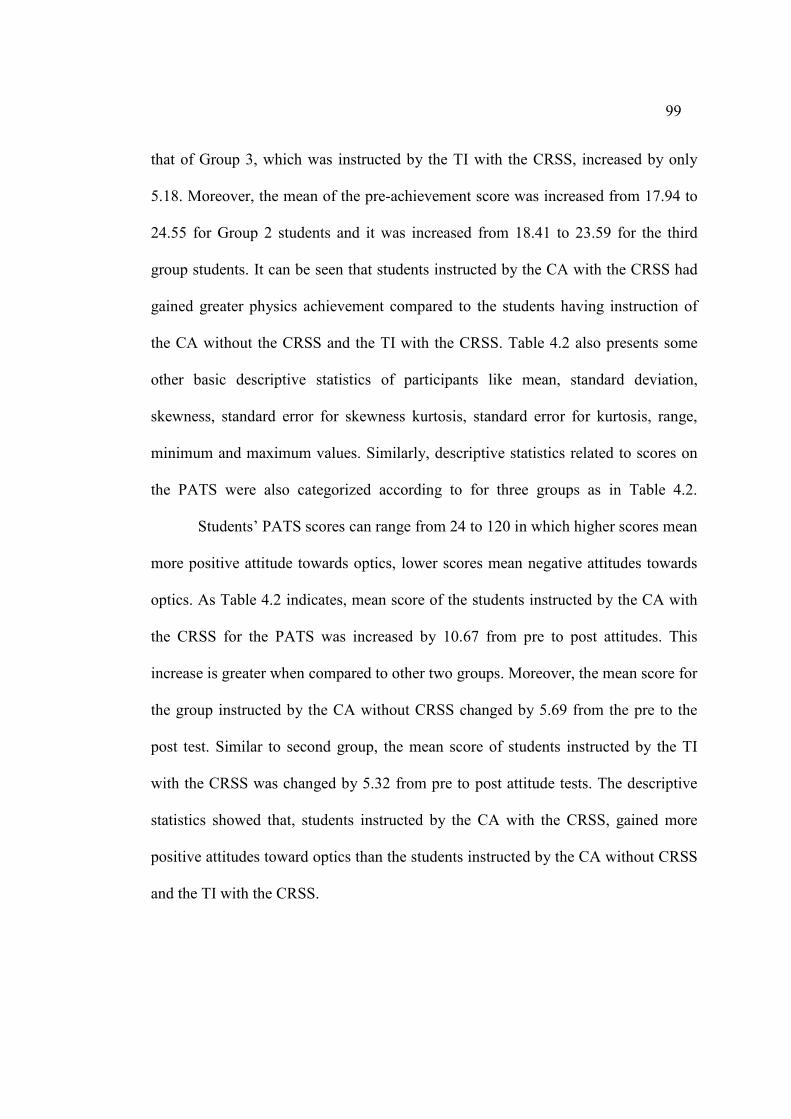
99
that of Group 3, which was instructed by the TI with the CRSS, increased by only
5.18. Moreover, the mean of the pre-achievement score was increased from 17.94 to
24.55 for Group 2 students and it was increased from 18.41 to 23.59 for the third
group students. It can be seen that students instructed by the CA with the CRSS had
gained greater physics achievement compared to the students having instruction of
the CA without the CRSS and the TI with the CRSS. Table 4.2 also presents some
other basic descriptive statistics of participants like mean, standard deviation,
skewness, standard error for skewness kurtosis, standard error for kurtosis, range,
minimum and maximum values. Similarly, descriptive statistics related to scores on
the PATS were also categorized according to for three groups as in Table 4.2.
Students’ PATS scores can range from 24 to 120 in which higher scores mean
more positive attitude towards optics, lower scores mean negative attitudes towards
optics. As Table 4.2 indicates, mean score of the students instructed by the CA with
the CRSS for the PATS was increased by 10.67 from pre to post attitudes. This
increase is greater when compared to other two groups. Moreover, the mean score for
the group instructed by the CA without CRSS changed by 5.69 from the pre to the
post test. Similar to second group, the mean score of students instructed by the TI
with the CRSS was changed by 5.32 from pre to post attitude tests. The descriptive
statistics showed that, students instructed by the CA with the CRSS, gained more
positive attitudes toward optics than the students instructed by the CA without CRSS
and the TI with the CRSS.
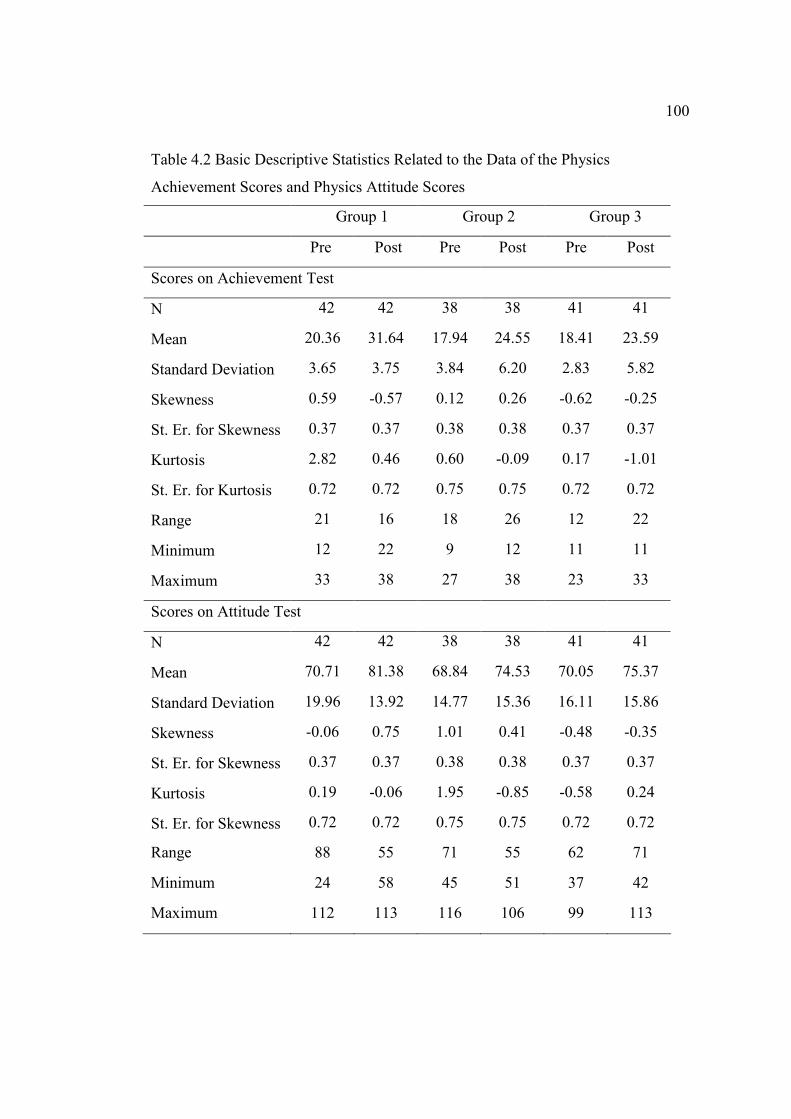
100
Table 4.2 Basic Descriptive Statistics Related to the Data of the Physics
Achievement Scores and Physics Attitude Scores
Group 1 Group 2 Group 3
Pre Post Pre Post Pre Post
Scores on Achievement Test
N 42 42 38 38 41 41
Mean 20.36 31.64 17.94 24.55 18.41 23.59
Standard Deviation 3.65 3.75 3.84 6.20 2.83 5.82
Skewness 0.59 -0.57 0.12 0.26 -0.62 -0.25
St. Er. for Skewness 0.37 0.37 0.38 0.38 0.37 0.37
Kurtosis 2.82 0.46 0.60 -0.09 0.17 -1.01
St. Er. for Kurtosis 0.72 0.72 0.75 0.75 0.72 0.72
Range 21 16 18 26 12 22
Minimum 12 22 9 12 11 11
Maximum 33 38 27 38 23 33
Scores on Attitude Test
N 42 42 38 38 41 41
Mean 70.71 81.38 68.84 74.53 70.05 75.37
Standard Deviation 19.96 13.92 14.77 15.36 16.11 15.86
Skewness -0.06 0.75 1.01 0.41 -0.48 -0.35
St. Er. for Skewness 0.37 0.37 0.38 0.38 0.37 0.37
Kurtosis 0.19 -0.06 1.95 -0.85 -0.58 0.24
St. Er. for Skewness 0.72 0.72 0.75 0.75 0.72 0.72
Range 88 55 71 55 62 71
Minimum 24 58 45 51 37 42
Maximum 112 113 116 106 99 113
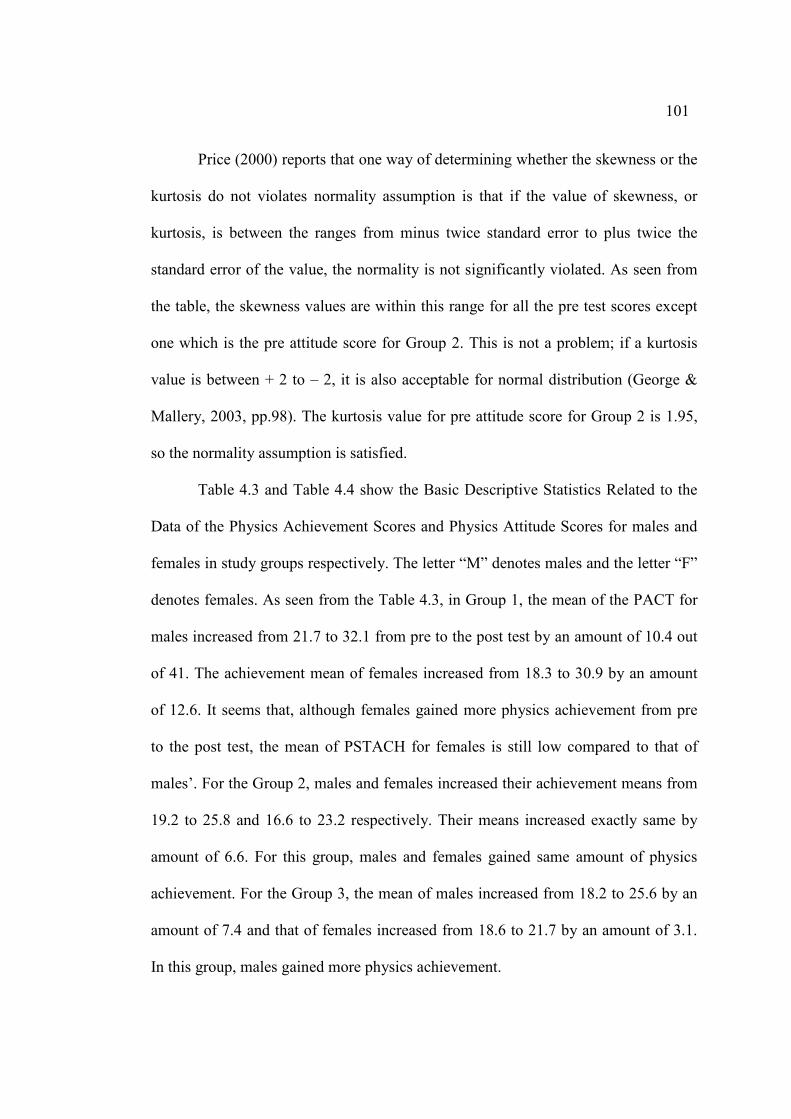
101
Price (2000) reports that one way of determining whether the skewness or the
kurtosis do not violates normality assumption is that if the value of skewness, or
kurtosis, is between the ranges from minus twice standard error to plus twice the
standard error of the value, the normality is not significantly violated. As seen from
the table, the skewness values are within this range for all the pre test scores except
one which is the pre attitude score for Group 2. This is not a problem; if a kurtosis
value is between + 2 to – 2, it is also acceptable for normal distribution (George &
Mallery, 2003, pp.98). The kurtosis value for pre attitude score for Group 2 is 1.95,
so the normality assumption is satisfied.
Table 4.3 and Table 4.4 show the Basic Descriptive Statistics Related to the
Data of the Physics Achievement Scores and Physics Attitude Scores for males and
females in study groups respectively. The letter “M” denotes males and the letter “F”
denotes females. As seen from the Table 4.3, in Group 1, the mean of the PACT for
males increased from 21.7 to 32.1 from pre to the post test by an amount of 10.4 out
of 41. The achievement mean of females increased from 18.3 to 30.9 by an amount
of 12.6. It seems that, although females gained more physics achievement from pre
to the post test, the mean of PSTACH for females is still low compared to that of
males’. For the Group 2, males and females increased their achievement means from
19.2 to 25.8 and 16.6 to 23.2 respectively. Their means increased exactly same by
amount of 6.6. For this group, males and females gained same amount of physics
achievement. For the Group 3, the mean of males increased from 18.2 to 25.6 by an
amount of 7.4 and that of females increased from 18.6 to 21.7 by an amount of 3.1.
In this group, males gained more physics achievement.
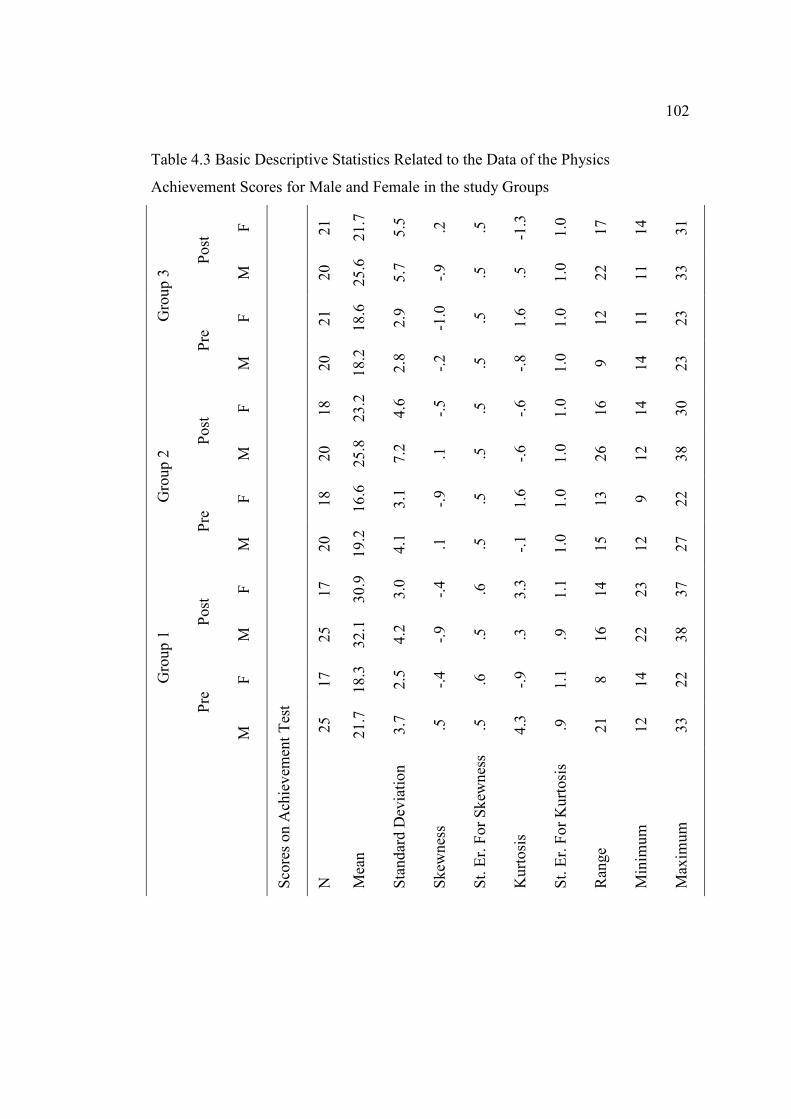
102
Table 4.3 Basic Descriptive Statistics Related to the Data of the Physics
Achievement Scores for Male and Female in the study Groups
F
21
21.7
5.5 .2
.5
-1.3
1.0
17
14
31
Post
M
20
25.6
5.7
-.9 .5
.5
1.0
22
11
33
F
21
18.6
2.9
-1.0
.5
1.6
1.0
12
11
23
Group
3
Pre
M
20
18.2
2.8
-.2 .5
-.8
1.0 9 14
23
F
18
23.2
4.6
-.5 .5
-.6
1.0
16
14
30
Post
M
20
25.8
7.2 .1
.5
-.6
1.0
26
12
38
F
18
16.6
3.1
-.9 .5
1.6
1.0
13
9 22
Group
2
Pre
M
20
19.2
4.1 .1
.5
-.1
1.0
15
12
27
F
17
30.9
3.0
-.4 .6
3.3
1.1
14
23
37
Post
M
25
32.1
4.2
-.9 .5
.3
.9
16
22
38
F
17
18.3
2.5
-.4 .6
-.9
1.1 8 14
22
Group
1
Pre
M 25
21.7
3.7 .5
.5
4.3 .9
21
12
33
Scores on
Achievement Test
N
Mean
Stand
ard Deviation
Skewness
St. Er. For Skewness
Kurtosis
St. Er. For Kurtosis
Range
Minim
um
Maxim
um
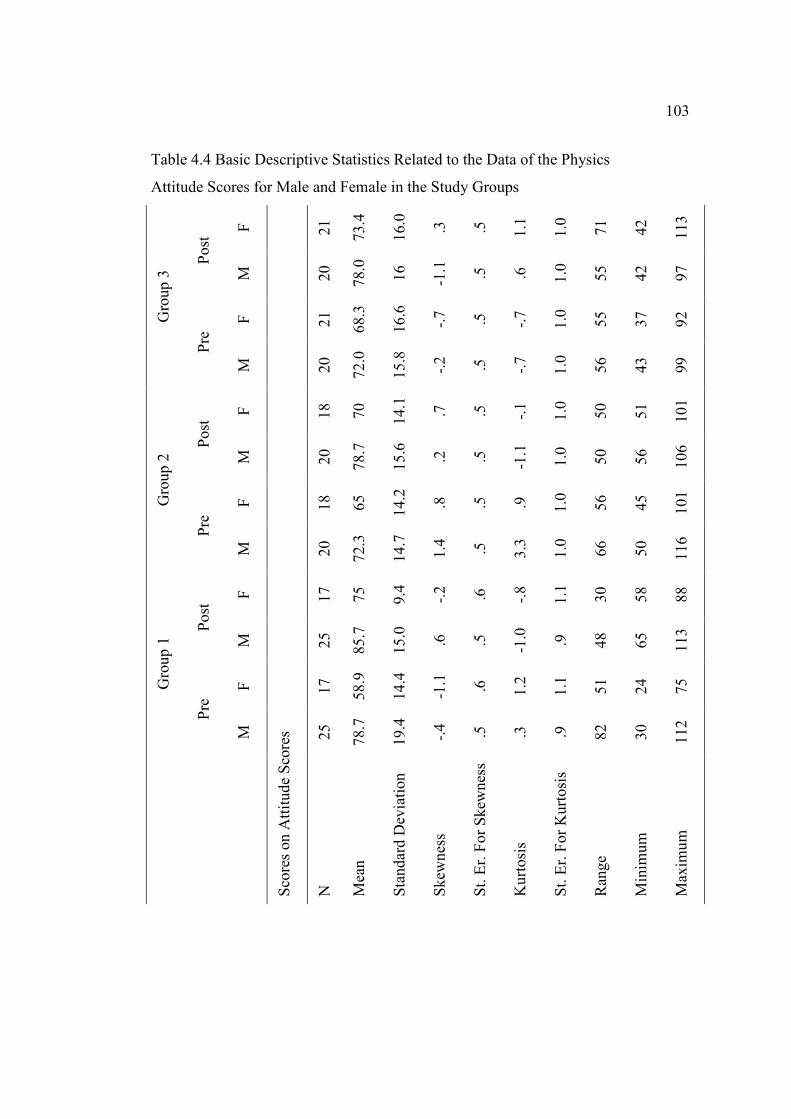
103
Table 4.4 Basic Descriptive Statistics Related to the Data of the Physics
Attitude Scores for Male and Female in the Study Groups
F
21
73.4
16.0
.3
.5
1.1
1.0
71
42
113
Post
M
20
78.0
16
-1.1
.5
.6
1.0
55
42
97
F
21
68.3
16.6
-.7 .5
-.7
1.0
55
37
92
Group
3
Pre
M
20
72.0
15.8
-.2 .5
-.7
1.0
56
43
99
F
18
70
14.1
.7
.5
-.1
1.0
50
51
101
Post
M
20
78.7
15.6
.2
.5
-1.1
1.0
50
56
106
F
18
65
14.2
.8
.5
.9
1.0
56
45
101 Group
2
Pre
M
20
72.3
14.7
1.4 .5
3.3
1.0
66
50
116
F
17
75
9.4
-.2 .6
-.8
1.1
30
58
88
Post
M
25
85.7
15.0
.6
.5
-1.0
.9
48
65
113
F
17
58.9
14.4
-1.1
.6
1.2
1.1
51
24
75
Group
1
Pre
M
25
78.7
19.4
-.4 .5
.3
.9
82
30
112
Scores on
Attitud
e Scores
N
Mean
Stand
ard Deviation
Skewness
St. Er. For Skewness
Kurtosis
St. Er. For Kurtosis
Range
Minim
um
Maxim
um

104
Table 4.4 presents that in Group 1, the mean of the physics attitude test for
males increased from 78.7 to 85.7 by an amount of 7 points out of 120. The mean of
attitude test for females increased from 58.9 to 75 by an amount of 16.1. Although
the increase in the means of females is greater than that of males’, the mean of the
PSTATT for females is still smaller than that of males’. The changes in the means of
males and females are almost equal to each other in Group 2 and Group 3 from pre to
the post attitude test. Moreover, the attitude mean for males increased from 72.3 to
78.7 by an amount of 6.4 and it increased from 65 to 70 by an amount of 5 for
females in Group 2. Similarly, for Group 3, the attitude mean increased from 72 to
78 by an amount of 6 for males and it increased from 68.3 to 73.4 by an amount of
5.1 for females. As seen from Table 4.4, there are increases in the means of attitude
test for males and females, but the average means are still to low for all students in
all groups when compared to the total 120 points.
Figure 4.1 and Figure 4.2 show the histograms with normal curves related to
the PSTACH and PSTATT for all groups. These are also an evidence for the normal
distribution.
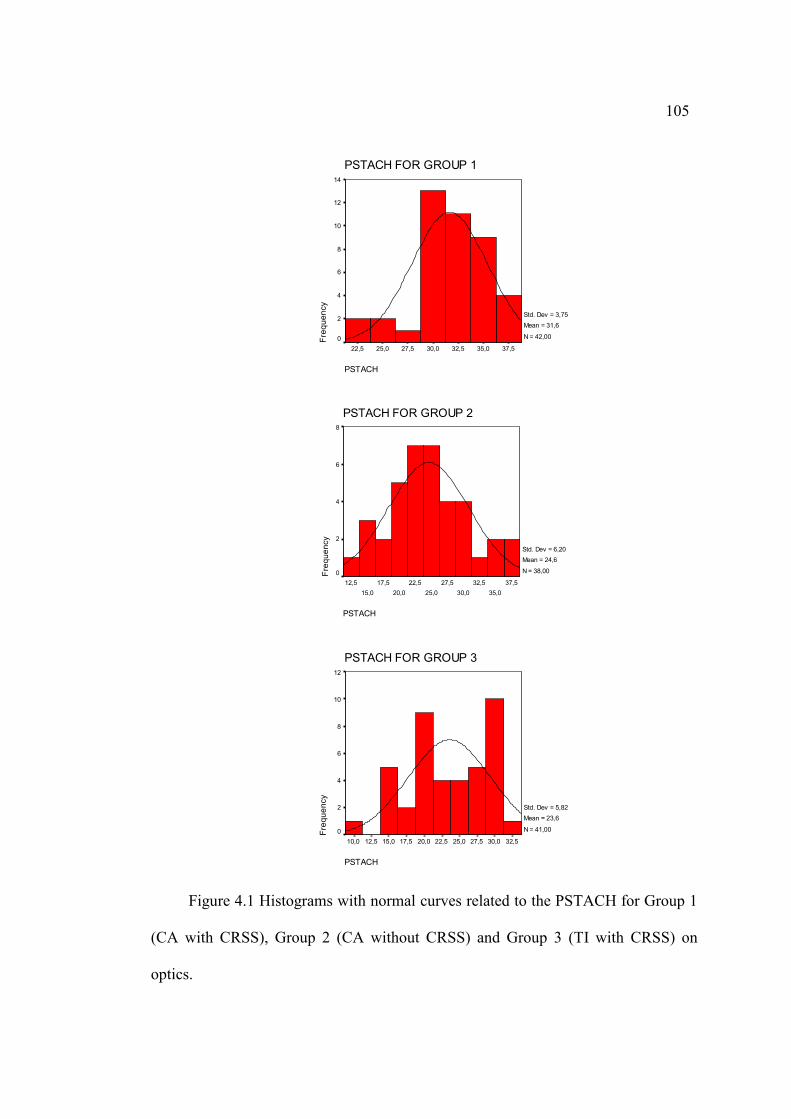
105
PSTACH
37,535,032,530,027,525,022,5
PSTACH FOR GROUP 1
Frequency
14
12
10
8
6
4
2
0
Std. Dev = 3,75
Mean = 31,6
N = 42,00
PSTACH
37,5
35,0
32,5
30,0
27,5
25,0
22,5
20,0
17,5
15,0
12,5
PSTACH FOR GROUP 2
Frequency
8
6
4
2
0
Std. Dev = 6,20
Mean = 24,6
N = 38,00
PSTACH
32,530,027,525,022,520,017,515,012,510,0
PSTACH FOR GROUP 3
Frequency
12
10
8
6
4
2
0
Std. Dev = 5,82
Mean = 23,6
N = 41,00
Figure 4.1 Histograms with normal curves related to the PSTACH for Group 1
(CA with CRSS), Group 2 (CA without CRSS) and Group 3 (TI with CRSS) on
optics.
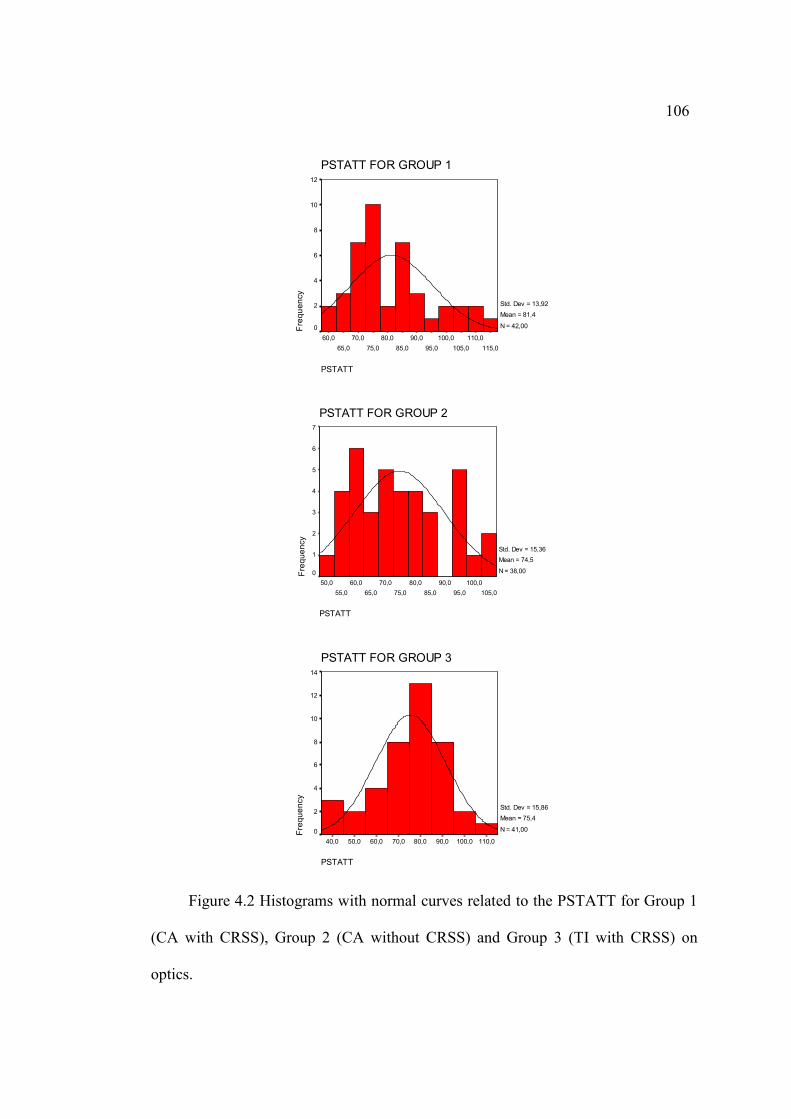
106
PSTATT
115,0
110,0
105,0
100,0
95,0
90,0
85,0
80,0
75,0
70,0
65,0
60,0
PSTATT FOR GROUP 1
Frequency
12
10
8
6
4
2
0
Std. Dev = 13,92
Mean = 81,4
N = 42,00
PSTATT
105,0
100,0
95,0
90,0
85,0
80,0
75,0
70,0
65,0
60,0
55,0
50,0
PSTATT FOR GROUP 2
Frequency
7
6
5
4
3
2
1
0
Std. Dev = 15,36
Mean = 74,5
N = 38,00
PSTATT
110,0100,090,080,070,060,050,040,0
PSTATT FOR GROUP 3
Frequency
14
12
10
8
6
4
2
0
Std. Dev = 15,86
Mean = 75,4
N = 41,00
Figure 4.2 Histograms with normal curves related to the PSTATT for Group 1
(CA with CRSS), Group 2 (CA without CRSS) and Group 3 (TI with CRSS) on
optics.

107
4.2.2 Inferential Statistics
This section has three different sub sections. The first sub section deals with
the determination of the covariates. Second sub section deals with the verification of
the MANCOVA assumptions. Finally, statistical model of the MANCOVA and the
analyses of the hypotheses are given.
4.2.2.1 Determination of Covariates
Five independent variables; age, the PREACH, PREATT, PCGPA, and
PPCG were pre-determined as potential confounding factors of the study. In addition
to these, the MISPRE was also considered as potential confounding factor. So, the
total six independent variables were regarded as covariates for the study. To
statistically equalize the differences among three groups, these variables were
included in Set A as covariates. All pre-determined independent variables in Set A
have been correlated with dependent variables of the PSTACH and PSTATT. Table
4.5 presents the results of these correlations and their level of significance. All of the
independent variables in Set A, age, the PREACH, PREATT, PCGGA, PPCG and
MISPRE have significant correlations with at least one of the dependent variables of
the PSTACH and PSTATT. Table 4.5 denotes the significance test of correlations
between dependent variables and covariates.
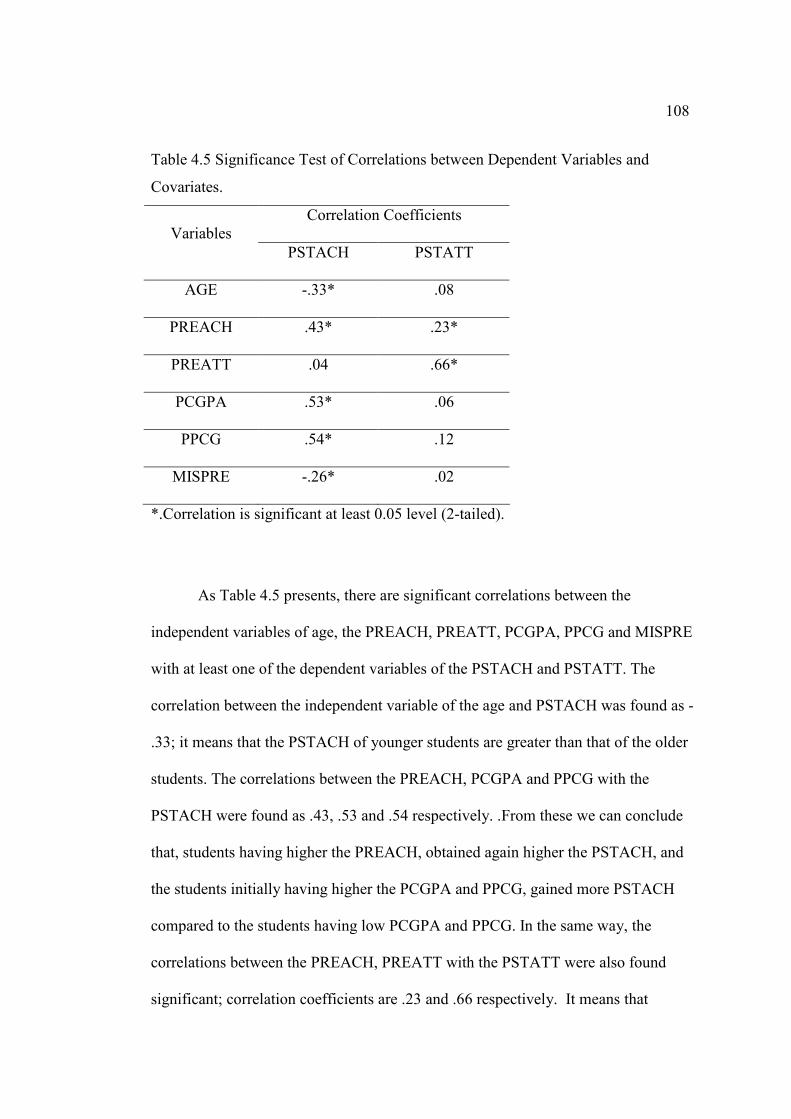
108
Table 4.5 Significance Test of Correlations between Dependent Variables and
Covariates.
Correlation Coefficients Variables
PSTACH PSTATT
AGE -.33* .08
PREACH .43* .23*
PREATT .04 .66*
PCGPA .53* .06
PPCG .54* .12
MISPRE -.26* .02
*.Correlation is significant at least 0.05 level (2-tailed).
As Table 4.5 presents, there are significant correlations between the
independent variables of age, the PREACH, PREATT, PCGPA, PPCG and MISPRE
with at least one of the dependent variables of the PSTACH and PSTATT. The
correlation between the independent variable of the age and PSTACH was found as -
.33; it means that the PSTACH of younger students are greater than that of the older
students. The correlations between the PREACH, PCGPA and PPCG with the
PSTACH were found as .43, .53 and .54 respectively. .From these we can conclude
that, students having higher the PREACH, obtained again higher the PSTACH, and
the students initially having higher the PCGPA and PPCG, gained more PSTACH
compared to the students having low PCGPA and PPCG. In the same way, the
correlations between the PREACH, PREATT with the PSTATT were also found
significant; correlation coefficients are .23 and .66 respectively. It means that
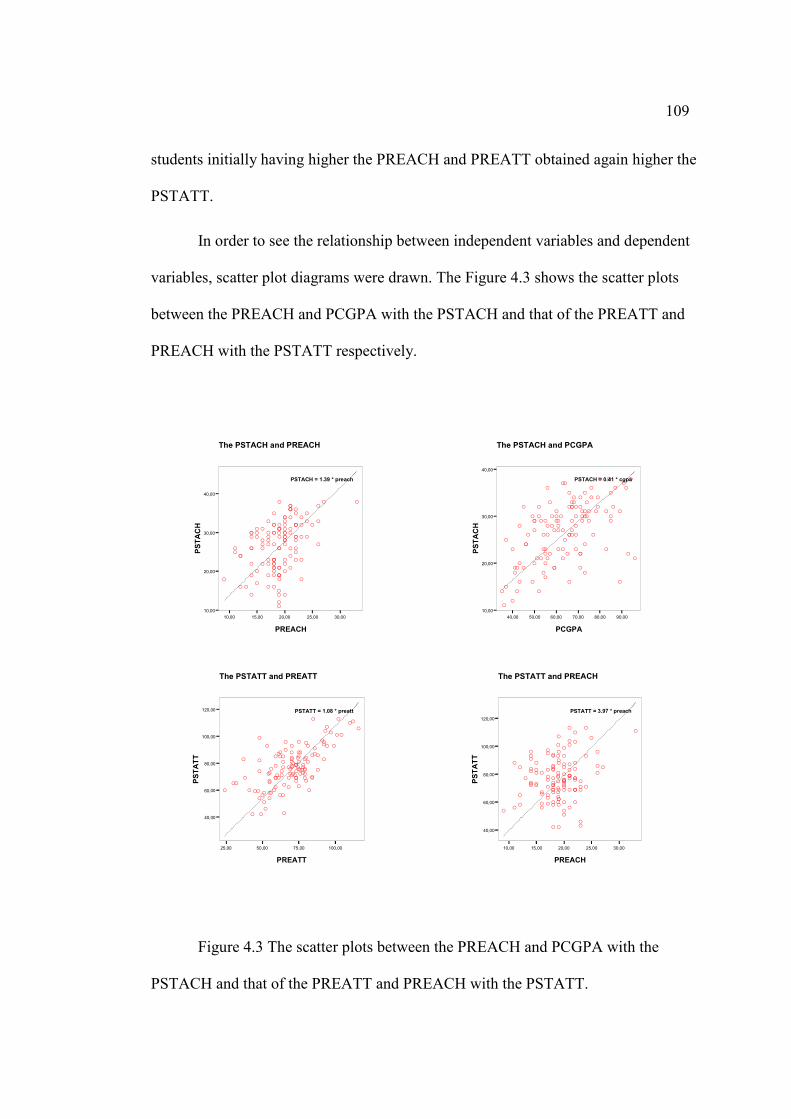
109
students initially having higher the PREACH and PREATT obtained again higher the
PSTATT.
In order to see the relationship between independent variables and dependent
variables, scatter plot diagrams were drawn. The Figure 4.3 shows the scatter plots
between the PREACH and PCGPA with the PSTACH and that of the PREATT and
PREACH with the PSTATT respectively.
10,00 15,00 20,00 25,00 30,00
PREACH
10,00
20,00
30,00
40,00
PSTACH
A
A
A
AA
AAA
A
A
A
A
A A
A
A
A
A
A
A
A
AA
A
A
A
A A
A
A
A
A
AA
A
A
A
A
A
A
A
A
AA
A
A
A
A
A
A
A
A
A
AA
A
A
A
AA
A
A
A
A
A
A
AAA
A
AA
A
AA
A
A
A
A
A
A
AA
A
A
A
A
A
A
AA
A
A
A
AA
A
AA
A
A
A
A
A
A A
A A
A
A
A
A
AA
A
A
A
A
A
AA
PSTACH = 1.39 * preach
The PSTACH and PREACH
40,00 50,00 60,00 70,00 80,00 90,00
PCGPA
10,00
20,00
30,00
40,00
PSTACH
A
A
A
AA
AAA
A
A
A
A
A A
A
A
A
A
A
A
A
AA
A
A
A
AA
A
A
A
A
AA
A
A
A
A
A
A
A
A
AA
A
A
A
A
A
A
A
A
A
AA
A
A
A
AA
A
A
A
A
A
A
AA
AA
A A
A
AA
A
A
A
A
A
A
AA
A
A
A
A
A
A
AA
A
A
A
AA
A
AA
A
A
A
A
A
A A
A A
A
A
A
A
AA
A
A
A
A
A
A A
PSTACH = 0.41 * cgpa
The PSTACH and PCGPA
25,00 50,00 75,00 100,00
PREATT
40,00
60,00
80,00
100,00
120,00
PSTATT
A
A
AA
A
A
A
AA
A
A AAA
A
A
A
A
A
A A
A
A
A
A
A
AA AAA
A
A
AA
A
A
AA
A
A
A
A
A
AA
A
AAAA
A
A
A
A
A
AAA
A
A
A
AA
A
AA
A
A
A
A
A
A
A
A
A
A
A
A
A A
A
A
A
AA
A
A
A
A
A
A
AA
A
A
AA
A
A
A
A
A
A
A
AA
A
AA
A
A
A
A A
A
A
AA
AA
PSTATT = 1.08 * preatt
The PSTATT and PREATT
10,00 15,00 20,00 25,00 30,00
PREACH
40,00
60,00
80,00
100,00
120,00
PSTATT A
A
AA
A
A
A
AA
A
A A AA
A
A
A
A
A
AA
A
A
A
A
A
AA AAAA
A
AA
A
A
AA
A
A
A
A
A
AAA
AA
AA
A
A
A
A
A
AA A
A
A
A
AA
A
AA
A
A
A
A
A
A
A
A
A
A
A
A
A A
A
A
A
AA
A
A
A
A
A
A
AA
A
A
AA
A
A
A
A
A
A
A
AA
A
AAA
A
A
AA
A
A
AA
AA
PSTATT = 3.97 * preach
The PSTATT and PREACH
Figure 4.3 The scatter plots between the PREACH and PCGPA with the
PSTACH and that of the PREATT and PREACH with the PSTATT.
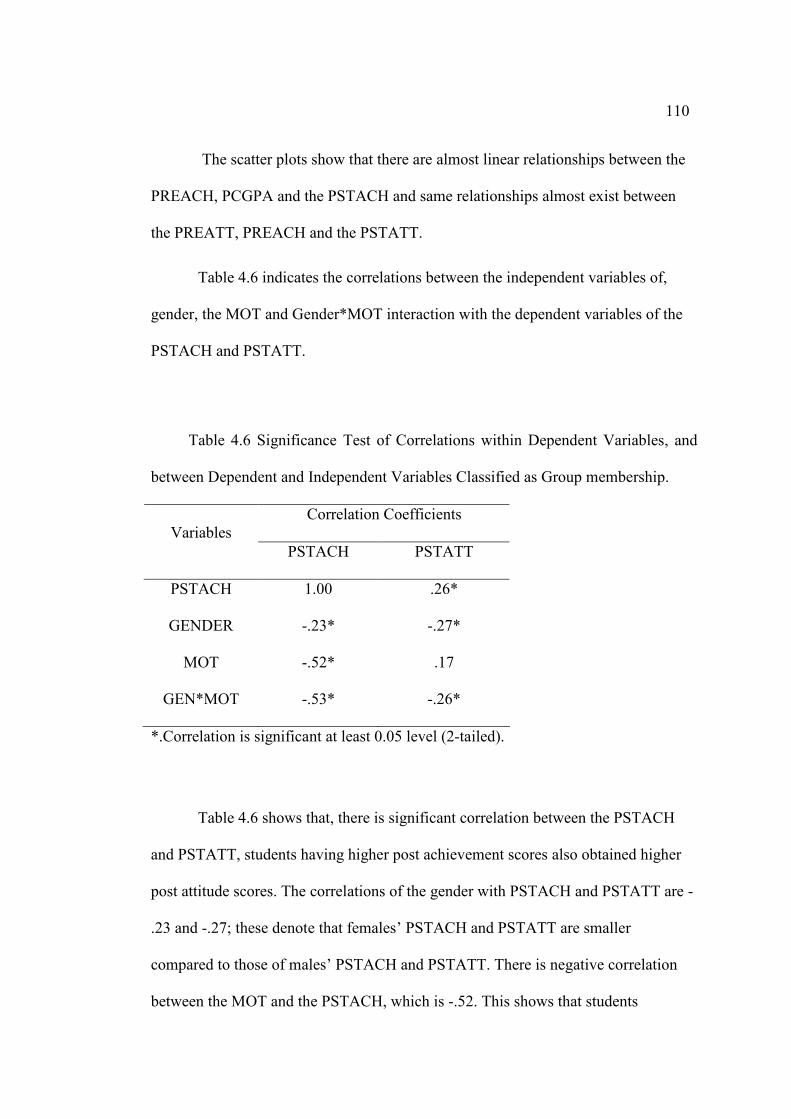
110
The scatter plots show that there are almost linear relationships between the
PREACH, PCGPA and the PSTACH and same relationships almost exist between
the PREATT, PREACH and the PSTATT.
Table 4.6 indicates the correlations between the independent variables of,
gender, the MOT and Gender*MOT interaction with the dependent variables of the
PSTACH and PSTATT.
Table 4.6 Significance Test of Correlations within Dependent Variables, and
between Dependent and Independent Variables Classified as Group membership.
Correlation Coefficients Variables
PSTACH PSTATT
PSTACH 1.00 .26*
GENDER -.23* -.27*
MOT -.52* .17
GEN*MOT -.53* -.26*
*.Correlation is significant at least 0.05 level (2-tailed).
Table 4.6 shows that, there is significant correlation between the PSTACH
and PSTATT, students having higher post achievement scores also obtained higher
post attitude scores. The correlations of the gender with PSTACH and PSTATT are -
.23 and -.27; these denote that females’ PSTACH and PSTATT are smaller
compared to those of males’ PSTACH and PSTATT. There is negative correlation
between the MOT and the PSTACH, which is -.52. This shows that students
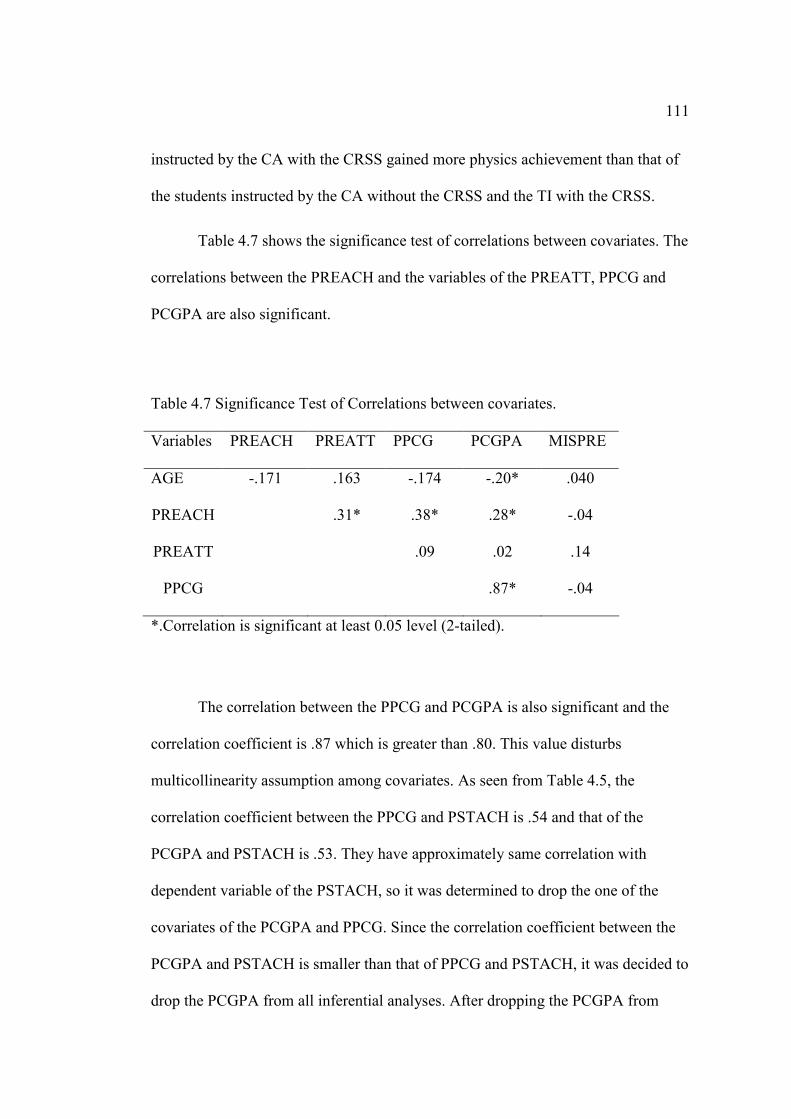
111
instructed by the CA with the CRSS gained more physics achievement than that of
the students instructed by the CA without the CRSS and the TI with the CRSS.
Table 4.7 shows the significance test of correlations between covariates. The
correlations between the PREACH and the variables of the PREATT, PPCG and
PCGPA are also significant.
Table 4.7 Significance Test of Correlations between covariates.
Variables PREACH PREATT PPCG PCGPA MISPRE
AGE -.171 .163 -.174 -.20* .040
PREACH .31* .38* .28* -.04
PREATT .09 .02 .14
PPCG .87* -.04
*.Correlation is significant at least 0.05 level (2-tailed).
The correlation between the PPCG and PCGPA is also significant and the
correlation coefficient is .87 which is greater than .80. This value disturbs
multicollinearity assumption among covariates. As seen from Table 4.5, the
correlation coefficient between the PPCG and PSTACH is .54 and that of the
PCGPA and PSTACH is .53. They have approximately same correlation with
dependent variable of the PSTACH, so it was determined to drop the one of the
covariates of the PCGPA and PPCG. Since the correlation coefficient between the
PCGPA and PSTACH is smaller than that of PPCG and PSTACH, it was decided to
drop the PCGPA from all inferential analyses. After dropping the PCGPA from
112
analyses, the multicollinearity problem was also solved; now none of the correlation
value is greater than 0.80, we can assume that there is no multicollinearity among
covariates. Although as the number of covariates increases, the power of the study
decreases, we accepted the independent variables of age, the PREACH, PREATT,
PPCG and MISPRE as covariates for the following inferential analyses.
4.2.2.2 Assumptions of MANCOVA
Multiple analysis of covariance (MANCOVA) has five assumptions:
Normality, homogeneity of regression, equality of variances, multicollinearity and
independency of observations. All the variables were tested for all the assumptions.
The PSTACH and the PSTATT were in acceptable range for normal
distribution as stated in Section 4.2.1 for descriptive statistics. The histograms given
in Figure 4.1 and Figure 4.2 are evidences for the normality assumptions.
Homogeneity of regression line shows that the effect of methods does not
change through the covariates. Statistically, it means that the slope of the regression
of a dependent variable on covariates must be constant over different values of group
membership. Table 4.8 indicates the results of Multivariate Regression Correlation
(MRC) analysis of homogeneity of regression. For this analysis, 15 new interaction
terms were produced. These interaction terms were prepared by multiplying the
group membership with the covariate independent variables of, age, the PREACH,
PREATT, and the PPCG separately. After that, three different blocks were produced.
Covariate variables were set to Block 1, group membership was set to Block 2 and
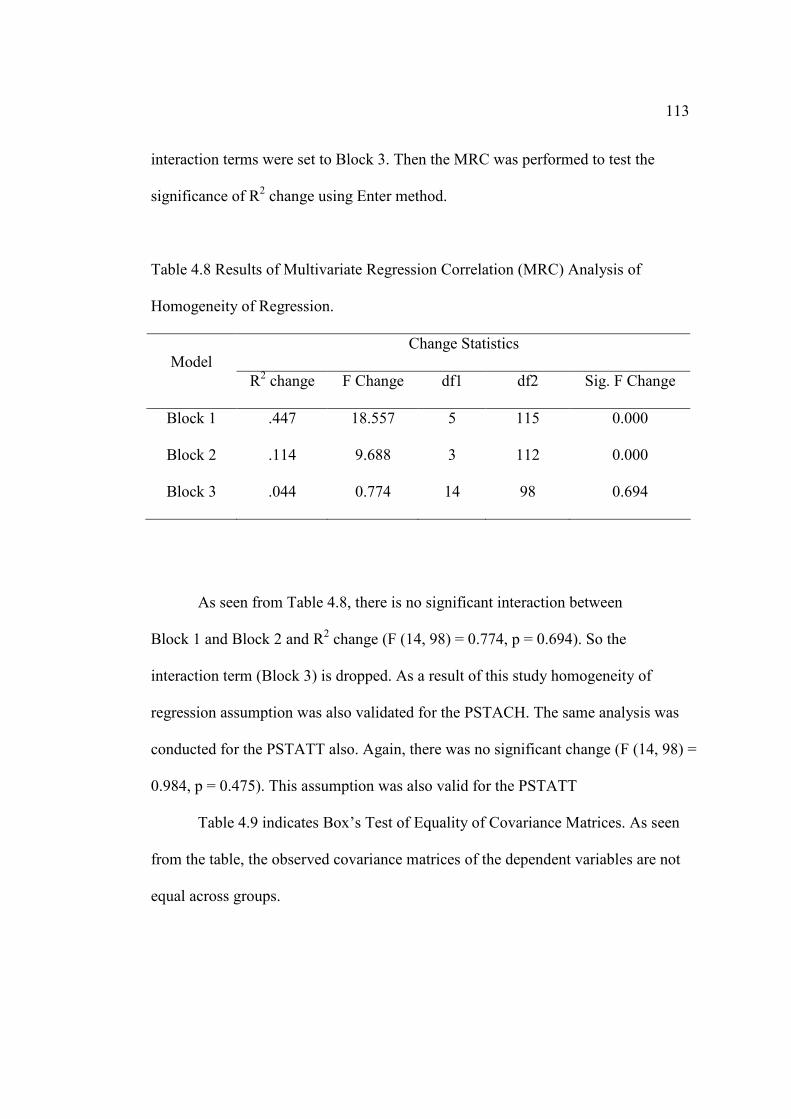
113
interaction terms were set to Block 3. Then the MRC was performed to test the
significance of R2 change using Enter method.
Table 4.8 Results of Multivariate Regression Correlation (MRC) Analysis of
Homogeneity of Regression.
Change Statistics Model
R2 change F Change df1 df2 Sig. F Change
Block 1 .447 18.557 5 115 0.000
Block 2 .114 9.688 3 112 0.000
Block 3 .044 0.774 14 98 0.694
As seen from Table 4.8, there is no significant interaction between
Block 1 and Block 2 and R2 change (F (14, 98) = 0.774, p = 0.694). So the
interaction term (Block 3) is dropped. As a result of this study homogeneity of
regression assumption was also validated for the PSTACH. The same analysis was
conducted for the PSTATT also. Again, there was no significant change (F (14, 98) =
0.984, p = 0.475). This assumption was also valid for the PSTATT
Table 4.9 indicates Box’s Test of Equality of Covariance Matrices. As seen
from the table, the observed covariance matrices of the dependent variables are not
equal across groups.
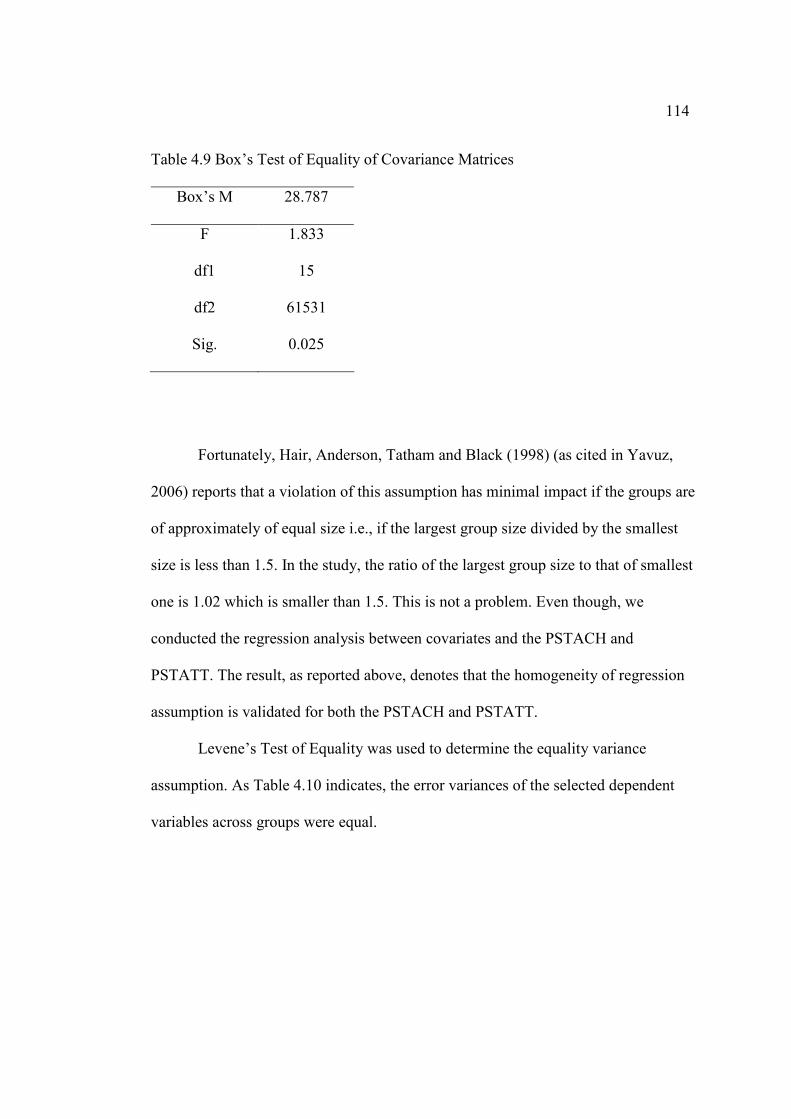
114
Table 4.9 Box’s Test of Equality of Covariance Matrices
Box’s M 28.787
F 1.833
df1 15
df2 61531
Sig. 0.025
Fortunately, Hair, Anderson, Tatham and Black (1998) (as cited in Yavuz,
2006) reports that a violation of this assumption has minimal impact if the groups are
of approximately of equal size i.e., if the largest group size divided by the smallest
size is less than 1.5. In the study, the ratio of the largest group size to that of smallest
one is 1.02 which is smaller than 1.5. This is not a problem. Even though, we
conducted the regression analysis between covariates and the PSTACH and
PSTATT. The result, as reported above, denotes that the homogeneity of regression
assumption is validated for both the PSTACH and PSTATT.
Levene’s Test of Equality was used to determine the equality variance
assumption. As Table 4.10 indicates, the error variances of the selected dependent
variables across groups were equal.
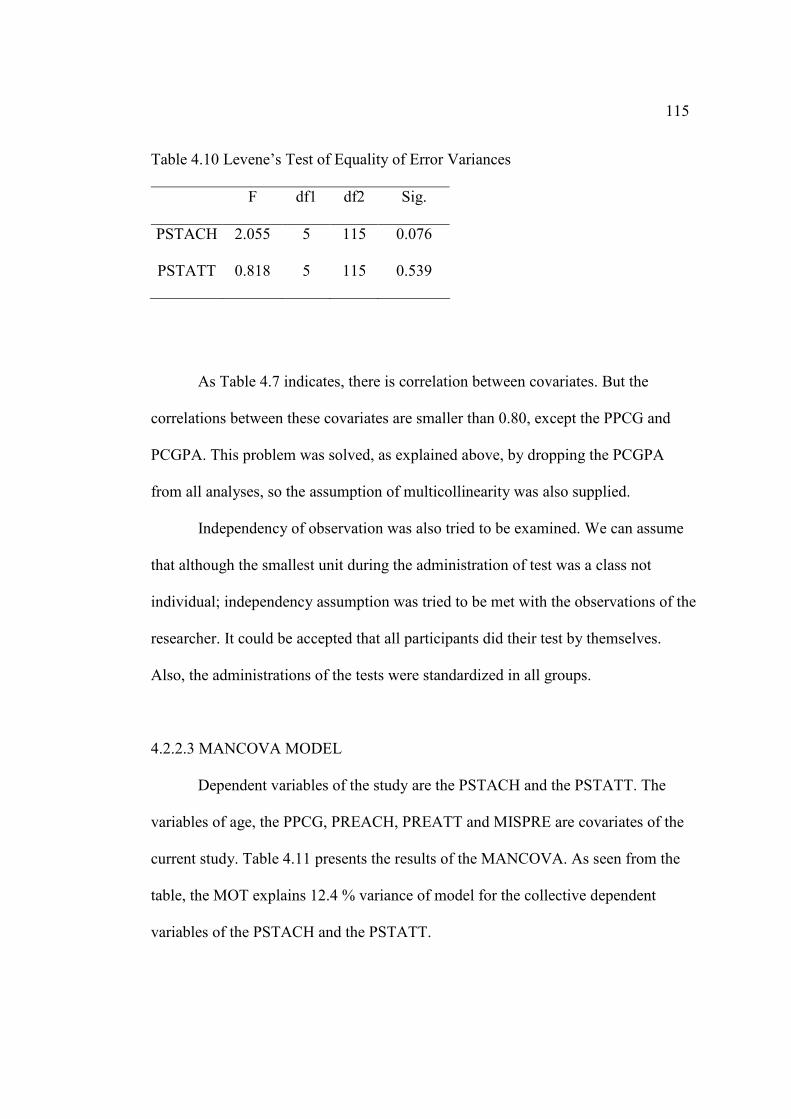
115
Table 4.10 Levene’s Test of Equality of Error Variances
F df1 df2 Sig.
PSTACH 2.055 5 115 0.076
PSTATT 0.818 5 115 0.539
As Table 4.7 indicates, there is correlation between covariates. But the
correlations between these covariates are smaller than 0.80, except the PPCG and
PCGPA. This problem was solved, as explained above, by dropping the PCGPA
from all analyses, so the assumption of multicollinearity was also supplied.
Independency of observation was also tried to be examined. We can assume
that although the smallest unit during the administration of test was a class not
individual; independency assumption was tried to be met with the observations of the
researcher. It could be accepted that all participants did their test by themselves.
Also, the administrations of the tests were standardized in all groups.
4.2.2.3 MANCOVA MODEL
Dependent variables of the study are the PSTACH and the PSTATT. The
variables of age, the PPCG, PREACH, PREATT and MISPRE are covariates of the
current study. Table 4.11 presents the results of the MANCOVA. As seen from the
table, the MOT explains 12.4 % variance of model for the collective dependent
variables of the PSTACH and the PSTATT.
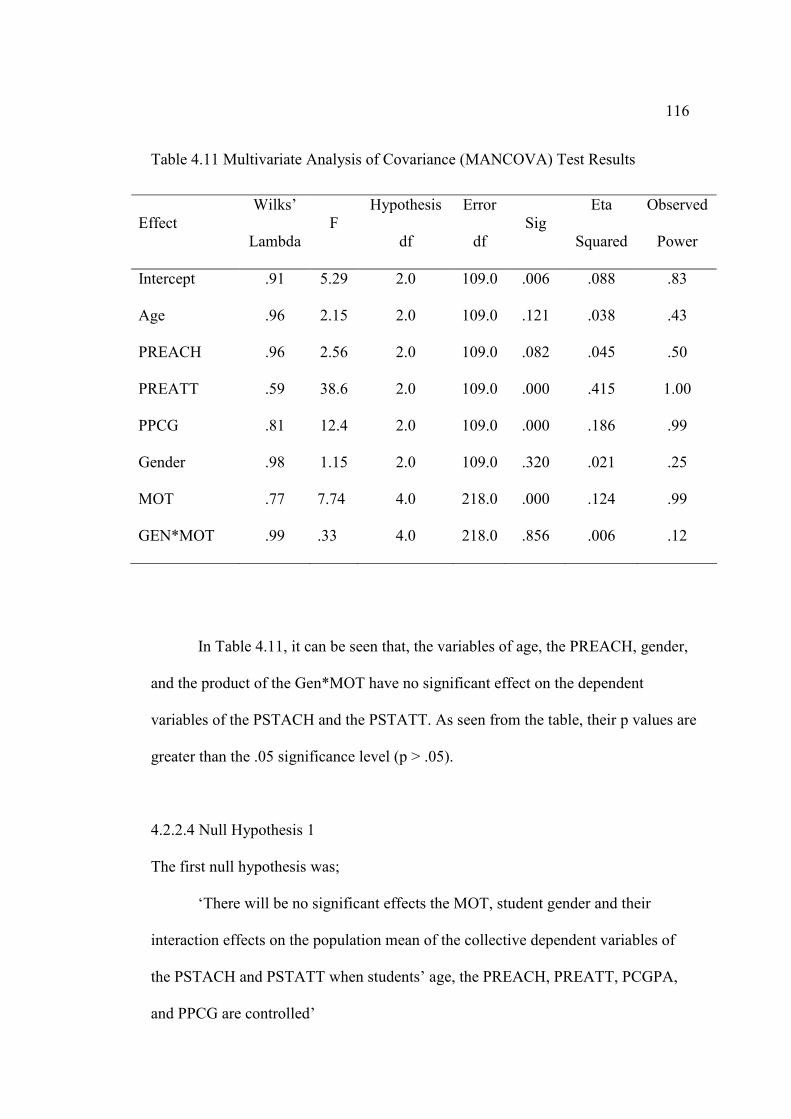
116
Table 4.11 Multivariate Analysis of Covariance (MANCOVA) Test Results
Effect Wilks’
Lambda F
Hypothesis
df
Error
df Sig
Eta
Squared
Observed
Power
Intercept .91 5.29 2.0 109.0 .006 .088 .83
Age .96 2.15 2.0 109.0 .121 .038 .43
PREACH .96 2.56 2.0 109.0 .082 .045 .50
PREATT .59 38.6 2.0 109.0 .000 .415 1.00
PPCG .81 12.4 2.0 109.0 .000 .186 .99
Gender .98 1.15 2.0 109.0 .320 .021 .25
MOT .77 7.74 4.0 218.0 .000 .124 .99
GEN*MOT .99 .33 4.0 218.0 .856 .006 .12
In Table 4.11, it can be seen that, the variables of age, the PREACH, gender,
and the product of the Gen*MOT have no significant effect on the dependent
variables of the PSTACH and the PSTATT. As seen from the table, their p values are
greater than the .05 significance level (p > .05).
4.2.2.4 Null Hypothesis 1
The first null hypothesis was;
‘There will be no significant effects the MOT, student gender and their
interaction effects on the population mean of the collective dependent variables of
the PSTACH and PSTATT when students’ age, the PREACH, PREATT, PCGPA,
and PPCG are controlled’

117
As seen from Table 4.11, the first null hypothesis was rejected for the MOT
(λ= 0.77, p =. 000). There has been found significant main effect of the MOT on the
collective dependent variables of the PSTACH and PSTATT.
Table 4.11 presents also that the first hypothesis was not rejected for gender
and Gender*MOT. There were no evidences about the effectiveness of gender (λ=
0.98, p =. 320) and Gender*MOT (λ= 0.99, p =. 856) on PSTACH and PSTATT.
In order to test the effect of independent variable of the MOT (the CA with
the CRSS, the CA without the CRSS and the TI with the CRSS) on each dependent
variable, an analysis of covariance (ANCOVA) was conducted as follow-up tests to
the MANCOVA. Table 4.12 indicates the result of the statistical analysis of
ANCOVA.
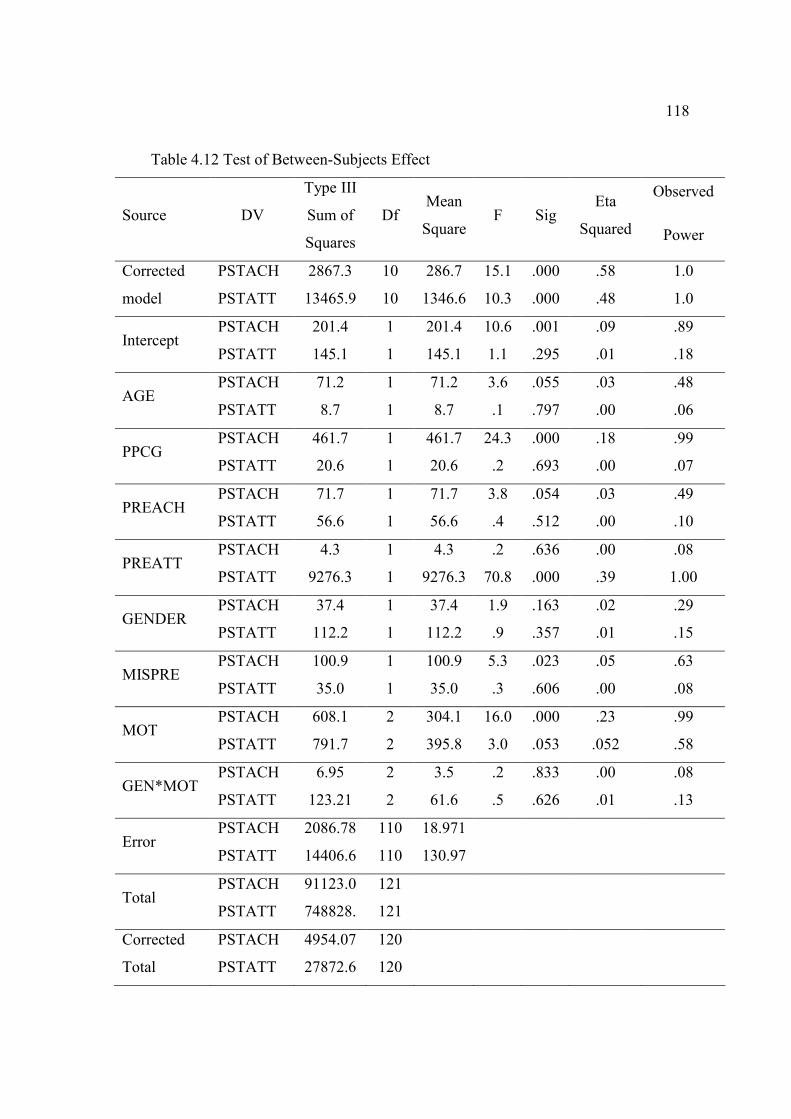
118
Table 4.12 Test of Between-Subjects Effect
Source DV
Type III
Sum of
Squares
Df Mean
Square F Sig
Eta
Squared
Observed
Power
Corrected
model
PSTACH
PSTATT
2867.3
13465.9 10
10
286.7
1346.6
15.1
10.3
.000
.000
.58
.48
1.0
1.0
Intercept PSTACH
PSTATT
201.4
145.1
1
1
201.4
145.1
10.6
1.1
.001
.295
.09
.01
.89
.18
AGE PSTACH
PSTATT
71.2
8.7
1
1
71.2
8.7
3.6
.1
.055
.797
.03
.00
.48
.06
PPCG PSTACH
PSTATT
461.7
20.6
1
1
461.7
20.6
24.3
.2
.000
.693
.18
.00
.99
.07
PREACH PSTACH
PSTATT
71.7
56.6
1
1
71.7
56.6
3.8
.4
.054
.512
.03
.00
.49
.10
PREATT PSTACH
PSTATT
4.3
9276.3
1
1
4.3
9276.3
.2
70.8
.636
.000
.00
.39
.08
1.00
GENDER PSTACH
PSTATT
37.4
112.2
1
1
37.4
112.2
1.9
.9
.163
.357
.02
.01
.29
.15
MISPRE PSTACH
PSTATT
100.9
35.0
1
1
100.9
35.0
5.3
.3
.023
.606
.05
.00
.63
.08
MOT PSTACH
PSTATT
608.1
791.7
2
2
304.1
395.8
16.0
3.0
.000
.053
.23
.052
.99
.58
GEN*MOT PSTACH
PSTATT
6.95
123.21
2
2
3.5
61.6
.2
.5
.833
.626
.00
.01
.08
.13
Error PSTACH
PSTATT
2086.78
14406.6
110
110
18.971
130.97
Total PSTACH
PSTATT
91123.0
748828.
121
121
Corrected
Total
PSTACH
PSTATT
4954.07
27872.6
120
120
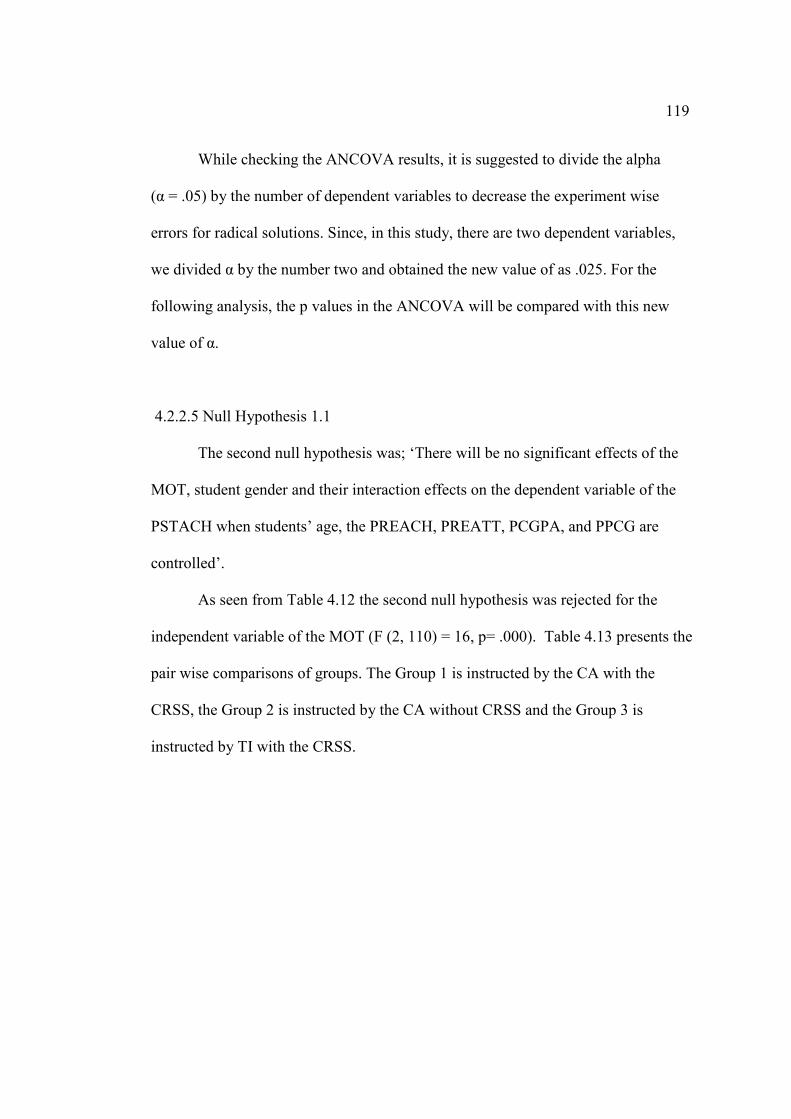
119
While checking the ANCOVA results, it is suggested to divide the alpha
(α = .05) by the number of dependent variables to decrease the experiment wise
errors for radical solutions. Since, in this study, there are two dependent variables,
we divided α by the number two and obtained the new value of as .025. For the
following analysis, the p values in the ANCOVA will be compared with this new
value of α.
4.2.2.5 Null Hypothesis 1.1
The second null hypothesis was; ‘There will be no significant effects of the
MOT, student gender and their interaction effects on the dependent variable of the
PSTACH when students’ age, the PREACH, PREATT, PCGPA, and PPCG are
controlled’.
As seen from Table 4.12 the second null hypothesis was rejected for the
independent variable of the MOT (F (2, 110) = 16, p= .000). Table 4.13 presents the
pair wise comparisons of groups. The Group 1 is instructed by the CA with the
CRSS, the Group 2 is instructed by the CA without CRSS and the Group 3 is
instructed by TI with the CRSS.
120
Table 4.13 The Pair wise Comparisons for the PSTACH
DV Group (I) Group (J) Mean
Difference Std. Error Sig.
1 2 4.70 1.07 .000
3 5.56 1.03 .000
2 1 -4.70 1.07 .000 PSTACH
3 .85 99 1.00
The Table 4.13 presents that the CA with CRSS was effective on the
PSTACH. Students instructed by the CA with CRSS had higher physics achievement
scores than the students thought by the CA without CRSS and the TI with the CRSS.
The Table 4.12 also reports that effects of gender and gender*MOT on the
PSTACH were found insignificant. There were no evidences about the significant
effects of gender (F (1, 110) = 1.9, p= .163) and gender*MOT (F (2, 110) = .2, p=
.833). Moreover, there was no significant difference of male’s PSTACH and
female’s PSTACH. Similarly, MOT did not affect the male’s PSTACH and female’s
PSTACH.
4.2.2.6 Null Hypothesis 1.2
The third null hypothesis was; ‘There will be no significant effects of the
MOT, student gender and their interaction effects on the dependent variable of the
PSTATT when students’ age, the PREACH, PREATT, PCGPA, and PPCG are
controlled’.
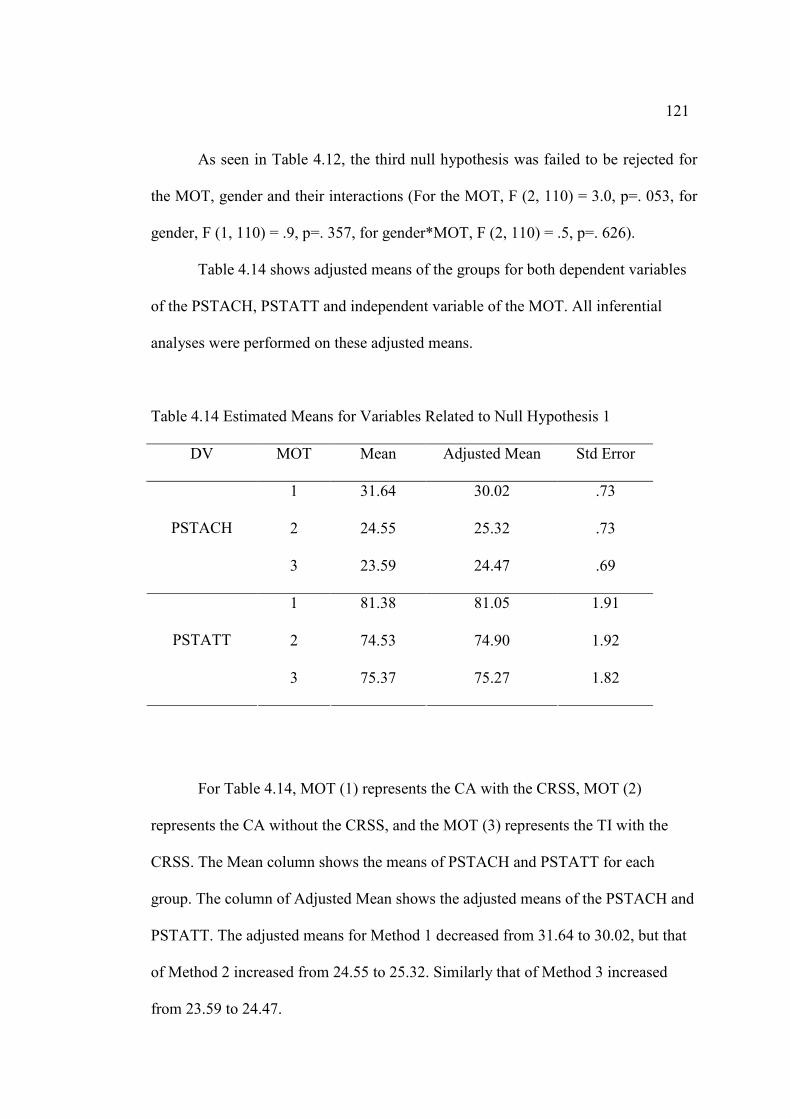
121
As seen in Table 4.12, the third null hypothesis was failed to be rejected for
the MOT, gender and their interactions (For the MOT, F (2, 110) = 3.0, p=. 053, for
gender, F (1, 110) = .9, p=. 357, for gender*MOT, F (2, 110) = .5, p=. 626).
Table 4.14 shows adjusted means of the groups for both dependent variables
of the PSTACH, PSTATT and independent variable of the MOT. All inferential
analyses were performed on these adjusted means.
Table 4.14 Estimated Means for Variables Related to Null Hypothesis 1
DV MOT Mean Adjusted Mean Std Error
1 31.64 30.02 .73
2 24.55 25.32 .73 PSTACH
3 23.59 24.47 .69
1 81.38 81.05 1.91
2 74.53 74.90 1.92 PSTATT
3 75.37 75.27 1.82
For Table 4.14, MOT (1) represents the CA with the CRSS, MOT (2)
represents the CA without the CRSS, and the MOT (3) represents the TI with the
CRSS. The Mean column shows the means of PSTACH and PSTATT for each
group. The column of Adjusted Mean shows the adjusted means of the PSTACH and
PSTATT. The adjusted means for Method 1 decreased from 31.64 to 30.02, but that
of Method 2 increased from 24.55 to 25.32. Similarly that of Method 3 increased
from 23.59 to 24.47.
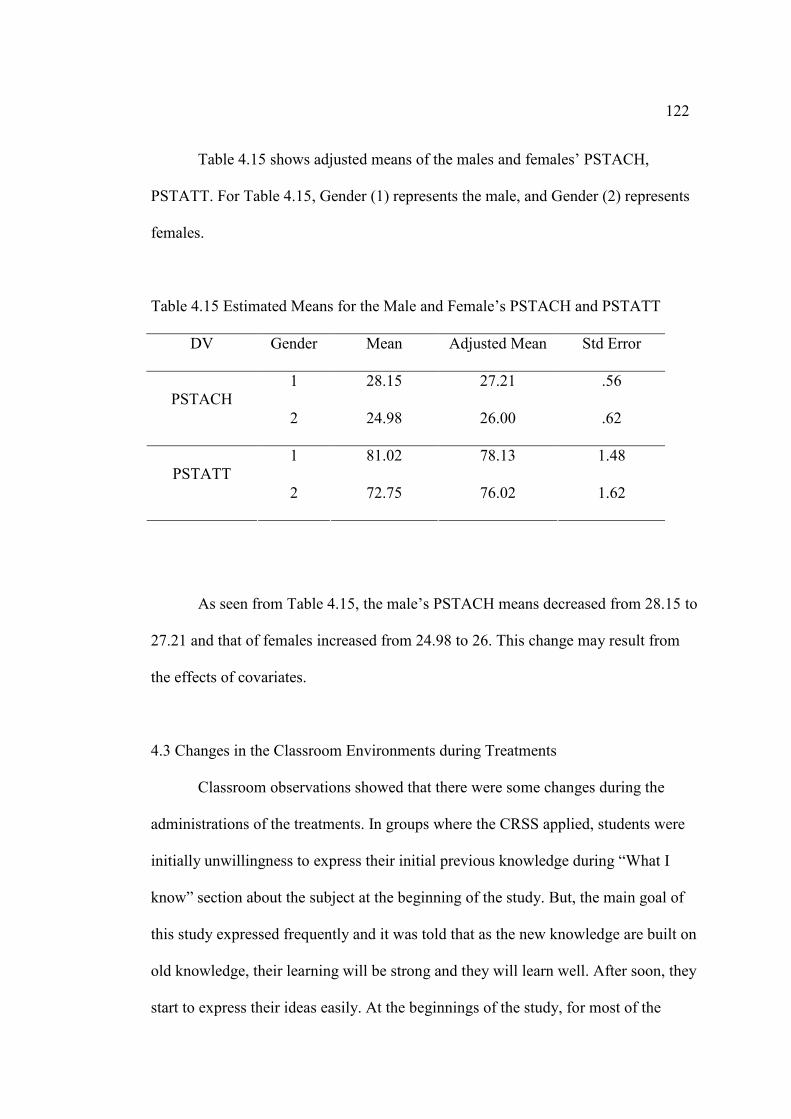
122
Table 4.15 shows adjusted means of the males and females’ PSTACH,
PSTATT. For Table 4.15, Gender (1) represents the male, and Gender (2) represents
females.
Table 4.15 Estimated Means for the Male and Female’s PSTACH and PSTATT
DV Gender Mean Adjusted Mean Std Error
1 28.15 27.21 .56 PSTACH
2 24.98 26.00 .62
1 81.02 78.13 1.48 PSTATT
2 72.75 76.02 1.62
As seen from Table 4.15, the male’s PSTACH means decreased from 28.15 to
27.21 and that of females increased from 24.98 to 26. This change may result from
the effects of covariates.
4.3 Changes in the Classroom Environments during Treatments
Classroom observations showed that there were some changes during the
administrations of the treatments. In groups where the CRSS applied, students were
initially unwillingness to express their initial previous knowledge during “What I
know” section about the subject at the beginning of the study. But, the main goal of
this study expressed frequently and it was told that as the new knowledge are built on
old knowledge, their learning will be strong and they will learn well. After soon, they
start to express their ideas easily. At the beginnings of the study, for most of the
123
students, producing their own questions, reading the text to find out answers to their
questions and writing what they have learned from readings was difficult and boring
because until this time they did not use this technique anywhere.
The students instructed by the CA with the CRSS, also have some difficulties.
Fortunately, the CA enforce teaching hardcore physics, critical thinking and relating
role of physics to technology, it attracted students’ interest to subject matter more
quickly.
The CA and CRSS completed each other as a powerful method. As the study
continued, students start to take part in class discussions and asked more conceptual
oriented questions. Moreover, sometimes they started to ask global questions and the
discussions extended to other subjects matter, but at these points teachers managed to
convert discussions to optics. Besides, the experimental demonstrations, class
discussions, activity sessions, power point presentations and animations took
students’ attention to optics. Especially, the discussions related to real life
phenomenon enforced students to enroll the lessons. But again, filling the CRSS
tables was boring for most of the students in this group.
Students instructed by the CA without the CRSS liked the experimental
demonstrations, class discussions, activities, conceptual oriented real life questions.
The power point presentations animations were useful for them also.
The students instructed by the TI with the CRSS, similar to the CA with the
CRSS, did not express their initial knowledge in “What I know” sessions. After a
while they got used to techniques, but their enrollment to the class discussions did
not increase like the CA with CRSS group students. According to them, filing the
CRSS tables is not so much beneficial. And their questions for the “What I want to
124
learn “ parts are traditional questions. But regularly, they also completed the tables
and brought their responsibilities regularly.
4.4 The Results of the Self Evaluation - Observation Check Lists
In studies, one way of controlling the treatment verification is observing the
classrooms and evaluating whether the methods are administered relevant to their
protocols or not. For the treatment verification, throughout the study, the researcher
and the teachers evaluated the study. For this aim researcher prepared self evaluation
- observation check list. Since it was not possible to follow all groups in two schools,
the lists were filled mostly by the teachers who applied the methods and the
researcher. The checklist consists of four parts; these parts are related with physical
properties of classroom, teacher characteristics, students’ characteristics and method
related characteristics. During the study 24 lists were filled, each group was
evaluated by eight self evaluation checklists. Each teacher evaluated their
instructions by three evaluation check lists. Besides these, the researcher filled two
checklists for each group in one school, but he couldn’t make observation for the
classes of other school. The data were collected and their percentages were
calculated and the results were presented in Table 4.16.
The classrooms’ physical properties were evaluated by six questions. Table
4.16 presents the results of physical properties of classroom observation according to
each item.
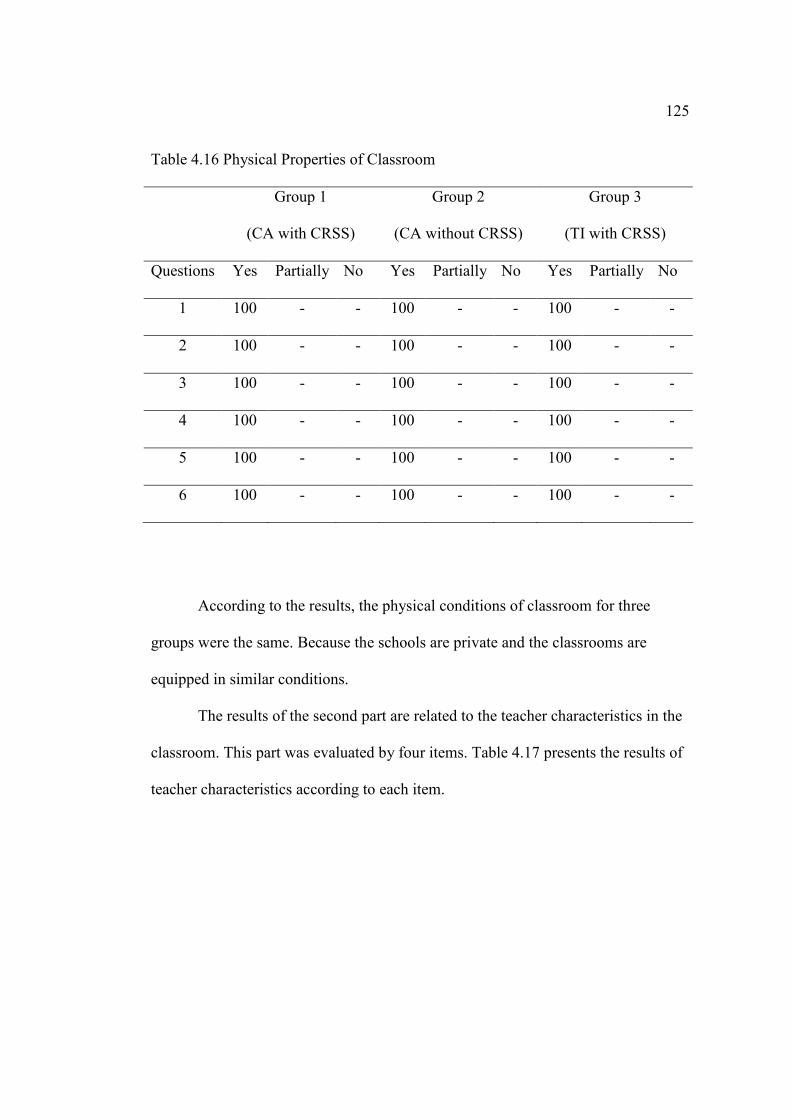
125
Table 4.16 Physical Properties of Classroom
Group 1
(CA with CRSS)
Group 2
(CA without CRSS)
Group 3
(TI with CRSS)
Questions Yes Partially No Yes Partially No Yes Partially No
1 100 - - 100 - - 100 - -
2 100 - - 100 - - 100 - -
3 100 - - 100 - - 100 - -
4 100 - - 100 - - 100 - -
5 100 - - 100 - - 100 - -
6 100 - - 100 - - 100 - -
According to the results, the physical conditions of classroom for three
groups were the same. Because the schools are private and the classrooms are
equipped in similar conditions.
The results of the second part are related to the teacher characteristics in the
classroom. This part was evaluated by four items. Table 4.17 presents the results of
teacher characteristics according to each item.
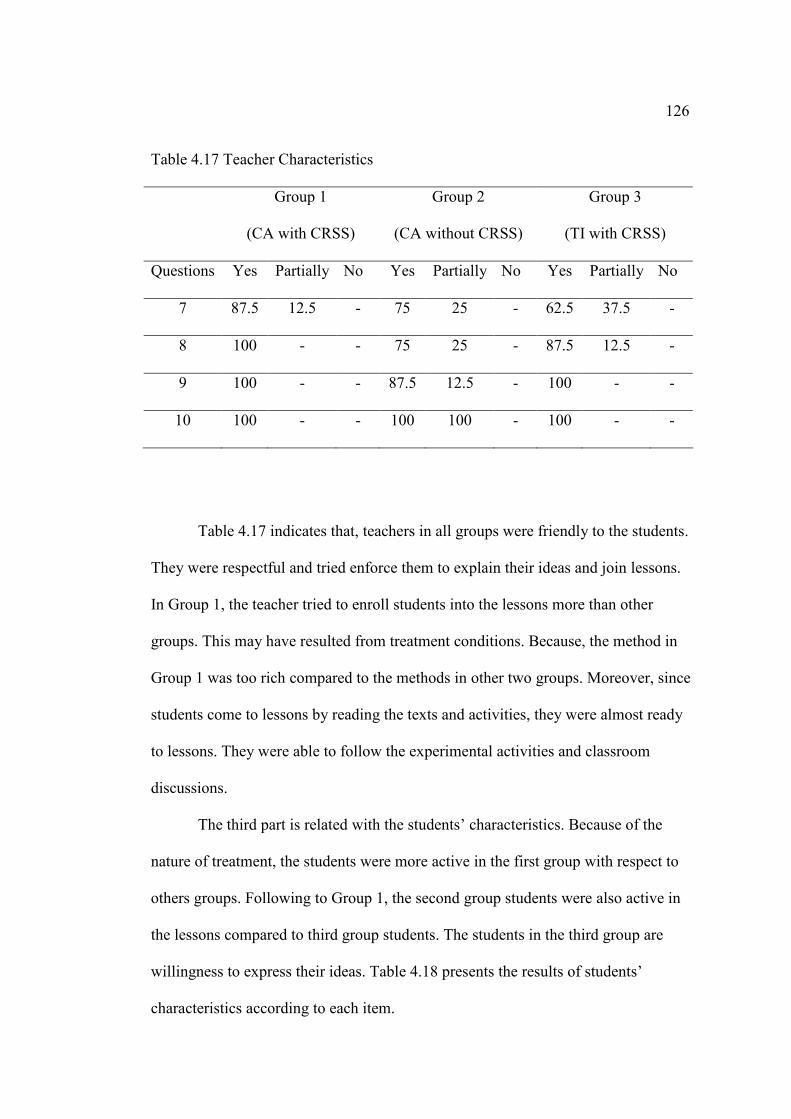
126
Table 4.17 Teacher Characteristics
Group 1
(CA with CRSS)
Group 2
(CA without CRSS)
Group 3
(TI with CRSS)
Questions Yes Partially No Yes Partially No Yes Partially No
7 87.5 12.5 - 75 25 - 62.5 37.5 -
8 100 - - 75 25 - 87.5 12.5 -
9 100 - - 87.5 12.5 - 100 - -
10 100 - - 100 100 - 100 - -
Table 4.17 indicates that, teachers in all groups were friendly to the students.
They were respectful and tried enforce them to explain their ideas and join lessons.
In Group 1, the teacher tried to enroll students into the lessons more than other
groups. This may have resulted from treatment conditions. Because, the method in
Group 1 was too rich compared to the methods in other two groups. Moreover, since
students come to lessons by reading the texts and activities, they were almost ready
to lessons. They were able to follow the experimental activities and classroom
discussions.
The third part is related with the students’ characteristics. Because of the
nature of treatment, the students were more active in the first group with respect to
others groups. Following to Group 1, the second group students were also active in
the lessons compared to third group students. The students in the third group are
willingness to express their ideas. Table 4.18 presents the results of students’
characteristics according to each item.
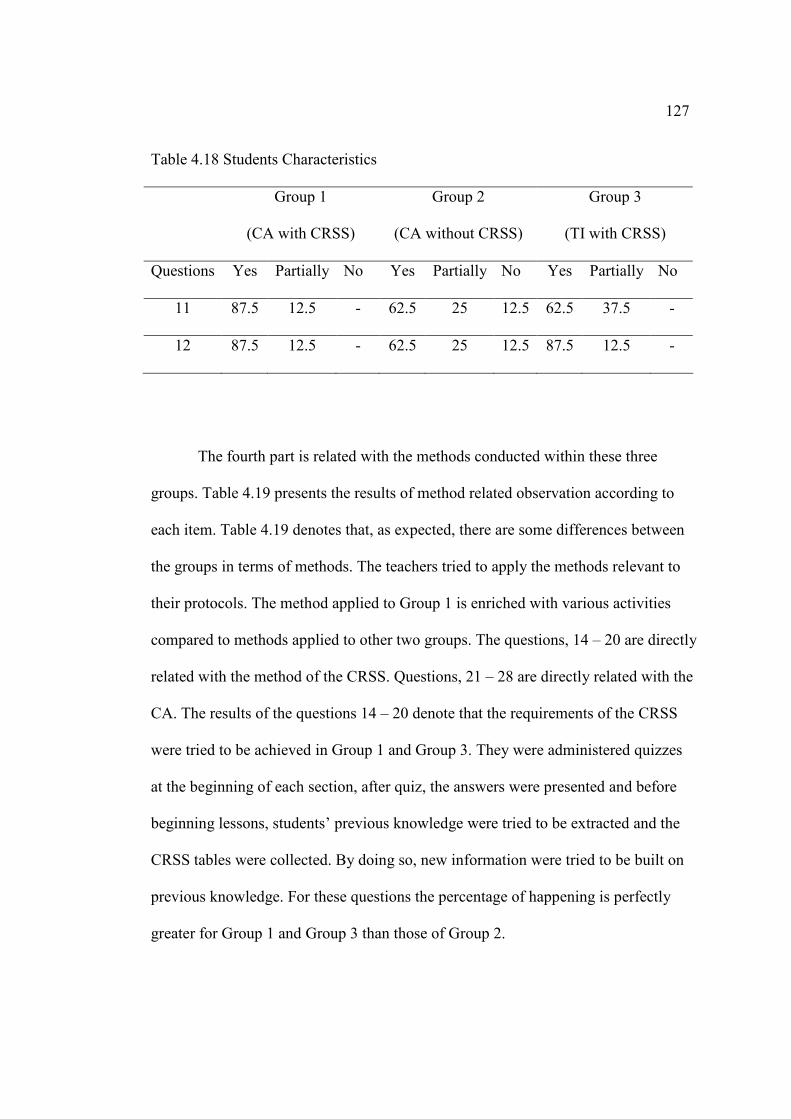
127
Table 4.18 Students Characteristics
Group 1
(CA with CRSS)
Group 2
(CA without CRSS)
Group 3
(TI with CRSS)
Questions Yes Partially No Yes Partially No Yes Partially No
11 87.5 12.5 - 62.5 25 12.5 62.5 37.5 -
12 87.5 12.5 - 62.5 25 12.5 87.5 12.5 -
The fourth part is related with the methods conducted within these three
groups. Table 4.19 presents the results of method related observation according to
each item. Table 4.19 denotes that, as expected, there are some differences between
the groups in terms of methods. The teachers tried to apply the methods relevant to
their protocols. The method applied to Group 1 is enriched with various activities
compared to methods applied to other two groups. The questions, 14 – 20 are directly
related with the method of the CRSS. Questions, 21 – 28 are directly related with the
CA. The results of the questions 14 – 20 denote that the requirements of the CRSS
were tried to be achieved in Group 1 and Group 3. They were administered quizzes
at the beginning of each section, after quiz, the answers were presented and before
beginning lessons, students’ previous knowledge were tried to be extracted and the
CRSS tables were collected. By doing so, new information were tried to be built on
previous knowledge. For these questions the percentage of happening is perfectly
greater for Group 1 and Group 3 than those of Group 2.
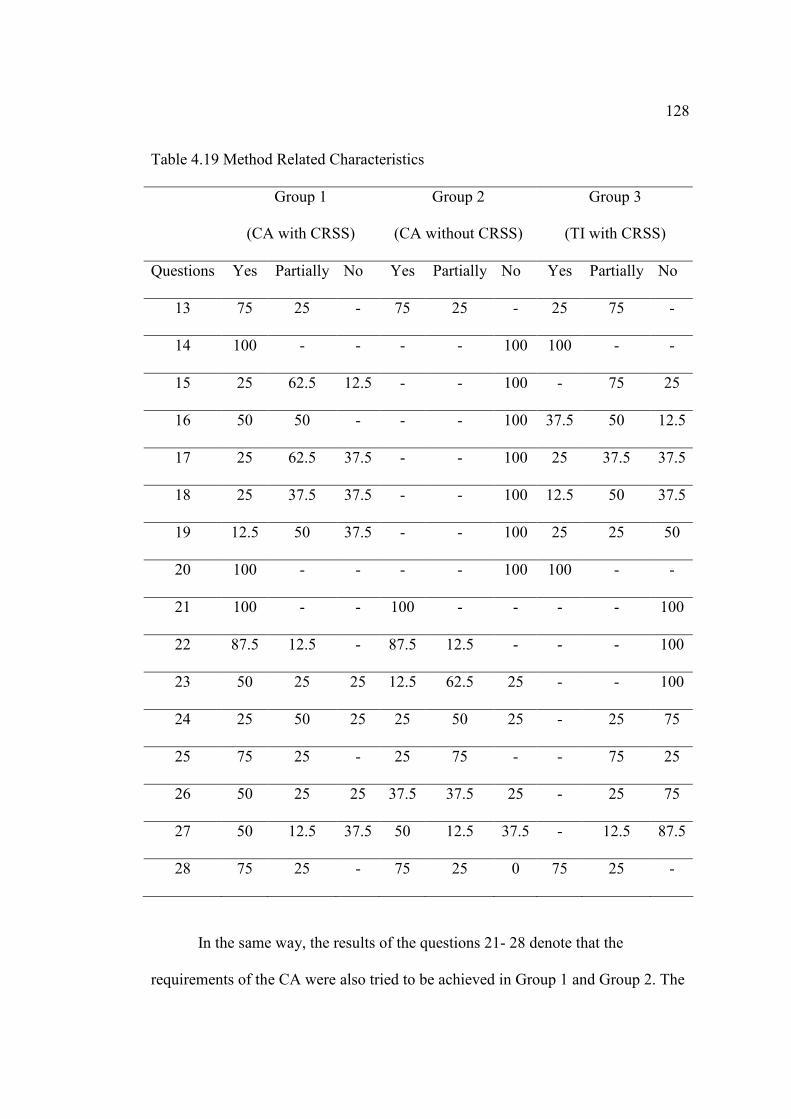
128
Table 4.19 Method Related Characteristics
Group 1
(CA with CRSS)
Group 2
(CA without CRSS)
Group 3
(TI with CRSS)
Questions Yes Partially No Yes Partially No Yes Partially No
13 75 25 - 75 25 - 25 75 -
14 100 - - - - 100 100 - -
15 25 62.5 12.5 - - 100 - 75 25
16 50 50 - - - 100 37.5 50 12.5
17 25 62.5 37.5 - - 100 25 37.5 37.5
18 25 37.5 37.5 - - 100 12.5 50 37.5
19 12.5 50 37.5 - - 100 25 25 50
20 100 - - - - 100 100 - -
21 100 - - 100 - - - - 100
22 87.5 12.5 - 87.5 12.5 - - - 100
23 50 25 25 12.5 62.5 25 - - 100
24 25 50 25 25 50 25 - 25 75
25 75 25 - 25 75 - - 75 25
26 50 25 25 37.5 37.5 25 - 25 75
27 50 12.5 37.5 50 12.5 37.5 - 12.5 87.5
28 75 25 - 75 25 0 75 25 -
In the same way, the results of the questions 21- 28 denote that the
requirements of the CA were also tried to be achieved in Group 1 and Group 2. The
129
lessons in these groups were studied over power point slides prepared by researcher
by using computer and overhead projectors and the teachers stressed on the meanings
of concepts by showing demonstrations, animations, experimental activities and
giving daily life examples. The classroom discussions were conducted to enforce
students’ critical thinking.
The results of the checklists, filled by teacher and researcher for each group
were correlated for the classes having the same methods. The results showed that the
Inter – rater reliabilities were found as .92 for the classes instructed by the CA with
the CRSS, and .98 for the classes instructed by the CA without the CRSS and .98 for
those instructed by the TI with the CRSS. These show that whether the researcher,
teacher or other observers observed lessons or not, the lessons were studied relevant
to teaching protocols in each group independent of the observer.
4.5 The Results of the Short Quizzes
The CRSS requires students to read the sections strategically and fill the
CRSS tables relevant to theory. In order to enforce student to read systematically and
continuously, five different short quizzes, for each section, were prepared and
applied to students instructed by the CRSS. The questions are true/false, multiple
choice and open ended type. The number of questions varied from 3 to 10. Each quiz
was evaluated out of five points. After, the quizzes were administered, the questions
were answered in the classroom environment and the results were announced at the
beginning of the next lesson.
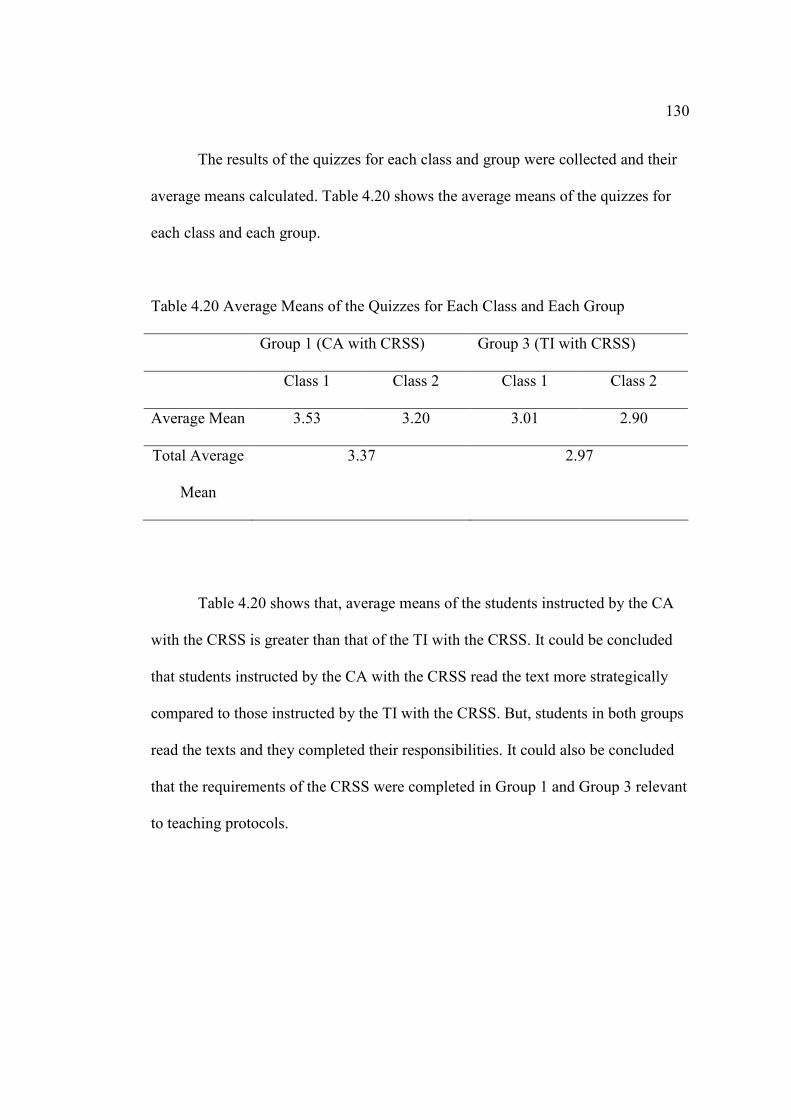
130
The results of the quizzes for each class and group were collected and their
average means calculated. Table 4.20 shows the average means of the quizzes for
each class and each group.
Table 4.20 Average Means of the Quizzes for Each Class and Each Group
Group 1 (CA with CRSS) Group 3 (TI with CRSS)
Class 1 Class 2 Class 1 Class 2
Average Mean 3.53 3.20 3.01 2.90
Total Average
Mean
3.37 2.97
Table 4.20 shows that, average means of the students instructed by the CA
with the CRSS is greater than that of the TI with the CRSS. It could be concluded
that students instructed by the CA with the CRSS read the text more strategically
compared to those instructed by the TI with the CRSS. But, students in both groups
read the texts and they completed their responsibilities. It could also be concluded
that the requirements of the CRSS were completed in Group 1 and Group 3 relevant
to teaching protocols.

131
4.6 The Summary of Results
In the light of the findings, obtained by statistical analyses, the following
results could be summarized as follows:
1. In the current study, students’ PACT were scored out of 41. The descriptive study
indicated that the minimum score was 9 and the maximum score was 33 on the
PREACH among whole students. After the study was completed, the minimum
score was 11 and the maximum score was 38 for the PSTACH among all
students. The treatments increased the general mean of the PREACH from 18.93
up to 26.68 for the PSTACH. Even though the students’ achievement mean was
increased, it is still low compared to 41. This could be because of the nature of
the test. Mainly it consists of questions related with misconceptions in optics and
most of the questions are conceptual questions. Similarly, students’ PATS were
scored out of 120. The general mean of the PREATT was 69.89 and it was
increased up to 77.89 for the PSTATT. Even though there was increase in the
mean of the PSTATT, the mean of the PSTATT is too low compared to 120.
2. The statistical analyses showed that independent variables of age, the PPCG,
PCGPA, PREACH, and PREATT have significant correlations with at least one
of the dependent variables of the PSTACH and PSTATT.
3. The independent variables of age, the PPCG, PREACH, and PREATT were
chosen as the covariates of the study.
4. The statistical analysis of MANCOVA showed that, there was significant effect
of the MOT on the collective dependent variables of the PSTACH and PSTATT,
but the effects of gender and gender*MOT on the collective dependent variables
of the PSTACH and PSTATT were insignificant.
132
5. The statistical analysis of the ANCOVA showed that, there was significant effect
of the MOT on the PSTACH, but the effects of gender and gender*MOT on
PSTACH were insignificant. The results of the ANCOVA also indicated that,
there were no significant effects of the MOT, gender and gender*MOT on the
PSTATT.
6. The results of the Post – Hoc analysis indicated that students, instructed by the
CA with the CRSS, gained more physics achievement than the students
instructed by the CA without the CRSS and those of instructed by the TI with the
CRSS. But, the CA without the CRSS and the TI with the CRSS increased
students average achievement means almost equally.
7. The mean of the PATS for the students instructed by the CA with the CRSS was
increased more compared to that of students instructed by the CA without CRSS
and the TI with the CRSS. But this increase is not statistically significant.
8. The results of the self evaluation – observation checklists denoted that, during the
study the physical conditions of the classrooms were suitable and almost same
for all study groups. The teachers were friendly and helpful to students and they
tried to implement the methods relevant to their protocols in all study groups.
133
CHAPTER 5
CONCLUSIONS, DISCUSSION AND IMPLICATIONS
This chapter is divided into five sections. The first section deals with the
discussion of the results. The second section presents the internal and external
validity of the study. The third section is related with the conclusions of the study.
The fourth section presents the implications of the study. Finally, the last section
gives recommendations for further studies.
5.1 Discussion of the Results
When the findings of this research compared with those of previous ones, this
research supports mostly the findings of previous studies conducted in Turkey and
abroad. There are some differences of this study when compared to previous studies.
Generally, the previous studies investigated only the effects of conceptual approach
or only the effects of reading strategies of the KWL or SQ3R separately on students’
achievement and attitudes, and the results were expressed with verbally rather than
statistically. In this study the CA means Conceptual Physics which is defined as the
study of the concepts of physics qualitatively by emphasizing on mental imagery and
studying physics by relating the concepts to the things, events that are familiar in the
everyday environment. In addition, The KWL and SQ3R are two popular reading
strategies. They enforce students to read the text strategically and effectively. In the
literature, the researcher came across with the some modifications of the KWL and
134
SQ3R such as the KWWL, KWLA, SQ4R and SQRC. But, there was no study which
integrates the KWL and SQ3R into a new strategy and investigates the effect of it on
students’ achievement and attitudes towards physics in quantitatively. Furthermore,
we did not come across any study investigating the combined effects of the CA and
CRSS and their interactions on students’ achievement and attitudes towards physics.
In this study, we integrated the popular two reading strategies of the KWL
and SQ3R into a new and powerful reading study strategy, which we call it as the
CRSS.
When histograms with normal curves related to the PSTACH for the CA with
the CRSS group, in Figure 4.1, are investigated, it can be easily seen that, some
students gained more physics achievement from the product of the CA and CRSS.
The histogram for the first group is right skeweed; most of the students have higher
scores than the mean of post-achievement scores. Unfortunately, the histograms for
the group instructed by the CA without the CRSS and the group instructed by the TI
with the CRSS, the percentage of the students below the average mean is almost
equal to that of above the mean. Descriptively, the average achievement means also
increased for the students instructed by the CA without the CRSS and those
instructed by the TI with the CRSS, but they are low compared to those of instructed
by the CA with the CRSS.
One of the aims of this study is to remedy the students’ misconceptions in
optics. The PACT consists of misconception questions also. The results of the
descriptive statistics also denotes that the CA with CRSS is effective method for
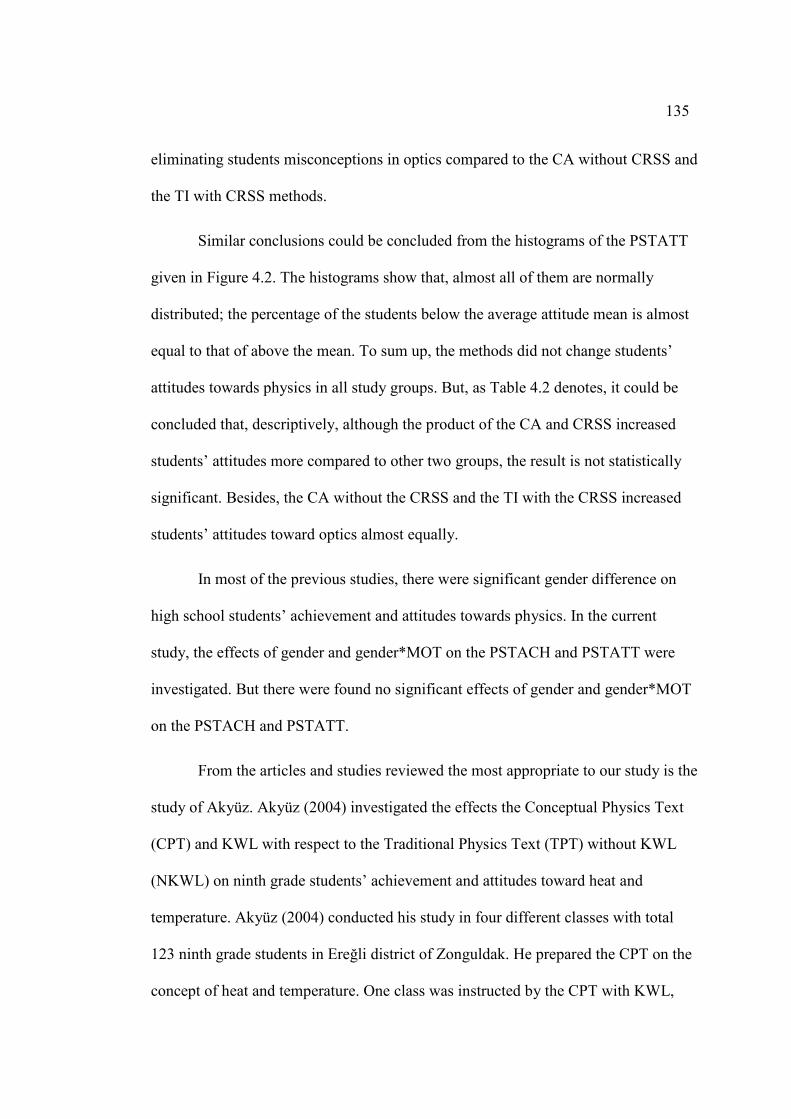
135
eliminating students misconceptions in optics compared to the CA without CRSS and
the TI with CRSS methods.
Similar conclusions could be concluded from the histograms of the PSTATT
given in Figure 4.2. The histograms show that, almost all of them are normally
distributed; the percentage of the students below the average attitude mean is almost
equal to that of above the mean. To sum up, the methods did not change students’
attitudes towards physics in all study groups. But, as Table 4.2 denotes, it could be
concluded that, descriptively, although the product of the CA and CRSS increased
students’ attitudes more compared to other two groups, the result is not statistically
significant. Besides, the CA without the CRSS and the TI with the CRSS increased
students’ attitudes toward optics almost equally.
In most of the previous studies, there were significant gender difference on
high school students’ achievement and attitudes towards physics. In the current
study, the effects of gender and gender*MOT on the PSTACH and PSTATT were
investigated. But there were found no significant effects of gender and gender*MOT
on the PSTACH and PSTATT.
From the articles and studies reviewed the most appropriate to our study is the
study of Akyüz. Akyüz (2004) investigated the effects the Conceptual Physics Text
(CPT) and KWL with respect to the Traditional Physics Text (TPT) without KWL
(NKWL) on ninth grade students’ achievement and attitudes toward heat and
temperature. Akyüz (2004) conducted his study in four different classes with total
123 ninth grade students in Ereğli district of Zonguldak. He prepared the CPT on the
concept of heat and temperature. One class was instructed by the CPT with KWL,
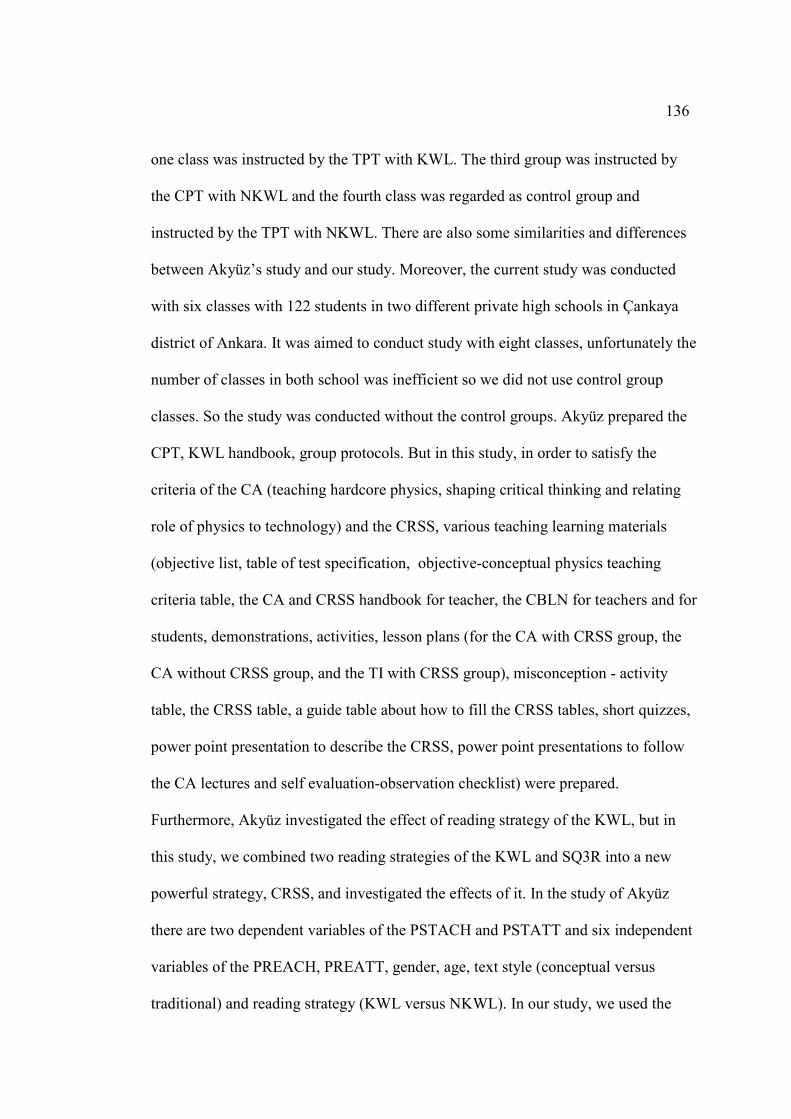
136
one class was instructed by the TPT with KWL. The third group was instructed by
the CPT with NKWL and the fourth class was regarded as control group and
instructed by the TPT with NKWL. There are also some similarities and differences
between Akyüz’s study and our study. Moreover, the current study was conducted
with six classes with 122 students in two different private high schools in Çankaya
district of Ankara. It was aimed to conduct study with eight classes, unfortunately the
number of classes in both school was inefficient so we did not use control group
classes. So the study was conducted without the control groups. Akyüz prepared the
CPT, KWL handbook, group protocols. But in this study, in order to satisfy the
criteria of the CA (teaching hardcore physics, shaping critical thinking and relating
role of physics to technology) and the CRSS, various teaching learning materials
(objective list, table of test specification, objective-conceptual physics teaching
criteria table, the CA and CRSS handbook for teacher, the CBLN for teachers and for
students, demonstrations, activities, lesson plans (for the CA with CRSS group, the
CA without CRSS group, and the TI with CRSS group), misconception - activity
table, the CRSS table, a guide table about how to fill the CRSS tables, short quizzes,
power point presentation to describe the CRSS, power point presentations to follow
the CA lectures and self evaluation-observation checklist) were prepared.
Furthermore, Akyüz investigated the effect of reading strategy of the KWL, but in
this study, we combined two reading strategies of the KWL and SQ3R into a new
powerful strategy, CRSS, and investigated the effects of it. In the study of Akyüz
there are two dependent variables of the PSTACH and PSTATT and six independent
variables of the PREACH, PREATT, gender, age, text style (conceptual versus
traditional) and reading strategy (KWL versus NKWL). In our study, we used the
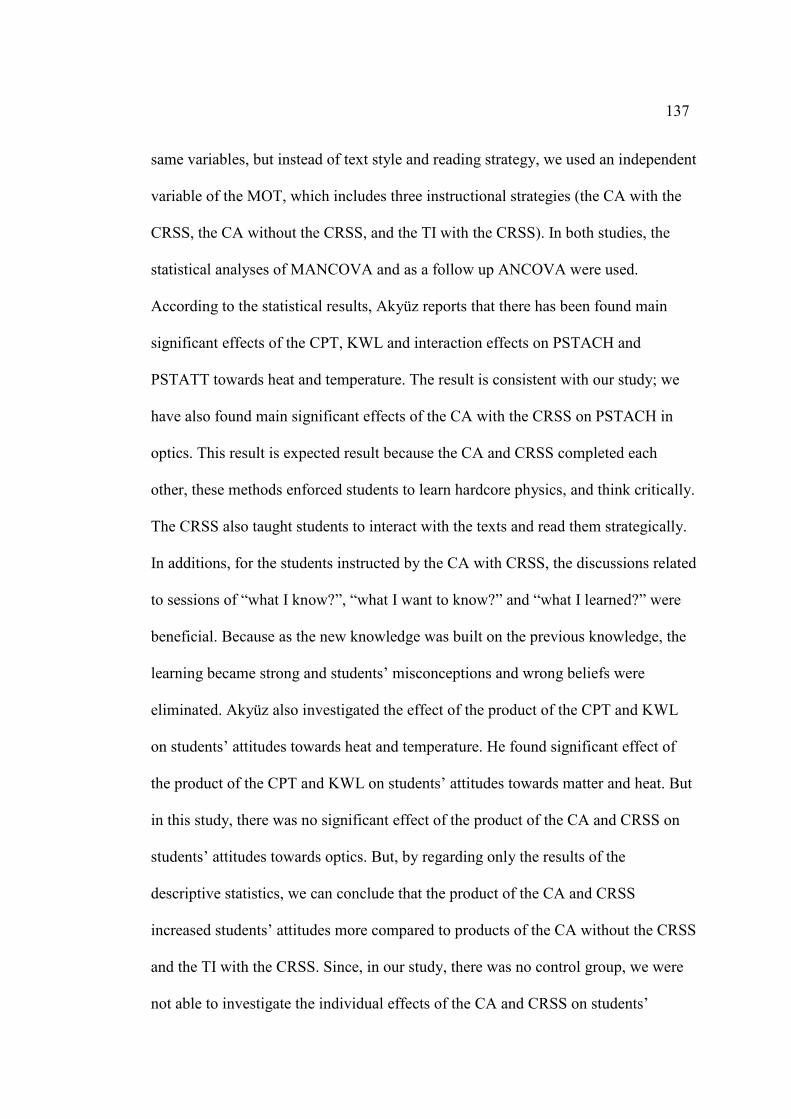
137
same variables, but instead of text style and reading strategy, we used an independent
variable of the MOT, which includes three instructional strategies (the CA with the
CRSS, the CA without the CRSS, and the TI with the CRSS). In both studies, the
statistical analyses of MANCOVA and as a follow up ANCOVA were used.
According to the statistical results, Akyüz reports that there has been found main
significant effects of the CPT, KWL and interaction effects on PSTACH and
PSTATT towards heat and temperature. The result is consistent with our study; we
have also found main significant effects of the CA with the CRSS on PSTACH in
optics. This result is expected result because the CA and CRSS completed each
other, these methods enforced students to learn hardcore physics, and think critically.
The CRSS also taught students to interact with the texts and read them strategically.
In additions, for the students instructed by the CA with CRSS, the discussions related
to sessions of “what I know?”, “what I want to know?” and “what I learned?” were
beneficial. Because as the new knowledge was built on the previous knowledge, the
learning became strong and students’ misconceptions and wrong beliefs were
eliminated. Akyüz also investigated the effect of the product of the CPT and KWL
on students’ attitudes towards heat and temperature. He found significant effect of
the product of the CPT and KWL on students’ attitudes towards matter and heat. But
in this study, there was no significant effect of the product of the CA and CRSS on
students’ attitudes towards optics. But, by regarding only the results of the
descriptive statistics, we can conclude that the product of the CA and CRSS
increased students’ attitudes more compared to products of the CA without the CRSS
and the TI with the CRSS. Since, in our study, there was no control group, we were
not able to investigate the individual effects of the CA and CRSS on students’
138
attitudes towards optic. From these we can conclude that only the CA and only CRSS
are not effective as the product of the CA and the CRSS.
The insignificant result in attitude may be due to some reasons; first of all,
most of the students initially had negative attitudes towards optics. Before the study
began, researcher talked to some of the students in the study groups. They stated that
they have studied the optics in primary school and restudied it while preparing to
“Orta Öğretim Kurumları” exam. They generally complained that the optics is more
abstract, and although they studied very much, again they did not understand
concept. So, they didn’t like the subject. Even the successful students presented the
same attitudes. Initially, most of them started the study with fear.
The second reason could be related with the CRSS leg of the study. The
CRSS loaded some responsibilities to the students; as explained before, students
must read the text strategically and fill the CRSS tables at home before the beginning
of each new section. Since students are not used to do this kind of responsibility, it
was boring for most of them. As Ogle (1986) warns, at the beginning of the study,
students were unwillingness to read the text, fill the tables and reluctant to discuss
their initial knowledge in classroom environment. Sometimes, some of them did not
bring the CRSS tables. At these situations, teacher enforced them to complete their
responsibilities; the teacher followed these students and collected tables from them as
soon as possible. According to the researcher, the discussions and quizzes made also
students feel pressure on them and enforce them to complete their responsibilities
relevant to the aim of the study. This may also have affected students’ attitudes
toward optic in negatively.
139
The third reason may be related with the duration of the study. The study
continued for two months; this time duration may not be enough to change students’
attitude in a positive manner. Since they come across as a first time with this kind of
method, it might be difficult for them to adapt in and feel positive attitudes.
In the literature, as stated previously, most of the studies reported,
investigated only the effect of conceptual approach or only the effects of the KWL or
SQ3R separately. When we investigated these studies almost similar finding were
found. Taşlıdere (2002) investigated the effects of conceptual approach on ninth
grade students’ achievement and attitudes toward optics. It was the first study that
investigated the effects of conceptual approach on students’ achievement and
attitudes quantitatively in Turkey. He conducted the study with 73 students in a
private college in Ankara. There were two dependent variables of the PSTACH and
PSTATT and eight independent variables; students’ age, the PREACH, PREATT,
PPCG, PCGPA, Gender, Teacher and the MOT (Conceptual Teaching and
Conventional Lecturing). The independent variables of the PPCG, PCGPA,
PREACH, PREATT and teacher were determined as covariates for the inferential
analyses. In our study, the dependent and independent variables are almost same. The
independent variables of age, the PREACH, PREATT, PPCG and the MISPRE were
found as covariates for inferential analyses. In the study of Taşlıdere there were two
experiment groups and two control groups. The study was conducted for three
weeks. Various teaching learning materials (objective list, table of specification,
objective-conceptual physics teaching criteria table, lesson plan (for teacher and for
student), acetates, demonstrations, experiments and methodology) were prepared.
The results of the MANCOVA showed that conceptual approach increased students’
140
physics achievement significantly compared to traditional method. The students’
achievement tests were scored out of 25. Furthermore, the mean of the achievement
scores of experimental group students increased from 9.45 to 14.84 by an amount of
5.39. But, the mean of the achievement scores for the control group students
increased by only 1.15 points from 10.07 to 11.22.
Madsen and Lanier (1992) investigated the effect of conceptually oriented
instruction on students’ competencies. They used two groups of students in their
study. As a measuring tool, a computational test was used. It was applied two times
as the pre and the post-tests to both groups. One of the group students practiced a
computational procedure without emphasis on the mathematical concepts. The
second group of students learned the mathematical concepts underlying the
procedures and spent little if any, time on practicing computational procedures. The
findings of the computational test showed that in one conceptually oriented class the
average-grade level equivalence for computational competence was increased from a
6.5 grade level at the start of the school year to a 9.1 grade level at the end of the
year. On the other hand, computationally oriented class had an average level of 7.1 at
the start of the school year and at the end of the school year the grade-level
equivalence was 7.5. In our study, the average mean of the students instructed by the
CA without the CRSS increased from 17.94 to 24.55 by an amount of 6.61. In line
with the results of the study of Madsen and Lanier, in our study, the CA without the
CRSS increased students’ average achievement means; so the results are almost
consistent.
141
Suchner (1998) indicates that students’ level of interest affects science
achievement. The results of the studies of Akyüz (2004) and Taşlıdere (2002)
supported the study of Suchner; they have found significant correlation between
students’ pre-attitude scores and post-achievement scores. On the other hand,
Chamber and Andre (1997) report that the level of interest and prior-experience did
not correlate significantly with post-test scores. Different from Chamber and Andre,
in our study, like Akyüz, Taşlıdere and Suchner, we found significant correlation
between students pre-attitude scores and post-achievement scores.
Wang and Andre (1991) report that effectiveness of conceptual change text
varied with gender. On the other hand, Akyüz (2004), Chambers and Andre (1997)
report insignificant interaction between effectiveness of conceptual change text and
gender. Taşlıdere (2002) did not find also any significant interaction between
Conceptual Approach and gender. Both males and females benefited from
Conceptual Approach equally. In the current study, we did not find any significant
effect of gender*MOT interaction on the PSTACH and PSTATT. It means that, the
effectiveness of MOT did not change with gender.
In our study, effect size was preset to 0.15 in a medium level. The statistical
result of the SPSS calculated it as 0.226 for the PSTACH and 0.052 for the PSTATT.
The value for the PSTACH is larger than the large effect size. We can conclude that
the study has also practical significance for the students’ physics achievement.
142
5.2 Internal and External Validities of the Study
Possible threats to the internal and external validities of this study and their
control were discussed in this section
5.2.1 Internal validity of the Study
There are various possible threads that most of the studies suffer. The internal
validity of the study refers to the degree to which extraneous variables may influence
the results of research. The subject characteristics, Hawthorne effect,
instrumentation, location, testing, mortality, were some of the possible threats to the
internal validity of the study. In general, missing data analysis, standardizing
conditions and the procedures, the MANCOVA model, two month treatment period,
and the research design of the study were used as a measure to control these threats.
In this study, not the individual but the groups were randomly assigned to
study groups (the CA with CRSS group, the CA without CRSS group, and TI with
CRSS group). Therefore the individuals included in each group may have different
characteristics. Hence, many subject characteristics (the PPCG, PCGPA, age,
PREACH and PREATT) might affect the PSTACH and PSTATT. They were
regarded as potential extraneous variables of the study. As shown in Table 4.5, most
of the variables were included in the covariate set to statistically match subjects on
these factors. Although accepting these variables as covariates decreases the power
of study, we behaved radically and performed the statistical analyses. And also, other
factors were assumed to be effective on internal validity such as students’ cognitive
development and mathematical skills. The mathematical background and previous
science studies were assumed to be equal for all students.
143
A Hawthorne effect and data collector characteristics should not be threat for
the study. The teachers were aware of this point and experienced in this field. They
tried to standardize procedure under which the data were collected. Exposing to pre-
test might affect students’ performance on the lessons and post-test. However, it is
assumed that pre-test would affect to all groups equally. Beside this, the study was
conducted for two months. All situations for all groups were tried to be made similar.
Post-tests were tried to be administered to all groups approximately at the same time
in order to alleviate location threat. One class hour were given for the PACT and 10
minutes for the PATS. Unintentionally or unexpectedly no event happened during
the testing, hence there was no history threat.
Implementation was not a problem. Because, to satisfy consistency between
teacher and treatment fidelity, various teaching learning materials were prepared and
teachers were treated about the treatments and their applications. Periodically,
teachers and the researcher had meetings and made plans. And also, at the end of
each week they evaluated the study, whether they could apply the methods or not?
were there any unplanned or undesired situation. In general, the methods were
applied in relevant to theory.
Mortality is the most important threat to internal validity to control. To
eliminate it, missing data analysis was conducted as mentioned in previous chapter.
Some students did not complete the pre-achievement test questions. They were
determined and their total scores were regarded as missing. The variables that have
missing subjects were analyzed for significance using SPSS. According to the result
of the analysis, there has been found significant difference between the mean scores
of post-achievement tests of students having missing data and those of having no
144
missing data, respectively. So, the missing values in variables were replaced with the
series mean of the entire subject and the assigned Dummy coded missing data
variable (MISPRE) was taken into all analysis with the independent variable of pre-
achievement test.
It was also aimed to eliminate the ethical problems in the study. The term
ethics refers to the question of right and wrong. All of the students were protected
from physical and psychological harm. They were assured that any data collected
from about them would be held in confidence. The results of the tests applied to them
would not be used for the term grading.
Finally, confidentially was not a problem for this study since names of the
students or the schools were not used anywhere. Their names were just taken for the
sake of statistical analysis.
5.2.2 External Validity of the Study
Subjects of the study were not randomly selected from the accessible
population. They were the students of two different private high schools whose
teaching languages are English in science lessons. There are sixteen private high
schools in Çankaya districts of Ankara, but only three of them teach the science
lessons in English. Sample of the study consists of 124 individuals which constitute
approximately 54.62 % of the population. The results of the study could be
generalized to the private high schools whose teaching languages are English in
science lessons in Çankaya districts of Ankara.
Treatments and all testing procedure took place in ordinary classrooms. Since
the studies were conducted in private high schools, their physical conditions are
145
similar to each other. The results of the observation – self evaluation check lists also
denoted that the physical conditions of the classes and schools are equal. There were
possibly no remarkable differences among environmental conditions. Hence, all
issues related to ecological validity were adequately controlled by the settings used
in this study.
The results of this study could be generalized to the private high schools
whose teaching languages are English in physics lessons and having the same
physical properties in Çankaya districts of Ankara.
5.3 Conclusions
As previously stated before, the target population of the study consists of all
ninth grade private high school students whose teaching language are English in
physics lessons in Çankaya districts of Ankara. There are sixteen private high
schools in this region; one of them use France, twelve use Turkish, and left three
schools use English as teaching language in physics lessons. The study was
conducted with two private high schools in Çankaya. The schools were selected by
convenience sampling. The accessible population is all ninth grade private high
school students from these two private high schools in Çankaya. There are
approximately 227 ninth grade students in the region. The study sample chosen from
the accessible population is a sample of convenience. Fraenkel and Wallen (2003)
report that ideal representative sample should be 10% of the population. The study
sample consists of 124 students which constitutes approximately 54.62 % of the
population. So the results of this study could be generalized to similar private high
146
schools whose teaching languages are English in physics lessons in Çankaya districts
of Ankara. Here are the conclusions;
1. The MOT affected students’ achievement in optics significantly. Moreover,
the CA with CRSS was an effective means of increasing students’ physics
achievement in optics. Students, instructed by the CA with the CRSS, gained
more physics achievement than that of students instructed by the CA without
the CRSS and by the TI with the CRSS.
2. The effects of the CA without CRSS and that of the TI with CRSS on
PSTACH are almost same. The students in these two groups gained almost
the same average physics achievement means.
3. The MOT did not affect students’ attitudes towards physics significantly. But,
descriptively, the CA with the CRSS increased students’ average mean of
attitude scores more compared to other two instructional strategies of the CA
without CRSS and the TI with CRSS.
4. The effects of the CA without the CRSS and that of the the TI with the CRSS
on PSTATT are almost equal; the students in these two groups gained almost
the same average means from the PREATT to the PSTATT. But these
changes in average means of attitude scores are not statistically significant.
5. The gender and gender*MOT did not affect students’ physics achievement
and attitudes towards physics significantly.
6. The CA requires three main objectives. These are teaching hardcore physics,
shaping critical thinking and relating role of physics to technology. For the
attainment of these objectives some methods are effective. For instance,
while teaching hardcore physics; conceptual analogies, demonstrations,
147
drawings, student oriented experiments, discussions, games, exemplifications
from daily life and their applications, power point presentations, animations
and home projects were effective. Similarly, stressing on the meaning of
terms and using formulas as guides rather than equations for solving
problems were effective for improvements of students’ critical thinking. In
addition to these, relating role of physics to technology was effective for
increasing students’ interest towards physics.
7. The CRSS is the integration of reading strategies of the KWL and SQ3R. The
KWL and SQ3R complete each other as a powerful reading study strategy.
8. The CRSS enforces students to read and study the texts systematically and
effectively. It seems to increase the students’ achievement in physics.
9. When the CA is supported by the CRSS, their combined effect significantly
increased students’ achievements in physics.
5.4 Implications
According to the findings of this study and previous studies conducted in
Turkey and abroad on the same topic, following suggestions are offered.
The Ministry of National Education;
1. Should consider that the first physics course in high schools should be
conceptual physics. It should teach hardcore physics, enforce students to
critical thinking and establish relationship between physics and technology.
So as Hewitt (1998, p.XVI) physics course should be educational main
stream for all science and non-science students.
148
2. Should regard also that the students should be informed about the reading
study strategies of the KWL or SQ3R or other modifications while they are in
primary schools. These techniques should be placed into the primary school
curriculum as a topic to be taught. It would be beneficial for all students if
they can learn these reading techniques and apply them during their readings.
Otherwise, it should be too late to teach these techniques when they are at
high schools. By doing so, we could obtain effective readers.
The Physics Teacher;
1. Should be aware of the conceptual physics. They should first teach the
hardcore physics by using daily life examples, experiments, demonstrations,
animations, games and drawings. After the concepts were taught then
mathematical nature of physics should be introduced; formulas should be
used as meaningful equations to enforce students’ critical thinking. The
students should learn the relationships of concepts rather than memorizing
and computing the unknown in the formula. As a third requirement, teacher
should establish the relationship between physics and technology; students
should understand that physics is important discipline for the technological
improvement.
2. Should be aware of the reading strategies of the KWL, SQ3R and their
extended versions. They should use these techniques in classroom
environment and enforce their students to use in their homes also.
149
Authors of the Textbooks;
1. Should give more importance to conceptual approach and special reading
study techniques. The books should be enriched with also conceptual and
daily life examples besides computational examples. While writing their
books, one of the aims of author should be to extract students’ initial
knowledge and connect them to the new learning.
The Faculties of Education;
1. Should be sensitive while preparing their prospective teachers. These
candidates should be equipped with conceptual approach and special reading
study techniques. For these, some elective courses should be inserted into the
curriculum.
5.5 Recommendations for Further Research
This study has suggested a variety of useful topics for further studies. These
are briefly as follows:
1. This study was conducted with two private high schools students in Çankaya,
districts of Ankara. Future study could examine the effect of the CA, the
CRSS and their interactions on students’ physics achievement and attitudes
toward physics in public high schools.
2. Future study could examine the effects of the CA, CRSS and their
interactions on students’ physics achievement and attitudes toward physics
for a term period. By doing so, the students can get used to the methods,
becomes more successful and impart positive attitudes towards physics.
150
3. In this study, both reading strategies the KWL and SQ3R are integrated into a
new CRSS. According to the educational needs, or different content areas
new modifications of reading study techniques could be improved and their
effects on students’ achievement and attitudes toward physics should be
investigated.
4. Studies are needed to improve the CA and CRSS in optics or in other
concepts of physics. It should be improved and used for in any other branches
of science (mathematics, chemistry and biology).
5. Future research could perform a replication of this study using different
physics topics.
151
REFERENCES
Akyüz, V. (2004). The effects of textbook style and reading strategy on students’
achievement and attitudes towards heat and temperature. Unpublished Master
Thesis, Middle East Technical University, Ankara, Turkey.
Bendall, S., Goldberg, F., & Galili, I. (1993). Prospective Elemantary Teachers’
Prior Knowledge obout Light. Jornal of Research in Science Teaching, 30 (9),
1169 – 1187.
Bilgiç, M. (1985). The effectiveness of inquiry oriented laboratory on students’
understanding of the nature of scientific knowledge at university level.
Unpublished Master Thesis, Middle East Technical University, Ankara,
Turkey.
Bonwell, C., & Eison, J. (1991). Active learning: creating excitement in the
classroom. Retrieved April 10, 2005, from
http://www.ed.gov/databases/ERIC_Digests/ed340272.html.
Booth, G., McDuell, B., Sears, J. (1999). World of Science 2. Gecko Ltd, Bicester.
Brouwer, W. (1984). Problem-posing physics: A conceptual approach. American
Association of Physics Teachers, 52(7), 602-607.
Bryan, J. (1998). Teaching reading; K-W-W-L: Questioning the known. The Reading
Teacher, 51(7), 618-620.
Bueche, F.J., & Jerde, D. A. (1995). Principles of physics,(6th ed.). New York:
McGraw-Hill, Inc.
152
Call, P. E. (1991). SQ3E + What I Know Sheet = one strong strategy. Journal of
Reading, 35(1), 50-52.
Cantrelll. J.(1997). K-W-L learning journals: A way to encourage reflection. Journal
of Adolescent & Adult Literacy, 40, 392,
Carr, E., & Ogle, D. (1987). KWL Plus: A strategy for comprehension and
summarization. Journal of Reading, 30, 626-631.
Chambers, S. K., & Andre. T. (1996). Gender, prior knowledge, interest, and
experience in electricity and conceptual change text manipulations in learning
about direct current. Journal of Research in Science Teaching, 34(2), 107-123.
Cohen, C. C., Lin, S. H., & Lin, M. L. (2002). Developing a Two-Tier Diagnostic
Instrument to Asses High School Students’ Understanding – The formation of
Images by a Plane Mirror. Proc. Natl. Sci. Counc. ROC(D), 12 (3), 106 - 121
Cohen. J. & Cohen. P.(1983). Applied multiple regression / correlation analysis to
the analysis of behavioural Science. New Jersey: Lawrence Erlbaum
Associates.
Durkin, D. (1984). Is there a match between what elementary teachers do and what
basal reader manuals recommend? The Reading Teacher, 37, 734-744.
Feher, E. & Rice, K. (1988). Shadows and Anti-Images: Children’s Conceptions of
Light and Vision. 2. Science Education, 72 (5), 637-649.
Feldt, R. C., & Moore, R. E. (1999). Learning how to read emprical research articles:
An application of a modified version of SQ3R. Reading Improvement, 36(3),
102-108.
153
Fetherstonhaugh, T., Treagust, F. D. (1992). Students’ Understanding of Light and
Its Properties: Teaching to Engender Conceptual Change. Science Education,
Vol. 76, pp. 653-672.
Fraenkel, J. R., & Wallen, N. E. (2003). How to design and evaluate research in
education,(6th ed.). New York: McGraw-Hill, Inc.
Fritz, M. (2002). Using a reading strategy to foster active learning in content area
courses. Journal of College Reading and Learning, 32(2), 189-194.
Giesen, C. (1983). Optics Raybox Experiments, (1st ed.). Ley bold – Heraeus, 0,3-9-
83, Fed. Rep. of Germany.
George, D. & Mallery, P. (2003).SPSS for Windows Step by Ste,.(4th ed.). Pearson
Education, Inc.
Goldberg, F., & McDermott, L. C. (1986). Student difficulties in understanding
image formation by a plane mirror. The Physics Teacher, 24, 472 – 480.
Hair, J. F., Anderson, R. E., Tatham, R. L. & Black, W. C. (1998). Multivariate Data
Analysis. 5th Edition. Prentice Hall, New Jersey.
Hartlep, K. L., & Forsyth. G. A. (2000). The effect of self-reference on learning and
retention. teaching of psychology, 27(4), 269-271.
Headley, K. N., & Dunston, P. J. (2000). Teachers’ choices books and
comprehension strategies as transaction tools. The Reading Teacher, 54(3),
260-268.
Hewitt, P.G. (1972). Conceptual physics turning non-science students on to their
everyday environments. The Physics Teacher, 522-524.
154
Hewitt, P.G. (1983). Millikan Lecture 1982: The missing essential- a conceptual
understanding of physics. American Association of Physics Teachers, 51(4),
305-311.
Hewitt, P.G. (1990). Conceptually speaking. The Science Teacher, 55-57.
Hewitt, P.G. (1998). Conceptual physics, (8th ed.). One Jacob Way, Reading, MA
01867, USA: Addison Wesley Longman, Inc.
Huber, J. A. (2004). A Closer look at SQ3R. Reading Improvement, 41(2), 108-112.
Kutluay, Y. (2005). Diagnosis of Eleventh Grade Students’ Misconceptions About
Geometric Optics By a Three-Tier Test. Unpublished master thesis, Middle
East Technical University, Ankara, Turkey.
Langley, D., Ronen, M., & Eylon, B. (1997). Light Propogation and Visual Patterns:
Preinstruction Learners’ Conceptions. Journal of Research in Science
Teaching, 34 (4), 399 – 424.
Lord, C. G. (1980). Schemas and images as memory aids: Two modes of processing
social information. Journal of Personality and Social Psychology, 38, 257-269.
Madsen, A. L. & Lanier, P E. (1992). The effect of conceptually oriented instruction
on students’ computational competencies (Research Series No. 214) East
Lansing, MI: Michigan State University. ( ERIC Document Reproduction
Service No. ED 351194)
Marinak, B. A., Moore, J. C., Henk, W. A., Keepers, M. (1998). The pennsylvania
assesment system: Reading Instructional Handbook. Harrisburg: Pennsylvania
Department of Education.
Mandeville, T. F. (1994). K-W-L-A: Linking the affective and cognitive domains.
The Reading Teacher, 47(8), 679-680.
155
Ogle, D. M. (1986). K-W-L: A teaching model that develops active reading of
expository text. The Reading Teacher, 564-570
Paris, S. G. & Oka, E. R. (1989). Strategies for comprehending text and coping with
reading difficulties. Learning Disability Quarterly,12, 32-42.
Paulson, D. & Faust, J. (2000). Active learning. Retrieved April 10, 2005 from
http://www.calstatela.edu/centers/cetl/instspeak/scl/active_learning.
Ramadas, J., & Driver, R. (1989). Aspects of Secondary Students’ Ideas About Light.
Technical Report, University of Leeds.
Robert, L. (2002). Technology concepts, information: technical reading and writing.
Tech Directions, 62(2), 12-13.
Romig, J.L, & Allbee, I.E. (2000). Some guidelines for active learning in the college
classroom. Retrieved April 10, 2005 from
http://www.drake.edu/romig/activelng.
Sakta, C. G. (1999). SQRC: A strategy for guiding reading and higher level thinking.
Journal of Adolescent and Adult Literacy, 42(4), 265-269.
Sampson, M. B. (2002). Confirming K-W-L: considering the source. The Reading
Teacher, 55(6), 528-532.
Sippola, A. (1995). K-W-L-S. The Reading Teacher, 542-543.
Taşlıdere, E. (2002). The effect of conceptual approach on students’ achievement
and attitudes towards physics. Unpublished master thesis, Middle East
Technical University, Ankara, Turkey.
Vondracek, M. (1999). Teaching physics with math to weak math students. The
Physics Teacher, 37, 32-33.
156
Wang, T. & Andre, T. (1991). Conceptual change text versus traditional text and
application questions versus no questions in learning about electricity.
Contemporary Educational Psychology, 16, 103-116.
Yavuz, F. (2006).Investigating Students’ Motivational Traits in Science.
Unpublished master thesis, Middle East Technical University, Ankara, Turkey.
Yaz, M. A., Aksoy, S., Candan, H., Tekin, L., Özer, A., Kahraman, Z., Şahan, Y.,
Teymur, A., & Vardar, T. (1996). Physics 3. Sürat Basım – Yayın ve Dağıtım
Anonim Şirketi, Üsküdar, Đstanbul.
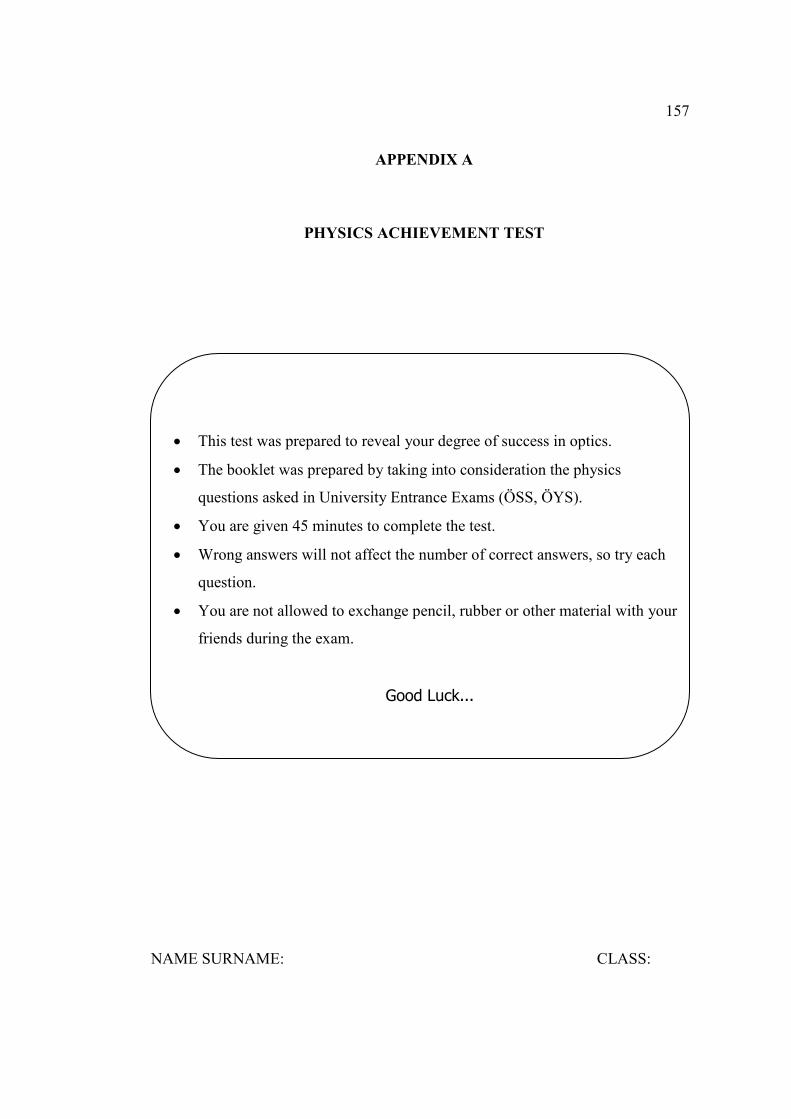
157
APPENDIX A
PHYSICS ACHIEVEMENT TEST
NAME SURNAME: CLASS:
• This test was prepared to reveal your degree of success in optics.
• The booklet was prepared by taking into consideration the physics
questions asked in University Entrance Exams (ÖSS, ÖYS).
• You are given 45 minutes to complete the test.
• Wrong answers will not affect the number of correct answers, so try each
question.
• You are not allowed to exchange pencil, rubber or other material with your
friends during the exam.
Good Luck...
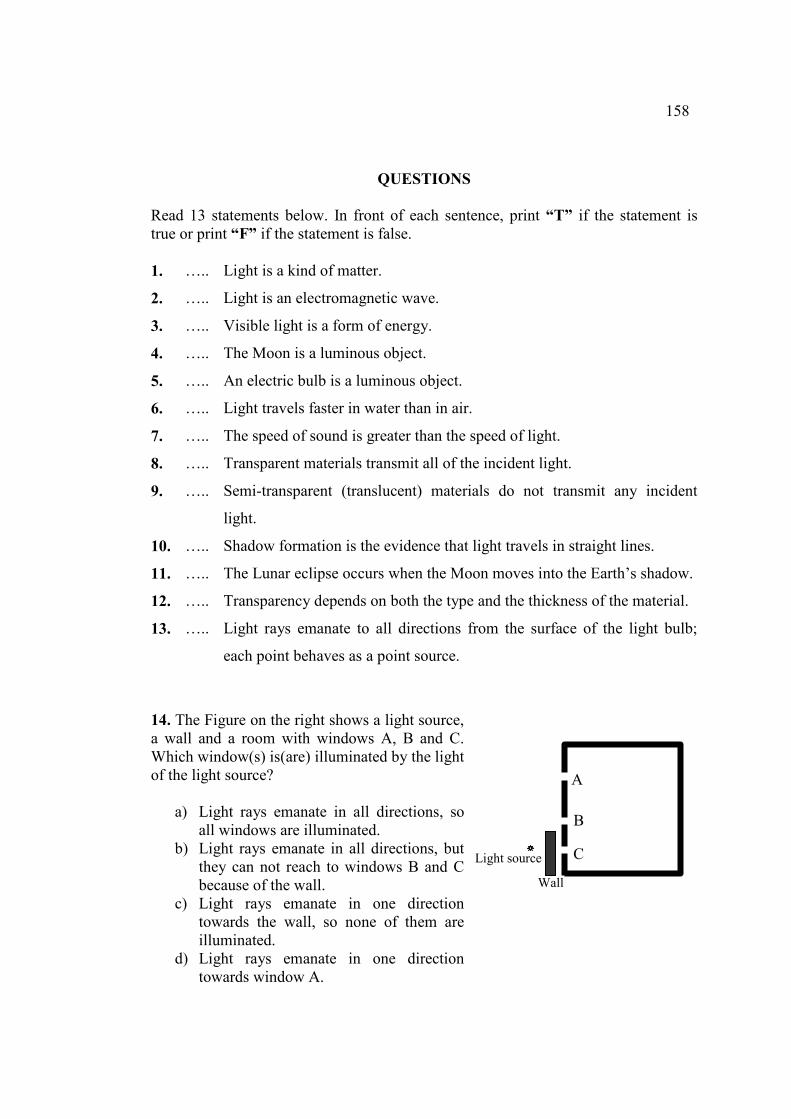
158
QUESTIONS
Read 13 statements below. In front of each sentence, print “T” if the statement is true or print “F” if the statement is false. 1. ….. Light is a kind of matter.
2. ….. Light is an electromagnetic wave.
3. ….. Visible light is a form of energy.
4. ….. The Moon is a luminous object.
5. ….. An electric bulb is a luminous object.
6. ….. Light travels faster in water than in air.
7. ….. The speed of sound is greater than the speed of light.
8. ….. Transparent materials transmit all of the incident light.
9. ….. Semi-transparent (translucent) materials do not transmit any incident
light.
10. ….. Shadow formation is the evidence that light travels in straight lines.
11. ….. The Lunar eclipse occurs when the Moon moves into the Earth’s shadow.
12. ….. Transparency depends on both the type and the thickness of the material.
13. ….. Light rays emanate to all directions from the surface of the light bulb;
each point behaves as a point source.
14. The Figure on the right shows a light source, a wall and a room with windows A, B and C. Which window(s) is(are) illuminated by the light of the light source?
a) Light rays emanate in all directions, so all windows are illuminated.
b) Light rays emanate in all directions, but they can not reach to windows B and C because of the wall.
c) Light rays emanate in one direction towards the wall, so none of them are illuminated.
d) Light rays emanate in one direction towards window A.
Light source C
B
A
Wall
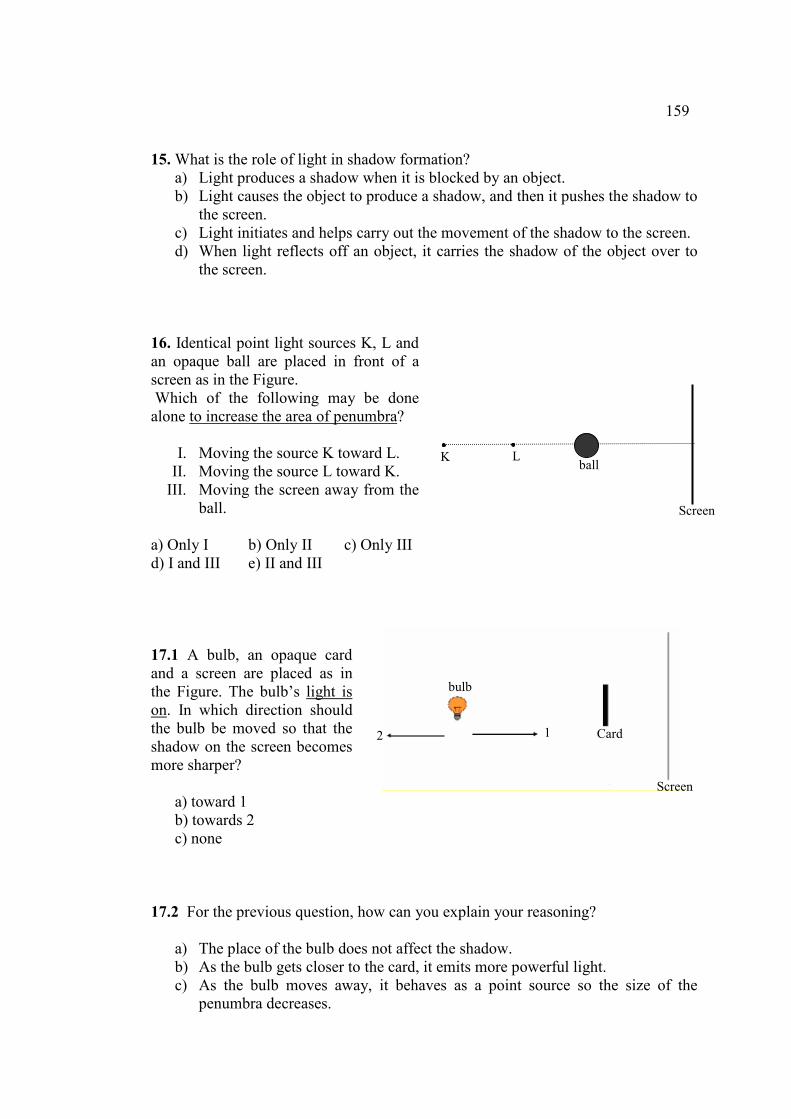
159
15. What is the role of light in shadow formation? a) Light produces a shadow when it is blocked by an object. b) Light causes the object to produce a shadow, and then it pushes the shadow to
the screen. c) Light initiates and helps carry out the movement of the shadow to the screen. d) When light reflects off an object, it carries the shadow of the object over to
the screen. 16. Identical point light sources K, L and an opaque ball are placed in front of a screen as in the Figure. Which of the following may be done alone to increase the area of penumbra?
I. Moving the source K toward L. II. Moving the source L toward K. III. Moving the screen away from the
ball. a) Only I b) Only II c) Only III d) I and III e) II and III
17.1 A bulb, an opaque card and a screen are placed as in the Figure. The bulb’s light is on. In which direction should the bulb be moved so that the shadow on the screen becomes more sharper? a) toward 1 b) towards 2 c) none
17.2 For the previous question, how can you explain your reasoning?
a) The place of the bulb does not affect the shadow. b) As the bulb gets closer to the card, it emits more powerful light. c) As the bulb moves away, it behaves as a point source so the size of the
penumbra decreases.
K L ball
Screen
1 2 Card
Screen
bulb
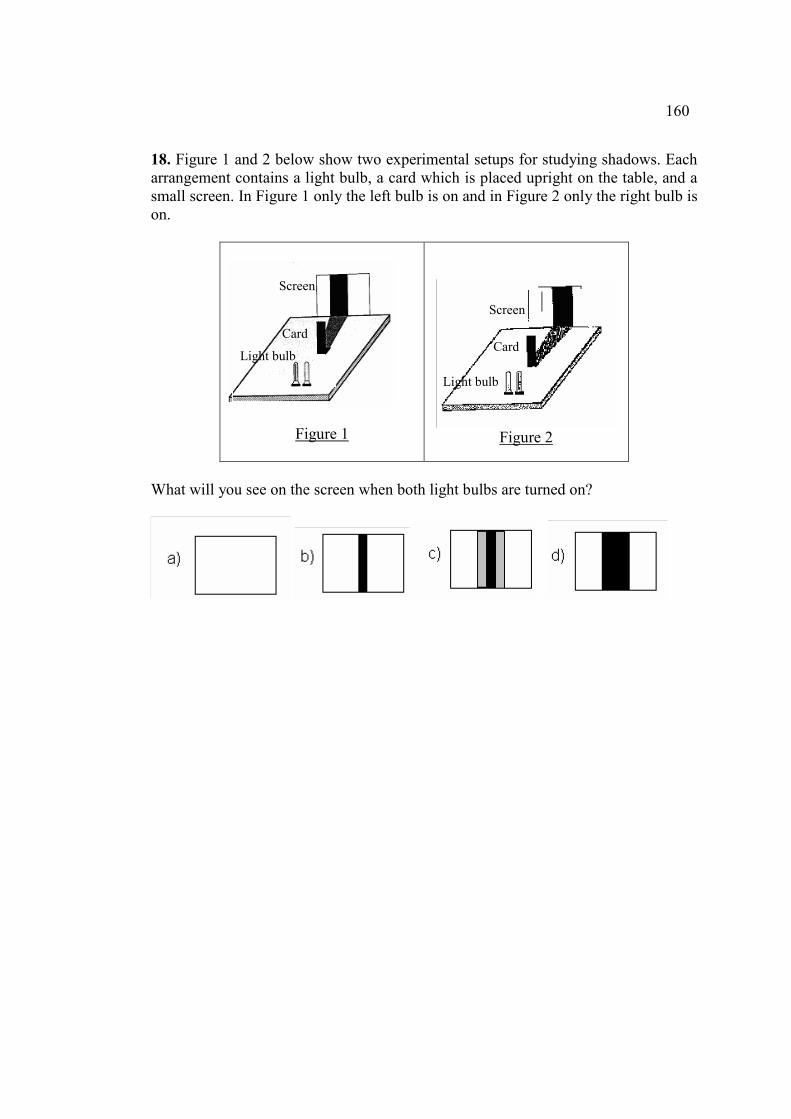
160
18. Figure 1 and 2 below show two experimental setups for studying shadows. Each arrangement contains a light bulb, a card which is placed upright on the table, and a small screen. In Figure 1 only the left bulb is on and in Figure 2 only the right bulb is on.
Figure 1
Figure 2
What will you see on the screen when both light bulbs are turned on?
Screen
Card
Light bulb
Screen
Card
Light bulb
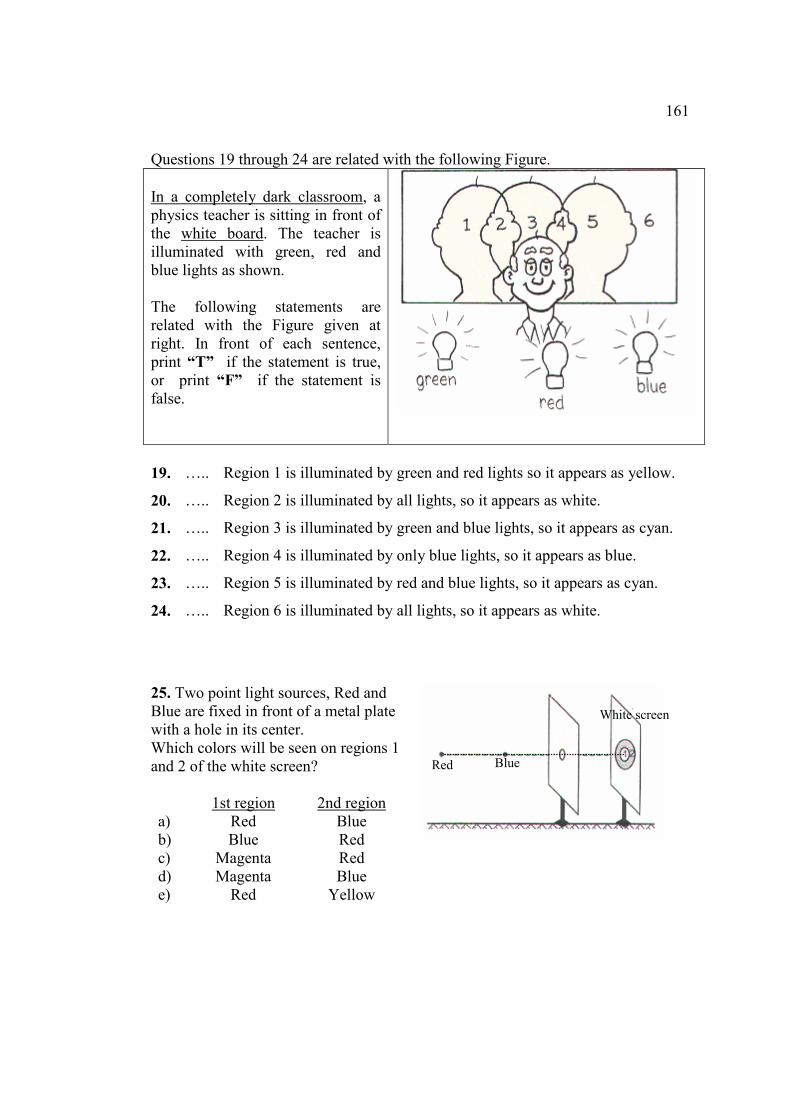
161
Questions 19 through 24 are related with the following Figure. In a completely dark classroom, a physics teacher is sitting in front of the white board. The teacher is illuminated with green, red and blue lights as shown. The following statements are related with the Figure given at right. In front of each sentence, print “T” if the statement is true, or print “F” if the statement is false.
19. ….. Region 1 is illuminated by green and red lights so it appears as yellow.
20. ….. Region 2 is illuminated by all lights, so it appears as white.
21. ….. Region 3 is illuminated by green and blue lights, so it appears as cyan.
22. ….. Region 4 is illuminated by only blue lights, so it appears as blue.
23. ….. Region 5 is illuminated by red and blue lights, so it appears as cyan.
24. ….. Region 6 is illuminated by all lights, so it appears as white.
25. Two point light sources, Red and Blue are fixed in front of a metal plate with a hole in its center. Which colors will be seen on regions 1 and 2 of the white screen? 1st region 2nd region a) Red Blue b) Blue Red c) Magenta Red d) Magenta Blue e) Red Yellow
Red Blue
White screen
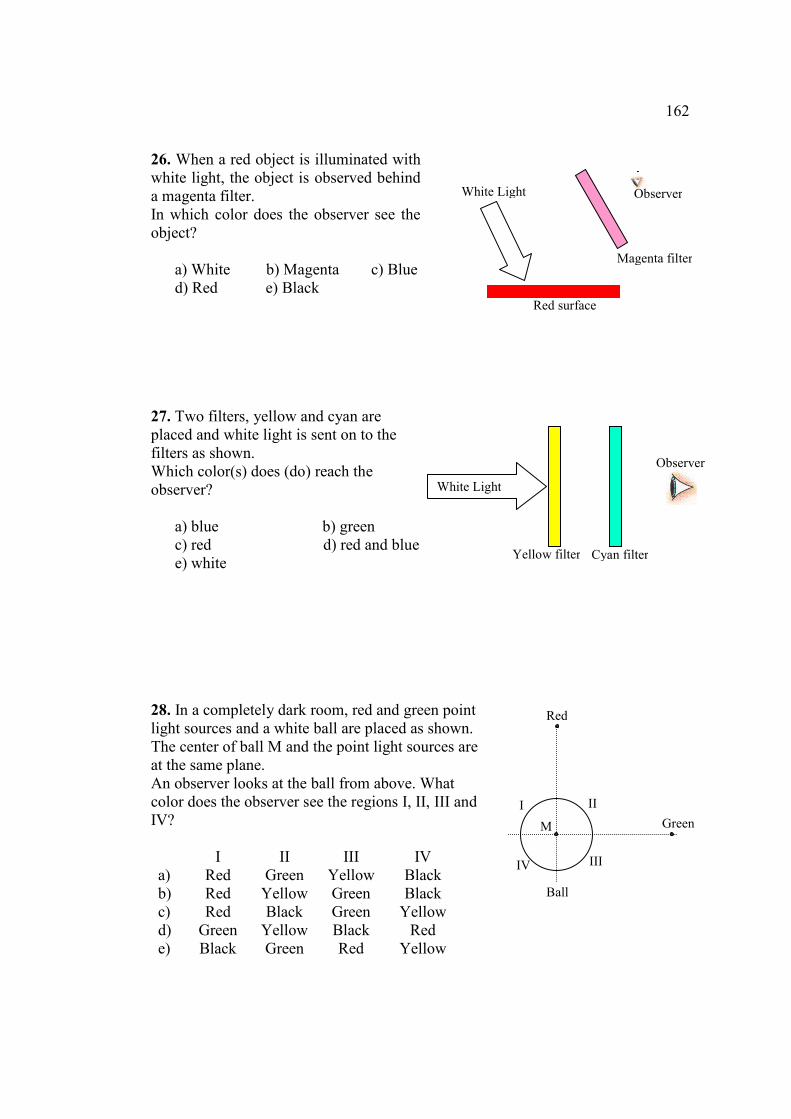
162
26. When a red object is illuminated with white light, the object is observed behind a magenta filter. In which color does the observer see the object? a) White b) Magenta c) Blue d) Red e) Black
27. Two filters, yellow and cyan are placed and white light is sent on to the filters as shown. Which color(s) does (do) reach the observer? a) blue b) green c) red d) red and blue e) white
28. In a completely dark room, red and green point light sources and a white ball are placed as shown. The center of ball M and the point light sources are at the same plane. An observer looks at the ball from above. What color does the observer see the regions I, II, III and IV? I II III IV a) Red Green Yellow Black b) Red Yellow Green Black c) Red Black Green Yellow d) Green Yellow Black Red e) Black Green Red Yellow
White Light
Yellow filter
Cyan filter
Observer
M
I II
III IV
Ball
Red
Green
White Light
Red surface
Observer
Magenta filter
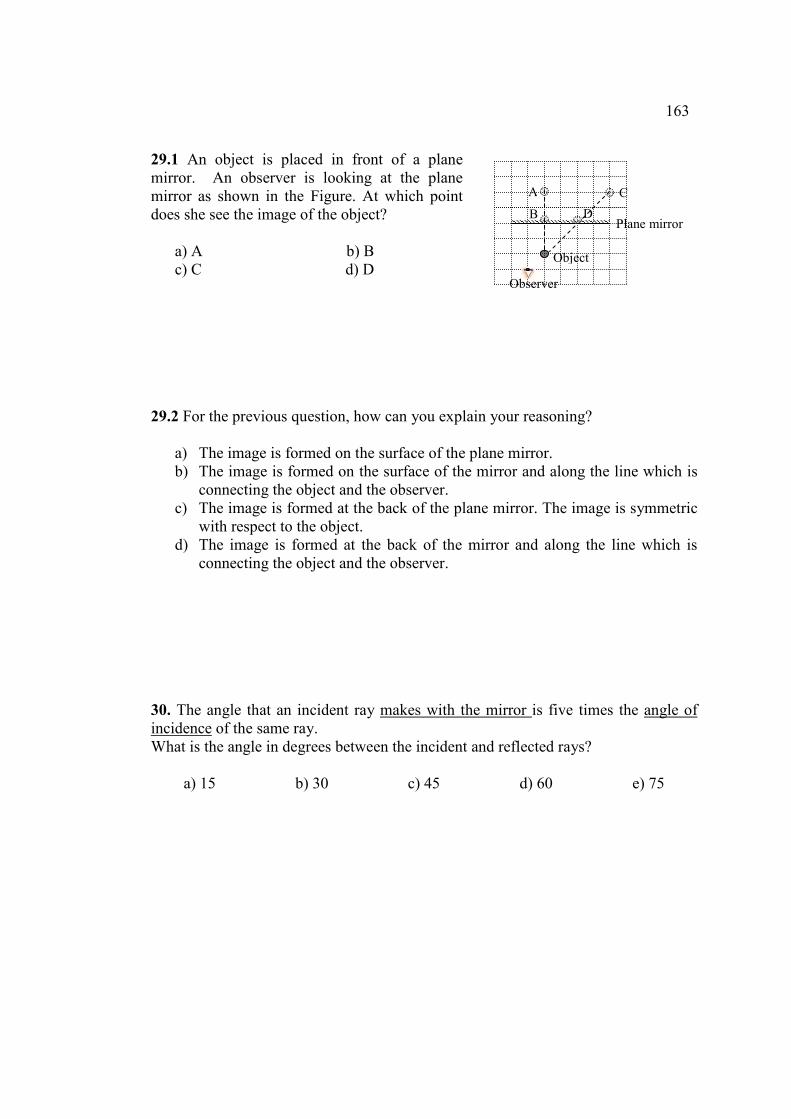
163
29.1 An object is placed in front of a plane mirror. An observer is looking at the plane mirror as shown in the Figure. At which point does she see the image of the object? a) A b) B c) C d) D
29.2 For the previous question, how can you explain your reasoning?
a) The image is formed on the surface of the plane mirror. b) The image is formed on the surface of the mirror and along the line which is
connecting the object and the observer. c) The image is formed at the back of the plane mirror. The image is symmetric
with respect to the object. d) The image is formed at the back of the mirror and along the line which is
connecting the object and the observer. 30. The angle that an incident ray makes with the mirror is five times the angle of incidence of the same ray. What is the angle in degrees between the incident and reflected rays?
a) 15 b) 30 c) 45 d) 60 e) 75
Plane mirror
Observer
B
C A
D
Object
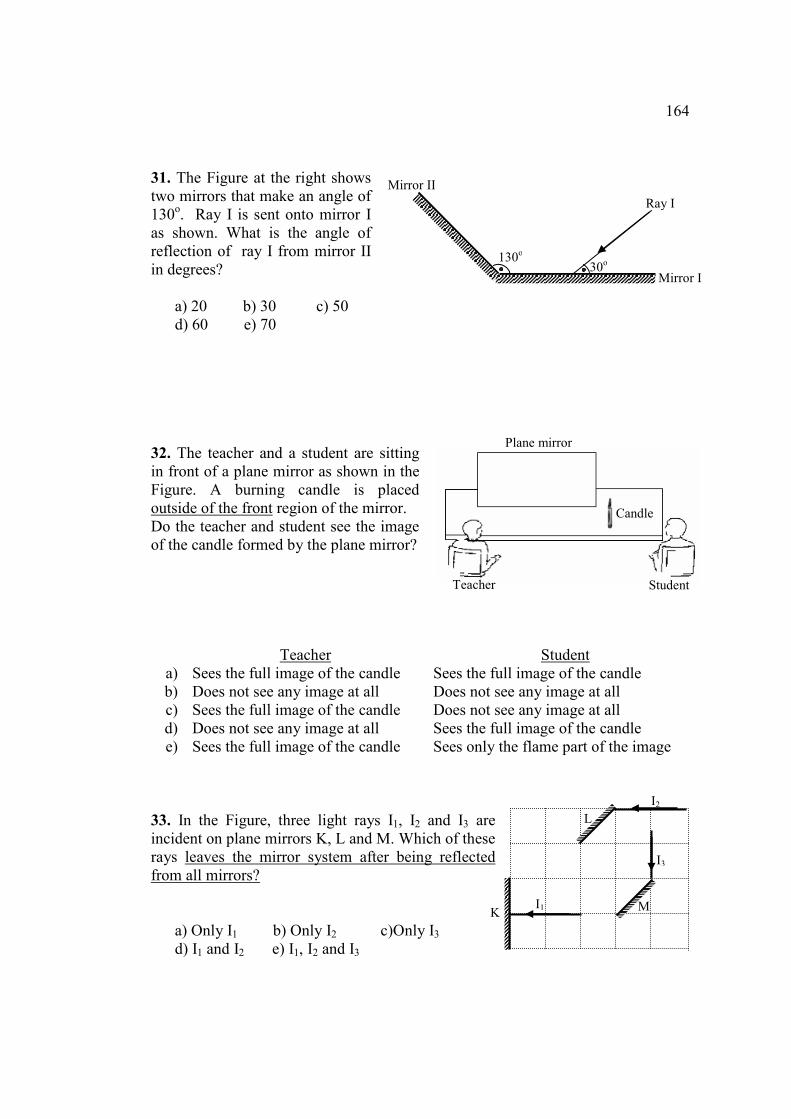
164
31. The Figure at the right shows two mirrors that make an angle of 130o. Ray I is sent onto mirror I as shown. What is the angle of reflection of ray I from mirror II in degrees? a) 20 b) 30 c) 50 d) 60 e) 70
32. The teacher and a student are sitting in front of a plane mirror as shown in the Figure. A burning candle is placed outside of the front region of the mirror. Do the teacher and student see the image of the candle formed by the plane mirror?
Teacher Student a) Sees the full image of the candle Sees the full image of the candle b) Does not see any image at all Does not see any image at all c) Sees the full image of the candle Does not see any image at all d) Does not see any image at all Sees the full image of the candle e) Sees the full image of the candle Sees only the flame part of the image
33. In the Figure, three light rays I1, I2 and I3 are incident on plane mirrors K, L and M. Which of these rays leaves the mirror system after being reflected from all mirrors?
a) Only I1 b) Only I2 c)Only I3 d) I1 and I2 e) I1, I2 and I3
Mirror I
Mirror II
130o 30o
Ray I
Teacher Student
Candle
Plane mirror
K
L
I2
I3
I1 M
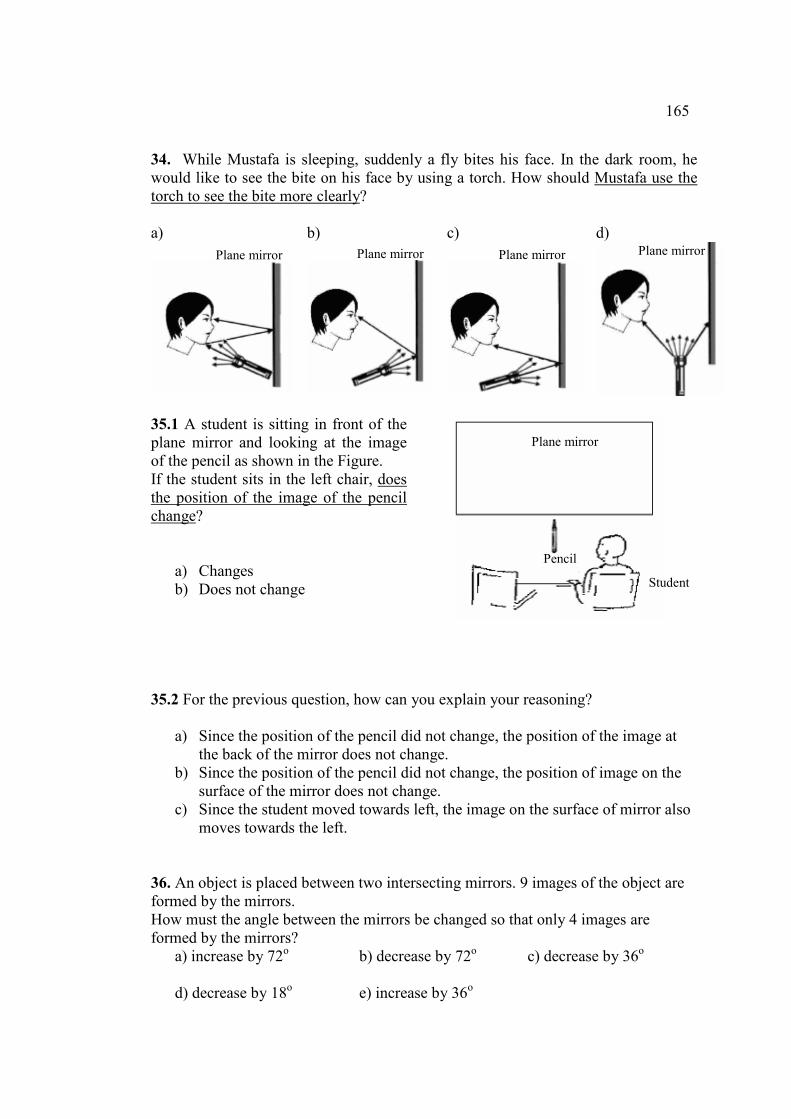
165
34. While Mustafa is sleeping, suddenly a fly bites his face. In the dark room, he would like to see the bite on his face by using a torch. How should Mustafa use the torch to see the bite more clearly? a)
b)
c)
d)
35.1 A student is sitting in front of the plane mirror and looking at the image of the pencil as shown in the Figure. If the student sits in the left chair, does the position of the image of the pencil change?
a) Changes b) Does not change
35.2 For the previous question, how can you explain your reasoning?
a) Since the position of the pencil did not change, the position of the image at the back of the mirror does not change.
b) Since the position of the pencil did not change, the position of image on the surface of the mirror does not change.
c) Since the student moved towards left, the image on the surface of mirror also moves towards the left.
36. An object is placed between two intersecting mirrors. 9 images of the object are formed by the mirrors. How must the angle between the mirrors be changed so that only 4 images are formed by the mirrors? a) increase by 72o b) decrease by 72o c) decrease by 36o d) decrease by 18o e) increase by 36o
Plane mirror Plane mirror Plane mirror Plane mirror
Student
Pencil
Plane mirror
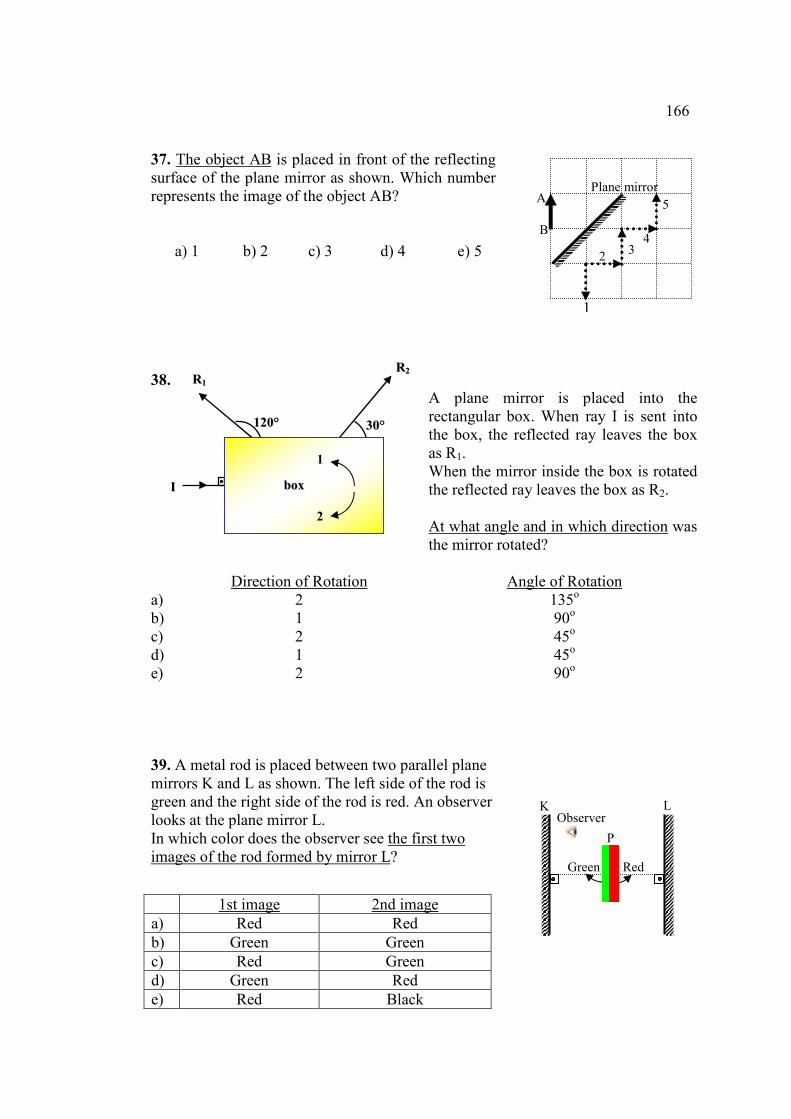
166
37. The object AB is placed in front of the reflecting surface of the plane mirror as shown. Which number represents the image of the object AB? a) 1 b) 2 c) 3 d) 4 e) 5
38.
A plane mirror is placed into the rectangular box. When ray I is sent into the box, the reflected ray leaves the box as R1. When the mirror inside the box is rotated the reflected ray leaves the box as R2. At what angle and in which direction was the mirror rotated?
Direction of Rotation Angle of Rotation
a) 2 135o b) 1 90o c) 2 45o d) 1 45o e) 2 90o 39. A metal rod is placed between two parallel plane mirrors K and L as shown. The left side of the rod is green and the right side of the rod is red. An observer looks at the plane mirror L. In which color does the observer see the first two images of the rod formed by mirror L?
1st image 2nd image a) Red Red b) Green Green c) Red Green d) Green Red e) Red Black
A 5
B
Plane mirror
1
2 3 4
112200°° 3300°°
bbooxx
RR11
II
RR22
1
2
Green Red
P
Observer L K
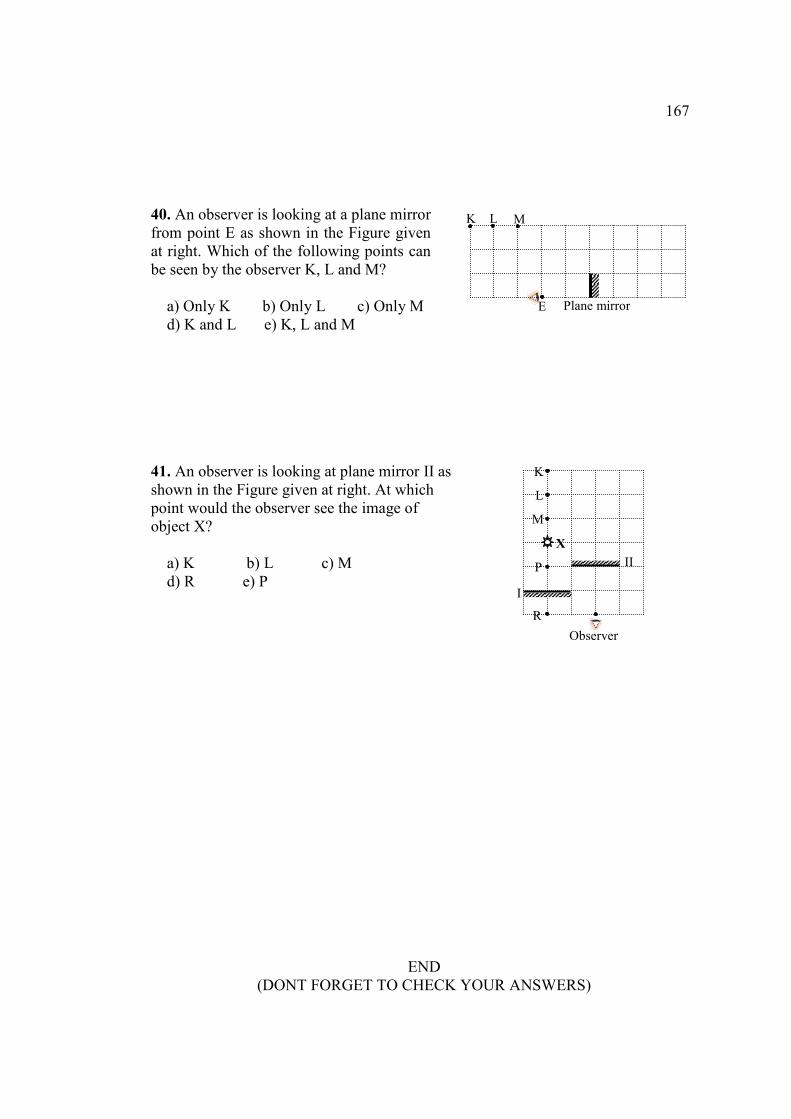
167
40. An observer is looking at a plane mirror from point E as shown in the Figure given at right. Which of the following points can be seen by the observer K, L and M? a) Only K b) Only L c) Only M d) K and L e) K, L and M
41. An observer is looking at plane mirror II as shown in the Figure given at right. At which point would the observer see the image of object X? a) K b) L c) M d) R e) P
END (DONT FORGET TO CHECK YOUR ANSWERS)
E Plane mirror
K L M
K
L
M
X
P
R
Observer
II
I

168
APPENDIX B
PHYSICS ATTITUDE SCALE
Sevgili Öğrenciler;
Bu anket sizin Optik konularına karşı tutumlarınızı öğrenmek için
geliştirilmiştir. Cevaplarınız önümüzdeki yıllarda fizik derslerinin sizin görüşleriniz
ve beklentileriniz doğrultusunda şekillenmesine katkıda bulunabileceğinden önem
taşımaktadır. Lütfen bütün soruları yanıtlayınız. Bu araştırmada toplanılan tüm
bilgiler kesinlikle gizli tutulacaktır.
Her bir cümleyi dikkatle okuduktan sonra, cümleye ne derecede katıldığınızı
veya katılmadığınızı belirtmek için yanındaki seçeneklerden birini işaretleyiniz.
Adı Soyadı: Sınıfı:
Cinsiyeti: E / K Doğum Tarihi (Ay/Yıl):________

169
Optik konusu;
• Işık ve özellikleri
• Gölge,
• Renk,
• Yansıma ve düzlem ayna konularını kapsamaktadır.
Kesinlikle Katılıyorum
Katılıyorum
Kararsızım
Katılmıyorum
Kesinlikle Katılmıyorum
1. Optik konularını severim.
2. Optik konularına karşı olumlu hislerim vardır.
3. Benim için Optik konuları eğlendiricidir.
4. Okulda Optik konularını çalışmaktan hoşlanırım.
5. Diğer konulara göre Optik konuları daha ilgi çekicidir.
6. Optik konularının, ilerideki meslek hayatımda önemli bir yeri
olacağını düşünüyorum.
7. Optik konularında öğrendiklerimin, gündelik hayatta işime
yarayacağını düşünüyorum.
8. Optik konularında öğrendiklerimin, hayatımı kolaylaştıracağını
düşünüyorum.
9. Optik veya teknolojideki uygulamaları ile ilgili kitaplar
okumaktan hoşlanırım.
10. Optik konularının, ilerideki çalışmalarımda bana yararlı
olacağını düşünüyorum.
11. Optik konuları ve teknolojideki uygulamaları ile ilgili kitaplar
okumaktan hoşlanırım.
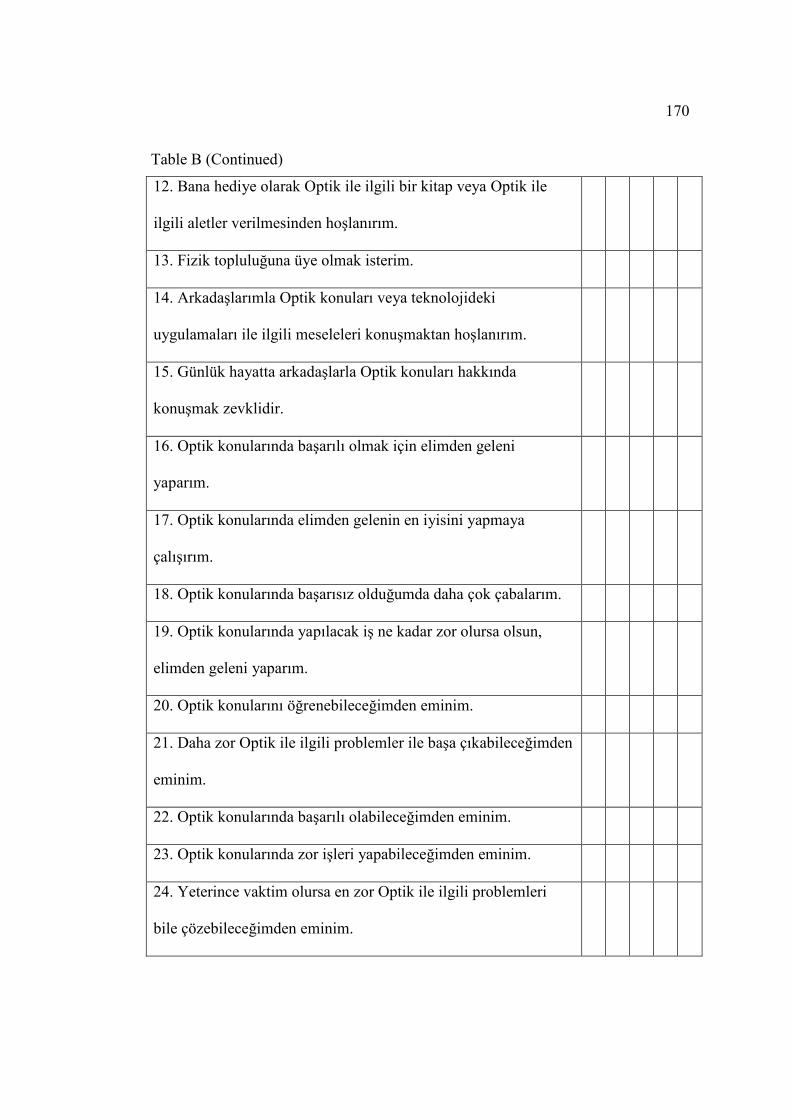
170
Table B (Continued)
12. Bana hediye olarak Optik ile ilgili bir kitap veya Optik ile
ilgili aletler verilmesinden hoşlanırım.
13. Fizik topluluğuna üye olmak isterim.
14. Arkadaşlarımla Optik konuları veya teknolojideki
uygulamaları ile ilgili meseleleri konuşmaktan hoşlanırım.
15. Günlük hayatta arkadaşlarla Optik konuları hakkında
konuşmak zevklidir.
16. Optik konularında başarılı olmak için elimden geleni
yaparım.
17. Optik konularında elimden gelenin en iyisini yapmaya
çalışırım.
18. Optik konularında başarısız olduğumda daha çok çabalarım.
19. Optik konularında yapılacak iş ne kadar zor olursa olsun,
elimden geleni yaparım.
20. Optik konularını öğrenebileceğimden eminim.
21. Daha zor Optik ile ilgili problemler ile başa çıkabileceğimden
eminim.
22. Optik konularında başarılı olabileceğimden eminim.
23. Optik konularında zor işleri yapabileceğimden eminim.
24. Yeterince vaktim olursa en zor Optik ile ilgili problemleri
bile çözebileceğimden eminim.
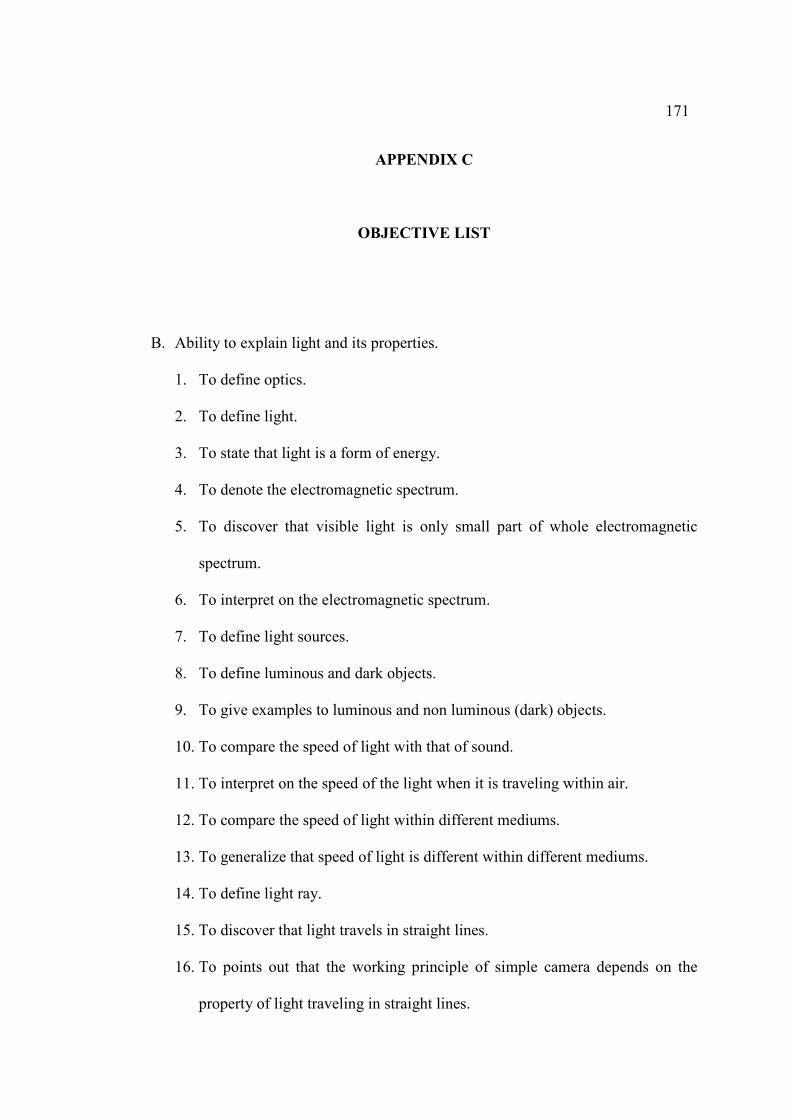
171
APPENDIX C
OBJECTIVE LIST
B. Ability to explain light and its properties.
1. To define optics.
2. To define light.
3. To state that light is a form of energy.
4. To denote the electromagnetic spectrum.
5. To discover that visible light is only small part of whole electromagnetic
spectrum.
6. To interpret on the electromagnetic spectrum.
7. To define light sources.
8. To define luminous and dark objects.
9. To give examples to luminous and non luminous (dark) objects.
10. To compare the speed of light with that of sound.
11. To interpret on the speed of the light when it is traveling within air.
12. To compare the speed of light within different mediums.
13. To generalize that speed of light is different within different mediums.
14. To define light ray.
15. To discover that light travels in straight lines.
16. To points out that the working principle of simple camera depends on the
property of light traveling in straight lines.

172
17. To infers that light rays leave the light source from each point to whole
direction.
18. To define transparent materials.
19. To comprehend transparency.
20. To define semi transparent materials.
21. To comprehend semi transparency.
22. To define opaque materials.
23. To comprehend the opaque materials.
24. To discover whether materials are transparent, semi transparent or opaque.
25. To state that the transparency depends on both the type of material and the
thickness of the material.
C. Ability to explain formation of shadows.
1. To give daily life examples of shadow.
2. To relate that the shadow is the evidence of light traveling in straight lines
3. To list the factors affecting the size of shadow.
4. To show the shadow of and opaque object.
5. To demonstrate that as the distance between light source and opaque object
decrease the size of shadow increases.(when the screen is fixed)
6. To demonstrate that as the distance between light source and opaque object
increase the size of shadow decreases and the shadow becomes clearer. (when
the screen is fixed)
7. To demonstrate that as the distance between opaque object and the screen
increase the size of shadow increases. (when the screen is fixed)

173
8. To demonstrate that as the size of object increase the size of shadow also
increases. (when the source and screen is fixed)
9. To show the formation of umbra.
10. To define umbra.
11. To explain the formation of umbra.
12. To show the formation of penumbra.
13. To define penumbra.
14. To explain the formation of penumbra.
15. To solve examples related to umbra and penumbra.
16. To relates the eclipse of the Sun to the shadow concept
17. To relates the eclipse of the Moon to the shadow concept.
D. Ability to understand color.
1. To state that colors of things are not in the substances, they are in the eye of
the observer.
2. To speak about the experiment conducted by Isaac Newton.
3. To state that sunlight is composed of a mixture of all the colors of the
rainbow.
4. To define spectrum.
5. To show that white light is composed of a mixture of all the colors of the
rainbow.
6. To show that the red light bent less, the violet light bent more after passing
from the prism.

174
7. To devise that white light is also results from the combination of Red,
Orange, Yellow, Green, Blue, Indigo and Violet lights.
8. To show that white light is also results from the combination of only red,
green, and blue light.
9. To define that red, green and blue lights are called the additive primary
colors.
10. To show that the combination of red light and green light results in yellow
color.
11. To show that the combination of red light and blue light alone results in
bluish red color called magenta.
12. To show that the combination of green light and blue light alone results in the
greenish blue color called cyan.
13. To identify secondary colors.
14. To identify complementary colors.
15. To discover the complementary colors.
16. To state that sun light is white light.
17. To state that under white light, white objects appear white and colored objects
appear in their individual colors.
18. To explain why objects are seen colored.
19. To explain that white objects are seen with the same color as the light that
shines on it.
20. To defend that black is similarly not a color itself, but is the absence of light.
21. To predict the colors of different surfaces when they are illuminated with
different colors.

175
22. To infer why the flowers are seen green and why the roses are seen red under
white light.
23. To state that color filters transmit of their color and absorb other.
24. To explain why we see the objects around us in the color of filter when we
look through the filter.
25. To predict which colors pass through different filters when different colors
are sent on to the filters.
26. To solve problems about filters.
D. Ability to understand plane mirror.
1. To recall that light rays travel in straight lines.
2. To define regular reflection.
3. To define diffuse reflection.
4. To define mirror.
5. To infer that the angle between incident ray and 00 line is always equal to the
angle between reflected ray and 00 (Normal) line.
6. To define normal, incidence angle and reflection angle.
7. To show the reversibility of the light.
8. To writes Laws’ of Reflection.
9. To explain how can we see the objects around us?
10. To solve examples about the reflection of light from plane mirror.
11. To show that the image of object is formed at the back of the plane mirror.
12. To show that the image is always symmetrical according to the object.
176
13. To state that for the formation of the image of a point, we need at least two
light rays which originate from the point and incident on plane mirror.
14. To explain the image formation at the plane mirror.
15. To discover the properties of image formed by the plane mirror.
16. To discover that the position of the image is independent of the observer.
17. To discover that without any light, the image of the object never formed at
the mirror.
18. To solve examples.
19. To define the region of the sight of the plane mirror.
20. To explain how the objects within the region of the sight can be seen by an
observer.
21. To solve questions.
22. To show that although some objects are in region of sight, the observer can
not see the image of objects because of other objects or their images.
23. To devise the length of the plane mirror which shows the whole body of the
observer.
24. To define plane mirror system.
25. To explain the condition for the formation of the multiple images formed at
the plane mirror system.
26. To explain the multiple images formed at the plane mirror system.
27. To find out the places of the images of object placed in front of mirrors when
mirrors are at angle of 90o.
28. To show that as the angle between two plane mirrors decreases the number of
images formed at the system increases.
177
29. To explain why the number of images increases when the angle between two
mirrors decreases.
30. To give the formula about the number of image when the angle between two
mirrors is α.
31. To discuss the formula.
32. To show that the number of image formed by two parallel plane mirrors is
infinite.
33. To explain the multiple images formed between two parallel plane mirrors.
34. To solve problems.
35. To observe that when a plane mirror is rotated around a fixed axis by an angle
of α, the reflected ray also rotates by an angle of 2α in the direction of
rotation.
36. To devise that when a plane mirror is rotated around a fixed axis by an angle
of α, the reflected ray also rotates by an angle of 2α in the direction of
rotation.
37. To solve examples.
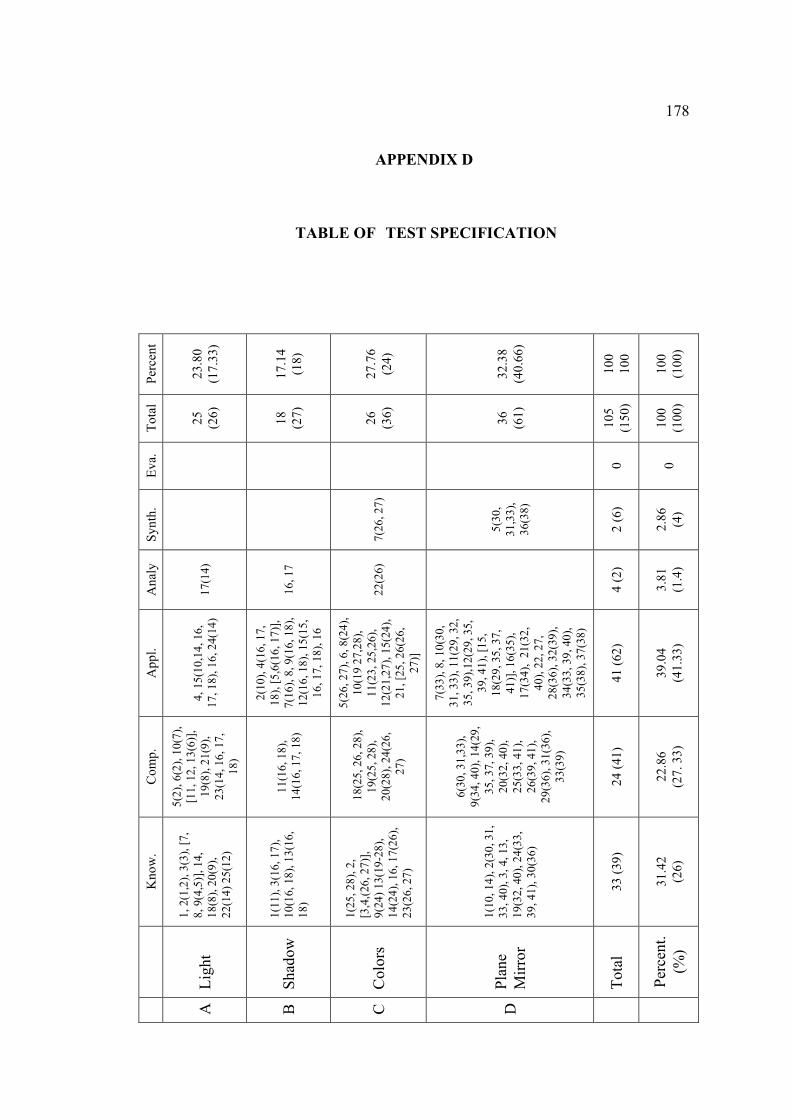
178
APPENDIX D
TABLE OF TEST SPECIFICATION
Percent
23.80
(17.33
)
17.14
(18)
27.76
(24)
32.38
(40.66
)
100
100
100
(100
)
Total
25
(26)
18
(27)
26
(36)
36
(61)
105
(150
)
100
(100
)
Eva.
0 0
Syn
th.
7(26
, 27)
5(30
, 31
,33),
36(38)
2 (6)
2.86
(4)
Analy
17(14)
16, 1
7
22(26)
4 (2)
3.81
(1.4)
App
l.
4, 15(10
,14, 16,
17, 1
8), 1
6, 24(14
)
2(10
), 4(16, 17,
18), [5,6(16
, 17)],
7(16
), 8, 9
(16, 18),
12(16, 18), 1
5(15
, 16
, 17, 18), 1
6
5(26
, 27), 6
, 8(24),
10(19 27
,28),
11(23, 25,26
),
12(21,27
), 15(24
),
21, [25
, 26(26
, 27
)]
7(33
), 8, 1
0(30
, 31
, 33), 1
1(29
, 32,
35, 3
9),12(29
, 35,
39, 4
1), [15
, 18
(29, 35, 37,
41)], 16(35
),
17(34), 21
(32,
40), 22, 27,
28(36), 32(39
),
34(33, 39, 40),
35(38), 37(38
)
41 (62
)
39.04
(41.33
)
Com
p.
5(2), 6
(2), 10(7),
[11, 12, 13(6)],
19(8), 21(9),
23(14, 16, 17,
18)
11(16, 18),
14(16, 17, 18)
18(25
, 26, 28),
19(25, 28),
20(28), 24(26
, 27
)
6(30
, 31,33
),
9(34
, 40), 14(29
, 35
, 37, 39),
20(32, 40),
25(33, 41),
26(39, 41),
29(36), 31(36
),
33(39)
24 (41
)
22.86
(27. 33)
Kno
w.
1, 2(1,2), 3(3), [7,
8, 9(4,5)], 1
4,
18(8), 20(9),
22(14) 25(12
)
1(11
), 3(16, 17),
10(16, 18), 1
3(16
, 18
)
1(25
, 28), 2
, [3,4,(26
, 27)],
9(24
) 13
(19-28
),
14(24), 16, 17(26
),
23(26, 27)
1(10
, 14), 2
(30, 31,
33, 4
0), 3
, 4, 1
3,
19(32, 40), 2
4(33
, 39
, 41), 3
0(36
)
33 (39
)
31.42
(26)
Light
Shado
w
Colors
Plane
Mirror
Total
Percent.
(%)
A
B
C
D
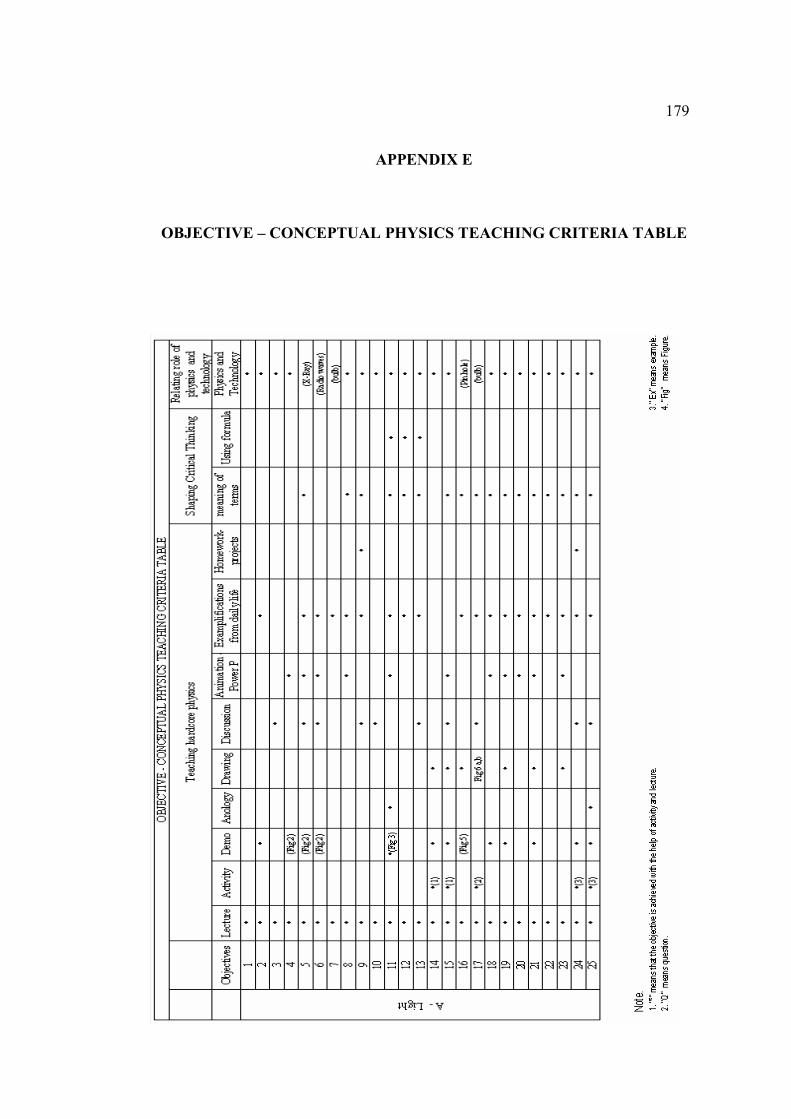
179
APPENDIX E
OBJECTIVE – CONCEPTUAL PHYSICS TEACHING CRITERIA TABLE
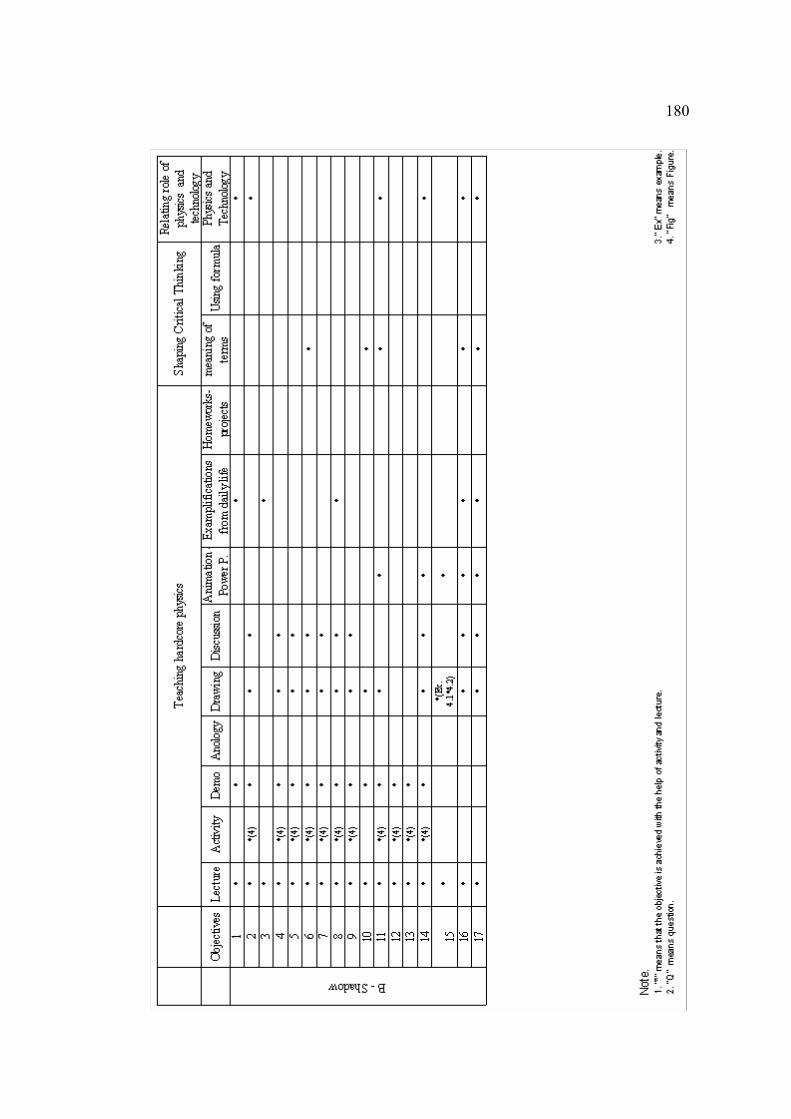
180
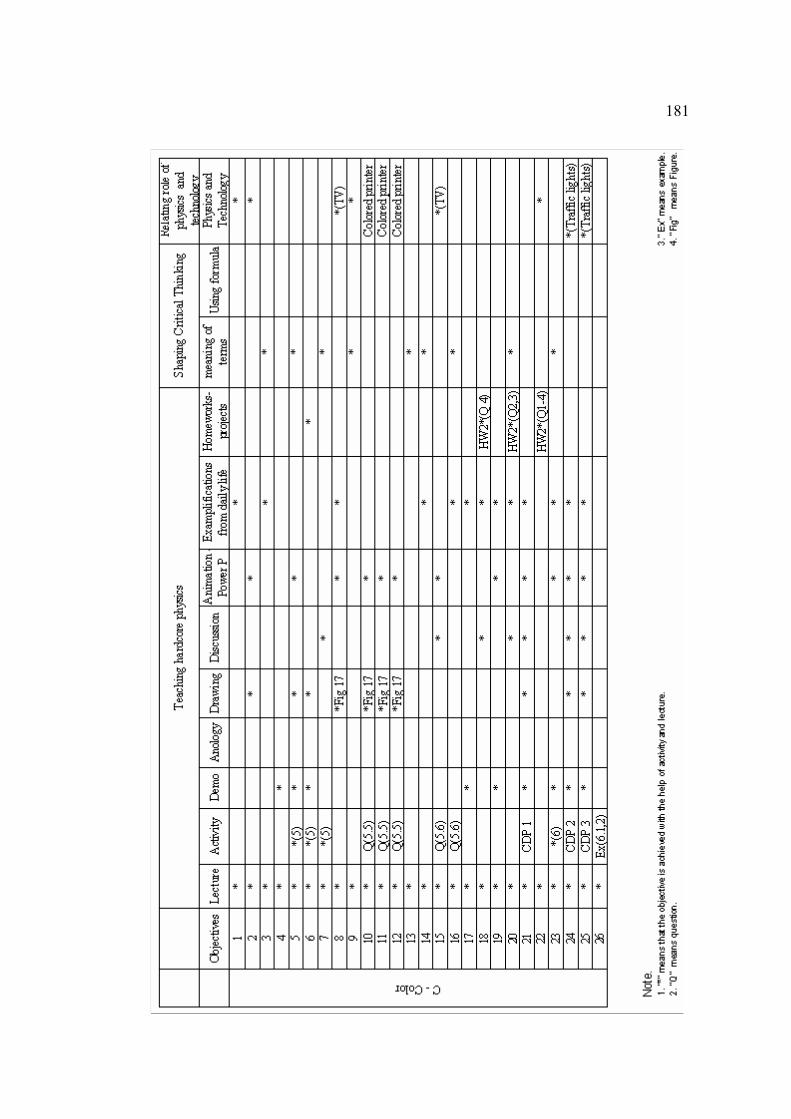
181
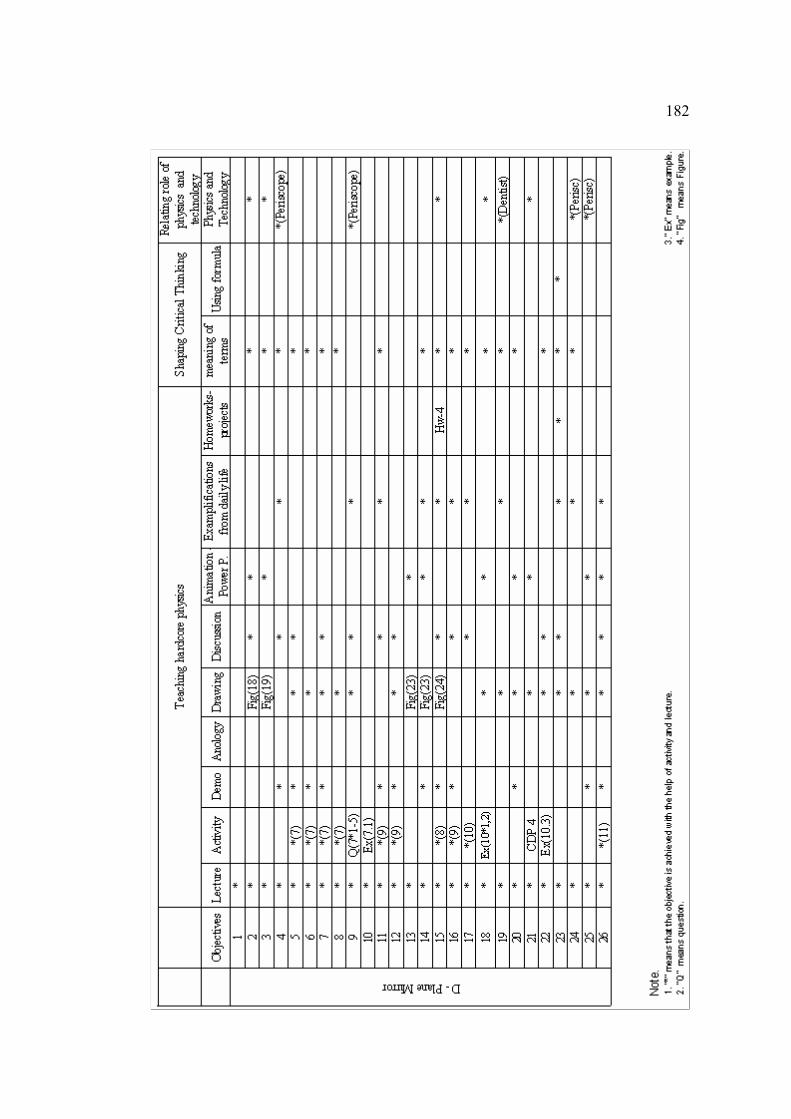
182
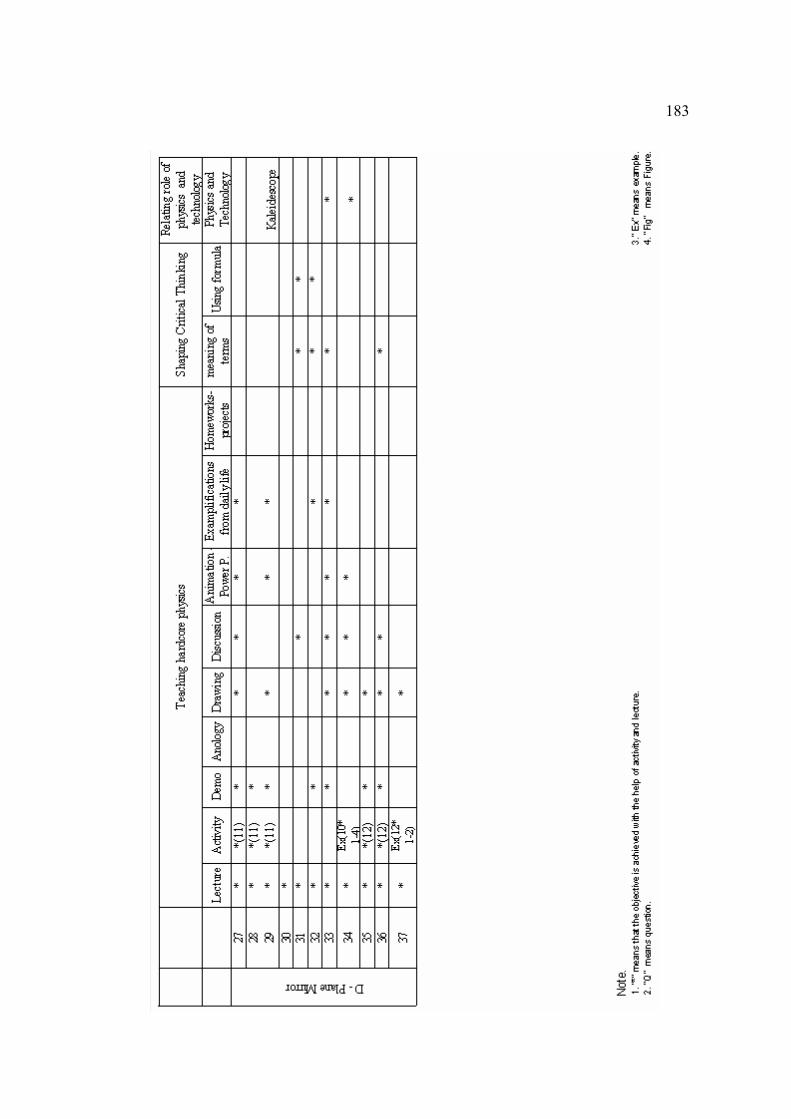
183
184
APPENDIX F
CONCEPTUAL APROACH AND COMBINED READING STUDY
STRATEGY HANDBOOK FOR TEACHERS
A. CONCEPTUAL APPROACH (CA) Conceptual Approach (CA) is the instruction that is based on Conceptual
Physics. Hewitt (1983) describes conceptual physics as “The study of the concepts of
physics qualitatively by emphasizing on mental imagery. Studying physics by
relating the concepts to the things, events that are familiar in the everyday
environment” (Hewitt, 1983, p. 305). It has three important objectives; to teach
hardcore physics with emphasis on the everyday environment, to shape the critical
thinking of students and to relate the role of physics and technology toward the
positive future.
To teach hardcore physics:
Our environment and everyday world is full of physics. Hewitt (1983) states
physics is everywhere and our task should be to bring it alive in the minds of
students. The richness in life is not observed only seeing the world with open eyes,
but also knowing what to look for. The important think is to get the main ideas and
improve it with good real life examples. It is suggested that, in order to teach
hardcore physics, the instructors can use, drawings, experiments, demonstrations,
185
classroom discussions, home projects, animations, analogies, games and
exemplifications from daily life.
To shape critical thinking:
The second important objective of the conceptual physics is to shape the
critical thinking. The questions of “how do we know that such-and-such is valid?
What evidence do we have for believing so? If we’re wrong, how would we know?”
are important questions to improve and shape students’ critical thinking. The
important thing is to understand the underlying idea of principles or rules rather than
finding a name, a phrase, or a label for that certain phenomenon.
To Relate the Role of Physics and Technology:
The third objective of conceptual physics is to relate the role of physics and
technology and to impart positive attitude toward science and its role in the future.
The worst think for the people is to give up hope for better world. As Hewitt (1983)
reports physics teachers have great chance and huge responsibility to point out the
positive things, which happened technologically. We should balance the negative
vision of the future that is mostly resulted from misleading data, with more accurate
forecasts based on the correct and suitable information.
186
B. READING STUDY STRATEGIES
B1. K-W-L: The Instructional Strategy
K-W-L is an instructional strategy which is first introduced by Ogle (1986). K
stands for “what I know”, W stands for “what I want to know” and L stands for
“what I learned”. Marinak (1998) reports that the method involves to activate
students’ prior knowledge, set purposes for reading by asking questions and try to
learn the answers of questions by reading through the text.
Step K - What I Know
Ogle (1986) reports that the important think is to access the students’ prior
knowledge. This is achieved by having students brainstorm about the content. There
are two important purpose of brainstorming; first to extract what the students know
about the topic and second to encourage students to think more general categories of
information. While conducting first purpose, the teachers’ role is to encourage
students to tell something about the content, meanwhile, the teacher observes,
records the reactions or responses of students on the board or overhead projector.
There is an important point here; Ogle (1986) suggests teachers to use a key concept
and then encourage students to discuss their prior knowledge. The key concept
should be enough specific that it should help students to extract their initial
knowledge.
After determining students’ initial knowledge, now it is time to achieve the
second purpose of brainstorming. At this point the teachers’ function is to help and
187
encourage students to categorize the information which were previously written on
the board. Ogle warns that at the beginnings of this process, students would be
unwillingness to categorize the knowledge because it could most probably be
confusing for most of them. So, teachers should help them by being model; he/she
proposes one or two examples. Then, the categorized information is written below
column K.
Step W- What do I Want to Learn?
At the end of the step K, students performed brainstorming on the topic.
Teacher determined what students brought to the class and what kinds of category of
information they have on the topic. Using the information that is stated as known,
students generate questions to be answered about the topic. The questions are written
to the second column, W. At this stage Ogle (1986) defines the teachers’ role as to
help students to produce questions that take their attention to the reading. According
to Fritz (2002) this step allows students to clarify their ideas and concepts in question
form.
Ogle (1986) reports that with this step, students gain a purpose for reading;
they read the text to find out answers to their questions. So, it would be beneficial for
each student to generate their own questions.
Step L- What I Learned?
Upon steps K and W, students read the text and fill the column L with the
answers of their questions. Ogle (1986) suggests teacher to ask students whether they
188
could have found answers to their questions written on column W. If they couldn’t
have find, teacher suggests further reading to find answers to their questions.
B2. SQ3R: The Instructional Strategy
SQ3R is another instructional strategy suggested by Frances Robinson in
1940s. Roberts (2002) defines SQ3R as a study strategy standing on survey,
question, read, recite and review. Lipson and Wixson (as cited in Huber, 2004) called
it as “the grand father of study strategies”. It was developed to improve higher-order
learning from textbooks.
Feldt and Moore (1999) explain SQ3R briefly; during the study, students
survey to get an overview of the text, and then work section by section to ask
questions. Following the questions, they start to read to find out answers. Then,
students recall their readings by reciting and finally they revive the text by glancing
their questions and answers.
Step S; Survey
In this step, students just look at the headings, sub-headings, diagrams, and
topic sentences to get an idea of what the text is about. Feldt and Moore (1999)
suggest students read the abstract first, and then survey to determine what the text is
about by reading topic sentences of introduction. This allows students to think about
prior knowledge related to topic. Bold face headings and italicized phrases are key
concept to survey. Roberts (2002) makes also similar suggestion; students should
first preview the chapter by reading its title, introduction and summary.
189
Step Q; Question
In the “Question” stage, Robert (2002) states that students convert their
chapter survey into questions in order to answer during reading process. The main
purpose of questioning is to stimulate curiosity and promote comprehension. The
questions, created by students, motivate students to read the text. With the help of
this stage students become mentally active.
Step 3R; Read-Recite-Review
Robinson (as cited in Feldt & Moore, 1999) indicates that students read the
material and try to answer their questions. During reading process, when students
come to related parts, they are advised to take notes for their questions.
For step, Recite, Robinson recommends to look away from the text and try to
recall the answer to each question. If there is any difficulty in recalling any answer,
then it would be better to write answer after reviewing the text.
In the last stage, Review, Students go back to review and reread sections that
are unclear in order to verify their answer. They reexamine notes and try to recall
major points and sub points. Review is suggested to eliminate the forgetting,
Robert (2002) states that while conducting this strategy, students must be
conscious to the study. He makes suggestion that after students get used to use this
model, during reading process, teacher have them stop and encourage themselves to
ask how and where their readings will be used or will be applied to somewhere else.

190
C. COMBINED READING STUDY STRATEGY (CRSS)
In our study, we combined the two instructional strategies, KWL and SQ3R
into a new Combined Reading Study Strategy (CRSS). The new CRSS is the
combination of KWL, SQ3R and Lecturing. Students will fill a CRSS table. ). K
stands for “what I know”, W stands for “what I want to know”, R stands for
“reading” and L stands for “what I learned”.
THE CRSS TABLE
Name, Surname:………………………No:………..Class:………… …./…./2007
Subject……………………………………………….
What I Know?
(Survey, Write)
What I Want to Know?
(Survey, Question, Write)
What I Learned?
(Recite, Review, Write)
Read
the
text
191
The study will begin at home and will continue at school. As Ogle (1986)
reports, students’ prior knowledge is important for the implementation of new
knowledge. Students should make preparation before coming to school; they will fill
the columns of What I know, What I want to know? and what I learned? before
coming to school. At the beginning of the lesson, the teacher will administer short
quiz. These quizzes will help teacher to control whether students read the text and
learned some certain concepts. It will also encourage students to read the texts. After
quizzes, teacher will ask students what they initially know and what they want to
know further. The students’ responses are important and teacher should be sensitive
to their responses. After all, teacher will study his lessons as initially planned. The
study consists of five steps and each step also consists of some certain sub steps. The
four steps; writing what I know, determining what I want to know, reading the text
and writing what I learned, will be conducted by students at home. The final step,
lecturing, will be conducted at school by teacher.
The first step is determining prior knowledge about the concept and writing
them into the “what I know” column of the CRSS table. It includes two sub steps;
survey (S) and write (W) what I Know. The step “S” will require students just to
look at the headings, sub-headings, diagrams, and topic sentences. It is suggested that
students should read the abstract first, and then survey to determine what the text is
about by reading topic sentences of introduction. Bold face headings and italicized
phrases are key concept to survey. It would be better to glance at chapter pictures,
graphs and charts. These activities will help students to activate their previous
knowledge about the concept. The second sub step “W” requires students to write
their previous knowledge into the “what I know” column of the table.
192
The second step consists of also two sub steps; Question (Q) and write (W)
What I want to know. For step “Q” student will convert their chapter survey into
questions. The main purpose of questioning is to stimulate curiosity and promote
comprehension. Ogle (1986) reports that with the help of this step, students gain a
purpose for reading; they read the text to find out answers to their questions. So, it
would be beneficial for each student to generate their own questions. In the second
sub step “W” each student will write their own questions into what I want to know
column of the table. The second step will help students to develop their reasons to
read the text.
The third step is Reading the text. Students will read the text to answer their
initially developed questions. During reading process, it is advised that when
students come to related parts, they should take notes for their questions. If the text is
not understood clearly, it is advised to reread the text
The fourth step is filling the What I Learned Column. It consists of three sub
steps; Recite (R), Review (R) and Write (W) What I learned. After reading the text,
students will recite; they will try to recall the answer to each question without
looking at the text. If there is any difficulty in recalling any answer, then it is advised
to take small notes to small paper. After completing Recite section, students will
follow the Review section. It is required that students go back to review and reread
sections that are unclear in order to verify their answers. They reexamine notes and
try to recall major points and sub points. Review is suggested to eliminate the
forgetting. After all, as a final step, students will write what they have learned from
this text in to what I learned column.
193
Until this point, students will follow the steps and fill the columns of the table
individually. While coming to school, they bring their tables. It is required that all
students must fill all columns by themselves. At the beginning of the lesson, teacher
will administer a short quiz about the subject. It will last five or six minutes. The
purpose of administering quiz is to control whether students read the text or not.
When students finish their quizzes, teacher will collect quiz papers and answers the
questions briefly. Then, teacher asks students what they initially know about the
concept. During this process, teacher will categorize the knowledge by regarding
students’ responses and then asks students, before reading what they expected to
learn and after reading what they could/couldn’t have learned from the text.
After all, teacher starts to convey his lesson according to the lesson plan. At
this point, teacher should take consider the students’ responses and he can pass
quickly over the concepts which were learned well, and stress on the points which
were understood weakly. After studying the lesson, teacher again ask, whether they
have questions or points that couldn’t be understood well. If there is/are he should
represent the points. If there still is/are weak point(s) he should recommend students
further readings from other sources.
194
PROCEDURES
A- CONCEPTUAL APPROACH AND READING STUDY STRATEGY
Before the Study Begin
• Distribute Conceptual Based Lecture Notes (CBLN) and the CRSS tables to
the students at the previous lesson.
• Inform students about the study. During this process the teacher will use
power point presentation. This presentation is prepared by the researcher and
it informs students about the study and the responsibilities of students during
the study. At the end of presentation, it is expected that student will have
learned what to do before the lesson, during the lesson and after the lesson.
• It is expected that students
o understand how to fill the CRSS table.
o understand what kinds of strategies they will follow while filling the
table.
o complete the CRSS table before coming to lesson.
• Inform students about the short quizzes; explain that the purpose of these
quizzes is to stimulate reading and understanding concept better.
• Warn students that, they must fill the CRSS tables by themselves before
coming to lesson.
• It is expected that the teacher should
o read and understand “CBLN prepared for Instructor”
o read and understand “Lesson Plan for CA and CRSS group ”

195
o study the power point animation and be ready to apply them.
o perform the experiments, demonstrations or activities at least once
before the lesson.
o prepare equipments and bring them to the laboratories before the
lesson begin. This saves time.
During the study
• During the study, four sections will be studied. These are; light and its
properties, shadow, color, reflection and plane mirror. The first three sections
will be studied within six hours; the last section will be completed within
another six hours.
• At the beginning of each section, administer a short quiz. The main purpose
of administering quiz is to control whether students read the text or copy the
table from their friends. It will also encourage students read for the further
lessons.
• After students complete their quizzes, collect them and answer the questions
briefly. After school evaluate the quiz results and inform students about the
quiz results at the beginning of the next day of the school.
• For three or four minutes, ask students what they initially know about the
concept. What did they write on the column of “what I know?”
• According to their responses, write the general titles, statements or concepts
on the left side of blackboard. This behavior will remember students about
what they initially know.

196
• Categorize these general statements or titles and write them on the
blackboard.
• For the next three or four minutes, ask students “Before reading the text what
they would like to learn from the text?” and “Have they been able to find
answers to their questions? and “how much they learned”
• Ask students “During the lesson what they would like to learn further about
the concept?”
• Start to teach your lesson by following the lesson plan prepared for the CA
and CRSS group. It will guide you, what to do and how to achieve the
objectives according to the conceptual physics.
• While studying the concept, frequently ask students whether they understood
or not? If you doubt any point which is weakly learned, re explain and try to
recover the deficiency.
• At the end of the each lesson, summarize briefly what you taught students.
• Ask students whether there is(are) point(s) that is(are) unclear? If there
is(are), you can either re explain or suggests for further readings from the
other sources.
• During the lesson, sometimes you will need to power point animations,
hence the computer and overhead projector should be open and ready to use.
• Ensure that the related equipments for the experiments and activities should
be ready. This will save time.
• Arrange your time, and try to follow the lesson plan as much as you can.
• At the end of the lesson, collect the CRSS tables.
197
• Inform students what to do for the next lesson.
After lesson
• Evaluate the results of the quizzes.
• Inform students about the quiz results as soon as possible, may be at the
beginning of the next day.
B- CONCEPTUAL APPROACH
Before the Lesson
• Distribute CBLN before the study begins.
• Inform students about the study and tell them to bring these notes with them
for every physics lesson. They will study the lessons from CBLN.
• It is expected that teacher should
o study “The Conceptual Based Lecture Notes Prepared for Instructor”
o study the “Lesson Plan for Conceptual Based Instruction”
o study the power point animation and be familiar to use them
specifically
o do the experiments, demonstrations or activities at least once before
the lesson.
o prepare and bring the related equipments
198
During the Lesson
• Start to teach your lesson by following the “Lesson Plan Prepared for the CA
Group” It will guide you, what to do and how to achieve the objectives
according to the conceptual physics.
• While studying the concept, frequently ask students whether they understood
or not? If you doubt any point which is weakly learned, re explain and try to
recover the deficiency.
• At the end of each lesson, summarize briefly the concept and what students
are expected to learn.
• Arrange your time, and try to follow the lesson plan as much as you can.
• Inform students about next lesson.
C- TRADITIONAL INSTRUCTION AND READING STUDY STRATEGY
Before the Lesson
• Distribute the traditional lecture notes and the CRSS tables to students before
the study begins.
• Inform students about the study. During this process the teacher will use
power point presentation. This presentation is prepared by the researcher and
it informs students about the study and the responsibilities of students during
the study. At the end of presentation student will have learned what to do
before the lesson, during the lesson and after the lesson.
• It is expected that students will complete the CRSS table.
199
• Inform students about the short quizzes; explain that the purpose of these
quizzes is to stimulate reading and understanding concept better.
• Warn students that, they must complete their study before coming to class
and must bring their tables.
During the Lesson
• During the study, four sections will be studied. These are; light and its
properties, shadow, color, reflection and plane mirror. The first three
sections will be studied within six hours; the last section will be
completed within another six hours.
• Administer a short quiz about the concept.
• After they complete their quizzes, collect the quiz papers and answer the
questions briefly. After school evaluate quizzes and inform students about
the quiz results at the beginning of the next day of the school.
• For two or three minutes, ask students what they initially know about the
concept. What did they write on the column of “what I know?” According
to their responses, write the general titles, statements or concepts on the
left side of blackboard. This behavior will remember students about what
they know and how they complete “what I know?” column of the tables.
• Then, categorize these general statements or titles and write them on the
blackboard.
• For the next three or four minutes, ask students “Before reading the text
what they expected to learn from the text?” and “Have they been able to
find answers to their questions? and how much they learned”

200
• Ask students during the lesson “What would they like to learn further
about the concept?”
• Than, summarize the categories of knowledge and state the objectives of
the lesson briefly. It is expected that these discussions will motivate
students and they will also have their reason to listen the lesson carefully.
• Start to teach your lesson traditionally. Do not use the activities, or
specific behaviors prepared for the Conceptual Approach group.
• At the end of the lesson, collect the CRSS tables.
• Inform students what to do for the next lesson.
After the Lesson
• Evaluate the results of the quizzes.
• Inform the students as soon as possible may be at the beginning of the next
day
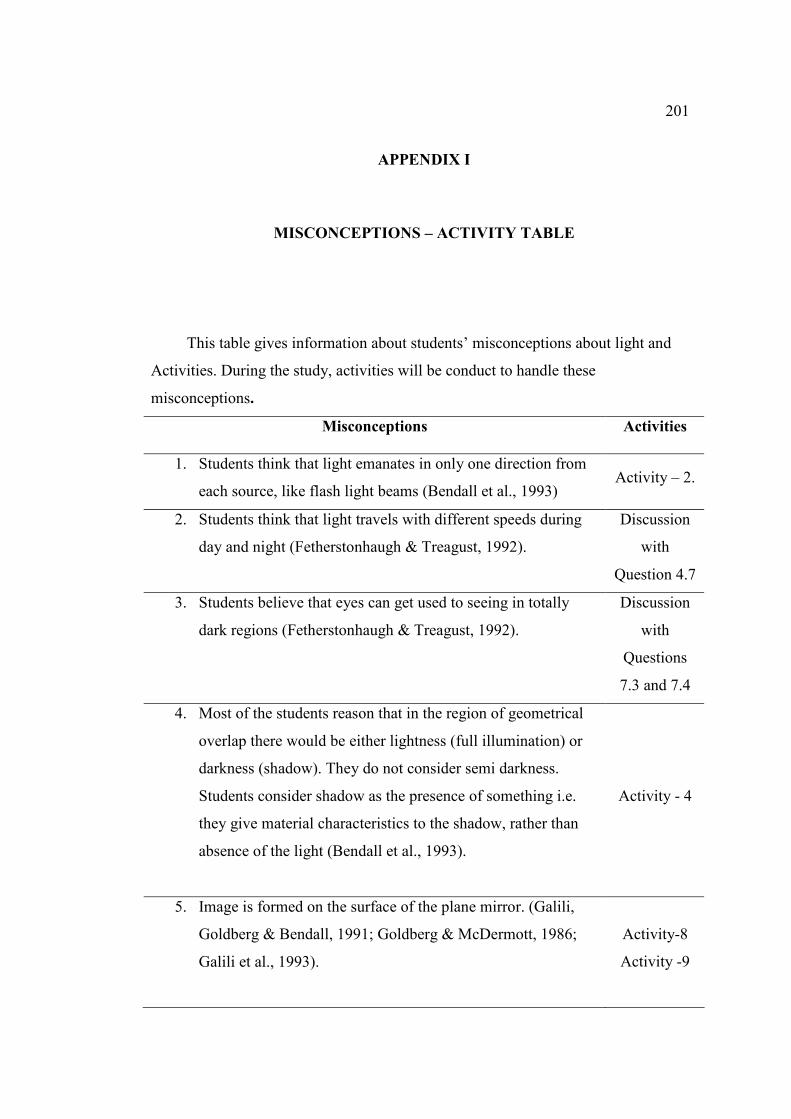
201
APPENDIX I
MISCONCEPTIONS – ACTIVITY TABLE
This table gives information about students’ misconceptions about light and
Activities. During the study, activities will be conduct to handle these
misconceptions.
Misconceptions Activities
1. Students think that light emanates in only one direction from
each source, like flash light beams (Bendall et al., 1993) Activity – 2.
2. Students think that light travels with different speeds during
day and night (Fetherstonhaugh & Treagust, 1992).
Discussion
with
Question 4.7
3. Students believe that eyes can get used to seeing in totally
dark regions (Fetherstonhaugh & Treagust, 1992).
Discussion
with
Questions
7.3 and 7.4
4. Most of the students reason that in the region of geometrical
overlap there would be either lightness (full illumination) or
darkness (shadow). They do not consider semi darkness.
Students consider shadow as the presence of something i.e.
they give material characteristics to the shadow, rather than
absence of the light (Bendall et al., 1993).
Activity - 4
5. Image is formed on the surface of the plane mirror. (Galili,
Goldberg & Bendall, 1991; Goldberg & McDermott, 1986;
Galili et al., 1993).
Activity-8
Activity -9
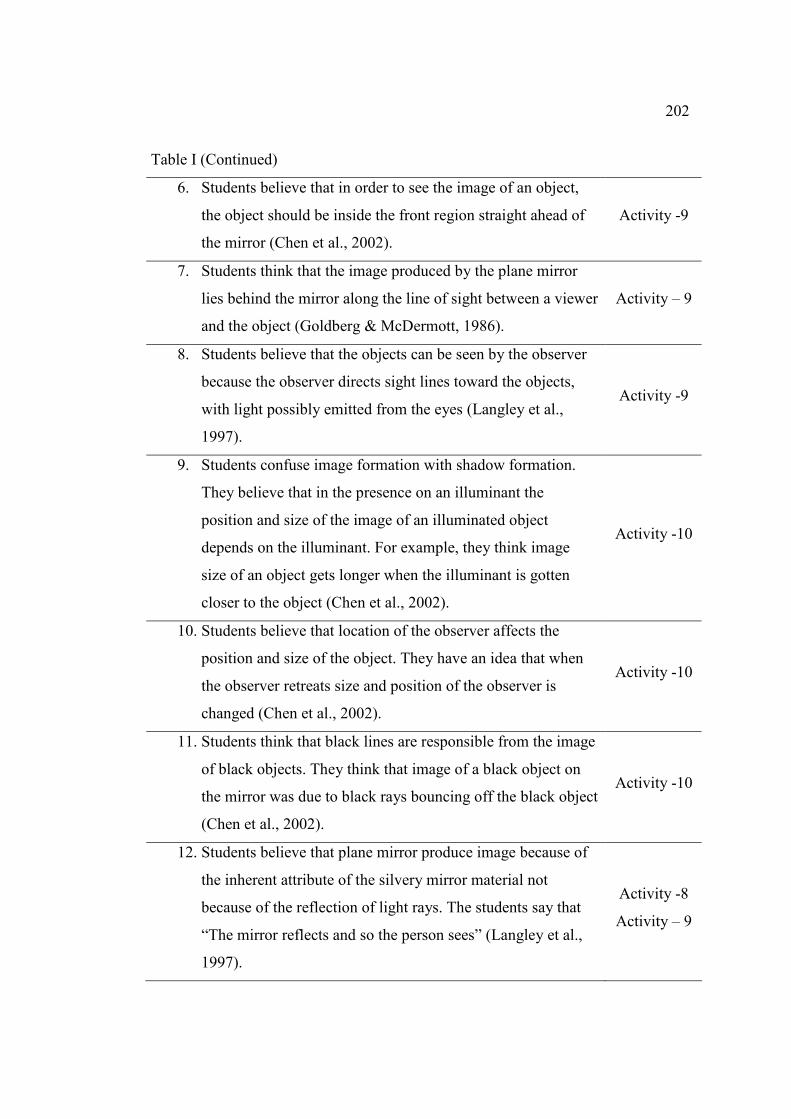
202
Table I (Continued)
6. Students believe that in order to see the image of an object,
the object should be inside the front region straight ahead of
the mirror (Chen et al., 2002).
Activity -9
7. Students think that the image produced by the plane mirror
lies behind the mirror along the line of sight between a viewer
and the object (Goldberg & McDermott, 1986).
Activity – 9
8. Students believe that the objects can be seen by the observer
because the observer directs sight lines toward the objects,
with light possibly emitted from the eyes (Langley et al.,
1997).
Activity -9
9. Students confuse image formation with shadow formation.
They believe that in the presence on an illuminant the
position and size of the image of an illuminated object
depends on the illuminant. For example, they think image
size of an object gets longer when the illuminant is gotten
closer to the object (Chen et al., 2002).
Activity -10
10. Students believe that location of the observer affects the
position and size of the object. They have an idea that when
the observer retreats size and position of the observer is
changed (Chen et al., 2002).
Activity -10
11. Students think that black lines are responsible from the image
of black objects. They think that image of a black object on
the mirror was due to black rays bouncing off the black object
(Chen et al., 2002).
Activity -10
12. Students believe that plane mirror produce image because of
the inherent attribute of the silvery mirror material not
because of the reflection of light rays. The students say that
“The mirror reflects and so the person sees” (Langley et al.,
1997).
Activity -8
Activity – 9
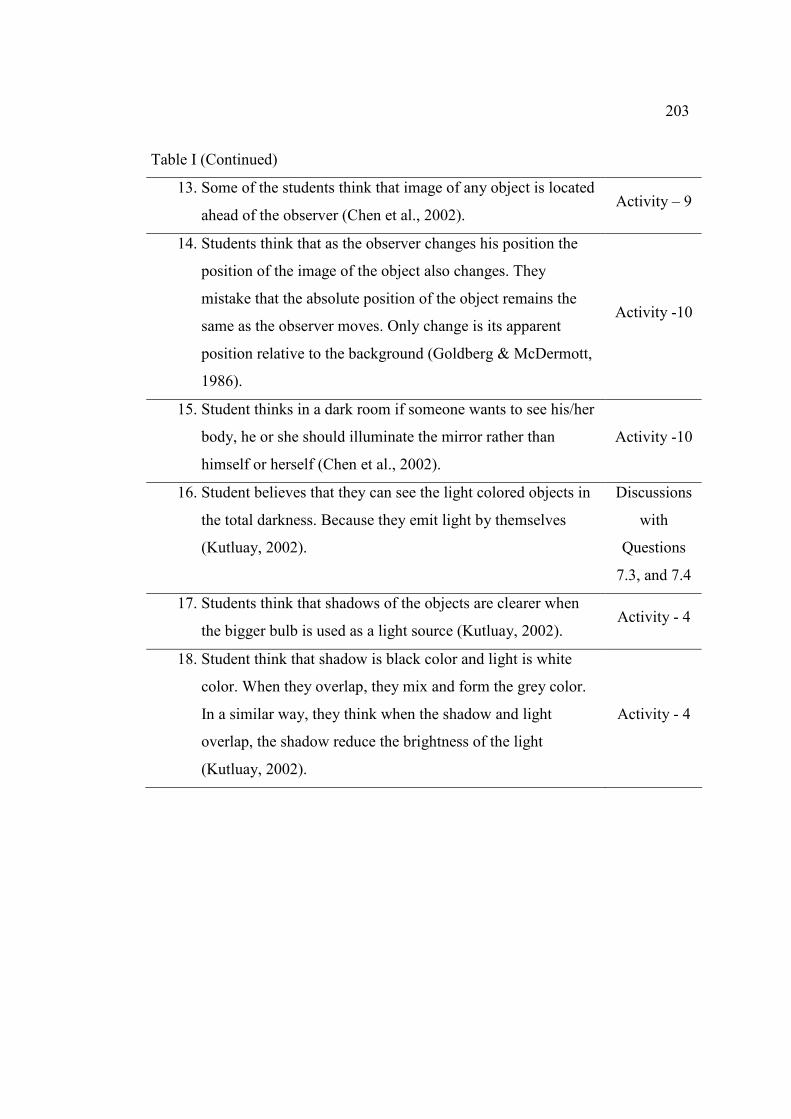
203
Table I (Continued)
13. Some of the students think that image of any object is located
ahead of the observer (Chen et al., 2002). Activity – 9
14. Students think that as the observer changes his position the
position of the image of the object also changes. They
mistake that the absolute position of the object remains the
same as the observer moves. Only change is its apparent
position relative to the background (Goldberg & McDermott,
1986).
Activity -10
15. Student thinks in a dark room if someone wants to see his/her
body, he or she should illuminate the mirror rather than
himself or herself (Chen et al., 2002).
Activity -10
16. Student believes that they can see the light colored objects in
the total darkness. Because they emit light by themselves
(Kutluay, 2002).
Discussions
with
Questions
7.3, and 7.4
17. Students think that shadows of the objects are clearer when
the bigger bulb is used as a light source (Kutluay, 2002). Activity - 4
18. Student think that shadow is black color and light is white
color. When they overlap, they mix and form the grey color.
In a similar way, they think when the shadow and light
overlap, the shadow reduce the brightness of the light
(Kutluay, 2002).
Activity - 4

204
APPENDIX J
THE CRSS TABLE
Name, Surname:…………………… No:………..Class:…………. …./…./2007 Subject: …………………………………………………………………………….
What I Know? (Survey and Write)
What I Want to Know? (Question and Write)
What I Learned? (Recite, Review,
Write)
Read the text
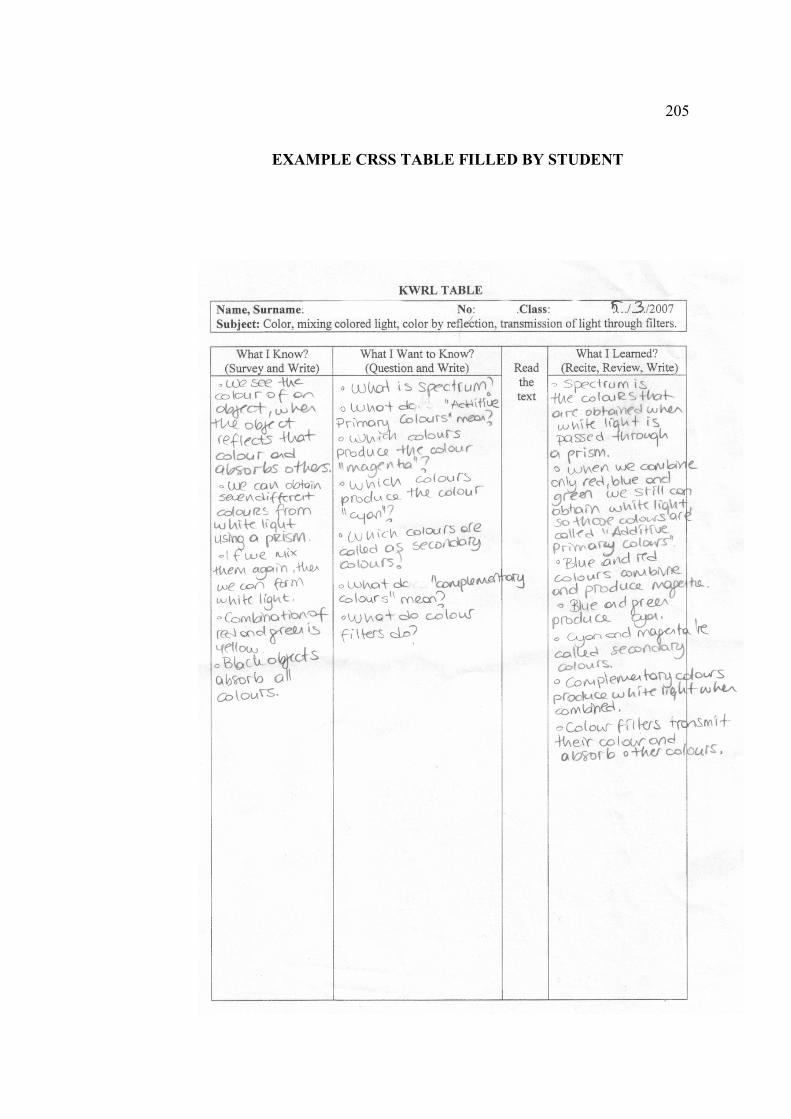
205
EXAMPLE CRSS TABLE FILLED BY STUDENT
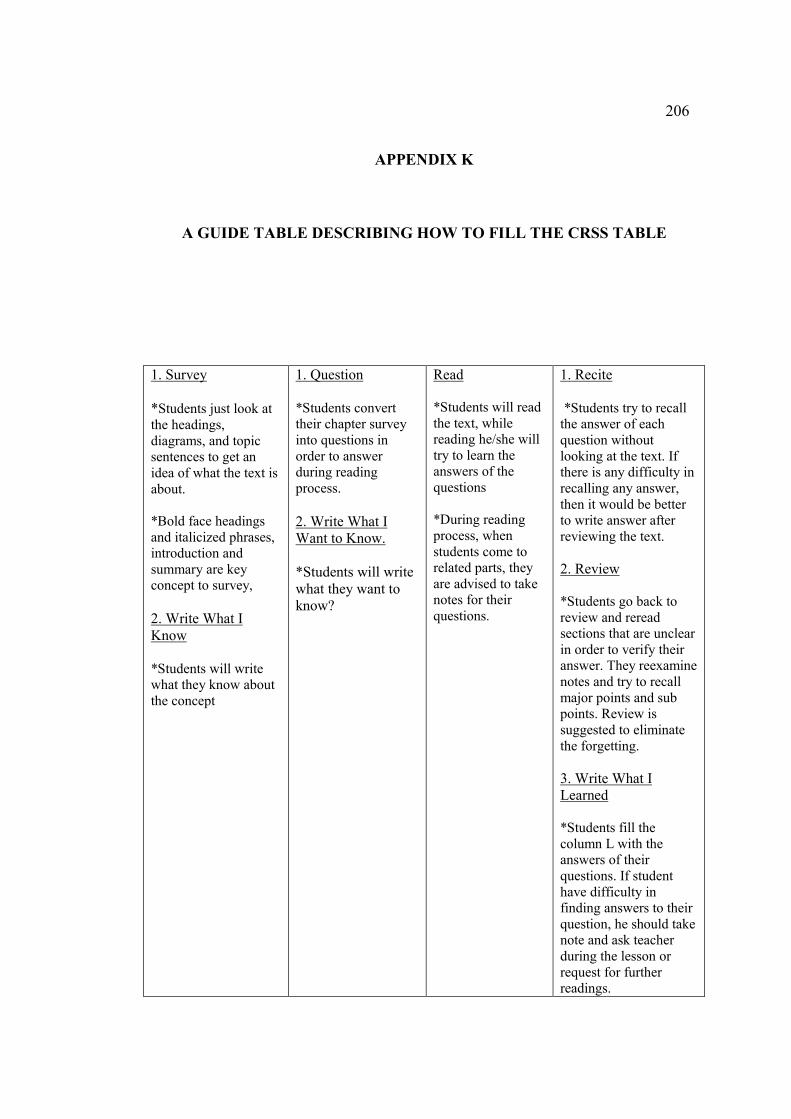
206
APPENDIX K
A GUIDE TABLE DESCRIBING HOW TO FILL THE CRSS TABLE
1. Survey *Students just look at the headings, diagrams, and topic sentences to get an idea of what the text is about. *Bold face headings and italicized phrases, introduction and summary are key concept to survey, 2. Write What I Know *Students will write what they know about the concept
1. Question *Students convert their chapter survey into questions in order to answer during reading process. 2. Write What I Want to Know. *Students will write what they want to know?
Read *Students will read the text, while reading he/she will try to learn the answers of the questions *During reading process, when students come to related parts, they are advised to take notes for their questions.
1. Recite *Students try to recall the answer of each question without looking at the text. If there is any difficulty in recalling any answer, then it would be better to write answer after reviewing the text.
2. Review *Students go back to review and reread sections that are unclear in order to verify their answer. They reexamine notes and try to recall major points and sub points. Review is suggested to eliminate the forgetting.
3. Write What I Learned *Students fill the column L with the answers of their questions. If student have difficulty in finding answers to their question, he should take note and ask teacher during the lesson or request for further readings.
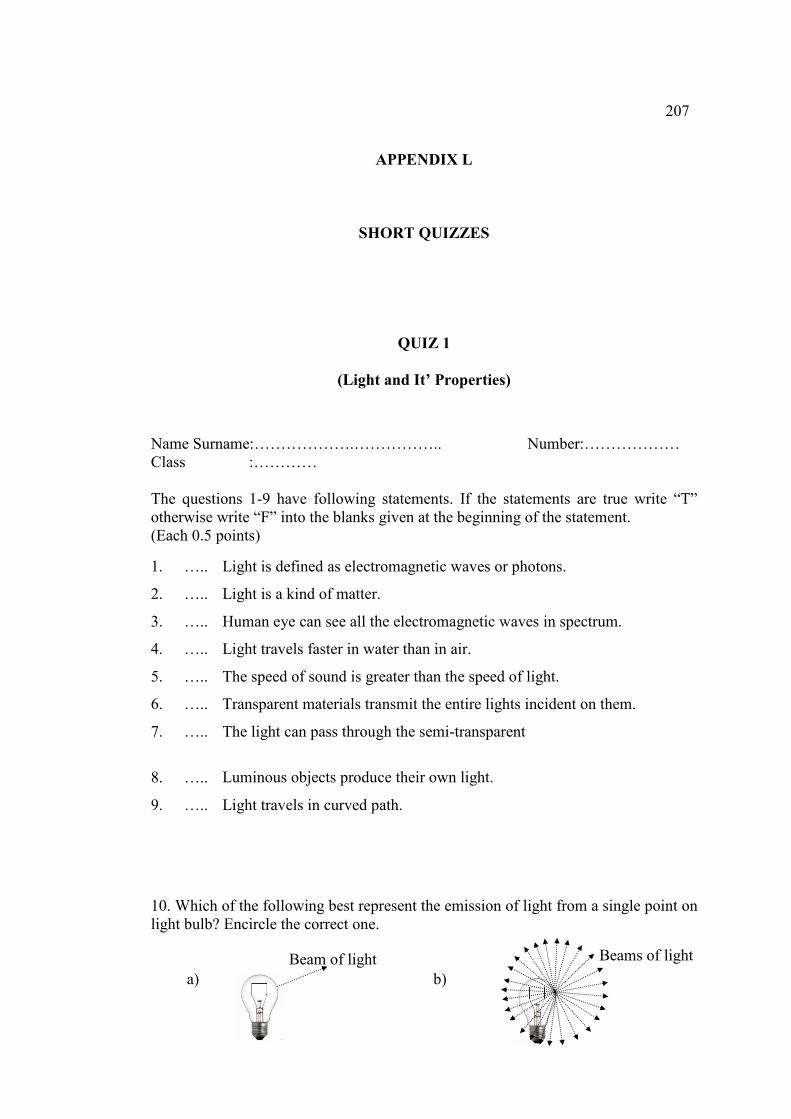
207
APPENDIX L
SHORT QUIZZES
QUIZ 1
(Light and It’ Properties)
Name Surname:……………….…………….. Number:……………… Class :………… The questions 1-9 have following statements. If the statements are true write “T” otherwise write “F” into the blanks given at the beginning of the statement. (Each 0.5 points)
10. Which of the following best represent the emission of light from a single point on light bulb? Encircle the correct one.
a) b)
1. ….. Light is defined as electromagnetic waves or photons.
2. ….. Light is a kind of matter.
3. ….. Human eye can see all the electromagnetic waves in spectrum.
4. ….. Light travels faster in water than in air.
5. ….. The speed of sound is greater than the speed of light.
6. ….. Transparent materials transmit the entire lights incident on them.
7. ….. The light can pass through the semi-transparent
8. ….. Luminous objects produce their own light.
9. ….. Light travels in curved path.
Beam of light Beams of light
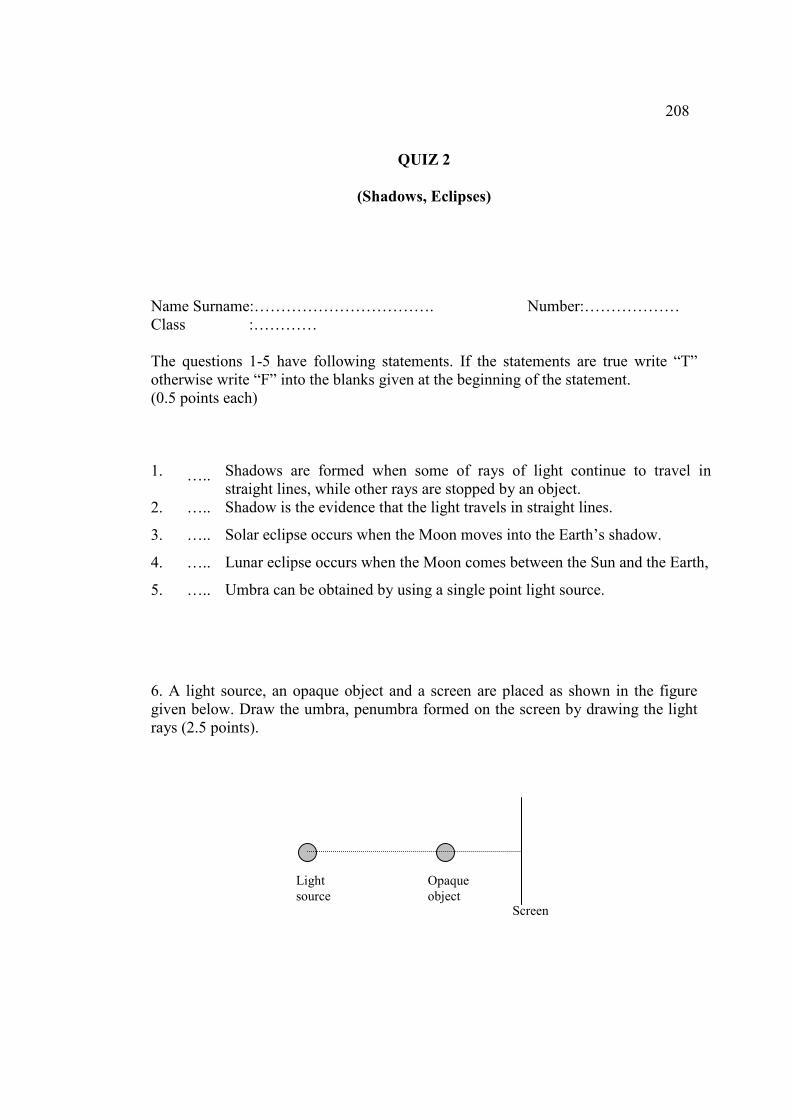
208
QUIZ 2
(Shadows, Eclipses)
Name Surname:……………………………. Number:……………… Class :………… The questions 1-5 have following statements. If the statements are true write “T” otherwise write “F” into the blanks given at the beginning of the statement. (0.5 points each)
6. A light source, an opaque object and a screen are placed as shown in the figure given below. Draw the umbra, penumbra formed on the screen by drawing the light rays (2.5 points).
1. ….. Shadows are formed when some of rays of light continue to travel in straight lines, while other rays are stopped by an object.
2. ….. Shadow is the evidence that the light travels in straight lines.
3. ….. Solar eclipse occurs when the Moon moves into the Earth’s shadow.
4. ….. Lunar eclipse occurs when the Moon comes between the Sun and the Earth,
5. ….. Umbra can be obtained by using a single point light source.
Light source
Opaque object
Screen
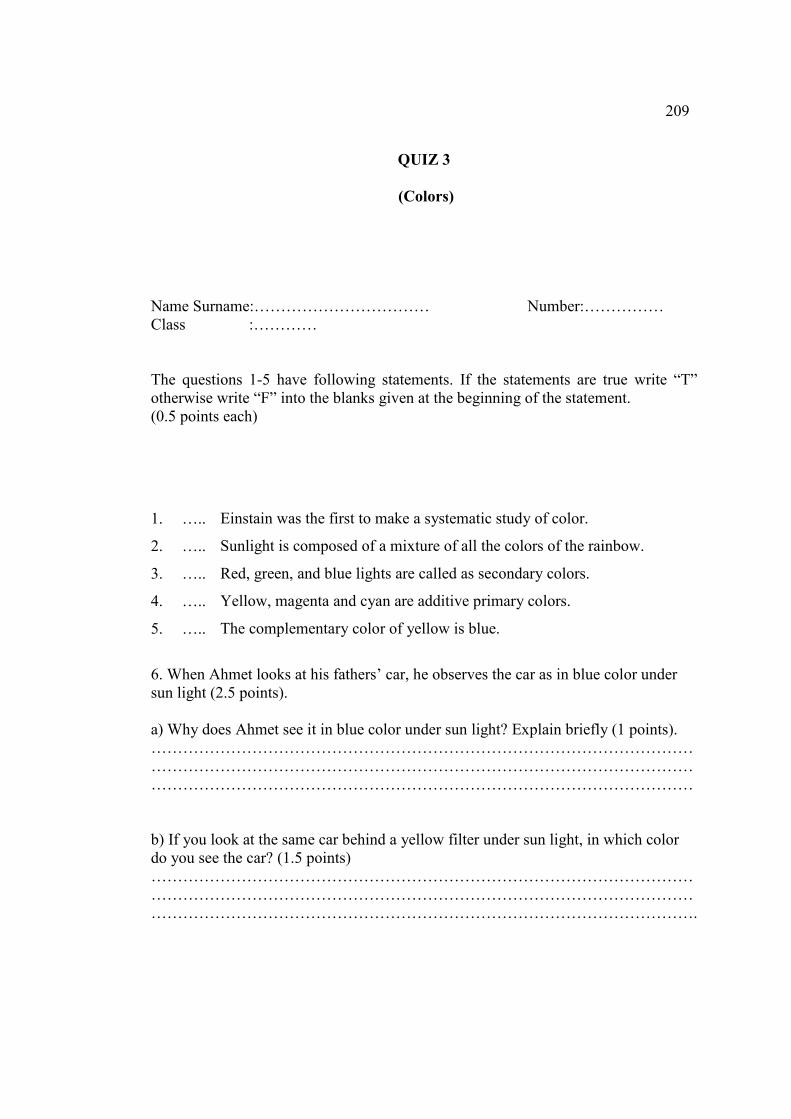
209
QUIZ 3
(Colors)
Name Surname:…………………………… Number:…………… Class :…………
The questions 1-5 have following statements. If the statements are true write “T” otherwise write “F” into the blanks given at the beginning of the statement. (0.5 points each)
6. When Ahmet looks at his fathers’ car, he observes the car as in blue color under sun light (2.5 points). a) Why does Ahmet see it in blue color under sun light? Explain briefly (1 points). ……………………………………………………………………………………………………………………………………………………………………………………………………………………………………………………………………………… b) If you look at the same car behind a yellow filter under sun light, in which color do you see the car? (1.5 points) ……………………………………………………………………………………………………………………………………………………………………………………………………………………………………………………………………………….
1. ….. Einstain was the first to make a systematic study of color.
2. ….. Sunlight is composed of a mixture of all the colors of the rainbow.
3. ….. Red, green, and blue lights are called as secondary colors.
4. ….. Yellow, magenta and cyan are additive primary colors.
5. ….. The complementary color of yellow is blue.
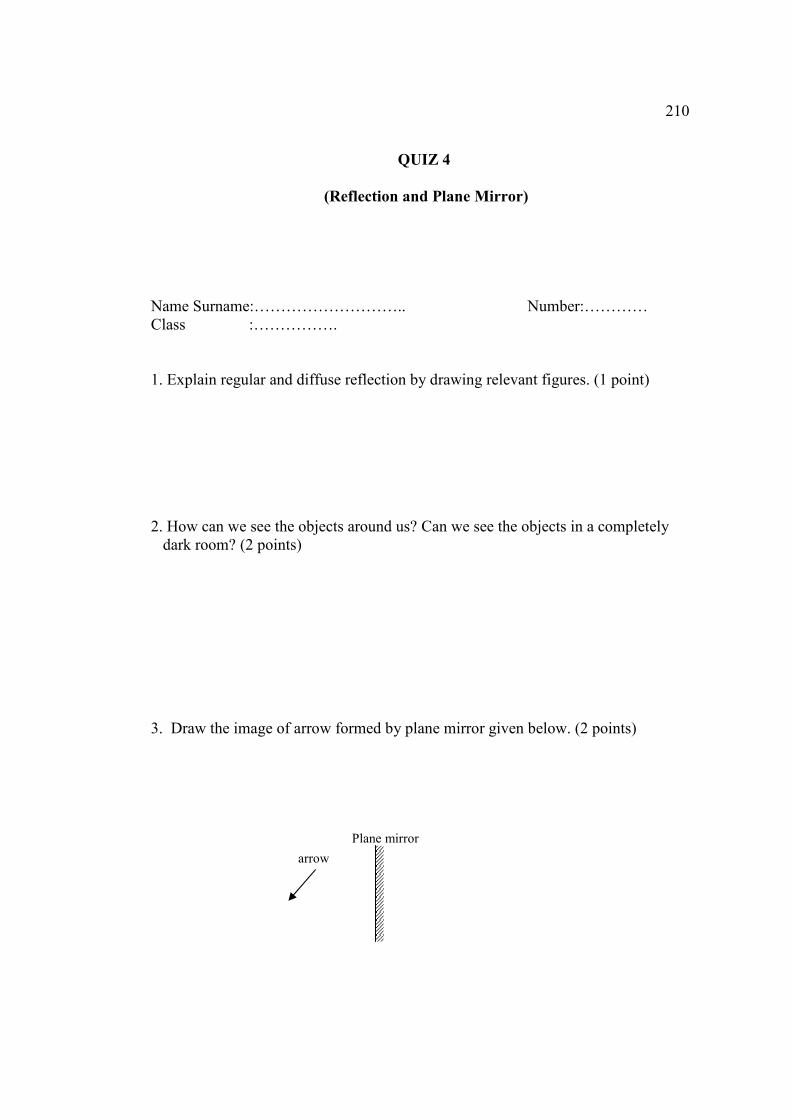
210
QUIZ 4
(Reflection and Plane Mirror)
Name Surname:……………………….. Number:………… Class :…………….
1. Explain regular and diffuse reflection by drawing relevant figures. (1 point) 2. How can we see the objects around us? Can we see the objects in a completely dark room? (2 points) 3. Draw the image of arrow formed by plane mirror given below. (2 points)
arrow
Plane mirror
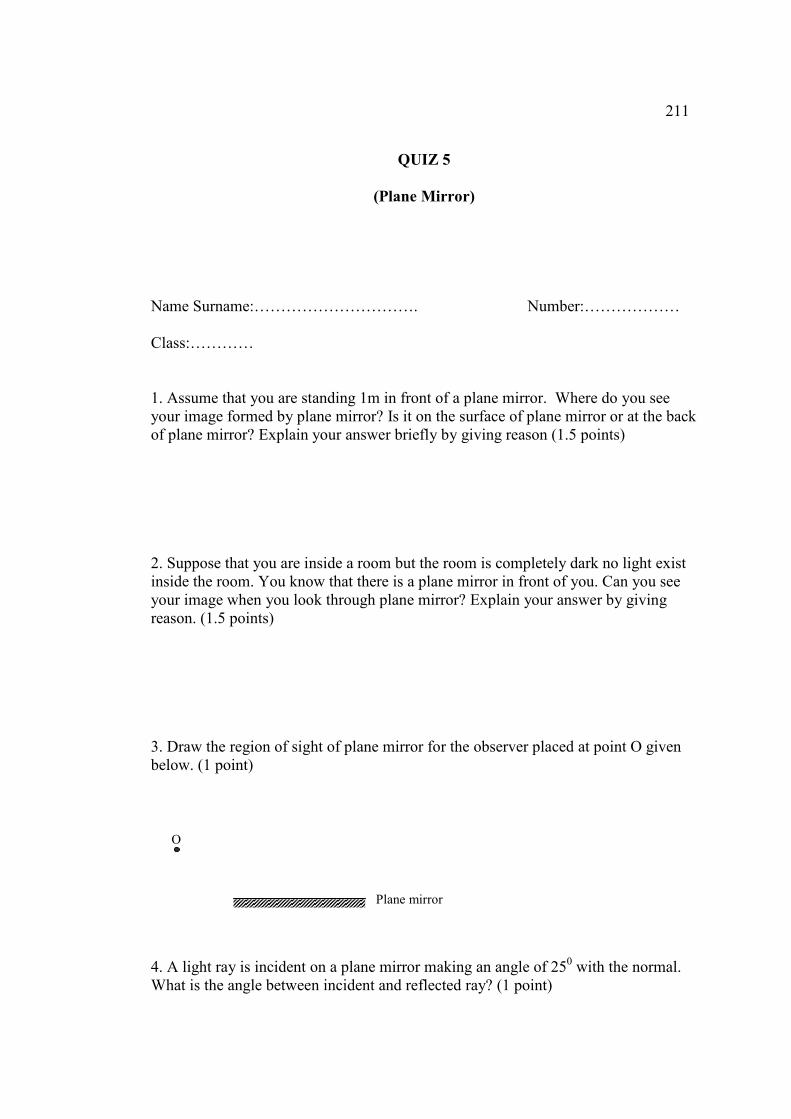
211
QUIZ 5
(Plane Mirror)
Name Surname:…………………………. Number:………………
Class:…………
1. Assume that you are standing 1m in front of a plane mirror. Where do you see your image formed by plane mirror? Is it on the surface of plane mirror or at the back of plane mirror? Explain your answer briefly by giving reason (1.5 points) 2. Suppose that you are inside a room but the room is completely dark no light exist inside the room. You know that there is a plane mirror in front of you. Can you see your image when you look through plane mirror? Explain your answer by giving reason. (1.5 points) 3. Draw the region of sight of plane mirror for the observer placed at point O given below. (1 point)
4. A light ray is incident on a plane mirror making an angle of 250 with the normal. What is the angle between incident and reflected ray? (1 point)
O
Plane mirror
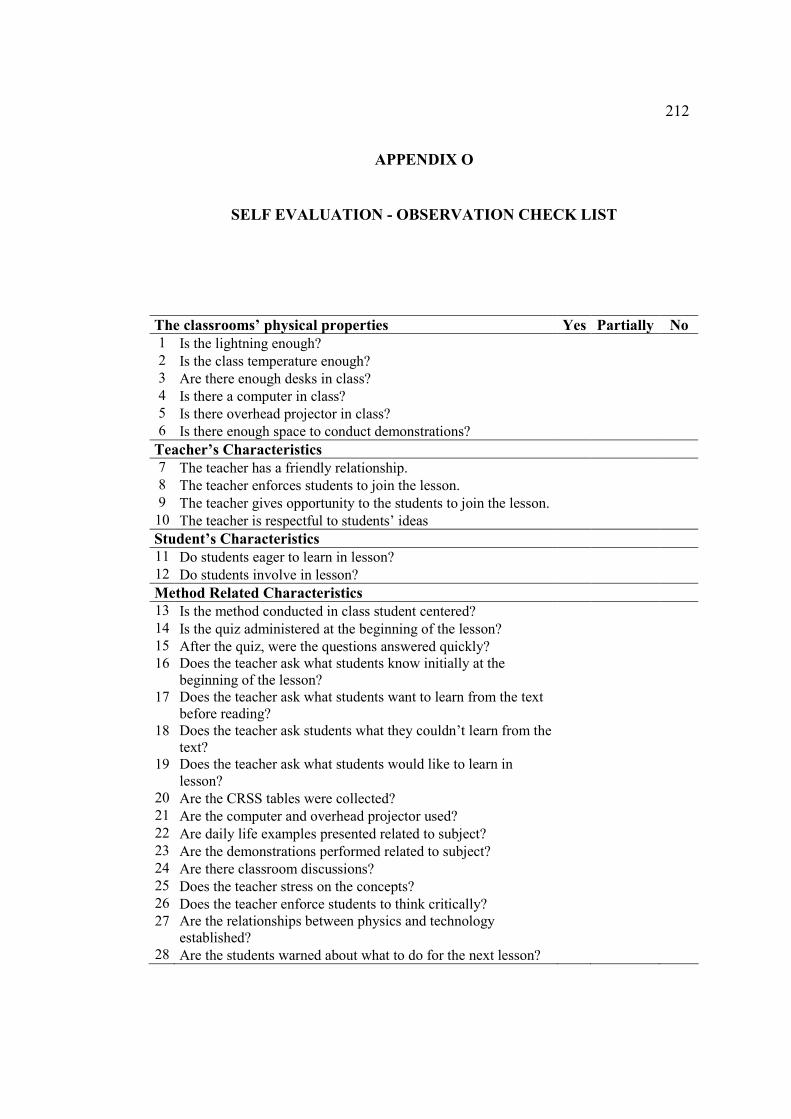
212
APPENDIX O
SELF EVALUATION - OBSERVATION CHECK LIST
The classrooms’ physical properties Yes Partially No 1 Is the lightning enough? 2 Is the class temperature enough? 3 Are there enough desks in class? 4 Is there a computer in class? 5 Is there overhead projector in class? 6 Is there enough space to conduct demonstrations? Teacher’s Characteristics 7 The teacher has a friendly relationship. 8 The teacher enforces students to join the lesson. 9 The teacher gives opportunity to the students to join the lesson. 10 The teacher is respectful to students’ ideas Student’s Characteristics 11 Do students eager to learn in lesson? 12 Do students involve in lesson? Method Related Characteristics 13 Is the method conducted in class student centered? 14 Is the quiz administered at the beginning of the lesson? 15 After the quiz, were the questions answered quickly? 16 Does the teacher ask what students know initially at the
beginning of the lesson? 17 Does the teacher ask what students want to learn from the text
before reading? 18 Does the teacher ask students what they couldn’t learn from the
text? 19 Does the teacher ask what students would like to learn in
lesson? 20 Are the CRSS tables were collected? 21 Are the computer and overhead projector used? 22 Are daily life examples presented related to subject? 23 Are the demonstrations performed related to subject? 24 Are there classroom discussions? 25 Does the teacher stress on the concepts? 26 Does the teacher enforce students to think critically? 27 Are the relationships between physics and technology
established? 28 Are the students warned about what to do for the next lesson?
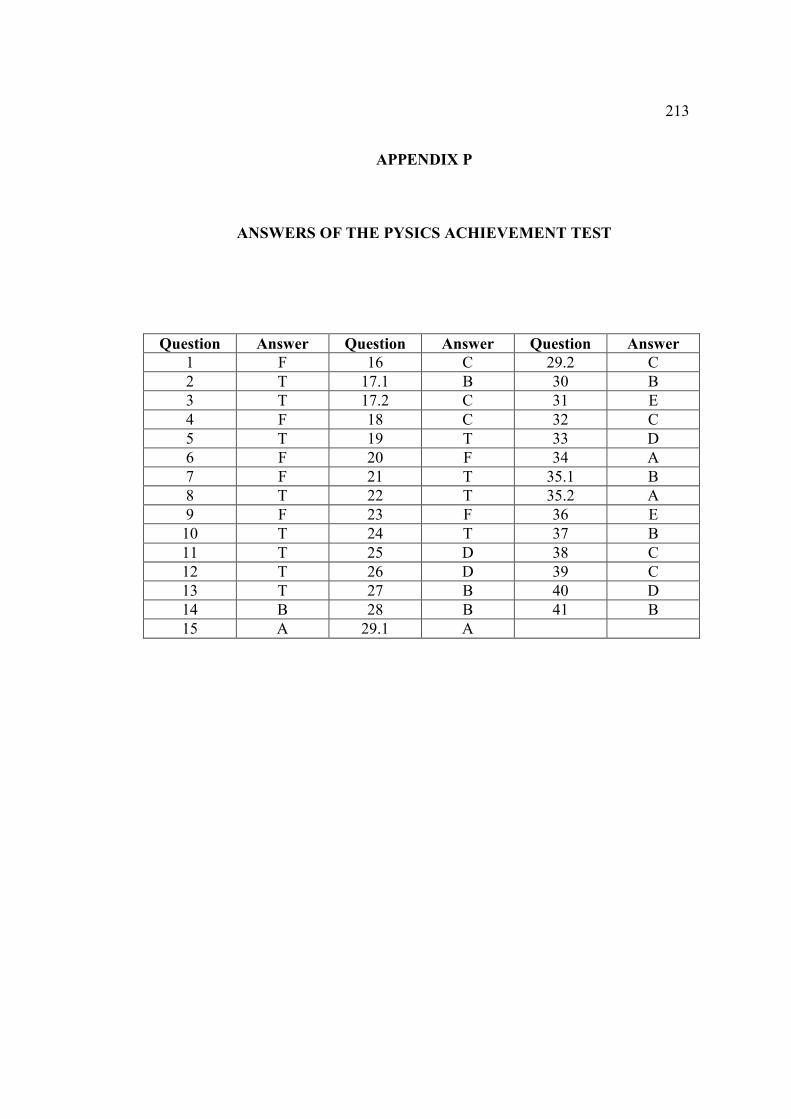
213
APPENDIX P
ANSWERS OF THE PYSICS ACHIEVEMENT TEST
Question Answer Question Answer Question Answer 1 F 16 C 29.2 C 2 T 17.1 B 30 B 3 T 17.2 C 31 E 4 F 18 C 32 C 5 T 19 T 33 D 6 F 20 F 34 A 7 F 21 T 35.1 B 8 T 22 T 35.2 A 9 F 23 F 36 E 10 T 24 T 37 B 11 T 25 D 38 C 12 T 26 D 39 C 13 T 27 B 40 D 14 B 28 B 41 B 15 A 29.1 A
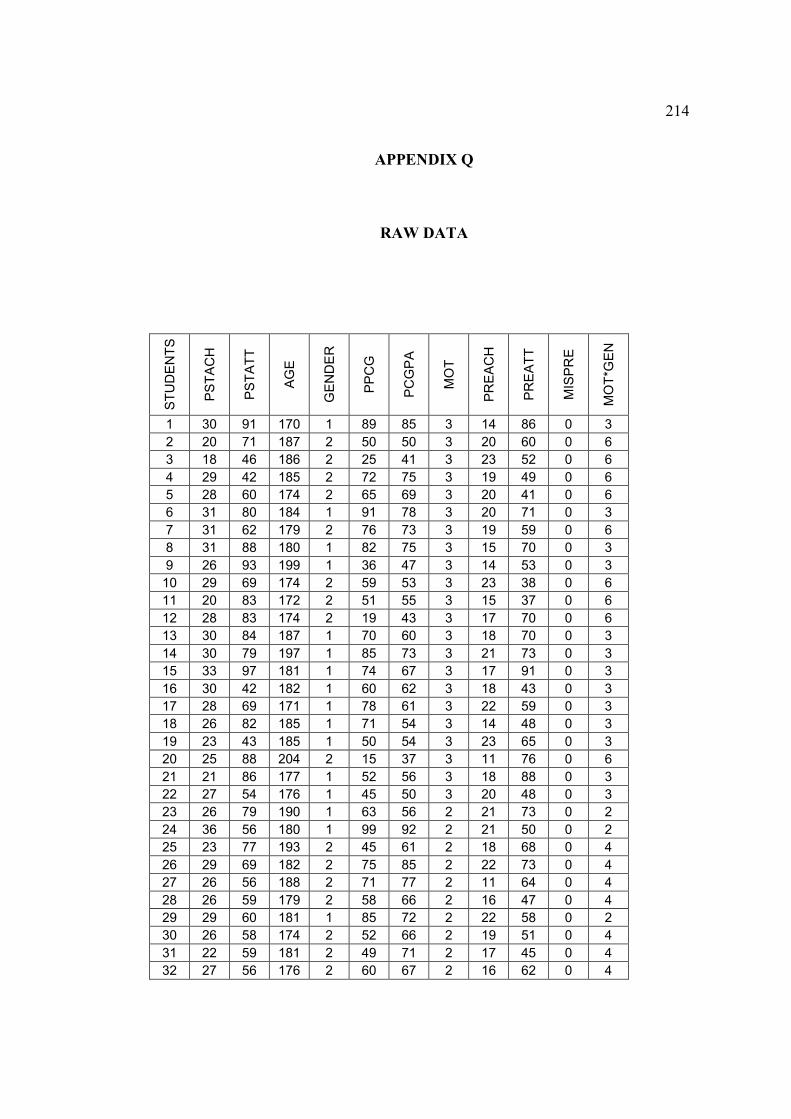
214
APPENDIX Q
RAW DATA
STUDENTS
PSTACH
PSTATT
AGE
GENDER
PPCG
PCGPA
MOT
PREACH
PREATT
MISPRE
MOT*G
EN
1 30 91 170 1 89 85 3 14 86 0 3
2 20 71 187 2 50 50 3 20 60 0 6
3 18 46 186 2 25 41 3 23 52 0 6
4 29 42 185 2 72 75 3 19 49 0 6
5 28 60 174 2 65 69 3 20 41 0 6
6 31 80 184 1 91 78 3 20 71 0 3
7 31 62 179 2 76 73 3 19 59 0 6
8 31 88 180 1 82 75 3 15 70 0 3
9 26 93 199 1 36 47 3 14 53 0 3
10 29 69 174 2 59 53 3 23 38 0 6
11 20 83 172 2 51 55 3 15 37 0 6
12 28 83 174 2 19 43 3 17 70 0 6
13 30 84 187 1 70 60 3 18 70 0 3
14 30 79 197 1 85 73 3 21 73 0 3
15 33 97 181 1 74 67 3 17 91 0 3
16 30 42 182 1 60 62 3 18 43 0 3
17 28 69 171 1 78 61 3 22 59 0 3
18 26 82 185 1 71 54 3 14 48 0 3
19 23 43 185 1 50 54 3 23 65 0 3
20 25 88 204 2 15 37 3 11 76 0 6
21 21 86 177 1 52 56 3 18 88 0 3
22 27 54 176 1 45 50 3 20 48 0 3
23 26 79 190 1 63 56 2 21 73 0 2
24 36 56 180 1 99 92 2 21 50 0 2
25 23 77 193 2 45 61 2 18 68 0 4
26 29 69 182 2 75 85 2 22 73 0 4
27 26 56 188 2 71 77 2 11 64 0 4
28 26 59 179 2 58 66 2 16 47 0 4
29 29 60 181 1 85 72 2 22 58 0 2
30 26 58 174 2 52 66 2 19 51 0 4
31 22 59 181 2 49 71 2 17 45 0 4
32 27 56 176 2 60 67 2 16 62 0 4
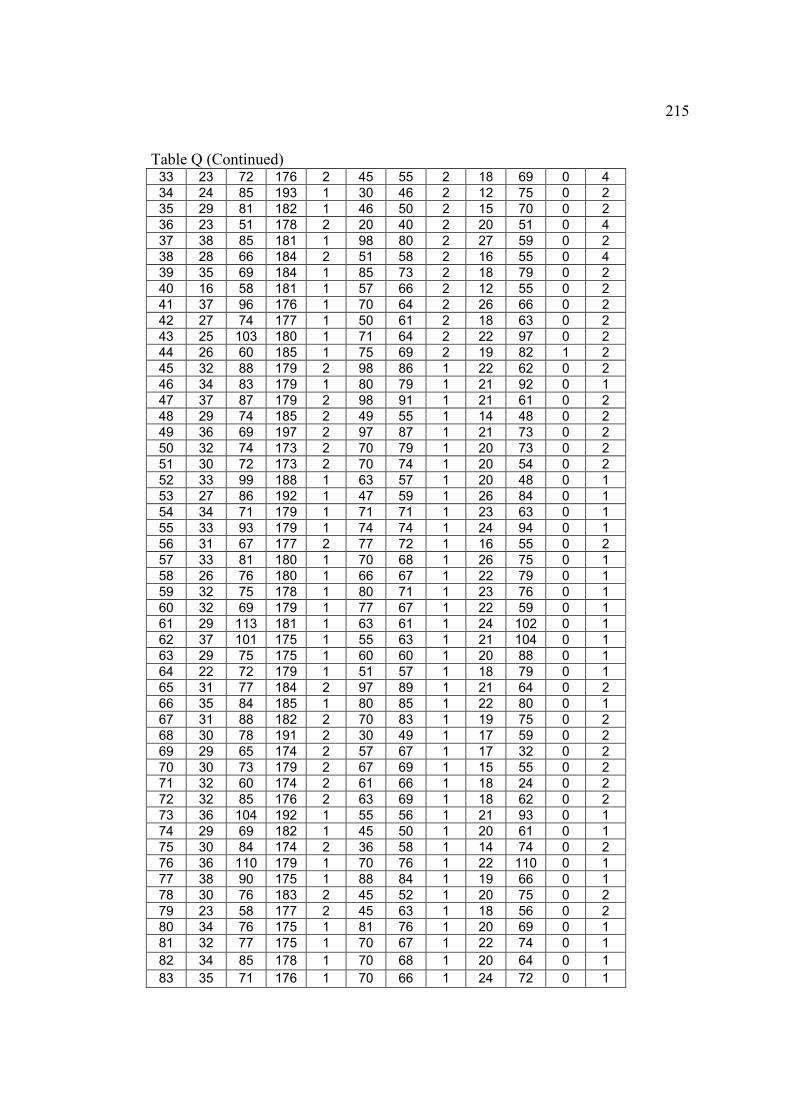
215
Table Q (Continued) 33 23 72 176 2 45 55 2 18 69 0 4
34 24 85 193 1 30 46 2 12 75 0 2
35 29 81 182 1 46 50 2 15 70 0 2
36 23 51 178 2 20 40 2 20 51 0 4
37 38 85 181 1 98 80 2 27 59 0 2
38 28 66 184 2 51 58 2 16 55 0 4
39 35 69 184 1 85 73 2 18 79 0 2
40 16 58 181 1 57 66 2 12 55 0 2
41 37 96 176 1 70 64 2 26 66 0 2
42 27 74 177 1 50 61 2 18 63 0 2
43 25 103 180 1 71 64 2 22 97 0 2
44 26 60 185 1 75 69 2 19 82 1 2
45 32 88 179 2 98 86 1 22 62 0 2
46 34 83 179 1 80 79 1 21 92 0 1
47 37 87 179 2 98 91 1 21 61 0 2
48 29 74 185 2 49 55 1 14 48 0 2
49 36 69 197 2 97 87 1 21 73 0 2
50 32 74 173 2 70 79 1 20 73 0 2
51 30 72 173 2 70 74 1 20 54 0 2
52 33 99 188 1 63 57 1 20 48 0 1
53 27 86 192 1 47 59 1 26 84 0 1
54 34 71 179 1 71 71 1 23 63 0 1
55 33 93 179 1 74 74 1 24 94 0 1
56 31 67 177 2 77 72 1 16 55 0 2
57 33 81 180 1 70 68 1 26 75 0 1
58 26 76 180 1 66 67 1 22 79 0 1
59 32 75 178 1 80 71 1 23 76 0 1
60 32 69 179 1 77 67 1 22 59 0 1
61 29 113 181 1 63 61 1 24 102 0 1
62 37 101 175 1 55 63 1 21 104 0 1
63 29 75 175 1 60 60 1 20 88 0 1
64 22 72 179 1 51 57 1 18 79 0 1
65 31 77 184 2 97 89 1 21 64 0 2
66 35 84 185 1 80 85 1 22 80 0 1
67 31 88 182 2 70 83 1 19 75 0 2
68 30 78 191 2 30 49 1 17 59 0 2
69 29 65 174 2 57 67 1 17 32 0 2
70 30 73 179 2 67 69 1 15 55 0 2
71 32 60 174 2 61 66 1 18 24 0 2
72 32 85 176 2 63 69 1 18 62 0 2
73 36 104 192 1 55 56 1 21 93 0 1
74 29 69 182 1 45 50 1 20 61 0 1
75 30 84 174 2 36 58 1 14 74 0 2
76 36 110 179 1 70 76 1 22 110 0 1
77 38 90 175 1 88 84 1 19 66 0 1
78 30 76 183 2 45 52 1 20 75 0 2
79 23 58 177 2 45 63 1 18 56 0 2
80 34 76 175 1 81 76 1 20 69 0 1
81 32 77 175 1 70 67 1 22 74 0 1
82 34 85 178 1 70 68 1 20 64 0 1
83 35 71 176 1 70 66 1 24 72 0 1
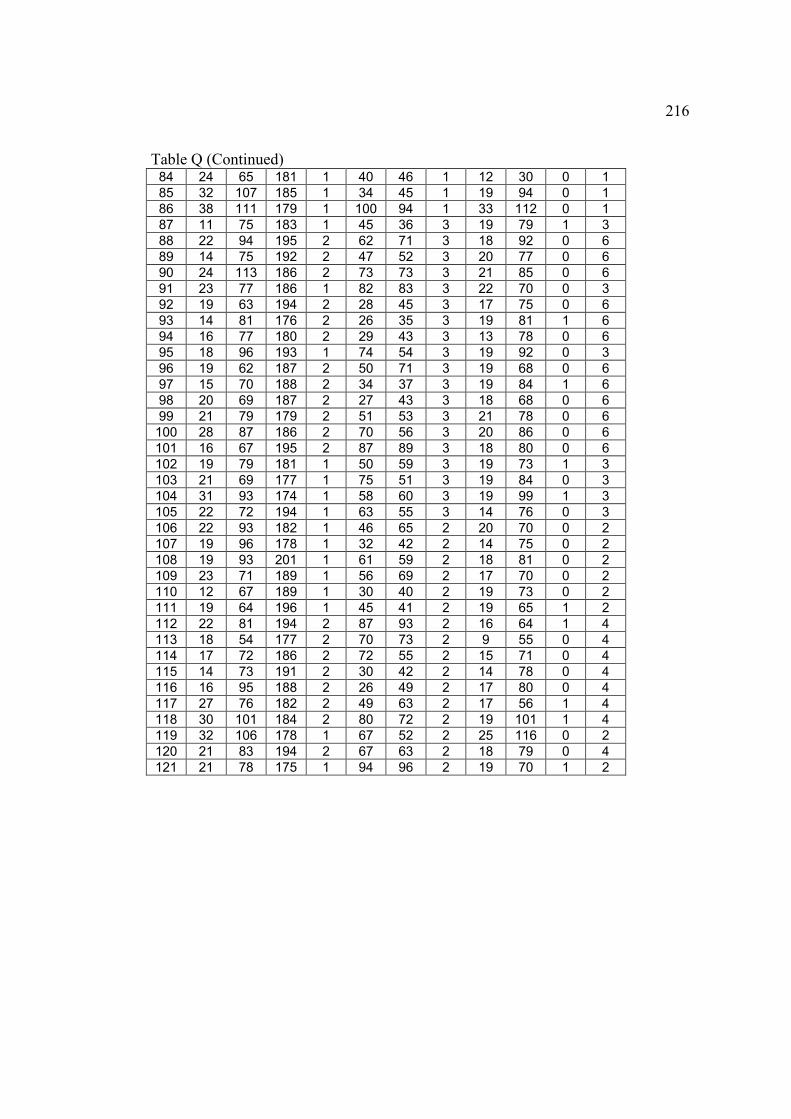
216
Table Q (Continued) 84 24 65 181 1 40 46 1 12 30 0 1
85 32 107 185 1 34 45 1 19 94 0 1
86 38 111 179 1 100 94 1 33 112 0 1
87 11 75 183 1 45 36 3 19 79 1 3
88 22 94 195 2 62 71 3 18 92 0 6
89 14 75 192 2 47 52 3 20 77 0 6
90 24 113 186 2 73 73 3 21 85 0 6
91 23 77 186 1 82 83 3 22 70 0 3
92 19 63 194 2 28 45 3 17 75 0 6
93 14 81 176 2 26 35 3 19 81 1 6
94 16 77 180 2 29 43 3 13 78 0 6
95 18 96 193 1 74 54 3 19 92 0 3
96 19 62 187 2 50 71 3 19 68 0 6
97 15 70 188 2 34 37 3 19 84 1 6
98 20 69 187 2 27 43 3 18 68 0 6
99 21 79 179 2 51 53 3 21 78 0 6
100 28 87 186 2 70 56 3 20 86 0 6
101 16 67 195 2 87 89 3 18 80 0 6
102 19 79 181 1 50 59 3 19 73 1 3
103 21 69 177 1 75 51 3 19 84 0 3
104 31 93 174 1 58 60 3 19 99 1 3
105 22 72 194 1 63 55 3 14 76 0 3
106 22 93 182 1 46 65 2 20 70 0 2
107 19 96 178 1 32 42 2 14 75 0 2
108 19 93 201 1 61 59 2 18 81 0 2
109 23 71 189 1 56 69 2 17 70 0 2
110 12 67 189 1 30 40 2 19 73 0 2
111 19 64 196 1 45 41 2 19 65 1 2
112 22 81 194 2 87 93 2 16 64 1 4
113 18 54 177 2 70 73 2 9 55 0 4
114 17 72 186 2 72 55 2 15 71 0 4
115 14 73 191 2 30 42 2 14 78 0 4
116 16 95 188 2 26 49 2 17 80 0 4
117 27 76 182 2 49 63 2 17 56 1 4
118 30 101 184 2 80 72 2 19 101 1 4
119 32 106 178 1 67 52 2 25 116 0 2
120 21 83 194 2 67 63 2 18 79 0 4
121 21 78 175 1 94 96 2 19 70 1 2
217
VITA
Surname, Name : TAŞLIDERE, Erdal
Nationality : Turkish (T.C)
Date and Place of Birth : 20.01.1976, Isparta
email : [email protected]
Education : SSME, Master of science, 2002, METU, Ankara
Physics Education, Undergraduate, 1999, METU,
Ankara
Science, High School, 1993, Gönen Anatolian Teacher
High School, Isparta
Work Experience : Physics Teacher, September 1999 -, METU
Development Foundation Private High School, Ankara
Foreign Language : Advanced English
Top Related
Copyright © 2022 FDOKUMEN

