


Bahasa
Halaman
Hukum


The Effects of Brain Injury and Talker Characteristics on Speech Processing in a Single-Talker Interference Task
A DISSERTATION SUBMITTED TO THE FACULTY OF THE GRADUATE SCHOOL
OF THE UNIVERSITY OF MINNESOTA BY
Miriam Ottilie Krause
IN PARTIAL FULFILLMENT OF THE REQUIREMENTS FOR THE DEGREE OF
DOCTOR OF PHILOSOPHY
Mary R.T. Kennedy
July 2011

© Miriam O. Krause 2011

i
Acknowledgements
I owe immeasurable thanks to my advisor, Mary Kennedy, for shepherding me
through the past eight years with patience, wisdom, and an admirable sense of humor.
Thanks also to my committee – Chad Marsolek, Ben Munson, and Peggy Nelson
– each of whom were unfailingly generous with their help, support, and flexibility
throughout this process.
I could not have completed this dissertation without the technical assistance and
expert advice of Edward Carney, Sarah Angerman, and Paula Chesley.
Thank you to my labmates Katy O’Brien, Jocelyn Yu, Mike Peterson, Shelley
Johnson, Daniel DeLapp, Olivia Matthys, Krystle Baumgarten, Pradeep Ramanathan, and
Hsin-Huei Chiou. Each of them made crucial contributions to this project, from recruiting
and testing participants to checking reliability to sharing their own dissertations.
Thank you to Sarah Angerman (again), Jay Sasisekaran, Laura Crocker, and Yu-
Wen Chen for taking the time to help me create my experimental stimuli.
I'm also very grateful to my extensive support system, including many of those
already mentioned, as well as my parents and my dissertation group (Susan Park
Anderson, Bess Borchert, Alvina Kittur, and Katrina Schleisman). Thank you all for
lending your ears, commiserating, and helping me keep things in perspective.
Finally, I want to express my profound thanks to my research participants. I am
particularly grateful to those people with brain injury who generously dedicate time,
energy, and effort to projects like this one that do not help them personally, just because
the work may someday indirectly benefit others who experience TBI.

ii
Dedication
This dissertation is dedicated to Rabbi Yosi Gordon, to add to his collection.
iii
Abstract
People who have experienced traumatic brain injury (TBI) often report increased
difficulty processing speech than they experienced before their injuries; and this
difficulty is not always accompanied by impaired performance on standardized tests of
language, auditory processing, or other cognitive factors. Unfortunately, there is a paucity
of research directly addressing this issue. Prior studies have mostly focused on measures
of characteristics such as attention (e.g. Schmitter-Edgecombe & Nissley, 2000), dichotic
listening (e.g. Meyers, Roberts, Bayless, Volkert, & Evitts, 2002), and masking release
(e.g. Krause, Nelson, & Kennedy, 2009) in people with TBI. All of these factors may
play their part in functional listening tasks, but separately they cannot capture the
complex task of speech processing (e.g. Wilson 2003). The goal of this dissertation is to
build on existing work to explore and compare the issue of speech processing after brain
injury across several levels: sentence repetition with single-talker interference, using
targets spoken by native- and non-native-accented speakers of English; standardized
testing of cognition and auditory processing; and semi-structured interviews about
participants’ subjective experiences with complex speech processing.
This study comprised two experiments. The purpose of Experiment 1 was to
demonstrate the effects of simulated peripheral hearing loss on performance on the
sentence repetition task. Participants in Experiment 1 were 30 healthy young adults, 15 of
whom completed the sentence repetition task with stimuli that were filtered with a 1400
Hz low-pass filter to simulate peripheral hearing loss. The other 15 participants
completed the task with unfiltered stimuli. The purpose of Experiment 2 was to compare
iv
adults with and without TBI on the (unfiltered) sentence repetition task, and included 13
people in each participant group. Groups were matched for age, education, and estimated
verbal IQ within each experiment. Dependent variables for the sentence repetition task
were accuracy and subjective effort. Participants in Experiment 2 also completed a
battery of standardized tests and a semi-structured interview about their subjective
experiences with speech processing.
Results of Experiment 1 showed that the filtered group was less accurate and
reported greater effort than the unfiltered group, and the filtered group showed greater
effects of speaker accent. Results of Experiment 2 demonstrated that the TBI group had
poorer accuracy than controls, but not significantly higher effort. As predicted, the TBI
group also reported more subjective difficulty with complex speech processing than
healthy controls, but there was no direct correlation between interview reports and
accuracy on the sentence repetition task. Comparisons between the TBI group of
Experiment 2 and the filtered group of Experiment 1 suggest that, although the TBI group
did show impaired performance on the speech processing task, their performance was not
consistent with the peripheral auditory effects that were modeled in Experiment 1. This
suggests that the speech processing difficulty experienced by people with TBI cannot be
explained by bottom-up processing (e.g. energetic masking) alone.
Further research is needed in order to better understand the nature of speech
processing problems after TBI, the ultimate goal of which is to be able to develop
therapies and strategies that will allow people with TBI to communicate successfully
even in difficult circumstances.

v
Table of Contents
Abstract . . . . . . . . . . . . . . . . . . . . . . . . . . . . . . . . . . . . . . . . . . . . . . . . . . . . . . . . . . . . . . iii
Table of Contents . . . . . . . . . . . . . . . . . . . . . . . . . . . . . . . . . . . . . . . . . . . . . . . . . . . . . . . v
List of Tables . . . . . . . . . . . . . . . . . . . . . . . . . . . . . . . . . . . . . . . . . . . . . . . . . . . . . . . . . . ix
List of Figures . . . . . . . . . . . . . . . . . . . . . . . . . . . . . . . . . . . . . . . . . . . . . . . . . . . . . . . . . . xi
Introduction . . . . . . . . . . . . . . . . . . . . . . . . . . . . . . . . . . . . . . . . . . . . . . . . . . . . . . . . . . . . 1
Project overview . . . . . . . . . . . . . . . . . . . . . . . . . . . . . . . . . . . . . . . . . . . . . . . . . . 1
Background . . . . . . . . . . . . . . . . . . . . . . . . . . . . . . . . . . . . . . . . . . . . . . . . . . . . . . . . . . . . 3
Traumatic Brain Injury and Speech Processing . . . . . . . . . . . . . . . . . . . . . . . . . . . 4
Central Auditory Processing . . . . . . . . . . . . . . . . . . . . . . . . . . . . . . . . . . . . . . . . . 5
Energetic and informational masking . . . . . . . . . . . . . . . . . . . . . . . . . . . . 7
Dichotic listening . . . . . . . . . . . . . . . . . . . . . . . . . . . . . . . . . . . . . . . . . . . 14
Processing Speed . . . . . . . . . . . . . . . . . . . . . . . . . . . . . . . . . . . . . . . . . . . . . . . . . 16
Effort . . . . . . . . . . . . . . . . . . . . . . . . . . . . . . . . . . . . . . . . . . . . . . . . . . . . . . . . . . 19
Attention . . . . . . . . . . . . . . . . . . . . . . . . . . . . . . . . . . . . . . . . . . . . . . . . . . . . . . . 22
Non-Native Accented Speech . . . . . . . . . . . . . . . . . . . . . . . . . . . . . . . . . . . . . . . 29
Why Mixed Methods? . . . . . . . . . . . . . . . . . . . . . . . . . . . . . . . . . . . . . . . . . . . . 35
Research Questions and Hypotheses . . . . . . . . . . . . . . . . . . . . . . . . . . . . . . . . . 37
Experiment 1: Filtered vs. unfiltered speech (healthy controls only) . . . 39
Experiment 2: TBI vs. healthy controls (unfiltered speech only) . . . . . . 40
Methods . . . . . . . . . . . . . . . . . . . . . . . . . . . . . . . . . . . . . . . . . . . . . . . . . . . . . . . . . . . . . . 44
Overview . . . . . . . . . . . . . . . . . . . . . . . . . . . . . . . . . . . . . . . . . . . . . . . . . . . . . . . 44
vi
General Procedures . . . . . . . . . . . . . . . . . . . . . . . . . . . . . . . . . . . . . . . . . . . . . . . 44
Recruitment . . . . . . . . . . . . . . . . . . . . . . . . . . . . . . . . . . . . . . . . . . . . . . . 45
Participants . . . . . . . . . . . . . . . . . . . . . . . . . . . . . . . . . . . . . . . . . . . . . . . . . . . . . 47
Standardized Testing . . . . . . . . . . . . . . . . . . . . . . . . . . . . . . . . . . . . . . . . . . . . . . 49
Tests of cognition and communication . . . . . . . . . . . . . . . . . . . . . . . . . . 50
Tests of auditory processing . . . . . . . . . . . . . . . . . . . . . . . . . . . . . . . . . . 53
Procedural Overview . . . . . . . . . . . . . . . . . . . . . . . . . . . . . . . . . . . . . . . . . . . . . . 56
Stimuli . . . . . . . . . . . . . . . . . . . . . . . . . . . . . . . . . . . . . . . . . . . . . . . . . . . . . . . . . 58
Recording . . . . . . . . . . . . . . . . . . . . . . . . . . . . . . . . . . . . . . . . . . . . . . . . . 58
Stimulus selection . . . . . . . . . . . . . . . . . . . . . . . . . . . . . . . . . . . . . . . . . . 59
Editing . . . . . . . . . . . . . . . . . . . . . . . . . . . . . . . . . . . . . . . . . . . . . . . . . . . 61
Sentence Repetition Task Procedure . . . . . . . . . . . . . . . . . . . . . . . . . . . . . . . . . . 63
Presentation of stimuli . . . . . . . . . . . . . . . . . . . . . . . . . . . . . . . . . . . . . . . 64
Semi-Structured Interviews . . . . . . . . . . . . . . . . . . . . . . . . . . . . . . . . . . . . . . . . . 66
Analyses . . . . . . . . . . . . . . . . . . . . . . . . . . . . . . . . . . . . . . . . . . . . . . . . . . . . . . . . 67
Statistical analysis . . . . . . . . . . . . . . . . . . . . . . . . . . . . . . . . . . . . . . . . . . 67
Reliability . . . . . . . . . . . . . . . . . . . . . . . . . . . . . . . . . . . . . . . . . . . . . . . . . . . . . . . 68
Results . . . . . . . . . . . . . . . . . . . . . . . . . . . . . . . . . . . . . . . . . . . . . . . . . . . . . . . . . . . . . . . 70
Experiment 1 . . . . . . . . . . . . . . . . . . . . . . . . . . . . . . . . . . . . . . . . . . . . . . . . . . . . 70
Experiment 2 . . . . . . . . . . . . . . . . . . . . . . . . . . . . . . . . . . . . . . . . . . . . . . . . . . . . 75
Sentence repetition task . . . . . . . . . . . . . . . . . . . . . . . . . . . . . . . . . . . . . 76
Accommodation . . . . . . . . . . . . . . . . . . . . . . . . . . . . . . . . . . . . . . . . . . . 81
vii
Standardized test measures and repetition accuracy . . . . . . . . . . . . . . . . 82
Semi-structured interviews . . . . . . . . . . . . . . . . . . . . . . . . . . . . . . . . . . . 86
Experiment 1 and Experiment 2 . . . . . . . . . . . . . . . . . . . . . . . . . . . . . . . . . . . . . 90
Discussion . . . . . . . . . . . . . . . . . . . . . . . . . . . . . . . . . . . . . . . . . . . . . . . . . . . . . . . . . . . . 93
Experiment 1 . . . . . . . . . . . . . . . . . . . . . . . . . . . . . . . . . . . . . . . . . . . . . . . . . . . 94
Experiment 2 . . . . . . . . . . . . . . . . . . . . . . . . . . . . . . . . . . . . . . . . . . . . . . . . . . . 98
Sentence repetition task . . . . . . . . . . . . . . . . . . . . . . . . . . . . . . . . . . . . . 99
Standardized test measures and repetition accuracy . . . . . . . . . . . . . . . 104
Semi-structured interviews . . . . . . . . . . . . . . . . . . . . . . . . . . . . . . . . . . 107
TBI versus filtered results . . . . . . . . . . . . . . . . . . . . . . . . . . . . . . . . . . . 110
Limitations . . . . . . . . . . . . . . . . . . . . . . . . . . . . . . . . . . . . . . . . . . . . . . . . . . . . . 112
Future Directions . . . . . . . . . . . . . . . . . . . . . . . . . . . . . . . . . . . . . . . . . . . . . . . . 114
Conclusions . . . . . . . . . . . . . . . . . . . . . . . . . . . . . . . . . . . . . . . . . . . . . . . . . . . . 119
Tables . . . . . . . . . . . . . . . . . . . . . . . . . . . . . . . . . . . . . . . . . . . . . . . . . . . . . . . . . . . . . . . 121
Figures . . . . . . . . . . . . . . . . . . . . . . . . . . . . . . . . . . . . . . . . . . . . . . . . . . . . . . . . . . . . . . 148
References . . . . . . . . . . . . . . . . . . . . . . . . . . . . . . . . . . . . . . . . . . . . . . . . . . . . . . . . . . . 161
Appendices . . . . . . . . . . . . . . . . . . . . . . . . . . . . . . . . . . . . . . . . . . . . . . . . . . . . . . . . . . . 180
Appendix 1: Preliminary Screening Form . . . . . . . . . . . . . . . . . . . . . . . . . . . . . 180
Appendix 2: Standardized Test Scores . . . . . . . . . . . . . . . . . . . . . . . . . . . . . . . 184
Appendix 3: Sentence Repetition Task Stimuli . . . . . . . . . . . . . . . . . . . . . . . . . 188
Appendix 4: Effort Follow-Up . . . . . . . . . . . . . . . . . . . . . . . . . . . . . . . . . . . . . . 203
Appendix 5: Semi-Structured Interview Questions . . . . . . . . . . . . . . . . . . . . . . 204
viii
Appendix 6: Linear Mixed-Effects Model Output . . . . . . . . . . . . . . . . . . . . . . . 205
Appendix 7: Thematic Coding and Example Quotes from Interviews . . . . . . . 206
ix
List of Tables
Table 1. Explanations of Different Types of Masking . . . . . . . . . . . . . . . . . . . . . . . . . 121
Table 2. Healthy Control Participants, Stimulus Conditions, and Experiment(s) Using
Data . . . . . . . . . . . . . . . . . . . . . . . . . . . . . . . . . . . . . . . . . . . . . . . . . . . . . . . . . . 122
Table 3. Experiment 1 Participant Demographics (Healthy Adults Without TBI) . . . . 124
Table 4. Experiment 2 Participant Demographics (Adults With and Without TBI) . . . 125
Table 5. TBI Participant Injury Information . . . . . . . . . . . . . . . . . . . . . . . . . . . . . . . . . 126
Table 6. Summary List of Standardized Tests Administered in Experiment 2 . . . . . . . 127
Table 7. Mean Performance on Standardized Tests of Cognition for Participants in
Experiment 2 . . . . . . . . . . . . . . . . . . . . . . . . . . . . . . . . . . . . . . . . . . . . . . . . . . . 128
Table 8. Sequence of Presentation for Experimental Blocks in Sentence-Repetition Task .
. . . . . . . . . . . . . . . . . . . . . . . . . . . . . . . . . . . . . . . . . . . . . . . . . . . . . . . . . . . . . . . 129
Table 9. Mean Proportion Correct by Group and Target Speaker for Experiment 1 . . . 129
Table 10. Statistics Table for Experiment 1 Accuracy . . . . . . . . . . . . . . . . . . . . . . . . . 130
Table 11. Mean Effort Ratings by Group and Target Speaker for Experiment 1 . . . . . 131
Table 12. Statistics Table for Experiment 1 Effort . . . . . . . . . . . . . . . . . . . . . . . . . . . . 132
Table 13. Mean Accuracies by Group and Target Speaker for Experiment 2 . . . . . . . . 133
Table 14. Statistics Table for Experiment 2 Accuracy . . . . . . . . . . . . . . . . . . . . . . . . . 134
Table 15. Mean Effort (on a 0-to-10 scale) by Group,Target Speaker, and Condition for
Experiment 2 . . . . . . . . . . . . . . . . . . . . . . . . . . . . . . . . . . . . . . . . . . . . . . . . . . .135
Table 16. Statistics Table for Experiment 2 Effort . . . . . . . . . . . . . . . . . . . . . . . . . . . . 136
x
Table 17. Target-Interfering Repetition Differences in Experiment 2, Reported in
Proportions . . . . . . . . . . . . . . . . . . . . . . . . . . . . . . . . . . . . . . . . . . . . . . . . . . . . . 137
Table 18. Statistics Table for Experiment 2: Differences Between Target and Interfering
Word Repetitions . . . . . . . . . . . . . . . . . . . . . . . . . . . . . . . . . . . . . . . . . . . . . . . . 138
Table 19. Test Scores for Assessments of Central Auditory Processing . . . . . . . . . . . . 139
Table 20. Correlation Matrix: Pearson Correlations Among Cognitive Test Scores and
Sentence Repetition Accuracies for the TBI Group . . . . . . . . . . . . . . . . . . . . . 140
Table 21. Correlation Matrix: Pearson Correlations Among Cognitive Test Scores and
Sentence Repetition Accuracies for the Control Group . . . . . . . . . . . . . . . . . . 141
Table 22. Interview Themes (number reporting from TBI group minus control group)
. . . . . . . . . . . . . . . . . . . . . . . . . . . . . . . . . . . . . . . . . . . . . . . . . . . . . . . . . . . . . . . . . . . . . 142
Table 23. Counts (and Percentages) of Only Negative Interview Themes . . . . . . . . . . 144
Table 24. Proportion of Repetition Accuracy, Mean (SD), for All Groups in Experiment 1
and Experiment 2 . . . . . . . . . . . . . . . . . . . . . . . . . . . . . . . . . . . . . . . . . . . . . . . . 145
Table 25. Statistics Table for Accuracy Comparing the Filtered Group from Experiment 1
and the TBI Group from Experiment 2 . . . . . . . . . . . . . . . . . . . . . . . . . . . . . . . 146
Table 26. Hearing Thresholds for Disqualified Participants A and B in the TBI Group . . .
. . . . . . . . . . . . . . . . . . . . . . . . . . . . . . . . . . . . . . . . . . . . . . . . . . . . . . . . . . . . . . . 147
Table 27. Sentence Repetition Accuracy (Proportion Correct) for Disqualified
Participants A and B with TBI and Hearing Loss . . . . . . . . . . . . . . . . . . . . . . . 147
xi
List of Figures
Figure 1. Overall study design . . . . . . . . . . . . . . . . . . . . . . . . . . . . . . . . . . . . . . . . . . . . 148
Figure 2. Experimental procedure for Experiment 2, including the experimental sentence
repetition task, standardized tests, and semi-structured interview . . . . . . . . . . . 149
Figure 3. Effort rating screen from E-Prime . . . . . . . . . . . . . . . . . . . . . . . . . . . . . . . . . 150
Figure 4. Sentence repetition accuracy for Experiment 1 . . . . . . . . . . . . . . . . . . . . . . . 151
Figure 5. Three-way interaction of accuracy for condition x target x group in
Experiment 1 . . . . . . . . . . . . . . . . . . . . . . . . . . . . . . . . . . . . . . . . . . . . . . . . . . . 151
Figure 6. Sentence repetition effort ratings for Experiment 1 . . . . . . . . . . . . . . . . . . . . 152
Figure 7. Two-way interaction for effort for condition x target in Experiment 1 . . . . . 152
Figure 8. Two-way interaction of effort for condition x group in Experiment 1 . . . . . . 153
Figure 9. Sentence repetition accuracy for Experiment 2 . . . . . . . . . . . . . . . . . . . . . . . 153
Figure 10. Two-way interaction of accuracy for condition x target, collapsed across
groups, in Experiment 2 . . . . . . . . . . . . . . . . . . . . . . . . . . . . . . . . . . . . . . . . . . 154
Figure 11. Two-way non-significant interaction of accuracy for condition x group
collapsed across targets in Experiment 2 . . . . . . . . . . . . . . . . . . . . . . . . . . . . . 154
Figure 12. Sentence repetition effort for Experiment 2 . . . . . . . . . . . . . . . . . . . . . . . . 155
Figure 13. Two-way interaction of effort for condition x target, collapsed across groups
in Experiment 2 . . . . . . . . . . . . . . . . . . . . . . . . . . . . . . . . . . . . . . . . . . . . . . . . 155
Figure 14. Repetition of target and distracter words in Experiment 2 . . . . . . . . . . . . 156
Figure 15. Effort ratings regressed against repetition accuracy . . . . . . . . . . . . . . . . . 156

xii
Figure 16. Average keywords correct by trial in the NNS block of the attend condition . .
. . . . . . . . . . . . . . . . . . . . . . . . . . . . . . . . . . . . . . . . . . . . . . . . . . . . . . . . . . . . . . . 157
Figure 17. Interaction between trial number (position in list) and target speaker in the
attend condition, based on linear mixed-effects modeling . . . . . . . . . . . . . . . . 158
Figure 18. Negative quotes from interviews plotted against attend condition repetition
accuracy . . . . . . . . . . . . . . . . . . . . . . . . . . . . . . . . . . . . . . . . . . . . . . . . . . . . . . . 159
Figure 19. Total quotes from interviews plotted against attend condition repetition
accuracy . . . . . . . . . . . . . . . . . . . . . . . . . . . . . . . . . . . . . . . . . . . . . . . . . . . . . . . 159
Figure 20. Number of negative themes by high and low accuracy groups . . . . . . . . . . 160
Figure 21. Three-way interaction of accuracy for condition x target x group in comparing
filtered (Experiment 1) and TBI (Experiment 2) groups . . . . . . . . . . . . . . . . . . 160
1
Introduction
“I have to think hard when talking to people.”
“There's so much other noise that my brain doesn't know what to listen to.”
These quotes are examples of how some people who have experienced traumatic
brain injury (TBI) describe their difficulties with speech processing. This type of problem
may hinder a person’s participation in social activities and their performance on complex
listening tasks. This phenomenon is acknowledged by TBI researchers such as Musiek,
Baran, and Shinn (2004) and Bergemalm and Lyxell (2005), who note that “every-day
problems (e.g. keeping track of a conversation, listening to a conversation in noisy
environments) are frequently reported by patients” (p. 40). Unfortunately, there is a
paucity of research directly addressing this issue. Prior studies have mostly focused on
measures of selective attention, dichotic listening, and masking release. While all of these
may play a role in functional listening tasks, separately they may not be able to capture
the complex task of speech processing (e.g. Wilson, 2003). The goal of this dissertation is
to provide direct evidence regarding whether people with TBI have deficits in speech
processing and, if so, to determine what cognitive factors contribute to those deficits.
Project Overview
Research about speech processing after TBI is important for several reasons. The
Centers for Disease Control (CDC) estimates that at least 1.7 million civilians sustain a
TBI in the United States every year; of those, roughly 275,000 are hospitalized (Faul, Xu,
Wald, & Coronado, 2010). This dissertation is part of a growing body of research seeking
to better understand the effects of TBI in the post-acute or chronic phase of recovery. In

2
this phase, people with TBI re-integrate into the communication realms of family and
community as well as rehabilitation, assisted living, school, and work. This type of
speech processing research can help clinicians and people with TBI to anticipate possible
challenges, and may eventually lead to treatments or strategies to help people with TBI
function more effectively and independently, and to communicate more successfully with
caretakers and others. In addition, studying the mechanisms of disordered speech
processing can provide insight into the normal variation that occurs in speech processing
among the uninjured population.
The design of the dissertation project comprises two experiments, and is discussed
in detail in the Methods section. Experiment 1 compared two groups of healthy controls
in a single-talker interference sentence repetition task; one group heard sentences that
were low-pass filtered at 1400 Hz, while the other group heard the same stimuli with no
filter. The low-pass filtering was intended to approximate the effects of a peripheral
hearing loss (e.g. Fabry & Van Tasell, 1986; Wang, Reed, & Bilger, 1978). Experiment 2
compared a group of adults with TBI to a healthy control group that was matched for age,
education, and estimated verbal IQ. Experiment 2 participants also completed a set of
standardized tests of auditory processing and cognitive abilities such as working memory
and processing speed, as well as a semi-structured interview about their subjective
experience of speech processing in challenging situations.
3
Background
As of the beginning of 2005, the CDC estimated that there are approximately 3.2
million people in the U.S. living with long-term disability due to TBI (Zaloshnja, Miller,
Langlois, & Selassie, 2008). One recent definition, developed to support consistency in
research, states that TBI is “an alteration in brain function, or other evidence of brain
pathology, caused by an external force” (Menon, Schwab, Wright, & Maas, 2010). An
open or penetrating brain injury occurs when the external force breaches the bone of the
skull; a closed or non-penetrating injury occurs when the skull remains intact. The
neurophysiological and behavioral effects of non-penetrating injuries can be quite diffuse
relative to penetrating or focal injuries, due to mechanisms such as axonal shearing,
intracranial pressure, and contra-coup impacts (e.g. Constantinidou & Kennedy, in press).
The alteration of brain function in Menon et al.’s (2010) definition can comprise
loss of consciousness or altered consciousness, neurological deficits, loss of memory for
information before or after the event, and altered mental states. After a mild TBI, all
symptoms may resolve after a period of days or weeks, whereas with mild-complicated,
moderate, or severe injuries, effects are likely to linger much longer (e.g. Carroll et al.,
2004).
Researchers have found numerous and varied effects of brain injury that may
continue for years to decades after injury, both by subjective report (Mazaux, Masson,
Levin, Alaoui, Maurette, & Barat, 1997; van Zomeren & van den Burg, 1985) and based
on standardized assessments (Dikmen, Machamer, Winn, & Temkin, 1995; Klein, Houx,
& Jolles, 1996). Among the effects commonly observed after TBI are difficulty with
short-term memory (e.g. Hanten & Martin, 2000; Rios, Perianez, & Munoz-C’espedes,

4
2004), regulation of attention (e.g. Rueda, Posner, & Rothbart, 2004), processing speed
(e.g. Madigan, DeLuca, Diamond, Tramontano, & Averill, 2000; Nicholas & Brookshire,
1995; Spikman, van Zomeren, & Deelman, 1996), auditory processing (Bergemalm &
Borg, 2001), and executive functions (e.g. Kennedy, Carney, & Peters, 2003; Kennedy &
Coelho, 2005). Any or all of these may arguably impact speech processing in challenging
situations.
In addition to trauma, other forms of acquired brain injury (ABI) can have similar
effects on cognition and communication; the broader term ABI includes events such as
stroke, aneurysm (e.g. Evitts, Nelson, & McGuire, 2003), tumor resection, and anoxia as
well as TBI. For the sake of participant recruitment, and because of its emphasis on
functional outcomes rather than on specific etiology or mechanisms of deficits, the
current study’s inclusion criteria allowed for acquired injury as well as TBI. Only one
participant in the current study had ABI and not TBI, and for the sake of simplicity the
remainder of this dissertation will predominantly discuss TBI.
Traumatic Brain Injury and Speech Processing
There are several areas of evidence to support the hypothesis that individuals with
TBI will have more difficulty than healthy controls with complex speech processing.
Three areas most relevant to the current study are central auditory processing, processing
speed, and attention. The theory underlying the dissertation experiments is that, due to the
complexity and redundancy inherent in both the tasks and the processing involved (e.g.
Cooke, Garcia Lecumberri, & Barker, 2008; Oxenham & Simonson, 2009), impairments
in any one of these areas are unlikely to have a one-to-one relationship with functional
5
communication deficits. Rather, it is the combination of deficits associated with brain
injury that may hinder some individuals’ ability to process speech in challenging
environments. This complexity, and the heterogeneity of injuries and experiences of
individuals with TBI, necessitates the use of both quantitative and qualitative measures.
Thus both quantitative measures of speech processing and qualitative measures from
interviews are used in this project.
Central Auditory Processing
Intuitively, auditory processing – how auditory information is processed by the
ear and brain – must play a key role in the processing of speech. Many researchers
consider peripheral and central auditory processes separately: peripheral audition
involves the outer, middle, and inner ear and auditory nerve, while central audition
comprises the auditory pathway within the brainstem and cerebral cortex (e.g. Peelle,
Johnsrude, & Davis, 2010). Both have to function in order for a listener to process
speech.
Peripheral auditory problems include conductive and sensorineural hearing loss;
peripheral auditory processing is affected by energetic masking, in which the spectral
energy of the interfering signal masks that of the target (see Table 1). Central auditory
processing includes functions of the brainstem, measured by auditory brainstem response
(ABR) (e.g. Bergemalm & Lyxell, 2005), and more central areas. In contrast to peripheral
processing, which is affected by energetic masking, central auditory processing is also
affected by informational masking, in which phonological or semantic information from
the interfering signal can mask that of the target (e.g. Oxenham & Simonson, 2009;

6
Schneider, Li, & Daneman, 2007).
As Lagace, Jutras, and Gagne (2010) point out, auditory assessments of speech
perception in noise may be useful in assessing central auditory processing. They are
writing from the perspective of evaluating Auditory Processing Disorder (APD), a
disorder whose nature is debated among clinicians and researchers (American Speech-
Language-Hearing Association, 1996; Jerger, 2009; Moore, 2006). Nevertheless, there is
consensus that further explanation is needed for the complaints that are attributed to
APD, including in individuals with TBI.
One study that supports both auditory processing difficulties for people with brain
injury and the potential for treatment is a case report by Musiek et al. (2004). A 41-year-
old woman experienced difficulty processing speech more than a year after concussion.
The authors assessed peripheral and central auditory functioning and found that, although
her peripheral hearing was normal, several measures of central auditory processing,
including dichotic digits and compressed speech, were “outside of the range of normal.”
The patient participated in intensive auditory rehabilitation with several components:
behavioral and metacognitive strategies such as reading aloud, asking communication
partners to speak slowly and clearly, and anticipating problem situations; and auditory
components such as auditory memory training, auditory speech discrimination training,
and temporal sequence training. The client completed much of the therapy independently,
and when she was re-tested seven months after her initial evaluation, her scores on
several of the measures of central auditory processing had improved to normal or near-
normal. In contrast, auditory brainstem response measures remained the same before and
after therapy. Musiek et al. also report subjective improvements, quoting the participant
7
as saying, “I can talk, listen (and think) while the radio is on and people are talking
around me. This was impossible after my accident and has greatly improved, though not
recovered 100%” (p. 130).
In this dissertation, the different designs of Experiment 1 and Experiment 2 were
developed to distinguish between peripheral and central auditory effects, the latter of
which are predicted to be more pronounced in individuals with brain injury than in
healthy controls. This is because, absent peripheral hearing loss, the diffuse neurological
changes following TBI are predicted to include regions and functions related to central
auditory processing.
Energetic and informational masking.
Studies about auditory masking come largely from the field of audiology, with
relevant contributions also coming from perceptual psychology. The three concepts
related to masking that are most relevant to the current project are energetic masking,
informational masking, and masking release (see Table 1). With energetic masking, a
masking sound acoustically covers the masked sound, making it inaudible. When one
sound is completely masked by another, the first sound is not detectable to the listener; in
experiments, the masker is often broad-spectrum noise, such as white noise or pink noise.
White noise contains equal energy at all frequencies, whereas pink noise is
logarithmically distributed to contain equal energy at each octave. An everyday example
of energetic masking would be part of a conversation becoming inaudible when a large
and noisy vehicle drives by. Audiologists use masking during hearing assessments by
playing masking noise in one ear in order to isolate responses from the other ear. As
8
Stickney, Zeng, Litovsky, and Assmann (2004) explain, energetic masking comprises two
or more sounds that overlap to create a peripheral effect.
Informational masking, in contrast, is described as a central as opposed to a
peripheral phenomenon that inhibits the ability to process sound (Oxenham, Fligor,
Mason, & Kidd, 2003). An everyday example would be when the conversation of a
neighboring student makes it difficult to for a listener to follow the speech of the lecturer.
As explained by Schneider et al. (2007),
Both kinds of distracting sound sources [noise and speech] produce
interference at the auditory periphery (activate similar regions along
the basilar membrane), and this kind of interference is called energetic
masking. However, in addition to energetic masking, meaningful
sound sources, such as competing speech, can and do interfere with
the processing of the target speech at more central levels (phonetic
and/or semantic), and this kind of interference is often called
informational masking. (p. 478).
Although a sufficiently loud, consistent noise (e.g. a jet engine) can completely
mask speech, it is often possible to understand speech if the masking noise is fluctuating
(e.g. a noisy restaurant). This ability to piece together intelligible speech in modulated as
opposed to steady noise is called release from masking.
Nelson, Jin, Carney, and Nelson (2003) and Nelson and Jin (2004) described the
phenomenon of energetic release from masking in detail using gated (modulated, or
periodic) noise. In a comparison between people with normal hearing and cochlear
implant (CI) users, they found that normal-hearing listeners had significant release from
9
masking at various signal-to-noise ratios (SNR), especially with a modulation frequency
of 8 Hz. This means that the listeners were able to understand the speech signal much
better with noise that was modulated at 8Hz than with steady noise of the same intensity.
However, individuals with cochlear implants – and normal-hearing participants listening
to cochlear implant simulations – did not benefit from modulation of the masker, even
when the signal was 16 dB louder than the noise. The authors proposed three likely
components of masking release for cochlear implant users: informational masking,
spectral resolution, and auditory fusion/segregation. Informational masking is a complex
topic discussed in greater detail below but, for the purposes of explaining masking release
for CI users, it was described as “threshold elevation due to non-energetic factors such as
signal uncertainty, masker-stimulus similarity, or distraction from extraneous sounds”
(Nelson & Jin, 2004).
Nelson and Jin (2004) conducted a second experiment in which the stimulus
sentences themselves were gated (i.e. interrupted by periodic bursts of silence) without
including background noise. Procedures were similar to those of the first experiment, and
the authors found that the performance of normal-hearing listeners improved with
increasing gate frequency, meaning more frequent, briefer periods of silence disrupting
the speech signal. Cochlear implant and simulation listeners, in contrast, showed very
poor speech perception across gating frequencies. Overall, Nelson and Jin concluded that
cochlear implant and simulation listeners are not successful with auditory fusion of
interrupted speech but do gain masking release benefits from increased spectral
information.
Cullington and Zheng (2008) also compared CI users, people with normal
10
hearing, and people listening to CI simulations in the presence of noise, single-talker, and
multiple-talker interference. They found that, although the simulation listeners performed
similarly to the CI users in noise-masker conditions, the simulation was not as successful
in matching real CI-users’ performance in the single-talker interference task.
Nelson and Jin’s (2004) methodology provided the basis for the procedures used
by Krause, Nelson, and Kennedy (2009), who examined whether the experience of
masking release was the same for individuals with and without ABI. Listeners repeated
sentences in different masking conditions, including steady noise, gated noise at 8 Hz and
16 Hz, gated speech at 4 Hz with no noise, and single-talker interference (two voices at
the same time). The authors hypothesized that deficits of masking release might be
related to reduced processing speed. Moreover, if there were differential effects of
spectral masking after brain injury compared to the performance by uninjured controls, it
would be expected that gated noise conditions would be at least as affected as gated
speech or single-talker interference conditions in this experiment. Although no significant
group differences were found in accuracy (i.e. ability to accurately repeat sentences in
different masking conditions), regressions showed that some processing speed measures
correlated significantly and positively with listening accuracy, but only for gated speech
and single-talker interference conditions and not for steady or gated noise-masking
conditions. This suggests that, in some situations, faster processing speed was associated
with better sentence repetition performance; the fact that the correlations occurred in the
gated speech and single-talker interference but not in the gated masking conditions
suggests that informational masking rather than spectral masking was more significant in
the performance of individuals with TBI in that experiment. In addition, the experiment
11
showed a significant overall effect of subjective effort between groups, with the TBI
group reporting greater effort than the control group.
Brungart (2001) found informational masking predominant over energetic
masking in an experiment comparing phrase repetition in the presence of single-talker
interference and speech-spectrum-shaped noise in healthy adults. Speech-spectrum-
shaped noise is that in which the temporal and/or spectral characteristics are manipulated
to mimic those of a speech sample. The authors found masking effects in the speech
interference conditions beyond those of the same signal-to-noise ratios (SNRs) in the
speech-shaped-noise conditions; in addition, for most conditions, performance was better
in a modulated (gated) noise condition than in the two-talker condition. Moreover,
Brungart points out that the different-sex talker condition showed the least masking,
indicating that the effects found by Krause et al. (2009), whose single-talker interference
condition used opposite-sex talkers, could have been even more pronounced had they
used same-sex talkers for interference. Altogether, this evidence suggests the dominance
of informational masking over energetic masking effects in the single-talker interference
task.
Other work has demonstrated additional mechanisms of release from
informational masking. Of the multiple factors involved in informational masking – and
in release from informational masking – arguably one of the most important is the
capacity for stream segregation, which is the ability to separate complex auditory input
into two or more perceptual “streams.” For example, Freyman, Balakrishnan, and Helfer
(2001) demonstrated that normal-hearing listeners had better comprehension in one- and
two-talker interference tasks when the talkers were perceived as spatially different

12
compared to when the voices came from the same location. They also showed that
informational masking became less of a factor with an increasing number of voices; in
other words, the more voices that make up the interference, the more similar their
masking characteristics are to a non-speech noise masker. Arbogast, Mason, and Kidd
(2005) found similar release from masking with spatial separation, and additionally
compared the phenomenon in normal and hearing-impaired listeners. They found that
people with sensorineural hearing loss did experience release from informational
masking, but to a significantly lesser extent than those with normal hearing, a finding that
is particularly relevant to Experiment 1 of the current project. In a set of three
experiments, Freyman, Balakrishnan, and Helfer (2004) also found increased release
from informational masking with both spatial separation and increased number of talkers,
both independently and in combination; in addition, they demonstrated masking release
benefits from providing a preview of target sentences.
The findings of three more studies provide critical information on the contrast
between informational and energetic masking that bear on the current project. Brungart,
Simpson, Ericson, and Scott (2001) conducted a study with two-, three-, and four-talker
interference in various combinations of gender and intensity. They found improved
performance when the target and masking voices were qualitatively different and
worsened performance when the target and masking voices were qualitatively similar.
Performance was most often best when the target and masking voices were different
sexes and, with negative SNRs, different intensities also helped with release from
masking. In an interesting effect that the authors called “odd-sex distraction,” having
more than one same-sex masking voice combined with a single opposite-sex masker

13
actually led to poorer performance than did the same number of maskers all of the same
sex as the target. In other words, two male and one female masker caused more
interference for a male target than three male maskers. The authors attributed this to a
type of informational masking in which the salience of the masker distracts the listener
from attending to the target. It is possible to expect a related effect in the proposed study,
in the non-native speaker target/native speaker masker (NNS-ns) condition; the salience
of the masker may make it more difficult to ignore than in the opposite (NS-nns)
condition, in which the target itself is the more cognitively salient signal.
Stickney et al. (2004) specifically addressed energetic and informational masking
in cochlear implant listening in an experiment using a procedure similar to that of
Brungart (2001). They found that single-talker interference led to poorer performance
than speech-shaped noise, indicating the effect of informational masking: since the two
signals were the same in spectral energy, the additional interference in the single-talker
condition must be due to informational masking. In addition, participants with normal
hearing showed the greatest masking effects when the masking voice was the same as the
target voice, demonstrating the combination of energetic masking and informational
masking.
Finally, in a study of different types of masking, Oxenham and Simonson (2009)
used high- and low-pass filters to compare masking release effects in steady noise,
speech-modulated noise, and single-talker interference tasks. Based on earlier studies
suggesting that both temporal and pitch information are important for masking release,
they predicted that these factors would play an important role in participant performance
in their experiments. However, counter to predictions, the authors demonstrated that
14
masking release was not significantly affected by the temporal fine structure of pitch
information. Rather, they suggested that how much perceptual redundancy is present in
the target governs the amount of masking release the listener will experience. The
phenomenon of perceptual redundancy can be argued to encompass everything from
spatial location to spectral overlap to semantic similarity or listener interest; thus,
Oxenham and Simonson’s work, along with the studies discussed above, contribute
support to the idea that informational masking operates on multiple perceptual and
cognitive levels.
Dichotic listening.
One of the most common ways that researchers have measured central auditory
processing is through dichotic listening tasks (e.g. Harris, 1994; Levin et al., 1989). As
explained by Meyers, Roberts, Bayless, Volkert, and Evitts (2002), in a dichotic listening
task the participant wears stereo headphones and simultaneously hears one word in one
ear and a different word in the other ear. The words are usually matched for number of
syllables, and the listener is asked to repeat one or both words. Roberts et al. (1994)
developed the Dichotic Word Listening Test (DWLT) to standardize the procedure for
testing dichotic listening. They tested adults and children with and without TBI, as well
as healthy adults from both the U.S. and Canada and from both rural and urban areas.
They found that adults with brain injury performed significantly worse than those
without. However, they also found significant differences among the adult control
subgroups, which they speculated might be partly related to the bilingualism of some of
the Canadian participants. Furthermore, socioeconomic status was not controlled for in

15
the study, and has been shown to affect dichotic listening task performance. These
caveats make it clear that dichotic listening tasks cannot be interpreted as simple tests of
central auditory processing; nevertheless, there has been other research suggesting that
accuracy on such tasks is adversely affected by brain injury.
Meyers et al. (2002) followed up the Roberts et al. (1994) study by adding 200
additional healthy controls to the original group of 136 in order to develop better norms
for the DWLT short form (30 items). They found that age had a significant negative
correlation with dichotic listening, and they published means and 5th percentile cutoff
scores for age groups ranging from 16 to 69 based on their findings. In their second
experiment, Meyers et al. examined a database of individuals with TBI and stroke who
had taken the test. The TBI participants were divided based on duration of
unconsciousness into mild, moderate, and severe; the stroke participants were divided
into right and left cerebrovascular accident (CVA) groups. The TBI and stroke
participants were compared to a group of 36 healthy controls, a subset of the 336 from
the first experiment that completed the same neuropsychological test battery as the TBI
and stroke groups. Consistent with the first experiment, Meyers et al. found a significant
effect of age in the second experiment. In addition, they found that DWLT scores
correlated significantly with duration of LOC (i.e. severity of injury) such that those with
more severe injuries had poorer dichotic listening scores. Although no control participant
“failed” the test by scoring lower than the 5th percentile (Roberts et al., 1994), 70% of the
TBI group in the Meyers (2002) study failed at least one of the three measures used, with
more severely injured participants failing more frequently than those with more mild
injuries. In the stroke groups, there were predictable laterality effects; more participants

16
with right CVA failed the test, and overall the RCVA group did more poorly than the left
CVA group. Indeed, 89% vs. 55%, respectively, failed at least one measure, compared to
the 70% failure rate for the TBI group. The authors concluded that dichotic listening may
be a useful tool for neuropsychological evaluation but caution that there are clearly
numerous mechanisms behind poor dichotic listening performance after ABI.
Importantly, while researchers including Roberts and Meyers have demonstrated
dichotic listening consequences of brain injury, and others such as Schneider and
Oxenham have discussed the importance of informational masking in speech processing,
no one has yet connected the two concepts in a functional experiment. One goal of this
dissertation is to explicitly compare a speech processing task with measures of central
auditory processing, including dichotic listening.
Some evidence exists for the possibility of therapeutic intervention to improve
dichotic listening after TBI. In addition to the case study by Musiek et al. (2004)
discussed earlier, Yokota-Adachi, Kershner, Jutai, and Knox (2003) found that after
musical attention training, an adolescent with brain injury showed improved performance
on a dichotic listening task for CV syllables. Neither of these studies, however, addressed
whether either deficits or improvements in dichotic listening were directly related to
ecologically valid speech processing tasks.
Processing Speed
Processing of speech is a highly time-sensitive task. Speaking rates of 140 words
per minute are typical (e.g. Tun, Wingfield, Stine, & Mecsas, 1992), equivalent to several
words per second. Findings from current research have concluded that individuals with

17
TBI have slower speed of processing than those without TBI. For example, Madigan et
al. (2000) explored the issue of processing speed in individuals with TBI as it impacts
visual and auditory modalities, finding deficits particularly in auditory processing speed.
They used a variation of the Paced Auditory Serial Addition Task (PASAT), a test of
working memory that places increasing demands on processing speed with each subtest.
Other studies are more indirectly relevant to the connection between general
processing speed and speech processing. Hinton-Bayre, Geffen, and McFarland (1997)
showed that tests of processing speed were sensitive to post-acute mild brain injury in a
group of rugby players. One of the tasks they used, although not a measure of speech
processing, measured another aspect of language processing: participants read sentences
and rated whether they were sensible or nonsensible. The other task in that study was a
symbol-digits task, in which participants had to decode symbols from a key. This is
similar to one of the “attention” tasks on the Repeatable Battery for the Assessment of
Neuropsychological Status (R-BANS) (Randolph, Tierney, Mohr, & Chase, 1998), a
neuropsychological screening battery used in the current study.
In a study of speaking rate in children and adolescents with TBI, (Campbell &
Dollaghan, 1995) used syllable duration and clinical judgments to measure speed of
articulation and average duration of within-utterance pauses during natural speech as a
measure of language processing time. They showed that slowing of articulation and
language processing both contributed independently to slower speech rates among
participants. Although their study addressed expressive and not receptive skills, the dual
effects of motor and cognitive factors are suggestive for the current project.
Further support for the prediction of processing speed effects on speech
18
processing can be found in the study of masking release and ABI by Krause et al. (2009).
In that study, participants repeated sentences in different noise masking conditions, and
correlations were found between processing speed and sentence repetition accuracy.
Studies of speech processing in elderly people with normal hearing are another
source of data supporting the role of processing speed in speech processing. Dubno,
Horwitz, and Ahlstrom (2002) found several differences between younger and older
subjects in speech recognition in noise, independent of audibility. The greatest
differences between older and younger adults occurred with temporally challenging
listening tasks, specifically speech processing in fluctuating rather than steady-state
noise. With this finding, they broach the idea that speed of processing may influence
individuals’ ability to process speech in disadvantageous conditions such as those in the
current experiment.
The work of Tun et al. (1992) comparing older and younger adults is also relevant
here. They used a dual-task paradigm, in which participants immediately recalled
sentences at varying speech rates while simultaneously performing a visual picture
recognition task. The older adults’ performance on immediate memory for sentences was
more affected by increasing speech rates than was that of the younger adults, suggesting
reduced speed of processing for the older versus the younger group. There was no
interaction between age and speech rate on accuracy in either task, suggesting that both
groups were able to divide their attention with similar efficiency. The fact that slowed
processing in Tun et al.’s study was demonstrated using a sentence repetition task further
supports the link between speech processing and overall processing speed.
Another time-sensitive element of speech processing occurs when listeners adapt
19
or adjust to a difficult or unfamiliar speech pattern. This is called accommodation, which
is the ability of a listener to adapt to an unfamiliar or difficult signal over time. Studies
have shown that accommodation occurs very quickly for normal listeners. For example,
Clark and Garrett (2004) showed that healthy adults can improve their performance in
processing accented speech with less than a minute of exposure. Davis, Johnsrude,
Hervais-Adelman, Taylor, and McGettigan (2005), also demonstrated this type of
accommodation for noise-vocoded speech. Although research has not been done to
directly link accommodation with processing speed, it is discussed here as a speed-based
phenomenon that is potentially sensitive to the speed of processing of the listener.
There are two measures in this dissertation that processing speed would be
predicted to affect. First, reduced processing speed is predicted to be associated with
reduced accuracy in the sentence repetition task. Second, individuals with TBI are
predicted to accommodate to the challenging listening tasks more slowly; in other words,
more trials would be required before they reached ceiling, particularly in the conditions in
which the target talker was a non-native speaker. Participants with TBI may also describe
more subjective difficulty “catching up” in day-to-day conversational contexts compared
to healthy controls.
Effort
Increased mental effort is another frequent complaint following brain injury.
Effort is difficult to operationalize, but may be related to self-regulation of attention,
allocation of cognitive resources, simple subjective difficulty, or – more likely – some
combination of factors. Researchers have attempted to measure effort in various ways,
20
including direct self-report measures such as rating scales (Fraser, Gagne, Alepins, &
Dubois, 2010; Krause et al., 2009) and indirect measures such as performance differences
within a dual-task paradigm (Sarampalis, Kalluri, Edwards, & Hafter, 2009) or fMRI
localization of brain areas differentially activated during more difficult speech
comprehension tasks, (Davis & Johnsrude, 2003; Peelle, Eason, Schmitter,
Schwarzbauer, & Davis, 2010).
Rating effort on a 1-to-10 scale in a sentence repetition task, the group of listeners
with ABI in Krause, et al.’s (2009) study showed greater effort overall compared to
matched controls, with group differences most pronounced in the single-talker
interference condition. In addition, studies using surveys and interviews have shown that
students returning to college after brain injury report that studying requires greater effort
compared to before their injuries (Kennedy & Krause, 2011; Kennedy, Krause, &
Turkstra, 2008).
Effort reports do not always match performance in speech processing tasks,
however. In a dual-task study about noise reduction (NR) algorithms for hearing aids,
Sarampalis et al. (2009) gauged effort in normal-hearing listeners by noting differential
performance on a working memory task that was conducted simultaneously with a speech
perception in noise (SPIN) word repetition test. In addition to repeating the final word of
each sentence in the SPIN test, participants were asked to maintain those words in
memory and repeat them again after each block of eight sentences. The study found that
even when the NR algorithm did not demonstrably improve speech intelligibility for
listeners, it did reduce the cognitive effort of listening, and participants often stated that
the new algorithms led to improved ease of listening, sound quality, and speech

21
understanding. In a second experiment, the researchers found differential effects on
processing speed with and without the NR algorithms. They conclude that, even though
the algorithms did not significantly improve listeners’ performance on the speech
processing tasks, “NR, by doing some of the processing normally done by a listener, may
free resources for other, simultaneous tasks” (p. 1239).
In a similar study, Fraser et al. (2010) used a dual-task experiment to show that
visual cues decreased the effort required to process speech in noise compared with an
audio-only condition. In contrast to previous studies, the two tasks used by Fraser et al.
were in two different modalities: while speech recognition (in auditory only or auditory-
visual modality) was the primary task, the secondary task required tactile pattern
recognition. In addition to the accuracy and processing speed measures, Fraser et al. gave
participants a self-rating questionnaire after each condition, asking them to rate both their
performance and their level of effort on each task from 0 to 100% effort. Results showed
that the audiovisual condition of the speech recognition task required less effort than the
audio-only condition. In addition, as with the study of Sarampalis et al. (2009), there was
no relationship between effort ratings and actual dual task performance in the auditory-
only condition. However, there was a negative correlation between effort rating and
performance in the audio-visual condition, such that lower accuracy scores were
associated with higher effort ratings.
The work of these researchers supports the value of measuring subjective effort in
the current study. In addition to quantitative ratings of effort, thematic analysis of
interview responses is also predicted to show group differences relative to listening
accuracy and effort. It is predicted that there would be an overall effect of effort between

22
groups, such that individuals with TBI would report greater effort required for the
challenging listening tasks. Speed/performance trades-offs, potentially manifested in
greater perceived effort, are discussed further in the section on attention below.
Attention
Attention is one of the cognitive factors most relevant to the consideration of how
individuals with TBI process complex auditory information. It is a complex, multi-
faceted cognitive factor, and researchers debate to what extent its different aspects can be
studied independently of each other or of other cognitive issues such as processing speed.
Driver (2001) provides a convenient overview describing selective attention in particular,
which involves attending to a target while ignoring a distracting stimulus. This is the
aspect of attention most relevant to the current study, because the single-talker
interference task could be described as a selective attention task (as well as a stream-
segregation task, as discussed above).
Individuals with TBI frequently demonstrate various difficulties with attention,
including reporting everyday experiences of distractibility and difficulty with
multitasking (e.g. Cicerone, 1996). Studies related to distractibility include Knight, Titov,
& Crawford (2006), who showed that visual and auditory distractions affected
prospective memory – the ability to recall and carry out a plan – in participants with TBI
more than in controls. Veltman, Brouwer, Van Zomeren, and Van Wolffelaar (1996)
found divided attention among the executive function deficits observed in a group of 20
people in subacute recovery (<6 months) after severe closed-head injuries. Schmitter-
Edgecombe and Nissley (2000) conducted a study of people with severe TBI who were at

23
a chronic recovery stage (>1 year post injury). Participants were shown two lists of 28
five- to seven-letter words and then given word-stem cues to recall them. One list was
used in the full-attention condition, in which the study phase only involved reading the
word list; the second list was studied in divided-attention condition, in which participants
simultaneously performed an even/odd decision task for numbers. A third list appeared in
the testing phase without having been studied, as a baseline condition. The researchers
contrasted between controlled and automatic recall with a two-part recall test. With
“inclusion” items, participants were told to complete the word stem cues using words
they had studied; with “exclusion” items, they were told to avoid words they had studied
and provide only new words. Words from the studied lists that were provided in response
to “exclusion” cues were assumed to represent automatic and not controlled recall,
because participants would only provide them based on implicit recall in the absence of
explicit recall. Accuracy results showed that divided attention load impacted performance
on controlled but not automatic memory more so for the TBI group than for healthy
controls. In other words, the individuals with TBI were no different from controls in their
implicit recall of items studied during the distraction condition, but they were less
accurate for controlled-recall items.
Telling, Meyer, and Humphreys (2010) investigated basic visual distractibility in
healthy controls and individuals with frontal lobe injury using an eye tracker. Participants
were shown a target word followed by an array of four pictures, and were told to press a
button indicating whether the target was present or absent among the pictures. The eye
tracker recorded participants’ gazes as they looked at the pictures, which, in addition to
the target or foil item, included semantically related and unrelated distracters. Participants
24
with frontal-lobe injuries had more first initial gazes to distracters and fewer to target
items, had more false-positive errors on trials where targets were absent, and were slower
to look away from distracters than controls were. Although Telling et al. used the visual
rather than auditory domain, their study is analogous to the current project in several
ways. First, participants in the current study hear a sample of which voice to attend for
each block of sentences in the single-talker interference task; this is comparable to the
visual “search template” discussed by Telling et al., which participants may use to
facilitate finding target images within an array. Also, the rapid initial discrimination
involved in target selection for attention in the current study is similar to the early visual
saccades discussed by Telling et al. In other words, the effect of frontal lobe injury on
participants’ ability to quickly and accurately identify targets while ignoring distracters in
a the visual domain supports the hypothesis that similar difficulties may be found in
related auditory tasks such as those in the current study.
Several studies have claimed that reduced processing speed can account for nearly
all differences between groups with and without TBI on attention tasks (e.g. Ponsford &
Kinsella, 1992; Spikman et al., 1996), and – as discussed above – reduced processing
speed is one of the most commonly reported sequelae of TBI. However, there seems to be
some agreement that this link is not as clear when it comes to supervisory control or
regulation of attention – what Rueda, et al. (2004) call “executive attention.” The more
fundamental types of attention are arguably more automatic processes, even if they may
be slower in people with TBI. For example, in their anatomical approach to areas of
attention, Posner and Petersen (1990) identified orientation, detection, and vigilance as
the primary types of attention processes. Indeed, these areas may be impaired in

25
individuals with severe or acute brain injury (e.g. Stuss et al., 1999). From a cognitive
rehabilitation standpoint, however, Sohlberg and Mateer (2001) separate attention into
possible areas of deficit including sustained attention (similar to vigilance), selective
attention (called “focus” by some others), alternating attention, and divided attention.
Any of these types of attention may, in some circumstances, require supervisory control.
In other words, the individual may need to deliberately control his or her attention in
order to complete a task (e.g. prioritize attending to one task over another), particularly if
there are contextual requirements involved, which make the process of developing
automaticity much more difficult.
It is in these supervisory attention control conditions that deficits may occur for
individuals with TBI that are over and above those caused by reduced processing speed;
instead, they would fall under the category of self-regulation. The current study is not
designed to directly test self-regulation. However, if the hypothesized group differences
are found, a future course of study is planned that will specifically focus on the self-
regulatory aspects of complex speech processing.
Schneider et al. (2007) conceive of difficulty with a single-talker interference task
as a problem with alternating attention, or switching. They state that difficulties with
scene analysis or linguistic interference as well as energetic masking can cause problems
in switching attention when a conversation requires the listener to attend to multiple
speakers. Whether or not it is truly an alternating attention problem, the three factors they
cite are certainly relevant. Energetic and informational masking, as well as scene analysis
(in terms of stream segregation), were discussed in the section above on auditory
processing. Semantic and linguistic interference are also relevant to the current study, in

26
that all interfering signals consist of speech in the language of the listener, rather than
noise or speech in other languages. Schneider et al. sum up the role of attention in speech
processing in a single-talker interference task nicely:
[A] person must be able to focus their attention on one auditory stream
(voice) in order to extract the meaning from that stream, while
simultaneously inhibiting the processing of information from other
auditory streams, or, if the information from the second stream is
processed, prohibiting it from interfering with the processing of the
targeted voice. (p. 582)
There is existing evidence that attention plays a role in auditory stream
segregation, which is the ability to separate a single stream of auditory information into
two meaningful components. Carlyon, Cusack, Foxton, and Robertson (2001) studied
stream segregation in healthy adult listeners. They used tone sequences in which a pair of
tones at frequencies A and B could be perceived as either a single “galloping” ABA-ABA
pattern, or as two separate streams of A and B, depending on the rate of presentation and
other factors. Stream segregation, the perception that the tone pairs are two separate
patterns, builds up over time. In Carlyon et al.’s study, participants were asked to press
one button when they heard a single stream and another button when they heard two
streams. This task was done with and without the presence of distracters, and sometimes
after instructions to ignore or attend to features of the distracter signal. The researchers
found that the buildup of stream segregation could be limited by manipulating attention.
This means that when attention was directed away from the streaming signal, the time at
which it was perceived to switch from one stream to two was delayed.

27
In a clinical application, Carlyon et al. (2001) performed additional experiments
comparing among participants with right hemisphere brain damage (RHD) with left
visual neglect, those with RHD but no neglect, and healthy controls. Left neglect is a
phenomenon in which some people who have experienced damage to the right cerebral
hemisphere have difficulty attending to stimuli on the contralateral (left) side. The
authors found an asymmetry of results for the group with neglect but not for the other two
groups: participants with neglect showed reduced stream segregation for stimuli that were
presented to their left ears compared with those presented to their right ears. The results
overall strongly suggest that attention plays a role in the perception of auditory streaming.
However, the authors do not directly demonstrate the connection between the
experimental tasks and functional communication effects.
Pitt and Samuel (1990) took a step closer to everyday speech processing by
studying phoneme monitoring in words and pseudowords. By controlling the location of
target phonemes within their stimuli, they implicitly manipulated the expectations – and
attentional focus – of listeners. They found faster response times for phonemes that were
in the expected location, suggesting a performance benefit from attention. This effect was
somewhat stronger in the nonword condition, suggesting that it was easier for participants
to focus narrowly on monitoring phonemes in nonwords than words. In addition, they
found that adding a distracter semantic evaluation task resulted in poorer performance on
the phoneme-monitoring task. Gordon, Eberhart, and Rueckl (1993) and Francis and
Nusbaum (2002) also noted the importance of attention in speech. Gordon et al. showed
that engaging in dual tasks affected how different acoustic cues were weighted in

28
phoneme identification; and Francis and Nusbaum showed that attention plays a role in
learning new phonemic categories.
In addition to research on healthy adults, there have been numerous studies
exploring the role of attention in communication for various clinical populations, such as
people with aphasia (e.g. Erickson, Goldinger, & LaPointe, 1996; Sohlberg & Mateer,
2001). Among the recent literature about attention difficulties in people with aphasia are
studies on selective and divided attention (e.g. Murray, Holland, & Beeson, 1997) and on
switching (Chiou & Kennedy, 2007). In order to compare focused and divided attention
in adults with and without mild aphasia, Murray et al. asked participants to complete
semantic and lexical decision tasks as well as a tone discrimination task. Each was done
in isolation and in selective and divided attention conditions with secondary stimuli. In
other words, participants were asked to either complete the primary task while ignoring
the secondary task (selective attention, or what the authors call “focused attention”) or to
do the primary task first and the secondary task second (divided attention). Secondary
stimuli included verbal and nonverbal conditions. Participants with aphasia were more
affected by the presence of secondary stimuli than controls. In addition, semantic
judgment for all groups was more affected by verbal than nonverbal secondary tasks,
which is consistent with what would be predicted based on the discussion of
informational masking earlier in this introduction. The fact that people with aphasia had
greater difficulty than controls in the selective attention condition is relevant to the
current study because the single-talker interference task is also a selective attention task,
in which participants must repeat back one voice while ignoring the other.
29
In order to study the phenomenon of switching in adults with and without aphasia,
Chiou and Kennedy (2007) conducted a study using four go/no-go tasks, in which both
modality of presentation (visual vs. auditory) and task rules could be switched,
sometimes predictably and sometimes unpredictably. All participants did better when the
modality switching was predictable when there was no rule switching; but when rule-
switching was involved, predictability of modality switching had no effect. This meant
that knowing the switching pattern from visual to auditory presentation and back in
advance improved performance when response rules were consistent, but not when there
was rule switching. In addition, participants with aphasia performed more poorly with
regards to speed, accuracy, and ability to adopt new rules after switching. Switching is
relevant to this dissertation study because participants must attend to first one speaker,
then the other speaker in the two single-talker interference blocks of the experiment.
In summary, previous research has shown that attentional changes can affect
performance on a speech processing task in healthy adults. In addition, attention effects
have been demonstrated in TBI and other clinical populations as well. These findings
suggest that attentional deficits of adults with TBI may impact their speech processing
performance in the current study, which specifically demands controlled, selective
attention and switching.
Non-Native Accented Speech
There have been many studies exploring the intelligibility of non-native speakers
(NNS) speaking English. Some have included both native speaker (NS) and NNS
listeners, while others, like the proposed study, focus only on NS listeners. It is important

30
to note the distinctions among language proficiency, comprehensibility, intelligibility,
and accentedness. Language proficiency comprises factors such as vocabulary size and
accuracy and complexity of receptive and expressive syntax. Comprehensibility relates to
how easily the message can be understood, whereas intelligibility is a more fine-grained
measure of whether individual words can be understood. A person with dysarthria might
have reduced intelligibility but relatively preserved comprehensibility; in contrast, a
person with fluent aphasia might be fully intelligible and yet his or her intended meaning
might be incomprehensible.
Non-native accent can occur based on any of a variety of factors that affect
expressive language, and may or may not be independent of proficiency,
comprehensibility, and intelligibility. Munro and Derwing (1999) specifically examined
phonemic, grammatical, and prosodic variation in speakers of Chinese-accented English.
Both comprehensibility and accentedness were subjectively measured on 1-to-9 scales,
while intelligibility was measured based on sentence transcription. Many participants
showed negative correlations between comprehensibility and accentedness, such that
higher accentedness ratings were associated with lower comprehensibility. However,
these two were often not correlated with the objective intelligibility measure, and the
authors emphasized that a “heavy” accent can still be highly intelligible. They also
showed that prosodic errors in the study had more influence on accent and
comprehensibility ratings than did phonemic or grammatical errors. McHenry (2011) also
demonstrated the wide variability of intelligibility ratings in a study using speakers with
dysarthria: she found no significant patterns related to age, gender, or education level in
accounting for the variability of ratings among listeners.
31
Munro and Derwing (1999) also emphasize the importance of distinguishing
between accentedness and intelligibility or comprehensibility because efforts at “accent
reduction” may not actually have any impact on whether a speaker becomes more
intelligible or comprehensible. Along similar lines, Munro and Derwing (1995) found
that, although comprehensibility was significantly related to processing speed (i.e.
listeners were faster at a sentence verification task with sentences they rated as more
comprehensible), accentedness was not.
Studies of listening to non-native accented speech in noise have shown that the
intelligibility of non-native speech is more affected by background noise than native
speech (Rogers, Dalby, & Nishi, 2004; Wilson & Spaulding, 2010). This is consistent
with the concept of reduced signal redundancy discussed by Oxenham and Simonson
(2009) – because NNS contains less redundancy than NS, it is more susceptible to
energetic masking effects.
Several previous studies are relevant to the topic of the effects of native versus
non-native speech in a single-talker interference task. In a study exploring perception of
spatial separation in a two-talker interference task, Freyman et al. (2001) included a
condition which used the voices of two native speakers of Dutch, speaking both Dutch
and English. Consistent with the predictions of the current study, their results suggested
that when the native Dutch speakers spoke English, it led to equal energetic masking but
less informational masking compared to the masker spoken by native English speakers.
Van Engen and Bradlow (2007) conducted a study relevant to the question of
informational masking in which participants listened to English target sentences in the
presence of two or six interfering talkers speaking English or Mandarin. Whereas there
32
was no language effect in the six-talker condition, native listeners experienced more
masking with English babble than with Mandarin babble in the two-talker-babble
condition. This suggests that the six-talker stimuli’s “greater spectral and temporal
density” led to increased energetic masking and minimized the effect of informational
masking; the converse was true for the two-talker condition. Although all speakers in the
current project spoke English, the results of Van Engen and Bradlow (2007) provide
support for the hypothesis that informational masking would be greater when the
interfering talkers are native speakers.
Research on intelligibility in dialect variations is also indirectly related to the
current study. For example, Clopper and Bradlow (2008) found that the effects of
moderate amounts of noise on intelligibility were different for different dialects of
American English. In addition, with increasing noise, listeners became poorer at
classification of the dialects, even when sentences remained intelligible. The authors note
that “at more difficult noise levels, participants cannot effectively adapt to dialect
variation in the acoustic signal and cross-dialect differences in intelligibility emerge for
all listeners, regardless of their dialect” (p. 175). This difficulty with adaptation in a noisy
situation may be comparable to what listeners experience during the single-talker
interference conditions in the current study.
Although the current study compares the performance of monolingual native
listeners repeating native- and non-native-accented speakers, there is an overlapping
literature about speech perception for non-native listeners, which shows some similar
consequences to those of native listeners listening to NNS. For example, Smiljanic and
Bradlow (2007) found that native and non-native listeners benefit similarly from clear

33
speech over plain speech by both native and non-native speakers. Clear speech is a mode
of speech that is automatically produced by speakers in adverse conditions, and
incorporates a range of features such as widened pitch variation, slowed rate, and
exaggerated contrasts among phonological categories (Smiljanic & Bradlow, 2007).
Conversely, Bradlow and Alexander (2007) suggest that non-native listeners are less able
to use higher-level compensatory information in challenging listening conditions. In other
words, non-native listeners are able to take advantage of contextual information, but need
greater signal clarity than native speakers in order to do so. Cooke et al. (2008) and
Lecumberri and Cooke (2006) also showed that non-native listeners experience greater
effects of both energetic and informational masking than native listeners. Shi (2010)
studied native listeners and bilingual listeners with different ages of acquisition of their
second language. He found that non-native speakers, even those who learned their second
language before the age of seven, were more vulnerable than monolingual listeners to
effects of acoustic degradation on their ability to use context in sentence repetition. All
these studies further support the idea, discussed also by Oxenham and Simonson (2009),
that reduced redundancy in the signal – or reduced ability on the part of the listener to
take advantage of redundancy – leads to greater masking effects.
Research on the speech perception of non-native listeners is directly relevant to
the current study based on the premise that both non-native listeners and native listeners
listening to non-native speech face similarly increased cognitive loads. One “top-down”
cognitive factor that affects speech perception is listener expectations. For example, in an
experiment in which participants listened to sentences in single- or mixed-talker blocks,
Magnuson and Nusbaum (2007) showed that listeners had slower responses during
34
mixed-talker blocks but that, for speakers with similar voices and vowel spaces, this
slowing disappeared when listeners believed they were only listening to a single talker.
One study suggesting that attention plays a role in the comprehension of difficult
or unfamiliar (e.g. accented) speech is Pallier, Sebastian-Galles, Dupoux, Christophe, and
Mehler (1998). The authors found that monolingual Spanish speakers actually benefited
more than bilingual speakers from transcribing compressed Catalan as training for
compressed Spanish. One explanation for this is that the monolingual speakers had to
concentrate more in order to transcribe an unfamiliar language, and perhaps this
intensified their training benefit. In addition, Francis and Nusbaum (2002) showed that
attending to different dimensions (or adjusting the weighting of different dimensions) is
crucial for learning new phonemic categories.
This dissertation incorporates a number of factors based on the existing research
about non-native speech intelligibility. For example, the current study focuses on
intelligibility, not proficiency, comprehensibility, or accentedness. By using the IEEE
sentence corpus and providing sentences rather than using spontaneous speech, the study
side-steps the issue of speaker proficiency. Intelligibility is more important than
comprehensibility in repeating the IEEE sentences, because they are designed to be
grammatical but not predictable, and scoring is based only on keywords correct and not
overall meaning. Listeners were not asked to rate speaker accentedness.
Based on the work of Rogers et al. (2004), Wilson and Spaulding (2010), and
Oxenham and Simonson (2009) regarding redundancy, in the current study it is
hypothesized that the NNS target conditions will be more susceptible to informational
masking effects; and, moreover, that lack of redundancy will have a greater effect on the
35
performance of the TBI group than on that of healthy controls. Finally, the fact that
attention can affect the ability to process speech in challenging situations in general, and
in unfamiliar language specifically (Francis & Nusbaum, 2002; Pallier et al., 1998),
suggests that NNS intelligibility is likely to be affected by attention. Moreover, because
individuals with TBI are known to have deficits of attention, it is reasonable to expect
that survivors of TBI may have greater difficulty with the proposed experimental task
than healthy controls.
Why Mixed Methods?
Historically, scientists avowed allegiance to either quantitative or qualitative
methods. These camps were at times so oppositional that proponents of quantitative
methods would dismiss the work of qualitative researchers as unscientific while
advocates of qualitative methods would dismiss quantitative work as being ecologically
invalid and ignoring the importance of individual variation (Cresswell & Plano Clark,
2007). Much has been written about the utility of mixing quantitative and qualitative
methods. As Cresswell, Plano Clark, Gutmann, and Hanson (2003) point out, the
complexities of social phenomena, including communication, make them particularly
suited to study using mixed methods. In the current project, a qualitative component is
included in the form of a semi-structured interview in order to supplement the primary,
quantitative component of the experiment. Mixing methods in this way combines
convergence and explanation: in other words, the results of the qualitative portion of the
study will be used both to provide an additional perspective on the phenomenon in
question (e.g. Cresswell & Plano Clark, 2007) and to provide explanation for the
36
quantitative results (e.g. Morse & Niehaus, 2009). More specifically, participants’
subjective descriptions of their experience with listening to speech in challenging
situations may provide further – and perhaps more nuanced – support for the findings of
their performance on the quantitative listening task. In addition, discrepancies or
complexities observed in the quantitative data may be explained by details present in the
qualitative interviews.
A further advantage to employing a mixed-methods approach is that it allows an
investigation of potential deficits at all three levels of the World Health Organization’s
International Classification of Functioning, Disability, and Health (World Health
Organization, 2001). In the World Health Organization classification, assessments of
such basic abilities concerned with body structures and “low-level” functions are
described as body/function-level abilities. Examples include motor movement of the legs
or verbal naming of pictures, and difficulties with this level of task are referred to as
impairments. In contrast, difficulties with activity-level tasks are called limitations, such
as difficulty with walking or talking on the telephone. Finally, participation-level
measures describe a person’s ability to function within his or her environment or social
context, and problems on that level are called restrictions. For example, climbing stairs to
get to class or carrying on a conversation in a crowded restaurant are participation-level
tasks. The sentence-repetition component of this experiment, while not a truly activity-
level task, is intended to model real-world behaviors so as to be a better measure of
activity-level performance than existing standardized tests.
One goal of this dissertation is to build on existing work to expand on the issue of
speech processing after brain injury using body/function-, activity-, and participation-
37
level measurements (standardized testing, sentence repetition, and interviews,
respectively). Specifically, the body/function-level part of the study uses standardized
assessments of memory, language, attention, dichotic listening, and other abilities
relevant to speech processing. The activity-level portion of the study involves participants
listening to and repeating target speakers with single-talker interference; target and
interfering talkers are one native-accented and one non-native-accented speaker of
English. Finally, the study explores participation-level speech processing effects using
semi-structured interviews to gather subjective information. The study uses a mixed-
methods design to accommodate this combination of quantitative and qualitative data
collection and analysis.
By studying the effects of one type of challenging listening situation on the
speech processing of those with and without TBI, and attempting to correlate those
effects with impairment- and participation-level abilities, the current study has the
potential to shape future research as well as to suggest ways of improving communication
for brain injury survivors. The choice to study the experience of monolingual listeners
interacting with non-native speakers has wide-ranging practical implications for modern
U.S. society.
Research Questions and Hypotheses
Overall, despite the heterogeneity of brain injuries and brain injury sequelae, it is
possible to paint a general picture of deficits that may affect the processing of speech in
challenging situations such as the current experimental task. Research has found that
individuals with TBI often experience deficits in central auditory processing,
38
accompanied by difficulties with processing speed and attention regulation. Research on
informational masking suggests that reduced access to signal redundancy increases the
difficulty of auditory speech stream segregation. Finally, research on the intelligibility of
non-native speech reinforces the importance of informational redundancy for accurate
comprehension, and suggests that typical listeners adjust very quickly to unfamiliar
speech.
This experiment is the first to explicitly attempt to test the associations between
impairment-, activity-, and participation-level measures of speech processing: these
measures are standardized assessments, the experimental sentence-repetition task, and
semi-structured interview, respectively. It has been found in various areas of TBI
research (e.g. Wilson, 2003) that day-to-day challenges encountered by high-functioning
TBI survivors are not always reflected on impairment-level assessments; for this reason,
the contribution of the qualitative component of the study is crucial. By comparing the
results of the interview portion of the study with the standardized testing and
experimental listening task results, a more thorough description of the effects of brain
injury on speech processing is developed than has been possible before. In addition,
comparisons between the filtered group in Experiment 1 and the TBI group in
Experiment 2 will offer further insight into the nature of the speech processing
difficulties faced by people with TBI. The combination of all these factors makes it
possible to develop research questions and hypotheses predicting the outcomes of the
experiments in this dissertation.

39
Experiment 1: Filtered vs. unfiltered speech (healthy controls only).
Research questions.
• Is the filtered group less accurate than the control group with the sentence repetition
task?
• Are participants less accurate in the NNS than the NS target speaker condition?
• Is there an interaction between group and target speaker (i.e. is the filtered group
more susceptible to target effect than the control group?)
• Does the filtered group report greater effort than the control group with the sentence
repetition task?
Hypotheses.
1. Within-group differences
• Accuracy will be lower in the non-native target/native masker (NNS-ns) block than in
the native target/non-native masker (NS-nns) block; and lower in the alone
condition than the attend condition.
• Subjective effort will be greater for the NNS-ns block than the NS-nns block; and
greater in the attend condition than the alone condition.
2. Between-group differences
• Accuracy will be lower for the filtered speech group than the unfiltered speech group.
• Subjective effort will be greater for the filtered speech group than the unfiltered
speech group.

40
3. Interactions
• There will be group-by-condition interactions such that the filtered group will obtain
less benefit from the NS target than the unfiltered group.
Experiment 2: TBI vs. healthy controls (unfiltered speech only).
Quantitative research questions.
1. Accuracy
• Is the TBI group less accurate than the control group with the sentence repetition
task?
• Are participants less accurate for the NNS than the NS target?
• Is there an interaction between group and target speaker (i.e. is the TBI group more
susceptible to target effects than the control group?)
• Was the TBI group more likely than the control group to repeat interfering words?
2. Effort
• Does the TBI group report more effort than the control group with the sentence
repetition task?
• Do participants report more effort for the NNS than the NS target?
• Is there an interaction between group and target (i.e. is the TBI group more
susceptible to target effects than the control group?)
41
3. Accommodation
• Does the control group accommodate faster than the TBI group? In other words, do
they improve more over the course of the experiment, resulting in order effects?
4. Standardized tests
• Are there correlations between standardized tests or demographic factors and
sentence repetition accuracy?
Quantitative hypotheses.
1. Within-group differences
• Accuracy will be lower and subjective effort greater for the NNS target than the NS
target.
• Accuracy will be lower and subjective effort greater in the attend condition than the
alone condition.
2. Between-group differences
• Accuracy will be lower and subjective effort greater for the TBI group than the
healthy control group.
• Accommodation effects will be reduced for the TBI group compared to the healthy
control group.
3. Interactions
• There will be group-by-condition interactions such that the decrements in accuracy

42
and effort across conditions will show different patterns for the TBI group than the
healthy control group. Specifically, the more challenging listening conditions (i.e.
NNS target in the attend condition) will affect the TBI group significantly more
than they will the control group.
4. Correlations
• Across groups, standardized measures of processing speed, attention, and/or working
memory will be associated with performance on the experimental task (i.e., faster
processing speed and better attention scores will predict better accuracy).
• Across groups, measures of central auditory processing will not predict accuracy on
the experimental task.
Qualitative and mixed-methods research questions.
• Is there a difference in how the two groups subjectively describe their speech
processing?
• To what extent do the interview reports (qualitative), standardized testing
(quantitative), and listening task (quantitative) results converge?
• In what ways do the interview (qualitative) data help to explain the listening task
(quantitative) results?
• Are there correlations between repetition accuracy and quantified interview data?
43
Mixed-method hypotheses.
• Interview reports of difficulty with listening to speech in challenging situations will
converge or correspond with poorer performance and/or greater effort on sentence
repetition tasks.
• Interview responses will reveal details of individual experience with challenging
listening situations, including strategies to compensate for difficulties, which will
augment and provide insight into performance on the sentence repetition task.
• Interview reports of difficulty with speech processing will show correlations with
reduced accuracy in the sentence repetition task.

44
Methods
Overview
This dissertation project consisted of two experiments. Experiment 1 compared
healthy adults without TBI or other neurological problems in filtered and unfiltered
versions of the experimental sentence repetition task. Experiment 2 compared adults with
and without TBI on the unfiltered listening task, and also included standardized testing
and interview components.
Figure 1 shows a diagram of the overall study design. The disproportionate
recruitment of control participants allowed Experiment 1 to compare filtered and
unfiltered speech, and provided sufficient numbers so that a subgroup could be matched
to the experimental group in Experiment 2 for age, education, and estimated verbal IQ.
General Procedures
All studies were approved by the University of Minnesota Institutional Review
Board (IRB). Sessions took place at Shevlin Hall at the University of Minnesota with
three exceptions, when standardized testing was conducted at participants’ homes. The
experimental sentence repetition task, hearing screening, and auditory processing tests
took place in sound-treated booths; all other procedures took place in quiet laboratory
rooms. Participants provided informed consent to participate, and were invited to take
regular breaks throughout the procedures.
Participants were compensated for participating. Those who were recruited
through the Psychology Department extra credit program were offered a choice between
extra credit points and cash. For those who were paid in cash, for Experiment 1 and the
first part of Experiment 2, they received five dollars plus an incentive of $0.05 per

45
keyword correct for accuracy in the better of the two attend condition blocks of the
sentence repetition task. Those who chose extra credit points also received the additional
$0.05 per keyword incentive. With a possible total of 150 words, this equaled a total
possible bonus of $7.50. This incentive system was used to encourage participants to
perform their best, particularly in the very difficult attend condition for the filtered group
of Experiment 1. All participants received a minimum of $7.50 in compensation (or $2.50
for those whose base compensation was extra course credit), regardless of their accuracy
scores. For the second part of Experiment 2, comprising the standardized testing and
interview, all participants were compensated $10 per hour.
Recruitment
Participants for Experiment 1 were largely recruited from undergraduate classes at
the University of Minnesota–Twin Cities using in-class presentations, fliers, and online
recruiting through the U of MN Department of Psychology website. The unequal number
of male and female participants in this study is partly due to having recruited participants
through classes in the Speech-Language-Hearing Science Department, whose student
body is predominantly female. The undergraduate population at the U of M is roughly
53% female (Education-Portal.com), and within the SLHS Department the percentage of
female students is much higher.
Several mechanisms were used in order to recruit participants for Experiment 2,
which included a group of adults with brain injury and a group of healthy controls
matched for age, education, and estimated verbal IQ. Some of the healthy controls were
participants from Experiment 1 who were recruited to participate in Experiment 2 based
46
on group matching of those three criteria (experimental task performance was not
considered, as sentence repetition accuracy was not analyzed until later). Table 2 lists all
healthy control participants, whether they completed the filtered or unfiltered version of
the sentence repetition task, and in which studies their data were included. There were
three participants who completed the experiment but whose demographics did not fit the
demographic matching needs of either experiment; these participants’ data were not
included in analysis, and they are not listed in Table 2.
In addition to the methods used for Experiment 1, some participants were
recruited from a database of prior research participants in the NeuroCognitive
Communication Lab. These individuals were contacted via telephone or email.
Additional recruitment was done via an advertisement placed in the Brain Injury
Association of Minnesota (BIA-MN) electronic newsletter, and through word of mouth.
All potential participants were screened using an IRB-approved demographic
questionnaire, either by email or over the telephone according to participant preference
(see Appendix 1). Criteria for inclusion for all participants in both experiments was that
they be between the ages of 18 and 65 and have no history of degenerative neurological
disorder, learning disability, significant substance abuse, or hearing loss. Two
participants did not disclose – or were not aware of – their hearing loss until after they
had been recruited. These two participants completed the experimental sentence
repetition task, but their data were not included in analysis, and they did not complete the
standardized testing or interview.
All participants were monolingual English speakers with no more than four
semesters of undergraduate second-language instruction. This criterion was chosen
47
because four semesters is the minimum graduation requirement for undergraduates in the
University of Minnesota College of Liberal Arts.
Inclusion criteria for the TBI group included having adult-acquired brain injury
events such as TBI, stroke, aneurysm, tumor resection, and anoxic brain injury; and being
six months or more post-onset or -injury (post-acute stage). Excluded diagnoses included
injuries acquired in childhood (younger than 18), encephalitis, meningitis, epilepsy or
other seizure disorder, and schizophrenia. As it happened, all but one participant in this
group had a traumatic brain injury, one participant (#1) having an acquired brain injury
due to a cerebral-spinal fluid (CSF) dysfunction. Potential participants were also
excluded if they had dysarthria severe enough to compromise intelligibility in the
sentence repetition task, or any aphasia beyond mild word-finding problems.
Participants
Participants in Experiment 1 were a group of 30 healthy young adults, aged 18–
26. Their demographic information is shown in Table 3. As shown in the table, the
groups were matched for age (unfiltered group mean 20.4 years; filtered group mean 20.8
years), education (unfiltered group mean 14.1 years; filtered group mean 14.3 years), and
estimated verbal IQ (unfiltered group mean 107.1; filtered group mean 108.1). None of
the group differences were significant for these characteristics.
Healthy participants who completed Experiment 1 were asked whether they
would be willing to return for the additional testing and interview to be included in
Experiment 2; all Experiment 1 participants agreed to this, and a subset from the
unfiltered stimulus group was invited back to complete the additional tasks of Experiment

48
2. As mentioned above, this selection was based on creating a group to match the TBI
group on age, education, and estimated verbal IQ.
Participants in Experiment 2 were twenty-six adults ranging in age from 18 to 59.
Demographic information for participants in Experiment 2 is shown in Table 4. Two
participants in the TBI group were disqualified due to hearing loss, and a third was
eliminated from analysis due to procedural problems. These three participants are not
listed in Table 4. As shown in the table, the groups were matched for age (control group
mean 33.6 years, TBI group mean 39.2 years); education (control group mean 15.2 years,
TBI group mean 14.6 years); or estimated verbal IQ (control group mean 112.5, TBI
group mean 112.1) for Experiment 2. None of the group differences were significant for
these factors.
Injury information specific to participants with TBI is shown in Table 5. The
mean time post injury was 11.3 years, and ranged from 2 to 40 years. Nine of the 13
participants had experienced a severe TBI, one had a moderate TBI, two had mild-
complicated injuries, and one experienced a CSF dysfunction resulting in intracranial
hypotension and brain injury.
In addition to age, education, and estimated verbal IQ, more detailed demographic
information was gathered for all participants during the initial screening. Questions were
asked about participants’ experience with foreign languages and musical expertise. The
former is relevant because the study of non-English languages could provide benefit to
listeners in the NNS-target conditions of the sentence repetition task. Information on
musical training was gathered because research by Oxenham et al. (2003) indicated that a
group of expert musicians experienced significantly less informational masking than

49
nonmusicians on a complex stream segregation task. Musical history was not a factor in
participant recruitment, so it is unlikely that any participants in this project would meet
the rigorous standards of musical training used by Oxenham et al.; nevertheless, musical
experience was considered as an exploratory demographic category.
Standardized Testing
A battery of standardized tests was given to all participants in Experiment 2 in
order to understand the cognitive and linguistic functioning of participants (see Table 6).
The rationale for testing these aspects of cognition (e.g. attention, processing speed, and
memory) and auditory processing is discussed in the introduction section. All TBI
participants and six of the 13 healthy control participants completed the auditory
processing tests on the same day as the listening task. The remaining seven participants
did the other standardized tests first, followed by the auditory processing tests at the end
of the second session. This was done so that if there were any fatigue effects of doing the
auditory processing tests at the end of the session, it would be similar across participants.
In other words, the auditory processing tests were done either at the end of session 1 or at
the end of session 2. The order of standardized tests was randomized across participants,
with the exception of the National Adult Reading Test (NART), which was done at the
beginning of session 1, for the purpose of matching estimated verbal IQ in both studies.
Group differences for standardized tests were evaluated using simple one-way ANOVAs,
and group means for each test are listed in Table 7. The full dataset of scores for each
participant can be found in Appendix 2.

50
Standardized testing was conducted in a quiet room for the cognitive tests and in a
sound-treated booth for tests of auditory processing. Participants were invited to take
breaks as desired between each test.
Tests of cognition and communication.
The Repeatable Battery for the Assessment of Neuropsychological Status (RBANS)
(Randolph et al., 1998) is a battery used to screen cognition and memory, including list
learning, story learning, semantic fluency, naming, coding, and other tasks. It provides
normed subtest scores of immediate and delayed memory, language, visuospatial skills,
and attention. The TBI group scored significantly lower than the control group on total
RBANS score. This is as predicted, given that the test is designed to assess areas
commonly affected by TBI such as memory and attention. The only subtests that were
significantly different between the groups were attention and language. The attention
subtest of the RBANS comprises a timed “coding” task (writing numbers corresponding
to a set of symbols) and a digit-span task. The language subtest includes a semantic
fluency task (naming as many fruits and vegetables as possible in one minute) and simple
picture naming. Because all participants were at ceiling for the picture naming task, the
significant difference between groups in this case can be entirely attributed to the
semantic fluency task, for which “language” is arguably a poor descriptor. The fact that
the other RBANS subtests did not show significant deficits for the TBI group supports
the assertion that the participants in this experiment were quite high-functioning.
The National Adult Reading Test (NART) (Nelson, 1982) is a measure commonly
used to estimate premorbid intelligence. The test was administered to all participants in

51
both Experiments 1 and 2 to enable group matching of verbal IQ. Groups were
deliberately matched on estimated verbal IQ scores, derived from the NART.
Tompkins’ Listening Span task (Tompkins, Bloise, Timko, & Baumgaertner,
1994) was used as a measure of verbal working memory. In this task participants hear a
series of short statements and must (1) indicate whether each statement is true or false,
and (2) remember the final word of each statement for reporting later. Final words are
recalled in sets of two, three, four, and five sentences. While both groups were at ceiling
on the true/false portion of this task, the control group was significantly more accurate
than the TBI group on the ability to recall the sentences’ final words.
The digits backward subtest of the Weschler Memory Scale–III (WMS-III)
(Weschler, 1997) was used as an additional measure of working memory, to supplement
the Listening Span task. The lack of group differences for this frequently used measure of
working memory demonstrates that participants in this study’s TBI group were high
functioning, with deficits manifesting only on more complex, language-based tasks such
as the Listening Span.
The Attention Process Training Attention Questionnaire (APT-II) (Sohlberg &
Mateer, 1996) was administered to measure self-report of attention difficulties.
Participants are presented with a list of statements such as “can’t keep mind on activity or
thought because mind keeps wandering,” and “easily lose place if task or thinking
interrupted” and are asked to check a box indicating how often the statement applies to
their daily functioning, ranging from “not a problem or no change from before” to “is a
problem all the time (affects most activities).” As predicted, people with TBI reported
significantly more difficulty with attention than healthy controls.
52
The Behavioral Assessment of Dysexecutive Function Dex questionnaire (BADS)
(Wilson, Alderman, Burgess, & Emslie, 1996) is a self-report questionnaire of executive
functioning, similar in structure to the APT-II questionnaire. Participants check a box
ranging from “never” to “very often” for a series of statements such as, “I have difficulty
thinking ahead or planning for the future,” or “I find it difficult to stop myself from doing
something even if I know I shouldn’t.” It was predicted that, like the APT-II
questionnaire, the BADS Dex questionnaire would show significant differences between
the control and TBI groups, but this was not the case.
The Decision Speed subtest of the Woodcock-Johnson III Test of Cognitive
Abilities (WJ-III) (Woodcock, McGrew, & Mather, 2001) was used as a measure of
processing speed. In this test, participants are presented with a series of rows of simple
pictures, and are asked to circle the two items in each row that “go together or are most
alike.” The TBI group was less accurate than the control group, indicating how many
items participants were able to complete within three minutes.
The trail-making subtest of the Delis-Kaplan Executive Function System (D-
KEFS Trails) (Delis, Kaplan, & Kramer, 2001) was used as another measure of executive
functioning, specifically in the contrast between the switching item (connecting
alternating numbers and letters) and non-switching items (connecting only numbers and
only letters). There were significant differences between groups in the combined letter-
sequence and number-sequence (no-switching) measure, and in the switching subtest.
However, once motor speed (subtest 5) was taken into account, the two groups were
almost identical, with the TBI group mean (and SD) standard score of 9.77 (2.0) and the
control group score of 9.77 (1.7).
53
An abbreviated version of the Western Aphasia Battery (WAB) (Kertesz, 1982)
was administered to participants in the TBI group, to ensure that they did not have
aphasia. No participant with a diagnosis of aphasia was included in the study, though
some reported occasional word-finding problems. No language errors were demonstrated
by any participant on this abbreviated administration of the WAB.
In addition to the tests described above, all participants were given a hearing
screening before the experimental listening task, in order to ensure that their hearing was
within normal limits. Participants were screened at 20 dB at 500, 1000, 2000, and 4000
Hz.
Tests of auditory processing.
Each participant in Experiment 2 completed three tests of central auditory
processing: the SCAN-A, the Masking Level Difference test (MLD), and the Gaps-in-
Noise test (GIN).
The SCAN-A Test for Auditory Processing Disorders in Adolescents and Adults
(SCAN-A) (Keith, 1986) is a test of auditory processing that consists of four different
subtests involving word repetition. The first is the filtered word subtest, the second is the
auditory figure-ground subtest (words are presented with a speech-like babbling noise in
the background), the third is the competing words subtest (a dichotic listening test with
different words presented in each ear), and the fourth is the competing sentences subtest
(dichotic listening for sentences). Only the first three subtests were administered for this
study. This was mostly due to time constraints: participants in the TBI group often took a
full two hours to complete their first session, and adding the fourth SCAN-A subtest
54
would have extended the time an additional 5 to 10 minutes. Also, the fourth subtest is a
dichotic sentences task in which participants repeat back the sentences heard in one ear
while ignoring sentences heard in the other ear. Given the overlapping content between
subtest 4, subtest 3 (dichotic word repetition), and the experimental listening task (single-
talker interference sentence repetition), it was felt that this subtest would not provide
enough additional information to justify the extra time required.
The MLD test (Auditec, 1999) is designed to test central auditory processing at
the level of the brainstem (e.g. Jiang, McAlpine, & Palmer, 1997). Listeners repeat
spondee words that are presented with background noise; the words decrease in intensity
until they become inaudible. The list is repeated twice: first in the SoNo condition, then
in the SπNo condition, in which the phase of the noise is inverted relative to the signal.
The test is designed so that a masking level difference of less than 5 dB between the two
conditions indicates impaired functioning.
The GIN test (Musiek et al., 2005) was used as a test of gap detection, a measure
of temporal auditory processing. The test is designed to measure the shortest gap of
silence that listeners can hear within six-second periods of noise. Several different tests
have been developed to test gap detection, including the Random Gap Detection Test
(RGDT) (Keith, 2000), the Adaptive Test of Temporal Resolution (Lister, Roberts,
Shackelford, & Rogers, 2006), and the GIN. Musiek (2005) found a significant difference
in gap detection threshold between a healthy control group (4–5 ms) and a group of
adults with central auditory system deficits (7–8 ms). Samelli and Schochat (2008) also
tested the GIN on a group of 100 healthy young adults (age 18–31) and found 96%
detection accuracy for gaps of 5 ms or longer. Finally, Zaidan, Garcia, Tedesco, and
55
Baran (2008) compared a group of young adults on the GIN and RGDT and found that
the gap detection threshold was significantly better for the GIN, but that males performed
better than females on both tests; in addition, they found no difference in thresholds
between ears. They also found the GIN to be preferable for scoring and application.
Based on this previous research, the GIN was chosen as a measure of gap
detection for the current study, but a modified version was used. The original test
provides cutoff scores for “disordered” performance based on a series of four subtests
with thirty-five items each. In each subtest, participants hear six-second bursts of
broadband noise, punctuated by occasional “gaps” of silence. The number of gaps in each
trial ranges from zero to three, and gaps are 2, 3, 4, 5, 6, 8, 10, 12, 15, or 20 ms in
duration. Each duration occurs six times per subtest, and the full administration of the test
takes about 40 minutes. This reason, as well as poor availability of norming data and
inconvenient design for participant response, led to the decision to use a modified
administration for the current study.
The method of participant responses on the GIN was altered in several ways. The
scoresheet indicates both the duration of each gap and its relative position within the trial:
early, middle, or late. The administrator is supposed to judge response accuracy based on
the timing of when participants press a response button. The described button response
system was not available for use in this study; moreover, the methodology would be
problematic for use with groups with potentially different processing and motor speeds,
such as the adults with and without TBI in this project. Therefore, an alternative response
scheme was developed, in which participants counted the number of gaps they heard and
reported the number to the experimenter after each trial. They were told at the beginning

56
of the test that there might be zero, one, two, or three gaps in each item. In fact, this
alternative method was used as a backup system by Samelli and Schochat (2008) on trials
when participant button responses needed clarification. By participant report, and based
on the six-second trial time and participants’ performance on the assessments of working
memory described elsewhere, short-term memory abilities were not judged to be a
limiting factor in participants’ ability to give responses in this way.
The other difficulty with conducting the GIN as designed is the time required for
administration. Because the GIN was one component of a two-hour session including the
experimental listening task and the two other auditory processing tasks described above,
it was not reasonable to devote 40 minutes to this test alone. Respecting participants’
schedules and avoiding fatigue and boredom were judged to outweigh the benefits of
administering the entire test as designed. Instead, only the first of the four subtests was
done, along with practice trials from the original design. Participants did ten practice
items in the right ear first, ensuring that they understood and were able to complete the
task; then the first 17 items of subtest 1 were administered to the right ear, and finally the
remaining 18 items of subtest 1 were administered to the left ear (totaling 35).
Because of the modifications described here, the results of the modified GIN are
used only for comparisons within this study; no conclusions are made in the Results
section regarding how study participants compare to the norms published with the test.
Procedural Overview
Procedures for the project comprised four parts: the experimental sentence
repetition task, standardized assessments of cognition and communication, tests of
57
auditory processing, and the semi-structured interview. All participants completed the
sentence repetition task and NART (for the purpose of matching estimated verbal IQ
between groups), but only participants in Experiment 2 completed the rest of the
standardized testing and the interviews. Figure 2 shows the procedure for Experiment 2 in
more detail. All participants in both Experiment 1 and Experiment 2 completed the
experimental listening task shown in the left-most column, but only participants with TBI
and the matched control subgroup completed the standardized testing and semi-structured
interview.
Participants in Experiment 1 were scheduled for a single session. Participants in
the TBI group of Experiment 2 were scheduled for two research sessions, ranging from
one day to 28 days apart, based on scheduling convenience. The mean time between
sessions was 7.7 days (SD 7.3). The first session included the experimental sentence
repetition task and standardized tests of auditory processing, and the second session
included standardized testing and the semi-structured interview. One exception to this
was participant #3 in the TBI group, who completed the testing in reverse order, with the
standardized testing and interview at her residence, due to transportation problems. Of
necessity, most participants from Experiment 1 who were invited back to complete the
interview and testing for Experiment 2 completed the listening task first, and had a longer
delay between the two sessions, ranging from five to 161 days. The mean time between
sessions for controls was 58.2 days (SD 44.0). Of the 14 control participants recruited for
Experiment 2, six of them completed auditory processing tests during session 1 (like the
TBI group).
58
Stimuli
Listeners were asked to repeat back sentences from the IEEE corpus (IEEE,
1969), which consists of 72 blocks of sentences, with 10 sentences per block and five
keywords per sentence. The sentences are designed to be syntactically and semantically
correct but low-context. For example, when a listener hears “The birch canoe slid on the
smooth ____” it is difficult to predict the final word “planks.”
The order of presentation was randomized across participants, and block order
within both the alone and attend conditions was counterbalanced across participants. This
led to four possible sequences for the experiment, listed in Table 8. These orders were
assigned to participants sequentially (e.g. the first participant scheduled did sequence I,
the next did sequence II, and so on).
Recording.
Recordings for all the stimuli except practice sentences were made using an AKG
C420 condenser microphone and a Marantz Professional CDR 300 CD recorder in a
sound-treated booth. The sentences used in the practice block were recorded by two
speakers different from those used in the main task, and were recorded using a laptop
computer and microphone in quiet rooms. This difference in recording procedure was not
a concern because the purpose of the practice block was to accustom participants to the
task, and the data from practice responses were not to be considered in the analysis.
Informal evaluation by two listeners determined that the practice sentences did not differ
noticeably in quality from the experimental sentences.
All four speakers – two each for the practice and experimental blocks – were
59
female. The target speaker in the practice block was a native speaker of mainstream-
American English (NS), and the distracter was a speaker of Hindi-accented English
(NNS). In the experimental blocks, one speaker was a native speaker of mainstream-
American English (NS) and the other was a speaker of Mandarin-accented English
(NNS). The two speakers for the experimental blocks were chosen to have similar mean
fundamental frequencies. Fundamental frequency was scaled in equivalent rectangular
bandwidth (ERB) (Hermes & van Gestel, 1991), as these have been shown to be better-
correlated with judgments of vocal pitch than are measures in Hertz. Mean F0 was
approximately 4.56 ERB and 4.51 ERB for the NS and NNS, respectively (ranges 2.3–5.0
and 1.7–5.3). Stimuli were presented as mono audio signals in order to maximize
informational masking. As discussed in the introduction section, differences in sex,
intensity, or spatial location can serve as cues for stream segregation, even in the
presence of a negative SNR that would increase energetic masking (e.g. Brungart, 2001).
Stimulus selection.
For the purposes of this study, a total of 160 sentences from the IEEE corpus were
used, consisting of 10 sentences x 2 speakers for practice; 10 sentences each for two
alone condition blocks; and 30 sentences x 2 speakers each for two attend condition
blocks. A list of all sentences and sentence pairs is provided in Appendix 3.
The first step in selecting the 160 sentences from the 720 available in the IEEE
corpus was to eliminate from the list any sentence not beginning with “the.” This was
done in an attempt to make sure that, in the attend condition, one voice would not be
more salient or intelligible due to different sentence onsets. Next, the pool of sentences
60
was restricted to those from six to nine words long, in order to limit the working memory
burden potential in repeating longer sentences. These sentences were split into two sets
for recording by the two volunteer speakers. Items were discarded in the few instances
when the non-native-accented speaker made pronunciation errors that suggested she was
not familiar with the word (as opposed to pronunciations simply consistent with her
accent). Items were also discarded in a few cases when the recording levels for the
native-accented speaker produced a recording artifact. This final step narrowed the pool
to the requisite 160 sentences.
After the sentences were recorded, sentence pairs were created such that the
keywords in each pair aligned to occur in the same sentence positions. For example, in
the following sentence pair, the keywords (capitalized) for both sentences are the second,
third, fourth, sixth, and seventh words:
The GRASS CURLED AROUND the FENCE POST.
The PLAY SEEMS DULL and QUITE STUPID.
Pairing sentences in this way was intended to increase the likelihood that keywords
would acoustically overlap, rather than alternate, in the combined sound stream heard by
participants.
It is worth noting that Helfer and Freyman (2009) developed a different set of
stimuli that they specifically designed for speech interference experiments. In their TVM
corpus, the listener is cued to the target sentence using a target name (Theo, Victor, or
Michael). The authors found that cuing listeners with the name versus a voice sample
made little difference in their ability to repeat the sentences. They also found that voices
that are similarly affected by energetic masking can be differentially affected by
informational masking. IEEE sentences rather than TVM sentences were used for this

61
experiment for consistency with a precursor study about energetic masking release in
adults with and without TBI (Krause et al., 2009).
Editing.
All sentences were converted to mono and sound files trimmed using Goldwave
software (www.goldwave.com). Trimming was done by zooming to a window of
approximately 0.05 sec around the sentence onset, and cutting silence up to the point of
the first visible waveform.
The next step in the process of editing the stimuli was to match durations for each
sentence pair. This was done by calculating the average duration for each pair using Praat
software (Boersma & Weenink, 2011) and then lengthening the shorter sentence and
shortening the longer sentence so both equaled the average. The experimenter and two
independent listeners judged the naturalness of these duration-adjusted sentences and
determined that lengthening or shortening the sentences up to 25% resulted in acceptably
natural-sounding sentences. Sentence pairs whose differing lengths would have required
greater than 25% duration adjustment were discarded and replaced with alternates.
The twenty sentences used in the alone condition were chosen from the pool of
sentences that were either never paired or whose pairings were discarded because of
mismatched durations. These “alone” sentences were shortened or lengthened in a
pseudo-random pattern designed to mimic the distribution of duration manipulations
among the paired sentences.
After duration adjustments were completed, 150 ms of silence was added to the
beginning of each sentence file as a buffer between trial onset and sentence onset during

62
the experimental procedure. The intensity of each sentence was then adjusted to 70 dB
using Praat’s intensity scaling tool. Finally, each sentence pair was combined into a
single stereo .wav file, which was then compressed into a mono file for use in the
experimental protocol.
For Experiment 1, a final step was required to develop stimuli for the filtered
condition. All sentences and sentence pairs were filtered with a 1400 Hz low-pass band
pass filter using Goldwave’s batch processing function, which can apply the same
process to multiple files. The purpose of this filtering was to simulate the effects of a
peripheral hearing loss. Precedent for this procedure includes Wang et al. (1978), who
found that, for CV and VC nonsense syllables with 1400 Hz low-pass filtering, listeners
with normal hearing demonstrated consonant confusion similar to listeners with high-
frequency hearing loss; they also found that 2800 Hz high-pass filtering produced results
similar to those of listeners with flat or rising audiograms. Fabry and van Tassell (1986)
showed similar findings based on a study whose participants each had one normal ear and
one ear with hearing loss, using filtering as low as 7500 Hz. Oxenham and Simonson
(2009) used low-pass filtering at 1200 Hz and high-pass filtering at 1500 Hz for their
simulations. For the current study, pilot testing was done with low-pass filters at 1200,
1400, and 1600 Hz and a high-pass filter at 2800 Hz. The 1200 Hz filter resulted in
accuracies near zero in the single-talker interference task, and the high-pass filter was
reported by listeners to be annoying and difficult to listen to. Therefore, the 1400 Hz
filter was chosen for this study based on a combination of maintaining consistency with
previous research, sensitivity of measurement (keeping scores off floor), and positive
listener experience.
63
Sentence Repetition Task Procedure
The experimental sentence repetition task was completed by all participants in
both Experiment 1 and Experiment 2. Participants were seated in a sound-treated room
and, before starting the experimental task, they were given a hearing screening using a
screening audiometer to ensure that their hearing was within normal limits. The screening
used a 20 dB signal at 500, 1000, 2000, 3000, and 4000 Hz. Participants #13 and #16 in
the TBI group, and #11 in the control group, had thresholds of up to 30 dB for one ear at
4000 Hz, and participant #22 in the control group had a threshold of 30 dB at 4000 Hz in
the right ear and 25 dB at 2000 Hz in the left ear. All other participants were able to
detect the signal at 20 dB in both ears for all frequencies tested. Two participants in the
TBI group were disqualified when the hearing screening revealed more significant
hearing difficulties, but completed the listening task anyway so as not to have wasted
their visit to the University. Data for these two participants are examined briefly in the
Discussion section.
All experimental procedures were recorded using a digital audio recorder (either a
Zoom Handy Recorder H2 or an Olympus WS-500M). The experimenter also scored the
sentence repetition task on paper in real time. The procedure began with a screen of
written instructions, accompanied by a simultaneous audio recording of the instructions.
Participants pressed the space bar to advance from this screen, and the experimenter then
asked if the participant had any questions. The next step was a sample audio file
presented as an example of how loud the sentences would be in the upcoming
experiment; participants were invited to indicate whether they wanted the sound louder,
or quieter, or preferred it to stay the same. Loudness was initially set at approximately 70

64
dB for all participants, and the experimenter then adjusted the loudness as requested. At
the end of this setup phase, participants were invited to ask any questions about the
procedure.
Presentation of stimuli.
Stimuli in the sentence repetition task included five blocks of sentences: one
practice and four experimental (see Figure 2). After having an opportunity to adjust the
loudness of the stimuli, participants again pressed the space bar to indicate they were
ready to proceed to the practice block. The time between the presentation of the “press
the space bar when you are ready to continue” instruction and when the participant
pressed the space bar to advance to the next trial was recorded by E-prime, but no other
response time measures were gathered. Methods of measuring response time for this type
of task often require participants to limit their movement, even with head-mounted
microphones. Therefore, for the sake of naturalness and comfort, it was decided that
precise response time measures were not a priority for this experiment.
Practice block.
The practice block consisted of 10 sentence pairs, spoken simultaneously by two
female speakers. The purpose of the practice block was simply to familiarize participants
with the single-talker interference protocol. After participants pressed the space bar to
indicate that they were ready to begin, a screen displayed, “In the sentences coming up,
you will hear two voices at the same time. Press the space bar and you will hear an
example of the voice that you should listen to and repeat back.” When participants

65
pressed the space bar, a sample sentence of the target speaker was played. Next, the
display read, “Now you will hear two voices at the same time. Remember, only repeat
back the sentences spoken by the example voice you just heard. Just guess if you are not
sure. Press the space bar when you are ready to continue.” When participants pressed the
space bar this time, the first trial of the block was presented. Each auditory sentence
presentation was accompanied by a visual display stating, “Listen and repeat.” This
screen displayed for 2 seconds (with the 150 ms lag built in to the beginning of each
sound file), followed by 2 seconds of a blank screen, followed by the prompt, “Press the
space bar when you are ready to continue.”
Experimental blocks 1 and 2: alone condition.
Each of the first two experimental blocks comprised ten sentences, in
counterbalanced order among participants, of the two experimental speakers in quiet
(with no background noise or second speaker). Specific procedures were the same as for
the practice block, but without the sample target voice because each block had only one
speaker.
Experimental blocks 3 and 4: attend condition.
Each of the last two experimental blocks comprised thirty sentence pairs of both
speakers (NS and NNS) at the same time. Participants were asked to repeat back only one
of the speakers for the first block, and the other speaker for the second block, with order
counterbalanced among participants. Specific procedures were the same as for the
practice block.

66
Effort.
After each of the four blocks, participants were asked to rate the level of effort
required to understand the target sentences on a visual scale from 0 (no effort) to 10
(extreme effort) by clicking with the computer mouse on the equal-appearing interval
scale. Figure 3 shows the screen that was used for effort ratings. The experimenter also
noted the participant’s responses on a paper form for later follow-up, shown in Appendix
4. After the conclusion of block 4 of the sentence repetition task, participants were shown
the ratings they had made during the task. The experimenter verbally reviewed which
ratings were for which block, and asked, “Can you please tell me more about what was
behind your ratings?” The analysis presented here is based on the numerical ratings, but
follow-up qualitative responses were audio recorded for future analysis.
Semi-Structured Interviews
The qualitative portion of this study comprised a semi-structured interview in
which participants discussed their individual experiences of speech processing in
challenging situations and, in the case of participants with TBI , if and how that
experience has changed since their injury (see Appendix 5). All interviews were
transcribed, and the utterances of the interviewees were parsed into quotations; a list of
thematic codes was then developed based on these quotations, and each quote was
labeled with one, two, or three appropriate codes. Both qualitative and mixed-methods
results based on the interviews are presented in the next section.
The goal of the qualitative analysis was to determine whether the two participant
groups reported different subjective experiences of complex speech processing. The
67
mixed-methods analyses are used to help explain the quantitative results, and are also
quantified for correlational analyses with the sentence repetition and cognitive testing
data. Interviews were conducted on the same day as standardized testing (i.e. not on the
same day as the experimental listening task) in order to minimize direct association of the
two for the participants.
Analyses
Dependent variables in the sentence repetition task were accuracy and effort.
Accuracy was measured as the proportion of key words correctly repeated (five possible
per sentence; 50 total in each alone block and 150 in each attend block). Effort ratings
from 0 to 10 were made after each block within the listening task, and were compared as
raw numbers. In summary, quantitative dependent measures were accuracy (proportion)
and subjective effort ratings (0–10). Independent variables were group (filtered vs.
unfiltered in Experiment 1 and TBI vs. control in Experiment 2), target voice (NS vs.
NNS), and condition (alone vs. attend).
Statistical analysis.
For both Experiment 1 and Experiment 2, the primary analysis used a three-way
repeated measures ANOVA: group x target x condition, with presentation order (NS vs.
NNS first in the attend condition) nested within group. Group was a between-subjects
factor while target and condition were repeatable within-subjects factors. In addition,
linear mixed-effects modeling was completed for Experiment 2 using item-by-item
scoring of the experimental sentence repetition task. This method can account for random

68
item effects (e.g. Baayen, Davidson, & Bates, 2008) which, in this case, were sentences
and trial number, or order of item presentation. Exploratory correlations were calculated
among sentence repetition accuracy and several demographic features and cognitive test
scores. Linear regressions were performed to compare effort ratings and accuracy, to
determine whether higher accuracy was associated with greater or lesser effort.
Qualitative analyses were conducted by identifying themes within transcribed
interviews. As described above, quotes were tabulated from each interview, and up to
three thematic codes were assigned to each quote. For the mixed-methods analysis,
interview data were quantified by tabulating the total number of quotes for each
participant, the number of times participants mentioned each theme, and the number of
participants in each group who mentioned each theme. Finally, the number of specifically
negative themes mentioned by each participant was counted for comparison between
groups. Between-group comparisons were done using univariate ANOVA.
Reliability
All sentence repetition sessions and tests of auditory processing were
administered by the principal investigator. Other standardized testing was completed by
the principal investigator and two research assistants. Scoring was done by the author and
a research assistant.
Reliability checking was done on 20–23% of test protocols (three per participant
group). One undergraduate research assistant checked scoring on standardized tests and
the sentence-repetition task; this involved rescoring all standardized tests of cognition for
three participants per group, recounting responses on answer sheets for the sentence-
repetition task for three participants per group, and rescoring the sentence-repetition task
69
for three other participants in each group based on audio recordings of the experiment
sessions. Inter-rater reliability for standardized test scoring was 98%; reliability for
counting sentence repetition scores was 99.99%.
Another undergraduate research assistant assisted with transcribing and did
reliability checking on three interviews per group. Reliability checking consisted of
listening to the audio recording of the interview while reading the transcription and using
Microsoft Word’s “track changes” function to note discrepancies. The primary
investigator checked for reliability on one of the research assistant’s six transcriptions,
and the research assistant checked for reliability on three of the principal investigator’s
20 transcriptions. Inter-rater reliability for the interview transcriptions was 97.5%.
Finally, a graduate research assistant was given the list of 45 thematic codes for
the semi-structured interviews, along with descriptions and examples of each code, and
recoded quotes that the primary investigator had extracted from the interviews of three
participants. Inter-rater reliability for this coding was 73%.

70
Results
Results from both experiments are summarized below. The purpose of
Experiment 1 was to determine the effects of peripheral deficits on a sentence repetition
task. This was accomplished by comparing accuracy and effort ratings on the sentence
repetition task for healthy participants in groups presented with filtered versus unfiltered
stimuli. The purpose of Experiment 2 was to determine the effects of TBI on the same
sentence repetition task that was used in Experiment 1. This was done by comparing a
group of adults with TBI to a group of age-, education-, and verbal IQ-matched healthy
controls on the unfiltered version of the experimental sentence repetition task. In
addition, Experiment 2 examined whether participants demonstrated accommodation to
the task by measuring improvement over the course of the experiment; it also included
exploratory correlations between sentence repetition accuracy and standardized tests of
cognition and auditory processing. Finally, Experiment 2 included semi-structured
interviews in which participants discussed their subjective experiences with complex
speech processing.
Experiment 1
The primary research questions for Experiment 1 were whether a peripheral
auditory deficit simulated with filtering would result in reduced accuracy or increased
effort on the experimental sentence repetition task, whether participants were less
accurate or reported more effort in the NNS than the NS condition, and whether there was
an interaction between group and target such that the filtered group was more susceptible
to target effects than the control group. Results for each condition are discussed in detail
71
in the sections below. Because performances of the filtered group in the attend condition
of Experiment 1 were initially near floor, these data were analyzed using randomized
arcsine unit (RAU) transformation. In addition, during data collection, it was noted that
many participants missed the same word spoken by the NNS (“rags” in the sentence The
SMELL of BURNT RAGS ITCHES my NOSE). Therefore, this word was excluded from
scoring. These modifications are reflected in Table 9 and Figure 4, which show the mean
accuracies for each group in Experiment 1.
A three-way repeated-measures ANOVA was used to analyze the results of
Experiment 1, in which group (filtered vs. unfiltered) was a between-subjects factor while
target (NS vs. NNS) and condition (alone vs. attend) were repeatable within-subjects
factors. The affect of block order was considered; a model incorporating order as a nested
variable within groups showed that the effect of order was not significant. Therefore,
order was not considered in the model reported here. Statistics for this analysis are shown
in Table 10.
As shown in Table 10, there were significant main effects for group, condition,
and target in Experiment 1, such that the unfiltered group had higher accuracy than the
filtered group, the alone condition had higher accuracy than the attend condition, and the
NS target had higher accuracy than the NNS target. In addition, there were significant
two-way interaction effects for condition x group, target x group, and condition x target;
and a three-way interaction effect for condition x target x group.
Figure 5 illustrates the three-way interaction between condition, target, and group
for accuracy in Experiment 1. Pairwise comparisons for the components of the three-way
interaction using two-sample t-tests assuming unequal variances showed numerous

72
significant differences. Within the alone condition, the unfiltered group differed from the
filtered group for the NS target, t(14) = 7.96, p = 7.29 x 10⁻⁷, and the NNS target, t(15) =
26.27, p = 2.94 x 10⁻¹⁴, where the unfiltered group was more accurate in both
comparisons. For the filtered group in the alone condition, the NS target was significantly
more accurate than the NNS target, t(27) = 11.13, p = 6.82 x 10⁻¹², but this was not the
case for the unfiltered group, where the same difference was only a trend toward
significance, t(25) = 1.45, p = 0.08.
Within the attend condition, the unfiltered group was more accurate than the
filtered group for both the NS target t(22) = 15.21, p = 1.85 x 10⁻¹³, and the NNS target,
t(22) = 20.20, p = 5.42 x 10⁻¹⁶. Within the filtered group in the attend condition, the NS
target was more accurate than the NNS target, t(28) = 5.19, p = 8.32 x 10⁻⁶, but, like the
alone condition, for the attend condition there was no significant difference in accuracy
between the NS and NNS target for the unfiltered group, t(27) = 0.70, p = 0.24. Between
the alone and attend conditions, the alone condition was consistently significantly more
accurate: for the unfiltered group NS and NNS targets, t(14) = 10.42, p = 2.79 x 10⁻⁸ and
t(15) = 12.39, p = 1.39 x 10⁻⁹, respectively; and for the filtered group NS and NNS
targets, t(22) = 24.92, p = 6.44 x 10⁻¹⁸ and , t(18) = 20.07, p = 4.54 x 10⁻¹⁴, respectively.
With a simple Bonferroni correction, in which the significant p value is divided by the
number of comparisons analyzed in the interaction the significant differences remained
significant. In this case, twelve comparisons were required by the three-way interaction,
resulting in an adjusted p = 0.004.
In summary, the explanation of the three-way interaction between condition,
target, and group for Experiment 1 accuracy scores has several components. First, while

73
the filtered group did significantly more poorly on the NNS target than the NS target in
both conditions, the unfiltered group scores were essentially the same for each target.
Second, as shown in Figure 5, this decrease in accuracy was more pronounced for the
filtered group in the alone condition than in the attend condition, perhaps partly due to
near-floor effects observed in the attend condition. In fact, the filtered group’s accuracy
dropped precipitously between the alone and attend condition, a difference of 66% for the
NS target and 40% for the NNS target, compared to decreases of 34% and 32% for the
unfiltered group.
In addition to accuracy, Experiment 1 also compared effort ratings. Table 11 and
Figure 6 show the mean effort ratings for each group. Similar to the accuracy analysis, a
three-way repeated-measures ANOVA was used to analyze the effort ratings in
Experiment 1, in which group (filtered vs. unfiltered) was a between-subjects factor while
target (NS vs. NNS) and condition (alone vs. attend) were repeatable within-subjects
factors. Statistics for this analysis are shown in Table 12.
As shown in Table 12, there were significant main effects for group, condition,
and target in the effort comparisons for Experiment 1, such that the filtered group
reported greater effort than the unfiltered group, the attend condition required more effort
than the alone condition, and the NNS target was more effortful than the NS target. In
addition, there were significant two-way interaction effects for condition by target and
condition by group. Figures 7 and 8 illustrate these interactions.
As shown in Figure 7, the condition by target interaction involves several
significant differences. Two-sample t-tests assuming unequal variances revealed that the
NNS target was more effortful than the NS target in the alone but not the attend

74
condition, t(58) = -4.03, p = 8.31 x 10⁻⁵ and t(57) = -1.01, p = 0.16, respectively; and the
attend condition was more effortful than the alone condition for both the NS and NNS
targets, t(40) = -11.25, p = 2.88 x 10⁻¹⁴ and t(42) = -6.50, p = 3.82 x 10⁻⁸, respectively.
The interaction, therefore, may stem from the fact that effort was uniformly high
throughout the attend condition, whereas in the alone condition participants reported
significantly higher effort for the NNS than the NS target.
For the condition by group interaction, as shown in Figure 8, all t-test
comparisons were significant. The filtered group reported higher effort in both the alone
and attend conditions, t(58) = -7.82, p = 6.16 x 10⁻¹¹ and t(45) = -4.70, p = 1.22 x 10⁻⁵,
respectively; and the attend condition was significantly more effortful for both the
unfiltered and filtered groups, t(48) = -13.28, p = 5.43 x 10⁻¹⁸ and t(36) = -8.43, p = 2.44
x 10-10, respectively. Therefore, this interaction is less clear to explain than the condition
by target interaction; however, the slope of change between groups appears higher for the
alone condition than the attend condition. Therefore, the interaction may be due to greater
effort effect in the alone condition compared to the attend condition. In other words,
effort was similarly high for both groups in the attend condition, possibly a near-ceiling
effect, whereas in the alone condition there was a larger increase in effort for the filtered
group compared to the unfiltered group.
As with the accuracy analyses, Bonferroni corrections do not result in any
changes in significance for the effort interaction t-tests in Experiment 1. In this case, four
comparisons result in an adjusted significant p = 0.0125.
In summary, the findings of Experiment 1 support the hypotheses that participants
in the filtered group would demonstrate poorer accuracy and higher effort than those in
75
the unfiltered group. They also partly support the hypothesis that the NNS target would
have lower accuracy and higher effort than the NS target: this was the case more so for
the alone condition than for the attend condition. The prediction of a group by target
interaction was supported, in that the filtered group was more adversely affected by the
NNS target than was the unfiltered group. Moreover, the three-way interaction for
accuracy scores suggests that the differential effect of NNS target for the filtered group
was most pronounced in the alone condition, whereas in the attend condition both targets
were near floor for the filtered group.
Experiment 2
In contrast to Experiment 1, which tested two groups of healthy adults with
different types of stimuli, Experiment 2 tested two different groups, adults with and
without TBI, using the same unfiltered stimuli. The first analysis paralleled the analysis
used in Experiment 1, comparing mean sentence repetition accuracies and effort between
conditions, groups, and targets using repeated-measures ANOVAs. Accuracies were also
compared between the target and interfering speakers in the attend condition in order to
more thoroughly assess group differences in the ability to ignore the interfering speaker
while repeating the target. The second research question to be addressed was whether the
control group learned or accommodated faster than the TBI group to the single-talker
interference task and to the less-familiar, non-native accented speaker. Next, an
exploratory correlation matrix was developed to examine whether standardized test
results were associated with performance on the experimental sentence repetition task.
Finally, results are presented based on qualitative and mixed-methods analyses of data
from the semi-structured interviews that were conducted.

76
Sentence repetition task.
In order to assess whether mean accuracies were different between groups,
conditions, or target speakers in Experiment 2, a three-way repeated-measures ANOVA
similar to the one applied to data from Experiment 1 was used to analyze accuracy data
from Experiment 2. As with Experiment 1, many participants missed the word “rags”
during the NNS target block of the alone condition: in Experiment 2, only two
participants in each group repeated it correctly. Therefore, the mean scores reflect
proportions correct out of 49 words, excluding “rags,” in the NS alone block, in order to
more precisely reflect the accuracy for each group. Mean accuracies for each group in
each condition are shown in Table 13 and Figure 9.
Like in Experiment 1, presentation order was considered as a possible factor, but
a model incorporating block order as a nested variable within group showed that the
effect of order was not significant. Therefore, order was not considered in the primary
model, a three-way repeated-measures ANOVA in which group (TBI vs. control) was a
between-subjects factor while target (NS vs. NNS) and condition (alone vs. attend) were
repeatable within-subjects factors. Results of this analysis are shown in Table 14.
As shown in Table 14, there were significant main effects for group, condition,
and target in the accuracy comparisons for Experiment 2. The control group overall was
more accurate than the TBI group; the alone condition was more accurate than the attend
condition; and the NS target was more accurate than the NNS target. In addition, there
was a significant interaction between condition and target and a trend toward significance
for the condition x group interaction.

77
As shown in Figure 10, the condition x target interaction involves several
significant differences. Two-sample t-tests assuming unequal variances revealed that,
within both the alone and attend conditions, the NS target was more accurate than the
NNS target, t(31) = 1.84, p = 0.03 and t(49) = 1.95, p = 0.03, respectively. In addition,
the alone condition was significantly more accurate than the attend condition for both the
NS and NNS target, t(25) = 12.70, p = 1.06x10⁻¹² and t(27) = 13.08, p = 1.70x10⁻¹³,
respectively. With Bonferroni corrections (modified p = 0.0125 criterion), only the alone
vs. attend differences remain significant. This pattern of significant differences in the
condition by target interaction may be explained by the greater decrease in accuracy
between the NS and NNS targets for the attend condition compared to the alone
condition. In the attend condition, there was a nearly 10% drop in accuracy for the NNS
target, whereas in the alone condition both targets were near ceiling, with the NNS target
only 1.5% lower than the NS target.
The condition by group interaction, which showed a trend toward significance, is
illustrated in Figure 11. While the interaction is not significant, the pattern of responses
here suggests that the TBI group may have had a greater decrement in accuracy with the
attend condition than did the control group, though both groups showed significant
decreases, t(27) = 12.45, p = 5.30x10⁻¹³ and t(25) = 15.22, p = 1.90x10⁻¹⁴, respectively.
Effort ratings were assessed in the same way as accuracy, first eliminating block
order as a significant factor and then using a three-way repeated-measures ANOVA in
which group (TBI vs. control) was a between-subjects factor and condition (alone vs.
attend) and target (NS vs. NNS) were repeatable within-subjects factors. Means and
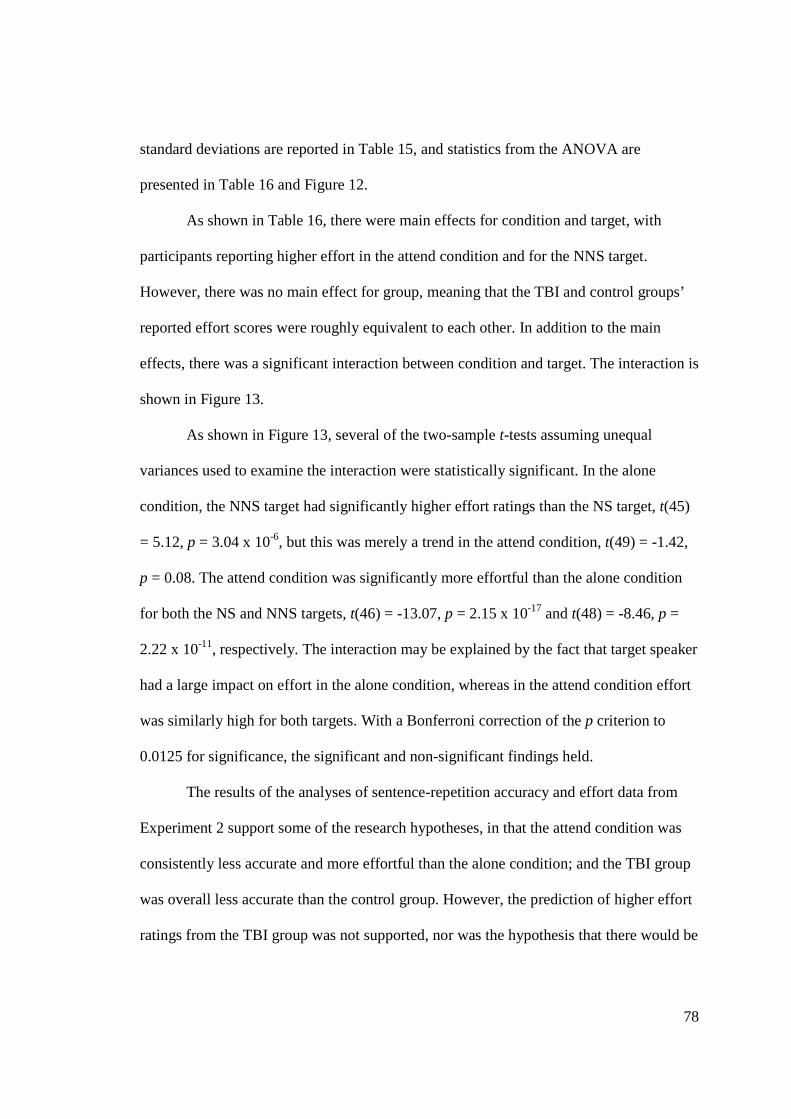
78
standard deviations are reported in Table 15, and statistics from the ANOVA are
presented in Table 16 and Figure 12.
As shown in Table 16, there were main effects for condition and target, with
participants reporting higher effort in the attend condition and for the NNS target.
However, there was no main effect for group, meaning that the TBI and control groups’
reported effort scores were roughly equivalent to each other. In addition to the main
effects, there was a significant interaction between condition and target. The interaction is
shown in Figure 13.
As shown in Figure 13, several of the two-sample t-tests assuming unequal
variances used to examine the interaction were statistically significant. In the alone
condition, the NNS target had significantly higher effort ratings than the NS target, t(45)
= 5.12, p = 3.04 x 10⁻⁶, but this was merely a trend in the attend condition, t(49) = -1.42,
p = 0.08. The attend condition was significantly more effortful than the alone condition
for both the NS and NNS targets, t(46) = -13.07, p = 2.15 x 10⁻¹⁷ and t(48) = -8.46, p =
2.22 x 10⁻¹¹, respectively. The interaction may be explained by the fact that target speaker
had a large impact on effort in the alone condition, whereas in the attend condition effort
was similarly high for both targets. With a Bonferroni correction of the p criterion to
0.0125 for significance, the significant and non-significant findings held.
The results of the analyses of sentence-repetition accuracy and effort data from
Experiment 2 support some of the research hypotheses, in that the attend condition was
consistently less accurate and more effortful than the alone condition; and the TBI group
was overall less accurate than the control group. However, the prediction of higher effort
ratings from the TBI group was not supported, nor was the hypothesis that there would be

79
a group by talker interaction in which the TBI group experienced a greater decrement of
accuracy and increase of effort with the NNS target than did controls. The only result
potentially supporting this type of interaction was a non-significant trend suggesting that
the TBI group may have had a greater decrease in accuracy for the attend condition
compared to controls.
Another research question for Experiment 2 was whether the TBI group was more
likely than the control group to repeat interfering words. In order to consider this
question, an analysis was completed to take into account not only words that were
repeated from the target speaker, but also words that were repeated from the interfering
or distracter voice. All participants repeated at least a few words from the “wrong” voice;
some stated that they were aware that they were not repeating the target speaker and
others did not. Experiment instructions included the statement, “Remember, only repeat
back the sentences spoken by the example voice you just heard. Just guess if you are not
sure.” Because of this, some participants may have deliberately refrained from repeating
words if they knew them to be from the interfering voice; however, if they inquired, they
were told that while they should try to repeat the target speaker, they should go ahead and
say whatever words they were able to pick out.
In order to compare the TBI and control groups on their repetition of distractor
words, difference scores were calculated for each participant: the proportion of target
words repeated minus the proportion of interfering words repeated. Table 17 and Figure
14 show these differences. A two-way repeated-measures ANOVA was performed, with
group (TBI vs. control) as a between-subjects factor and target (NS vs. NNS) as a within-
subjects repeated factor. The statistics for this comparison are shown in Table 18. As
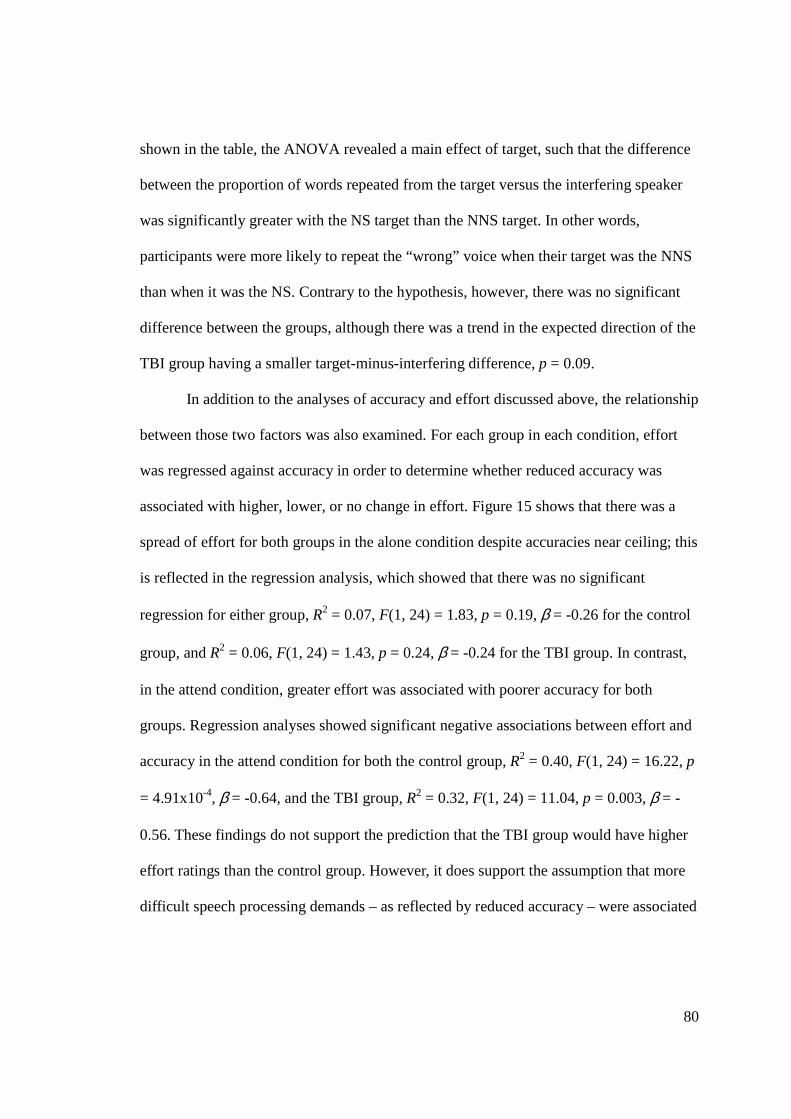
80
shown in the table, the ANOVA revealed a main effect of target, such that the difference
between the proportion of words repeated from the target versus the interfering speaker
was significantly greater with the NS target than the NNS target. In other words,
participants were more likely to repeat the “wrong” voice when their target was the NNS
than when it was the NS. Contrary to the hypothesis, however, there was no significant
difference between the groups, although there was a trend in the expected direction of the
TBI group having a smaller target-minus-interfering difference, p = 0.09.
In addition to the analyses of accuracy and effort discussed above, the relationship
between those two factors was also examined. For each group in each condition, effort
was regressed against accuracy in order to determine whether reduced accuracy was
associated with higher, lower, or no change in effort. Figure 15 shows that there was a
spread of effort for both groups in the alone condition despite accuracies near ceiling; this
is reflected in the regression analysis, which showed that there was no significant
regression for either group, R2 = 0.07, F(1, 24) = 1.83, p = 0.19, β = -0.26 for the control
group, and R2 = 0.06, F(1, 24) = 1.43, p = 0.24, β = -0.24 for the TBI group. In contrast,
in the attend condition, greater effort was associated with poorer accuracy for both
groups. Regression analyses showed significant negative associations between effort and
accuracy in the attend condition for both the control group, R2 = 0.40, F(1, 24) = 16.22, p
= 4.91x10⁻⁴, β = -0.64, and the TBI group, R2 = 0.32, F(1, 24) = 11.04, p = 0.003, β = -
0.56. These findings do not support the prediction that the TBI group would have higher
effort ratings than the control group. However, it does support the assumption that more
difficult speech processing demands – as reflected by reduced accuracy – were associated

81
with greater effort on the part of participants. In other words, poor accuracy was not
reflective of participants giving up on the task or failing to put forth effort.
Accommodation.
The next research question addressed in Experiment 2 was whether there were
group differences in how participants accommodated to the less familiar (i.e. NNS)
target. Two types of analysis were used to address the question of accommodation. First,
regression analyses were performed for each group to determine whether there was a
change in the number of keywords that were accurately repeated over the course of NNS
target block. Second, linear mixed-effects modeling was used as an alternative
mechanism to explore whether the order of trials played a significant role in repetition
accuracy. These analyses were applied only to the attend condition because all
participants were essentially at ceiling in the alone condition, so it would be difficult if
not impossible to detect accommodation in that condition.
The first method for exploring whether participants’ performance changed over
time in the attend condition of the sentence repetition task was to regress accuracy over
time (trials 1–30 over the NNS block). As shown in Figure 16, regressions were not
significant for either the TBI group, R2 = 0.02, F(1, 28) = 0.55, p = 0.46, β = 0.006, or the
control group, R2 = 0.008, F(1, 28) = 0.21, p = 0.65, β = 0.005. One limitation to this type
of analysis is that, with only five possible keywords per trial, there is little possible
variation in scores.
The second technique that was used to examine participants’ accommodation
during the experiment was linear mixed-effects modeling. As discussed in the methods

82
section, linear mixed-effects modeling can provide an advantage over ANOVAs when
there are both random and fixed effects to take into account. In this case, a model was
created for the attend condition accuracy data in which participant and sentence were
assigned as random effects, and group, block order, and trial number (position in list)
were assigned as fixed effects. Appendix 6 lists the data tables for the model, which
found a significant effect of block order (i.e. whether the first target was the NS or NNS),
with an estimated p = 0.02. This suggests that, across both groups, accuracy was different
depending on whether the NS or NNS block was administered first. In addition, a
significant interaction was found between trial number and target speaker, with an
estimated p = 0.0001. This interaction is shown in Figure 17, in which responses to the
NS target across both groups increase in accuracy over the course of the experiment
while responses to the NNS target slightly decline. Like the regression analysis, linear
mixed-effects modeling is limited in that each trial had only five possible keywords to
repeat, which reduced the possible variation in scores.
Overall, these analyses do not support the hypothesis that the TBI group would
accommodate more slowly than the control group, but there may be effects depending on
which target was presented first during the experiment. The differing results found by the
two methods suggest that further research is needed to explore the question of
accommodation in more detail.
Standardized test measures and repetition accuracy.
Participants in Experiment 2 completed a battery of standardized tests, partly as
demographic measures in order to be able to compare the abilities of the two groups, and

83
also in order to be able to examine connections between cognitive and auditory
processing abilities and performance on the experimental sentence repetition task. Results
of the standardized tests of cognition and communication were discussed in the methods
section, and the full dataset of scores for each participant can be found in Appendix 2. In
addition, participants completed three tests of auditory processing in order to establish if
and how these tests are related to performance on the experimental sentence repetition
task. The results of those tests are presented here, along with a set of exploratory
correlation matrices designed to explore the relationship between test scores and sentence
repetition accuracy.
Central auditory processing.
Three tests of central auditory processing were included in the standardized test
battery for participants in Experiment 2. Table 19 lists the means and standard deviations
for these tests for each group of participants.
For the SCAN-A, univariate ANOVAs showed no group differences for any of
the three subtests: filtered words F(1, 24) = 2.24, p = 0.15; figure-ground F(1, 24) =
0.088, p = 0.77; and dichotic listening F(1, 24) = 0.52, p = 0.48.
The MLD test showed group differences, in which the TBI group had a lower
masking level difference than the healthy control group, F(1, 24) = 4.29, p = 0.05 ( =
0.15, observed power = 0.51). This difference may be partly explained by one outlier: the
only participant in either group who scored below the cutoff for “failing” the test was #5
in the TBI group, who had an MLD of 2. When this datapoint is excluded, the group
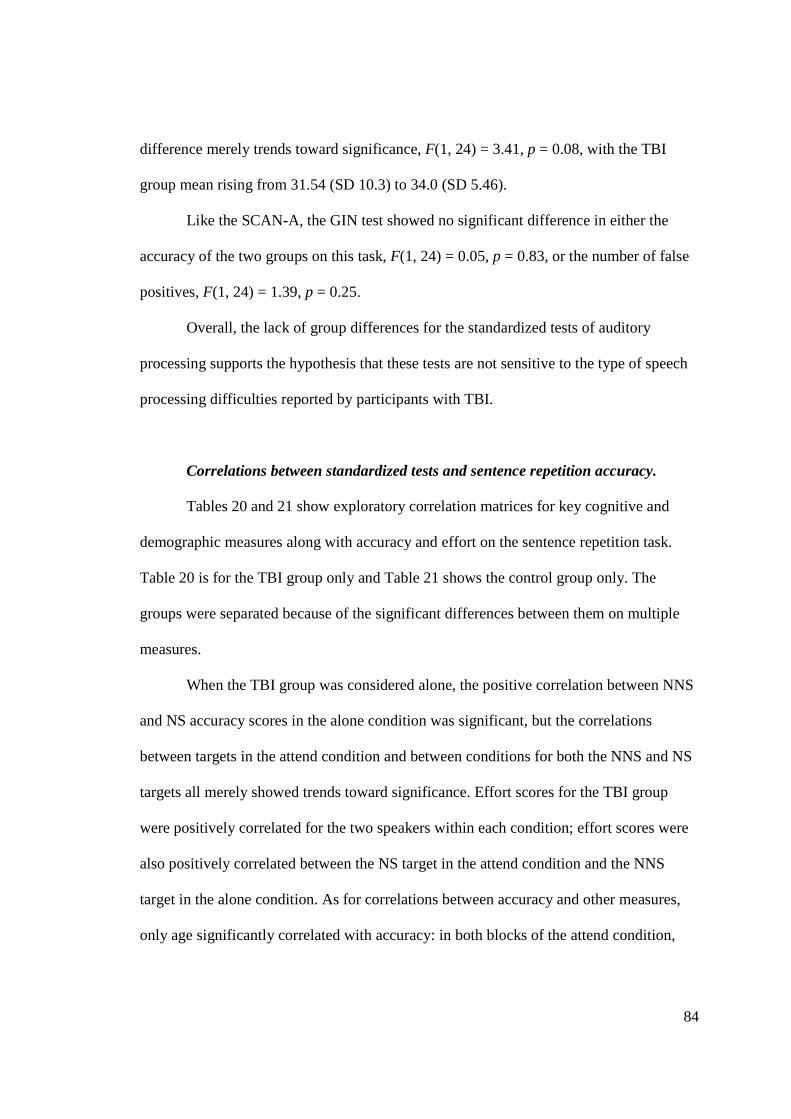
84
difference merely trends toward significance, F(1, 24) = 3.41, p = 0.08, with the TBI
group mean rising from 31.54 (SD 10.3) to 34.0 (SD 5.46).
Like the SCAN-A, the GIN test showed no significant difference in either the
accuracy of the two groups on this task, F(1, 24) = 0.05, p = 0.83, or the number of false
positives, F(1, 24) = 1.39, p = 0.25.
Overall, the lack of group differences for the standardized tests of auditory
processing supports the hypothesis that these tests are not sensitive to the type of speech
processing difficulties reported by participants with TBI.
Correlations between standardized tests and sentence repetition accuracy.
Tables 20 and 21 show exploratory correlation matrices for key cognitive and
demographic measures along with accuracy and effort on the sentence repetition task.
Table 20 is for the TBI group only and Table 21 shows the control group only. The
groups were separated because of the significant differences between them on multiple
measures.
When the TBI group was considered alone, the positive correlation between NNS
and NS accuracy scores in the alone condition was significant, but the correlations
between targets in the attend condition and between conditions for both the NNS and NS
targets all merely showed trends toward significance. Effort scores for the TBI group
were positively correlated for the two speakers within each condition; effort scores were
also positively correlated between the NS target in the attend condition and the NNS
target in the alone condition. As for correlations between accuracy and other measures,
only age significantly correlated with accuracy: in both blocks of the attend condition,

85
higher age was correlated with poorer accuracy. Age was also positively correlated with
years since injury, not surprisingly. There were additional trends toward significance for
a positive correlation between Listening Span and accuracy repeating the NNS target in
the alone condition, and for a negative correlation between Decision Speed accuracy and
accuracy repeating the NNS target in the attend condition. These trends suggest that there
may be relationships among good linguistic working memory, fast processing speed, and
success with complex speech processing in adults with TBI, but further study is needed to
explore these relationships.
In the case of the control group, all participants scored 100% for sentence
repetition in the alone NS block, so no correlations were possible with this factor. Within
the attend condition, however, NS and NNS accuracies were significantly positively
correlated, and effort was also positively correlated between the two targets within the
alone condition but not the attend condition. Moreover, in the attend condition, accuracy
in the NNS block was significantly correlated with effort in both the NNS and NS blocks.
The correlation between age and accuracy observed in the TBI group was not present in
the control group, although, interestingly, Decision Speed was correlated with MLD
score.
These preliminary correlational findings support the hypothesis that no one
standardized test of cognition or auditory processing would be able to explain
performance on the single-talker interference task. The fact that the standardized test
scores were not all intercorrelated with each other supports the assumption that they were
testing somewhat independent factors. However, these results are merely exploratory, in
that they do not take into account any corrections for reducing Type I error. The small n

86
involved in this study means that such corrections would eliminate most of the significant
results in the correlation analysis.
Semi-structured interviews.
Both qualitative and mixed-methods approaches were used to analyze data from
the semi-structured interview. These methods were used to explore whether there were
group differences in how participants subjectively described their speech perception, and
how those subjective experiences were related to the quantitative measures in the
experiment. There has been very little prior research in this area. Bergemalm and Borg
(2001) included the Gothenberg Hearing Questionnaire and a questionnaire about quality
of life in their study of long-term audiological consequences of TBI; however, the
responses relating to possible informational masking or experiences in different
environments are not analyzed or discussed in the article.
Appendix 7 lists the 45 thematic codes that emerged from the semi-structured
interview transcriptions, along with example quotes representing each theme. The total
number of quotes culled from the TBI group was 325 (M 19.85, SD 7.99), compared to
219 (M 13.08, SD 2.33) from the control group. A univariate ANOVA demonstrated that
this was a significant difference, F(1, 14) = 4.26, p = 0.01. Given that the structure of
each interview was the same (see Appendix 5), this difference shows that participants
with TBI had more to say on the topic of complex speech processing than did healthy
controls.
One way to examine the interviews’ thematic data is to look at the number of
participants who mentioned various themes. This is relevant because some people

87
repeatedly mentioned the same theme several times, and it is illustrative to remove the
effect of multiple mentions. Table 22 lists each theme and the difference between the
number of participants in each group who mentioned that theme. Positive difference
scores represent themes that were mentioned more frequently by the TBI group, and
negative difference scores represent themes that were mentioned by more control
participants.
Table 22 demonstrates a number of interesting results. First, there was similar
discussion of strategies in the interviews for each group: 92% people in the TBI group
mentioned strategies, as did 100% in the control group, giving that theme a difference
score of -1. This is not surprising, given that part of the interview specifically asked about
strategies, so each participant responded by mentioning that theme. In addition, the
strategy theme is particularly prevalent because it is not subdivided into the different
types of strategies discussed.
In contrast, nearly 40% of the TBI group specifically mentioned lacking a strategy
in some context (the “no strategy” theme), while none of the control participants stated
that they lacked strategies, leading to a difference score of 5. The same difference
occurred with the “can’t process” theme, in which participants with TBI explicitly
reported difficulty processing complex speech information. Likewise, the “overload” and
“stressful” themes, referring to feeling overwhelmed, overloaded, or stressed by complex
speech processing situations, were mentioned by 32% of TBI participants but no healthy
controls, resulting in difference scores of 4 for each theme.
Other notable contrasts between the groups included the “change” themes, in
which improvement in speech processing over time (change + theme) and no noticeable
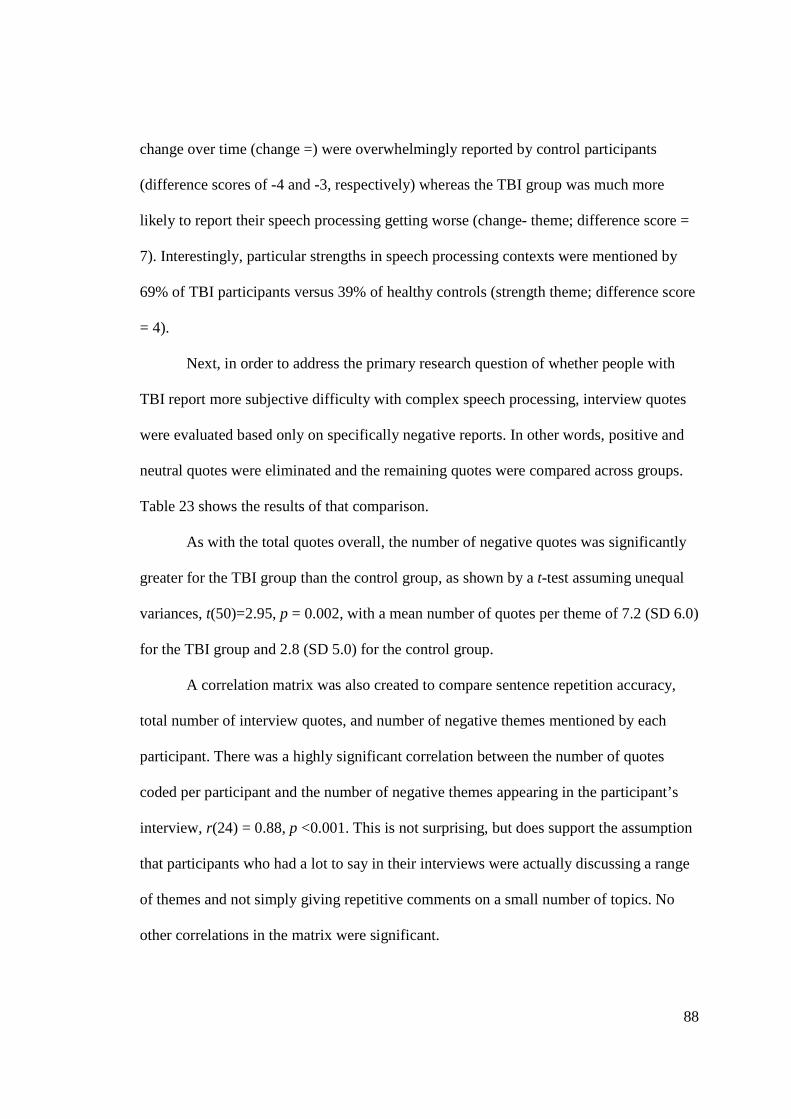
88
change over time (change =) were overwhelmingly reported by control participants
(difference scores of -4 and -3, respectively) whereas the TBI group was much more
likely to report their speech processing getting worse (change- theme; difference score =
7). Interestingly, particular strengths in speech processing contexts were mentioned by
69% of TBI participants versus 39% of healthy controls (strength theme; difference score
= 4).
Next, in order to address the primary research question of whether people with
TBI report more subjective difficulty with complex speech processing, interview quotes
were evaluated based only on specifically negative reports. In other words, positive and
neutral quotes were eliminated and the remaining quotes were compared across groups.
Table 23 shows the results of that comparison.
As with the total quotes overall, the number of negative quotes was significantly
greater for the TBI group than the control group, as shown by a t-test assuming unequal
variances, t(50)=2.95, p = 0.002, with a mean number of quotes per theme of 7.2 (SD 6.0)
for the TBI group and 2.8 (SD 5.0) for the control group.
A correlation matrix was also created to compare sentence repetition accuracy,
total number of interview quotes, and number of negative themes mentioned by each
participant. There was a highly significant correlation between the number of quotes
coded per participant and the number of negative themes appearing in the participant’s
interview, r(24) = 0.88, p <0.001. This is not surprising, but does support the assumption
that participants who had a lot to say in their interviews were actually discussing a range
of themes and not simply giving repetitive comments on a small number of topics. No
other correlations in the matrix were significant.
89
In the next analysis, plots were created showing the number of negative quotes
and total quotes for each participant versus their overall attend condition accuracy, in
order to show whether interview reports directly corresponded with sentence repetition
accuracy. Figures 18 and 19 show these relationships; none of these regressions were
significant. For number of negative themes only, the TBI group regression was R2 =
0.004, F(1, 11) = 0.04, p = 0.84, β = -1.67, and the control group regression was R2 =
0.005, F(1, 12) = 0.05, p = 0.83, β = -1.05. For the total quotes overall, the TBI group
regression was R2 = 0.002, F(1, 11) = 0.02, p = 0.88, β = -2.05, and the control group
regression was R2 = 0.11, F(1, 11) = 1.31, p = 0.28, β = -6.28.
Finally, the relationship between interview reports and sentence repetition
accuracy was examined by relating the number of negative themes reported by each
participant to above- and below-average sentence repetition accuracy groupings. The
themes of particular negative affect reported by each participant were counted: distracted,
focus, stressful, focus, can't process, filter, frustrated, change-, anxiety, and overload. The
number of these themes mentioned by each person is shown in Figure 20, presented by
high- and low-accuracy groups (above and below the mean for the TBI and control
groups).
Although it is clear again that participants with TBI reported more negative
experiences with complex speech processing, there is little apparent difference in these
reports between those who performed well on the single-talker interference task and those
who performed relatively poorly. The only notable pattern is that four out of the seven
control participants who had below-average accuracy cited none of the negative-affect
categories in their interviews. Overall, the mixed-method findings suggest that, within

90
groups, there is little or no direct relationship between subjective report of difficulty with
speech processing and how each participant performed on the experimental sentence-
repetition task.
Experiment 1 and Experiment 2
The primary purpose of Experiment 1 was to determine whether any speech
processing effects observed in participants with TBI were similar to peripheral hearing
effects. To determine this, the TBI group results from Experiment 2 were compared to
those of the filtered group from Experiment 1. Unlike the groups within each experiment,
these two groups were not matched demographically. Two-sample t-tests showed that
they were significantly different in age, t(12) = -4.66, p = 0.0003, where the mean age for
the TBI group was 39 compared to 21 for the filtered group; and in estimated verbal IQ,
t(22) = -1.76, p = 0.05, where the TBI group mean was 113 and the filtered group mean
was 108. Table 24 shows the overall comparison of sentence repetition accuracy for all
the participant groups across both studies.
As with Experiments 1 and 2, a three-way repeated-measures ANOVA was used
to compare the filtered group to the TBI group, in which group (filtered vs. TBI) was a
within-subjects factor while target (NS vs. NNS) and condition (alone vs. attend) were
repeatable between-subjects factors. As with the analysis for Experiment 2, block order
was initially included as a nested factor within group, was demonstrated to have no
significant effect, and was eliminated from further analysis. Three covariates were also
tested: a model with age, education, and verbal IQ as covariates showed that, whereas age
was a significant factor, IQ and education were not and were eliminated from the final
model. Age was kept as a covariate. Statistics for this analysis are shown in Table 25.
91
As shown in Table 25, there were significant main effects of group, condition, and
target, such that the TBI group was more accurate than the filtered group, the alone
condition was more accurate than the attend condition, and the NS was more accurate
than the NNS target. There were also two-way interactions between condition and age,
condition and group, and target and group; and a three-way interaction between
condition, target, and group. Figure 21 illustrates the three-way interaction.
Pairwise comparisons for the components of the three-way interaction using two-
sample t-tests assuming unequal variances showed numerous significant differences.
Within the alone condition, the TBI group was significantly more accurate than the
filtered group for both speakers, t(16) = 7.59, p = 5.48x10⁻⁷ for NS; t(25) = 20.37, p =
2.18x10⁻¹⁷ for NNS, and this difference was larger for the NNS target. The difference
between the NS and NNS targets in the alone block was significant within each group,
t(16) = 2.43, p = 0.01 for TBI and t(27) = 11.13, p = 6.82x10⁻¹² for filtered, but much
more distinct for the filtered group. Within the attend condition, the TBI group was again
more accurate than the filtered group for both targets, t(14) = 7.68, p = 1.1x10⁻⁶ for NS
and t(12) = 5.78, p = 4.35x10⁻⁵ for NNS. The filtered group was significantly more
accurate for the NS target than the NNS target in the attend block, t(22) = 5.21, p =
1.6x10⁻⁵, whereas this difference was only a trend toward significance for the TBI group
t(23) = 1.58, p = 0.06. Finally, both groups were significantly more accurate in the alone
than the attend condition for both targets: for the TBI group the comparison was t(12) =
9.23, p = 4.23x10⁻⁷ for the NS target and t(13) = 8.84, p = 3.68x10⁻⁷ for the NNS; for the
filtered group the comparisons were t(22) = 24.92, p = 6.44x10⁻¹⁸ for the NS target and
t(18) = 20.07, p = 4.54x10⁻¹⁴ for the NNS.

92
Overall, the results of the comparison between Experiment 1 and Experiment 2
support the hypothesis that the pattern of performance for adults with TBI on the single-
talker interference sentence repetition task is different from the performance of healthy
adults with simulated peripheral hearing loss. The filtered group in Experiment 1 had
consistently poorer accuracies in each listening condition compared to the TBI group
from Experiment 2; moreover, the pattern of accuracies was different for the two groups,
with the filtered group showing strong reductions in performance between the NS and
NNS target in both conditions, whereas the TBI group had a much smaller (although still
significant) decrease in accuracy between the NS and NNS targets in the alone condition
compared to the attend condition. The fact that age remained a significant factor in this
last comparison even after being covaried out in the analysis suggests that age needs to be
considered in more detail in future studies.

93
Discussion
People who have experienced TBI often report lingering difficulties with
processing speech in challenging situations. Even those who have returned to work or
school, and perform well on many standardized assessments of language and cognition,
may experience problems when faced with conversation in noisy backgrounds, with
multiple talkers, with unfamiliar accents, or in other challenging circumstances. In this
study a group of adults with TBI demonstrated reduced accuracy on a single-talker
interference task compared to healthy controls. In interviews, the TBI group also reported
more negative subjective experiences with speech processing compared to the control
group, including experiences of frustration, feeling overwhelmed, and changes for the
worse over time.
Previous research has demonstrated impairment-level deficits following TBI in
multiple areas potentially relevant to complex speech processing. These include central
auditory processing (e.g. Bergemalm & Borg, 2001), processing speed (e.g. Madigan et
al., 2000), short-term memory (e.g. Rios et al., 2004), and regulation of attention (e.g.
Rueda et al., 2004). The combination of these factors is behind the prediction that the TBI
group in this study would exhibit greater informational masking effects than the healthy
control group, while showing equivalent energetic masking effects. Most prior research
has focused on measurements of basic function in individuals with TBI in order to study
impairments following brain injury. Using a mixed-methods design, this dissertation
compared performance across standardized tests measuring body-function level, an
experimental single-talker interference task intended to approximate activity-level ability,
and semi-structured interviews designed to assess participation-level experiences. The

94
goal of combining these measures was to provide a more complete picture of complex
speech processing after brain injury.
An additional goal of the project was to compare the performance of adults with
TBI on the experimental sentence repetition task with the performance of a group of
healthy adults with simulated peripheral hearing loss. This peripheral effect was explored
in Experiment 1, which compared young adults in filtered and unfiltered groups
completing the sentence repetition task. Experiment 2 comprised a healthy control and
TBI group performing the same task with only unfiltered stimuli, as well as a battery of
standardized assessments of cognition and auditory processing, and semi-structured
interviews about participants’ subjective experiences with complex speech processing.
The results of each experiment are discussed in the following section.
Experiment 1
The purpose of Experiment 1 was to examine purely peripheral effects on
sentence repetition with single-talker interference. Healthy control participants repeated
sentences spoken by native- and non-native-accented speakers, in alone and attend
conditions (speakers heard individually vs. simultaneously). One group heard the stimuli
without filtering, and the other heard them with 1400 Hz low-pass filtering. The research
questions for Experiment 1 were:
• Is the filtered group less accurate than the control group on the sentence
repetition task?
• Are participants less accurate in the NNS than the NS condition?

95
• Is there an interaction between group and target (i.e. is the filtered group more
susceptible to target effect than the control group)?
The work of Nelson et al. (2003, 2004) and Cullington and Zeng (2008) suggests
that people with peripheral hearing loss are more susceptible to masking effects, and less
able to achieve release from energetic masking, than healthy controls. The results of
Experiment 1 in this dissertation support these conclusions, in that listeners in the filtered
group did much more poorly than those in the unfiltered group. A simulated peripheral
hearing loss, as predicted, reduced accuracy and increased effort in the sentence
repetition task.
In addition to the main effects of group (unfiltered > filtered), condition (alone >
attend) and target speaker (NS > NNS) on accuracy in Experiment 1, there was a three-
way condition x target x group interaction. One component of this interaction was that
the filtered group but not the unfiltered group was significantly less accurate for the NNS
target than the NS target in the alone condition. In other words, in an ideal listening
situation, the unfiltered group’s accuracy was at ceiling regardless of speaker, but the
filtered group was less accurate with the non-native target. This is consistent with
research such as that of Wilson and Spaulding (2010) showing that non-native speech
intelligibility is more affected by energetic masking effects than native speech. In the
attend condition, the same pattern was observed, in that the unfiltered group performed
the same for both targets while the filtered group did significantly worse with the NNS
than the NS target.
These results suggest that much of the main effect of target in Experiment 1 was
driven by differences in the filtered group. These differences are consistent with the

96
theory that NNS speech has less redundancy in the signal than NS speech. This idea was
based on previous research by Oxenham and Simonson (2009), who discussed
redundancy regarding filtered speech, and Cooke et al. (2008), who examined it from the
perspective of non-native listeners. Any reduction in access to acoustic information, such
as band-pass filtering, would be easier to overcome in a target with more redundant
information available, such as the NS. Moreover, what little information is available in
the filtered condition would be further limited by single-talker interference. The decrease
in attend-condition accuracy for the NS target from 68% in the unfiltered group to 15% in
the filtered group illustrates the impact of reduced access to peripheral auditory
information.
The results of Experiment 1 also suggest that energetic effects were dominant
over informational masking effects in that experiment. Block 3 and Block 4 of the
experiment were the same except for the attention factor: the stimuli throughout both
blocks comprised sentences from the NS and NNS presented simultaneously, and the
only difference was which speaker the participant was instructed to repeat. This was
intended to measure informational masking effects, because the acoustic signal between
the two blocks did not change. In contrast, the 1400 Hz low-pass filtering experienced by
the filtered group was intended to gauge energetic masking effects. The contrasting
patterns of performance between the two groups suggests that the energetic effects of the
filtered condition was more influential than the informational masking involved in the
attend condition. The fact that the filtered group did so much worse with the NNS in the
alone condition, when there was no informational masking at all, while the unfiltered
97
group showed no difference between the two talkers in either condition, demonstrates
that the peripheral effects overwhelmed informational effects in this experiment.
In addition to accuracy, Experiment 1 also looked at effects of subjective effort
ratings. Significant main effects for group, condition, and target showed that the filtered
group reported greater effort overall than the unfiltered group; the attend condition
required greater effort than the alone condition, and the NNS target was more effortful to
repeat than the NS. A two-way interaction between condition and target showed that,
across groups, effort was uniformly high for both target speakers in the attend condition
but significantly higher for the NNS target in the alone condition. This shows that the
difficulty of the single-talker interference task was high enough to overcome the more
subtle effects of target speaker that were apparent in the alone condition. There was also a
two-way interaction between condition and group: both the filtered and unfiltered groups
had high effort in the attend condition, but the filtered group reported significantly greater
effort than the unfiltered group in both conditions. This difference was more pronounced
in the alone condition, possibly an artifact of ceiling effects for the filtered group. As
shown in Figure 8, that group’s mean effort ratings went from 6.2 in the alone condition
to 9.3 out of 10 in the attend condition, whereas the unfiltered group showed more range,
going from mean effort ratings of 2.3 to 8.1. It is possible that the slopes of these changes
might have been more parallel, reducing the interaction effect, if the rating scale had
allowed the filtered group to increase their ratings further in the attend condition.
These findings are consistent with studies such as Sarampalis et al.(2009) that
have studied the high effort associated with peripheral hearing loss; Krause et al. (2009)
also found increased effort in a sentence repetition task involving energetic masking. The
98
uniformly high effort reported in the attend condition of Experiment 1 may indicate
ceiling effects. This possibility is discussed further in the context of Experiment 2.
The goal of Experiment 1 was to provide information about the effects of a purely
peripheral auditory deficit on the sentence-repetition task. Results demonstrated that
peripheral effects, as modeled by a low-pass filter, have a significant impact on both the
accuracy and effort involved in the experimental sentence-repetition task. Moreover, the
effect of speaker accent is more pronounced for the alone condition, whereas in the attend
condition the filtered group’s accuracy was near floor for both speakers. Results suggest
that the energetic masking effects of the low-pass filtering dominated the informational
masking effects of the single-talker interference task.
The comparison of the filtered group from Experiment 1 with the TBI group from
Experiment 2 will be discussed further below.
Experiment 2
Experiment 2 had several primary goals. The first goal was to explore any
differences between adults with and without TBI on the experimental sentence-repetition
task. The second goal was to describe relationships between the sentence-repetition
results and standardized tests of cognition and auditory processing. The third goal was to
provide a qualitative description of participants’ subjective reports on their experiences of
complex speech processing. Finally, the fourth goal was to offer a mixed-methods
analysis combining data gleaned from interviews with those of the sentence-repetition
task.

99
Sentence repetition task.
The primary quantitative research questions for Experiment 2 included the
following:
• Was the TBI group less accurate than the control group with the sentence
repetition task? Did the TBI group report more effort?
• Were participants less accurate, or did they report more effort, in the NNS than
the NS condition?
• Was there an interaction between group and target (i.e. was the TBI group more
susceptible to target effect than the control group?) for either accuracy or effort?
Similar to Experiment 1, in the alone condition of Experiment 2 the accuracy for
both groups was essentially at ceiling for across target speakers. There was a small but
significant difference in accuracy between the NS and NNS target across groups, with the
NNS being slightly less accurate. This significant difference between targets indicates
that, despite pilot testing that showed both speakers’ intelligibility to be at ceiling, the
goal of finding two speakers who were equally intelligible in quiet listening conditions
was not quite met. Ideally, both the NS and NNS would have been 100% intelligible in
the alone condition. However, the difference was small: 100% versus 99% for the control
group, and 99% versus 97% for the TBI group.
In the attend condition, in contrast, the significant main effect of target reflected
larger differences between the two speakers: 64% versus 57% for the control group, and
54% versus 42% for the TBI group. There were also main effects for group, such that the
TBI group was less accurate than controls, but there were no interactions between group
and the other factors. Although the hypothesis that participants with TBI would be

100
differentially affected by target accent was not supported, Experiment 2 does offer clear
evidence that people who have had a TBI are more likely than controls to have difficulty
with single-talker interference such as the experimental sentence-repetition task.
The high variability in accuracy among participants in both groups is also
noteworthy, particularly in the attend condition. This is consistent with the findings of
Freyman, Helfer, and Balakrishnan (2007), who showed high variability among healthy
controls in a two-talker interference task. Whether there are different patterns of
variability between TBI and healthy control groups may be worth further examination in
the future.
Another analysis of repetition accuracy centered on the frequency with which
participants repeated the interfering speaker rather than the target speaker in the attend
condition, asking “Was the TBI group more likely than the control group to repeat
interfering words?” Difference scores were calculated between words repeated from the
target and interfering sentences. Although there was not a significant group effect, there
was a trend (p = 0.09) in the direction of smaller differences for the TBI group than the
control group. There was a significant effect of target, such that when the NS was the
target, the difference between target and interfering word repetitions was greater than
when the NNS was the target. In other words, when the NNS was the target, participants
across groups were more likely to repeat interfering words than they were when the target
speaker was the NS.
Research on attention such as Rueda et al. (2004), Telling et al. (2010), and
Schmitter-Edgcombe and Nissley (2000) has demonstrated that adults with TBI can show
greater distractibility than healthy controls, particularly in situations requiring conscious

101
control of attention. This led to the prediction that participants with TBI would have
greater difficulty than healthy controls ignoring the distracter voice in Experiment 2. This
prediction was not supported by the current analysis, although there was a statistical trend
in the predicted direction. Across groups, participants showed the predicted effect of
speaker familiarity, in that the NS distracter intruded more on the NNS target than the
other way around. Some participants had much greater difficulty filtering out the
interfering speaker than others across both groups, and some were more accurate with the
NNS target. It is possible that some participants were more susceptible than others to the
odd-distracter salience effect described by Brungart et al. (2001), in which a single odd-
sex distracter voice combined with several same-sex distracters was more intrusive than
an equal number of distracters that were all the same sex as the target. In the current
experiment, this effect could explain the few participants who had significantly greater
accuracy in the NNS target condition than the NS target. This phenomenon warrants
further study; it is not clear to what extent differences among listeners were related to
listener characteristics, the target speaker, the order of presentation, some combination of
these, or other factors entirely.
Patterns of reported effort were also analyzed in Experiment 2. Prior research
such as Kennedy et al. (2008, 2011) and Krause et al. (2009), in which participants with
TBI reported increased effort following their injuries, led to the prediction that
participants with TBI would report greater effort than controls in the current project.
Analysis of results did not support this prediction of a group effect; however, there were
main effects of condition and target, as well as an interaction between condition and
target. The attend condition was significantly more effortful than the alone condition

102
overall, and the NNS target was significantly more effortful than the NS target. The
interaction showed that effort increased more between the NS and NNS target in the
alone condition than in the attend condition.
The interaction illustrates one drawback to the effort measure used here. Ratings
were uniformly high in the attend condition regardless of target, and it is possible that
ratings were not sensitive to subtle differences between stimulus blocks, particularly in
the attend condition. Participants may have been reacting mostly to the contrast in effort
between the alone and attend condition, rather than offering a nuanced evaluation of any
difference in effort between blocks within the attend condition. Finally, it is also possible
that the long delay between effort ratings (30 trials in the attend condition, compared to
only 10 in the alone condition) made it difficult for participants to accurately calibrate
their ratings. This delay was instituted in order to minimize “breaks” and maximize
fatigue effects within the repetition task, but it may have undermined the sensitivity of
the effort ratings.
Despite these shortcomings, regressions of effort versus accuracy (Figure 15) did
show significant correspondence in the attend condition between higher reported effort
and lower repetition accuracy. This suggests that participants perceived poorer
performance as more effortful, as opposed to low accuracy occurring when listeners were
not trying hard. Further study is needed to determine details about the relationship
between effort and accuracy, but the current data suggests that the increased effort
reported in the attend condition is tied to the specific difficulty of the task for individual
participants. In other words, participants did not arbitrarily rate each attend block as
highly effortful, but did calibrate their ratings somewhat in relation to their ability to

103
complete the task. This is consistent with the findings of Fraser et al. (2010), who found a
similar negative correlation between effort rating and accuracy in the audio-visual
condition of their speech recognition task.
Another research question important to understanding how participants performed
on the sentence repetition task was, “Did the control group accommodate faster than the
TBI group?” Previous research has studied the phenomenon of accommodation to
unfamiliar speech stimuli such as vocoded speech (Davis et al., 2005) and non-native
speech (Clarke & Garrett, 2004), which can occur with very brief exposure; and that this
process of accommodation can be disrupted by peripheral effects such as background
noise (e.g. Clopper & Bradlow, 2008). These findings led to the prediction that
participants would increase their accuracy over the course of the single-talker
interference task when the NNS was the target. Moreover, due to the difficulty with
regulation of attention experienced by people with TBI (e.g. Rueda et al., 2004), it was
predicted that the selective attention required in the single-talker interference task would
lead to slower accommodation for the TBI group in this experiment than for healthy
controls.
In contrast to these predictions, simple regressions did not reveal any increase in
accuracy over the course of the NNS block for either participant group. However, with
only five keywords per trial, this type of regression analysis may not have been
sufficiently sensitive to detect accommodation effects.
A more complex picture emerged from linear mixed-effects modeling of order
effects, which suggest that the order of presentation (which speaker was targeted first and
which second) interacted with target speaker and group to affect accuracy. This
104
interaction suggests that, rather than accommodating to the unfamiliar accent over time as
predicted, participants may have been accommodating to the single-talker interference
task in the NS target condition, and were less able to do so in the NNS condition. The
practice block was intended to limit this type of effect, but it was conducted only with an
NS target. The lack of interaction with group in this model suggests that this effect was
not significantly stronger for the TBI group than it was for controls, although further
analysis is warranted to explore this phenomenon further.
Block order (whether the NS or NNS target was presented first) was considered as
a factor nested within groups in the repeated-measures ANOVAs of accuracy and effort
for both Experiment 1 and 2. These analyses showed that block order was not significant,
and it was excluded from further consideration. The findings of the linear mixed-effects
model do not undermine these results; rather, they suggest a possible avenue for future
study. In particular, clinical research could benefit from a more detailed understanding of
the patterns of learning and accommodation for people with and without TBI.
Standardized test measures and repetition accuracy.
Along with the sentence repetition task, a battery of standardized tests of
cognition and auditory processing was administered to each participant in Experiment 2,
both for the purposes of demographic comparison between groups and as a way to assess
the features, such as processing speed and attention, predicted to affect speech
processing. The group differences that were found were in the expected direction, such
that the TBI group in this study showed significantly lower overall scores on the RBANS,
higher self-reported attention difficulties on the APT-II questionnaire, and lower recall

105
scores on the Listening Span task. There were no group differences on two tests of basic
executive function, digits backwards and the D-KEFS trails switching subtest when
motor speed was accounted for, or on the BADS-Dex questionnaire. This demonstrates
that the participants with TBI in this study comprised individuals who have achieved
strong recovery after their brain injuries.
Another research question related to standardized testing in Experiment 2 was,
“Are there correlations between standardized tests or demographic factors and sentence
repetition accuracy?” In order to address this question, exploratory correlation matrices
were created between measures of repetition accuracy and standardized tests of cognition
and central auditory processing that could influence complex speech processing.
For the TBI group, accuracies were significantly positively correlated for the two
speakers in the alone condition, and showed trends toward significance positively in the
attend condition. This is not surprising given that variability was much higher in the
attend condition. Correlations among effort ratings showed that, within each condition,
participants rated both speakers similarly, and that effort ratings for the NNS target in the
alone condition were significantly positively associated with reported effort on the NS
target of the attend condition. In other words, people who found the NNS effortful even
in the alone condition were also likely to report high effort for the NS target in the attend
condition. As for the significant correlations with age found in the TBI group, it is
difficult to offer any confident interpretations due to the fact that, in this group, age is
also strongly correlated with time since injury. Future research could be designed to
specifically address the relationships among age, time since injury, and speech
processing.

106
Both decision speed and listening span showed nonsignificant trends toward
correlation with sentence repetition measures for the TBI group: better listening span was
associated with better accuracy for the NNS target in the alone condition, while less
decision speed accuracy (i.e. slower speed) was associated with better NNS target
accuracy in the attend condition. The possible association between sentence repetition
and verbal working memory seems fairly straightforward: in functional situations where
single-talker interference occurs, working memory demands similar to those of the
experimental task may occur. The listener may need to maintain the first part of an
utterance in working memory long enough to reinterpret based on information gleaned
from the latter part of the utterance. Indeed, several participants reported attempting this
strategy during the sentence repetition task. The negative association between processing
speed and sentence repetition accuracy is more difficult to explain. One possibility is that
low decision speed scores reflected greater deliberation by some participants, who then
demonstrated the same care in completing the sentence repetition task. Clearly, further
research would be needed to learn to what extent these cognitive factors are associated
with performance on sentence repetition tasks.
None of the measures of central auditory processing showed significant group
differences, with the exception of the MLD test, which approached significance with
lower scores for the TBI group after an outlier was removed. Little prior research exists
describing how this type of measure is affected by TBI. Olsen, Noffsinger, and Carhart
(1976) found that MLD scores were normally distributed among a healthy control group
of 50 adults, and based their pass-fail criterion on the 5th percentile of that population.
They also tested disordered populations, including a group of 20 participants with cortical

107
lesions (e.g. stroke or hemispherectomy, but not TBI). In results similar to the current
study, all but one of the participants in Olsen et al.’s disordered group had normal
spondee MLDs, but the authors do not comment on whether the cortical lesion group’s
mean MLD was any lower than that of the healthy control group.
In addition to the lack of group mean differences for auditory processing tests in
Experiment 2, there were also no significant correlations found between auditory
processing scores and accuracy on the experimental sentence repetition task. These
findings suggest that, while these tests are designed to measure central as opposed to
peripheral auditory processing, they are not sensitive to the type of central processing
required for the experimental sentence repetition task. This is not entirely surprising,
given the range of neurological functions that may be considered “central.” Nevertheless,
it is important to highlight the point that if individuals with a history of TBI complain of
speech processing difficulty, some standard central auditory processing assessments may
not be ecologically valid measures of their abilities. This is consistent with the Schneider
et al.’s (2007), discussion of informational masking, in which they observe that “at
present there are no tools in the audiologist’s toolbox to assess a person’s ability to use
the available auditory cues to parse the auditory scene and suppress the processing of
irrelevant information” (p. 590).
Semi-structured interviews.
The primary qualitative research question relating to data from the semi-
structured interviews in Experiment 2 was, “Is there a difference in how the two groups
describe their speech processing subjectively?” Overall, results from the semi-structured
108
interviews support the hypothesis that people with TBI would report greater difficulty
than controls with everyday experiences of complex speech processing. Participants in
the TBI group spoke more extensively during their interviews, using a wider range of
topics and reporting negative experiences more often than healthy controls.
Some specific results from the semi-structured interviews warrant closer
examination. At first glance, it seems contrary to expectations that the control group
should endorse difficulties with speech processing more frequently than the TBI group
(19% of quotes versus 8%), while the TBI group spent 5.7% of their responses denying
difficulty (the “not a problem” theme). However, these contrasts may be artifacts of
coding: the “endorse” code was used whenever a participant simply agreed with an
interview question about whether one scenario was more difficult than another for speech
processing (e.g. “Is there any difference for you in how easy it is to understand someone
in a crowded restaurant versus eating at home?”) If the respondent simply said “Yes,” or
“a busy street would be harder,” that was coded as “endorsing” the difficulty. However, if
the participant went on to give specific examples, there were additional, more specific
codes. For example, in response to the same question, participant #3 in the TBI group
stated, “Yeah, it’s just the noise is a big deal, and you know it’s stuff that you never
really want to pay attention to. It took me years to figure that out.” This quote was coded
as fitting the “background noise” and “filter” themes as well as the “endorse” theme.
Thus, the prevalence of the “endorse” code in the control group represents the tendency
of participants in that group to simply agree that some situations are more difficult than
others without elaborating or sharing any personal experience. Similarly, the “not a
problem” code represents a non-specific comment that something is not particularly

109
difficult; this theme represented 5.7% of quotes for the TBI group, not much higher than
the 3.9% for the control group.
Another interesting group difference in the interviews occurred with the
“strength” code. Participants with TBI referred to strengths in their speech processing
more frequently than controls. This may reflect a greater awareness of strengths and
weaknesses on the part of people with TBI, or a propensity to mention strengths in
contrast to the weaknesses under discussion. However, it is worth noting that only
participants in the control group specifically cited processing in the presence of
background noise as a strength. For example, participant #16 in the control group stated,
“In fact I tend to work better when there’s actually a lot of noise around;” and participant
#18 in the control group said, “I kind of like white noise, I mean I, things going on in the
background.” None of the participants with TBI reported a tolerance, much less a
preference, for noisy backgrounds.
One purpose of the mixed-methods analyses was to help explain the quantitative
findings. An exploratory correlation matrix and regressions were used to assess whether
there were direct relationships between interview results and quantitative measures.
Neither the correlation matrix nor the regressions of interview measures against sentence
repetition scores found any direct relationship between the total number of quotes or
number of negative themes in interviews and performance on the sentence-repetition task.
This could be because self-perceptions of speech processing are idiosyncratic and
reflective of social and autobiographical factors more than actual ability. In addition, the
interviews were deliberately not conducted during the same session as the sentence-
repetition task, in order to reflect broader experience outside the experiment.

110
TBI versus filtered results.
The purpose of comparing accuracy results between the filtered group from
Experiment 1 and the TBI group from Experiment 2 was to evaluate whether the pattern
of performance of participants with TBI could be explained by peripheral auditory
effects. As predicted, the patterns of performance on the experimental task were
significantly different between the filtered and TBI groups. While the simulated
peripheral hearing loss of band-pass filtering significantly decreased accuracy even in the
alone condition, participants with TBI showed little decrement in accuracy until the
single-talker interference portion of the task. And whereas the TBI group was less
accurate than the control group in the attend condition, they remained more accurate than
the filtered group.
Further support for the idea that peripheral auditory effects on the sentence
repetition task are different from the effects of TBI is provided by the example of two
participants who were disqualified from analysis in the TBI group due to hearing loss.
Participants A and B both stated during the initial screening that their hearing was
adequate but, once they were on site to participate in the study, the preliminary hearing
screening revealed that they did have hearing loss. Table 26 shows the screening results
for these two participants.
Obviously, data from only two participants are not sufficient to make any broad
statements, but it is interesting that these two examples of people with both TBI and
hearing loss had accuracies generally in between the mean performance of the TBI group
with normal hearing and the healthy controls with simulated hearing loss. The fact that

111
participant B, who arguably had more significant hearing loss, was more accurate than
participant A, adds further support to the idea that far more factors than peripheral
hearing play into the ability to perform the task. Because of their disqualification, these
two participants did not complete the standardized testing and interview parts of the
study, so further comparison with the other experimental groups is not possible. The
question of compounded effects of hearing loss and TBI on speech processing is relevant
for future research, however, particularly in light of the frequent comorbidity of hearing
loss with TBI (e.g. Scott, Bauch, & Olsen, 1999).
Finally, the comparison between the TBI and filtered groups raised the issue of
age as a significant factor in sentence repetition accuracy. The groups compared within
Experiment 1 and Experiment 2 were deliberately matched for age, so age was not
covaried in the ANOVAs. However, the fact that age differed between the TBI and
filtered groups even after being covaried out suggests that it may play an important role
in sentence repetition accuracy. One possible explanation for this is that there was
relatively little variation in age for the filtered group (18 to 26 years old) compared to the
TBI group (20 to 58 years old). Therefore, it is possible that the significant effect of age
in the TBI versus filtered group comparison was partly an artifact of the strong difference
in accuracy between the two groups. In other words, the model may have been showing
that younger people (i.e. the filtered group) were less accurate than older people (i.e. the
TBI group). Another possibility is that increasing age is genuinely associated with better
– or worse – speech processing abilities. This was not evaluated in Experiments 1 and 2
because of the matching of mean age between groups, as well as the confound between
age and time since injury for the TBI group, which was discussed previously. Further
112
study is needed to explore the effects of age on complex speech processing abilities, a
topic that has particular clinical applications for elderly adults with communication needs
in health care and other settings that may pose speech processing challenges.
Limitations
The present study has a number of limitations. Some are related to the small
number of participants, which restricted the statistical power of many analyses,
particularly given the high within-group variability. Other weaknesses in the project were
inherent in the design or arose as the experiment progressed, partly because this was the
first time the experimental method had been used; some drawbacks were discovered only
after data collection was underway. For example, one procedural challenge occurred with
the process of adjusting loudness in the sentence repetition task. Because the
experimenter had to step outside of the sound booth to adjust the loudness, some
participants may have been hesitant to request a change. Ideally, in future studies, a
system should be devised so that participants can adjust the loudness themselves. The
compensation scheme used for this study was also cumbersome without necessarily
adding the hoped-for motivational boost for participants. When they were told how much
compensation they had earned, several participants commented that they had forgotten
about the incentive scheme; others explicitly stated that it did not make any difference in
their motivation during the task. This suggests that future studies using this methodology
may be able to simplify the compensation system without concern about participants’
motivation levels affecting performance.
113
One limitation inherent in the design of the study was the fact that, for most
participants, accuracy was at ceiling for the NS target in the alone condition. Because the
scores were at ceiling for the unfiltered group in Experiment 1 and for both groups in
Experiment 2, all condition by group or condition by target interactions must be called
into question. The choice to include stimuli that were 100% intelligible was deliberate,
based on the drive for clinical and ecological validity: it was important to demonstrate
whether each speaker could be understood in ideal circumstances (the alone condition) in
order to establish the effects of the single-talker interference (attend) condition.
Nevertheless, these ceiling effects – deliberate or not – may have confounded some of the
statistical findings. One possible way to address this limitation would have been to
calculate RAU scores for all alone condition accuracies using the same method that was
applied to the attend condition of Experiment 1, in which the filtered group scores were
near zero. Future studies using this methodology could also incorporate techniques to
bring the alone condition performance off ceiling, such as increasing demands of speed or
adding a dual-task component or small amounts of noise masking.
Another possible limitation in the study is that the repetition task did not
explicitly establish listeners’ ability to distinguish between the two speakers in the attend
condition, though this is unlikely because almost all participants did consistently repeat
the target speaker, suggesting that they were able to tell the two speakers apart. The
experiment also could have done more to distinguish between energetic and
informational masking effects (e.g. by having the NNS speak Mandarin for some
interfering sentences and English for others, and/or using speech-shaped noise as
interference). On the other hand, the task did provide its own control in that energetic
114
masking would be equal for the two attend blocks: the acoustic signal is the same, the
only difference being in the instructions about which voice to attend to.
Future Directions
The current study sets the stage for numerous possible follow-ups and extensions.
Further analyses of the existing dataset related to accuracy, error patterns, response times,
effort ratings, and interview responses could be used in the future to expand on the
findings already presented. Future studies can also be designed to follow up and continue
the line of inquiry begun with the current study, including increasing the number of
participants, expanding to studies of treatment or effects in elderly rather than TBI
populations, focusing within the TBI population on mild TBI or course of recovery, or
possibly developing standardized assessments for complex speech processing.
Several areas of further analysis would be possible with the data already collected
for this dissertation. As mentioned in the discussion, there may be more to learn from
different patterns of repetition accuracies within groups, such as whether individual
participants scored higher on the NNS or the NS target in the attend condition. These
patterns could be examined in conjunction with demographic variables, cognitive
variables, and order effects. The order effects themselves should also be explored further,
possibly using nonparametric statistical tools and/or with a larger n for increased power.
Error analyses of the sentence repetition data could also be illuminating. The only
error analysis of the sentence repetition data that has been done so far is the comparison
of number and percentage of interfering words repeated. Further error analysis could
examine which sentences were more or less likely to be repeated correctly or incorrectly,
115
as well as the phonemic and semantic errors produced by participants. For example, were
participants more likely to provide incorrect words that were phonetically related to the
target (i.e. based on available acoustic information, using a bottom-up process) or
semantically related to the rest of their repetition (i.e. based on available content
information, a more top-down process)? Any group differences – or lack thereof – in
such error patterns could further illuminate the effects of brain injury on speech
processing.
Another potential avenue for analysis is reaction or recovery time data for the
sentence repetition task. Data measuring the duration between the presentation of the
“press the space bar when you are ready to continue” instruction and when the participant
pressed the space bar to advance to the next trial were collected automatically using E-
prime software. This is not strictly the time it took to respond to each stimulus, so a better
description might be “recovery time” or simply “trial time.” Similar analyses could be
done with these data as were done for accuracy and effort, although the data are
extremely variable for participants in both groups; a trial-by-trial evaluation along with
the audio recordings of the relevant sessions would be necessary in order to eliminate
data points that included conversation or questions as well as simple statistical outliers.
Effort ratings are another avenue for additional analysis. As discussed briefly
above, the method of assessing effort was potentially problematic, particularly in the
attend condition, in which effort ratings were made only after each 30-sentence block was
completed. This may have made it difficult for participants to be precise in comparing the
two blocks. Future studies could ask for a preliminary effort rating after only 5–10
sentences before proceeding with the rest of the block; further analysis is also possible
116
with the data that were already collected. In addition to the numerical effort ratings made
after each block in the sentence repetition task, participants were asked to elaborate on
their ratings once the entire task was completed. These follow-up questions are listed in
Appendix 4. Further analysis could be useful in that these qualitative data could offset
some of the limitations of the numerical effort ratings. They could also be analyzed for
correlations with accuracy using a similar method to that applied already to the semi-
structured interview data: it is possible that subjective commentary that is more directly
related to the experimental task would reveal stronger correlations with task performance.
Further analyses of the interview transcriptions would be another potentially
fruitful avenue of research. For example, closer examination and development of
subthemes for utterances coded within the catchall category of “strategy” could address
several research questions. What were the types and specificities of strategies mentioned
by participants in each group? Did control participants differ from participants with TBI
in the quantity or quality of the strategies they described? Given that the TBI group
mentioned their strengths more often than controls during the interviews, are they
correspondingly more prone to discuss strategies for successful speech processing?
Finally, along with further examination of the “strategy” and “strength” codes
(and other relatively broad codes such as “not a problem” and “accent”), a conversational
analysis of the interviews could be used to address some questions about the effects of
TBI on conversation. For example, are word choices and syntactic patterns different in
the interview statements of participants with and without TBI? Are there differences in
fluency or patterns of word choice?
117
Along with further analyses of data already collected, the current work suggests
several possible avenues of future research on this topic. For example, as mentioned
above, future studies could repeat a very similar methodology with a greater number of
participants in order to (a) re-assess effort using methods designed to increase validity
and (b) analyze the effects of presentation order with increased statistical power.
Research into therapy or remediation is another promising direction for future
research. While documenting deficits after brain injury such as those found in the current
study does serve a purpose in the greater scheme of TBI research, it is of questionable
value unless followed up with investigations into how to remediate those deficits. Future
intervention studies could target the subjective perception of effort in the task as well as
improvement of sentence repetition accuracy. For example, the experimenter noted that,
in the current study, the single-talker interference task seemed subjectively easier when
participants in the unfiltered condition were run immediately after participants in the
filtered condition: it would be interesting to explore whether training in the filtered
condition would reduce effort and/or improve accuracy on a subsequent unfiltered
condition. Reduced effort alone could be a worthwhile goal for this type of intervention,
given the prevalence of feelings such as frustration, stress, and anxiety reported in
interviews among individuals with brain injury regarding complex speech processing.
Metacognitive training could also be explored as a means to improve both subjective
experience and objective accuracy. Both Kennedy and Coelho (2005) and Chen, Abrams,
and D’Esposito (2006) emphasize the importance of metacognitive strategy instruction
that is both explicitly goal-oriented and individualized to the client. In addition, Chen et

118
al. recommend multi-modal treatments to activate across multiple components of the
prefrontal cortical network for executive functioning.
A third avenue for future research to build on the present study would be to
pursue issues of processing non-native-accented speech in elderly adults as opposed to
adults with TBI. As discussed above, age was a significant factor in some of the analyses
in the current study. Aging adults are faced with the potential for mild cognitive
impairment, reduced processing speed, and dementia, not to mention peripheral hearing
loss even in those with completely intact cognitive abilities. As the baby boomer
population in the United States ages, increasing numbers of people are entering assisted
living and skilled nursing facilities and staff at such facilities often include non-native-
accented speakers of English. Therefore, quality of life for residence and job satisfaction
and effectiveness for staff have the potential to be affected by issues of complex speech
processing such as those addressed in the present line of research.
Targeted research into speech processing after mild TBI is another potential
direction that this line of research could explore. The current study population comprised
mostly individuals who had experienced moderate to severe brain injury. Additional
research is needed to determine whether comparable difficulties with speech processing
occur following specifically mild (or, more likely, mild-complicated) TBI. This is an area
of growing public interest, with increasing media discussion of sports-related concussion
and the prevalence of mild (or worse) TBI among military service members.
Both civilian and military populations would also benefit from better research on
the long-term effects of TBI. All participants in the present study were in the post-acute
stage, ranging from two to 22 years after injury. Several participants mentioned in their
119
interviews that, although their speech processing had worsened relative to their
premorbid abilities, it had improved over the course of their recovery. Further research
would be useful in order to establish whether there is a common time-course for
improvement of speech processing deficits after TBI; in addition, this could be combined
with treatment studies to determine if there are differential treatment effects at different
stages of recovery.
Finally, the current project may be used as a jumping-off point for future
development of a standardized assessment of complex speech processing. At this time, no
such assessments are available, though the subjective reports of participants in this study
suggest that they might be of considerable benefit to people with TBI. The assessments
could be useful in the acute stage after TBI, in order to alert clinicians and clients to
difficulties that may occur outside the environment of acute care; they could also, in
conjunction with treatment research, help clinicians and clients in post-acute stages to
select and apply appropriate interventions.
Conclusions
This dissertation has examined several facets of complex speech processing,
specifically in a single-talker interference task with native- and non-native-accented
speakers. Experiment 1 showed that a simulated peripheral hearing loss led to
significantly lower accuracy for repeating the non-native speaker than the native speaker
target, particularly in the alone condition. The results of Experiment 2 demonstrated that
adults with TBI were less accurate than healthy controls at the sentence repetition task,
particularly in the attend condition. The TBI group also reported greater difficulty with
120
complex speech processing in everyday situations. Although there was no direct
correspondence found between subjective reports and repetition accuracy, within the
interviews participants reported experiences of distraction, reduced attention and
difficulty filtering that led to experiences of frustration, stress, and anxiety as well as
reduced comprehension. Exploratory correlations with standardized testing of cognition
and auditory processing showed that, for the TBI group, listening span (a measure of
verbal working memory) and processing speed showed trends toward significant
associations with the ability to repeat one speaker while ignoring another. In contrast,
standardized measures of central auditory processing showed no correspondence with
performance on the single-talker interference task.
People who experience TBI face many challenges as they adjust to the chronic
stage of their recovery. One of the challenges common among TBI survivors is difficulty
with complex speech processing; the present study has shown that this difficulty can be
demonstrated quantitatively as well as qualitatively, and offers numerous avenues for
future investigation.
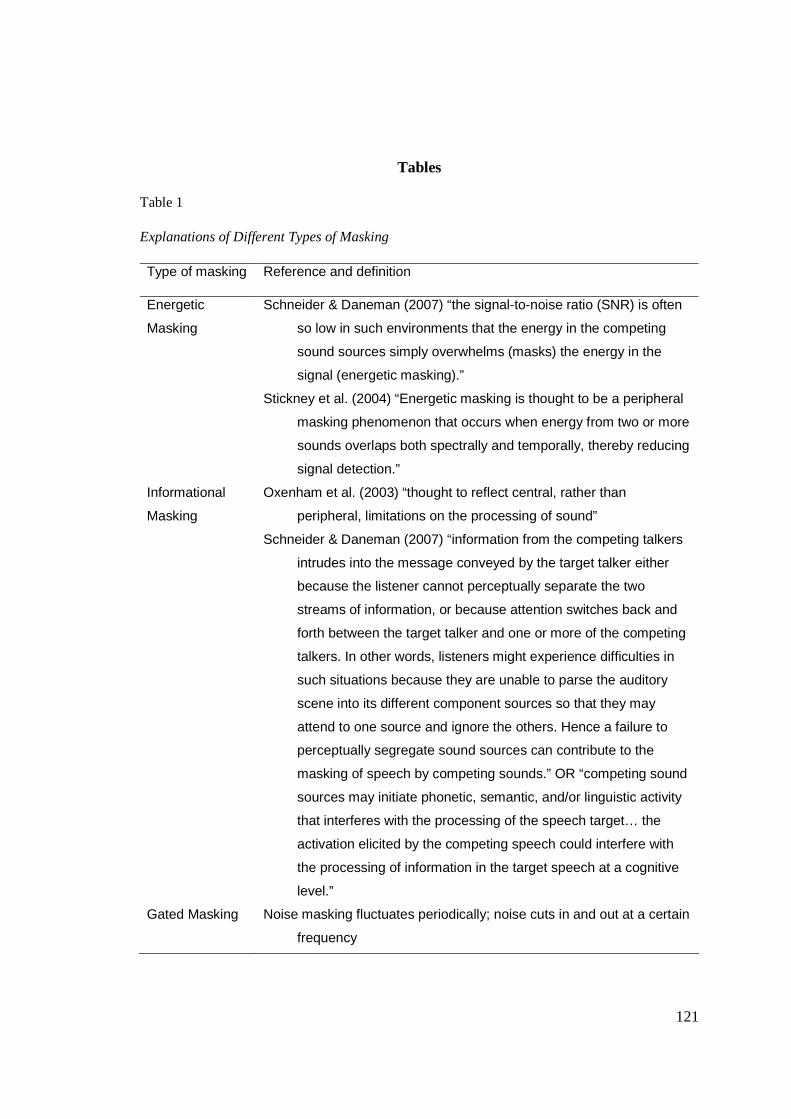
121
Tables
Table 1
Explanations of Different Types of Masking
Type of masking Reference and definition
Energetic
Masking
Schneider & Daneman (2007) “the signal-to-noise ratio (SNR) is often
so low in such environments that the energy in the competing
sound sources simply overwhelms (masks) the energy in the
signal (energetic masking).”
Stickney et al. (2004) “Energetic masking is thought to be a peripheral
masking phenomenon that occurs when energy from two or more
sounds overlaps both spectrally and temporally, thereby reducing
signal detection.”
Informational
Masking
Oxenham et al. (2003) “thought to reflect central, rather than
peripheral, limitations on the processing of sound”
Schneider & Daneman (2007) “information from the competing talkers
intrudes into the message conveyed by the target talker either
because the listener cannot perceptually separate the two
streams of information, or because attention switches back and
forth between the target talker and one or more of the competing
talkers. In other words, listeners might experience difficulties in
such situations because they are unable to parse the auditory
scene into its different component sources so that they may
attend to one source and ignore the others. Hence a failure to
perceptually segregate sound sources can contribute to the
masking of speech by competing sounds.” OR “competing sound
sources may initiate phonetic, semantic, and/or linguistic activity
that interferes with the processing of the speech target… the
activation elicited by the competing speech could interfere with
the processing of information in the target speech at a cognitive
level.”
Gated Masking Noise masking fluctuates periodically; noise cuts in and out at a certain
frequency
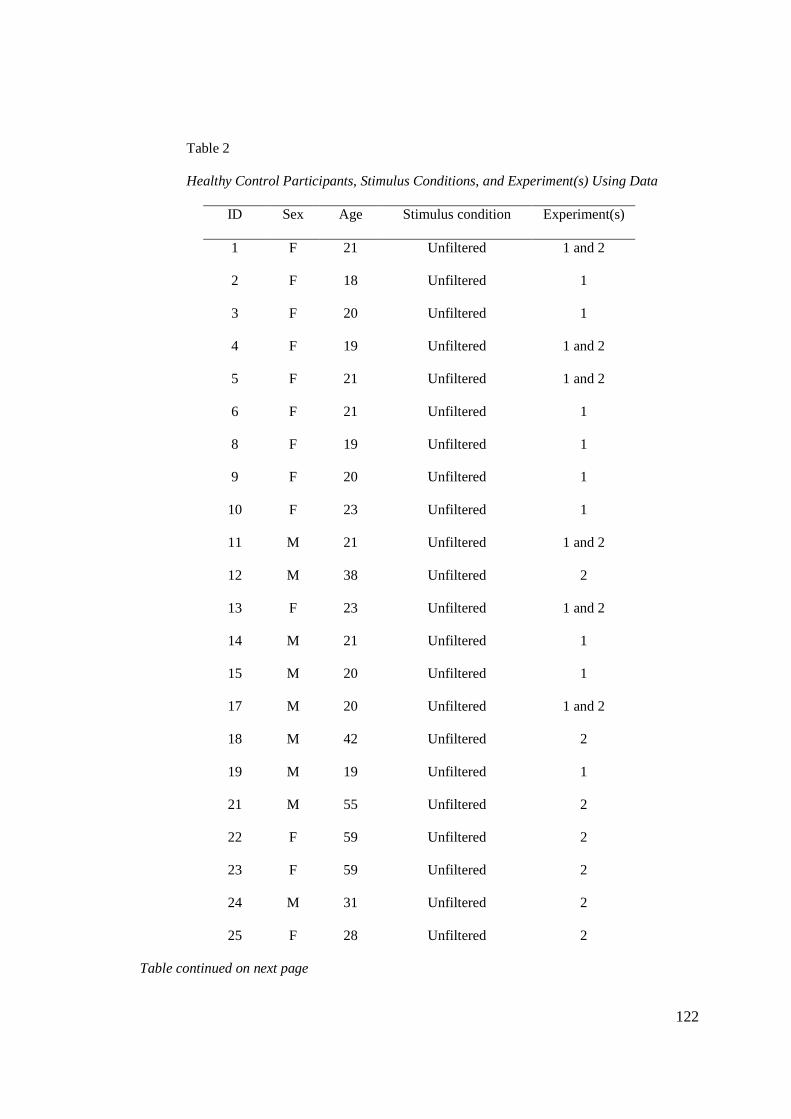
122
Table 2
Healthy Control Participants, Stimulus Conditions, and Experiment(s) Using Data
ID Sex Age Stimulus condition Experiment(s)
1 F 21 Unfiltered 1 and 2
2 F 18 Unfiltered 1
3 F 20 Unfiltered 1
4 F 19 Unfiltered 1 and 2
5 F 21 Unfiltered 1 and 2
6 F 21 Unfiltered 1
8 F 19 Unfiltered 1
9 F 20 Unfiltered 1
10 F 23 Unfiltered 1
11 M 21 Unfiltered 1 and 2
12 M 38 Unfiltered 2
13 F 23 Unfiltered 1 and 2
14 M 21 Unfiltered 1
15 M 20 Unfiltered 1
17 M 20 Unfiltered 1 and 2
18 M 42 Unfiltered 2
19 M 19 Unfiltered 1
21 M 55 Unfiltered 2
22 F 59 Unfiltered 2
23 F 59 Unfiltered 2
24 M 31 Unfiltered 2
25 F 28 Unfiltered 2
Table continued on next page

123
Table 2
Continued from Previous Page
ID Sex Age Stimulus condition Experiment(s)
1 F 21 Filtered 1
2 F 21 Filtered 1
3 M 19 Filtered 1
4 F 20 Filtered 1
5 F 22 Filtered 1
6 F 18 Filtered 1
7 F 20 Filtered 1
8 F 26 Filtered 1
9 F 18 Filtered 1
10 M 19 Filtered 1
11 F 22 Filtered 1
12 F 22 Filtered 1
13 F 22 Filtered 1
14 F 22 Filtered 1
15 F 20 Filtered 1
Note: The “Experiment(s)” column indicates whether each participant’s data were
used for analysis in Experiment 1, Experiment 2, or both.

124
Table 3
Experiment 1 Participant Demographics (Healthy Adults Without TBI)
Unfiltered group Filtered group
ID Sex
(M/F) Age
Education
(yrs)
Est. verbal
IQ ID
Sex
(M/F) Age
Education
(yrs)
Est.
verbal IQ
1 F 21 15 111 1 F 21 15 103
2 F 18 12 113 2 F 21 15 102
3 F 20 13 107 3 M 19 13 113
4 F 19 13 103 4 F 20 14 110
5 F 21 15 107 5 F 22 15 105
6 F 21 15 99 6 F 18 12 109
7 F 19 12 100 7 F 20 14 115
8 F 20 15 108 8 F 26 17 98
9 F 23 16 123 9 F 18 12 99
10 M 21 14 95 10 M 19 12 108
12 F 23 15 106 11 F 22 16 114
13 M 21 15 106 12 F 22 15 115
14 M 20 14 110 13 F 22 15 110
15 M 20 14 110 14 F 22 15 108
17 M 19 13 109 15 F 20 14 113
M 5/10 20.4 14.07 107.13 2/13 20.8 14.27 108.13
SD 1.4 1.22 6.58 2.0 1.49 5.63

125
Table 4
Experiment 2 Participant Demographics (Adults With and Without TBI)
Control group TBI group
ID Sex
(M/F)
Age Education
(yrs)
Est. verbal
IQ
ID Sex
(M/F)
Age Education
(yrs)
Est.
verbal IQ
1 F 21 15 111 1 M 55 13 113
4 F 19 13 103 2 F 30 16 113
5 F 21 15 107 3 F 48 12 110
10 M 21 14 95 4 M 21 13 100
11 M 38 16 121 5 F 23 17 103
12 F 23 15 106 6 M 42 12 111
15 M 20 14 110 7 M 47 11 125
16 M 42 18 119 8 F 58 16 119
18 M 55 16 119 9 M 22 14 113
19 F 59 14 116 10 F 20 13 112
20 F 59 16 123 11 F 55 18 105
21 M 31 16 115 12 F 47 22 124
22 F 28 16 118 13 M 43 14 115
M 6/7 33.62 15.23 112.5 6/7 39.21 14.64 112.1
SD 15.45 1.30 8.13 13.64 2.93 7.22

126
Table 5
TBI Participant Injury Information
ID Time post
injury (yrs)
Severity of
injury*
Type & description of injury
1 6 N/A
CSF deficit; no LOC but severe pain & functional
impairments
2 3
Mild
complicated
2 falls in 2 mos; 5-15 min LOC each time
3 9 Severe MVA; 17 days coma
4 2 Severe Fall; 6 wks coma (induced)
5 4 Severe MVA; 9 days LOC
6 21 Severe MVA; 10 days coma
7 22 Severe MVA; 10 days coma
8 40 Severe MVA; 6 days coma
9 2 Severe MVA; 4 days coma
10 2 Severe MVA; 1 month LOC
11 15 Moderate Bike accident; 30 min LOC
12 5
Mild
complicated
Bike accident; 5-10 min LOC
13 16 Severe MVA; 1-2 wks PTA
M 11.31
SD 11.26
Note: CSF = cerebrospinal fluid; LOC = loss of consciousness; MVA = motor vehicle accident *Severity of injury estimated based on hospital records and/or length of coma or post-traumatic amnesia (Lezak, 1995)

127
Table 6
Summary List of Standardized Tests Administered in Experiment 2
Test name Acronym Process measured
National Adult Reading Test NART Estimated verbal IQ
Repeatable Battery for the Assessment of
Neuropsychological Status
RBANS Subtests for immediate memory,
delayed memory, verbal,
visuospatial, attention
Tompkins Listening Span test Listening Span Working memory
Woodcock-Johnson Test of Cognition,
decision speed subtest
Decision
Speed
Processing speed
Attention Process Training – II questionnaire APT-II
questionnaire
Attention
Behavioral Assessment of Dysexecutive
Syndrome Dex questionnaire
BADS
questionnaire
Executive function
Delis-Kaplan Executive Function System,
trail-making subtest
D-KEFS Trails Executive function (switching)
Western Aphasia Battery WAB Screen for aphasia
Weschler Memory Scale – III,
digits backwards subtest
WMS-III digits
backward
Working memory
SCAN for adolescents and adults SCAN-A Central auditory processing
(CAP): subtests for filtered
words, words in noise, dichotic
listening
Masking Level Difference test MLD CAP: brainstem
Gaps in Noise test GIN CAP: temporal auditory
processing
Hearing screening Peripheral hearing loss

128
Table 7
Mean Performance on Standardized Tests of Cognition for Participants in Experiment 2
TBI Control
Test Subtest/outcome Mean (stdev) Mean (stdev)
RBANS Immediate memory (%ile) 40.31 (31.44) 53.08 (23.69)
Visuospatial (%ile) 71.69 (22.96) 80.69 (18.03)
Language (%ile) * 28.85 (18.92) 47.54 (20.14)
Attention (%ile) * 43.69 (27.83) 68.69 (30.31)
Delayed memory (%ile) 46.85 (24.92) 62.38 (20.52)
Total (%ile) * 42.85 (25.53) 68.54 (22.49)
NART Predicted verbal IQ 113.15 (6.50) 112.85 (8.46)
Listening Span Listening Span (raw) ** 32.85 (5.11) 37.77 (2.28)
WMS-III Digits backwards 7.54 (2.37) 7.92 (2.22)
APT-II APT questionnaire * 19.67 (14.30) 9.31 (7.03)
BADS Dex questionnaire 19.08 (14.49) 15.92 (5.87)
WJ-III Decision Speed: time (sec) 178.62 (4.99) 172.00 (15.20)
Decision Speed: accuracy (raw) *** 35.00 (3.19) 38.54 (1.27)
D-KEFS Trails: non-switching
(letters+numbers) (SS) * 11.38 (3.23) 13.54 (1.76)
Trails: switching (SS) * 10.92 (1.89) 12.23 (1.30)
Trails: motor speed (SS) 12.15 (3.39) 12.15 (1.14)
Trails: switching/non-switching diff
(SS) 8.92 (2.47) 8.46 (3.02)
Trails: switching/motor diff (SS) 9.77 (2.0) 9.77 (1.7)
Note:%ile = percentile; raw = raw score; SS = standard score
Significant group differences: * p ≤ 0.05 ** p ≤ 0.01 *** p ≤ 0.001

129
Table 8
Sequence of presentation for experimental blocks in sentence-repetition task
Experimental
block Sequence I Sequence II Sequence III Sequence IV
1 NNS alone NS alone NNS alone NS alone
2 NS alone NNS alone NS alone NNS alone
3 NNS target NNS target NS target NS target
4 NS target NS target NNS target NNS target
Note: “Target” indicates which speaker was the target in each block of the attend condition.
Table 9
Mean Proportion Correct by Group and Target Speaker for Experiment 1
Alone condition Attend condition
Group NNS NS NNS NS
Filtered Group
(mean, SD) 0.48 (0.07) 0.82 (0.09) 0.08 (0.03) 0.16 (0.05)
Unfiltered Group
(mean, SD) 0.99 (0.02) 1.00 (0.01) 0.65 (0.10) 0.68 (0.12)
Note: Attend condition values are RAU adjusted; scores for the NNS target in the alone
condition were calculated out of 49 words to exclude one that was missed by most
participants.

130
Table 10
Statistics Table for Experiment 1 Accuracy
Comparison
Mean
Square df F Sig.
Observed
Power
Group (6.22) 1 753.42 2.23x10⁻³³ 0.96 1.00
Error (Group) (0.01) 28
Condition (5.93) 1 664.31 4.77x10⁻²¹ 0.96 1.00
Condition x Group (0.37) 1 41.94 514x10-7 0.60 1.00
Error (Condition) (0.01) 28
Target (0.43) 1 198.84 3.03x10⁻¹⁴ 0.88 1.00
Target x Group (0.31) 1 144.60 1.42x10⁻¹² 0.84 1.00
Error (Target) (0.002) 28
Condition x Target (0.07) 1 22.48 5.63x10⁻⁵ 0.45 1.00
Condition x Target x Group (0.11) 1 33.55 3.20x10⁻⁶ 0.55 1.00
Error (Condition x Target) (0.003) 28
Note: p values significant at the p < 0.05 level.

131
Table 11
Mean Effort ratings by Group and Target Speaker for Experiment 1
Alone condition Attend condition
Group NNS NS NNS NS
Filtered Group
(mean, SD) 7.43 (1.21) 5.03 (1.61) 9.37 (0.72) 9.17 (0.62)
Unfiltered Group
(mean, SD) 3.67 (1.89) 0.93 (1.02) 8.23 (1.39) 7.87 (1.06)

132
Table 12
Statistics Table for Experiment 1 Effort
Comparison df Mean Square F Sig.
Observed
Power
Group 1 (117.51) 18.62 1.79x10⁻⁴ 0.40 0.99
Error (Group) 28 (6.31)
Condition 1 (463.06) 100.70 8.91x10⁻¹¹ 0.78 1.00
Condition x Group 1 (18.21) 4.21 0.05 0.13 0.51
Error (Condition) 28 (4.33)
Target 1 (50.38) 58.28 2.57x10⁻⁸ 0.68 1.00
Target x Group 1 (0.001) 0.001 0.98 0.00 0.05
Error (Target) 28 (0.86)
Condition x Target 1 (29.75) 49.18 1.26x10⁻⁷ 0.64 1.00
Condition x Target x Group 1 (0.33) 0.54 0.47 0.02 0.11
Error (Condition x Target) 28 (0.61)
Note: p values significant at the p < 0.05 level.
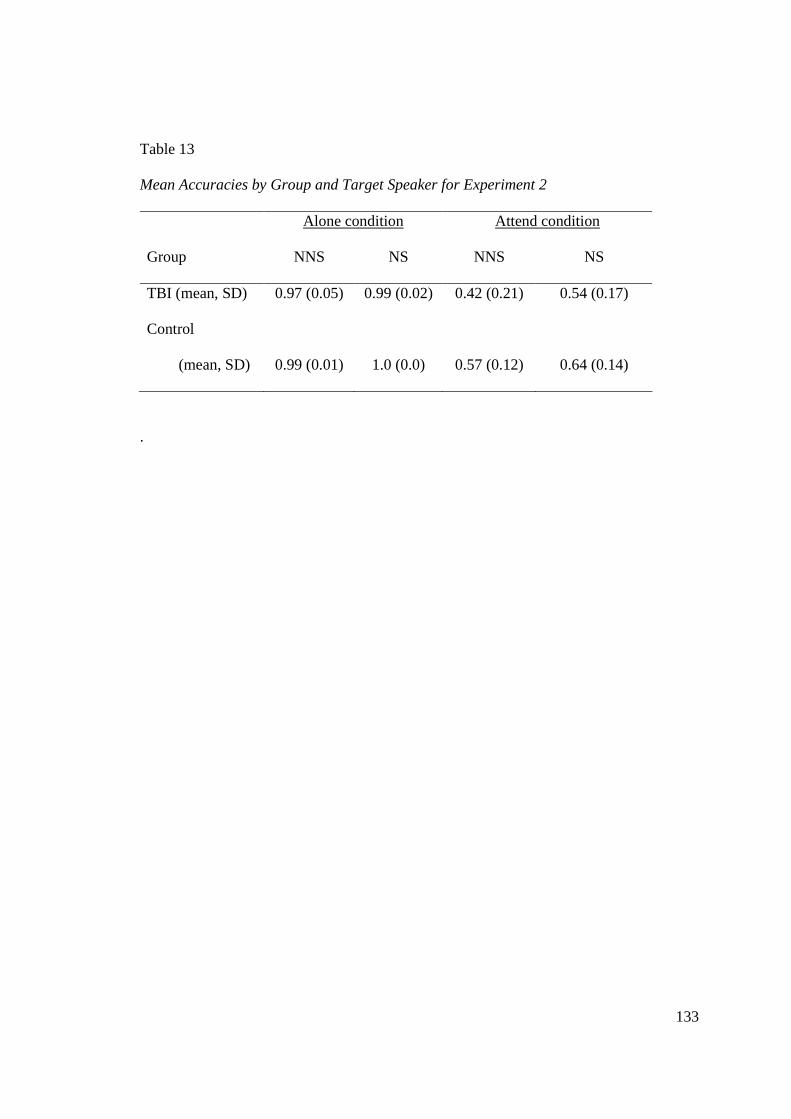
133
Table 13
Mean Accuracies by Group and Target Speaker for Experiment 2
Alone condition Attend condition
Group NNS NS NNS NS
TBI (mean, SD) 0.97 (0.05) 0.99 (0.02) 0.42 (0.21) 0.54 (0.17)
Control
(mean, SD) 0.99 (0.01) 1.0 (0.0) 0.57 (0.12) 0.64 (0.14)
.
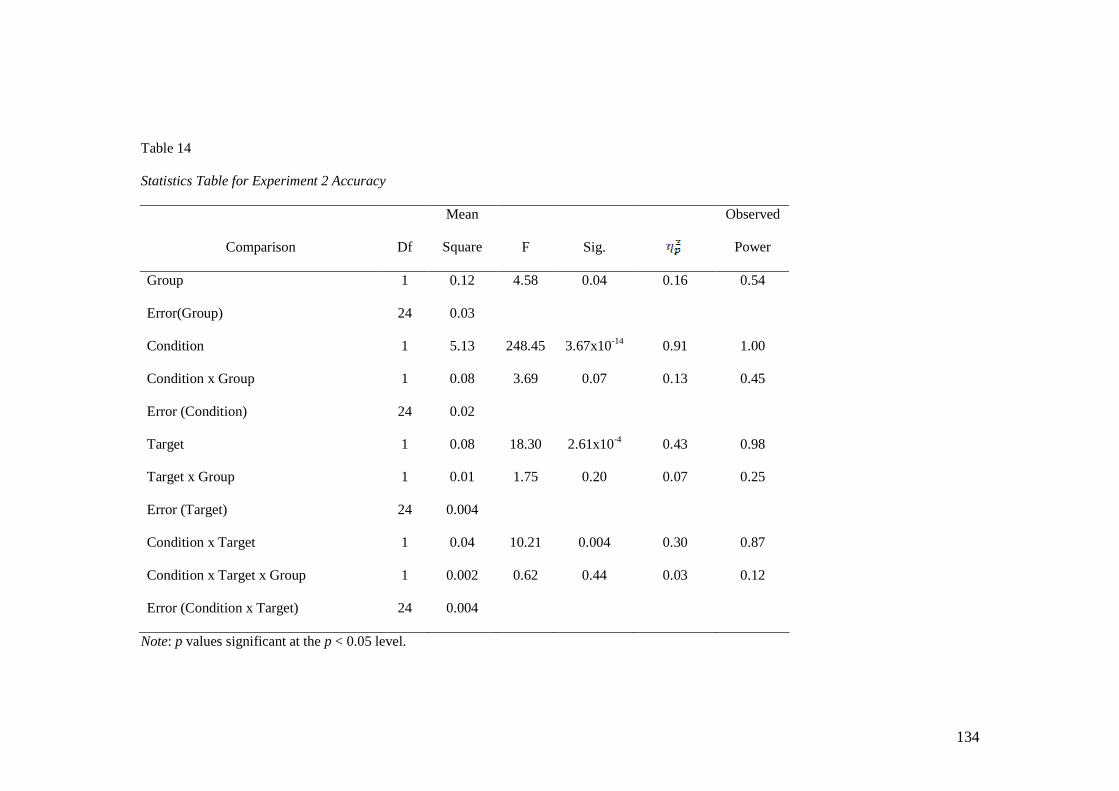
134
Table 14
Statistics Table for Experiment 2 Accuracy
Comparison Df
Mean
Square F Sig.
Observed
Power
Group 1 0.12 4.58 0.04 0.16 0.54
Error(Group) 24 0.03
Condition 1 5.13 248.45 3.67x10⁻¹⁴ 0.91 1.00
Condition x Group 1 0.08 3.69 0.07 0.13 0.45
Error (Condition) 24 0.02
Target 1 0.08 18.30 2.61x10⁻⁴ 0.43 0.98
Target x Group 1 0.01 1.75 0.20 0.07 0.25
Error (Target) 24 0.004
Condition x Target 1 0.04 10.21 0.004 0.30 0.87
Condition x Target x Group 1 0.002 0.62 0.44 0.03 0.12
Error (Condition x Target) 24 0.004
Note: p values significant at the p < 0.05 level.

135
Table 15
Mean Effort (on a 0-to-10 scale) by Group,Target Speaker, and Condition for Experiment 2
Alone condition Attend condition
Group NNS NS NNS NS
TBI (mean, SD) 4.10 (2.38) 1.67 (1.68) 8.23 (2.28) 7.42 (2.56)
Control
(mean, SD) 3.62 (1.91) 0.81 (1.22) 8.65 (1.11) 7.96 (1.32)

136
Table 16
Statistics Table for Experiment 2 Effort
Comparison df
Mean
Square F Sig.
Observed
Power
Group 1 (0.24) 0.03 0.87 0.001 0.05
Error (Group) 24 (8.89)
Condition 1 (792.01) 263.57 1.92x10⁻¹⁴ 0.92 1.00
Condition x Group 1 (8.65) 2.88 0.10 0.11 0.37
Error (Condition) 24 (3.01)
Target 1 (73.62) 67.03 2.09x10⁻⁸ 0.74 1.00
Target x Group 1 (0.12) 0.11 0.75 0.004 0.06
Error (Target) 24 (1.10)
Condition x Target 1 (22.62) 19.25 1.97x10⁻⁴ 0.45 0.99
Condition x Target x Group 1 (0.41) 0.35 0.56 0.01 0.09
Error (Condition x Target) 24 (1.18)
Note: p values significant at the p < 0.05 level.

137
Table 17
Target-Interfering Repetition Differences in Experiment 2, Reported in Proportions
Proportion difference between target and interfering words
Group NNS NS
TBI (mean, SD) 0.32 (0.31) 0.44 (0.25)
Control (mean, SD) 0.50 (0.15) 0.55 (0.20)
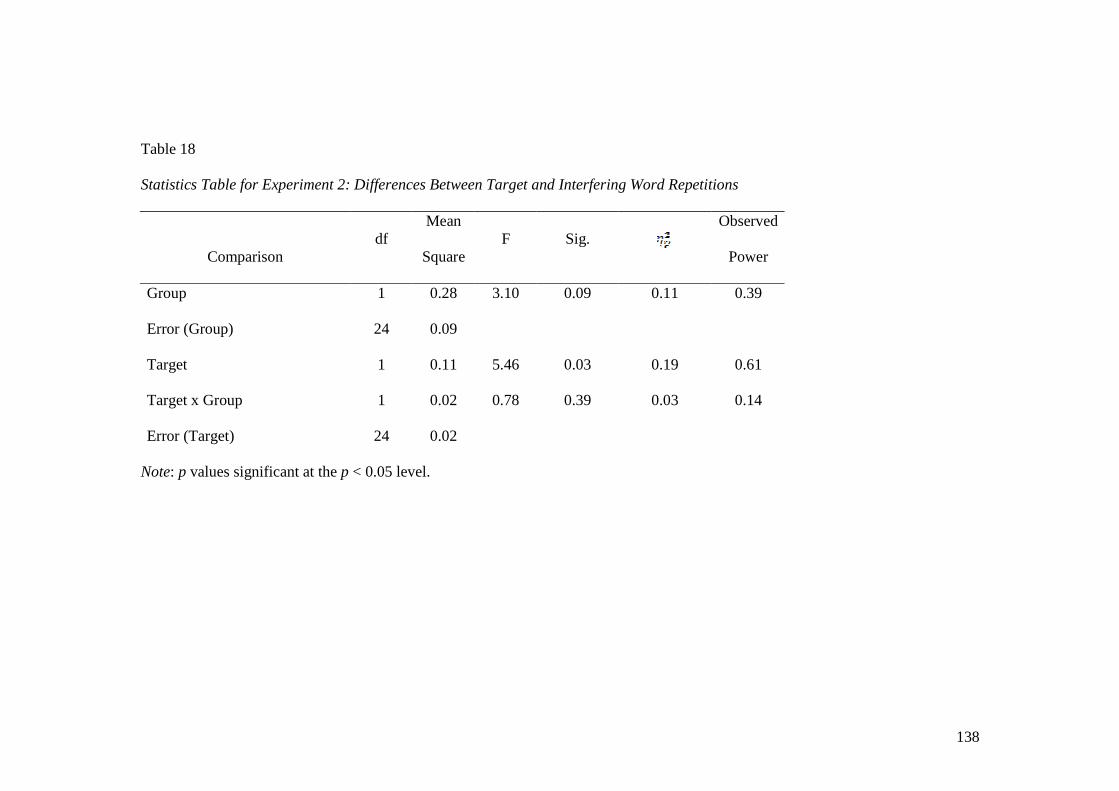
138
Table 18
Statistics Table for Experiment 2: Differences Between Target and Interfering Word Repetitions
Comparison df
Mean
Square F Sig.
Observed
Power
Group 1 0.28 3.10 0.09 0.11 0.39
Error (Group) 24 0.09
Target 1 0.11 5.46 0.03 0.19 0.61
Target x Group 1 0.02 0.78 0.39 0.03 0.14
Error (Target) 24 0.02
Note: p values significant at the p < 0.05 level.

139
Table 19
Test Scores for Assessments of Central Auditory Processing
Assessment
TBI group
Mean (SD)
Control group
Mean (SD)
i SCANA filtered words (SS) 9.15 (2.27) 10.46 (2.18)
SCANA figure-ground (SS) 10.00 (2.73) 10.23 (2.65)
SCANA dichotic listening (SS) 9.85 (2.44) 10.54 (2.47)
ii Masking Level Difference * 31.54 (10.30) 38.77 (7.24)
iii Gaps In Noise (% accuracy) 0.66 (0.10) 0.67 (0.14)
Gaps In Noise (number of false positives) 1.77 (2.83) 0.77 (1.17)
* p < 0.05

140
Table 20
Correlation Matrix: Pearson Correlations Among Cognitive Test Scores and Sentence Repetition Accuracies for the TBI Group
Age APT
Dcsn
Speed
Acc
Listen
Span MLD
Alone
NNS:
acc
Attend
NNS:
acc
Alone
NNS:
eff
Attend
NNS
eff
Alone
NS:
acc
Attend
NS:acc
Alone
NS:eff
Attend
NS: eff
yrs.
since
injury
Age 1.00 0.07 0.33 -0.45 -0.33 -0.27 -0.63* 0.37 0.35 0.16 -0.61* 0.26 0.48 0.67*
APT 1.00 0.10 -0.02 0.51 0.03 -0.47 0.09 0.01 0.08 -0.43 -0.01 0.24 -0.18
DcsnSpdAcc 1.00 0.19 -0.28 -0.03 -0.54 ~ 0.36 0.26 -0.06 0.01 -0.31 -0.05 0.37
ListnSpan 1.00 0.13 0.55 ~ 0.45 -0.07 0.03 0.34 0.59 -0.12 -0.21 -0.09
MLD 1.00 0.36 0.07 -0.55 ~ -0.45 0.34 -0.04 -0.09 -0.37 -0.49
AloneNNS:acc 1.00 0.55 ~ -0.16 -0.27 0.79** 0.51 0.10 -0.39 -0.04
AttendNNS:acc 1.00 -0.32 -0.45 0.25 0.58 ~ 0.08 -0.48 -0.16
AloneNNS:eff 1.00 0.46 -0.24 -0.31 0.63* 0.60* 0.02
Attend NNS:eff 1.00 -0.24 0.10 0.05 0.80** 0.15
Alone NS:acc 1.00 0.16 0.19 -0.19 0.20
Attend NS:acc 1.00 -0.37 -0.30 -0.17
Alone NS:eff 1.00 0.46 -0.24
Attend NS:eff 1.00 0.02
yrs.since.injury 1.00
Note: N= 11 Acc = accuracy; Eff = effort ~ p ≤ 0.1 * p ≤ 0.05 ** p ≤ 0.01

141
Table 21
Correlation Matrix: Pearson Correlations Among Cognitive Test Scores and Sentence Repetition Accuracies for the Control Group
Age APT Dcsn
SpdAcc
Listen
Span MLD
Alone
NNS:
acc
Attend
NNS:
acc
Alone
NNS:
eff
Attend
NNS
eff
Alone
NS:
acc
Attend
NS:acc
Alone
NS:eff
Attend
NS: eff
Age 1.00 -0.31 0.03 -0.34 -0.20 0.06 0.08 0.02 -0.47 NA -0.21 -0.24 0.22
APT 1.00 0.12 0.03 0.33 -0.16 -0.28 -0.41 0.12 NA 0.02 -0.02 -0.02
DcsnSpdAcc 1.00 0.22 0.66* -0.20 -0.42 0.20 0.14 NA 0.00 -0.04 0.14
ListnSpan 1.00 0.46 0.31 0.12 -0.03 0.15 NA 0.41 0.07 -0.37
MLD 1.00 -0.13 -0.45 0.02 0.31 NA 0.11 0.07 0.26
AloneNNS:acc 1.00 0.51 ~ 0.07 -0.11 NA 0.31 -0.06 0.02
AttendNNS:acc 1.00 -0.08 -0.72** NA 0.78** 0.25 -0.58*
AloneNNS:eff 1.00 0.33 NA -0.04 0.62* 0.43
Attend NNS:eff 1.00 NA -0.54 0.07 0.53
Alone NS:acc 1 NA NA NA
Attend NS:acc 1.00 0.43 -0.53 ~
Alone NS:eff 1.00 -0.06
Attend NS:eff 1.00
Note: N = 13 Acc = accuracy; Eff = effort The Alone NS:acc factor lists “NA” because all participants were 100% accurate. ~ p ≤ 0.1 * p ≤ 0.05 ** p ≤ 0.01

142
Table 22
Interview Themes (number reporting from TBI group minus control group)
Theme Group Difference
change - 7
can't process 5
focus 5
frustrated 5
no strategy 5
accommodation 4
distraction 4
less social 4
overload 4
strength 4
stressful 4
extra effort 3
fatigue 3
filter 3
multiple talkers 3
speaking 3
alcohol 2
conversation partners 2
impulsivity 2
slow 2
anxiety 1
difficult 1
headache 1
simple 1
think 1
tinnitus 1
topic 1
Continued on next page.

143
Table 22
Continued from previous page.
Theme Group Difference
accent 0
familiarity 0
mumble 0
nonverbal 0
Not a problem 0
visual 0
camouflage -1
depends -1
fluency -1
monotone -1
phone -1
strategy -1
text -2
background noise -3
change = -3
endorse -3
change + -4
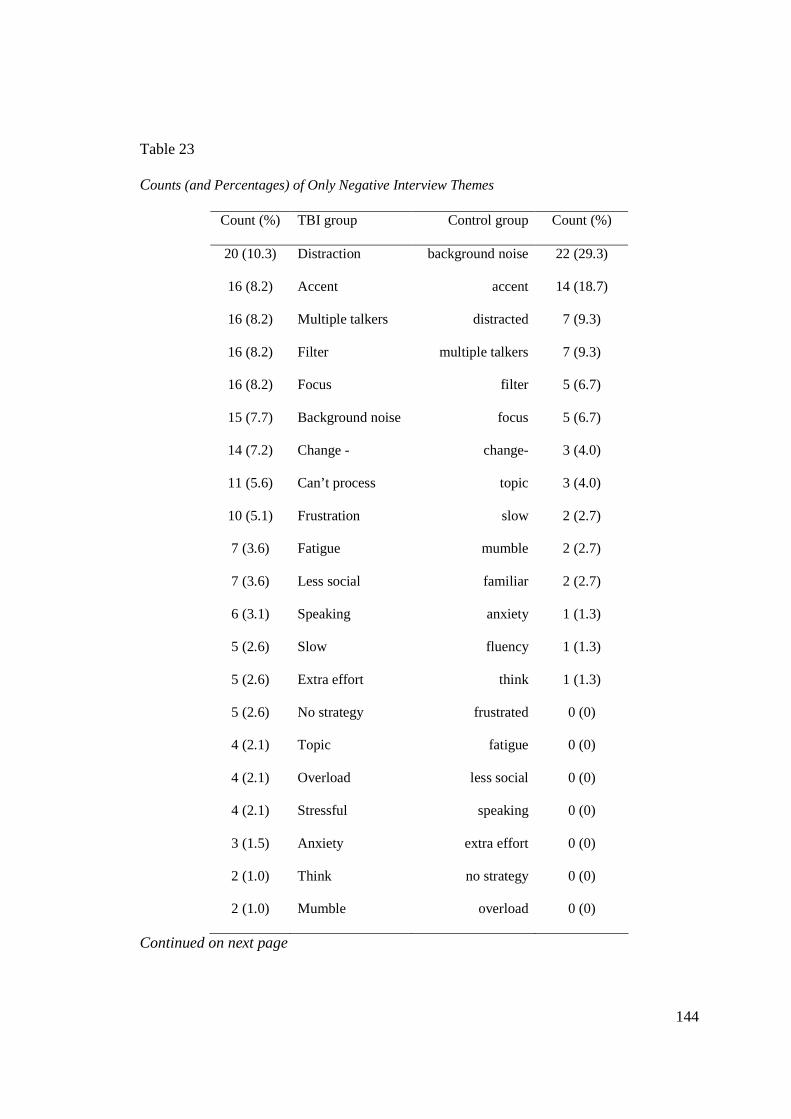
144
Table 23
Counts (and Percentages) of Only Negative Interview Themes
Count (%) TBI group Control group Count (%)
20 (10.3) Distraction background noise 22 (29.3)
16 (8.2) Accent accent 14 (18.7)
16 (8.2) Multiple talkers distracted 7 (9.3)
16 (8.2) Filter multiple talkers 7 (9.3)
16 (8.2) Focus filter 5 (6.7)
15 (7.7) Background noise focus 5 (6.7)
14 (7.2) Change - change- 3 (4.0)
11 (5.6) Can’t process topic 3 (4.0)
10 (5.1) Frustration slow 2 (2.7)
7 (3.6) Fatigue mumble 2 (2.7)
7 (3.6) Less social familiar 2 (2.7)
6 (3.1) Speaking anxiety 1 (1.3)
5 (2.6) Slow fluency 1 (1.3)
5 (2.6) Extra effort think 1 (1.3)
5 (2.6) No strategy frustrated 0 (0)
4 (2.1) Topic fatigue 0 (0)
4 (2.1) Overload less social 0 (0)
4 (2.1) Stressful speaking 0 (0)
3 (1.5) Anxiety extra effort 0 (0)
2 (1.0) Think no strategy 0 (0)
2 (1.0) Mumble overload 0 (0)
Continued on next page

145
Table 23
Continued from previous page
Count (%) TBI group Control group Count (%)
2 (1.0) Impulsivity Can’t process 0 (0)
2 (1.0) Simple impulsivity 0 (0)
1 (0.5) Familiar simple 0 (0)
1 (0.5) Difficult stressful 0 (0)
1 (0.5) Headache difficult 0 (0)
0 (0) Fluency headache 0 (0)
195 Total count Total count 75
Note: Excluded neutral/positive themes: strategy, endorse, strength, deny, depends, visual, phone,
change=, change+, camouflage, accommodation, text, nonverbal, alcohol, conversation partner,
tinnitus, and monotone.
Table 24
Proportion of Repetition Accuracy, mean (SD), for All Groups in Experiment 1 and
Experiment 2
Alone Attend
Group NNS NS NNS NS
Experiment 1 Control 0.97 (0.02) 1.00 (0.01) 0.65 (0.10) 0.68 (0.12)
Experiment 2 Control 0.99 (0.01) 1.0 (0.0) 0.57 (0.12) 0.64 (0.14)
Filtered 0.48 (0.07) 0.82 (0.09) 0.08 (0.03) 0.16 (0.05)
TBI 0.97 (0.05) 0.99 (0.02) 0.42 (0.21) 0.54 (0.17)
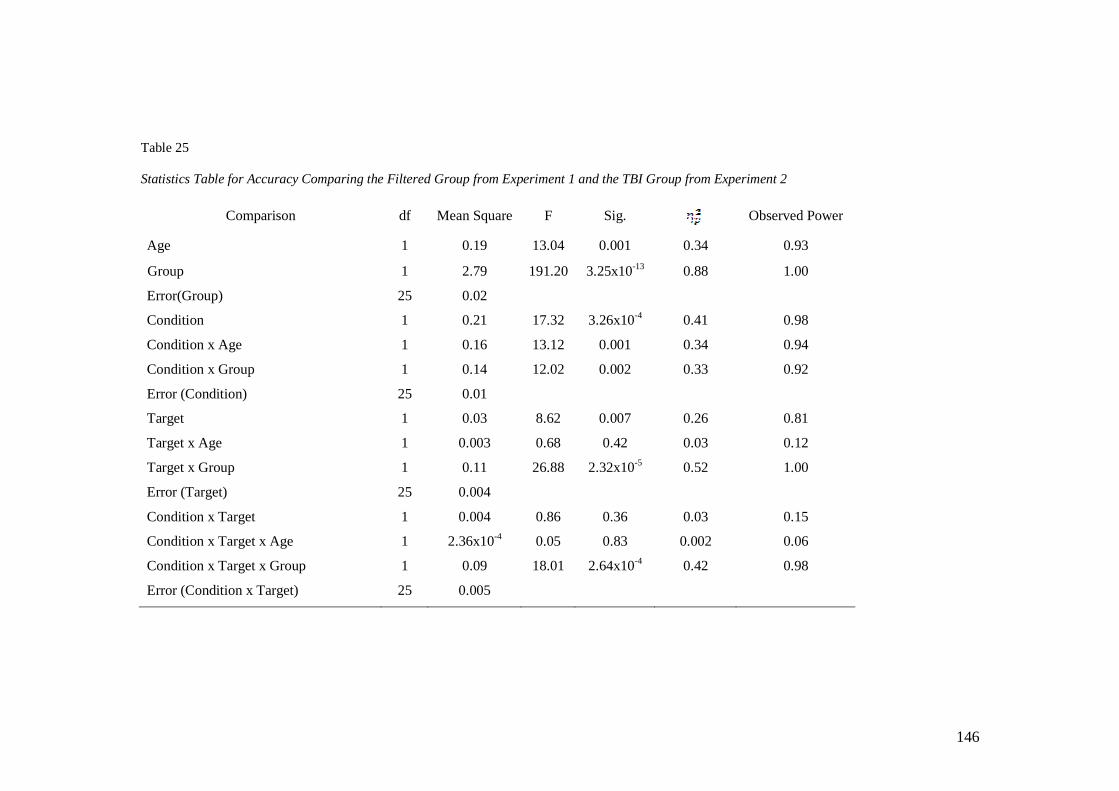
146
Table 25
Statistics Table for Accuracy Comparing the Filtered Group from Experiment 1 and the TBI Group from Experiment 2
Comparison df Mean Square F Sig. Observed Power
Age 1 0.19 13.04 0.001 0.34 0.93
Group 1 2.79 191.20 3.25x10⁻¹³ 0.88 1.00
Error(Group) 25 0.02
Condition 1 0.21 17.32 3.26x10⁻⁴ 0.41 0.98
Condition x Age 1 0.16 13.12 0.001 0.34 0.94
Condition x Group 1 0.14 12.02 0.002 0.33 0.92
Error (Condition) 25 0.01
Target 1 0.03 8.62 0.007 0.26 0.81
Target x Age 1 0.003 0.68 0.42 0.03 0.12
Target x Group 1 0.11 26.88 2.32x10⁻⁵ 0.52 1.00
Error (Target) 25 0.004
Condition x Target 1 0.004 0.86 0.36 0.03 0.15
Condition x Target x Age 1 2.36x10⁻⁴ 0.05 0.83 0.002 0.06
Condition x Target x Group 1 0.09 18.01 2.64x10⁻⁴ 0.42 0.98
Error (Condition x Target) 25 0.005

147
Table 26
Hearing Thresholds for Disqualified Participants A and B in the TBI Group
500 Hz 1000 Hz 2000 Hz 4000 Hz
Screening Threshold (R / L)
A 25 dB / 20 dB 30 dB / 20 dB 50 dB / 35 dB 40 dB / 35 dB
B 60 dB / 25 dB Unable / 30 dB Unable / 30 dB Unable / 50 dB
Table 27
Sentence Repetition Accuracy (Proportion Correct) for Disqualified Participants A and B
with TBI and Hearing Loss
Alone Attend
NS NNS NS NNS
A 0.94 0.38 0.21 0
B 0.98 0.96 0.36 0.09

148
Figures
Control Participants
TBI Participants
SESSION 1 SESSION 2
completed
completed
Listening task (Filtered condition); NART
Listening task (Unfiltered condition); NART
Completed (n=15)
Completed (n=12)
Recruited for Phase B (n=13)
Standardized testing (all); interview
Listening task (Unfiltered condition); NART; standardized tests of auditory processing (n=13)
Standardized testing of memory, processing speed, etc; interview
Figure 1. Overall study design.
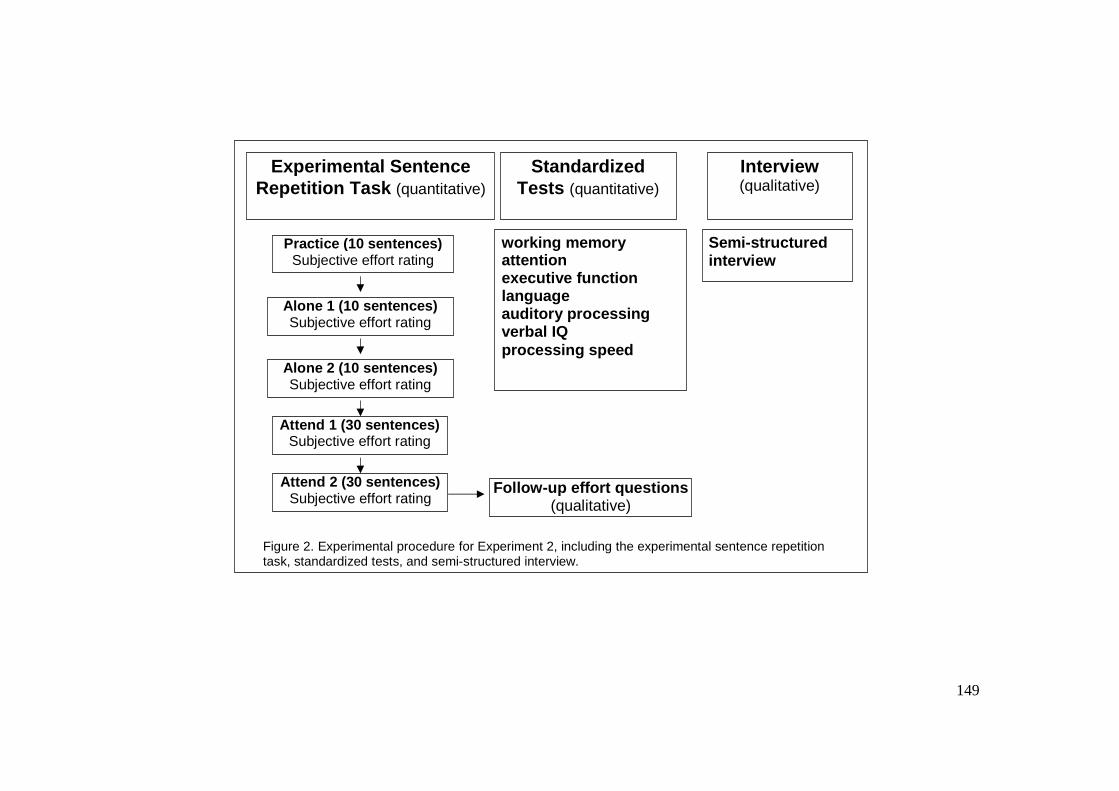
149
working memory attention executive function language auditory processing verbal IQ processing speed
Semi-structured interview
Experimental Sentence Repetition Task (quantitative)
Standardized Tests (quantitative)
Interview (qualitative)
Practice (10 sentences) Subjective effort rating
Alone 1 (10 sentences) Subjective effort rating
Alone 2 (10 sentences) Subjective effort rating
Attend 1 (30 sentences) Subjective effort rating
Attend 2 (30 sentences) Subjective effort rating
Follow-up effort questions (qualitative)
Figure 2. Experimental procedure for Experiment 2, including the experimental sentence repetition task, standardized tests, and semi-structured interview.

150
Figure 3. Effort rating screen from E-Prime
1 2 3 4 0 5 6 7 8 9 10
How much effort did it take to understand the sentences you just
repeated?
Click anywhere on the line to answer.
No effort
Extreme effort

151
0
0.1
0.2
0.3
0.4
0.5
0.6
0.7
0.8
0.9
1
Alone AttendCondition
Pro
po
rtio
n C
orr
ect
Unfiltered-NS
Unfiltered-NNS
Filtered-NS
Filtered-NNS
Figure 4 . Sentence repetition accuracy for Experiment 1.
00.10.20.30.40.50.60.70.80.9
1
NS NNSTarget
Pro
po
rtio
n C
orr
ect
Unfilt-Alone
Unfilt-Attend
Filt-Alone
Filt-Attend
Figure 5. Three-way interaction of accuracy for condition x target x group in Experiment 1.

152
0
1
2
3
4
5
6
7
8
9
10
Alone AttendCondition
Eff
ort
Rat
ing
Unfiltered-NS
Unfiltered-NNS
Filtered-NS
Filtered-NNS
Figure 6 . Sentence repetition effort ratings for Experiment 1.
0123456789
10
NS NNSTarget
Eff
ort
Attend
Alone
Figure 7. Two-way interaction of effort for condition x target in Experiment 1. *** p <0.001
***
***
***

153
012345
6789
10
Unfiltered FilteredTarget
Eff
ort
Attend
Alone
Figure 8. Two-way interaction of effort for condition x group in Experiment 1. *** p <0.001
***
***
***
***
0
0.1
0.2
0.3
0.4
0.5
0.6
0.7
0.8
0.9
1
Alone AttendCondition
Pro
po
rtio
n C
orr
ect
Control-NS
Control-NNS
TBI-NS
TBI-NNS
Figure 9 . Sentence repetition accuracy for Experiment 2.

154
0
0.10.2
0.3
0.40.5
0.6
0.7
0.80.9
1
NS NNSTarget
Pro
po
rtio
n c
orr
ect
Alone
Attend
Figure 10. Two-way interaction of accuracy for condition x target, collapsed across groups, in Experiment 2. * p<0.05 ***p<0.001
******
*
*
0
0.1
0.20.3
0.4
0.5
0.6
0.70.8
0.9
1
Control TBITarget
Pro
po
rtio
n c
orr
ect
Alone
Attend
Figure 11. Two-way non-significant interaction of accuracy for condition x group collapsed across targets, in Experiment 2. * p <0.05 ** p <0.01 ***p <0.001
*
******
**
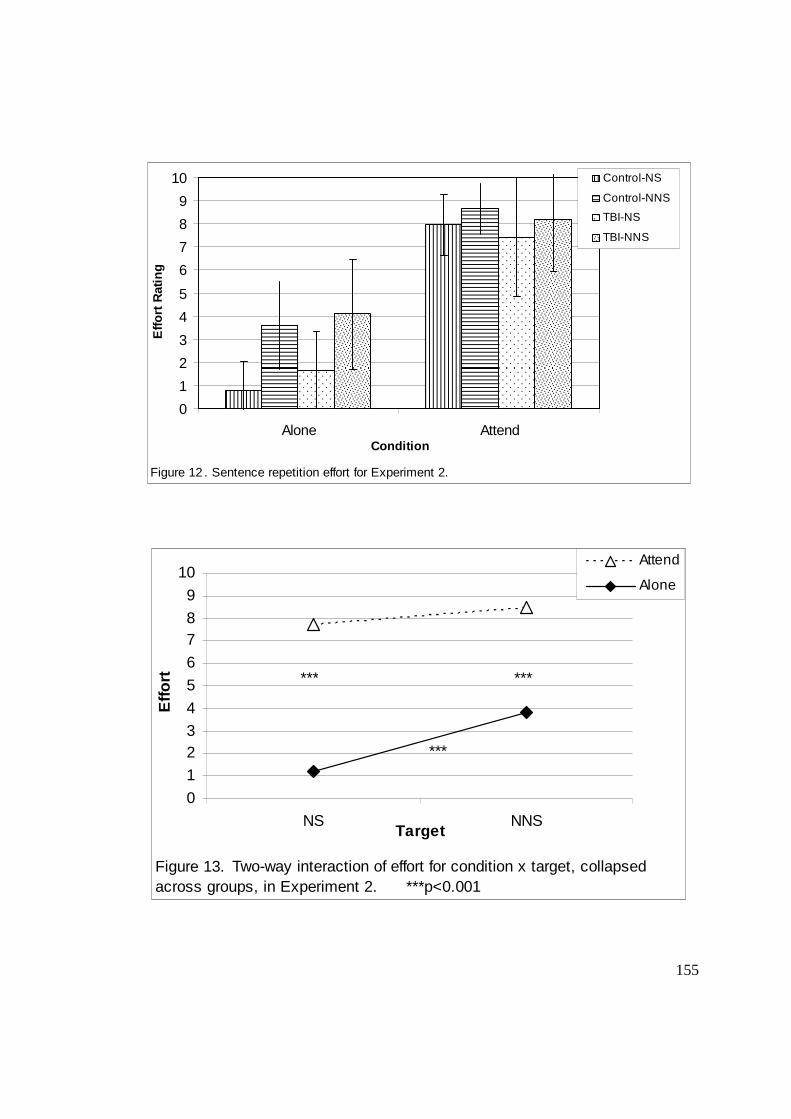
155
0
1
2
3
4
5
6
7
8
9
10
Alone AttendCondition
Eff
ort
Rat
ing
Control-NS
Control-NNS
TBI-NS
TBI-NNS
Figure 12 . Sentence repetition effort for Experiment 2.
0
1
23
4
5
6
78
9
10
NS NNSTarget
Eff
ort
Attend
Alone
Figure 13. Two-way interaction of effort for condition x target, collapsed across groups, in Experiment 2. ***p<0.001
***
*** ***
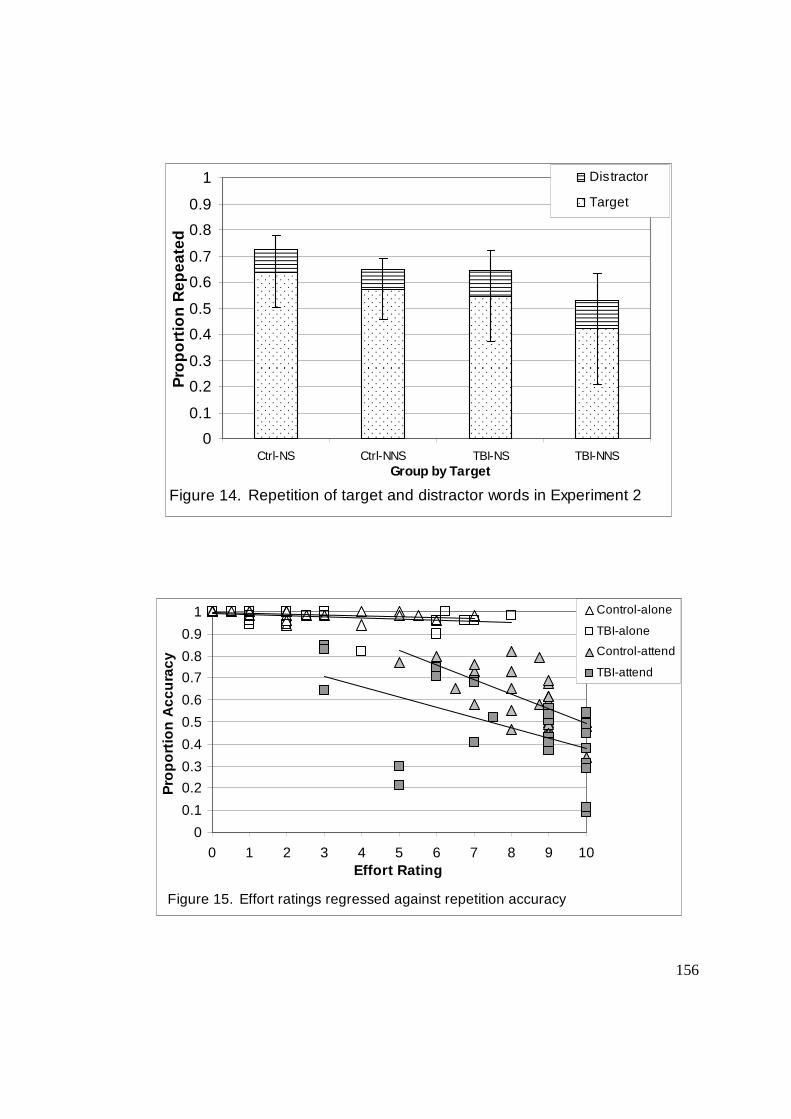
156
0
0.1
0.2
0.3
0.4
0.5
0.6
0.7
0.8
0.9
1
Ctrl-NS Ctrl-NNS TBI-NS TBI-NNSGroup by Target
Pro
po
rtio
n R
epea
ted
Distractor
Target
Figure 14. Repetition of target and distractor words in Experiment 2
0
0.1
0.2
0.3
0.4
0.5
0.6
0.7
0.8
0.9
1
0 1 2 3 4 5 6 7 8 9 10Effort Rating
Pro
po
rtio
n A
ccu
racy
Control-alone
TBI-alone
Control-attend
TBI-attend
Figure 15. Effort ratings regressed against repetition accuracy

157
0
1
2
3
4
5
0 5 10 15 20 25 30
Trial (NNS block)
Key
wo
rds
Co
rrec
tControl
TBI
Control trendline
TBI trendline
Figure 16. Average keywords correct by trial in the NNS block of the attend condition.
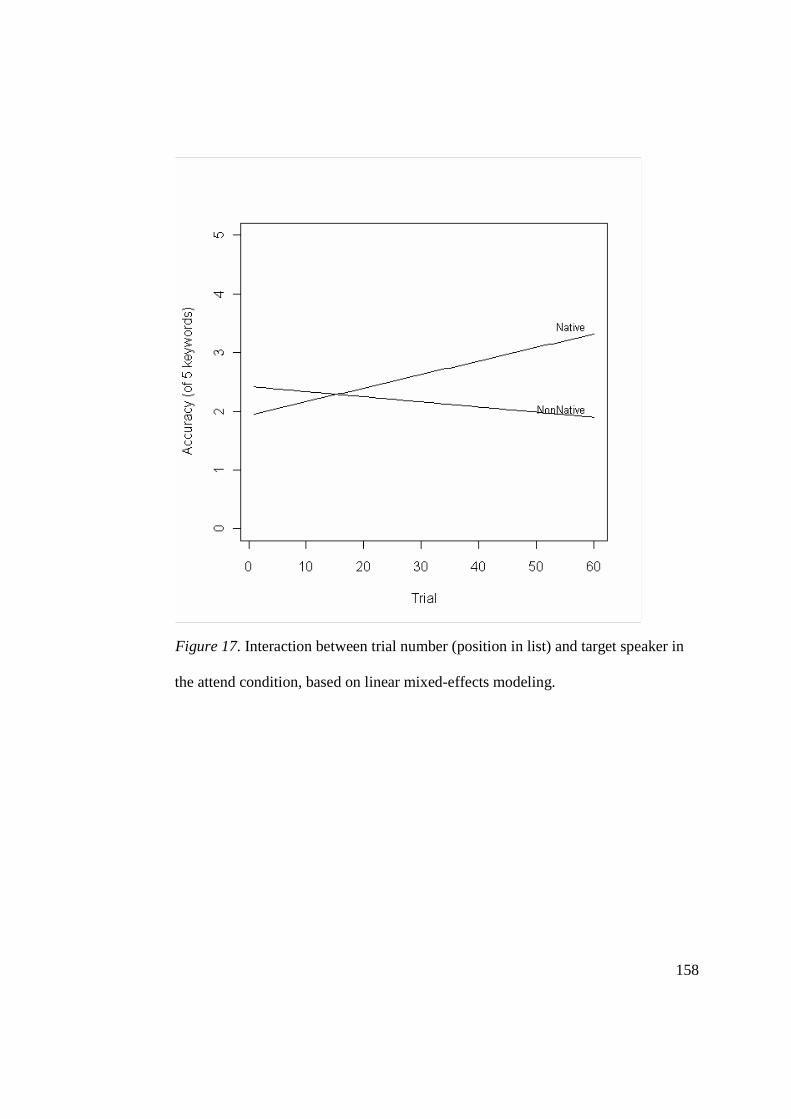
158
Figure 17. Interaction between trial number (position in list) and target speaker in
the attend condition, based on linear mixed-effects modeling.

159
0
4
8
12
16
20
0 0.1 0.2 0.3 0.4 0.5 0.6 0.7 0.8 0.9 1Repetition accuracy (total attend)
Nu
mb
er o
f n
egat
ive
them
esTBI
Control
Figure 18. Negative quotes from interviews plotted against attend condition repetition accuracy
048
1216202428323640
0 0.1 0.2 0.3 0.4 0.5 0.6 0.7 0.8 0.9 1Repetition accuracy (total attend)
Nu
mb
er o
f in
terv
iew
qu
ote
s TBI
Control
Figure 19. Total quotes from interviews plotted against attend condition repetition accuracy

160
0
1
2
3
4
5
6
7
8
Group
Nu
mb
er o
f N
egat
ive
Aff
ect
cate
go
ries
TBI-low
TBI-high
CTRL-low
CTRL-high
Figure 20. Number of negative themes by high and low accuracy groups
00.10.20.30.40.50.60.70.80.9
1
NS NNSTarget
Pro
po
rtio
n C
orr
ect
TBI-Alone
TBI-Attend
Filt-Alone
Filt-Attend
Figure 21. Three-way interaction of accuracy for condition x target x group in comparing filtered (Experiment 1) and TBI (Experiment 2) groups.
161
References
American Speech-Language-Hearing Association. (1996). Central auditory processing:
current status of research and implications for clinical practice [technical report].
Arbogast, T. L., Mason, C. R., & Kidd, G.,Jr. (2005). The effect of spatial separation on
informational masking of speech in normal-hearing and hearing-impaired listeners.
The Journal of the Acoustical Society of America, 117(4 Pt 1), 2169-2180.
Auditec, Inc. (1999) Masking Level Difference Test – Speech Version. St. Louis.
Baayen, R. H., Davidson, D. J., & Bates, D. M. (2008). Mixed-effects modeling with
crossed random effects for subjects and items. Journal of Memory and Language,
59, 390-412.
Bergemalm, P. O., & Borg, E. (2001). Long-term objective and subjective audiologic
consequences of closed head injury. Acta Oto-Laryngologica, 121(6), 724-734.
Bergemalm, P. O., & Lyxell, B. (2005). Appearances are deceptive? Long-term cognitive
and central auditory sequelae from closed head injury. International Journal of
Audiology, 44(1), 39-49.
Boersma, P., & Weenink, D. (2011). Praat: Doing Phonetics by Computer [computer
program]. Retrieved March 10, 2011, from http://www.praat.org/
162
Bradlow, A. R., & Alexander, J. A. (2007). Semantic and phonetic enhancements for
speech-in-noise recognition by native and non-native listeners. The Journal of the
Acoustical Society of America, 121(4), 2339-2349.
Brungart, D. S. (2001). Informational and energetic masking effects in the perception of
two simultaneous talkers. The Journal of the Acoustical Society of America, 109(3),
1101-1109.
Brungart, D. S., Simpson, B. D., Ericson, M. A., & Scott, K. R. (2001). Informational and
energetic masking effects in the perception of multiple simultaneous talkers. The
Journal of the Acoustical Society of America, 110(5 Pt 1), 2527-2538.
Campbell, T. F., & Dollaghan, C. A. (1995). Speaking rate, articulatory speed, and
linguistic processing in children and adolescents with severe traumatic brain injury.
Journal of Speech and Hearing Research, 38(4), 864-875.
Carlyon, R. P., Cusack, R., Foxton, J. M., & Robertson, I. H. (2001). Effects of attention
and unilateral neglect on auditory stream segregation. Journal of Experimental
Psychology, 27(1) 115-127.
Carroll, L. J., Cassidy, J. D., Peloso, P. M., Borg, J., von Holst, H., Holm, L., . . . (2004).
Prognosis for mild traumatic brain injury: results of the WHO collaborating centre
task force on mild traumatic brain injury. Journal of Rehabilitation Medicine,
43(Suppl), 84-105.

163
Chen, A. J., Abrams, G. M., & D'Esposito, M. (2006). Functional reintegration of
prefrontal neural networks for enhancing recovery after brain injury. The Journal of
Head Trauma Rehabilitation, 21(2), 107-118.
Chiou, H. H., & Kennedy, M. R. (2007, November). Switching Abilities in Adults with
Aphasia. Presented at American Speech-Language-Hearing Association Convention,
Boston, MA.
Cicerone, K. (1996). Attention deficits and dual task demands after mild traumatic brain
injury. Brain Injury, 10(2), 79-90.
Clarke, C. M., & Garrett, M. F. (2004). Rapid adaptation to foreign-accented english.
Journal of the Acoustical Society of America, 116(6), 3647-3658.
Clopper, C. G., & Bradlow, A. R. (2008). Perception of dialect variation in noise:
intelligibility and classification. Language and Speech, 51(Pt 3), 175-198.
Constantinidou, F. & Kennedy, M.R.T (in press). Traumatic Brain Injury. In I.
Papathanasiou, P. Coppens, & C. Potagas (Eds.), Aphasia and Related Disorders.
Cooke, M., Lecumberri, M. L., & Barker, J. (2008). The foreign language cocktail party
problem: energetic and informational masking effects in non-native speech
perception. The Journal of the Acoustical Society of America, 123(1), 414-427.
Cresswell, J., & Plano Clark, V. (2007). Designing and Conducting Mixed Methods
Research. Thousand Oaks, CA: Sage Publications.

164
Cresswell, J., Plano Clark, V., Gutmann, M., & Hanson, W. (2003). Advanced mixed
methods research designs. In A. Tashakkori, & C. Teddlie (Eds.), Handbook of
Mixed Methods in Social and Behavioral Research (pp. 209-240). Thousand Oaks,
CA: Sage Publications.
Cullington, H. E., & Zeng, F. G. (2008). Speech recognition with varying numbers and
types of competing talkers by normal-hearing, cochlear-implant, and implant
simulation subjects. The Journal of the Acoustical Society of America, 123(1), 450-
461.
Davis, M. H., & Johnsrude, I. S. (2003). Hierarchical processing in spoken language
comprehension. The Journal of Neuroscience, 23(8), 3423-3431.
Davis, M. H., Johnsrude, I. S., Hervais-Adelman, A., Taylor, K., & McGettigan, C.
(2005). Lexical information drives perceptual learning of distorted speech: evidence
from the comprehension of noise-vocoded sentences. Journal of Experimental
Psychology: General, 134(2), 222-240.
Delis, D. C., Kaplan, E., & Kramer, J. H. (2001). Delis–Kaplan Executive Function
System. New York: Psychological Corporation.
Dikmen, S. S., Machamer, J. E., Winn, H. R., & Temkin, N. R. (1995).
Neuropsychological outcome at 1-year post head injury. Neuropsychology, 9(1), 80-
90.
165
Driver, J. (2001). A selective review of selective attention research from the past century.
British Journal of Psychology, 92, 53-78.
Dubno, J. R., Horwitz, A. R., & Ahlstrom, J. B. (2002). Benefit of modulated maskers for
speech recognition by younger and older adults with normal hearing. Journal of the
Acoustical Society of America, 111(6) 2897-2907.
Education-Portal.com. Minnesota (MN): Universities and Colleges. Retrieved Nov. 10,
2010
Erickson, R. J., Goldinger, S. D., & LaPointe, L. L. (1996). Auditory vigilance in aphasic
individuals: detecting nonlinguistic stimuli with full or divided attention. Brain and
Cognition, 30(2), 244-253.
Evitts, P. M., Nelson, L. L., & McGuire, R. A. (2003). Impairments in dichotic listening
in patients presenting anterior communicating artery aneurysm. Applied
Neuropsychology, 10(2), 89-95.
Fabry, D. A., & Van Tasell, D. J. (1986). Masked and filtered simulation of hearing loss:
effects on consonant recognition. Journal of Speech and Hearing Research, 29(2),
170-178.
Faul, M., Xu, L., Wald, M. M., & Coronado, V. G. (2010). Traumatic Brain Injury in the
United States: Emergency Department Visits, Hospitalizations, and Deaths 2002-
166
2006. Atlanta, GA: Centers for Disease Control and Prevention, National Center for
Injury Prevention and Control.
Francis, A., & Nusbaum, H. (2002). Selective attention and the acquisition of new
phonetic categories. Journal of Experimental Psychology: Human Perception and
Performance, 28(2), 349-66.
Fraser, S., Gagne, J. P., Alepins, M., & Dubois, P. (2010). Evaluating the effort expended
to understand speech in noise using a dual-task paradigm: the effects of providing
visual speech cues. Journal of Speech, Language, and Hearing Research, 53(1), 18-
33.
Freyman, R. L., Balakrishnan, U., & Helfer, K. S. (2001). Spatial release from
informational masking in speech recognition. The Journal of the Acoustical Society
of America, 109(5), 2112-2122.
Freyman, R. L., Balakrishnan, U., & Helfer, K. S. (2004). Effect of number of masking
talkers and auditory priming on informational masking in speech recognition. The
Journal of the Acoustical Society of America, 115(5), 2246-2256.
Freyman R. L., Helfer, K. S., & Balakrishnan, U. (2007). Variability and uncertainty in
masking by competing speech. Journal of the Acoustical Society of America, 121(2),
1040-1046.

167
Gordon, P., Eberhart, J., & Rueckl, J. (1993). Attentional modulation of the phonetic
significance of acoustic cues. Cognitive Psychology, 25(1), 1-42.
Hanten, G., & Martin, R. C. (2000). Contributions of phonological and semantic short-
term memory to sentence processing: evidence from two cases of closed head injury
in children. Journal of Memory and Language, 43(2), 335-361.
Harris, J. (1994). Brain lesions, central masking, and dichotic speech perception. Brain
and Language, 46(1), 96-108.
Helfer, K. S., & Freyman, R. L. (2009). Lexical and indexical cues in masking by
competing speech. The Journal of the Acoustical Society of America, 125(1), 447-
456.
Hermes, D. J., & van Gestel, J. C. (1991). The frequency scale of speech intonation. The
Journal of the Acoustical Society of America, 90(1), 97-102.
Hinton-Bayre, A. D., Geffen, G., & McFarland, K. (1997). Mild head injury and speed of
information processing: a prospective study of professional rugby league players.
Journal of Clinical and Experimental Neuropsychology, 19(2), 275-289.
IEEE Subcommittee. (1969). IEEE recommended practice for speech quality
measurements. IEEE Trans. Audio and Electroacoustics, AU, 17, 1043-1064.

168
Jerger, J. (2009). The concept of auditory processing disorder: a brief history. In A.
Cacace, & D. McFarland (Eds.), Controversies in Central Auditory Processing
Disorder (pp. 1-15). San Diego, CA: Plural.
Jiang, D., McAlpine, D., & Palmer, A. R. (1997). Detectability index measures of
binaural masking level difference across populations of inferior colliculus neurons.
The Journal of Neuroscience : The Official Journal of the Society for Neuroscience,
17(23), 9331-9339.
Keith, R. W. (1986). SCAN-A: A Screening Test for Auditory Processing Disorders
. San Antonio, TX: Psychological Corporation.
Keith, R. W. (2000). Random Gap Detection Test (RGDT). St. Louis: Auditec.
Kennedy, M. R., Carney, E., & Peters, S. M. (2003). Predictions of recall and study
strategy decisions after diffuse brain injury. Brain Injury, 17(12), 1043-1064.
Kennedy, M. R., & Coelho, C. (2005). Self-regulation after traumatic brain injury: a
framework for intervention of memory and problem solving. Seminars in Speech and
Language, 26(4), 242-255.
Kennedy, M. R., & Krause, M. O. (2011). Self-regulated learning in a dynamic coaching
model for supporting college students with traumatic brain injury: two case reports.
The Journal of Head Trauma Rehabilitation, 26(3), 212-223.

169
Kennedy, M. R., Krause, M. O., & Turkstra, L. S. (2008). An electronic survey about
college experiences after traumatic brain injury. NeuroRehabilitation, 23(6), 511-
520.
Kertesz, A. (1982). The Western Aphasia Battery. New York: Psychological Corporation.
Klein, M., Houx, P. J., & Jolles, J. (1996). Long-term persisting cognitive sequelae of
traumatic brain injury and the effect of age. The Journal of Nervous and Mental
Disease, 184(8), 459-467.
Knight, R., Titov, N., & Crawford, M. (2006). The effects of distractin on prospective
remembering following traumatic brain injury assessed in a simulated naturalistic
environment. Journal of the International Neuropsychological Society, 12, 8-16.
Krause, M. O., Nelson, P. B., & Kennedy, M. R. (2009, November). Processing speed
and masking release in adults with traumatic brain injury. Presented at the American
Speech-Language-Hearing Association Convention, New Orleans, LA.
Lagace, J., Jutras, B., & Gagne, J. P. (2010). Auditory processing disorder and speech
perception problems in noise: finding the underlying origin. American Journal of
Audiology, 19(1), 17-25.
Langlois, J. S., Rutland-Brown, W., & Thomas, K. E. (2004). Traumatic Brain Injury in
the United States: Emergency Department Visits, Hospitalizations, and Deaths.
170
Atlanta, GA: Centers for Disease Control and Prevention, National Center for Injury
Prevention and Control.
Lecumberri, M. L., & Cooke, M. (2006). Effect of masker type on native and non-native
consonant perception in noise. The Journal of the Acoustical Society of America,
119(4), 2445-2454.
Levin, H. S., High, W. M., Jr., Williams, D. H., Eisenberg, H. M., Amparo, E. G.,
Guinto, F. C.,Jr, & Ewert, J. (1989). Dichotic listening and manual performance in
relation to magnetic resonance imaging after closed head injury. Journal of
Neurology, Neurosurgery, and Psychiatry, 52(10), 1162-1169.
Lister, J. J., Roberts, R. A., Shackelford, J., & Rogers, C. L. (2006). An adaptive clinical
test of temporal resolution. American Journal of Audiology, 15(2), 133-140.
Madigan, N. K., DeLuca, J., Diamond, B. J., Tramontano, G., & Averill, A. (2000).
Speed of information processing in traumatic brain injury: modality-specific factors.
Journal of Head Trauma Rehabilitation,15(3), 943-956.
Magnuson, J. S., & Nusbaum, H. C. (2007). Acoustic differences, listener expectations,
and the perceptual accommodation of talker variability. Journal of Experimental
Psychology: Human Perception and Performance, 33(2) 391-409.
171
Mazaux, J. M., Masson, F., Levin, H. S., Alaoui, P., Maurette, P., & Barat, M. (1997).
Long-term neuropsychological outcome and loss of social autonomy after traumatic
brain injury. Archives of Physical Medicine and Rehabilitation, 78(12), 1316-1320.
McHenry, M. (2011). An exploration of listener variability in intelligibility judgments.
American Journal of Speech-Language Pathology, 20(2), 119-123.
Menon, D. K., Schwab, K., Wright, D. W., & Maas, A. I. (2010). Position statement:
definition of traumatic brain injury. Archives of Physical Medicine and
Rehabilitation, 91(11), 1637-1640.
Meyers, J. E., Roberts, R. J., Bayless, J. D., Volkert, K., & Evitts, P. E. (2002). Dichotic
listening: expanded norms and clinical application. Archives of Clinical
Neuropsychology, 17(1), 79-90.
Moore, D. (2006). Auditory processing disorder (APD): definition, diagnosis, neural
basis, and intervention. Audiological Medicine, 4, 4-11.
Morse, J., & Niehaus, L. (2009). Mixed Method Design: Principles and Procedures.
Walnut Creek, CA: Left Coast Press.
Munro, M. J., & Derwing, T. M. (1995). Processing time, accent, and comprehensibility
in the perception of native and foreign-accented speech. Language and Speech, 38,
289-306.
172
Munro, M. J., & Derwing, T. M. (1999). Foreign accent, comprehensibility, and
intelligibility in the speech of second language learners. Language Learning, 49,
285-310.
Murray, L. L., Holland, A. L., & Beeson, P. M. (1997). Auditory processing in
individuals with mild aphasia: a study of resource allocation. Journal of Speech,
Language, and Hearing Research, 40(4), 792-808.
Musiek, F. E., Baran, J. A., & Shinn, J. (2004). Assessment and remediation of an
auditory processing disorder associated with head trauma. Journal of the American
Academy of Audiology, 15(2), 117-132.
Musiek, F. E., Shinn, J. B., Jirsa, R., Bamiou, D. E., Baran, J. A., & Zaida, E. (2005).
GIN (gaps-in-noise) test performance in subjects with confirmed central auditory
nervous system involvement. Ear and Hearing, 26(6), 608-618.
Nelson, H. E. (1982). The national adult reading test. Windsor, England: NFER-Nelson.
Nelson, P. B., & Jin, S. H. (2004). Factors affecting speech understanding in gated
interference: cochlear implant users and normal-hearing listeners. Journal of the
Acoustical Society of America, 115(5), 2286-2294.
Nelson, P. B., Jin, S. H., Carney, A. E., & Nelson, D. A. (2003). Understanding speech in
modulated interference: Cochlear implant users and normal-hearing listeners.
Journal of the Acoustical Society of America, 113(2), 961- 968.
173
Nicholas, L. & Brookshire, R. (1995). Comprehension of spoken narrative discourse by
adults with aphasia, right-hemisphere brain damage, or traumatic brain injury.
American Journal of Speech-Language Pathology, 4, 69-81.
Olsen, W. O., Noffsinger, D., & Carhart, R. (1976). Masking level differences
encountered in clinical populations. Audiology, 15(4), 287-301.
Oxenham, A. J., Fligor, B. J., Mason, C. R., & Kidd, G.,Jr. (2003). Informational
masking and musical training. The Journal of the Acoustical Society of America,
114(3), 1543-1549.
Oxenham, A. J., & Simonson, A. M. (2009). Masking release for low- and high-pass-
filtered speech in the presence of noise and single-talker interference. The Journal of
the Acoustical Society of America, 125(1), 457-468.
Pallier, C., Sebastian-Galles, N., Dupoux, E., Christophe, A., & Mehler, J. (1998).
Perceptual adjustment to time-compressed speech: a cross-linguistic study. Memory
& Cognition, 26(4), 844-851.
Peelle, J. E., Eason, R. J., Schmitter, S., Schwarzbauer, C., & Davis, M. H. (2010).
Evaluating an acoustically quiet EPI sequence for use in fMRI studies of speech and
auditory processing. NeuroImage, 52(4), 1410-1419.
174
Peelle, J. E., Johnsrude, I. S., & Davis, M. H. (2010). Hierarchical processing for speech
in human auditory cortex and beyond. Frontiers in Human Neuroscience, 4, article
51, 1-3.
Pitt, M. A., & Samuel, A. G. (1990). Attentional allocation during speech perception:
how fine is the focus? Journal of Memory and Language, 29(5), 611-632.
Ponsford, J., & Kinsella, G. (1992). Attentional deficits following closed-head injury.
Journal of Clinical and Experimental Neuropsychology, 14(5) 822-838.
Posner, M., & Petersen, S. (1990). The attention system of the human brain. Annual
Review of Neuroscience, 13(1), 25-42.
Randolph, C., Tierney, M. C., Mohr, E., & Chase, T. N. (1998). The repeatable battery
for the assessment of neuropsychological status (RBANS): preliminary clinical
validity. Journal of Clinical and Experimental Neuropsychology, 20(3), 310-319.
Rios, M., Perianez, J. A., & Munoz-C'espedes, J. M. (2004). Attentional control and
slowness of information processing after severe traumatic brain injury. Brain Injury,
18(3), 257-272.
Roberts, M. A., Persinger, M. A., Grote, C., Evertowski, L. M., Springer, J. A., Tuten, T.,
. . . Baglio, C. S. (1994). The dichotic word listening test: preliminary observations
in American and Canadian samples. Applied Neuropsychology, 1(1-2), 45-56.

175
Rogers, C. L., Dalby, J., & Nishi, K. (2004). Effects of noise and proficiency on
intelligibility of chinese-accented english. Language and Speech , 47(2) 139-154.
Rueda, M., Posner, M., & Rothbart, M. (2004). Attentional control and self-regulation. In
R. Baumeister & K. Vohs (Eds.), Handbook of Self-Regulation. New York: The
Guilford Press.
Samelli, A. G., & Schochat, E. (2008). The gaps-in-noise test: gap detection thresholds in
normal-hearing young adults. International Journal of Audiology, 47(5), 238-245.
Sarampalis, A., Kalluri, S., Edwards, B., & Hafter, E. (2009). Objective measures of
listening effort: effects of background noise and noise reduction. Journal of Speech,
Language, and Hearing Research, 52, 1230-1240.
Schmitter-Edgecombe, M., & Nissley, H. M. (2000). Effects of divided attention on
automatic and controlled components of memory after severe closed-head injury.
Neuropsychology, 14(4), 559-569.
Schneider, B. A., Li, L., & Daneman, M. (2007). How competing speech interferes with
speech comprehension in everyday listening situations. Journal of the American
Academy of Audiology, 18(7), 559-572.
Scott, A. M., Bauch, C. D., & Olsen, W. O. (1999). Head trauma and mid-frequency
hearing loss. American Journal of Audiology, 8(2), 101-105.
176
Shi, L. F. (2010). Perception of acoustically degraded sentences in bilingual listeners who
differ in age of English acquisition. Journal of Speech, Language, and Hearing
Research, 53(4), 821-835.
Smiljanic, R., & Bradlow, A. R. (2007). Clear speech intelligibility: listener and talker
effects. Proceedings of the 16th International Conference on Phonetic Sciences, 661-
664.
Sohlberg, M., & Mateer, C. (2001). Management of attention disorders. In Cognitive
Rehabilitation: An Integrative Neuropsychological Approach. New York: Guilford
Press.
Sohlberg, M. M., & Mateer, C. A. (1996). Attention Process Training II (APT-II).
Puyallup, WA: Association for Neuropsychological Research and Development.
Spikman, J. M., van Zomeren, A. H., & Deelman, B. G. (1996). Deficits of attention after
closed-head injury: slowness only? Journal of Clinical and Experimental
Neuropsychology, 18(5), 755-767.
Stickney, G. S., Zeng, F. G., Litovsky, R., & Assmann, P. (2004). Cochlear implant
speech recognition with speech maskers. The Journal of the Acoustical Society of
America, 116(2), 1081-1091.
Stuss, D. T., Binns, M. A., Carruth, F. G., Levine, B., Brandys, C. E., Moulton, R. J., . . .
Schwartz, M. L. (1999). The acute period of recovery from traumatic brain injury:

177
posttraumatic amnesia or posttraumatic confusional state? Journal of Neurosurgery,
90(4), 635-643.
Telling, A. L., Meyer, A. S., & Humphreys, G. W. (2010). Distracted by relatives: effects
of frontal lobe damage on semantic distraction. Brain and Cognition, 73(3), 203-
214.
Tompkins, C. A., Bloise, C. G., Timko, M. L., & Baumgaertner, A. (1994). Working
memory and inference revision in brain-damaged and normally aging adults. Journal
of Speech and Hearing Research, 37(4), 896-912.
Tun, P. A., Wingfield, A., Stine, E. A. L., & Mecsas, C. (1992). Rapid speech processing
and divided attention: processing rate versus processing resources as an explanation
of age effects. Psychology and Aging, 7(4), 546-550.
Van Engen, K. J., & Bradlow, A. R. (2007). Sentence recognition in native- and foreign-
language multi-talker background noise. The Journal of the Acoustical Society of
America, 121(1), 519-526.
van Zomeren, A. H., & van den Burg, W. (1985). Residual complaints of patients two
years after severe head injury. Journal of Neurology, Neurosurgery, and Psychiatry,
48(1), 21-28.
Veltman, J. C., Brouwer, W. H., Van Zomeren, A. H., & Van Wolffelaar, P. C. (1996).
Central executive aspects of attention in subacute severe and very severe closed head
178
injury patients: planning, inhibition, flexibility, and divided attention.
Neuropsychology, 10, 357-367.
Wang, M. D., Reed, C. M., & Bilger, R. C. (1978). A comparison of the effects of
filtering and sensorineural hearing loss on patients of consonant confusions. Journal
of Speech and Hearing Research, 21(1), 5-36.
Weschler, D. (1997). WMS-III: Wechsler Memory Scale Administration and Scoring
Manual. Psychological Corporation.
Wilson, B. A. (2003). Goal planning rather than neuropsychological testing should be
used to structure and evaluate cognitive rehabilitation. Brain Impairment, 4(1), 25-
30.
Wilson, B. A., Alderman, N., Burgess, P., & Emslie, H. (1996). Behavioural Assessment
of the Dysexecutive Syndrome. Bury St. Edmunds (UK): Thames Valley Test Co.
Wilson, E. O., & Spaulding, T. J. (2010). Effects of noise and speech intelligibility on
listener comprehension and processing time of Korean-accented English. Journal of
Speech, Language, and Hearing Research, 53(6), 1543-1554.
Woodcock, R., McGrew, K., & Mather, N. (2001). Woodcock-Johnson III Test of
Cognitive Abilities. Itasca, IL: Riverside.
179
World Health Organization (2001). International Classification of Functioning, Disability
and Health (ICF). Accessed July 10, 2011 from
http://www.who.int/classifications/icf/en/
Yokota-Adachi, H., Kershner, J., Jutai, J., & Knox, R. (2003). Musical attention training
program and alternating attention in brain injury: an initial report. Music Therapy
Perspectives, 21, 99-104.
Zaidan, E., Garcia, A. P., Tedesco, M. L., & Baran, J. A. (2008). Performance of normal
young adults in two temporal resolution tests. Pro-Fono: Revista De Atualizacao
Cientifica, 20(1), 19-24.
Zaloshnja E., Miller, T., Langlois, J., & Selassie, A. (2008). Prevalence of long-term
disability from traumatic brain injury in the civilian population of the United
States, 2005. Journal of Head Trauma Rehabilitation, 23(6), 394-400.
180
Appendices
Appendix 1: Preliminary Screening Form
The effects of brain injury and talker characteristics on speech perception in a single-talker interference task
Initial Screening – Email Version
Introduction: Thanks for expressing an interest in my study! The purpose of this form is to tell you more about the study and to find out if you fit the demographics we need and are eligible to participate. Brief description of the study: This study is designed to learn about how people who have survived a brain injury understand speech in a challenging listening situation. You would be participating in the study as either an Experimental participant (if you have had a brain injury) or a Control participant (if you have never had a brain injury). If you decide to participate in this study, we would ask you to do several different things. First, you would take several types of standardized assessments that are designed to evaluate things like vocabulary, thinking speed, and short-term memory. Second, the main part of the experiment involves listening to sentences and repeating back what you hear based on how much you understand. These sentences will be played with a second voice speaking that you have to ignore, which may make them harder to understand. In addition to repeating the sentences, you will be asked to evaluate how much effort it takes to understand the sentences. Participation in the study takes two to three hours, spread over two days about a week apart. Each day will include several breaks. You will receive $30 to compensate you for participating. If you are still interested in participating, please fill out the rest of this form (it should take 5 to 10 minutes). You are free to decline to answer any of the questions that you don’t want to answer. Some questions have to do with your prior experiences in school, and others are more personal, like, “When you were in school, did you ever have difficulty learning how to read or write?” and “Have you ever experienced an extended period of alcohol abuse?” and so on. If you would prefer to complete this questionnaire by phone, or if you have any questions, please contact me at [email protected] or 612-625-3327.

181
Screening Questions:
- Are you a high school graduate? Yes No
- What is the last grade or year of school you completed?
- How old are you? What is your birthdate?
- Is English your first language? Yes No
- If NO: when did you learn English?
- Do you speak or understand any languages other than English? Yes No
- If YES: which language(s)?
- How many semesters/years have you studied/spoken these other languages?
Do you consider yourself fluent in any language other than English? Yes No
- When you were in school, did you have any difficulty learning to read or write?
Yes No * If YES, please explain:
- Did you ever receive speech therapy or remedial help for anything in school?
Yes No. * If YES, please explain:
- Were you ever told that you had a learning disability? Yes No
- Did you ever participate in classes for gifted students, or skip a grade? Yes No
* If YES, please explain:
- To the best of your knowledge, are your hearing AND vision adequate?
Yes No * If NO, please explain:
11. Do you sing or play a musical instrument? Yes No
* If YES, did you ever take lessons? Yes No If YES, for how long?
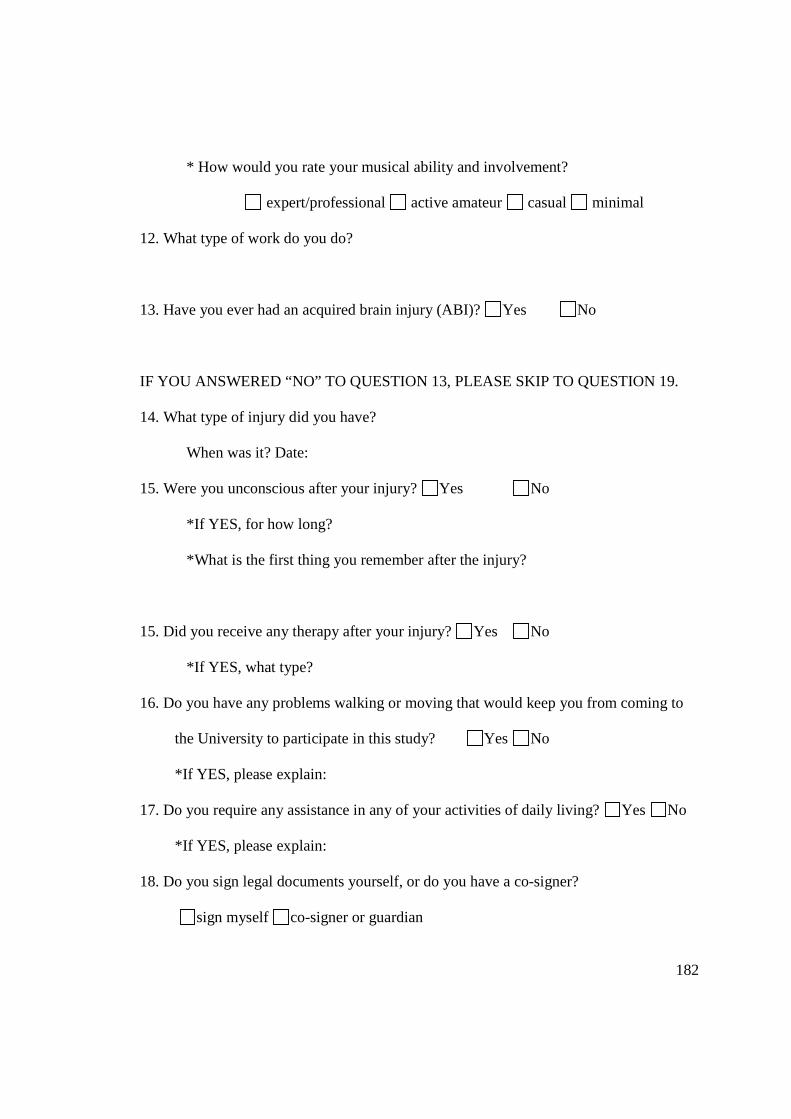
182
* How would you rate your musical ability and involvement?
expert/professional active amateur casual minimal
12. What type of work do you do?
13. Have you ever had an acquired brain injury (ABI)? Yes No
IF YOU ANSWERED “NO” TO QUESTION 13, PLEASE SKIP TO QUESTION 19.
14. What type of injury did you have?
When was it? Date:
15. Were you unconscious after your injury? Yes No
*If YES, for how long?
*What is the first thing you remember after the injury?
15. Did you receive any therapy after your injury? Yes No
*If YES, what type?
16. Do you have any problems walking or moving that would keep you from coming to
the University to participate in this study? Yes No
*If YES, please explain:
17. Do you require any assistance in any of your activities of daily living? Yes No
*If YES, please explain:
18. Do you sign legal documents yourself, or do you have a co-signer?
sign myself co-signer or guardian
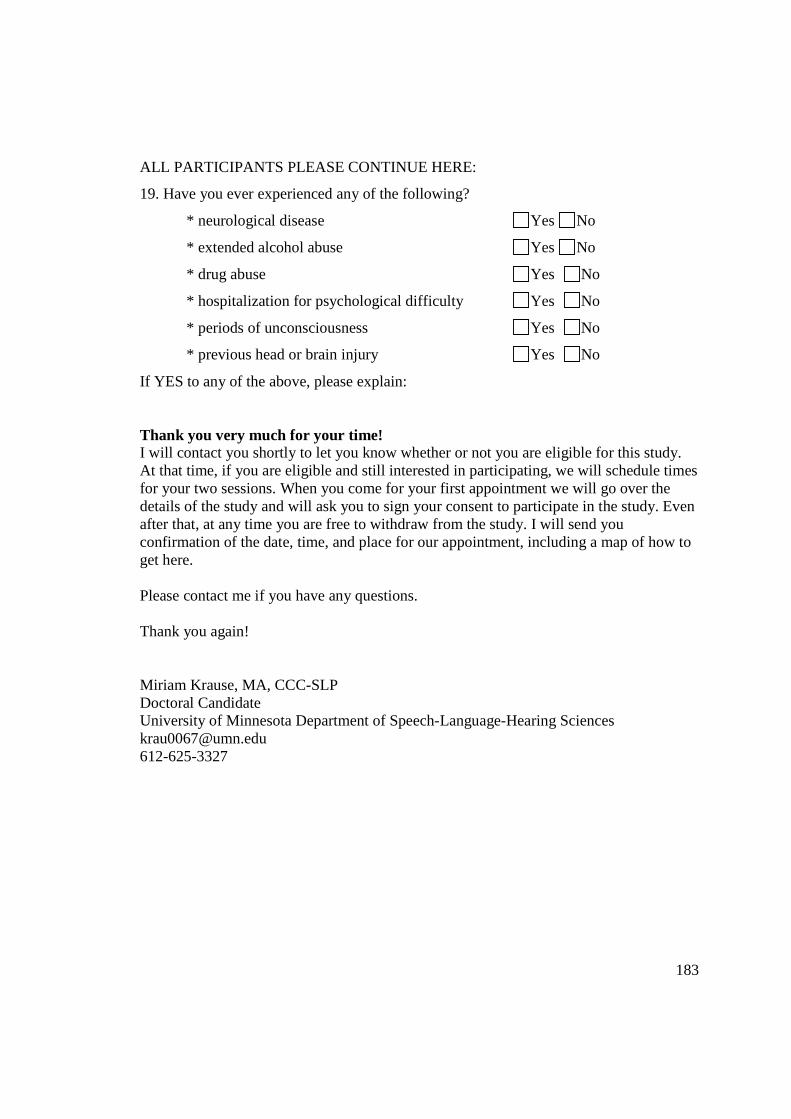
183
ALL PARTICIPANTS PLEASE CONTINUE HERE:
19. Have you ever experienced any of the following?
* neurological disease Yes No
* extended alcohol abuse Yes No
* drug abuse Yes No
* hospitalization for psychological difficulty Yes No
* periods of unconsciousness Yes No
* previous head or brain injury Yes No
If YES to any of the above, please explain:
Thank you very much for your time! I will contact you shortly to let you know whether or not you are eligible for this study. At that time, if you are eligible and still interested in participating, we will schedule times for your two sessions. When you come for your first appointment we will go over the details of the study and will ask you to sign your consent to participate in the study. Even after that, at any time you are free to withdraw from the study. I will send you confirmation of the date, time, and place for our appointment, including a map of how to get here. Please contact me if you have any questions. Thank you again! Miriam Krause, MA, CCC-SLP Doctoral Candidate University of Minnesota Department of Speech-Language-Hearing Sciences [email protected] 612-625-3327

184
Appendix 2: Standardized Test Scores
TBI group scores.
Participants RBANS Working memory Questionnaires
TBI
Immed
memory Visuospatial Language Attention
Delayed
memory Total
Listening
Span
WMS-III
Digits Bkwd APT BADS
1 58 86 34 50 53 58 27 6 18 15
2 19 63 39 8 27 19 40 11 24 24
3 34 96 58 95 58 82 36 11
4 13 73 4 16 34 16 33 7 8 6
5 25 79 39 27 42 37 37 8 7 15
6 90 92 50 50 58 58 31 6 1 8
7 42 86 19 58 58 53 27 9 35 24
8 87 23 55 79 90 75 38 8 9 16
9 19 63 16 21 42 23 32 5 24 12
10 7 50 4 42 6 9 38 10 14 8
11 91 39 25 27 70 50 23 3 10 9
12 34 96 27 79 68 68 35 8 43 36
13 5 86 5 16 3 9 30 6 43 56
M 40.31 71.69 28.85 43.69 46.85 42.85 32.85 7.54 19.67 19.08
SD 31.44 22.96 18.92 27.83 24.92 25.53 5.11 2.37 14.30 14.49
Note: Questionnaire data for participant #3 is missing because she did not complete them during the in-person session due to lack of
time, and did not submit them later even after several requests. Continued on next page.

185
TBI group scores continued
Participants WJ-III Decision Speed DKEFS-Trails (standard scores)
TBI
Time
(seconds) Accuracy NoSwitch Switch
Motor
Speed
NoSwitch-switch
difference
Motor-switch
difference
1 180 31 14 13 11 9 12
2 180 34 14 12 23 8 10
3 180 40 8 12 11 11 11
4 180 30 12 7 11 5 6
5 180 34 12 12 11 10 11
6 180 39 11 9 11 8 8
7 180 33 14 12 12 8 10
8 180 37 13 12 9 9 13
9 180 35 9 12 13 13 9
10 180 33 11 13 11 8 12
11 180 35 15 10 12 5 8
12 162 40 12 9 12 9 9
13 180 34 3 9 11 13 8
M 178.62 35.00 11.38 10.92 12.15 8.92 9.77
SD 4.99 3.19 3.23 1.89 3.39 2.47 2.01
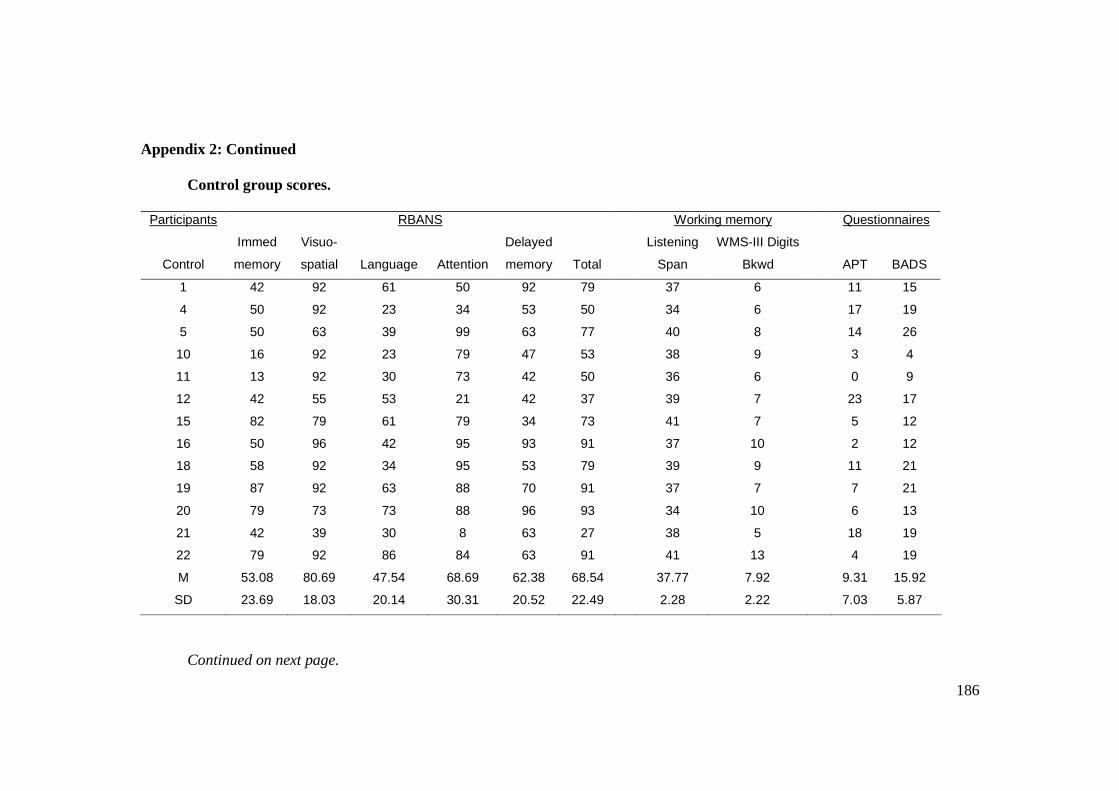
186
Appendix 2: Continued
Control group scores.
Participants RBANS Working memory Questionnaires
Control
Immed
memory
Visuo-
spatial Language Attention
Delayed
memory Total
Listening
Span
WMS-III Digits
Bkwd APT BADS
1 42 92 61 50 92 79 37 6 11 15
4 50 92 23 34 53 50 34 6 17 19
5 50 63 39 99 63 77 40 8 14 26
10 16 92 23 79 47 53 38 9 3 4
11 13 92 30 73 42 50 36 6 0 9
12 42 55 53 21 42 37 39 7 23 17
15 82 79 61 79 34 73 41 7 5 12
16 50 96 42 95 93 91 37 10 2 12
18 58 92 34 95 53 79 39 9 11 21
19 87 92 63 88 70 91 37 7 7 21
20 79 73 73 88 96 93 34 10 6 13
21 42 39 30 8 63 27 38 5 18 19
22 79 92 86 84 63 91 41 13 4 19
M 53.08 80.69 47.54 68.69 62.38 68.54 37.77 7.92 9.31 15.92
SD 23.69 18.03 20.14 30.31 20.52 22.49 2.28 2.22 7.03 5.87
Continued on next page.

187
Control group scores continued
Participants WJ-III Decision Speed DKEFS-Trails (standard scores)
Control
Time
(seconds) Accuracy NoSwitch Switch
Motor
Speed
NoSwitch-switch
difference
Motor-switch
difference
1 142 39 14 13 13 9 10
4 180 37 14 13 11 9 12 5 161 40 15 12 12 7 10
10 180 39 16 11 13 5 8
11 168 40 14 13 13 9 10 12 190 38 11 15 13 14 8
15 180 38 11 11 12 10 9
16 180 37 14 13 12 9 11 18 141 40 15 13 11 8 12 19 180 39 12 12 11 10 11
20 180 37 12 11 10 9 11
21 174 40 16 10 14 1 6
22 180 37 12 12 13 10 9 M 172.00 38.54 13.54 12.23 12.15 8.46 9.77 SD 15.20 1.27 1.76 1.30 1.14 3.02 1.74

188
Appendix 3: Sentence Repetition Task Stimuli
PRACTICE BLOCK
Pair Speaker Sentence (keywords capitalized)
a NNS The CLEAT SANK DEEPLY into the SOFT TURF.
a NS The RAMP LED UP to the WIDE HIGHWAY.
b NNS The KITE FLEW WILDLY in the HIGH WIND.
b NS The DUSTY BENCH STOOD by the STONE WALL.
c NNS The CURTAIN ROSE and the SHOW WAS ON.
c NS The FIRST PART of the PLAN NEEDS CHANGING.
d NNS The BIG RED APPLE FELL to the GROUND.
d NS The YOUNG PRINCE BECAME HEIR to the THRONE.
e NNS The HORN of the CAR WOKE the SLEEPING COP.
e NS The NOZZLE of the FIRE HOSE was BRIGHT BRASS.
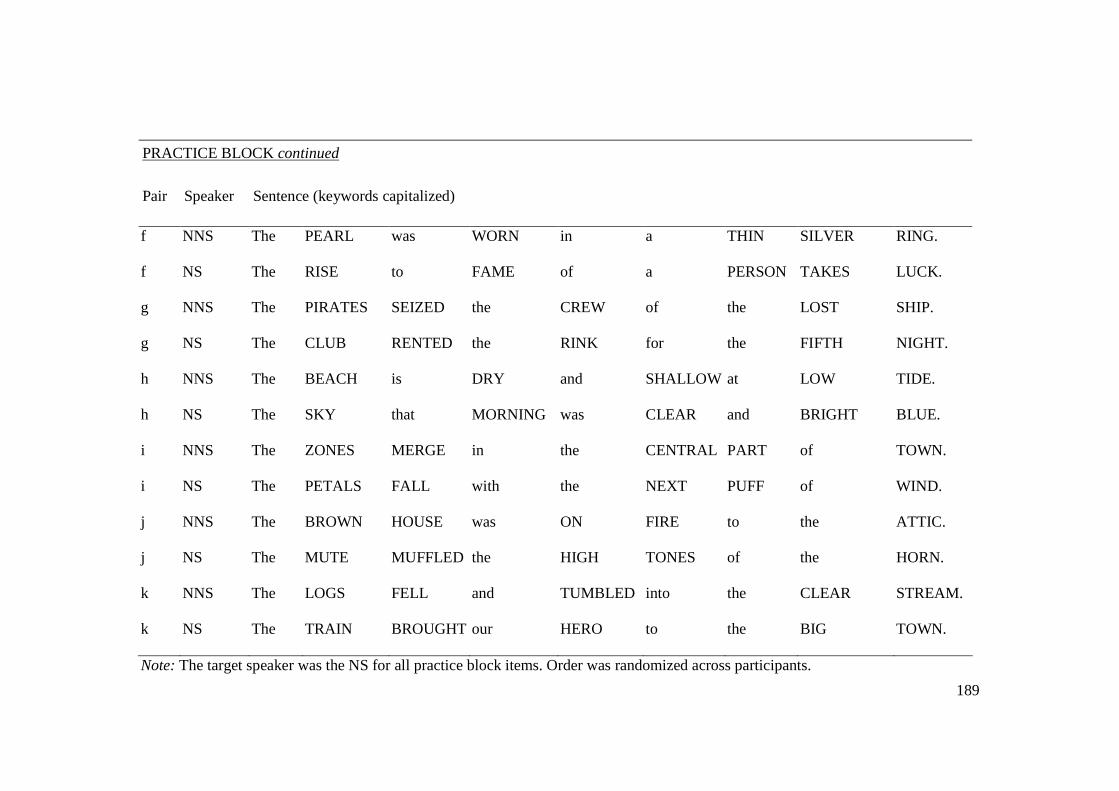
189
PRACTICE BLOCK continued
Pair Speaker Sentence (keywords capitalized)
f NNS The PEARL was WORN in a THIN SILVER RING.
f NS The RISE to FAME of a PERSON TAKES LUCK.
g NNS The PIRATES SEIZED the CREW of the LOST SHIP.
g NS The CLUB RENTED the RINK for the FIFTH NIGHT.
h NNS The BEACH is DRY and SHALLOW at LOW TIDE.
h NS The SKY that MORNING was CLEAR and BRIGHT BLUE.
i NNS The ZONES MERGE in the CENTRAL PART of TOWN.
i NS The PETALS FALL with the NEXT PUFF of WIND.
j NNS The BROWN HOUSE was ON FIRE to the ATTIC.
j NS The MUTE MUFFLED the HIGH TONES of the HORN.
k NNS The LOGS FELL and TUMBLED into the CLEAR STREAM.
k NS The TRAIN BROUGHT our HERO to the BIG TOWN.
Note: The target speaker was the NS for all practice block items. Order was randomized across participants.

190
Appendix 3: Continued.
ALONE CONDITION
Speaker Sentence
NNS The KITE DIPPED and SWAYED, but STAYED ALOFT.
NNS The CHAIR LOOKED STRONG but had NO BOTTOM.
NNS The SMELL of BURNED RAGS ITCHES my NOSE.
NNS The CHAP SKIPPED INTO the CROWD and was LOST.
NNS The SOFA CUSHION is RED and of LIGHT WEIGHT.
NNS The SQUARE WOODEN CRATE was PACKED to be SHIPPED.
NNS The RUSH for FUNDS REACHED its PEAK TUESDAY.
NNS The RIPE TASTE of CHEESE IMPROVES with AGE.
NNS The DRY WAX PROTECTS the DEEP SCRATCH.
NNS The BUNCH of GRAPES was PRESSED INTO WINE.
NS The OLD PAN was COVERED with HARD FUDGE.
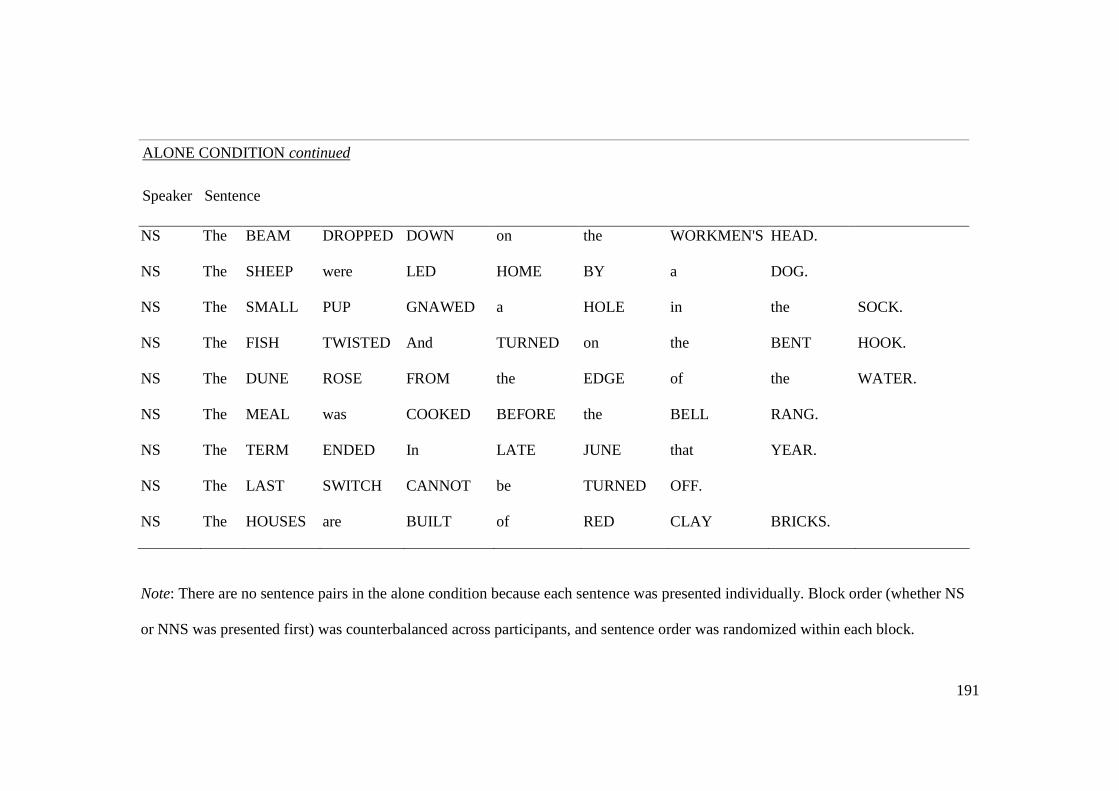
191
ALONE CONDITION continued
Speaker Sentence
NS The BEAM DROPPED DOWN on the WORKMEN'S HEAD.
NS The SHEEP were LED HOME BY a DOG.
NS The SMALL PUP GNAWED a HOLE in the SOCK.
NS The FISH TWISTED And TURNED on the BENT HOOK.
NS The DUNE ROSE FROM the EDGE of the WATER.
NS The MEAL was COOKED BEFORE the BELL RANG.
NS The TERM ENDED In LATE JUNE that YEAR.
NS The LAST SWITCH CANNOT be TURNED OFF.
NS The HOUSES are BUILT of RED CLAY BRICKS.
Note: There are no sentence pairs in the alone condition because each sentence was presented individually. Block order (whether NS
or NNS was presented first) was counterbalanced across participants, and sentence order was randomized within each block.

192
Appendix 3: Continued
ATTEND CONDITION
Pair Speaker Sentence
a NNS The STRAW NEST HOUSED FIVE ROBINS.
a NS The FIRST WORM GETS SNAPPED EARLY.
aa NNS The BLIND MAN COUNTED his OLD COINS.
aa NS The BRASS TUBE CIRCLED the HIGH WALL.
ab NNS The GOLD RING FITS only a PIERCED EAR.
ab NS The DARK POT HUNG in the FRONT CLOSET.
ac NNS The COLD DRIZZLE will HALT the BOND DRIVE.
ac NS The FLINT SPUTTERED and LIT a PINE TORCH.
af NNS The HORSE BALKED and THREW the TALL RIDER.
af NS The STORE WALLS were LINED with COLORED FROCKS.
ag NNS The KEY YOU DESIGNED will FIT the LOCK.
ag NS The PEACE LEAGUE MET to DISCUSS their PLANS.
ah NNS The PLEASANT HOURS FLY by much TOO SOON.
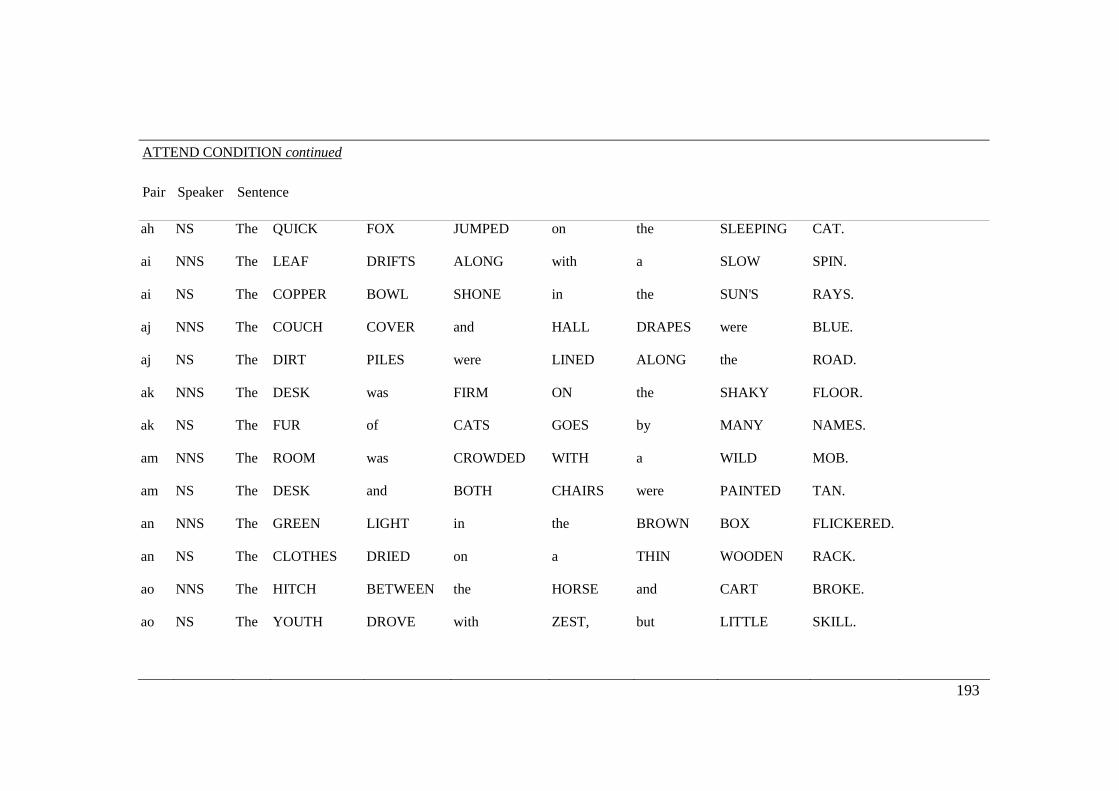
193
ATTEND CONDITION continued
Pair Speaker Sentence
ah NS The QUICK FOX JUMPED on the SLEEPING CAT.
ai NNS The LEAF DRIFTS ALONG with a SLOW SPIN.
ai NS The COPPER BOWL SHONE in the SUN'S RAYS.
aj NNS The COUCH COVER and HALL DRAPES were BLUE.
aj NS The DIRT PILES were LINED ALONG the ROAD.
ak NNS The DESK was FIRM ON the SHAKY FLOOR.
ak NS The FUR of CATS GOES by MANY NAMES.
am NNS The ROOM was CROWDED WITH a WILD MOB.
am NS The DESK and BOTH CHAIRS were PAINTED TAN.
an NNS The GREEN LIGHT in the BROWN BOX FLICKERED.
an NS The CLOTHES DRIED on a THIN WOODEN RACK.
ao NNS The HITCH BETWEEN the HORSE and CART BROKE.
ao NS The YOUTH DROVE with ZEST, but LITTLE SKILL.

194
ATTEND CONDITION continued
Pair Speaker Sentence
ap NNS The FACTS DON'T ALWAYS SHOW who is RIGHT.
ap NS The BANK PRESSED FOR PAYMENT of the DEBT.
aq NNS The MAIL COMES in THREE BATCHES per DAY.
aq NS The LINE WHERE the EDGES JOIN was CLEAN.
ar NNS The PODS of PEAS FERMENT in BARE FIELDS.
ar NS The KNIFE was HUNG INSIDE its BRIGHT SHEATH.
at NNS The FRUIT of a FIG TREE is APPLE SHAPED.
at NS The BEAUTY of the VIEW STUNNED the YOUNG BOY.
av NNS The LURE is USED to CATCH TROUT and FLOUNDER.
av NS The ROPE will BIND the SEVEN BOOKS at ONCE.
ax NNS The HARDER he TRIED the LESS he GOT DONE.
ax NS The FIN was SHARP and CUT the CLEAR WATER.
ay NNS The WHARF COULD be SEEN at the FARTHER SHORE.
ay NS The BOSS RAN the SHOW with a WATCHFUL EYE.

195
ATTEND CONDITION continued
Pair Speaker Sentence
az NNS The PLAY BEGAN as SOON as we SAT DOWN.
az NS The CIGAR BURNED a HOLE in the DESK TOP.
b NNS The TIN BOX HELD PRICELESS STONES.
b NS The PENCILS HAVE ALL BEEN USED.
ba NNS The BABY PUTS his RIGHT FOOT in his MOUTH.
ba NS The COFFEE STAND is TOO HIGH for the COUCH.
bb NNS The NIGHT SHIFT men RATE EXTRA PAY.
bb NS The EARLY PHASE of LIFE MOVES FAST.
bc NNS The SUN CAME up to LIGHT the EASTERN SKY.
bc NS The WRECK OCCURRED by the BANK on MAIN STREET.
bd NNS The SLAB was HEWN from HEAVY BLOCKS of SLATE.
bd NS The SHELVES were BARE of BOTH JAM or CRACKERS.
c NNS The BILL was PAID EVERY THIRD WEEK.
c NS The JUICE of LEMONS MAKES FINE PUNCH.

196
ATTEND CONDITION continued
Pair Speaker Sentence
cc NNS The POOR BOY MISSED the BOAT AGAIN.
cc NS The RED PAPER BRIGHTENED the DIM STAGE.
d NNS The FRIENDLY GANG LEFT the DRUG STORE.
d NS The SOFT CUSHION BROKE the MAN'S FALL.
dd NNS The WIDE ROAD SHIMMERED in the HOT SUN.
dd NS The BIRCH CANOE SLID on the SMOOTH PLANKS.
e NNS The LEASE RAN OUT in SIXTEEN WEEKS.
e NS The YOUNG GIRL GAVE no CLEAR RESPONSE.
ee NNS The BOY was THERE WHEN the SUN ROSE.
ee NS The BOX was THROWN BESIDE the PARKED TRUCK.
f NNS The SLUSH LAY DEEP ALONG the STREET.
f NS The STRAY CAT GAVE BIRTH to KITTENS.
ff NNS The URGE to WRITE SHORT STORIES is RARE.
ff NS The HOGS were FED CHOPPED CORN and GARBAGE.
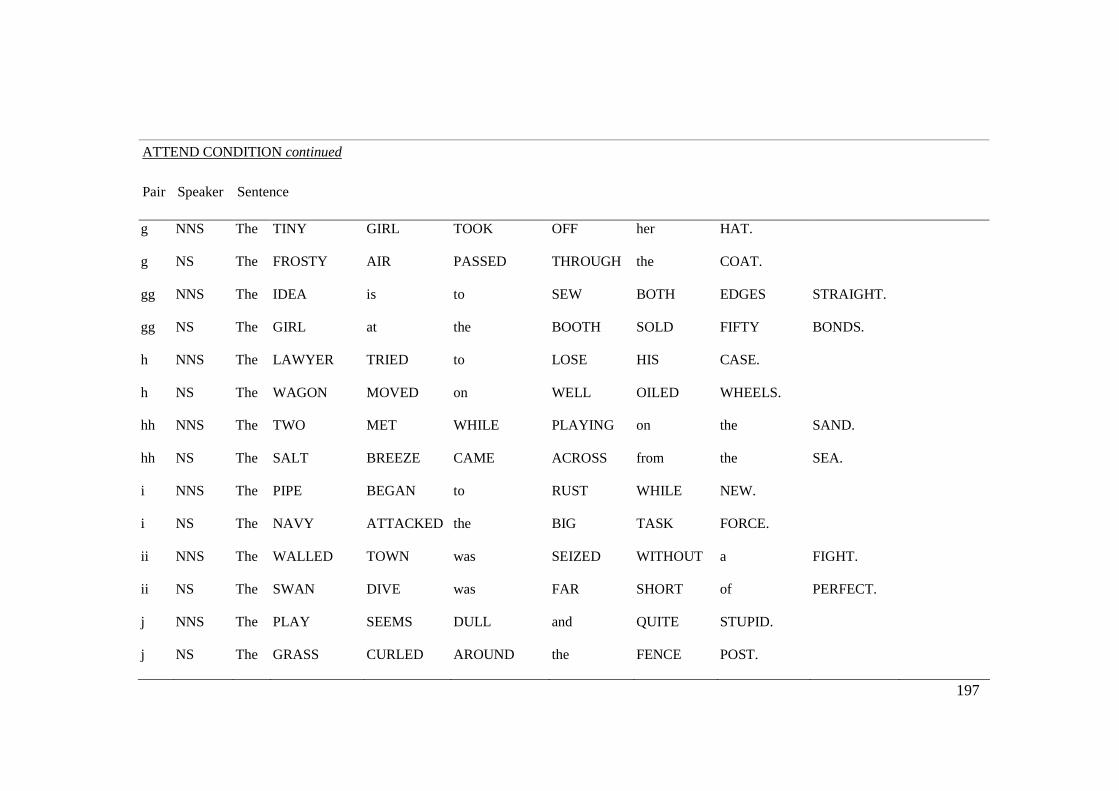
197
ATTEND CONDITION continued
Pair Speaker Sentence
g NNS The TINY GIRL TOOK OFF her HAT.
g NS The FROSTY AIR PASSED THROUGH the COAT.
gg NNS The IDEA is to SEW BOTH EDGES STRAIGHT.
gg NS The GIRL at the BOOTH SOLD FIFTY BONDS.
h NNS The LAWYER TRIED to LOSE HIS CASE.
h NS The WAGON MOVED on WELL OILED WHEELS.
hh NNS The TWO MET WHILE PLAYING on the SAND.
hh NS The SALT BREEZE CAME ACROSS from the SEA.
i NNS The PIPE BEGAN to RUST WHILE NEW.
i NS The NAVY ATTACKED the BIG TASK FORCE.
ii NNS The WALLED TOWN was SEIZED WITHOUT a FIGHT.
ii NS The SWAN DIVE was FAR SHORT of PERFECT.
j NNS The PLAY SEEMS DULL and QUITE STUPID.
j NS The GRASS CURLED AROUND the FENCE POST.
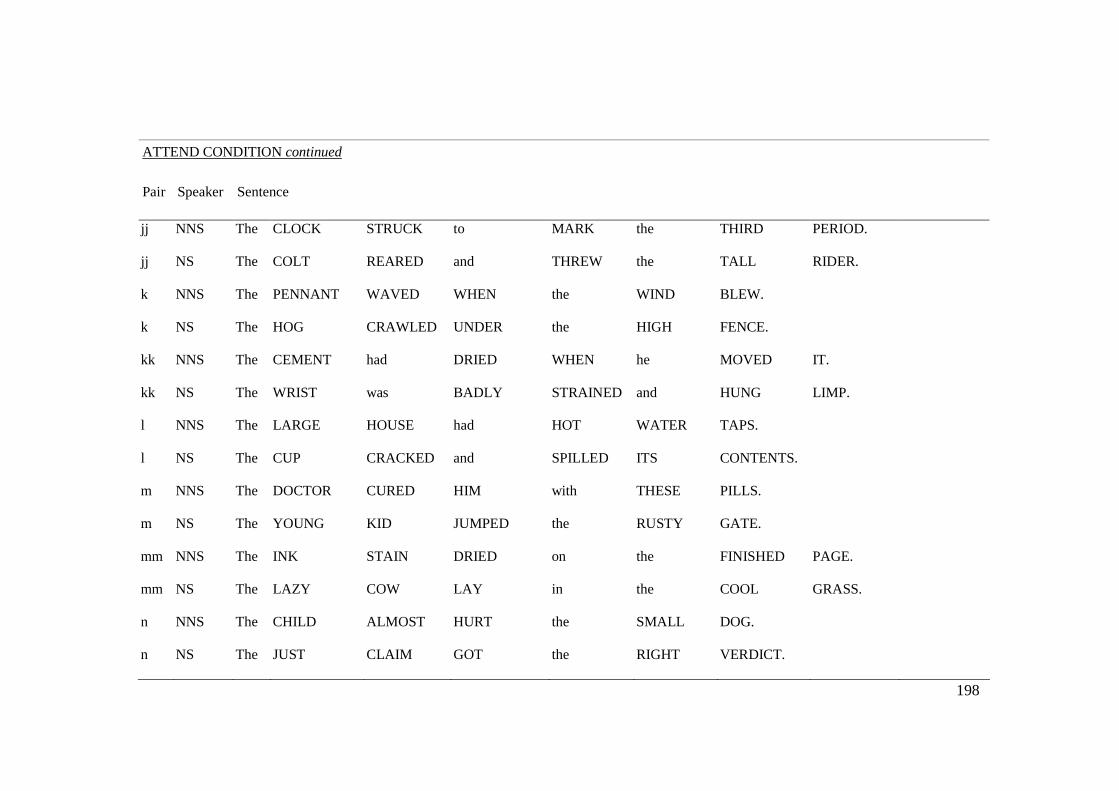
198
ATTEND CONDITION continued
Pair Speaker Sentence
jj NNS The CLOCK STRUCK to MARK the THIRD PERIOD.
jj NS The COLT REARED and THREW the TALL RIDER.
k NNS The PENNANT WAVED WHEN the WIND BLEW.
k NS The HOG CRAWLED UNDER the HIGH FENCE.
kk NNS The CEMENT had DRIED WHEN he MOVED IT.
kk NS The WRIST was BADLY STRAINED and HUNG LIMP.
l NNS The LARGE HOUSE had HOT WATER TAPS.
l NS The CUP CRACKED and SPILLED ITS CONTENTS.
m NNS The DOCTOR CURED HIM with THESE PILLS.
m NS The YOUNG KID JUMPED the RUSTY GATE.
mm NNS The INK STAIN DRIED on the FINISHED PAGE.
mm NS The LAZY COW LAY in the COOL GRASS.
n NNS The CHILD ALMOST HURT the SMALL DOG.
n NS The JUST CLAIM GOT the RIGHT VERDICT.

199
ATTEND CONDITION continued
Pair Speaker Sentence
nn NNS The THAW CAME EARLY and FREED the STREAM.
nn NS The CROOKED MAZE FAILED to FOOL the MOUSE.
o NNS The RUDE LAUGH FILLED the EMPTY ROOM.
o NS The TONGS LAY BESIDE the ICE PAIL.
oo NNS The PAPER BOX is FULL of THUMB TACKS.
oo NS The FRUIT PEEL was CUT in THICK SLICES.
p NNS The PLUSH CHAIR LEANED AGAINST the WALL.
p NS The BIRCH LOOKED STARK WHITE and LONESOME.
pp NNS The TREE TOP WAVED in a GRACEFUL WAY.
pp NS The HEART BEAT STRONGLY and with FIRM STROKES.
q NNS The PURPLE TIE was TEN YEARS OLD.
q NS The PRINCE ORDERED his HEAD CHOPPED OFF.
qq NNS The MAP HAD an X that MEANT NOTHING.
qq NS The HAT BRIM was WIDE and TOO DROOPY.

200
ATTEND CONDITION continued
Pair Speaker Sentence
r NNS The JUNK YARD HAD a MOLDY SMELL.
r NS The RED TAPE BOUND the SMUGGLED FOOD.
ss NNS The NEW GIRL was FIRED TODAY at NOON.
ss NS The SLANG WORD for RAW WHISKEY is BOOZE.
t NNS The STALE SMELL of OLD BEER LINGERS.
t NS The CLAN GATHERED on EACH DULL NIGHT.
tt NNS The SHAKY BARN FELL with a LOUD CRASH.
tt NS The EMPTY FLASK STOOD on the TIN TRAY.
u NNS The CHILD CRAWLED INTO the DENSE GRASS.
u NS The NEWS STRUCK DOUBT into RESTLESS MINDS.
uu NNS The LAKE SPARKLED in the RED HOT SUN.
uu NS The OFFICE PAINT was a DULL, SAD TAN.
v NNS The NAG PULLED the FRAIL CART ALONG.
v NS The BOY OWED his PAL THIRTY CENTS.

201
ATTEND CONDITION continued
Pair Speaker Sentence
vv NNS The FLY MADE its WAY ALONG the WALL.
vv NS The HOSTESS TAUGHT the NEW MAID to SERVE.
w NNS The MUSIC PLAYED ON WHILE they TALKED.
w NS The WALL PHONE RANG LOUD and OFTEN.
ww NNS The FIGHT will END in JUST SIX MINUTES.
ww NS The DOORKNOB was MADE of BRIGHT CLEAN BRASS.
x NNS The BLACK TRUNK FELL FROM the LANDING.
x NS The LITTLE TALES THEY TELL are FALSE.
xx NNS The BEETLE DRONED in the HOT JUNE SUN.
xx NS The LAMP SHONE with a STEADY GREEN FLAME.
y NNS The LONG JOURNEY HOME TOOK a YEAR.
y NS The SMALL RED NEON LAMP went OUT.
yy NNS The KITTEN CHASED the DOG DOWN the STREET.
yy NS The ANCIENT COIN was QUITE DULL and WORN.

202
ATTEND CONDITION continued
Pair Speaker Sentence
z NNS The RAM SCARED the SCHOOL CHILDREN OFF.
z NS The FAN WHIRLED its ROUND BLADES SOFTLY.
Note: Order of sentence pairs was randomized across participants. The first 30 sentence pairs were Block 1 and the second 30 sentence pairs were
Block 2. Block order (whether the NS or NNS was assigned first as the target) was counterbalanced across participants.
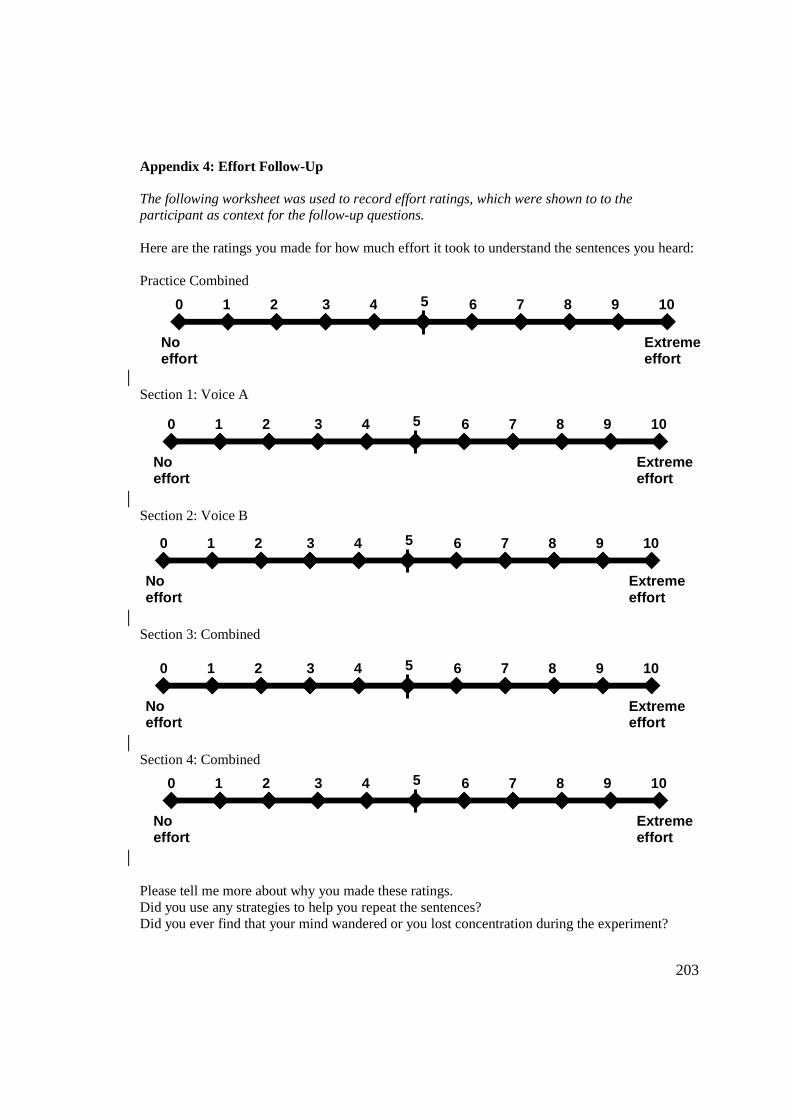
203
Appendix 4: Effort Follow-Up The following worksheet was used to record effort ratings, which were shown to to the participant as context for the follow-up questions. Here are the ratings you made for how much effort it took to understand the sentences you heard: Practice Combined
Section 1: Voice A
Section 2: Voice B
Section 3: Combined
Section 4: Combined
Please tell me more about why you made these ratings. Did you use any strategies to help you repeat the sentences? Did you ever find that your mind wandered or you lost concentration during the experiment?
1 2 3 4 0 5 6 7 8 9 10
No effort
Extreme effort
1 2 3 4 0 5 6 7 8 9 10
No effort
Extreme effort
1 2 3 4 0 5 6 7 8 9 10
No effort
Extreme effort
1 2 3 4 0 5 6 7 8 9 10
No effort
Extreme effort
1 2 3 4 0 5 6 7 8 9 10
No effort
Extreme effort
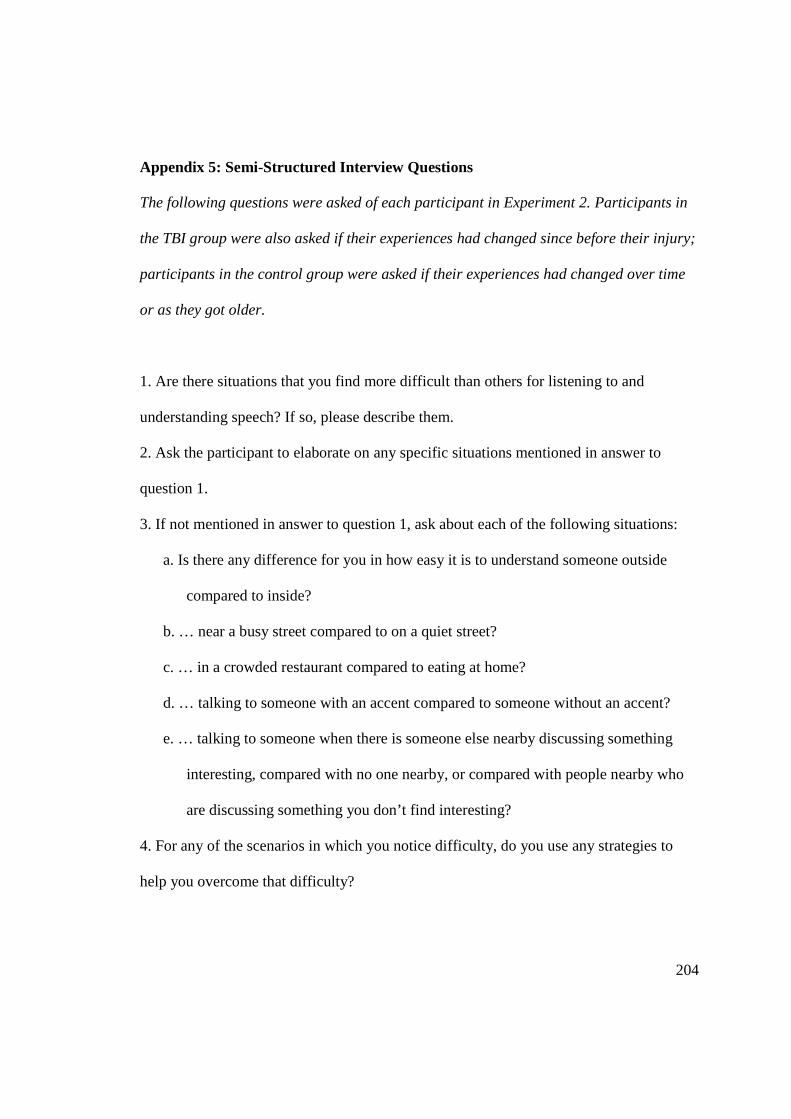
204
Appendix 5: Semi-Structured Interview Questions
The following questions were asked of each participant in Experiment 2. Participants in
the TBI group were also asked if their experiences had changed since before their injury;
participants in the control group were asked if their experiences had changed over time
or as they got older.
1. Are there situations that you find more difficult than others for listening to and
understanding speech? If so, please describe them.
2. Ask the participant to elaborate on any specific situations mentioned in answer to
question 1.
3. If not mentioned in answer to question 1, ask about each of the following situations:
a. Is there any difference for you in how easy it is to understand someone outside
compared to inside?
b. … near a busy street compared to on a quiet street?
c. … in a crowded restaurant compared to eating at home?
d. … talking to someone with an accent compared to someone without an accent?
e. … talking to someone when there is someone else nearby discussing something
interesting, compared with no one nearby, or compared with people nearby who
are discussing something you don’t find interesting?
4. For any of the scenarios in which you notice difficulty, do you use any strategies to
help you overcome that difficulty?
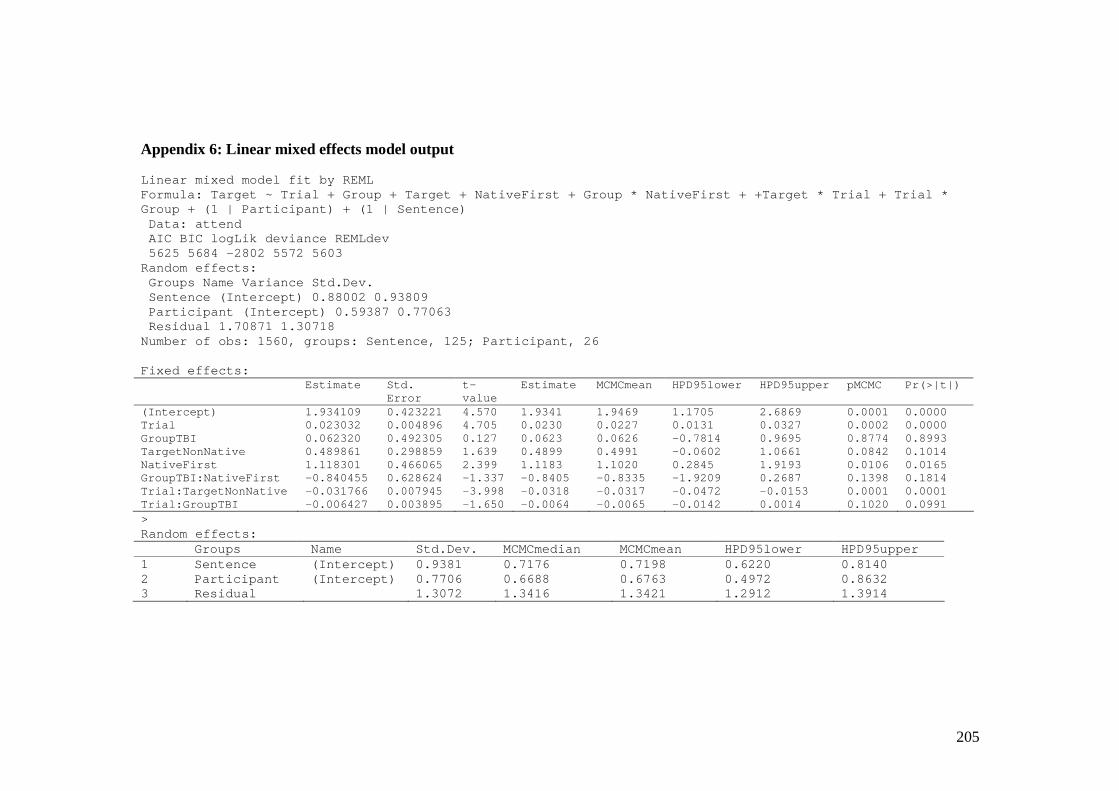
205
Appendix 6: Linear mixed effects model output Linear mixed model fit by REML Formula: Target ~ Trial + Group + Target + NativeFirst + Group * NativeFirst + +Target * Trial + Trial * Group + (1 | Participant) + (1 | Sentence) Data: attend AIC BIC logLik deviance REMLdev 5625 5684 -2802 5572 5603 Random effects: Groups Name Variance Std.Dev. Sentence (Intercept) 0.88002 0.93809 Participant (Intercept) 0.59387 0.77063 Residual 1.70871 1.30718 Number of obs: 1560, groups: Sentence, 125; Participant, 26 Fixed effects: Estimate Std.
Error t-value
Estimate MCMCmean HPD95lower HPD95upper pMCMC Pr(>|t|)
(Intercept) 1.934109 0.423221 4.570 1.9341 1.9469 1.1705 2.6869 0.0001 0.0000 Trial 0.023032 0.004896 4.705 0.0230 0.0227 0.0131 0.0327 0.0002 0.0000 GroupTBI 0.062320 0.492305 0.127 0.0623 0.0626 -0.7814 0.9695 0.8774 0.8993 TargetNonNative 0.489861 0.298859 1.639 0.4899 0.4991 -0.0602 1.0661 0.0842 0.1014 NativeFirst 1.118301 0.466065 2.399 1.1183 1.1020 0.2845 1.9193 0.0106 0.0165 GroupTBI:NativeFirst -0.840455 0.628624 -1.337 -0.8405 -0.8335 -1.9209 0.2687 0.1398 0.1814 Trial:TargetNonNative -0.031766 0.007945 -3.998 -0.0318 -0.0317 -0.0472 -0.0153 0.0001 0.0001 Trial:GroupTBI -0.006427 0.003895 -1.650 -0.0064 -0.0065 -0.0142 0.0014 0.1020 0.0991 > Random effects: Groups Name Std.Dev. MCMCmedian MCMCmean HPD95lower HPD95upper 1 Sentence (Intercept) 0.9381 0.7176 0.7198 0.6220 0.8140 2 Participant (Intercept) 0.7706 0.6688 0.6763 0.4972 0.8632 3 Residual 1.3072 1.3416 1.3421 1.2912 1.3914
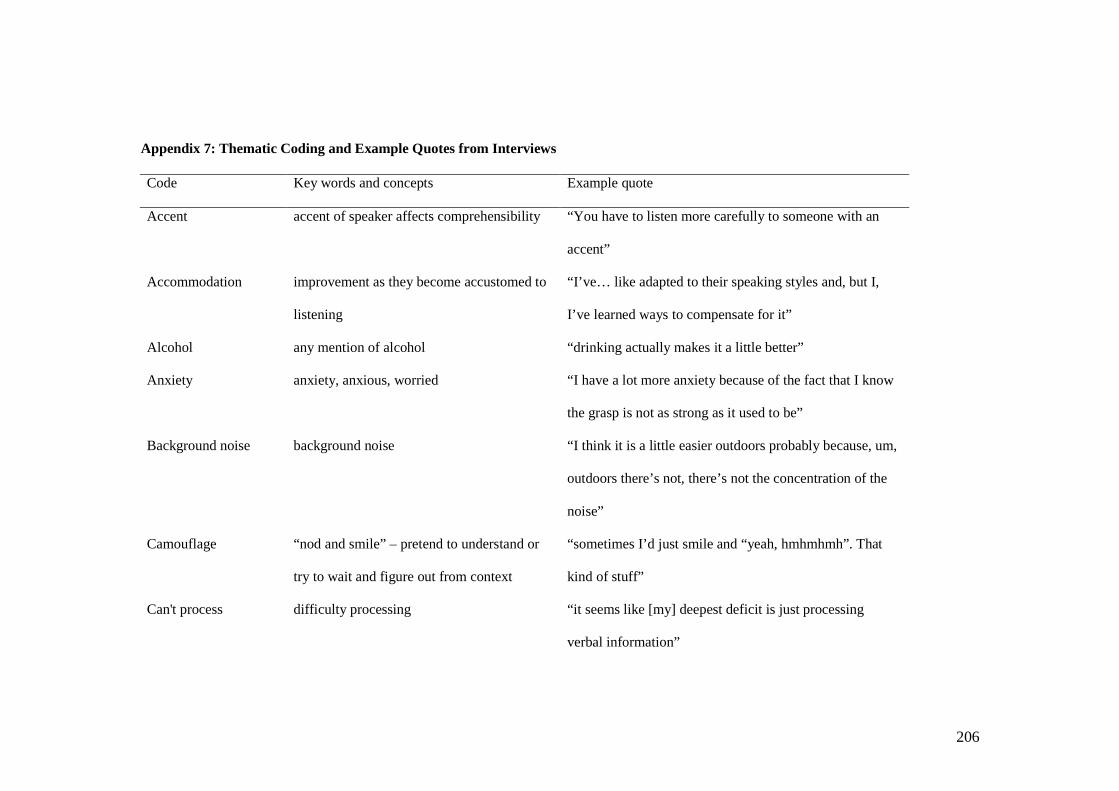
206
Appendix 7: Thematic Coding and Example Quotes from Interviews Code Key words and concepts Example quote
Accent accent of speaker affects comprehensibility “You have to listen more carefully to someone with an
accent”
Accommodation improvement as they become accustomed to
listening
“I’ve… like adapted to their speaking styles and, but I,
I’ve learned ways to compensate for it”
Alcohol any mention of alcohol “drinking actually makes it a little better”
Anxiety anxiety, anxious, worried “I have a lot more anxiety because of the fact that I know
the grasp is not as strong as it used to be”
Background noise background noise “I think it is a little easier outdoors probably because, um,
outdoors there’s not, there’s not the concentration of the
noise”
Camouflage “nod and smile” – pretend to understand or
try to wait and figure out from context
“sometimes I’d just smile and “yeah, hmhmhmh”. That
kind of stuff”
Can't process difficulty processing “it seems like [my] deepest deficit is just processing
verbal information”

207
Appendix 7 Continued
Code Key words and concepts Example quote
Change- worsening over time “I never had problems with it before my brain injury, so
it’s definitely worse”
Change+ getting better over time “I feel like listening to people with accents has gotten
easier just ‘cause I’ve done it more”
Change= no change over time “I feel like I’ve been the same.”
Conversation partners effect of conversation partner (e.g. depends
who I’m talking to)
“probably the most challenging thing, is just dealing with
people that you need to converse with”
Depends usually in response to a prompt “it would just depend on how calm the environment is”
Difficult “it’s just harder” “having a basic conversation is pretty difficult.”
Distraction distraction, pulling attention, hard to re-
focus, multitasking
“every single thing outside of me is a distraction”
Endorse agree that something is difficult in response
to prompt but don’t elaborate much OR state
it can be difficult but is not a big deal
“Obviously a loud busy street would be difficult”

208
Appendix 7 Continued
Code Key words and concepts Example quote
Extra effort hard work, effort, “it’s just huge amounts of concentration…wears me out.”
Familiarity better with more familiar person or accent “the more time I spend with an individual, the easier it
gets for me to be able to understand them”
Fatigue tired, fatigue, progressively harder, worn out “The later in the day the worse it gets”
Filter tuning out, ignoring, filter, hearing unwanted
information
“there’s so much other noise that my brain can’t tell what
to listen to.”
Fluency e.g. Less fluent = less comprehensible “a stuttering problem … and I was really kind of panicked
because I didn’t want to appear [rude]”
Focus pay attention, focus, honing in, concentrating “I’m not…able to differentiate some of the speech from
one person to the other, unless I’m really concentrating
and focusing on what they’re saying”
Frustration frustrated, annoyed, aggravated “I tend to get really frustrated and it’s a lot harder to pay
attention to the one conversation.”
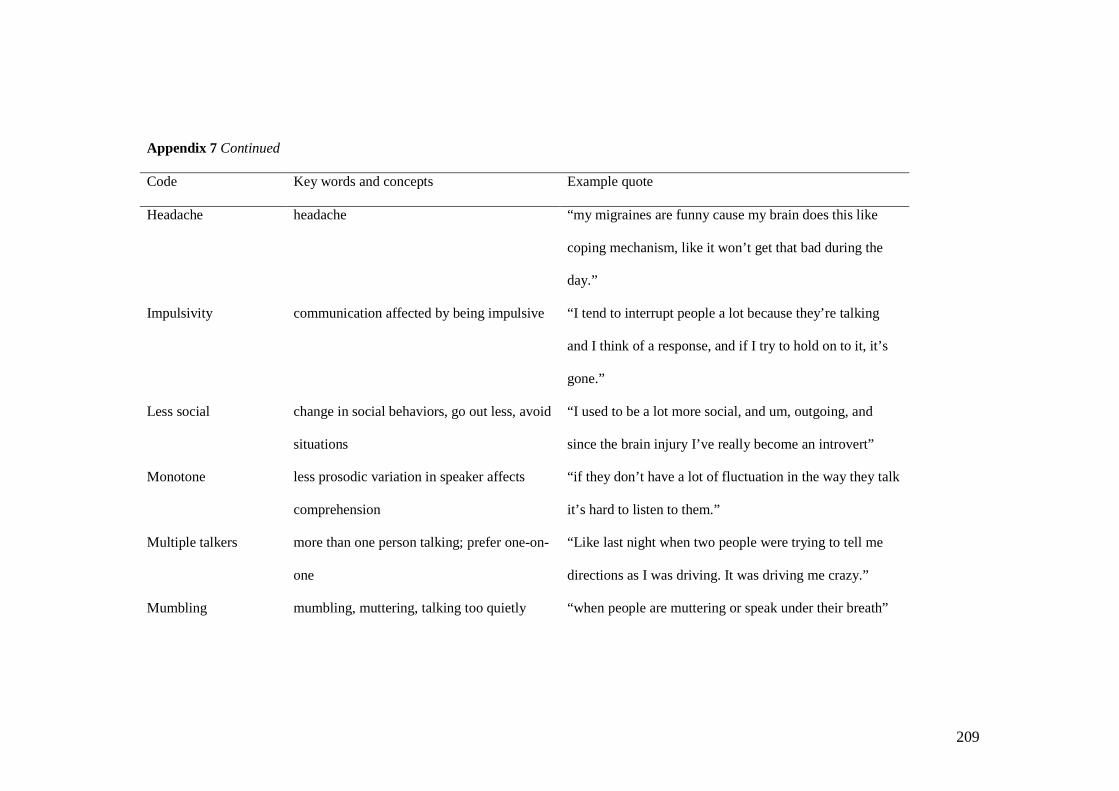
209
Appendix 7 Continued
Code Key words and concepts Example quote
Headache headache “my migraines are funny cause my brain does this like
coping mechanism, like it won’t get that bad during the
day.”
Impulsivity communication affected by being impulsive “I tend to interrupt people a lot because they’re talking
and I think of a response, and if I try to hold on to it, it’s
gone.”
Less social change in social behaviors, go out less, avoid
situations
“I used to be a lot more social, and um, outgoing, and
since the brain injury I’ve really become an introvert”
Monotone less prosodic variation in speaker affects
comprehension
“if they don’t have a lot of fluctuation in the way they talk
it’s hard to listen to them.”
Multiple talkers more than one person talking; prefer one-on-
one
“Like last night when two people were trying to tell me
directions as I was driving. It was driving me crazy.”
Mumbling mumbling, muttering, talking too quietly “when people are muttering or speak under their breath”
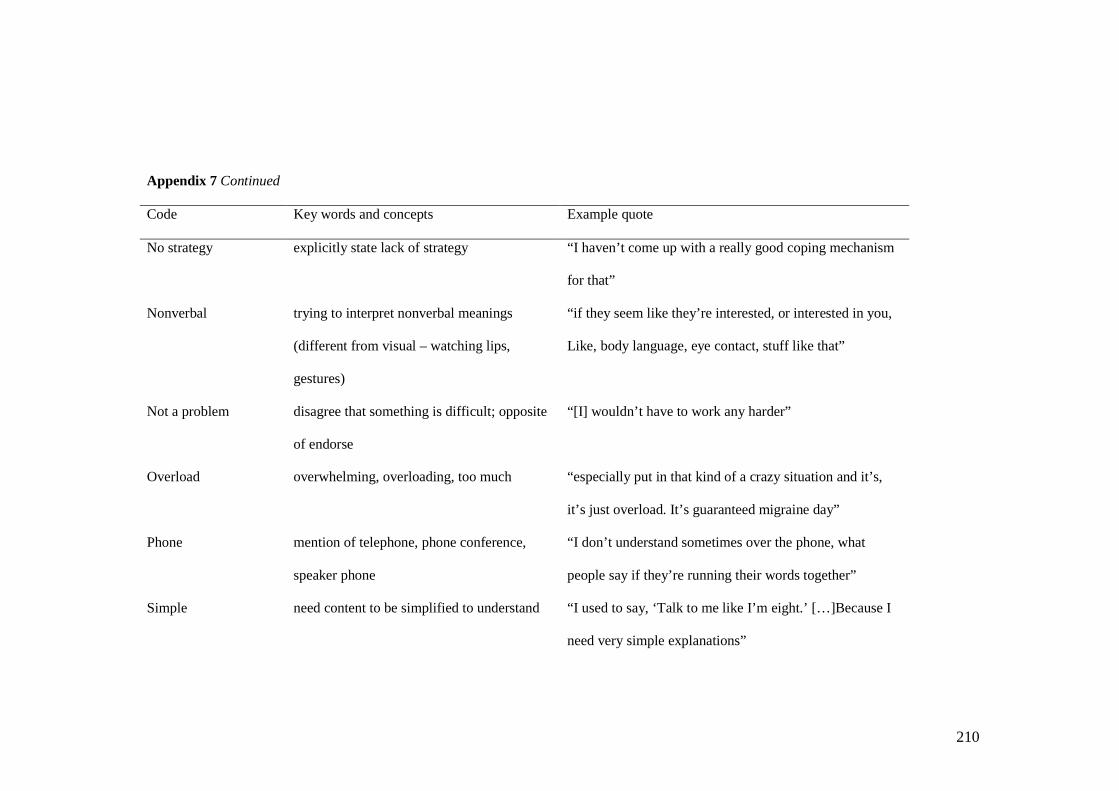
210
Appendix 7 Continued
Code Key words and concepts Example quote
No strategy explicitly state lack of strategy “I haven’t come up with a really good coping mechanism
for that”
Nonverbal trying to interpret nonverbal meanings
(different from visual – watching lips,
gestures)
“if they seem like they’re interested, or interested in you,
Like, body language, eye contact, stuff like that”
Not a problem disagree that something is difficult; opposite
of endorse
“[I] wouldn’t have to work any harder”
Overload overwhelming, overloading, too much “especially put in that kind of a crazy situation and it’s,
it’s just overload. It’s guaranteed migraine day”
Phone mention of telephone, phone conference,
speaker phone
“I don’t understand sometimes over the phone, what
people say if they’re running their words together”
Simple need content to be simplified to understand “I used to say, ‘Talk to me like I’m eight.’ […]Because I
need very simple explanations”
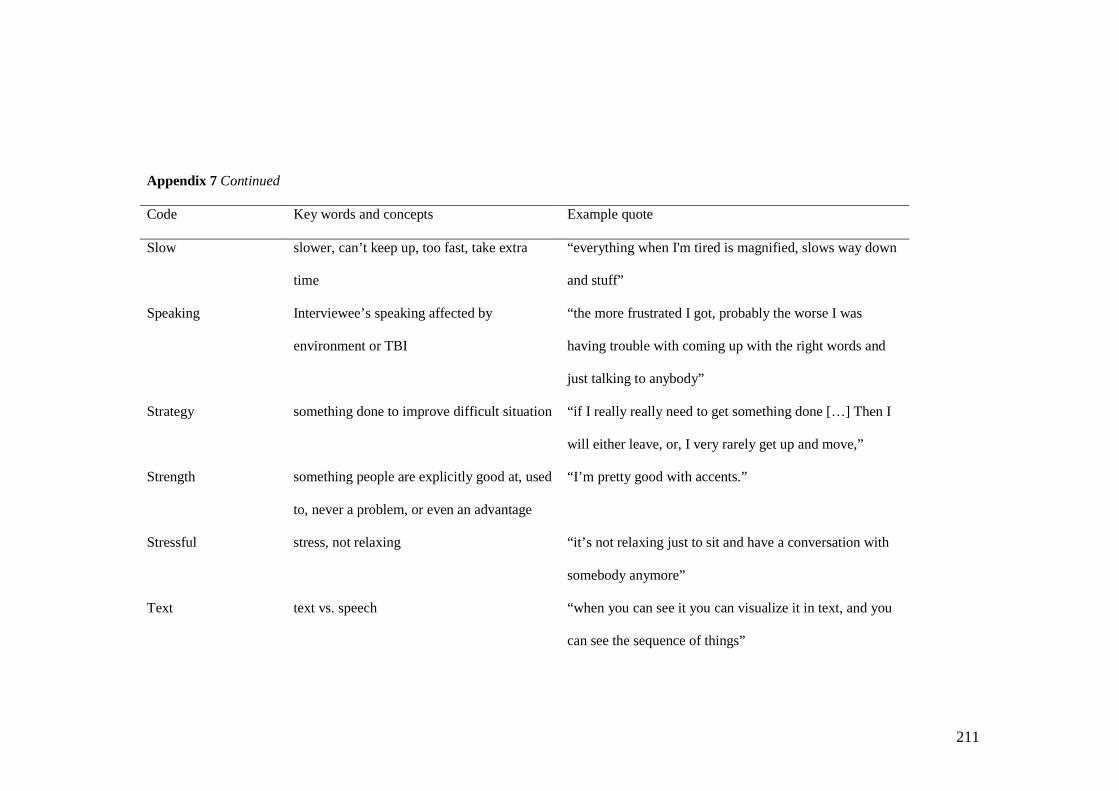
211
Appendix 7 Continued
Code Key words and concepts Example quote
Slow slower, can’t keep up, too fast, take extra
time
“everything when I'm tired is magnified, slows way down
and stuff”
Speaking Interviewee’s speaking affected by
environment or TBI
“the more frustrated I got, probably the worse I was
having trouble with coming up with the right words and
just talking to anybody”
Strategy something done to improve difficult situation “if I really really need to get something done […] Then I
will either leave, or, I very rarely get up and move,”
Strength something people are explicitly good at, used
to, never a problem, or even an advantage
“I’m pretty good with accents.”
Stressful stress, not relaxing “it’s not relaxing just to sit and have a conversation with
somebody anymore”
Text text vs. speech “when you can see it you can visualize it in text, and you
can see the sequence of things”

212
Appendix 7 Continued
Code Key words and concepts Example quote
Think pause to re-play or think through what has
been said
“And then replay it back in my head before I try and
respond”
Tinnitus tinnitus “I’d say it makes it harder cause it makes the ringing in
my ears louder.”
Topic depends on the topic/type of conversation ,
interest, preference
“something that I know about I understand more than a
new topic of information.”
Visual focus on mouth, harder if can’t see, watch for
gestures
“And if it were face-to-face, I have so much more
information, to be able to figure out what they’re saying.”
DO NOT DELETE LAST 2 PAGE RETURNS
Copyright © 2022 FDOKUMEN

