


Bahasa
Halaman
Hukum

i
THE DEVELOPMENT OF A CULTURE-BASED TOOL TO PREDICT TEAM PERFORMANCE
by
Allan Hodgson
A Doctoral Thesis submitted in partial fulfilment of the requirements for the award of
Doctor of Philosophy of Loughborough University
October 2014
© by Allan Hodgson 2014
i
Acknowledgements I would like to thank my supervisors, Professor Carys Siemieniuch and Dr Ella Hubbard, for
their guidance, advice and encouragement over the period of the PhD. I would also like to
acknowledge the patience and forbearance of friends, former industrial colleagues and
academic colleagues who provided information on the various teams that they had worked
with; this information formed an important part of my research.
I would also like to thank my wife, Christine, for her patience and support, and son and
daughter, Alec and Leonie, for their unwavering confidence in my ability to succeed –
confidence that I did not always possess myself.
Finally, I would like to thank my friend and colleague, Pavel, for his insights, support, advice
and encouragement.
ii
Abstract The effect of national culture on the performance of teams is becoming an increasingly
important issue in advanced western countries. There are many interlinked reasons for this,
including the increasing globalisation of companies and the use of joint ventures for the
development of expensive platforms. A further issue relates to the export of complex socio-
technical systems, where a culture clash between designer/manufacturer and user can lead
to significant problems.
This report describes research work that was carried out to analyse the cultural factors that
influence the performance of teams (including researchers, designers, operators and crews),
and to determine whether these factors could be captured in a tool to provide assistance to
team managers and team builders. The original point of interest related to the development
of increasingly complex sociotechnical systems, for example nuclear power stations, oil
refineries, offshore oil platforms, hospital systems and large transport aircraft. Answers that
might be sought, in particular by the senior managers of global companies, include (1) the
best teams (or best national locations) for fundamental research, industrial research &
development, product/system improvement and other key activities, and (2) the implications
for system performance and, as a result, for system design, of targeting an eastern Asian
market, a South-American market, etc.
A literature review was carried out of the effects of culture on team performance, of culture
measures and tools and of task classifications; in addition, empirical evidence of the validity
of measures and tools was sought. Significant evidence was found of the effects of culture
on teams and crews, but no national culture-based team performance prediction tools were
found. Based on the results of the literature review, Hofstede’s original four-dimension
cultural framework was selected as the basis for the collection and analysis of empirical data,
including the results of studies from the literature and the researcher’s own empirical studies.
No team or task classification system was found that was suitable for the purposes of linking
culture to team performance, so a five-factor task classification was developed, based on the
literature review, to form the basis of the initial modelling work.
A detailed analysis of results from the literature and from the author’s pilot studies revealed
additional culture-performance relationships, including those relating to cultural diversity.
Three culture-performance models were incorporated into software tools that offered perfor-
mance prediction capabilities. The first model was primarily a test bed for ideas; the second
model incorporated a task/behavioural approach which achieved limited success; the third
and final model was evaluated against a range of team and crew performance data before
iii
being tested successfully for acceptability by users.
The research results indicated that the effects of cultural diversity must be sought at the
individual cultural dimension level not at the composite level, that the effects of national
culture on team performance were consistent and strong enough to be usefully captured in a
predictive culture tool and that the relationships between culture and behaviour were
moderated by contextual factors.
iv
CONTENTS
ACKNOWLEDGEMENTS ........................................................................................... I
ABSTRACT ................................................................................................................ II
LIST OF FIGURES ..................................................................................................... X
LIST OF TABLES ..................................................................................................... XI
GLOSSARY OF TERMS ......................................................................................... XIII
1 INTRODUCTION ................................................................................................... 1
1.1 Overview ....................................................................................................... 1
1.2 Background ................................................................................................... 2 1.2.1 The increasing importance of ‘other culture’ teams and multicultural teams ..... 2 1.2.2 ‘Other culture’ teams and multicultural teams - problem areas ......................... 3 1.2.3 Sociotechnical systems – problem areas .......................................................... 4
1.3 Initial assumptions ......................................................................................... 4
1.4 Aims and objectives of the research .............................................................. 5
1.5 Main contribution to knowledge ..................................................................... 5
1.6 Stakeholders and potential users .................................................................. 6
1.7 Scope and boundaries of the work ................................................................ 6 1.7.1 Culture ............................................................................................................. 6 1.7.2 Team types ...................................................................................................... 6 1.7.3 Tasks ............................................................................................................... 7
1.8 Background to the research methodology ..................................................... 7
1.9 Structure of this report ................................................................................... 7
2 GENERAL PROBLEM STATEMENT AND RESEARCH METHODOLOGY ...... 10
2.1 Introduction .................................................................................................. 10
2.2 The problem area ........................................................................................ 10 2.2.1 Background .....................................................................................................10 2.2.2 An initial problem statement ............................................................................11 2.2.3 The primary stakeholders ................................................................................13
2.3 Purpose statement, research questions and delimitations .......................... 14 2.3.1 Purpose statement ..........................................................................................14 2.3.2 Research question ..........................................................................................14 2.3.3 Research sub-questions ..................................................................................14 2.3.4 Delimitations of scope .....................................................................................14
2.4 Research methodology ................................................................................ 15
2.5 The study design ......................................................................................... 16
2.6 Approach adopted and activities undertaken ............................................... 17
2.7 Summary of problem statement and research methodology ....................... 20
v
3 REVIEW OF THE LITERATURE AND STATE-OF-THE-ART ............................ 22
3.1 Introduction .................................................................................................. 22
3.2 An overview of the literature review ............................................................. 23 3.2.1 The literature review design ............................................................................23 3.2.2 Literature review sources – databases and search engines ............................24 3.2.3 Key authors .....................................................................................................25
3.3 What we know about ‘other culture’ teams and multicultural teams ............ 26 3.3.1 Evidence of the effects of culture on external aspects or measures of team performance .................................................................................................................27 3.3.2 Evidence of the effects of culture on intrateam aspects of performance ..........50 3.3.3 Summarising evidence of the effects of culture on both external and intra-team aspects of team performance .......................................................................................60
3.4 Tools that are available to evaluate ‘other culture’ teams and multicultural teams .................................................................................................................... 62
3.4.1 Methods, models and tools for the prediction of team performance or allocation of tasks based on national culture .................................................................................63 3.4.2 Cultural frameworks ........................................................................................66 3.4.3 Measures of team cultural diversity .................................................................73 3.4.4 Team and task classifications ..........................................................................75
3.5 Empirical evidence about the validity of national culture-based tools .......... 78 3.5.1 Empirical evidence for the validity of methods, models and tools for the culture-based prediction of team performance ..........................................................................78 3.5.2 Empirical evidence for the validity of cultural frameworks ................................79 3.5.3 Empirical evidence for the validity of measures of team cultural diversity ........84 3.5.4 Empirical evidence for the validity of team and task classifications for the proposed work ..............................................................................................................85
3.6 Summary of the review of the literature and state-of-the-art ........................ 85 3.6.1 What was not helpful .......................................................................................86 3.6.2 Gaps identified ................................................................................................87
3.7 Detailed problem statement based on the review of the literature and state-of-the-art ............................................................................................................... 87
4 RESEARCH TOOLS AND PROPOSED ACTIVITIES ........................................ 89
4.1 Introduction .................................................................................................. 89
4.2 The selection of a cultural framework .......................................................... 90 4.2.1 The four (original) cultural dimensions in more detail.......................................90 4.2.2 Caveats with regard to the cultural framework .................................................92 4.2.3 Simplifying assumptions made with regard to the cultural framework ..............95
4.3 Selection or derivation of a measure for team cultural diversity .................. 96 4.3.1 Requirements for a quantitative measure of cultural diversity ..........................96 4.3.2 Derivation of an expression for cultural diversity based on cultural distance ....97 4.3.3 Caveats with regard to the expression for cultural diversity ........................... 101 4.3.4 Simplifying assumptions with regard to the measure of cultural diversity ....... 102
4.4 Defining teams and tasks from the viewpoint of culture............................. 102 4.4.1 A practical team/task framework ................................................................... 103 4.4.2 An ideal team/task framework ....................................................................... 109
4.5 Proposed further research activities .......................................................... 110 4.5.1 Specific research questions........................................................................... 110
vi
4.5.2 Culture models and tools ............................................................................... 111
4.6 Summary of research tools and proposed activities .................................. 111
5 DATA COLLECTION AND ANALYSIS ............................................................ 113
5.1 Introduction ................................................................................................ 113
5.2 The collection of qualitative anecdotal information .................................... 114 5.2.1 Informal interviews and personal conversations ............................................ 114 5.2.2 Questionnaire responses .............................................................................. 116
5.3 Data from the author’s studies ................................................................... 117 5.3.1 Industrial and commercial project and management teams ........................... 117 5.3.2 Student project groups .................................................................................. 118 5.3.3 University research groups ............................................................................ 119 5.3.4 Sports teams ................................................................................................. 122 5.3.5 Organised action teams ................................................................................ 125
5.4 Answers to the earlier research questions ................................................. 130 5.4.1 The effects of masculinity (MAS) on team performance ................................ 130 5.4.2 The effects of uncertainty avoidance (UAI) on team performance ................. 131 5.4.3 The effects of cultural diversity on team performance.................................... 132
5.5 Establishment of quantitative culture-performance relationships from the data 133
5.5.1 Optimum ‘high’ and ‘low’ culture dimension scores ....................................... 134 5.5.2 Relative weighting factors for cultural dimensions ......................................... 138
5.6 Potential issues with Hofstede’s cultural framework .................................. 139 5.6.1 The incremental addition of cultural dimensions ............................................ 139 5.6.2 The calculation of cultural dimension scores ................................................. 140
5.7 Summary ................................................................................................... 140
6 A FIRST MODEL AND PROTOTYPE TEAM CULTURE TOOL....................... 141
6.1 Introduction ................................................................................................ 141
6.2 The basis of the first model (TCT1) ........................................................... 141 6.2.1 Overview of the first model ............................................................................ 141 6.2.2 Underpinning assumptions of the first model ................................................. 142
6.3 A detailed description of the first model and team culture tool .................. 143 6.3.1 Profiling the team .......................................................................................... 144 6.3.2 Profiling the task/mission ............................................................................... 145 6.3.3 Interpreting the results ................................................................................... 145 6.3.4 Basis of the predicted performance equations ............................................... 146
6.4 Evaluation of the first prototype tool (TCT1) .............................................. 149
6.5 Limitations, successes and a re-evaluation of assumptions ...................... 149 6.5.1 Limitations and successes of the tool ............................................................ 149 6.5.2 A re-examination of the original assumptions ................................................ 150 6.5.3 Comments on the application of Hofstede’s cultural framework ..................... 151 6.5.4 Conclusions .................................................................................................. 153
6.6 Summary ................................................................................................... 153
7 A SECOND MODEL AND PROTOTYPE TEAM CULTURE TOOL.................. 155
vii
7.1 Introduction ................................................................................................ 155
7.2 The basis of the second model (TCT2) ..................................................... 155 7.2.1 Overview of the second model ...................................................................... 155 7.2.2 Underpinning assumptions of the second model ........................................... 157
7.3 A detailed description of the key elements of the second model and tool . 158 7.3.1 Team cultural profiler..................................................................................... 158 7.3.2 Team task/mission profiler ............................................................................ 159
7.4 Description of the operation of the tool ...................................................... 163 7.4.1 Profiling the team .......................................................................................... 163 7.4.2 Profiling the mission ...................................................................................... 165 7.4.3 Mapping the task/mission profile into a cultural profile and deriving discrepancies.............................................................................................................. 167 7.4.4 Interpreting the results ................................................................................... 169
7.5 Validation and evaluation of the second prototype tool ............................. 172 7.5.1 Initial testing and validation ........................................................................... 172 7.5.2 User testing and evaluation of the tool .......................................................... 173 7.5.3 Re-examining the underpinning assumptions of the second model ............... 179
7.6 Proposed changes to the tool .................................................................... 180
7.7 Summary of the second model and team culture tool ............................... 180
8 A THIRD MODEL AND PROTOTYPE CULTURE TOOL ................................. 181
8.1 Introduction ................................................................................................ 181
8.2 The basis of the third model (TCT3) .......................................................... 181 8.2.1 Overview of the third model ........................................................................... 181 8.2.2 Underpinning assumptions of the third model ................................................ 183
8.3 A description of the key elements of the third model and tool ................... 184 8.3.1 Project teams, primarily for the research, development and implementation of sociotechnical systems and products .......................................................................... 186 8.3.2 Organised action teams - crews of sociotechnical systems ........................... 189
8.4 A description of the methodology and tool operation ................................. 191 8.4.1 Profiling the team .......................................................................................... 192 8.4.2 Profiling the mission ...................................................................................... 192 8.4.3 Mapping the mission profile into a cultural profile and deriving discrepancies193 8.4.4 Interpreting the results ................................................................................... 194
8.5 Validation and user evaluation of the third prototype tool .......................... 196 8.5.1 Initial testing and validation ........................................................................... 196 8.5.2 User testing and evaluation of the third team culture tool (TCT3) .................. 200
8.6 Limitations to the tool ................................................................................. 202 8.6.1 Scoping limitations ........................................................................................ 202 8.6.2 Data availability ............................................................................................. 203 8.6.3 A re-examination of the underpinning assumptions of the TCT3 ................... 203
8.7 Summary of the third model and team culture tool .................................... 205
9 DISCUSSION AND ANALYSIS ........................................................................ 207
9.1 Introduction ................................................................................................ 207
9.2 A brief overview of the research activities ................................................. 207
viii
9.3 A critical analysis of the research .............................................................. 210 9.3.1 The research/creativity/invention/innovation/improvement conundrum .......... 210 9.3.2 The representational accuracy of Hofstede’s and others’ cultural frameworks 212 9.3.3 The choice of ‘cultural profile discrepancies’ as the basis for prediction of team performances .............................................................................................................. 214 9.3.4 Task classifications ....................................................................................... 215 9.3.5 Implications of the critical analysis for the validity of the initial assumptions .. 216
9.4 What could have been done differently with hindsight? ............................. 217
9.5 Meeting the research aims and objectives ................................................ 218
9.6 Contributions to knowledge and novel outputs .......................................... 220
9.7 What questions can we now ask (that we couldn’t get an answer to before)? 221
9.8 Meeting the requirements of the (primary) stakeholders ........................... 222
9.9 Further work .............................................................................................. 223
10 CONCLUSIONS AND RECOMMENDATIONS FOR FURTHER WORK .......... 226
10.1 Introduction ............................................................................................ 226
10.2 Meeting the aims and objectives of the research ................................... 226
10.3 Summary of research findings and contribution to knowledge ............... 227
10.4 Further work ........................................................................................... 228
10.5 Exploitation of the tool ............................................................................ 229
REFERENCES ....................................................................................................... 230
APPENDICES ........................................................................................................ 252
APPENDIX 1: THE LITERATURE REVIEW – ADDITIONAL INFORMATION ... 253
APPENDIX 1A: Literature review resources and search engines ..................... 253
APPENDIX 1B: Keywords and their synonyms................................................. 258
APPENDIX 1C: Main literature sources cited in this thesis ............................... 260
APPENDIX 1D Evidence of the effects of culture on external aspects of team performance (expansion of Subsection 3.3.1) ..................................................... 263
APPENDIX 1E Tools that are available to evaluate ‘other culture’ teams and multicultural teams (expansion of Section 3.4) .................................................... 292
A1E.1 Methods, models and tools for the prediction of team performance or allocation of tasks based on national culture ............................................................................... 292 A1E.2 Cultural frameworks ...................................................................................... 296 A1E.3 Measures of team cultural diversity ............................................................... 309 A1E.4 Team and task classifications ........................................................................ 310
APPENDIX 2: ANECDOTAL – INTERVIEWS AND PERSONAL CONVERSATIONS ........................................................................................... 314
APPENDIX 3: ON-LINE CULTURE SURVEY FORM ......................................... 320
ix
APPENDIX 4: DETAILED STATISTICAL RESULTS.......................................... 322
Appendix 4A: Loughborough 2nd year student group data ................................. 322
Appendix 4B: UK physics & astronomy department RAE2008 data .................. 323
Appendix 4C: UK chemical engineering department RAE2008 data ................. 324
Appendix 4D: UK English Premiership football match performance data........... 325
Appendix 4E: UK English Premiership football team performance data............. 326
Appendix 4F: Aircraft accident data (accidents per million flights) ..................... 327
Appendix 4G: Aircraft accident data (FLE per million flights) ............................. 328
Appendix 4H: Maritime fatality rate data (per 100k seafarer years) ................... 329
Appendix 4I: Aircraft automation preferences .................................................... 330
APPENDIX 5: TEST DATA - AIRCRAFT ACCIDENTS AND ISSUES ............... 338
APPENDIX 6: TCT2 QUESTIONNAIRE/SURVEY FORM .................................. 341
APPENDIX 7: TEAM QUESTIONNAIRE/SURVEY FORM ................................. 342
APPENDIX 8: TCT3 QUESTIONNAIRE/SURVEY FORM .................................. 343
APPENDIX 9: GENERATING THE EXEMPLARS FOR THE TCT3 ................... 344
APPENDIX 10: HOFSTEDE’S FIFTH AND SIXTH DIMENSIONS ...................... 345
x
LIST OF FIGURES Figure 1-1: Thesis organisation ............................................................................................ 9 Figure 2-1: Study design ......................................................................................................17 Figure 3-1: The three-stage literature review process of Levy & Ellis ...................................22 Figure 3-2: Estimate of optimum culture values for innovation teams from the literature review ...................................................................................................................................36 Figure 3-3: A potential 3-D framework .................................................................................37 Figure 3-4: Relationships between culture dimension scores and sociotechnical team performance under stress .....................................................................................................62 Figure 3-5: A generic flow diagram of a potential method or tool for predicting team performance based on culture ..............................................................................................63 Figure 4-1: Cultural distance or separation ..........................................................................98 Figure 4-2: Fragmentation into subgroups ......................................................................... 101 Figure 4-3: Idealised process of mapping missions or tasks from task/mission space to culture space (due to representational difficulties, only three dimensions are shown for each ‘space’) ............................................................................................................................... 110 Figure 6-1: The underlying culture/mission model for the TCT1 ......................................... 142 Figure 6-2: The Excel implementation of the first prototype culture tool (TCT1) ................. 144 Figure 7-1: Flow diagram illustrating the model underlying the second team culture tool (TCT2) ................................................................................................................................ 156 Figure 7-2: Culture/innovation relationships deduced from the literature and pilot studies . 160 Figure 7-3: Example TCT2 cultural profiler output .............................................................. 165 Figure 7-4: Example task/mission profiler user input (in the pale blue areas only) ............. 167 Figure 7-5: Team cultural discrepancy table ...................................................................... 168 Figure 7-6: The four key tables of the second team culture tool (TCT2) and their relationships ....................................................................................................................... 170 Figure 7-7: Process and flow diagram for the second team culture tool (TCT2) ................. 171 Figure 7-8: Validation of TCT2 via aircraft incident data .................................................... 173 Figure 8-1: The underlying basis for the third model and culture tool (TCT3) ..................... 182 Figure 8-2: Flow diagram illustrating the model for the third team culture tool (TCT3) ....... 183 Figure 8-3: Culture/innovation relationships deduced from the literature and pilot studies . 187 Figure 8-4: Culture/social complexity relationship deduced from the literature and pilot studies ................................................................................................................................ 188 Figure 8-5: Culture/response time relationships for sociotechnical systems (deduced from the literature and pilot studies) ............................................................................................ 190 Figure 8-6: Profiling the mission by locating it on the grid – eng’g/mgmt. project teams..... 192 Figure 8-7: Profiling the mission by locating it on the grid – organised action teams .......... 193 Figure 8-8: The result of a mapping from mission to desirable cultural profile .................... 194 Figure 8-9: Radar diagram showing an overview of cultural fit ........................................... 195 Figure 8-10: Applying the tool to a project team - note the discrepancy scores (TCT3 Table 1) ........................................................................................................................................ 196 Figure 8-11: Evaluation of TCT3 organised action team option via aircraft incident data (TCT2 results for the same data greyed out) ...................................................................... 198 Figure 8-12: Evaluation of TCT3 via data provided by industrial managers and aircraft pilot ........................................................................................................................................... 199 Figure 8-13: The basis for calculating teaming ability (the first six items in the above list) . 199
xi
LIST OF TABLES Table 3-1: Summary of study results – work team creativity and innovation .........................34 Table 3-2: Summary of study results – student groups .........................................................40 Table 3-3: Summary of study results – safety-critical sociotechnical systems .......................47 Table 3-4: Average cultural dimension scores of non-German Bundesliga players ..............48 Table 3-5: Summary of study results – team sport ................................................................49 Table 3-6: A comparison of national cultural dimensions, orientations and syndromes ........70 Table 3-7: A comparison of organisational cultural dimensions, orientations and syndromes .............................................................................................................................................72 Table 4-1: Power distance (PDI) – expectations and behaviour ...........................................90 Table 4-2: Individualism (IDV) - expectations and behaviour ...............................................91 Table 4-3: Masculinity (MAS) - expectations and behaviour ................................................91 Table 4-4: Uncertainty avoidance (UAI) - expectations and behaviour .................................92 Table 4-5: Some differences between UK and USA cultures ................................................93 Table 4-6: Differences between culture scores of selected countries based on the default values of Hofstede’s framework ............................................................................................94 Table 4-7: Example data and results based on the proposed diversity expression ............ 100 Table 4-8: The effect of team size on maximum diversity scores ....................................... 100 Table 5-1: Student group data - summary of statistical analysis ........................................ 119 Table 5-2: Relative contributions of cultural dimensions to student group performance ..... 119 Table 5-3: University RAE2008 (physics & astronomy) – final regression model (with two independent variables) ....................................................................................................... 120 Table 5-4: Relative contributions of cultural dimensions to university RAE2008 (P&A) ...... 120 Table 5-5: University RAE2008 (chemical engineering) – final regression model .............. 121 Table 5-6: Relative contributions of cultural dimensions to university RAE2008 (CE) ........ 121 Table 5-7: English Football Premiership match performance (combined defence and attack) – regression model ............................................................................................................. 123 Table 5-8: Relative contributions of cultural dimensions to English Premiership match performances ..................................................................................................................... 124 Table 5-9: English Football Premiership team performance over the season (combined defence and attack) – regression model ............................................................................. 124 Table 5-10 Relative contributions of cultural dimensions to English Premiership team performances ..................................................................................................................... 125 Table 5-11: Airline accidents per million flights - key statistical factors in regression model ........................................................................................................................................... 126 Table 5-12: Airline full loss equivalent per million flights - key statistical factors in regression model ................................................................................................................................. 126 Table 5-13: Relative contributions of cultural dimensions to aircraft accident/FLE rates .... 127 Table 5-14: Maritime seafarer fatality rates - key statistical factors in regression model .... 127 Table 5-15: Relative contributions of cultural dimensions to maritime seafarer fatality rates ........................................................................................................................................... 128 Table 5-16: Automation preference results (based on Sherman et al. (1997)) ................... 129 Table 5-17: Low scores utilised for cultural dimensions ..................................................... 136 Table 5-18: High scores utilised for cultural dimensions .................................................... 137 Table 5-19: Cultural dimension relative weightings for creativity/innovation (from the literature) ............................................................................................................................ 138 Table 5-20: Cultural dimension relative weightings (from the author's studies) .................. 139 Table 6-1: 1st prototype team culture profiler output .......................................................... 145 Table 6-2: Relative culture dimension predictive powers for innovation ............................. 147 Table 7-1: Incident data for commercial passenger aircraft ................................................ 172 Table 7-2: User and case numbers.................................................................................... 174 Table 7-3: Summary of TCT2 user questionnaire answers ................................................ 174 Table 8-1: Data set for evaluation of action team option of TCT3 ...................................... 197
xii
Table 8-2: User and case numbers.................................................................................... 201 Table 8-3: Summary of TCT3 user questionnaire answers ................................................ 201
xiii
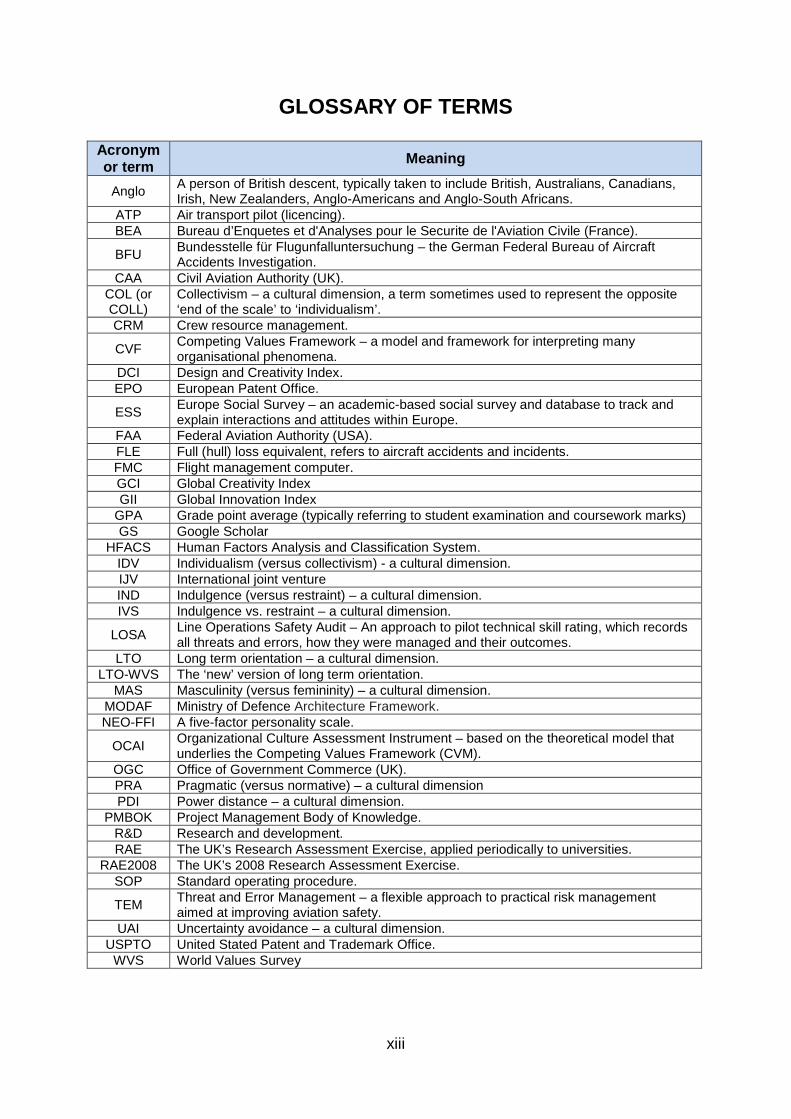
GLOSSARY OF TERMS Acronym or term Meaning
Anglo A person of British descent, typically taken to include British, Australians, Canadians, Irish, New Zealanders, Anglo-Americans and Anglo-South Africans.
ATP Air transport pilot (licencing). BEA Bureau d’Enquetes et d'Analyses pour le Securite de l'Aviation Civile (France).
BFU Bundesstelle für Flugunfalluntersuchung – the German Federal Bureau of Aircraft Accidents Investigation.
CAA Civil Aviation Authority (UK). COL (or COLL)
Collectivism – a cultural dimension, a term sometimes used to represent the opposite ‘end of the scale’ to ‘individualism’.
CRM Crew resource management.
CVF Competing Values Framework – a model and framework for interpreting many organisational phenomena.
DCI Design and Creativity Index. EPO European Patent Office.
ESS Europe Social Survey – an academic-based social survey and database to track and explain interactions and attitudes within Europe.
FAA Federal Aviation Authority (USA). FLE Full (hull) loss equivalent, refers to aircraft accidents and incidents. FMC Flight management computer. GCI Global Creativity Index GII Global Innovation Index
GPA Grade point average (typically referring to student examination and coursework marks) GS Google Scholar
HFACS Human Factors Analysis and Classification System. IDV Individualism (versus collectivism) - a cultural dimension. IJV International joint venture IND Indulgence (versus restraint) – a cultural dimension. IVS Indulgence vs. restraint – a cultural dimension.
LOSA Line Operations Safety Audit – An approach to pilot technical skill rating, which records all threats and errors, how they were managed and their outcomes.
LTO Long term orientation – a cultural dimension. LTO-WVS The ‘new’ version of long term orientation.
MAS Masculinity (versus femininity) – a cultural dimension. MODAF Ministry of Defence Architecture Framework. NEO-FFI A five-factor personality scale.
OCAI Organizational Culture Assessment Instrument – based on the theoretical model that underlies the Competing Values Framework (CVM).
OGC Office of Government Commerce (UK). PRA Pragmatic (versus normative) – a cultural dimension PDI Power distance – a cultural dimension.
PMBOK Project Management Body of Knowledge. R&D Research and development. RAE The UK’s Research Assessment Exercise, applied periodically to universities.
RAE2008 The UK’s 2008 Research Assessment Exercise. SOP Standard operating procedure.
TEM Threat and Error Management – a flexible approach to practical risk management aimed at improving aviation safety.
UAI Uncertainty avoidance – a cultural dimension. USPTO United Stated Patent and Trademark Office.
WVS World Values Survey
1
1 Introduction
1.1 Overview
Multinational companies design and produce complex sociotechnical systems (large
transport aircraft, ships, nuclear power plants, oil refineries, etc.) that are utilised and/or
installed round the World. As such companies grow, they acquire subsidiaries in increasingly
diverse regions, and these subsidiaries become increasingly viable options for research,
development, product design and manufacture.
The area of particular interest for the work of thesis relates to the interplay of cultures.
Engineers and designers are products of their cultures - their approaches to research,
development, design and manufacture are culture-bound, and they build their cultural
assumptions into their products, systems and procedures. Users of sociotechnical systems
are similarly culture-bound and, therefore, culture-related problems can occur when designer
and operator cultures differ.
Teams, in particular project teams, are increasingly being utilised to develop sociotechnical
systems and their sub-systems. In Europe and in Anglo1 countries, such teams are often
multicultural due, in particular, to the influx of foreign graduate engineers and scientists.
Elsewhere, project teams are often created at subsidiaries by multinational companies and
may be of a single culture (or dominant culture) that is different to that of the companies’
base countries. Sociotechnical systems are, in turn, operated by organised action teams
such as aircrews or refinery crews who are typically (but not always) nationals of the
countries where or from which they operate.
Although there now exists a large amount of practical experience and theoretical under-
standing of teams, much of this body of knowledge relates to North European and Anglo
teams, and has been amassed by researchers and practitioners from within those cultures;
as a result, many of the tacit assumptions behind this body of knowledge are culture-bound.
Although Anglo and North European companies began to use multicultural teams (and
different culture teams via their subsidiaries) increasingly widely in the 1980s, the effects of
1 Anglo refers to people of British descent, e.g. British, Irish, Canadian, Anglo-American, New Zealander, Australian and Anglo-South African.
2
differing cultures on team performance were not well understood, and early experiences of
different-culture teams and multicultural teams were not very positive. For managers, the
development of multicultural teams, in particular, has been fraught with problems (Wolf,
2002) and the performance outcomes have been discouraging (Hambrick, Davison, Snell, &
Snow, 1998).
Note that the terms ‘multicultural’ and ‘multinational’ are not synonymous. There are single
nationality teams (e.g. comprising USA Hispanics and USA Anglos) whose members have
significantly different ethnic cultures; there are multinational teams (e.g. comprising Belgians
and French) whose members have very similar ethnic cultures. In addition, cultural
misunderstandings and conflicts in many team-based projects have arisen from differing
organisational and professional cultures, rather than differing ethnic cultures.
The work described in this report was centred on teams (single- or multicultural) and the
effects of cultural differences – whether internal or external to the team, i.e. whether these
differences were associated with other individuals in the team or were built into the systems
that the team members utilised. The primary aims of the research were to gain an under-
standing of the culture-related factors that influenced the effectiveness of single- and multi-
cultural teams, and to develop a methodology and tool that could assist managers to predict
the effects of culture on existing and proposed teams, and that could also function as part of
an educational suite on teams and team working.
1.2 Background
1.2.1 The increasing importance of ‘other culture’ teams and multicultural teams
Technically advanced companies have faced higher competition and an accelerating pace of
change over the last few decades, and have increasingly adopted team-based approaches to
task execution and problem solving. Originally, these work teams were typically homogen-
eous, single-cultural and, as experience and analysis brought a better understanding of the
dynamics of such teams, they proved increasingly useful for bringing a sharp focus to bear
on important or urgent tasks and problems. However, these single-culture work teams have
been increasingly replaced by multicultural and ‘other culture’ work teams, and this trend
shows no sign of abating, particularly in the UK. Some of the key factors contributing to the
increasing incidence of multicultural work teams in the UK are listed below:
• The annual output from the UK’s universities, of engineers and scientists who choose
to enter engineering/science-related occupations, has been in decline for more than a
3
decade; this has necessitated the recruitment of foreign engineers and scientists to fill
the indigenous gap between the supply of graduates and industrial requirements.
• The huge costs associated with bringing new high technology products to market
have resulted in an increasing trend towards major international joint ventures aimed
at the global market, for example between international vehicle manufacturers; this
necessitates the utilisation of multinational, multicultural teams.
• Global companies are increasingly choosing to place research and development
operations at foreign subsidiaries due to differential skills, costs and subsidies.
Similar factors apply in most Western European countries, and in other Anglo countries.
Therefore the utilisation of ‘other culture’ teams and multicultural teams is becoming the
norm, rather than the exception for multinational companies.
1.2.2 ‘Other culture’ teams and multicultural teams - problem areas
Individuals and groups are heavily ‘programmed’ by their cultures (based on a combination of
ethnic, organisational and professional cultural backgrounds). Culture affects values,
attitudes, expectations, interaction styles, signals, behaviours and emotions. Therefore,
when individuals of two or more cultures meet, or even when they interact remotely, their
differing actions, signals, etc., tend to be misinterpreted to negative effect, unless there are
joint understandings of their cultural differences and effective means of addressing these
differences.
It has become increasingly clear that the nature of interactions between individuals of
different cultures is more complex than those between individuals that share the same or a
similar culture; assumptions that are taken for granted by members of single-culture teams
are no longer valid, and team members cannot rely on informal processes to come into play
to enable a team ethos to form. Snow et al. (1996) carried out a two-year study of multi-
cultural teams at thirteen companies; they came to the conclusion that a precondition for
multicultural team effectiveness was the development of clear processes for communicating,
for decision-making and for handling conflicts and disagreements . In the absence of
adequate measures to remedy or ameliorate such problems, multicultural teams typically
underperformed when compared to single-culture teams, despite the wider range of
experience that they could often bring to tasks and projects. However, where effective
integration was achieved within multicultural teams, they could perform as well as, and in
some cases better than, single-culture teams; in particular, their wider range of thinking
styles could result in higher creativity and innovation, improved decisions and higher
4
performance (DiStefano & Maznevski, 2000; Earley & Gibson, 2002).
Our limited understandings applied not only multicultural teams, but also to ‘other culture’
teams (teams with members of a culture different to ours). Complex sociotechnical systems
exported from the West were typically crewed or operated by ‘other culture’ teams, i.e. teams
of different national culture to those that designed the systems. In addition, research &
development work has been increasingly delegated to foreign subsidiaries, to be carried out
by ‘other culture’ teams.
Theories of motivation and teaming that were developed in the West (in particular in the
Anglo countries) contained cultural assumptions that were not universal. For example,
Maslow’s hierarchy of needs (Maslow 1943; Maslow 1997, Ch. 5) placed self-actualisation at
the top of the hierarchy, whereas group actualisation would be more important for the
collectivistic majority in the World. The second element of Tuckman’s forming, storming,
norming, performing model of team development (Tuckman & Jensen, 1977) would not be
acceptable in collectivistic cultures due to the risks of loss of face. Some of Belbin’s team
roles (R M Belbin, 1993) would have been difficult to fill, or even unacceptable in collectivistic
societies, for example the shaper role, which included arguing, disagreeing and displaying
aggression in the pursuit of goals.
1.2.3 Sociotechnical systems – problem areas
As stated earlier, cultural mismatches between complex sociotechnical systems and their
operators occurred due to the cultural assumptions that designers built into their complex
systems and standard operating procedures. Designers’ default assumptions were typically
that the system operators would behave similarly (i.e. have the same cultural values) as
them. These assumptions resulted in degraded operational effectiveness and reduced
safety.
1.3 Initial assumptions
The initial assumptions included the following:
• The cultural properties (i.e. ‘cultural profiles’) of teams could be usefully modelled2 by
quantifying team member cultural values along a limited number of ‘cultural
dimensions’.
2 In this context, ‘usefully modelled’ implied that the cultural profiles captured the differences between teams that influenced relative team performance.
5
• The tasks that teams performed3 (i.e. their task profiles) could be modelled in terms
of factors that were directly affected by team culture.
• Relationships between culture dimension scores and the performance of task factors
could be established.
• Models that incorporated team cultural profiles and task profiles could be used to
predict the effect of team culture on team performance.
One or more of the above initial assumptions could have been shown to be false in the
literature review or subsequent data collection exercises; in this case, the programme of
research would have been adapted to account for this.
1.4 Aims and objectives of the research
The primary aims of the research were to develop an improved understanding of the cultural
factors that influenced the effectiveness of teams, and to create a methodology and toolset
for the evaluation of project teams and sociotechnical system operators and crews.
The associated objectives were as follows:
• To identify the culturally-related factors that contributed most to variances in team
performances.
• To identify a task classification relevant to culturally-moderated team performance
• To build a model that incorporated the above factors for the prediction of the effects
of culture on team performance when tackling specified types of task.
• To develop tools that encompassed the above model in order to:
o Facilitate the creation of successful work teams in given situations.
o Enable the prediction of the effects of culture on team performance, and likely
success or failure, of existing or proposed teams.
1.5 Main contribution to knowledge
The main contribution to knowledge was intended be a cultural theory of work team
performance and a validated, quantitative methodology and tool that would enable the
culturally-based assessment and improvement of teams.
3 Many complex sociotechnical systems are highly automated and, for most of the time, crews are acting as monitors rather than operators. To be useful, a task/mission model must capture the functionalities and capabilities required at critical times, e.g. when performing complex tasks or dealing with emergencies.
6
1.6 Stakeholders and potential users The main stakeholders and potential users of the outputs of the research were considered to be:
• Organizations that designed or built complex sociotechnical systems
• Organisations that utilised complex sociotechnical systems
• Organizations that utilised multicultural (or different culture) teams for project and
problem-solving work
• Education and training organisations
1.7 Scope and boundaries of the work
1.7.1 Culture
The primary area of focus for the research described in this thesis was that of culture and its
effects on teams, products and systems. Personality, leadership, qualifications, training,
experience, age, health and many other factors impinge on the performance of teams; where
beneficial to the research, the effects of these additional factors was to be explored to a
limited degree, inasmuch as they affected an individual’s and team’s culture.
The research was not primarily concerned with the technical skill sets required to complete
specific tasks.
1.7.2 Team types
A further limitation to the scope of the research related to the types of team under consider-
ation. The primary focus of the research was on formal work teams, not informal or ad-hoc
groups; such work teams:
• Were formally created for one or more purposes,
• Existed within a work environment, and
• Either:
o Included individuals who were involved in activities that could be associated
with the creation of sociotechnical systems or products (e.g. research,
development, design, planning, manufacture),
o Included individuals that were operating sociotechnical systems (e.g. crewing
aircraft or power plants)
7
1.7.3 Tasks
The research was not concerned with analysing and categorising tasks other than from the
point of view of the constraints and demands that they placed on culture-moderated aspects
of team organisation, communication and performance.
1.8 Background to the research methodology
Most of the articles and books covering multicultural and ‘other culture’ teams were
anecdotal and qualitative. In contrast, the development of predictive cultural models required
a quantitative, statistical approach. Coverage of the topics proposed in this thesis therefore
required a mixed methods research approach, i.e. combining the (largely) inductive
reasoning of qualitative methods and the (largely) deductive reasoning of quantitative
methods; this resulted in the inductive-deductive research cycle.
It was important that the outputs of the research had potential applicability and, to that end, a
compromise between explanatory power and usability was required. The researcher there-
fore adopted the approach known as dialectical pragmatism, where the value of a theory was
judged on the basis of its ‘workability’, i.e. its applicability and predictive power:
“Theories are viewed instrumentally (they are “true” to differing degrees based on how well
they currently work; workability is judged especially on the criteria of predictability and
applicability).”
The research methodology is described in more detail in Chapter 2.
1.9 Structure of this report
This chapter (Chapter1) provides an introduction to the problem area, general research
hypothesis, aims and objectives, scope and research methodology. Chapter 2 discusses the
problem area and research methodology in more detail, introduces the proposed problem
solution in terms of theories, methodologies and software-based tools and lists the main
areas to be studied in the literature review of Chapter 3.
Chapter 3 explores the current state of knowledge and opinion about the effects of national
culture on teams, the tools that are available to evaluate and predict the performance of such
teams, and the empirical evidence that is available to support such tools.
Chapter 4 describes research decisions that were based on the literature review of Chapter
8
3. A specific cultural framework was selected as the basis for data collection, analysis and
tool-building, and a measure of cultural diversity was defined. A detailed set of culture-
affected team/task/mission factors was described, and a set of task/mission dimensions was
also proposed as an alternative basis for the quantitative description of team tasks. Three
research questions relating to specific cultural factors were also asked in Chapter 4, because
qualitative and quantitative studies in the literature relating to the effects of these cultural
factors had been found to be limited and contradictory.
Chapter 5 describes the collection of statistical data from the literature, the collection of
anecdotal information via questionnaire and interview, and the generation of statistical data
by the author from pilot studies; this data was combined and utilised for the evaluation of the
research questions of Chapter 4 and for the development of models of culture/task-perfor-
mance relationships that would be utilised by the team culture tools described in later
chapters.
Chapter 6 describes a first team culture model and tool that utilised the team cultural profile
to predict, directly, the team culture-related performance for a limited range of team and task
types. Chapter 7 describes a second version of the model and tool that took account of the
issues and limitations that were revealed during the evaluation of the first model. This
second model and tool used an extended team cultural profile and a task profile based on
the set of detailed team/task/mission factors developed in Chapter 4. The second model and
tool used a different approach to prediction to that of the first model and tool; prediction was
based on the discrepancies between the actual team cultural profile and a ‘desirable cultural
profile’ generated from the task profile. Chapter 8 describes the third and final version of the
model and tool. The third model and tool utilised the team cultural profile of the second
model, but utilised a different, dimension-based approach for mission representation; this
was, in part, because users had found this aspect of the second model to be problematic.
Chapter 9 presents an overview of the work and a discussion and analysis of the research
results, models and tools; Chapter 10 offers conclusions and recommendations for further
work.
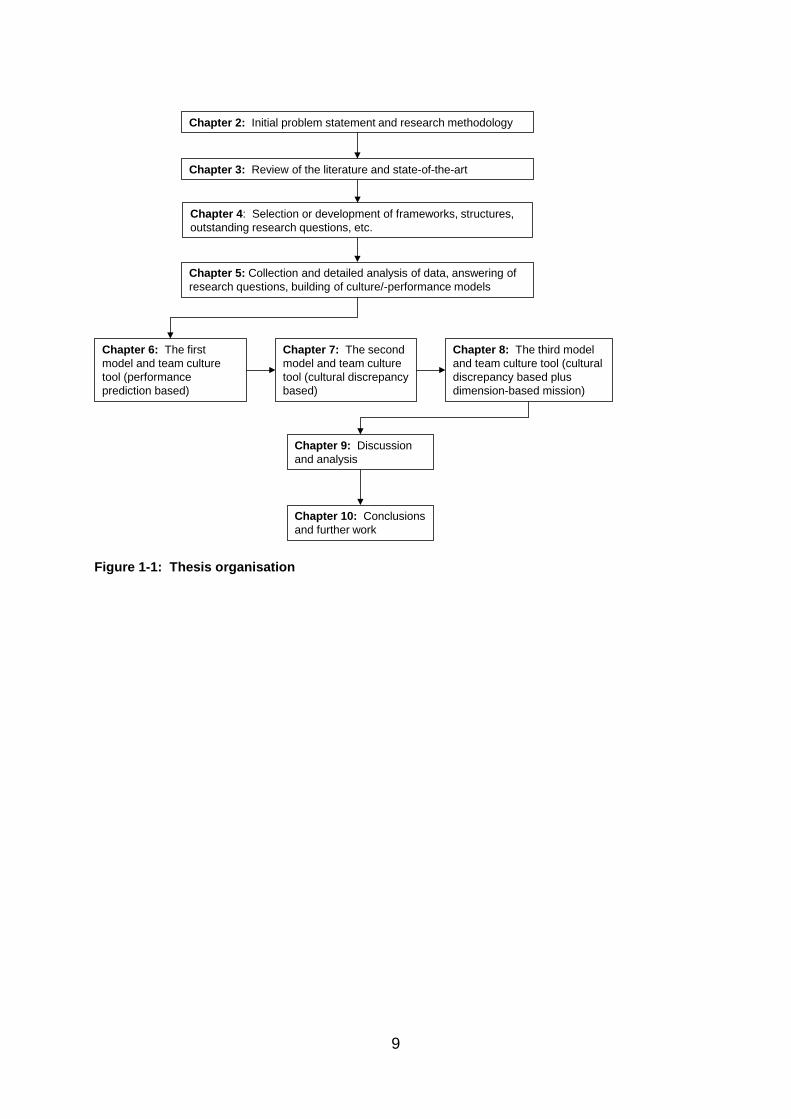
Figure 1-1 presents an overview of the thesis structure and contents.
9
Figure 1-1: Thesis organisation
Chapter 3: Review of the literature and state-of-the-art
Chapter 5: Collection and detailed analysis of data, answering of research questions, building of culture/-performance models
Chapter 4: Selection or development of frameworks, structures, outstanding research questions, etc.
Chapter 6: The first model and team culture tool (performance prediction based)
Chapter 8: The third model and team culture tool (cultural discrepancy based plus dimension-based mission)
Chapter 7: The second model and team culture tool (cultural discrepancy based)
Chapter 10: Conclusions and further work
Chapter 9: Discussion and analysis
Chapter 2: Initial problem statement and research methodology
10
2 General problem statement and research methodology
2.1 Introduction
The purpose of this chapter is to define the problem area, problem statement (in detail) and
research questions, to describe the proposed research methodology and to detail the
solution approach. This includes the boundaries of the literature review, the selection or
development of research tools, the collection and analysis of data from the literature, from
interviews and from the author’s pilot studies, and the building and evaluation of culture-
based performance prediction models and tools.
2.2 The problem area
2.2.1 Background
All humans are products of the cultures in which they are immersed; culture heavily colours
what people perceive (particularly in social situations), how they interpret what they perceive,
how they react to it and how they behave towards each other. The products and systems of
various cultures are increasingly exported to customers of different cultures, and people of
differing cultures now intermix and collaborate more than ever before. Therefore, issues
arising from differing culturally-based world views are impinging on a wide range of
organisations, for example:
• Companies exporting complex sociotechnical systems to other parts of the World: Such systems include oil refineries, power generation systems and
commercial transport aircraft. As systems have become more complex, formal
systems modelling methods have improved; however, these methods primarily
capture the specification and design of the technical subsystems; the human
components of such systems are captured in much less detail, and cultural aspects
are not formally captured at all. To compound the problem, cultural assumptions are
unconsciously built into sociotechnical systems; these assumptions lead to reduced
performance and safety when such systems are exported to culturally-distant
countries (see next paragraph).
11
• Operators (or crews) of complex sociotechnical systems: Cultural differences
between designers and operators of complex sociotechnical systems with regard to
communication, handling uncertainty, prioritising and decision-making result in
differing safety performances in the operation of complex sociotechnical systems;
these differences can be seen, for example, in the safety records of national airlines.
An improved understanding of the effects of cultural traits on the factors that contribute to
performance and safety would enable system designers, planners and implementers to take
account of culture in system design, standard operating instructions, training, etc.
2.2.2 An initial problem statement
For several decades, multinational companies have been outsourcing a growing proportion
of their research and development (R&D) activities to foreign subsidiaries; international joint
ventures have also become more common over this period, for example to develop new
multi-company vehicle platforms. Such companies have faced increasing choices when
placing a new R&D project. It has become clear that different countries (with differing
national cultures) tend to offer differing strengths that fit better with particular types of R&D
than others. In addition, many teams have become internally more diverse, thus introducing
further complexities. The R&D location decision has become more complicated.
A further issue relates to the safe and effective operation of complex systems. Although
accidents involving safety-critical sociotechnical systems have occurred infrequently, they
have typically been associated with high costs in terms of loss of life and destruction of
resources. Worldwide, approximately seventy percent of sociotechnical system failures have
been assigned to human error (Hollywell 1996; Amalberti 2001); however there have been
clear differences in the error rates (and the corresponding accident rates) of operators of
different nationalities. In particular, the accident rates amongst operators of similar cultures
to those of the (typically European or North American) original system designers have tended
to be low, whereas the accident rates amongst those of significantly different cultures have
been much higher. Although there are methodologies and tools to aid in the specification
and design of the technical aspects of complex systems and systems-of-systems, there are
no equivalent methodologies or tools to aid in the specification or definition of the cultural and
social aspects of these systems; as a result, designers have unwittingly built their own
cultural assumptions into such systems. Evidence is presented in the literature review of
significant variations in accident rates amongst users of different cultural backgrounds.
The problems of particular interest to the author are detailed in the following subsections.
12
The research has therefore covered these areas, but has not been limited to them because,
in order to develop models of the relationships between team member cultural traits and
team performance, it has been necessary to utilise data from a wide variety of team types.
a) The project team, including the sociotechnical system design team
The primary focus of interest was the effect of team member culture on the ability of the team
to achieve a satisfactory level of performance.
Performance-limiting problems that could arise in single-culture teams (depending on the
ethnic, professional and organizational cultures of the team) included:
• Reluctance to suggest or support new ideas
• Excessive consensus-seeking (“groupthink”)
• Low creativity
Additional problems that could arise in multicultural teams included:
• Poor communication, misunderstandings and conflict
• Fragmentation and social loafing
• Poor decision-making
A multinational company might have many national branches that have the resources
(human, physical, organisational) required for product design. However, differing cultural
backgrounds could result in different branches performing better at specific stages of
research and development processes, such as ‘blue-skies’ research, focused research, new
system/product development, product mid-term upgrade or detailed process improvement.
b) The sociotechnical system operator team or crew
The primary focus of interest was the potential mismatch between system designers’ default
cultural assumptions about system operators and the cultural reality.
Problems arising from this included:
• Inadequate representations (or specifications) of the operators of socio-technical systems: As a result, unanticipated problems could arise during
operation, including those that increased the risk of catastrophic failure.
• Unrecognised cultural assumptions built into products and systems: These
assumptions related not only to the physical equipment and software of the product or
13
system, but also to the associated standard operating procedures, training and
support systems. As a result, users who were culturally distant from system builders
operated such systems and products less effectively and also suffered higher
accident and failure rates.
2.2.3 The primary stakeholders
It was important, in defining the problem area and scope, to consider the primary stake-
holders (listed below); this encouraged a more focused approach.
• Organisations that designed or built complex sociotechnical systems: It was
important that the designers and engineers (in particular systems engineers) of such
organisations were aware of their own cultural traits, and that they were enabled to
specify the cultural traits of the system users, and to take these traits into account in
their systems.
• Organisations that utilised complex sociotechnical systems: These would be
interested in the effects of culture on the training requirements, safety and
performances of their operators or crew
• Organisations that utilised different culture or multicultural teams for project or problem-solving work: These organisations (which could also be the sociotechnical
system designers of the first point, above), would have an interest in the effects that
team culture had on creativity, decision-making, etc.
• Education and training organisations: Many of these organisations had a respon-
sibility to impart team-working experience and training to their students. Most Anglo
and European university engineering undergraduate courses included at least one
team-based project during the students’ second and third years. These teams were
often culturally mixed, therefore an introduction to culture and a hands-on investi-
gation of its effects, via the tools that form an output of this research, would help
students to understand, respect and take advantage of cultural differences.
In particular, it was intended that outputs from the proposed research should provide
assistance or guidance in two ways:
• Enabling engineers to take into account the effects of user (operator, crew) culture on
the performance of their systems, when specifying and designing those systems.
• Enabling managers to compose or select single-culture or multicultural systems/-
product design teams that could potentially deliver the best results; this might be at
the level of assembling a new team at a particular location, assembling a virtual team
14
distributed across the globe, or assigning work to an existing team based at one of
many locations across the globe.
2.3 Purpose statement, research questions and delimitations
2.3.1 Purpose statement
Based on the problem descriptions of the previous subsections, the purpose statement was
as follows:
The purpose of this research is to investigate relationships between team cultural
traits and team performances for teams associated with the design and operation of
sociotechnical systems, and to capture those relationships in a methodology or tool to
assist in the design and operation of sociotechnical systems.
2.3.2 Research question
The associated research question was stated as:
Is it feasible to predict, to a practicable degree, the performances of teams involved in
the design or operation of sociotechnical systems, on the basis of those teams’
members’ national cultures?
2.3.3 Research sub-questions
The above research question provided three sub-questions, to form the basis of the literature
review and subsequent research activities:
1. What do we know about ‘different culture’ and multicultural teams?
2. What tools are available to evaluate them?
3. What empirical evidence is available about the validity of such tools?
2.3.4 Delimitations of scope
The proposed research and tool took account of situations where no information was
available about the individuals who would make up a team, other than their likely national
cultures and, perhaps, their educational attainments. Therefore, factors associated with
individual team members’ personalities, their experiences and skills would not be
15
investigated. As a result the following topics were not, in themselves, of interest4:
• Cultural/intercultural competence and the associated measurement tools and
methods.
• Individual team member personalities and their effects on team performance.
• The effects of informed leadership on team performance (e.g. inter-culturally
competent team leaders).
In addition, when designing complex sociotechnical systems, it was unlikely that detailed
information on the organisational and safety cultures of user organisations would be
available; therefore, the following topics were not of primary interest5:
• Safety culture and the associated measurement/assessment tools and methods.
• Organisational culture and the associated measurement/assessment tools and
methods.
2.4 Research methodology
Many of the most relevant articles retrieved during the literature review described in this
thesis, including those on team or crew attitudes to automation in complex sociotechnical
systems and those on the efficacy and effectiveness of multicultural teams, were found to be
highly anecdotal and qualitative in nature. Other articles, for example many of those that
examined cultural traits, were quantitative in their approach. In addition to this reliance on
both qualitative and quantitative research sources, the work described in this thesis also
relied on qualitative and quantitative methods in order to collect evidence, to develop and
evaluate hypotheses and to create demonstration tools.
The main implication of the findings described in the above paragraph was the necessity to
apply a mixed method research approach, as described in Teddlie & Tashakkori (2009).
As described earlier in this thesis, the issues and problems associated with multicultural and
‘different culture’ teams had important consequences for many organizations. It was there-
fore important that the theories and tools that arose out of this work could offer practical
predictions or guidance with regard to the conduct and performance of multicultural teams.
The culture-moderated interactions between operators and their sociotechnical systems were 4 Except where the associated methods or tools could be adapted to the prediction or assessment of the effects of national culture on relevant aspects of team performance. 5 As above.
16
highly complex, as were the internal interactions of multicultural teams and groups; a very
wide range of qualitative and quantitative factors could be considered (and had been
considered elsewhere) as candidates for new theories of culture-moderated team perfor-
mance. Although it would have been very valuable to develop a theory that was highly
explanatory, there was little benefit in developing a toolset that incorporated so many factors
that it was unusable in typical situations due to the unavailability of data or due to the
restrictions of data protection laws. It was therefore necessary to adopt the pragmatist
approach in order to develop a theory that could form the basis of a practical toolset, see
Teddlie & Tashakkori (2009), Table 4.1, p.74. Point (5) of this table stated the pragmatist
principle:
“Theories are viewed instrumentally (they are “true” to differing degrees based on
how well they currently work; workability is judged especially on the criteria of
predictability and applicability).”
The above statement concurred with the view the philosophy of science scholar Laudan; he
advocated that the criteria for assessing the development of a theory should relate to that
theory’s problem-solving effectiveness, rather than to its falsifiability (Laudan, 1978).
The toolset had to balance the effort of application against the value of the answers that it
produced. To that end, it might have been possible to reduce the number of factors required
in the toolset, or at least to enable trade-offs between accuracy and cost/effort.
2.5 The study design
The central subject area of the research related to sociotechnical systems, and the driving
rationale behind the research activities was to develop and test a culture tool. The study
design was intended to reflect the associated requirements. An outline of the study design is
presented in Figure 2-1.
Based on the three research sub-questions, the literature review provided insights as to the
effects of national culture on team activities, the availability of culture-based tools to predict
various aspects of team performance, and the validity of such tools. Based on the outputs of
the literature review, gaps and limitations were identified and several hypotheses were
generated. Appropriate methodologies were adapted from the literature, where available,
and initial conceptual models were proposed. Selected case study material from the
literature was supplemented via the collection of qualitative anecdotal data and by studies
carried out by the author; the studies were statistically analysed, in part to answer earlier-
17
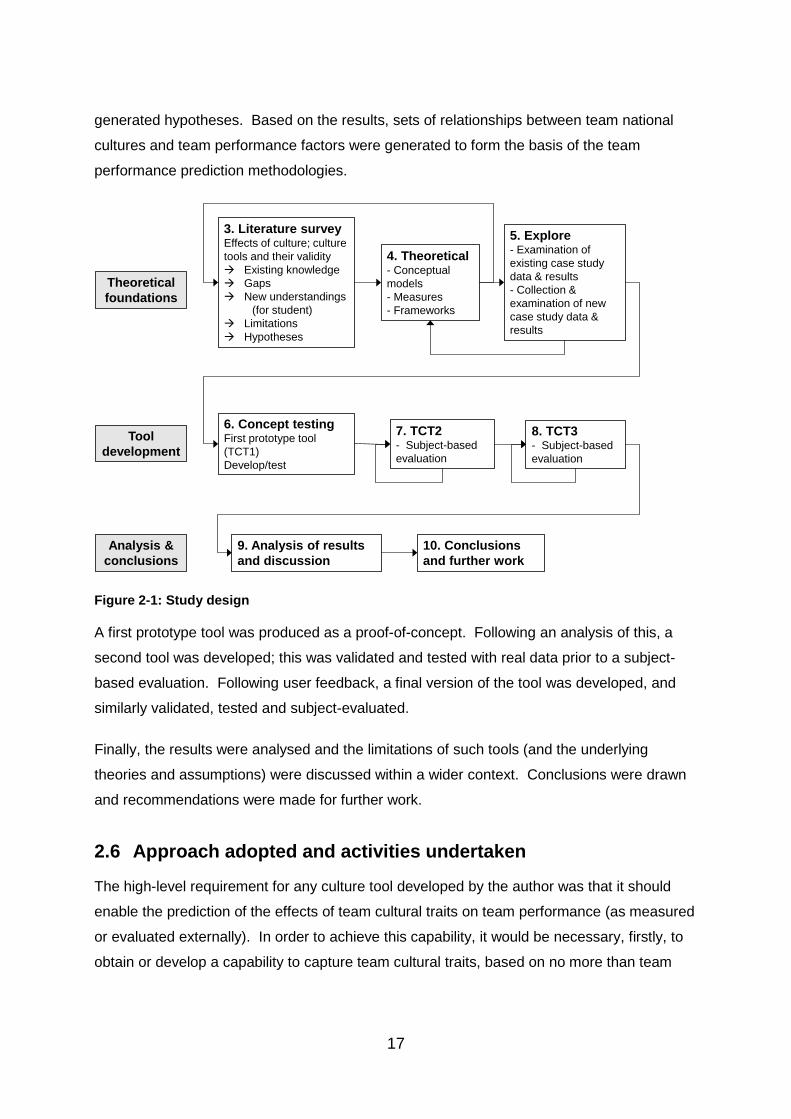
generated hypotheses. Based on the results, sets of relationships between team national
cultures and team performance factors were generated to form the basis of the team
performance prediction methodologies.
Figure 2-1: Study design
A first prototype tool was produced as a proof-of-concept. Following an analysis of this, a
second tool was developed; this was validated and tested with real data prior to a subject-
based evaluation. Following user feedback, a final version of the tool was developed, and
similarly validated, tested and subject-evaluated.
Finally, the results were analysed and the limitations of such tools (and the underlying
theories and assumptions) were discussed within a wider context. Conclusions were drawn
and recommendations were made for further work.
2.6 Approach adopted and activities undertaken
The high-level requirement for any culture tool developed by the author was that it should
enable the prediction of the effects of team cultural traits on team performance (as measured
or evaluated externally). In order to achieve this capability, it would be necessary, firstly, to
obtain or develop a capability to capture team cultural traits, based on no more than team
Theoreticalfoundations
Tooldevelopment
Analysis &conclusions
3. Literature surveyEffects of culture; culture tools and their validity Existing knowledge Gaps New understandings
(for student) Limitations Hypotheses
4. Theoretical- Conceptual models- Measures- Frameworks
5. Explore- Examination of existing case study data & results- Collection & examination of new case study data & results
6. Concept testingFirst prototype tool (TCT1)Develop/test
7. TCT2 - Subject-based evaluation
8. TCT3- Subject-based evaluation
9. Analysis of results and discussion
10. Conclusions and further work
18
member nationalities and educational levels6. Secondly, it would be necessary to obtain or
develop a capability to capture the culture-affected task, skill or mission factors that were
associated with key aspects of teams’ performance. Thirdly, it would be necessary to
associate specific cultural trait levels or scores with optimum achievement of these factors.
Finally, it would be necessary to be able to assess any team based on its closeness to the
ideal represented by the above cultural trait levels or scores.
It was difficult to establish a set of detailed requirements at the outset because an
examination of academic sources revealed little literature on cultural tools other than a range
of cultural frameworks; these frameworks were typically based on cultural dimensions or
attributes that enabled the placing of groups or populations in cultural space. There were, in
addition, a number of academically-developed questionnaire-based tools that assessed
individual team members’ cultural intelligence (or similar) from their personalities and cultural
attitudes as captured in the questionnaire responses. The author also examined non-
academic sources of various commercial and community-produced ‘culture tools’. Such
tools were typically intended for the provision of advice or training to individuals who were
travelling to other cultural zones, for the assessment of individuals’ cultural preferences, for
the assessment of individuals’ cultural competences or for the assessment of companies’
organisational or safety cultures.
The author discussed aspects of the requirements with, amongst others, Geert Hofstede
(developer of the most widely used cultural framework) and Peter Richerson (joint author of
the book ‘Not by Genes Alone – How Culture Transformed Human Evolution’).
No tools were found that enabled the effective assessment of the performance of various
types of team on the basis of (default) team national culture. Although this finding
demonstrated that there was a dearth of such tools, it was still necessary to obtain evidence
of the effects of culture on performance (and of a corresponding need for culture tools) and
to define the detailed requirements for such tools.
The first part of the literature review (‘what we know about multicultural teams’) revealed
empirical evidence of the effects of culture on the performance of various types of teams,
e.g. research/design team creativity and innovation performance, sports team performance
and operator/crew safety and accident rates. In addition, evidence was found on the effects
of culture on skill or task factors associated with team performance, for example, communi-
6 A key potential application of any culture tool produced by the author was as an adjunct to a suite of system design tools; as such, the only information available about potential operators or crew would be their nationalities and likely educational levels.
19
cation, management and leadership, training and situation awareness. However, no
evidence was found to suggest that the effects of team culture were specifically taken into
account to-date by designers of complex systems and standard operating procedures.
The second part of the literature review (‘the tools that are available to evaluate them’)
revealed very little information on tools that could utilise team member national culture to
estimate or predict team performance. There were many cultural frameworks that enabled
the positioning of individuals (or teams consisting of ‘same culture’ members) in culture
space, but only one national culture-based model and one national culture-based tool
attempted to provide further analysis of likely performance, or optimum team cultural traits;
neither of these provided an effective capability to predict team performance in a range of
sociotechnical situations.
As the second part of the literature review had revealed that there were no relevant
theoretical models or practical team culture tools, the third part of the literature review
(‘empirical evidence about the validity of the tools’) examined the validity of various tools,
models, frameworks and taxonomies that could provide the building blocks of such a tool.
Based on the literature review, a widely-used cultural framework was selected as the basis
for scoring team members default cultural traits, algorithms were developed to produce team
cultural trait and cultural diversity values from these scores, and a five factor skill/task set
was developed.
Detailed results from the literature review were combined with further data collection and
analysis by the author in order to assign optimal cultural dimension scores to sub-factors of
the above five skill/task factors. In addition, questionnaires were employed to gather
anecdotal information about individuals’ cross-cultural experiences in order to ascertain the
degree to which they observed and reacted according to their country-level scores. Long,
unstructured interviews were held with several experts who had significant experience in
various team types, in order to ascertain their personal observations about cultural effects on
team member performances.
The process of detailing and testing the requirements included the building of an initial ‘Aunt
Sally’ tool in order to ‘test the water’, i.e. a tool that captured a cultural representation of a
team, a representation of the required tasks/skills and produced a measure of team
performance based on culture. This initial tool attempted to generate an absolute measure
of a team’s effectiveness, expressed as a percentage; however, the potential complexity of
the equations, and the difficulty associated with justifying the weightings chosen in the
20
equations, convinced the author that this approach could not be extended satisfactorily, and
would be extremely difficult to update in the light of improved knowledge. Although the tool’s
measure of effectiveness was unsatisfactory, it did demonstrate the effectiveness of the
method that had been developed to produce a team cultural profile. As a result of building
and testing this initial culture tool, a revised requirement for establishing cultural ‘fitness for
purpose’ was devised, which was based directly on the level of discrepancy between actual
and optimum or desirable culture trait scores.
The second tool utilised a similar team cultural profiling method to the first, but utilised the
earlier-developed five task/skill factors as the basis for establishing a ‘desirable cultural
profile’, and (as stated above) produced a ‘cultural discrepancy score’, which indicated the
degree of mismatch between a team’s actual and desirable cultural profile. The use of a
discrepancy score avoided the complexity problems of the first tool and allowed the use of a
more detailed set of task skill sub-factors. Individual factor and sub-factor discrepancies
could be analysed to highlight the types of problems that the discrepancies signified. This
tool was verified and validated before being user-tested. Feedback from the users indicated
that some had difficulties when scoring the task/skill factors; this was unsurprising in
hindsight, as this scoring task required a high level of understanding of skill requirements that
would only develop with training and experience in team selection.
The third tool was developed in order to overcome user difficulties with the second tool’s
task/skill scoring requirement. Based on the task/skill factors used in the second tool, the
author produced optimal scores for a range of teams for each of two cases: organised action
teams (e.g. airline crew, ship crews, power station operators), and sociotechnical system
design/project teams. Instead of having to assign scores to the various task/skill factors,
users were presented, in each case, with a two dimensional matrix containing a range of
teams, and were required to select the location that represented their team via a process of
comparison with other teams that were pre-located on the matrix.
2.7 Summary of problem statement and research methodology
Section 2.2 defined the main problem area of research interest to include sociotechnical
system design teams and sociotechnical system operator teams; the main stakeholders were
identified as the designers and users of complex sociotechnical systems, their managers,
and education and training organisations.
A mixed method research methodology was chosen, and a pragmatist approach was
selected for theory development to ensure that it could form the basis of a reliable, practical
21
toolset.
The proposed solution approach included the selection of relevant areas of the literature to
review and, from these, the identification of methodologies that could be utilised and gaps
that required to be filled or circumvented, the collection of and analysis of data and, on the
basis of the analysis results, the development of a culture-based theory of team
performance; this theory was incorporated in culture-based performance prediction
methodologies and tools.
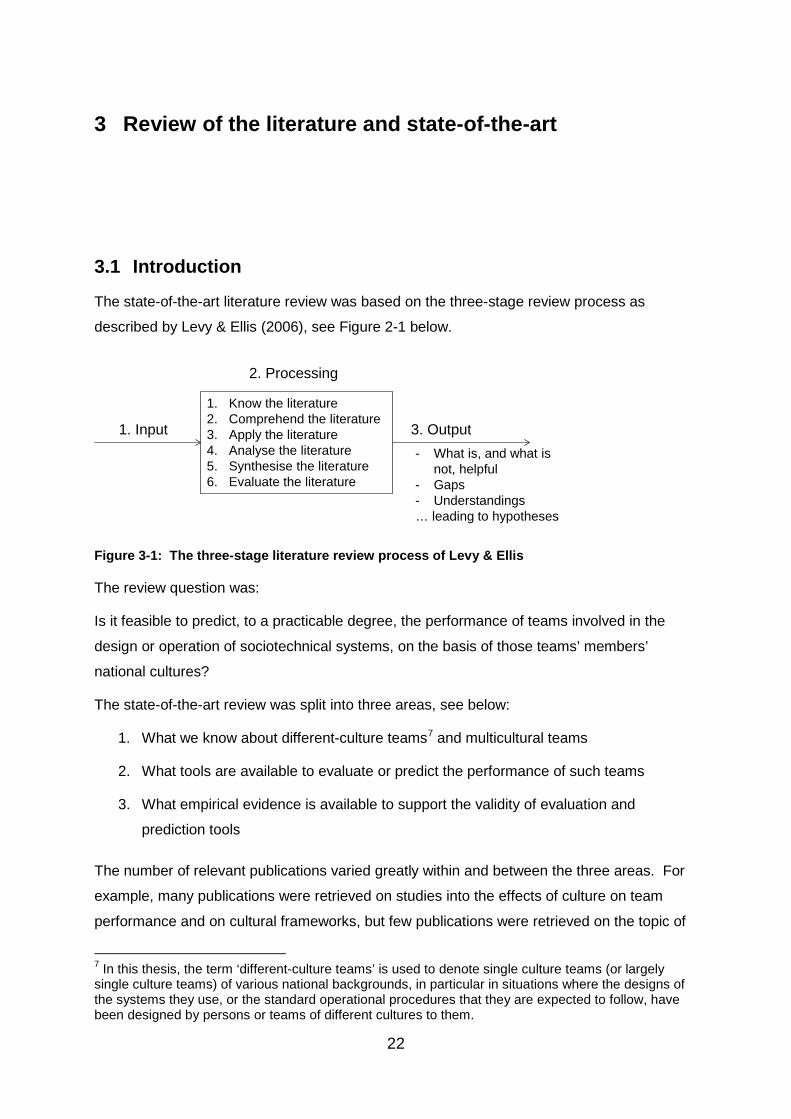
22
3 Review of the literature and state-of-the-art
3.1 Introduction
The state-of-the-art literature review was based on the three-stage review process as
described by Levy & Ellis (2006), see Figure 2-1 below.
Figure 3-1: The three-stage literature review process of Levy & Ellis
The review question was:
Is it feasible to predict, to a practicable degree, the performance of teams involved in the
design or operation of sociotechnical systems, on the basis of those teams’ members’
national cultures?
The state-of-the-art review was split into three areas, see below:
1. What we know about different-culture teams7 and multicultural teams
2. What tools are available to evaluate or predict the performance of such teams
3. What empirical evidence is available to support the validity of evaluation and
prediction tools
The number of relevant publications varied greatly within and between the three areas. For
example, many publications were retrieved on studies into the effects of culture on team
performance and on cultural frameworks, but few publications were retrieved on the topic of
7 In this thesis, the term ‘different-culture teams’ is used to denote single culture teams (or largely single culture teams) of various national backgrounds, in particular in situations where the designs of the systems they use, or the standard operational procedures that they are expected to follow, have been designed by persons or teams of different cultures to them.
1. Know the literature2. Comprehend the literature3. Apply the literature4. Analyse the literature5. Synthesise the literature6. Evaluate the literature
1. Input 3. Output
2. Processing
- What is, and what is not, helpful
- Gaps- Understandings… leading to hypotheses
23
culture-based performance prediction tools, and those that were found were concerned with
safety culture or organisational culture, not national culture.
Key findings that directly affected subsequent research towards the aims and objectives of
this thesis are detailed in this chapter’s summary.
3.2 An overview of the literature review
3.2.1 The literature review design
As stated above, the literature review was split into three major parts. For the first research
sub-question, a small number of key authors and their publications (journal papers and
academic books) was initially identified, read and commented. Following this activity,
potentially relevant forward and backward citations8 were followed. Sets of key words and
phrases (and their synonyms) were then selected, based in part on the most relevant
publications on each topic and sub-topic; in addition, after initial evaluative literature
searches, key ‘exclusion words’ were identified. This enabled complex search logic state-
ments to be built up, e.g. culture AND (framework OR tool OR methodology) AND team AND
performance NOT “safety culture” NOT “organizational culture”9. These keywords (and their
synonyms) and phrases were utilised in several citation databases and search engines. In
sub-topic areas where many publications were amassed then, following reading and
commentary, the sets of subjects and authors were pruned to enable more focused citation
and keyword searches to be carried out. See Appendix 1B for more details of keyword
searches.
For the second part of the literature review, only one relevant article was initially found in the
search for national culture-based team performance prediction models, methods and tools,
despite widening the search and evaluating a wide range of articles and websites. As a
result, the search was broken into ‘sub-searches’ for potential components of such models,
methods and tools. At this stage, the literature review process followed that of the first part
of the review, except that the range of published materials was extended to include
professional magazines, commercial tools, websites, blogs, etc.
For the third part of the literature review, the search for material was driven by the tools
found in the second part of the literature review.
8 Potential relevance was identified via comments in the text of the citing paper, by cited paper title and/or by author. 9 Note that the various citation databases and search engines differed in the form and complexity of logic that they could interpret; in some cases, only the simplest of logic statements could be used.
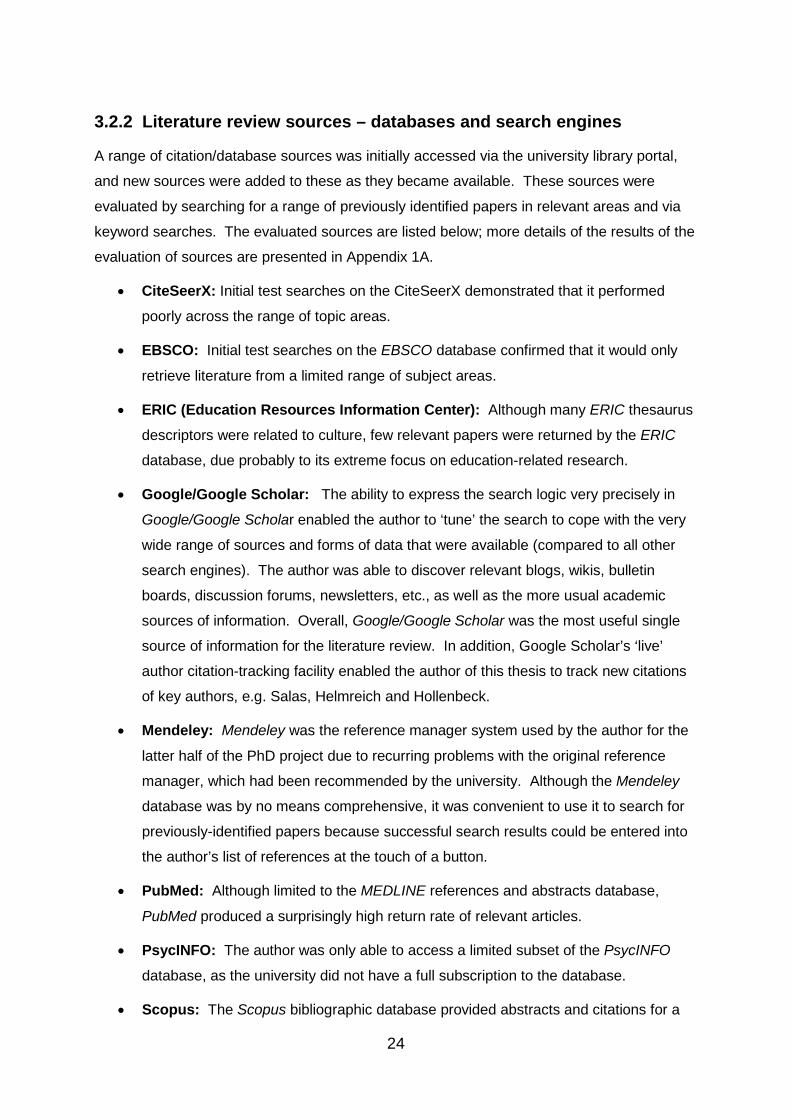
24
3.2.2 Literature review sources – databases and search engines
A range of citation/database sources was initially accessed via the university library portal,
and new sources were added to these as they became available. These sources were
evaluated by searching for a range of previously identified papers in relevant areas and via
keyword searches. The evaluated sources are listed below; more details of the results of the
evaluation of sources are presented in Appendix 1A.
• CiteSeerX: Initial test searches on the CiteSeerX demonstrated that it performed
poorly across the range of topic areas.
• EBSCO: Initial test searches on the EBSCO database confirmed that it would only
retrieve literature from a limited range of subject areas.
• ERIC (Education Resources Information Center): Although many ERIC thesaurus
descriptors were related to culture, few relevant papers were returned by the ERIC
database, due probably to its extreme focus on education-related research.
• Google/Google Scholar: The ability to express the search logic very precisely in
Google/Google Scholar enabled the author to ‘tune’ the search to cope with the very
wide range of sources and forms of data that were available (compared to all other
search engines). The author was able to discover relevant blogs, wikis, bulletin
boards, discussion forums, newsletters, etc., as well as the more usual academic
sources of information. Overall, Google/Google Scholar was the most useful single
source of information for the literature review. In addition, Google Scholar’s ‘live’
author citation-tracking facility enabled the author of this thesis to track new citations
of key authors, e.g. Salas, Helmreich and Hollenbeck.
• Mendeley: Mendeley was the reference manager system used by the author for the
latter half of the PhD project due to recurring problems with the original reference
manager, which had been recommended by the university. Although the Mendeley
database was by no means comprehensive, it was convenient to use it to search for
previously-identified papers because successful search results could be entered into
the author’s list of references at the touch of a button.
• PubMed: Although limited to the MEDLINE references and abstracts database,
PubMed produced a surprisingly high return rate of relevant articles.
• PsycINFO: The author was only able to access a limited subset of the PsycINFO
database, as the university did not have a full subscription to the database.
• Scopus: The Scopus bibliographic database provided abstracts and citations for a
25
very wide range of disciplines, but it appeared to have less coverage of pre-1985
articles than the Web of Science.
• SSCI (Social Science Citation Index): Accessed as part of the Web of Science.
• Web of Science: The Web of Science provided advanced search facilities for its
‘core’ collection, but only basic search facilities for the full collection. Its forward and
backward citation following facilities proved very effective and fast. In addition, the
search facility was efficient, producing a higher proportion of relevant articles than
most search engines (including Google/Google Scholar).
• Individual journal searches: In the late stages of the literature review, the student
subjected two journals of high relevance to his research to a 100% article-by-article
examination of abstracts (when in doubt, the whole paper was perused). Out of 108
articles deemed as relevant to the student’s research, 98 had already been retrieved;
of the previously omitted 10 articles, only one was deemed to be of sufficient
importance to be cited in the thesis.
To summarise the literature search sources: The most useful sources were found to be
Google/Google Scholar, which retrieved a significantly wider range of publications than all
other sources, and Web of Science, which not only accessed a wide (though lesser) range of
publications, but also included useful forward and backward citation-chasing capabilities.
3.2.3 Key authors
Based on prior reading and knowledge, a small number of key authors, and their most
relevant publications, were initially identified for each research sub-question; the literature
review was then extended via forward and backward citations.
The first literature review topic was “What we know about different-culture teams and multi-
cultural teams”. For this topic, the initially-identified authors were Helmreich, Merritt,
Sherman and Harris (for sociotechnical system operators and crew), Shane, Barjak, Herbig
and Jones (for design innovation teams) and Stahl et al. (2010) for studies concentrating on
multicultural teams.
The second literature review topic was “What tools are available to evaluate or predict the
performance of such teams”. An initial search revealed no relevant national culture tools;
however, a range of cultural frameworks had been developed and, for these, the initially-
identified authors were Hofstede, House et al., Triandis, Schwartz and Earley & Gibson;
academic books detailing many of these frameworks were available, and represented a
26
useful starting point. The initially-perused academic books associated with these authors
included “Culture’s Consequences” (G H Hofstede, 1980), “Cultures and Organizations”
(Geert Hofstede, 1991), “Culture, Leadership and Organizations” (House, Hanges, Javidan,
Dorfman, & Gupta, 2004), “Culture and Social Behavior” (Triandis, 1993), “Beyond
Individualism/Collectivism” (S H Schwartz, 1994) and “Multinational Work Teams: A New
Perspective” (Earley & Gibson, 2002). Academic papers by these authors, and reviews by
other authors of their work were then retrieved and examined before expanding the literature
review via forward- and back-citations. Detailed forward and backward citation searches
revealed no publications on methodologies and tools for the assessment or prediction of
national culture’s effects on the performance of teams, and a subsequent extensive search of
the academic literature, utilising a wide range of search terms, only revealed one publication
on this topic (other than the author’s own publications). As a result a further search was
carried out in order to retrieve academic publications on safety culture/organisational culture
tools, and non-academic sources of culture tools. The intention of this activity was to
examine any culture- and task-related factors utilised in these tools, and to determine
whether any of them could be re-used in a national culture tool.
The third literature review topic was “What empirical evidence is available to support the
validity of evaluation and prediction tools”. As no relevant tools had been found, this section
was devoted to an examination of the validity of the cultural frameworks, diversity indices and
team/task/behaviour classifications. As any evaluations of such frameworks and classifi-
cations would cite the relevant developers, the initial starting points for this third topic was
similar to the second, i.e. tracing citations of the same key papers; indeed many relevant
papers had been retrieved during the literature search activity for the (above) second topic.
The keyword searches employed for this third review topic included additional search terms,
e.g. ‘evaluation’, validity’, ‘criticism’ and ‘limitations’.
For this third literature review topic, the research was spread across a very wide range of
fields, with limited cross-connection. As a result, the author of this thesis had to rely heavily
on keyword searches. Appendix 1C provides an incomplete list of journal papers, learned
society and professional society publications that were cited in this thesis.
3.3 What we know about ‘other culture’ teams and multicultural teams
This section is divided into two parts. The first part reviews the literature that addresses
‘external’ aspects of team performance, i.e. how effectively teams of various cultures
27
performed in terms of their missions; the second part reviews the literature that addresses
‘internal’ aspects of team performance that are affected by culture, e.g. communication and
decision-making. These divisions are somewhat artificial, but assist in identifying
intermediate variables that could be used later in the research.
Note that many of the references in this section refer to ‘cultural dimensions’ such as
individualism, power distance, uncertainty avoidance and masculinity. Descriptions of these
cultural terms are provided in Tables 4-1 to 4-4.
3.3.1 Evidence of the effects of culture on external aspects or measures of team performance
Particular attention is paid to the two key areas of interest for this research thesis, i.e.
complex sociotechnical system design, and sociotechnical system operation.
Expanded descriptions of the material in this section can be found in Appendix 1D.
a) Teams involved in creativity and innovation Complex, automated sociotechnical systems are the products, of various levels of research,
invention and technical development. As producers of sociotechnical systems have become
increasingly multinational (e.g. via expansion, takeover or merger), they have gained access
to a wider range of choices when placing research, development and manufacturing
activities. This subsection examines evidence about relationships between national cultural
traits (or scores) and various levels of research and innovation performance.
Western cultures have tended to associate creativity with the creation of new knowledge,
paradigms, novel systems, products or processes, whereas eastern cultures have tended to
associate creativity with the search for, or a revealing of, a truth that is temporarily hidden
from view. Morris & Leung (2010) claimed that there was evidence that westerners
prioritised novelty over usefulness whereas easterners prioritised usefulness over novelty.
The lack of a universal classification or agreement about the various forms of knowledge
creation and application e.g. about differentiating between academic/fundamental/blue-skies
research10, industrial research & development (R&D), creativity/creation, inventiveness,
innovation, improvement and implementation, has made it difficult to accurately categorise
differing forms and levels of creative output. Could we identify differing human capabilities
10 In many ways, blue-skies research could be associated with the eastern view of creativity, i.e. the search for, or a revealing of, a truth that is temporarily hidden from view. The (western) creative aspects of fundamental research are perhaps associated with the development of tools to carry out the research, rather than with the research itself.

28
associated with each of these dimensions? The author has chosen the western view of
‘creativity-as-novelty’ (rather than creativity-as-usefulness’) in order to differentiate between
creativity and innovation, each of which requires different skill sets as suggested earlier.
The primary purpose of education in high-individualism nations has been to ‘learn how to
learn’, whereas the primary purpose in low-individualism (highly collectivist) nations has been
to ‘learn how to do’ (Geert Hofstede, 1986); most nations could be placed somewhere on the
continuum between the above two ‘educational extremes’. ‘Learning how to learn’
encouraged the search for new ideas, i.e. western-type creativity and innovation, whereas
‘learning how to do’ encouraged the implementation of prior innovations and improvements in
tangible products and services. In support of this view, Herbig & Palumbo (1996) suggested
that western cultures favoured breakthrough innovations, and eastern cultures fostered
incremental innovations.
Published studies of the effects of national culture on the generation and development of
new ideas (by both academic and industrial teams) are examined in this subsection. Such
studies covered basic (or blue skies) research, applied research, product and process
development and improvement.
i) Research
Barjak (2006) reported on a study of the effects of cultural and disciplinary diversity on the
performance of academic research teams in the life sciences. The outperforming teams had
20-25% of foreign-educated members11; low cultural diversity teams and high cultural
diversity teams (those containing 40-45%) performed less well, resulting in an inverted ’U’-
shaped performance curve. Barjak & Robinson (2008) subsequently carried out a larger
study, the results of which indicated that the most successful academic life science research
teams had a strong domestic base (with a minority of foreign team members – representing a
Shannon’s diversity index of less than 0.38), a moderate amount of collaboration with foreign
research teams and a small proportion of research students. They also found that small
teams (optimum size seven members) produced the maximum number of publications per
capita, and the highest number of citations per paper.
Kedia et al. (1992) carried out a study of industrial and academic research units that revealed
higher research productivity for high masculinity/low power distance countries than for low
masculinity/low power distance countries, i.e. high masculinity appeared to help researchers
11 Foreign-educated in the sense that the team member’s last degree was obtained outside the host country.
29
contribute to ideas initiation.
ii) Industrial research & development
Cozzi & Giordani (2011) carried out an analysis of the effects of ambiguity aversion on
countries’ R&D performances; they discovered a strong negative relationships between
national uncertainty avoidance scores and research performance as exhibited by the level of
R&D intensity and the proportion of researchers in each country; they also found that this
negative correlation was stronger across European countries than across OECD or a wider
range of countries. Niebuhr (2010) found that innovation performances in the various
German regions implied that diverse cultural backgrounds in the team or workforce
enhanced R&D performance. Because Niebuhr’s work was carried out at the regional, rather
than team level, there were issues with its validity.
Jones & Davis (2000) produced a taxonomy of company (or subsidiary) R&D focus, with
associated optimum cultural scores (all other things being equal) based on their analysis of
studies as follows: Locally-supported support/adaption – high power distance (PDI), low
individualism (IDV), high masculinity (MAS), high uncertainty avoidance (UAI) and high long
term orientation (LTO); locally-orientated R&D – low/medium PDI, medium/high IDV, low/-
medium MAS, low/medium UAI and high LTO; globally-orientated R&D – low PDI, high IDV,
low MAS, low UAI and high LTO.
Rinne et al. (2013) found a strong positive relationship between individualism and the Global
Creativity Index (GCI) and the Design and Creativity Index (DCI) indices, but no significant
relationship between power distance, uncertainty avoidance and these creativity indices.
iii) Innovation
Herbig and Miller (1992) found that higher order innovation was best served by high
individualist, low uncertainty-avoidance societies. Shane (1992) found that power distance
(negative) and individualism (positive) had strong correlations with per-capita inventiveness
and innovation. Willems ( 2007) found that individualism had the highest correlation
(positive) with innovation, as measured in terms of European and US patents, followed by
power distance (negative), masculinity (positive) and uncertainty avoidance (negative).
Bouncken & Winkler (2008) found that differences in power distance among team members
were particularly damaging to the performance of bicultural global innovation teams.
Rothwell & Wissema (1986) identified characteristics associated with low power distance,
long term orientation and low uncertainty avoidance as promoting technical innovation.
30
Herbig & Dunphy (1998) found that high individualism, low power distance and low
uncertainty avoidance promoted technical innovation.
Halkos & Tzeremes (2011) found that masculinity was positively correlated with innovation
up to a score of 70-80. The emphasis on relationships and agreement-seeking within a low-
masculinity culture, rather than on externally-measured goals, was similar to that of low-
individualism communities; such an emphasis could lead to reduced performance when
faced with high creativity or blue-skies research goals. The same authors later found, from a
study of twenty-five European countries, that high uncertainty avoidance had the greatest
effect on innovation, followed by high power distance – in both cases, the effects were
negative (G. E. Halkos & Tzeremes, 2013). As part of a three-decade multi-level review of
the application of Hofstede’s cultural framework, Taras, Kirkman & Steel (2010) found that
uncertainty avoidance was strongly negatively related to innovation.
Efrat (2014) examined the impacts of national culture on innovation in 35 countries for the
years 1998, 2004 and 2008; innovation output measures were based on patents, journal
articles and high-technology exports (obtained from the World Bank database). He found
that power distance had little effect, high individualism contributed positively to publications
but negatively to patents, uncertainty avoidance had a general negative effect, and that high
masculinity contributed negatively to publications and positively to patents. There were a
number of issues with the results of Efrat’s study. Firstly, the results were based on national,
not team values; research teams often contain many foreign members, therefore the default
national default values may not be accurate. Secondly, journal articles tend to be produced
by academic research teams, patents by industrial innovation teams, and high technology
exports (the end of a long chain) often depend significantly on lower level process and
product improvements; these three outputs represent significantly different levels of creativity
or innovation, and should be distinguished from each other.
iv) Product development (initiation)
Nakata & Sivakumar (1996) split the product development process into two stages, as
suggested by Johne (1984), i.e. initiation (idea generation, screening, concept testing) and
implementation (product development, test marketing, product launch); They found that the
best-performing national cultures at the initiation stage had high individualism, low power
distance, low uncertainty avoidance and low masculinity scores (i.e. as in Nordic cultures);
the low masculinity scores contrast with the findings of Kedia et al. and Halkos & Tzemeres.
D’Iribarne et al. (1998, Ch.IV) reported on a joint venture between Renault of France (high
31
power distance, high masculinity and high uncertainty avoidance) and Volvo of Sweden (low
power distance, low masculinity and low uncertainty avoidance); the hierarchically-organised
French team members produced the most innovative designs and defended them
aggressively; the democratically-organised Swedish team members sought consensus to
such a degree that they were limited in the range of ideas that they could even conceive.
The joint venture failed and was subsequently dissolved. Geert Hofstede referred to this case
during a conversation with the author of this thesis at a Loughborough University workshop
(Fellows, 2011), highlighting the Swedish high femininity (low masculinity) score; he
suggested that this had caused the need for consensus to overrule the purpose of the joint
venture. This low masculinity/inadequate product development result contradicts that of
Nakata & Sivakumar (above).
Rinne et al. (2012) investigated the effects of national culture on innovation in 66 countries,
as measured by the 2008-2009 Global Innovation Index (INSEAD, 2009); they reported that
power distance was strongly negatively related to innovation performance, individualism was
strongly positively related, but no statistically significant relationship with uncertainty
avoidance was found. Kaasa and Vadi (2010) analysed the effects of culture on innovation
in European countries, using patenting activity as a measure. They found a strong negative
(but non-linear) relationship between national uncertainty avoidance scores and indicators of
patenting intensity; power distance and masculinity were negatively correlated with inno-
vation, but their effects could be counteracted to some extent by high individualism.
Shane (1993) investigated the effects of national culture on the innovation rates of 33
countries over the period 1975 to 1980, using trademarks filed in the USA as a measure of
the countries’ innovation rates. He found that low uncertainty avoidance was the most
important cultural variable, followed by low power distance and high individualism. Shane
later examined the effects of culture on attitudes towards the role of innovation champions,
finding, again, that a low uncertainty avoidance score was an indicator of high support
(Shane, 1995). Shane’s measures of innovation performance were different from those used
by Rinne et al. (see earlier), and it is therefore unsurprising that the results of the two investi-
gations, in terms of cultural influences, differed to some extent.
v) Product and process implementation
Herbig & Miller (1992) proposed that low-IDV, high PDI (collectivist) societies were pre-
eminent in lower order innovations, in particular those societies with high MAS. Ambos &
Schlegelmilch (2008) carried out a study of 139 R&D laboratories (located in 21 countries)
and found that the optimum ‘cultural environment’ for capability-exploitation laboratories
32
(those whose aim was to bring technology to market) was high power distance, low
individualism, high masculinity and high uncertainty avoidance.
Nakata & Sivakumar’s (1996) literature review found that the best-performing national
cultures at the implementation stage had low individualism, high power distance, high
uncertainty avoidance and high masculinity scores (e.g. Japan, Taiwan and Mexico). Lin’s
(2009) study of detailed process development and implementation in major car manufac-
turers in fourteen countries revealed that high uncertainty avoidance and (high) long term
orientation positively influenced performance.
Herbig and Jacobs (1998) explained the strengths and weaknesses of Japanese research
and development. Japan excelled in improving process and product technology but, with the
exception of a small number of scientists, did not produce radical innovations or extend basic
knowledge - technology transfers to Japan from the USA and Europe were almost four times
greater than transfers from Japan. In the case of Japan, the country’s history and its cultural
combination of high power distance, low individualism, high uncertainty avoidance and high
masculinity resulted in a fierce competitiveness at the company level, rather than at the
individual level.
vi) Acceptance and promotion of new technologies
Although this subsection does not specifically refer to project teams, such teams are typically
involved in the adoption and implementation of new technologies.
Hasan and Ditsa (1999) found that West Africans were more favourable to the adoption of
information technology than were Middle Easterners, and considered that this was due to the
much lower level of uncertainty avoidance in West Africa. Van Everdingen and Waarts
(2003) concluded, from a study of ten European countries, that high national scores for
power distance, uncertainty avoidance and masculinity negatively influenced the adoption of
enterprise resource planning; individualism appeared to play a positive role in only the early
adoption of enterprise resource planning software.
Based on a study of the literature on entrepreneurship, Menzel et al. (2006) proposed an
ideal supportive culture consisting of very low power distance and uncertainty avoidance
scores, medium individualism and masculinity scores, and medium-to-high long-term
orientation scores.
vii) Complex projects involving significant political or social issues
Most large, complex sociotechnical projects have been unique and, in addition to technology
33
issues, many such projects have had significant additional complexities imposed on them
due to political or social issues (D. Hodgson & Cicmil, 2008), e.g. due to multiple customer
stakeholders or partners, for example in the negotiation of large international defence
contracts involving commercial rivals and civil service organisations. Many smaller projects
have also had significant cultural, personal and vested interests (often undisclosed), typically
adding to complexity, time delays and costs. It was almost impossible to analyse such
projects on a comparative, quantitative basis, as there was no equivalent of a ‘level playing
field’ via which the author could compare their performances. It was possible, however, to
examine qualitatively the key reasons why complex projects often failed.
A large proportion of complex technical and social projects failed to a greater or lesser
degree – cost and time overruns were ‘the norm’; the 2012 UK Olympics project was (of
course) delivered on time, but the costs had escalated by 200% over the original estimates.
The Bull Survey (Spikes Cavell Research Company, 1998) revealed that the largest single
cause of project failure was poor communication between the relevant parties on the project.
The UK government’s OGC best practice report entitled ‘Common Causes of Project Failure’
(Office of Government Commerce, 2005) identified two of the eight major causes of failure in
government-funded projects as lack of understanding/lack of contacts at senior levels, and
lack of project team integration between clients and supplier team. Anderson (2011)
identified bad communications as the largest single root cause of project failure. It appears
from the above (and from many other references) that failures in communication and under-
standing, particularly across departmental and organisational boundaries, were the leading
causes of failure in complex projects.
Buckle & Thomas’ (2003) study of the Project Management Body of Knowledge, PMBOK,
(PMI, 2000) revealed an embedded masculine set of values. Masculine cultures tended be
highly competitive assertive and aggressive (G H Hofstede 2001, Ch.6), and tended to apply
impersonal problem-solving approaches (Daley & Naff, 1998) and decision-making styles
(Baxter Magolda, 1992); contrastingly, feminine cultures tended to value relationships and
seek consensus (G H Hofstede 2001, Ch.6). However, project management typically
attracted masculine-orientated individuals (Cartwright & Gale, 1995), even from within more
feminine cultures. Given the earlier-described primary causes for the high rates of project
failure, it is probable that personnel with lower masculinity scores, perhaps applying
alternative project management methods, e.g. the Scandinavian approach (Lichtenberg,
1983), would perform more effectively in socially or politically complex projects.
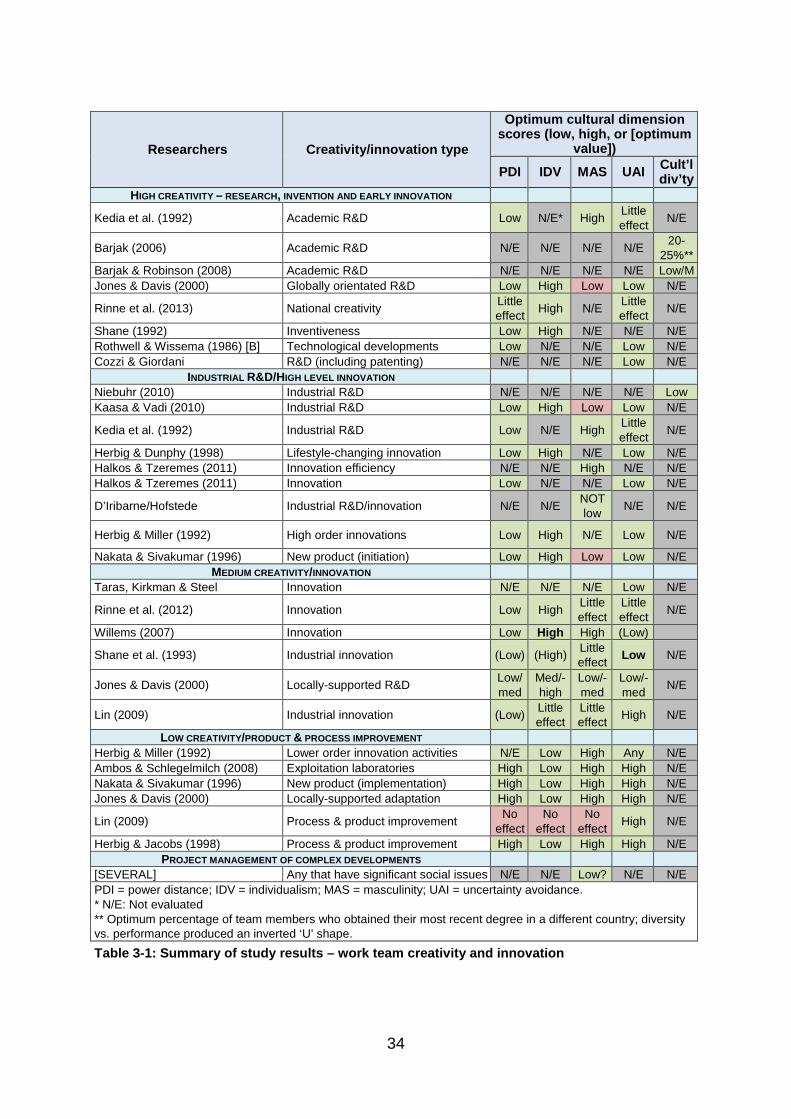
34
Researchers Creativity/innovation type
Optimum cultural dimension scores (low, high, or [optimum
value])
PDI IDV MAS UAI Cult’l div’ty
HIGH CREATIVITY – RESEARCH, INVENTION AND EARLY INNOVATION
Kedia et al. (1992) Academic R&D Low N/E* High Little effect N/E
Barjak (2006) Academic R&D N/E N/E N/E N/E 20-25%**
Barjak & Robinson (2008) Academic R&D N/E N/E N/E N/E Low/M Jones & Davis (2000) Globally orientated R&D Low High Low Low N/E
Rinne et al. (2013) National creativity Little effect High N/E Little
effect N/E
Shane (1992) Inventiveness Low High N/E N/E N/E Rothwell & Wissema (1986) [B] Technological developments Low N/E N/E Low N/E Cozzi & Giordani R&D (including patenting) N/E N/E N/E Low N/E
INDUSTRIAL R&D/HIGH LEVEL INNOVATION Niebuhr (2010) Industrial R&D N/E N/E N/E N/E Low Kaasa & Vadi (2010) Industrial R&D Low High Low Low N/E
Kedia et al. (1992) Industrial R&D Low N/E High Little effect N/E
Herbig & Dunphy (1998) Lifestyle-changing innovation Low High N/E Low N/E Halkos & Tzeremes (2011) Innovation efficiency N/E N/E High N/E N/E Halkos & Tzeremes (2011) Innovation Low N/E N/E Low N/E
D’Iribarne/Hofstede Industrial R&D/innovation N/E N/E NOT low N/E N/E
Herbig & Miller (1992) High order innovations Low High N/E Low N/E
Nakata & Sivakumar (1996) New product (initiation) Low High Low Low N/E MEDIUM CREATIVITY/INNOVATION
Taras, Kirkman & Steel Innovation N/E N/E N/E Low N/E
Rinne et al. (2012) Innovation Low High Little effect
Little effect N/E
Willems (2007) Innovation Low High High (Low)
Shane et al. (1993) Industrial innovation (Low) (High) Little effect Low N/E
Jones & Davis (2000) Locally-supported R&D Low/med
Med/-high
Low/-med
Low/-med N/E
Lin (2009) Industrial innovation (Low) Little effect
Little effect High N/E
LOW CREATIVITY/PRODUCT & PROCESS IMPROVEMENT Herbig & Miller (1992) Lower order innovation activities N/E Low High Any N/E Ambos & Schlegelmilch (2008) Exploitation laboratories High Low High High N/E Nakata & Sivakumar (1996) New product (implementation) High Low High High N/E Jones & Davis (2000) Locally-supported adaptation High Low High High N/E
Lin (2009) Process & product improvement No effect
No effect
No effect High N/E
Herbig & Jacobs (1998) Process & product improvement High Low High High N/E PROJECT MANAGEMENT OF COMPLEX DEVELOPMENTS
[SEVERAL] Any that have significant social issues N/E N/E Low? N/E N/E PDI = power distance; IDV = individualism; MAS = masculinity; UAI = uncertainty avoidance. * N/E: Not evaluated ** Optimum percentage of team members who obtained their most recent degree in a different country; diversity vs. performance produced an inverted ‘U’ shape. Table 3-1: Summary of study results – work team creativity and innovation
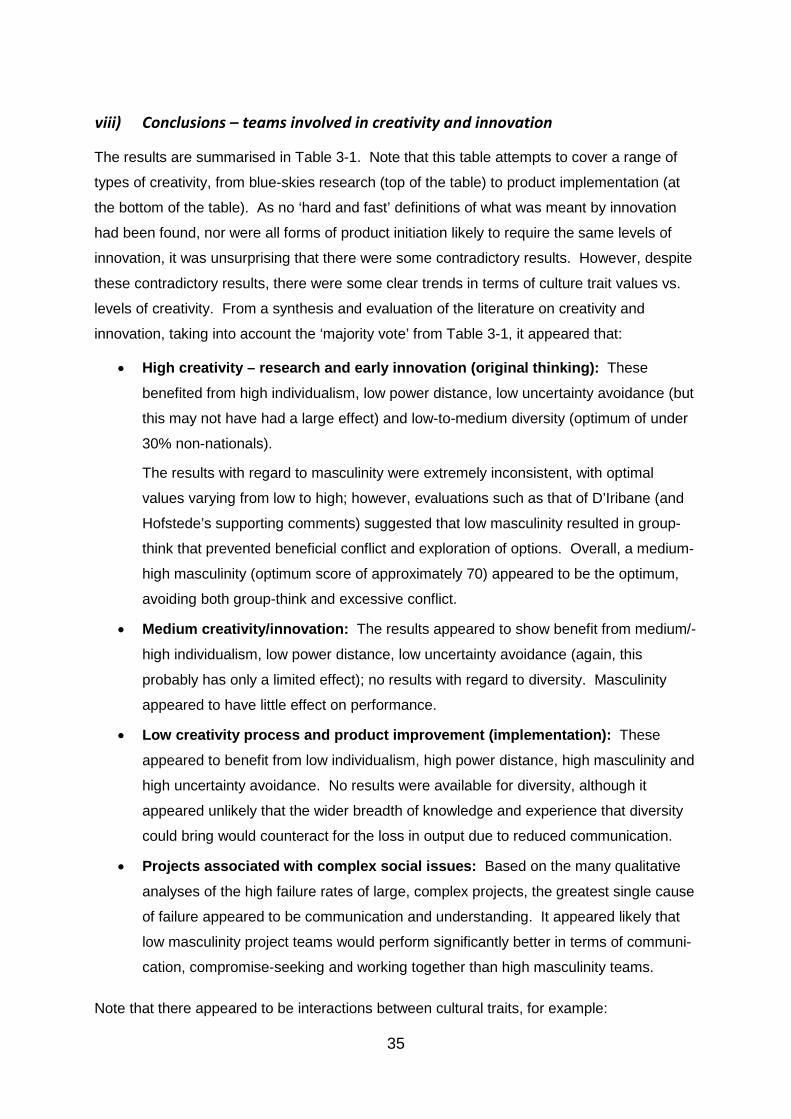
35
viii) Conclusions – teams involved in creativity and innovation
The results are summarised in Table 3-1. Note that this table attempts to cover a range of
types of creativity, from blue-skies research (top of the table) to product implementation (at
the bottom of the table). As no ‘hard and fast’ definitions of what was meant by innovation
had been found, nor were all forms of product initiation likely to require the same levels of
innovation, it was unsurprising that there were some contradictory results. However, despite
these contradictory results, there were some clear trends in terms of culture trait values vs.
levels of creativity. From a synthesis and evaluation of the literature on creativity and
innovation, taking into account the ‘majority vote’ from Table 3-1, it appeared that:
• High creativity – research and early innovation (original thinking): These
benefited from high individualism, low power distance, low uncertainty avoidance (but
this may not have had a large effect) and low-to-medium diversity (optimum of under
30% non-nationals).
The results with regard to masculinity were extremely inconsistent, with optimal
values varying from low to high; however, evaluations such as that of D’Iribane (and
Hofstede’s supporting comments) suggested that low masculinity resulted in group-
think that prevented beneficial conflict and exploration of options. Overall, a medium-
high masculinity (optimum score of approximately 70) appeared to be the optimum,
avoiding both group-think and excessive conflict.
• Medium creativity/innovation: The results appeared to show benefit from medium/-
high individualism, low power distance, low uncertainty avoidance (again, this
probably has only a limited effect); no results with regard to diversity. Masculinity
appeared to have little effect on performance.
• Low creativity process and product improvement (implementation): These
appeared to benefit from low individualism, high power distance, high masculinity and
high uncertainty avoidance. No results were available for diversity, although it
appeared unlikely that the wider breadth of knowledge and experience that diversity
could bring would counteract for the loss in output due to reduced communication.
• Projects associated with complex social issues: Based on the many qualitative
analyses of the high failure rates of large, complex projects, the greatest single cause
of failure appeared to be communication and understanding. It appeared likely that
low masculinity project teams would perform significantly better in terms of communi-
cation, compromise-seeking and working together than high masculinity teams.
Note that there appeared to be interactions between cultural traits, for example:
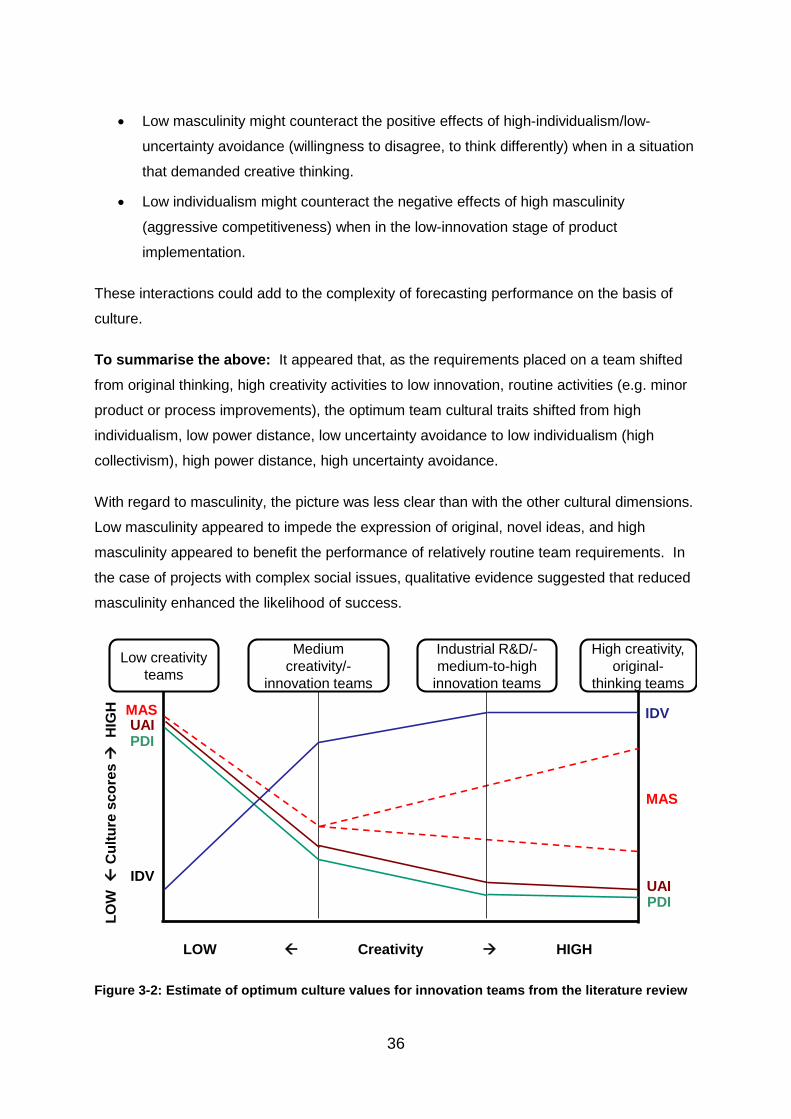
36
• Low masculinity might counteract the positive effects of high-individualism/low-
uncertainty avoidance (willingness to disagree, to think differently) when in a situation
that demanded creative thinking.
• Low individualism might counteract the negative effects of high masculinity
(aggressive competitiveness) when in the low-innovation stage of product
implementation.
These interactions could add to the complexity of forecasting performance on the basis of
culture.
To summarise the above: It appeared that, as the requirements placed on a team shifted
from original thinking, high creativity activities to low innovation, routine activities (e.g. minor
product or process improvements), the optimum team cultural traits shifted from high
individualism, low power distance, low uncertainty avoidance to low individualism (high
collectivism), high power distance, high uncertainty avoidance.
With regard to masculinity, the picture was less clear than with the other cultural dimensions.
Low masculinity appeared to impede the expression of original, novel ideas, and high
masculinity appeared to benefit the performance of relatively routine team requirements. In
the case of projects with complex social issues, qualitative evidence suggested that reduced
masculinity enhanced the likelihood of success.
Figure 3-2: Estimate of optimum culture values for innovation teams from the literature review
Low creativity teams
High creativity, original-
thinking teams
Medium creativity/-
innovation teams
PDI
IDV
UAI
MAS
PDIUAI
MAS
IDV
LOW
C
ultu
re s
core
s
HIG
H
LOW Creativity HIGH
Industrial R&D/-medium-to-high
innovation teams
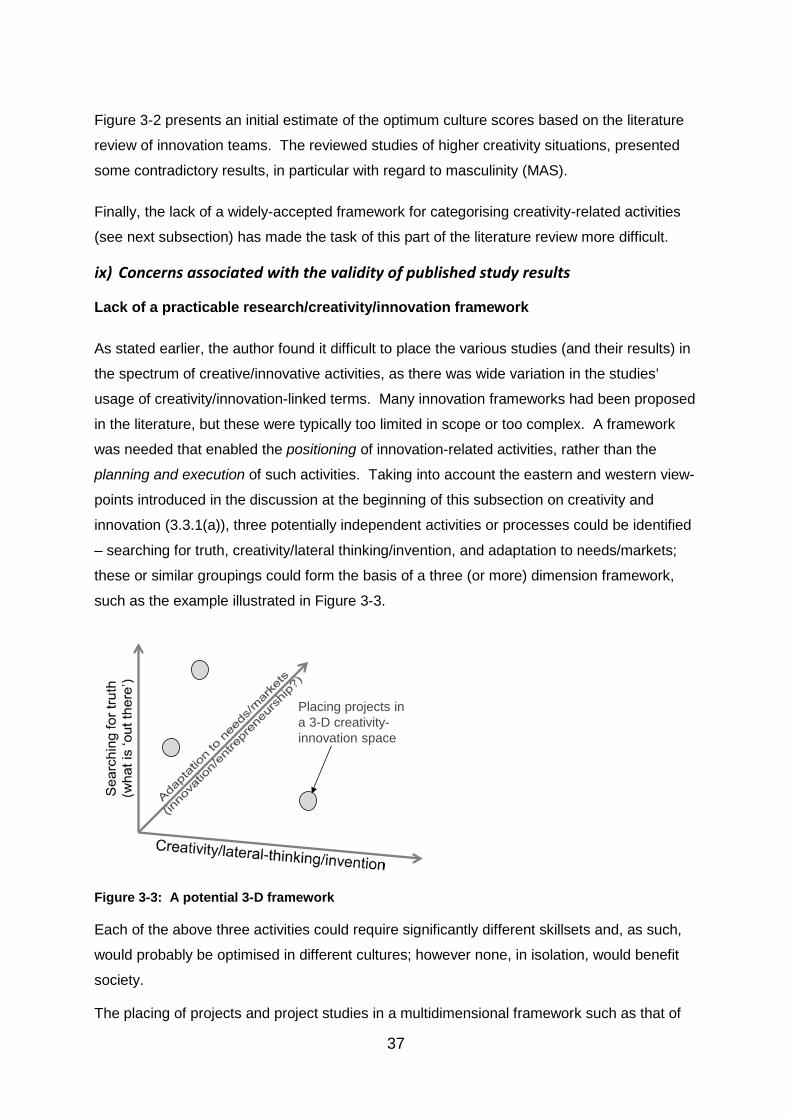
37
Figure 3-2 presents an initial estimate of the optimum culture scores based on the literature
review of innovation teams. The reviewed studies of higher creativity situations, presented
some contradictory results, in particular with regard to masculinity (MAS).
Finally, the lack of a widely-accepted framework for categorising creativity-related activities
(see next subsection) has made the task of this part of the literature review more difficult.
ix) Concerns associated with the validity of published study results
Lack of a practicable research/creativity/innovation framework
As stated earlier, the author found it difficult to place the various studies (and their results) in
the spectrum of creative/innovative activities, as there was wide variation in the studies’
usage of creativity/innovation-linked terms. Many innovation frameworks had been proposed
in the literature, but these were typically too limited in scope or too complex. A framework
was needed that enabled the positioning of innovation-related activities, rather than the
planning and execution of such activities. Taking into account the eastern and western view-
points introduced in the discussion at the beginning of this subsection on creativity and
innovation (3.3.1(a)), three potentially independent activities or processes could be identified
– searching for truth, creativity/lateral thinking/invention, and adaptation to needs/markets;
these or similar groupings could form the basis of a three (or more) dimension framework,
such as the example illustrated in Figure 3-3.
Figure 3-3: A potential 3-D framework
Each of the above three activities could require significantly different skillsets and, as such,
would probably be optimised in different cultures; however none, in isolation, would benefit
society.
The placing of projects and project studies in a multidimensional framework such as that of
Placing projects in a 3-D creativity-innovation space
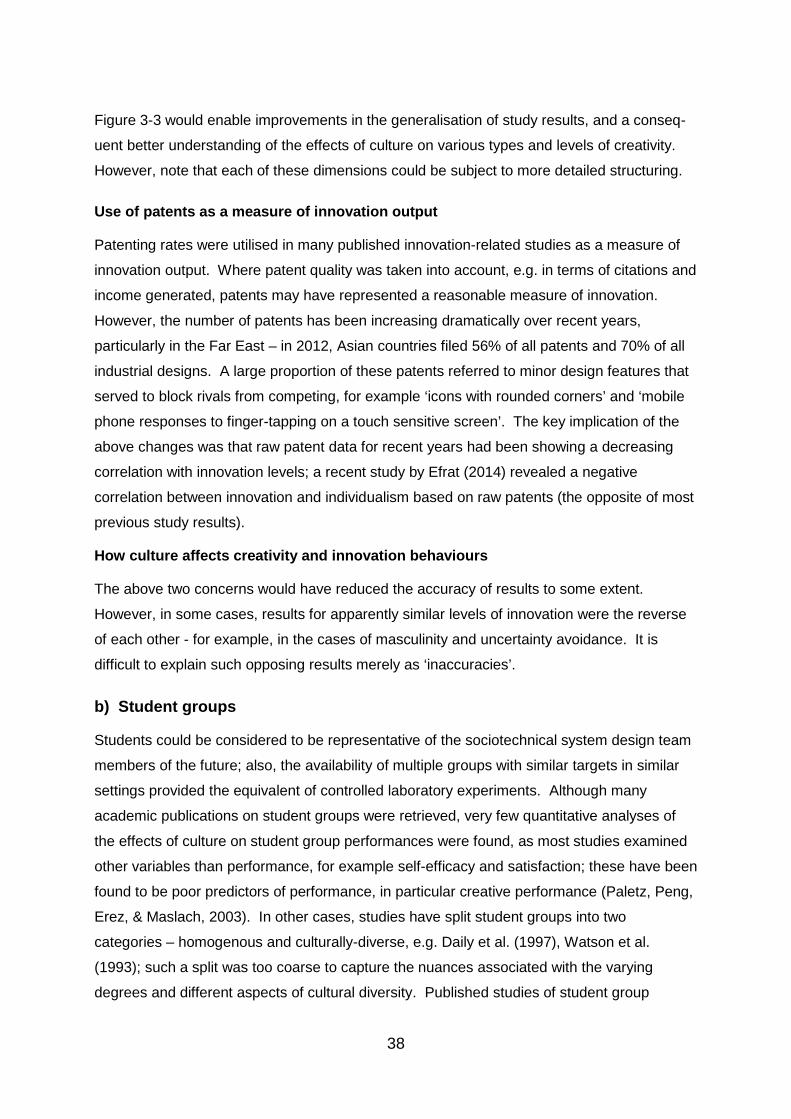
38
Figure 3-3 would enable improvements in the generalisation of study results, and a conseq-
uent better understanding of the effects of culture on various types and levels of creativity.
However, note that each of these dimensions could be subject to more detailed structuring.
Use of patents as a measure of innovation output
Patenting rates were utilised in many published innovation-related studies as a measure of
innovation output. Where patent quality was taken into account, e.g. in terms of citations and
income generated, patents may have represented a reasonable measure of innovation.
However, the number of patents has been increasing dramatically over recent years,
particularly in the Far East – in 2012, Asian countries filed 56% of all patents and 70% of all
industrial designs. A large proportion of these patents referred to minor design features that
served to block rivals from competing, for example ‘icons with rounded corners’ and ‘mobile
phone responses to finger-tapping on a touch sensitive screen’. The key implication of the
above changes was that raw patent data for recent years had been showing a decreasing
correlation with innovation levels; a recent study by Efrat (2014) revealed a negative
correlation between innovation and individualism based on raw patents (the opposite of most
previous study results).
How culture affects creativity and innovation behaviours
The above two concerns would have reduced the accuracy of results to some extent.
However, in some cases, results for apparently similar levels of innovation were the reverse
of each other - for example, in the cases of masculinity and uncertainty avoidance. It is
difficult to explain such opposing results merely as ‘inaccuracies’.
b) Student groups
Students could be considered to be representative of the sociotechnical system design team
members of the future; also, the availability of multiple groups with similar targets in similar
settings provided the equivalent of controlled laboratory experiments. Although many
academic publications on student groups were retrieved, very few quantitative analyses of
the effects of culture on student group performances were found, as most studies examined
other variables than performance, for example self-efficacy and satisfaction; these have been
found to be poor predictors of performance, in particular creative performance (Paletz, Peng,
Erez, & Maslach, 2003). In other cases, studies have split student groups into two
categories – homogenous and culturally-diverse, e.g. Daily et al. (1997), Watson et al.
(1993); such a split was too coarse to capture the nuances associated with the varying
degrees and different aspects of cultural diversity. Published studies of student group
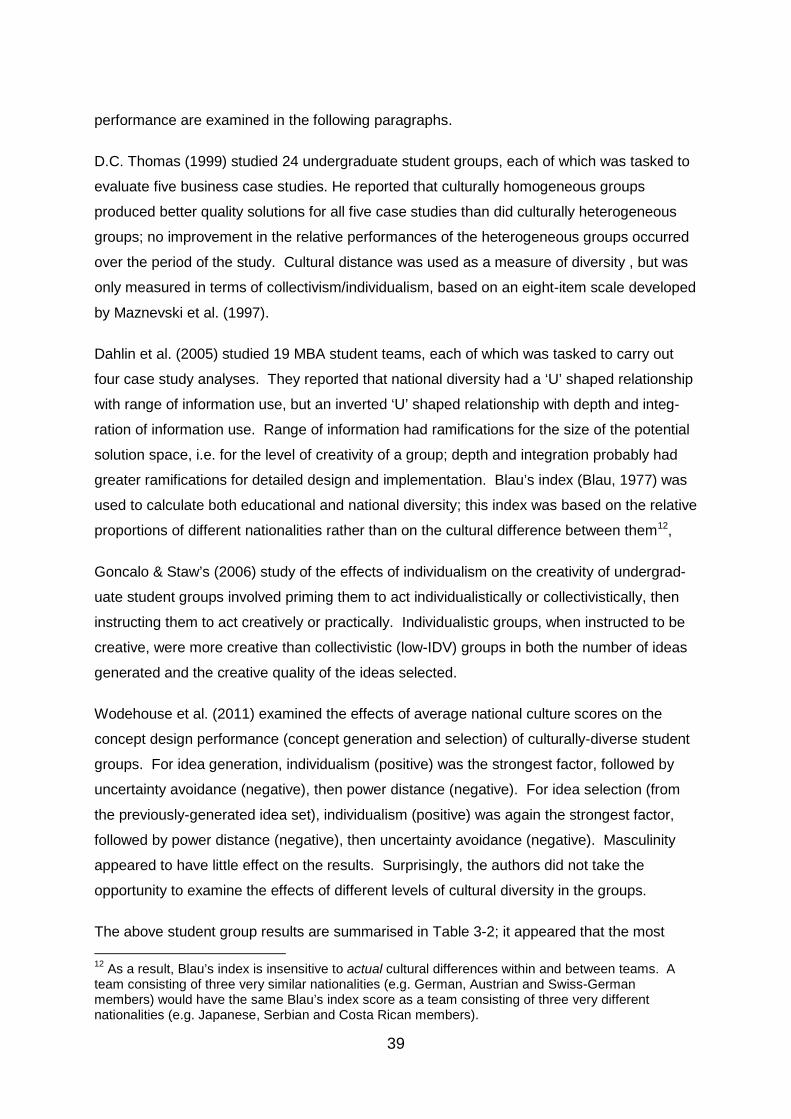
39
performance are examined in the following paragraphs.
D.C. Thomas (1999) studied 24 undergraduate student groups, each of which was tasked to
evaluate five business case studies. He reported that culturally homogeneous groups
produced better quality solutions for all five case studies than did culturally heterogeneous
groups; no improvement in the relative performances of the heterogeneous groups occurred
over the period of the study. Cultural distance was used as a measure of diversity , but was
only measured in terms of collectivism/individualism, based on an eight-item scale developed
by Maznevski et al. (1997).
Dahlin et al. (2005) studied 19 MBA student teams, each of which was tasked to carry out
four case study analyses. They reported that national diversity had a ‘U’ shaped relationship
with range of information use, but an inverted ‘U’ shaped relationship with depth and integ-
ration of information use. Range of information had ramifications for the size of the potential
solution space, i.e. for the level of creativity of a group; depth and integration probably had
greater ramifications for detailed design and implementation. Blau’s index (Blau, 1977) was
used to calculate both educational and national diversity; this index was based on the relative
proportions of different nationalities rather than on the cultural difference between them12,
Goncalo & Staw’s (2006) study of the effects of individualism on the creativity of undergrad-
uate student groups involved priming them to act individualistically or collectivistically, then
instructing them to act creatively or practically. Individualistic groups, when instructed to be
creative, were more creative than collectivistic (low-IDV) groups in both the number of ideas
generated and the creative quality of the ideas selected.
Wodehouse et al. (2011) examined the effects of average national culture scores on the
concept design performance (concept generation and selection) of culturally-diverse student
groups. For idea generation, individualism (positive) was the strongest factor, followed by
uncertainty avoidance (negative), then power distance (negative). For idea selection (from
the previously-generated idea set), individualism (positive) was again the strongest factor,
followed by power distance (negative), then uncertainty avoidance (negative). Masculinity
appeared to have little effect on the results. Surprisingly, the authors did not take the
opportunity to examine the effects of different levels of cultural diversity in the groups.
The above student group results are summarised in Table 3-2; it appeared that the most 12 As a result, Blau’s index is insensitive to actual cultural differences within and between teams. A team consisting of three very similar nationalities (e.g. German, Austrian and Swiss-German members) would have the same Blau’s index score as a team consisting of three very different nationalities (e.g. Japanese, Serbian and Costa Rican members).

40
creative student groups were high in individualism, low in power distance and uncertainty
avoidance. Masculinity appeared to have little effect, and the results for cultural diversity
were inconclusive.
Researchers Group and task types
Optimum cultural dimension scores (low, moderate, high, or [optimum
value])
PDI IDV MAS UAI Diversity
Thomas (1999) Undergraduate student groups, business case studies. N/E* N/E N/E N/E 0
Dahlin et al. (2005)
MBA student groups, business case studies – range of info used. N/E N/E N/E N/E Low or
high** (‘U’) MBA student groups, business case studies – depth & integration of information. N/E N/E N/E N/E Mod*** (‘∩’)
Goncalo & Staw (2006)
Undergraduate student groups, creativity of solutions. N/E High N/E N/E N/E
Wodehouse et al. (2011) (small sample)
Student groups, design idea generation Low High Little effect Low N/E
Student groups, design idea selection Low High Little effect Low N/E
* N/E: Not evaluated. ** U-shaped – low and high diversity teams perform better than moderate diversity teams. *** Inverted U-shaped – moderately diverse teams perform better than low or high diversity teams. Table 3-2: Summary of study results – student groups
Although the above evaluation of student creativity appeared to confirm the earlier results for
creativity in academic and industrial teams, there were grounds for caution. In most or all of
the cases, collectivist (low individualist) students were at a disadvantage in that they were
typically situated in a foreign environment; this could have had a negative effect on their
group performances. It would therefore be informative to be able to compare the above
results with those of diverse student groups that were performing in a collectivist
environment.
c) Culture, safety and sociotechnical system accidents
National culture plays a significant role in accident rates (in particular in complex socio-
technical systems such as large transport aircraft, oil refineries and power stations). There
are, however, very few quantitative studies of the effects of culture on safety-critical socio-
technical systems other than aircraft, and some of these have been criticised due to the
potential impacts of external factors that were not taken into account (Strauch, 2010).
i) Accident rates in commercial aviation
During the 1990s, an investigation by Boeing revealed a significant relationship between
national cultures and accident rates of Western-built commercial passenger jet aircraft, even
after taking account of differing fleets, ground facilities and training. In particular, Weener’s
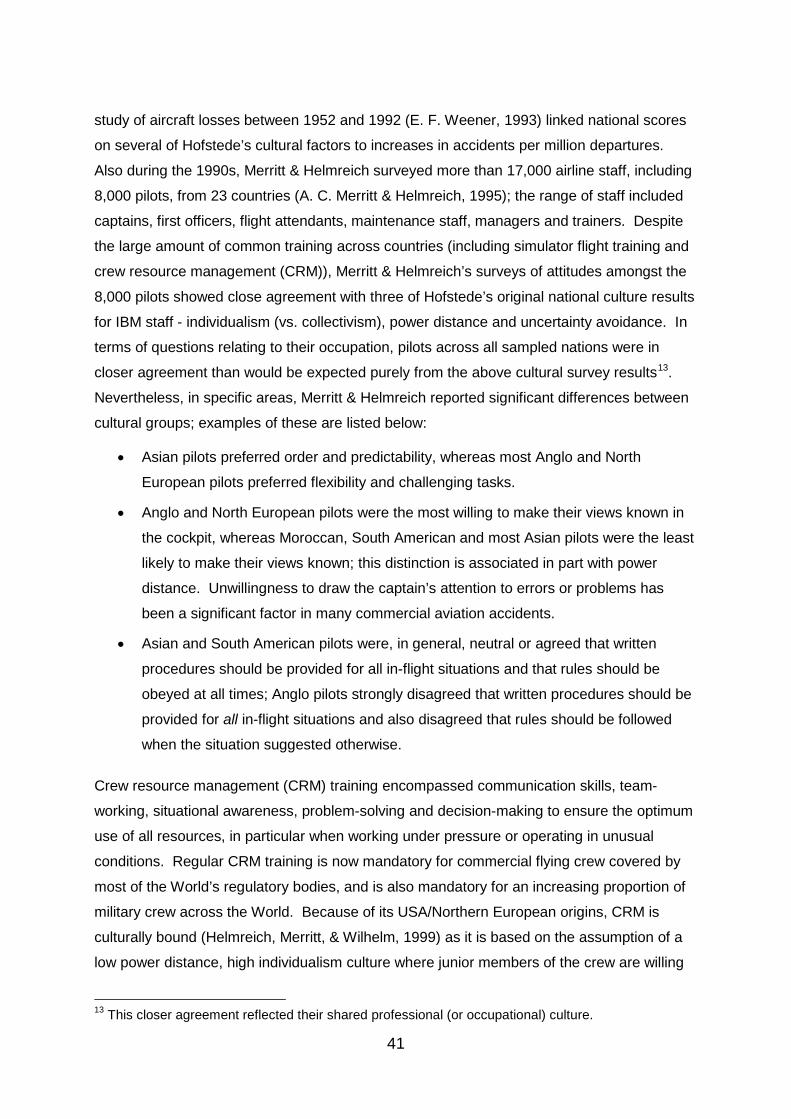
41
study of aircraft losses between 1952 and 1992 (E. F. Weener, 1993) linked national scores
on several of Hofstede’s cultural factors to increases in accidents per million departures.
Also during the 1990s, Merritt & Helmreich surveyed more than 17,000 airline staff, including
8,000 pilots, from 23 countries (A. C. Merritt & Helmreich, 1995); the range of staff included
captains, first officers, flight attendants, maintenance staff, managers and trainers. Despite
the large amount of common training across countries (including simulator flight training and
crew resource management (CRM)), Merritt & Helmreich’s surveys of attitudes amongst the
8,000 pilots showed close agreement with three of Hofstede’s original national culture results
for IBM staff - individualism (vs. collectivism), power distance and uncertainty avoidance. In
terms of questions relating to their occupation, pilots across all sampled nations were in
closer agreement than would be expected purely from the above cultural survey results13.
Nevertheless, in specific areas, Merritt & Helmreich reported significant differences between
cultural groups; examples of these are listed below:
• Asian pilots preferred order and predictability, whereas most Anglo and North
European pilots preferred flexibility and challenging tasks.
• Anglo and North European pilots were the most willing to make their views known in
the cockpit, whereas Moroccan, South American and most Asian pilots were the least
likely to make their views known; this distinction is associated in part with power
distance. Unwillingness to draw the captain’s attention to errors or problems has
been a significant factor in many commercial aviation accidents.
• Asian and South American pilots were, in general, neutral or agreed that written
procedures should be provided for all in-flight situations and that rules should be
obeyed at all times; Anglo pilots strongly disagreed that written procedures should be
provided for all in-flight situations and also disagreed that rules should be followed
when the situation suggested otherwise.
Crew resource management (CRM) training encompassed communication skills, team-
working, situational awareness, problem-solving and decision-making to ensure the optimum
use of all resources, in particular when working under pressure or operating in unusual
conditions. Regular CRM training is now mandatory for commercial flying crew covered by
most of the World’s regulatory bodies, and is also mandatory for an increasing proportion of
military crew across the World. Because of its USA/Northern European origins, CRM is
culturally bound (Helmreich, Merritt, & Wilhelm, 1999) as it is based on the assumption of a
low power distance, high individualism culture where junior members of the crew are willing
13 This closer agreement reflected their shared professional (or occupational) culture.
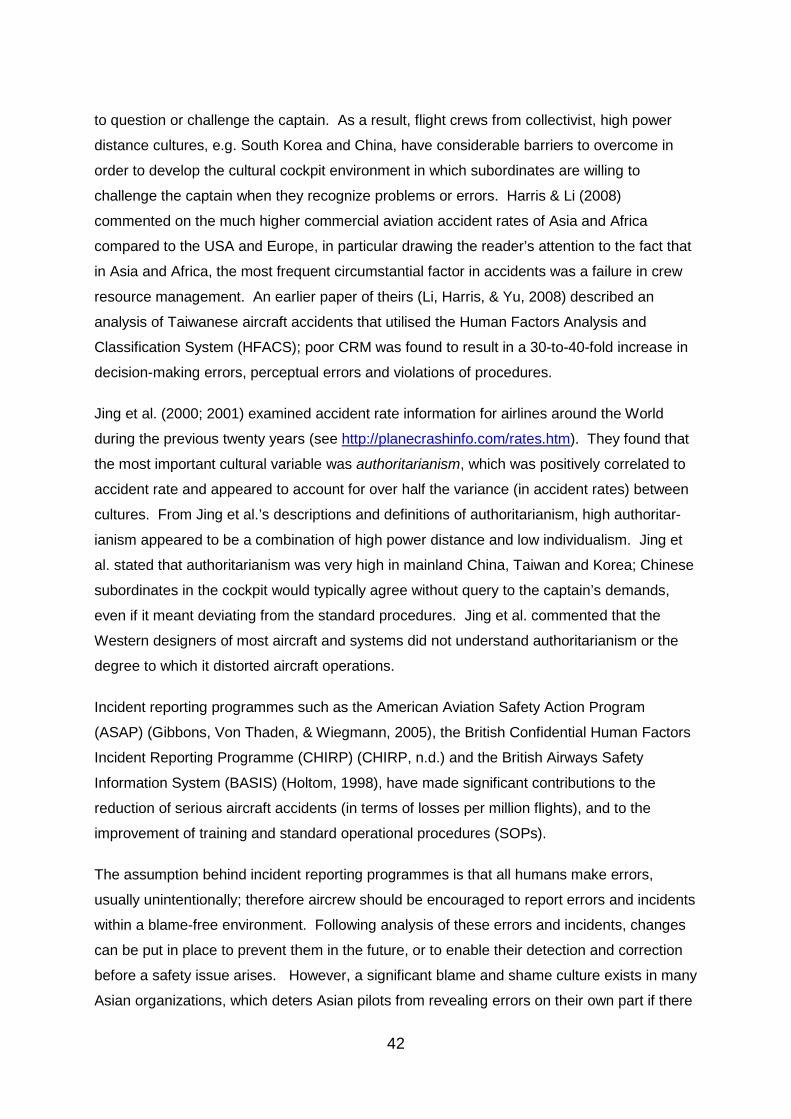
42
to question or challenge the captain. As a result, flight crews from collectivist, high power
distance cultures, e.g. South Korea and China, have considerable barriers to overcome in
order to develop the cultural cockpit environment in which subordinates are willing to
challenge the captain when they recognize problems or errors. Harris & Li (2008)
commented on the much higher commercial aviation accident rates of Asia and Africa
compared to the USA and Europe, in particular drawing the reader’s attention to the fact that
in Asia and Africa, the most frequent circumstantial factor in accidents was a failure in crew
resource management. An earlier paper of theirs (Li, Harris, & Yu, 2008) described an
analysis of Taiwanese aircraft accidents that utilised the Human Factors Analysis and
Classification System (HFACS); poor CRM was found to result in a 30-to-40-fold increase in
decision-making errors, perceptual errors and violations of procedures.
Jing et al. (2000; 2001) examined accident rate information for airlines around the World
during the previous twenty years (see http://planecrashinfo.com/rates.htm). They found that
the most important cultural variable was authoritarianism, which was positively correlated to
accident rate and appeared to account for over half the variance (in accident rates) between
cultures. From Jing et al.’s descriptions and definitions of authoritarianism, high authoritar-
ianism appeared to be a combination of high power distance and low individualism. Jing et
al. stated that authoritarianism was very high in mainland China, Taiwan and Korea; Chinese
subordinates in the cockpit would typically agree without query to the captain’s demands,
even if it meant deviating from the standard procedures. Jing et al. commented that the
Western designers of most aircraft and systems did not understand authoritarianism or the
degree to which it distorted aircraft operations.
Incident reporting programmes such as the American Aviation Safety Action Program
(ASAP) (Gibbons, Von Thaden, & Wiegmann, 2005), the British Confidential Human Factors
Incident Reporting Programme (CHIRP) (CHIRP, n.d.) and the British Airways Safety
Information System (BASIS) (Holtom, 1998), have made significant contributions to the
reduction of serious aircraft accidents (in terms of losses per million flights), and to the
improvement of training and standard operational procedures (SOPs).
The assumption behind incident reporting programmes is that all humans make errors,
usually unintentionally; therefore aircrew should be encouraged to report errors and incidents
within a blame-free environment. Following analysis of these errors and incidents, changes
can be put in place to prevent them in the future, or to enable their detection and correction
before a safety issue arises. However, a significant blame and shame culture exists in many
Asian organizations, which deters Asian pilots from revealing errors on their own part if there
43
is a perceived risk of being exposed. In 1999, the Taiwanese government introduced the
TACARE voluntary incident reporting programme in order to improve the country’s very poor
airline flight safety record. The level of incident reporting was low, therefore Lee & Weitzel
(2003) conducted a study of the usage of TACARE and found that carriers would attempt to
identify and punish flight crews responsible for (reported) incidents, rather than seek to
establish and eliminate the root causes of incidents. Lee & Weitzel also commented in their
paper that there was a very high power distance between Taiwanese flight crew captains and
first officers, a cultural factor value known to be strongly, positively correlated with flying
incidents; this high power distance would also discourage lower ranking officers from
reporting incidents associated with their captains’ behaviours. A decade-later review of the
utilisation of the TACARE system by maintenance personnel (Y.-F. Chen, Metscher, Smith,
Ramsay, & Mason, 2014) revealed that fear of punishment and lack of feedback still
discouraged personnel from submitting safety reports.
It has become clear that Western-designed training, crew resource management and
incident reporting systems do not fully meet the needs of non-individualist, high power
distance cultures. In addition, aircraft cockpit layouts and standard operating procedures
are based on Western individualist cultural assumptions.
ii) Accident rates in NATO air forces
Soeters & Boer (2000) conducted a comparative study of fourteen NATO air forces using
data based on the years 1988 to 1995. These air forces used similar or identical aircraft,
underwent similar training, had common NATO-designed operating procedures and
regulations, were involved in the exchange of personnel between NATO air forces and took
part in combined exercises with other NATO countries. The range of NATO aircraft included
single-seat tactical fighters and tactical ground attack aircraft (typically operating in pairs of
groups of four), two-seat trainers and strategic penetration aircraft and large multiple-crewed
aircraft; however, all worked in a larger team environment (i.e. including command & control).
Despite the commonality of training, operating procedures and aircraft, strong positive, statis-
tically-validated correlations were found between low individualism, high power distance and
high uncertainty avoidance scores, and increased accident rates. It is important to note that
the NATO standards, regulations, operating procedures, etc., were based on the US/British
model; this model had built-in assumptions with regard to aircrew cultures, i.e. that they had
an Anglo culture (which scored high in individualism, low in power distance and low in
uncertainty avoidance).
44
iii) Automation of sociotechnical systems
Over recent decades, sociotechnical systems have become increasingly automated, and it is
therefore worth examining automation-related issues in a separate subsection; a more
detailed examination can be found in Hodgson, Siemieniuch & Hubbard (2013). These
issues go beyond the cultures of specific groups or nationalities, although they are affected
by certain cultural traits. It is not feasible to predict all modes of failure in highly automated
sociotechnical systems; therefore, given the severe consequences of failure, it has been
necessary to back up these automation systems with humans. However, this automation
has brought changes to the activities, workloads, situation awareness and skill levels of
human operators or crew. The issues arising from these changes are considered below, with
particular reference to the aviation environment.
Automation systems, including flight deck automation, changed the role of the operator from
that of active, in-the-loop ‘doer’ to that of passive, out-of-the-loop monitor. Humans proved to
be poor system monitors of high-reliability systems (Parasuraman, Molloy, & Singh, 1993),
and they reacted more slowly to deviations than when inside the control loop (Kaber &
Endsley, 1997). Crews of highly automated aircraft typically had reduced situation aware-
ness not only with regard to the current ‘flying state’ of the aircraft but also, critically, with
regard to the detailed mode of the automation system, its constraints and its likely future
behaviour (Sarter & Woods, 1995a).
In 1996, a U.S. Federal Aviation Administration (FAA) report (Federal Aviation Administration
Human Factors Team, 1996) stated that systemic vulnerabilities in flight path management
systems adversely affected crews’ situation awareness and management of automation.
The level and complexity of flight automation increased significantly after 1996, and even
highly-experienced crews found increasing difficulties with automation (Sarter, Mumaw, &
Wickens, 2007). An updated FAA report on flight path management systems (FAA, 2013)
found that systemic vulnerabilities remained in the design, user training and operation of
modern flight path management systems; excessive complexity and pilot skill degradation
had resulted in many incidents and accidents. Recent examples of such incidents and
accidents included Hamburg (BFU, 2010), Learmouth (Australian Transport Safety Bureau,
2011) and Schipol (Dutch Safety Board, 2010). Evidence of flight crew loss of skills
associated with automation (and automation policy) has been widely reported (Ebbatson,
Harris, Huddlestone, & Sears, 2010; Ebbatson, 2009; Gillen, 2010; Wood, 2004; Young,
Fanjoy, & Suckow, 2006). A recent survey (Zimmermann, Paries, & Amalberti, 2011)
revealed that commercial pilots and air traffic controllers believed that flight safety was
45
decreasing. The uncontained engine failure on a Qantas Airbus A380 in 2008 (Australian
Transport Safety Bureau, 2010) and the successful ditching of an Airbus A300 on the River
Hudson after engine failure in 2008 (National Transportation Safety Board, 2010) were
demonstrations of very high manual skill levels that few of the latest generation of pilots
possess.
Researchers have highlighted the paucity and low quality of interaction between crews and
automation systems (Norman, 1990), the need for context-aware systems that emulate CRM
principles (Geiselman, Johnson, Buck, & Patrick, 2013) and the need for multisensory feed-
back to crews (Sarter, 2000). To-date, the automation elements of most sociotechnical
systems have behaved as poorly trained, incommunicative members of the systems’ crews –
thus defeating the purpose of crew resource management (CRM) training. To replace the
loss of shared situation awareness resulting from automation, researchers have argued that
the automated system must become, to an adequate degree, part of the crew (Christoffersen
& Woods, 2002), (G. Klein, Woods, Bradshaw, Hoffman, & Feltovich, 2004).
Sherman et al. (1997) surveyed the attitudes of a sample of 5,879 airline pilots from 12
nations towards flight deck automation. They reported that the influence of national culture
on the pilots’ agreement (or otherwise) to 15 automation-related questions was far greater
than that of organizational culture or pilot experience14. Cultural differences in attitudes to
automation were important because they affected crew utilisation of automation and their
levels of trust, manual skills and situation awareness.
A summary of sociotechnical system automation safety issues: To-date, increased
automation of sociotechnical systems, in particular aircraft automation, has resulted in
changes to primary crew functions from ‘doing’ to ‘monitoring’, reductions in crew situation
awareness and downgrading of crew ‘hands-on’ skills. As a result of these changes, when
failures of automation systems have occurred, manual recoveries have been compromised.
Developments in automation, combined with airline crew flight training policies, have resulted
in an increasing gap between actual and required crew capabilities and situation awareness.
In terms of Reason’s ‘Safety Space’ model (Reason, 2008), flight automation systems are
moving rapidly in the direction of increasing vulnerability; similar issues can be found in other
complex sociotechnical systems, for example nuclear power stations and refineries.
14 The author of this thesis carried out a further analysis of Sherman’s results (see Chapter 5 for more details) in order to gain further insights, for example ‘More automation is better’ scores were positively correlated with national power distance scores, and ‘I prefer automation’ scores were positively correlated with national PDI and UAI scores.
46
iv) Accident rates in industry
Many (but not all) industrial accidents have been associated with team activities. Infortunio’s
(2003) study showed that industrial fatal accident rates were correlated with high UAI scores
and high PDI/IDV ratios but not with MAS scores. Note that Infortunio (on page 115) warned
that other factors, including country wealth levels, could moderate the results of his study;
see Subsection III.B.4 of his thesis for further comments on this.
v) Road traffic accidents
Although traffic accidents are not typically the result of team activities, they are worth
studying because the cultural factors associated with road accidents also play a part in other
forms of accident and failure. Ozkan & Lajunen’s (2007) study of traffic accident data from
46 countries identified gross national product (GNP) per capita (negatively related),
neuroticism and uncertainty avoidance (both positively related) as being significantly
correlated with accident rates. Masculinity (positive) and individualism (negative) were
identified as being correlated to a lesser degree.
vi) Reaction times to anomalies
G.A. Klein et al. (1999) stated that personnel with low uncertainty avoidance scores mentally
‘reframed’ with less information than did personnel with high uncertainty avoidance scores,
i.e. they responded quicker to anomalies. In the context of a complex sociotechnical system,
this could provide valuable additional time in which to respond to a deteriorating situation,
though it could also lead to false alarms.
vii) Summary – safety-critical sociotechnical teams
The results of the review of the effects of national culture on the safety of sociotechnical
systems are presented in Table 3-3; these include studies of reactions to anomalies. High
accident rates appear to be associated with a particular pattern of cultural dimension scores -
low individualism, high uncertainty avoidance and, in most cases, high power distance
scores. In the case of uncertainty avoidance, performance in emergency situations is also
typically hampered by inadequate practical training and a reluctance to react promptly. A
high masculinity score might have been expected to increase the rate of accidents caused by
competitiveness and bravado, but little evidence of this was found in the statistics, other than
in (non-team) road accidents.
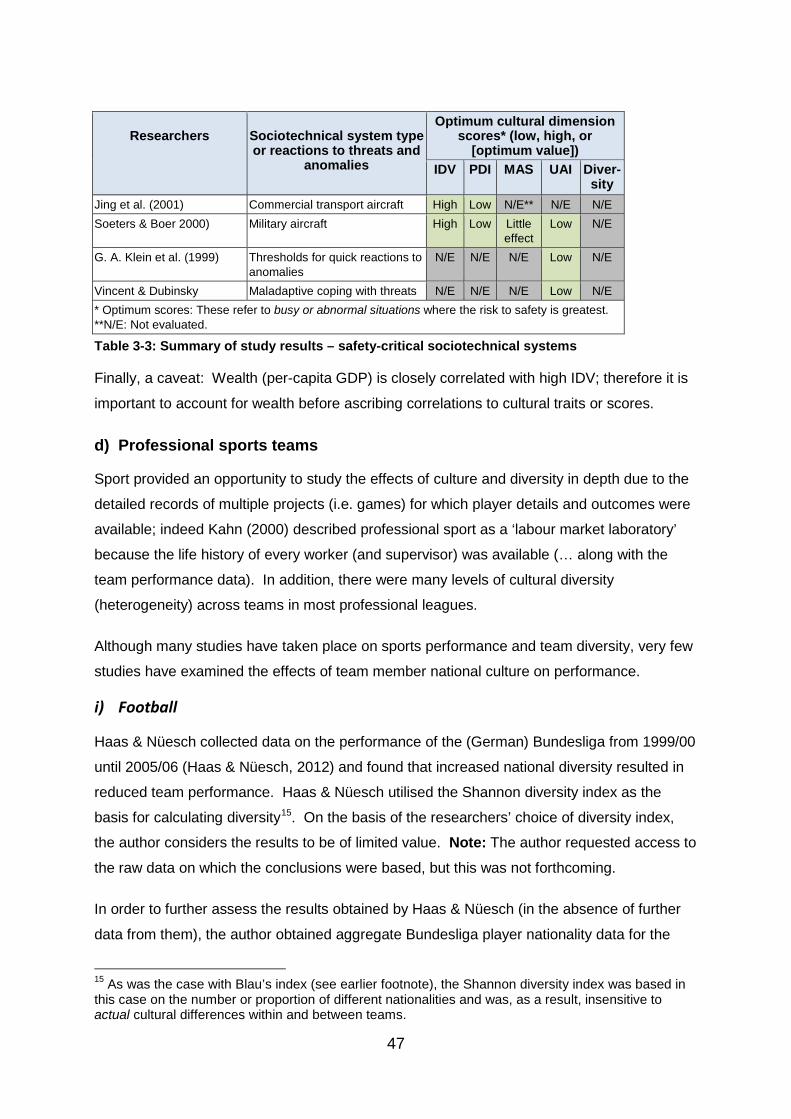
47
Researchers
Sociotechnical system type or reactions to threats and
anomalies
Optimum cultural dimension scores* (low, high, or
[optimum value]) IDV PDI MAS UAI Diver-
sity Jing et al. (2001) Commercial transport aircraft High Low N/E** N/E N/E Soeters & Boer 2000) Military aircraft High Low Little
effect Low N/E
G. A. Klein et al. (1999) Thresholds for quick reactions to anomalies
N/E N/E N/E Low N/E
Vincent & Dubinsky Maladaptive coping with threats N/E N/E N/E Low N/E * Optimum scores: These refer to busy or abnormal situations where the risk to safety is greatest. **N/E: Not evaluated.
Table 3-3: Summary of study results – safety-critical sociotechnical systems
Finally, a caveat: Wealth (per-capita GDP) is closely correlated with high IDV; therefore it is
important to account for wealth before ascribing correlations to cultural traits or scores.
d) Professional sports teams
Sport provided an opportunity to study the effects of culture and diversity in depth due to the
detailed records of multiple projects (i.e. games) for which player details and outcomes were
available; indeed Kahn (2000) described professional sport as a ‘labour market laboratory’
because the life history of every worker (and supervisor) was available (… along with the
team performance data). In addition, there were many levels of cultural diversity
(heterogeneity) across teams in most professional leagues.
Although many studies have taken place on sports performance and team diversity, very few
studies have examined the effects of team member national culture on performance.
i) Football
Haas & Nüesch collected data on the performance of the (German) Bundesliga from 1999/00
until 2005/06 (Haas & Nüesch, 2012) and found that increased national diversity resulted in
reduced team performance. Haas & Nüesch utilised the Shannon diversity index as the
basis for calculating diversity15. On the basis of the researchers’ choice of diversity index,
the author considers the results to be of limited value. Note: The author requested access to
the raw data on which the conclusions were based, but this was not forthcoming.
In order to further assess the results obtained by Haas & Nüesch (in the absence of further
data from them), the author obtained aggregate Bundesliga player nationality data for the
15 As was the case with Blau’s index (see earlier footnote), the Shannon diversity index was based in this case on the number or proportion of different nationalities and was, as a result, insensitive to actual cultural differences within and between teams.
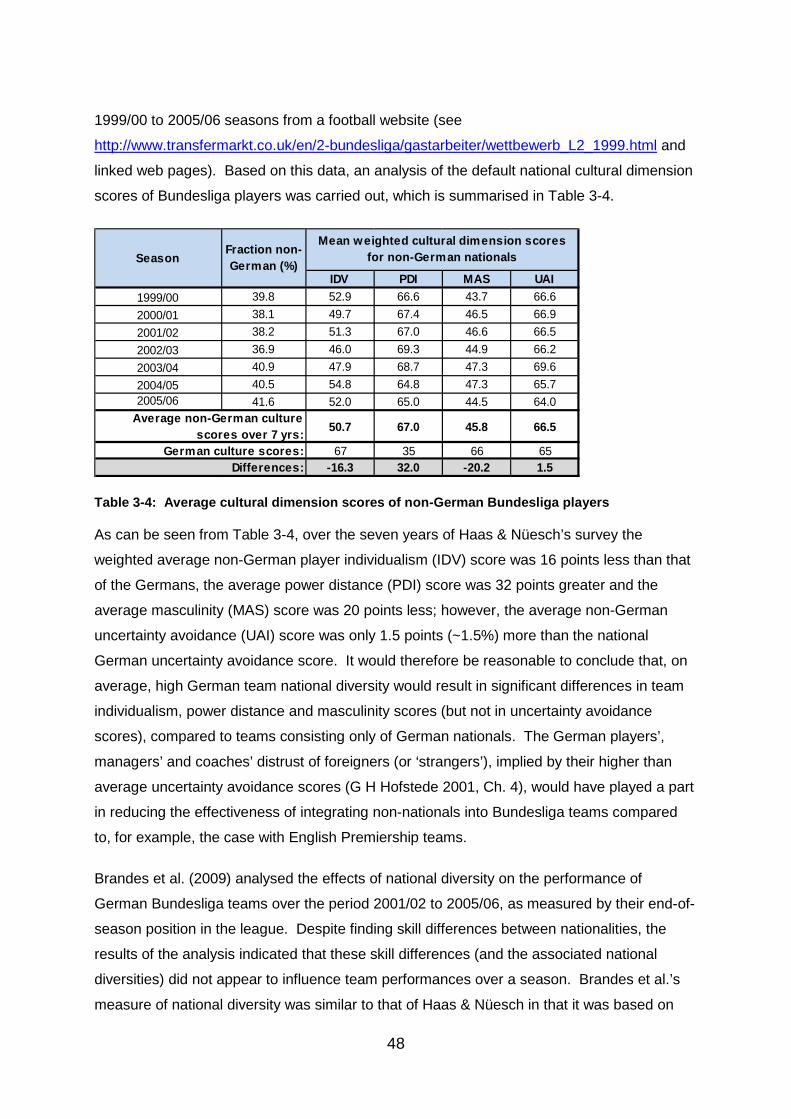
48
1999/00 to 2005/06 seasons from a football website (see
http://www.transfermarkt.co.uk/en/2-bundesliga/gastarbeiter/wettbewerb_L2_1999.html and
linked web pages). Based on this data, an analysis of the default national cultural dimension
scores of Bundesliga players was carried out, which is summarised in Table 3-4.
Table 3-4: Average cultural dimension scores of non-German Bundesliga players
As can be seen from Table 3-4, over the seven years of Haas & Nüesch’s survey the
weighted average non-German player individualism (IDV) score was 16 points less than that
of the Germans, the average power distance (PDI) score was 32 points greater and the
average masculinity (MAS) score was 20 points less; however, the average non-German
uncertainty avoidance (UAI) score was only 1.5 points (~1.5%) more than the national
German uncertainty avoidance score. It would therefore be reasonable to conclude that, on
average, high German team national diversity would result in significant differences in team
individualism, power distance and masculinity scores (but not in uncertainty avoidance
scores), compared to teams consisting only of German nationals. The German players’,
managers’ and coaches’ distrust of foreigners (or ‘strangers’), implied by their higher than
average uncertainty avoidance scores (G H Hofstede 2001, Ch. 4), would have played a part
in reducing the effectiveness of integrating non-nationals into Bundesliga teams compared
to, for example, the case with English Premiership teams.
Brandes et al. (2009) analysed the effects of national diversity on the performance of
German Bundesliga teams over the period 2001/02 to 2005/06, as measured by their end-of-
season position in the league. Despite finding skill differences between nationalities, the
results of the analysis indicated that these skill differences (and the associated national
diversities) did not appear to influence team performances over a season. Brandes et al.’s
measure of national diversity was similar to that of Haas & Nüesch in that it was based on
IDV PDI MAS UAI1999/00 39.8 52.9 66.6 43.7 66.62000/01 38.1 49.7 67.4 46.5 66.92001/02 38.2 51.3 67.0 46.6 66.52002/03 36.9 46.0 69.3 44.9 66.22003/04 40.9 47.9 68.7 47.3 69.62004/05 40.5 54.8 64.8 47.3 65.72005/06 41.6 52.0 65.0 44.5 64.0
50.7 67.0 45.8 66.5
67 35 66 65-16.3 32.0 -20.2 1.5
German culture scores:Differences:
Mean weighted cultural dimension scores for non-German nationalsSeason
Fraction non-German (%)
Average non-German culture scores over 7 yrs:
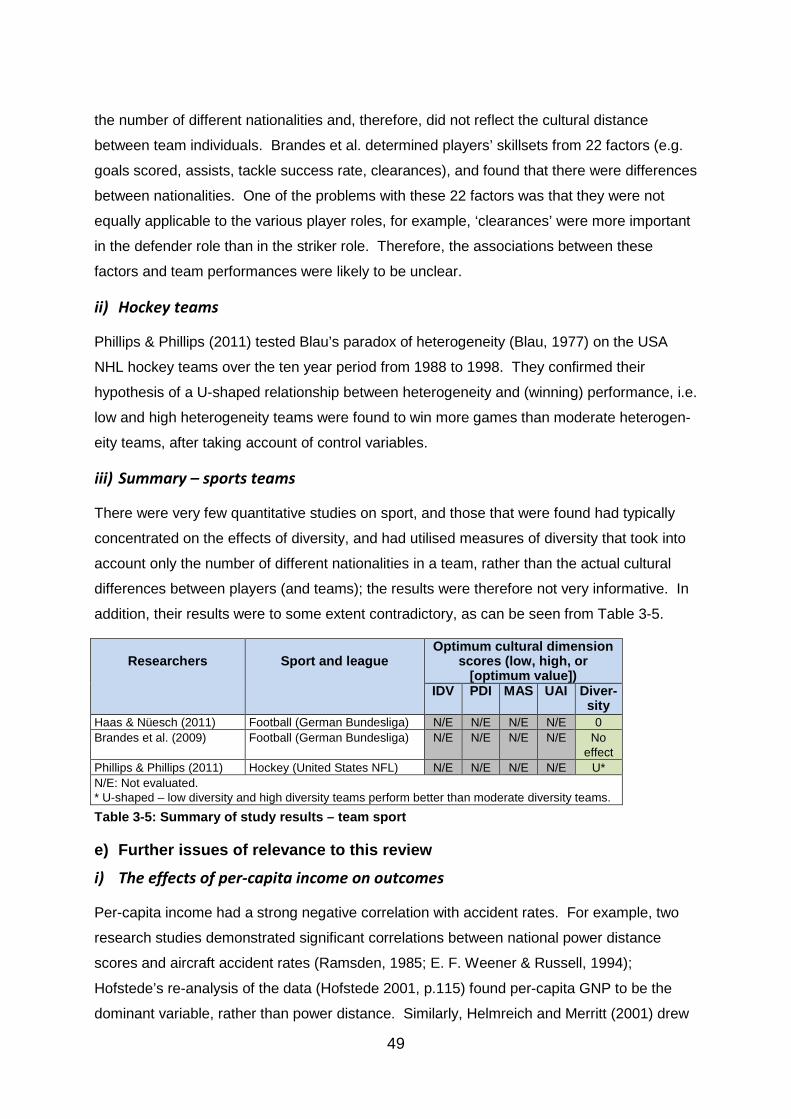
49
the number of different nationalities and, therefore, did not reflect the cultural distance
between team individuals. Brandes et al. determined players’ skillsets from 22 factors (e.g.
goals scored, assists, tackle success rate, clearances), and found that there were differences
between nationalities. One of the problems with these 22 factors was that they were not
equally applicable to the various player roles, for example, ‘clearances’ were more important
in the defender role than in the striker role. Therefore, the associations between these
factors and team performances were likely to be unclear.
ii) Hockey teams
Phillips & Phillips (2011) tested Blau’s paradox of heterogeneity (Blau, 1977) on the USA
NHL hockey teams over the ten year period from 1988 to 1998. They confirmed their
hypothesis of a U-shaped relationship between heterogeneity and (winning) performance, i.e.
low and high heterogeneity teams were found to win more games than moderate heterogen-
eity teams, after taking account of control variables.
iii) Summary – sports teams
There were very few quantitative studies on sport, and those that were found had typically
concentrated on the effects of diversity, and had utilised measures of diversity that took into
account only the number of different nationalities in a team, rather than the actual cultural
differences between players (and teams); the results were therefore not very informative. In
addition, their results were to some extent contradictory, as can be seen from Table 3-5.
Researchers
Sport and league
Optimum cultural dimension scores (low, high, or
[optimum value]) IDV PDI MAS UAI Diver-
sity Haas & Nüesch (2011) Football (German Bundesliga) N/E N/E N/E N/E 0 Brandes et al. (2009) Football (German Bundesliga) N/E N/E N/E N/E No
effect Phillips & Phillips (2011) Hockey (United States NFL) N/E N/E N/E N/E U* N/E: Not evaluated. * U-shaped – low diversity and high diversity teams perform better than moderate diversity teams. Table 3-5: Summary of study results – team sport
e) Further issues of relevance to this review
i) The effects of per-capita income on outcomes
Per-capita income had a strong negative correlation with accident rates. For example, two
research studies demonstrated significant correlations between national power distance
scores and aircraft accident rates (Ramsden, 1985; E. F. Weener & Russell, 1994);
Hofstede’s re-analysis of the data (Hofstede 2001, p.115) found per-capita GNP to be the
dominant variable, rather than power distance. Similarly, Helmreich and Merritt (2001) drew
50
readers’ attention to the potential effects on accident rates of factors such as facility quality
and government regulation (pp.104-5).
ii) Studies that utilised multiple cultural frameworks Several published studies on national culture appeared to ‘mix-and-match’ cultural
dimensions from two or more cultural frameworks, for example that of Hasan & Ditsa (1999).
Because the introduction of non-orthogonal (i.e. overlapping) dimensions would tend to
reduce the strengths of relationships between cultural dimensions and outcomes, or even
reverse them, such studies were for the most part discarded.
3.3.2 Evidence of the effects of culture on intrateam aspects of performance
This section presents an overview from the literature of the intrateam effects of culture on
human performance in various team-related situations. The cultural dimensions referred to
in the section are primarily the original four of Hofstede’s cultural framework.
a) Power distance
In high power distance societies, authority was concentrated in centralised decision-making
structures, there were deep organisational hierarchies, information flow was constrained by
these hierarchies (Hofstede 2001, Ch.3) , and there was a lack of informal ’across-the-
hierarchy’ (horizontal) communications (Khatri, 2009).
Khare (1999) found that that communications between superiors and subordinates in India (a
high power distance country) were primarily via formal channels. Kim (1999) found that
communication in high power distance South Korea was largely top-down, flowing through
the formal chain of command, with little voluntary feedback on the part of subordinates;
upwards communication tended to occur primarily as responses to superiors in formal
settings or to be in the form of indirect, deferential, mitigated speech. Similarly, Offerman &
Hellmann (1997) noted that most communication in high power distance settings was in the
form of commands, i.e. flowing downwards through the formal hierarchy, and that there was
little delegation of authority. Indeed, consultation of subordinates in high power distance
organisations was likely to be construed as a sign of incompetence on the part of the
superior (Francesco & Chen, 2000). Subordinates in high power distance organisations
were typically unwilling to participate in decisions; as a result, managers were inundated with
routine decisions (Khatri, 2009) and likely to suffer role overload (M. F. Peterson et al.,
1995). The senior person in a team or group was expected to possess all the knowledge
relevant to his or her position, even though this was clearly not the case in situations where
51
significant specialisation occurred. As a result, levels of subordinate-initiated communication
were low (Khatri, 2009), decisions were made autocratically (Terzi, 2011) and implemented
more quickly than in a typical low power distance organisation due to lack of consultation
(Graf, Hemmasi, Lust, & Liang, 1990); however, such decisions were likely to be suboptimal
(Khatri, 2009), and employees typically dared not point out errors or mistakes.
In low power distance societies, employees expressed a preference for consultation,
communication typically flowed freely up and down the formal hierarchy and authority for
most decisions was typically delegated to those with the relevant knowledge (Hofstede 2001,
Ch.3). Indeed, attempts to implement decisions without consultation in low power distance
workplaces could potentially result in employee resistance (Brockner, 2001). Xie et al.
(2009) examined the effects of culture on communication effectiveness, finding that low
power distance participants were more effective at communication and interaction (as in a
work situation) than were high power distance participants. However, there was typically
more role ambiguity in low power distance organisations (M. F. Peterson et al., 1995), which
could lead to higher job stress.
Helmreich and Merritt’s five-year survey of commercial airline staff from 23 countries
(Helmreich & Merritt, 2001) revealed that low power distance crew members were willing to
make their views known to their captains, whereas high power distance crew members found
it much more difficult to raise issues with their captains, even when these were safety-related
issues. Asian and South American crews were low in individualism, and this discouraged
them further from drawing their captain’s attention to errors, as there was also the major
issue of loss of face to contend with.
High power distance once offered stability to communities, as every member of society knew
his or her position; however, in advanced societies it discouraged some of the most able
people from contributing fully to their organisations, because their potentially useful ideas
might never be aired. As a result, decisions tended to be suboptimal due to the reduced
range of options under consideration, and might be seriously flawed due to the unwillingness
of subordinates to point out errors. High power distance also discouraged spontaneous
communication between subordinates and leaders; in time-critical situations, for example in
the case of sociotechnical system emergencies, this resulted in reduced shared situation
awareness.
To summarise the above: In high power distance societies and organisations, manage-
ment and decision-making tended to be strongly centralised with little delegation of authority
52
or discussion with subordinates – this could result in suboptimal decisions, quickly taken;
communication was primarily down the hierarchy, with little cross- or upwards communication
(of facts or opinions) by subordinates; shared understandings or shared situation awareness
would typically be low because of the resulting lack of interaction. In low power distance
societies and organisations, management and decision-making tended to be much more
consensus-based, with delegation of authority to the most capable person, and decisions
would be discussed with subordinates; communication typically flowed up and down the
hierarchy, promoting continuous or frequent interactions and improved shared under-
standings or shared situation awareness.
b) Individualism
Members of high individualism societies considered ‘speaking one’s mind’ as reflecting
honesty, whereas members of low individualism (i.e. collectivist) societies considered that
the maintenance of harmony and the avoidance of direct confrontation should always take
precedence (Hofstede 2001, Ch.5, p,236). As a result, team members from high individ-
ualism societies typically communicated in a direct, low context manner, where the intended
meaning was in the message, whereas team members from low individualism (high collec-
tivism) societies typically communicated in an indirect, high context manner, where only a
small part of the meaning was in the message itself, the remainder was inferred from
contextual references and pre-existing knowledge (Ting-Toomey, 1988). Although high
context indirect communication ensured the maintenance of harmony and reduced the risk of
loss of face, it had negative consequences, in particular for urgent safety-critical communi-
cations, as it could lead to reduced shared situation awareness at critical times. For example,
a low individualism subordinate, on detecting an error on the part of his or her superior, could
not typically point this out, but had to attempt to draw the superior’s attention to the error in
such a way that the superior discovered it for himself or herself. This error discovery process
could take a considerable period of time, and could involve the attention of several members
of the team (e.g. aircrew, nuclear power station operators) at a critical time; an aircrew might
only resort to direct communication with their captain when seconds away from a fatal crash;
evidence for this was found in flight recorder voice recordings, for example National Trans-
portation Safety Board (2000). One potential explanation for such behaviour came in the
form of theories about chronically-accessible emotion-related schemas that were based on
cultural norms (Weber & Morris, 2010)16; frequent activation of such schemas could lead to
them taking precedence over important action schemas that had been acquired through
16 The habitual activation of any construct in one’s everyday environment leads to chronic accessibility (Bargh, 1984; Higgins, 1996).
53
training and practice. This was probably the case with face maintenance schemas
associated with members of many Far-Eastern societies.
A further effect of the need to maintain harmony in low individualism societies was that a
need for consensus discouraged individuals from ‘going against the flow’, for example to
suggest ideas that differed significantly from those that the majority were pursuing. This
consensus had an effect on such societies’ approaches to innovation, resulting in a focus on
market-orientated incremental developments and improvements, rather than on novel ideas
and products; in countries such as Japan, Taiwan and South Korea, such a focus was highly
successful, and has proved difficult to replicate in the West. Erez & Nouri (2010) identified
the differences between the innovation approaches and goals of Eastern (collectivist)
societies and Western (individualist) societies in terms of creativity-as-useful/appropriate vs.
creativity-as-novel. The low-individualist consensus that led to reduced novelty in ideas
proved beneficial when it came to implementing an agreed course of action, as all members
typically worked hard to achieve the associated plans.
Many scholars have implied that trust is higher in collectivist countries than in individualist
countries, because of the greater importance that collectivists place on interpersonal relation-
ships (C. C. Chen, Chen, & Meindl, 1998; Etzioni, 1996). However, this has not appeared to
be the case in recent surveys. Realo & Allik (2009) found that trust was higher in individualist
societies when measured in terms of social capital. Huff & Kelly (2003) investigated trust of
in-groups and out-groups exhibited by American individuals and by individuals of six Asian
countries, and found that USA individualists exhibited higher trust of both in-group and out-
group individuals and organisations than did Asian collectivists. The results of an earlier
cross-national survey of Japanese and American respondents by Yamagashi & Yamagashi
(1994) indicated that American respondents were more trusting of people in general than
were the Japanese. The relationships between individualism and trust were complicated by
the fact that another cultural dimension, uncertainty avoidance, also affected the propensity
to trust.
To summarise the above: Low individualism (or high collectivism) reduced the speed and
clarity of communications in teams, and also tended to reduce creativity in teams due to the
drive for harmony and the need to avoid conflict. However, the harmony and commitment
that low individualism engendered enabled teams to perform very effectively at lower
creativity tasks. Low individualism also reduced shared situation awareness in organised
action teams due to issues of face maintenance. It was not clear as to the role that trust
played in team performances, but it appeared that trust in others (not the same as trust in
54
others’ abilities) was higher amongst high individualism individuals than amongst low
individualism individuals.
c) Masculinity
Hofstede (2001, Ch.6, p.318) described low masculinity employees as ‘working in order to
live’, valuing working conditions and social relationships more than performance, under-
selling themselves, being unwilling to relocate their families to enhance their careers and
preferring the achievement of quality of working life. He described high masculinity
employees (in particular, managers) as ‘living in order to work’, valuing interesting work,
performance and pay more than working conditions and social relationships, overselling
themselves, being competitive and willing to relocate their families in order to enhance their
careers.
Low masculinity (high femininity) appears to produce some of the behaviours of low individ-
ualism, in particular compromise-seeking activities; such behaviours are beneficial to team-
working, but suppress the generation and discussion of contentious issues or novel ideas.
Medium-to-high masculinity appears to encourage the generation and presentation of novel
ideas in a team situation. As stated by Hofstede, one of the attributes of a high masculinity
society is a high level of competition. It was therefore surprising that little evidence was
found that high masculinity contributed to industrial or aircraft accident rates. It was also
surprising to find, from a study of medical communication across ten European countries
(Meeuwesen, van den Brink-Muinen, & Hofstede, 2009) that general practitioners in high
masculinity countries devoted more of their time to psychosocial issues (responding to the
emotional issues of patients) and were more satisfied with their work than was the case with
practitioners in low masculinity countries. In their three-decade multi-level review of the
application of Hofstede’s cultural framework, Taras, Kirkman & Steel (2010) examined the
relationships between Hofstede’s original four dimensions and a wide range of organisat-
ionally relevant outcomes. They found that masculinity was strongly correlated with a
preference for a compromising approach to conflict management, rather than an avoiding or
confrontational approach, or cooperation with opponents.
Helmreich & Merritt’s survey of more than 15,000 civil aircraft crew (2001, p.249) found that,
although the crew power distance, individualism and (to a slightly lesser extent) uncertainty
avoidance scores were reasonably correlated with Hofstede’s original IBM country scores,
their masculinity scores were not significantly correlated with Hofstede’s original scores.
Soeters (1997) utilised Hofstede’s Value Surveys Module to carry out a survey of student-
officers at thirteen European military academies. Surprisingly, the masculinity scores were
55
all lower, in most cases much lower, than the standard scores for the student officers’ civilian
compatriots, and were in almost a random ranking compared to the standard Hofstede
scores. There may be certain exceptional issues in play, for example a particularly high level
of self-selection for both civil aviation pilots and military officers, but there may be more
fundamental issues about the nature of this masculinity dimension.
To summarise the above: Masculinity appeared to play a part in generating (or at least
ensuring the presentation of) novel ideas in high creativity teams due to the associated
competitiveness and willingness to engage in conflict behaviour (this would also ensure rapid
communication), but high masculinity could lead to excessive intra-team conflict. However,
there were conflicting results from surveys that utilised default national culture scores, and
cultural value surveys of civil aircraft crew and military officers revealed that actual scores for
this dimension tended to conform less to default national scores than was the case with other
cultural dimensions.
d) Uncertainty avoidance
Compared to members of high uncertainty-avoidance societies, members of low uncertainty-
avoidance societies were lower stressed, less anxious, more open to change and innovation,
curious about, rather than frightened of, what was different, and were more tolerant of
diversity, (Hofstede 2001, Ch.4, p.161). High uncertainty avoidance societies coped with the
many things beyond human control by reducing apparent uncertainties, e.g. by introducing
many laws and rules and by adherence to clearly-defined procedures, rituals, etc.
Offerman & Hellman’s (1997) survey of the attitudes of mid-level managers of a multinational
organisation from 39 countries revealed that high uncertainty avoidance was significantly
associated with managers maintaining control, refusing to delegate and lacking
approachability.
Joy & Kolb (2009) carried out a research investigation into the effects of cultural dimension
scores on preferred learning styles. They reported that students and teachers in high
uncertainty avoidance societies preferred abstract conceptualization and reflective observa-
tion, whereas those in low uncertainty avoidance societies were comfortable with concrete
experience and active experimentation, e.g. training exercises with realistic role play.
Effective mental schemas for dealing with situations such as accidents and emergencies
could only be developed via realistic role play, so this reluctance had negative implications
for the safety of complex sociotechnical systems. Burke et al. (2008) examined data from 68
organizations from 14 nations in order to assess the effectiveness of training in reducing
56
accidents and injuries; they found that workers from high uncertainty avoiding nations were
less well engaged with safety training, that their training was less effective in reducing
accidents and injuries and that they responded to critical situations in a rigid manner. Burke
et al.’s results supported those of Joy & Kolb.
High uncertainty-avoiding Asian and South-American pilots in Helmreich & Merritt’s survey of
commercial airline staff (Helmreich & Merritt, 2001, p.84) were either neutral to or agreed
with the statement that written procedures should be provided for all in-flight situations and
that rules should be obeyed at all times, whereas low uncertainty-avoiding Anglo pilots
strongly disagreed with this statement. This tendency of personnel from high uncertainty-
avoiding societies to follow standard operating procedures (SOPs) more closely than
personnel from low uncertainty-avoiding societies when running complex sociotechnical
systems (such as airliners) could reduce the likelihood of errors – a significant benefit in
normal operating situations, in maintenance activities and in routine manufacturing situations.
However, such personnel would typically persist in following these SOPs (or organisational
rules) when they were no longer relevant to the situation (Beckmann, Menkhoff, & Suto,
2008; Helmreich & Merritt, 2001). Vincent and Dubinsky (2004) examined the response-to-
threat reactions of students from USA (low-to-medium uncertainty avoidance) and France
(high uncertainty avoidance) when faced with threat situations; they reported that the French
students exhibited more maladaptive coping than did the USA students.
G. Klein et al. (1999) stated that tolerance for uncertainty (the inverse of uncertainty
avoidance) influenced the threshold for initial reaction to an anomaly; this was because
problem detection took place when the observer mentally reframed his/her understanding of
a situation; see G. A. Klein et al. (2005) for a more detailed discussion of problem detection.
Personnel with low uncertainty avoidance scores (high tolerance for uncertainty) changed to
a new initial understanding (i.e. reframed) with less information than did personnel with high
uncertainty avoidance scores; although this lower information threshold could lead to more
false alarms, it alerted an individual to anomalies at an earlier stage. The differences in
capability or willingness to deal with uncertainty and unexpected change extended beyond
the environment of fast-reaction organised action teams and crews.
Barr & Glynn (2004) administered a survey to 276 participants on graduate or executive
management courses (47% U.S. citizens, the remainder from Europe and the Far East). The
aim of the survey was to assess the participants’ responses to threats and opportunities
associated with strategic issues. They were particularly interested in participants’
associations between indicators of controllability and threats or opportunities. Their results
57
indicated that participants from high uncertainty avoiding cultures more strongly associated
lack of controllability attributes with threats than did those from low uncertainty avoiding
cultures. Much weaker associations were found based on the power distance, individualism
and masculinity cultural dimensions. These results have implications for the performance of
high innovation teams where, due to the presence of ‘unknowns’, controllability is reduced.
Indeed, Cozzi & Giordani’s (2011) analysis of the effects of ambiguity aversion on countries’
R&D performances (referred to earlier in this thesis) showed that high UAI personnel and
organisations were less effective at R&D, with its potential outcome uncertainties and
ambiguities.
To summarize the above: High uncertainty avoiding cultures preferred order and routine, in
teaching, training, employment and life in general. They were poor at dealing with
uncertainty and disliked to ‘venture into the unknown’, and this had a negative effect on their
creativity. Personnel with high uncertainty avoidance scores tended not to delegate, lacked
approachability (affecting communications). They followed SOPs more closely than
personnel with low scores, which was beneficial to sociotechnical system safety under
normal operating conditions. However, high uncertainty avoidance scores tended to hamper
decision-making in response to rare emergencies because of reduced situation awareness
(due to a lack of realistic training), delayed problem detection and reaction (due to an
unwillingness to mentally reframe) and an unwillingness to abandon inappropriate SOPs.
e) Cultural diversity
Researchers have long claimed that the multiple perspectives of cultural diversity provided
the potential for higher team creative performance, as suggested by Cox & Blake’s ‘value-in-
diversity’ hypothesis, and could also reduce ‘groupthink’ (Cox & Blake 1991). Nemeth (1986)
found that the level of critical analysis relating to decisions amongst alternatives was higher
in groups that included minority views than in groups that did not, resulting in improved
decision processes. McLeod et al. (1996) found that ethnically diverse groups produced
better quality ideas on brainstorming tasks than did ethnically homogeneous groups.
In contrast to the above, Thomas (1999) found that homogenous teams outperformed
multicultural teams in a range of tasks, and Wolf (2002) reported on the unexpected
problems that managers had faced with multicultural teams. Hambrick (1998) reported that
the performance outcomes of multicultural teams had generally been discouraging,
particularly in situations that involved coordinative tasks; the promising areas for multicultural
teams appeared to be in creative tasks, where heterogeneity in values and cognition could
be beneficial. Vodosek ( 2007) investigated the mediation roles of intra-group relationship,
58
process and task conflict on the relationships between cultural diversity and science research
group outcomes; he found that cultural diversity was positively associated with all three forms
of conflict, which were in turn associated with unfavourable group outputs.
Niebuhr (2010) carried out a regression analysis of innovation performance in the various
German regions; this indicated that diverse cultural backgrounds in the workforce might
enhance research & development performance. Kochan et al. (2003) investigated the effects
of race and gender diversity on performance, but found few direct positive or negative
effects. Earley & Mosakowski ( 2000) investigated the performance of five teams whose
members had a wide diversity in nationalities, but had similar educational and work back-
grounds; they found that there were greater communication and conflict problems in
moderately heterogeneous teams than in highly heterogeneous teams; they explained their
results in terms of Lau & Murnighan’s (1998) faultline concept. However, Earley &
Mosakowski based their measure of heterogeneity or diversity on the proportions of different
nationalities (e.g. as in Shannon’s or Blau’s index), rather than on the degree of cultural
distance between team members. Elron (1997) examined the effects of cultural diversity on
the performance of top management teams (TMTs) at 121 subsidiaries of multinational
companies. He assigned Hofstede’s default country scores to team members, and
calculated team cultural diversities based on statistical measures of mean and variance.
Elron found a positive relationship between cultural diversity and TMT performance; in
particular, he found that only diversity in individualism and masculinity were significant for
team performance, whereas diversity in uncertainty avoidance was a significant factor for
intra-team disagreements.
Horwitz & Horwitz (2007) carried out a meta-analysis based on a set of 78 correlations
obtained from 35 journal articles on teams; they considered both task-related diversity
(functional expertise, education and organisational tenure) and bio-demographic diversity
(age, gender and race/ethnicity). They found a positive impact for task-related diversity, but
none for bio-demographic diversity (of which race/ethnicity could be associated to culture).
Stahl et al. (2007) carried out a meta-analysis of 80 empirical studies of multicultural teams;
they concluded that cultural diversity caused process losses due to reduced communication,
reduced social interaction and increased conflict, but that these losses could be partially
offset by increased creativity. They later carried out a further meta-analysis of 108 empirical
studies (Stahl et al. 2010); they concluded that cultural diversity led to process losses
through increased task conflict and reduced social integration (in particular, for co-located
teams), but led to process gains due to increased creativity and satisfaction; no clear
relationship between cultural diversity and overall performance could be demonstrated.
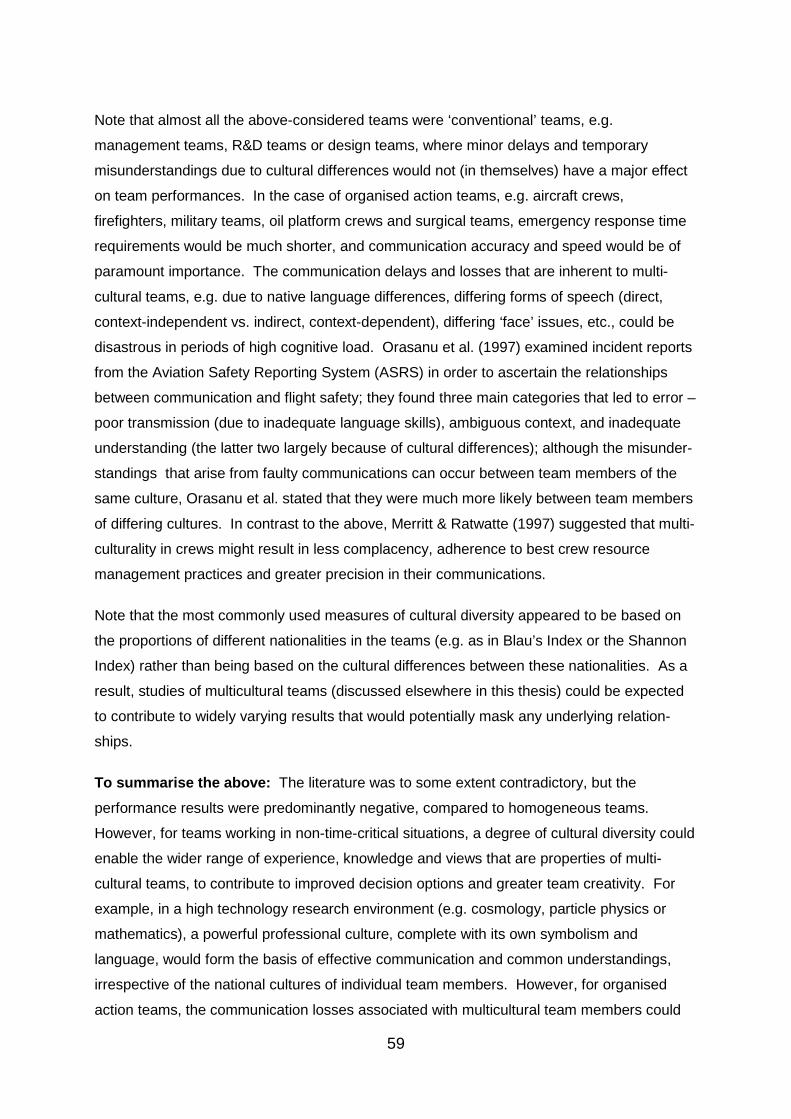
59
Note that almost all the above-considered teams were ‘conventional’ teams, e.g.
management teams, R&D teams or design teams, where minor delays and temporary
misunderstandings due to cultural differences would not (in themselves) have a major effect
on team performances. In the case of organised action teams, e.g. aircraft crews,
firefighters, military teams, oil platform crews and surgical teams, emergency response time
requirements would be much shorter, and communication accuracy and speed would be of
paramount importance. The communication delays and losses that are inherent to multi-
cultural teams, e.g. due to native language differences, differing forms of speech (direct,
context-independent vs. indirect, context-dependent), differing ‘face’ issues, etc., could be
disastrous in periods of high cognitive load. Orasanu et al. (1997) examined incident reports
from the Aviation Safety Reporting System (ASRS) in order to ascertain the relationships
between communication and flight safety; they found three main categories that led to error –
poor transmission (due to inadequate language skills), ambiguous context, and inadequate
understanding (the latter two largely because of cultural differences); although the misunder-
standings that arise from faulty communications can occur between team members of the
same culture, Orasanu et al. stated that they were much more likely between team members
of differing cultures. In contrast to the above, Merritt & Ratwatte (1997) suggested that multi-
culturality in crews might result in less complacency, adherence to best crew resource
management practices and greater precision in their communications.
Note that the most commonly used measures of cultural diversity appeared to be based on
the proportions of different nationalities in the teams (e.g. as in Blau’s Index or the Shannon
Index) rather than being based on the cultural differences between these nationalities. As a
result, studies of multicultural teams (discussed elsewhere in this thesis) could be expected
to contribute to widely varying results that would potentially mask any underlying relation-
ships.
To summarise the above: The literature was to some extent contradictory, but the
performance results were predominantly negative, compared to homogeneous teams.
However, for teams working in non-time-critical situations, a degree of cultural diversity could
enable the wider range of experience, knowledge and views that are properties of multi-
cultural teams, to contribute to improved decision options and greater team creativity. For
example, in a high technology research environment (e.g. cosmology, particle physics or
mathematics), a powerful professional culture, complete with its own symbolism and
language, would form the basis of effective communication and common understandings,
irrespective of the national cultures of individual team members. However, for organised
action teams, the communication losses associated with multicultural team members could
60
reduce the teams’ abilities to handle exceptions and emergencies.
3.3.3 Summarising evidence of the effects of culture on both external and intra-team aspects of team performance
In this subsection, the areas of external team and intra-team performance affected by team
member cultures are summarised based on Subsections 3.3.1 and 3.3.2. These are
grouped under five headings. Note that these are tendencies only - individuals from the
same cultural group can display opposite cultural tendencies.
a) Management and decision-making
Culture (as measured via the power distance, individualism and uncertainty avoidance
scores) has a major effect on subordinate/superior relationships. Some tasks and missions
are best served by high power distance, authoritarian, strongly centralised management, for
example highly automated factory systems or missions involving large military manoeuvres;
others, for example complex decisions requiring wide or deep knowledge are typically best
served by the consensus-based decentralised, delegating management that tends to be a
feature of low power distance, low uncertainty-avoiding cultures. In some environments
performance is best served by the rigid adherence to rules or standard operating procedures
(SOPs) that tend to be a feature of high uncertainty-avoiding cultures, e.g. in many
production and maintenance environments; in other environments, the ability to recognise
when to abandon rules or SOPs may ‘save the day’, for example, when an aircraft is no
longer operating within its normal flight envelope. Where it is important to recognise and
correct errors (particularly if time is a factor), the improved team communication of low power
distance, low uncertainty avoiding cultures, and the context-free communication of high
individualism cultures combine to provide prompt accurate responses.
b) Creativity and innovation
Some team goals require an ability to produce (and present) a large number of ideas, go
against the consensus and engage in a degree of conflict; others require an ability to take
new ideas forward towards usable concepts; yet others require an ability to implement
existing technologies into products and processes; in this latter situation, disciplined concen-
tration on the task in hand is better than constantly exploring new ideas. Culture, via
pressure to conform, willingness to speak out and attitudes to uncertainty, has a
considerable effect on creativeness.
61
c) Interaction (communication and co-ordination within the team)
Some team situations require rapid, accurate communication and continuous co-ordination,
best achieved with low power distance, high individualism and low uncertainty avoidance;
other team situations require complex but non-time-critical communication, where cultural
factors are less critical, although high power distance will still impede contributions from
subordinates. Cultures, due to face issues (in the case of low individualism) and status
issues (in the case of high power distance), vary widely in the degree to which rapid, direct,
factual communication can occur. Cultural diversity impedes accurate communication, due
to differences in default assumptions and language.
d) Handling uncertainty and dealing with failures
Some environments and team goals result in highly predictable activities and/or outcomes;
other environments result in highly unpredictable activities and/or outcomes that must be
accommodated by the team or crew. Cultures (in particular, as measured by their
uncertainty avoidance scores) vary greatly in their capabilities to deal with uncertainty.
e) Situation awareness
Some team situations require an ability to reframe and react early based on anomalous cues,
others are best served by a preference to stick to standard procedures until there is no
alternative but to change. Culture, in particular uncertainty avoidance, heavily influences the
communication, training and reframing activities that are required for effective situation
awareness. Power distance, individualism, uncertainty avoidance and cultural diversity affect
the communications that are vital part of transforming individual situation awareness into joint
or shared situation awareness.
Summarising the evidence from subsections 3.3.1(c) and 3.3.2, Figure 3-4 captures the key
relationships between culture and sociotechnical team performance (e.g. aircrews, oil
platform operators) when under stress, e.g. due to emergencies or system failure.
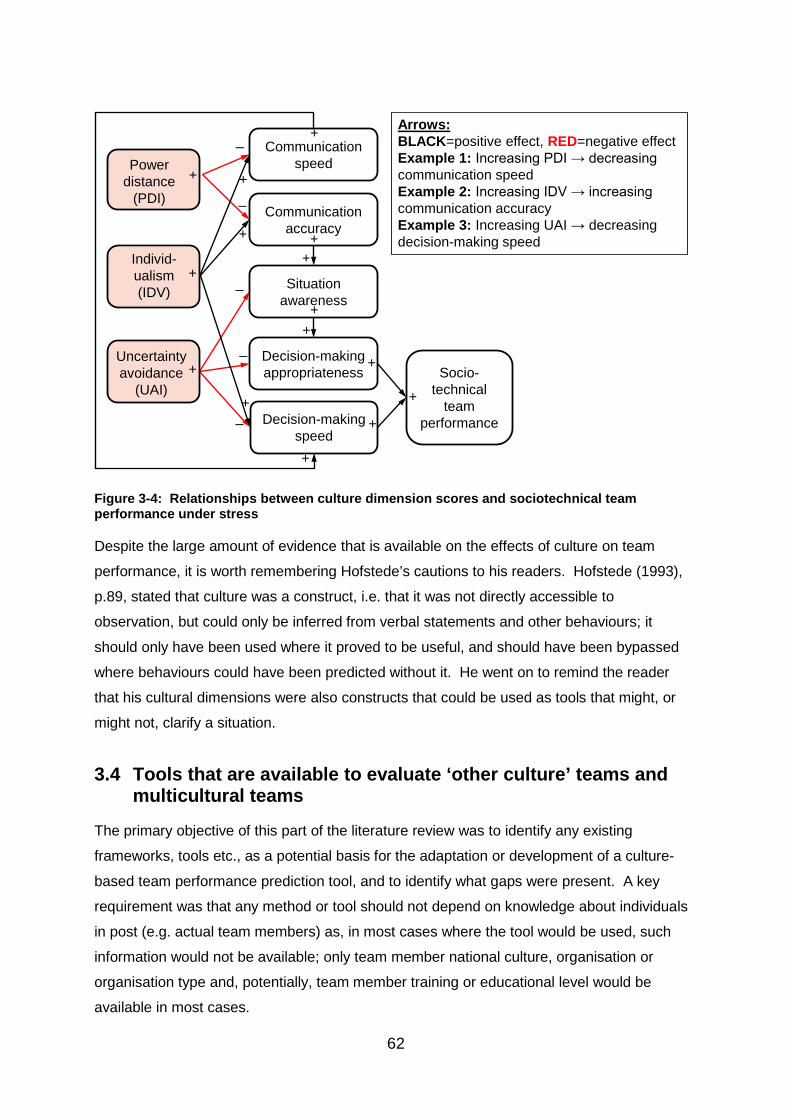
62
Figure 3-4: Relationships between culture dimension scores and sociotechnical team performance under stress
Despite the large amount of evidence that is available on the effects of culture on team
performance, it is worth remembering Hofstede’s cautions to his readers. Hofstede (1993),
p.89, stated that culture was a construct, i.e. that it was not directly accessible to
observation, but could only be inferred from verbal statements and other behaviours; it
should only have been used where it proved to be useful, and should have been bypassed
where behaviours could have been predicted without it. He went on to remind the reader
that his cultural dimensions were also constructs that could be used as tools that might, or
might not, clarify a situation.
3.4 Tools that are available to evaluate ‘other culture’ teams and multicultural teams
The primary objective of this part of the literature review was to identify any existing
frameworks, tools etc., as a potential basis for the adaptation or development of a culture-
based team performance prediction tool, and to identify what gaps were present. A key
requirement was that any method or tool should not depend on knowledge about individuals
in post (e.g. actual team members) as, in most cases where the tool would be used, such
information would not be available; only team member national culture, organisation or
organisation type and, potentially, team member training or educational level would be
available in most cases.
+
+
_
_
_
+
_
+
_
+Uncertainty avoidance
(UAI)
+
+
+
Power distance
(PDI)
Individ-ualism (IDV)
+
+Communication
speed
+Decision-making appropriateness
+Decision-making speed
+
Communication accuracy
+
Situation awareness
Socio-technical
team performance
+
Arrows:BLACK=positive effect, RED=negative effectExample 1: Increasing PDI → decreasing communication speedExample 2: Increasing IDV → increasing communication accuracyExample 3: Increasing UAI → decreasing decision-making speed
+
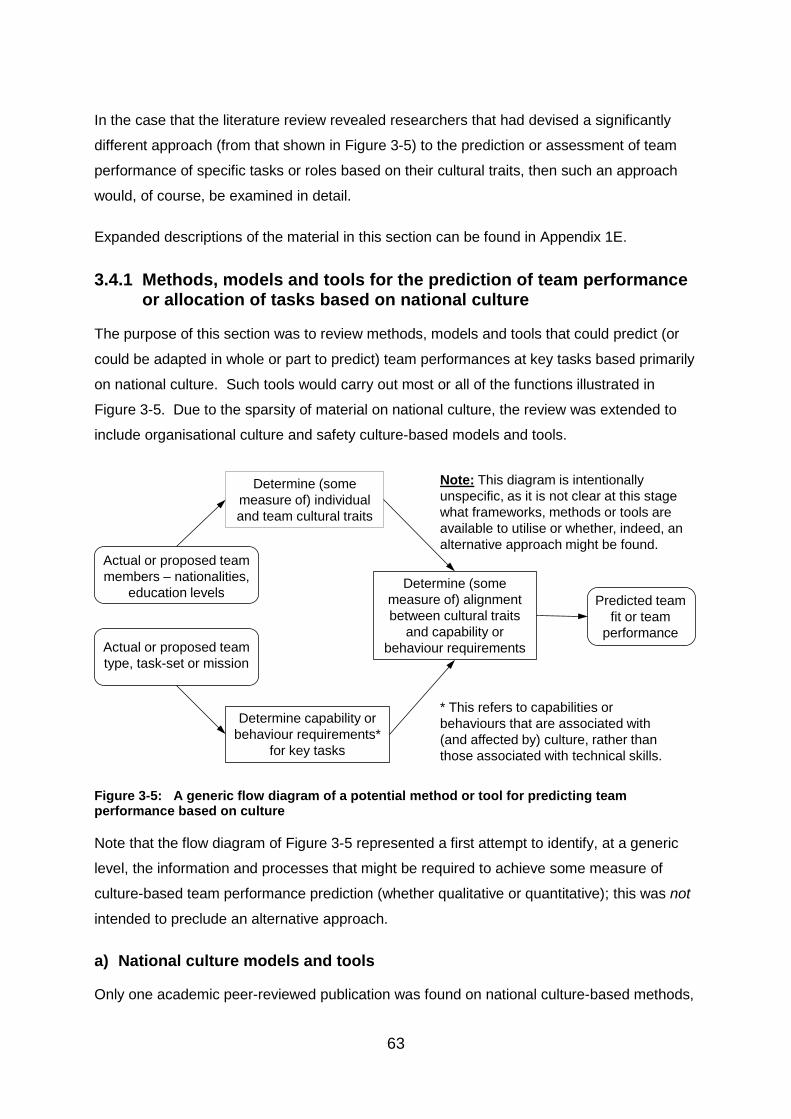
63
In the case that the literature review revealed researchers that had devised a significantly
different approach (from that shown in Figure 3-5) to the prediction or assessment of team
performance of specific tasks or roles based on their cultural traits, then such an approach
would, of course, be examined in detail.
Expanded descriptions of the material in this section can be found in Appendix 1E.
3.4.1 Methods, models and tools for the prediction of team performance or allocation of tasks based on national culture
The purpose of this section was to review methods, models and tools that could predict (or
could be adapted in whole or part to predict) team performances at key tasks based primarily
on national culture. Such tools would carry out most or all of the functions illustrated in
Figure 3-5. Due to the sparsity of material on national culture, the review was extended to
include organisational culture and safety culture-based models and tools.
Figure 3-5: A generic flow diagram of a potential method or tool for predicting team performance based on culture
Note that the flow diagram of Figure 3-5 represented a first attempt to identify, at a generic
level, the information and processes that might be required to achieve some measure of
culture-based team performance prediction (whether qualitative or quantitative); this was not
intended to preclude an alternative approach.
a) National culture models and tools
Only one academic peer-reviewed publication was found on national culture-based methods,
Determine (some measure of) individual and team cultural traits
Determine capability or behaviour requirements*
for key tasks
Determine (some measure of) alignment between cultural traits
and capability or behaviour requirementsActual or proposed team
type, task-set or mission
Actual or proposed team members – nationalities,
education levels Predicted team fit or team
performance
* This refers to capabilities or behaviours that are associated with (and affected by) culture, rather than those associated with technical skills.
Note: This diagram is intentionally unspecific, as it is not clear at this stage what frameworks, methods or tools are available to utilise or whether, indeed, an alternative approach might be found.
64
models or tools for the prediction of team performance or the allocation of tasks. This
publication, by Sivakumar & Nakata (2003), split the product development process into two
stages (initiation and implementation) as recommended by Johne (1984). Overall, the
Sivakumar & Nakata model was too limited (new product development only), only produced a
set of values for an ‘optimum culture’, and relied on a set of culture ‘slope coefficients’ that
were not clearly justified in the paper. An examination of citations of this and one of their
earlier papers on a similar topic (Nakata & Sivakumar, 1996) failed to identify any ‘culture
tool’ related publications. Earley &Gibson’s (2002) qualitative, two-level model of multicul-
tural teams incorporated six factors at the level of the individual team member and five
factors at the group level; this model could not as such be applied to a real team, and only
provided some very general guidance linking factors to performance effects (e.g. competi-
tiveness can lead to fragmentation).
Due to the dearth of academic publications of relevance to national culture-based tools, the
search was widened to include non-academic sources, and to review organisational culture
and safety culture tools. An examination of non-academic sources of culture tools, in
particular, commercial web sites and business management books, revealed three ‘national
culture’ tools. The first, ‘The CULTURE Tool’ by Catholic Health was a very simple paper-
based checklist; it appeared to be targeted primarily at U.S. health workers travelling abroad.
The second national culture tool (‘The Culture Compass Survey’ - see http://geert-
hofstede.com/cultural-survey.html) was provided by Hofstede17 and the consultancy
company itim international. This tool enabled the user to select his/her home country,
country of interest and proposed role, then take a survey of cultural preferences. Following
this, cultural differences compared to home country and country of interest default national
cultures were revealed and potential pitfalls and problems were highlighted. This tool
appeared to carry out, to some degree, several of the activities presented in Figure 3-4; it
produced a cultural profile (for an individual, not a team), and took limited account of the
individual’s role (rather than tasks). The tool was aimed at the determination of the degree of
fit of an individual ‘outsider’ to another culture, rather than the degree of fit of a team’s culture
to a task set or mission. Interestingly, Hofstede has in the past repeatedly warned about the
ecological fallacy arising from assigning cultural scores (or cultural preferences) to an
individual (Hofstede 2001, p.16). Note that the Culture Compass Survey was released at a
late stage of the work described in this thesis.
The third national culture tool, by DFA Intercultural Global Solutions, (‘CultureCompass’ - see 17 Hofstede’s academic contributions will be discussed later in this thesis.
65
http://dfaculturecompass.com/) was similar to the Hofstede-based Culture Compass Survey
(above), it asked the user to select a role, to take a survey consisting of ten questions (each
with a sliding scale between two extremes), and then to enter his/her nationality. The tool
then displayed the differences between the user and the national average, and reproduced
standard material on the particular dimensions.
b) Organisational culture models and tools
A number of the more interesting organisational culture instruments described in the
academic literature were assessed, for example, the Organizational Culture Inventory
(Cooke & Szumal, 1993), Competing Values Framework (Cameron & Quinn, 2006).
Typically, following the utilisation of checklists, questionnaires, interviews, discussion groups
or a combination of these, the organisation’s current or proposed culture was allocated into
one of several types (via a taxonomic or dimensional scheme); these types were clearly
related to or affected by national culture, but very little reference was made as to the
potential relationships to, and effects of, national culture. None of these organisational
culture tools contained elements that could be adapted to a national-culture-based tool; in
particular, these tools did not enable the consideration of relationships between cultural
elements and task performance requirements. The majority of non-academic sources
presented commercial variants on organisational culture tools, for example ‘lean culture’
tools, ‘cultural transformation’ tools, ‘culture alignment’ tools and ‘customer culture’ tools.
Few of the publications and commercial tools on organisational culture acknowledged the
heavy influence of national culture; as a result, they would have had little relevance outside
western cultures. In addition, the organisational culture tools appeared not to consider task-
related requirements of organisations, instead they compared actual corporate culture with a
target culture that was thought to be conducive from specific viewpoints (e.g. ‘the customer’).
c) Safety culture models and tools
The safety culture models and tools had many similarities to those of organisational culture,
again employing checklists, questionnaires, interviews, discussion group, etc. However,
none of the safety-related dimensions, nor any task-related aspects, appeared to offer any
contribution to the culture tool requirements of the author’s research. As was the case with
organisational culture, none of the safety culture tools could be adapted to a national-culture-
based tool, nor did these tools enable the consideration of relationships between the cultural
elements and the task performance requirements associated with the teams’ purposes.
66
d) Summary on culture tools
To summarise this section, no national culture-based models or tools were found that could
enable the prediction of the performance of a proposed or current team in a range of
team/task situations. No national, organizational or safety culture tools were found that could
be adapted effectively to meet the requirements of the research described in this thesis. The
tool that came nearest to meeting the requirements was that of Hofstede and itim inter-
national. There appeared to be a significant gap, in both academia and commerce/industry,
in the provision of tools or guidance for culture-based team selection, adaptation and
performance prediction for critical tasks.
3.4.2 Cultural frameworks
In the absence of national culture-based models, methods and tools for the estimation or
prediction of team performance, the purpose of this section was to ascertain the availability
and capabilities of frameworks, models, methods or tools for the capture of national cultural
traits of individuals and/or teams. These could form the basis of, or at least provide guidance
in the construction of, the ‘cultural side’ of a performance prediction model and tool (see
Figure 3-5). Note that Figure 3-5 represented a first attempt to identify, at a generic level, the
information and processes that might be required to achieve some measure of culture-based
team performance prediction (whether qualitative or quantitative); this was not intended to
preclude an alternative approach. As no practicable culture-based team performance
prediction methodologies or tools were found, the flow diagram could provide a basis for
reviewing the literature for potential components of such a method or tool.
Over the last half century, researchers in human culture have developed a variety of quanti-
tative instruments for the measurement of culture. Typically, these instruments or frame-
works encapsulated sets of cultural factors, attributes, orientations or dimensions that were
presented as a binary or ternary choice between qualitative alternatives, or in terms of a
quantitative scale between two extremes, and appeared to capture meaningful differences
between people of different nationalities. Although there was no universally-agreed set of
cultural dimensions, certain dimensions (and minor variations on them) appeared in several
of the cultural frameworks, and had been found to be statistically robust.
A review of cultural frameworks has been carried out by the student, for which the initially-
identified authors were Hofstede, House et al., Triandis and Schwartz. Academic books
detailing many of these frameworks represented a useful starting point; these initially-
perused academic books included “Culture’s Consequences” (G H Hofstede, 1980),
67
“Cultures and Organizations” (Geert Hofstede, 1991), “Culture, Leadership and
Organizations” (House et al., 2004), “Culture and Social Behavior” (Triandis, 1993), “Beyond
Individualism/Collectivism” (S H Schwartz, 1994) and “Multinational Work Teams: A New
Perspective” (Earley & Gibson, 2002). Academic papers by these authors, and reviews by
other authors of their work, were then retrieved and examined before expanding the review
via forward- and backward-citations. Following reading and commenting on these further
papers, sets of keywords and phrases were identified, and utilised via the databases/search
engines described in Subsection 3.2.2.
There are now too many culture-measurement instruments (or frameworks) for all to be
detailed in this thesis, for example, a recent review paper (Taras, Rowney, & Steel, 2009)
identified 121 such instruments. Therefore, this review was limited to the higher impact
cultural frameworks, as only these could offer the range of study results that would enable
the researcher to extract useful, predictive relationships between culture and performance.
In providing a form of ‘cultural location’ (see top box of Figure 3-5), the above frameworks
could, if combined with task/skill frameworks, provide the basis for a culture-based team
performance prediction methodology. Note that most of the descriptions of cultural
dimensions in this section are, of necessity, limited; the references provide access to detailed
definitions and explanations.
a) National or ethnic culture frameworks
National (or ethnic) culture typically reflects the most profound aspects of culture (compared
to occupational, organisational, etc.), as it is inculcated in individuals from a very age. This
section describes the higher impact frameworks.
Kluckhohn & Strodtbeck’s value orientations method (VOM) (Hills, 2002; Kluckhohn &
Strodtbeck, 1961) has been utilised to identify cultural differences between groups; it
encapsulated the work of the Harvard Values Project that took place during the 1940s and
1950s (Bahr, 2006). The method was based on five concerns or cultural orientations, each
with three descriptive values or responses – human nature (good, mixed, evil), man-nature
relationship (dominant, in harmony, subordinate), time sense (past, present, future), activity
(doing, becoming, being) and social relations (individual, collateral, hierarchical). The
associated VOM assessment survey tool enabled members of communities to rank the
responses for each of the above concerns, thus describing their own cultures as they saw
them. Unsurprisingly, people of different cultures chose different responses.
68
The VOM was successfully applied in a range of cross-cultural situations including higher
education, healthcare and conflict resolution in public resource management (Gallagher,
2001b), and could be used to train people to be aware of cultural differences.
Triandis’ cultural framework (Triandis 1995; 1996) was composed of five cultural
syndromes (or dimensions) – cultural complexity, cultural tightness, individualism, horizontal
collectivism and vertical collectivism, each with two descriptive values (the equivalent of low
and high) to choose from, i.e. a total of 32 (25) cultural categories. Whereas many cultural
frameworks treated individualism/collectivism as expressing the extremes of a single
dimension, Triandis treated individualism and collectivism as three separate syndromes,
including two types of collectivism – horizontal (‘interdependence and oneness’) and vertical
(‘serving the group’).
Hofstede’s cultural framework (1984) emerged out of a series of research investigations
into culture at IBM sites in forty countries, between 1967 and 1973. Based on statistical
analyses of responses to a large set of questions, four largely independent cultural
dimensions were originally identified – power distance, individualism, masculinity and
uncertainty avoidance; national scores were derived for these and normalised to a range
between 0 and 100. More detailed descriptions of these dimensions can be found in
Hofstede (2001), chapters 3 to 6. Since Hofstede’s original analyses, many further countries
have been evaluated and, at the start of this research, scores were available for 76 countries
and regions (representing a large proportion of the World’s population). Two more dimen-
sions, long term orientation (Hofstede 2001, Ch.7) and indulgence vs. restraint (Hofstede &
Minkov 2010, Ch.8); however, at the time the author began his research, relatively few
country values were available for long term orientation and no indulgence vs. restraint
scores were available.
Trompenaars’ cultural framework (F. Trompenaars, Hampden-Turner, & C., 1997) was
based on his consultancy experiences. He concluded from these that cultures are distin-
guished from each other by the ways that their members solve three fundamental problems -
their relationships with other people, with (or to) time, and with nature. He collected data
from his international business clients and their employees. In particular, Trompenaars
wished to know how these people resolved dilemmas. He developed seven cultural
dimensions that appeared to explain most of the variations in behaviour that he had
observed via the questionnaires (Fons Trompenaars & Hampden-Turner, 1997). These
dimensions were universalism vs. particularism, individualism vs. communitarianism,
specificity vs. diffusion, affectivity vs. neutrality, achieved status vs. ascribed status, inner
69
direction vs. outer direction and sequential time vs. asynchronous time.
The GLOBE cultural framework was based on one of the largest recent studies of national
culture (House et al., 2004); it examined the attitudes and beliefs of more than 17,000
managers from 950 organisations in 62 countries. The study was primarily focused on
cultural influences on organisational leadership. Based on detailed analyses of
questionnaire results, the GLOBE researchers classified societies into ten regional clusters -
Anglo, Latin Europe, Nordic Europe, Germanic Europe, Eastern Europe, Latin America,
Middle East, Sub-Saharan Africa, Southern Asia and Confucian Asia. The GLOBE study
identified nine cultural dimensions. Of these, assertiveness, gender egalitarianism,
institutional collectivism, in-group collectivism and power distance originated from Hofstede’s
cultural dimensions. Future orientation was based on Kluckhohn and Strodtbeck’s time
sense orientation (Kluckhohn & Strodtbeck, 1961) and was also related in concept to
Hofstede’s long-term orientation cultural dimension. Humane orientation was based on
Kluckhohn and Strodtbeck’s human nature orientation, Putnam’s civil society work and
McClelland’s affiliative motive work.
Schwartz’s culture-level value scale (or cultural values framework) was based on data
collected and analysed data from 49 nations (Shalom H Schwartz, 1999, 2006). He
identified seven ‘cultural level value types’, which could be structured or condensed as
‘cultural orientations’ along three polar dimensions, mastery vs. harmony, embeddedness vs.
autonomy and hierarchy vs. egalitarianism.
A summary of national culture frameworks: The most commonly referenced culture
frameworks (described earlier) have been compared to each other via a table, enabling the
reader to observe the differing ‘cultural coverage’ of the various researchers’ offerings. The
six vertical columns of Table 3-6 represent the cultural dimensions, orientations or
syndromes of the six cultural frameworks that are being compared. The table rows associate
dimensions that are similar, based on the descriptions of their authors. It can be seen from
the table that, for these six publicised and widely used cultural frameworks, individualism vs.
collectivism (or its near equivalent) is the only cultural dimension common to all. Power
distance (or its near equivalent) appears in four of the six frameworks. Uncertainty
avoidance and man-nature relationships (or their near equivalents), appear in three of the
frameworks.
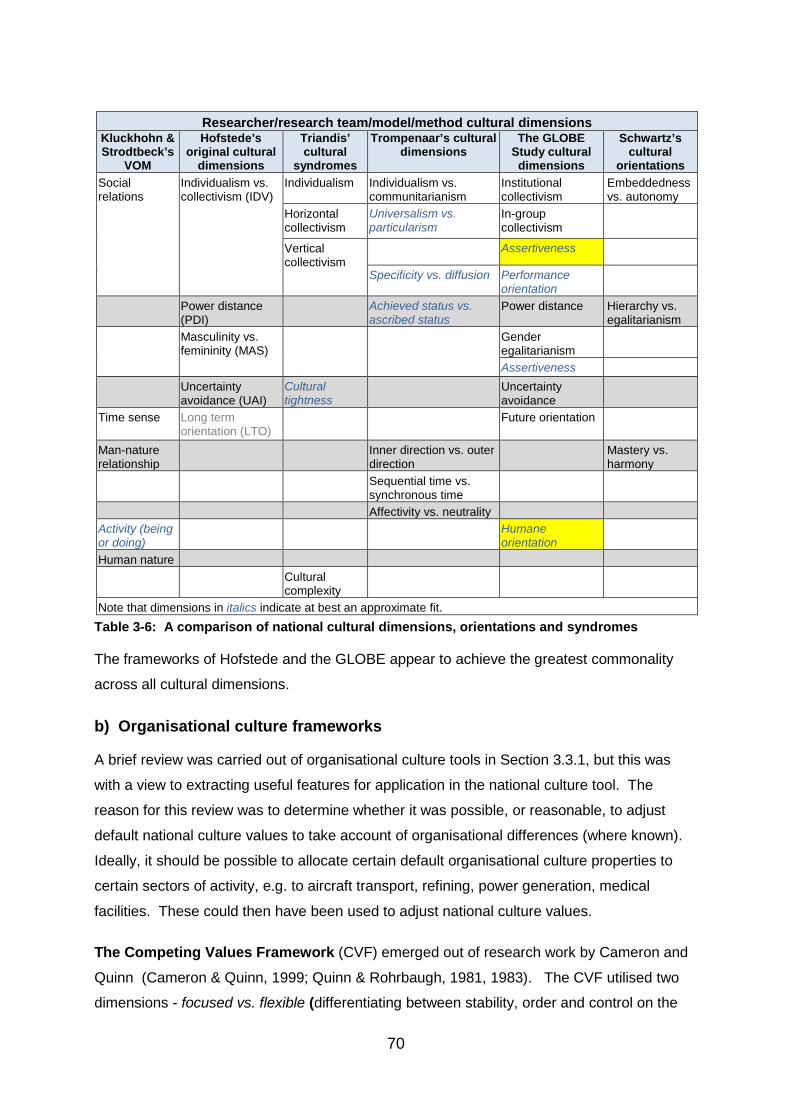
70
Researcher/research team/model/method cultural dimensions Kluckhohn & Strodtbeck’s
VOM
Hofstede’s original cultural
dimensions
Triandis’ cultural
syndromes
Trompenaar’s cultural dimensions
The GLOBE Study cultural dimensions
Schwartz’s cultural
orientations Social relations
Individualism vs. collectivism (IDV)
Individualism Individualism vs. communitarianism
Institutional collectivism
Embeddedness vs. autonomy
Horizontal collectivism
Universalism vs. particularism
In-group collectivism
Vertical collectivism
Assertiveness
Specificity vs. diffusion Performance orientation
Power distance (PDI)
Achieved status vs. ascribed status
Power distance Hierarchy vs. egalitarianism
Masculinity vs. femininity (MAS)
Gender egalitarianism
Assertiveness Uncertainty
avoidance (UAI) Cultural tightness
Uncertainty avoidance
Time sense Long term orientation (LTO)
Future orientation
Man-nature relationship
Inner direction vs. outer direction
Mastery vs. harmony
Sequential time vs. synchronous time
Affectivity vs. neutrality Activity (being or doing)
Humane orientation
Human nature Cultural
complexity
Note that dimensions in italics indicate at best an approximate fit. Table 3-6: A comparison of national cultural dimensions, orientations and syndromes
The frameworks of Hofstede and the GLOBE appear to achieve the greatest commonality
across all cultural dimensions.
b) Organisational culture frameworks
A brief review was carried out of organisational culture tools in Section 3.3.1, but this was
with a view to extracting useful features for application in the national culture tool. The
reason for this review was to determine whether it was possible, or reasonable, to adjust
default national culture values to take account of organisational differences (where known).
Ideally, it should be possible to allocate certain default organisational culture properties to
certain sectors of activity, e.g. to aircraft transport, refining, power generation, medical
facilities. These could then have been used to adjust national culture values.
The Competing Values Framework (CVF) emerged out of research work by Cameron and
Quinn (Cameron & Quinn, 1999; Quinn & Rohrbaugh, 1981, 1983). The CVF utilised two
dimensions - focused vs. flexible (differentiating between stability, order and control on the
71
one hand, and flexibility, discretion and dynamism on the other) and internal vs. external (differentiating between an internally orientated focus on unity, integration and collaboration
on the one hand, and a focus on competition, rivalry and differentiation on the other). The
associated organization culture assessment instrument (OCAI) covered six categories of
organisation-related statements. By allocating a total of 100 points across the four
statements in each category (a total of 600 points), a set of scores emerged that located the
organisation within the four CVF quadrants. This allocation exercise was typically carried out
for the ‘as-is’ organisation, and again for the ‘would like to be’ organisation. The two
orthogonal dimensions produced four quadrants; companies falling into these four quadrants
were identified as hierarchy (focus/internal), market (focus/external), clan (flexible/internal)
and adhocracy (flexible/external).
Deal & Kennedy’s organisational culture framework (1988) utilised two cultural
dimensions - rapidity of feedback and reward (the speed with which companies learned
whether their actions and strategies have been successful), and degree of risk or uncertainty (the amount of risk (or uncertainty) associated with the organisation’s key activities). These
two dimensions produced four quadrants of culture (as with the earlier-presented CVF);
companies falling into these four quadrants were identified as possessing process culture
(slow/low-risk), bet-the-company culture (slow/high-risk), work-hard-play-hard culture
(rapid/low-risk) and tough-guy-macho culture (rapid/high-risk). Each of these company
cultures fitted a particular type of business. For example, the ‘tough-guy’, macho culture
(high risk, rapid feedback) was associated with high-stress organizations that focused
primarily on the present, facing constant risk of failing to achieve targets and losing rewards,
for example sports and hospital surgery. By way of contrast, the process culture (slow
feedback/reward, low risk) was typically a slow plodding bureaucracy intent on maintaining
the status quo (past=present=future).
Harrison’s organisational culture framework: Harrison (1972) argued that there were six
‘interests’ associated with organisations, which formed the basis of ideological tension and
struggle. He proposed four organisational ideologies that emerged out of these – power
orientation, role orientation, task orientation and person orientation. Looking to national
culture dimensions, Harrison’s power orientation could (from its description) be associated
with high power distance, his role orientation could be associated with high uncertainty
avoidance, and the other two with aspects of high masculinity and high individualism.
However, in the absence of associations between the above orientations and particular
sectors, it was not feasible for it to be adopted for the research work described in this thesis.
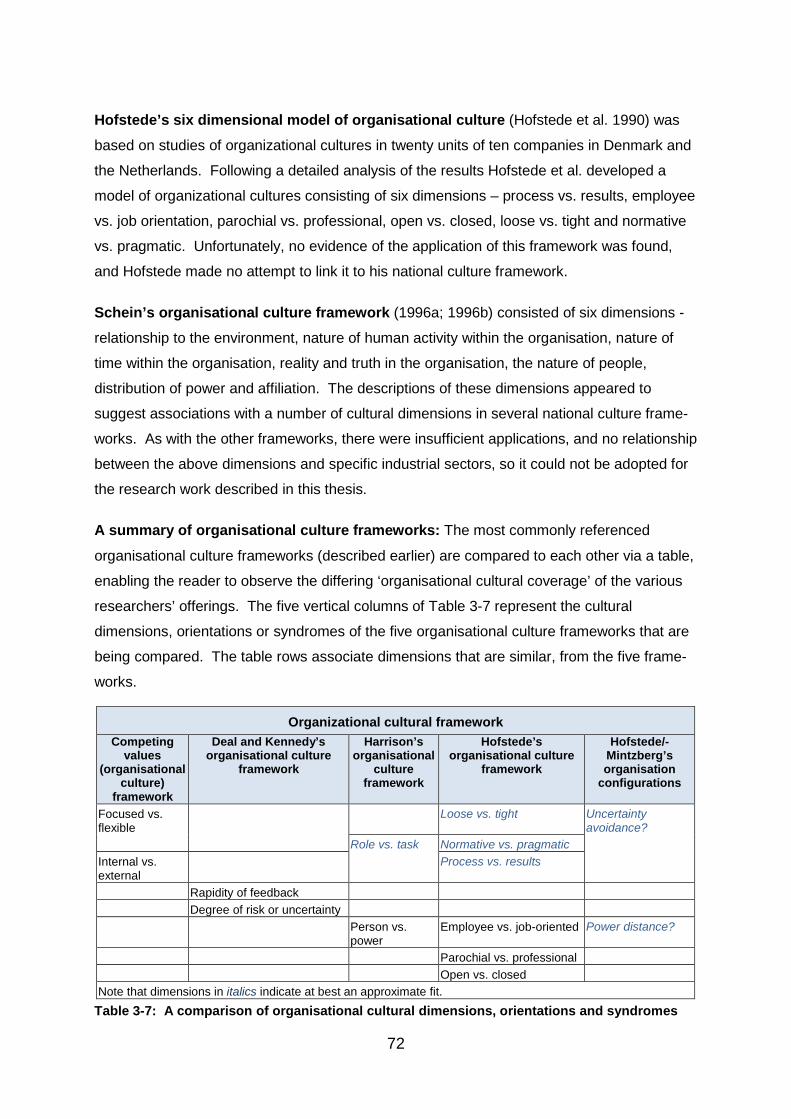
72
Hofstede’s six dimensional model of organisational culture (Hofstede et al. 1990) was
based on studies of organizational cultures in twenty units of ten companies in Denmark and
the Netherlands. Following a detailed analysis of the results Hofstede et al. developed a
model of organizational cultures consisting of six dimensions – process vs. results, employee
vs. job orientation, parochial vs. professional, open vs. closed, loose vs. tight and normative
vs. pragmatic. Unfortunately, no evidence of the application of this framework was found,
and Hofstede made no attempt to link it to his national culture framework.
Schein’s organisational culture framework (1996a; 1996b) consisted of six dimensions -
relationship to the environment, nature of human activity within the organisation, nature of
time within the organisation, reality and truth in the organisation, the nature of people,
distribution of power and affiliation. The descriptions of these dimensions appeared to
suggest associations with a number of cultural dimensions in several national culture frame-
works. As with the other frameworks, there were insufficient applications, and no relationship
between the above dimensions and specific industrial sectors, so it could not be adopted for
the research work described in this thesis.
A summary of organisational culture frameworks: The most commonly referenced
organisational culture frameworks (described earlier) are compared to each other via a table,
enabling the reader to observe the differing ‘organisational cultural coverage’ of the various
researchers’ offerings. The five vertical columns of Table 3-7 represent the cultural
dimensions, orientations or syndromes of the five organisational culture frameworks that are
being compared. The table rows associate dimensions that are similar, from the five frame-
works.
Organizational cultural framework Competing
values (organisational
culture) framework
Deal and Kennedy’s organisational culture
framework
Harrison’s organisational
culture framework
Hofstede’s organisational culture
framework
Hofstede/-Mintzberg’s organisation
configurations
Focused vs. flexible
Loose vs. tight Uncertainty avoidance?
Role vs. task
Normative vs. pragmatic Internal vs. external
Process vs. results
Rapidity of feedback Degree of risk or uncertainty Person vs.
power Employee vs. job-oriented Power distance?
Parochial vs. professional Open vs. closed Note that dimensions in italics indicate at best an approximate fit.
Table 3-7: A comparison of organisational cultural dimensions, orientations and syndromes
73
It can be seen from Table 3-7 that, for this sample of organisational culture frameworks,
there was little common ground across them in terms of cultural dimensions. No dimensions
emerged as ‘clear winners’, and none provided guidance as to the likely ‘default’ dimension
scores or values for given organisation types. Also, none of the frameworks provided a basis
for an association of organisational culture traits with sectors and, other than the competing
values framework, they had not been widely applied. On the basis of the above survey, it
appeared that organisational culture could not be used as a contributory input to the work of
this thesis.
c) Occupational culture frameworks
There have been few studies of occupational (or professional) culture, compared to
organisational culture. The majority of studies appeared to be comparisons between
professions, or comparisons between the culture dimension scores of professionals and the
national cultural dimension scores of their compatriots. It was, however, clear that there was
a significant degree of self-selection in many professions – different personality types chose
to be accountants, teachers, doctors, etc.; this was likely to be reflected to some degree in
their quantitative culture scores.
The only study that appeared to offer a replicable, quantitative approach was one by Bosland
(G H Hofstede 2001, pp.493-494; Bosland 1985). This adjusted Hofstede’s cultural
dimension scores based on years in full time education. As most professions demand long
periods in education, this provided a valid means of adjusting national culture scores
indirectly for professions, although it did not capture the differences between ‘conservative’
(e.g. accountancy) and ‘outgoing’ (e.g. sales) professions that both required degree-level
qualifications.
A summary: Bosland’s adjustment of the four dimension scores of Hofstede’s original
national cultural framework was the only quantitative approach found that was related (via
years of full-time-equivalent education) to professional culture.
3.4.3 Measures of team cultural diversity
For the purposes of the work described in this thesis, a measure of cultural diversity of team
members was required that provided a quantitative value reflecting the mean cultural
differences between team members. It was important that any measure utilised by the
researcher would take account, not only of the number of different cultures (e.g. national
cultures) in a team, but also the degree of difference between each of those cultures. In
addition, it was important that such a measure would enable users of a tool incorporating the
74
measure to identify the diversity associated with each team member.
A review of the literature revealed three main approaches to the determination of diversity,
examples of which are briefly discussed below.
The Blau Index of racial and ethnic diversity (Blau, 1977) , the Herfindhal-Hirschmann Index (HHI) (Rhoades, 1993), the Shannon (or Shannon-Wiener) Diversity Index (SDI)
and Simpson’s Index (Simpson’s D) were based on the number of different types (e.g. plant
species, nationalities) and their relative weightings, not the degree of difference (diversity)
between types.
Greenberg’s Diversity Index (also known as the linguistic diversity index, LDI) was primarily
utilised to measure the diversity of a country’s languages. In his paper on the measurement
of linguistic diversity (Greenberg, 1956), Greenberg described a simple index based on the
probability of two speakers from the selected population speaking the same language,
GDI(A), and also described an alternative that included a weighting for each language pair
based on their linguistic similarities, GDI(B). He then described an approach that takes
account of multilingual speakers. The weighted monolingual index was defined as:
GDI(B) = 1 - ∑m,n (mn) (rMN)
where m, n were the proportions of speakers of languages M and N in the population,
and rMN was a measure of the resemblance between languages M and N.
The Greenberg monolingual weighted index (type B) took account of the level of disparity
between object types (species, languages, etc.). It was therefore able to distinguish between
teams with members of different but similar cultures from those of very different cultures.
The Stirling Index (Stirling, 1999; Stirling, 2007) took account of the level of disparity
between object types (different species, languages, cultures/countries, etc.) by assuming that
they were located in Euclidean space, and the distance between any two object types
represented their mutual disparity. The Stirling index was defined as:
SI = ∑i,j dij pi pj
for i,j = 1 to the number of species (or team member countries),
dij = distance (disparity) between species (or country) ‘i’ and ‘j’
and pi = the proportion of the population belonging to species or country ‘i’.
The Stirling index took account of the level of disparity between object types (species,
languages, etc.).
75
The standard statistical measures of mean and variance, as used by Elron (1997) could
be utilised to derive a value for team cultural diversity. Elron calculated the mean and
standard deviation of team members based on Hofstede’s default national culture scores for
team members, the standard deviation providing a measure of team cultural diversity.
To summarise the above: There appeared to be three main approaches to the derivation
of diversity within a team or population. The most common approach took account of the
number of different members based on some nominal value (e.g. gender, profession or
nationality); although this was accurate for binary differences such as gender, it was unsatis-
factory as a measure of diversity because cultures could be very similar (e.g. Germany,
Czech Republic) or very different (e.g. Guatemala, Australia). The second approach utilised
a measure of distance or separation in Euclidean space between members (e.g. based on
their national culture scores, education and/or ages). However, to combine (in our case) the
cultural separation along several axes into a single (Euclidean) distance was to imply that
each factor or dimension had a similar effect to each other in every circumstance. The third,
statistical approach to the derivation of team or population diversity placed an overemphasis
on outliers.
3.4.4 Team and task classifications
For the purposes of the work described in this thesis, it was necessary to be able to describe
teams and/or their tasks in terms of the behavioural capabilities required for successful
performance. Such behavioural capabilities (for want of a better term) could then be
associated with team member cultural scores to form the basis of an assessment
methodology and tool. The following five culture-modified areas of behaviour/behavioural
requirements were identified in Subsection 3.3.3: Management and decision-making,
creativity and innovation, interaction (communication and co-ordination), uncertainty handing
and achieving shared situation awareness. It was therefore important to examine the
literature in order to evaluate team and task typologies (taxonomies, classifications) in terms
of their abilities to represent the above culture-related requirements.
There have been many detailed reviews of the literature on team theory, in particular on
team classifications, for example Guzzo & Dickson (1996), DeMatteo et al. (1998), Wildman
et al. (2012) and Hollenbeck et al. (2012). It appeared from an examination of these reviews
that team classifications varied greatly depending on the ‘central’ team type (the classifier’s
starting point) and on the purpose of the classification. Some of the more interesting
approaches to team/task classification (from the point of view of the author’s research) are
briefly described below.
76
Cohen and Bailey (1997) carried out a review of research on teams and groups published
between January 1990 and April 1996. Their team classification was unsuitable for the
approach in this thesis, as they appeared to place some types of organised action team in
the same category as routine manufacturing teams. However, they defined team
performance along three dimensions – output quantity and quality, member attitudes, and
behavioural outcomes. The latter category was of interest, as it could contribute to a link
between culture and some aspects of performance. Marks, Mathieu and Zaccaro (2001)
appeared to concentrate on the classification of industrial and commercial work teams but
did not provide sufficient details on the task or behavioural aspects of teams to be useful to
the work of this thesis; however, their ‘team maintenance’ processes could perhaps offer a
basis for ‘layering’ the effects of culture onto team performance.
Fernandez et al.’s emergency medicine team taxonomy (2008) utilised the input-process-
output (I-P-O) model that is widely used in industry and academia. Inputs represented the
team member characteristics (abilities, experience, etc.), processes represented the
behaviours and collaborations required to achieve successful outputs in terms of task
outcomes and team performances; the various sets of ‘task-work’ went through the I-P-O
cycle, the output of one cycle being an input to the next. The emergency medicine process
model was proposed as having (in temporal sequence) a planning and preparation phase,
action processes and reflection processes. In particular, the taxonomy’s ‘action process’
phase and ‘support mechanisms’ might have been the locations for culture-affected
tasks/behaviours, but insufficient details were available to consider it further. Steiner (1972)
recognised that the task was one of the key factors in team or group performance. He split
unitary (indivisible) tasks into disjunctive, conjunctive, additive and discretionary tasks, and
divisible tasks into self-matching, (pre-)specified and organisationally (externally) allocated
tasks; however, the basis of his classification was to enable the optimum allocation of team
members on the basis of their technical or experience-based proficiencies, and it would be
difficult to associate such tasks with the effects of culture.
McGrath’s circumplex (McGrath 1984, Ch. 5) integrated the work of Hackman & Morris
(1975), Shaw (1973), Davis and Laughlin, to produce his ‘task circumplex’ classification
framework for group tasks. This circumflex was represented as a circle with eight segments,
each segment being one of eight mutually exclusive and collectively exhaustive task
categories - planning, creativity, intellective (have ‘correct’ answers), decision-making (have
no ‘correct’ answers), cognitive conflict, mixed motive, competitive and performance/psycho-
motor tasks. McGrath’s circumflex listed some of the areas where problems might occur in
teams due to the effects of culture, for example in creativity tasks, cognitive conflict tasks,
77
mixed motive tasks and competitive tasks.
Gluesing & Gibson (2003), Chapter 11: Designing and Forming Global Teams, pp. 199-
226, claimed that the complexity that global teams, in particular, faced could be described
along five dimensions – task, context, people, time and technology. Task complexity
appeared to be the most relevant for cultural issues, and could be described in terms of four
elements - workflow interdependence (based on the degree of interaction required between
team members), task environment (varying from a static, stable, predictable environment to
one that was highly dynamic and unpredictable, causing disruptions and re-evaluations of
activities), external coupling (which appeared to overlap task environment), and internal
coupling (which appeared to overlap workflow interdependence). Gluesing & Gibson’s
approach was extremely complex, but it was perhaps only the communication ramifications
of workflow interdependence and the uncertainty ramifications of task environment that had
clear links to culture.
Hollenbeck et al. (2012) reviewed the literature of team taxonomies and classifications, and
demonstrated the weaknesses of taxonomies and other categorical systems when
attempting to categorise concepts such as team types, which can be placed on a continuum.
They proposed three dimensions as forming the basis for a wide range of team types - skill
differentiation (the degree of knowledge or skill specialisation, which made it difficult to
substitute team members), authority differentiation (the degree to which decision-making was
concentrated, or distributed) and temporal stability (the degree to which team members had
a shared history and expectations of a shared future). This three-dimensional approach
offered a limited degree of flexibility in categorising industrial and commercial work teams,
but could not capture the key differences between teams that are related to culture, e.g.
creativity or handling uncertainty. Although the dimensions chosen by Hollenbeck et al. were
not suitable for a culture-based team performance prediction methodology, the authors
presented a very cogent case for a dimensional, rather than categorical (e.g. taxonomic)
approach to team/task classification.
To summarise the above: Most of the team/task classifications were concentrated on a
very small range of teams, and did not include the factors that were mediated by culture.
Steiner’s approach to task classification was valid for research and production-type teams,
but was not very relevant to rapid-reaction (and similar) teams. McGrath’s task circumplex
contained several potentially useful task categories, Gluesing & Gibson’s dimensions of
complexity covered too few of the factors that influence culture-related performance to be
usable. The multidimensional approaches of Hollenbeck et al. and Gluesing & Gibson
78
appeared to be the most flexible, but the chosen dimensions excluded most of the key team
types of relevance to this author’s research, and also did not capture nuances of relevance to
culture; however, the workflow interdependence and task environment of Gluesing and
Gibson’s approach could (in theory) be adapted. None of the team and task typologies
identified in the literature covered the range of factors required for this research work.
However, the reviews, in particular that of Hollenbeck et al., highlighted the severe limitations
of any taxonomic approach – some concepts fit into rigid taxonomic hierarchies (e.g. flora
and fauna), others do not (e.g. team and task types, games, word definitions). Therefore, it
was necessary to devise an alternative team/task typology, based on a non-taxonomic
classification.
3.5 Empirical evidence about the validity of national culture-based tools
Due to the sparsity of national culture-based team performance prediction-based tools, this
subsection also examined empirical evidence for the validity of national culture frameworks
and role/task sets.
3.5.1 Empirical evidence for the validity of methods, models and tools for the culture-based prediction of team performance
As stated in Sub-section 3.4.1, only one academic peer-reviewed publication was found on
methods, models or tools for the prediction of team performance or the allocation of tasks
based on national culture. The two-stage models by Sivakumar & Nakata (2003) was too
limited (new product development only), produced the culture scores for an optimum team
only, i.e. provided no guidance for any proposed or actual team, and relied on a set of culture
‘slope coefficients’ that were not clearly justified in the paper. Furthermore, citations of this
publication produced no evidence that the model/tool had been applied in an industrial
product development environment, so it could not be validated. The qualitative Earley and
Gibson multicultural team model (Earley & Gibson, 2002) provided no more than general
guidance to a team’s potential internal problems, and was criticised for its excessive
complexity and redundancy, for example role processes were modelled at individual and
group levels, and as integrative mechanisms (Troyer, 2002). In practical terms, this model
was little more than a checklist of factors to consider when evaluating a team of individuals of
known personal and cultural traits, and did not offer any capability or basis for developing a
predictive cultural tool that took account of team mission and location.
As a very simple paper-based checklist, ‘The CULTURE Tool’ by Catholic Health was of no
79
significant interest to the research of the author of this thesis. However, it did raise the
question as to whether a qualitative culture-based performance prediction tool could be
developed. After a brief consideration of requirements, it became clear that such a tool
would have to contain a huge amount of text and would not provide any capability for further
analysis, unless there was a numeric basis behind the text.
‘The Culture Compass Survey’ by Geert Hofstede and the consultancy company itim
international appeared to carry out, to some degree, several of the activities presented in
Figure 3-5; it produced a cultural profile (for an individual, not a team) and took account of
the individual’s role (rather than tasks). However, the tool was aimed at the determination of
the degree of fit of an individual ‘outsider’ to another culture, rather than the degree of fit of a
team’s culture to a task set. In addition, it did not offer role/task choices of key importance to
sociotechnical systems (e.g. associated with innovation teams or organised action crews).
Nevertheless, the qualitative feedback comments of this tool (clearly based on quantitative
differences between national cultural scores and the scores generated from the individual’s
survey answers) represented a ‘user-friendly’ way of communicating potential problem areas.
This tool did not encompass teams or detailed roles or tasks, nor did it consider the cultural
fit with tasks or roles, instead it looked at the degree of difference between cultures, and their
effects. Although offering interesting insights about the generation and presentation of
cultural information, it did not otherwise represent a means towards the aims of this author’s
research.
In comparison to The Culture Compass Survey tool, the CultureCompass tool accepted less
information from the user, offered considerably less information in return and was not
considered to be of further interest.
3.5.2 Empirical evidence for the validity of cultural frameworks
In this section, evidence is presented for the empirical validity and potential applicability (in
the researcher’s work) of the national cultural frameworks described in Section 3.4.2.
In addition to empirical validity, the author’s work places requirements on a cultural
framework to provide default cultural traits (however described or enumerated) for all of the
World’s major countries or areas, to discriminate adequately between national differences, to
enable the linking of a range of team behaviours or task performances to cultural traits18, to
have been validated by researchers and to have been utilised in a large number of studies.
18 This ‘enablement’ might occur in terms of the extended descriptions and examples provided in relevant texts and/or the applications of the framework to cultural studies as described in publications.
80
a) The empirical validity of national or ethnic culture frameworks
Kluckhohn & Strodtbeck’s five-dimension (or five syndrome) value orientations method (VOM) (Gallagher, 2001a; Hills, 2002; Kluckhohn & Strodtbeck, 1961) was intended
primarily as a tool to enable (and train) people to understand their own and other cultures.
The VOM’s three-value (trinary) syndromes lacked discrimination, did not provide default
values for the majority of countries, and would have been difficult to link to behavioural traits
that were relevant to task performance assessment. Maznevski et al. (2002) applied the
value orientations method (also known as the cultural orientations framework) to 1,600
people in five countries, but this was one of comparatively few studies of reasonable size.
Although the VOM served a valid purpose as a thought-provoking introduction to cultural
differences, it was not suitable as the basis for a culture-based performance prediction tool.
Triandis’ five-dimension (or five syndrome) cultural framework (Triandis 1995; 1996)
lacked discrimination due to its two-value (binary) syndromes and, as was the case with the
VOM (above), did not provide default values for the majority of countries. In addition,
Triandis (1993, p.177) stated that the tightness syndrome was related to the collectivism
syndrome, i.e. that they were not independent of each other; this would lead to increased
problems during any statistical analyses.
Hofstede’s original cultural framework (1984) consisted of the four dimensions of power
distance, individualism-collectivism, masculinity and uncertainty avoidance. Summarised
data including default culture scores for 76 countries and regions (representing a large
proportion of the World’s population) were available at the start of the author’s research,
whereas for the later-added ‘long-term orientation’ dimension, default values were only
available for 23 countries; in addition, a number of criticisms had been made of the
dimension (Fang, 2003; Jacob, 2005). A sixth cultural dimension, ‘indulgence vs. restraint’,
was added shortly after the author began his research, but a comprehensive set of default
national scores was not available at the time.
Hofstede’s original four-dimension framework had been verified many times and in many
countries since its original publication for example in Russia (Naumov, 2000), the Gulf States
(At-Twaijri & Al-Muhaiza, 1996), New Zealand (Brown, 2003); in addition, individual
dimensions had been further evaluated and verified, for example uncertainty avoidance
(Merkin, 2006; Minkov & Hofstede, 2014). The framework also had its antagonists based on
claims of questionable underlying assumptions (McSweeney, 2002), that Hofstede might not
have been actually measuring culture (Baskerville, 2003) and that the framework’s dimen-
sions had limited distinctiveness and independence (Blodgett, Bakir, & Rose, 2008).
81
Hofstede answered such antagonists directly (G H Hofstede, 2002, 2003), typically
elaborating on the misassumptions that these antagonists had made about his work. Jones
(2007) examined publications by scholarly antagonists and protagonists of Hofstede’s
framework, and also examined published dialogues between Hofstede and his antagonists
(see above references); Jones concluded that the weight of evidence supported the majority
of Hofstede’s work, and that it remained the most valuable contribution on culture to-date for
scholars and practitioners. Based on the results of a study of cultural frameworks,
Magnusson, Wilson, Zdravkovic, Zhou, & Westjohn (2008) concluded that cultural distance
constructs based on Hofstede’s and Trompenaar’s frameworks19 had strong convergent
validity, whereas those based on the Schwartz and GLOBE frameworks had much weaker
validity.
The most important validations of Hofstede’s framework were found in meta-studies of the
framework’s application. Smith & Bond (1998, Ch. 3) examined large scale studies
published since Hofstede’s original version of ‘Culture’s Consequences’ (1984), and
concluded that those studies had supported, rather than contradicted, Hofstede’s work.
Kirkman et al. (2006) reviewed the use of Hofstede’s framework in 180 studies, agreed with
Smith & Bond, but drew attention to limitations in the coverage of these studies (in part due
to fragmentation and redundancy) and made recommendations for the improvement of
researchers’ use of Hofstede’s framework. In a final example, Taras et al. (2010) utilised data
from 598 studies to meta-analyse the relationships between Hofstede’s original four
dimensions and a range of ‘organisationally relevant outcomes’. They found that, at the
individual level of analysis, the predictive power of Hofstede’s cultural values was lower than
those of personality traits and demographics for outcomes such as job performance and
absenteeism, but higher for outcomes such as organisational commitment, team-related
attitudes and feedback-seeking; the latter were perhaps more strongly related to the team-
related aspects of this PhD study than were the former.
To summarise: Hofstede’s cultural dimension scores possessed precision (in itself no
guarantee of accuracy) and, at the start of this researcher’s work, national scores for
Hofstede’s original four cultural dimensions were available for the majority of the World’s
population. Also, compared to other cultural frameworks, Hofstede’s framework had been
subject to much more corroborative research and had been used in many culture surveys.
The GLOBE nine dimension cultural framework appeared to adapt its dimensions from a
several pre-existing frameworks, including Hofstede’s and Kluckhohn & Strodtbeck’s VOM. 19 This is an important consideration for the research described in this thesis.
82
In view of some of the conflicting or indeterminate results in the literature for Hofstede’s
masculinity dimension, the GLOBE’s splitting of Hofstede’s masculinity dimension into two –
gender egalitarianism and assertiveness – was of particular interest.
As in the case of Hofstede’s framework, data from the GLOBE studies were available to the
author in summarised form. The primary sources for this data were in the two main books of
the project, i.e. House et al. (2004) and Chhokar et al. (2008). Hofstede (2006) statistically
analysed this GLOBE data and questioned the basis for deriving the nine GLOBE cultural
dimensions, pointing out (amongst other things) that the data suggested the presence of the
Hofstede masculinity/femininity dimension. A further issue for this researcher was that, at
the start of this PhD research, few independent researchers had published studies utilising
the GLOBE dimensions compared to those utilising Hofstede’s framework. Later literature
reviews by the author revealed a continuing paucity of studies that utilised the GLOBE
cultural scores; the majority of published articles consisted of further papers by the GLOBE’s
authors, critiques of the GLOBE framework, or comparisons of GLOBE with Hofstede’s
framework and others, for example Graen (2006) and Peterson & Castro (2006) – a critique
that was answered by Hanges & Dickson (2006).
Schwartz’s culture-level value scale (or cultural values framework) was condensed from
seven ‘cultural level value types’ into three ‘cultural orientations’ or dimensions; Schwartz
stated that he believed that these types and dimensions were non-independent of each
other, which negated the effectiveness of using them as dimensions. As is the case with the
GLOBE framework and Trompenaars’ framework, there were relatively few published
independent research studies that utilised Schwartz’s framework, compared to Hofstede’s.
A summary of the validity of national culture frameworks: As stated at the beginning of
this section, there was a set of minimum requirements for any cultural dimension framework
to be viable for the purposes of the research described in this thesis. In particular, a national
cultural framework would be required to: provide default cultural traits or scores (however
described or enumerated) for all of the World’s major countries or areas, discriminate adeq-
uately between national differences, enable the linking of a range of team behaviours or task
performances to cultural traits20, have been widely validated by researchers and have been
utilised in a large number of studies. The latter requirement was of particular importance, as
these studies would be the sources of qualitative and/or quantitative data for this PhD study.
20 This ‘enablement’ might occur in terms of the extended descriptions and examples provided in relevant texts and/or the applications of the framework to cultural studies as described in publications.
83
At the time that this literature review was originally carried out, the national culture framework
with the most empirical validation was that of Hofstede’s. Hofstede’s framework was also the
one that was critiqued the most, and which appeared to have the most support amongst
researchers. However, there were issues with the framework, many of which applied also to
other frameworks. The potential effects of such issues needed to be noted, as they could
threaten the validity of subsequent work.
d) The empirical validity of organisational culture frameworks
It can be seen from Table 3-7 that, for the most commonly-cited organisational culture frame-
works, there was little common ground across them in terms of cultural dimensions. No
dimensions emerged as ‘clear winners’, nor was there common guidance as to the likely
‘default’ dimension scores or values for given organisation types. Also, none of the
frameworks provided a basis for an association of organisational culture traits with sectors
and, other than the competing values framework, they had not been widely applied. It
appeared that existing organisational culture frameworks could not be used as a contributory
input to the work of this thesis.
e) The empirical validity of occupational culture frameworks
As stated in Subsection 3.4.2(c), the majority of studies of occupational culture appeared to
be comparisons between the cultures or cultural dimension scores of different professions,
for example, Helmreich and Merritt’s (2001) study of the cultural traits and attitudes of
personnel in aviation and medicine. It was clear that there was a degree of self-selection in
many professions – different personality types chose to be accountants, teachers, doctors,
etc.; this was likely to be reflected to some degree in their quantitative culture scores.
The only study that appeared to offer a practicable, replicable, quantitative approach was
one by Bosland (G H Hofstede 2001, pp.493-494; Bosland 1985). This adjusted Hofstede’s
national cultural dimension scores based on years in full time education. As most
professions demand long periods in education, this provided a valid means of adjusting
national culture scores indirectly for professions, although it did not capture the differences
between ‘conservative’ and ‘outgoing’ professions that both required degree-level qualifi-
cations. Bosland’s tables were validated to some extent when they were used to adjust the
culture scores of country elites that emerged from a study by Hoppe (1990). Other studies
have, in general terms, confirmed Bosland’s work. For example, Bosland’s tables indicated
an increase in individualism score with education; this was supported by Bangwayo-Skeete,
Rahim & Zikhali’s (2011) analysis of the 2005 World Value Survey data; this analysis found
84
that individuals with higher education attached an increased importance to autonomy vs.
conformity to traditional social norms, implying an attitudinal move towards increased
individualism.
A summary of the validity of occupational culture frameworks: Bosland’s adjustment of
the four dimension scores of Hofstede’s original national cultural framework was the only
quantitative approach found that was related (via years of full time education) to professional
culture. As it adjusted Hofstede’s national culture scores, it would be simple to incorporate
into a method or tool that utilised Hofstede’s national culture framework.
3.5.3 Empirical evidence for the validity of measures of team cultural diversity
More detailed descriptions of the diversity measures discussed in this section are provided in
Subsection 3.4.3. The majority of quantitative publications on multicultural teams appeared
to use measures of diversity based on the proportions of different nationalities, rather than
the degree of difference between those nationalities, for example measures such as the Blau
Index, the Herfindhal-Hirschmann Index, the Shannon (or Shannon-Wiener) Diversity Index
(SDI) and Simpson’s Index. These nominal measures would produce the same diversity
score for a four-member team consisting of British, Irish, Australian and New Zealander
members as for a team consisting of Chinese, Iraqi, Canadian and Brazilian members.
Clearly, such diversity measures are insensitive to the actual cultural differences between
team members, and their utilisation had contributed to the inconclusive performance results
that emerged from meta-studies such those of Stahl et al.
Measures of diversity such as Stirling’s index utilised quantitative measures of distance or
diversity. However, the assumption implicit in combining several cultural dimension scores
into a single Euclidean distance was that all dimensions contributed similarly to each other in
every circumstance; this was not a realistic assumption with regard to human culture.
As stated in Subsection 3.4.3, Elron (1997) applied the statistics-based measures of mean
and variance to Hofstede’s cultural scores for team members in order to calculate team
cultural diversity; however, although this approach took account of the default national
cultural scores of team members, it placed a very high weighting on ‘outliers’ due to the use
of variance; this may have exaggerated the cultural diversity of certain teams. In addition, it
was not clear as to how this approach could enable the diversity of each team member to be
expressed individually – this would be important if it were required to ‘tailor’ a team to be
more or less diverse.
85
To summarise the above: The majority of diversity measures (e.g. Blau and Shannon
indices) were related to the number (or proportion) of different species, ethnic groups,
nationalities, etc., not to the amount of difference or diversity between them. Diversity (or
heterogeneity) indices such as those of Greenberg and Stirling indices took account of the
Euclidean distances between groups or subgroups (e.g. ages, culture scores, years in post),
assuming that it did not matter which element of diversity contributed the most; however, this
does matter. Diversity measures based on statistical measures of variance took into account
the actual allocated culture scores of individual team or group members, but put excessive
weight on outliers, due to the calculation of variance. All of the diversity measures produced
an aggregate team diversity value, but did not provide any diversity-related information about
individual team members – such information would be necessary if a culture tool were
required to provide guidance about team composition.
3.5.4 Empirical evidence for the validity of team and task classifications for the proposed work
As stated in Subsection 3.4.4, to achieve the aims of the research described in this thesis, it
was necessary to be able to describe teams and/or their tasks in terms of the behavioural
capabilities required for successful performance. Such behavioural capabilities (for want of a
better term) could then be associated with team member cultural scores to form the basis of
an assessment methodology and tool.
Examination of a range of team and task classifications (see Subsection 3.4.4) revealed no
classification that covered an adequate breadth of team types, task types or behaviour
requirements that could be moderated by culture.
3.6 Summary of the review of the literature and state-of-the-art
This chapter started with an introduction to the literature review method and literature
sources that were utilised. Section 3.3 presented evidence of the effects of national culture
on team performances. Section 3.4 presented information on culture-related tools and
methods. Subsection 3.4.1 highlighted the sparsity of culture-based performance prediction
tools, indicating that there was a substantial gap in the literature. In the absence of such
tools, Section 3.4.2 presented details of culture frameworks, which allowed us to describe the
cultures of teams and individuals, Section 3.4.3 addressed measures of cultural diversity that
were required for a culture-based performance prediction tool and Section 3.4.4 addressed
team/task behavioural and performance requirements.
86
Section 3.5 examined the empirical evidence for the validity of culture-related tools and
methodologies, finding that only Hofstede’s tool met all the requirements of the researcher’s
proposed research for discrimination, validity and the availability of published case studies
and analyses.
3.6.1 What was not helpful
a) ‘Citation disconnect’ between disciplines
Researchers have traditionally relied heavily on citation following in order to trace valuable
veins of research. However, the research publications of interest to the author were very
widely dispersed across disciplines - more than a hundred different journals had been refer-
enced by the completion of the thesis; this count excluded conferences, reports and web-
based data sources. Unsurprisingly, there appeared to be little connection in terms of cross-
citations between papers published in journals of different disciplines. Also, publications
tended to have either an extremely high number of citations or a very low number of (or zero)
citations, according to World of Science and Scopus; neither of these alternatives was useful.
b) Lack of a creativity/invention/innovation classification The examination in this review of the effects of culture on innovation-related activities was
hampered by the lack of clarity amongst researchers as to the degree of creativity, invention,
etc., that their study results were associating particular cultural traits with. There was a need
for a common creativity/innovation framework against which such activities could be
measured, e.g. one similar to that proposed in Subsection 3.3.1(a) (ix), Figure 3-3. To add
further concerns over the accuracy of recent study results, the use of raw patent numbers as
a measure of innovation output must now be called into question due to the increasingly
trivial nature of patents that are created as ‘foot-soldiers in the commercial litigation wars’.
The recent degradation of patents as genuine intellectual property has resulted in the
reversal of apparent optimum culture scores – a few years ago, high individualism was
associated, via patent output levels, with high innovation; a recently published study
demonstrated the opposite result. This reversal was reflected in the recent major increase of
Far-Eastern patenting activities. Whereas it was to be expected that other cultures would
reduce the longstanding Anglo/European dominance over innovation, there was no evidence
other than that of patent numbers that a watershed had been reached.
c) Paucity of material relating safety culture to national culture
A significant part of the research described in this review was concerned with the operational
safety of sociotechnical systems, and the effects of national culture on this safety. A large
87
majority of publications relating to safety and culture concerned the topics of safety culture
and safety climate; disappointingly, very few of these publications made a connection
between safety culture and national culture. Most of those that did mention national culture,
failed to identify clear links, for example from national culture, through organisational culture
to safety culture/climate.
3.6.2 Gaps identified
a) Lack of culture-based performance prediction tools
No culture-based team performance prediction tools were found in the literature. The most
similar method or tool to that proposed by the researcher was a commercial tool offered by
Hofstede and the company itim that, following completion of a questionnaire, determined an
individual’s cultural differences from his or her own country and that of a proposed country,
and indicated (on the basis of a selection from a small number of general roles) the likely
issues that might arise; however, this was neither adaptable to team (rather than individual)
level, nor were the general roles adaptable to meaningful team tasks or behaviours.
b) Lack of team/task/mission classification of relevance to national culture-based tools
No team/task/mission classification was found that could incorporate team member culture
as a factor in performance.
c) Lack of a creativity/invention/innovation classification
As stated in Subsection 3.6.1(c) above no satisfactory classification system was found to
enable the accurate placement of innovation-related activities to enable the comparison of
published culture/innovation studies.
3.7 Detailed problem statement based on the review of the literature and state-of-the-art
The design of complex sociotechnical systems (e.g. oil refineries, power stations, airport
systems, large transport aircraft), has been dominated by Western organisations; even in the
case of non-Western designs, the ’blueprint’ is based on Western designs, due in part to the
constraints imposed by international standards and the associated licencing requirements.
As a result, Western cultural assumptions are built into such systems, which function less
effectively when operated by non-Westerners. There are limited quantitative ergonomic
tables and tools to assist designers to take account of human physical and mental limitations
(if they choose to use them); however, there are no such tables and tools to assist designers
88
to take account of user culture. Whereas we are not yet at a stage where culture-sensitive
methodologies could be developed directly to improve designs, a ‘cultural clash’ detection
system might warn designers where there was a likelihood of mismatch.
Multinational companies increasingly delegate R&D and product improvement projects to
foreign subsidiaries, with mixed results to-date. The location, selection or building of teams,
as opposed to systems, for various functions (e.g. sociotechnical system design, problem-
solving, process improvement, product updating, blue-skies research) could be improved by
matching culturally-related strengths to project requirements.
Culture has been shown, in this literature review, to affect behaviour, communication,
decision-making, creativity, training and other aspects of team performance, leading in many
cases to reduced performance or safety. However, current understandings of the effects of
various cultural traits are variable. The effects of power distance and individualism on team
performance are better understood and more consistently reported in the literature than are
the effects of masculinity and uncertainty avoidance; reports on the performance effects of
various levels of cultural diversity in teams are extremely inconsistent and contradictory.
There is a need for an improved understanding of these three team cultural traits.
To summarise: There is no effective quantitative methodology or tool for taking account of
culture when designing systems or selecting teams. As a result, system and team
performances are hampered, in some cases with fatal consequences. It is important, there-
fore, to understand and capture relevant culture-related performance factors both for the
improvement of the sociotechnical system design process, and for improved safety in the
operation or crewing of such systems.
89
4 Research tools and proposed activities
4.1 Introduction
The key purposes of the research described in this thesis were to identify relationships
between the observed performances of various team types (based on their tasks/missions)
and the cultural backgrounds of their team members, and to develop models, methodologies
and tools to aid in the selection of team members and the prediction of team performance-
limiting issues.
In order to develop the above explanations, it was first necessary to select or define cultural
frameworks, methodologies and classifications that would enable the representation (or
description) of cultural traits, team and/or task types and to relate them to team performance
levels. The primary purposes of activities described in this chapter were therefore:
• To select or define a framework for the representation of team member cultural traits
(primarily based on national cultural traits) in quantitative terms,
• To select or define a quantitative measure for team cultural diversity,
• To select or define an initial team/task/behavioural framework that enabled the
relationships between team member cultural traits and team performance levels to be
explored for various team/task situations.
• To highlight simplifying assumptions related to the choices made in selecting and/or
defining elements of proposed tools.
• To detail the further research activities required to achieve the aims and objectives of
the work.
Section 4.2 describes the selection of a cultural framework, and the associated issues,
caveats and assumptions. Section 4.3 describes the development of a measure of cultural
diversity, and the associated issues, caveats and assumptions. Section 4.4 presents details
of a practical team/task/mission framework consisting of five major factors, which is based on
the studies of the literature review, in particular Section 3.3. Section 4.5 details additional
research activities (based in part on Section 3.6.2 of the literature review).
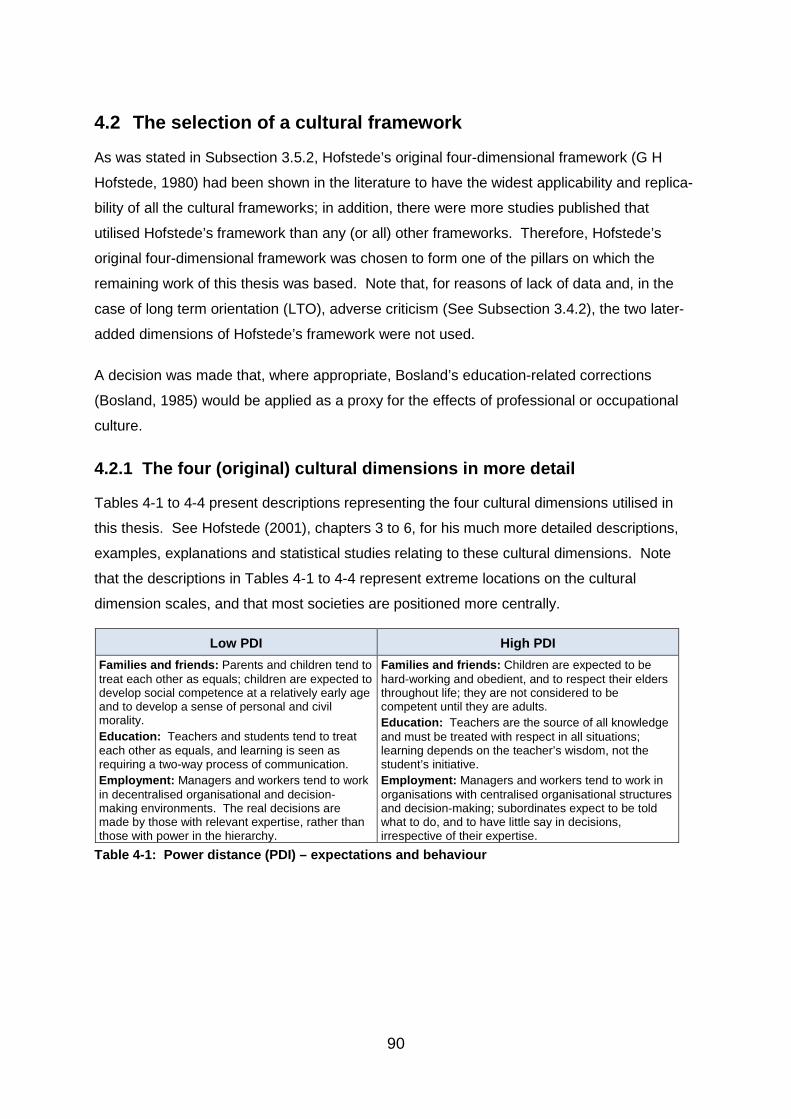
90
4.2 The selection of a cultural framework
As was stated in Subsection 3.5.2, Hofstede’s original four-dimensional framework (G H
Hofstede, 1980) had been shown in the literature to have the widest applicability and replica-
bility of all the cultural frameworks; in addition, there were more studies published that
utilised Hofstede’s framework than any (or all) other frameworks. Therefore, Hofstede’s
original four-dimensional framework was chosen to form one of the pillars on which the
remaining work of this thesis was based. Note that, for reasons of lack of data and, in the
case of long term orientation (LTO), adverse criticism (See Subsection 3.4.2), the two later-
added dimensions of Hofstede’s framework were not used.
A decision was made that, where appropriate, Bosland’s education-related corrections
(Bosland, 1985) would be applied as a proxy for the effects of professional or occupational
culture.
4.2.1 The four (original) cultural dimensions in more detail
Tables 4-1 to 4-4 present descriptions representing the four cultural dimensions utilised in
this thesis. See Hofstede (2001), chapters 3 to 6, for his much more detailed descriptions,
examples, explanations and statistical studies relating to these cultural dimensions. Note
that the descriptions in Tables 4-1 to 4-4 represent extreme locations on the cultural
dimension scales, and that most societies are positioned more centrally.
Low PDI High PDI Families and friends: Parents and children tend to treat each other as equals; children are expected to develop social competence at a relatively early age and to develop a sense of personal and civil morality. Education: Teachers and students tend to treat each other as equals, and learning is seen as requiring a two-way process of communication. Employment: Managers and workers tend to work in decentralised organisational and decision-making environments. The real decisions are made by those with relevant expertise, rather than those with power in the hierarchy.
Families and friends: Children are expected to be hard-working and obedient, and to respect their elders throughout life; they are not considered to be competent until they are adults. Education: Teachers are the source of all knowledge and must be treated with respect in all situations; learning depends on the teacher’s wisdom, not the student’s initiative. Employment: Managers and workers tend to work in organisations with centralised organisational structures and decision-making; subordinates expect to be told what to do, and to have little say in decisions, irrespective of their expertise.
Table 4-1: Power distance (PDI) – expectations and behaviour
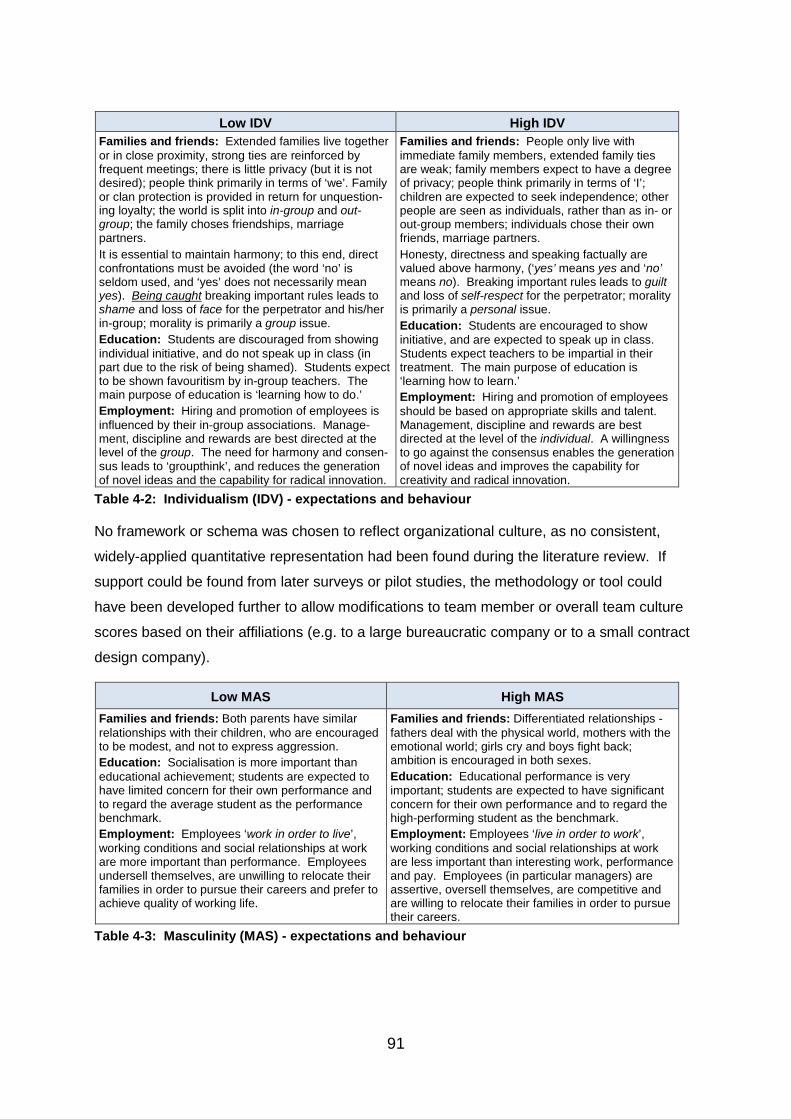
91
Low IDV High IDV Families and friends: Extended families live together or in close proximity, strong ties are reinforced by frequent meetings; there is little privacy (but it is not desired); people think primarily in terms of ‘we’. Family or clan protection is provided in return for unquestion-ing loyalty; the world is split into in-group and out-group; the family choses friendships, marriage partners. It is essential to maintain harmony; to this end, direct confrontations must be avoided (the word ‘no’ is seldom used, and ‘yes’ does not necessarily mean yes). Being caught breaking important rules leads to shame and loss of face for the perpetrator and his/her in-group; morality is primarily a group issue. Education: Students are discouraged from showing individual initiative, and do not speak up in class (in part due to the risk of being shamed). Students expect to be shown favouritism by in-group teachers. The main purpose of education is ‘learning how to do.’ Employment: Hiring and promotion of employees is influenced by their in-group associations. Manage-ment, discipline and rewards are best directed at the level of the group. The need for harmony and consen-sus leads to ‘groupthink’, and reduces the generation of novel ideas and the capability for radical innovation.
Families and friends: People only live with immediate family members, extended family ties are weak; family members expect to have a degree of privacy; people think primarily in terms of ‘I’; children are expected to seek independence; other people are seen as individuals, rather than as in- or out-group members; individuals chose their own friends, marriage partners. Honesty, directness and speaking factually are valued above harmony, (‘yes’ means yes and ‘no’ means no). Breaking important rules leads to guilt and loss of self-respect for the perpetrator; morality is primarily a personal issue. Education: Students are encouraged to show initiative, and are expected to speak up in class. Students expect teachers to be impartial in their treatment. The main purpose of education is ‘learning how to learn.’ Employment: Hiring and promotion of employees should be based on appropriate skills and talent. Management, discipline and rewards are best directed at the level of the individual. A willingness to go against the consensus enables the generation of novel ideas and improves the capability for creativity and radical innovation.
Table 4-2: Individualism (IDV) - expectations and behaviour
No framework or schema was chosen to reflect organizational culture, as no consistent,
widely-applied quantitative representation had been found during the literature review. If
support could be found from later surveys or pilot studies, the methodology or tool could
have been developed further to allow modifications to team member or overall team culture
scores based on their affiliations (e.g. to a large bureaucratic company or to a small contract
design company).
Low MAS High MAS Families and friends: Both parents have similar relationships with their children, who are encouraged to be modest, and not to express aggression. Education: Socialisation is more important than educational achievement; students are expected to have limited concern for their own performance and to regard the average student as the performance benchmark. Employment: Employees ‘work in order to live’, working conditions and social relationships at work are more important than performance. Employees undersell themselves, are unwilling to relocate their families in order to pursue their careers and prefer to achieve quality of working life.
Families and friends: Differentiated relationships - fathers deal with the physical world, mothers with the emotional world; girls cry and boys fight back; ambition is encouraged in both sexes. Education: Educational performance is very important; students are expected to have significant concern for their own performance and to regard the high-performing student as the benchmark. Employment: Employees ‘live in order to work’, working conditions and social relationships at work are less important than interesting work, performance and pay. Employees (in particular managers) are assertive, oversell themselves, are competitive and are willing to relocate their families in order to pursue their careers.
Table 4-3: Masculinity (MAS) - expectations and behaviour
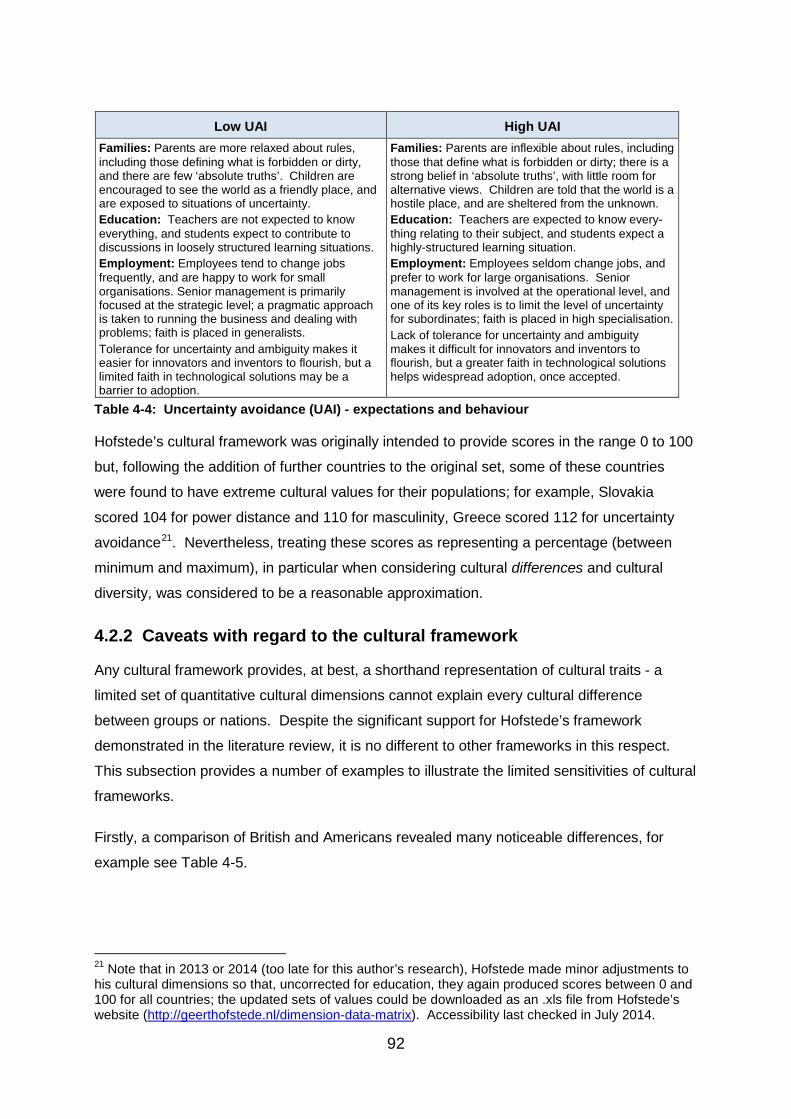
92
Low UAI High UAI Families: Parents are more relaxed about rules, including those defining what is forbidden or dirty, and there are few ‘absolute truths’. Children are encouraged to see the world as a friendly place, and are exposed to situations of uncertainty. Education: Teachers are not expected to know everything, and students expect to contribute to discussions in loosely structured learning situations. Employment: Employees tend to change jobs frequently, and are happy to work for small organisations. Senior management is primarily focused at the strategic level; a pragmatic approach is taken to running the business and dealing with problems; faith is placed in generalists. Tolerance for uncertainty and ambiguity makes it easier for innovators and inventors to flourish, but a limited faith in technological solutions may be a barrier to adoption.
Families: Parents are inflexible about rules, including those that define what is forbidden or dirty; there is a strong belief in ‘absolute truths’, with little room for alternative views. Children are told that the world is a hostile place, and are sheltered from the unknown. Education: Teachers are expected to know every-thing relating to their subject, and students expect a highly-structured learning situation. Employment: Employees seldom change jobs, and prefer to work for large organisations. Senior management is involved at the operational level, and one of its key roles is to limit the level of uncertainty for subordinates; faith is placed in high specialisation. Lack of tolerance for uncertainty and ambiguity makes it difficult for innovators and inventors to flourish, but a greater faith in technological solutions helps widespread adoption, once accepted.
Table 4-4: Uncertainty avoidance (UAI) - expectations and behaviour
Hofstede’s cultural framework was originally intended to provide scores in the range 0 to 100
but, following the addition of further countries to the original set, some of these countries
were found to have extreme cultural values for their populations; for example, Slovakia
scored 104 for power distance and 110 for masculinity, Greece scored 112 for uncertainty
avoidance21. Nevertheless, treating these scores as representing a percentage (between
minimum and maximum), in particular when considering cultural differences and cultural
diversity, was considered to be a reasonable approximation.
4.2.2 Caveats with regard to the cultural framework
Any cultural framework provides, at best, a shorthand representation of cultural traits - a
limited set of quantitative cultural dimensions cannot explain every cultural difference
between groups or nations. Despite the significant support for Hofstede’s framework
demonstrated in the literature review, it is no different to other frameworks in this respect.
This subsection provides a number of examples to illustrate the limited sensitivities of cultural
frameworks.
Firstly, a comparison of British and Americans revealed many noticeable differences, for
example see Table 4-5.
21 Note that in 2013 or 2014 (too late for this author’s research), Hofstede made minor adjustments to his cultural dimensions so that, uncorrected for education, they again produced scores between 0 and 100 for all countries; the updated sets of values could be downloaded as an .xls file from Hofstede’s website (http://geerthofstede.nl/dimension-data-matrix). Accessibility last checked in July 2014.
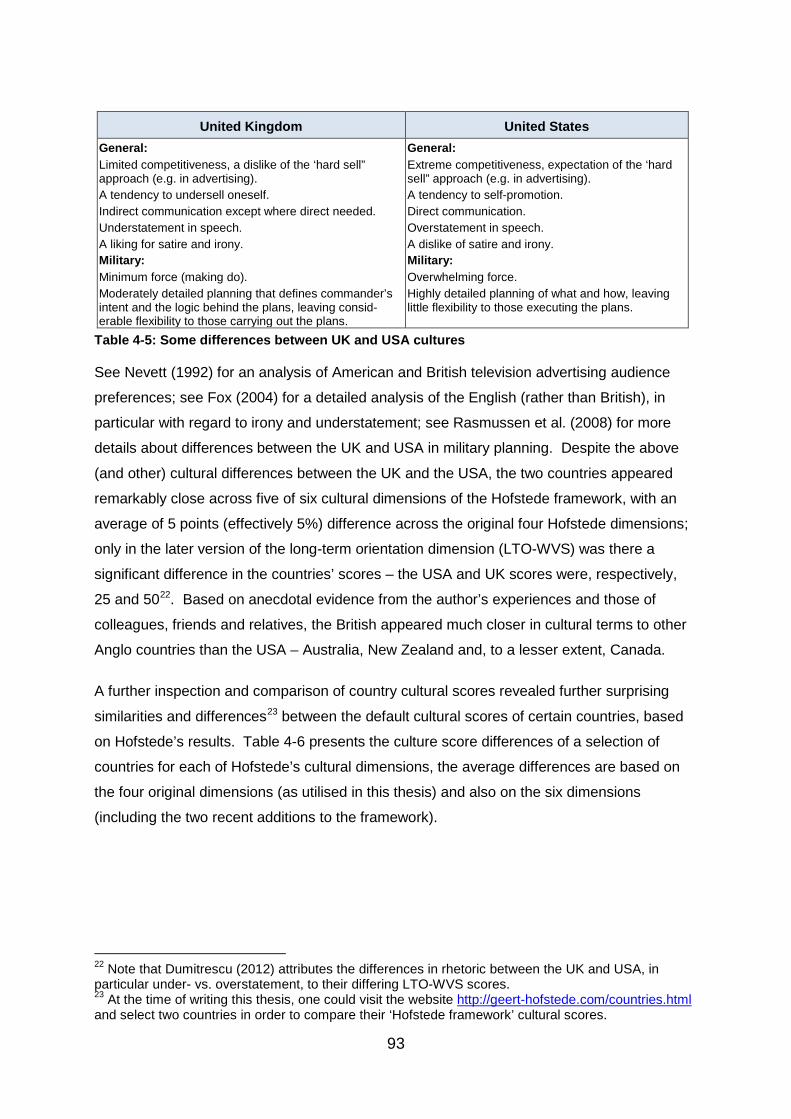
93
United Kingdom United States General: Limited competitiveness, a dislike of the ‘hard sell” approach (e.g. in advertising). A tendency to undersell oneself. Indirect communication except where direct needed. Understatement in speech. A liking for satire and irony. Military: Minimum force (making do). Moderately detailed planning that defines commander’s intent and the logic behind the plans, leaving consid-erable flexibility to those carrying out the plans.
General: Extreme competitiveness, expectation of the ‘hard sell” approach (e.g. in advertising). A tendency to self-promotion. Direct communication. Overstatement in speech. A dislike of satire and irony. Military: Overwhelming force. Highly detailed planning of what and how, leaving little flexibility to those executing the plans.
Table 4-5: Some differences between UK and USA cultures
See Nevett (1992) for an analysis of American and British television advertising audience
preferences; see Fox (2004) for a detailed analysis of the English (rather than British), in
particular with regard to irony and understatement; see Rasmussen et al. (2008) for more
details about differences between the UK and USA in military planning. Despite the above
(and other) cultural differences between the UK and the USA, the two countries appeared
remarkably close across five of six cultural dimensions of the Hofstede framework, with an
average of 5 points (effectively 5%) difference across the original four Hofstede dimensions;
only in the later version of the long-term orientation dimension (LTO-WVS) was there a
significant difference in the countries’ scores – the USA and UK scores were, respectively,
25 and 5022. Based on anecdotal evidence from the author’s experiences and those of
colleagues, friends and relatives, the British appeared much closer in cultural terms to other
Anglo countries than the USA – Australia, New Zealand and, to a lesser extent, Canada.
A further inspection and comparison of country cultural scores revealed further surprising
similarities and differences23 between the default cultural scores of certain countries, based
on Hofstede’s results. Table 4-6 presents the culture score differences of a selection of
countries for each of Hofstede’s cultural dimensions, the average differences are based on
the four original dimensions (as utilised in this thesis) and also on the six dimensions
(including the two recent additions to the framework).
22 Note that Dumitrescu (2012) attributes the differences in rhetoric between the UK and USA, in particular under- vs. overstatement, to their differing LTO-WVS scores. 23 At the time of writing this thesis, one could visit the website http://geert-hofstede.com/countries.html and select two countries in order to compare their ‘Hofstede framework’ cultural scores.
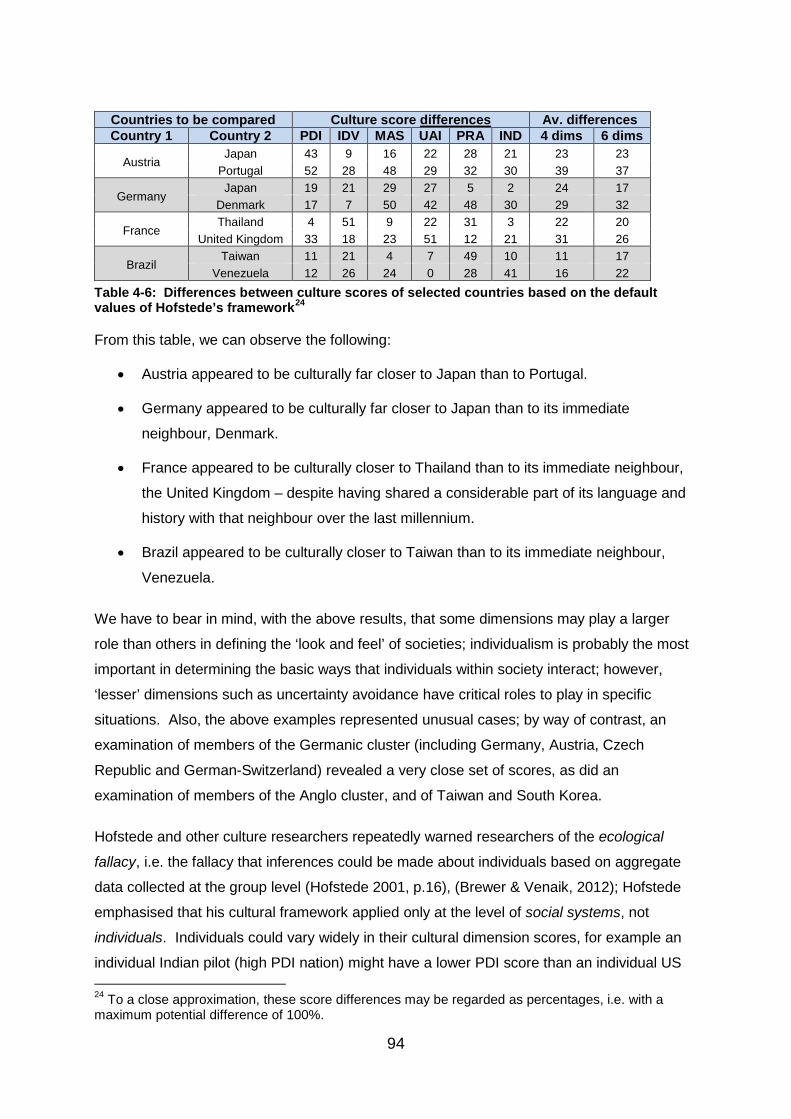
94
Countries to be compared Culture score differences Av. differences Country 1 Country 2 PDI IDV MAS UAI PRA IND 4 dims 6 dims
Austria Japan 43 9 16 22 28 21 23 23
Portugal 52 28 48 29 32 30 39 37
Germany Japan 19 21 29 27 5 2 24 17
Denmark 17 7 50 42 48 30 29 32
France Thailand 4 51 9 22 31 3 22 20
United Kingdom 33 18 23 51 12 21 31 26
Brazil Taiwan 11 21 4 7 49 10 11 17
Venezuela 12 26 24 0 28 41 16 22 Table 4-6: Differences between culture scores of selected countries based on the default values of Hofstede’s framework24
From this table, we can observe the following:
• Austria appeared to be culturally far closer to Japan than to Portugal.
• Germany appeared to be culturally far closer to Japan than to its immediate
neighbour, Denmark.
• France appeared to be culturally closer to Thailand than to its immediate neighbour,
the United Kingdom – despite having shared a considerable part of its language and
history with that neighbour over the last millennium.
• Brazil appeared to be culturally closer to Taiwan than to its immediate neighbour,
Venezuela.
We have to bear in mind, with the above results, that some dimensions may play a larger
role than others in defining the ‘look and feel’ of societies; individualism is probably the most
important in determining the basic ways that individuals within society interact; however,
‘lesser’ dimensions such as uncertainty avoidance have critical roles to play in specific
situations. Also, the above examples represented unusual cases; by way of contrast, an
examination of members of the Germanic cluster (including Germany, Austria, Czech
Republic and German-Switzerland) revealed a very close set of scores, as did an
examination of members of the Anglo cluster, and of Taiwan and South Korea.
Hofstede and other culture researchers repeatedly warned researchers of the ecological
fallacy, i.e. the fallacy that inferences could be made about individuals based on aggregate
data collected at the group level (Hofstede 2001, p.16), (Brewer & Venaik, 2012); Hofstede
emphasised that his cultural framework applied only at the level of social systems, not
individuals. Individuals could vary widely in their cultural dimension scores, for example an
individual Indian pilot (high PDI nation) might have a lower PDI score than an individual US 24 To a close approximation, these score differences may be regarded as percentages, i.e. with a maximum potential difference of 100%.
95
pilot (low PDI nation). However, a key aspect of the research described in this thesis related
to the prediction of the mismatch between the operators of sociotechnical systems and the
requirements of those sociotechnical systems. In many cases, the only knowledge available
about operators was their likely nationalities and (perhaps) educational levels, therefore it
was necessary to work with these (default) national-culture-level scores and determine, from
the performance of culture tools that were built, whether national culture actually provided a
useful basis (in the absence of other measures) for the prediction of performance constraints
or benefits. Clearly, if a system were to be designed to for users or operators in a particular
country, then taking account of those operators’ national cultural traits, rather than the
cultural traits of the country where the system was designed, would produce a better (if less
than perfect) accommodation.
Returning to Hofstede’s ecological fallacy: Whereas individuals within a culture might vary
significantly in terms of their own preferences (as would be reflected in their ‘personal’ culture
dimension scores), the author suggests that these same individuals would vary far less in
terms of their expectations of the behaviour of others; they would also vary less in their own
behaviours when in social situations within their own cultures because cultures impose a
behavioural straitjacket, due in part to the strong conformity bias that humans experience
with regard to social norms. This straitjacket is particularly strong in low-IDV, high-PDI and
high-UAI cultures, where non-conformance is heavily discouraged. In support of the author’s
view, Gudykunst (1997) stated that, although each member of a culture had a unique view of
that culture, the theories that members of that culture shared overlapped sufficiently so that
they could co-ordinate their behaviours in everyday life. In addition, researchers have
challenged Hofstede’s concerns about the ecological fallacy; Fischer & Poortinga (2012) and
Huang & Van de Vliert (2003) investigated individual-level and culture-level value structures,
and found strong similarities that negated the justification for separate structures. Steel &
Ones (2002) attributed stronger predictive powers at the national level to the reduction of
measurement error on aggregated data, rather than to the ecological fallacy.
The author of this thesis collected a range of anecdotal information in order to investigate the
ecological fallacy and other issues, see Chapter 5 for further details.
4.2.3 Simplifying assumptions made with regard to the cultural framework
Following on from the caveats presented in Subsection 4.2.2, it is useful at this stage to
discuss the assumptions associated with the adoption of Hofstede’s dimensional framework
and Bosland’s educational adjustments as key elements of the model and tool. These are
96
presented below:
(a) The representational accuracy of a simple four-dimensional cultural framework: Four integer numbers between 0 and 100 (approximately) clearly
cannot capture the nuances of human culture. However, within the constraints of
the team environment, the researcher assumed that the scores captured
sufficiently the behavioural tendencies of team members that useful general
predictions of some aspects of team performance could be made.
(b) The ecological fallacy and individual variance within cultures: Hofstede’s
cultural scores were analysed at the societal level, and Hofstede has repeatedly
warned of the fallacy of using them at the level of the individual. However, the
researcher assumed that, within the constraints of the team environment,
individuals faced strong pressures to conform to the perceived cultural expec-
tations of their colleagues; they would therefore behave in ways that were typical
of their cultures.
(c) The accuracy of Bosland’s educational adjustments: Education and
occupation have significant effects on culture-based attitudes and, thereby, on
potential behaviours. Although only Hofstede and his colleagues directly
endorsed Bosland’s education-related adjustments, there appeared to be support
in the literature for cultural changes in the direction of Bosland’s adjustments
(increasing education was associated with more individualistic, less uncertainty
avoiding attitudes), see Subsection 3.5.2. Although Bosland’s educational
adjustments failed to capture cultural differences across professions (e.g.
accounting vs. acting), they were expected to improve the accuracy of the default
Hofstede national culture values.
4.3 Selection or derivation of a measure for team cultural diversity
Currently utilised measures of diversity were examined in Section 3.4.3 of the literature
review. None of these measures met the requirements associated with the culture methods
and tools proposed in this thesis; therefore an alternative measure has been proposed in
Subsection 4.3.2.
4.3.1 Requirements for a quantitative measure of cultural diversity
A measure of cultural diversity was required that met the following criteria:
1. It provided a measure of the mean cultural distance of team members from each
97
other, as a measure of overall team diversity,
2. It used readily available data, in this case the cultural scores of individuals, (either as
default country scores or as manually-entered scores),
3. It enabled the retention and modification of culture scores for each individual team
member; this allowed experimentation, and also allowed the entry of both default
(country-average) scores and actual individual scores, e.g. those obtained via
questionnaire25,
4. It enabled the identification of individual team members that contributed most to the
team’s cultural diversity,
5. It provided diversity values separately for each cultural dimension,
6. It could be implemented on a spread sheet without the use of macros26.
7. The measure of cultural diversity would be understandable to users as well as to
researchers.
4.3.2 Derivation of an expression for cultural diversity based on cultural distance
Based on the requirements listed in Section 4.3.1, a measure of cultural diversity was
proposed that utilised the separation between team members in cultural space. Figure 4-1
illustrates the location of each member of an imaginary team in three-dimensional culture
space consisting of power distance, individualism and uncertainty avoidance; in the research
described in this thesis, team members will be placed in four-dimensional space (with the
addition of the dimension of masculinity).
In Figure 4-1, the distances from one of the members of the team to the other five members
are represented by arrows; if we calculate the average length for these arrows, we have a
measure of the individual’s cultural separation from the rest of the team. We can repeat the
above calculation for all team members and take an average; we then have a measure of
team cultural diversity based on team members’ cultural distances from each other.
In practice, in order to maintain cultural diversity values for each of the four cultural
dimensions, the cultural separation calculations for each team member and for the team 25 The author considered, from his past experiences, that there were seldom more twenty members in a meaningfully interacting team. Therefore, it was practicable to consider each team member individually in the calculation without incurring significant overheads. 26 The issue of using spread sheets without macros was important if the tool were to be introduced to industrial companies, as many organisations placed major restrictions on their computer systems’ functionalities due to security concerns.
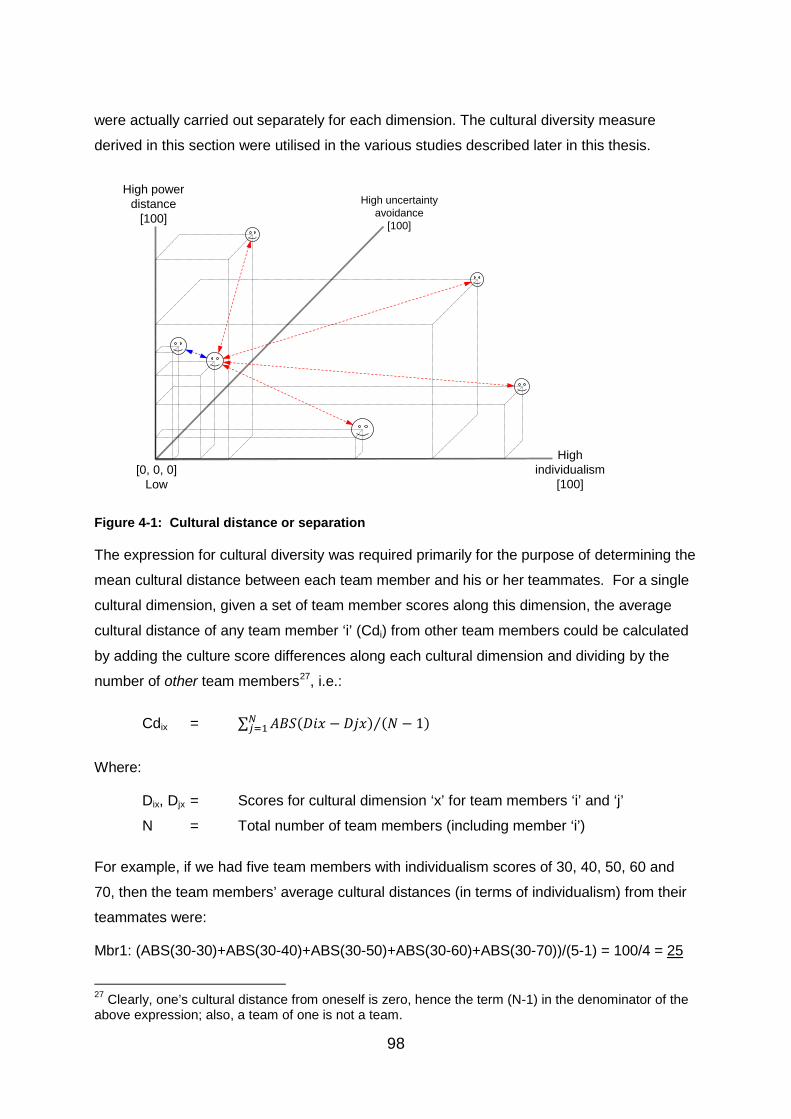
98
were actually carried out separately for each dimension. The cultural diversity measure
derived in this section were utilised in the various studies described later in this thesis.
Figure 4-1: Cultural distance or separation
The expression for cultural diversity was required primarily for the purpose of determining the
mean cultural distance between each team member and his or her teammates. For a single
cultural dimension, given a set of team member scores along this dimension, the average
cultural distance of any team member ‘i’ (Cdi) from other team members could be calculated
by adding the culture score differences along each cultural dimension and dividing by the
number of other team members27, i.e.:
Cdix = ∑ 𝐴𝐵𝑆(𝐷𝑖𝑥 − 𝐷𝑗𝑥)𝑁𝑗=1 (𝑁 − 1)⁄
Where:
Dix, Djx = Scores for cultural dimension ‘x’ for team members ‘i’ and ‘j’
N = Total number of team members (including member ‘i’)
For example, if we had five team members with individualism scores of 30, 40, 50, 60 and
70, then the team members’ average cultural distances (in terms of individualism) from their
teammates were:
Mbr1: (ABS(30-30)+ABS(30-40)+ABS(30-50)+ABS(30-60)+ABS(30-70))/(5-1) = 100/4 = 25
27 Clearly, one’s cultural distance from oneself is zero, hence the term (N-1) in the denominator of the above expression; also, a team of one is not a team.
High power distance
[100]
High individualism
[100]
High uncertainty avoidance
[100]
[0, 0, 0]Low
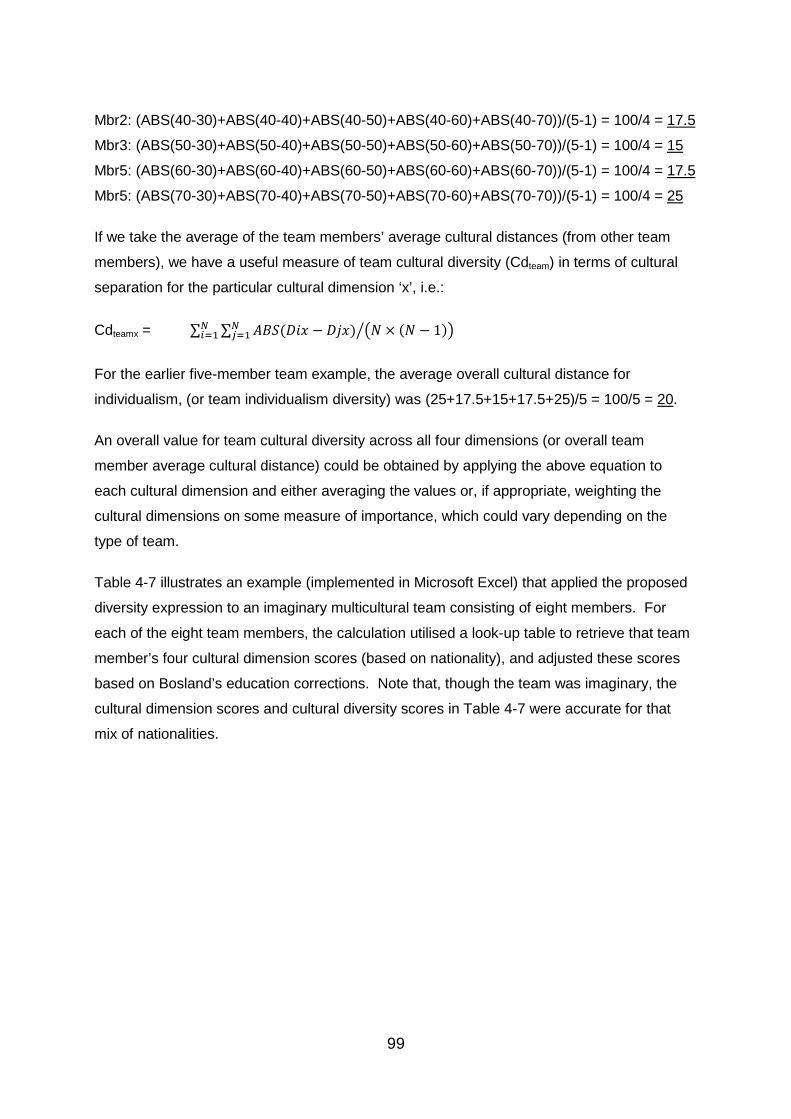
99
Mbr2: (ABS(40-30)+ABS(40-40)+ABS(40-50)+ABS(40-60)+ABS(40-70))/(5-1) = 100/4 = 17.5
Mbr3: (ABS(50-30)+ABS(50-40)+ABS(50-50)+ABS(50-60)+ABS(50-70))/(5-1) = 100/4 = 15
Mbr5: (ABS(60-30)+ABS(60-40)+ABS(60-50)+ABS(60-60)+ABS(60-70))/(5-1) = 100/4 = 17.5
Mbr5: (ABS(70-30)+ABS(70-40)+ABS(70-50)+ABS(70-60)+ABS(70-70))/(5-1) = 100/4 = 25
If we take the average of the team members’ average cultural distances (from other team
members), we have a useful measure of team cultural diversity (Cdteam) in terms of cultural
separation for the particular cultural dimension ‘x’, i.e.:
Cdteamx = ∑ ∑ 𝐴𝐵𝑆(𝐷𝑖𝑥 − 𝐷𝑗𝑥)𝑁𝑗=1
𝑁𝑖=1 �𝑁 × (𝑁 − 1)��
For the earlier five-member team example, the average overall cultural distance for
individualism, (or team individualism diversity) was (25+17.5+15+17.5+25)/5 = 100/5 = 20.
An overall value for team cultural diversity across all four dimensions (or overall team
member average cultural distance) could be obtained by applying the above equation to
each cultural dimension and either averaging the values or, if appropriate, weighting the
cultural dimensions on some measure of importance, which could vary depending on the
type of team.
Table 4-7 illustrates an example (implemented in Microsoft Excel) that applied the proposed
diversity expression to an imaginary multicultural team consisting of eight members. For
each of the eight team members, the calculation utilised a look-up table to retrieve that team
member’s four cultural dimension scores (based on nationality), and adjusted these scores
based on Bosland’s education corrections. Note that, though the team was imaginary, the
cultural dimension scores and cultural diversity scores in Table 4-7 were accurate for that
mix of nationalities.
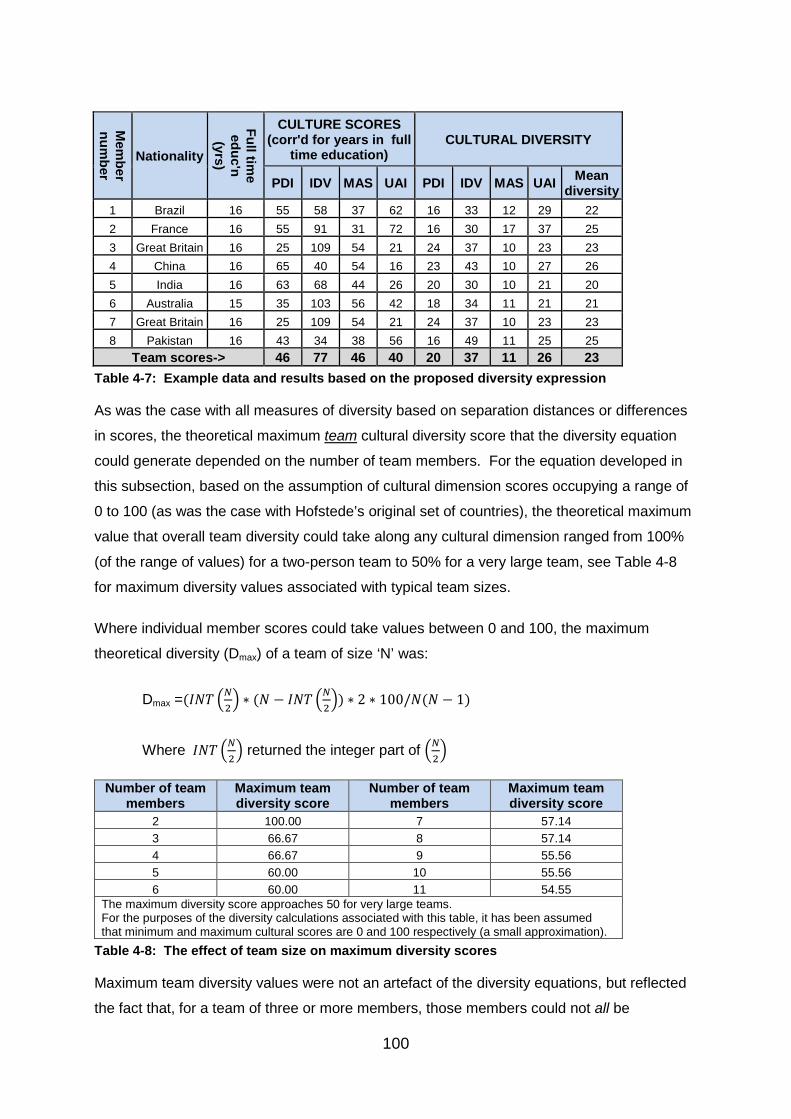
100
Mem
ber num
ber
Nationality
Full time
educ'n (yrs)
CULTURE SCORES (corr'd for years in full
time education) CULTURAL DIVERSITY
PDI IDV MAS UAI PDI IDV MAS UAI Mean diversity
1 Brazil 16 55 58 37 62 16 33 12 29 22 2 France 16 55 91 31 72 16 30 17 37 25 3 Great Britain 16 25 109 54 21 24 37 10 23 23 4 China 16 65 40 54 16 23 43 10 27 26 5 India 16 63 68 44 26 20 30 10 21 20 6 Australia 15 35 103 56 42 18 34 11 21 21 7 Great Britain 16 25 109 54 21 24 37 10 23 23 8 Pakistan 16 43 34 38 56 16 49 11 25 25
Team scores-> 46 77 46 40 20 37 11 26 23 Table 4-7: Example data and results based on the proposed diversity expression
As was the case with all measures of diversity based on separation distances or differences
in scores, the theoretical maximum team cultural diversity score that the diversity equation
could generate depended on the number of team members. For the equation developed in
this subsection, based on the assumption of cultural dimension scores occupying a range of
0 to 100 (as was the case with Hofstede’s original set of countries), the theoretical maximum
value that overall team diversity could take along any cultural dimension ranged from 100%
(of the range of values) for a two-person team to 50% for a very large team, see Table 4-8
for maximum diversity values associated with typical team sizes.
Where individual member scores could take values between 0 and 100, the maximum
theoretical diversity (Dmax) of a team of size ‘N’ was:
Dmax =(𝐼𝑁𝑇 �𝑁2� ∗ (𝑁 − 𝐼𝑁𝑇 �𝑁
2�) ∗ 2 ∗ 100/𝑁(𝑁 − 1)
Where 𝐼𝑁𝑇 �𝑁2� returned the integer part of �𝑁
2�
Number of team members
Maximum team diversity score
Number of team members
Maximum team diversity score
2 100.00 7 57.14 3 66.67 8 57.14 4 66.67 9 55.56 5 60.00 10 55.56 6 60.00 11 54.55
The maximum diversity score approaches 50 for very large teams. For the purposes of the diversity calculations associated with this table, it has been assumed that minimum and maximum cultural scores are 0 and 100 respectively (a small approximation).
Table 4-8: The effect of team size on maximum diversity scores
Maximum team diversity values were not an artefact of the diversity equations, but reflected
the fact that, for a team of three or more members, those members could not all be
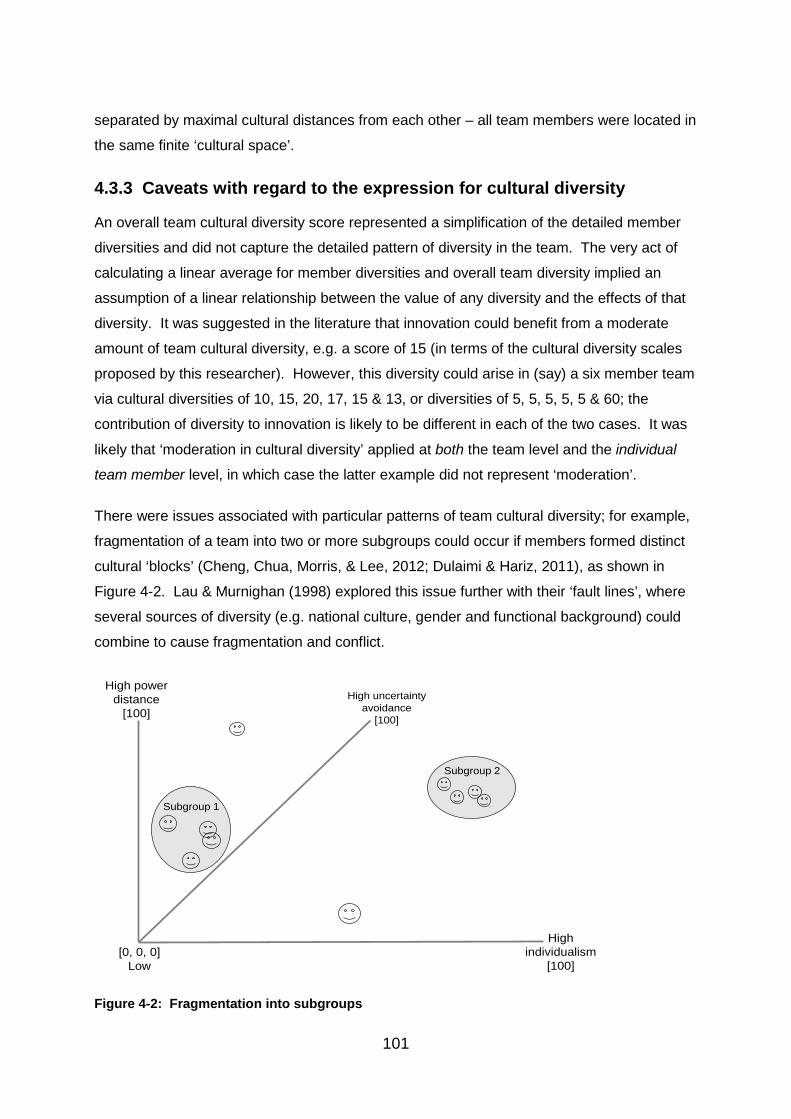
101
separated by maximal cultural distances from each other – all team members were located in
the same finite ‘cultural space’.
4.3.3 Caveats with regard to the expression for cultural diversity
An overall team cultural diversity score represented a simplification of the detailed member
diversities and did not capture the detailed pattern of diversity in the team. The very act of
calculating a linear average for member diversities and overall team diversity implied an
assumption of a linear relationship between the value of any diversity and the effects of that
diversity. It was suggested in the literature that innovation could benefit from a moderate
amount of team cultural diversity, e.g. a score of 15 (in terms of the cultural diversity scales
proposed by this researcher). However, this diversity could arise in (say) a six member team
via cultural diversities of 10, 15, 20, 17, 15 & 13, or diversities of 5, 5, 5, 5, 5 & 60; the
contribution of diversity to innovation is likely to be different in each of the two cases. It was
likely that ‘moderation in cultural diversity’ applied at both the team level and the individual
team member level, in which case the latter example did not represent ‘moderation’.
There were issues associated with particular patterns of team cultural diversity; for example,
fragmentation of a team into two or more subgroups could occur if members formed distinct
cultural ‘blocks’ (Cheng, Chua, Morris, & Lee, 2012; Dulaimi & Hariz, 2011), as shown in
Figure 4-2. Lau & Murnighan (1998) explored this issue further with their ‘fault lines’, where
several sources of diversity (e.g. national culture, gender and functional background) could
combine to cause fragmentation and conflict.
Figure 4-2: Fragmentation into subgroups
High power distance
[100]
High individualism
[100]
High uncertainty avoidance
[100]
[0, 0, 0]Low
Subgroup 2
Subgroup 1
102
The proposed measure of cultural diversity would provide detailed intermediate information
about the location of each team member in cultural space. This, in turn, would allow the
development of further analyses at a later stage (if required) to determine whether
fragmentation into subgroups represented a significant risk for a team.
4.3.4 Simplifying assumptions with regard to the measure of cultural diversity
Taking account of the detailed descriptions and examples presented in Subsection 4.3.3, it is
useful at this stage to discuss the assumptions associated with the adoption of the measure
of cultural diversity as an element of the model and tool. These are presented below:
(a) Linearity of diversity effects (see examples in Subsection 4.3.3): The diversity
values for each individual team member, and the mean diversity value for each
dimension, were calculated as linear averages. This implied an assumption of the
linearity of the effects of cultural distance, i.e. a doubling of cultural distance between
two members was assumed to bring twice as much in terms of diversity problems and
benefits. In situations where moderate levels of cultural diversity were beneficial,
then the diversity expression would be less accurate in terms of its predictions if team
member diversities were unevenly distributed, see the example described in Sub-
section 4.3.3. The author has ignored this potential source of error, other than
incorporating a warning in the tool when a single individual’s diversity is substantially
greater than those of other team members.
(b) Limited interactions between culture and diversity: It was probable that team
members from high uncertainty avoiding cultures, with their heightened suspicions of
foreigners (Geert H. Hofstede, 2001, p.160, exhibit 4.4), would cope with cultural
diversity less effectively than would those from low uncertainty avoiding cultures.
This implied that the effects of team diversity were not independent of team average
cultural values. The author has ignored this potential source of error, and has
assumed, for the purpose of tool-building, that such culture/diversity interactions had
a limited effect compared to those of the average cultural scores and cultural diversity
scores.
4.4 Defining teams and tasks from the viewpoint of culture
The team and task classifications identified in the literature review were unsuitable for the
purpose of identifying the effects of culture on team task performance. In particular, these
103
team taxonomies were typically applicable to a narrow range of teams, and the task
taxonomies did not capture aspects of tasks that were affected by team member cultural
traits. Methods of representing team/task combinations had to be developed that were
appropriate for the purpose of predicting the effects of culture on performance.
Taxonomic approaches to team classification were very limited in what they could cover
(Bacharach, 1989; Hollenbeck et al., 2012); their default assumption (of non-overlapping
categories) forced users to assign teams semi-arbitrarily. Even if our teams had five key
features that could each take only four values, this would potentially generate more than a
thousand slots in the taxonomy if we needed to differentiate between each team type. In
reality, team types had overlapping properties, and could often be assigned to several
categories. In our case, we needed to distinguish between teams, not only on the basis of
their tasks or missions, but also on the basis of the effects of team member cultures on team
performance of those tasks or missions.
4.4.1 A practical team/task framework
The set of five key ‘culture-relevant’ factors, identified in Section 3.3.3, have been ‘fleshed
out’ into a number of sub-factors (based on the information contained in Sub-sections 3.3.1
to 3.3.3). These factors and their sub-factors are described and summarised below:
i) Management and decision-making
Culture (as measured via the power distance, individualism and uncertainty avoidance
scores) had a major effect on subordinate/superior relationships.
Delegation of management authority: High power distance and high uncertainty
avoidance cultures both encouraged strong, centralised, directive, non-consultative forms of
management and decision-making, whereas low power distance and low uncertainty
avoidance cultures encouraged more consensus-based, delegation-based forms of
management and decision-making. Some tasks and missions were best served by authori-
tarian, strongly centralised management, for example highly automated factory systems or
missions involving large military manoeuvres; others, for example complex decisions
requiring wide or deep knowledge were typically best served by the consensus-based
decentralised, delegating management.
Decision-making under uncertainty: Managers from high uncertainty-avoiding cultures
were slow to ‘reframe’ and tended to have difficulty with decision-making under uncertainty,
resulting in delays and non-optimal choices that were made in an attempt to reduce
104
uncertainty. Managers from high power distance cultures typically failed to exploit their
subordinates’ knowledge, and often made decisions swiftly, based on inadequate
information. In some environments performance was best served by the rigid adherence to
rules or standard operating procedures (SOPs) that tended to be a feature of high
uncertainty-avoiding cultures, e.g. in many production and maintenance environments; in
other environments, the ability to recognise when to abandon rules or SOPs could ‘save the
day’, for example, when an aircraft was no longer operating within its normal flight envelope.
Following standard operating instructions (SOPs) (vs. not following them when appropriate): Members of high uncertainty avoidance teams would tend to adhere at all
times to SOPs, thus reducing errors under normal conditions; however, they would continue
to follow SOPs that were no longer applicable due to their tardiness in ‘reframing’. Members
of high power distance teams would not challenge their superiors when they failed to follow
SOPs. Members of low individualist teams would not directly challenge their superiors when
they failed to follow SOPs, but would attempt, indirectly, to bring their attention to this failure.
Members of high individualist teams were willing to challenge their superiors when they
deviated from SOPs. Note that cultural dimension scores interact and could produce
conflicting constraints on team members.
Recognising and correcting mistakes: Members of high power distance cultures would
typically be unwilling to correct their superiors (e.g. team leaders) when they had made a
mistake. Members of low individualism cultures would not correct others (in particular,
leaders) because this would result in a loss of face; instead, they would try, indirectly, to draw
the other person’s attention to the error so that he/she could discover and correct it.
Members of high uncertainty-avoidance teams tended to take more time than others to
recognise mistakes or incorrect assumptions; in addition, their leaders or managers tended
to discourage feedback from their subordinates. Where it was important to recognise and
correct errors (particularly if time was a factor), the improved team communication of low
power distance, low uncertainty avoiding cultures, and the context-free communication of
high individualism cultures combined to provide prompt, accurate feedback.
Summarising the above sub-factors:
• Centralisation of authority and non-consultative decision-making vs. delegation of
authority and consultative decision-making.
• Decision-making under uncertainty.
• Following standard operational procedures (SOPs) at all times vs. not following SOPs
105
when circumstances demand.
• Recognising and correcting errors.
ii) Creativity and innovation
Culture, via pressure to conform, willingness to speak out and attitudes to uncertainty, had a
considerable effect on creativeness. Some team goals required an ability to produce (and
present) a large number of ideas, go against the consensus and engage in a degree of
conflict; others required an ability to take new ideas forward towards usable concepts; yet
others required an ability to implement existing technologies into products and processes; in
this latter situation, disciplined concentration on the task in hand was better than constantly
exploring new ideas.
Developing new ideas and concepts: High power distance team members would be less
likely than low power distance team members to volunteer ideas; high uncertainty avoidance
team members would feel uncomfortable with novel ideas (‘outside their comfort zone’). Low
individualism and low masculinity team members would tend to seek consensus rather than
novelty. A degree of cultural diversity offered a wider range of ideas, if they could be ‘teased
out’, e.g. by brain storming.
Developing, improving more conventional ideas, products, processes: In the case of
less creative work, well-controlled, ordered organisations and processes appeared to be
more effective. In this case, high power distance, low individualist, high uncertainty avoiding
and medium-high masculinity cultures appeared to be most effective. In between low and
high creativity, it appeared that the cultural dimension scores were similarly intermediate. In
the case of low-creativity teamwork, it was unlikely that the disruption caused by cultural
diversity was of any benefit.
Going against the consensus: High power distance team members would normally agree
with their leaders, or would say nothing rather than to disagree. High uncertainty-avoiding
team members would not generally be encouraged to state differing opinions. Low
individualism team members would typically regard consensus as a prior requirement for
good performance; low masculinity team members would similarly be driven by a need for
consensus. High individualism team members would feel much less constrained to go with
the consensus, and high masculinity team members would tend ensure that their views were
heard, even if this caused intra-team conflict; however, their scores in other dimensions
would affect this willingness to go against the consensus (e.g. low individualist, high
106
masculinity team members in Japan directed their competitiveness externally to the team).
Summarising the above sub-factors:
• Developing new ideas and concepts through to minor product improvements and
following procedures (e.g. in maintenance).
• Going against the consensus.
iii) Interaction (communication and co-ordination within the team)
Cultures, due to face and status issues, varied widely in the degree to which rapid, direct,
factual communication could occur. Some team situations required rapid, accurate
communication and continuous co-ordination; other team situations required complex but
non-time-critical communication. The required speed, complexity and accuracy of communi-
cation within a team depended on the tasks that the team had to able to carry out. In a ‘blue-
skies’ research team, occasional interchange of complex information might be required
between team members; under emergency conditions in the cockpit of an advanced
transport aircraft, or in the control room of a nuclear reactor, rapid, accurate interchange of
key information would be required.
Saying what you mean, meaning what you say vs. conveying meaning diplomatically (typically indirectly): In certain circumstances, it was important that team members
exchanged information in a prompt, direct, accurate manner, for example in military
manoeuvres or rapidly-developing situations, e.g. emergencies, which required immediate
responses. High power distance discouraged subordinates from communicating (unless
prompted by their superiors); low-individualism demanded high-context communication and,
as stated earlier, drawing a superior’s attention to a problem or error could only be done
indirectly – taking time and attention away from any developing situation. However, when
negotiating with low-individualist, high-power-distance or little-understood groups, it was best
to proceed with caution and a minimum of commitment to any expression of views. In this
case, the low-collectivist, high-power-distance team member might be most effective.
Communicate rapidly and accurately with colleagues, superiors and subordinates when necessary vs. communicating about and discuss in-depth complex concepts in a considered manner: In some forms of teamwork, e.g. in action teams (aircrews, facility
operating crews), rapid, accurate communication was required at key times. Conversely, in
some other forms of teamwork, for example project planning or research & development,
team members came together to discuss problems on an ad-hoc or regular basis; although
107
there might be pressure to achieve specific goals, there was typically time for detailed
discussions and deliberations.
Interacting with other team members on a frequent or continuous basis vs. interacting with other team members mainly (or only) at key decision points: When carrying out
highly integrated or co-ordinated tasks, continuous interaction might be necessary, for
example as part of an assembly or test task, or during a complex manoeuvre such as
docking a ship, co-ordinating the landing of aircraft on a carrier or when handling an
emergency. Conversely, in some forms of teamwork, team members worked individually for
long periods, coming together to discuss progress and key stages, etc., for example in much
of research and development work.
Sharing information with other team members whenever possible vs. only sharing information on a need-to-know basis: Keeping others in the team informed of any actions
or status changes helped maintain a shared understanding of the situation or stage of
development in an ongoing project. Such information sharing was easier in a low power
distance, high individualism, low uncertainty avoiding culture. Conversely, in situations
where secrecy (or confidentiality) was important, it might be necessary to limit information-
sharing. In such cases, the suspiciousness of high-uncertainty-avoiding team members
might be an asset. Also, high-power distance, in discouraging informal information
exchange, might be beneficial.
Summarising the above sub-factors:
• Say what you mean, mean what you say vs. convey meaning indirectly,
diplomatically.
• Communicate rapidly and accurately with colleagues, superiors and subordinates vs.
communicate and discuss in-depth a range of complex topics in a considered
manner.
• Interact with other team members on a frequent or continuous basis vs. interact with
other team members mainly (or only) at key decision points.
• Share information at all times vs. share information only on a need to know basis.
iv) Handling uncertainty and dealing with failures
Some environments and team goals resulted in highly predictable activities and/or outcomes;
108
other environments resulted in highly unpredictable activities and/or outcomes that had to be
accommodated by the team or crew. Cultures (in particular, as measured by their
uncertainty avoidance scores) varied greatly in their capabilities to deal with uncertainty.
Highly-predictable activities and outcomes vs. highly unpredictable activities and outcomes: In situations of relatively low uncertainty, for example planned maintenance of
sociotechnical systems and the activities of many team games, the inflexibility of high power
distance, the commitment to rules and caution of high uncertainty avoidance and the
subservience to the group of low individualism might offer benefits. In the opposite case,
where both activities and outcomes might be unpredictable, then the flexibility of low power
distance, low uncertainty avoidance and high individualism might offer benefits.
Errors and failures must be dealt with quickly vs. errors and failures require careful consideration prior to action: In situations where errors caused rapid deterioration in the
situation, they had to be recognised and dealt with promptly. High uncertainty avoidance
reduced the speed with which errors are detected, high power distance reduced the
willingness of team/crew members to inform their superiors or leaders, and low individualism
prevented subordinates from informing their superiors directly due to loss of face issues.
Low uncertainty avoidance, low power distance and high individualism contributed to rapid
detection of errors and failures (willingness to reframe) and the informing of superiors
promptly, in a direct clear manner. In situations where there was time for extended
consideration, the effects of culture on performance were less severe than when fast action
was required. However, high power distance still tended to reduce the range of solutions
under consideration (due in part to lack of consultation), and high uncertainty avoidance
tended to limit potential solutions to those that were well-understood.
Summarising the above sub-factors:
• Handle highly-predictable activities and outcomes.
• Handle highly predictable activities and outcomes except under rare circumstances
when they become highly dangerous and unpredictable
• Handle highly UNpredictable activities and outcomes
• Handle errors and failures very quickly
• Give careful consideration to errors and failures prior to action
109
v) Situation awareness
Individual situation awareness: This applied primarily to organised action teams, e.g.
aircrews, power station operators. High uncertainty avoidance tended to reduce individual
situation awareness (due to both training issues and reluctance to mentally reframe).
Shared situation awareness: As above, this applied primarily to organised action teams.
As stated above, high uncertainty avoidance tended to reduce individual situation awareness
(due to both training issues and reluctance to mentally reframe) of all operators or crew
members. In addition, crew or operator communication difficulties hampered further shared
situation awareness – high power distance and high uncertainty avoidance both discouraged
unprompted subordinate communication of information, and low individualism caused
subordinates to refer indirectly to arising situational issues, often resulting in substantial
delays in reactions and reduced shared situation awareness.
Summarising the above sub-factors:
• Maintain individual situation awareness at all times
• Maintain shared situation awareness at all times
4.4.2 An ideal team/task framework
The cultural framework described and applied in the work of this thesis utilised four dimen-
sions (PDI, IDV, MAS and UAI) plus cultural diversity, thus enabling us to position team
member cultures and team mean culture at locations in continuous culture space. Rather
than pursuing a taxonomic or factor approach to team/task classification, it would have
greatly simplified matters if a small number of dimensions based on relevant independent
factors could have been adopted as the basis for team/task classification, as recommended
by Hollenbeck et al. (2012); this would have enabled us to position a team at a location in
continuous team/task/mission space, rather than to ‘shoehorn’ it into an ill-fitting taxonomic
slot.
Figure 4-3 illustrates the idealised case, where a task/mission located in task/mission space
could be mapped (by a process of transformation) into a ‘desirable’ location in culture space;
for ease of illustration, only three axes are shown in the figure.
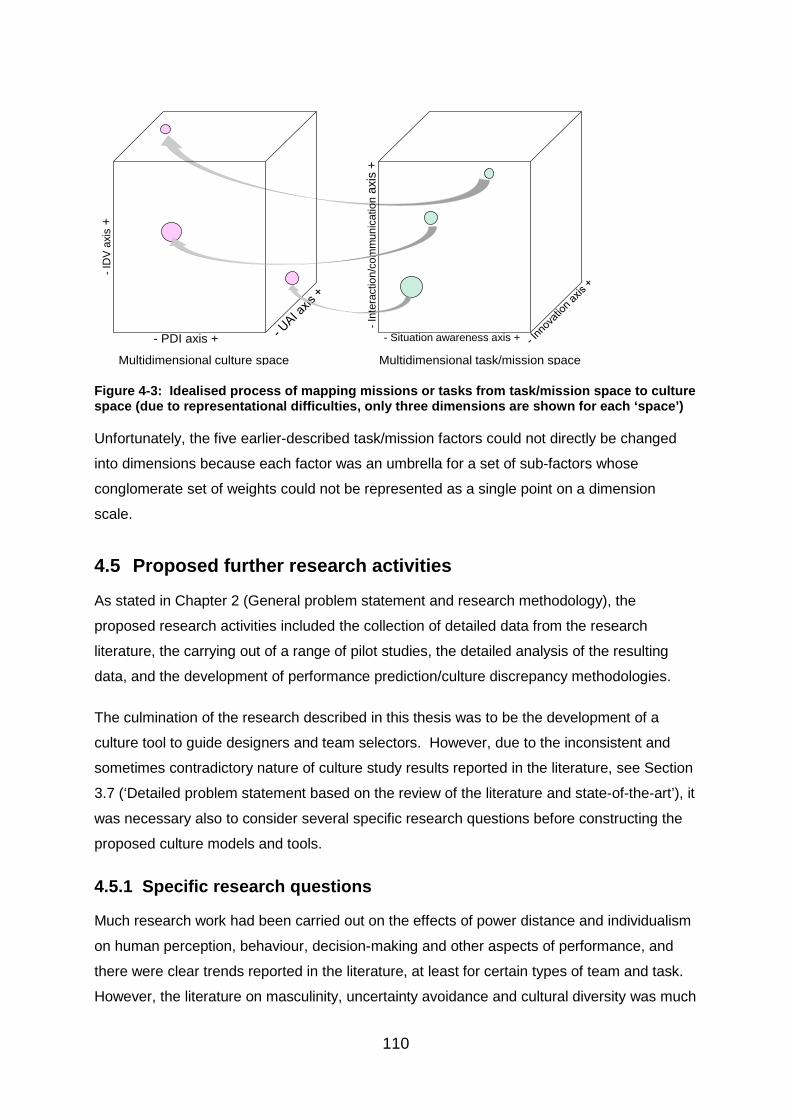
110
Figure 4-3: Idealised process of mapping missions or tasks from task/mission space to culture space (due to representational difficulties, only three dimensions are shown for each ‘space’)
Unfortunately, the five earlier-described task/mission factors could not directly be changed
into dimensions because each factor was an umbrella for a set of sub-factors whose
conglomerate set of weights could not be represented as a single point on a dimension
scale.
4.5 Proposed further research activities
As stated in Chapter 2 (General problem statement and research methodology), the
proposed research activities included the collection of detailed data from the research
literature, the carrying out of a range of pilot studies, the detailed analysis of the resulting
data, and the development of performance prediction/culture discrepancy methodologies.
The culmination of the research described in this thesis was to be the development of a
culture tool to guide designers and team selectors. However, due to the inconsistent and
sometimes contradictory nature of culture study results reported in the literature, see Section
3.7 (‘Detailed problem statement based on the review of the literature and state-of-the-art’), it
was necessary also to consider several specific research questions before constructing the
proposed culture models and tools.
4.5.1 Specific research questions
Much research work had been carried out on the effects of power distance and individualism
on human perception, behaviour, decision-making and other aspects of performance, and
there were clear trends reported in the literature, at least for certain types of team and task.
However, the literature on masculinity, uncertainty avoidance and cultural diversity was much
Multidimensional culture space Multidimensional task/mission space
- PDI axis +
-Int
erac
tion/
com
mun
icat
ion
axis
+
- Situation awareness axis +
-ID
V ax
is+
111
less clear. Therefore, the following three research questions were posed:
1. Masculinity (MAS): There were mixed results in the literature with regard to the
effects of MAS on innovation, although low MAS appeared to be associated with
compromise and groupthink. In areas such as transport and industrial production,
there appeared to be remarkably little association between MAS and accident rates; it
would be logical to expect that high-MAS, highly-competitive operators and crew
would take more risks than low-MAS highly socialising operators and crew. Could the
effects of MAS on team performance in various domains be clarified?
2. Uncertainty avoidance (UAI): High UAI appeared to have a negative effect on most
team-related activities, except in the development of low innovation products and
services. Were there other areas where high UAI offered benefits?
3. Cultural diversity: Reports from the literature about the effects of cultural diversity
on performance were inconsistent and, in many cases, contradictory. Were there any
cases where there were clear diversity-linked patterns of effects?
4.5.2 Culture models and tools
Based on findings from the literature review and further studies, it was necessary to draw up,
at very least, approximate or general models of the relationships between the four cultural
dimensions (plus cultural diversity) and the factors relating to task/mission performance.
These, detailed in Chapter 5, would form the information or knowledge basis of the culture
tools.
The first tool (TCT1, Chapter 6) was intended as an initial exploration of approaches to
cultural aspects of performance prediction; the later tools were intended to demonstrate
increasingly practicable approaches to the assessment of cultural fit and performance
prediction.
4.6 Summary of research tools and proposed activities
Hofstede’s four-dimension culture framework was selected as the cultural framework for the
proposed research, along with Bosland’s educational adjustment factors (Bosland, 1985)
where appropriate. A measure of cultural diversity based on team member location in four-
dimensional culture space was developed. A team task/mission classification based on five
factors and their sub-factors was proposed, based on the literature review.

112
Prior to the development of the models and tool, a detailed data collection and analysis
exercise was required, utilising material collected from the literature and the researcher’s
own questionnaire results and pilot studies. This exercise, detailed in Chapter 5, was
intended to provide more details of relationships between cultural factors and the above-
proposed team/task performance factors.
113
5 Data collection and analysis
5.1 Introduction
This chapter describes a set of studies, the purpose of which was to gather detailed
information in order to identify or clarify culture-performance relationships for various team
types. These culture-performance relationships, combined with those found in the earlier
literature review, were subsequently utilised in a set of team culture tools described in later
chapters.
Section 5.2 describes the collection (via interview and questionnaire) of anecdotal
information and its analysis by the author of this thesis. Section 5.3 presents the results of
studies carried out by the author, either directly or (in some cases) based on data collected
from external sources. Section 5.4 provides partial answers to three research questions
posed in Chapter 4. Section 5.5 combines the results of the literature review and the
analyses of Sections 5.2, 5.3 and 5.4 in order to derive culture/performance relationships for
a set of team culture models and tools. Section 5.6 provides a summary of the work of this
chapter.
The default assumption behind statistical analyses of data was that relationships between
variables were linear. This assumption appeared to be true in some cases, and appeared to
be a good approximation over a limited range in other cases; however, it would not be the
case where an optimum value (or score) occurred in the middle of a range. As examples of
potential non-linear relationships, consider two of the cultural dimensions utilised in this
report:
• Masculinity and innovative or creative team projects: Very high masculinity could
result in excessive competition and reduced co-operation within a research team; low
masculinity (high femininity) could result in excessive effort being devoted to the
achievement of consensus, at the expense of novelty. As stated in Chapter 3, Halkos
& Tzeremes’ (2011) results implied an optimum masculinity score of perhaps 70 to
80.
• Power distance and complex projects requiring high co-ordination: Very high
power distance resulted in much-reduced delegation, potentially resulting in low
114
quality decision-making (based on status rather than knowledge) where subject
matter experts were not encouraged to contribute and slow responses to problems
(due to lack of feedback); however, very low power distance could lead to a loss of
leadership and co-ordination.
It was important, therefore, to consider non-linear (or bilinear) relationships where
operational logic would indicate the likelihood of such relationships.
Unless otherwise stated, the cultural dimensions referred to in this chapter were those that
were identified in Hofstede’s original research, i.e. power distance (PDI), individualism (IDV),
masculinity (MAS) and uncertainty avoidance (UAI).
In order to determine team member culture scores, to apply Bosland’s educational correc-
tions (where appropriate), to calculate cultural diversity scores and to derive average team
culture scores, many complex calculations were required. Several tools were developed and
incorporated into spread sheets for the purposes of carrying out these calculations.
5.2 The collection of qualitative anecdotal information
The author has worked, and continues to work, in a multicultural university environment.
Through contacts via research meetings, research training courses, former colleagues and
current friends in other departments and other universities and via sports contacts, the author
has been able to gather a range of qualitative anecdotal information. In addition, he has
utilised an on-line survey form to collect additional information.
5.2.1 Informal interviews and personal conversations
Note that, as the examples presented in this section were anecdotal, no claim is made to the
effect that they are typical or representative. The sources of most of the anecdotes below
were the conversations that the author had with other research staff, foreign students,
lecturers, fellow footballers and others about their experiences on coming to Britain or
travelling elsewhere. In many cases, the anecdotes that the author obtained were potentially
traceable to their sources, and in other cases he was asked not to quote them; such
anecdotes have not been listed in the selection below. See Appendix 2 for more detailed
versions of the conversations.
115
Examples of culturally-related feedback include the following28:
• Rank and status: Two high-PDI respondents (from different parts of the World)
commented on the lack of respect accorded them by juniors of their own country
when in this country.
• Indirectness: Despite their high IDV score (which would imply a direct mode of
conversation), the British are typically very indirect in their commands and feedback.
A direct-speaking Scandinavian commented on what he saw as this irritating aspect
of dealing with the British; he also commented on the still-prevalent although
declining occurrences of sexist remarks.
• Face: Several Chinese respondents commented on guanxi and face-related aspects
of their culture (e.g. obtaining jobs, criticism).
• A British pilot’s experiences: The author carried out an unstructured interview with
a pilot who had more than twenty years flying experience on flag carriers, budget
airlines and private lease flying services. As a regular pilot trainer, the pilot described
one of his key tasks as attempting to minimise the ‘power slope’ in the cockpit as, for
crews of many nationalities, the captain was a considerable distance above the first
officer. From the pilot’s description, it became clear that ‘power slope’ was the
equivalent of power distance. The pilot also described his concern about attitudes to
standard operational procedures (SOPs), in particular the agitation of some non-UK
co-pilots (including experienced ones) when told by him that he would deviate from
SOPs in order to maintain a margin of safety, e.g. when landing at difficult airports in
bad weather conditions.
The pilot commented on the increasingly multinational nature of the industry, with
some airlines employing more than seventy nationalities of flying crews. One such
airline used a set of ‘watertight’ SOPs in order to cope with problems associated with
crew national diversity; the pilot expressed concerns about this SOP-fixation and the
safety issues that would arise when conditions deviated excessively from the norm,
resulting in a loss of safety margin. He commented that the Swissair MD-11 crash of
1998 might have been avoided if the pilots had immediately headed for the nearest
airport instead of being preoccupied with following SOPs and going through detailed
checklists. The author described the uncertainty avoidance dimension which, the
pilot felt, explained some of the above differences he had found between various
28 Note that the cultural values (e.g. high-PDI) referred to the individuals’ default national culture scores for the Hofstede cultural framework.
116
nationalities of pilot, in particular the ‘SOP-fixation’.
The pilot went on to describe issues of face that came to the fore when he had to
correct pilots of some nationalities, in particular when training or testing pilots; he also
commented on the ‘gung-ho’ attitudes29 of US pilots, in particular. We discussed this
latter point further and it appeared to relate to masculinity; however, this attitude was
apparently not common amongst other nationalities. As the USA default masculinity
score was lower than that of the UK and many other countries, this supported
Merritt’s findings that Hofstede’s masculinity scores were not closely replicated
amongst aircrew (A. C. Merritt, 2000). The pilot also commented on differing
preferences for automation, and the issue of loss of flying skills.
To summarise this pilot’s experiences, it appeared that national culture played a
significant role in civil aviation crewing. In particular, the effects of power distance,
individualism and uncertainty avoidance appeared to be in line with those reported in
the literature; however, the default masculinity scores appeared to be unreliable
indicators of attitudes and behaviour.
5.2.2 Questionnaire responses
The author designed a web-based culture questionnaire (taking advice from others as to its
format and content) and distributed it via email to a range of students and employees and via
Facebook to other contacts. The questionnaire form is shown in Appendix 3. Approximately
75% of answers related to travellers to the UK, and 25% of the answers related to travellers
from the UK (to elsewhere). The most common issues and differences commented on in the
questionnaire returns included the following:
• Friendships: One low-MAS and three low-IDV respondents commented on the
disappointing shallowness of English friendships - the apparent initial friendliness did
not develop into anything.
• Formality and power distance (by other names): Virtually all respondents from
countries significantly higher in power distance (compared to the UK) noted this
difference; in particular they commented on the reduced formality in meetings and the
ease with which they could discuss matters with their team leader or supervisor.
• Timing and preparation: This was remarked on by several respondents. In
particular, the high-uncertainty-avoiding German respondents did not like the 29 As in over-competitiveness, overenthusiasm, lacking caution and not thinking through potential consequences.
117
apparent lack of preparation and the lax time-keeping (including meeting overruns)
that were often a feature of meetings in the UK.
Although not all the comments received from conversations, interviews and questionnaire
returns were directly related to culture, they seemed to confirm the author’s view (based on
previous experience) that individuals’ culturally-defined expectations of behaviour were
engrained to such a degree, almost irrespective of their personalities, that they felt shock
and/or disappointment when these expectations were not met. Such culturally-defined
expectations about the behaviours of others (in particular the behaviours of others of the
same nationality) almost certainly play a larger role in defining team member interactions
than did minor differences in personality and upbringing. This represented an ameliorating
factor with regard to Hofstede’s ‘ecological fallacy’ warning.
5.3 Data from the author’s studies
The author carried out a range of pilot studies on commercial and industrial work teams and
student groups; in addition, he collected data from various sources (including websites
detailing football fixtures and performances, footballer abilities, aircraft crash data, seafarer
fatalities and research performance data). The data was processed and statistically
analysed; summary results are presented in the following subsections, and more details can
be found in Appendix 4.
As well as contributing to the discovery or confirmation of general relationships, the pilot
studies enabled the relative contributions of the various cultural dimensions and cultural
diversity dimensions to be determined; these have contributed to the culture-performance
models that underlie the team culture tools described later.
5.3.1 Industrial and commercial project and management teams
A large number of researchers have investigated project and management team success
and failure factors, e.g. Pinto & Mantel (1990), Cozijnsen et al. (2000), Belout & Gauvreau
(2004) and Iamratanakul et al. (2007). Their results have been extremely variable due in part
to the wide disparity in measures of performance effectiveness, the large range of
contributing factors (independent variables) taken into account and the wide range of project
stages considered. It was therefore with some trepidation that the author gathered data on
project team performance via questionnaires and (where possible) accompanying interviews.
The data was acquired from personnel who were, or had been, involved in technical project
and/or management teams. The results, in particular the interview feedback and
118
questionnaire comments sections, revealed some of the issues that plagued researchers in
this area; for example, a proven high performance team could find itself with an unattainable
target due to external politics. In general, however, it was usually clear from the question-
naire and interview comments as to how well teams performed on a professional and social
level, irrespective of the achievement of the externally imposed team goals.
Following further consideration, it was decided to retain the material on project and manage-
ment teams for the purpose of testing the culture tools rather than for influencing the task-
mission/desirable-culture relationships.
5.3.2 Student project groups
The primary data sources for the student group studies were the undergraduate student
group projects carried out in Loughborough University’s School of Electronic, Electrical &
Systems Engineering. These student groups were effectively self-managed project teams.
a) The student group studies
Data was collected on the previous seven years of student group projects; students had
been encouraged to comment in these past projects so that additional information on
individual views of the groups and their performances were available. The projects had been
assessed in part on creativity and innovation.
Table 5-1 presents a summary of the data analysis of student groups, detailed data can be
found in Appendix 4A. The results of the statistical analysis indicated that the two main
contributors to student group performance (as measured by overall project mark) were
average individual student grade point average (GPA)30 and student group mean uncertainty
avoidance (UAI) score; together, they explained 74.5% of the variance in group performance.
Student group project performance was positively correlated with average student GPA (as
would be expected), negatively correlated with UAI score and positively correlated with UAI
diversity score. Other researchers have suggested that best student GPA score is more
important than average student GPA score, e.g. (Swigger, Brazile, Harrington, Peng, &
Alpaslan, 2005); this was tested but not supported by the statistical analysis.
30 Based primarily on the students’ individual performances on coursework and examinations.
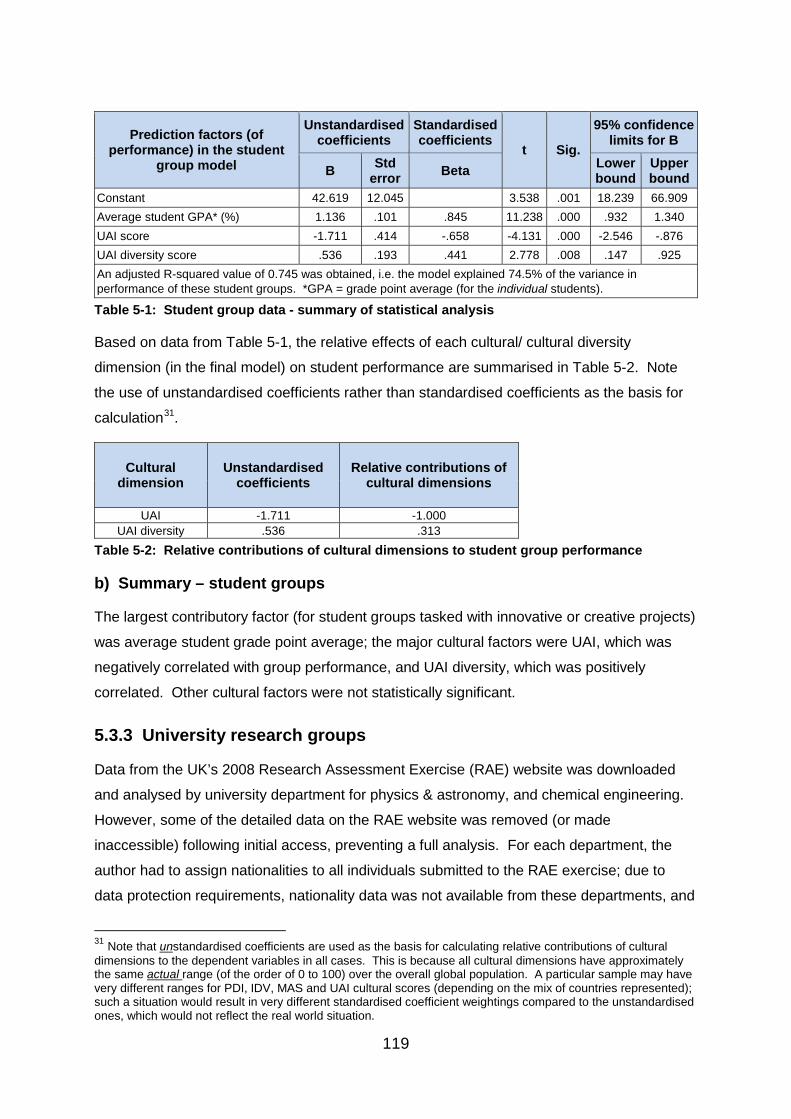
119
Prediction factors (of performance) in the student
group model
Unstandardised coefficients
Standardised coefficients
t Sig.
95% confidence limits for B
B Std error Beta Lower
bound Upper bound
Constant 42.619 12.045 3.538 .001 18.239 66.909 Average student GPA* (%) 1.136 .101 .845 11.238 .000 .932 1.340 UAI score -1.711 .414 -.658 -4.131 .000 -2.546 -.876 UAI diversity score .536 .193 .441 2.778 .008 .147 .925 An adjusted R-squared value of 0.745 was obtained, i.e. the model explained 74.5% of the variance in performance of these student groups. *GPA = grade point average (for the individual students).
Table 5-1: Student group data - summary of statistical analysis
Based on data from Table 5-1, the relative effects of each cultural/ cultural diversity
dimension (in the final model) on student performance are summarised in Table 5-2. Note
the use of unstandardised coefficients rather than standardised coefficients as the basis for
calculation31.
Cultural dimension
Unstandardised coefficients
Relative contributions of cultural dimensions
UAI -1.711 -1.000 UAI diversity .536 .313
Table 5-2: Relative contributions of cultural dimensions to student group performance
b) Summary – student groups
The largest contributory factor (for student groups tasked with innovative or creative projects)
was average student grade point average; the major cultural factors were UAI, which was
negatively correlated with group performance, and UAI diversity, which was positively
correlated. Other cultural factors were not statistically significant.
5.3.3 University research groups
Data from the UK’s 2008 Research Assessment Exercise (RAE) website was downloaded
and analysed by university department for physics & astronomy, and chemical engineering.
However, some of the detailed data on the RAE website was removed (or made
inaccessible) following initial access, preventing a full analysis. For each department, the
author had to assign nationalities to all individuals submitted to the RAE exercise; due to
data protection requirements, nationality data was not available from these departments, and
31 Note that unstandardised coefficients are used as the basis for calculating relative contributions of cultural dimensions to the dependent variables in all cases. This is because all cultural dimensions have approximately the same actual range (of the order of 0 to 100) over the overall global population. A particular sample may have very different ranges for PDI, IDV, MAS and UAI cultural scores (depending on the mix of countries represented); such a situation would result in very different standardised coefficient weightings compared to the unstandardised ones, which would not reflect the real world situation.
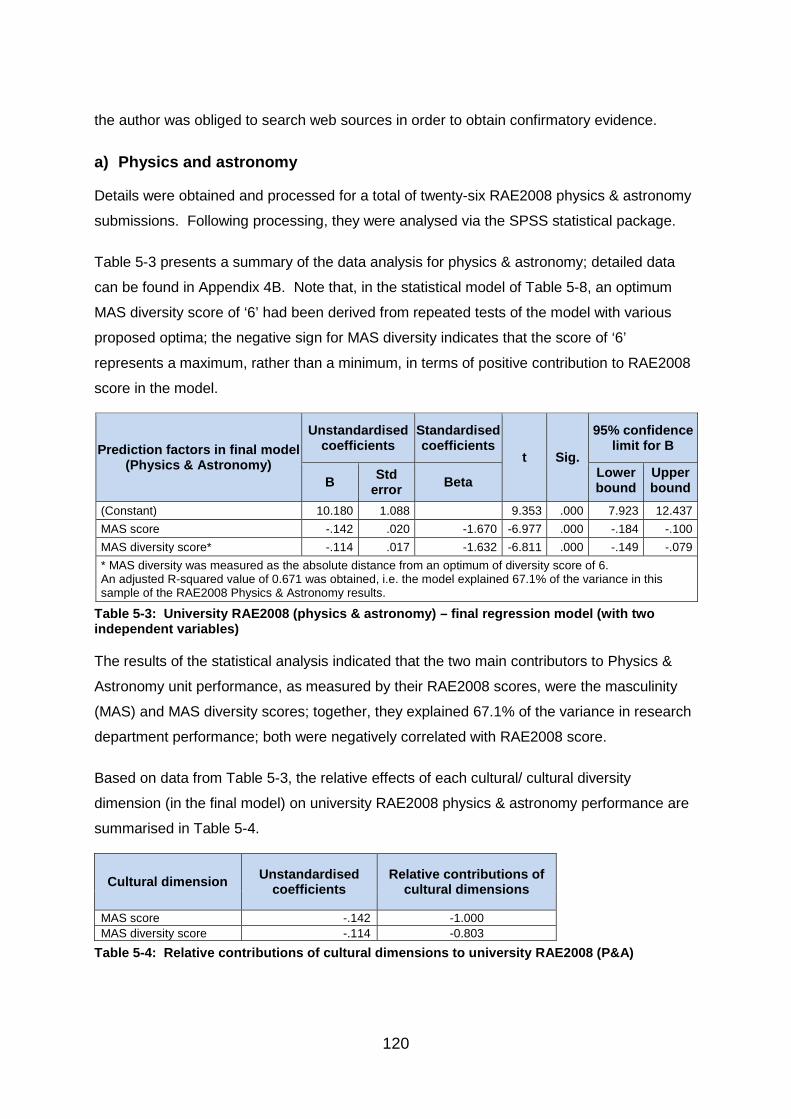
120
the author was obliged to search web sources in order to obtain confirmatory evidence.
a) Physics and astronomy
Details were obtained and processed for a total of twenty-six RAE2008 physics & astronomy
submissions. Following processing, they were analysed via the SPSS statistical package.
Table 5-3 presents a summary of the data analysis for physics & astronomy; detailed data
can be found in Appendix 4B. Note that, in the statistical model of Table 5-8, an optimum
MAS diversity score of ‘6’ had been derived from repeated tests of the model with various
proposed optima; the negative sign for MAS diversity indicates that the score of ‘6’
represents a maximum, rather than a minimum, in terms of positive contribution to RAE2008
score in the model.
Prediction factors in final model (Physics & Astronomy)
Unstandardised coefficients
Standardised coefficients
t Sig.
95% confidence limit for B
B Std error Beta
Lower bound
Upper bound
(Constant) 10.180 1.088 9.353 .000 7.923 12.437 MAS score -.142 .020 -1.670 -6.977 .000 -.184 -.100 MAS diversity score* -.114 .017 -1.632 -6.811 .000 -.149 -.079 * MAS diversity was measured as the absolute distance from an optimum of diversity score of 6. An adjusted R-squared value of 0.671 was obtained, i.e. the model explained 67.1% of the variance in this sample of the RAE2008 Physics & Astronomy results.
Table 5-3: University RAE2008 (physics & astronomy) – final regression model (with two independent variables)
The results of the statistical analysis indicated that the two main contributors to Physics &
Astronomy unit performance, as measured by their RAE2008 scores, were the masculinity
(MAS) and MAS diversity scores; together, they explained 67.1% of the variance in research
department performance; both were negatively correlated with RAE2008 score.
Based on data from Table 5-3, the relative effects of each cultural/ cultural diversity
dimension (in the final model) on university RAE2008 physics & astronomy performance are
summarised in Table 5-4.
Cultural dimension Unstandardised coefficients
Relative contributions of cultural dimensions
MAS score -.142 -1.000 MAS diversity score -.114 -0.803
Table 5-4: Relative contributions of cultural dimensions to university RAE2008 (P&A)
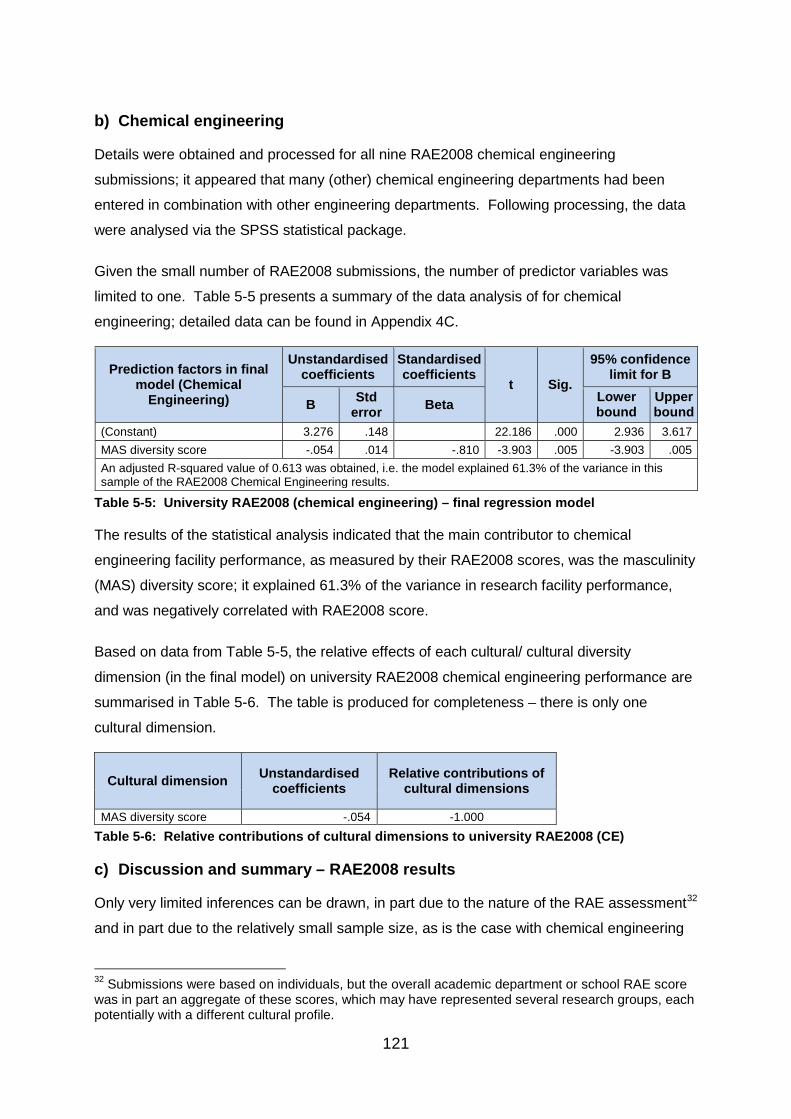
121
b) Chemical engineering
Details were obtained and processed for all nine RAE2008 chemical engineering
submissions; it appeared that many (other) chemical engineering departments had been
entered in combination with other engineering departments. Following processing, the data
were analysed via the SPSS statistical package.
Given the small number of RAE2008 submissions, the number of predictor variables was
limited to one. Table 5-5 presents a summary of the data analysis of for chemical
engineering; detailed data can be found in Appendix 4C.
Prediction factors in final model (Chemical
Engineering)
Unstandardised coefficients
Standardised coefficients
t Sig.
95% confidence limit for B
B Std error Beta Lower
bound Upper bound
(Constant) 3.276 .148 22.186 .000 2.936 3.617 MAS diversity score -.054 .014 -.810 -3.903 .005 -3.903 .005 An adjusted R-squared value of 0.613 was obtained, i.e. the model explained 61.3% of the variance in this sample of the RAE2008 Chemical Engineering results.
Table 5-5: University RAE2008 (chemical engineering) – final regression model
The results of the statistical analysis indicated that the main contributor to chemical
engineering facility performance, as measured by their RAE2008 scores, was the masculinity
(MAS) diversity score; it explained 61.3% of the variance in research facility performance,
and was negatively correlated with RAE2008 score.
Based on data from Table 5-5, the relative effects of each cultural/ cultural diversity
dimension (in the final model) on university RAE2008 chemical engineering performance are
summarised in Table 5-6. The table is produced for completeness – there is only one
cultural dimension.
Cultural dimension Unstandardised coefficients
Relative contributions of cultural dimensions
MAS diversity score -.054 -1.000 Table 5-6: Relative contributions of cultural dimensions to university RAE2008 (CE)
c) Discussion and summary – RAE2008 results
Only very limited inferences can be drawn, in part due to the nature of the RAE assessment32
and in part due to the relatively small sample size, as is the case with chemical engineering
32 Submissions were based on individuals, but the overall academic department or school RAE score was in part an aggregate of these scores, which may have represented several research groups, each potentially with a different cultural profile.
122
The main topic of interest in the RAE2008 results related to cultural diversity. Almost all the
measures of cultural diversity that the author of this thesis had previously found in the
literature represented ‘total’ or ‘combined’ diversity measures. However, diversity along
different cultural dimensions could have produced opposite effects on performance; this may
explain why there was little consistency in the academic literature on diversity. However, the
above RAE2008 results suggested that MAS diversity could be a significant negative
contributor to research performance, but that other forms of diversity were not. When a
combined measure of diversity was substituted, its contribution was insignificant.
The sizes of the samples limited the number of independent variables that could justifiably be
retained in the final model, and therefore limited the inferences that could be drawn from
them. MAS, in one model, and MAS diversity in the both models appeared to have a
significant role (mainly negative) to play in performance as measured by the RAE2008 grade
scores. This was perhaps logical if we consider what could happen in discussions and
meetings; without formal controls or strong leadership, consensus-seeking low-MAS
researchers could be dominated by over-competitive high-MAS researchers.
It is also worth commenting that there appeared to be significant group size effects in both
models. Three size-related variables were tested in the early models, but √(group size) was
found to contribute the most to the regression model. It was logical that increased group size
would tend to broaden experience and enable members to increase their individual
knowledge and skills; however, as group sizes increased, groups would tend to become
more bureaucratic, thus reducing the positive ‘group effect’. The group size variables were
removed from both of the final regression models as part of the ‘independent variable cull’.
Turning to a different issue, academic research appeared to be ‘tagged’ onto one end of the’
innovation-improvement spectrum’ in the literature, yet the author found no evidence in that
literature to support such a continuum. As stated in Subsection 3.3.1(a)(x), three potentially
independent activities or processes could be identified – searching for truth (much of
academic blue-skies research), creativity/lateral thinking/invention, and adaptation to needs/-
markets; these or similar groupings could form the basis of a three (or more) dimension
framework, as illustrated in Figure 3-3.
5.3.4 Sports teams
The author carried out a study of the 2010-2011 English Premier Football League season,
during which twenty teams played a total of 380 matches. Talent scores were obtained for
all Premiership players based on the Castrol EDGE Rankings (Castrol, 2011), and were
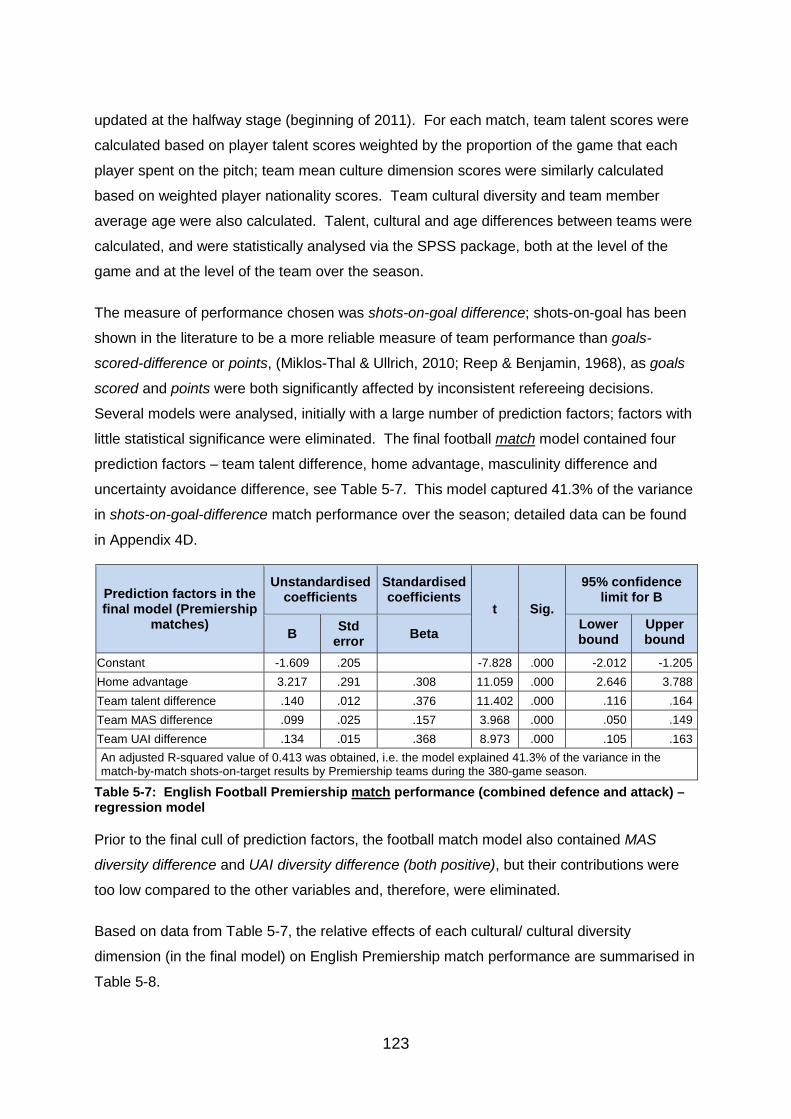
123
updated at the halfway stage (beginning of 2011). For each match, team talent scores were
calculated based on player talent scores weighted by the proportion of the game that each
player spent on the pitch; team mean culture dimension scores were similarly calculated
based on weighted player nationality scores. Team cultural diversity and team member
average age were also calculated. Talent, cultural and age differences between teams were
calculated, and were statistically analysed via the SPSS package, both at the level of the
game and at the level of the team over the season.
The measure of performance chosen was shots-on-goal difference; shots-on-goal has been
shown in the literature to be a more reliable measure of team performance than goals-
scored-difference or points, (Miklos-Thal & Ullrich, 2010; Reep & Benjamin, 1968), as goals
scored and points were both significantly affected by inconsistent refereeing decisions.
Several models were analysed, initially with a large number of prediction factors; factors with
little statistical significance were eliminated. The final football match model contained four
prediction factors – team talent difference, home advantage, masculinity difference and
uncertainty avoidance difference, see Table 5-7. This model captured 41.3% of the variance
in shots-on-goal-difference match performance over the season; detailed data can be found
in Appendix 4D.
Prediction factors in the final model (Premiership
matches)
Unstandardised coefficients
Standardised coefficients
t Sig.
95% confidence limit for B
B Std error Beta
Lower bound
Upper bound
Constant -1.609 .205 -7.828 .000 -2.012 -1.205 Home advantage 3.217 .291 .308 11.059 .000 2.646 3.788 Team talent difference .140 .012 .376 11.402 .000 .116 .164 Team MAS difference .099 .025 .157 3.968 .000 .050 .149 Team UAI difference .134 .015 .368 8.973 .000 .105 .163 An adjusted R-squared value of 0.413 was obtained, i.e. the model explained 41.3% of the variance in the match-by-match shots-on-target results by Premiership teams during the 380-game season.
Table 5-7: English Football Premiership match performance (combined defence and attack) – regression model
Prior to the final cull of prediction factors, the football match model also contained MAS
diversity difference and UAI diversity difference (both positive), but their contributions were
too low compared to the other variables and, therefore, were eliminated.
Based on data from Table 5-7, the relative effects of each cultural/ cultural diversity
dimension (in the final model) on English Premiership match performance are summarised in
Table 5-8.
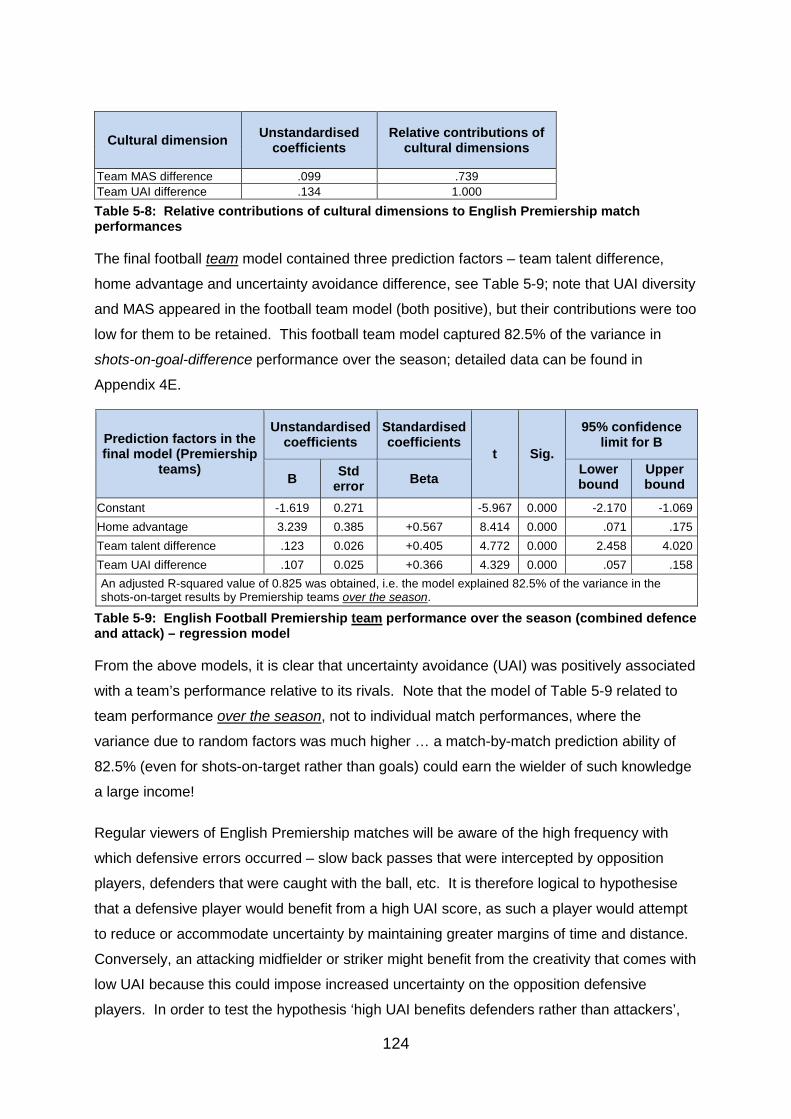
124
Cultural dimension Unstandardised coefficients
Relative contributions of cultural dimensions
Team MAS difference .099 .739 Team UAI difference .134 1.000 Table 5-8: Relative contributions of cultural dimensions to English Premiership match performances
The final football team model contained three prediction factors – team talent difference,
home advantage and uncertainty avoidance difference, see Table 5-9; note that UAI diversity
and MAS appeared in the football team model (both positive), but their contributions were too
low for them to be retained. This football team model captured 82.5% of the variance in
shots-on-goal-difference performance over the season; detailed data can be found in
Appendix 4E.
Prediction factors in the final model (Premiership
teams)
Unstandardised coefficients
Standardised coefficients
t Sig.
95% confidence limit for B
B Std error Beta
Lower bound
Upper bound
Constant -1.619 0.271 -5.967 0.000 -2.170 -1.069 Home advantage 3.239 0.385 +0.567 8.414 0.000 .071 .175 Team talent difference .123 0.026 +0.405 4.772 0.000 2.458 4.020 Team UAI difference .107 0.025 +0.366 4.329 0.000 .057 .158 An adjusted R-squared value of 0.825 was obtained, i.e. the model explained 82.5% of the variance in the shots-on-target results by Premiership teams over the season.
Table 5-9: English Football Premiership team performance over the season (combined defence and attack) – regression model
From the above models, it is clear that uncertainty avoidance (UAI) was positively associated
with a team’s performance relative to its rivals. Note that the model of Table 5-9 related to
team performance over the season, not to individual match performances, where the
variance due to random factors was much higher … a match-by-match prediction ability of
82.5% (even for shots-on-target rather than goals) could earn the wielder of such knowledge
a large income!
Regular viewers of English Premiership matches will be aware of the high frequency with
which defensive errors occurred – slow back passes that were intercepted by opposition
players, defenders that were caught with the ball, etc. It is therefore logical to hypothesise
that a defensive player would benefit from a high UAI score, as such a player would attempt
to reduce or accommodate uncertainty by maintaining greater margins of time and distance.
Conversely, an attacking midfielder or striker might benefit from the creativity that comes with
low UAI because this could impose increased uncertainty on the opposition defensive
players. In order to test the hypothesis ‘high UAI benefits defenders rather than attackers’,
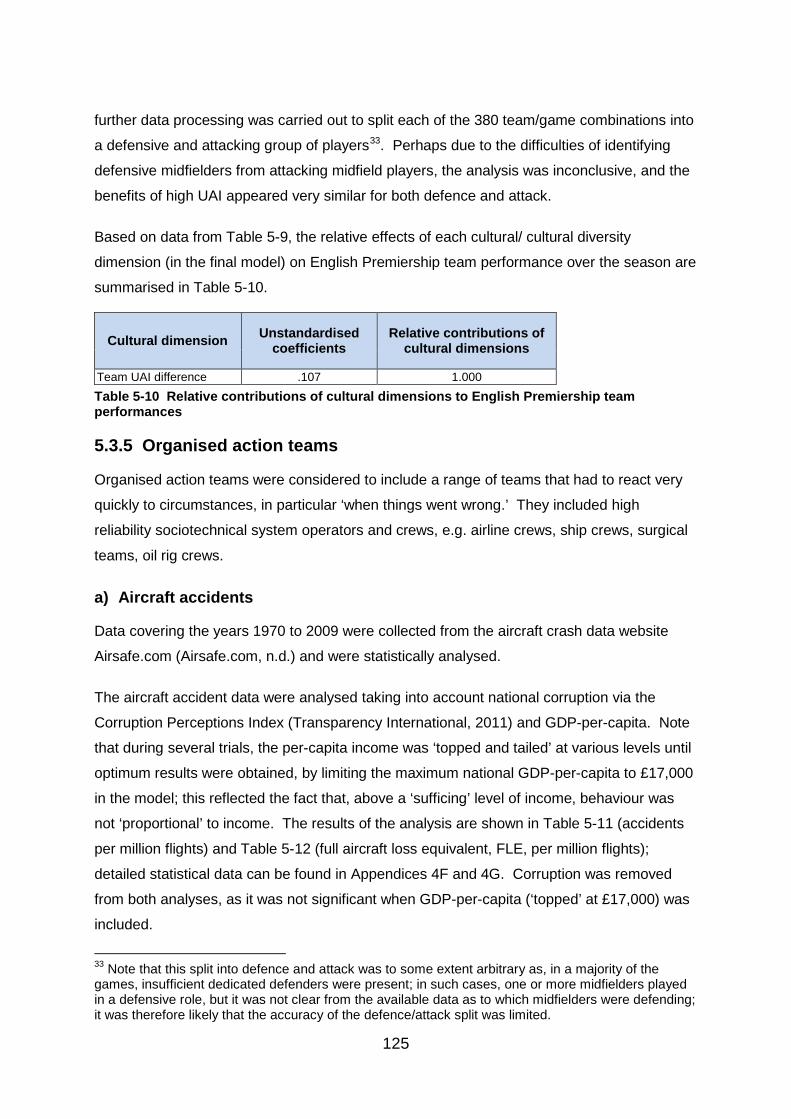
125
further data processing was carried out to split each of the 380 team/game combinations into
a defensive and attacking group of players33. Perhaps due to the difficulties of identifying
defensive midfielders from attacking midfield players, the analysis was inconclusive, and the
benefits of high UAI appeared very similar for both defence and attack.
Based on data from Table 5-9, the relative effects of each cultural/ cultural diversity
dimension (in the final model) on English Premiership team performance over the season are
summarised in Table 5-10.
Cultural dimension Unstandardised coefficients
Relative contributions of cultural dimensions
Team UAI difference .107 1.000 Table 5-10 Relative contributions of cultural dimensions to English Premiership team performances
5.3.5 Organised action teams
Organised action teams were considered to include a range of teams that had to react very
quickly to circumstances, in particular ‘when things went wrong.’ They included high
reliability sociotechnical system operators and crews, e.g. airline crews, ship crews, surgical
teams, oil rig crews.
a) Aircraft accidents
Data covering the years 1970 to 2009 were collected from the aircraft crash data website
Airsafe.com (Airsafe.com, n.d.) and were statistically analysed.
The aircraft accident data were analysed taking into account national corruption via the
Corruption Perceptions Index (Transparency International, 2011) and GDP-per-capita. Note
that during several trials, the per-capita income was ‘topped and tailed’ at various levels until
optimum results were obtained, by limiting the maximum national GDP-per-capita to £17,000
in the model; this reflected the fact that, above a ‘sufficing’ level of income, behaviour was
not ‘proportional’ to income. The results of the analysis are shown in Table 5-11 (accidents
per million flights) and Table 5-12 (full aircraft loss equivalent, FLE, per million flights);
detailed statistical data can be found in Appendices 4F and 4G. Corruption was removed
from both analyses, as it was not significant when GDP-per-capita (‘topped’ at £17,000) was
included.
33 Note that this split into defence and attack was to some extent arbitrary as, in a majority of the games, insufficient dedicated defenders were present; in such cases, one or more midfielders played in a defensive role, but it was not clear from the available data as to which midfielders were defending; it was therefore likely that the accuracy of the defence/attack split was limited.
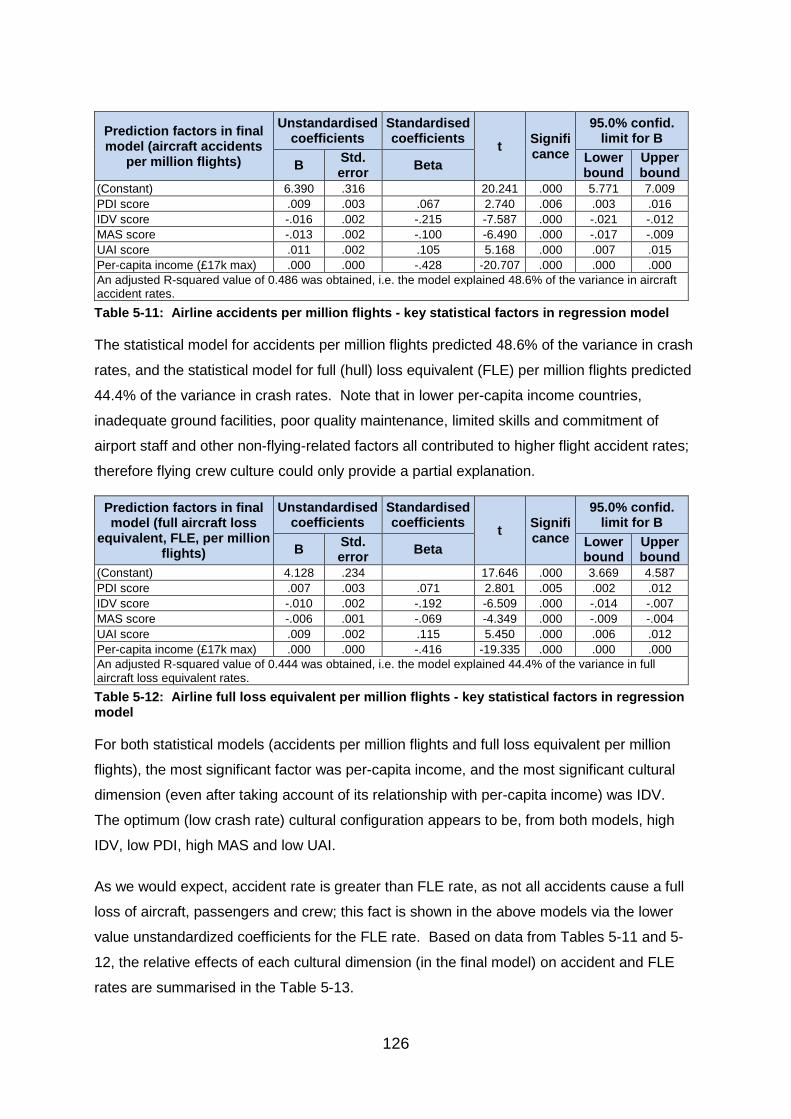
126
Prediction factors in final model (aircraft accidents
per million flights)
Unstandardised coefficients
Standardised coefficients t Signifi
cance
95.0% confid. limit for B
B Std. error Beta Lower
bound Upper bound
(Constant) 6.390 .316 20.241 .000 5.771 7.009 PDI score .009 .003 .067 2.740 .006 .003 .016 IDV score -.016 .002 -.215 -7.587 .000 -.021 -.012 MAS score -.013 .002 -.100 -6.490 .000 -.017 -.009 UAI score .011 .002 .105 5.168 .000 .007 .015 Per-capita income (£17k max) .000 .000 -.428 -20.707 .000 .000 .000 An adjusted R-squared value of 0.486 was obtained, i.e. the model explained 48.6% of the variance in aircraft accident rates. Table 5-11: Airline accidents per million flights - key statistical factors in regression model
The statistical model for accidents per million flights predicted 48.6% of the variance in crash
rates, and the statistical model for full (hull) loss equivalent (FLE) per million flights predicted
44.4% of the variance in crash rates. Note that in lower per-capita income countries,
inadequate ground facilities, poor quality maintenance, limited skills and commitment of
airport staff and other non-flying-related factors all contributed to higher flight accident rates;
therefore flying crew culture could only provide a partial explanation.
Prediction factors in final model (full aircraft loss
equivalent, FLE, per million flights)
Unstandardised coefficients
Standardised coefficients t Signifi
cance
95.0% confid. limit for B
B Std. error Beta Lower
bound Upper bound
(Constant) 4.128 .234 17.646 .000 3.669 4.587 PDI score .007 .003 .071 2.801 .005 .002 .012 IDV score -.010 .002 -.192 -6.509 .000 -.014 -.007 MAS score -.006 .001 -.069 -4.349 .000 -.009 -.004 UAI score .009 .002 .115 5.450 .000 .006 .012 Per-capita income (£17k max) .000 .000 -.416 -19.335 .000 .000 .000 An adjusted R-squared value of 0.444 was obtained, i.e. the model explained 44.4% of the variance in full aircraft loss equivalent rates. Table 5-12: Airline full loss equivalent per million flights - key statistical factors in regression model
For both statistical models (accidents per million flights and full loss equivalent per million
flights), the most significant factor was per-capita income, and the most significant cultural
dimension (even after taking account of its relationship with per-capita income) was IDV.
The optimum (low crash rate) cultural configuration appears to be, from both models, high
IDV, low PDI, high MAS and low UAI.
As we would expect, accident rate is greater than FLE rate, as not all accidents cause a full
loss of aircraft, passengers and crew; this fact is shown in the above models via the lower
value unstandardized coefficients for the FLE rate. Based on data from Tables 5-11 and 5-
12, the relative effects of each cultural dimension (in the final model) on accident and FLE
rates are summarised in the Table 5-13.
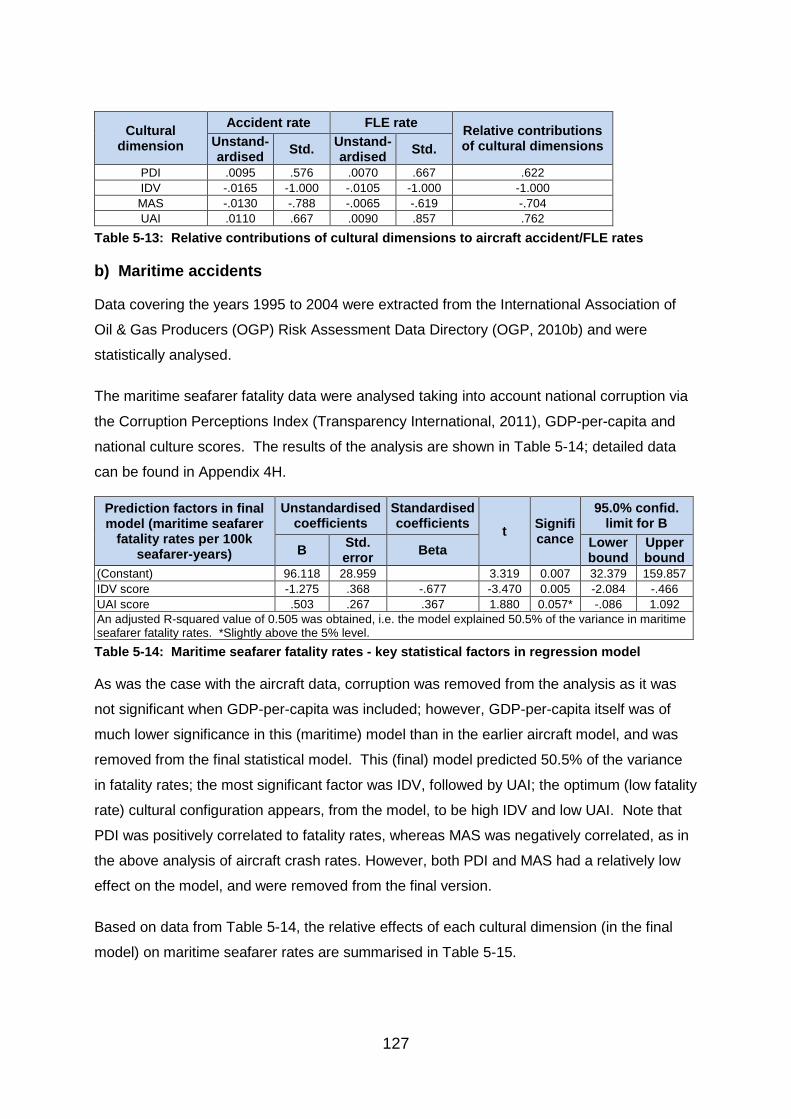
127
Cultural dimension
Accident rate FLE rate Relative contributions of cultural dimensions Unstand-
ardised Std. Unstand-ardised Std.
PDI .0095 .576 .0070 .667 .622 IDV -.0165 -1.000 -.0105 -1.000 -1.000 MAS -.0130 -.788 -.0065 -.619 -.704 UAI .0110 .667 .0090 .857 .762
Table 5-13: Relative contributions of cultural dimensions to aircraft accident/FLE rates
b) Maritime accidents
Data covering the years 1995 to 2004 were extracted from the International Association of
Oil & Gas Producers (OGP) Risk Assessment Data Directory (OGP, 2010b) and were
statistically analysed.
The maritime seafarer fatality data were analysed taking into account national corruption via
the Corruption Perceptions Index (Transparency International, 2011), GDP-per-capita and
national culture scores. The results of the analysis are shown in Table 5-14; detailed data
can be found in Appendix 4H.
Prediction factors in final model (maritime seafarer
fatality rates per 100k seafarer-years)
Unstandardised coefficients
Standardised coefficients t Signifi
cance
95.0% confid. limit for B
B Std. error Beta Lower
bound Upper bound
(Constant) 96.118 28.959 3.319 0.007 32.379 159.857 IDV score -1.275 .368 -.677 -3.470 0.005 -2.084 -.466 UAI score .503 .267 .367 1.880 0.057* -.086 1.092 An adjusted R-squared value of 0.505 was obtained, i.e. the model explained 50.5% of the variance in maritime seafarer fatality rates. *Slightly above the 5% level. Table 5-14: Maritime seafarer fatality rates - key statistical factors in regression model
As was the case with the aircraft data, corruption was removed from the analysis as it was
not significant when GDP-per-capita was included; however, GDP-per-capita itself was of
much lower significance in this (maritime) model than in the earlier aircraft model, and was
removed from the final statistical model. This (final) model predicted 50.5% of the variance
in fatality rates; the most significant factor was IDV, followed by UAI; the optimum (low fatality
rate) cultural configuration appears, from the model, to be high IDV and low UAI. Note that
PDI was positively correlated to fatality rates, whereas MAS was negatively correlated, as in
the above analysis of aircraft crash rates. However, both PDI and MAS had a relatively low
effect on the model, and were removed from the final version.
Based on data from Table 5-14, the relative effects of each cultural dimension (in the final
model) on maritime seafarer rates are summarised in Table 5-15.
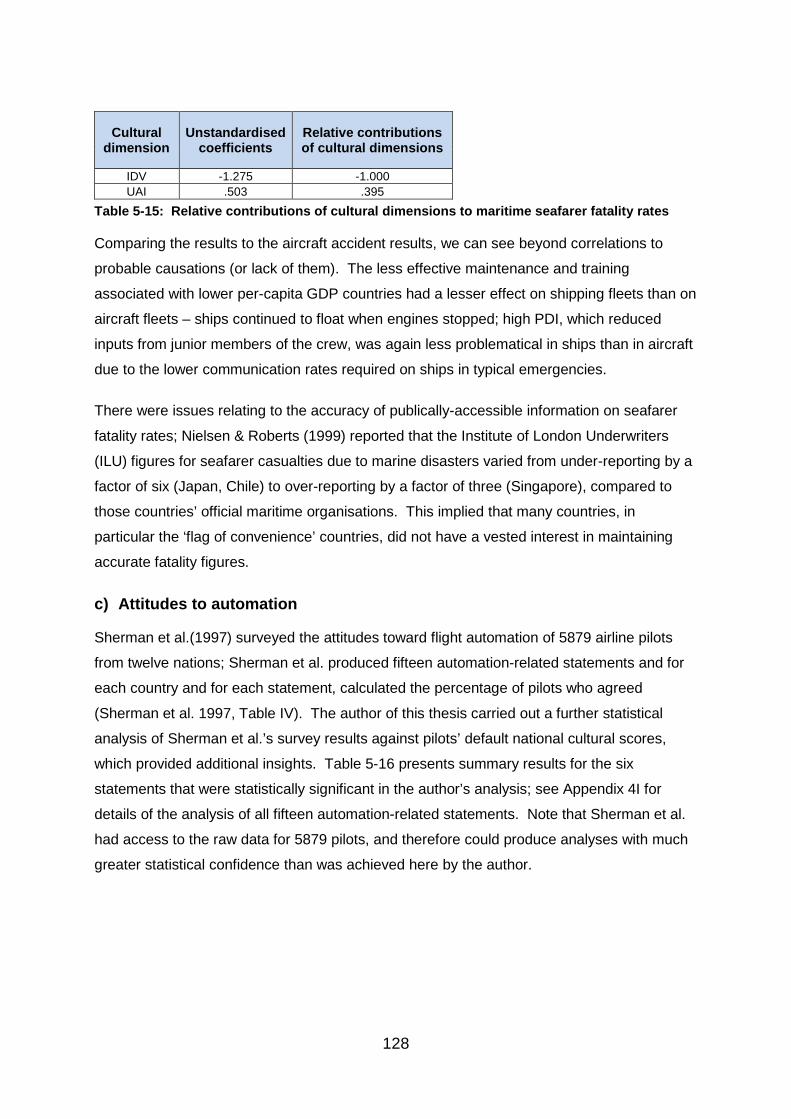
128
Cultural dimension
Unstandardised coefficients
Relative contributions of cultural dimensions
IDV -1.275 -1.000 UAI .503 .395
Table 5-15: Relative contributions of cultural dimensions to maritime seafarer fatality rates
Comparing the results to the aircraft accident results, we can see beyond correlations to
probable causations (or lack of them). The less effective maintenance and training
associated with lower per-capita GDP countries had a lesser effect on shipping fleets than on
aircraft fleets – ships continued to float when engines stopped; high PDI, which reduced
inputs from junior members of the crew, was again less problematical in ships than in aircraft
due to the lower communication rates required on ships in typical emergencies.
There were issues relating to the accuracy of publically-accessible information on seafarer
fatality rates; Nielsen & Roberts (1999) reported that the Institute of London Underwriters
(ILU) figures for seafarer casualties due to marine disasters varied from under-reporting by a
factor of six (Japan, Chile) to over-reporting by a factor of three (Singapore), compared to
those countries’ official maritime organisations. This implied that many countries, in
particular the ‘flag of convenience’ countries, did not have a vested interest in maintaining
accurate fatality figures.
c) Attitudes to automation
Sherman et al.(1997) surveyed the attitudes toward flight automation of 5879 airline pilots
from twelve nations; Sherman et al. produced fifteen automation-related statements and for
each country and for each statement, calculated the percentage of pilots who agreed
(Sherman et al. 1997, Table IV). The author of this thesis carried out a further statistical
analysis of Sherman et al.’s survey results against pilots’ default national cultural scores,
which provided additional insights. Table 5-16 presents summary results for the six
statements that were statistically significant in the author’s analysis; see Appendix 4I for
details of the analysis of all fifteen automation-related statements. Note that Sherman et al.
had access to the raw data for 5879 pilots, and therefore could produce analyses with much
greater statistical confidence than was achieved here by the author.
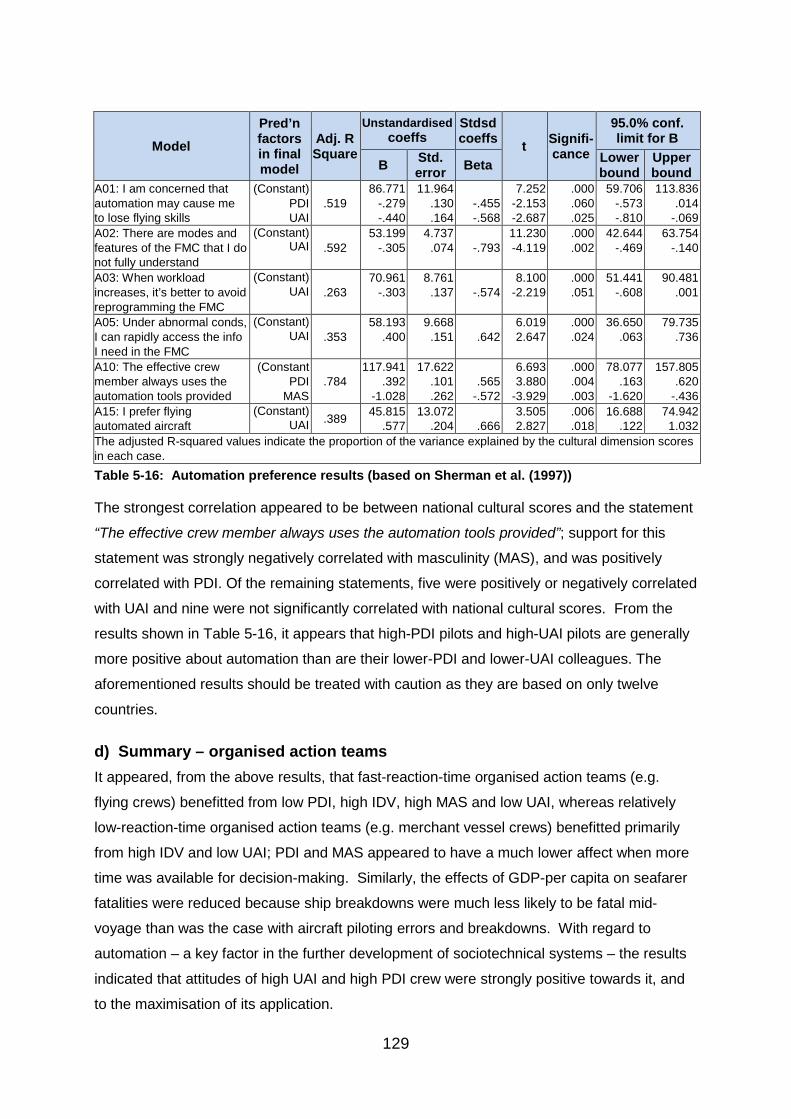
129
Model Pred’n factors in final model
Adj. R Square
Unstandardised coeffs
Stdsd coeffs t Signifi-
cance
95.0% conf. limit for B
B Std. error Beta Lower
bound Upper bound
A01: I am concerned that automation may cause me to lose flying skills
(Constant) PDI UAI
.519 86.771
-.279 -.440
11.964 .130 .164
-.455 -.568
7.252 -2.153 -2.687
.000
.060
.025
59.706 -.573 -.810
113.836 .014
-.069 A02: There are modes and features of the FMC that I do not fully understand
(Constant) UAI .592
53.199 -.305
4.737 .074
-.793
11.230 -4.119
.000
.002 42.644
-.469 63.754
-.140
A03: When workload increases, it’s better to avoid reprogramming the FMC
(Constant) UAI .263
70.961 -.303
8.761 .137
-.574
8.100 -2.219
.000
.051 51.441
-.608 90.481
.001
A05: Under abnormal conds, I can rapidly access the info I need in the FMC
(Constant) UAI .353
58.193 .400
9.668 .151
.642
6.019 2.647
.000
.024 36.650
.063 79.735
.736
A10: The effective crew member always uses the automation tools provided
(Constant PDI
MAS .784
117.941 .392
-1.028
17.622 .101 .262
.565
-.572
6.693 3.880
-3.929
.000
.004
.003
78.077 .163
-1.620
157.805 .620
-.436 A15: I prefer flying automated aircraft
(Constant) UAI .389 45.815
.577 13.072
.204
.666 3.505 2.827
.006
.018 16.688
.122 74.942 1.032
The adjusted R-squared values indicate the proportion of the variance explained by the cultural dimension scores in each case. Table 5-16: Automation preference results (based on Sherman et al. (1997))
The strongest correlation appeared to be between national cultural scores and the statement
“The effective crew member always uses the automation tools provided”; support for this
statement was strongly negatively correlated with masculinity (MAS), and was positively
correlated with PDI. Of the remaining statements, five were positively or negatively correlated
with UAI and nine were not significantly correlated with national cultural scores. From the
results shown in Table 5-16, it appears that high-PDI pilots and high-UAI pilots are generally
more positive about automation than are their lower-PDI and lower-UAI colleagues. The
aforementioned results should be treated with caution as they are based on only twelve
countries.
d) Summary – organised action teams It appeared, from the above results, that fast-reaction-time organised action teams (e.g.
flying crews) benefitted from low PDI, high IDV, high MAS and low UAI, whereas relatively
low-reaction-time organised action teams (e.g. merchant vessel crews) benefitted primarily
from high IDV and low UAI; PDI and MAS appeared to have a much lower affect when more
time was available for decision-making. Similarly, the effects of GDP-per capita on seafarer
fatalities were reduced because ship breakdowns were much less likely to be fatal mid-
voyage than was the case with aircraft piloting errors and breakdowns. With regard to
automation – a key factor in the further development of sociotechnical systems – the results
indicated that attitudes of high UAI and high PDI crew were strongly positive towards it, and
to the maximisation of its application.
130
5.4 Answers to the earlier research questions
Three research questions relating to masculinity, uncertainty avoidance and cultural diversity
were posed in Sub-section 4.6.1; these are considered further in this section.
5.4.1 The effects of masculinity (MAS) on team performance
a) Analysis of the literature on MAS
The evidence from the literature review (see Subsection 3.3) about the effects of MAS on
team performance was generally inconsistent and, in most cases where found, had a small
affect compared to other cultural dimensions.
Creativity and innovation: Low-level innovation projects appeared to benefit from high
team MAS scores, whereas medium-level innovation projects appeared to benefit from
low/medium team MAS scores; no consensus appeared for high level innovation or
academic research and development. In the case of very large projects, in particular those
with complex social or political issues, it appeared from qualitative analyses that high team
member masculinity scores would tend to contribute to project failure.
b) The author’s studies on MAS
Creativity and innovation: High academic research team MAS scores were associated
with reduced performance (as measured by the UK Research Assessment Exercise).
However, as commented in Subsection 5.3.3, the way that the original RAE data had been
collected (at the department or school level) meant that that the effects of culture on
individual teams within departments were somewhat masked; also, the sample sizes (in
terms of number of schools/departments) were small.
Sociotechnical system operators or crews: High operator or crew MAS scores were
associated with reduced sociotechnical accident rates, but MAS was significantly less
influential than individualism (an accident-reducing factor) and uncertainty avoidance (an
accident-increasing factor). However, in the case of attitudes towards automation, high-MAS
aircraft crews were strongly opposed to the use of automation at all times.
c) Summary of findings about masculinity (MAS)
There was general agreement in the literature that a high MAS score was beneficial in
project team activities requiring low creativity, e.g. minor product or process improvement,
but elsewhere, the evidence was inconsistent. A high team MAS score appeared
disadvantageous in some situations where time was not a critical factor, e.g. in multicultural
131
research teams, perhaps because it discouraged some lower-MAS team members from
contributing fully; note that low MAS scores could have had a similar effect, but for reasons
associated with group-think. However, where rapid decisions had to be made, for example in
organised action teams, high MAS scores appeared to be associated with benefits –
probably in terms of quicker responses to deteriorating situations.
The relationship between MAS and creativity/inventiveness did not appear to be a simple
linear one.
5.4.2 The effects of uncertainty avoidance (UAI) on team performance
a) Analysis of the literature on UAI
Creativity and innovation: A detailed analysis of reports in the research literature (see
Subsection 3.3.1) indicated that a low team UAI score was beneficial to high-level innovation
projects, and that a high UAI score was beneficial to low-level innovation projects. Note that
UAI did not appear to have a significant effect on academic research, as measured by the
UK’s RAE2008 scores (see Subsection 5.3.3); this raised a question as to assumptions
about the relationships between fundamental research and creativity, inventiveness and
innovation.
Sociotechnical system operators or crews: A high crew UAI score was associated with
reduced effectiveness of training, and also contributed to increased accident rates in high-
reliability sociotechnical systems.
b) The author’s studies on UAI
Student project groups: Student group project performances were negatively affected by
high student group UAI scores.
Team sports: UAI was found to have a significant effect on the performance of professional
footballers in the English Premiership; high team UAI scores were associated with improved
shots-on-target-difference performance. Football is a game with simple rules and highly
constrained and predictable scenarios; in such an environment, the emphasis (at least for
defenders) should be on the avoidance of mistakes. This emphasis on predictability and
avoidance of mistakes is paralleled in maintenance organisations, in particular those that are
responsible for sociotechnical systems.
Sociotechnical system operators or crews: High crew UAI was found to have a negative
effect on sociotechnical system safety; it appeared to have an influence between half and
132
two-thirds that of individualism (IDV). High crew UAI scores were also associated with
positive attitudes toward automation, its usage and its capabilities – potentially leading to
overconfidence and complacency.
c) Summary of findings about UAI
A high UAI score appeared to be beneficial wherever the emphasis was on following the
rules and not taking excessive apparent risks – e.g. in repetitive or low-innovation work, in
maintenance and in team games. However, where there was a need to ‘reframe’, to
reassess quickly, a high UAI score appeared to be disadvantageous; high UAI scores also
reduced the effectiveness of training. A high UAI score was also associated with very
positive views of automation and its capabilities.
5.4.3 The effects of cultural diversity on team performance
a) Analysis of the literature on cultural diversity
The original literature review (see Section 3.3) revealed a paucity of consistent results in the
research literature. This was considered to be due, in part, to the utilisation of inadequate
measures of cultural diversity.
Student groups: Studies indicated cultural diversity to be a negative contributor to
performance, or to be represented by a ‘U-shaped’ or ‘inverted-U-shaped’ distribution,
depending on exactly what aspect of performance was measured.
Innovation and creativity: Academic research appeared to benefit from 20-25% non-
indigenous researchers or, alternatively, ‘low’ diversity.
Sports teams: Studies of the German Bundesliga performance indicated that team cultural
diversity was either associated with reduced performance, or had no effect on performance;
note that the German high UAI nationality score is likely to have a negative effect on the
effectiveness of integrating other-culture players within teams34. A study of cultural diversity
in USA professional hockey teams revealed a ‘U-shaped’ relationship to team performance;
low- and high-diversity teams outperformed medium-diversity teams.
b) The author’s studies on cultural diversity
In each of the author’s studies, the statistical analyses included separate evaluations of
models that initially included the four individual cultural diversities (of PDI, IDV, MAS and 34 High uncertainty avoidance is associated with suspiciousness of foreigners (Hofstede et al. 2010, Ch. 6)
133
UAI) and of models that initially included, instead, the mean cultural diversity (the average
value of the four individual diversities). In no case was this mean cultural diversity found to
be significant.
Student groups: Diversity in uncertainty avoidance (UAI diversity) appeared to have a
significant and positive effect on student group performance.
Innovation and creativity: Diversity in masculinity (MAS diversity) appeared to have a
negative effect on academic research team performance (but see earlier-stated caveats).
This would be logical in the sense that high-MAS researchers might tend to dominate
discussions and meetings, thus discouraging low-MAS researchers from contributing their
ideas.
Team sports: MAS diversity and UAI diversity were found to have a small effect on English
Premiership team performance over the season, but were removed from the final statistical
analysis.
c) Summary of findings about cultural diversity
Mean cultural diversity, taken across all cultural dimensions, appeared to have no net effect.
However, diversity in individual cultural dimensions was found to play a part in the
performance levels of student groups, academic research teams and, to a lesser extent,
sports teams (football). This implies that one should consider diversity along each cultural
dimension independently.
Note that measures of diversity such as Shannon’s index or Blau’s index were, as previously
stated, fundamentally flawed when applied to multicultural teams.
5.5 Establishment of quantitative culture-performance relationships from the data
As stated earlier, the literature on culture/performance relationships, including the
quantitative studies, was unclear and frequently contradictory; the author’s studies supported
some studies in the literature, contradicted others and suggested further relationships.
Taking all this into consideration, the author, therefore, had to make ‘best estimates’ of
culture-performance relationships in various team situations. These, in turn, formed the
basis for the culture/performance associations incorporated in the methodologies and tools
described in later chapters.
134
5.5.1 Optimum ‘high’ and ‘low’ culture dimension scores
Neither the studies identified in the literature review, nor the author’s own studies, provided
absolute values in terms of optimum quantitative culture scores for particular missions/tasks;
much of the literature, e.g. G. K. Jones & Davis (2000), merely associated general culture
dimension scores (e.g. ‘high PDI’) with particular scenarios (e.g. ‘low creativity teamwork’).
In other cases (as in the author’s studies), a cultural dimension ‘slope’ was obtained. This
would enable the identification of a positive or negative relationship between a cultural
dimension and a performance factor (e.g. that uncertainty avoidance (UAI) had a negative
relationship with creativity); it would also enable the determination of the relative importance
of each cultural dimension to the particular mission (e.g. MAS contributed 23% as much as
IDV in the statistical analysis); see Table 5-20 for a summary of the relative effect strengths
of the cultural dimensions for each of the author’s studies. However, in order for a culture-
based performance prediction tool to be effective, it would be necessary to associate specific
situations/missions/tasks with specific quantitative optimum culture scores, in order to
produce some measure of sub-optimality for any proposed or actual team. For example,
what are the optimum PDI, IDV, MAS and UAI scores for a team operating a large ocean-
going ship? In order to develop the above culture score/mission relationships it was
necessary to make several assumptions and approximations. These are discussed below
and in the following subsections.
First of all, a brief examination of the literature: Harzing (1999) stated that, where theory was
stated in ordinal terms (e.g. low/high, as above), a simple theoretical approach could be
used, e.g. assigning ‘low’ a zero score, and ‘high’ a one hundred score; alternatively,
empirical ‘ideal profiles’ could be generated, e.g. by using the mean scores generated from
calibration samples, for example the mean scores of high performance organisations, as
exemplified by Gresov (1989) and Venkatraman & Prescott (1990); deviations from such
profiles could be calculated to produce ‘misfit’ scores. In the case of the author’s work, there
are two complicating factors; these are described further below:
1. Hofstede’s cultural framework: Hofstede’s original cultural scores (based on the
data from IBM subsidiaries) were weighted to form a range between zero and one
hundred. However, later additions (e.g. Malaysia (PDI), Slovakia (MAS) and Greece
(UAI)) extended the range of cultural scores beyond one hundred. In addition, the
work described in this thesis has utilised Bosland’s educational corrections, which
have also extended the range beyond one hundred (e.g. the Anglo countries (IDV))
and below zero (e.g. Sweden (MAS)). This complicates the issue of where to position
135
‘low’ scores and ‘high’ scores for each dimension. See Tables 5-17 and 5-18 for
examples of these range changes.
2. The ramifications of extreme culture scores: As is the case with all extremes (e.g.
in political views or personality), there are potential dangers in the assumption that
‘more of a good thing’ (or ‘less of a bad thing’) is better throughout the full range of
potential values. For example, extreme masculinity may lead to extreme intra-team
conflict, and extreme uncertainty avoidance may lead to paralysis in decision-making.
The author therefore examined the countries associated with extreme scores in order to
evaluate their appropriateness, or otherwise. For example, the countries with the highest
uncertainty avoidance scores were Greece (112), Portugal (104), Guatemala (101) and
Uruguay (100); these were not countries that were associated with highly effective low-
innovation capabilities. Japan (92), South Korea (85) and Taiwan (69) were, however,
associated with excellent low-innovation capabilities. They were therefore chosen as the
exemplars to represent optimum low-innovation uncertainty avoidance score; their average
score, corrected for thirteen years full time education equivalence was selected.
The above-described process is not clear-cut, and the author was obliged to make a number
of subjective best estimates as to which countries to discount and whether to take a
maximum (or minimum) or average of a group of countries. Where a particularly high-
performing country was at an extreme end, then the author would choose that country’s
culture score. For example, in the case of low uncertainty avoidance, the high-performing
Nordic group was immediately above Jamaica and Singapore (the lowest-scoring countries).
A decision was taken to choose the Danish score, as Denmark was the highest performing
Nordic country with regard to high originality (e.g. Nobel science awards), and had the lowest
Nordic uncertainty avoidance score; the Nordic average uncertainty-avoidance score would
also have been defensible.
A case of particular difficulty was that of high masculinity, for which Japan had the highest
score (of 95, uncorrected for education). The aggressive competitiveness of Japan’s high
masculinity appeared to be redirected out from the team or group to focus on competition
with other groups and organisations; note that the individualism score for Japan is signifi-
cantly higher than those of two West European countries, Portugal and Greece, so an
explanation based on collectivism does not appear to be satisfactory. It was decided there-
fore to base the high masculinity scores on the average of the Germanic group (including
Austria) which was the highest masculinity scoring group of ‘high performance’ countries.
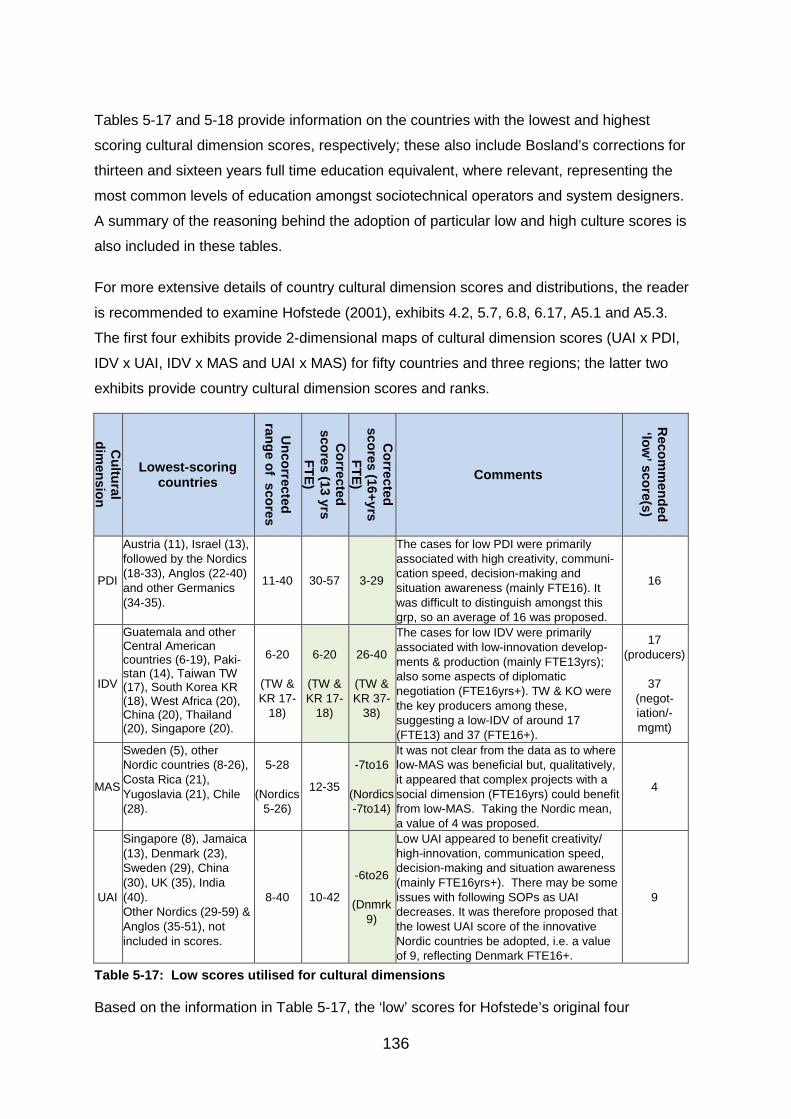
136
Tables 5-17 and 5-18 provide information on the countries with the lowest and highest
scoring cultural dimension scores, respectively; these also include Bosland’s corrections for
thirteen and sixteen years full time education equivalent, where relevant, representing the
most common levels of education amongst sociotechnical operators and system designers.
A summary of the reasoning behind the adoption of particular low and high culture scores is
also included in these tables.
For more extensive details of country cultural dimension scores and distributions, the reader
is recommended to examine Hofstede (2001), exhibits 4.2, 5.7, 6.8, 6.17, A5.1 and A5.3.
The first four exhibits provide 2-dimensional maps of cultural dimension scores (UAI x PDI,
IDV x UAI, IDV x MAS and UAI x MAS) for fifty countries and three regions; the latter two
exhibits provide country cultural dimension scores and ranks.
Cultural
dimension
Lowest-scoring countries
Uncorrected
range of scores
Corrected
scores (13 yrs FTE)
Corrected
scores (16+yrs FTE)
Comments R
ecomm
ended ‘low
’ score(s)
PDI
Austria (11), Israel (13), followed by the Nordics (18-33), Anglos (22-40) and other Germanics (34-35).
11-40 30-57 3-29
The cases for low PDI were primarily associated with high creativity, communi-cation speed, decision-making and situation awareness (mainly FTE16). It was difficult to distinguish amongst this grp, so an average of 16 was proposed.
16
IDV
Guatemala and other Central American countries (6-19), Paki-stan (14), Taiwan TW (17), South Korea KR (18), West Africa (20), China (20), Thailand (20), Singapore (20).
6-20
(TW & KR 17-
18)
6-20
(TW & KR 17-
18)
26-40
(TW & KR 37-
38)
The cases for low IDV were primarily associated with low-innovation develop-ments & production (mainly FTE13yrs); also some aspects of diplomatic negotiation (FTE16yrs+). TW & KO were the key producers among these, suggesting a low-IDV of around 17 (FTE13) and 37 (FTE16+).
17 (producers)
37
(negot-iation/-mgmt)
MAS
Sweden (5), other Nordic countries (8-26), Costa Rica (21), Yugoslavia (21), Chile (28).
5-28
(Nordics 5-26)
12-35
-7to16
(Nordics -7to14)
It was not clear from the data as to where low-MAS was beneficial but, qualitatively, it appeared that complex projects with a social dimension (FTE16yrs) could benefit from low-MAS. Taking the Nordic mean, a value of 4 was proposed.
4
UAI
Singapore (8), Jamaica (13), Denmark (23), Sweden (29), China (30), UK (35), India (40). Other Nordics (29-59) & Anglos (35-51), not included in scores.
8-40 10-42
-6to26
(Dnmrk 9)
Low UAI appeared to benefit creativity/ high-innovation, communication speed, decision-making and situation awareness (mainly FTE16yrs+). There may be some issues with following SOPs as UAI decreases. It was therefore proposed that the lowest UAI score of the innovative Nordic countries be adopted, i.e. a value of 9, reflecting Denmark FTE16+.
9
Table 5-17: Low scores utilised for cultural dimensions
Based on the information in Table 5-17, the ‘low’ scores for Hofstede’s original four
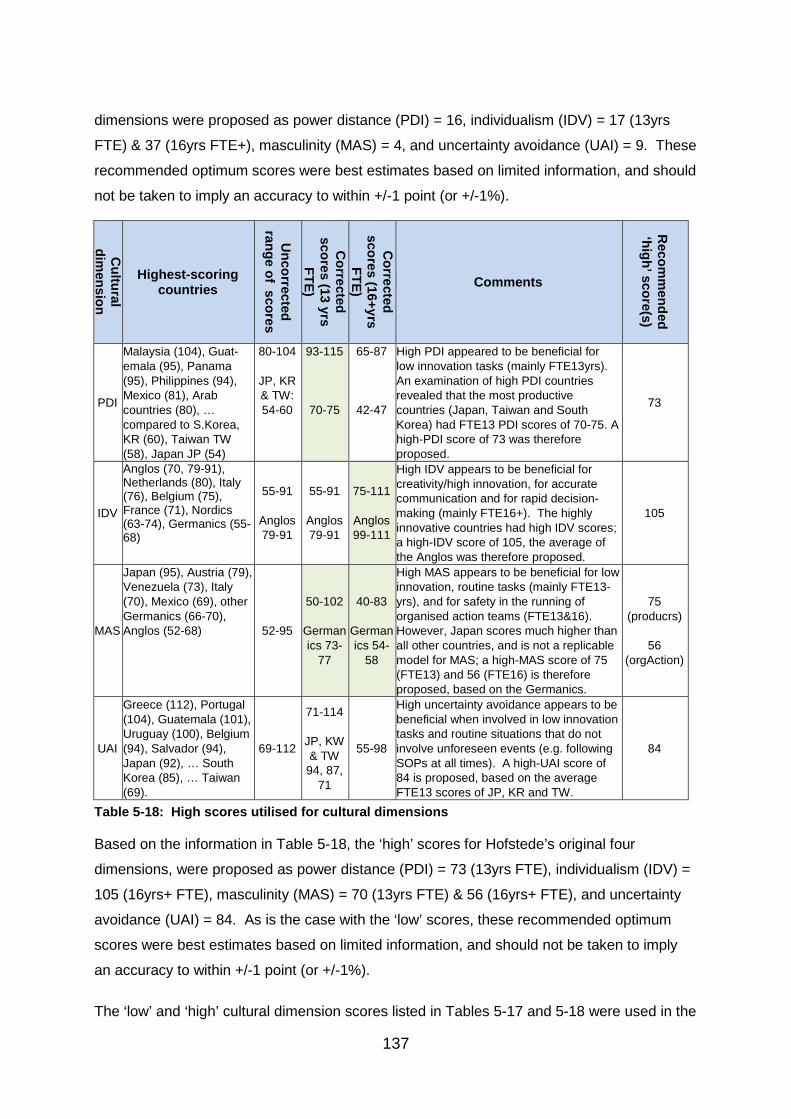
137
dimensions were proposed as power distance (PDI) = 16, individualism (IDV) = 17 (13yrs
FTE) & 37 (16yrs FTE+), masculinity (MAS) = 4, and uncertainty avoidance (UAI) = 9. These
recommended optimum scores were best estimates based on limited information, and should
not be taken to imply an accuracy to within +/-1 point (or +/-1%).
Cultural
dimension
Highest-scoring countries
Uncorrected
range of scores
Corrected
scores (13 yrs FTE)
Corrected
scores (16+yrs FTE)
Comments
R
ecomm
ended ‘high’ score(s)
PDI
Malaysia (104), Guat-emala (95), Panama (95), Philippines (94), Mexico (81), Arab countries (80), … compared to S.Korea, KR (60), Taiwan TW (58), Japan JP (54)
80-104
JP, KR & TW: 54-60
93-115
70-75
65-87
42-47
High PDI appeared to be beneficial for low innovation tasks (mainly FTE13yrs). An examination of high PDI countries revealed that the most productive countries (Japan, Taiwan and South Korea) had FTE13 PDI scores of 70-75. A high-PDI score of 73 was therefore proposed.
73
IDV
Anglos (70, 79-91), Netherlands (80), Italy (76), Belgium (75), France (71), Nordics (63-74), Germanics (55-68)
55-91
Anglos 79-91
55-91
Anglos 79-91
75-111
Anglos 99-111
High IDV appears to be beneficial for creativity/high innovation, for accurate communication and for rapid decision-making (mainly FTE16+). The highly innovative countries had high IDV scores; a high-IDV score of 105, the average of the Anglos was therefore proposed.
105
MAS
Japan (95), Austria (79), Venezuela (73), Italy (70), Mexico (69), other Germanics (66-70), Anglos (52-68) 52-95
50-102
Germanics 73-
77
40-83
Germanics 54-
58
High MAS appears to be beneficial for low innovation, routine tasks (mainly FTE13-yrs), and for safety in the running of organised action teams (FTE13&16). However, Japan scores much higher than all other countries, and is not a replicable model for MAS; a high-MAS score of 75 (FTE13) and 56 (FTE16) is therefore proposed, based on the Germanics.
75 (producrs)
56
(orgAction)
UAI
Greece (112), Portugal (104), Guatemala (101), Uruguay (100), Belgium (94), Salvador (94), Japan (92), … South Korea (85), … Taiwan (69).
69-112
71-114
JP, KW & TW
94, 87, 71
55-98
High uncertainty avoidance appears to be beneficial when involved in low innovation tasks and routine situations that do not involve unforeseen events (e.g. following SOPs at all times). A high-UAI score of 84 is proposed, based on the average FTE13 scores of JP, KR and TW.
84
Table 5-18: High scores utilised for cultural dimensions
Based on the information in Table 5-18, the ‘high’ scores for Hofstede’s original four
dimensions, were proposed as power distance (PDI) = 73 (13yrs FTE), individualism (IDV) =
105 (16yrs+ FTE), masculinity (MAS) = 70 (13yrs FTE) & 56 (16yrs+ FTE), and uncertainty
avoidance (UAI) = 84. As is the case with the ‘low’ scores, these recommended optimum
scores were best estimates based on limited information, and should not be taken to imply
an accuracy to within +/-1 point (or +/-1%).
The ‘low’ and ‘high’ cultural dimension scores listed in Tables 5-17 and 5-18 were used in the
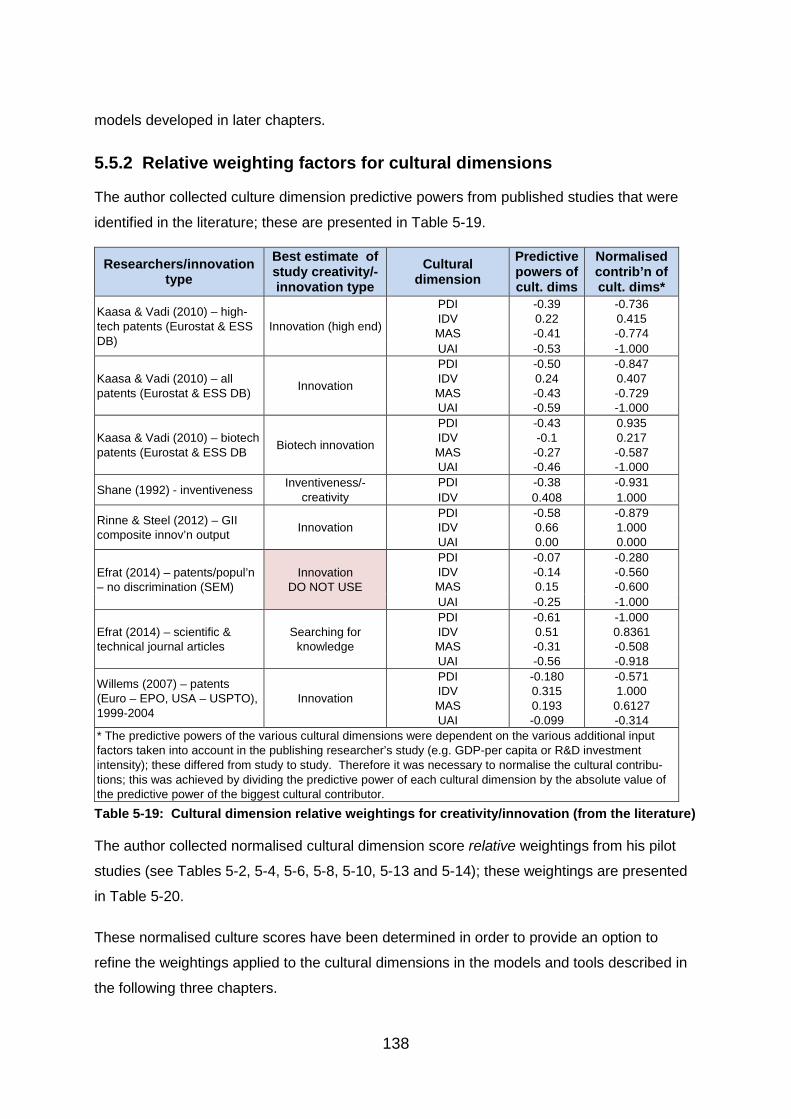
138
models developed in later chapters.
5.5.2 Relative weighting factors for cultural dimensions
The author collected culture dimension predictive powers from published studies that were
identified in the literature; these are presented in Table 5-19.
Researchers/innovation type
Best estimate of study creativity/-innovation type
Cultural dimension
Predictive powers of cult. dims
Normalised contrib’n of cult. dims*
Kaasa & Vadi (2010) – high-tech patents (Eurostat & ESS DB)
Innovation (high end)
PDI IDV MAS
-0.39 0.22 -0.41
-0.736 0.415 -0.774
UAI -0.53 -1.000
Kaasa & Vadi (2010) – all patents (Eurostat & ESS DB) Innovation
PDI IDV MAS UAI
-0.50 0.24 -0.43 -0.59
-0.847 0.407 -0.729 -1.000
Kaasa & Vadi (2010) – biotech patents (Eurostat & ESS DB Biotech innovation
PDI IDV MAS UAI
-0.43 -0.1
-0.27 -0.46
0.935 0.217 -0.587 -1.000
Shane (1992) - inventiveness Inventiveness/-creativity
PDI -0.38 -0.931 IDV 0.408 1.000
Rinne & Steel (2012) – GII composite innov’n output Innovation
PDI IDV UAI
-0.58 0.66 0.00
-0.879 1.000 0.000
Efrat (2014) – patents/popul’n – no discrimination (SEM)
Innovation DO NOT USE
PDI IDV MAS
-0.07 -0.14 0.15
-0.280 -0.560 -0.600
UAI -0.25 -1.000
Efrat (2014) – scientific & technical journal articles
Searching for knowledge
PDI IDV MAS UAI
-0.61 0.51 -0.31 -0.56
-1.000 0.8361 -0.508 -0.918
Willems (2007) – patents (Euro – EPO, USA – USPTO), 1999-2004
Innovation
PDI IDV MAS UAI
-0.180 0.315 0.193 -0.099
-0.571 1.000 0.6127 -0.314
* The predictive powers of the various cultural dimensions were dependent on the various additional input factors taken into account in the publishing researcher’s study (e.g. GDP-per capita or R&D investment intensity); these differed from study to study. Therefore it was necessary to normalise the cultural contribu-tions; this was achieved by dividing the predictive power of each cultural dimension by the absolute value of the predictive power of the biggest cultural contributor. Table 5-19: Cultural dimension relative weightings for creativity/innovation (from the literature)
The author collected normalised cultural dimension score relative weightings from his pilot
studies (see Tables 5-2, 5-4, 5-6, 5-8, 5-10, 5-13 and 5-14); these weightings are presented
in Table 5-20.
These normalised culture scores have been determined in order to provide an option to
refine the weightings applied to the cultural dimensions in the models and tools described in
the following three chapters.
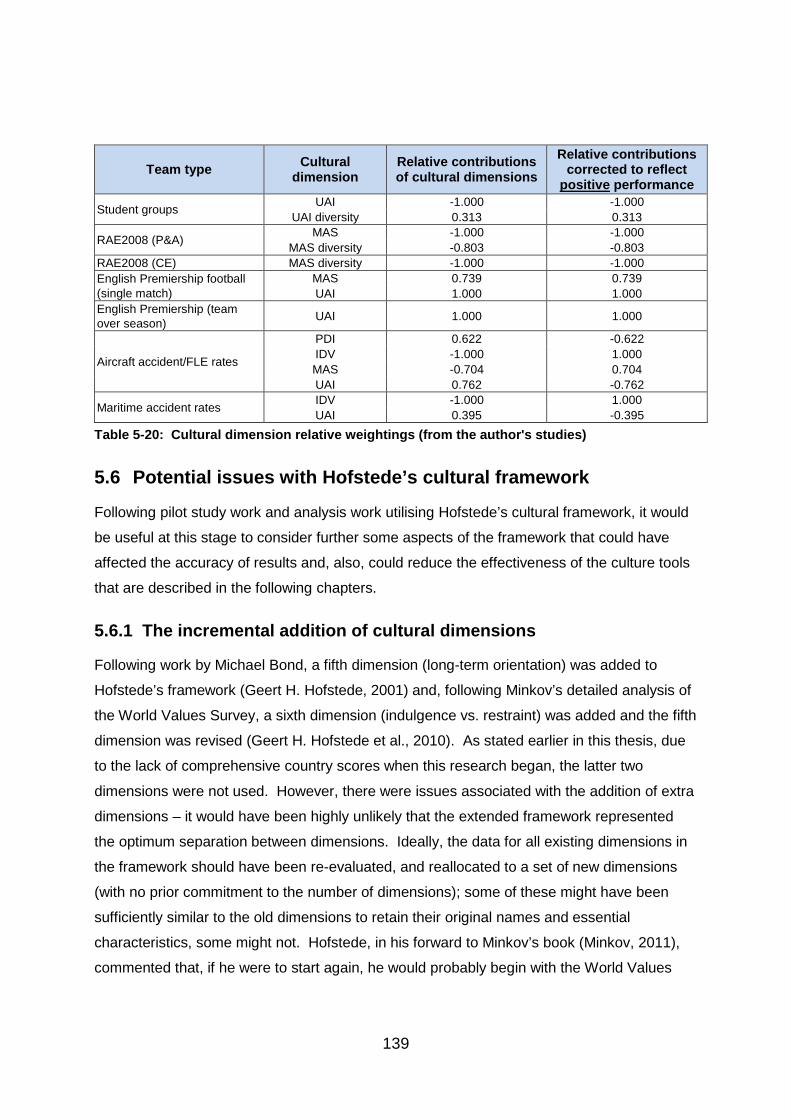
139
Team type Cultural dimension
Relative contributions of cultural dimensions
Relative contributions corrected to reflect
positive performance
Student groups UAI -1.000 -1.000 UAI diversity 0.313 0.313
RAE2008 (P&A) MAS -1.000 -1.000 MAS diversity -0.803 -0.803
RAE2008 (CE) MAS diversity -1.000 -1.000 English Premiership football (single match)
MAS 0.739 0.739 UAI 1.000 1.000
English Premiership (team over season) UAI 1.000 1.000
Aircraft accident/FLE rates
PDI 0.622 -0.622 IDV -1.000 1.000 MAS -0.704 0.704 UAI 0.762 -0.762
Maritime accident rates IDV -1.000 1.000 UAI 0.395 -0.395
Table 5-20: Cultural dimension relative weightings (from the author's studies)
5.6 Potential issues with Hofstede’s cultural framework
Following pilot study work and analysis work utilising Hofstede’s cultural framework, it would
be useful at this stage to consider further some aspects of the framework that could have
affected the accuracy of results and, also, could reduce the effectiveness of the culture tools
that are described in the following chapters.
5.6.1 The incremental addition of cultural dimensions
Following work by Michael Bond, a fifth dimension (long-term orientation) was added to
Hofstede’s framework (Geert H. Hofstede, 2001) and, following Minkov’s detailed analysis of
the World Values Survey, a sixth dimension (indulgence vs. restraint) was added and the fifth
dimension was revised (Geert H. Hofstede et al., 2010). As stated earlier in this thesis, due
to the lack of comprehensive country scores when this research began, the latter two
dimensions were not used. However, there were issues associated with the addition of extra
dimensions – it would have been highly unlikely that the extended framework represented
the optimum separation between dimensions. Ideally, the data for all existing dimensions in
the framework should have been re-evaluated, and reallocated to a set of new dimensions
(with no prior commitment to the number of dimensions); some of these might have been
sufficiently similar to the old dimensions to retain their original names and essential
characteristics, some might not. Hofstede, in his forward to Minkov’s book (Minkov, 2011),
commented that, if he were to start again, he would probably begin with the World Values
140
Survey35; this is precisely what Minkov did in order to produce his four-dimensional cultural
framework, however his 2011 publication appeared too late to be utilised in this research.
The author of this thesis, if starting two years later, might have chosen Minkov’s framework,
rather than Hofstede’s36.
5.6.2 The calculation of cultural dimension scores
Hofstede normalised the culture scores he obtained from his originals samples so that the
countries’ scores ranged from zero to one hundred, although this range changed with the
addition of new countries to the samples. However, as a consequence of this normalisation,
the scores only reflected a country’s relative position amongst a group of countries, rather
than reflecting (directly) any tendency to think or behave in a certain way. This lack of
absolute meaning caused the author of this thesis difficulties in making judgements of
optimum ‘low’ and ‘high’ scores (see Subsection 5.5.1). This point is discussed further at the
end of the next chapter.
5.7 Summary
Relevant studies from the literature were evaluated and, in combination with the author’s pilot
studies, enabled a number of general relationships between culture dimension scores and
team performances in various situations to be identified. In particular, quantitative scores
were assigned to the ‘low’ and ‘high’ cultural dimension scores identified in the literature
review and in the author’s studies; these scores formed an essential part of the data basis of
the team culture tools that are described in the following chapters.
A contribution was made to current understandings of masculinity, uncertainty avoidance and
cultural diversity.
35 See Web page http://www.worldvaluessurvey.org/wvs.jsp for information on the World Value Survey (WVS) and for access to WVS data. 36 But note that the author of this thesis has not yet found any significant studies that have utilised Minkov’s framework.
141
6 A first model and prototype team culture tool
6.1 Introduction
This chapter describes the development of a first model and team culture tool (the TCT1). In
this and subsequent chapters, the terms ‘mission’, ‘task’ and ‘task set’ are used inter-
changeably.
The first prototype of the culture tool was intended to produce a direct score of culture-based
team effectiveness. The purpose of developing the first prototype was to gain an under-
standing of the limitations imposed by our current knowledge of the effects of culture, in
particular when attempting to quantify these effects directly in terms of team performance. It
was therefore expected to represent a step too far, i.e. to be attempting to ‘do too much with
the limited data available to us’. It also provided a platform to test and assess a vital
component of any culture tool – the team cultural profiler.
6.2 The basis of the first model (TCT1)
This section is intended to provide an overview of the model behind the first tool, in parti-
cular, the basis on which it generated a measure of team performance, and the assumptions
that lay behind the approach.
6.2.1 Overview of the first model
The performance prediction model underlying the first team culture tool took the team cultural
profile (generated by the team cultural profiler when the user entered the team member
details) and applied it to three task/mission factors. The team culture scores reduced the
effectiveness of each of the team /mission factors to varying degrees based on how far these
scores were away from their optimum scores for each of the factors; the resultant factor
effectiveness values were expressed as percentages. The user entered the relative
importance of the three task/mission factors as weights (e.g. 50, 100 and 115), and the
performance prediction model used those weights to calculate an overall cultural-profile-
based efficiency for that team carrying out that task/mission. Figure 6-1 provides an outline
flow diagram of the model.
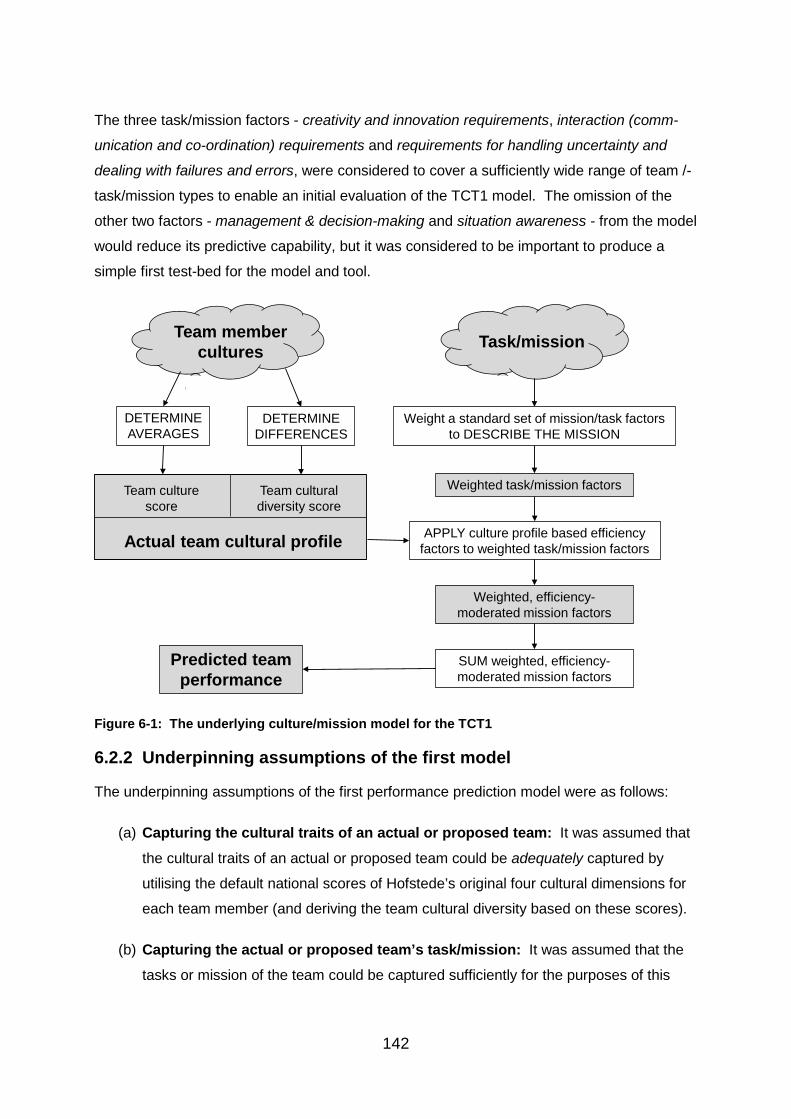
142
The three task/mission factors - creativity and innovation requirements, interaction (comm-
unication and co-ordination) requirements and requirements for handling uncertainty and
dealing with failures and errors, were considered to cover a sufficiently wide range of team /-
task/mission types to enable an initial evaluation of the TCT1 model. The omission of the
other two factors - management & decision-making and situation awareness - from the model
would reduce its predictive capability, but it was considered to be important to produce a
simple first test-bed for the model and tool.
Figure 6-1: The underlying culture/mission model for the TCT1
6.2.2 Underpinning assumptions of the first model
The underpinning assumptions of the first performance prediction model were as follows:
(a) Capturing the cultural traits of an actual or proposed team: It was assumed that
the cultural traits of an actual or proposed team could be adequately captured by
utilising the default national scores of Hofstede’s original four cultural dimensions for
each team member (and deriving the team cultural diversity based on these scores).
(b) Capturing the actual or proposed team’s task/mission: It was assumed that the
tasks or mission of the team could be captured sufficiently for the purposes of this
Team member cultures
DETERMINEAVERAGES
DETERMINEDIFFERENCES
Team culture score
Team cultural diversity score
Actual team cultural profile
Task/mission
Weight a standard set of mission/task factors to DESCRIBE THE MISSION
APPLY culture profile based efficiency factors to weighted task/mission factors
Predicted team performance
Weighted, efficiency-moderated mission factors
Weighted task/mission factors
SUM weighted, efficiency-moderated mission factors
143
‘Aunt Sally’37 by weighting three ‘standard’ task/mission factors compared to each
other.
(c) Calculating the effects of the team’s cultural traits on the task/mission factors: For each of the task mission factors, it was assumed that the cultural traits of the
team potentially reduced the performance of each task/mission factor from a
theoretical ideal performance (depending how far away the cultural trait was from the
ideal trait, as captured by the culture scores), and that a worst-case scenario (in
terms of cultural traits) would result in very poor factor performance.
The implications of the above assumptions and the degree to which they were found to be
justified are discussed later in this chapter.
6.3 A detailed description of the first model and team culture tool
The first model was based on profiling the team in terms of national culture scores, and
profiling the mission in terms of a subset of the factors identified in Subsection 3.3.3 and
detailed in Subsection 4.4.1. The task/mission factors chosen were:
• Creativity or innovation requirements
• Communication and co-ordination requirements
• Level of uncertainty/unpredictability
Irrespective of the mission, a particular team cultural profile would affect each of the three
task/mission factors the same way, reducing the team’s performance (compared to ‘ideal’) of
each of these factors by its own culture-based efficiency factor. It was the relative weightings
of the mission factors that would determine the overall effects of those culture-based
efficiency factors in the final ‘performance as a team’ value.
Figure 6-2 illustrates the actual TCT1 as implemented in the Microsoft Excel spread sheet
program. It can be seen from Figure 6-2, that the team cultural profile (derived from team
member nationalities and years in full-time education, see Subsection 6.3.1), was used to
derive estimates of internal communication capability and potential innovation capability.
These factors were then combined with the task/mission profile weights (manually entered as
estimates) and summed to produce an estimate of likely team performance of the given
mission profile.
37 ‘Aunt Sally’: A person or thing that is set up as a target for criticism. High accuracy was not a requirement in this model, rather the ability to demonstrate a principle, its weaknesses and limitations.
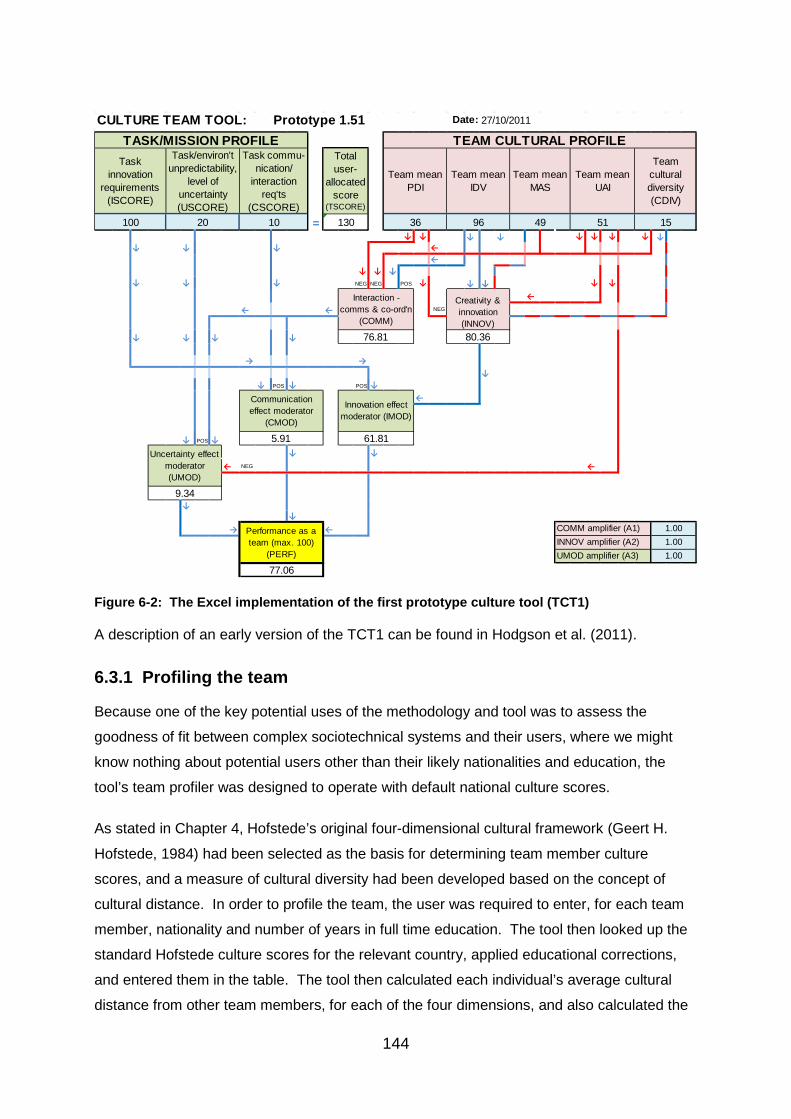
144
Figure 6-2: The Excel implementation of the first prototype culture tool (TCT1)
A description of an early version of the TCT1 can be found in Hodgson et al. (2011).
6.3.1 Profiling the team
Because one of the key potential uses of the methodology and tool was to assess the
goodness of fit between complex sociotechnical systems and their users, where we might
know nothing about potential users other than their likely nationalities and education, the
tool’s team profiler was designed to operate with default national culture scores.
As stated in Chapter 4, Hofstede’s original four-dimensional cultural framework (Geert H.
Hofstede, 1984) had been selected as the basis for determining team member culture
scores, and a measure of cultural diversity had been developed based on the concept of
cultural distance. In order to profile the team, the user was required to enter, for each team
member, nationality and number of years in full time education. The tool then looked up the
standard Hofstede culture scores for the relevant country, applied educational corrections,
and entered them in the table. The tool then calculated each individual’s average cultural
distance from other team members, for each of the four dimensions, and also calculated the
=↓ ↓ ↓ ↓ ↓ ↓ ↓ ↓ ↓
↓ ↓ ↓ ←←
↓ ↓ ↓↓ ↓ ↓ NEG NEG POS ↓ ↓ ↓ ↓ ↓
←← ← NEG
↓ ↓ ↓ ↓
→ →↓
↓ POS ↓ POS ↓←
↓ POS ↓↓ ↓
← NEG ←
↓↓
→ ←
Creativity & innovation (INNOV)80.36
Innovation effect moderator (IMOD)
61.81
COMM amplifier (A1) 1.00
1.001.00
UMOD amplifier (A3)INNOV amplifier (A2)
Uncertainty effect moderator (UMOD)
9.34
Performance as a team (max. 100)
(PERF)
77.06
Communication effect moderator
(CMOD)
5.91
130
TEAM CULTURAL PROFILE
76.81
Interaction - comms & co-ord'n
(COMM)
49 51 15100 20 10 36 96
Team mean MAS
Team mean UAI
Team cultural diversity (CDIV)
Task innovation
requirements (ISCORE)
Task/environ't unpredictability,
level of uncertainty (USCORE)
Task commu-nication/
interaction req'ts
(CSCORE)
Team mean PDI
Team mean IDV
Total user-
allocated score
(TSCORE)
TASK/MISSION PROFILECULTURE TEAM TOOL: Prototype 1.51 Date: 27/10/2011
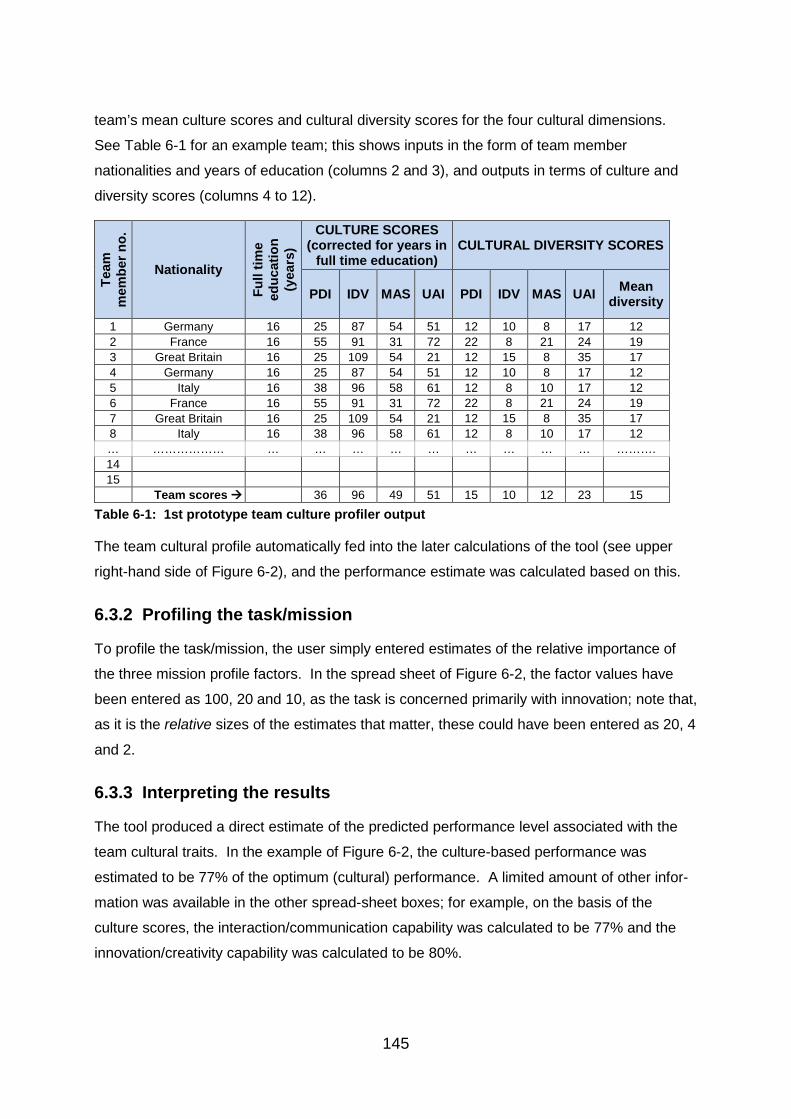
145
team’s mean culture scores and cultural diversity scores for the four cultural dimensions.
See Table 6-1 for an example team; this shows inputs in the form of team member
nationalities and years of education (columns 2 and 3), and outputs in terms of culture and
diversity scores (columns 4 to 12).
Team
m
embe
r no.
Nationality Fu
ll tim
e ed
ucat
ion
(yea
rs)
CULTURE SCORES (corrected for years in
full time education) CULTURAL DIVERSITY SCORES
PDI IDV MAS UAI PDI IDV MAS UAI Mean diversity
1 Germany 16 25 87 54 51 12 10 8 17 12 2 France 16 55 91 31 72 22 8 21 24 19 3 Great Britain 16 25 109 54 21 12 15 8 35 17 4 Germany 16 25 87 54 51 12 10 8 17 12 5 Italy 16 38 96 58 61 12 8 10 17 12 6 France 16 55 91 31 72 22 8 21 24 19 7 Great Britain 16 25 109 54 21 12 15 8 35 17 8 Italy 16 38 96 58 61 12 8 10 17 12 … ……………… … … … … … … … … … ………. 14 15 Team scores 36 96 49 51 15 10 12 23 15
Table 6-1: 1st prototype team culture profiler output
The team cultural profile automatically fed into the later calculations of the tool (see upper
right-hand side of Figure 6-2), and the performance estimate was calculated based on this.
6.3.2 Profiling the task/mission
To profile the task/mission, the user simply entered estimates of the relative importance of
the three mission profile factors. In the spread sheet of Figure 6-2, the factor values have
been entered as 100, 20 and 10, as the task is concerned primarily with innovation; note that,
as it is the relative sizes of the estimates that matter, these could have been entered as 20, 4
and 2.
6.3.3 Interpreting the results
The tool produced a direct estimate of the predicted performance level associated with the
team cultural traits. In the example of Figure 6-2, the culture-based performance was
estimated to be 77% of the optimum (cultural) performance. A limited amount of other infor-
mation was available in the other spread-sheet boxes; for example, on the basis of the
culture scores, the interaction/communication capability was calculated to be 77% and the
innovation/creativity capability was calculated to be 80%.
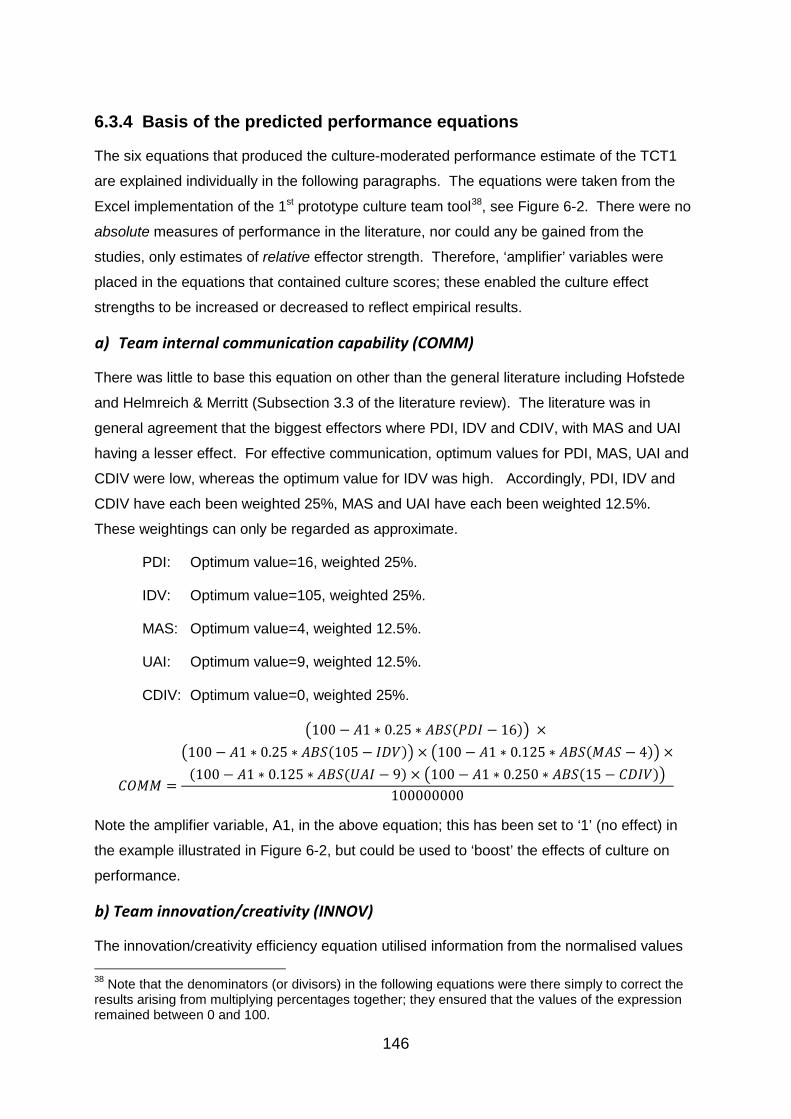
146
6.3.4 Basis of the predicted performance equations
The six equations that produced the culture-moderated performance estimate of the TCT1
are explained individually in the following paragraphs. The equations were taken from the
Excel implementation of the 1st prototype culture team tool38, see Figure 6-2. There were no
absolute measures of performance in the literature, nor could any be gained from the
studies, only estimates of relative effector strength. Therefore, ‘amplifier’ variables were
placed in the equations that contained culture scores; these enabled the culture effect
strengths to be increased or decreased to reflect empirical results.
a) Team internal communication capability (COMM)
There was little to base this equation on other than the general literature including Hofstede
and Helmreich & Merritt (Subsection 3.3 of the literature review). The literature was in
general agreement that the biggest effectors where PDI, IDV and CDIV, with MAS and UAI
having a lesser effect. For effective communication, optimum values for PDI, MAS, UAI and
CDIV were low, whereas the optimum value for IDV was high. Accordingly, PDI, IDV and
CDIV have each been weighted 25%, MAS and UAI have each been weighted 12.5%.
These weightings can only be regarded as approximate.
PDI: Optimum value=16, weighted 25%.
IDV: Optimum value=105, weighted 25%.
MAS: Optimum value=4, weighted 12.5%.
UAI: Optimum value=9, weighted 12.5%.
CDIV: Optimum value=0, weighted 25%.
𝐶𝑂𝑀𝑀 =
�100 − 𝐴1 ∗ 0.25 ∗ 𝐴𝐵𝑆(𝑃𝐷𝐼 − 16)� × �100 − 𝐴1 ∗ 0.25 ∗ 𝐴𝐵𝑆(105 − 𝐼𝐷𝑉)� × �100 − 𝐴1 ∗ 0.125 ∗ 𝐴𝐵𝑆(𝑀𝐴𝑆 − 4)� ×
(100 − 𝐴1 ∗ 0.125 ∗ 𝐴𝐵𝑆(𝑈𝐴𝐼 − 9) × �100 − 𝐴1 ∗ 0.250 ∗ 𝐴𝐵𝑆(15 − 𝐶𝐷𝐼𝑉)�100000000
Note the amplifier variable, A1, in the above equation; this has been set to ‘1’ (no effect) in
the example illustrated in Figure 6-2, but could be used to ‘boost’ the effects of culture on
performance.
b) Team innovation/creativity (INNOV)
The innovation/creativity efficiency equation utilised information from the normalised values 38 Note that the denominators (or divisors) in the following equations were there simply to correct the results arising from multiplying percentages together; they ensured that the values of the expression remained between 0 and 100.
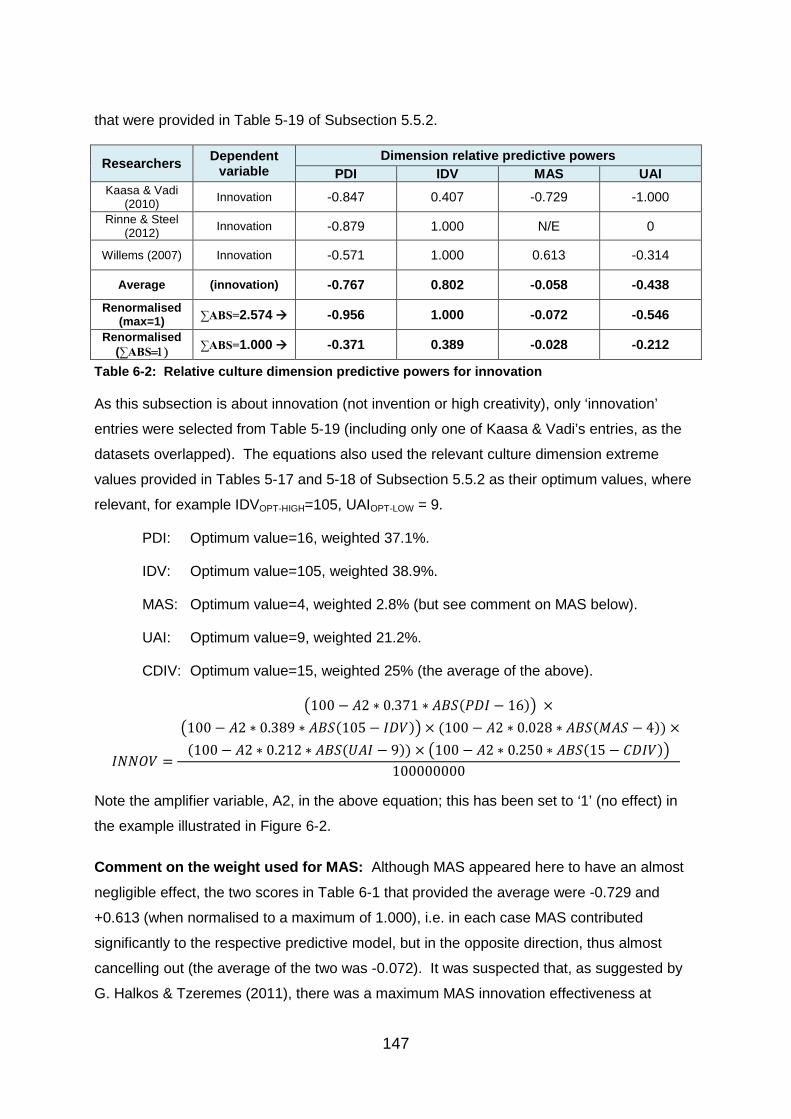
147
that were provided in Table 5-19 of Subsection 5.5.2.
Researchers Dependent variable
Dimension relative predictive powers PDI IDV MAS UAI
Kaasa & Vadi (2010) Innovation -0.847 0.407 -0.729 -1.000
Rinne & Steel (2012) Innovation -0.879 1.000 N/E 0
Willems (2007) Innovation -0.571 1.000 0.613 -0.314
Average (innovation) -0.767 0.802 -0.058 -0.438 Renormalised
(max=1) ∑ABS=2.574 -0.956 1.000 -0.072 -0.546 Renormalised
(∑ABS=1) ∑ABS=1.000 -0.371 0.389 -0.028 -0.212
Table 6-2: Relative culture dimension predictive powers for innovation
As this subsection is about innovation (not invention or high creativity), only ‘innovation’
entries were selected from Table 5-19 (including only one of Kaasa & Vadi’s entries, as the
datasets overlapped). The equations also used the relevant culture dimension extreme
values provided in Tables 5-17 and 5-18 of Subsection 5.5.2 as their optimum values, where
relevant, for example IDVOPT-HIGH=105, UAIOPT-LOW = 9.
PDI: Optimum value=16, weighted 37.1%.
IDV: Optimum value=105, weighted 38.9%.
MAS: Optimum value=4, weighted 2.8% (but see comment on MAS below).
UAI: Optimum value=9, weighted 21.2%.
CDIV: Optimum value=15, weighted 25% (the average of the above).
𝐼𝑁𝑁𝑂𝑉 =
�100 − 𝐴2 ∗ 0.371 ∗ 𝐴𝐵𝑆(𝑃𝐷𝐼 − 16)� × �100 − 𝐴2 ∗ 0.389 ∗ 𝐴𝐵𝑆(105− 𝐼𝐷𝑉)�× (100 − 𝐴2 ∗ 0.028 ∗ 𝐴𝐵𝑆(𝑀𝐴𝑆 − 4)) ×
(100 − 𝐴2 ∗ 0.212 ∗ 𝐴𝐵𝑆(𝑈𝐴𝐼 − 9)) × �100 − 𝐴2 ∗ 0.250 ∗ 𝐴𝐵𝑆(15 − 𝐶𝐷𝐼𝑉)�100000000
Note the amplifier variable, A2, in the above equation; this has been set to ‘1’ (no effect) in
the example illustrated in Figure 6-2.
Comment on the weight used for MAS: Although MAS appeared here to have an almost
negligible effect, the two scores in Table 6-1 that provided the average were -0.729 and
+0.613 (when normalised to a maximum of 1.000), i.e. in each case MAS contributed
significantly to the respective predictive model, but in the opposite direction, thus almost
cancelling out (the average of the two was -0.072). It was suspected that, as suggested by
G. Halkos & Tzeremes (2011), there was a maximum MAS innovation effectiveness at
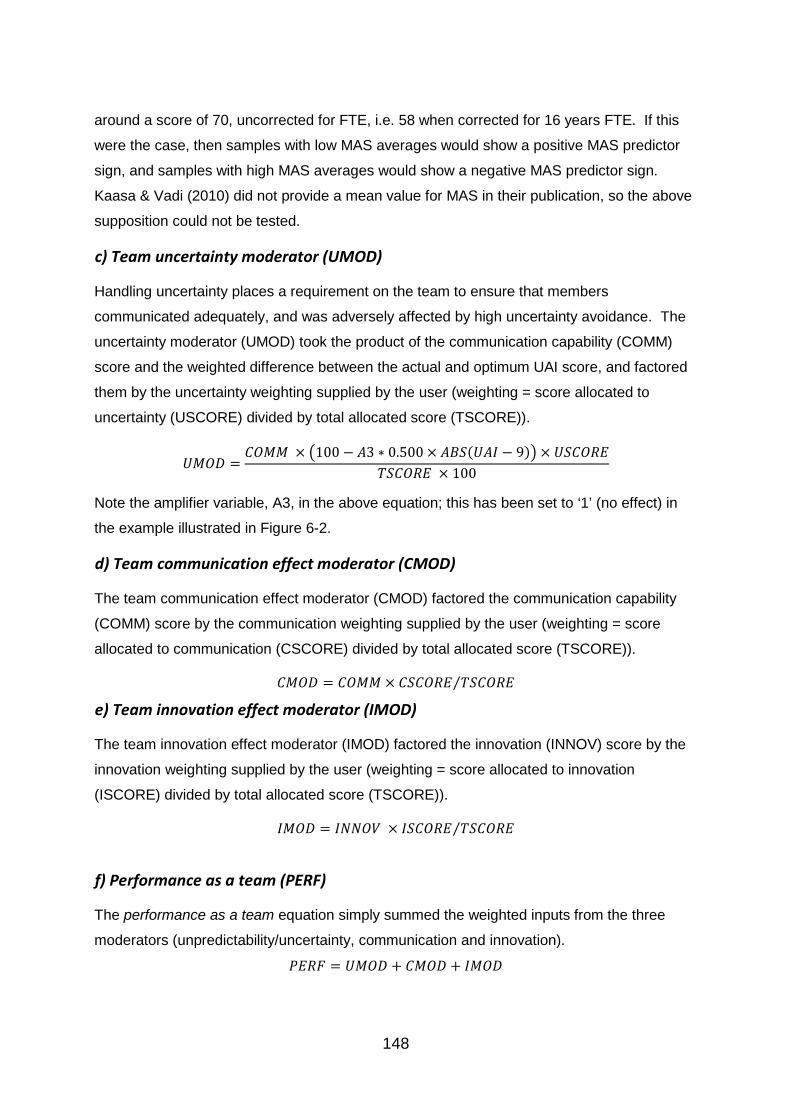
148
around a score of 70, uncorrected for FTE, i.e. 58 when corrected for 16 years FTE. If this
were the case, then samples with low MAS averages would show a positive MAS predictor
sign, and samples with high MAS averages would show a negative MAS predictor sign.
Kaasa & Vadi (2010) did not provide a mean value for MAS in their publication, so the above
supposition could not be tested.
c) Team uncertainty moderator (UMOD)
Handling uncertainty places a requirement on the team to ensure that members
communicated adequately, and was adversely affected by high uncertainty avoidance. The
uncertainty moderator (UMOD) took the product of the communication capability (COMM)
score and the weighted difference between the actual and optimum UAI score, and factored
them by the uncertainty weighting supplied by the user (weighting = score allocated to
uncertainty (USCORE) divided by total allocated score (TSCORE)).
𝑈𝑀𝑂𝐷 =𝐶𝑂𝑀𝑀 × �100 − 𝐴3 ∗ 0.500 × 𝐴𝐵𝑆(𝑈𝐴𝐼 − 9)� × 𝑈𝑆𝐶𝑂𝑅𝐸
𝑇𝑆𝐶𝑂𝑅𝐸 × 100
Note the amplifier variable, A3, in the above equation; this has been set to ‘1’ (no effect) in
the example illustrated in Figure 6-2.
d) Team communication effect moderator (CMOD)
The team communication effect moderator (CMOD) factored the communication capability
(COMM) score by the communication weighting supplied by the user (weighting = score
allocated to communication (CSCORE) divided by total allocated score (TSCORE)).
𝐶𝑀𝑂𝐷 = 𝐶𝑂𝑀𝑀 × 𝐶𝑆𝐶𝑂𝑅𝐸 𝑇𝑆𝐶𝑂𝑅𝐸⁄
e) Team innovation effect moderator (IMOD)
The team innovation effect moderator (IMOD) factored the innovation (INNOV) score by the
innovation weighting supplied by the user (weighting = score allocated to innovation
(ISCORE) divided by total allocated score (TSCORE)).
𝐼𝑀𝑂𝐷 = 𝐼𝑁𝑁𝑂𝑉 × 𝐼𝑆𝐶𝑂𝑅𝐸 𝑇𝑆𝐶𝑂𝑅𝐸⁄
f) Performance as a team (PERF)
The performance as a team equation simply summed the weighted inputs from the three
moderators (unpredictability/uncertainty, communication and innovation).
𝑃𝐸𝑅𝐹 = 𝑈𝑀𝑂𝐷 + 𝐶𝑀𝑂𝐷 + 𝐼𝑀𝑂𝐷
149
6.4 Evaluation of the first prototype tool (TCT1)
The TCT1 was tested and analysed on a range of team and mission types (high innovation
teams, low innovation teams and aircrew39), but was not made available to potential users
outside the research team because it was clear that it had a number of limitations (see
Section 6.5).
A paper on the first prototype tool, and the associated culture research was presented at the
IEEE System of Systems Conference in Albuquerque (A. Hodgson et al., 2011). The
presentation generated considerable interest, and useful discussions with researchers and
industrialists took place. Following a demonstration of the tool, a number of issues about the
tool and general approach were raised, and were later taken into account when the second
tool was developed.
6.5 Limitations, successes and a re-evaluation of assumptions
The model performed a useful function in highlighting weaknesses in the general approach to
the evaluation of the effects of culture on performance.
6.5.1 Limitations and successes of the tool
It became clear, after testing the tool with a range of mission profiles, that there were several
significant problems with the tool, for example:
(a) Differentiating between tasks/missions: The tool was unable to differentiate
adequately between different tasks/missions. Low or moderate innovation capability
(and a willingness to pursue the mundane) can be more useful than high innovation
capability in certain types of team projects, for example when carrying out some
forms of process improvement. However, the tool scoring process could not capture
this adequately.
(b) Relative vs. absolute weighting of cultural dimensions: Subject to the sensitivity
limitation stated above, the relative weightings of cultural dimensions in the equations
could be justified, as they reflected study results from the literature (captured in
Tables 5-19 and 6-1). However, the absolute weightings40 (captured in the model
39 These were specific team types, not specific teams, i.e. exemplars that were used to assess whether the tool could produce acceptable results. 40 In this context, absolute weightings were those weightings applied directly to the task/mission performance measure (e.g. every unit (or 1%) increase in power distance causes a 0.25% reduction in task/mission performance).
150
and tool by ‘tuning’ the values of the amplifier variables A1, A2 and A3) could only be
established by comparisons against the performance of real teams. The author was
following the pragmatist principle41, but in this case, the model was too insensitive for
it to be practicable to match its outputs against real-world performances.
(c) Providing user guidance: It would be difficult to extend the methodology and tool to
provide guidance for team improvement because only limited information was
produced. For example, Figure 6-2 indicated a culture-based performance rating of
77%. How could we improve this? What were the key problem areas?
(d) Increasing sensitivity leads to excessive complexity: To include more task/-
mission profile factors in the tool, and to split these factors into sub-factors
(necessary to capture the nuances of creativity, innovation, etc.), would result in a
model of excessive complexity; it would be extremely difficult to maintain the resulting
large set of equations, or to modify or to test the model and tool.
(e) The cultural profiler: This worked very effectively, and enabled the user to
experiment efficiently and effectively with different combinations of team members.
However, several researchers (including two researchers at the IEEE System of
Systems Conference where the researcher presented a paper on the TCT1)
commented on the limitations of being constrained to automatically-generated
individual cultural profiles based on a single nationality for each team member.
Therefore the cultural profiler would be modified in the second culture tool to enable
more flexibility.
6.5.2 A re-examination of the original assumptions
With regard to the assumptions behind the model, the following conclusions could be drawn:
(a) Capturing the cultural traits of an actual or proposed team: It was considered
that this was the least problematical part of the model and tool and that, inasmuch as
any quantitative modeller of default national culture could capture traits, the cultural
profiler captured the traits adequately.
(b) Capturing the actual or proposed team’s task/mission: This model demonstrated
the need for a much more detailed task/mission profile in order for a realistic,
41 See Chapter 2 for a full statement of the pragmatist principle. As Laudan (1978) states, the criteria for assessing the development of a theory should be based on its problem-solving effectiveness, rather than on its falsifiability.
151
adequately-discriminating tool performance.
(c) Calculating the effects of the team’s cultural traits on the task/mission factors: Although this assumption (that a worst-case scenario cultural mismatch to mission
would likely result in very poor performance) was probably true, the first team culture
tool (TCT1) could not reliably demonstrate such an effect because the required data
was not available, and the detailed relationships for such a model would be difficult to
incorporate in a tool and would also be difficult to verify.
6.5.3 Comments on the application of Hofstede’s cultural framework
Some of the problems that arose in the modelling of the TCT1 may have been caused by the
nature of the cultural dimensions, others by easily-made assumptions about the nature of the
associated statistical distributions. These are discussed below.
(a) The ‘relative’, rather than ‘absolute’ nature of Hofstede’s dimension scores
Hofstede’s calculations of culture scores for his original samples of countries included
normalisations that brought the range of country default scores for each of the four
dimensions to between zero and one hundred. This had two effects; the first was
that, as new countries were added, the range of scores was extended to below zero
and above one hundred. However, a more important effect was that the post-
normalisation culture scores did not provide a measure of the actual degree of power
distance, masculinity, etc. that countries possessed, just the relative differences
between countries compared to the overall range of country values. For example, a
difference of twenty between two countries implied a difference of one-fifth of the
maximum difference between any two of the original countries in the survey –
whatever that might be. It would be possible (although unlikely) that a country with a
power distance score of zero was only modestly different from one with a score of
one hundred. The lack of meaning associated with these scores made it difficult to
develop absolute relationships between cultural values and their effects on
communication, conflict, etc.
Instead of the above ‘relative’ scale, it would have been more informative to have an
international set of culture scores that represented the absolute scores from answers
to cultural dimension-related questions. A score of zero (for example, on power
distance) would be ‘maximally low’ on the survey’s power distance questions, and a
score of one hundred would be ‘maximally high’. In such a framework, it would be
152
likely that the distribution of country scores would be much less than the theoretical
zero to one hundred range, perhaps thirty to seventy for one dimension, fifteen to
sixty for another, but those scores would tell us much more – within the limitations of
the original questions – about the cultures of those countries and about human
societies in general. We might deduce that (say) human societies are much less
variable along certain dimensions than along others.
The difficulties that the author had in assigning maximum and minimum cultural
dimension scores (Subsection 5.5.1) would have been eased if the default culture
scores had been absolute rather than relative. A score of one hundred for uncertainty
avoidance would have implied a society that was terrified of everything that was less
than familiar in its world, a society that rejected all innovations, etc., rather than just
‘the most uncertainty-avoiding society’. When building the equations for the TCT1
(Subsection 6.3.4), the author was able to assign relative values to the effects of
cultural dimensions on behaviours, but there was no clear basis for the assignment of
absolute relationships between cultural dimension scores and behaviours.
Note that the above discussion is not intended to imply that a change to’ absolute’
measures would be any form of panacea, merely that it would be clear what the score
meant in terms of answering a certain group of questions that were considered to
relate to a particular cultural trait.
(b) Further issues with the masculinity culture dimension
When developing the innovation equation in Subsection 6.3.4(b), there were large
effector scores for masculinity (from the literature), but they were of opposite signs,
as was illustrated in Table 3-1 of the literature review. These scores cancelled out,
resulting in little input to the innovation equation of the TCT1 on the part of cultural
masculinity. This may be due to a statistical error in the published pilot studies due
to the shape of the masculinity/innovation curve42, as G. Halkos & Tzeremes (2011)
suggested that masculinity’s beneficial effects on innovation might peak at a score of
70 (uncorrected for FTE, i.e. 58 when corrected for 16 years FTE). If this were the
case, then samples with low MAS averages would show a positive MAS predictor
sign, and samples with high MAS averages would show a negative MAS predictor
sign. One of the data set sources, Kaasa & Vadi (2010), did not provide a mean
42 E.g. an incorrect assumption that there is a linear relationship between the masculinity score and its effects on innovation performance when the actual shape has a distinct maximum within the range of samples.
153
value for the MAS samples in their publication, so the above supposition could not be
tested. However, there appeared widely conflicting results in the literature with
regard to the effects of masculinity, so there are perhaps deeper issues with this
cultural dimension.
However, another reason could be that the masculinity cultural trait only comes into
play under certain circumstances or situations. Both in the case of airline pilots (A. C.
Merritt, 2000) and military officers under training (Soeters, 1997), the measured
masculinity scores did not relate to the country scores of the pilots and officers.
6.5.4 Conclusions
Several conclusions were reached, in particular:
(a) The basis of the performance measure was flawed: There were three main
problems with the model:
a. Relative vs. absolute data and relationships: At the time of this research, it
was not possible to obtain data on absolute relationships between cultural
traits (as represented by cultural dimension scores) and aspects of team
performance. A methodology based on the relative effects of culture was
required for the second model and prototype.
b. Insensitivity and complexity: Even if the data had been available, the
model was too insensitive to incremental differences between teams. The full
range of factors and their sub-factors would have to be utilised to improve the
sensitivity; however, this would result in excessive model complexity.
c. User information and guidance: The tool did not (and could not) provide
information to inform the user adequately or to guide him/her in team improve-
ment.
(b) The method of obtaining the team cultural profile had proved very easy and effective to use: The cultural profiler proved efficient, effective and understandable
in use; discussions with other researchers led to proposed improvements in its
representational flexibility, to be incorporated in the next tool.
6.6 Summary
Evaluations of the first prototype team culture tool demonstrated the effectiveness of the

154
team cultural profiler, but highlighted issues with the representation of task/mission profiles,
raised some issues with regard to the cultural framework, and with the method by which an
estimate of potential team performance was obtained. It was therefore decided to carry the
cultural profiler (in improved form) across to the second model and prototype team culture
tool, but to develop a different assessment methodology, based on transforming the
mission/task profile into an ideal or desirable culture profile to form the basis for a
comparison with the actual team culture.
155
7 A second model and prototype team culture tool
7.1 Introduction
This chapter describes the development and evaluation of the second model and team
culture tool (TCT2). Unlike the first culture tool (TCT1), this version of the team culture tool
was not intended to predict the ‘absolute’ performances of individual teams; instead, it was
intended to highlight where culture was likely to be a significant factor in underperformance
or heightened risk by assessing the goodness of fit between team and mission. This ‘fit’ was
based on the generation of discrepancies between the desirable team culture profile (based
on the mission) and the actual team culture profile.
To use the tool, the user described the team cultural profile, as in the TCT1, and described
the team task or mission by weighting a set of factors and their sub-factors; these factors
were affected by culture and contributed positively or negatively to the task or mission.
7.2 The basis of the second model (TCT2)
This section is intended to provide an overview of the model behind the second tool, in
particular, the basis on which it generated a measure of fit between teams and their task/-
mission requirements, and the assumptions that lay behind the approach.
7.2.1 Overview of the second model
The logic of the second performance prediction model was based on profiling the team via its
members’ national cultural traits43 (as was the first model), profiling the task/mission in terms
of five task/mission factors and their sub-factors (which were associated with specific cultural
traits), and deriving a set of cultural ‘discrepancies’ that formed the basis for the assessment
of team fitness for the task/mission.
The team cultural profile was created by entering team members’ nationalities and their
education levels into the model; this then calculated team average cultural scores and
diversity scores, based on Hofstede’s default national culture scores. The task/mission
profile was produced by weighting the set of five task/mission factors identified in Subsection 43 These ‘traits’ were captured in shorthand form using Hofstede’s cultural framework.
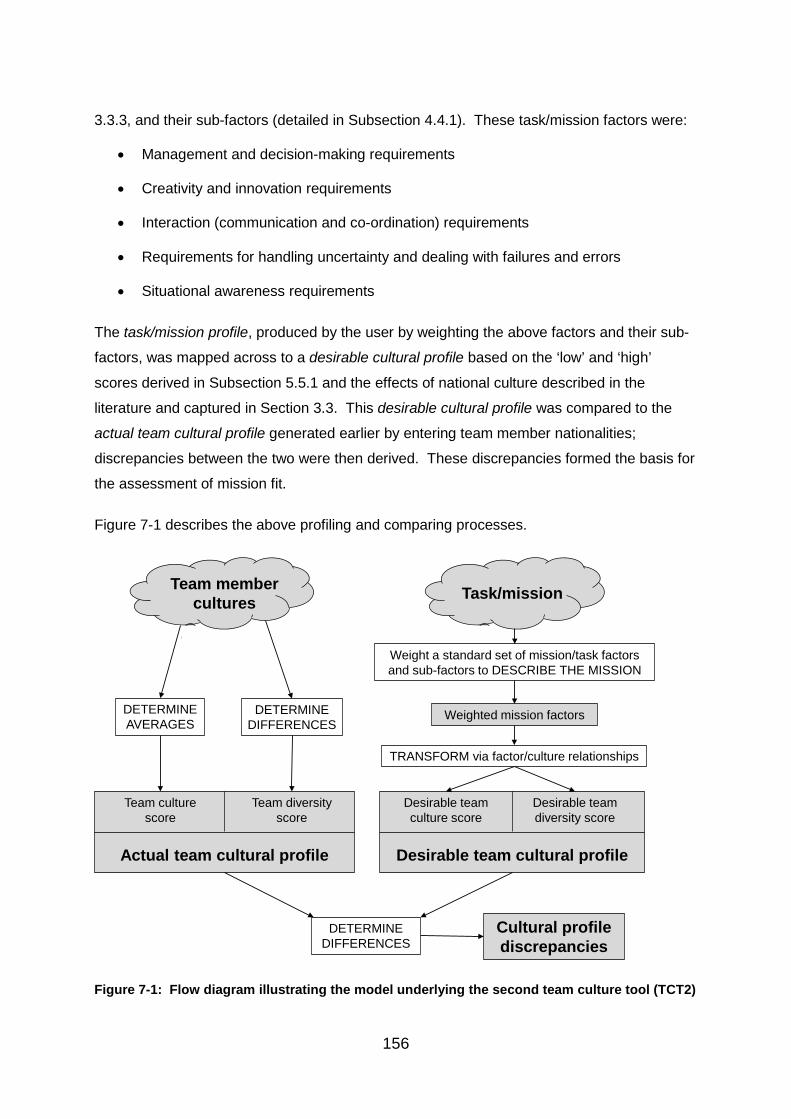
156
3.3.3, and their sub-factors (detailed in Subsection 4.4.1). These task/mission factors were:
• Management and decision-making requirements
• Creativity and innovation requirements
• Interaction (communication and co-ordination) requirements
• Requirements for handling uncertainty and dealing with failures and errors
• Situational awareness requirements
The task/mission profile, produced by the user by weighting the above factors and their sub-
factors, was mapped across to a desirable cultural profile based on the ‘low’ and ‘high’
scores derived in Subsection 5.5.1 and the effects of national culture described in the
literature and captured in Section 3.3. This desirable cultural profile was compared to the
actual team cultural profile generated earlier by entering team member nationalities;
discrepancies between the two were then derived. These discrepancies formed the basis for
the assessment of mission fit.
Figure 7-1 describes the above profiling and comparing processes.
Figure 7-1: Flow diagram illustrating the model underlying the second team culture tool (TCT2)
Team culture score
Team diversity score
Actual team cultural profile
Team member cultures
DETERMINEAVERAGES
DETERMINEDIFFERENCES
Task/mission
Weight a standard set of mission/task factors and sub-factors to DESCRIBE THE MISSION
TRANSFORM via factor/culture relationships
Desirable team culture score
Desirable team diversity score
Desirable team cultural profile
DETERMINE DIFFERENCES
Cultural profile discrepancies
Weighted mission factors
157
A key aspect of this approach was that it allowed the user to define the importance of the
above five team factors and their sub-factors to the team task or mission, rather than
allowing them directly to select a team task or mission. This approach acknowledged that
mission or task requirements could be changed by the utilisation of new processes and/or
new technologies. For example, the need for joint (or shared) situation awareness could be
met, at least in part, by a future intelligent agent that proactively informed crews of sociotech-
nical systems (such as aircraft, oil rigs or power stations) of developing hazards.
7.2.2 Underpinning assumptions of the second model
The underpinning assumptions of the second performance prediction model were as follows:
(a) Capturing the cultural traits of an actual or proposed team: As with the first
model, it was assumed that the cultural traits of an actual or proposed team could be
adequately captured by utilising the default national scores of Hofstede’s original four
cultural dimensions for each team member (and deriving the team cultural diversity
based on these scores).
(b) Capturing the desirable team cultural traits to achieve a task/mission: It was
assumed that the tasks or mission of the team could be captured sufficiently by
weighting five ‘standard’ factors and their sub-factors; this required the following:
(i) Capturing the culture-sensitive elements of team tasks or missions: It was assumed that a small number of behavioural factors and their sub-
factors could capture the elements of a range of team tasks or missions
that were most affected by cultural traits.
(ii) Relating culture-sensitive elements of tasks/missions to culture traits: It was assumed that the cultural traits required for optimum
performance of the factors/sub-factors of (i) above could be adequately
identified and encapsulated in the model.
(iii) Describing a particular task or mission in terms of the above factors: It was assumed that users had sufficient knowledge to be able to weight
the above five factors and their sub-factors with enough accuracy to define
adequately the team’s behavioural requirements for the task or mission.
(c) Obtaining useful information from the discrepancies between desirable and actual cultural traits: It was assumed that the cultural discrepancies between actual
158
and desirable cultural traits were meaningful, i.e. they informed the user of something
useful about potential team performance and/or team problems.
Note: The terms ‘adequate’ and ‘adequately’ related to the effects of inaccuracy on the
performance of the model and tool. The adequacy issue was complicated by the fact that
inaccuracies in various areas would potentially add together to reduce the overall effective-
ness of the tool in use. It was therefore difficult to judge the degree of adequacy of individual
steps in the process; however, the overall performance could be adjudged from the tool’s
effectiveness in the hands of users.
The implications of the above assumptions and the degree to which they were found to be
justified are discussed later in this chapter.
7.3 A detailed description of the key elements of the second model and tool
The two key elements of the model and tool were the team cultural profiler, and the
task/mission profiler. These are further described below.
7.3.1 Team cultural profiler
This was based on the cultural profiler described in Subsection 6.3.1, with the addition of two
further options:
(i) Hybrid (or dual) cultural nationality: This facility was provided to enable better
alignment for those team members who were bicultural, e.g. because they had emigrated
from one cultural area to another. On selecting this option, the user was expected to
select not one, but two nationalities when filling in the particular team member’s details in
the cultural profile table. The relevant culture dimension scores for the two nationalities
were then retrieved by the tool (from a table that listed Hofstede’s default culture scores
by country), corrected for the team member’s years in full time education, the four pairs of
scores (2 x PDI, 2 x IDV, etc.) were averaged, and these four averaged cultural
dimension scores were used in all further calculations for that individual.
(ii) Manual entry of cultural scores: This facility was provided for those team members
with individually assessed culture dimension scores, or those with clear deviations from
the mean of their culture (e.g. an American pilot with a very high power distance). On
selecting this option, the user was expected to enter, manually, the team member’s
scores for the four Hofstede cultural dimensions. The user’s nationality was then ignored
159
by the tool, and the manually-entered cultural dimension scores were used directly in all
further calculations for that individual.
7.3.2 Team task/mission profiler
The five-factor team/task profiler framework is described in detail in this subsection. The key
aim of this profiler was to enable the user to describe the task/mission profile of the team in
terms of factors which were associated with particular cultural dimension scores or ranges.
By selecting and weighting the five major factors and their sub-factors (i.e. by indicating how
important they were to the team mission), the user enabled the tool to generate an
associated set of ‘optimum’ or ‘desirable’ cultural dimension scores. Note that, for different
aspects of a particular mission (e.g. communications and following standard operational
procedures), contradictory ‘desirable’ cultural dimension scores could be generated – this
reflected the reality of multifaceted tasks and missions.
The five factors were originally described in Subsection 3.3 and expanded in Subsection
4.4.1. The culture dimension scores of Tables 5-17 and 5-18 were used where appropriate
to quantify the scores for the sub-factors of the five factors44.
Figure 7-2 is based on the innovation-related findings of Subsection 3.3 of the literature
review, in particular Figure 3.2 and the author’s pilot study findings, combined with the ‘low’
and ‘high’ cultural dimension scores as derived in Section 5.5. This figure was used to obtain
quantitative values for ‘in-between’ sub-factors of the creativity & innovation factor.
Two of the relationships in Figure 7-2 were particularly difficult to assess. Firstly, MAS
appeared to be strongly positive for low innovation, but not clear for high innovation (but see
comment in previous chapter). Secondly, the results for cultural diversity appeared to be
inconclusive and frequently contradictory; however, a degree of cultural diversity appeared to
be beneficial in the case of high innovation/creativity, but not in the case of low innovation.
The value of ‘15’ on the right-hand scale of Figure 7-2 represented the approximate
equivalent to 20-25% non-nationals, or equivalent to a Shannon Index score of 0.35, as
suggested by Barjak (2006) and Barjak & Robinson (2008).
44 In cases where no evidence was found for the effects of a particular cultural dimension on a sub-factor, no score was allocated to that factor for that cultural dimension.
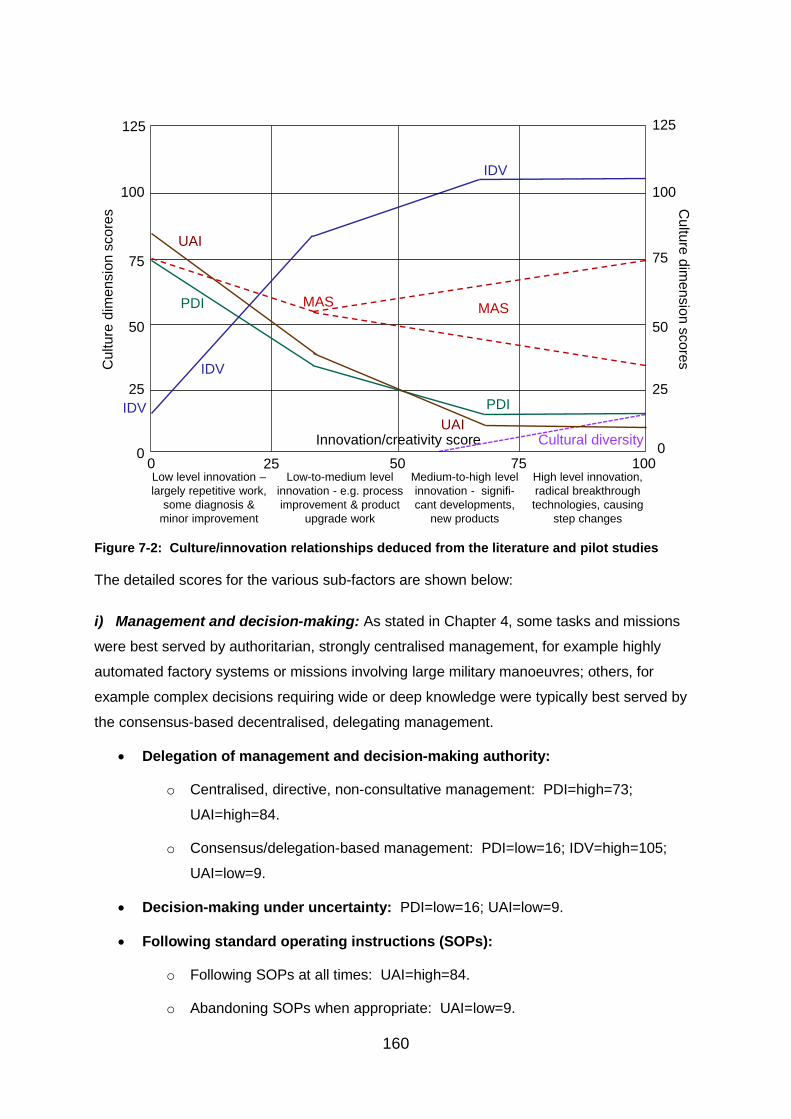
160
Figure 7-2: Culture/innovation relationships deduced from the literature and pilot studies
The detailed scores for the various sub-factors are shown below:
i) Management and decision-making: As stated in Chapter 4, some tasks and missions
were best served by authoritarian, strongly centralised management, for example highly
automated factory systems or missions involving large military manoeuvres; others, for
example complex decisions requiring wide or deep knowledge were typically best served by
the consensus-based decentralised, delegating management.
• Delegation of management and decision-making authority:
o Centralised, directive, non-consultative management: PDI=high=73;
UAI=high=84.
o Consensus/delegation-based management: PDI=low=16; IDV=high=105;
UAI=low=9.
• Decision-making under uncertainty: PDI=low=16; UAI=low=9.
• Following standard operating instructions (SOPs):
o Following SOPs at all times: UAI=high=84.
o Abandoning SOPs when appropriate: UAI=low=9.
0
25
50
75
100
0
25
50
75
100
Low level innovation –largely repetitive work,
some diagnosis & minor improvement
High level innovation, radical breakthrough technologies, causing
step changes
Medium-to-high level innovation - signifi-cant developments,
new products
Low-to-medium level innovation - e.g. process improvement & product
upgrade work
25 50 75 1000
PDI
IDV
UAI
MASMAS
Cul
ture
dim
ensi
on s
core
s Culture dim
ension scores
Innovation/creativity score Cultural diversity
IDVUAI
125125
PDI
IDV
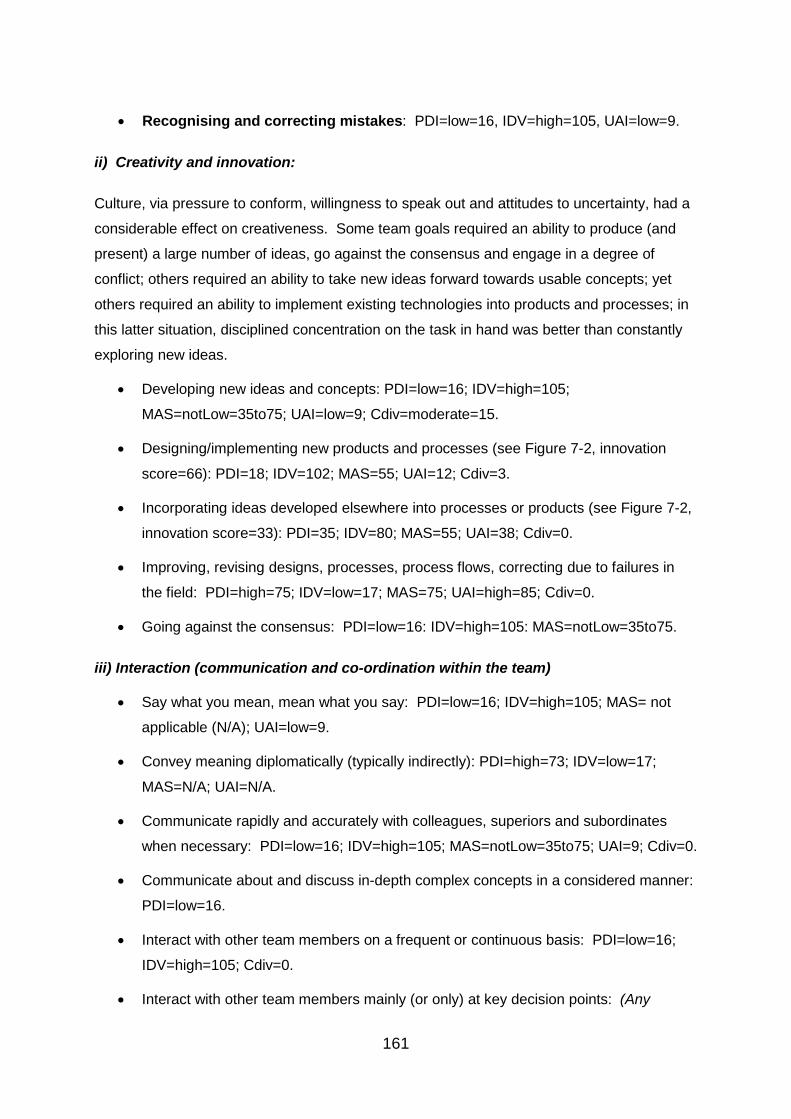
161
• Recognising and correcting mistakes: PDI=low=16, IDV=high=105, UAI=low=9.
ii) Creativity and innovation:
Culture, via pressure to conform, willingness to speak out and attitudes to uncertainty, had a
considerable effect on creativeness. Some team goals required an ability to produce (and
present) a large number of ideas, go against the consensus and engage in a degree of
conflict; others required an ability to take new ideas forward towards usable concepts; yet
others required an ability to implement existing technologies into products and processes; in
this latter situation, disciplined concentration on the task in hand was better than constantly
exploring new ideas.
• Developing new ideas and concepts: PDI=low=16; IDV=high=105;
MAS=notLow=35to75; UAI=low=9; Cdiv=moderate=15.
• Designing/implementing new products and processes (see Figure 7-2, innovation
score=66): PDI=18; IDV=102; MAS=55; UAI=12; Cdiv=3.
• Incorporating ideas developed elsewhere into processes or products (see Figure 7-2,
innovation score=33): PDI=35; IDV=80; MAS=55; UAI=38; Cdiv=0.
• Improving, revising designs, processes, process flows, correcting due to failures in
the field: PDI=high=75; IDV=low=17; MAS=75; UAI=high=85; Cdiv=0.
• Going against the consensus: PDI=low=16: IDV=high=105: MAS=notLow=35to75.
iii) Interaction (communication and co-ordination within the team)
• Say what you mean, mean what you say: PDI=low=16; IDV=high=105; MAS= not
applicable (N/A); UAI=low=9.
• Convey meaning diplomatically (typically indirectly): PDI=high=73; IDV=low=17;
MAS=N/A; UAI=N/A.
• Communicate rapidly and accurately with colleagues, superiors and subordinates
when necessary: PDI=low=16; IDV=high=105; MAS=notLow=35to75; UAI=9; Cdiv=0.
• Communicate about and discuss in-depth complex concepts in a considered manner:
PDI=low=16.
• Interact with other team members on a frequent or continuous basis: PDI=low=16;
IDV=high=105; Cdiv=0.
• Interact with other team members mainly (or only) at key decision points: (Any
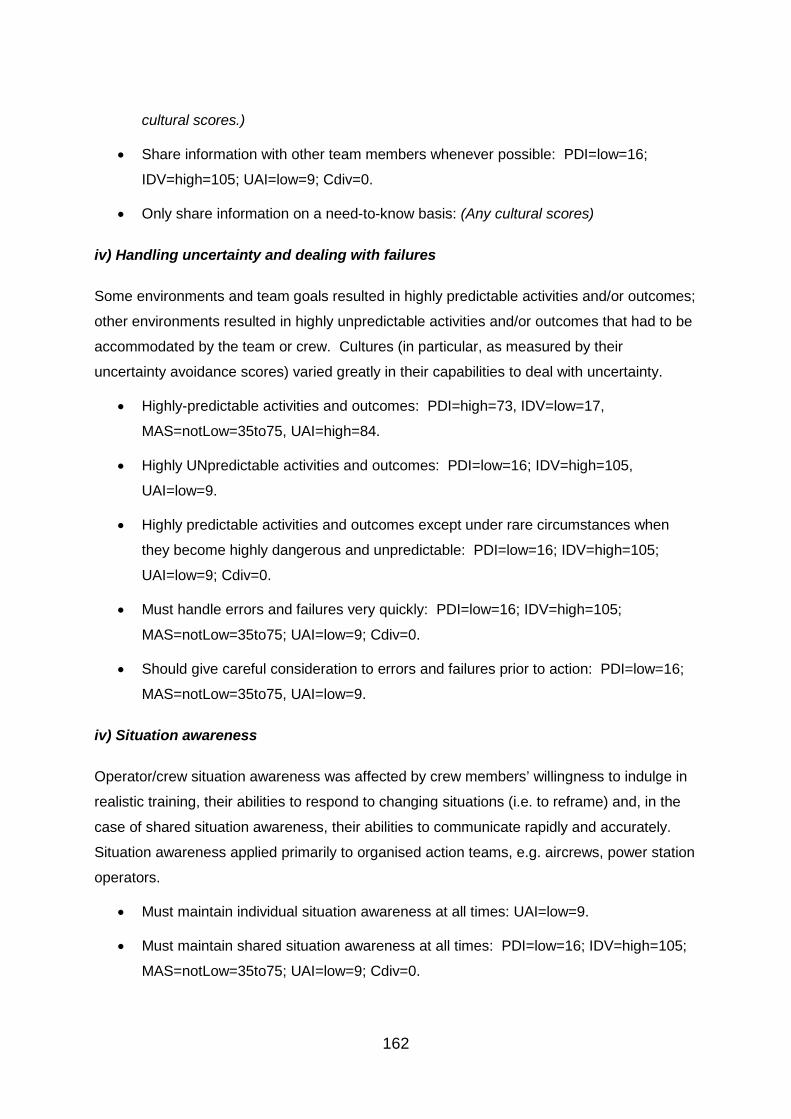
162
cultural scores.)
• Share information with other team members whenever possible: PDI=low=16;
IDV=high=105; UAI=low=9; Cdiv=0.
• Only share information on a need-to-know basis: (Any cultural scores)
iv) Handling uncertainty and dealing with failures
Some environments and team goals resulted in highly predictable activities and/or outcomes;
other environments resulted in highly unpredictable activities and/or outcomes that had to be
accommodated by the team or crew. Cultures (in particular, as measured by their
uncertainty avoidance scores) varied greatly in their capabilities to deal with uncertainty.
• Highly-predictable activities and outcomes: PDI=high=73, IDV=low=17,
MAS=notLow=35to75, UAI=high=84.
• Highly UNpredictable activities and outcomes: PDI=low=16; IDV=high=105,
UAI=low=9.
• Highly predictable activities and outcomes except under rare circumstances when
they become highly dangerous and unpredictable: PDI=low=16; IDV=high=105;
UAI=low=9; Cdiv=0.
• Must handle errors and failures very quickly: PDI=low=16; IDV=high=105;
MAS=notLow=35to75; UAI=low=9; Cdiv=0.
• Should give careful consideration to errors and failures prior to action: PDI=low=16;
MAS=notLow=35to75, UAI=low=9.
iv) Situation awareness
Operator/crew situation awareness was affected by crew members’ willingness to indulge in
realistic training, their abilities to respond to changing situations (i.e. to reframe) and, in the
case of shared situation awareness, their abilities to communicate rapidly and accurately.
Situation awareness applied primarily to organised action teams, e.g. aircrews, power station
operators.
• Must maintain individual situation awareness at all times: UAI=low=9.
• Must maintain shared situation awareness at all times: PDI=low=16; IDV=high=105;
MAS=notLow=35to75; UAI=low=9; Cdiv=0.
163
7.4 Description of the operation of the tool
In order to assess the suitability of a team in cultural terms, it was necessary to:
1. Profile the team in terms of its cultural traits or characteristics (user input).
2. Profile the team mission (including relevant environmental aspects) and thereby
generate a desirable cultural profile (user input).
3. Compare the two profiles and thus assess the team’s suitability or mismatch in terms
of discrepancies (tool calculation).
The process of describing the mission was, in reality, a process of weighting the various
task-related factors and their sub-factors according to their importance to the performance of
the team. The only differences between any two team missions or tasks were the weightings
assigned to the factors and sub-factors. The reasons for incorporating weightings of both
factors and their sub-factors were:
• The two levels of weighting enabled users to discount, at a high level (i.e. factor
level), those items that were not important; for example, for some tasks or missions,
creativity would not be important, for others, dealing with uncertainty or situation
awareness would not be important.
• Users found it much easier to weight a small number of alternative sub-factors on a
comparative basis, rather than the full set of sub-factors.
The following subsections describe the activities and profiles in more detail; as the culture
tool represented the implementation of the model, the descriptions are presented in terms of
tool usage and processes.
7.4.1 Profiling the team
As stated earlier, the team cultural profiler was based on that used for the first prototype, with
the additional options of hybrid nationality and manual entry of cultural dimension scores.
The user was first expected to enter team member names or identities, then to select from a
dropdown list, for each team member, the choice of input – single nationality, hybrid
nationality or manual entry; if ‘manual entry’ was selected, then the user was expected to
manually enter scores for the four Hofstede dimensions. The user was then required to
select the number of years in full time education for each team member (from a dropdown
list); these factored the scores, based on Bosland’s corrections. A field was also provided to
record the gender of each team member (M or F), but this was not utilised in the calculations
164
because insufficient data had been found to justify its use.
The team cultural profiler subsequently carried out one of the following courses of action:
• Single nationality: Retrieve the four standard culture scores for the relevant country
or countries45, apply educational corrections then enter them in the table.
• Hybrid (dual) nationality: Retrieve the four standard culture scores for both
nationalities, calculate the mean value for each score, apply educational corrections,
then enter them in the team culture profile table.
• Manual entry: Take the (four) manually entered culture scores and enter them
directly in the team culture profile table without any further corrections.
Following entry of the above information, the team cultural profiler calculated each
individual’s average cultural distance from other team members for each of the four
dimensions based on the equation described in Subsection 4.3.2, see below:
Cdix = ∑ 𝐴𝐵𝑆(𝐷𝑖𝑥 − 𝐷𝑗𝑥)𝑁𝑗=1 (𝑁 − 1)⁄
Where Dix, Djx = scores for cultural dimension ‘x’ for team members ‘i’ and ‘j, and N =
total number of team members (including member ‘i’)
The team cultural profiler also calculated team mean culture scores and mean cultural
diversity scores for the four cultural dimensions. See Figure 7-3 for an example team,
showing inputs in the form of team member nationalities and education, and outputs in terms
of culture and diversity scores.
45 Default country scores for the four cultural dimensions were stored in a separate table.
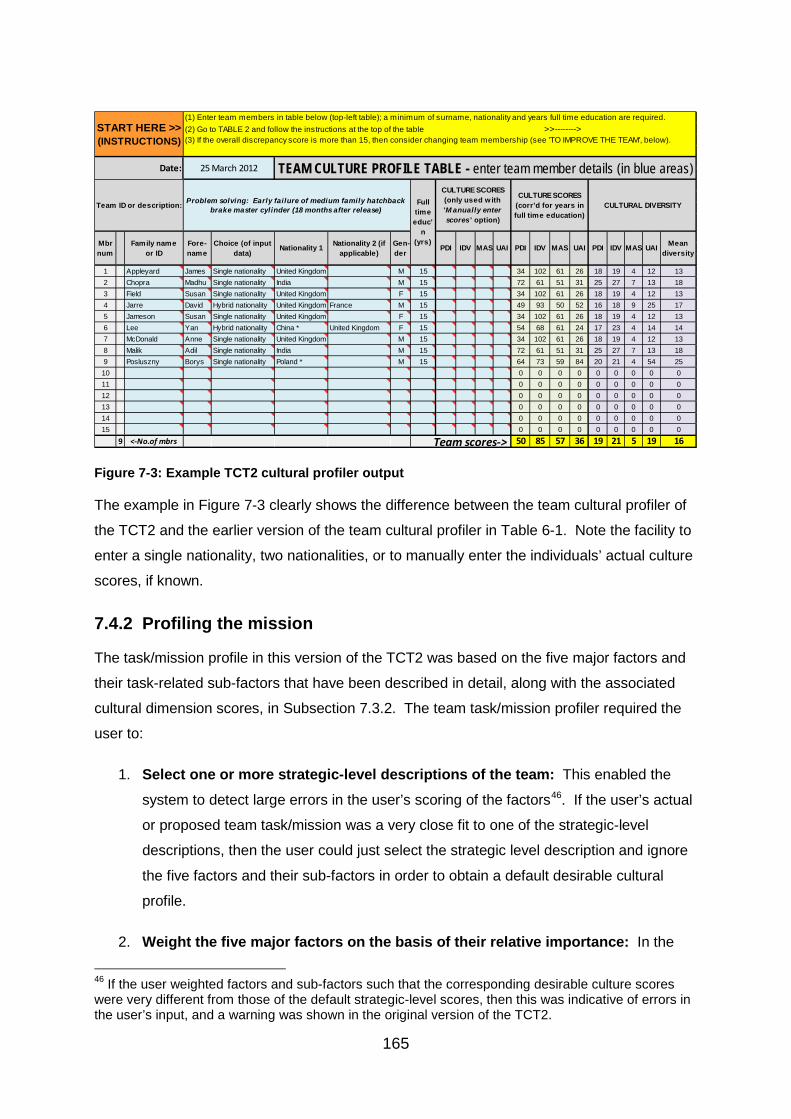
165
Figure 7-3: Example TCT2 cultural profiler output
The example in Figure 7-3 clearly shows the difference between the team cultural profiler of
the TCT2 and the earlier version of the team cultural profiler in Table 6-1. Note the facility to
enter a single nationality, two nationalities, or to manually enter the individuals’ actual culture
scores, if known.
7.4.2 Profiling the mission
The task/mission profile in this version of the TCT2 was based on the five major factors and
their task-related sub-factors that have been described in detail, along with the associated
cultural dimension scores, in Subsection 7.3.2. The team task/mission profiler required the
user to:
1. Select one or more strategic-level descriptions of the team: This enabled the
system to detect large errors in the user’s scoring of the factors46. If the user’s actual
or proposed team task/mission was a very close fit to one of the strategic-level
descriptions, then the user could just select the strategic level description and ignore
the five factors and their sub-factors in order to obtain a default desirable cultural
profile.
2. Weight the five major factors on the basis of their relative importance: In the
46 If the user weighted factors and sub-factors such that the corresponding desirable culture scores were very different from those of the default strategic-level scores, then this was indicative of errors in the user’s input, and a warning was shown in the original version of the TCT2.
(1) Enter team members in table below (top-left table); a minimum of surname, nationality and years full time education are required.
1 1 Appleyard James Single nationality United Kingdom M 15 34 102 61 26 18 19 4 12 132 1 Chopra Madhu Single nationality India M 15 72 61 51 31 25 27 7 13 183 1 Field Susan Single nationality United Kingdom F 15 34 102 61 26 18 19 4 12 134 1 Jarre David Hybrid nationality United Kingdom France M 15 49 93 50 52 16 18 9 25 175 1 Jameson Susan Single nationality United Kingdom F 15 34 102 61 26 18 19 4 12 136 1 Lee Yan Hybrid nationality China * United Kingdom F 15 54 68 61 24 17 23 4 14 147 1 McDonald Anne Single nationality United Kingdom M 15 34 102 61 26 18 19 4 12 138 1 Malik Adil Single nationality India M 15 72 61 51 31 25 27 7 13 189 1 Posluszny Borys Single nationality Poland * M 15 64 73 59 84 20 21 4 54 2510 0 0 0 0 0 0 0 0 0 011 0 0 0 0 0 0 0 0 0 012 0 0 0 0 0 0 0 0 0 013 0 0 0 0 0 0 0 0 0 014 0 0 0 0 0 0 0 0 0 015 0 0 0 0 0 0 0 0 0 0
9 <-No.of mbrs 50 85 57 36 19 21 5 19 16
Date: 25 March 2012 TEAM CULTURE PROFILE TABLE - enter team member details (in blue areas)
Mbr num
Family name or ID
Fore-name
Choice (of input data)
Nationality 1 Nationality 2 (if applicable)
Gen-der
UAIMASIDVPDI IDVPDIUAIMASIDVPDI MAS Mean diversity
UAI
(2) Go to TABLE 2 and follow the instructions at the top of the table >>-------->
Problem solving: Early failure of medium family hatchback brake master cylinder (18 months after release)
CULTURE SCORES (only used with 'M anually enter scores ' option)
CULTURE SCORES (corr'd for years in full time education)
CULTURAL DIVERSITYFull time educ'
n (yrs)
Team scores->
Team ID or description:
START HERE >> (INSTRUCTIONS) (3) If the overall discrepancy score is more than 15, then consider changing team membership (see 'TO IMPROVE THE TEAM', below).
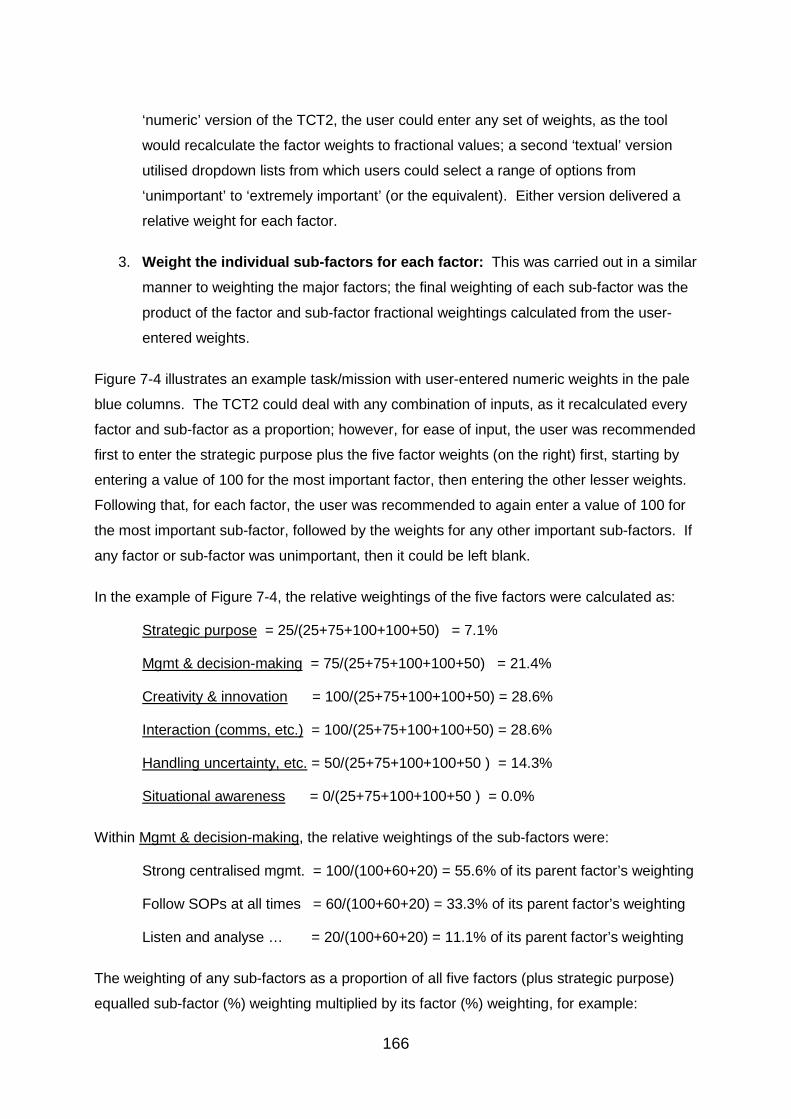
166
‘numeric’ version of the TCT2, the user could enter any set of weights, as the tool
would recalculate the factor weights to fractional values; a second ‘textual’ version
utilised dropdown lists from which users could select a range of options from
‘unimportant’ to ‘extremely important’ (or the equivalent). Either version delivered a
relative weight for each factor.
3. Weight the individual sub-factors for each factor: This was carried out in a similar
manner to weighting the major factors; the final weighting of each sub-factor was the
product of the factor and sub-factor fractional weightings calculated from the user-
entered weights.
Figure 7-4 illustrates an example task/mission with user-entered numeric weights in the pale
blue columns. The TCT2 could deal with any combination of inputs, as it recalculated every
factor and sub-factor as a proportion; however, for ease of input, the user was recommended
first to enter the strategic purpose plus the five factor weights (on the right) first, starting by
entering a value of 100 for the most important factor, then entering the other lesser weights.
Following that, for each factor, the user was recommended to again enter a value of 100 for
the most important sub-factor, followed by the weights for any other important sub-factors. If
any factor or sub-factor was unimportant, then it could be left blank.
In the example of Figure 7-4, the relative weightings of the five factors were calculated as:
Strategic purpose = 25/(25+75+100+100+50) = 7.1%
Mgmt & decision-making = 75/(25+75+100+100+50) = 21.4%
Creativity & innovation = 100/(25+75+100+100+50) = 28.6%
Interaction (comms, etc.) = 100/(25+75+100+100+50) = 28.6%
Handling uncertainty, etc. = 50/(25+75+100+100+50 ) = 14.3%
Situational awareness = 0/(25+75+100+100+50 ) = 0.0%
Within Mgmt & decision-making, the relative weightings of the sub-factors were:
Strong centralised mgmt. = 100/(100+60+20) = 55.6% of its parent factor’s weighting
Follow SOPs at all times = 60/(100+60+20) = 33.3% of its parent factor’s weighting
Listen and analyse … = 20/(100+60+20) = 11.1% of its parent factor’s weighting
The weighting of any sub-factors as a proportion of all five factors (plus strategic purpose)
equalled sub-factor (%) weighting multiplied by its factor (%) weighting, for example:
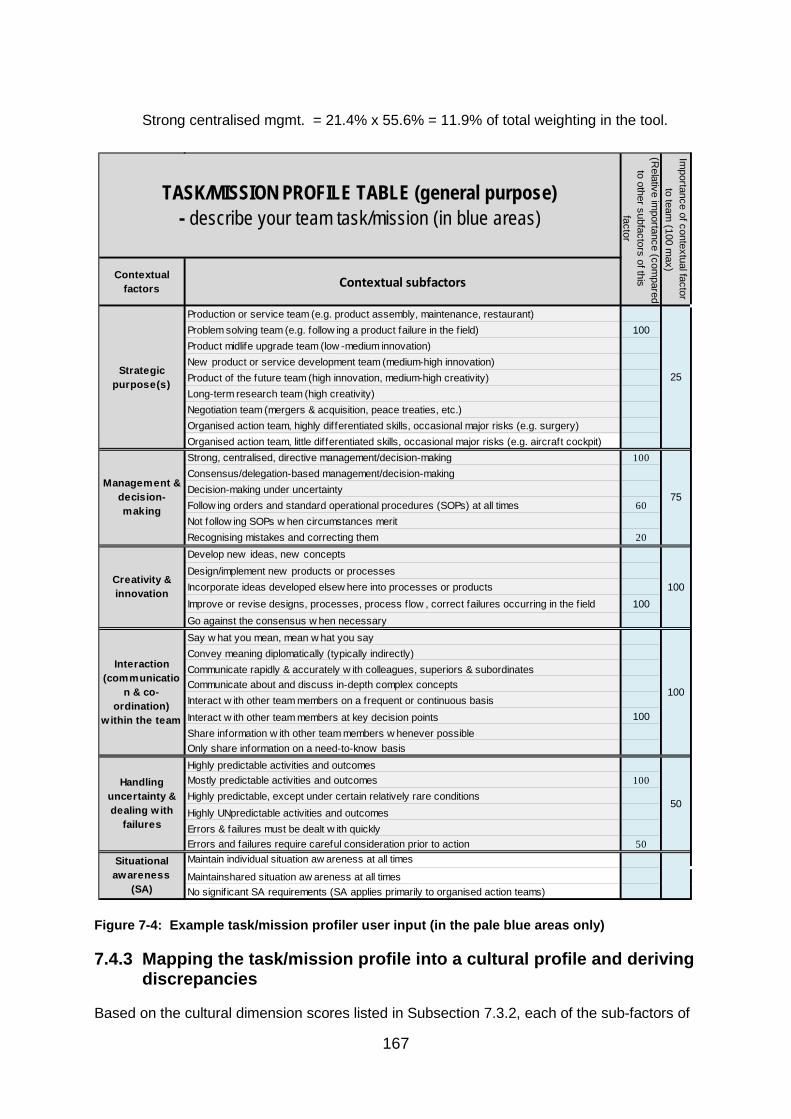
167
Strong centralised mgmt. = 21.4% x 55.6% = 11.9% of total weighting in the tool.
Figure 7-4: Example task/mission profiler user input (in the pale blue areas only)
7.4.3 Mapping the task/mission profile into a cultural profile and deriving discrepancies
Based on the cultural dimension scores listed in Subsection 7.3.2, each of the sub-factors of
Production or service team (e.g. product assembly, maintenance, restaurant)Problem solving team (e.g. follow ing a product failure in the f ield) 100Product midlife upgrade team (low -medium innovation)New product or service development team (medium-high innovation)Product of the future team (high innovation, medium-high creativity)Long-term research team (high creativity)Negotiation team (mergers & acquisition, peace treaties, etc.)Organised action team, highly differentiated skills, occasional major risks (e.g. surgery)Organised action team, little differentiated skills, occasional major risks (e.g. aircraft cockpit)Strong, centralised, directive management/decision-making 100Consensus/delegation-based management/decision-makingDecision-making under uncertaintyFollow ing orders and standard operational procedures (SOPs) at all times 60Not follow ing SOPs w hen circumstances meritRecognising mistakes and correcting them 20Develop new ideas, new conceptsDesign/implement new products or processesIncorporate ideas developed elsew here into processes or productsImprove or revise designs, processes, process f low , correct failures occurring in the f ield 100Go against the consensus w hen necessarySay w hat you mean, mean w hat you sayConvey meaning diplomatically (typically indirectly)Communicate rapidly & accurately w ith colleagues, superiors & subordinatesCommunicate about and discuss in-depth complex conceptsInteract w ith other team members on a frequent or continuous basisInteract w ith other team members at key decision points 100Share information w ith other team members w henever possibleOnly share information on a need-to-know basisHighly predictable activities and outcomesMostly predictable activities and outcomes 100Highly predictable, except under certain relatively rare conditionsHighly UNpredictable activities and outcomesErrors & failures must be dealt w ith quicklyErrors and failures require careful consideration prior to action 50Maintain individual situation aw areness at all times
Maintainshared situation aw areness at all timesNo signif icant SA requirements (SA applies primarily to organised action teams)
Strategic purpose(s)
25
(Relative im
portance (compared
to other subfactors of this factor
Importance of contextual factor
to team (100 m
ax)
Contextual factors Contextual subfactors
TASK/MISSION PROFILE TABLE (general purpose)- describe your team task/mission (in blue areas)
Management & decision-making
75
Interaction (communicatio
n & co-ordination)
w ithin the team
100
Handling uncertainty & dealing w ith
failures
50
Situational awareness
(SA)
Creativity & innovation 100
168
the 2nd prototype (TCT2) had an associated ‘desirable culture score’ for each of the four
cultural dimensions, four cultural diversity dimensions and mean diversity dimension47; these
were stored in a ‘desirable culture score’ master table). Therefore, for each sub-factor, nine
discrepancy values (one for each of the above nine culture/cultural diversity dimensions),
were calculated as the difference between the team’s culture/cultural diversity score and the
score in the ‘desirable culture score’ master table. These were factored by the sub-factor
and factor weights (entered by the user in the task/mission profile table – see Subsection
7.4.2, above), and the results appeared in the team cultural discrepancy table, see Figure 7-
5.
Figure 7-5: Team cultural discrepancy table
Note the ‘traffic light’ warning system in Table 7-5. From this, it can immediately be seen that
the greatest problem areas were management & decision-making, where the main issue
relates to the requirement for strong, directive management, and creativity and innovation,
47 Note that, due to very limited data on the effects of cultural diversity, for most sub-factors, cultural diversity values were set to ‘NA’ (not applicable). Where a reasonable estimate for overall diversity was available from the data, either the same value was also put in the individual diversities, or the value was only put into the mean diversity (with the individual diversities set to ‘NA’. This was less than satisfactory, but it was hoped that, when diversity data became available at a later date, it could be entered into the TCT.
Task/mission factors Task/mission subfactors
Production or service team (e.g. product assembly, maintenance, restaurant) 0 7.14 NA NA NA NA NA NA NA NA NA 0.0Problem solving team (e.g. follow ing a product failure in the f ield) 100 7.14 -20.46 39.83 NA -48.89 19.32 21.39 5.44 13.53 NA 24.1Product midlife upgrade team (low -medium innovation) 0 7.14 NA NA NA NA NA NA NA NA NA 0.0New product or service development team (medium-high innovation) 0 7.14 NA NA NA NA NA NA NA NA NA 0.0Product of the future team (high innovation, medium-high creativity) 0 7.14 NA NA NA NA NA NA NA NA NA 0.0Long-term research team (high creativity) 0 7.14 NA NA NA NA NA NA NA NA NA 0.0Negotiation team (mergers & acquisition, peace treaties, etc.) 0 7.14 NA NA NA NA NA NA NA NA NA 0.0Organised action team, highly differentiated skills, occasional major risks (e.g. surgery) 0 7.14 NA NA NA NA NA NA NA NA NA 0.0Organised action team, little differentiated skills, occasional major risks (e.g. a/c cockpit) 0 7.14 NA NA NA NA NA NA NA NA NA 0.0Strong, centralised, directive management/decision-making 55.556 21.43 -13.03 NA NA -26.60 NA NA NA NA NA 19.8Consensus/delegation-based management/decision-making 0 21.43 NA NA NA NA NA NA NA NA NA 0.0Decision-making under uncertainty 0 21.43 NA NA NA NA NA NA NA NA NA 0.0Follow ing orders and standard operational procedures (SOPs) at all times 33.333 21.43 NA NA NA -15.96 NA NA NA NA NA 16.0Not follow ing SOPs w hen circumstances merit 0 21.43 NA NA NA NA NA NA NA NA NA 0.0Recognising mistakes and correcting them 11.111 21.43 3.73 -2.24 NA 3.01 NA NA NA NA NA 3.0Develop new ideas, new concepts 0 28.57 NA NA NA NA NA NA NA NA NA 0.0Design/implement new products or processes 0 28.57 NA NA NA NA NA NA NA NA NA 0.0Incorporate ideas developed elsew here into processes or products 0 28.57 NA NA NA NA NA NA NA NA NA 0.0Improve or revise designs, processes, process f low , correct failures occurring in the f ield 100 28.57 -25.46 67.83 -17.72 -48.89 NA NA NA NA 16.17 35.2Go against the consensus w hen necessary 0 28.57 NA NA NA NA NA NA NA NA NA 0.0Say w hat you mean, mean w hat you say 0 28.57 NA NA NA NA NA NA NA NA NA 0.0Convey meaning diplomatically (typically indirectly) 0 28.57 NA NA NA NA NA NA NA NA NA 0.0Communicate rapidly & accurately w ith colleagues, superiors & subordinates 0 28.57 NA NA NA NA NA NA NA NA NA 0.0Communicate about and discuss in-depth complex concepts 0 28.57 NA NA NA NA NA NA NA NA NA 0.0Interact w ith other team members on a frequent or continuous basis 0 28.57 NA NA NA NA NA NA NA NA NA 0.0Interact w ith other team members at key decision points 100 28.57 NA NA NA NA NA NA NA NA NA 0.0Share information w ith other team members w henever possible 0 28.57 NA NA NA NA NA NA NA NA NA 0.0Only share information on a need-to-know basis 0 28.57 NA NA NA NA NA NA NA NA NA 0.0Highly predictable activities and outcomes 0 14.29 NA NA NA NA NA NA NA NA NA 0.0Mostly predictable activities and outcomes 66.667 14.29 -0.31 16.56 4.85 -9.26 NA NA NA NA NA 7.7Highly predictable, except under certain relatively rare conditions 0 14.29 NA NA NA NA NA NA NA NA NA 0.0Highly UNpredictable activities and outcomes 0 14.29 NA NA NA NA NA NA NA NA NA 0.0Errors & failures must be dealt w ith quickly 0 14.29 NA NA NA NA NA NA NA NA NA 0.0Errors and failures require careful consideration prior to action 33.333 14.29 11.18 NA 2.43 9.04 NA NA NA NA NA 7.5Maintain individual situation aw areness at all times 0 0.00 NA NA NA NA NA NA NA NA NA 0.0Maintainshared situation aw areness at all times 0 0.00 NA NA NA NA NA NA NA NA NA 0.0No signif icant SA requirements (SA applies primarily to organised action teams) 0 0.00 NA NA NA NA NA NA NA NA NA 0.0
-9.7 23.7 -4.5 -22.1 1.4 1.5 0.4 1.0 4.6Overall discrepancy score->
22.3 100%
Creativity & innovation 35.2 28.57%
Individualism (IDV)
Power distance (PDI)
Cultural dimension score discrepancies
Overall team
cultural diversity (O
Cdiv)
Uncertainty avoidance diversity (UAIdiv)
Masculinity diversity (M
ASdiv)
Individualism diversity (IDVdiv)
Power distance diversity (PDIdiv)
Cultural diversity score discrepancies
Mean subfactor discrepancies (from
ideal)
Overall w
eighting of context to team (%
)
Strategic purpose(s)
TEAM CULTURAL DISCREPANCY TABLE (general purpose) … areas of weakness and strength
Relevance to team (allocate 100 points to
each section)
Uncertainty avoidance (UAI)
Masculinity (M
AS)
Situational awareness (SA)
Management & decision-making
Interaction (communication & co-
ordination) within the team
Handling uncertainty & dealing with failures
Task/mission factor discrepancy scores
7.14%
Contextual factor weighting (%
)
38.8
0.00%
24.1
0.0
0.0
15.3
21.43%
28.57%
14.29%
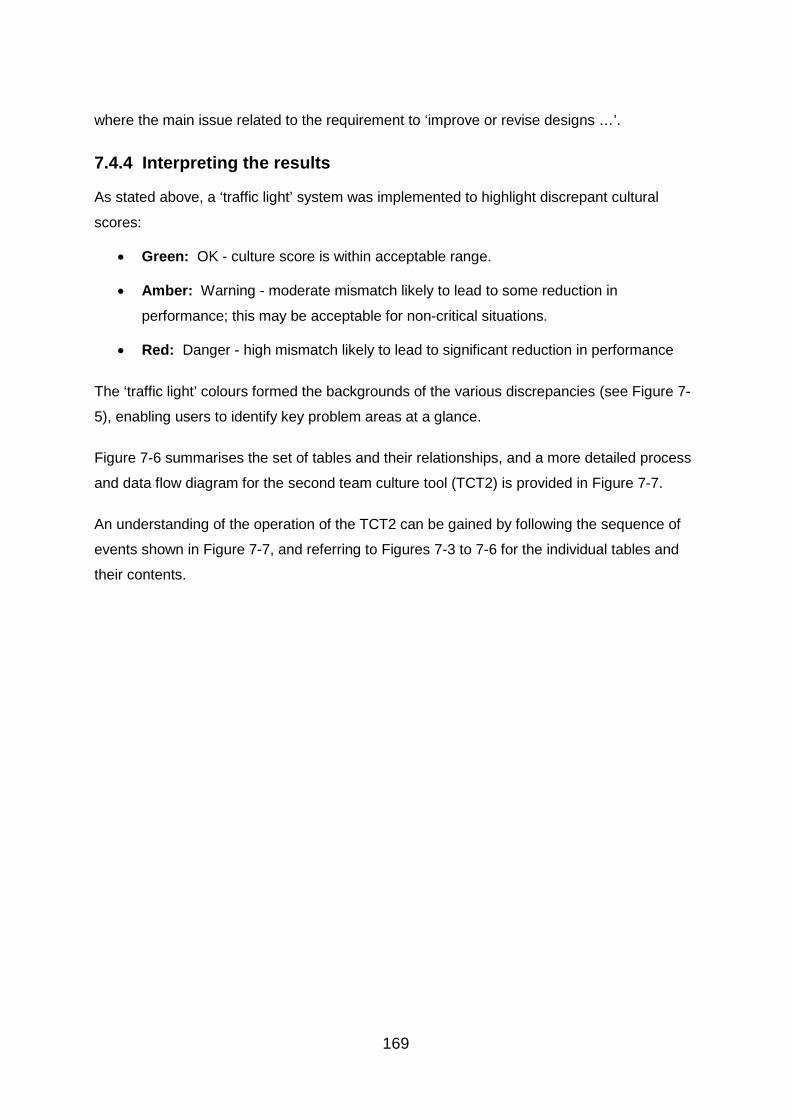
169
where the main issue related to the requirement to ‘improve or revise designs …’.
7.4.4 Interpreting the results
As stated above, a ‘traffic light’ system was implemented to highlight discrepant cultural
scores:
• Green: OK - culture score is within acceptable range.
• Amber: Warning - moderate mismatch likely to lead to some reduction in
performance; this may be acceptable for non-critical situations.
• Red: Danger - high mismatch likely to lead to significant reduction in performance
The ‘traffic light’ colours formed the backgrounds of the various discrepancies (see Figure 7-
5), enabling users to identify key problem areas at a glance.
Figure 7-6 summarises the set of tables and their relationships, and a more detailed process
and data flow diagram for the second team culture tool (TCT2) is provided in Figure 7-7.
An understanding of the operation of the TCT2 can be gained by following the sequence of
events shown in Figure 7-7, and referring to Figures 7-3 to 7-6 for the individual tables and
their contents.
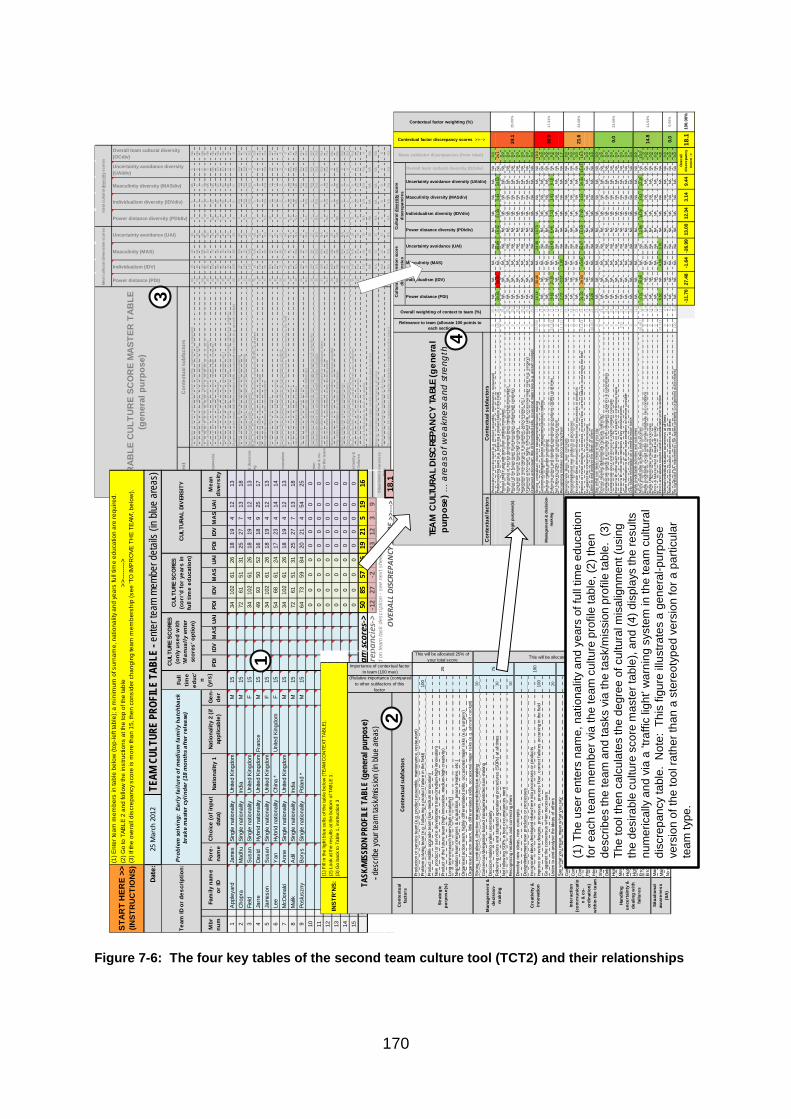
170
Figure 7-6: The four key tables of the second team culture tool (TCT2) and their relationships
Con
text
Con
text
ual s
ubfa
ctor
sPr
oduc
tion
or s
ervi
ce te
am (e
.g. p
rodu
ct a
ssem
bly,
mai
nten
ance
, res
taur
ant)
9035
4090
55
NA5
NAPr
oble
m s
olvi
ng te
am (e
.g. f
ollo
win
g a
prod
uct f
ailu
re in
the
field
)70
45NA
850
00
5NA
Prod
uct m
idlif
e up
grad
e te
am (l
ow-m
ediu
m in
nova
tion)
5560
NA65
00
00
NANe
w p
rodu
ct o
r ser
vice
dev
elop
men
t tea
m (m
ediu
m-h
igh
inno
vatio
n)30
8050
505
5NA
5NA
Prod
uct o
f the
futu
re te
am (h
igh
inno
vatio
n, m
ediu
m-h
igh
crea
tivity
)20
100
7045
NA20
NANA
NALo
ng-te
rm re
sear
ch te
am (h
igh
crea
tivity
)15
8065
2515
2520
20NA
Nego
tiatio
n te
am (m
erge
rs &
acq
uisi
tion,
pea
ce tr
eatie
s, e
tc.)
3560
3040
1020
1010
NAO
rgan
ised
act
ion
team
, hig
hly
diff
eren
tiate
d sk
ills, o
ccas
iona
l maj
or ri
sks
(e.g
. sur
gery
)35
9050
300
0NA
0NA
Org
anis
ed a
ctio
n te
am, l
ittle
diff
eren
tiate
d sk
ills, o
ccas
iona
l maj
or ri
sks
(e.g
. airc
raft
cock
pit)
2010
560
250
00
00
Stro
ng, c
entra
lised
, dire
ctiv
e m
anag
emen
t/dec
isio
n-m
akin
g75
30N
A80
0N
AN
AN
AN
ACo
nsen
sus/
dele
gatio
n-ba
sed
man
agem
ent/d
ecis
ion-
mak
ing
2511
035
20N
AN
AN
AN
A15
Deci
sion
-mak
ing
unde
r unc
erta
inty
2511
0N
A25
0N
AN
A0
NA
Follo
win
g or
ders
and
sta
ndar
d op
erat
iona
l pro
cedu
res
(SO
Ps) a
t all t
imes
7020
NA
800
00
0N
ANo
t fol
low
ing
SOPs
whe
n ci
rcum
stan
ces
mer
it25
110
NA
200
00
0N
ARe
cogn
isin
g m
ista
kes
and
corr
ectin
g th
em25
9040
NA
NA
NA
NA
NA
NA
Dev
elop
new
idea
s, ne
w co
ncep
ts30
NA
6525
1035
1520
NA
Des
ign/
impl
emen
t new
pro
duct
s or p
roce
sses
4010
065
450
2015
15N
AIn
corp
orat
e id
eas d
evel
oped
else
wher
e in
to p
roce
sses
or p
rodu
cts
5070
4055
00
00
0Im
prov
e or
revi
se d
esig
ns, p
roce
sses
, pro
cess
flow
, cor
rect
failu
res o
ccur
ring
in th
e fie
ld75
5070
800
00
00
Go a
gain
st th
e co
nsen
sus w
hen
nece
ssar
y30
110
70N
AN
AN
AN
AN
A10
List
en to
and
ana
lyse
the
idea
s of o
ther
s30
NA
NA
NA
NA
NANA
NANA
Say
what
you
mea
n, m
ean
what
you
say
2010
060
250
0N
AN
AN
ACo
nvey
mea
ning
dip
lom
atic
ally
(typ
ical
ly in
dire
ctly
)N
A20
15N
AN
AN
AN
AN
AN
ACo
mm
unic
ate
rapi
dly
& a
ccur
atel
y wi
th c
olle
ague
s, su
perio
rs &
subo
rdin
ates
2010
060
250
0N
AN
AN
ACo
mm
unic
ate
abou
t and
dis
cuss
in-d
epth
com
plex
con
cept
s30
NA
NA
NA
NA
NA
NA
NA
NA
Inte
ract
with
oth
er te
am m
embe
rs o
n a
freq
uent
or c
ontin
uous
bas
is25
100
NA
NA
00
0N
AN
AIn
tera
ct w
ith o
ther
team
mem
bers
at k
ey d
ecis
ion
poin
tsN
AN
AN
AN
AN
AN
AN
AN
AN
ASh
are
info
rmat
ion
with
oth
er te
am m
embe
rs w
hene
ver p
ossi
ble
2010
0NA
250
00
0NA
Onl
y sh
are
info
rmat
ion
on a
nee
d-to
-kno
w b
asis
NANA
NANA
NANA
NANA
NAH
ighl
y pr
edic
tabl
e ac
tiviti
es a
nd o
utco
mes
7030
NA
NA
00
00
NA
Mos
tly p
redi
ctab
le a
ctiv
ities
and
out
com
es50
60N
AN
A0
00
0N
AH
ighl
y pr
edic
tabl
e, e
xcep
t und
er c
erta
in re
lativ
ely
rare
con
ditio
ns30
110
NA
200
00
0N
AH
ighl
y U
Npr
edic
tabl
e ac
tiviti
es a
nd o
utco
mes
3011
0N
A20
1010
1010
NA
Erro
rs &
failu
res m
ust b
e de
alt w
ith q
uick
ly30
110
6030
NA
NA
NA
NA
0
Erro
rs a
nd fa
ilure
s req
uire
car
eful
con
sider
atio
n pr
ior t
o ac
tion
30NA
4525
NANA
NANA
NA
Mai
ntai
n in
divi
dual
situ
atio
n aw
aren
ess a
t all
times
NA
NA
6525
NA
NANA
NANA
Mai
ntai
nsha
red
situa
tion
awar
enes
s at a
ll tim
es20
100
3025
00
00
0
No
signi
fican
t SA
requ
irem
ents
(SA
app
lies p
rimar
ily to
org
anise
d ac
tion
team
s)N
AN
AN
AN
AN
AN
AN
AN
AN
A
Man
agem
ent &
dec
isio
n-m
akin
g
Crea
tivity
& in
nova
tion
Inte
ract
ion
(com
mun
icat
ion
& c
o-or
dina
tion)
with
in th
e te
am
Hand
ling
unce
rtai
nty
&
deal
ing
with
failu
res
Situ
atio
nal a
war
enes
s (S
A)
Stra
tegi
c pu
rpos
e(s)
Power distance (PDI)
Individualism (IDV)
Masculinity (MAS)
Uncertainty avoidance (UAI)
Power distance diversity (PDIdiv)
Individualism diversity (IDVdiv)
Masculinity diversity (MASdiv)
Uncertainty avoidance diversity (UAIdiv)
Overall team cultural diversity (OCdiv)
DES
IRA
BLE
CU
LTU
RE
SCO
RE
MA
STER
TA
BLE
(g
ener
al p
urpo
se)
Idea
l cul
tura
l dim
ensi
on s
core
sId
eal c
ultu
ral d
iver
sity
sco
res
(1) E
nter
team
mem
bers
in ta
ble
belo
w (t
op-le
ft ta
ble)
; a m
inim
um o
f sur
nam
e, n
atio
nalit
y an
d ye
ars
full
time
educ
atio
n ar
e re
quire
d.
11
App
leya
rdJa
mes
Sing
le n
atio
nality
Unite
d Ki
ngdo
mM
1534
102
6126
1819
412
132
1Ch
opra
Mad
huSi
ngle
nat
iona
lityIn
dia
M15
7261
5131
2527
713
183
1Fi
eld
Susa
nSi
ngle
nat
iona
lityUn
ited
King
dom
F15
3410
261
2618
194
1213
41
Jarr
eDa
vid
Hybr
id n
atio
nality
Unite
d Ki
ngdo
mFr
ance
M15
4993
5052
1618
925
175
1Ja
mes
onSu
san
Sing
le n
atio
nality
Unite
d Ki
ngdo
mF
1534
102
6126
1819
412
136
1Le
eY
anHy
brid
nat
iona
lityCh
ina
*Un
ited
King
dom
F15
5468
6124
1723
414
147
1M
cDon
ald
Ann
eSi
ngle
nat
iona
lityUn
ited
King
dom
M15
3410
261
2618
194
1213
81
Mal
ikA
dil
Sing
le n
atio
nality
Indi
aM
1572
6151
3125
277
1318
91
Posl
uszn
yBo
rys
Sing
le n
atio
nality
Pola
nd *
M15
6473
5984
2021
454
2510
00
00
00
00
00
110
00
00
00
00
012
00
00
00
00
00
130
00
00
00
00
014
00
00
00
00
00
150
00
00
00
00
09
<-N
o.of
mbr
s50
8557
3619
215
1916
-12
27-2
-27
1312
39
18.1
Date
:25
Mar
ch 2
012
TEAM
CUL
TURE
PRO
FILE
TAB
LE -
ente
r tea
m me
mber
det
ails (
in blu
e ar
eas)
Mbr
nu
mFa
mily
nam
e or
IDFo
re-
nam
eC
hoic
e (o
f inp
ut
data
)Na
tiona
lity
1Na
tiona
lity
2 (if
ap
plic
able
)G
en-
der
UAI
MA
SID
VPD
IID
VPD
IUA
IM
AS
IDV
PDI
MA
SM
ean
dive
rsity
UAI
(2) G
o to
TAB
LE 2
and
follo
w th
e in
stru
ctio
ns a
t the
top
of th
e ta
ble
>
>----
---->
Pro
blem
sol
ving
: Ea
rly
fail
ure
of m
ediu
m fa
mil
y ha
tchb
ack
brak
e m
aste
r cy
lind
er (1
8 m
onth
s af
ter
rele
ase)
CUL
TURE
SC
ORE
S (o
nly
used
with
'M
anua
lly
ente
r sc
ores
' opt
ion)
CUL
TURE
SC
ORE
S (c
orr'
d fo
r ye
ars
in
full
time
educ
atio
n)C
ULTU
RAL
DIV
ERSI
TYFu
ll tim
e ed
uc'
n (y
rs) Dis
crep
anci
es->
(bas
ed o
n te
am ta
sk d
escr
iptio
n - s
ee n
ext s
heet
)
OVE
RALL
DIS
CREP
ANCY
SCO
RE >
>--->
Igno
re a
ll th
ese
disc
repa
ncy
figur
es u
ntil
you
have
fille
d th
e te
am d
escr
iptio
n a
nd e
nviro
nmen
t in
usin
g th
e te
am c
onte
xt ta
ble
(Tab
le 2
, to
the
right
>>-
-->)
.
Team
scor
es->
Team
ID o
r de
scri
ptio
n:
STAR
T H
ERE
>>
(INST
RU
CTI
ON
S)(3
) If t
he o
vera
ll di
scre
panc
y sc
ore
is m
ore
than
15,
then
con
side
r cha
ngin
g te
am m
embe
rshi
p (s
ee 'T
O IM
PR
OVE
TH
E T
EAM
', be
low
).
(2) L
ook
at th
e re
sults
at t
he b
otto
m o
f TAB
LE 1
.
Prod
uctio
n or
ser
vice
team
(e.g
. pro
duct
ass
embl
y, m
aint
enan
ce, r
esta
uran
t)Pr
oble
m s
olvi
ng te
am (e
.g. f
ollo
win
g a
prod
uct f
ailu
re in
the
field
)10
0Pr
oduc
t mid
life
upgr
ade
team
(low
-med
ium
inno
vatio
n)Ne
w p
rodu
ct o
r ser
vice
dev
elop
men
t tea
m (m
ediu
m-h
igh
inno
vatio
n)Pr
oduc
t of t
he fu
ture
team
(hig
h in
nova
tion,
med
ium
-hig
h cr
eativ
ity)
Long
-term
rese
arch
team
(hig
h cr
eativ
ity)
Nego
tiatio
n te
am (m
erge
rs &
acq
uisi
tion,
pea
ce tr
eatie
s, e
tc.)
Org
anis
ed a
ctio
n te
am, h
ighl
y di
ffer
entia
ted
skills
, occ
asio
nal m
ajor
risk
s (e
.g. s
urge
ry)
Org
anis
ed a
ctio
n te
am, l
ittle
diff
eren
tiate
d sk
ills, o
ccas
iona
l maj
or ri
sks
(e.g
. airc
raft
cock
pit)
Stro
ng, c
entra
lised
, dire
ctiv
e m
anag
emen
t/dec
isio
n-m
akin
g50
Cons
ensu
s/de
lega
tion-
base
d m
anag
emen
t/dec
isio
n-m
akin
gDe
cisi
on-m
akin
g un
der u
ncer
tain
tyFo
llow
ing
orde
rs a
nd s
tand
ard
oper
atio
nal p
roce
dure
s (S
OPs
) at a
ll tim
es30
Not f
ollo
win
g SO
Ps w
hen
circ
umst
ance
s m
erit
Reco
gnis
ing
mis
take
s an
d co
rrec
ting
them
10De
velo
p ne
w id
eas,
new
con
cept
sDe
sign
/impl
emen
t new
pro
duct
s or
pro
cess
esIn
corp
orat
e id
eas
deve
lope
d el
sew
here
into
pro
cess
es o
r pro
duct
sIm
prov
e or
revi
se d
esig
ns, p
roce
sses
, pro
cess
flow
, cor
rect
failu
res
occu
rrin
g in
the
field
100
Go
agai
nst t
he c
onse
nsus
whe
n ne
cess
ary
List
en to
and
ana
lyse
the
idea
s of
oth
ers
20Sa
y w
hat y
ou m
ean,
mea
n w
hat y
ou s
ayCo
nvey
mea
ning
dip
lom
atic
ally
(typ
ical
ly in
dire
ctly
)Co
mm
unic
ate
rapi
dly
& ac
cura
tely
with
col
leag
ues,
sup
erio
rs &
sub
ordi
nate
sCo
mm
unic
ate
abou
t and
dis
cuss
in-d
epth
com
plex
con
cept
sIn
tera
ct w
ith o
ther
team
mem
bers
on
a fr
eque
nt o
r con
tinuo
us b
asis
Inte
ract
with
oth
er te
am m
embe
rs a
t key
dec
isio
n po
ints
100
Shar
e in
form
atio
n w
ith o
ther
team
mem
bers
whe
neve
r pos
sibl
eO
nly
shar
e in
form
atio
n on
a n
eed-
to-k
now
bas
isHi
ghly
pre
dict
able
act
ivitie
s an
d ou
tcom
esM
ostly
pre
dict
able
act
ivitie
s an
d ou
tcom
es10
0Hi
ghly
pre
dict
able
, exc
ept u
nder
cer
tain
rela
tivel
y ra
re c
ondi
tions
High
ly U
Npre
dict
able
act
ivitie
s an
d ou
tcom
esEr
rors
& fa
ilure
s m
ust b
e de
alt w
ith q
uick
lyEr
rors
and
failu
res
requ
ire c
aref
ul c
onsi
dera
tion
prio
r to
actio
n50
Mai
ntai
n in
divi
dual
situ
atio
n aw
aren
ess
at a
ll tim
esM
aint
ains
hare
d si
tuat
ion
awar
enes
s at
all t
imes
No s
igni
fican
t SA
requ
irem
ents
(SA
app
lies
prim
arily
to o
rgan
ised
act
ion
team
s)10
0
Man
agem
ent &
de
cisi
on-
mak
ing
75
Inte
ract
ion
(com
mun
icat
ion
& c
o-or
dina
tion)
w
ithin
the
team
100
Hand
ling
unce
rtai
nty
&
deal
ing
with
fa
ilure
s
50
Situ
atio
nal
awar
enes
s (S
A)
Cre
ativ
ity &
in
nova
tion
100
Con
text
ual
fact
ors
Cont
extu
al su
bfac
tors
TASK
/MIS
SION
PRO
FILE
TAB
LE (g
ener
al p
urpo
se)
- des
cribe
your
team
task
/miss
ion (i
n blu
e ar
eas)
This will be allocated 25% of your total score This will be allocated 75% of your total score
Stra
tegi
c pu
rpos
e(s)
25
(Relative importance (compared to other subfactors of this
factor
Importance of contextual factor to team (100 max)
INST
R'N
S:
(1) F
ill in
the
light
blu
e ce
lls o
f the
tabl
e be
low
(TE
AM C
ON
TEXT
TAB
LE).
(3) G
o ba
ck to
Tab
le 1
, ins
truct
ion
3
2
1
3
Con
text
ual f
acto
rsC
onte
xtua
l sub
fact
ors
Prod
uctio
n or
ser
vice
team
(e.g
. pro
duct
ass
embl
y, m
aint
enan
ce, r
esta
uran
t)0
25.0
NANA
NANA
NANA
NANA
NA0.
0Pr
oble
m s
olvi
ng te
am (e
.g. f
ollo
win
g a
prod
uct f
ailu
re in
the
field
)10
025
.0-2
0.46
39.8
3NA
-48.
8919
.32
21.3
95.
4413
.53
NA24
.1Pr
oduc
t mid
life
upgr
ade
team
(low
-med
ium
inno
vatio
n)0
25.0
NANA
NANA
NANA
NANA
NA0.
0Ne
w p
rodu
ct o
r ser
vice
dev
elop
men
t tea
m (m
ediu
m-h
igh
inno
vatio
n)0
25.0
NANA
NANA
NANA
NANA
NA0.
0Pr
oduc
t of t
he fu
ture
team
(hig
h in
nova
tion,
med
ium
-hig
h cr
eativ
ity)
025
.0NA
NANA
NANA
NANA
NANA
0.0
Long
-term
rese
arch
team
(hig
h cr
eativ
ity)
025
.0NA
NANA
NANA
NANA
NANA
0.0
Nego
tiatio
n te
am (m
erge
rs &
acq
uisi
tion,
pea
ce tr
eatie
s, e
tc.)
025
.0NA
NANA
NANA
NANA
NANA
0.0
Org
anis
ed a
ctio
n te
am, h
ighl
y di
ffer
entia
ted
skills
, occ
asio
nal m
ajor
risk
s (e
.g. s
urge
ry)
025
.0NA
NANA
NANA
NANA
NANA
0.0
Org
anis
ed a
ctio
n te
am, l
ittle
diff
eren
tiate
d sk
ills, o
ccas
iona
l maj
or ri
sks
(e.g
. airc
raft
cock
pit)
025
.0NA
NANA
NANA
NANA
NANA
0.0
Stro
ng, c
entra
lised
, dire
ctiv
e m
anag
emen
t/dec
isio
n-m
akin
g55
.556
17.3
-14.
1430
.46
NA-2
4.38
10.7
3NA
NANA
NA19
.9Co
nsen
sus/
dele
gatio
n-ba
sed
man
agem
ent/d
ecis
ion-
mak
ing
017
.3NA
NANA
NANA
NANA
NANA
0.0
Deci
sion
-mak
ing
unde
r unc
erta
inty
017
.3NA
NANA
NANA
NANA
NANA
0.0
Follo
win
g or
ders
and
sta
ndar
d op
erat
iona
l pro
cedu
res
(SO
Ps) a
t all t
imes
33.3
3317
.3-6
.82
21.6
1NA
-14.
636.
447.
131.
816.
18NA
9.2
Not f
ollo
win
g SO
Ps w
hen
circ
umst
ance
s m
erit
017
.3NA
NANA
NANA
NANA
NANA
0.0
Reco
gnis
ing
mis
take
s an
d co
rrec
ting
them
11.1
1117
.32.
73-0
.57
1.92
NANA
NANA
NANA
1.7
Deve
lop
new
idea
s, n
ew c
once
pts
023
.1NA
NANA
NANA
NANA
NANA
0.0
Desi
gn/im
plem
ent n
ew p
rodu
cts
or p
roce
sses
023
.1NA
NANA
NANA
NANA
NANA
0.0
Inco
rpor
ate
idea
s de
velo
ped
else
whe
re in
to p
roce
sses
or p
rodu
cts
023
.1NA
NANA
NANA
NANA
NANA
0.0
Impr
ove
or re
vise
des
igns
, pro
cess
es, p
roce
ss fl
ow, c
orre
ct fa
ilure
s oc
curr
ing
in th
e fie
ld83
.333
23.1
-21.
2229
.03
-10.
60-3
6.57
16.1
017
.82
4.54
15.4
413
.47
18.3
Go
agai
nst t
he c
onse
nsus
whe
n ne
cess
ary
023
.1NA
NANA
NANA
NANA
NANA
0.0
List
en to
and
ana
lyse
the
idea
s of
oth
ers
16.6
6723
.13.
26NA
NANA
NANA
NANA
NA3.
3Sa
y w
hat y
ou m
ean,
mea
n w
hat y
ou s
ay0
23.1
NANA
NANA
NANA
NANA
NA0.
0Co
nvey
mea
ning
dip
lom
atic
ally
(typ
ical
ly in
dire
ctly
)0
23.1
NANA
NANA
NANA
NANA
NA0.
0Co
mm
unic
ate
rapi
dly
& ac
cura
tely
with
col
leag
ues,
sup
erio
rs &
sub
ordi
nate
s0
23.1
NANA
NANA
NANA
NANA
NA0.
0Co
mm
unic
ate
abou
t and
dis
cuss
in-d
epth
com
plex
con
cept
s0
23.1
NANA
NANA
NANA
NANA
NA0.
0In
tera
ct w
ith o
ther
team
mem
bers
on
a fr
eque
nt o
r con
tinuo
us b
asis
023
.1NA
NANA
NANA
NANA
NANA
0.0
Inte
ract
with
oth
er te
am m
embe
rs a
t key
dec
isio
n po
ints
100
23.1
NANA
NANA
NANA
NANA
NA0.
0Sh
are
info
rmat
ion
with
oth
er te
am m
embe
rs w
hene
ver p
ossi
ble
023
.1NA
NANA
NANA
NANA
NANA
0.0
Onl
y sh
are
info
rmat
ion
on a
nee
d-to
-kno
w b
asis
023
.1NA
NANA
NANA
NANA
NANA
0.0
High
ly p
redi
ctab
le a
ctiv
ities
and
outc
omes
011
.5NA
NANA
NANA
NANA
NANA
0.0
Mos
tly p
redi
ctab
le a
ctiv
ities
and
outc
omes
66.6
6711
.5-0
.31
16.5
6NA
NA12
.88
14.2
63.
6312
.35
NA10
.0Hi
ghly
pre
dict
able
, exc
ept u
nder
cer
tain
rela
tivel
y ra
re c
ondi
tions
011
.5NA
NANA
NANA
NANA
NANA
0.0
High
ly U
Npre
dict
able
act
ivitie
s an
d ou
tcom
es0
11.5
NANA
NANA
NANA
NANA
NA0.
0Er
rors
& fa
ilure
s m
ust b
e de
alt w
ith q
uick
ly0
11.5
NANA
NANA
NANA
NANA
NA0.
0Er
rors
and
failu
res
requ
ire c
aref
ul c
onsi
dera
tion
prio
r to
actio
n33
.333
11.5
6.51
NA4.
093.
70NA
NANA
NANA
4.8
Mai
ntai
n in
divi
dual
situ
atio
n aw
aren
ess
at a
ll tim
es0
0.0
NANA
NANA
NANA
NANA
NA0.
0M
aint
ains
hare
d si
tuat
ion
awar
enes
s at
all t
imes
00.
0NA
NANA
NANA
NANA
NANA
0.0
No s
igni
fican
t SA
requ
irem
ents
(SA
app
lies
prim
arily
to o
rgan
ised
act
ion
team
s)10
00.
0NA
NANA
NANA
NANA
NANA
0.0
-11.
7027
.48
-1.6
4-2
6.99
13.0
012
.34
3.14
9.44
18.1
100.
00%
21.6
0.0
14.8
17.3
1%
23.0
8%
23.0
8%
11.5
4%
Contextual factor discrepancy scores >>-->
25.0
0%Contextual factor weighting (%)
30.9
0.00
%
24.1
0.0
Ove
rall
disc
repa
ncy
scor
e ->
TEA
M C
ULTU
RAL
DISC
REPA
NC
Y TA
BLE
(gen
eral
pu
rpos
e) …
are
as o
f wea
knes
s and
stre
ngth
Relevance to team (allocate 100 points to each section)
Uncertainty avoidance (UAI)
Masculinity (MAS)
Overall weighting of context to team (%)
Stra
tegi
c pu
rpos
e(s)
Situ
atio
nal a
war
enes
s (S
A)
Man
agem
ent &
dec
isio
n-m
akin
g
Crea
tivity
& in
nova
tion
Inte
ract
ion
(com
mun
icat
ion
& c
o-or
dina
tion)
with
in th
e te
am
Hand
ling
unce
rtai
nty
&
deal
ing
with
failu
res
Individualism (IDV)
Power distance (PDI)Cultu
ral d
imen
sion
sco
re
disc
repa
ncie
s
Overall team cultural diversity (OCdiv)
Uncertainty avoidance diversity (UAIdiv)
Masculinity diversity (MASdiv)
Individualism diversity (IDVdiv)
Power distance diversity (PDIdiv)Cultu
ral d
iver
sity
sco
re
disc
repa
ncie
s
Mean subfactor discrepancies (from ideal)
(1) T
he u
ser e
nter
s na
me,
nat
iona
lity
and
year
s of
full
time
educ
atio
n fo
r eac
h te
am m
embe
r via
the
team
cul
ture
pro
file
tabl
e, (2
) the
n de
scrib
es th
e te
am a
nd ta
sks
via
the
task
/mis
sion
pro
file
tabl
e. (
3)
The
tool
then
cal
cula
tes
the
degr
ee o
f cul
tura
l mis
alig
nmen
t (us
ing
the
desi
rabl
e cu
lture
sco
re m
aste
r tab
le),
and
(4) d
ispl
ays
the
resu
lts
num
eric
ally
and
via
a ’t
raffi
c lig
ht’ w
arni
ng s
yste
m in
the
team
cul
tura
l di
scre
panc
y ta
ble.
Not
e: T
his
figur
e ill
ustra
tes
a ge
nera
l-pur
pose
ve
rsio
n of
the
tool
rath
er th
an a
ste
reot
yped
ver
sion
for a
par
ticul
ar
team
type
.
4
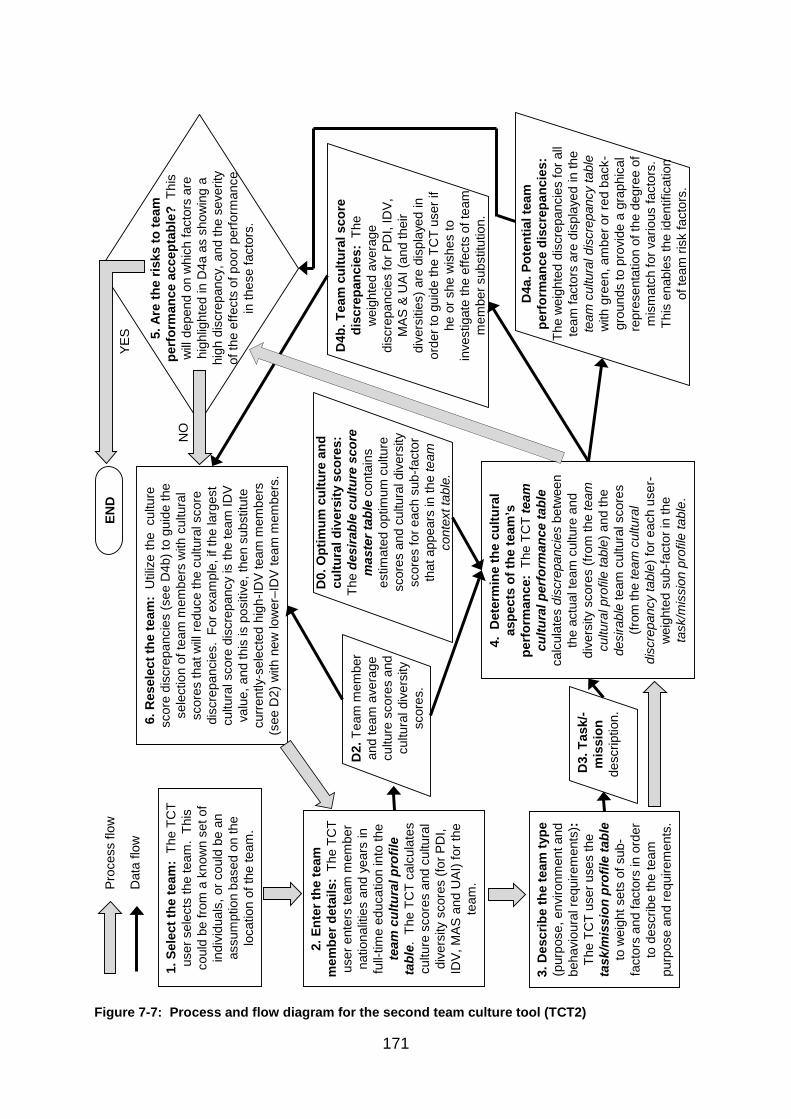
171
Figure 7-7: Process and flow diagram for the second team culture tool (TCT2)
1. S
elec
t the
team
: Th
e TC
T us
er s
elec
ts th
e te
am.
This
co
uld
be fr
om a
kno
wn
set o
f in
divi
dual
s, o
r cou
ld b
e an
as
sum
ptio
n ba
sed
on th
e lo
catio
n of
the
team
.
3. D
escr
ibe
the
team
type
(p
urpo
se, e
nviro
nmen
t and
be
havi
oura
l req
uire
men
ts):
The
TCT
user
use
s th
e ta
sk/m
issi
on p
rofil
e ta
ble
to w
eigh
t set
s of
sub
-fa
ctor
s an
d fa
ctor
s in
ord
er
to d
escr
ibe
the
team
pu
rpos
e an
d re
quire
men
ts.
4. D
eter
min
e th
e cu
ltura
l as
pect
s of
the
team
’s
perf
orm
ance
: Th
e TC
T te
am
cultu
ral p
erfo
rman
ce ta
ble
calc
ulat
es d
iscr
epan
cies
betw
een
th
e ac
tual
team
cul
ture
and
di
vers
ity s
core
s (fr
om th
e te
am
cultu
ral p
rofil
e ta
ble)
and
the
desi
rabl
ete
am c
ultu
ral s
core
s (fr
om th
e te
am c
ultu
ral
disc
repa
ncy
tabl
e) fo
r eac
h us
er-
wei
ghte
d su
b-fa
ctor
in th
e ta
sk/m
issi
on p
rofil
e ta
ble.
D4b
. Tea
m c
ultu
ral s
core
di
scre
panc
ies:
The
w
eigh
ted
aver
age
disc
repa
ncie
s fo
r PD
I, ID
V,
MAS
& U
AI (a
nd th
eir
dive
rsiti
es) a
re d
ispl
ayed
in
orde
r to
guid
e th
e TC
T us
er if
he
or s
he w
ishe
s to
in
vest
igat
e th
e ef
fect
s of
team
m
embe
r sub
stitu
tion.
2. E
nter
the
team
m
embe
r det
ails
: Th
e TC
T us
er e
nter
s te
am m
embe
r na
tiona
litie
s an
d ye
ars
in
full-
time
educ
atio
n in
to th
e te
am c
ultu
ral p
rofil
e ta
ble.
The
TC
T ca
lcul
ates
cu
lture
sco
res
and
cultu
ral
dive
rsity
sco
res
(for P
DI,
IDV,
MAS
and
UAI
) for
the
team
.
5. A
re th
e ris
ks to
team
pe
rfor
man
ce a
ccep
tabl
e? T
his
will
depe
nd o
n w
hich
fact
ors
are
high
light
ed in
D4a
as
show
ing
a hi
gh d
iscr
epan
cy, a
nd th
e se
verit
y of
the
effe
cts
of p
oor p
erfo
rman
ce
in th
ese
fact
ors.
END
6. R
esel
ect t
he te
am:
Util
ize
the
cul
ture
sc
ore
disc
repa
ncie
s (s
ee D
4b) t
o gu
ide
the
sele
ctio
n of
team
mem
bers
with
cul
tura
l sc
ores
that
will
redu
ce th
e cu
ltura
l sco
re
disc
repa
ncie
s. F
or e
xam
ple,
if th
e la
rges
t cu
ltura
l sco
re d
iscr
epan
cy is
the
team
IDV
valu
e, a
nd th
is is
pos
itive
, the
n su
bstit
ute
curr
ently
-sel
ecte
d hi
gh-ID
V te
am m
embe
rs
(see
D2)
with
new
low
er–I
DV
team
mem
bers
.
D0.
Opt
imum
cul
ture
and
cu
ltura
l div
ersi
ty s
core
s:
The
desi
rabl
e cu
lture
sco
re
mas
ter t
able
con
tain
s es
timat
ed o
ptim
um c
ultu
re
scor
es a
nd c
ultu
ral d
iver
sity
sc
ores
for e
ach
sub-
fact
or
that
app
ears
in th
e te
am
cont
ext t
able
.
D2.
Team
mem
ber
and
team
ave
rage
cu
lture
sco
res
and
cultu
ral d
iver
sity
sc
ores
.
D3.
Tas
k/-
mis
sion
desc
riptio
n.
D4a
. Pot
entia
l tea
m
perf
orm
ance
dis
crep
anci
es:
The
wei
ghte
d di
scre
panc
ies
for a
ll te
am fa
ctor
s ar
e di
spla
yed
in th
e te
am c
ultu
ral d
iscr
epan
cy ta
ble
with
gre
en, a
mbe
r or r
ed b
ack-
grou
nds
to p
rovi
de a
gra
phic
al
repr
esen
tatio
n of
the
degr
ee o
f m
ism
atch
for v
ario
us fa
ctor
s.
Th
is e
nabl
es th
e id
entif
icat
ion
of te
am ri
sk fa
ctor
s.
NO
Proc
ess
flow
Dat
a flo
wYE
S
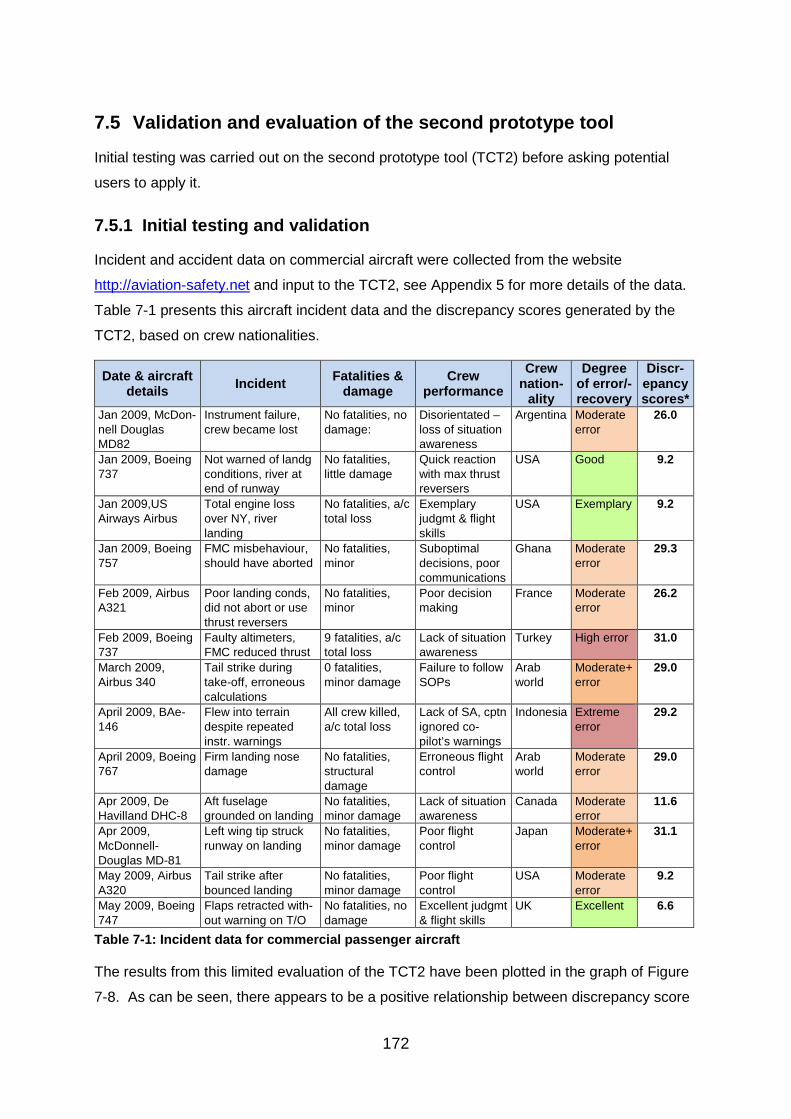
172
7.5 Validation and evaluation of the second prototype tool
Initial testing was carried out on the second prototype tool (TCT2) before asking potential
users to apply it.
7.5.1 Initial testing and validation
Incident and accident data on commercial aircraft were collected from the website
http://aviation-safety.net and input to the TCT2, see Appendix 5 for more details of the data.
Table 7-1 presents this aircraft incident data and the discrepancy scores generated by the
TCT2, based on crew nationalities.
Date & aircraft details Incident Fatalities &
damage Crew
performance Crew
nation-ality
Degree of error/-recovery
Discr-epancy scores*
Jan 2009, McDon-nell Douglas MD82
Instrument failure, crew became lost
No fatalities, no damage:
Disorientated – loss of situation awareness
Argentina Moderate error
26.0
Jan 2009, Boeing 737
Not warned of landg conditions, river at end of runway
No fatalities, little damage
Quick reaction with max thrust reversers
USA Good 9.2
Jan 2009,US Airways Airbus
Total engine loss over NY, river landing
No fatalities, a/c total loss
Exemplary judgmt & flight skills
USA Exemplary 9.2
Jan 2009, Boeing 757
FMC misbehaviour, should have aborted
No fatalities, minor
Suboptimal decisions, poor communications
Ghana Moderate error
29.3
Feb 2009, Airbus A321
Poor landing conds, did not abort or use thrust reversers
No fatalities, minor
Poor decision making
France Moderate error
26.2
Feb 2009, Boeing 737
Faulty altimeters, FMC reduced thrust
9 fatalities, a/c total loss
Lack of situation awareness
Turkey High error 31.0
March 2009, Airbus 340
Tail strike during take-off, erroneous calculations
0 fatalities, minor damage
Failure to follow SOPs
Arab world
Moderate+ error
29.0
April 2009, BAe-146
Flew into terrain despite repeated instr. warnings
All crew killed, a/c total loss
Lack of SA, cptn ignored co-pilot’s warnings
Indonesia Extreme error
29.2
April 2009, Boeing 767
Firm landing nose damage
No fatalities, structural damage
Erroneous flight control
Arab world
Moderate error
29.0
Apr 2009, De Havilland DHC-8
Aft fuselage grounded on landing
No fatalities, minor damage
Lack of situation awareness
Canada Moderate error
11.6
Apr 2009, McDonnell-Douglas MD-81
Left wing tip struck runway on landing
No fatalities, minor damage
Poor flight control
Japan Moderate+ error
31.1
May 2009, Airbus A320
Tail strike after bounced landing
No fatalities, minor damage
Poor flight control
USA Moderate error
9.2
May 2009, Boeing 747
Flaps retracted with-out warning on T/O
No fatalities, no damage
Excellent judgmt & flight skills
UK Excellent 6.6
Table 7-1: Incident data for commercial passenger aircraft
The results from this limited evaluation of the TCT2 have been plotted in the graph of Figure
7-8. As can be seen, there appears to be a positive relationship between discrepancy score
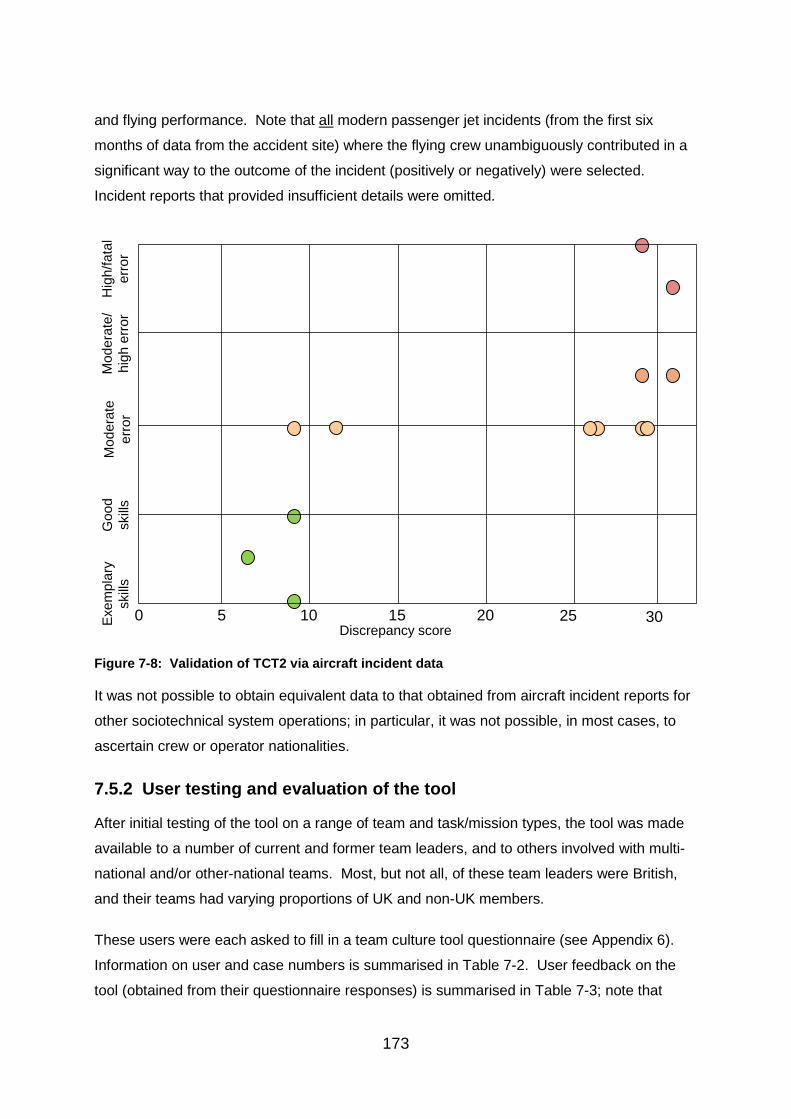
173
and flying performance. Note that all modern passenger jet incidents (from the first six
months of data from the accident site) where the flying crew unambiguously contributed in a
significant way to the outcome of the incident (positively or negatively) were selected.
Incident reports that provided insufficient details were omitted.
Figure 7-8: Validation of TCT2 via aircraft incident data
It was not possible to obtain equivalent data to that obtained from aircraft incident reports for
other sociotechnical system operations; in particular, it was not possible, in most cases, to
ascertain crew or operator nationalities.
7.5.2 User testing and evaluation of the tool
After initial testing of the tool on a range of team and task/mission types, the tool was made
available to a number of current and former team leaders, and to others involved with multi-
national and/or other-national teams. Most, but not all, of these team leaders were British,
and their teams had varying proportions of UK and non-UK members.
These users were each asked to fill in a team culture tool questionnaire (see Appendix 6).
Information on user and case numbers is summarised in Table 7-2. User feedback on the
tool (obtained from their questionnaire responses) is summarised in Table 7-3; note that
Exe
mpl
ary
skill
sM
oder
ate
erro
rM
oder
ate/
high
err
orH
igh/
fata
l er
ror
Goo
d sk
ills
Discrepancy score1510 2050 25 30
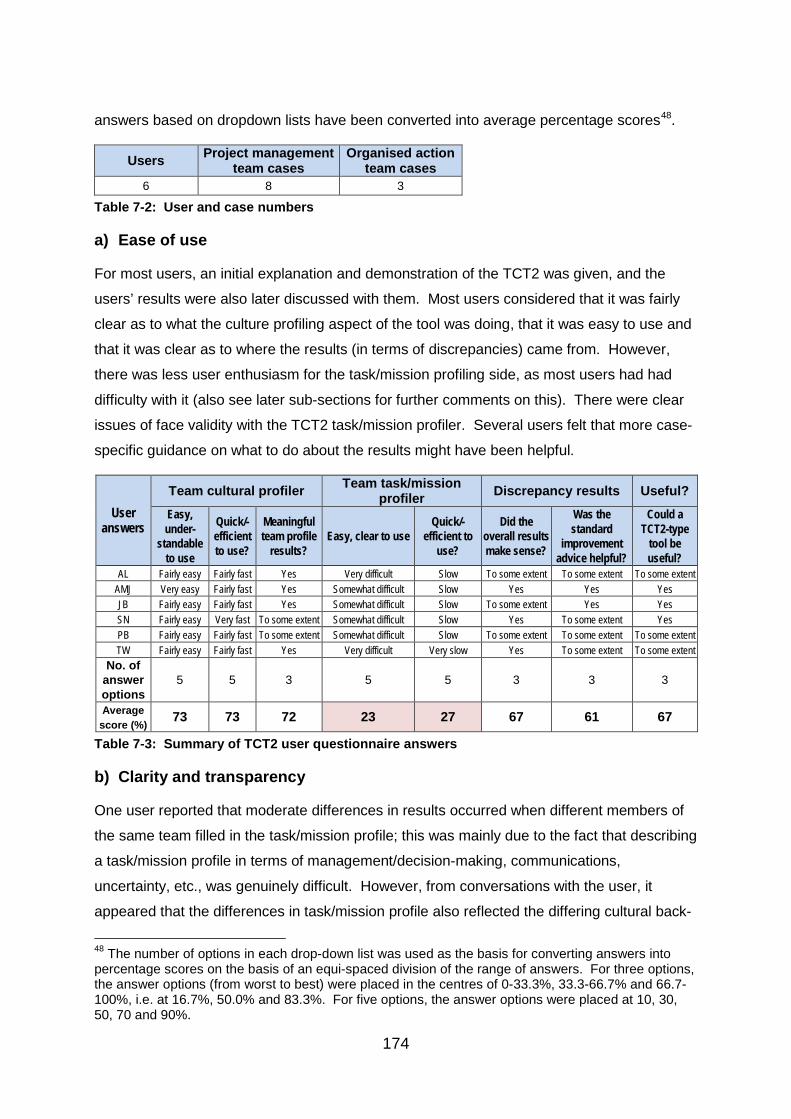
174
answers based on dropdown lists have been converted into average percentage scores48.
Users Project management team cases
Organised action team cases
6 8 3
Table 7-2: User and case numbers
a) Ease of use
For most users, an initial explanation and demonstration of the TCT2 was given, and the
users’ results were also later discussed with them. Most users considered that it was fairly
clear as to what the culture profiling aspect of the tool was doing, that it was easy to use and
that it was clear as to where the results (in terms of discrepancies) came from. However,
there was less user enthusiasm for the task/mission profiling side, as most users had had
difficulty with it (also see later sub-sections for further comments on this). There were clear
issues of face validity with the TCT2 task/mission profiler. Several users felt that more case-
specific guidance on what to do about the results might have been helpful.
User answers
Team cultural profiler Team task/mission profiler Discrepancy results Useful?
Easy, under-
standable to use
Quick/-efficient to use?
Meaningful team profile
results? Easy, clear to use
Quick/-efficient to
use?
Did the overall results make sense?
Was the standard
improvement advice helpful?
Could a TCT2-type
tool be useful?
AL Fairly easy Fairly fast Yes Very difficult Slow To some extent To some extent To some extent AMJ Very easy Fairly fast Yes Somewhat difficult Slow Yes Yes Yes JB Fairly easy Fairly fast Yes Somewhat difficult Slow To some extent Yes Yes SN Fairly easy Very fast To some extent Somewhat difficult Slow Yes To some extent Yes PB Fairly easy Fairly fast To some extent Somewhat difficult Slow To some extent To some extent To some extent TW Fairly easy Fairly fast Yes Very difficult Very slow Yes To some extent To some extent
No. of answer options
5 5 3 5 5 3 3 3
Average score (%) 73 73 72 23 27 67 61 67
Table 7-3: Summary of TCT2 user questionnaire answers
b) Clarity and transparency
One user reported that moderate differences in results occurred when different members of
the same team filled in the task/mission profile; this was mainly due to the fact that describing
a task/mission profile in terms of management/decision-making, communications,
uncertainty, etc., was genuinely difficult. However, from conversations with the user, it
appeared that the differences in task/mission profile also reflected the differing cultural back-
48 The number of options in each drop-down list was used as the basis for converting answers into percentage scores on the basis of an equi-spaced division of the range of answers. For three options, the answer options (from worst to best) were placed in the centres of 0-33.3%, 33.3-66.7% and 66.7-100%, i.e. at 16.7%, 50.0% and 83.3%. For five options, the answer options were placed at 10, 30, 50, 70 and 90%.
175
ground of one of the team members who entered the data into the TCT2.
c) Flexibility and adaptability
One user commented that the task/mission profiling weighting process imposed constraints
that prevented him from adequately describing his team.
One user commented positively on the ability to select dual cultural nationality or to enter
(directly), as he felt that some team members were ‘in-between’ or just different to others,
e.g. in terms of power distance or uncertainty avoidance49.
d) Errors and accuracy
There was a spread of opinion from non-committal to enthusiastic, but most felt that the tool
would be an adjunct to the team-picking process, rather than the basis of it, and that
accuracy was not a particular issue. However one user felt that it was easy to misinterpret
the intention or meaning of the task/mission sub-factors and enter an erroneous task
weighting.
There were some issues with regard to the mapping methodology. As the task profile was
created by weighting a completely standard profile, the team profile always showed some
degree of discrepancy with that standard profile, i.e. there could be no ideal cultural profile
for any given task/mission; it was the weighting process that selectively reduced the
discrepancies in unimportant areas. However, this also probably reflected the fact that any
task-set or mission requires different behaviours at different times, for example closely
adhering to standard operational procedures then abandoning them in some types of
emergency.
e) Other user-raised points
Political correctness and stereotyping: A user raised the issue of political correctness
with regard to the use of nationality-based culture scores.
Clearly, the tool used a process of stereotyping as, in many cases, there would be no other
information available. However, it would be unreasonable to use the tool directly as a basis
for the inclusion or exclusion of specific individuals because such individuals should be
personally assessed by their managers, as colleagues, rather than being assessed as
cultural stereotypes.
49 He and another user expressed particular interest in the cultural framework, as they felt that it offered an explanation for some of the issues they had previously contended with.
176
Trying to obtain the optimum team values: Several users entered a range of (hypo-
thetical) teams into the TCT2 in order to gain an understanding of how it worked. One such
user, in particular, complained that it was not possible to get an ideal (zero discrepancy)
score, as there was always at least one sub-factor that would be showing discrepancies.
Such residual discrepancies occurred because different aspects of tasks or missions were
associated with different culture scores.
Using the TCT2 as an adjunct to other tools: Another user suggested that the tool would
have to fit in with Belbin-type tools (R Meredith Belbin, 2004, 2010) in order to be accepted.
The tool has already been used at Loughborough University as part of a wider systems
engineering toolset.
Variable behaviours by team members: A user commented that he occasionally noticed
changes in the behaviours of individual non-UK team members, depending on the
composition of the rest of the team. In particular, he noticed that a particular team member
would contribute less when one or more other members of his nationality joined the team.
He suggested that the TCT2 would not account for this.
This change in behaviour may have been an example of conformity bias (firstly to the wider
team culture, then to the team member’s own culture), and the TCT2 would not directly
account for this.
The task-culture link: Several users commented about cultural aspects, but two users in
particular made some particularly interesting comments. The first of these was a pilot, not the
same pilot with whom this researcher had an unstructured interview (see Subsection 5.2.1);
the pilot’s comments have been reproduced below:
“The culture elements explained a great deal - we're very aware of the problems of
culture in the industry but mainly concentrate on the power gradient. Discussions with
crews on the effects of culture (maybe demonstrating with a tool like this) might be
valuable - if politically fraught. Some pilots seem to be internationalized so that their
own culture is less obvious, but most seem to be at times like the stereotypes in this
tool. I may be missing the point in some way but I have noticed that these cultural
differences aren't there all the time. Sometimes I suddenly notice the guy is acting
differently, he is agitated or not communicating anymore – it’s like he's switched some
part of his culture on.”
There were two parts of this comment that were of particular interest; the first was:
177
“Some pilots seem to be internationalized so that their own culture is less obvious.”
This was perhaps just a reflection of the international jet-setting community (literally), where
long, perhaps permanent absence from one’s home led to the development of a hybrid
culture. The second part was:
“I may be missing the point in some way but I have noticed that these cultural
differences aren't obvious all the time. Sometimes I suddenly notice the guy is acting
differently, he is agitated or not communicating anymore – it’s like he's switched his
culture on.”
This was of particular interest because it implied the turning on and off of cultural traits. It
appeared that, when the situation (or context) changed, a ‘dormant’ or background cultural
trait was ‘switched on’.
The second of the two users was a project manager who worked with both academia and
industry; his comments have been reproduced below:
“I'm not convinced about the way the task profile works. For instance, I have to deal
with industrial engineers and academics of several nationalities. The tasks or
missions they carry out may be the same in many ways if they collaborate on a
project, but their environments are different and the way they actually respond and
carry out the work is different. When one of my experienced academic colleagues
works at the industrial partner's premises, his behaviour is different from when at
university - and so is mine - I wear my industrial hat!”
This seemed to support the second part of the earlier comment, i.e. that specific (pre-exis-
ting) cultural traits are switched on or ‘primed’ in particular situations or contexts (though they
may be occupational or organisational cultural traits, rather than national cultural traits).
The following paragraph was taken from the anecdotal information referred to in Section 5.2
and detailed in Appendix 2:
“Two high power distance research colleagues have commented to me (and to other
British colleagues) that they found it offensive when people junior to themselves from
the same region (typically research students who had spent several years in the UK)
did not acknowledge their seniority when addressing them.”
This was interesting in that these same colleagues did not find it similarly offensive when
178
people junior to themselves of other nationalities did not acknowledge their seniority. It is
tempting to conjecture that this is a similar contextual response as the above examples.
The previous user comment (‘variable behaviour by team members) may also be a similar
contextual response to those above.
Feedback and brief discussions with two of the above people had indicated that they felt that
the actual behaviours within their teams or crew (in particular, within multicultural teams)
could vary significantly and that culture-related behaviours did not always surface. One, in
particular, felt that such behaviours were triggered by the context and cues (and perhaps by
expectations) within the team and the environment, thus reducing the effectiveness of default
culture-based prediction tools such as the TCT2.
f) Comments on user feedback
Evaluations of the second prototype team culture tool (TCT2) demonstrated the flexibility of
the task/mission profiler in terms of its ability to represent many team types, but users found
the TCT2 quite difficult to apply because, for any particular task, a significant number of sub-
factors would have little meaning or relevance, and could be confusing and open to misinter-
pretation. In addition, because many of the task sub-factors (e.g. management, delegation
and decision-making styles) related to team behaviour, these were very likely to be affected
by tool user cultural traits. Perhaps more importantly, users raised some critical points about
the underlying assumptions (see previous subsection).
The issue of residual discrepancies reported on by one user was worth considering further.
‘Tolerance bands’ rather than point values for the optimum cultural dimension scores could
be utilised; these would much-reduce or eliminate the residual discrepancies reported by
users who were experimenting to obtain zero-discrepancy teams (see (e) above). Given the
limited accuracy of any culture tool, such tolerances (if not excessive) would be a useful
trade-off.
The user comments with regard to contextually-modified behaviours were an important factor
to take into consideration. An examination of the literature, for example Oyserman & Lee
(2008) suggested that most of the research to-date on cultural priming has concentrated on
individualism-collectivism, and there appeared to be little literature associated with priming
other cultural dimensions. New research, based on simulating the neural network activities
associated with priming automatic social behaviours (Schröder & Thagard, 2013), may
improve understandings of the general underlying mechanisms of contextual priming, but
179
there is also a need for direct studies of uncertainty avoidance priming, etc.
7.5.3 Re-examining the underpinning assumptions of the second model
The underpinning assumptions of the second performance prediction model were originally
stated in Subsection 7.2.2. They are reconsidered in this subsection in order to evaluate
their validity.
a) Capturing the cultural traits of an actual or proposed team Within the limits of a simple dimension-based system, the cultural profiler based on
Hofstede’s framework was effective.
b) Capturing the desirable team cultural traits to achieve a task/mission It was assumed that the tasks or mission of the team could be captured sufficiently by
weighting five ‘standard’ factors and their sub-factors; this required the following:
(i) Capturing the culture-sensitive elements of team tasks or missions
Comments: The set of behavioural factors and their sub-factors was not ideal, but
the factors captured sufficient key culture-related details to produce results that ‘were
in the right direction’. However, two users raised issues about the validity about this
task-based approach (see following paragraphs).
(ii) Relating culture-sensitive elements of tasks/missions to culture traits
Comments: The literature review provided enough information, in conjunction with
the culture score ranges derived in Subsection 5.5.1, that the author was able to
identify and encapsulate in the model the cultural traits required for optimum
performance of the sub-factors. There remained question marks over some of the
relationships (in particular, those associated with masculinity and cultural diversity),
due to lack of data and contradictory published results.
However, as stated in Subsection 7.5.2(e), above, two of the participating managers
had questioned the link between culture and actual behaviours within their teams or
crew (in particular, within multicultural teams). Whereas such local-contextual effects
would certainly reduce the direct effects of culture (or the reliability with which such
effects appeared), cultural traits would still provide a baseline and, given certain
mission-related contextual cues, should tend to trigger certain behaviours.
180
(iii) Describing a particular task or in terms of the above factors
Comments: Some users found this difficult, as the sub-factors were not necessarily
those that they would normally use to describe a team. Although it was very flexible,
that very flexibility may have added to confusion (due to lack of focus towards specific
tasks/missions) and reduced its acceptability.
c) Obtaining useful information from the discrepancies between desirable and actual cultural traits Comments: General explanations were provided in the tool and, in addition, context-
sensitive (or discrepancy-sensitive) messages were generated to help in the identification
of problem areas. The managers who were interested in culture picked up the meanings
of the cultural dimensions quickly and appeared to understand the operation of the tool
and its outputs (discrepancy figures and comment(s)). However, there was a lack of
confidence on the part of the some users in the task/behavioural profile, and therefore in
the usefulness of the information.
7.6 Proposed changes to the tool
The proposed changes were based in part on the user comments and on the re-examination
of the assumptions. In particular, the comments by two users regarding situations or
contexts were of concern. A direct focus on the mission context could, to some extent, side-
step this issue, and also alleviate the practical difficulties that users had with the TCT2.
It was therefore decided that the third prototype would include changes from a task-oriented
representation to a dimension-based mission representation that attempted to capture the
key context of that mission. This would enable a user to define a mission by locating it in
‘mission space’, relative to other missions. In addition, the third prototype would incorporate
upper and lower bounds to optimum culture dimension scores, rather than single ‘optimum’
or ‘desirable’ values.
7.7 Summary of the second model and team culture tool
The second model and tool confirmed the effectiveness and face validity of the team cultural
profiler. However, it also highlighted issues with the factor/sub-factor representation of
task/mission profiles, both in terms of difficulties in use and underlying assumptions. A
substantially different approach was therefore needed for the task/mission profiler.
181
8 A third model and prototype culture tool
8.1 Introduction
This chapter describes the development of the third and final set of versions of the model
and team culture tool (TCT3); these versions utilised a dimension-based approach for both
the team cultural profile and mission profile.
The aim of this third exercise was to create a prototype culture tool that did not rely on a
task-based approach, and demonstrated the potential for application by engineers and
managers, rather than by researchers who had particular knowledge of culture and its inter-
actions with team performance.
As was the case with the TCT2, this version of the team culture tool was not intended to
predict the ‘absolute’ performances of individual teams, but was intended to highlight where
culture was likely to be a significant factor in underperformance or heightened risk. Also, as
was the case with the TCT2, the goodness of fit (between team and mission) was based on
the generation of discrepancies between the desirable team culture profile (based on the
mission) and the actual team profile.
The main difference in the third methodology and tool was that the team mission was
selected as a location in multidimensional mission space, rather than described via weighting
a set of factors and their sub-factors.
8.2 The basis of the third model (TCT3)
This section was intended to provide an overview of the model that underlies the third tool, in
particular, the basis on which it generated a measure of fit between teams and their mission
requirements, and the assumptions that lay behind the approach.
8.2.1 Overview of the third model
The logic of the third performance prediction model was based on profiling the team via its
members’ national cultural traits (as were the first and second models), profiling the mission
by locating it within a set of mission dimensions (rather than via the five team behavioural
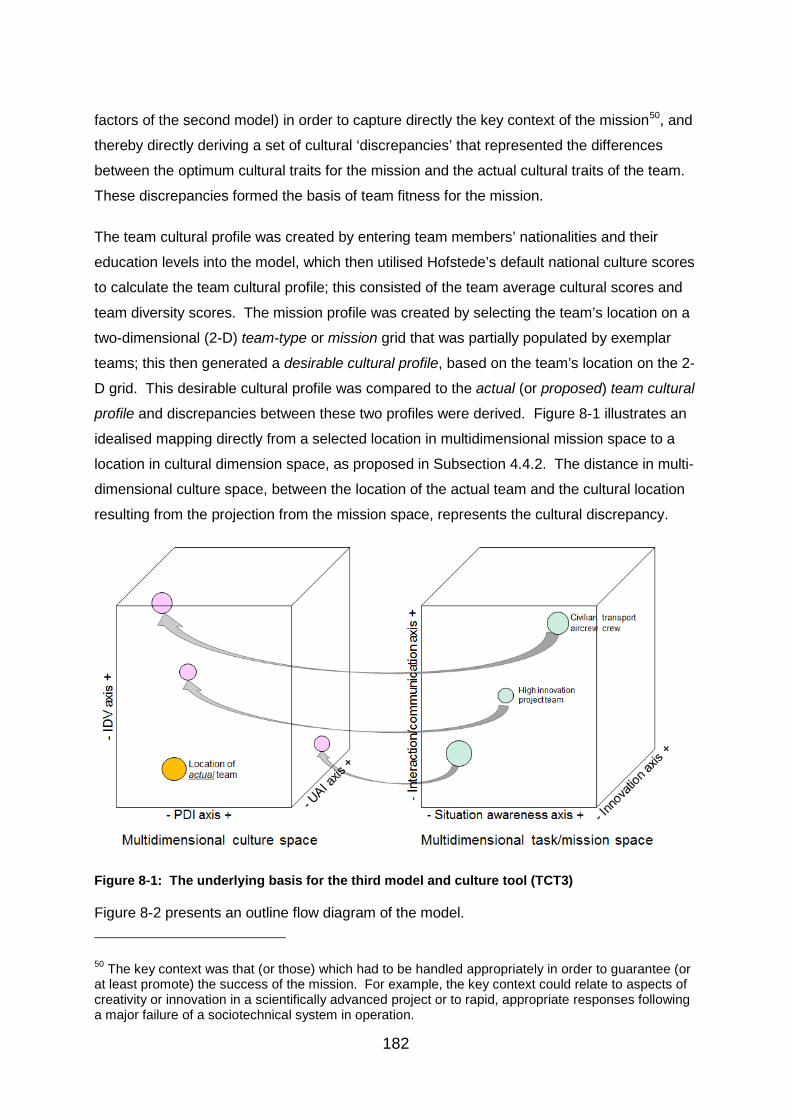
182
factors of the second model) in order to capture directly the key context of the mission50, and
thereby directly deriving a set of cultural ‘discrepancies’ that represented the differences
between the optimum cultural traits for the mission and the actual cultural traits of the team.
These discrepancies formed the basis of team fitness for the mission.
The team cultural profile was created by entering team members’ nationalities and their
education levels into the model, which then utilised Hofstede’s default national culture scores
to calculate the team cultural profile; this consisted of the team average cultural scores and
team diversity scores. The mission profile was created by selecting the team’s location on a
two-dimensional (2-D) team-type or mission grid that was partially populated by exemplar
teams; this then generated a desirable cultural profile, based on the team’s location on the 2-
D grid. This desirable cultural profile was compared to the actual (or proposed) team cultural
profile and discrepancies between these two profiles were derived. Figure 8-1 illustrates an
idealised mapping directly from a selected location in multidimensional mission space to a
location in cultural dimension space, as proposed in Subsection 4.4.2. The distance in multi-
dimensional culture space, between the location of the actual team and the cultural location
resulting from the projection from the mission space, represents the cultural discrepancy.
Figure 8-1: The underlying basis for the third model and culture tool (TCT3)
Figure 8-2 presents an outline flow diagram of the model. 50 The key context was that (or those) which had to be handled appropriately in order to guarantee (or at least promote) the success of the mission. For example, the key context could relate to aspects of creativity or innovation in a scientifically advanced project or to rapid, appropriate responses following a major failure of a sociotechnical system in operation.
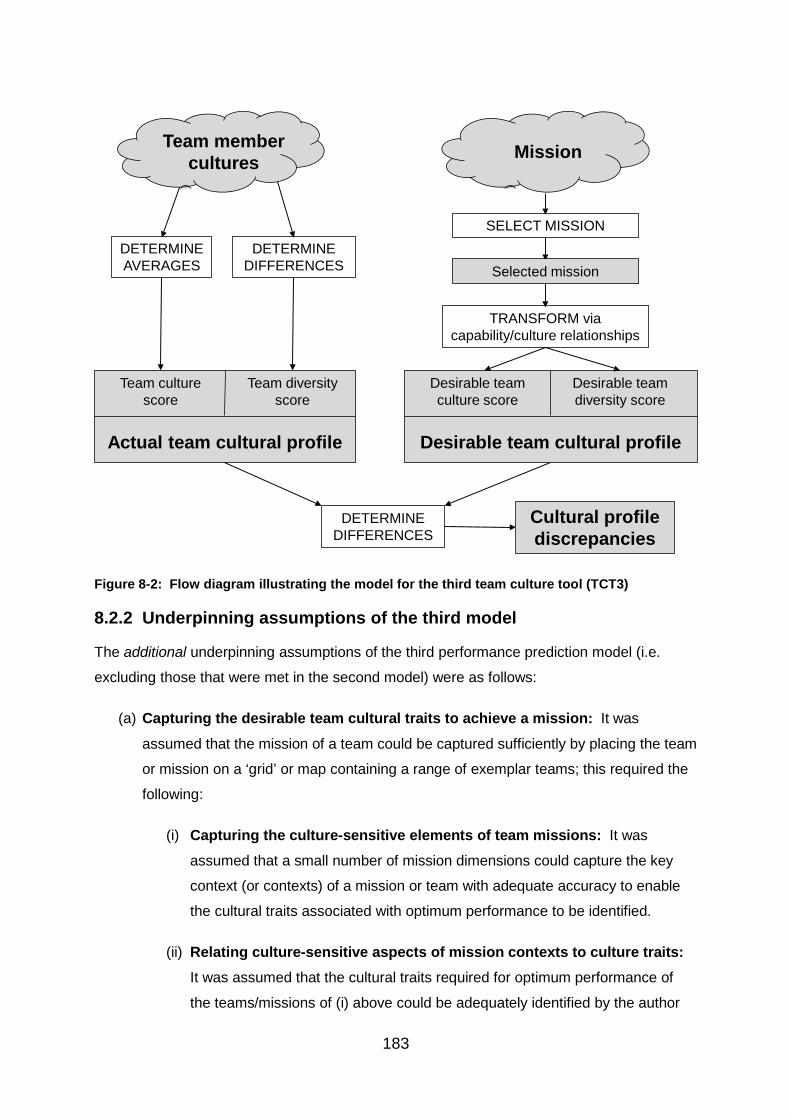
183
Figure 8-2: Flow diagram illustrating the model for the third team culture tool (TCT3)
8.2.2 Underpinning assumptions of the third model
The additional underpinning assumptions of the third performance prediction model (i.e.
excluding those that were met in the second model) were as follows:
(a) Capturing the desirable team cultural traits to achieve a mission: It was
assumed that the mission of a team could be captured sufficiently by placing the team
or mission on a ‘grid’ or map containing a range of exemplar teams; this required the
following:
(i) Capturing the culture-sensitive elements of team missions: It was
assumed that a small number of mission dimensions could capture the key
context (or contexts) of a mission or team with adequate accuracy to enable
the cultural traits associated with optimum performance to be identified.
(ii) Relating culture-sensitive aspects of mission contexts to culture traits: It was assumed that the cultural traits required for optimum performance of
the teams/missions of (i) above could be adequately identified by the author
Team member cultures
Team culture score
Team diversity score
Actual team cultural profile
DETERMINEAVERAGES
DETERMINEDIFFERENCES
Mission
SELECT MISSION
TRANSFORM via capability/culture relationships
Desirable team culture score
Desirable team diversity score
Desirable team cultural profile
DETERMINE DIFFERENCES
Cultural profile discrepancies
Selected mission
184
(based on the literature and his additional studies) and encapsulated in the
model; these included the cultural traits of the exemplar teams.
(iii) Placing a particular team or mission on a grid or map: It was assumed
that users had sufficient knowledge to locate their teams with adequate
accuracy within the grid or map in relation to exemplar teams.
(b) Obtaining useful information from the discrepancies between desirable and actual cultural traits: It was assumed that the cultural discrepancies between actual
and desirable cultural traits, when combined with the associated comments
generated by the model/tool, would be meaningful, i.e. that they would inform the
user of something useful about potential team performance and/or team problems.
Note: As stated in Subsection 7.2.2, the terms ‘adequate’ and ‘adequately’ related to the
effects of inaccuracy on the performance of the model and tool. It was difficult to judge the
degree of adequacy of individual steps in the process; however, the overall performance
could be adjudged from the tool’s effectiveness in the hands of users.
The implications of the above assumptions and the degree to which they were found to be
justified are discussed later in this chapter.
8.3 A description of the key elements of the third model and tool
The TCT3 team cultural profiler was identical to that used in the TCT2, which was described
in Subsection 7.3.1 and illustrated in Figure 7-3. Therefore, no further descriptions of the
profiler and the resulting team cultural profile have been provided in this subsection.
The mission profile, produced when the user placed the team (in terms of its mission) at an
appropriate location in mission space, was mapped across to a desirable cultural profile.
This desirable cultural profile was compared to the team cultural profile generated by
entering team member nationalities, and discrepancies between the two were derived.
These discrepancies, as in the second model, formed the basis for assessing mission fit.
The proposed changes of Subsection 7.6 included the adaptation of the tool to incorporate a
valid range of scores, rather than a single point optimum score. This range would reflect the
limited accuracy of the optimum culture scores and would provide several benefits:
• It would enable users to find optimum team configurations more easily if that was
their intent,
185
• It would enable the tool to cope with situations where a particular cultural trait was
unimportant, simply by expanding the range of ‘optimal’ scores,
• It would enable the tool to emulate a situation where a cultural trait reduced in
importance over a particular range of scenarios (whether or not its optimum score
changed); for example, this was the case with the organised action teams – the
slower the required response time was, the less important power distance and
masculinity were.
On the basis of the limited accuracy of the cultural dimension scores, a decision was made to
incorporate a default minimum range of +/-5. That implied, for example, that an optimum
cultural dimension score of 25 would become an optimum range of 20-30, and a team score
of anywhere between 20 and 30 (for that dimension) would have a discrepancy score of
zero.
When this third and final model was initially developed, the aim was to profile all potential
tasks/missions by locating them in three or four dimensions. However, this proved extremely
difficult for the following reasons:
• It proved impossible to design a simple three/four-dimensional input tool that a user
could utilise effectively. It required the user to select a team twice, once on each pair
of dimensions, and it proved difficult to place and explain the numerous exemplars
required to guide the user in his or her selection.
• Different team/mission types could not effectively be expressed via a common set of
dimensions, as at least one dimension would be superfluous and distracting.
As a result, a decision was taken to utilise different underlying dimensions and input forms
for the different forms of team mission. The decision to split team types greatly simplified the
process of implementation, and produced a mission interface that was extremely simple to
use.
The two key team/mission types (and their dimension) selected were the ones of key interest
to this research (see Sub-section 2.2.2), i.e.:
• Project teams – typically designing, implementing or improving elements of socio-
technical systems.
• Organised action teams – typically the crew or operators of safety-critical socio-
technical systems.
186
8.3.1 Project teams, primarily for the research, development and implementation of sociotechnical systems and products
Section 3.3 of the literature review examined the effects of culture on the performance of
teams involved in research, innovation, improvement, etc. The main culturally-moderated
issues that appeared to arise with project teams appeared from the literature to be the level
of creativity/innovation, and the additional problems imposed by social complexities on larger
projects – i.e. the parties involved, their cultural differences, etc. Whereas the innovation/-
creativity issues had been quantitatively evaluated by many authors (with varying results and
conclusions), the issue of social complexity and its effects on projects had been subject only
to limited qualitative analysis. However, the major social problems with complex projects, as
identified in Subsection 3.3.1(a) (vii), were failures in communications and understandings
across departmental and organisational boundaries. In particular, the very masculine
cultures associated with the management of large projects tended to result in impersonal
problem-solving, and a failure to form relationships and to adopt a consensus-seeking
approach. It appeared that a low-power distance, low-masculinity culture would improve
communication and encourage the building of consensual relations between partners, rather
than the adversarial relationships that formed the basis of much current project work.
The dimensions for sociotechnical system project teams were therefore defined as:
• Creativity/innovation
• Social complexity
Note that, in addition to technically-focussed project teams, this configuration of dimensions
also enabled the assessment of non-technical management teams. These dimensions are
discussed further in the following subsections.
a) Creativity/innovation dimension
The author has brought together the findings on innovation from the literature review and
from his own studies in order to produce a best estimate of the relationships. The author’s
pilot study results (Subsections 5.3.1 to 5.3.4 & 5.4) broadly supported the innovation results
that were obtained from the literature; in particular:
• The student group results demonstrated that uncertainty avoidance was a detractor
from innovation performance51.
• The football results demonstrated that, in an environment of clearly-defined rules and
51 Innovation formed a significant part of the student groups’ performance assessments.
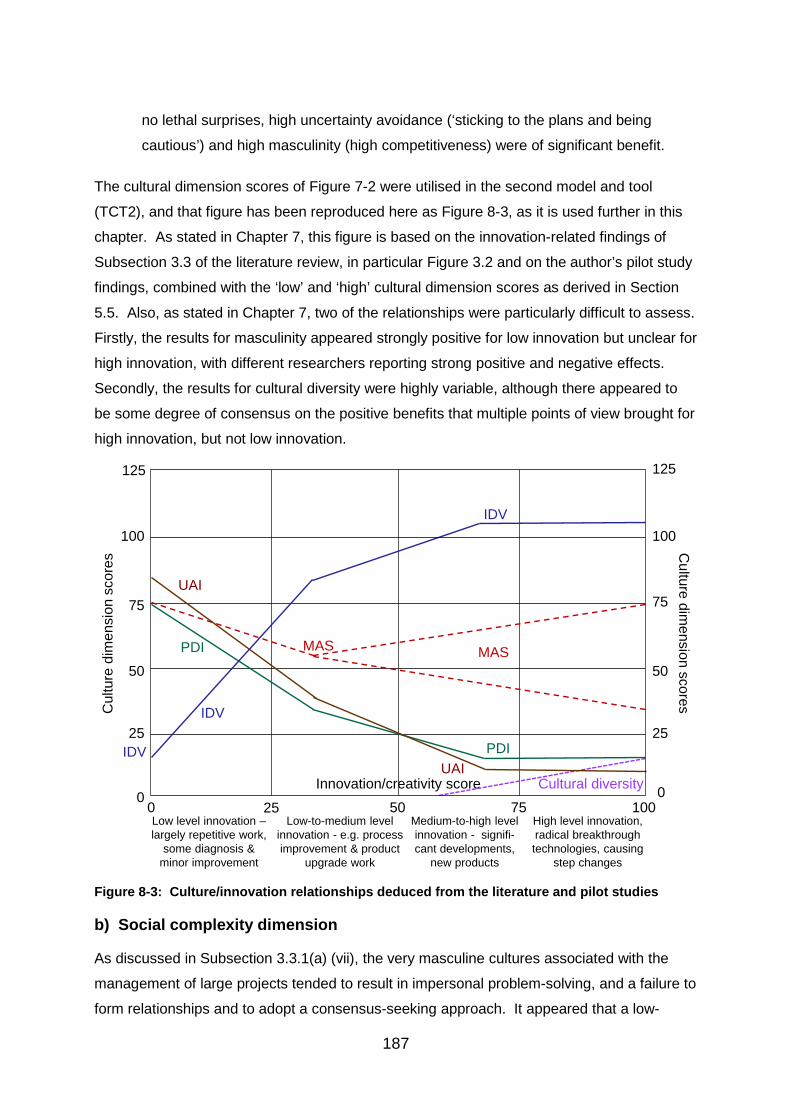
187
no lethal surprises, high uncertainty avoidance (‘sticking to the plans and being
cautious’) and high masculinity (high competitiveness) were of significant benefit.
The cultural dimension scores of Figure 7-2 were utilised in the second model and tool
(TCT2), and that figure has been reproduced here as Figure 8-3, as it is used further in this
chapter. As stated in Chapter 7, this figure is based on the innovation-related findings of
Subsection 3.3 of the literature review, in particular Figure 3.2 and on the author’s pilot study
findings, combined with the ‘low’ and ‘high’ cultural dimension scores as derived in Section
5.5. Also, as stated in Chapter 7, two of the relationships were particularly difficult to assess.
Firstly, the results for masculinity appeared strongly positive for low innovation but unclear for
high innovation, with different researchers reporting strong positive and negative effects.
Secondly, the results for cultural diversity were highly variable, although there appeared to
be some degree of consensus on the positive benefits that multiple points of view brought for
high innovation, but not low innovation.
Figure 8-3: Culture/innovation relationships deduced from the literature and pilot studies
b) Social complexity dimension
As discussed in Subsection 3.3.1(a) (vii), the very masculine cultures associated with the
management of large projects tended to result in impersonal problem-solving, and a failure to
form relationships and to adopt a consensus-seeking approach. It appeared that a low-
0
25
50
75
100
0
25
50
75
100
Low level innovation –largely repetitive work,
some diagnosis & minor improvement
High level innovation, radical breakthrough technologies, causing
step changes
Medium-to-high level innovation - signifi-cant developments,
new products
Low-to-medium level innovation - e.g. process improvement & product
upgrade work
25 50 75 1000
PDI
IDV
UAI
MASMAS
Cul
ture
dim
ensi
on s
core
s Culture dim
ension scores
Innovation/creativity score Cultural diversity
IDVUAI
125125
PDI
IDV
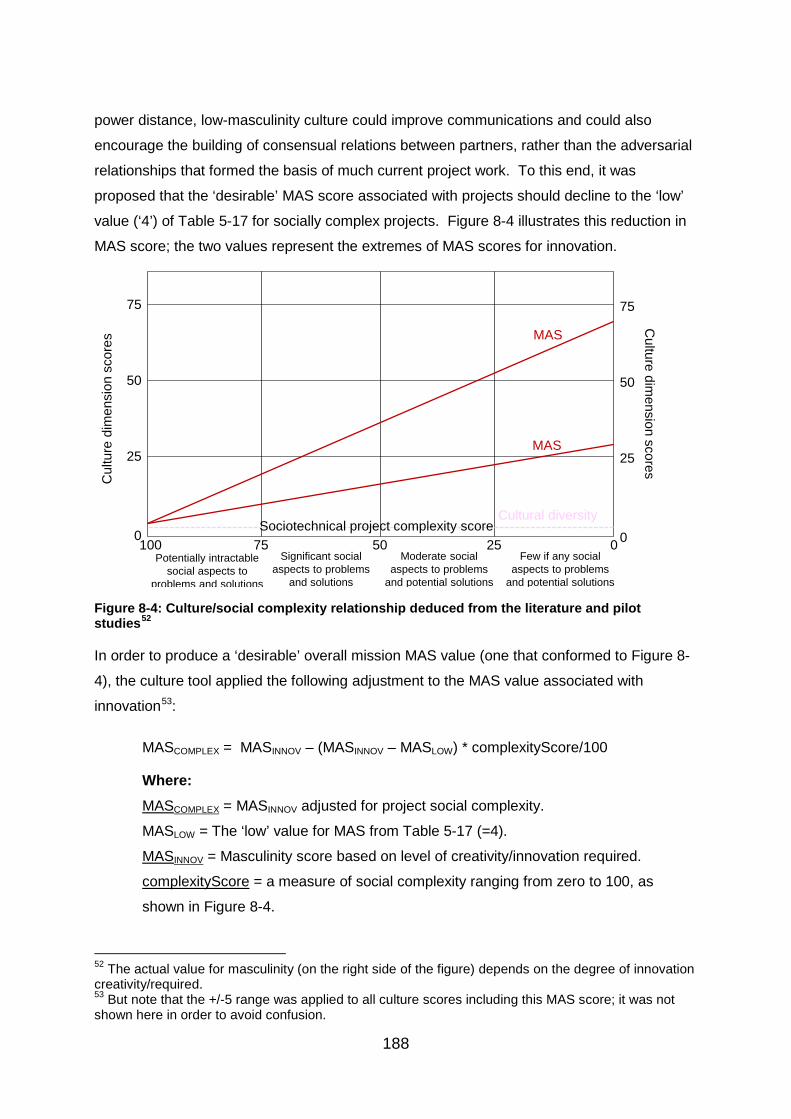
188
power distance, low-masculinity culture could improve communications and could also
encourage the building of consensual relations between partners, rather than the adversarial
relationships that formed the basis of much current project work. To this end, it was
proposed that the ‘desirable’ MAS score associated with projects should decline to the ‘low’
value (‘4’) of Table 5-17 for socially complex projects. Figure 8-4 illustrates this reduction in
MAS score; the two values represent the extremes of MAS scores for innovation.
Figure 8-4: Culture/social complexity relationship deduced from the literature and pilot studies52
In order to produce a ‘desirable’ overall mission MAS value (one that conformed to Figure 8-
4), the culture tool applied the following adjustment to the MAS value associated with
innovation53:
MASCOMPLEX = MASINNOV – (MASINNOV – MASLOW) * complexityScore/100
Where: MASCOMPLEX = MASINNOV adjusted for project social complexity.
MASLOW = The ‘low’ value for MAS from Table 5-17 (=4).
MASINNOV = Masculinity score based on level of creativity/innovation required.
complexityScore = a measure of social complexity ranging from zero to 100, as
shown in Figure 8-4.
52 The actual value for masculinity (on the right side of the figure) depends on the degree of innovation creativity/required. 53 But note that the +/-5 range was applied to all culture scores including this MAS score; it was not shown here in order to avoid confusion.
0
25
50
75
0
25
50
75
Potentially intractable social aspects to
problems and solutions
Few if any social aspects to problems
and potential solutions
Moderate social aspects to problems
and potential solutions
Significant social aspects to problems
and solutions
75 50 25100 0
MAS
Cul
ture
dim
ensi
on s
core
s
Culture dim
ension scores
Sociotechnical project complexity scoreCultural diversity
MAS
189
8.3.2 Organised action teams - crews of sociotechnical systems
Section 3.3.1(c) of the literature review examined the effects of national culture on the perfor-
mance of crews and operators of sociotechnical systems, in particular, aircraft crews.
Although only limited publication data was available in this area, compared to that on
innovation, that data was consistent across all researchers: national culture appeared to play
a significant role in accident rates. Accident recordings had revealed a range of intra-team
issues; low accident rates were associated with low PDI, high IDV, low UAI and high MAS;
high accident rates were associated with the opposite set of culture scores. Cultural diversity
was not given significant attention in the literature on organised action teams, but it would be
reasonable to assume that, because it reduced communication rates and increased
misunderstandings, cultural diversity would have added to the risk of accidents.
The author’s analysis of aircraft accident data (Subsection 5.3.5(a)) confirmed that high
accident rates in fast response time systems were associated with high PDI, low IDV, high
UAI and low MAS. In addition, the author’s analysis confirmed Hofstede’s assertion that per-
capita GDP was the most important factor relating to aircraft accident rates (low per-capita
GDP is associated with high aircraft accident rates). The author’s studies also indicated that,
in slower response time systems, e.g. merchant maritime (Subsection 5.3.5(b)), per-capita
GDP, MAS and PDI had much-reduced effects compared to IDV and UAI. The author’s
examination of automation issues (Subsection 3.3.1(c)) and analysis of attitudes to auto-
mation (Subsection 5.3.5(c)) provided further insights as to loss of flying skills, reduced
situation awareness and complacency, which are all potential contributors to accident risks.
Although no significant relationships were found in the literature between degree of special-
isation within a team and the effects of culture on accident rates, specialisation proved to be
a useful way of discriminating teams in order to display them on a two dimensional grid, and
to enable users to place their own teams’ missions.
To summarise the above, the two dimensions selected were:
• Mission response time requirements (rather than communication and co-ordination or
situational awareness, which were team behavioural factors).
• Mission specialisation amongst team members (a key team-differentiating dimension
identified by Hollenbeck et al. (2012)).
Figure 8-5 presents a best estimate of the optimum cultural values for sociotechnical system
crews based on the accident-related findings of Subsection 3.3 of the literature review and
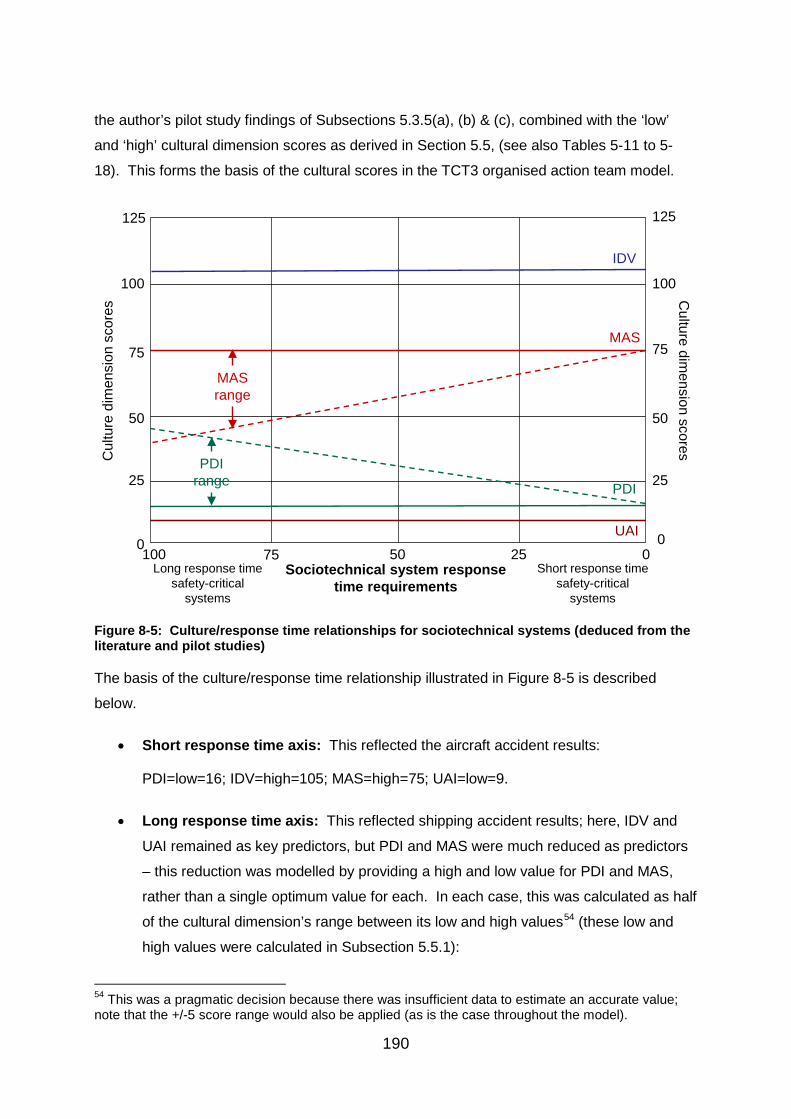
190
the author’s pilot study findings of Subsections 5.3.5(a), (b) & (c), combined with the ‘low’
and ‘high’ cultural dimension scores as derived in Section 5.5, (see also Tables 5-11 to 5-
18). This forms the basis of the cultural scores in the TCT3 organised action team model.
Figure 8-5: Culture/response time relationships for sociotechnical systems (deduced from the literature and pilot studies)
The basis of the culture/response time relationship illustrated in Figure 8-5 is described
below.
• Short response time axis: This reflected the aircraft accident results:
PDI=low=16; IDV=high=105; MAS=high=75; UAI=low=9.
• Long response time axis: This reflected shipping accident results; here, IDV and
UAI remained as key predictors, but PDI and MAS were much reduced as predictors
– this reduction was modelled by providing a high and low value for PDI and MAS,
rather than a single optimum value for each. In each case, this was calculated as half
of the cultural dimension’s range between its low and high values54 (these low and
high values were calculated in Subsection 5.5.1):
54 This was a pragmatic decision because there was insufficient data to estimate an accurate value; note that the +/-5 score range would also be applied (as is the case throughout the model).
0
25
50
75
100
0
25
50
75
100
Long response time safety-critical
systems
Short response time safety-critical
systems
Sociotechnical system response time requirements
75 50 25 0100
PDI
IDV
MAS range
MAS
Cul
ture
dim
ensi
on s
core
s Culture dim
ension scores
UAI
125125
PDI range
191
PDILOW=16 & PDIHIGH=16+(73-16)/2=45; IDV=high=105; MASHIGH=75 & MASLOW=75-
(75-4)/2=40; UAI=low=9.
The issues associated with the operation of high-reliability sociotechnical systems relate to
relatively rare situations where events combine or failures occur such that the operators or
crew must ‘reframe’ and, typically, abandon their normal standard operating procedures
(SOPs). However, operators that are willing to abandon their SOPs at an earlier stage may
abandon them when such a course may not be necessary. Where the balance of risk is
weighted towards the consequences of failure to follow SOPs, for example when carrying out
planned maintenance of an aircraft55 or of a section of a refinery, then high UAI (following
SOPs), high PDI (obeying orders) crews may perform better. Note that low IDV (high
collectivism) does not guarantee the following of SOPs or orders. Although sport may
appear at first consideration to have little to do with sociotechnical systems, the issues
associated with a willingness (or otherwise) to take a low uncertainty (high predictability)
course of action have been demonstrated in the author’s English Premiership pilot study;
here, the key contributory cultural dimension to successful performance was found to be high
UAI. Due to a lack of publications and data on maintenance operations in sociotechnical
systems, this topic has not been included in the TCT3.
8.4 A description of the methodology and tool operation
As stated in the previous chapter, in order to assess the suitability of a team in cultural terms,
it was necessary to be able to profile the team in terms of its culture, to profile the team
mission (including relevant environmental aspects), and to provide a mapping between the
team mission and cultural traits that would enable an assessment of team suitability or
mismatch to be carried out. The main difference in the third methodology and tool was that
the team mission was selected as a location in multidimensional mission space, rather than
described via weighting a set of factors and their sub-factors; Figure 8-1 illustrates an
idealised mapping directly from a selected location in multidimensional mission space to a
location in cultural dimension space.
Knowing the desirable location in ‘culture space’ and the actual team’s location in the same
space, the separation (or discrepancy) along each cultural dimension could be determined.
The following subsections describe the activities and profiles in more detail; as in the last
55 For an example of the failure of a UK aircraft maintenance organisation to follow standard operating procedures, see AAIB (2013). The UK score for uncertainty avoidance is low, but is not necessarily a contributing factor to this serious incident.
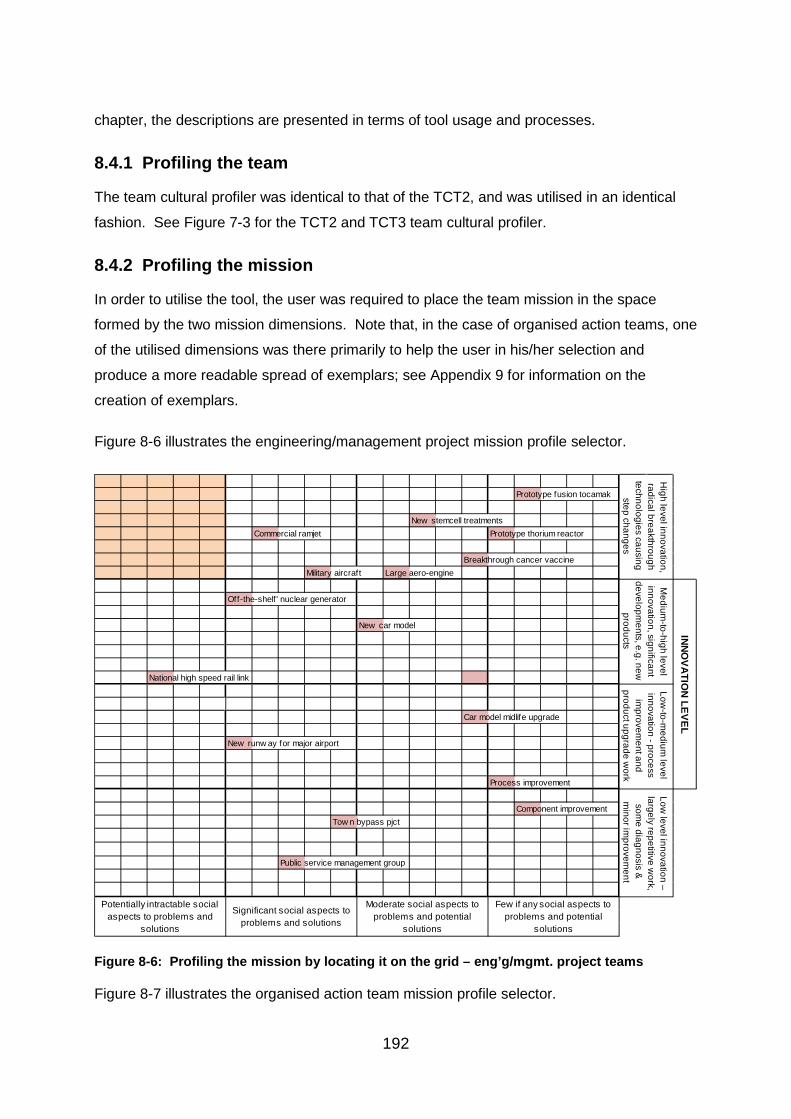
192
chapter, the descriptions are presented in terms of tool usage and processes.
8.4.1 Profiling the team
The team cultural profiler was identical to that of the TCT2, and was utilised in an identical
fashion. See Figure 7-3 for the TCT2 and TCT3 team cultural profiler.
8.4.2 Profiling the mission
In order to utilise the tool, the user was required to place the team mission in the space
formed by the two mission dimensions. Note that, in the case of organised action teams, one
of the utilised dimensions was there primarily to help the user in his/her selection and
produce a more readable spread of exemplars; see Appendix 9 for information on the
creation of exemplars.
Figure 8-6 illustrates the engineering/management project mission profile selector.
Figure 8-6: Profiling the mission by locating it on the grid – eng’g/mgmt. project teams
Figure 8-7 illustrates the organised action team mission profile selector.
Prototype fusion tocamak
New stemcell treatmentsCommercial ramjet Prototype thorium reactor
Breakthrough cancer vaccineMilitary aircraft Large aero-engine
Off-the-shelf ' nuclear generator
New car model
National high speed rail link
Car model midlife upgrade
New runw ay for major airport
Process improvement
Component improvementTow n bypass pjct
Public service management group
Low level innovation –
largely repetitive work,
some diagnosis &
m
inor improvem
ent
Low-to-m
edium level
innovation - process im
provement and
product upgrade work
Medium
-to-high level innovation, significant
developments, e.g. new
products
Moderate social aspects to problems and potential
solutions
Few if any social aspects to problems and potential
solutions
Potentially intractable social aspects to problems and
solutions
Significant social aspects to problems and solutions
High level innovation,
radical breakthrough technologies causing
step changes
INNOVATIO
N LEVEL
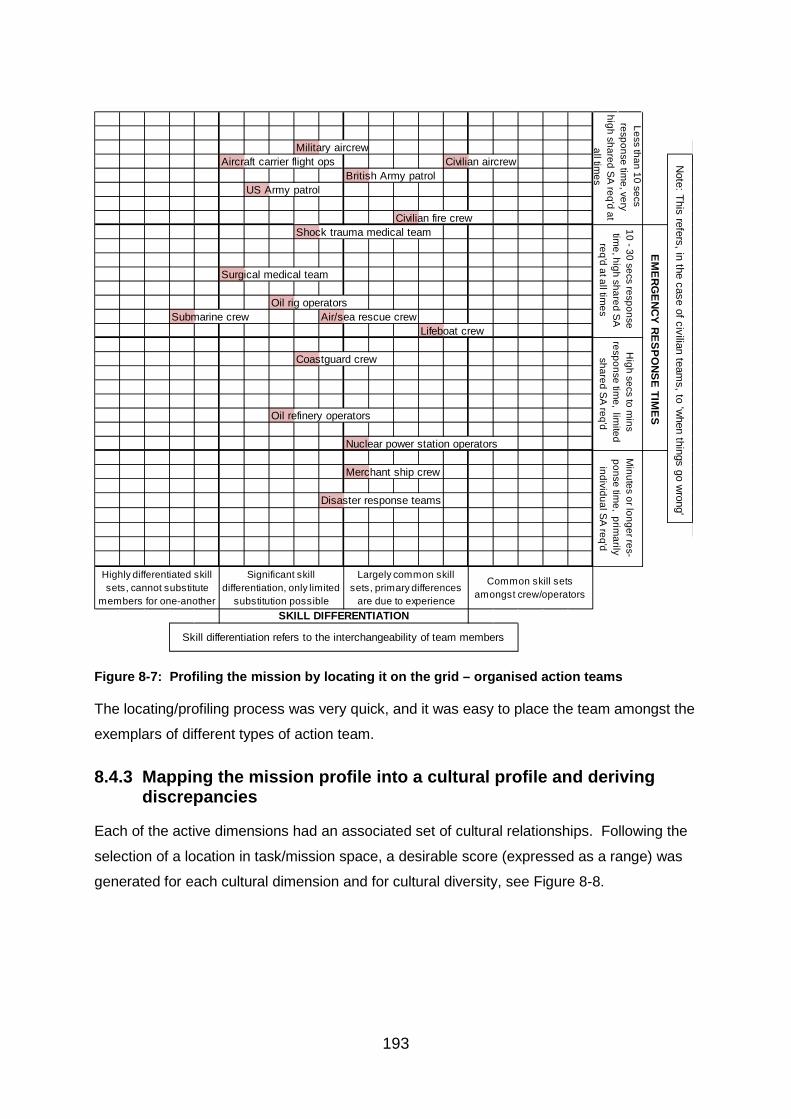
193
Figure 8-7: Profiling the mission by locating it on the grid – organised action teams
The locating/profiling process was very quick, and it was easy to place the team amongst the
exemplars of different types of action team.
8.4.3 Mapping the mission profile into a cultural profile and deriving discrepancies
Each of the active dimensions had an associated set of cultural relationships. Following the
selection of a location in task/mission space, a desirable score (expressed as a range) was
generated for each cultural dimension and for cultural diversity, see Figure 8-8.
Military aircrewAircraft carrier flight ops Civilian aircrew
British Army patrolUS Army patrol
Civilian fire crewShock trauma medical team
Surgical medical team
Oil rig operatorsSubmarine crew Air/sea rescue crew
Lifeboat crew
Coastguard crew
Oil refinery operators
Nuclear power station operators
Merchant ship crew
Disaster response teams
Note: This refers, in the case of civilian team
s, to 'when things go w
rong'
SKILL DIFFERENTIATION
Less than 10 secs response tim
e, very high shared S
A req'd at
all times
EMERG
ENCY RESPONSE TIM
ES
Minutes or longer res-
ponse time, prim
arily individual S
A req'd
10 - 30 secs response tim
e, high shared SA
req'd at all tim
es
High secs to m
ins response tim
e, limited
shared SA
req'd
Largely common skill sets, primary differences
are due to experience
Common skill sets amongst crew/operators
Skill differentiation refers to the interchangeability of team members
Highly differentiated skill sets, cannot substitute
members for one-another
Significant skill differentiation, only limited
substitution possible
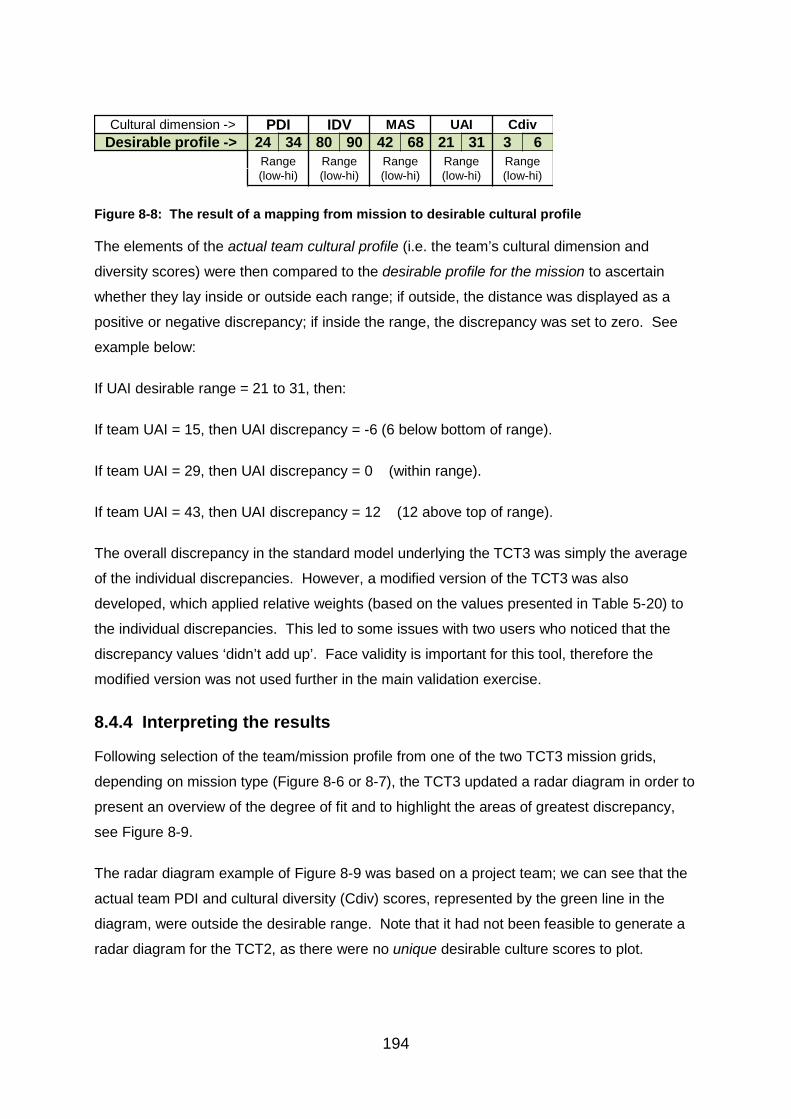
194
Figure 8-8: The result of a mapping from mission to desirable cultural profile
The elements of the actual team cultural profile (i.e. the team’s cultural dimension and
diversity scores) were then compared to the desirable profile for the mission to ascertain
whether they lay inside or outside each range; if outside, the distance was displayed as a
positive or negative discrepancy; if inside the range, the discrepancy was set to zero. See
example below:
If UAI desirable range = 21 to 31, then:
If team UAI = 15, then UAI discrepancy = -6 (6 below bottom of range).
If team UAI = 29, then UAI discrepancy = 0 (within range).
If team UAI = 43, then UAI discrepancy = 12 (12 above top of range).
The overall discrepancy in the standard model underlying the TCT3 was simply the average
of the individual discrepancies. However, a modified version of the TCT3 was also
developed, which applied relative weights (based on the values presented in Table 5-20) to
the individual discrepancies. This led to some issues with two users who noticed that the
discrepancy values ‘didn’t add up’. Face validity is important for this tool, therefore the
modified version was not used further in the main validation exercise.
8.4.4 Interpreting the results
Following selection of the team/mission profile from one of the two TCT3 mission grids,
depending on mission type (Figure 8-6 or 8-7), the TCT3 updated a radar diagram in order to
present an overview of the degree of fit and to highlight the areas of greatest discrepancy,
see Figure 8-9.
The radar diagram example of Figure 8-9 was based on a project team; we can see that the
actual team PDI and cultural diversity (Cdiv) scores, represented by the green line in the
diagram, were outside the desirable range. Note that it had not been feasible to generate a
radar diagram for the TCT2, as there were no unique desirable culture scores to plot.
Cultural dimension -> PDI IDV MAS UAI CdivDesirable profile -> 24 34 80 90 42 68 21 31 3 6
Range (low-hi)
Range (low-hi)
Range (low-hi)
Range (low-hi)
Range (low-hi)
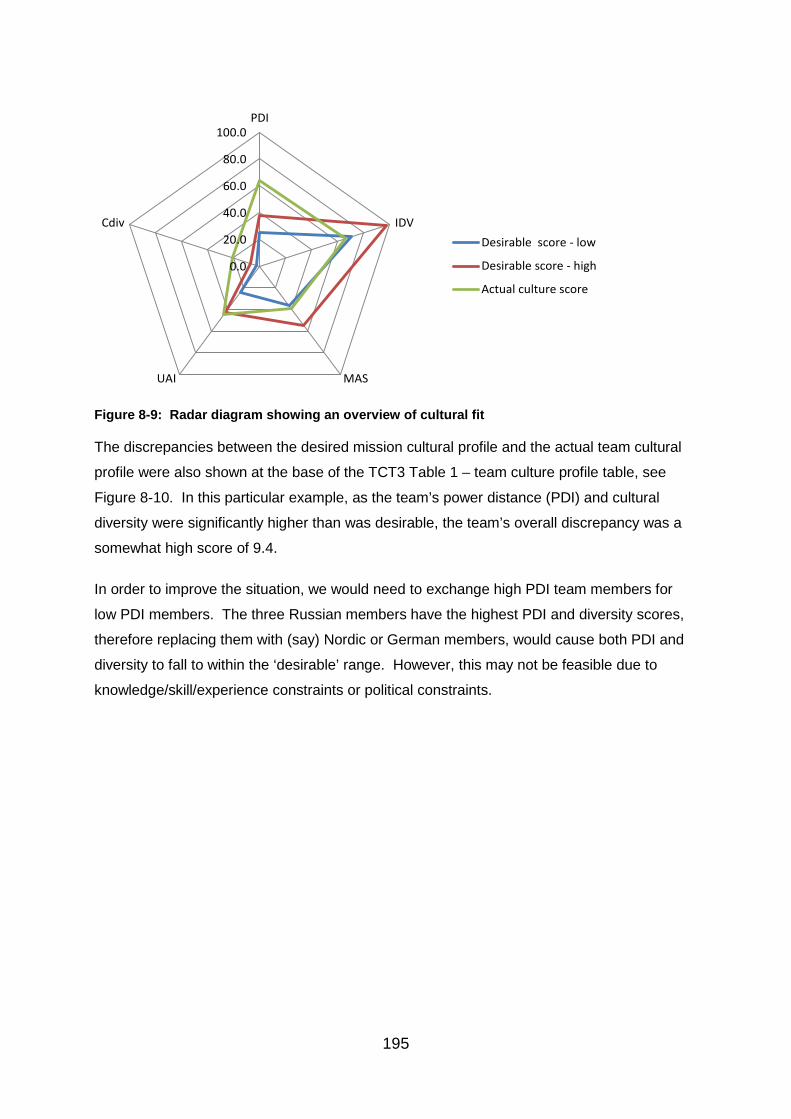
195
Figure 8-9: Radar diagram showing an overview of cultural fit
The discrepancies between the desired mission cultural profile and the actual team cultural
profile were also shown at the base of the TCT3 Table 1 – team culture profile table, see
Figure 8-10. In this particular example, as the team’s power distance (PDI) and cultural
diversity were significantly higher than was desirable, the team’s overall discrepancy was a
somewhat high score of 9.4.
In order to improve the situation, we would need to exchange high PDI team members for
low PDI members. The three Russian members have the highest PDI and diversity scores,
therefore replacing them with (say) Nordic or German members, would cause both PDI and
diversity to fall to within the ‘desirable’ range. However, this may not be feasible due to
knowledge/skill/experience constraints or political constraints.
0.0
20.0
40.0
60.0
80.0
100.0PDI
IDV
MASUAI
CdivDesirable score - low
Desirable score - high
Actual culture score
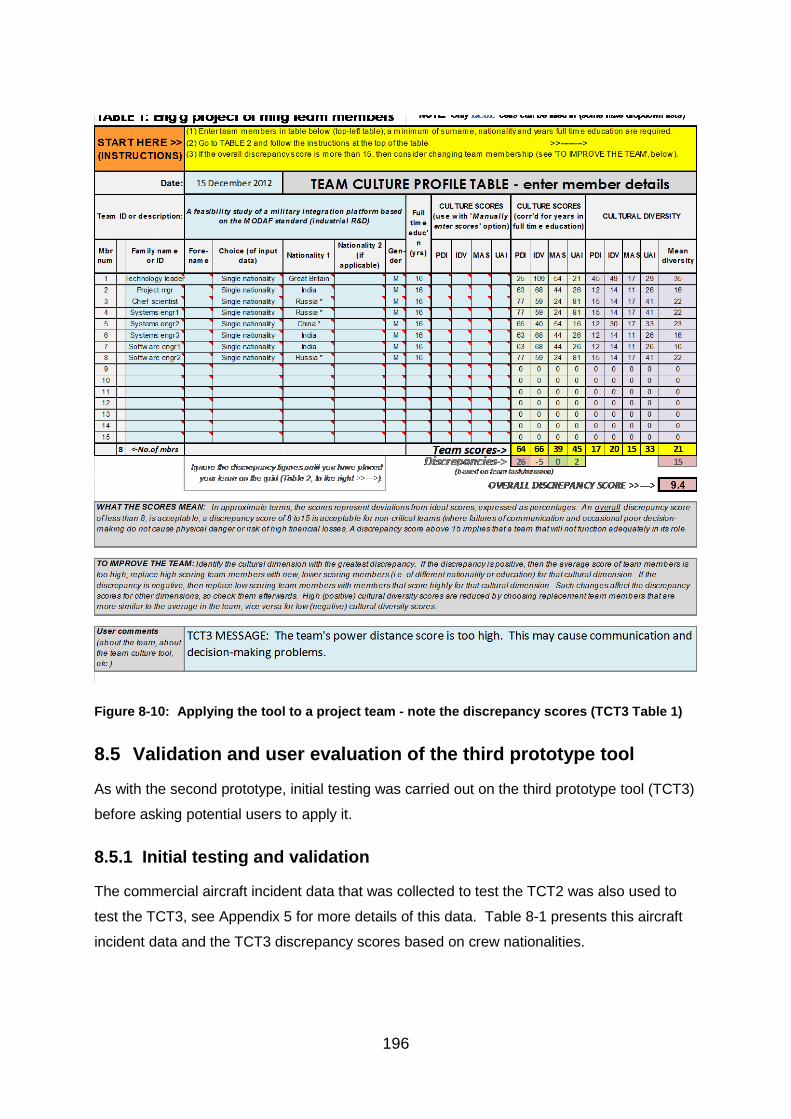
196
Figure 8-10: Applying the tool to a project team - note the discrepancy scores (TCT3 Table 1)
8.5 Validation and user evaluation of the third prototype tool
As with the second prototype, initial testing was carried out on the third prototype tool (TCT3)
before asking potential users to apply it.
8.5.1 Initial testing and validation
The commercial aircraft incident data that was collected to test the TCT2 was also used to
test the TCT3, see Appendix 5 for more details of this data. Table 8-1 presents this aircraft
incident data and the TCT3 discrepancy scores based on crew nationalities.
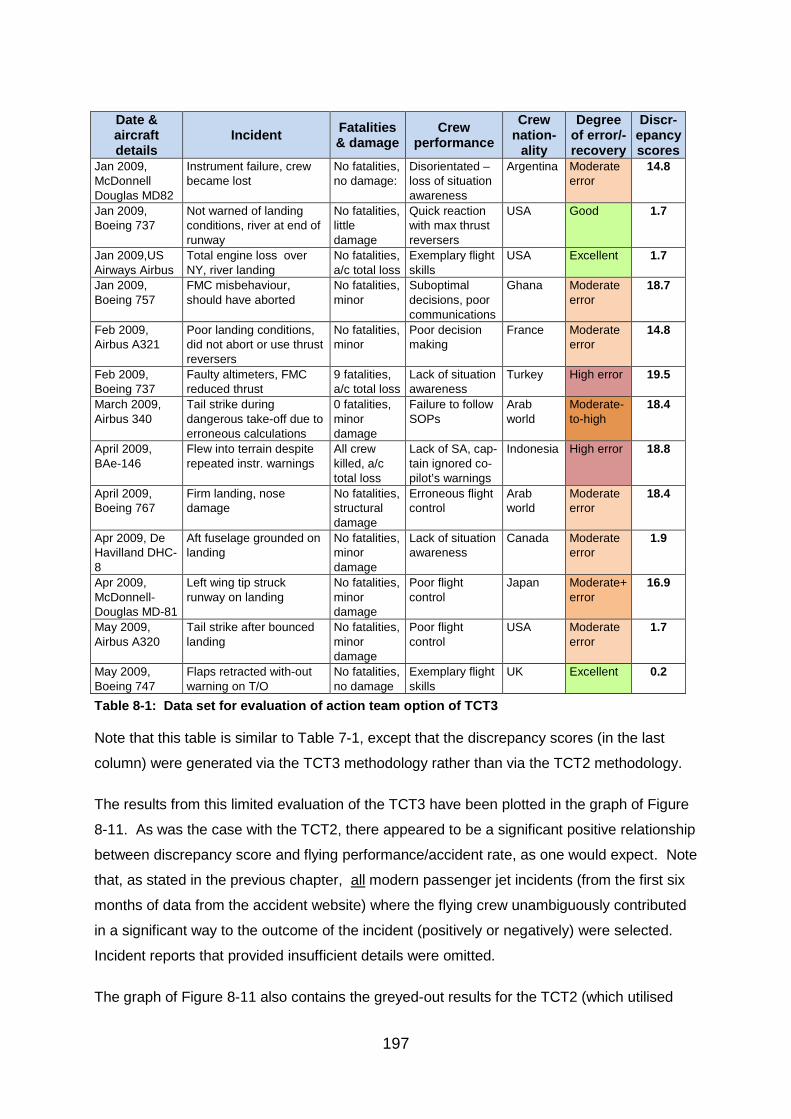
197
Date & aircraft details
Incident Fatalities & damage
Crew performance
Crew nation-
ality
Degree of error/-recovery
Discr-epancy scores
Jan 2009, McDonnell Douglas MD82
Instrument failure, crew became lost
No fatalities, no damage:
Disorientated – loss of situation awareness
Argentina Moderate error
14.8
Jan 2009, Boeing 737
Not warned of landing conditions, river at end of runway
No fatalities, little damage
Quick reaction with max thrust reversers
USA Good 1.7
Jan 2009,US Airways Airbus
Total engine loss over NY, river landing
No fatalities, a/c total loss
Exemplary flight skills
USA Excellent 1.7
Jan 2009, Boeing 757
FMC misbehaviour, should have aborted
No fatalities, minor
Suboptimal decisions, poor communications
Ghana Moderate error
18.7
Feb 2009, Airbus A321
Poor landing conditions, did not abort or use thrust reversers
No fatalities, minor
Poor decision making
France Moderate error
14.8
Feb 2009, Boeing 737
Faulty altimeters, FMC reduced thrust
9 fatalities, a/c total loss
Lack of situation awareness
Turkey High error 19.5
March 2009, Airbus 340
Tail strike during dangerous take-off due to erroneous calculations
0 fatalities, minor damage
Failure to follow SOPs
Arab world
Moderate-to-high
18.4
April 2009, BAe-146
Flew into terrain despite repeated instr. warnings
All crew killed, a/c total loss
Lack of SA, cap-tain ignored co-pilot’s warnings
Indonesia High error 18.8
April 2009, Boeing 767
Firm landing, nose damage
No fatalities, structural damage
Erroneous flight control
Arab world
Moderate error
18.4
Apr 2009, De Havilland DHC-8
Aft fuselage grounded on landing
No fatalities, minor damage
Lack of situation awareness
Canada Moderate error
1.9
Apr 2009, McDonnell-Douglas MD-81
Left wing tip struck runway on landing
No fatalities, minor damage
Poor flight control
Japan Moderate+ error
16.9
May 2009, Airbus A320
Tail strike after bounced landing
No fatalities, minor damage
Poor flight control
USA Moderate error
1.7
May 2009, Boeing 747
Flaps retracted with-out warning on T/O
No fatalities, no damage
Exemplary flight skills
UK Excellent 0.2
Table 8-1: Data set for evaluation of action team option of TCT3
Note that this table is similar to Table 7-1, except that the discrepancy scores (in the last
column) were generated via the TCT3 methodology rather than via the TCT2 methodology.
The results from this limited evaluation of the TCT3 have been plotted in the graph of Figure
8-11. As was the case with the TCT2, there appeared to be a significant positive relationship
between discrepancy score and flying performance/accident rate, as one would expect. Note
that, as stated in the previous chapter, all modern passenger jet incidents (from the first six
months of data from the accident website) where the flying crew unambiguously contributed
in a significant way to the outcome of the incident (positively or negatively) were selected.
Incident reports that provided insufficient details were omitted.
The graph of Figure 8-11 also contains the greyed-out results for the TCT2 (which utilised
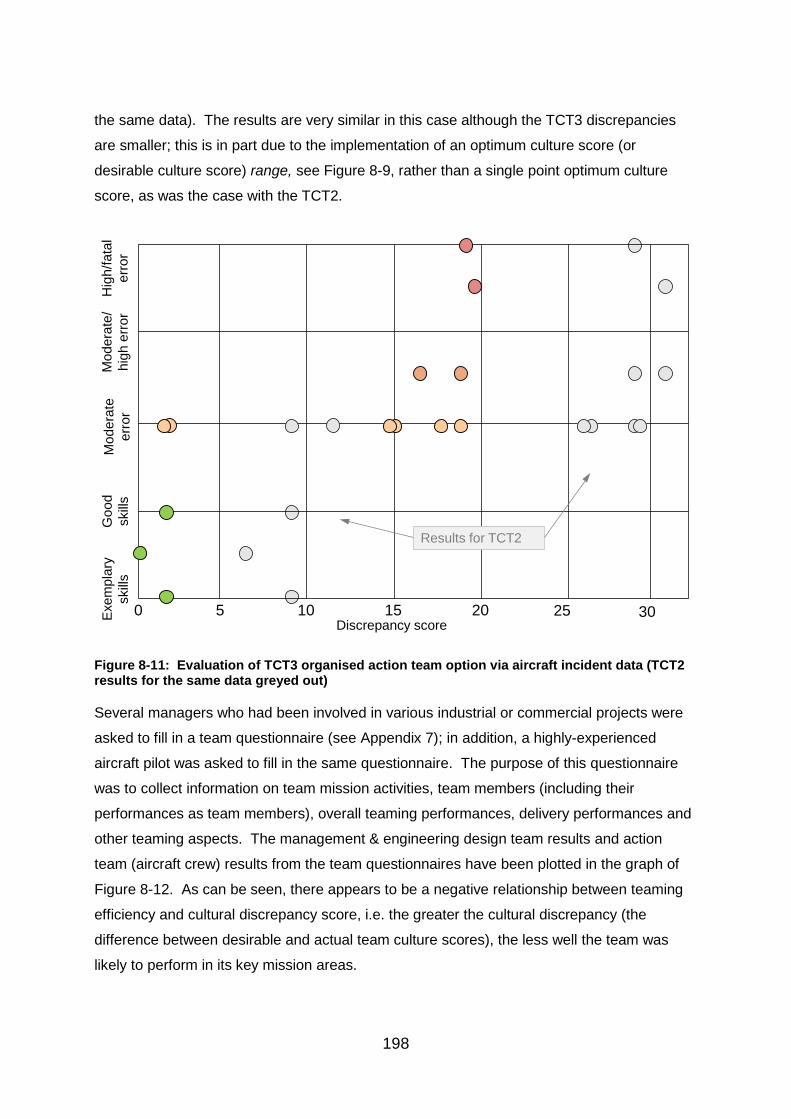
198
the same data). The results are very similar in this case although the TCT3 discrepancies
are smaller; this is in part due to the implementation of an optimum culture score (or
desirable culture score) range, see Figure 8-9, rather than a single point optimum culture
score, as was the case with the TCT2.
Figure 8-11: Evaluation of TCT3 organised action team option via aircraft incident data (TCT2 results for the same data greyed out)
Several managers who had been involved in various industrial or commercial projects were
asked to fill in a team questionnaire (see Appendix 7); in addition, a highly-experienced
aircraft pilot was asked to fill in the same questionnaire. The purpose of this questionnaire
was to collect information on team mission activities, team members (including their
performances as team members), overall teaming performances, delivery performances and
other teaming aspects. The management & engineering design team results and action
team (aircraft crew) results from the team questionnaires have been plotted in the graph of
Figure 8-12. As can be seen, there appears to be a negative relationship between teaming
efficiency and cultural discrepancy score, i.e. the greater the cultural discrepancy (the
difference between desirable and actual team culture scores), the less well the team was
likely to perform in its key mission areas.
Exe
mpl
ary
skill
sM
oder
ate
erro
rM
oder
ate/
high
err
orH
igh/
fata
l er
ror
Goo
d sk
ills
Discrepancy score1510 2050 25 30
Results for TCT2
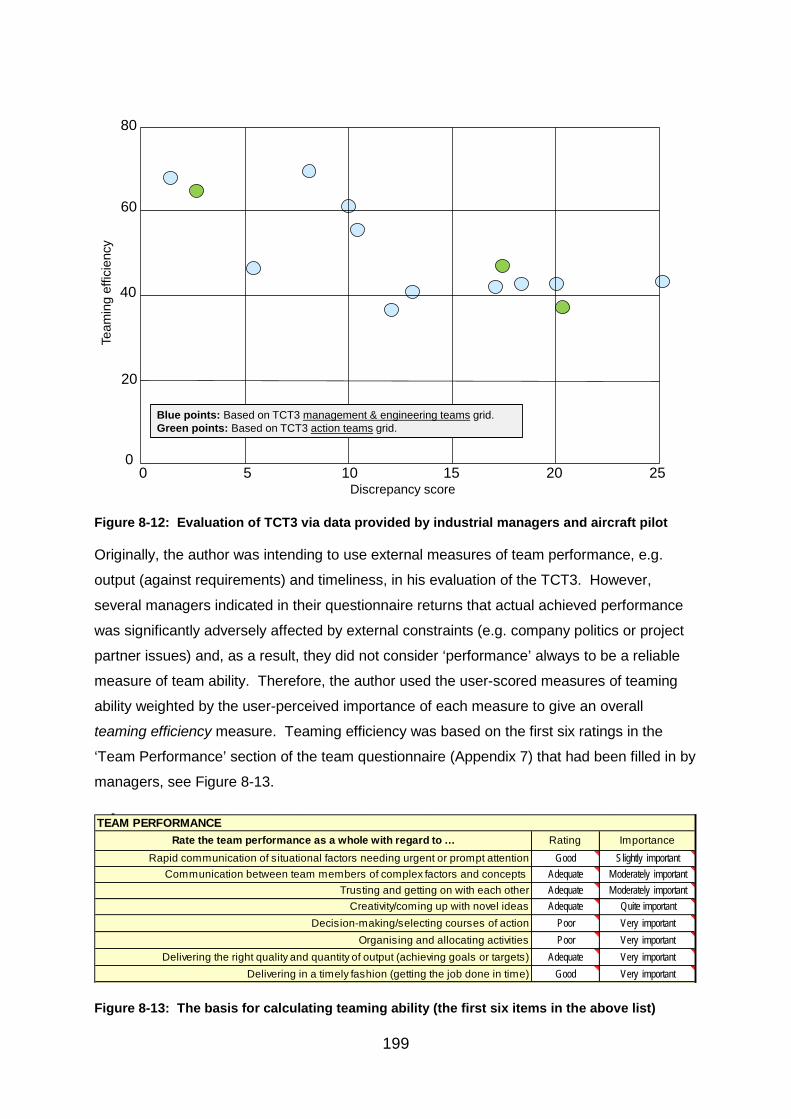
199
Figure 8-12: Evaluation of TCT3 via data provided by industrial managers and aircraft pilot
Originally, the author was intending to use external measures of team performance, e.g.
output (against requirements) and timeliness, in his evaluation of the TCT3. However,
several managers indicated in their questionnaire returns that actual achieved performance
was significantly adversely affected by external constraints (e.g. company politics or project
partner issues) and, as a result, they did not consider ‘performance’ always to be a reliable
measure of team ability. Therefore, the author used the user-scored measures of teaming
ability weighted by the user-perceived importance of each measure to give an overall
teaming efficiency measure. Teaming efficiency was based on the first six ratings in the
‘Team Performance’ section of the team questionnaire (Appendix 7) that had been filled in by
managers, see Figure 8-13.
Figure 8-13: The basis for calculating teaming ability (the first six items in the above list)
0
40
60
80
20
Discrepancy score
Team
ing
effic
ienc
y
151050 20 25
Blue points: Based on TCT3 management & engineering teams grid.Green points: Based on TCT3 action teams grid.
Delivering the right quality and quantity of output (achieving goals or targets) Adequate Very importantDelivering in a timely fashion (getting the job done in time) Good Very important
Decision-making/selecting courses of action Poor Very importantOrganising and allocating activities Poor Very important
Trusting and getting on with each other Adequate Moderately importantCreativity/coming up with novel ideas Adequate Quite important
Rapid communication of situational factors needing urgent or prompt attention Good Slightly importantCommunication between team members of complex factors and concepts Adequate Moderately important
TEAM PERFORMANCERate the team performance as a whole with regard to … Rating Importance
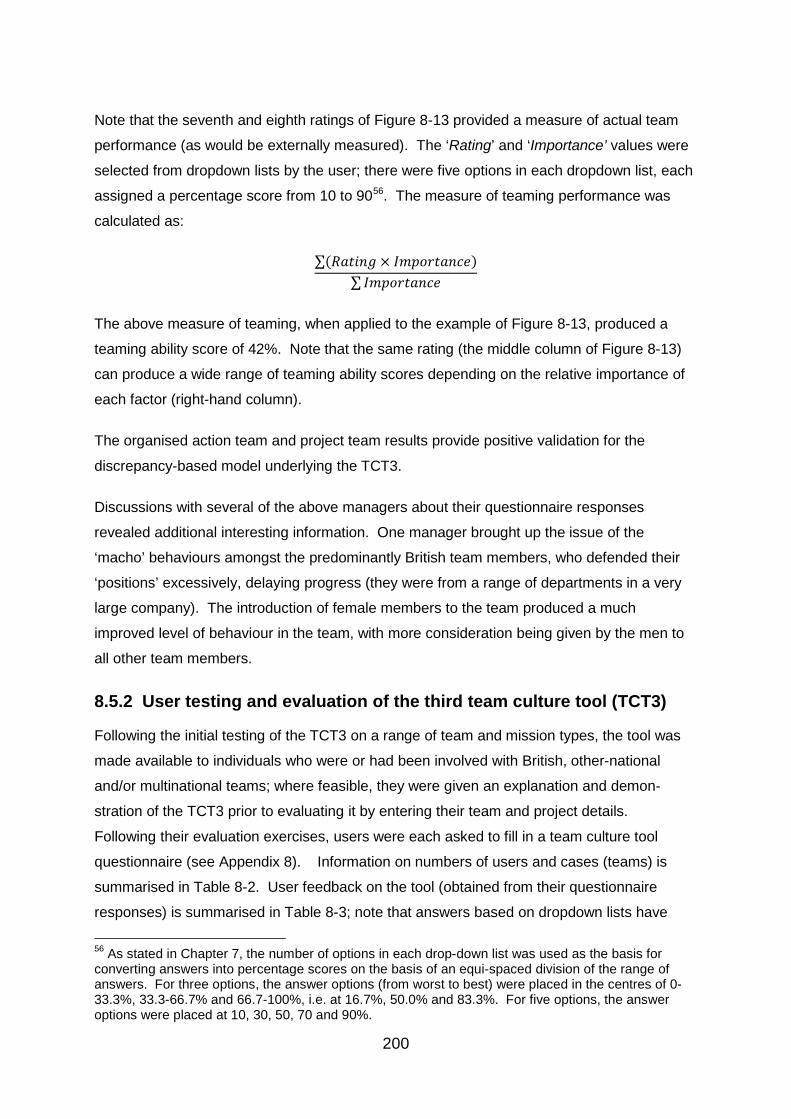
200
Note that the seventh and eighth ratings of Figure 8-13 provided a measure of actual team
performance (as would be externally measured). The ‘Rating’ and ‘Importance’ values were
selected from dropdown lists by the user; there were five options in each dropdown list, each
assigned a percentage score from 10 to 9056. The measure of teaming performance was
calculated as:
∑(𝑅𝑎𝑡𝑖𝑛𝑔 × 𝐼𝑚𝑝𝑜𝑟𝑡𝑎𝑛𝑐𝑒)∑𝐼𝑚𝑝𝑜𝑟𝑡𝑎𝑛𝑐𝑒
The above measure of teaming, when applied to the example of Figure 8-13, produced a
teaming ability score of 42%. Note that the same rating (the middle column of Figure 8-13)
can produce a wide range of teaming ability scores depending on the relative importance of
each factor (right-hand column).
The organised action team and project team results provide positive validation for the
discrepancy-based model underlying the TCT3.
Discussions with several of the above managers about their questionnaire responses
revealed additional interesting information. One manager brought up the issue of the
‘macho’ behaviours amongst the predominantly British team members, who defended their
‘positions’ excessively, delaying progress (they were from a range of departments in a very
large company). The introduction of female members to the team produced a much
improved level of behaviour in the team, with more consideration being given by the men to
all other team members.
8.5.2 User testing and evaluation of the third team culture tool (TCT3)
Following the initial testing of the TCT3 on a range of team and mission types, the tool was
made available to individuals who were or had been involved with British, other-national
and/or multinational teams; where feasible, they were given an explanation and demon-
stration of the TCT3 prior to evaluating it by entering their team and project details.
Following their evaluation exercises, users were each asked to fill in a team culture tool
questionnaire (see Appendix 8). Information on numbers of users and cases (teams) is
summarised in Table 8-2. User feedback on the tool (obtained from their questionnaire
responses) is summarised in Table 8-3; note that answers based on dropdown lists have
56 As stated in Chapter 7, the number of options in each drop-down list was used as the basis for converting answers into percentage scores on the basis of an equi-spaced division of the range of answers. For three options, the answer options (from worst to best) were placed in the centres of 0-33.3%, 33.3-66.7% and 66.7-100%, i.e. at 16.7%, 50.0% and 83.3%. For five options, the answer options were placed at 10, 30, 50, 70 and 90%.
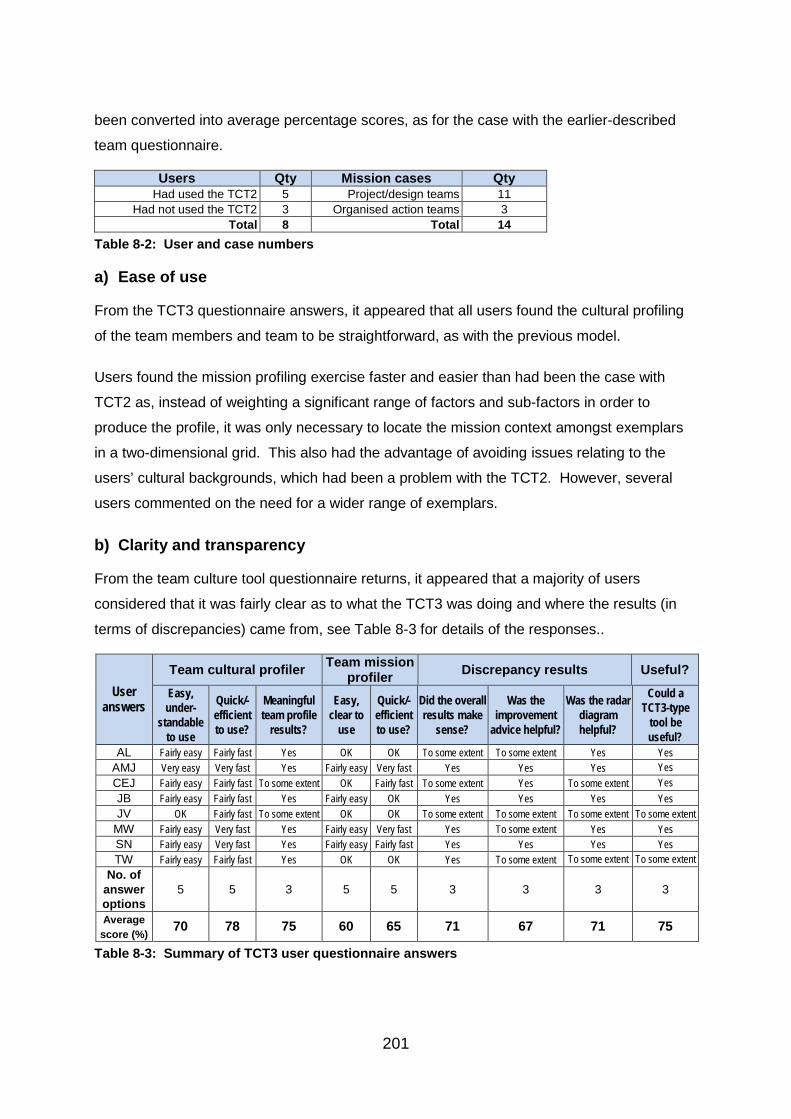
201
been converted into average percentage scores, as for the case with the earlier-described
team questionnaire.
Users Qty Mission cases Qty Had used the TCT2 5 Project/design teams 11
Had not used the TCT2 3 Organised action teams 3 Total 8 Total 14
Table 8-2: User and case numbers
a) Ease of use
From the TCT3 questionnaire answers, it appeared that all users found the cultural profiling
of the team members and team to be straightforward, as with the previous model.
Users found the mission profiling exercise faster and easier than had been the case with
TCT2 as, instead of weighting a significant range of factors and sub-factors in order to
produce the profile, it was only necessary to locate the mission context amongst exemplars
in a two-dimensional grid. This also had the advantage of avoiding issues relating to the
users’ cultural backgrounds, which had been a problem with the TCT2. However, several
users commented on the need for a wider range of exemplars.
b) Clarity and transparency
From the team culture tool questionnaire returns, it appeared that a majority of users
considered that it was fairly clear as to what the TCT3 was doing and where the results (in
terms of discrepancies) came from, see Table 8-3 for details of the responses..
User answers
Team cultural profiler Team mission profiler Discrepancy results Useful?
Easy, under-
standable to use
Quick/-efficient to use?
Meaningful team profile
results?
Easy, clear to
use
Quick/-efficient to use?
Did the overall results make
sense?
Was the improvement
advice helpful?
Was the radar diagram helpful?
Could a TCT3-type
tool be useful?
AL Fairly easy Fairly fast Yes OK OK To some extent To some extent Yes Yes AMJ Very easy Very fast Yes Fairly easy Very fast Yes Yes Yes Yes CEJ Fairly easy Fairly fast To some extent OK Fairly fast To some extent Yes To some extent Yes JB Fairly easy Fairly fast Yes Fairly easy OK Yes Yes Yes Yes JV OK Fairly fast To some extent OK OK To some extent To some extent To some extent To some extent
MW Fairly easy Very fast Yes Fairly easy Very fast Yes To some extent Yes Yes SN Fairly easy Very fast Yes Fairly easy Fairly fast Yes Yes Yes Yes TW Fairly easy Fairly fast Yes OK OK Yes To some extent To some extent To some extent
No. of answer options
5 5 3 5 5 3 3 3 3
Average score (%) 70 78 75 60 65 71 67 71 75
Table 8-3: Summary of TCT3 user questionnaire answers
202
c) Flexibility and adaptability
Users did not comment directly on this aspect.
d) Errors and accuracy
Based on the TCT3 questionnaire answers, four of the five users who had used both the
TCT2 and TCT3 considered that they were less likely to make errors with the TCT3. As with
the second tool, most users considered that the TCT3 would be an adjunct to the team-
picking process, rather than the basis of it and that high accuracy was unimportant. The only
potential issue associated with accuracy was considered to lie with the locations of the
projects/missions on the grids and the resulting desirable cultural profiles.
e) Other user comments
One user commented about the issue of longevity of a team and changing attitudes due to
familiarity – something that the culture tools did not adjust for. Another user suggested that
additional help in terms drop-down boxes to help chose level of technical complexity or
innovation, and more guidance for the social dimension.
Some users again commented about the (political) risks in using a culture tool, particularly
one based on stereotypes.
8.6 Limitations to the tool
Limitations were imposed on the scope of the research at an early stage of the study;
however, it is worth reiterating these and other limitations that subsequently arose during the
study.
8.6.1 Scoping limitations
Team analysis and performance prediction is a very wide area of research, which has been
active since the 1950s. In order to complete a meaningful research project on the effects of
culture, it had been necessary, from the beginning, to impose severe scoping limitations. As
a result, most factors relating to team performance, such as personality (and team member
types), leadership, training and stages in team development, were not considered, except
where they directly impinged on cultural aspects of team performance. Therefore, the tool
had limited applicability in terms of identifying a ‘good’ team, but could act as a ‘warning light’
that might lead to reconsideration in circumstances where culture would be likely to lead to
reduced performance.
203
8.6.2 Data availability
In addition to scoping limitations, the limited availability of detailed data from culture-related
studies constrained the degree of progress and tool development that could be achieved,
and also the accuracy of any tool.
8.6.3 A re-examination of the underpinning assumptions of the TCT3
A set of underpinning assumptions was listed in Subsection 8.2.2; it is worth reconsidering
these at this stage.
(a) Capturing the cultural traits of actual or proposed teams:
Comments: Feedback and brief discussions with two of the managers had indicated
that they felt that the actual behaviours within their teams (in particular, within multi-
cultural teams) could vary significantly based on the constraints and cues (and
perhaps implied expectations) within the team and the environment, thus reducing the
effectiveness of culture-based prediction tools such as the TCT3. This is probably
true; however, cultural traits would provide a baseline and, given certain mission-
related contextual cues, should trigger certain behaviours.
(b) Capturing the desirable team cultural traits to achieve a mission: It was
assumed that the mission of a team could be captured sufficiently by placing the team
or mission on a ‘grid’ or map containing a range of exemplar teams; this required the
following:
(i) Capturing the culture-sensitive elements of team missions: It was
assumed that a small number of dimensions could capture the description of a
mission or team with adequate accuracy to enable the cultural traits
associated with optimum performance to be identified.
Comments: The two dimensions chosen for each scenario appeared to
capture sufficient aspects of missions to enable useful culture-based
predictions, if the culture-related data was available (see (ii)).
(ii) Relating culture-sensitive elements of teams/missions to culture traits: It was assumed that the cultural traits required for optimum performance of
the teams/missions of (i) above could be adequately identified by the author;
these included the cultural traits associated with the exemplar teams.
204
Comments: The data from published studies varied widely, and there were
no definitive, high quality studies that could be relied on. As a result, only
limited confidence could be placed in the accuracy of the mission cultural
trait score transformation57. However, the evaluation results appeared overall
to support the relationships between mission context and the cultural traits
that were encapsulated in the TCT3.
(iii) Describing a particular team or mission in terms of the above factors: It was assumed that users had sufficient knowledge to locate their teams with
adequate accuracy within the grid or map.
Comments: In the case of the user evaluation, they appeared to be able to
locate their teams, but several expressed the opinion that more exemplars
were required. These were, in the main, sophisticated managers with whom I
had previously discussed the TCT3 and its purpose; most had also utilised the
TCT2. It was therefore clear that more work needed to be done on exemplars
(more of them, validation of their placing on the grid, and descriptions of their
essential qualities). It was probable that practical versions of a tool such as
the TCT3 would need to be specialised for software projects, civil engineering,
etc., where the exemplars would be much more meaningful to users.
(c) Obtaining useful information from the discrepancies between desirable and actual cultural traits: It was assumed that the cultural discrepancies between actual
and desirable cultural traits, when combined with the associated comments
generated by the model/tool, would be meaningful, i.e. that they would inform the
user of something useful about potential team performance and/or team problems.
Comments: The absolute values of the discrepancies probably meant little to the
users at first. However, after experimenting with the TCT3, e.g. entering differing
team member nationalities and selecting differing team types, the users appeared to
have a feel for the relationships between the discrepancies and the associated
messages (which were generated by the tool).
In the above assumptions the words ‘adequate’ and ‘adequately’ appeared several times.
These should not be confused with accurate/accuracy. Given the potentially large cultural
and personality variations between individuals, any team culture tool can at best only offer
generalised information about potential team characteristics, the effects of which can be 57 In particular, with regard to masculinity and cultural diversity.
205
mollified or encouraged by training, appropriate management and leadership, or by other
steps. Many internationally-experienced different-culture or multicultural teams would not be
represented accurately (in cultural terms) by any general culture tool.
8.7 Summary of the third model and team culture tool
A dimensionally-based approach (as opposed to a factor-weighting or taxonomic approach)
to team mission profiling was implemented in the third model and team culture tool (TCT3).
The dimension-based approach to missions had three advantages compared to the TCT2:
• Ease of use: The mission profiler was much easier and quicker to use, as it only
required the user to select a location in mission space, guided by pre-existing
exemplars. However it needed more, and more appropriate exemplars, with more
associated explanation, to be a practical, effective general user tool.
• Reduced cultural bias on the part of the user: Users no longer selected factors
that were subject to cultural bias (e.g. management and communication styles);
however, the approach may have increased the risks associated with tool designer
cultural bias (i.e. the author’s western biases).
• Direct associations between mission context and cultural traits: This avoids
issues associated with tasks and behaviours.
The dimension-based approach to missions had two disadvantages compared to the TCT2:
• Limited range of teams/missions: The mission profiler only covered a limited
range of teams – if the mission did not lie within one of the two environments
(design/project teams or organised action teams) then it could not be culturally
assessed.
• Tool inflexibility in a changing world: The mission desirable culture
transformation was fixed – i.e. team members of particular cultural backgrounds were
and would remain discrepant to a particular degree, depending on the mission.
However, in the ‘real world’, changing systems, in particular the development of
intelligent ‘automation-as-a-crew-member’ systems could obviate, or at least reduce,
cultural issues. As long as the tool is only used as a rough guide to potential
culturally-related problems, this should not be a major issue.
206
It proved impracticable to implement a single comprehensive multidimensional system, as
the dimensions required by different teams varied to such a degree that a comprehensive
system would have been effectively unusable; also additional dimensions were required to
assist the user to place the team58. It would be worth investigating a ‘dimension-hiding’
approach using a sophisticated programming environment at a later stage (a topic for future
work).
Two dimension-based team types – design/project teams and organised action teams (or
swift-start action teams) were successfully validated and user-evaluated. These were the key
teams of interest to the stakeholders identified in this thesis.
The TCT3 could be regarded as an implementation of a theory about the culture-
performance relationship, based on the pragmatist principle (Charles Teddlie & Abbas
Tashakkori 2009, Table 4.1, p.74), i.e.:
“Theories are viewed instrumentally (they are “true” to differing degrees based on
how well they currently work; workability is judged especially on the criteria of
predictability and applicability).”
58 As an example, a dimension relating to team member specialisation was introduced for action team mission selection; this spread the team types out and enabled the user to differentiate his/her mission, and place it effectively. In this case, specialisation did not play a significant part in deriving the desirable cultural profile.
207
9 Discussion and analysis
9.1 Introduction
The purpose of this chapter is to describe and critically analyse the ‘research path’ for
readers, then to highlight the key achievements, problems and limitations of the research
against the objectives and, finally, to detail the contributions to knowledge, limitations, novel
outputs and further research opportunities. These will be summarised in the conclusions of
the following and final chapter.
The use of teams in industry and commerce has increased rapidly over the last several
decades. In the case of multinationals, they have increasingly utilised ‘other culture’ or
‘different culture’59 teams and, in their home countries, multicultural teams. Whereas much
research has been carried out on team theory, particularly in the English-speaking world, this
has tended to be applied to single culture, typically ‘Anglo’60 teams. The research commu-
nity’s theoretical understanding of the performance of ’other-culture’ teams and multicultural
teams is much less developed, and many of the earlier-developed team-related assumptions
do not apply.
The purposes of the research described in this thesis were to gain an improved knowledge of
the relationships between team member cultural traits and team performance for various
team/task situations, and to encapsulate this knowledge in models and tools that offered the
potential for practicable application by managers and engineers.
9.2 A brief overview of the research activities
Chapter 2 provided a problem statement, identified the key stakeholders and described the
research methodology; the need to follow the pragmatist approach was emphasised in order
to ensure that a tool of potential practicable use emerged out of the work. The chapter then
provided an overview of the solution approach, including the key topic areas for investigation
59 ‘Different culture’ as in the majority of subsidiaries of multinational companies being of different national cultures to the head office and to each other, resulting in implications for the effective place-ment of various forms of research, development and manufacture. 60 As stated earlier in this thesis, the term ‘Anglo’ refers to people of British descent, e.g. British, Irish, Canadian, Anglo-American, New Zealander, Australian, Anglo-South African.
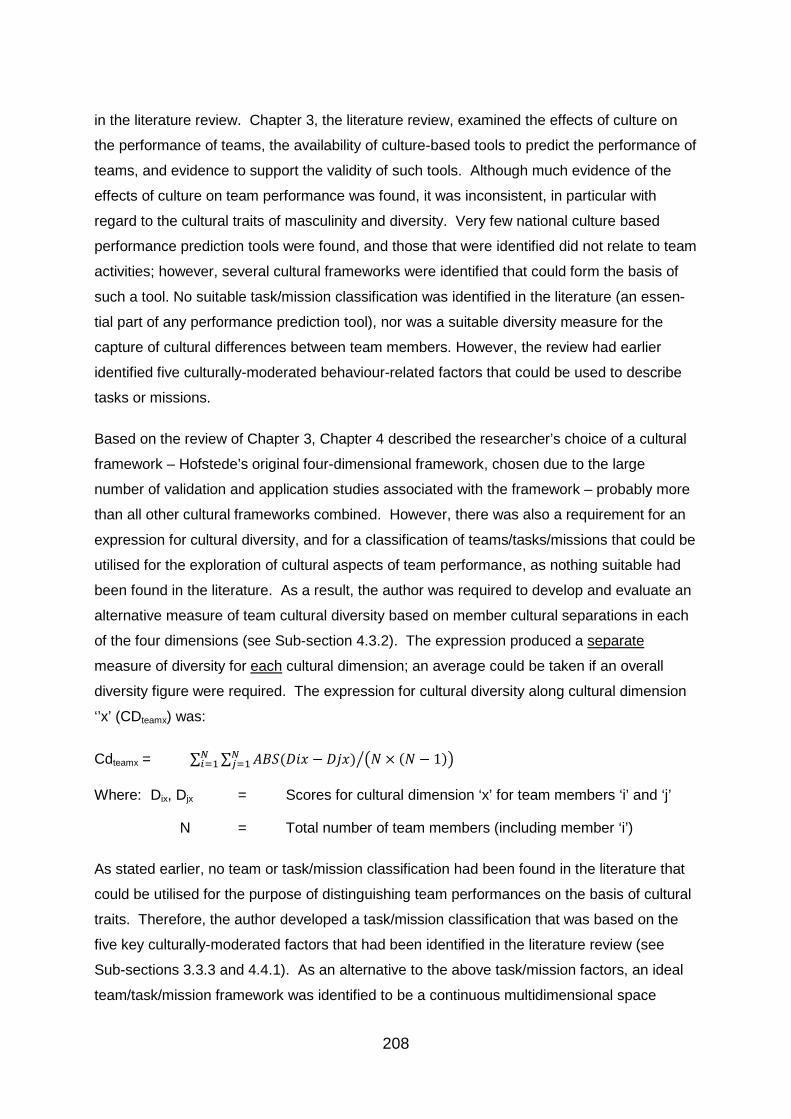
208
in the literature review. Chapter 3, the literature review, examined the effects of culture on
the performance of teams, the availability of culture-based tools to predict the performance of
teams, and evidence to support the validity of such tools. Although much evidence of the
effects of culture on team performance was found, it was inconsistent, in particular with
regard to the cultural traits of masculinity and diversity. Very few national culture based
performance prediction tools were found, and those that were identified did not relate to team
activities; however, several cultural frameworks were identified that could form the basis of
such a tool. No suitable task/mission classification was identified in the literature (an essen-
tial part of any performance prediction tool), nor was a suitable diversity measure for the
capture of cultural differences between team members. However, the review had earlier
identified five culturally-moderated behaviour-related factors that could be used to describe
tasks or missions.
Based on the review of Chapter 3, Chapter 4 described the researcher’s choice of a cultural
framework – Hofstede’s original four-dimensional framework, chosen due to the large
number of validation and application studies associated with the framework – probably more
than all other cultural frameworks combined. However, there was also a requirement for an
expression for cultural diversity, and for a classification of teams/tasks/missions that could be
utilised for the exploration of cultural aspects of team performance, as nothing suitable had
been found in the literature. As a result, the author was required to develop and evaluate an
alternative measure of team cultural diversity based on member cultural separations in each
of the four dimensions (see Sub-section 4.3.2). The expression produced a separate
measure of diversity for each cultural dimension; an average could be taken if an overall
diversity figure were required. The expression for cultural diversity along cultural dimension
‘’x’ (CDteamx) was:
Cdteamx = ∑ ∑ 𝐴𝐵𝑆(𝐷𝑖𝑥 − 𝐷𝑗𝑥)𝑁𝑗=1
𝑁𝑖=1 �𝑁 × (𝑁 − 1)��
Where: Dix, Djx = Scores for cultural dimension ‘x’ for team members ‘i’ and ‘j’
N = Total number of team members (including member ‘i’)
As stated earlier, no team or task/mission classification had been found in the literature that
could be utilised for the purpose of distinguishing team performances on the basis of cultural
traits. Therefore, the author developed a task/mission classification that was based on the
five key culturally-moderated factors that had been identified in the literature review (see
Sub-sections 3.3.3 and 4.4.1). As an alternative to the above task/mission factors, an ideal
team/task/mission framework was identified to be a continuous multidimensional space
209
(rather than a taxonomy), but it was not clear as to the nature of the minimum set of culture-
sensitive dimensions. Three research questions relating to masculinity, uncertainty
avoidance and cultural diversity were also posed in Chapter 4; these cultural dimensions and
diversity measures were relatively under-researched compared to those of power distance
and individualism, and the available evidence of their effects had tended to be contradictory;
it was important to include them in the culture models and tools, therefore an improved
understanding of their effects on team performance was needed.
Chapter 5 described the data collection and analysis activities. These included the collection
of qualitative anecdotal and questionnaire-based data to provide validation (or otherwise) for
some of the assumptions behind the proposed models and tools and the completion of a
range of pilot studies into the performances of ‘other-culture’ and multicultural teams. Based
on the analysis of all the collected data (both qualitative and quantitative), several novel
outputs were produced in answering the three research questions posed in Chapter 3. The
analysis also enabled the elaboration of the relationships between cultural dimensions and
performance factors, including the identification of optimum ‘high’ and ‘low’ culture scores.
Further details of these novel outputs are provided in Section 9.6.
Chapters 6, 7 and 8 described the three culture models and team culture tools developed as
a key part of the author’s research. All models were based on the concept of profiling the
team culture to provide estimates of team average culture scores and cultural diversity
scores for each cultural dimension (see Table 4-7, and Figure 7-3 for example cultural
profiles), but each model utilised a different approach to the generation and application of a
team/task/mission profile. The culture model described in Chapter 6 (TCT1) aimed to derive
a direct culture-based measure of team efficiency (expressed as a percentage). However,
the complex, interrelated calculations were difficult to justify on a theoretical basis; also, the
model was not flexible enough to cover an adequate range of teams, nor was it discrimin-
ating enough to distinguish between different levels of innovation.
The culture model described in Chapter 7 (TCT2) utilised a more sophisticated version of the
team cultural profiler that had been utilised in Chapter 6; this enabled bicultural and
culturally-unique team members to be entered into the profile. However, the model adopted
a very different approach to the evaluation of the effects of team culture on team
performance. A task/mission was profiled by applying weights to the standard set of five
task/mission factors and their sub-factors that had been identified in Chapter 3 and
elaborated in Chapter 4 (see Section 7.4.2 and Figure 7-4); these user-entered weights
indicated which culturally moderated behaviours and capabilities where important and which
210
were not. Each sub-factor in the task/mission profile was associated with a set of desirable
culture dimension scores; by determining the differences between actual team dimension
scores and desirable scores, and factoring these by both the sub-factor and factor
weightings, a set of cultural discrepancy scores was obtained. This set of discrepancies
formed the basis of the assessment of the team’s fit to the task/mission. Whereas the team
culture profiler was easy to use, the task profiler was difficult and unclear for those who had
not worked on the model and, as a result, had low face validity amongst users. Also several
users commented on the efficacy of utilising task or behavioural factors which, some
considered, were probably context-dependent anyway (this is discussed later).
Taking into account the difficulties encountered when using the second tool and user
concerns about the use of behaviours or behaviourally-related tasks, the culture model
described in Chapter 8 (TCT3) utilised a new dimension-based mission context profiler (as
suggested in Chapter 4); users merely placed their mission on a two-dimensional grid that
included exemplars to aid with the placement process. The TCT3 continued to utilise the
same culture profiler as that of the TCT2. The validations of the TCT3 demonstrated a
positive discrepancy/accident relationship for organised action team accident rates, and
negative discrepancy/project performance relationship for project team performances, i.e.
both relationships were confirmatory of the tool’s prediction capabilities. Users found this
tool to be easy to use, and the underlying model to be logical and understandable (see
Section 8.5.2 and Table 8-3 for details).
9.3 A critical analysis of the research Several factors imposed constraints on the research, presented issues, raised requirements
for additional work due to the absence of research results, suitable tools or representations,
or reduced the effectiveness of the research or accuracy of the tools that were developed
during the research. These are discussed further in this section.
9.3.1 The research/creativity/invention/innovation/improvement conundrum
The creation and application of new knowledge is a key part of the work of teams associated
with the design and development of sociotechnical systems. The lack of a suitable creativity
classification methodology in the literature was a major problem – the researchers carrying
out culture/creativity studies could not place their studies accurately, and their fellow
researchers could not place their results accurately in the context of other work. Basic
research, invention, innovation and improvement were significantly different activities that
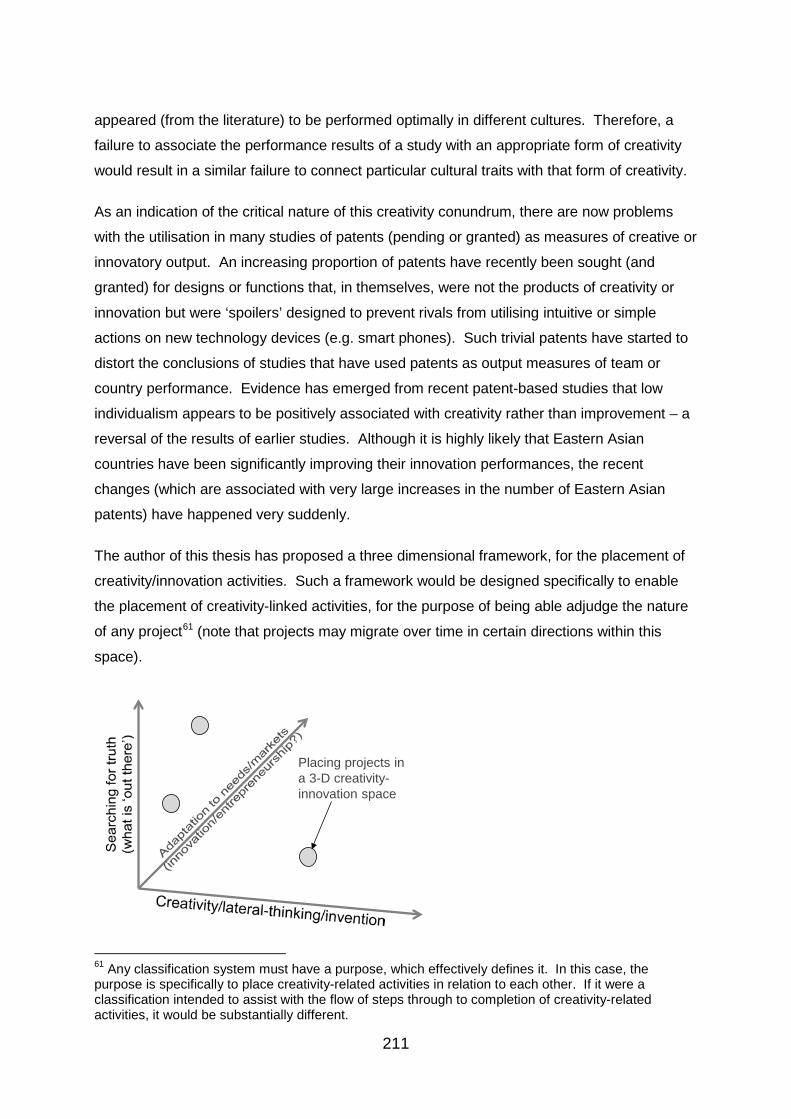
211
appeared (from the literature) to be performed optimally in different cultures. Therefore, a
failure to associate the performance results of a study with an appropriate form of creativity
would result in a similar failure to connect particular cultural traits with that form of creativity.
As an indication of the critical nature of this creativity conundrum, there are now problems
with the utilisation in many studies of patents (pending or granted) as measures of creative or
innovatory output. An increasing proportion of patents have recently been sought (and
granted) for designs or functions that, in themselves, were not the products of creativity or
innovation but were ‘spoilers’ designed to prevent rivals from utilising intuitive or simple
actions on new technology devices (e.g. smart phones). Such trivial patents have started to
distort the conclusions of studies that have used patents as output measures of team or
country performance. Evidence has emerged from recent patent-based studies that low
individualism appears to be positively associated with creativity rather than improvement – a
reversal of the results of earlier studies. Although it is highly likely that Eastern Asian
countries have been significantly improving their innovation performances, the recent
changes (which are associated with very large increases in the number of Eastern Asian
patents) have happened very suddenly.
The author of this thesis has proposed a three dimensional framework, for the placement of
creativity/innovation activities. Such a framework would be designed specifically to enable
the placement of creativity-linked activities, for the purpose of being able adjudge the nature
of any project61 (note that projects may migrate over time in certain directions within this
space).
61 Any classification system must have a purpose, which effectively defines it. In this case, the purpose is specifically to place creativity-related activities in relation to each other. If it were a classification intended to assist with the flow of steps through to completion of creativity-related activities, it would be substantially different.
Placing projects in a 3-D creativity-innovation space
212
Such a framework would enable improved classification of creativity-related activities, leading
to a better understanding of the cultural aspects of creativity, and an improved allocation of
projects around the World. Note that the vertical axis reflected an Eastern view of creativity
as the search for, or a revealing of, a truth that is temporarily hidden from view; the success-
ful collaborations of 113 nationalities of scientists and engineers at CERN implied that the
search for truth (as in fundamental research) was a task for all nations. Recent history would
suggest that the British have been more effective at creativity/lateral-thinking/invention than
adaptation-to-markets/innovation, whereas the Japanese have perhaps been the opposite.
To summarise: The lack of an adequate classification that covered the various forms of
creativity-related activities has resulted in reduced accuracy of the creativity-linked aspects of
this thesis, in particular, the prediction reliability of the sociotechnical project team aspect of
the TCT2 and TCT3 team culture tools was reduced.
9.3.2 The representational accuracy of Hofstede’s and others’ cultural frameworks
Selection of Hofstede’s framework: As stated earlier, Hofstede’s cultural framework was
selected as the basis for culture measurement because of the large number of evaluations of
it over the previous two decades, and the large number of studies that had used the
framework – more than all other quantitative frameworks combined. When the author’s PhD
studies began, a wide range of national scores was available for only four of Hofstede’s
cultural dimensions – power distance, individualism, masculinity and uncertainty avoidance.
A fifth dimension, long term orientation was available, but with only twenty-eight or so
national scores; in addition, there were criticisms of the validity of this dimension. A revised
fifth dimension (LTO-WVS) and a sixth dimension, indulgence vs. restraint (IVR), were
identified and published in 2010, eighteen months after the author’s PhD research had
started. Although many national scores have now been determined for the latter two
dimensions, these scores became available too late for incorporation in the work described in
this thesis; note also that the author could not locate any quantitative cultural studies that had
utilised these two additional dimensions62. See Appendix 10 for a brief discussion of the fifth
and sixth dimensions of Hofstede’s framework.
Limitations of any dimensional framework: As elaborated in Section 4.2, a small number
of quantitative cultural dimensions cannot explain every cultural difference between groups
or nations, and Hofstede’s framework is no different to others in this respect; Subsection
62 In commenting on the lack of studies here, I am referring to the later version of LTO (LTO-WVS) and IVR, not to the earlier version of LTO, for which a limited number of studies were located.
213
4.2.2 provides some surprising examples of cultural bedfellows and strangers.
Extension of the Hofstede framework: There was an obvious issue, commented on in
Subsection 5.6.1, about the incremental extension of cultural frameworks – two further
dimensions had been added to Hofstede’s framework. New dimensions cannot realistically
be ‘tacked on’ to existing frameworks without reducing the independence between
dimensions. Ideally, the introduction of the two new dimensions would have resulted in a re-
examination of all the original and new factors/questions, and an optimal reassignment of all
of them into potentially new dimensions.
Limited meanings of cultural dimension scores: Hofstede’s cultural dimension scores
were normalised so that the range between the lowest and highest scoring countries in each
dimension was 0 to 100 (this changed with the addition of new countries). How low was low
power distance, how high was high? It was difficult to utilise these scores to produce default
values for the ‘high’ and ‘low’ values claimed in the studies of the literature, as the scores
had little intrinsic meaning.
The ecological fallacy: Hofstede repeatedly reminded readers that his cultural framework
applied only at the level of social systems, and that users of his framework should avoid
falling into the ecological fallacy trap, i.e. by making inferences about individuals based on
his data. However, as stated in Section 4.2 of this thesis, a key aspect of the research
described in this thesis related to the prediction of the mismatch between the cultures of
operators of sociotechnical systems and the cultural requirements of those sociotechnical
systems. In many cases, the only knowledge available about operators was their likely
nationalities and (perhaps) their educational levels; it was therefore necessary to work with
the default national culture scores. It would only be possible to determine, on the basis of
actual culture tool performance, whether these default aggregate national scores provided a
useful basis for predicting performance problems. One might reasonably expect that taking
account of national culture when designing systems would produce a more culture-friendly
product or system than not taking account of national culture.
The author of this thesis suggested, in Section 4.2.2, that whereas individuals within a culture
might vary significantly in terms of their own preferences, these individuals would be likely to
vary far less in terms of their expectations of the behaviour of others, and in their actual
behaviours in social situations within their own cultures. This lower variance in behaviour
was likely because cultures imposed a behavioural straitjacket that was particularly strong in
low-individualism, high-power distance or high-uncertainty avoiding cultures, where non-
214
conformance was heavily discouraged. This view appeared to be supported by the
anecdotal evidence collected by the author (see Section 5.2 for a summary). No doubt, the
use of Hofstede’s default country scores for members of small teams (e.g. two or three
member crews) could introduce errors, but there was no alternative but to use the default
cultural scores.
An alternative to Hofstede’s framework: Hofstede’s cultural framework was probably the
only one with a sufficient number of associated studies; therefore it was the only feasible
choice to enable the route that was taken in this PhD study. An alternative approach would
have been to eschew cultural frameworks. Instead, it may have been feasible, firstly, to
access raw (or semi-processed) data on human populations, for example via the World
Value Survey, in order to build culture-related constructs. Secondly it would have been
feasible to access raw data on innovation, industrial outputs, accident rates and other
statistics, for example via The Global Innovation Index, World Intellectual Property
Organization, European Patent Office, US Patent & Trademark Office, Airsafe.com and
World Health Organization. These would have allowed the building of culture models based
on large databases. It would have required considerable statistical analysis, and would
probably have been a high risk strategy for a PhD study.
To summarise: It was unlikely that there would have been sufficient research study results
available with any other framework but Hofstede’s to enable the evidence-based assessment
of culture-performance relationships and the consequent building of the culture tools
described in this thesis. However, the above points, taken together, imply that the default
culture scores, as used in the work of this thesis, were less accurate than would be
desirable. An alternative, rather different approach would have been to use large information
sets such as that of the World Value Survey (WVS) to build cultural constructs, innovation
models, accident models, etc., and to produce predictive tools based on these.
9.3.3 The choice of ‘cultural profile discrepancies’ as the basis for prediction of team performances
Since the 1950s, a very large body of research has been carried out into team performance,
resulting in the identification of many performance-affecting factors and the development of
many frameworks, models and theories, for example Tuckman’s stages model (Tuckman &
Jensen, 1977), Tubbs’ systems model (Tubbs, 1995), Belbin’s team role theory (R M Belbin,
1993) and the balanced team generating model (van de Water, van de Water, & Bukman,
2007). It was impossible, within the constraints of a PhD, to incorporate, adapt and evaluate
these and other team models as part of a larger model and, in any case, such models are not
215
culture-free.
After evaluating the first team culture model and tool, it became clear that a practicable team
culture tool should not attempt directly to forecast overall team performance because this
performance depended on too many non-cultural factors, including those modelled by the
above-listed frameworks. Instead, following analysis of the first culture tool, the TCT1, it was
decided that the team cultural tool should determine the gaps or discrepancies between the
actual team cultural profile and an ‘ideal’ or ‘desirable’ cultural profile that was generated by
the tool; these discrepancies could form the basis for forecasting the likely effects of the
team’s cultural traits on performance.
To summarise: The choice of some of form of discrepancy between actual and desirable
team cultural profile appeared to have been the only practicable option, given our current
limited understandings of culture.
9.3.4 Task classifications
From an external perspective (e.g. the viewpoint of the customer, the enterprise or the
department), the key team performance measures typically related to the effectiveness or
safety and/or timeliness with which the team carried out its tasks or missions. It was there-
fore considered necessary, when defining a team, to consider the key tasks that it had to
perform successfully and the behaviours that were required; this appeared to necessitate the
adoption of some form of task/behaviour classification scheme. The literature review (Sub-
section 3.4.4) revealed that there were no team task classification systems that could be
adapted to provide a culture-sensitive team task scheme. It also revealed that a taxonomic
approach was likely to be ineffective, as it would introduce both complexity and inaccuracy
(Hollenbeck et al., 2012). As stated earlier, five task factors were identified and their sub-
task/behavioural factors were also identified; each of these behavioural sub-factors had an
optimum or ideal set of culture scores associated with it, based on the literature and the
author’s pilot studies. The first team culture tool (TCT1) task representation was based on
three of these factors, the second team culture tool (TCT2) task/mission representation was
based on all five of these factors and their sub-tasks/behaviours (see Section 4.4.1 for
details).
Evaluations of the five-factor/behavioural sub-factor approach utilised in the TCT2 produced
results that were in line with the literature and with the author’s expectations. However, two
users who evaluated the TCT2 had concerns about the direct associations between sub-
factor behavioural requirements and cultural traits, as they felt that these links were
216
conditional on situations. These concerns are discussed further in the next subsection.
9.3.5 Implications of the critical analysis for the validity of the initial assumptions
The initial assumptions (stated originally in Chapter 1) are listed below. Some comments are
made as to the individual assumptions. However, these assumptions are effectively inter-
linked, and it is the performance of the overall tool that reveals the validity (or otherwise) of
the set of assumptions; therefore, a separate discussion of the overall performance is
presented at the end.
The cultural properties (i.e. ‘cultural profiles’) of teams could be usefully modelled63 by quantifying team member cultural values along a limited number of ‘cultural dimensions’:
Based on the analysis of Subsection 9.3.2, the framework is almost certainly less accurate
than was originally thought. However, it is probably the way in which the researcher applies
the framework that is more important than its accuracy, Therefore this assumption largely
held true.
The tasks that teams performed (i.e. their task profiles) could be modelled in terms of behavioural factors that were directly affected by team culture:
As stated earlier, a five-factor/behavioural sub-factor generic representation of mission tasks
was produced, the sub-factors of which were clearly identified in the literature as being
affected by cultural traits, therefore this assumption largely held true.
Relationships between culture dimension scores and the performance of task behavioural factors could be established:
Based on the literature and on the results of author’s own studies, ‘optimum’ cultural
dimension scores were identified and associated with behavioural factors. This assumption
effectively held true.
Models that incorporated team cultural profiles and task/behavioural profiles could be used to predict the effect of team culture on team performance:
The second team culture tool incorporated the team cultural profile and task/behavioural
63 In this context, ‘usefully modelled’ implies that the cultural profiles capture some significant differences between teams that influence relative team performance.
217
profile, and the results of applying these to teams and their tasks were appeared
encouraging – increasing discrepancies were generally indicative of decreasingly effective
performance. However, comments from and discussions with former project team managers
who had evaluated the second tool, the TCT, revealed an issue relating to the initiating – or
not – of culturally-modified behaviours by contextual cues. Following these discussions, the
author looked at the literature in this area. It was realised that the actual triggering of
culturally-modified behaviours cannot be assumed – it depends on the contextual cues, and
degree of prior priming. This implies that the previously assumed culture behaviour
relationships are not as rigid (or reliable) as has been thought. The relationships are still
there, but cannot be assumed to cause the expected behaviour in all circumstances.
Unfortunately, it was also clear from the literature that researchers’ understandings of the
effects of contextual cues for culture-related behaviour were concentrated on the collectivism
– individualism dimension. A decision was therefore made to replace the task/behavioural
factors with direct associations between cultural traits and key mission contexts. Relation-
ships were established for two major team/task/mission types – organised action teams, and
a limited range of project teams. It was not possible to disentangle the many contextual cues
that might pay a part, as current research-based understandings were not adequate.
Although the second tool, based on these assumptions, demonstrated reasonable predictive
power in terms of showing associations between cultural discrepancies and reduced
performance or safety, the basic assumption of a direct link between culture and behaviour
was not strictly true.
To summarise: The original fourth assumption of a direct link between cultural traits and
behaviours was an oversimplification, and would lead to inaccuracy under some, perhaps
many, circumstances.
9.4 What could have been done differently with hindsight?
The author underestimated several aspects of the research and, with hindsight, could have
achieved more. Problem areas included:
Lack of access to published study data: Although it initially appeared that a significant
amount of quantitative data was available in published form, few studies were directly
comparable to each other due to the differing combinations of input and output variables,
correction factors, etc.; also, in most cases, the datasets used by other authors were not
available. The author contacted several researchers with a view to obtaining the raw data
218
that would enable comparative analysis, without success. This is, perhaps, understandable,
as the author spent many months collecting, processing and analysing data, and would
probably be less than happy to hand that data over to a stranger unless there was an option
of collaborative work.
With hindsight, the author would have spent more time at an early stage familiarising himself
with the key international data sources, e.g. United Nations (UNSD/UNdata), European
Union (Eurostat), World Values Survey (WVS) World Intellectual Property Organization
(WIPO), United States Patent and Trademark Office (USPTY), and the European Patent
Office (EPO). The WVS is the only source (as far as this author was aware) of international
comprehensive, timeline data on attitudes. A better understanding of the above (and other
similar) data sources would have enabled the author to develop a wider range of statistical
studies of his own, although this work would have been very time-consuming. The author did
access and utilise some international data sources, for example air accident databases.
Team/task/mission classifications: The lack of a suitable classification was a major
delaying factor in the research. With hindsight, the author would have spent more time
developing and analysing a multidimensional team/task/mission representation. The work
on this was started relatively late in the PhD, partially driven by user issues that arose with
the classification approach that had been initially adopted.
Cognitive neuroscience aspects of culture: The author has, for many years, been
interested in the cognitive neuroscience of affect, the associated behaviour, and (more
recently) the culturally-shaped modifications to that behaviour. He spent a significant part of
the early phase of the PhD studying this area; in particular, the work of Jaak Panksepp and
Peter Richerson appeared to offer a basis for new theories of affect and culture. With
hindsight, the author recognises that this, though fascinating, was a step too far. The time
should have been devoted to more accessible culture-related work.
9.5 Meeting the research aims and objectives
The original aims of the research were to develop an improved understanding of the factors
(in particular cultural factors) that influenced the effectiveness of teams, and to create a
methodology and toolset for the evaluation of project teams and sociotechnical system
operators and crews. The associated objectives are listed below, with brief descriptions of
the associated achievements:
• To identify the culturally-related factors that contributed most to variances in

219
team attitudes, behaviours and performances: This was achieved for a limited
range of team types, including project teams involved in creative and innovatory work
(e.g. sociotechnical system design), sociotechnical system operators and crew.
However, due to the extreme variance in the results from published research studies,
the effects of the cultural dimension ‘masculinity’, and the effects of cultural diversity
on team performance were less clear than those of the others (power distance,
individualism and uncertainty avoidance).
The author considers that he has only partially met this objective as the highly
variability for masculinity (in particular) in the published study results has limited the
accuracy of the work
• To identify a task classification relevant to culturally-moderated team performance: This proved difficult, as no team/task classification found in the
literature was either broad enough or could reasonably be linked to culturally-modified
behaviours. The author developed a five factor team/task/mission classification
(based on the literature, see Sub-sections 3.3.3 and 4.4.1); although there were
minor user difficulties and face validity issues, these could have been tackled. Issues
associated with the link between culture, contextual cueing and behaviour reduced
the potential reliability of the second model; therefore, a dimension-based mission
representation was introduced in the third model.
The author considers that he has partially achieved this objective.
• To build a model that incorporates the above factors for the prediction of the effects of culture on team performance when tackling specified types of task: Two detailed culture/mission models and their associated tools were developed
based on results from the literature and the author’s pilot studies (see Figures 5-1
and 5-2); one of these models covered organised action teams (including socio-tech-
nical system operators and crews), the other covered project teams carrying out
various levels of innovation (including socio-technical system design & build projects).
The author considers that he has achieved this objective, subject to the limitations
associated with cultural contexts.
• To encapsulate the above model(s) in a methodology and tool in order to:
o Facilitate the selection of successful teams in given situations.
220
o Enable the prediction of the effects of culture on team performance, and likely success or failure, of existing or proposed teams.
The first team culture tool attempted directly to predict team performance; however,
this was not considered to be based on a viable model. The second and third tools
encapsulated the above models (in different forms) to enable the selection of team
members and the prediction of potential performance reduction, based on cultural
discrepancies between actual and desirable team culture. It is considered that, for a
restricted set of teams (engineering/management project teams and organised action
teams) the tools have successfully encapsulated the models, and have been verified
and validated to a limited extent.
9.6 Contributions to knowledge and novel outputs
The contributions to knowledge and novel outputs are listed and described below.
1. An improved understanding of the relationships between uncertainty avoidance & cultural diversity (as measured by cultural dimension scores) and team performance factors (see Section 5.4).
The above results were important, in particular the findings with regard to cultural
diversity. The confirmation of the effects of uncertainty avoidance on creative
performance, and importantly in situations where ’sticking to the rules’ was important
were valuable. In the literature, cultural diversity was typically measured as a single
crude value based on the number and proportion of different nationalities. Such a
measure was highly insensitive to actual cultural diversity between individuals of
different cultures64, so it is hardly surprising that study results were contradictory.
Research by the author indicates that it was specific forms of diversity (e.g.
masculinity diversity or uncertainty avoidance diversity) that affected specific
task/mission situations; the author’s statistical results also showed that overall cultural
diversity (taken across the four original Hofstede dimensions) seldom appeared as
statistically significant. This result was important and, if other researchers were to
adopt similarly sensitive measures, consistent results relating to the effects of cultural
diversity might begin to emerge.
64 A team consisting of one each of British, Irish, Canadian and Australian members would typically be considered maximally diverse, despite the extremely similar cultural dimension scores amongst its members; a team consisting of two Saudi Arabian and two Swedish members would be considered less diverse despite the almost completely opposite cultural dimension scores associated with the two nationalities.
221
2. Significantly greater detail in the relationships between cultural dimension scores and team performance factors: These were encapsulated in the graphs of
Figures 8-3 to 8-5.
3. A theoretically-justifiable model of the effects of team culture on team performance: The discrepancy-based approach sidestepped the potential issues
caused by the many other factors associated with team performance. It enabled the
prediction of the effects of team culture of the team’s potential performance.
4. A practicable user-orientated team culture tool: The author did not come across
any practicable, quantitative culture tools that provided a prediction capability for
user-specified teams. The third team culture tool (TCT3) enabled the creation of a
culture profile for any real team (of up to sixteen members), simply by entering team
members’ nationalities and education levels65, and enabled the creation of a
desirable cultural profile based on the team’s task/mission by a single mouse click on
a two-dimensional grid that includes exemplar teams.
5. A recognition of the limits inherent in simple dimension-based quantitative cultural frameworks: The issue of contextual cueing (or priming) of culturally-
moderated behaviours has yet to be recognised in mainstream research. The author
makes no claim to have advanced the understanding of contextual cues on culture-
moderated behaviours, but feels that the work described in this thesis has drawn
attention to it.
The author claimed, in Chapter 1, that the main contribution to knowledge would be a cultural
theory of work team performance and a validated, quantitative methodology and tool that
would enable the culturally-based assessment and improvement of teams. It is considered
that these contributions have largely been achieved, but see point 5, above.
9.7 What questions can we now ask (that we couldn’t get an answer to before)?
The team culture tool enabled engineer and management users to obtain answers to
questions such as:
• All other things being equal, would it be better from a cultural point of view to move
65 The user could instead enter dual cultural nationalities (for example to reflect a team member’s immigrant background), or could directly enter cultural values based on an individual’s answers to a questionnaire or based on knowledge of the person.
222
our early-stage R&D to the subsidiary in the USA, or the subsidiary in Singapore?
• Why?
• Which countries do current flight deck layouts and automation systems pose the
biggest cultural threats to?
• Why?
9.8 Meeting the requirements of the (primary) stakeholders
The main stakeholders were identified, in Section 1.6, as:
• Organisations that designed and built complex sociotechnical systems:
The third team culture tool could demonstrate the designers/builders cultural profiles
and contrast these with the users’ (operators’, crews’) profiles – enabling
designers/builders to recognise the differences between themselves and users - and
the potential resulting issues. The tool could also show the discrepancies between
the demands of such systems and the culture-moderated abilities of the users.
• Organisations that used complex sociotechnical systems:
The tool could, via the discrepancies, indicate where crew resource management and
other training programmes could potentially reduce cultural mismatches and thereby
improve safety.
• Organisations that assembled and utilised multicultural and other-cultural teams for problem solving and project work:
The tool could demonstrate the effects of different team cultural profiles on proposed
projects of varying levels of creativity and innovation. This would enable organisa-
tions to decide where to place projects and who to select for particular teams.
• Education and training organisations:
The tool could be useful as a general culture teaching aid, and for training students to
deal with other cultures.
Note: The team culture tools were prototypes and would need to have improved data
collection and storage capabilities to be optimised for regular use.
223
9.9 Further work
The work described in this thesis produced methodologies and tools that enabled users to
explore to a limited degree the effects of team member cultural traits on team performance in
certain environments, for certain team/task types. There were several logical avenues for
further development, both pragmatic and theoretical.
On a pragmatic basis, extensions of the current work could include the following:
1. Expansion (or substitution) of the cultural framework
During the work described in this thesis, Hofstede’s cultural framework was expanded
to include a sixth dimension, that of indulgence vs. restraint; culture scores for this
and a modified form of the fifth dimension (long term orientation) became available
towards the end of the author’s research work. Despite the reservations expressed
earlier about long term orientation, it would be useful to explore the effects of these
two additional dimensions on performance; this could be done initially by statistically
reanalysing the existing data used in this thesis with the addition of the two extra
cultural dimensions. A search for relevant publications, conducted shortly before the
completion of this thesis, revealed no studies utilising either of the two additional
Hofstede cultural dimensions that would be relevant to the team types discussed in
this thesis. However, this could be considered to indicate a fertile new area of
investigation.
The more recent framework of Minkov (2011) may offer an interesting alternative.
2. Developing the dimensional representation of tasks/missions
Different sets of task/mission dimensions have been used for the two key team/task/-
mission types currently available in the third team culture tool. It is desirable to
develop a wider-scope set of common dimensions, perhaps incorporating a
dimension-hiding technique so that, for a given task/mission type, only dimensions
and exemplars of relevance to that type would be displayed.
3. Incorporating a model of the contextual cueing of culturally-moderated behaviour
This is a fascinating area, as there are several directions of development currently
taking place. It may be rewarding to explore the cueing (or suppression) of
224
uncertainty-avoiding behaviours, as an understanding of this would be beneficial to
safety and safety training.
4. Developing an organisational culture tool
Although there is currently little in the way of effective quantitative organisational
culture models or tools, Hofstede discusses the power distance/uncertainty
avoidance matrix as a basis for different national and company types. A pragmatic
approach based on a power distance/uncertainty avoidance matrix grid could be
tested against industrial project data in order to assess the potential of the approach;
industrial colleagues have commented several times on the problems caused by
projects involving multiple organisations.
On a more theoretical basis, new developments in tools and analytic techniques are offering
the scope for the development of completely new understandings of culture, personality,
affect and behaviour. These developments provide opportunities to move from statistical
correlation-based models to explanatory, causation-based models:
1. Cognitive neuroscience theories of affect, culture and behaviour
Cognitive neuroscience theories and tools have progressed to the stage where we
are able to observe in real time, and understand, some of the culture-based emotion
moderating pathways and feedback cycles in the brain. The development of causal
explanations of culture will help us to understand culture-based limitations, and also
help us to develop training techniques to reduce or remove such limitations, or work
environments that are more sympathetic to these limitations.
2. Gene/culture interaction and culture-moderating pathways
Clear evidence has already emerged of culture-based selection pressures on human
genes, e.g. the S-allele of the serotonin transporter gene SLC6A4; this example hints
at relationships with uncertainty avoidance and collectivism, and could lead to a
better understanding of the physical and neurochemical pathways through which
uncertainty avoidance is played out. It is likely that there are other culture/gene
interactions that could reveal further details of the fundamental structures behind
cultural and personality traits; in some cases, these interactions could reveal that
certain traits are not fundamental, but are statistical ephemera.
3. Epigenetics and the multigenerational expression of early cultural influences

225
The discovery of epigenetic changes in gene expression that are triggered by
environmental conditions has enabled the study of cultural influences on gene
expression. The yet-little-understood mechanisms that carry such changes across
generations have major ramifications for culture-based changes.
These are exciting times for culture researchers who are willing to look beyond the conven-
tional fields and methods of study.
226
10 Conclusions and recommendations for further work
10.1 Introduction
This chapter summarises the findings of the previous chapter. The statements below are
intentionally brief, more detailed descriptions and supporting material can be found in the
previous chapter.
10.2 Meeting the aims and objectives of the research
The original aims of the research were to develop an improved understanding of the factors
(in particular cultural factors) that influenced the effectiveness of teams, and to create a
methodology and toolset for the evaluation of project teams and sociotechnical system
operators and crews. The associated objectives are listed below, with brief descriptions of
the associated achievements:
• To identify the culturally-related factors that contributed most to variances in team attitudes, behaviours and performances:
This was achieved for a range of team types.
The author considers that he has partially met this objective
• To identify a task classification relevant to culturally-moderated team performance:
Team/task classifications presented in the literature were neither broad enough, nor
could they reasonably be linked to culturally-modified behaviours; therefore, the
author developed a five factor team/task/mission classification and later a dimension-
based task/mission representation.
The author considers that he has partially achieved this objective.
• To build a model that incorporated the above factors for the prediction of the effects of culture on team performance when tackling specified types of task:
227
Two detailed culture/mission models were developed based on results from the
literature and the author’s pilot studies. These covered organised action teams and
innovation-related project teams.
The author considers that he has largely achieved this objective, subject to the
limitations associated with cultural contexts.
• To encapsulate the above model(s) in a methodology and tool in order to:
o Facilitate the selection of successful teams in given situations.
o Enable the prediction of the effects of culture on team performance, and likely success or failure, of existing or proposed teams.
The second and third team culture tools encapsulated the above models (in different
form) to enable the selection of team members and the prediction of potential
performance reduction, rather than absolute performance.
The author considers that he has largely achieved this objective, albeit with limited
validation and verification of the tools.
10.3 Summary of research findings and contribution to knowledge
The author claimed, in Chapter 1, that the main contribution to knowledge would be a cultural
theory of work team performance and a validated, quantitative methodology and tool that
would enable the culturally-based assessment and improvement of teams. The key research
findings are considered to be:
1. Further relationships between uncertainty avoidance (UAI), MAS-diversity and UAI diversity and various aspects of team performance.
The results associated with cultural diversity were novel and of particular importance.
They demonstrated that team performance was affected by cultural diversity
constructs that were constrained to single cultural dimensions and were sensitive to
cultural distance.
2. Detailed relationships between cultural dimension scores and team performance factors were derived for two key types of task/mission.
The two team/task/mission types - sociotechnical system project teams, and socio-
228
technical system operators or crew (organised action teams), were the key types of
concern to the research of this thesis.
3. A theoretically-justifiable model of the effects of team culture on team performance
No other equivalent model was found in the literature. In particular, the incorporation
of discrepancies (between actual team culture and desirable culture) sidestepped the
issues that made team performance prediction extremely difficult.
4. A practicable user-orientated team culture tool encapsulating the above model and relationships
The author did not come across any other practicable, quantitative culture tool that
provided a prediction capability for user-specified teams.
The discrepancy-based model of point 3, above, and the team culture tool of point 4,
combined to achieve the projected contribution to knowledge stated in Chapter 1.
10.4 Further work
New tools and discoveries are now transforming our understandings of the human mind, and
culture is one of the areas that are likely to benefit from these advances. There are several
avenues for further development, some pragmatic and related to the models and tools
described in this thesis; others are more theoretical and take advantage of new research in
the fields of cognitive science, genetics and epigenetics.
On a pragmatic basis, extensions of the current work could include the following:
1. Expansion of the cultural framework used in the team culture tool to include all six of Hofstede’s dimensions
This should improve the accuracy of the team culture tool; it would also assist in the
re-evaluation of prior statistical results in the light of the new dimensions66 and in the
search for new culture/performance relationships.
2. Development of the dimensional representation of tasks/missions to achieve a 66 In order to process various datasets, including a large football dataset, the author developed a range of spread sheet tools that automatically allocate and process national cultural dimension scores for the original four Hofstede dimensions. These tools could be extended to process the current six dimensions.
229
single set of (say) four or five dimensions that covers all teams
This would enable the tool to tackle almost any task/mission configuration.
3. Development of an organisational culture tool that enables examination of the issues faced by multiple organisations working together on large projects
The development of a practical, empirical, successful tool should encourage the
development of a supporting theory in its wake. Also, this what industry wants, now.
On a more theoretical basis, tracking the work and adapting the results of cognitive neuro-
scientists and others could enable major contributions to the field of human culture:
1. The development of explanations for culture-moderated attitudes and behaviours,
based on emerging results from cognitive neuroscience and from simulation tools.
2. The identification of further evidence of culture-based gene selection in order to
understand better the physical and neurochemical pathways through which cultural
and personality traits interact with behaviour.
3. Determination of the effects of epigenetic changes on the reinforcement of cultural
traits and the transmission of those traits across generations.
The author considers the above work as providing an alternative causal-based model of
culture, rather than the current correlation-based model, which explains little, in itself, about
human behaviour.
10.5 Exploitation of the tool
The team culture tool is now part of a package of systems engineering tools that are utilised
in soft systems courses at Loughborough University, and has been used by an M.Eng.
project student for determining team cultural discrepancies at a major consultancy company.
The author has been in discussion with other researchers with regard to combining ‘form’
data with culture data improve the prediction of sports results.
The second and third versions of the Team Culture Tool will be made available to the
Engineering System of Systems (ESoS) Group’s industrial collaborator partners, via the
ESoS website.
230
References AAIB. (2013). AAIB Bulletin S3/2013 Special (p. 4). Farnborough, UK. Retrieved from
http://www.aaib.gov.uk/cms_resources.cfm?file=/AAIB S3-2013 G-EUOE.pdf
Airsafe.com. (n.d.). No Title. Plane Crashes and Other Significant Airline Safety Events by Airline. Retrieved February 11, 2013, from http://www.airsafe.com/airline.htm
Ambos, B., & Schlegelmilch, B. B. (2008). Innovation in multinational firms: Does cultural fit enhance performance? Management International Review, 48(2), 189–206. doi:10.1007/s11575-008-0011-2
Anderson, C. (2011). Top Ten Causes of Project Management Failures. Retrieved from http://www.bizmanualz.com/blog/top-10-causes-of-project-management-failures.html
At-Twaijri, M. I., & Al-Muhaiza, I. A. (1996). Hofstede’s cultural dimensions in the GCC countries: An empirical investigation. International Journal of Value-Based Management, 9(2), 121–131. doi:10.1007/BF00440149
Australian Transport Safety Bureau. (2010). In-flight uncontained engine failure overhead Batam Island, Indonesia 4 November 2010 VH-OQA Airbus A380-842 (No. ATSB Transport Safety Report AO-2010-089) (p. 51). Canberra. Retrieved from http://www.atsb.gov.au/media/2888854/ao-2010-089 preliminary report.pdf
Australian Transport Safety Bureau. (2011). In-flight upset 154 km West of Learmonth, WA 7 October 2008 VH-QPA Airbus A330-303 (No. ATSB Transport Safety Report AO-2008-070 Final) (p. 313). Canberra.
Bacharach, S. B. (1989). Organizational theories: Some criteria for evaluation. Academy of Management Review, 14(4), 496–515.
Bahr, H. M. (2006). Thomas F. O’Dea, the Harvard Values Project, and the mormons: Early lessons on ethnography among the literate. Human Organization, 65(4), 343–352.
Balachandra, R., & Friar, J. H. (1997). Factors for success in R&D projects and new product innovation: A contextual framework. IEEE Transactions on Engineering Management, 44(3), 276–287. doi:10.1109/17.618169
Bangwayo-Skeete, P. F., Rahim, A. H., & Zikhali, P. (2011). Does education engender cultural values that matter for economic growth? Journal of Socio-Economics, 40(2), 163–171.
Baregheh, A., Rowley, J., & Sambrook, S. (2009). Towards a multidisciplinary definition of innovation. Management Decision, 47(8), 1323–1339.
Bargh, J. A. (1984). Automatic and conscious processing of social information. In R. S. Wyer & T. K. Srull (Eds.), Handbook of Social Cognition, Vol. 3 (pp. 1–43). New York: Erlbaum.
Barjak, F. (2006). Team diversity and research collaboration in life science teams: Does a combination of research cultures pay off? University of Applied Sciences Northwestern Switzerland. Retrieved from http://www.netreact-eu.org/documents/DPW2006-02_Team Diversity _Barjak_Franz.pdf
231
Barjak, F., & Robinson, S. (2008). International collaboration, mobility and team diversity in the lifesciences: impact on research performance. Social Geography, 3, 23–36. Retrieved from http://www.soc-geogr.net/3/23/2008/sg-3-23-2008.pdf
Barr, P. S., & Glynn, M. A. (2004). Cultural variations in strategic issue interpretation: relating cultural uncertainty avoidance to controllability in discriminating threat and opportunity. Strategic Management Journal, 25(1), 59–67. doi:10.1002/smj.361
Baskerville, R. F. (2003). Hofstede never studied culture. Accounting, Organizations and Society, 28(1), 1.
Baxter Magolda, M. B. (1992). Knowing and reasoning in college: Gender-related patterns in students’ intellectual development. (U. Delworth, Ed.)The JosseyBass higher and adult education series (p. 446). Jossey-Bass. Retrieved from http://scholar.google.com/scholar?hl=en&q=Baxter+Magolda,+1992&btnG=&as_sdt=1,9&as_sdtp=#0
Beckmann, D., Menkhoff, L., & Suto, M. (2008). Does culture influence asset managers’ views and behavior? Journal of Economic Behavior and Organization, 67(3-4), 624–643. Retrieved from http://peer.ccsd.cnrs.fr/docs/00/61/46/85/PDF/PEER_stage2_10.1016%252Fj.jebo.2007.12.001.pdf
Belbin, R. M. (1993). Team Roles at Work (p. 160). Oxford, UK: Butterworth-Heinemann.
Belbin, R. M. (2004). Management Teams: Why They Succeed or Fail. Management Teams Why They Succeed or Fail (p. 7506). Butterworth Heinemann.
Belbin, R. M. (2010). Team Roles at Work (2nd ed., p. 162). Oxford: Elsevier Ltd.
Belout, A., & Gauvreau, C. (2004). Factors influencing project success: The impact of human resource management. International Journal of Project Management, 22(1), 1–11. doi:10.1016/S0263-7863(03)00003-6
Berthrong, J. H. (1998). Concerning Creativity: A Comparison of Chu Hsi, Whitehead, and Neville (p. 278). Albany, NY: State University of New York Press.
BFU. (2010). Investigation Report 5X003-0/08 (p. 85).
Blau, P. M. (1977). Inequality and Heterogeneity: A Primitive Theory of Social Structure (p. 307). New York: The Free Press.
Blodgett, J. G., Bakir, A., & Rose, G. M. (2008). A test of the validity of Hofstede’s cultural framework. The Journal of Consumer Marketing, 25(6), 339. Retrieved from http://proquest.umi.com/pqdweb?did=1564041431&Fmt=7&clientId=5238&RQT=309&VName=PQD
Bosland, N. (1985). An Evaluation of Replication Studies Using the Value Survey Module (No. 85/2) (Vol. Working Pa). Maastricht, Netherlands: Institute for Intercultural Cooperation, Tilburg.
Bouncken, R. B., & Winkler, V. A. (2008). National and cultural diversity in global innovation teams: Creativity and innovation as a function of cultural team composition. In PICMET ’08 - 2008
232
Portland International Conference on Management of Engineering & Technology. doi:10.1109/PICMET.2008.4599795
Brandes, L., Franck, E. P., & Theiler, P. (2009). The effect from national diversity on team production - empirical evidence from the sports industry. Schmalenbach Business Review, 61, 225–246. doi:10.2139/ssrn.1406933
Brewer, P., & Venaik, S. (2012). On the misuse of national culture dimensions. International Marketing Review, 29(6), 673–683. doi:10.1108/02651331211277991
Brockner, J. (2001). Culture and procedural justice: The influence of power distance on reactions to voice. Journal of Experimental Social Psychology, 37(4), 300–315. doi:10.1006/jesp.2000.1451
Brown, K. (2003). Cultural dimensions of New Zealand entrepreneurial behaviour. In 16th Annual Conference of Small Enterprise Association of Australia and New Zealand (Vol. University).
Buckle, P., & Thomas, J. (2003). Deconstructing project management: a gender analysis of project management guidelines. International Journal of Project Management, 21(6), 433–441. doi:10.1016/S0263-7863(02)00114-X
Budworth, D. (1986). The making (and breaking) of a myth. New Scientist, (1503, April 10th), 70. Retrieved from http://books.google.co.uk/books?id=ikRlsIIuZoQC&printsec=frontcover&dq=new+scientist+1986+issue+1503&hl=en&sa=X&ei=Qk8eUZqaGseJ4ATD6oHADw&redir_esc=y#v=onepage&q=new scientist 1986 issue 1503&f=false
Burke, M., Chan-Serafin, S., Salvador, R., Smith, A., & Sarpy, S. A. (2008). The role of national culture and organizational climate in safety training effectiveness. European Journal of Work and Organizational Psychology, 17(1), 133–152. doi:10.1080/13594320701307503
Cameron, K. S., & Quinn, R. E. (1999). Diagnosing and changing organizational culture based on the Competing Values Framework (review). Response, 59(3), 1–12. doi:10.1111/j.1744-6570.2006.00052_5.x
Cameron, K. S., & Quinn, R. E. (2006). Diagnosing and Changing Organizational Culture: Based on the Competing Values Framework (p. 242). Jossey-Bass.
Carley, W. M. (1998). Crash of Swissair 111 stirs debate on when to stick to procedure. Wall Street Journal Europe, (December 16).
Carter, R. T. (1990). Cultural value differences between African Americans and white Americans. Journal of College Student Development, 31(1), 71–79.
Cartwright, S., & Gale, A. (1995). Project management: different gender, different culture? Leadership & Organizational Development Journal, 16(4), 12–17.
Castrol. (2011). Castrol EDGE Rankings. Retrieved from http://www.castrolfootball.com/rankings/rankings/
Chen, C. C., Chen, X.-P., & Meindl, J. R. (1998). How can cooperation be fostered? The cultural effects of individualism-collectivism. Academy of Management Review, 23(2), 285–304. doi:10.5465/AMR.1998.533227
233
Chen, Y.-F., Metscher, D. S., Smith, M., Ramsay, J., & Mason, R. (2014). The Taiwan Civil Aviation Safety Reporting (TACARE) system in aircraft maintenance: An evaluation of the acceptance of voluntary incident reporting programs. International Journal of Professional Aviation Training & Testing Research, 6(1).
Cheng, C., Chua, R. O. Y. Y. J., Morris, M. W., & Lee, L. (2012). Finding the right mix : How the composition of self-managing multicultural teams ’ cultural value orientation influences performance over time. Journal of Organizational Behavior, 411(January), 389–411. doi:10.1002/job
Chhokar, J. S., Brodbeck, F. C., & House, R. J. (2008). Culture and Leadership Across the World: The GLOBE Book of In-Depth Studies of 25 Societies. Series in Organization and Management (p. 1200). New York, NY, USA: Taylor & Francis Group, LLC.
CHIRP. (n.d.). The UK Confidential Reporting Programme for Aviation and Maritime. Retrieved October 10, 2012, from http://www.chirp.co.uk/information-about.asp
Christoffersen, K., & Woods, D. D. (2002). How to make automated systems team players. Advances in Human Performance and Cognitive Engineering Research, 2(2002), 1–12. Retrieved from http://www.emeraldinsight.com/Insight/ViewContentServlet?contentType=Book&Filename=/published/emeraldfulltextarticle/pdf/10_1016_s1479-3601_02_02003-9.pdf
Cocklin, J. T. (2004). Swissair 111 human factors: Checklist and cockpit communication. Journal of Air Transportation, 9(3), 19–42. Retrieved from http://search.ebscohost.com/login.aspx?direct=true&profile=ehost&scope=site&authtype=crawler&jrnl=15446980&AN=14891788&h=79unwMXLU2mry+HMvVWDwMC3c/luQK54zOs6VSpI1raiKGwXOJLKc4owY4KcEE4lBd662JDZoq571YEdOo0dog==&crl=c
Cohen, S. G., & Bailey, D. E. (1997). What Makes Teams Work: Group Effectiveness Research from the Shop Floor to the Executive Suite. Journal of Management, 23(3), 239–290. doi:10.1177/014920639702300303
Cooke, R. A., & Szumal, J. L. (1993). Measuring normative beliefs and shared behavioral expectations in organizations: The reliability and validity of the Organizational Culture Inventory. Psychological Reports, 72(3c), 1299–1330. doi:10.2466/pr0.1993.72.3c.1299
Cooper, J. R. (1998). A multidimensional approach to the adoption of innovation. Management Decision, 36(8), 493–502.
Cox, T. H., & Blake, S. (1991). Managing cultural diversity: Implications for organizational competitiveness. Academy of Management Executive, 5(3), 45–56. doi:10.5465/AME.1991.4274465
Cozijnsen, A. J., Vrakking, W. J., & IJzerloo, M. Van. (2000). Success and failure of 50 innovation projects in Dutch companies. European Journal of Innovation Management, 3(3), 150–159. doi:10.1108/14601060010322301
Cozzi, G., & Giordani, P. E. (2011). Ambiguity attitude, R&D investments and economic growth. Journal of Evolutionary Economics, 21, 303–319. doi:10.1007/s00191-101-0217-x
d’Iribarne, P., Henry, A., Segal, J.-P., Chevrier, S., & Globokar, T. (1998). Cultures et Mondialisation: Gérer par-delà les Frontieres (p. 360). Paris: Points.
234
Dahlin, K. B., Weingart, L. R., & Hinds, P. J. (2005). Team diversity and information use. Academy of Management Journal, 48, 1107–1123. Retrieved from http://www.stanford.edu/~phinds/PDFs/Dahlin-et-al-AMJ05.pdf
Daily, B. F., Loveland, J., & Stenier, R. (1997). A comparative analysis of reactions from multicultural and culturally homogeneous teams to decision making with and without GDSS technology. ACM SIGCPR Computer Personnel, 18(1), 3–14.
Daley, D. M., & Naff, K. C. (1998). Gender differences and managerial competencies. Review of Public Personnel Administration, 18(2), 41–56.
Deal, T. E., & Kennedy, A. A. (1988). Corporate Cultures: The Rites and Rituals of Corporate Life. Harmondsworth: Penguin.
DeMatteo, J. S., Eby, L. T., & Sundstrom, E. (1998). Team-based rewards: Current empirical evidence and directions for future research. In Research in Organizational Behavior Vol 20 1998 (Vol. 20, pp. 141–183). JAI PRESS INC.
DiStefano, J., & Maznevski, M. L. (2000). Creating value with diverse teams in global management. Organizational Dynamics, 29(1), 45–63. doi:10.1016/S0090-2616(00)00012-7
Dulaimi, M., & Hariz, A. (2011). The impact of cultural diversity on the effectiveness of construction project teams. Engineering Project Organization Journal, 1(4), 213–221. Retrieved from http://www.tandfonline.com/doi/pdf/10.1080/21573727.2011.621419
Dumitrescu, V. M. (2012). The cultural dimension of rhetoric: The use of meiosis and hyperbole in British and American English. Business and Cultural Studies, 8(2), 161–169.
Dutch Safety Board. (2010). Crashed during approach, Boeing 737-800, near Amsterdam Schiphol Airport 25 February 2009 (No. Project No. M2009LV0225_01, 2010). The Hague. Retrieved from http://www.onderzoeksraad.nl/docs/rapporten/Rapport_TA_ENG_web.pdf
Earley, P. C., & Gibson, C. B. (2002). Multinational Work Teams: A New Perspective (Vol. 1, p. 352). Psychology Press.
Earley, P. C., & Mosakowski, E. (2000). Creating hybrid team cultures: An empirical test of transnational team functioning. Academy of Management Journal, 43(1), 26–49. doi:10.2307/1556384
Ebbatson, M. (2009). The Loss of Manual Flying Skills in Pilots of Highly Automated Airliners. Cranfield University.
Ebbatson, M., Harris, D., Huddlestone, J., & Sears, R. (2010). The relationship between manual handling performance and recent flying experience in air transport pilots. Ergonomics, 53(2), 268–277. Retrieved from http://www.ncbi.nlm.nih.gov/pubmed/20099179
Eeckelaert, L., Starren, A., van Scheppingen, A., Fox, D., & Bruck, C. (2011). Occupational Safety and Health Culture Assessment - a Review of Main Approaches and Selected Tools (No. TE-WE-11-005--EN-N) (p. 77). doi:10.2802/53184
Efrat, K. (2014). The direct and indirect impact of culture on innovation. Technovation, 34(1), 12–20. Retrieved from http://www.sciencedirect.com/science/article/pii/S0166497213001028
235
Elron, E. (1997). Top management teams within multinational corporations: Effects of cultural heterogeneity. The Leadership Quarterly, 8(4), 393–412. doi:10.1016/S1048-9843(97)90021-7
Erez, M., & Nouri, R. (2010). Creativity: The influence of cultural, social, and work contexts. Management and Organization Review, 6(3), 351–370. doi:10.1111/j.1740-8784.2010.00191.x
Etzioni, A. (1996). The New Golden Rule: Community and Morality in a Democratic Society (p. 338). New York, NY, USA: Basic Books.
EUNetPaS. (2010). Use of Patient Safety Culture Instruments and Recommendations (p. 32). Aarhus N, Denmark. Retrieved from http://ns208606.ovh.net/~extranet/images/EUNetPaS_Publications/eunetpas-report-use-of-psci-and-recommandations-april-8-2010.pdf
Everdingen, Y. M. Van, & Waarts, E. (2003). The effect of national culture on the adoption of innovations. Marketing Letters, 14(3), 217–232. doi:10.3727/109830403108750786
FAA. (2013). Operational Use of Flight Path Management Systems (p. 277). Washington, DC, USA. Retrieved from http://www.faa.gov/about/office_org/headquarters_offices/avs/offices/afs/afs400/parc/parc_reco/media/2013/130908_PARC_FltDAWG_Final_Report_Recommendations.pdf
Falagas, M. E., Pitsouni, E. I., Malietzis, G. A., & Pappas, G. (2008). Comparison of PubMed, Scopus, Web of Science, and Google Scholar: strengths and weaknesses. The FASEB Journal : Official Publication of the Federation of American Societies for Experimental Biology, 22(2), 338–342. doi:10.1096/fj.07-9492LSF
Fang, T. (2003). A critique of Hofstede’s fifth national culture dimension. International Journal of Cross Cultural Management, 3(3), 347–368. doi:10.1177/1470595803003003006
Federal Aviation Administration Human Factors Team. (1996). The Interfaces between Flightcrews and Modern Flight Deck Systems (p. 208). Retrieved from http://ocw.mit.edu/courses/aeronautics-and-astronautics/16-422-human-supervisory-control-of-automated-systems-spring-2004/readings/interfac.pdf
Fellows, R. (2011). Culture in construction. ARCOM Newsletter, 28(2), 2–3. Retrieved from http://www.arcom.ac.uk/-docs/newsletter/2011_28-2.pdf
Fernandez, R., Kozlowski, S. W. J., Shapiro, M. J., & Salas, E. (2008). Toward a definition of teamwork in emergency medicine. Academic Emergency Medicine, 15(11), 1104–1112. Retrieved from http://www.ncbi.nlm.nih.gov/pubmed/18828831
Fisch, C. O., Block, J. H., & Sandner, P. G. (2013). Chinese university patents: Quantity, quality, and the role of subsidy programs (p. 32). Trier, Germany. Retrieved from http://papers.ssrn.com/sol3/papers.cfm?abstract_id=2304224
Fischer, R., & Poortinga, Y. H. (2012). Are cultural values the same as the values of individuals? An examination of similarities in personal, social and cultural value structures. International Journal of Cross Cultural Management, 12(2), 157–170. doi:10.1177/1470595812439867
Fox, K. (2004). Watching the English: The Hidden Rules of English Behaviour (1st ed., p. 432). London, UK: Hodder & Stoughton.
236
Francesco, A. M., & Chen, Z.-X. (2000). Cross-cultural differences within a single culture: Power distance as a moderator of the participation-outcome relationship in the People’s Republic of China. In BRC Papers on Cross-Cultural Management. Hong Kong, PRC: Hong Kong Baptist University. Retrieved from http://ied.hkbu.edu.hk/publications/ccmp/CCMP200007.pdf
Gallagher, T. (2001a). The value orientations method: A tool to help understand cultural differences. Journal of Extension, 39(6). Retrieved from http://www.joe.org/joe/2001december/tt1.php
Gallagher, T. (2001b). Understanding other cultures: The Value Orientations Method. In Association of Leadership Educators Conference (Vol. Minneapoli). Minneapolis, MN, USA. Retrieved from http://www.leadershipeducators.org/Resources/Documents/Conferences/Minneapolis/Gallagher.pdf
Geiselman, E. E., Johnson, C. M., Buck, D. R., & Patrick, T. (2013). Flight deck automation: A call for context-aware logic to improve safety. Ergonomics in Design: The Quarterly of Human Factors Applications, 21(4), 13–18. doi:10.1177/1064804613489126
Gibbons, A. M., Von Thaden, T. L., & Wiegmann, D. A. (2005). Development of a Commercial Aviation Safety Culture Survey for Maintenance Operations - AHFD-05-06/FAA-05-02. Industrial (Vol. 6, p. 35). doi:10.1021/ie50064a053
Gillen, M. W. (2010). Diminishing skills? Aerosafety World. Retrieved from http://flightsafety.org/aerosafety-world-magazine/july-2010/diminishing-skills
Giustini, D., & Boulos, M. N. K. (2013). Google Scholar is not enough to be used alone for systematic reviews. Online Journal of Public Health Informatics, 5(2), 214. doi:10.5210/ojphi.v5i2.4623
Gluesing, J. C., & Gibson, C. B. (2003). Designing and forming global teams. In Handbook of Cross-Cultural Management. Retrieved from http://ceo.usc.edu/pdf/G035433.pdf
Goncalo, J. A., & Staw, B. M. (2006). Individualism–collectivism and group creativity. Organizational Behavior and Human Decision Processes, 100(1), 96–109. doi:10.1016/j.obhdp.2005.11.003
Graen, G. B. (2006). In the eye of the beholder: cross-cultural lesson in leadership from project GLOBE: A response viewed from the third culture bonding (TCB) model of cross-cultural leadership. Academy of Management Perspectives, 20(4), 95–101. doi:10.5465/AMP.2006.23270309
Graf, L. A., Hemmasi, M., Lust, J. A., & Liang, Y. (1990). Perceptions of desirable organizational reforms in Chinese state enterprises. International Studies of Management & Organization, 20(1/2), 47–56. Retrieved from http://search.ebscohost.com/login.aspx?direct=true&db=buh&AN=5813617&site=ehost-live
Greenberg, J. H. (1956). The measurement of linguistic diversity. Language, 32(9), 109–115.
Gresov, C. (1989). Exploring fit and misfit with multiple contingencies. Administrative Science Quarterly, 34, 431–453. doi:10.5465/AMBPP.1987.17534088
Gudykunst, W. B. (1997). Cultural variability in communication: An introduction. Communication Research, 24(4), 327–348. doi:10.1177/009365097024004001
237
Guzzo, R. A., & Dickson, M. W. (1996). Teams in organizations: recent research on performance and effectiveness. Annual Review of Psychology, 47(1), 307–338. Retrieved from http://www.ncbi.nlm.nih.gov/pubmed/15012484
Haas, H., & Nüesch, S. (2012). Are multinational teams more successful? International Journal of Human Resource Management, 23(15), 3105–3113.
Hackman, J. R., & Morris, C. G. (1975). Group tasks, group interaction process, and group performance effectiveness: A review and proposed integration. Advances in Experimental Social Psychology, 8, 45–99. doi:10.1016/S0065-2601(08)60248-8
Halkos, G. E., & Tzeremes, N. G. (2013). Modelling the effect of national culture on countries’ innovation performances: A conditional full frontier approach. International Review of Applied Economics, 27(5), 656–678. doi:10.1080/02692171.2013.778819
Halkos, G., & Tzeremes, N. (2011). The effect of national culture on countries’ innovation efficiency (MPRA Paper 30100) (p. 21). Munich. Retrieved from http://mpra.ub.uni-muenchen.de/30100/1/MPRA_paper_30100.pdf
Hambrick, D. C., Davison, S. C., Snell, S. A., & Snow, C. C. (1998). When groups consist of multiple nationalities: Towards a new understanding of the implications. Organizational Studies, 19(2), 181–206.
Hanges, P. J., & Dickson, M. W. (2006). Agitation over aggregation: Clarifying the development of and the nature of the GLOBE scales. Leadership Quarterly, 17(5), 522–536.
Harris, D., & Li, W.-C. (2008). Cockpit design and cross-cultural issues underlying failures in crew resource management. Aviation, Space, and Environmental Medicine, 79(5), 537–538. doi:10.3357/ASEM.2271.2008
Harrison, R. (1972). Understanding your organization’s character. Harvard Business Review, 50(3), 119–128. Retrieved from http://search.ebscohost.com/login.aspx?direct=true&db=buh&AN=3866987&site=ehost-live
Harzing, A.-W. (1999). Managing the Multinationals: An International Study of Control Mechanisms (p. 432). Cheltenham, UK: Edward Elgar.
Hasan, H. M., & Ditsa, G. (1999). The impact of culture on the adoption of IT: An interpretative study. Journal of Global Information Management, 7(1), 5–15.
Helmreich, R. L., & Merritt, A. C. (2001). Culture at Work in Aviation and Medicine: National, Organizational and Professional Influences (Vol. 2nd, p. 332). UK: Ashgate Publishing Limited.
Helmreich, R. L., Merritt, A. C., & Wilhelm, J. A. (1999). The evolution of crew resource management training in commercial aviation. The International Journal of Aviation Psychology, 9(1), 19–32. Retrieved from http://www.ncbi.nlm.nih.gov/pubmed/11541445
Herbig, P. A., & Miller, J. C. (1992). Culture and technology: Does the traffic move in both directions. Journal of Global Marketing, 6(3), 75. Retrieved from http://search.ebscohost.com/login.aspx?direct=true&db=buh&AN=5353375&site=ehost-live
238
Herbig, P., & Dunphy, S. (1998). Culture and innovation. Cross Cultural Management: An International Journal, 5(4), 13–21.
Herbig, P., & Jacobs, L. (1998). Culture as an explanatory variable for the Japanese innovative processes. Cross Cultural Management An International Journal, 5(3), 5–30. doi:10.1108/13527609810796808
Higgins, E. T. (1996). Knowledge activation: Accessibility, application and salience. In E. T. Higgins & A. W. Kruglanski (Eds.), Social Psychology: Handbook of Basic Principles (pp. 133–168). Ney York: Guilford Press.
Hills, M. D. (2002). Kluckhohn and Strodtbeck’s Values Orientation Theory. Online Readings in Psychology and Culture, Unit 4. Retrieved November 10, 2012, from http://scholarworks.gvsu.edu/orpc/vol4/iss4/3
Hodgson, A., Hubbard, E.-M., & Siemieniuch, C. E. (2011). Culture and the performance of teams in complex systems. In 2011 6th International Conference on System of Systems Engineering (pp. 95–100). IEEE. doi:10.1109/SYSOSE.2011.5966580
Hodgson, A., Hubbard, E.-M., & Siemieniuch, C. E. (2013). Toward an understanding of culture and the performance of teams in complex systems. IEEE Systems Journal, 7(4), 606–615.
Hodgson, A., Siemieniuch, C. E., & Hubbard, E.-M. (2013). Culture and the safety of complex automated sociotechnical systems. IEEE Transactions on Human-Machine Systems, 43(6), 608–619.
Hodgson, D., & Cicmil, S. (2008). The other side of projects: The case for critical project studies. International Journal of Managing Projects in Business, 1(1), 142–152. Retrieved from http://eprints.uwe.ac.uk/16734/
Hofstede, G. (1986). Cultural differences in teaching and learning. International Journal of Intercultural Relations, 10(3), 301–320. doi:10.1016/0147-1767(86)90015-5
Hofstede, G. (1991). Cultures and Organizations: Software of the Mind. Development (p. 296). McGraw-Hill Publishing Co.
Hofstede, G. (1993). Cultural constraints in management theories. Academy of Management Perspectives, 7(1), 81–94. doi:10.5465/AME.1993.9409142061
Hofstede, G. (2006). What did GLOBE really measure? Researchers’ minds versus respondents’ minds. Journal of International Business Studies, 37(6), 882–896. doi:10.1057/palgrave.jibs.8400233
Hofstede, G. H. (1980). Culture’s Consequences: International Differences in Work-Related Values. Beverly Hills: Sage.
Hofstede, G. H. (1984). Culture’s Consequences: International Differences in Work-Related Values (p. 328). Beverly Hills: Sage Publications Inc.
Hofstede, G. H. (2001). Culture’s Consequences: Comparing Values, Behaviors, Institutions, and Organizations across Nations. Cultures Consequences Comparing Values Behaviors Institutions
239
and Organizations across Nations (2nd ed., Vol. 2nd ed., p. 620). Thousand Oaks, CA: Sage Publications. Retrieved from http://books.google.com/books?id=w6z18LJ_1VsC
Hofstede, G. H. (2002). Dimensions do not exist: A reply to Brendan McSweeney. Human Relations, 55(11). Retrieved from http://www.geert-hofstede.com/dimBSGH.pdf
Hofstede, G. H. (2003). What is culture? A reply to Baskerville. Accounting, Organizations and Society., 28(7), 811.
Hofstede, G. H., Hofstede, G. J., & Minkov, M. (2010). Cultures and Organizations: Software of the Mind: Intercultural Cooperation and its Importance for Survival. Publish (3rd ed., p. xiv, 561 p.). McGraw-Hill. Retrieved from http://books.google.com/books?id=o4OqTgV3V00C
Hofstede, G., & Hofstede, G. J. (2004). Cultures and Organizations: Software of the Mind (Vol. 2, p. 300). McGraw-Hill Professional.
Hofstede, G., Hofstede, G. J., Minkov, M., & Vinken, H. (2008a). VSM 08. Retrieved November 18, 2012, from http://www.geerthofstede.nl/vsm-08
Hofstede, G., Hofstede, G. J., Minkov, M., & Vinken, H. (2008b). VSM08. Retrieved December 08, 2010, from http://www.geerthofstede.nl/vsm-08
Hofstede, G., Neuijen, B., Ohayv, D. D., & Sanders, G. (1990). Measuring organizational cultures: A qualitative and quantitative study across twenty cases. Administrative Science Quarterly, 35(2), 286–316. doi:10.2307/2393392
Hollenbeck, J. R., Beersma, B., & Schouten, M. E. (2012). Beyond team types and taxonomies: A dimensional scaling conceptualization for team description. Academy of Management Review, 37(1), 82–106. Retrieved from http://search.ebscohost.com/login.aspx?direct=true&db=bah&AN=69705782&site=ehost-live
Holtom, M. (1998). BASIS - British Airways Safety Information System. In Proceedings of the ISASI 29th Seminar (pp. 51–53). ISASI.
Hoppe, M. H. (1990). A Comparative Study of Country Elites: International Differences in Work-related Values and Learning and their Implications for Management Training and Development. University of North Carolina at Chapel Hill.
Horwitz, S. K., & Horwitz, I. B. (2007). The effects of team diversity on team outcomes: A meta-analytic review of team demography. Journal of Management, 33(6), 987–1015. doi:10.1177/0149206307308587
House, R. J., Hanges, P. J., Javidan, M., Dorfman, P. W., & Gupta, V. (2004). Culture, Leadership, and Organizations: The GLOBE Study of 62 Societies. GLOBE study of 62 societies. Sage Publications, Thousand Oaks, CA, USA: Sage Publications.
Huang, X., & Van de Vliert, E. (2003). Comparing work behaviors across cultures: A cross-level approach using multilevel modeling. International Journal of Cross Cultural Management, 3(2), 167–182. doi:10.1177/14705958030032002
Huff, L., & Kelley, L. (2003). Levels of trust in individualist versus collectivist societies: A seven-nation study. Organization Science, 14(1), 81–90.
240
Iamratanakul, S., Hernandez, I. P., Castilla, C., & Milozevic, D. Z. Innovation and factors affecting the success of NPD projects: Literature explorations and descriptions. , 2007 IEEE International Conference on Industrial Engineering and Engineering Management (2007). doi:10.1109/IEEM.2007.4419353
Infortunio, F. A. (2003). An Exploration of the Correlations Between Fatal Accident Rates Across Nations and the Cultural Dimensions of Power Distance, Uncertainty Avoidance, Individuality and Masculinity. Argosy University, Sarasota.
INSEAD. (2009). Global Innovation Index 2008-2009. Retrieved June 05, 2011, from http://elab.insead.edu
Jacob, N. (2005). Cross-cultural investigations: Emerging concepts. Journal of Organizational Change Management, 18(5), 514–528.
Jacso, P. (2005). As we may search – Comparison of major features of the Web of Science, Scopus, and Google Scholar. Current Science.
Jing, H.-S., Lu, C. J., & Peng, S.-J. (2001). Culture, authoritarianism and commercial aircraft accidents. Human Factors and Aerospace Safety, 1(4), 341–359.
Jing, H.-S., Peng, S.-J., & Lu, C. J. (2000). On the correlation between cultural background and the commercial aircraft accidents. In ICAS 2000 Congress. Retrieved from http://www.icas-proceedings.net/ICAS2000/PAPERS/ICA0674.PDF
Johne, F. A. (1984). How experienced product innovators organize. Journal of Product Innovation Management, 1(4), 210–223. doi:10.1111/1540-5885.140210
Jones, G. K., & Davis, H. J. (2000). National culture and innovation: Implications for locating global R&D operations. Management International Review, 40(1), 11–39. doi:10.2307/40835865
Jones, M. L. (2007). Hofstede - culturally questionable? In Oxford Business & Economics Conference (pp. 24–26). Oxford, UK.
Joy, S., & Kolb, D. A. (2009). Are there cultural differences in learning style? International Journal of Intercultural Relations, 33(1), 69–85. doi:10.1016/j.ijintrel.2008.11.002
Jung, T., Scott, T., Davies, H. T. O., Bower, P., Whalley, D., McNally, R., & Mannion, R. (2009). Instruments for exploring organizational culture: A review of the literature. Public Administration Review, 69(6), 1087–1096. doi:10.1111/j.1540-6210.2009.02066.x
Kaasa, A., & Vadi, M. (2010). How does culture contribute to innovation? Evidence from European countries. Economics of Innovation and New Technology, 19(7), 583–604. doi:10.1080/10438590902987222
Kaber, D. B., & Endsley, M. R. (1997). Out-of-the-loop performance problems and the use of intermediate levels of automation for improved control system functioning and safety. Process Safety Progress, 16(3), 126–131. doi:10.1002/prs.680160304
Kaber, D. B., & Endsley, M. R. (2004). The effects of level of automation and adaptive automation on human performance, situation awareness and workload in a dynamic control task. Theoretical Issues in Ergonomics Science, 5(2), 113–153. doi:10.1080/1463922021000054335
241
Kahn, L. M. (2000). The sports business as a labor market laboratory. Journal of Economic Perspectives, 14(3), 75–94. doi:10.1257/jep.14.3.75
Kedia, B. L., Keller, R. T., & Julian, S. D. (1992). Dimensions of national culture and the productivity of R&D units. The Journal of High Technology Management Research, 3(1), 1–18. doi:10.1016/1047-8310(92)90002-J
Khare, A. (1999). Japanese and Indian work patterns: A study of contrasts. In H. S. R. Kao, D. Sinha, & B. Wilpert (Eds.), 3rd Symposium on Indigenous Behaviors in Effective Management and Organizations (pp. 121–136). Guangzhou, Peoples Republic of China: Sage Publications, Thousand Oaks, CA, USA.
Khatri, N. (2009). Consequences of power distance orientation in organisations. Vision - The Journal of Business Perspective, 13(1), 1–9.
Kim, S. U. (1999). Determinants and characteristics of the corporate culture of Korean enterprises. In H. S. R. Kao, D. Sinha, & B. Wilpert (Eds.), Management and Cultural Values - the Indigenisation of Organisations in Asia (pp. 86–101). New Delhi, India: Sage Publications.
Kirkman, B. L., Lowe, K. B., & Gibson, C. B. (2006). A quarter century of Culture’s Consequences: A review of empirical research incorporating Hofstede's cultural values framework. Journal of International Business Studies, 37(3), 285–320. doi:10.1057/palgrave.jibs.8400202
Kirton, M. J. (1976). Adaptors and innovators: A description and measure. Journal of Applied Psychology, 61, 759–762.
Klein, G. A., Pliske, R. M., Crandall, B. W., & Woods, D. D. (2005). Problem detection. Methods, 7(1), 14–28. doi:10.1007/s10111-004-0166-y
Klein, G. A., Pliske, R. M., Crandall, B., & Woods, D. (1999). Features of problem detection. In Proc. Human Factors and Ergonomics Society 43rd Annual Meeting, Vol. 1 (pp. 133–137). Sage.
Klein, G., Woods, D. D., Bradshaw, J. M., Hoffman, R. R., & Feltovich, P. J. (2004). Ten challenges for making automation a “team player” in joint human-agent activity. IEEE Intelligent Systems, 19(6), 91–95.
Kluckhohn, F. R., & Strodtbeck, F. L. (1961). Variations in Value Orientations. Evanston, IL, USA: Row, Peterson.
Kochan, T., Bezrukova, K., Ely, R., Jackson, S., Joshi, A., Jehn, K., … Thomas, D. (2003). The effects of diversity on business performance: Report of the diversity research network. Human Resource Management, 42(1), 3–21. doi:10.1002/hrm.10061
Lau, D. C., & Murnighan, J. K. (1998). Demographic diversity and faultlines: The compositional dynamics oforganizational groups. Academy of Management Review, 23(2), 325–340. doi:10.5465/AMR.1998.533229
Laudan, L. (1978). Progress and its Problems: Toward a Theory of Scientific Growth. New Delhi: Ambika Publications.
242
Lee, P. I., & Weitzel, T. R. (2003). Air carrier safety and culture: An investigation of Taiwan’s adaptation to Western incident reporting programs. Journal of Air Transportation, 10(1), 20–37. Retrieved from http://swissair.wikispaces.com/file/view/17265480.pdf
Lee, S., & Saw, S. H. (2011). Nuclear fusion energy-mankind’s giant step forward. Journal of Fusion Energy, 30(5), 398–403.
Levy, Y., & Ellis, T. J. (2006). A systems approach to conduct an effective literature review in support of information systems research. Science Journal, 9(1), 181–212. doi:10.1049/cp.2009.0961
Li, W.-C., Harris, D., & Yu, C.-S. (2008). Routes to failure: analysis of 41 civil aviation accidents from the Republic of China using the human factors analysis and classification system. Accident; Analysis and Prevention, 40(2), 426–434.
Lichtenberg, S. (1983). Alternatives to conventional project management. International Journal of Project Management, 1(2), 101–102. Retrieved from http://www.sciencedirect.com/science/article/pii/0263786383900078
Lin, L.-H. (2009). Effects of national culture on process management and technological innovation. Total Quality Management Business Excellence, 20(12), 1287–1301. doi:10.1080/14783360903250621
Lubart, T. I. (1999). Creativity across cultures in R.J. Sternberg . In R. J. Sternberg (Ed.), Handbook of Creativity (pp. 339–350). Cambridge, UK: Cambridge University Press.
Magnusson, P., Wilson, R. T., Zdravkovic, S., Zhou, J. X., & Westjohn, S. A. (2008). Breaking through the cultural clutter: A comparative assessment of multiple cultural and institutional frameworks. International Marketing Review. doi:10.1108/02651330810866272
Marks, M. A., Mathieu, J. E., & Zaccaro, S. J. (2001). A temporally based framework and taxonomy of team processes. Academy of Management Review, 26(3), 356–376. doi:10.2307/259182
Maslow, A. H. (1943). A theory of human motivation. Psychological Review, 50(4), 370–396. doi:10.1037/h0054346
Maslow, A. H. (1997). Motivation and Personality (3rd ed., p. 489). Pearson.
Maznevski, M. L., DiStefano, J. J., Gomez, C. B., Nooderhaven, N. G., & Wu, P. (1997). Variations in cultural orientations within and among five countries. In Academy of International Business Annual Meeting. Monterrey, Mexico.
Maznevski, M. L., Gomez, C. B., DiStefano, J. J., Noorderhaven, N. G., & Wu, P.-C. (2002). Cultural dimensions at the individual level of analysis: The cultural orientations framework. International Journal of Cross Cultural Management, 2(3), 275–295. doi:10.1177/147059580223001
McClelland, D. C. (1985). How motives, skills, and values determine what people do. Vol 40(7), Jul 1985, 812-825. . American Psychologist, 40(7), 812–825.
McGrath, J. E. (1984). Groups: Interaction and Performance. Groups: Interaction and Performance (p. 320). Englewood Cliffs, NJ: Prentice Hall.
243
McLeod, P. L., Lobel, S. A., & Cox, T. H. (1996). Ethnic diversity and creativity in small groups. Small Group Research, 27(2), 248–264. doi:10.1177/1046496496272003
McSweeney, B. (2002). Hofstede’s model of national cultural differences and their consequences: A triumph of faith – a failure of analysis. Human Relations, 55(1), 89–118. Retrieved from http://www.uk.sagepub.com/managingandorganizations/downloads/Online articles/ch05/4 - McSweeney.pdf
Meeuwesen, L., van den Brink-Muinen, A., & Hofstede, G. (2009). Can dimensions of national culture predict cross-national differences in medical communication? Patient Education and Counseling, 75(1), 58–66.
Meho, L. I., & Yang, K. (2007). Impact of data sources on citation counts and rankings of LIS faculty: Web of science versus scopus and google scholar. Journal of the American Society for Information Science and Technology, 58(13), 2105–2125. doi:10.1002/asi.20677
Menzel, H. C., Krauss, R., Ulijn, J. M., & Weggeman, M. (2006). Developing Characteristics of an Intrapreneurship-Supportive Culture (No. Working Paper 06.10) (p. 54). Eindhoven. Retrieved from www.uquebec.ca/observgo/fichiers/17943_gdo-2.pdf?
Merkin, R. S. (2006). Uncertainty avoidance and facework: A test of the Hofstede model. International Journal of Intercultural Relations, 30(2), 213–228. doi:10.1016/j.ijintrel.2005.08.001
Merritt, A. C. (2000). Culture in the cockpit: Do Hofstede’s dimensions replicate? Journal of Cross-Cultural Psychology, 31(3), 283–301. doi:10.1177/0022022100031003001
Merritt, A. C., & Helmreich, R. (1995). Culture in the cockpit: A multi-airline study of pilot attitudes and values (Vol. 8, pp. 676–681).
Merritt, A., & Ratwatte, S. (1997). Who are you calling a safety threat?! A debate on safety in mono- versus multicultural cockpits. In 9th International Symposium on Aviation Psychology. Columbus, Ohio, USA.
Mihaela, H., Ogrean, C., & Belascu, L. (2011). Culture and national competitiveness. African Journal of Business Management, 5(8), 3056–3062.
Miklos-Thal, J., & Ullrich, H. (2010). Effort incentives in nomination contests: Evidence from professional soccer (unpublished discussion paper) (No. MPRA Paper 24340) (p. 40). Munich, Germany.
Minkov, M. (2011). Cultural Differences in a Globalizing World (First., Vol. 840, p. 320). Bingley, UK: Emerald Group Publishing Limited. doi:10.1097/PSY.0b013e31815b002c
Minkov, M., & Hofstede, G. (2014). A replication of Hofstede’s uncertainty avoidance dimension across nationally representative samples from Europe. International Journal of Cross Cultural Management, 14(1). doi:10.1177/1470595814521600
Morris, M. W., & Leung, K. (2010). Creativity East and West: Perspectives and parallels. Management and Organization Review, 6(3), 313–327. doi:10.1111/j.1740-8784.2010.00193.x
244
Nakata, C., & Sivakumar, K. (1996). National culture and new product development: An integrative review. Journal of Marketing, 60(1), 61–72. doi:10.2307/1251888
National Transportation Safety Board. (2000). Controlled Flight into Terrain, Korean Air Flight 801, Boeing 747-300, HL7468, Nimitz Hill, Guam, August 6, 1997 (p. 212). Washington, D.C., USA. Retrieved from http://www.ntsb.gov/doclib/reports/2000/AAR0001.pdf
National Transportation Safety Board. (2010). Loss of thrust in both engines after encountering a flock of birds and subsequent ditching on the Hudson River US Airways Flight 1549 Airbus A320-214, N106US Weehawken, New Jersey January 15, 2009 (No. Accident Report NTSB/AAR-10/03) (p. 196). Washington.
Naumov, A. I. (2000). Measuring Russian culture using Hofstede’s dimensions. Applied Psychology: An International Review, 49(4), 709–718.
Nemeth, C. J. (1986). Differential contributions of majority and minority influence. Psychological Review, 93(1), 23–32. doi:10.1037/0033-295X.93.1.23
Nevett, T. (1992). Differences between American and British television advertising: Explanations and implications. Journal of Advertising, 21(4), 61. Retrieved from http://proquest.umi.com/pqdweb?did=585386&Fmt=7&clientId=57458&RQT=309&VName=PQD
Niebuhr, A. (2010). Migration and innovation: Does cultural diversity matter for regional R&D activity? Papers in Regional Science, 89(3), 563–585. doi:10.1111/j.1435-5957.2009.00271.x
Nielsen, D., & Roberts, S. (1999). Fatalities among the world’s merchant seafarers (1990 - 1994). Marine Policy, 23(1), 71–80. Retrieved from http://www.sciencedirect.com/science/article/B6VCD-3W0GB9Y-C/2/3cbf8901c65c88b9b18ac0cbe6725c23
Niu, W., & Sternberg, R. (2002). Contemporary studies on the concept of creativity: The East and the West. The Journal of Creative Behavior, 36(4), 269–288. Retrieved from http://creativeeducation.metapress.com/index/A351L756HX7R2831.pdf
Norman, D. A. (1990). The “problem” with automation: inappropriate feedback and interaction, not “over-automation”. Philosophical Transactions of the Royal Society of London - Series B: Biological Sciences, 327(1241), 585–93. doi:10.1098/rstb.1990.0101
Offermann, L. R., & Hellmann, P. S. (1997). Culture’s consequences for leadership behavior: National values in action. Journal of Cross-Cultural Psychology, 28(3), 342–351. doi:10.1177/0022022197283008
Office of Government Commerce. (2005). Common Causes of Project Failure (No. CP0015/01/05) (p. 8). London. Retrieved from http://www.swan.ac.uk/media/cp0015.pdf
OGP. (2010a). A guide to selecting appropriate tools to improve HSE culture (p. 24). London & Brussels. Retrieved from http://www.ogp.org.uk/pubs/435.pdf
OGP. (2010b). Risk Assessment Data Directory (No. 434 – 10) (p. 22). London: International Association of Oil and Gas Producers. Retrieved from http://www.ogp.org.uk/pubs/434-10.pdf
245
Orasanu, J., Fischer, U., & Davison, J. (1997). Cross-cultural barriers to effective communication in aviation. In C. S. Granrose & S. Oskamp (Eds.), Cross-Cultual Work Groups (pp. 134–160). Thousand Oaks, CA, USA: Sage Publications Inc.
Oyserman, D., & Lee, S. W. S. (2008). Does culture influence what and how we think? Effects of priming individualism and collectivism. Psychological Bulletin, 134(2), 311–342. Retrieved from http://www.sciencedirect.com/science/article/B6WY5-4S3FH73-7/2/4a7df5360117c055f8b814e1c1dc9931
Ozkan, T., & Lajunen, T. (2007). The role of personality, culture, and economy in unintentional fatalities: An aggregated level analysis. Personality and Individual Differences, 43(3), 519–530.
Paletz, S. B. F., Peng, K., Erez, M., & Maslach, C. (2003). Ethnic composition and its differential impact on group processes in diverse teams. Small Group Research, 20(10), 1–31. Retrieved from http://iew3.technion.ac.il/~merez/papers/paletz_2004.pdf
Parasuraman, R., Molloy, R., & Singh, I. (1993). Performance consequences of automation-induced “complacency.” The International Journal of Aviation Psychology, 3(1), 1–23. doi:10.1207/s15327108ijap0301_1
Park, H. (2011). Man-made disasters: A cross-national analysis. International Business Review, 20, 466–476. doi:10.1016/j.ibusrev.2010.08.004
Parsons, T., & Shils, E. (1951). Toward a General Theory of Action. Cambridge, USA: Harvard University.
Pearce, R. D. (1990). The Internationalization of Research and Development by Multinational Enterprises (p. 209). New York: Palgrave Macmillan.
Peterson, M. F., & Castro, S. L. (2006). Measurement metrics at aggregate levels of analysis: Implications for organization culture research and the GLOBE project. Leadership Quarterly, 17(5), 506–521.
Peterson, M. F., Smith, P. B., Akande, A., Ayestaran, S., Bochner, S., Callan, V., … Setiadi, B. (1995). Role conflict, ambiguity, and overload: A 21-nation study. Academy of Management Journal, 38(2), 429–452. doi:10.2307/256687
Phillips, K. W., & Phillips, D. J. (2011). National heterogeneity, status, and Blau’s paradox: The case of NHL hockey team performance 1988-1998. (p. 7). Evanston, IL. Retrieved from web.mit.edu/sloan/.../KWP and DJP Hockey.doc
Pinto, J. K., & Mantel, S. J. J. The causes of project failure. , 37 IEEE Transactions on Engineering Management 269–276 (1990). IEEE. doi:10.1109/17.62322
PMI. (2000). A Guide to the Project Management Body of Knowledge 2000 (p. 226). Newtown Square, Pennsylvania, USA: Project Management Institute, Inc.
Putnam, R. D. (1993). Making Democracy Work. Princetown, NJ, USA: Princetown University Press.
Quinn, R. E., & Rohrbaugh, J. (1981). A competing values approach to organizational effectiveness. Public Productivity Review, 5(2), 122–140. Retrieved from http://www.jstor.org/stable/3380029
246
Quinn, R. E., & Rohrbaugh, J. (1983). A spatial model of effectiveness criteria: Towards a competing values approach to organizational analysis. Management Science, 29(3), 363–377. doi:10.1287/mnsc.29.3.363
Ramsden, J. R. (1985). World airline safety audit. Flight International, 29–34.
Rasmussen, L. J., Sieck, W. R., & Smart, P. R. (2008). US/UK mental models of planning: The relationship between plan detail and plan quality. Framework, 1–12. Retrieved from http://eprints.ecs.soton.ac.uk/14911/
Realo, A., & Allik, J. (2009). On the relationship between social capital and individualism–collectivism. Social and Personality Psychology Compass, 3(6), 871–886. doi:10.1111/j.1751-9004.2009.00226.x
Reason, J. T. (2008). The Human Contribution: Unsafe Acts, Accidents and Heroic Recoveries (p. 295). Farnham, Surrey: Ashgate Publishing Limited.
Reep, C., & Benjamin, B. (1968). Skill and chance in association football. Journal of the Royal Statistical Society, 131(4), 581–585.
Repiso-Caballero, R., & Delgado-López-Cózar, E. (2013). The impact of scientific journals of communication: Comparing Google Scholar metrics, Web of Science and Scopus. Comunicar, 21, 45–52. doi:10.3916/C41-2013-04
Rhoades, S. A. (1993). The Herfindahl-Hirschman index. Federal Reserve Bulletin, 79(3), 188. Retrieved from http://www.justice.gov/atr/public/testimony/hhi.htm
Rinne, T., Steel, D., & Fairweather, J. (2013). The role of Hofstede’s individualism in national-level creativity. Creativity Research Journal, 25(1), 129–136. doi:10.1080/10400419.2013.752293
Rinne, T., Steel, G. D., & Fairweather, J. (2012). Hofstede and Shane revisited: The role of power distance and individualism in national-level innovation success. Cross-Cultural Research, 46(2), 91–108. doi:10.1177/1069397111423898
Rothwell, R., & Wissema, H. (1986). Technology, culture and public policy. Technovation, 4(2), 91–115. doi:10.1016/0166-4972(86)90002-7
Russo, K. W. (2000). A sharing of subjectivities: the values project Northwest. In K. W. Russo (Ed.), Finding the Middle Ground: Insight and Applications of the Value Orientations Method (pp. 165–177). Yarmouth, ME, USA: Intercultural Press.
Sarter, N. B. (2000). The need for multisensory interfaces in support of effective attention allocation in highly dynamic event-driven domains: The case of cockpit automation. International Journal of Aviation Psychology, 10(3), 231–245. doi:10.1207/S15327108IJAP1003_02
Sarter, N. B., Mumaw, R. J., & Wickens, C. D. (2007). Pilots’ monitoring strategies and performance on automated flight decks: an empirical study combining behavioral and eye-tracking data. Human Factors, 49(3), 347–357. Retrieved from http://hfs.sagepub.com/cgi/doi/10.1518/001872007X196685
247
Sarter, N. B., & Woods, D. D. (1995a). ’Strong, Silent, and Out-of-the-Loop: Properties of Advanced (Cockpit) Automation and Their Impact on Human-Automation Interactions (No. CSEL 95-TR-01). Columbus, OH.
Sarter, N. B., & Woods, D. D. (1995b). How in the world did we ever get into that mode? Mode error and awareness in supervisory control. Human Factors, 37(1), 5–19. doi:10.1518/001872095779049516
Schein, E. H. (1996a). Culture: The missing concept in organization studies. Administrative Science Quarterly, 41, 229–240.
Schein, E. H. (1996b). Three cultures of management: The key to organizational learning. Sloan Management Review, 38(1), 9–20.
Schröder, T., & Thagard, P. (2013). The affective meanings of automatic social behaviors: Three mechanisms that explain priming. Psychological Review, 120(1), 255–80. doi:10.1037/a0030972
Schwartz, S. H. (1994). Beyond individualism/collectivism: New cultural dimensions of values. In U. Kim, H. C. Triandis, C. Kagitcibasi, S. C. Choi, & G. Yoon (Eds.), Individualism and Collectivism Theory Method and Applications (Vol. 18, pp. 85–119). Sage.
Schwartz, S. H. (1999). A theory of cultural values and some implications for work. Applied Psychology, 48(1), 23–47. doi:10.1111/j.1464-0597.1999.tb00047.x
Schwartz, S. H. (2006). A theory of cultural value orientations: Explication and applications. Comparative Sociology, 5(2), 137–182. doi:10.1163/156913306778667357
Scott, T., Mannion, R., Davies, H., & Marshall, M. (2003). The quantitative measurement of organizational culture in health care: a review of the available instruments. Health Services Research, 38(3), 923–945. Retrieved from http://dx.doi.org/10.1111/1475-6773.00154
Shane, S. (1993). Cultural influences on national rates of innovation. Journal of Business Venturing, 8(1), 59–73. doi:10.1016/0883-9026(93)90011-S
Shane, S. (1995). Uncertainty avoidance and the preference for innovation championing roles. Journal of International Business Studies, 26(1), 47–68. Retrieved from http://www.jstor.org/stable/155477
Shane, S. A. (1992). Why do some societies invent more than others? Journal of Business Venturing, 7(1), 29–46. doi:10.1016/0883-9026(92)90033-N
Shaw, M. E. (1973). Scaling group tasks: A method for dimensional analysis. JSAS Catalog of Selected Documents in Psychology, 3(8).
Sherman, P. J., Helmreich, R. L., & Merritt, A. C. (1997). National culture and flight deck automation: Results of a multination survey. The International Journal of Aviation Psychology, 7(4), 311–329. Retrieved from http://dx.doi.org/10.1207/s15327108ijap0704_4
Simonton, D. K., & Ting, S.-S. (2010). Creativity in eastern and western civilizations: The lessons of historiometry. Management and Organization Review, 6(3), 329–350.
248
Sivakumar, K., & Nakata, C. (2003). Designing global new product teams: Optimizing the effects of national culture on new product development. International Marketing Review, 20(4), 397–445. doi:10.1108/02651330310485162
Smith, P. B., & Bond, M. H. (1998). Social Psychology Across Cultures (2nd ed., p. 416). Harlow, UK: Pearson Education Limited.
Snow, C. C., Snell, S. A., Davison, S. C., & Hambrick, D. C. (1996). Use transnational teams to globalize your company. Organizational Dynamics, 24(4), 50.
Soeters, J. L. (1997). Value orientations in military academies: A thirteen country study. Armed Forces Society, 24(1), 7–32. doi:10.1177/0095327x9702400101
Soeters, J. L., & Boer, P. C. (2000). Culture and flight safety in military aviation. International Journal of Aviation Psychology, 10(2), 111–133. doi:10.1207/S15327108IJAP1002_1
Spikes Cavell Research Company. (1998). The Bull Survey. London.
Stahl, G. (2010). Perspective: group cognition factors in sociotechnical systems. Human Factors, 52(2), 340–343. Retrieved from http://hfs.sagepub.com/cgi/doi/10.1177/0018720810369491
Stahl, G. K., Mäkelä, K., Zander, L., & Maznevski, M. L. (2010). A look at the bright side of multicultural team diversity. Scandinavian Journal of Management, 26(4), 439–447. doi:10.1016/j.scaman.2010.09.009
Stahl, G. K., Maznevski, M. L., Voigt, A., & Jonsen, K. (2007). Unraveling the diversity-performance link in multicultural teams: Meta-analysis of studies on the impact of cultural diversity in teams. Journal of International Business Studies, 36, 1–49. Retrieved from http://scholar.google.com/scholar?hl=en&btnG=Search&q=intitle:Unraveling+the+diversity-performance+link+in+multicultural+teams:+Meta-analysis+of+studies+on+the+impact+of+cultural+diversity+in+teams#0
Steel, P., & Ones, D. S. (2002). Personality and happiness: A national-level analysis. Journal of Personality and Social Psychology, 83, 767–781.
Steiner, I. D. (1972). Group Process and Productivity (p. 204). Academic Press, Inc.
Stirling, A. (1999). On the economics and analysis of diversity. Brighton: Science Policy Research Unit, University of Sussex.
Stirling, A. (2007). A general framework for analysing diversity in science, technology and society. Journal of the Royal Society Interface the Royal Society, 4(15), 707–719. Retrieved from http://rsif.royalsocietypublishing.org/content/4/15/707.full
Strauch, B. (2010). Can cultural differences lead to accidents? Team cultural differences and sociotechnical system operations. Human Factors, 52(2), 246–263. doi:10.1177/0018720810362238
Swigger, K., Brazile, R., Harrington, B., Peng, S., & Alpaslan, F. A case study of student software teams using computer-supported software. , Proceedings of the 2005 International Symposium on Collaborative Technologies and Systems 2005 (2005). doi:10.1109/ISCST.2005.1553309
249
Taras, V., Kirkman, B. L., & Steel, P. (2010). “Examining the impact of Culture’s Consequences: A three-decade, multilevel, meta-analytic review of Hofstede's cultural value dimensions”: Correction to Taras, Kirkman, and Steel (2010). The Journal of Applied Psychology, 95(5), 888. doi:10.1037/a0020939
Taras, V., Rowney, J., & Steel, P. (2009). Half a century of measuring culture: Review of approaches, challenges, and limitations based on the analysis of 121 instruments for quantifying culture. Journal of International Management, 15(4), 357–373. doi:10.1016/j.intman.2008.08.005
Teddlie, C., & Tashakkori, A. (2009). Foundations of Mixed Methods Research: Integrating Quantitative and Qualitative Approaches in the Social and Behavioral Sciences. Book (Vol. 1, p. 400). Sage Publications. Retrieved from http://www.amazon.com/dp/0761930124
Terzi, A. R. (2011). Relationship between power distance and autocratic-democratic tendencies. Educational Research and Reviews, 6(7), 528–535. Retrieved from http://www.academicjournals.org/err/PDF/Pdf 2011/July/Terzi.pdf
Thomas, D. C. (1999). Cultural diversity and work group effectiveness: An experimental study. Journal of Cross-Cultural Psychology, 30(2), 242–263. Retrieved from http://jcc.sagepub.com/cgi/reprint/30/2/242
Ting-Toomey, S. (1988). Intercultural conflict styles: A face negotiation theory. In Y. Kim & W. Gudykunst (Eds.), Theories in Intercultural Communication (pp. 213–235). Newbury Park, CA: Sage.
Tokimatsu, K., Fujino, J., Konishi, S., Ogawa, Y., & Yamaji, K. (2003). Role of nuclear fusion in future energy systems and the environment under future uncertainties. Energy Policy, 31(8), 775–797.
Transparency International. (2011). Corruption Perceptions Index. Criticism. Transparency International. Retrieved from http://www.transparency.org/policy_research/surveys_indices/cpi
Triandis, H. C. (1993). Culture and Social Behavior (p. 330). McGraw-Hill Inc.
Triandis, H. C. (1995). Individualism and Collectivism (p. 280). HarperCollins.
Triandis, H. C. (1996). The psychological measurement of cultural syndromes. American Psychologist, 51(4), 407–415. doi:10.1037//0003-066X.51.4.407
Trompenaars, F., Hampden-Turner, & C. (1997). Riding the Waves of Culture: Understanding Cultural Diversity in Business. Nicholas Brearley. Retrieved from http://www.lboro.eblib.com/EBLWeb/patron/?target=patron&extendedid=E_342942_0
Trompenaars, F., & Hampden-Turner, C. (1997). Riding the Waves of Culture: Understanding Cultural Diversity in Business (2nd ed., p. 275). Nicholas Brealey Publishing.
Troyer, L. (2002). Review: Multinational work teams: A new perspective. American Journal of Sociology, 108(3), 704–706.
Tubbs, S. L. (1995). A Systems Approach to Small Group Interaction (Vol. 5th, p. 354). McGraw-Hill.
250
Tuckman, B., & Jensen, M. (1977). Stages of small group development. Group and Organizational Studies, 2, 419–427.
Van de Water, T., van de Water, H., & Bukman, C. (2007). A balanced team generating model. European Journal of Operational Research, 180, 885–906.
Vecchi, A., & Brennan, L. (2009). A cultural perspective on innovation in international manufacturing. Research in International Business and Finance, 23(2), 181–192. doi:10.1016/j.ribaf.2008.03.008
Venkatraman, N., & Prescott, J. E. (1990). Environment-strategy coalignment: An empirical test of its performance implications. Strategic Management Journal, 11(1), 1–23. doi:10.1002/smj.4250110102
Vincent, A.-M., & Dubinsky, A. J. (2004). Impact of fear appeals in a cross-cultural context. Journal of Euromarketing, 15(1), 17 – 32. Retrieved from http://search.ebscohost.com/login.aspx?direct=true&db=aph&AN=16881035&site=ehost-live
Vodosek, M. (2007). Intragroup conflict as a mediator between cultural diversity and work group outcome. International Journal of Conflict Management, 18(4), 345–375.
Watson, W. E., Kumar, K., & Michaelsen, L. K. (1993). Cultural diversity’s impact on interaction process and performance: Comparing homogeneous and diverse task groups. Academy of Management Journal, 36(3), 590–602. doi:10.2307/256593
Weber, E. U., & Morris, M. W. (2010). Culture and judgment and decision making: The constructivist turn. Perspectives on Psychological Science, 5(4), 410–419. doi:10.1177/1745691610375556
Weener, E. F. (1993). Crew factor accidents: Regional perspective. In Proceedings of the IATA 22nd Technical Conference on Human Factors in Aviation (Vol. Montreal,, pp. 45–61). International Air Transport Association.
Weener, E. F. (Boeing C. A. G., & Russell, P. D. (1994). Aviation safety review: Regional perspectives. In 22nd International Air Transport Association Technical Conference. Seattle, WA: IATA.
Wildman, J. L., Thayer, A. L., Rosen, M. A., Salas, E., Mathieu, J. E., & Rayne, S. R. (2012). Task types and team-level attributes: Synthesis of team classification literature. Human Resource Development Review, 11(1), 97–129.
Willems, M. J. T. (2007). The Influence of Social Capital and Cultural Dimensions on Innovation. Universiteit Maastricht.
WIPO. (2013). WIPO IP Facts and Figures (WIPO Publication No. 943E/13) (p. 44). Geneva, Switzerland: World Intellectual Property Organization. Retrieved from http://www.wipo.int/export/sites/www/freepublications/en/statistics/943/wipo_pub_943_2013.pdf
Wodehouse, A., Maclachlan, R., Grierson, H., & Strong, D. (2011). Culture and concept design: A study of international teams. In International Conference on Engineering Design. Kabenhavn, Denmark. Retrieved from
251
https://pure.strath.ac.uk/portal/files/10203357/Culture_and_concept_design_conference_resubmission_v2.pdf
Wolf, J. (2002). Multicultural workgroups (editorial). Management International Review, 42, 3–5.
Wood, S. J. (2004). Flight Crew Reliance on Automation: CAA Paper 2004/10 (No. 2004/10). London, UK. Retrieved from http://www.caa.co.uk/docs/33/2004_10.PDF
Xie, A., Rau, P. L. P., Tseng, Y., Su, H., & Zhao, C. (2009). Cross-cultural influence on communication effectiveness and user interface design. International Journal of Intercultural Relations, 33(1), 11–20.
Yamagishi, T., & Yamagishi, M. (1994). Trust and commitment in the United States and Japan. Motivation and Emotion, 18(2), 129–166. doi:10.1007/BF02249397
Young, J. P., Fanjoy, R. O., & Suckow, M. W. (2006). Impact of glass cockpit experience on manual flying skills. Journal of Aviation/Aerospace Education and Research, 15(2), 27–32.
Zimmermann, K., Paries, J., & Amalberti, R. (2011). Distress call from the flight deck: Cross-cultural survey of aviation professionals reveals perception that flight safety is decreasing. Safety Science Monitor, 15(2).

252
Appendices
253
Appendix 1: The literature review – additional information This appendix provides additional information associated with some aspects of the literature
review the literature review methodology and also provides a more detailed view of the data
collected from the review, and its analysis.
APPENDIX 1A: Literature review resources and search engines
The following literature search engines and thesauruses were accessed and evaluated, in
part by targeting previously-identified research papers in relevant areas:
• CiteSeerX: This was a free-to-use search engine that accessed publically available
websites, not publisher websites; although this reduced the number of articles
accessed, it was claimed that it provided a higher proportion of open-access than
other search engines. However, when tested by the author, CiteSeerX was found to
be exceedingly poor at retrieving previously-identified papers, and was therefore not
frequently utilised.
• EBSCO: Initial test searches on the EBSCO database confirmed that it would only
retrieve literature from a limited range of subject areas; highly relevant papers on
culture were not retrieved if published in non-social science/anthropology journals.
EBSCO was therefore not frequently utilised.
• ERIC (Education Resources Information Center): Following detailed examination
of the thesaurus of ERIC descriptors, several search tests were carried out on the
ERIC database using various descriptors and non-descriptor search terms. Although
many descriptors within the ERIC thesaurus were related to culture, only two
potentially-relevant papers (both on creativity) were returned by the ERIC database,
due probably to its extreme focus on education-related research. ERIC was therefore
not frequently utilised.
• Google/Google Scholar: The Google/Google Scholar free-to-use search engine
suffered from the opposite problem to EBSCO and ERIC, in that it retrieved
information from all sources and in all forms (e.g. blogs, wikis, bulletin boards,
discussion forums, newsletters, in addition to the standard academic sources). As a
result, searches required careful ‘tuning’ in order to limit the number of search results
to a manageable level. However, the ability to express the search logic more
precisely in Google searches than was the case with the other sources, combined
254
with the extreme breadth of disciplines within which culture-related articles appeared,
resulted in Google/Google Scholar being the most useful search engine, overall.
The citation tracking feature of Google Scholar proved to be very fast and efficient for
retrieving abstracts of citing articles for publications, although these were not always
accurate. In addition, Google Scholar’s ‘live’ author citation-tracking facility allowed
the selection of key authors, following which, regular updates were sent via email as
new citations of those authors’ works were discovered by Google Scholar. In the
case of Hofstede, this was somewhat overwhelming (new citations added daily to the
100,000-plus existing citations list) but, for other authors – e.g. Salas, Helmreich,
Hollenbeck, this was found to be a useful facility.
• Mendeley: Mendeley was a reference manager system with access to a large
database of publication details. The author used this system to maintain his
collection of references and to organise the references in this thesis because the
university-recommended reference manager proved unreliable. Mendeley’s
publication database was found to be incomplete - the author had to enter
approximately 25% of references manually, rather than just to select them from the
Mendeley database. In addition, a higher proportion of publications retrieved by
Mendeley’s search engine were irrelevant than was the case with most alternative
sources. However, it was convenient to conduct searches within Mendeley because
relevant search results could be entered into the author’s list of references at the
touch of a button; in addition, Mendeley offered good (full) document retrieval facilities
via its links to Google Scholar and other sources.
• PubMed: PubMed was a free-to-use search engine that accesses the MEDLINE
references and abstracts database. When evaluated against a range of articles of
relevance to author’s work, PubMed produced a surprisingly high return rate
considering the apparent limited range of sources, and was therefore frequently
utilised by the author.
• PsycINFO: The PsycINFO bibliographic database provided abstracts and citations
covering scholarly literature in the fields of psychology, social sciences, behavioural
sciences and health sciences. The student was only able to access a limited subset
of the PsycINFO database, as the university did not have a full subscription to the
database.
• ResearchGate: ResearchGate was a networking site for scientists and academics.
255
It enabled members to enter details of their publications on the site, to upload copies
of them and any associated statistical or other datasets, and to make them available
to other ResearchGate members. The site’s increasing membership resulted in it
becoming an increasingly useful source of publications. Even in the case where a
publication had not been uploaded to the site due to copyright restrictions, it could be
requested via the website and would usually be made available to the requestor by
the author within a few days. The author of this thesis found an increasing number of
papers (rather than just citation details) on ResearchGate, usually via a Google
search. A further benefit of visiting ResearchGate to download a paper was the
opportunity to rifle through the particular ResearchGate author’s other papers
• Scopus: The Scopus bibliographic database was claimed have access to 20,000
journals and 5.5 million conference proceedings. It provided abstracts and citations
of peer-reviewed literature in the fields of science, technology, arts, humanities, social
sciences and medicine. However, it appeared to have less coverage of earlier
articles than Web of Science.
• SSCI (Social Science Citation Index): This was accessed only as part of the Web of
Science.
• Web of Science: The Web of Science was claimed to have access to 12,000
journals and 150,000 conference proceedings. It provided advanced search facilities
for its ‘core’ collection, but only basic search facilities for the full collection. It also
provided (via the Web of Knowledge citation mapping tool) a capability to produce
one- or two-level forward and backward citation trees, presented in graphical form;
these could be inspected in order to follow up promising authors and titles. This
graphical citation tree tool proved to be very effective and fast for discovering further
research via citations. In addition, the search facility was efficient.
• Individual journal searches: In the late stages of the literature review, the student
wished to ascertain the thoroughness of the literature search process. He located
several journals with relevant coverage, for which all issues (or all modern issues)
were available on-line. These journals were then subjected to a 100% article-by-
article examination of abstracts (when in doubt, the whole paper was perused); the
results were as follows:
o International Journal of Cross Cultural Management (all issues, i.e. 2001 to 2013): 31 papers of potential interest were identified, of which 26 had
256
previously been located and selected via forward or backward citations or
keyword searches. One of the ‘new’ five papers offered a sufficient
contribution to be cited in the final literature review.
o Journal of Cross-Cultural Psychology (all issues, i.e. 1970 to 2013): 77
papers of potential interest were identified, of which 72 had previously been
located via references, citations or keyword searches. None of the ‘new’ five
papers offered a sufficient contribution to be cited in the final literature review.
Whereas it is impossible to guarantee complete coverage in a literature review, the
above 100% check of journals in the field of national culture provided a degree of
confidence that the keyword and citation based searches had been reasonably
thorough. Clearly, such an article-by-article search was not dependent on citation
chasing ‘starting points’, nor was it dependent on the choice of appropriate search
key words.
Further comments on Google
Over the period of this author’s research, Google Scholar (GS) started to change the
landscape of literature reviewing and citation following. Earlier publications on the relative
performance of citation sources tended to identify GS as less reliable and accurate, e.g.
Jacso (2005) and Falagas et al. (2008), although others identified Google’s greater coverage
of non-English language journals and conference proceedings in certain disciplines, e.g.
Meho & Yang (2007).
Following the launch of Google Scholar Metrics in 2012, Repiso-Caballero & Delgado-López-
Cózar (2013) carried out a comparative survey of GS Metrics, Web of Science (WoS) and
Scopus in the field of communication studies. They concluded that GS Metrics had twice the
coverage of WoS and Scopus, less bias towards English language publications, and that its
results were as reliable and valid as those of WoS and Scopus. However, Giustini & Boulos’
review of retrieval performance in the field of social media in health led them to the
conclusion that GS was less effective than the traditional citation databases in the case
where the titles and authors of articles were already known (Giustini & Boulos, 2013),
Google/GS’ comprehensive indexing of ‘everything’ on the Web has brought further benefits
to researchers because it has enabled them to gain free access to authors’ personal copies67
and research institutions’ pre-published copies of academic publications. This free access
67 For example, via the author’s ResearchGate account.

257
has been directly beneficial to researchers, but it has also been the catalyst for a rapid
increase in open access publications.
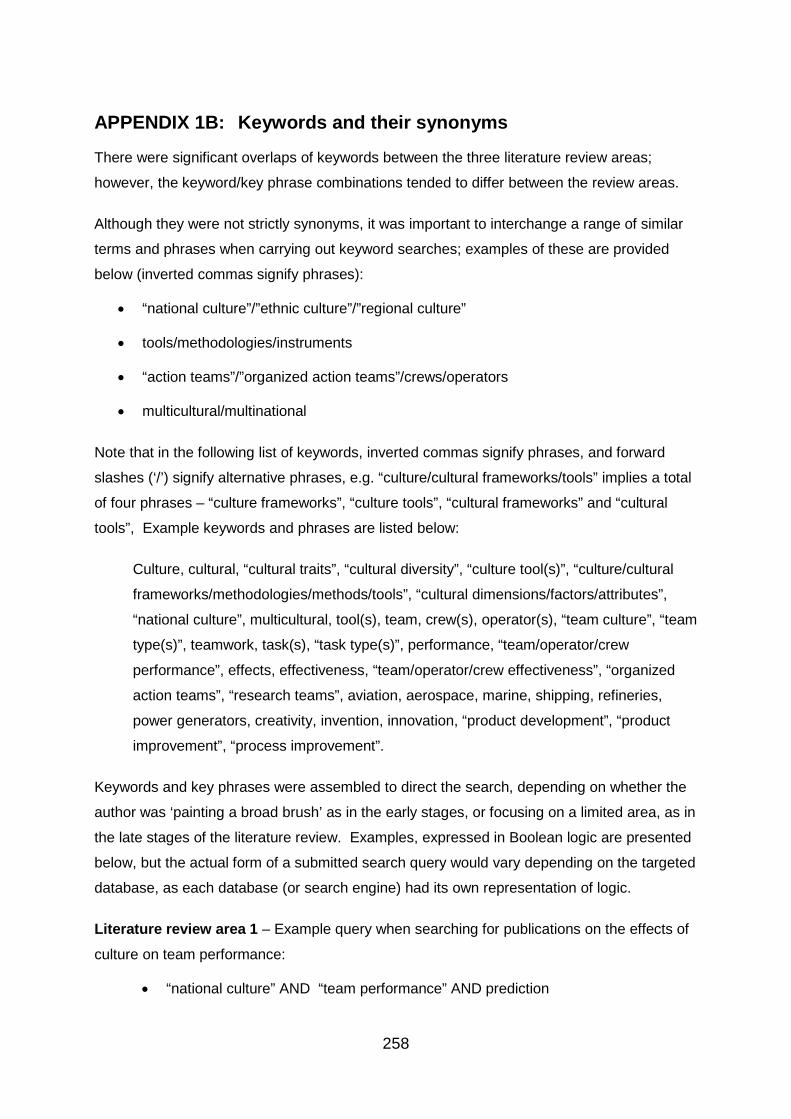
258
APPENDIX 1B: Keywords and their synonyms
There were significant overlaps of keywords between the three literature review areas;
however, the keyword/key phrase combinations tended to differ between the review areas.
Although they were not strictly synonyms, it was important to interchange a range of similar
terms and phrases when carrying out keyword searches; examples of these are provided
below (inverted commas signify phrases):
• “national culture”/”ethnic culture”/”regional culture”
• tools/methodologies/instruments
• “action teams”/”organized action teams”/crews/operators
• multicultural/multinational
Note that in the following list of keywords, inverted commas signify phrases, and forward
slashes (‘/’) signify alternative phrases, e.g. “culture/cultural frameworks/tools” implies a total
of four phrases – “culture frameworks”, “culture tools”, “cultural frameworks” and “cultural
tools”, Example keywords and phrases are listed below:
Culture, cultural, “cultural traits”, “cultural diversity”, “culture tool(s)”, “culture/cultural
frameworks/methodologies/methods/tools”, “cultural dimensions/factors/attributes”,
“national culture”, multicultural, tool(s), team, crew(s), operator(s), “team culture”, “team
type(s)”, teamwork, task(s), “task type(s)”, performance, “team/operator/crew
performance”, effects, effectiveness, “team/operator/crew effectiveness”, “organized
action teams”, “research teams”, aviation, aerospace, marine, shipping, refineries,
power generators, creativity, invention, innovation, “product development”, “product
improvement”, “process improvement”.
Keywords and key phrases were assembled to direct the search, depending on whether the
author was ‘painting a broad brush’ as in the early stages, or focusing on a limited area, as in
the late stages of the literature review. Examples, expressed in Boolean logic are presented
below, but the actual form of a submitted search query would vary depending on the targeted
database, as each database (or search engine) had its own representation of logic.
Literature review area 1 – Example query when searching for publications on the effects of
culture on team performance:
• “national culture” AND “team performance” AND prediction
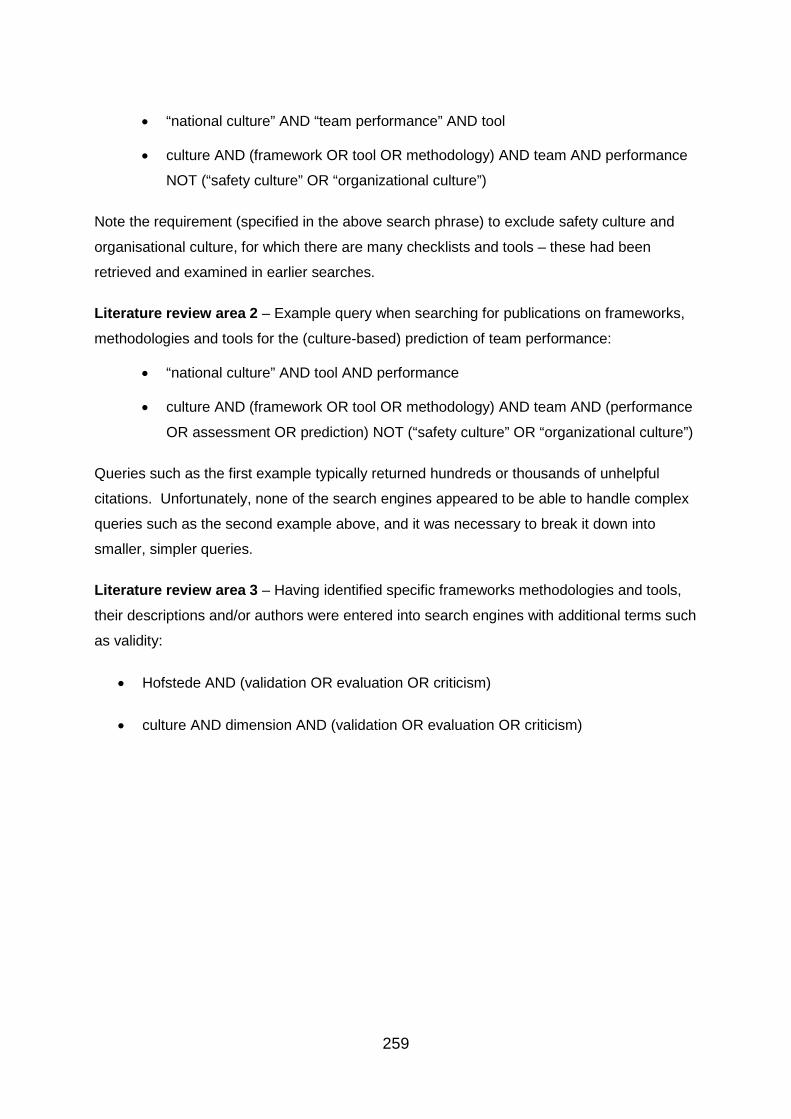
259
• “national culture” AND “team performance” AND tool
• culture AND (framework OR tool OR methodology) AND team AND performance
NOT (“safety culture” OR “organizational culture”)
Note the requirement (specified in the above search phrase) to exclude safety culture and
organisational culture, for which there are many checklists and tools – these had been
retrieved and examined in earlier searches.
Literature review area 2 – Example query when searching for publications on frameworks,
methodologies and tools for the (culture-based) prediction of team performance:
• “national culture” AND tool AND performance
• culture AND (framework OR tool OR methodology) AND team AND (performance
OR assessment OR prediction) NOT (“safety culture” OR “organizational culture”)
Queries such as the first example typically returned hundreds or thousands of unhelpful
citations. Unfortunately, none of the search engines appeared to be able to handle complex
queries such as the second example above, and it was necessary to break it down into
smaller, simpler queries.
Literature review area 3 – Having identified specific frameworks methodologies and tools,
their descriptions and/or authors were entered into search engines with additional terms such
as validity:
• Hofstede AND (validation OR evaluation OR criticism)
• culture AND dimension AND (validation OR evaluation OR criticism)
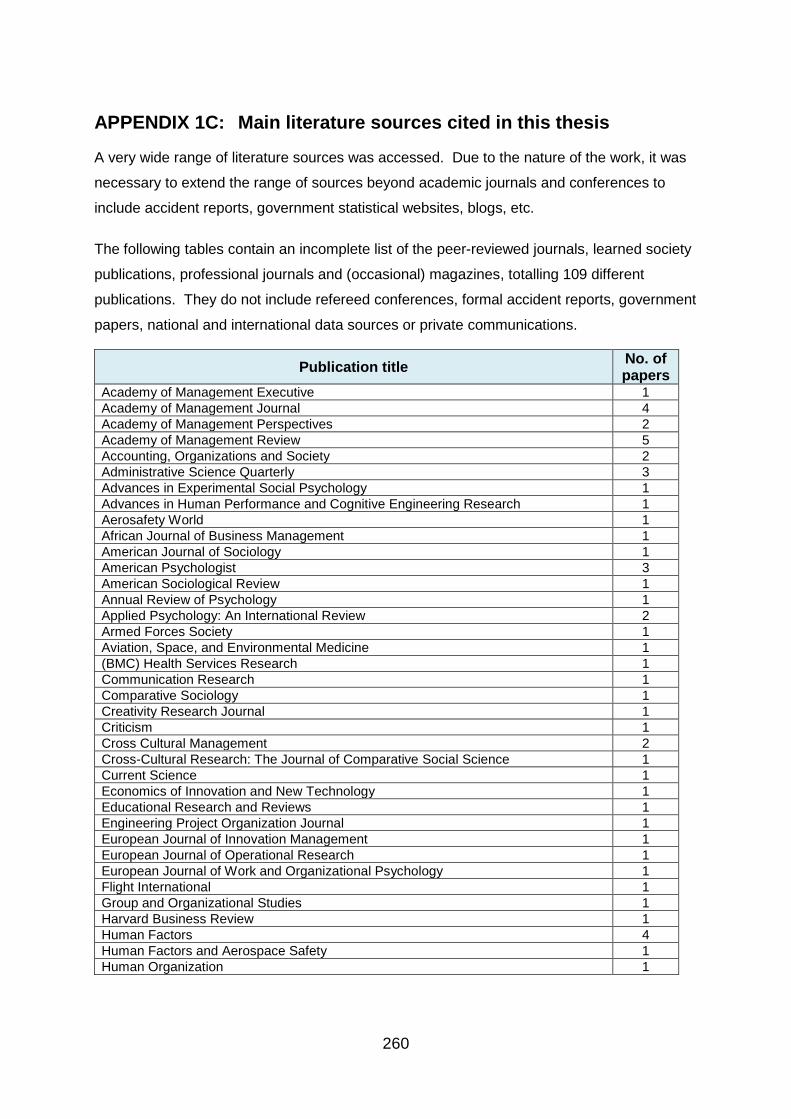
260
APPENDIX 1C: Main literature sources cited in this thesis
A very wide range of literature sources was accessed. Due to the nature of the work, it was
necessary to extend the range of sources beyond academic journals and conferences to
include accident reports, government statistical websites, blogs, etc.
The following tables contain an incomplete list of the peer-reviewed journals, learned society
publications, professional journals and (occasional) magazines, totalling 109 different
publications. They do not include refereed conferences, formal accident reports, government
papers, national and international data sources or private communications.
Publication title No. of papers
Academy of Management Executive 1 Academy of Management Journal 4 Academy of Management Perspectives 2 Academy of Management Review 5 Accounting, Organizations and Society 2 Administrative Science Quarterly 3 Advances in Experimental Social Psychology 1 Advances in Human Performance and Cognitive Engineering Research 1 Aerosafety World 1 African Journal of Business Management 1 American Journal of Sociology 1 American Psychologist 3 American Sociological Review 1 Annual Review of Psychology 1 Applied Psychology: An International Review 2 Armed Forces Society 1 Aviation, Space, and Environmental Medicine 1 (BMC) Health Services Research 1 Communication Research 1 Comparative Sociology 1 Creativity Research Journal 1 Criticism 1 Cross Cultural Management 2 Cross-Cultural Research: The Journal of Comparative Social Science 1 Current Science 1 Economics of Innovation and New Technology 1 Educational Research and Reviews 1 Engineering Project Organization Journal 1 European Journal of Innovation Management 1 European Journal of Operational Research 1 European Journal of Work and Organizational Psychology 1 Flight International 1 Group and Organizational Studies 1 Harvard Business Review 1 Human Factors 4 Human Factors and Aerospace Safety 1 Human Organization 1
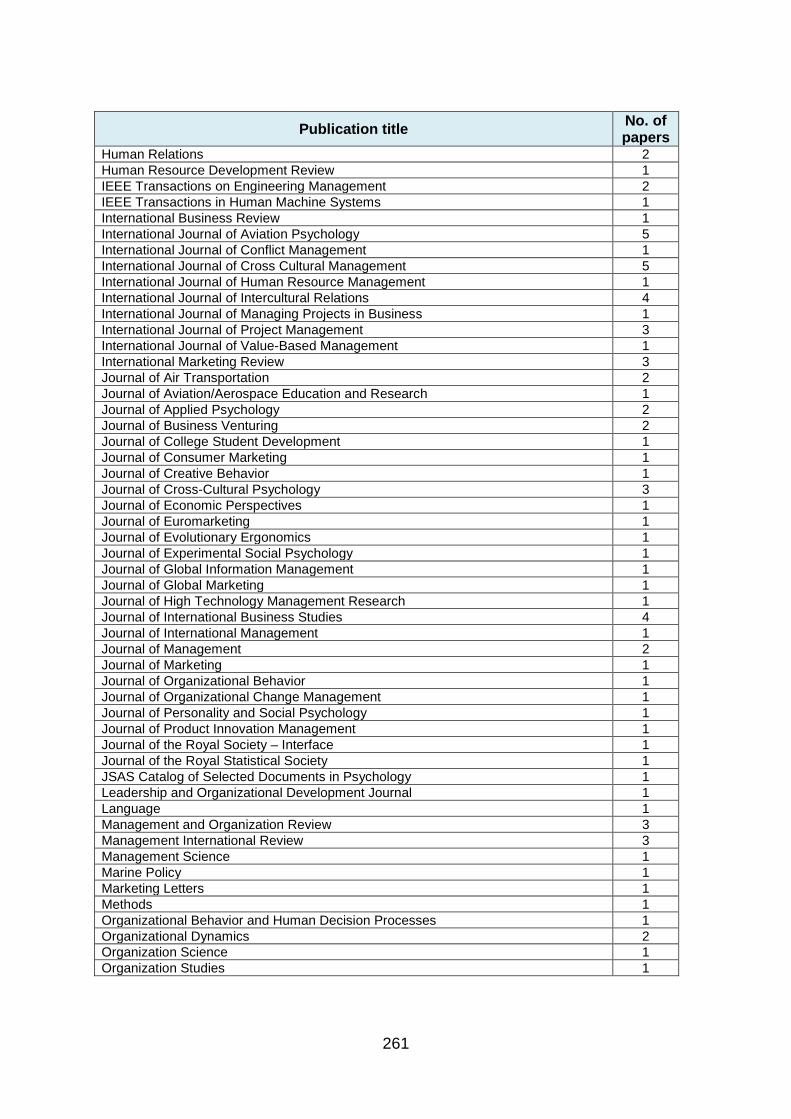
261
Publication title No. of papers
Human Relations 2 Human Resource Development Review 1 IEEE Transactions on Engineering Management 2 IEEE Transactions in Human Machine Systems 1 International Business Review 1 International Journal of Aviation Psychology 5 International Journal of Conflict Management 1 International Journal of Cross Cultural Management 5 International Journal of Human Resource Management 1 International Journal of Intercultural Relations 4 International Journal of Managing Projects in Business 1 International Journal of Project Management 3 International Journal of Value-Based Management 1 International Marketing Review 3 Journal of Air Transportation 2 Journal of Aviation/Aerospace Education and Research 1 Journal of Applied Psychology 2 Journal of Business Venturing 2 Journal of College Student Development 1 Journal of Consumer Marketing 1 Journal of Creative Behavior 1 Journal of Cross-Cultural Psychology 3 Journal of Economic Perspectives 1 Journal of Euromarketing 1 Journal of Evolutionary Ergonomics 1 Journal of Experimental Social Psychology 1 Journal of Global Information Management 1 Journal of Global Marketing 1 Journal of High Technology Management Research 1 Journal of International Business Studies 4 Journal of International Management 1 Journal of Management 2 Journal of Marketing 1 Journal of Organizational Behavior 1 Journal of Organizational Change Management 1 Journal of Personality and Social Psychology 1 Journal of Product Innovation Management 1 Journal of the Royal Society – Interface 1 Journal of the Royal Statistical Society 1 JSAS Catalog of Selected Documents in Psychology 1 Leadership and Organizational Development Journal 1 Language 1 Management and Organization Review 3 Management International Review 3 Management Science 1 Marine Policy 1 Marketing Letters 1 Methods 1 Organizational Behavior and Human Decision Processes 1 Organizational Dynamics 2 Organization Science 1 Organization Studies 1
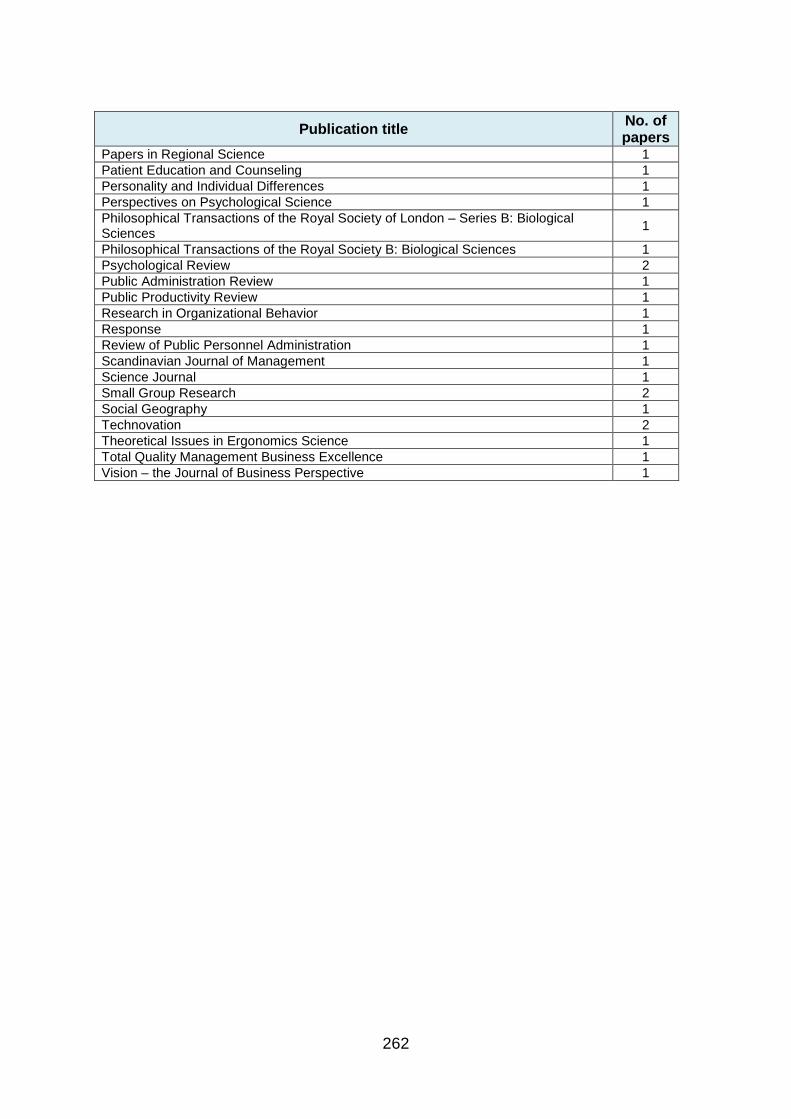
262
Publication title No. of papers
Papers in Regional Science 1 Patient Education and Counseling 1 Personality and Individual Differences 1 Perspectives on Psychological Science 1 Philosophical Transactions of the Royal Society of London – Series B: Biological Sciences 1
Philosophical Transactions of the Royal Society B: Biological Sciences 1 Psychological Review 2 Public Administration Review 1 Public Productivity Review 1 Research in Organizational Behavior 1 Response 1 Review of Public Personnel Administration 1 Scandinavian Journal of Management 1 Science Journal 1 Small Group Research 2 Social Geography 1 Technovation 2 Theoretical Issues in Ergonomics Science 1 Total Quality Management Business Excellence 1 Vision – the Journal of Business Perspective 1
263
APPENDIX 1D Evidence of the effects of culture on external aspects of team performance (expansion of Subsection 3.3.1)
Particular attention was paid to the two key areas of interest for this research thesis, i.e.
complex sociotechnical system design, and sociotechnical system operation.
A1D.1 Teams involved in creativity and innovation Complex, automated sociotechnical systems are the products, directly and indirectly, of
various levels of research, invention and technical development. As producers of sociotech-
nical systems have become increasingly multinational (e.g. via expansion, takeover or
merger), they have gained access to a wider range of choices when placing research,
development and manufacturing activities. This subsection examines evidence about
relationships between national cultural traits (or scores) and various levels of research and
innovation performance.
The term ‘creativity’ has had differing meanings in different cultures (Berthrong, 1998; Lubart,
1999; Niu & Sternberg, 2002). In many western cultures, creativity was considered to be
associated with the creation of new knowledge, paradigms, novel systems, products or
processes; in many eastern cultures, creativity was considered to be associated with the
search for, or a revealing of, a truth that is temporarily hidden from view. Even where a
degree of common understanding was reached, there were likely to be cultural differences in
emphasis, for example Morris & Leung (2010) claimed that there was evidence that
westerners prioritised novelty over usefulness whereas easterners prioritised usefulness over
novelty. Simonton & Ting (2010) suggested a definition of creativity as the product of novelty
x usefulness, i.e. that creativity only occurred where the result was both novel (or original)
and useful. However, the concept of innovation was already associated with usefulness, as
it was the process of developing an idea or invention into a product or service that customers
wanted; therefore Simonton & Ting’s definition merely added confusion. The lack of a
universal classification or agreement about the various forms of knowledge creation and
application has made it difficult to accurately categorise differing forms and levels of creative
output. For example, the following capabilities or activities produced new knowledge and/or
led to new products or services: Academic/fundamental/blue-skies research68, industrial
research & development (R&D), creativity/creation, inventiveness, innovation, improvement,
implementation. Could we identify differing human capabilities associated with each of these
68 In many ways, blue-skies research could be associated with the eastern view of creativity, i.e. the search for, or a revealing of, a truth that is temporarily hidden from view. The (western) creative aspects of fundamental research are perhaps associated with the development of tools to carry out the research, rather than with the research itself.
264
dimensions? Simple subdivisions, e.g. of R&D activities into basic research, applied
research, and development activities (as suggested by Pearce (1990) and others) were
inadequate because they did not cover the full gamut of activities that led to new products
and services.
The author of this thesis did not have the resources to explore further the issues of research,
creativity, inventiveness and innovation. Therefore, the Western view of ‘creativity-as-
novelty’ (rather than creativity-as-usefulness’) was chosen, as this emphasis on ‘novelty’
helped to differentiate between creativity and innovation, each of which required different skill
sets as suggested earlier.
Education has played a major part in enabling the creativity and innovation potential of a
population. However, the primary purpose of education in high-individualism nations has
been to ‘learn how to learn’, whereas the primary purpose in low-individualism (highly
collectivist) nations has been to ‘learn how to do’ (Geert Hofstede, 1986); most nations could
be placed somewhere on the continuum between the above two ‘educational extremes’.
‘Learning how to learn’ encouraged the search for new ideas, i.e. western-type creativity and
innovation, whereas ‘learning how to do’ encouraged the implementation of prior innovations
and improvements in tangible products and services. In support of this view, Herbig &
Palumbo (1996) suggested that western cultures favoured breakthrough innovations, and
eastern cultures fostered incremental innovations. Kirton’s adaptation – innovation inventory
of cognitive styles (Kirton, 1976) was informative, as its extremes appeared to describe some
of the strengths of eastern and western approaches to innovation. Kirton described an
adapter as one who reduced problems via incremental improvements, utilised tried and
tested means, was cautious, sensitive to people and maintained cooperation; he described
an innovator as one who tried to do things differently, was undisciplined, created dissonance
and shock, challenged rules and did not require consensus.
Published studies on the effects of national culture on the generation and development of
new ideas (by both academic and industrial teams) are examined in this subsection. Such
studies covered basic (or blue skies) research, applied research, product and process
development and improvement. Some studies, for example that of Mihaela, Ogrean, &
Belascu (2011) grouped countries into regions prior to the examination of cultural effects;
such studies have been omitted from the following examination because of the wide
intraregional ranges in culture scores (in some cases much wider than those of the corres-
ponding interregional ranges. Other studies, for example that of Vecchi & Brennan (2009)
concentrated on the relationships between national culture and innovation-related inputs;
265
such studies have also been omitted.
A1D.1.1 Research
Barjak (2006) reported on a study of the effects of cultural and disciplinary diversity on the
performance of academic research teams in the life sciences. The outperforming teams had
20-25% of foreign-educated members69; low cultural diversity teams and high cultural
diversity teams (those containing 40-45%) performed less well, resulting in an inverted ’U’-
shaped performance curve.
Following the above study, a larger study was carried out on a representative sample of life
science teams, based on 468 usable questionnaire returns (Barjak & Robinson, 2008).
Research performance was based on numbers of papers per researcher and average
number of citations. Research team diversity was measured separately for PhD students
and post-docs, based on the Shannon diversity index applied to countries of origin;
international collaboration was based on papers co-authored with researchers based in the
USA, EU and other foreign countries. Twelve regression models were produced that
variously included inputs relating to knowledge pooling (from internal cultural diversity and/or
external collaboration), characteristics of team leaders, team size, etc., and included
measures of performance based on output quantity, output quality. The results of Barjak &
Robinson’s (2008) analysis indicated that the most successful academic life science
research teams had a strong domestic base (with a minority of foreign team members), a
moderate amount of collaboration with foreign research teams and a small proportion of
research students. They also found that small teams (optimum size seven members)
produced the maximum number of publications per capita, and also the highest number of
citations per paper. The average cultural diversity of post-docs (based on Shannon’s
diversity index) was 0.38; based therefore on the qualitative recommendations (limited
cultural diversity within team), it would appear that academic research teams in the life
sciences should have a Shannon’s diversity index of somewhere below 0.38, in line with
Barjak’s earlier findings.
Kedia et al. (1992) carried out a study of eight hundred industrial and academic research
units in four countries – Austria, Belgium, Finland and Sweden. This revealed higher
research productivity for high masculinity/low power distance countries than for low
masculinity/low power distance countries, i.e. high masculinity appeared to help researchers
contribute to ideas initiation.
69 Foreign-educated in the sense that the team member’s last degree was obtained outside the host country.
266
A1D.1.2 Industrial research & development
Cozzi & Giordani (2011) carried out an analysis of the effects of ambiguity aversion on
countries’ R&D performances; they utilised OECD and United Nations data sources to
highlight a strong negative relationships between national uncertainty avoidance scores and
research performance as exhibited by the level of R&D intensity and the proportion of
researchers in each country. They found that the negative correlation between uncertainty
avoidance scores and research performance was stronger across European countries than
across OECD or a wider range of countries. Niebuhr (2010) carried out a regression
analysis of innovation performance in the various German regions, the results of which
suggested that diverse cultural backgrounds in the team or workforce could enhance R&D
performance. The maximum proportion of high-skilled workers (those that we would
associate with R&D) in any region was 12.92 percent, the lowest was near-zero; even the
highest figure (12.92%) would be considered low in terms of diversity within an R&D team.
Because Niebuhr’s work was carried out at the regional, rather than team level, there were
issues with its validity. Also, when time lags were applied (to represent delayed outputs), the
correlations between cultural diversity and R&D performance were significantly lower. In
addition, the measure of cultural diversity appeared to be based on the proportion of non-
German workers in each region; this was a poor measure of diversity.
Jones & Davis (2000) produced a taxonomy of company (or subsidiary) R&D focus, with
associated optimum cultural scores (all other things being equal) based on their analysis of
studies:
• Locally-supported support/adaption – low individualism, high power distance, high
masculinity, high uncertainty avoidance and long term orientation.
• Locally-orientated R&D - medium/high individualism, low/medium power distance,
low/medium masculinity, low/medium uncertainty avoidance and long term
orientation.
• Globally-orientated R&D – high individualism, low power distance, low masculinity,
low uncertainty avoidance and long term orientation.
Rinne et al. (2013) analysed the relationships between cultural dimension scores and two
creativity indices, the Global Creativity Index (GCI) and the Design and Creativity Index
(DCI). They found a strong positive relationship between individualism and the two creativity
indices, but no significant relationship between power distance, uncertainty avoidance and
the creativity indices. Willems ( 2007) investigated the relationships between national
267
culture, social capital and innovation (as measured in terms of patents registered in Europe
(EPO) and the USA (USPTO)); he found that individualism had the highest correlation
(positive) with innovation, followed by power distance (negative), masculinity (positive) and
uncertainty avoidance (negative).
A1D.1.3 Innovation
Herbig and Miller (1992) considered several levels of innovation, concluding that higher order
innovation was best served by high individualist, low uncertainty-avoidance societies.
Shane’s (1992) investigation of early stage per-capita inventiveness and innovation rates
across 33 countries indicated that power distance (negative) and individualism (positive) had
strong correlations with per-capita inventiveness and innovation.
Bouncken & Winkler (2008) found that differences in power distance among team members
were particularly damaging to the performance of bicultural global innovation teams.
Rothwell & Wissema (1986) presented two models of the process of technical innovation and
discussed the role that culture played in these models with particular reference to the
innovation diffusion process. They identified characteristics associated with low power
distance, long term orientation and low uncertainty avoidance as promoting technical
innovation. Herbig & Dunphy (1998) found that national culture played a significant role in
the adoption of innovative technologies, in particular if the adoption implied changes in
behaviour; they cited several studies that identified high individualism, low power distance
and low uncertainty avoidance scores as promoting technical innovation.
Halkos & Tzeremes (2011), who studied the effects of national culture on innovation
efficiency, found that masculinity was positively correlated with innovation up to a score of
70-8070. The emphasis on relationships and agreement-seeking within a low-masculinity
culture, rather than on externally-measured goals, was similar to that of low-individualism
communities; such an emphasis could lead to reduced performance when faced with high
creativity or blue-skies research goals. The same authors later carried out analyses of the
innovation efficiency and performance of 25 European countries (G. E. Halkos & Tzeremes,
2013); these analyses revealed that high uncertainty avoidance had the greatest effect on
innovation, followed by high power distance – in both cases, the effects were negative. As
part of a three-decade multi-level review of the application of Hofstede’s cultural framework,
Taras, Kirkman & Steel (2010) found that uncertainty avoidance was strongly negatively
related to innovation.
70 Perhaps adjusted to 55-65 following Bosland’s education corrections for 16 years FTE.
268
Efrat (2014) examined the impacts of national culture on innovation in 35 countries for the
years 1998, 2004 and 2008; innovation output measures were based on patents, journal
articles and high-technology exports (obtained from the World Bank database). He found
that power distance had little effect, high individualism contributed positively to publications
but negatively to patents, uncertainty avoidance had a general negative effect, and that high
masculinity contributed negatively to publications and positively to patents. There were a
number of issues with the results of Efrat’s study. Firstly, the results were based on national,
not team values; research teams often contain many foreign members, therefore the default
national default values may not be accurate. Secondly, journal articles tend to be produced
by academic research teams, patents by industrial innovation teams, and high technology
exports (the end of a long chain) often depend significantly on lower level process and
product improvements; these three outputs represent significantly different levels of creativity
or innovation, and should be distinguished from each other.
A1D.1.4 Product development (initiation)
Nakata & Sivakumar (1996) carried out a literature review in order to understand the relation-
ships between national culture and new product development. They split the product
development process into two stages, as suggested by Johne (1984), i.e. initiation (idea
generation, screening, concept testing) and implementation (product development, test
marketing, product launch). Nakata & Sivakumar found that the best-performing national
cultures at the initiation stage had high individualism, low power distance, low uncertainty
avoidance and low masculinity scores (i.e. as in Nordic cultures); the low masculinity scores
contrast with the findings of Kedia et al. and Halkos & Tzemeres. They found that the best-
performing national cultures at the implementation stage had low individualism, but high
power distance, uncertainty avoidance and masculinity scores (e.g. Japan, Taiwan and
Mexico).
D’Iribarne et al. (1998, Ch.IV) reported on a joint venture between Renault of France (high
power distance, high masculinity and high uncertainty avoidance) and Volvo of Sweden (low
power distance, low masculinity and low uncertainty avoidance) for the development of a
new car. According to d’Iribarne, the hierarchically-organised French team members
produced the most innovative designs and defended them aggressively; the democratically-
organised Swedish team members sought consensus to such a degree that they were limited
in the range of ideas that they could even conceive. The joint venture failed and was
subsequently dissolved. D’Iribarne highlighted the fact that the French, with their supposedly
creativity-limiting high uncertainty avoidance, were able to out-innovate the Swedes. Geert
Hofstede referred to this case during a conversation with the author of this thesis at a
269
Loughborough University workshop (Fellows, 2011), highlighting the Swedish high femininity
(low masculinity) score; he suggested that this had caused the need for consensus to
overrule the purpose of the joint venture. This low masculinity/inadequate product
development result contradicts that of Nakata & Sivakumar (above).
Rinne et al. (2012) utilised Hofstede’s cultural framework to investigate the effects of national
culture on innovation in 66 countries, as measured by the 2008-2009 Global Innovation Index
(INSEAD, 2009). A multiple linear regression analysis highlighted that power distance was
strongly negatively related to innovation performance, whereas individualism was strongly
positively related; no statistically significant relationship with uncertainty avoidance was
found. The 2008-2009 Global Innovation Index measure of performance was based on five
input measures (institutions, human capacity, uptake of infrastructure, market sophistication,
and business sophistication) and two output measures (scientific outputs, and creative
outputs & wellbeing).
Kaasa and Vadi (2010) analysed the effects of culture on innovation in European countries,
using patenting activity as a measure. They found a strong negative relationship between
national uncertainty avoidance scores and indicators of patenting intensity; however, the
relationship did not appear to be linear. In addition, high power distance and masculinity
scores reduced innovation, but their effects could be counteracted to some extent by high
individualism scores.
Shane (1993) utilised Hofstede’s cultural framework to investigate the effects of national
culture on the innovation rates of 33 countries over the period 1975 to 1980, using (this time)
trademarks filed in the USA as a measure of the countries’ innovation rates. He included two
economic independent variables that are known to influence innovation rates – per capita
income, and percentage of total value added accounted for by industries that typically
generated large numbers of innovations. A least squares multiple regression analysis
highlighted uncertainty avoidance as the most important cultural variable (it was also more
significant than either of the two economic control variables; a low uncertainty avoidance
score promoted innovation. High individualism and low power distance scores each also
promoted innovation to a lesser extent. Shane later examined the effects of culture on
attitudes towards the role of innovation champions, finding, again, that a low uncertainty
avoidance score was an indicator of high support (Shane, 1995). Shane’s measures of
innovation performance were very different from those used by Rinne et al. (see earlier),
which might at least partially explain why the results of the two investigations, in terms of
cultural influences, differed to so much.
270
A1D.1.5 Product and process implementation
Herbig & Miller (1992) proposed that low-IDV, high PDI (collectivist) societies are pre-
eminent in lower order innovations, in particular those societies with high MAS. Ambos &
Schlegelmilch (2008) carried out a study of 139 R&D laboratories (located in 21 countries)
and found that the optimum ‘cultural environment’ for capability-exploitation laboratories
(those whose aim was to bring that technology to market) was high power distance, low
individualism, high masculinity and high uncertainty avoidance.
Nakata & Sivakumar’s (1996) literature review found that the best-performing national
cultures at the implementation stage had low individualism, high power distance, high
uncertainty avoidance and high masculinity scores (e.g. Japan, Taiwan and Mexico).
Lin’s (2009) study examined major car manufacturers in fourteen countries in order to assess
the impacts of national culture on their process management and technical innovation.
However, from his description of technical innovation and its measurement, the study
appears to relate primarily to automobile and process detailed development and
implementation, rather than any form of novel innovation. Lin found that high uncertainty
avoidance and long term orientation positively influenced performance.
Herbig and Jacobs (1998) described Japanese culture in detail and explained the strengths
and weaknesses of Japanese research and development. Japan excelled in improving
process and product technology but, with the exception of a small number of scientists, did
not produce radical innovations or extend basic knowledge. This was reflected in technology
transfers to Japan from the USA and Europe, which were almost four times greater than
transfers from Japan. High masculinity (and the resultant aggressive competitiveness)
tended to be regarded as a hindrance to the performance of low/medium-creativity improve-
ment processes; however, in the case of Japan, the country’s history and its cultural
combination of high power distance, mid-low individualism, high uncertainty avoidance and
high masculinity resulted in a fierce competitiveness at the company level, rather than at the
individual level.
A1D.1.6 Acceptance and promotion of new technologies
Although this subsection does not specifically refer to project teams, such teams are typically
involved in the adoption and implementation of new technologies.
Hasan and Ditsa (1999) analysed attitudes to the take-up of new technologies across
Australia, West Africa and the Middle East. They found that West Africans were more
271
favourable to the adoption of information technology than were Middle Easterners, and
considered that this was due to the much lower level of uncertainty avoidance in West Africa.
Van Everdingen and Waarts (2003) carried out a large study on the effects of national culture
on the adoption of enterprise resource planning software in ten European countries. They
concluded that high national scores for power distance, uncertainty avoidance and
masculinity negatively influenced the adoption of enterprise resource planning; individualism
appeared to play a positive role in only the early adoption of enterprise resource planning
software.
Menzel et al. (2006) analysed the literature on the wider topic of entrepreneurship as the
basis of support and technical knowledge required for radical innovation. Based on their
analysis, they proposed an ideal supportive culture, which included very low power distance
and uncertainty avoidance scores, medium individualism and masculinity scores, and
medium-to-high long-term orientation scores (the latter cultural dimension was not used in
the research of this PhD).
A1D.1.7 Complex projects involving significant political or social issues
Almost every large, complex sociotechnical project was unique and, in addition to technology
issues, many such projects had significant additional complexities imposed on them due to
political or social issues (D. Hodgson & Cicmil, 2008). These complexities could have been
due to the involvement of multiple partners, for example in the negotiation of large
international defence contracts involving commercial rivals and civil service organisations, or
they could have been due to multiple customer stakeholders, or both. Examples of such
projects included new generation strike aircraft, aircraft carriers, nuclear power stations, high-
speed rail links, airports, bypasses and motorways. However, many smaller projects also
had significant cultural, personal and vested interests (often undisclosed), which could add to
complexity, time delays and costs. It was almost impossible to analyse such projects on a
comparative, quantitative basis, as there was no equivalent of a ‘level playing field’ on which
we could gauge their performances. We could, however, examine qualitatively the key
reasons why complex projects have often failed.
A large proportion of complex technical and social projects failed to a greater or lesser
degree – cost and time overruns were ‘the norm’; the 2012 UK Olympics project was (of
course) delivered on time, but the costs had escalated by 200% over the original estimates.
The Bull Survey (Spikes Cavell Research Company, 1998) revealed that the largest single
cause of project failure was poor communications between the relevant parties on the
project. The UK government’s OGC best practice report entitled ‘Common Causes of Project
272
Failure’ (Office of Government Commerce, 2005) identified two of the eight major causes of
failure in government-funded projects as lack of understanding/lack of contacts at senior
levels, and lack of project team integration between clients and supplier team. Anderson
(2011) identified bad communications as the largest single root cause of project failure. It
appears from the above (and from many other references) that failures in communication and
understanding, particularly across departmental and organisational boundaries, were the
leading causes of failure in complex projects.
Buckle & Thomas’ (2003) study of the Project Management Body of Knowledge, PMBOK,
(PMI, 2000) revealed an embedded masculine set of values. Masculine cultures tended be
highly competitive assertive and aggressive (G H Hofstede 2001, Ch.6), and tended to apply
impersonal problem-solving approaches (Daley & Naff, 1998) and decision-making styles
(Baxter Magolda, 1992); contrastingly, feminine cultures tended to value relationships and
seek consensus (G H Hofstede 2001, Ch.6). However, project management typically
attracted masculine-orientated individuals (Cartwright & Gale, 1995), even from within more
feminine cultures. Given the earlier-described primary causes for the high rates of project
failure, it is probable that personnel with lower masculinity scores, perhaps applying
alternative project management methods, e.g. the Scandinavian approach (Lichtenberg,
1983), would perform more effectively in socially or politically complex projects.
A1D.1.8 Conclusions – teams involved in creativity and innovation
The results are summarised in Table 3-1 (of the main body of the report). Note that this table
attempts to cover a range of types of creativity, from blue-skies research (top of the table) to
product implementation (at the bottom of the table). As there are no ‘hard and fast’
definitions of what is meant by innovation, nor are all forms of product initiation likely to
require the same levels of innovation, it is unsurprising that there are some contradictory
results. However, despite these contradictory results, there are some clear trends in terms of
culture trait values vs. levels of creativity.
From a synthesis and evaluation of the literature on creativity and innovation, taking into
account the ‘majority vote’ from Table 3-1, it appeared that:
• High creativity – research and early innovation (original thinking): These
benefited from high individualism, low power distance, low uncertainty avoidance (but
this may not have had a large effect) and low-to-medium diversity (optimum of under
30% non-nationals).
The results with regard to masculinity were extremely inconsistent, with optimal
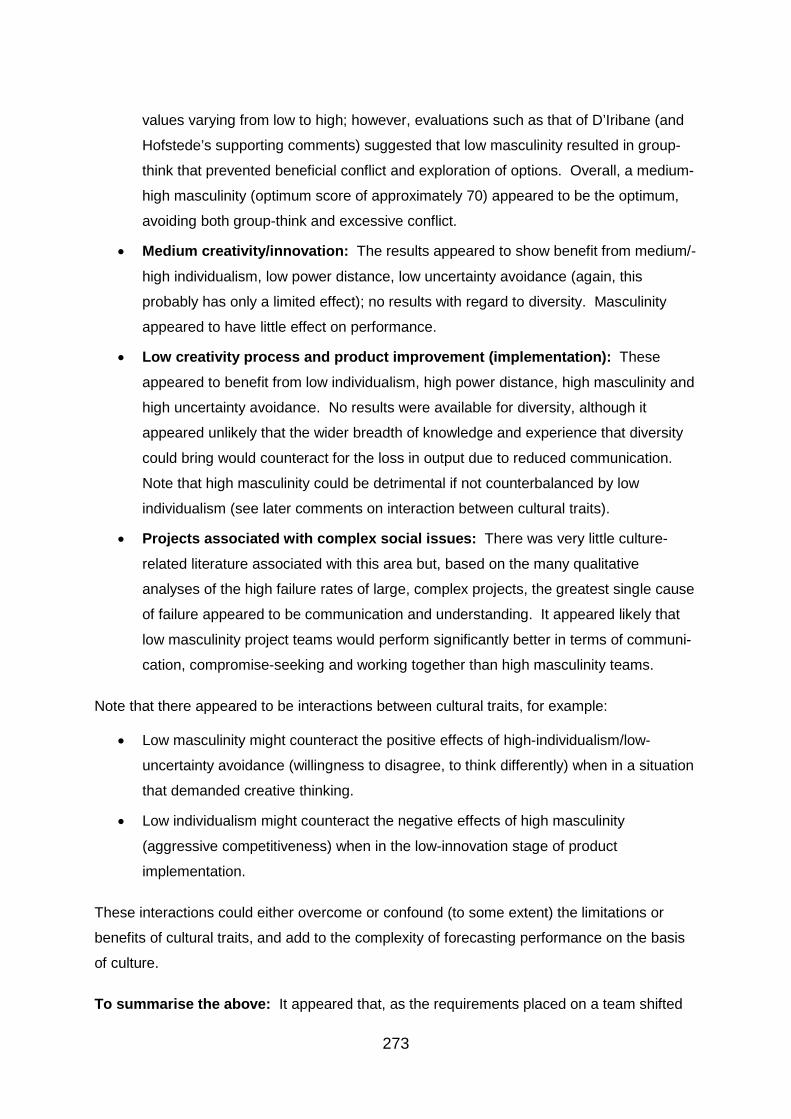
273
values varying from low to high; however, evaluations such as that of D’Iribane (and
Hofstede’s supporting comments) suggested that low masculinity resulted in group-
think that prevented beneficial conflict and exploration of options. Overall, a medium-
high masculinity (optimum score of approximately 70) appeared to be the optimum,
avoiding both group-think and excessive conflict.
• Medium creativity/innovation: The results appeared to show benefit from medium/-
high individualism, low power distance, low uncertainty avoidance (again, this
probably has only a limited effect); no results with regard to diversity. Masculinity
appeared to have little effect on performance.
• Low creativity process and product improvement (implementation): These
appeared to benefit from low individualism, high power distance, high masculinity and
high uncertainty avoidance. No results were available for diversity, although it
appeared unlikely that the wider breadth of knowledge and experience that diversity
could bring would counteract for the loss in output due to reduced communication.
Note that high masculinity could be detrimental if not counterbalanced by low
individualism (see later comments on interaction between cultural traits).
• Projects associated with complex social issues: There was very little culture-
related literature associated with this area but, based on the many qualitative
analyses of the high failure rates of large, complex projects, the greatest single cause
of failure appeared to be communication and understanding. It appeared likely that
low masculinity project teams would perform significantly better in terms of communi-
cation, compromise-seeking and working together than high masculinity teams.
Note that there appeared to be interactions between cultural traits, for example:
• Low masculinity might counteract the positive effects of high-individualism/low-
uncertainty avoidance (willingness to disagree, to think differently) when in a situation
that demanded creative thinking.
• Low individualism might counteract the negative effects of high masculinity
(aggressive competitiveness) when in the low-innovation stage of product
implementation.
These interactions could either overcome or confound (to some extent) the limitations or
benefits of cultural traits, and add to the complexity of forecasting performance on the basis
of culture.
To summarise the above: It appeared that, as the requirements placed on a team shifted
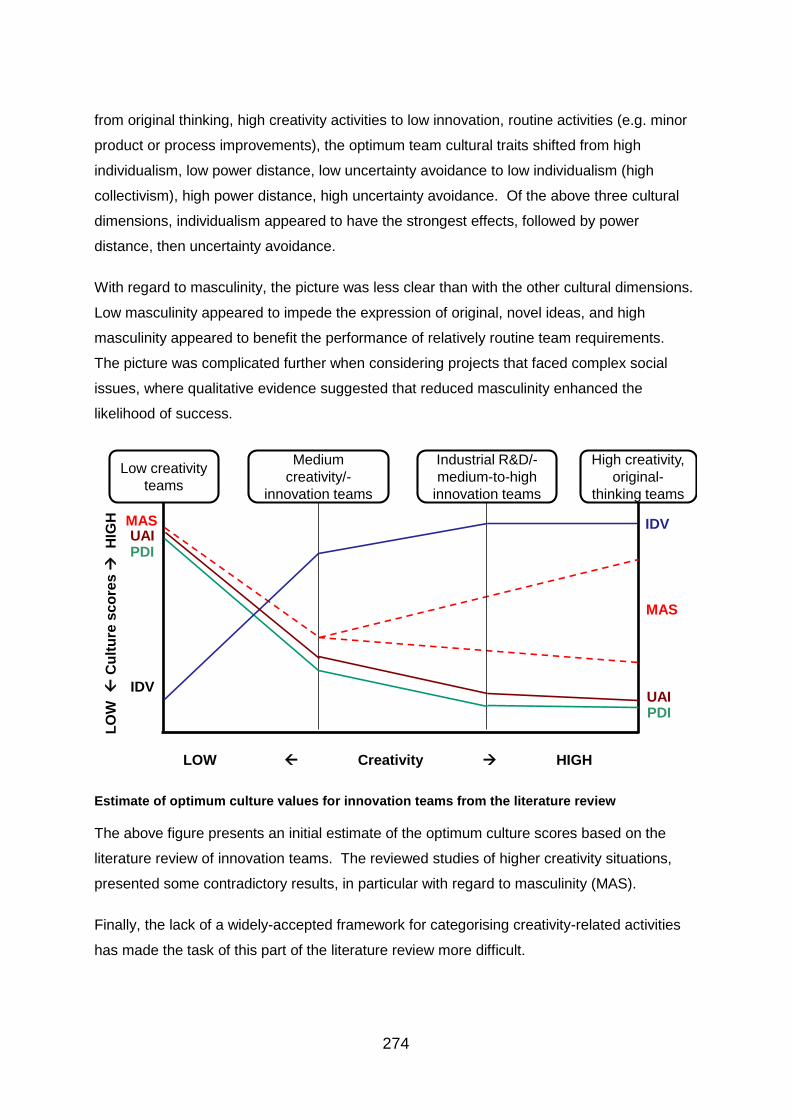
274
from original thinking, high creativity activities to low innovation, routine activities (e.g. minor
product or process improvements), the optimum team cultural traits shifted from high
individualism, low power distance, low uncertainty avoidance to low individualism (high
collectivism), high power distance, high uncertainty avoidance. Of the above three cultural
dimensions, individualism appeared to have the strongest effects, followed by power
distance, then uncertainty avoidance.
With regard to masculinity, the picture was less clear than with the other cultural dimensions.
Low masculinity appeared to impede the expression of original, novel ideas, and high
masculinity appeared to benefit the performance of relatively routine team requirements.
The picture was complicated further when considering projects that faced complex social
issues, where qualitative evidence suggested that reduced masculinity enhanced the
likelihood of success.
Estimate of optimum culture values for innovation teams from the literature review
The above figure presents an initial estimate of the optimum culture scores based on the
literature review of innovation teams. The reviewed studies of higher creativity situations,
presented some contradictory results, in particular with regard to masculinity (MAS).
Finally, the lack of a widely-accepted framework for categorising creativity-related activities
has made the task of this part of the literature review more difficult.
Low creativity teams
High creativity, original-
thinking teams
Medium creativity/-
innovation teams
PDI
IDV
UAI
MAS
PDIUAI
MAS
IDV
LOW
C
ultu
re s
core
s
HIG
H
LOW Creativity HIGH
Industrial R&D/-medium-to-high
innovation teams
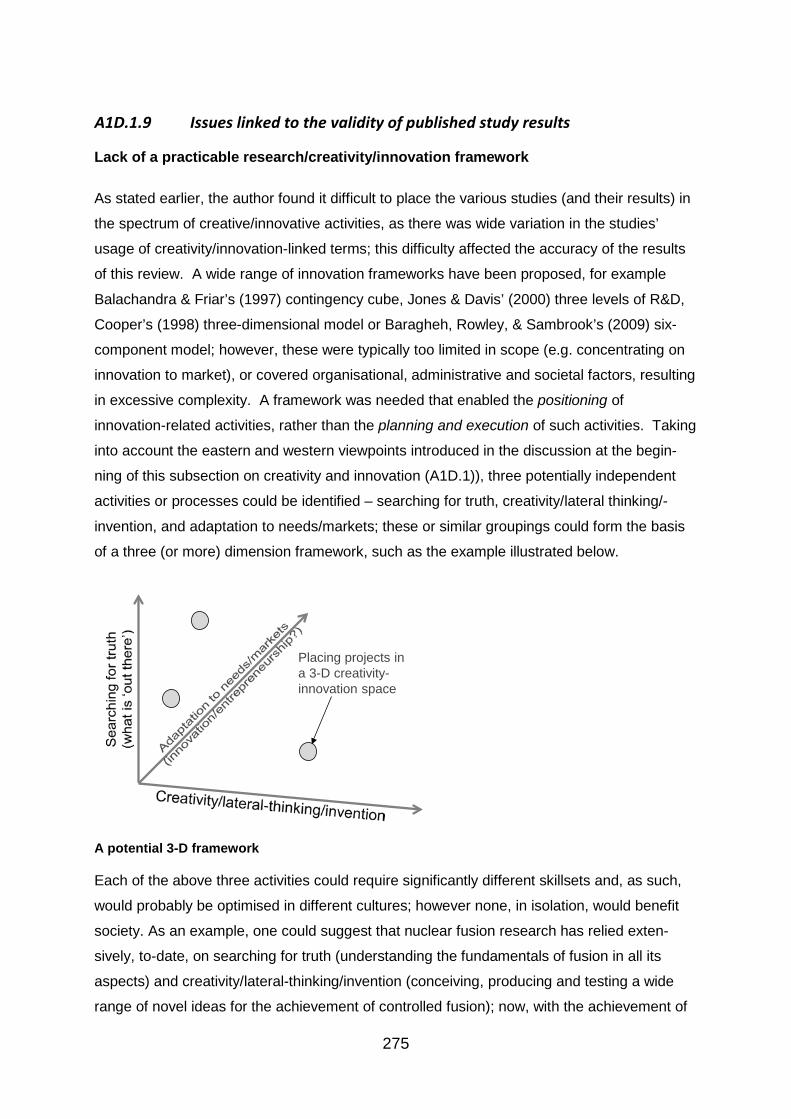
275
A1D.1.9 Issues linked to the validity of published study results
Lack of a practicable research/creativity/innovation framework
As stated earlier, the author found it difficult to place the various studies (and their results) in
the spectrum of creative/innovative activities, as there was wide variation in the studies’
usage of creativity/innovation-linked terms; this difficulty affected the accuracy of the results
of this review. A wide range of innovation frameworks have been proposed, for example
Balachandra & Friar’s (1997) contingency cube, Jones & Davis’ (2000) three levels of R&D,
Cooper’s (1998) three-dimensional model or Baragheh, Rowley, & Sambrook’s (2009) six-
component model; however, these were typically too limited in scope (e.g. concentrating on
innovation to market), or covered organisational, administrative and societal factors, resulting
in excessive complexity. A framework was needed that enabled the positioning of
innovation-related activities, rather than the planning and execution of such activities. Taking
into account the eastern and western viewpoints introduced in the discussion at the begin-
ning of this subsection on creativity and innovation (A1D.1)), three potentially independent
activities or processes could be identified – searching for truth, creativity/lateral thinking/-
invention, and adaptation to needs/markets; these or similar groupings could form the basis
of a three (or more) dimension framework, such as the example illustrated below.
A potential 3-D framework
Each of the above three activities could require significantly different skillsets and, as such,
would probably be optimised in different cultures; however none, in isolation, would benefit
society. As an example, one could suggest that nuclear fusion research has relied exten-
sively, to-date, on searching for truth (understanding the fundamentals of fusion in all its
aspects) and creativity/lateral-thinking/invention (conceiving, producing and testing a wide
range of novel ideas for the achievement of controlled fusion); now, with the achievement of
Placing projects in a 3-D creativity-innovation space
276
the technical milestone of energy-breakeven, fusion has arrived at the stage where the long
process of adaptation to meet the World’s energy needs could begin (S. Lee & Saw, 2011;
Tokimatsu, Fujino, Konishi, Ogawa, & Yamaji, 2003).
The placing of projects and project studies in a multidimensional framework such as that of
Figure 3-3 would enable improvements in the generalisation of study results, and a conseq-
uent better understanding of the effects of culture on various types and levels of creativity.
However, note that each of these dimensions could be subject to more detailed structuring.
Use of patents as a measure of innovation output
Patenting rates were utilised in many published innovation-related studies as a measure of
innovation output. Where patent quality was taken into account, e.g. in terms of citations and
income generated, patents may have represented a reasonable measure of innovation.
However, the raw number of patents per head of population has become increasingly
susceptible to changing governmental and industrial policies. For example, in recent years
the Chinese government has strongly encouraged and supported its universities to increase
the level of patenting of their outputs; this has resulted in a large increase in the quantity of
patents without a commensurate increase in their quality or potential value (Fisch, Block, &
Sandner, 2013). Patenting rates have increased far more rapidly in the Far East than in the
West - in 2012, Asia filed 56% of all patents and 70% of all industrial designs (WIPO, 2013);
in 2013, three of the World’s top five patenting countries were Far Eastern. As patenting
rates increased, so did the proportion of patents relating to minor design features; in many
cases, such features (both in the East and West) had little intellectual content, but served the
purpose of preventing rivals from competing on a ‘level playing field’. Examples of minor
patents included mobile phone responses to finger-tapping on a touch sensitive screen, and
icons with rounded corners. Litigation arising over such design-based patents has increased
recently, for example see
http://en.wikipedia.org/wiki/Apple_Inc._v._Samsung_Electronics_Co.,_Ltd.
For the research described in this thesis, the key implication of the above changes in
patenting patterns was that raw patent data for recent years has shown at best a small and
decreasing correlation with innovation levels. This was demonstrated in a recent study by
Efrat (2014) that revealed a negative correlation between innovation and individualism based
on raw patents (the opposite of most previous study results), but showed a positive correl-
ation between individualism and innovation based on journal publications. A mobile phone-
related patent for ‘image icon associated with caller’ is hardly comparable, in innovation or
creativity terms, to a patent for ‘a method of characterizing genomic DNA to create a genetic
277
fingerprint’; however, as a ‘raw’ patent, it is potentially weighted the same.
A1D.2 Student groups
Research into the performance of student groups has been rightly criticised in the past
because neither the students, nor their group environments, were representative of non-
student group or team situations. However, such students could be considered to be
representative of the sociotechnical system design team members of the future; also, the
availability of multiple groups with similar targets in similar settings provided the equivalent of
controlled laboratory experiments. Although many academic publications on student groups
were retrieved, there were relatively few studies that represented quantitative analyses of the
effects of culture on group performances. In many cases, these studies examined other
variables than performance, e.g. self-efficacy and satisfaction; these have been found to be
poor predictors of performance, in particular where creativity has been required (Paletz et al.,
2003). In other cases, studies have split student groups into two categories – homogenous
and culturally-diverse, e.g. Daily et al. (1997), Watson et al. (1993); such a split was too
coarse to capture the nuances associated with the varying degrees and different aspects of
cultural diversity.
Published studies of culturally-moderated performances of student groups are examined in
the following paragraphs.
D.C. Thomas (1999) examined the effects of national diversity on the performances of
undergraduate student groups. The study results were based on 24 groups, each of which
was tasked to evaluate five business case studies. Thomas reported that culturally
homogeneous groups produced better quality solutions for all five case studies than did
culturally heterogeneous groups; no improvement in the relative performances of the
culturally heterogeneous occurred over the period of the study. Cultural distance was used
as a measure of diversity (as is used by the author of this thesis); however, this cultural
distance was only measured in terms of collectivism/individualism, based on an eight-item
scale developed by Maznevski et al. (1997).
Dahlin et al. (2005) examined the effects of team educational and national diversity on team
information use, an important component of potential team performance. Their study results
were based on data from 19 MBA student teams that had each been set the task of carrying
out four case analyses involving organisational problems. Dahlin et al. reported that national
diversity had a ‘U’ shaped relationship with range of information use, but an inverted ‘U’
shaped relationship with depth and integration of information use. Range of information has
278
ramifications for the size of the potential solution space, i.e. for the level of creativity of a
group; depth and integration probably have greater ramifications for detailed design and
implementation. Blau’s index (Blau, 1977), which was based on the relative proportions of
different nationalities rather than the cultural difference between them71, was used to
calculate both educational and national diversity.
Goncalo & Staw (2006) examined the effects of individualism (vs. collectivism) on the
creativity of undergraduate student groups. A total of 68 groups were split into four sets
(primed to act individualistic or collectivistic and instructed to act creatively or practically).
Individualist (high IDV) groups, when instructed to be creative, were more creative than
collectivistic (low-IDV) groups in both the number of ideas generated and the creative quality
of the ideas selected.
Wodehouse et al. (2011) examined the effects of average national culture scores on the
concept design performance (concept generation and selection) of culturally-diverse student
groups. For idea generation, individualism (positive) was the strongest factor, followed by
uncertainty avoidance (negative), then power distance (negative). For idea selection (from
the previously-generated idea set), individualism (positive) was again the strongest factor,
followed by power distance (negative), then uncertainty avoidance (negative). Masculinity
appeared to have little effect on the results. Surprisingly, the authors did not take the
opportunity to examine the effects of different levels of cultural diversity in the groups.
71 As a result, Blau’s index is insensitive to actual cultural differences within and between teams. A team consisting of three very similar nationalities (e.g. German, Austrian and Swiss-German members) would have the same Blau’s index score as a team consisting of three very different nationalities (e.g. Japanese, Serbian and Costa Rican members).
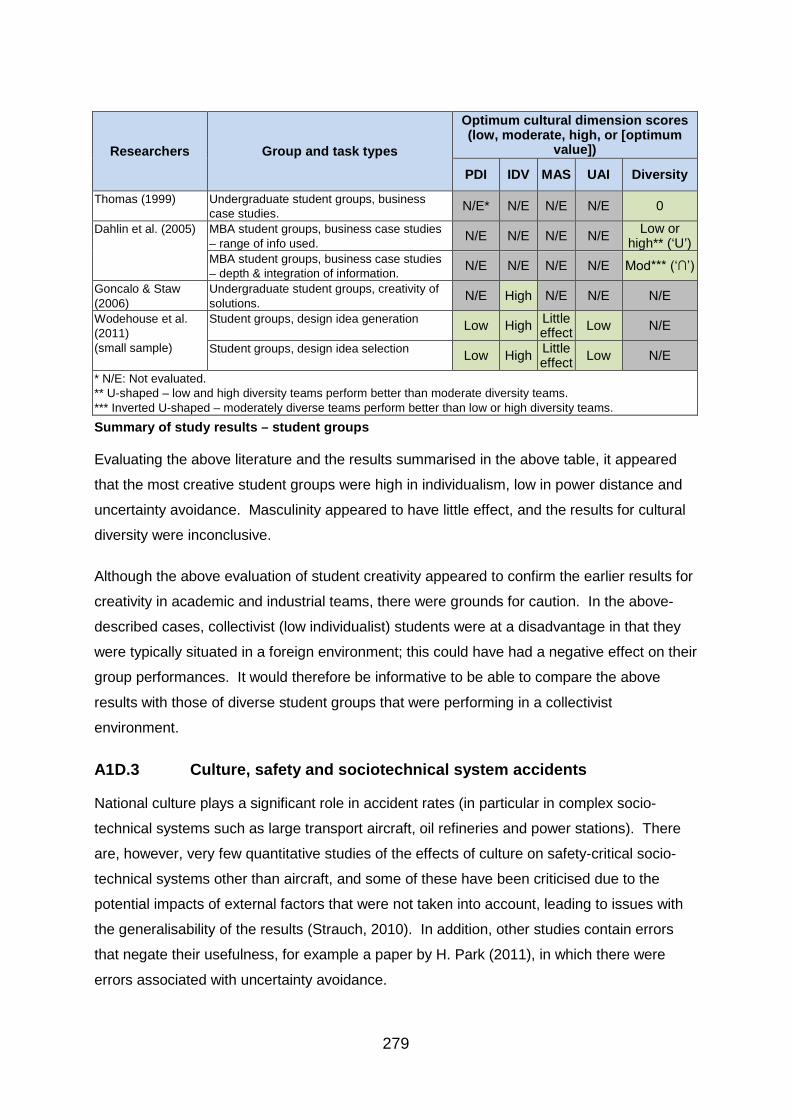
279
Researchers Group and task types
Optimum cultural dimension scores (low, moderate, high, or [optimum
value])
PDI IDV MAS UAI Diversity
Thomas (1999) Undergraduate student groups, business case studies. N/E* N/E N/E N/E 0
Dahlin et al. (2005)
MBA student groups, business case studies – range of info used. N/E N/E N/E N/E Low or
high** (‘U’) MBA student groups, business case studies – depth & integration of information. N/E N/E N/E N/E Mod*** (‘∩’)
Goncalo & Staw (2006)
Undergraduate student groups, creativity of solutions. N/E High N/E N/E N/E
Wodehouse et al. (2011) (small sample)
Student groups, design idea generation Low High Little effect Low N/E
Student groups, design idea selection Low High Little effect Low N/E
* N/E: Not evaluated. ** U-shaped – low and high diversity teams perform better than moderate diversity teams. *** Inverted U-shaped – moderately diverse teams perform better than low or high diversity teams. Summary of study results – student groups
Evaluating the above literature and the results summarised in the above table, it appeared
that the most creative student groups were high in individualism, low in power distance and
uncertainty avoidance. Masculinity appeared to have little effect, and the results for cultural
diversity were inconclusive.
Although the above evaluation of student creativity appeared to confirm the earlier results for
creativity in academic and industrial teams, there were grounds for caution. In the above-
described cases, collectivist (low individualist) students were at a disadvantage in that they
were typically situated in a foreign environment; this could have had a negative effect on their
group performances. It would therefore be informative to be able to compare the above
results with those of diverse student groups that were performing in a collectivist
environment.
A1D.3 Culture, safety and sociotechnical system accidents
National culture plays a significant role in accident rates (in particular in complex socio-
technical systems such as large transport aircraft, oil refineries and power stations). There
are, however, very few quantitative studies of the effects of culture on safety-critical socio-
technical systems other than aircraft, and some of these have been criticised due to the
potential impacts of external factors that were not taken into account, leading to issues with
the generalisability of the results (Strauch, 2010). In addition, other studies contain errors
that negate their usefulness, for example a paper by H. Park (2011), in which there were
errors associated with uncertainty avoidance.
280
A1D.3.1 Accident rates in commercial aviation
When carrying out investigations during the 1990s into aircraft accidents, Boeing found a
significant relationship between national cultures and accident rates of Western-built comm-
ercial passenger jet aircraft, even after taking account of differing fleets, ground facilities and
training. In particular, Weener’s study of aircraft losses between 1952 and 1992 (E. F.
Weener, 1993) linked national scores on several of Hofstede’s cultural factors to increases in
accidents per million departures.
Also during the 1990s, Merritt & Helmreich conducted a five-year project that surveyed more
than 17,000 airline staff, including 8,000 pilots, from 23 countries (A. C. Merritt & Helmreich,
1995); the range of staff included captains, first officers, flight attendants, maintenance staff,
managers and trainers. Pilots chose to compete for a high status cross-cultural occupation
that requires specific combinations of skills, and were therefore not typical members of their
ethnic populations. In addition they were subject to regular training and retraining regimes,
including simulator-based flying training and crew resource management (CRM). These
training facilities were supplied internationally, with minor adaptations. However, despite the
large amount of common training across countries, Merritt & Helmreich’s surveys of attitudes
amongst the 8,000 pilots showed close agreement with three of Hofstede’s original national
culture results for IBM staff - individualism (vs. collectivism), power distance and uncertainty
avoidance. In terms of questions relating to their occupation, pilots across all sampled
nations were in closer agreement than would be expected purely from the above cultural
survey results72. Nevertheless, in specific areas, Merritt & Helmreich reported significant
differences between cultural groups; examples of these are listed below:
• Asian pilots preferred order and predictability, whereas most Anglo and North
European pilots preferred flexibility and challenging tasks.
• Anglo and North European pilots were the most willing to make their views known in
the cockpit, whereas Moroccan, South American and most Asian pilots were the least
likely to make their views known; this distinction is associated in part with power
distance (low in the case of Anglo and Scandinavian pilots, high in the case of most
Asian pilots). The unwillingness of crew members to draw the captain’s attention to
errors or problems has been a significant factor in many commercial aviation
accidents.
• Asian and South American pilots were, in general, neutral or agreed that written
procedures should be provided for all in-flight situations and that rules should be 72 This closer agreement reflected their shared professional (or occupational) culture.
281
obeyed at all times; Anglo pilots strongly disagreed that written procedures should be
provided for all in-flight situations and also disagreed that rules should be followed
when the situation suggested otherwise.
Crew resource management (CRM) training encompasses communication skills, team-
working, situational awareness, problem-solving and decision-making in order to ensure the
optimum use of all resources, in particular when working under pressure or operating in
unusual conditions. Regular CRM training is now mandatory for commercial flying crew
covered by most of the World’s regulatory bodies, and is also mandatory for an increasing
proportion of military crew across the World. However, CRM was pioneered in the USA, and
was further developed primarily in the USA and Northern Europe. Because of these origins,
CRM is culturally bound (Helmreich et al., 1999) as it is based on the assumption of a culture
where junior members of the crew are willing to query issues with, or challenge, the captain.
As a result, CRM training has been most effective when applied to crews of high
individualism, low power distance cultures. Flight crews from collectivist, high power
distance cultures, e.g. South Korea and China, have considerable barriers to overcome in
order to develop the cultural cockpit environment in which subordinates are willing to
challenge the captain when they recognize problems or errors. Harris & Li (2008)
commented on the much higher commercial aviation accident rates of Asia and Africa
compared to the USA and Europe, in particular drawing the reader’s attention to the fact that
in Asia and Africa, the most frequent circumstantial factor in accidents was a failure in crew
resource management. An earlier paper of theirs (Li et al., 2008) described an analysis of
Taiwanese aircraft accidents that utilised the Human Factors Analysis and Classification
System (HFACS); poor CRM was found to result in a 30-to-40-fold increase in decision-
making errors, perceptual errors and violations of procedures.
Jing et al. (2000; 2001) examined accident rate information for airlines around the World
during the previous twenty years (information is available at
http://planecrashinfo.com/rates.htm). They found that the most important cultural variable
was authoritarianism, which was positively correlated to accident rate and appeared to
account for over half the variance (in accident rates) between cultures. From Jing et al.’s
descriptions and definitions of authoritarianism, high authoritarianism appeared to be a
combination of high power distance and low individualism. Jing et al. stated that authoritari-
anism was very high in mainland China, Taiwan and Korea; Chinese subordinates in the
cockpit would typically agree without query to the captain’s demands, even if it meant
deviating from the standard procedures. Jing et al. commented that most commercial aircraft
and most systems associated with these aircraft were designed by Westerners who had low
282
levels of authoritarianism. Therefore, these Western designers did not understand authoritari-
anism and were unaware of the degree to which aircraft operations were vulnerable to
distortion by authoritarianism.
USA airlines, European airlines and their pilots now largely take for granted their incident
reporting programmes; the purpose of these programmes is to improve safety before acci-
dents occur. An example of such a programme is the American Aviation Safety Action
Program (ASAP) (Gibbons et al., 2005), implemented at airline companies with the
agreement of the Federal Aviation Authority (FAA) and the pilots’ unions. Safety reporting
programmes have been developed elsewhere with similar success to those of the U.S.
ASRS, e.g. the British Confidential Human Factors Incident Reporting Programme (CHIRP)
(CHIRP, n.d.) and the British Airways Safety Information System (BASIS) (Holtom, 1998);
CHIRP is also widely used in the international maritime environment, and BASIS is used by
over one hundred airlines. Where these incident reporting and analysis programmes have
been effectively implemented, they have made significant contributions to the reduction of
serious aircraft accidents (in terms of losses per million flights), and to the improvement of
training and standard operational procedures (SOPs).
The assumption behind incident reporting programmes is that all humans make errors,
usually unintentionally; therefore aircrew should be encouraged to report errors and incidents
within a blame-free environment. Following analysis of these errors and incidents, changes
can be put in place to prevent them in the future, or to enable their detection and correction
before a safety issue arises. However, unlike the situation in European and USA airline
organisations, a significant blame and shame culture exists in many Asian organizations.
Therefore Asian pilots are much less willing than their Western counterparts to reveal any
errors on their own part if there is a perceived risk of being exposed. Taiwan provides an
insight to the effects of culture on the performance of incident reporting programmes. In
1999, the Taiwanese government introduced the TACARE voluntary incident reporting
programme in order to improve the country’s very poor airline flight safety record. The level
of incident reporting was low, therefore Lee & Weitzel (2003) conducted a study of
Taiwanese flight crew members’ acceptance and usage of TACARE and found that carriers
would attempt to identify and punish flight crews responsible for (reported) incidents, rather
than seek to establish and eliminate the root causes of incidents. Lee & Weitzel also
commented in their paper that there was a very high power distance between Taiwanese
flight crew captains and first officers, a cultural factor value known to be strongly, positively
correlated with flying incidents; this high power distance would also discourage lower ranking
officers from reporting incidents associated with their captains’ behaviours. A decade-later
283
review of the utilisation of the TACARE system by maintenance personnel (Y.-F. Chen et al.,
2014) revealed that fear of punishment and lack of feedback still discouraged personnel from
submitting safety reports.
It has become clear that Western-designed training, crew resource management and
incident reporting systems do not fully meet the needs of non-individualist, high power
distance cultures. In addition, aircraft cockpit layouts and standard operating procedures
are based on Western individualist cultural assumptions.
A1D.3.2 Accident rates in NATO air forces
Studies of the effects of cultural factors on military aircraft crew performance have revealed
very clear links between national cultures and accident rates. Soeters & Boer (2000)
conducted a comparative study of fourteen NATO air forces using data based on the years
1988 to 1995. These air forces used similar or identical aircraft and underwent similar
training. They used operating procedures and regulations that had been largely harmonized
across all NATO countries, and they were also involved in the exchange of personnel
between NATO air forces and took part in combined exercises with other NATO countries.
The range of NATO aircraft includes single-seat tactical fighters and tactical ground attack
aircraft (typically operating in pairs of groups of four), two-seat trainers and strategic
penetration aircraft and large multiple-crewed aircraft; however, all work in a larger team
environment (i.e. including command & control). Despite the commonality of training,
operating procedures and aircraft, strong positive, statistically-validated correlations were
found between low individualism, high power distance and high uncertainty avoidance scores
and increased accident rates. As the NATO-wide standardization of training, operating
procedures, exchange of personnel, etc., should clearly have produced similar professional
cultures and (to a lesser extent) similar organisational cultures, it is likely that the underlying
national (or ethnic) cultures exerted a major influence on aircrew behaviour. It is important to
note that the NATO standards, regulations, operating procedures, etc., are based on the
US/British model; this model has built-in assumptions with regard to aircrew cultures, i.e. that
they have an Anglo culture (which scores high in individualism, low in power distance and
low in uncertainty avoidance).
A1D.3.3 Automation of sociotechnical systems
Over recent decades, sociotechnical systems have become increasingly automated, and it is
therefore worth examining automation-related issues in a separate subsection; a more
detailed examination can be found in Hodgson, Siemieniuch & Hubbard (2013). These
issues go beyond the cultures of specific groups or nationalities, although they are affected
284
by certain cultural traits. As sociotechnical systems have become increasingly automated,
their very complexity has ensured that not all modes of failure can be predicted. Therefore,
given the severe consequences of failure (e.g. for modern passenger transport aircraft or
nuclear power stations), it has been necessary to back up these automation systems with
humans. However, this automation has brought changes to the activities, workloads,
situation awareness and skill levels of human operators or crew. The issues arising from
these changes are considered below, with particular reference to the aviation environment.
Automation systems, including flight deck automation, changed the role of the operator from
that of active, in-the-loop ‘doer’ to that of passive, out-of-the-loop monitor. Humans proved to
be poor system monitors, in particular if a system was highly reliable (Parasuraman et al.,
1993), and they reacted more slowly to deviations than when inside the control loop (Kaber &
Endsley, 1997). Acting as out-of-the-loop monitors of automation, flight crews typically had
reduced situation awareness not only with regard to the current ‘flying state’ of the aircraft but
also, critically, with regard to the detailed mode of the automation system, its constraints and
its likely future behaviour (Sarter & Woods, 1995a).
During the 1990s, increasing concerns were expressed about the large number of incidents
and accidents arising from pilot confusion with flight automation systems (Kaber & Endsley,
2004), in particular mode confusion (Sarter & Woods, 1995b). In 1996, a U.S. Federal
Aviation Administration (FAA) report (Federal Aviation Administration Human Factors Team,
1996) stated that flight crew/automation interface vulnerabilities adversely affected the crews’
situation awareness and management of automation; the report quoted incidents and
crashes due to the automation system changing flight modes without informing the pilots.
The level and complexity of flight automation has increased significantly since 1996, and
evidence has emerged that even highly-experienced crews are experiencing increasing
difficulties with automation (Sarter et al., 2007). An updated FAA report on flight path
management systems (FAA, 2013) found that systemic vulnerabilities remained in the
design, user training and operation of modern flight path management systems; the resulting
excessive complexity and pilot skill degradation had led to many incidents and accidents.
Recent examples of such incidents and accidents include Hamburg (BFU, 2010), Learmouth
(Australian Transport Safety Bureau, 2011) and Schipol (Dutch Safety Board, 2010).
Evidence of flight crew loss of skills associated with automation (and automation policy) has
been widely reported, for example the UK’s Civil Aviation Authority report about flight crew
reliance on automation (Wood 2004), the loss of manual flying skills (Ebbatson, 2009; Gillen,
2010), and the relationship between automation experience and manual flying skills
(Ebbatson et al., 2010). Following a study of the performance of pilots during refresher
285
training courses, Young et al. (2006) reported that the flight crews who utilized the most flight
deck automation also exhibited poorer manual flying skills than others. A recent survey
(Zimmermann et al., 2011) revealed that commercial pilots and air traffic controllers believed
that flight safety was decreasing. Cases such as the uncontained engine failure on a Qantas
Airbus A380 in 2008 (Australian Transport Safety Bureau, 2010) and the successful ditching
of an Airbus A300 on the River Hudson after engine failure in 2008 (National Transportation
Safety Board, 2010) are indicative of the very high manual skill levels required to survive a
major failure – skill levels that few of the latest generation of pilots possess.
Researchers have highlighted the paucity and low quality of interaction between crews and
automation systems (Norman, 1990), the need for context-aware systems that emulate CRM
principles (Geiselman et al., 2013) and the need for multisensory feedback to crews (Sarter,
2000). To-date, the automation element of most sociotechnical systems has acted as a
poorly trained, incommunicative member of the system’s crew – thus defeating the purpose
of crew resource management (CRM) training. In order for a crew to achieve the level of
shared situation awareness required for safe operation, researchers argue that the auto-
mated system must become to an adequate degree part of the crew (Christoffersen &
Woods, 2002), (G. Klein et al., 2004).
Sherman et al. (1997) surveyed the attitudes of a sample of 5,879 airline pilots from 12
nations towards flight deck automation. They listed 15 automation-related statements (e.g. ‘I
am concerned that automation may cause me to lose flying skills’, ‘I look forward to more
automation – the more the better’, ‘I prefer flying automated aircraft’) and, for each country
and for each statement, calculated the percentage of pilots who agreed (Sherman et al.,
1997), Table 4. Sherman et al. reported that the influence of national culture on the pilots’
agreement (or otherwise) was far greater than that of organizational culture or pilot
experience73. Cultural differences in attitudes to automation are important because they
affect crew utilisation of automation and thereby their levels of trust, manual skills and
situation awareness.
A summary of sociotechnical system automation safety issues: To-date, increased
automation of sociotechnical systems, in particular aircraft automation, has resulted in
changes to primary crew functions from ‘doing’ to ‘monitoring’, reductions in crew situation
awareness and downgrading of crew ‘hands-on’ skills. As a result of these changes, when
73 The author of this thesis carried out a further analysis of Sherman’s results (see Chapter 5 for more details) in order to gain further insights, for example ‘More automation is better’ scores were positively correlated with national power distance scores, and ‘I prefer automation’ scores were positively correlated with national PDI and UAI scores.
286
failures of automation systems occur, manual recovery is compromised. Developments in
automation, combined with airline crew flight training policies, are resulting in an increasing
gap between actual and required crew capability and situation awareness. In terms of
Reason’s ‘Safety Space’ model (Reason, 2008), flight automation systems are moving
rapidly in the direction of increasing vulnerability; similar issues can be found in other
complex sociotechnical systems, for example nuclear power stations and refineries.
A1D.3.4 Accident rates in industry
Not all industrial accidents relate to team activities, but many do. Infortunio (2003) carried
out a study of the correlations between international industrial fatal accidents and Hofstede’s
original cultural dimensions, i.e. power distance (PDI), individualism (IDV), masculinity (MAS)
and uncertainty avoidance (UAI). Due to the high correlations between PDI and IDV in his
initial results, he subsequently utilized the combined factor ‘log PDI/IDV’. Chi-squared tests
showed no significant correlation between log PDI/IDV and UAI.
Infortunio’s results showed that industrial fatal accident rates were correlated with high UAI
scores and high PDI/IDV ratios; they were not correlated with MAS scores. Infortunio
commented on the particularly high industrial injury rates that were experienced in
Guatemala (PDI=95, IDV=6, UAI=101, MAS=37). Note that Infortunio (on page 115) warned
that other factors, including country wealth levels, could moderate the results of his study;
see Subsection III.B.4 of his thesis for further comments on this.
A1D.3.5 Road traffic accidents
Although traffic accidents are not typically the result of team activities, they are worth
studying because the cultural factors in road accidents also play a part in other forms of
accident and failure. Ozkan & Lajunen (2007) carried out regression analyses on traffic
accident data from 46 countries, and identified gross national product (GNP) per capita
(negatively related), neuroticism and uncertainty avoidance (both positively related) as being
significantly correlated with accident rates. Masculinity (positive) and individualism
(negative) were identified as being correlated to a lesser degree.
A1D.3.6 Reaction times to anomalies
G.A. Klein et al. (1999) stated that uncertainty avoidance influenced the threshold for initial
reaction to an anomaly, which occurred when an observer mentally ‘reframed’; personnel
with low uncertainty avoidance scores reframed with less information than did personnel with
high uncertainty avoidance scores, i.e. they responded quicker to anomalies. In the context
of a complex sociotechnical system, this could provide valuable additional time in which to
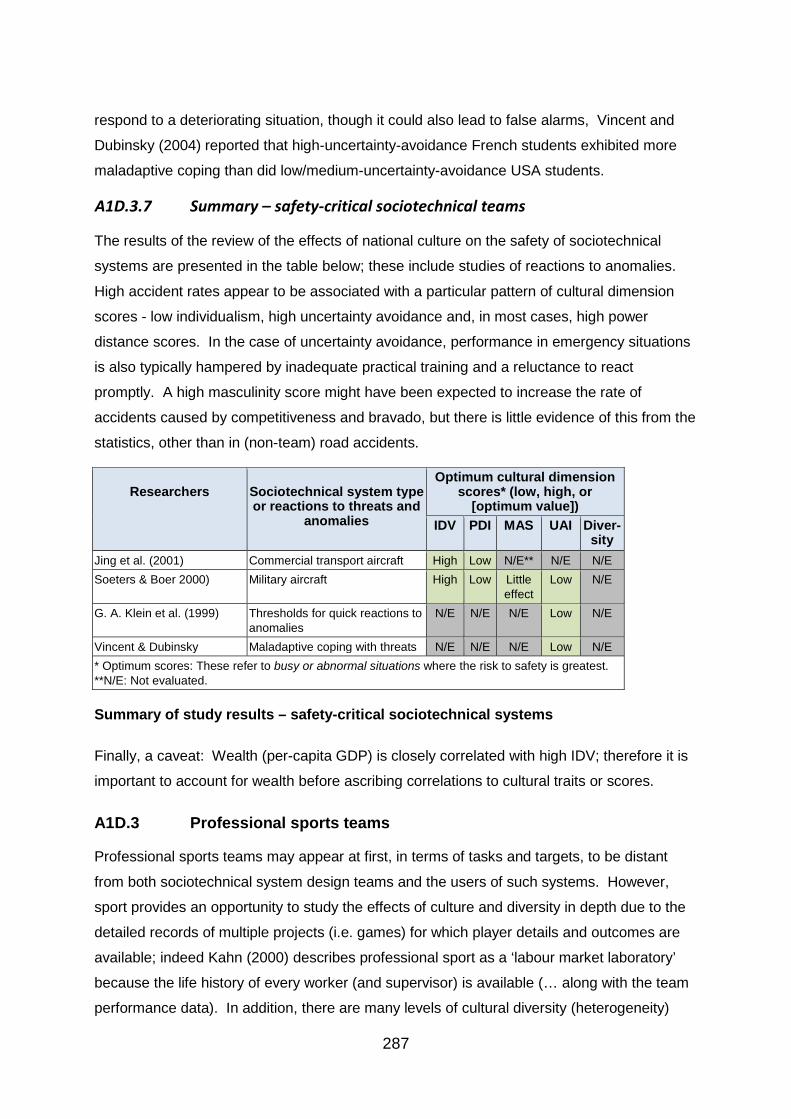
287
respond to a deteriorating situation, though it could also lead to false alarms, Vincent and
Dubinsky (2004) reported that high-uncertainty-avoidance French students exhibited more
maladaptive coping than did low/medium-uncertainty-avoidance USA students.
A1D.3.7 Summary – safety-critical sociotechnical teams
The results of the review of the effects of national culture on the safety of sociotechnical
systems are presented in the table below; these include studies of reactions to anomalies.
High accident rates appear to be associated with a particular pattern of cultural dimension
scores - low individualism, high uncertainty avoidance and, in most cases, high power
distance scores. In the case of uncertainty avoidance, performance in emergency situations
is also typically hampered by inadequate practical training and a reluctance to react
promptly. A high masculinity score might have been expected to increase the rate of
accidents caused by competitiveness and bravado, but there is little evidence of this from the
statistics, other than in (non-team) road accidents.
Researchers
Sociotechnical system type or reactions to threats and
anomalies
Optimum cultural dimension scores* (low, high, or
[optimum value]) IDV PDI MAS UAI Diver-
sity Jing et al. (2001) Commercial transport aircraft High Low N/E** N/E N/E Soeters & Boer 2000) Military aircraft High Low Little
effect Low N/E
G. A. Klein et al. (1999) Thresholds for quick reactions to anomalies
N/E N/E N/E Low N/E
Vincent & Dubinsky Maladaptive coping with threats N/E N/E N/E Low N/E * Optimum scores: These refer to busy or abnormal situations where the risk to safety is greatest. **N/E: Not evaluated.
Summary of study results – safety-critical sociotechnical systems
Finally, a caveat: Wealth (per-capita GDP) is closely correlated with high IDV; therefore it is
important to account for wealth before ascribing correlations to cultural traits or scores.
A1D.3 Professional sports teams
Professional sports teams may appear at first, in terms of tasks and targets, to be distant
from both sociotechnical system design teams and the users of such systems. However,
sport provides an opportunity to study the effects of culture and diversity in depth due to the
detailed records of multiple projects (i.e. games) for which player details and outcomes are
available; indeed Kahn (2000) describes professional sport as a ‘labour market laboratory’
because the life history of every worker (and supervisor) is available (… along with the team
performance data). In addition, there are many levels of cultural diversity (heterogeneity)
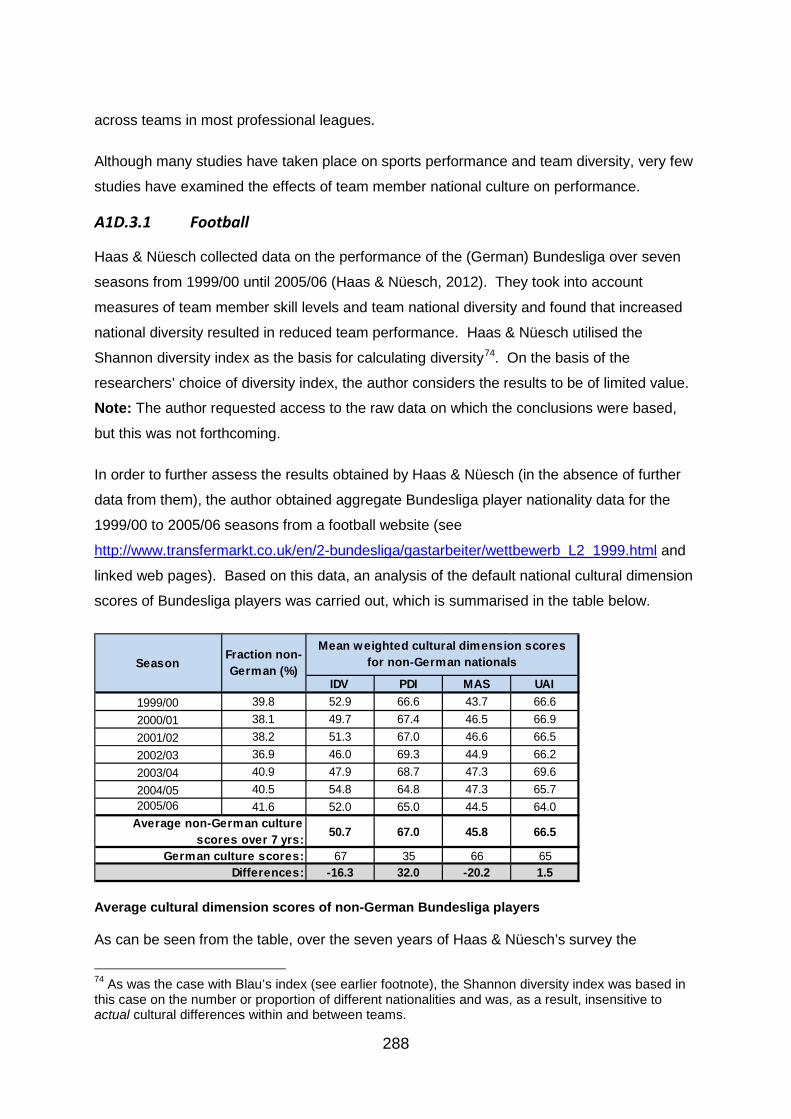
288
across teams in most professional leagues.
Although many studies have taken place on sports performance and team diversity, very few
studies have examined the effects of team member national culture on performance.
A1D.3.1 Football
Haas & Nüesch collected data on the performance of the (German) Bundesliga over seven
seasons from 1999/00 until 2005/06 (Haas & Nüesch, 2012). They took into account
measures of team member skill levels and team national diversity and found that increased
national diversity resulted in reduced team performance. Haas & Nüesch utilised the
Shannon diversity index as the basis for calculating diversity74. On the basis of the
researchers’ choice of diversity index, the author considers the results to be of limited value.
Note: The author requested access to the raw data on which the conclusions were based,
but this was not forthcoming.
In order to further assess the results obtained by Haas & Nüesch (in the absence of further
data from them), the author obtained aggregate Bundesliga player nationality data for the
1999/00 to 2005/06 seasons from a football website (see
http://www.transfermarkt.co.uk/en/2-bundesliga/gastarbeiter/wettbewerb_L2_1999.html and
linked web pages). Based on this data, an analysis of the default national cultural dimension
scores of Bundesliga players was carried out, which is summarised in the table below.
Average cultural dimension scores of non-German Bundesliga players
As can be seen from the table, over the seven years of Haas & Nüesch’s survey the
74 As was the case with Blau’s index (see earlier footnote), the Shannon diversity index was based in this case on the number or proportion of different nationalities and was, as a result, insensitive to actual cultural differences within and between teams.
IDV PDI MAS UAI1999/00 39.8 52.9 66.6 43.7 66.62000/01 38.1 49.7 67.4 46.5 66.92001/02 38.2 51.3 67.0 46.6 66.52002/03 36.9 46.0 69.3 44.9 66.22003/04 40.9 47.9 68.7 47.3 69.62004/05 40.5 54.8 64.8 47.3 65.72005/06 41.6 52.0 65.0 44.5 64.0
50.7 67.0 45.8 66.5
67 35 66 65-16.3 32.0 -20.2 1.5
German culture scores:Differences:
Mean weighted cultural dimension scores for non-German nationalsSeason
Fraction non-German (%)
Average non-German culture scores over 7 yrs:
289
weighted average non-German player individualism (IDV) score was 16 points less than that
of the Germans, the average power distance (PDI) score was 32 points greater and the
average masculinity (MAS) score was 20 points less; however, the average non-German
uncertainty avoidance (UAI) score was only 1.5 points (~1.5%) more than the national
German uncertainty avoidance score. It would therefore be reasonable to conclude that, on
average, high German team national diversity would result in significant differences in team
individualism, power distance and masculinity scores, compared to teams consisting only of
German nationals; these differing cultural dimension scores may have influenced match
performances as much as the diversity itself. Increased national diversity would have had
little effect on German team uncertainty avoidance scores, but the distrust of foreigners (or
‘strangers’) implied by the higher than average uncertainty avoidance scores of the German
players, managers and coaches (G H Hofstede 2001, Ch. 4) would have played a part in
reducing the effectiveness of integrating non-nationals into Bundesliga teams compared to,
for example, the case with English Premiership teams.
Brandes et al. (2009) collected and analysed the effects of national diversity on the perfor-
mance of German Bundesliga teams over the period 2001/02 to 2005/06, as measured by
their end-of-season position in the league. They hypothesised that different cultures could
bring differing skills to teams. Despite finding skill differences between nationalities, the
results of the analysis indicated that these skill differences (and the associated national
diversities) did not appear to have a bearing on team performance over a season. This
result is in contrast to that of Haas & Nüesch (see above), who analysed the Bundesliga
performances and national diversity over approximately the same period to find that cultural
diversity reduced team performances.
Brandes et al.’s measure of national diversity was similar to that of Haas & Nüesch in that it
was based on the number of different nationalities and, therefore, did not reflect the cultural
distance between team individuals. Brandes et al. determined players’ skillsets from 22
factors (e.g. goals scored, assists, tackle success rate, clearances), and found that there
were differences between nationalities. They developed a linear regression model that
explained teams’ final league position (or rank) in terms of the above 22 factors. One of the
problems with these 22 factors was that they were not equally applicable to the various
player roles, for example, ‘clearances’ were more important in the defender role than in the
striker role. Therefore, the associations between these factors and team performances were
likely to be unclear.
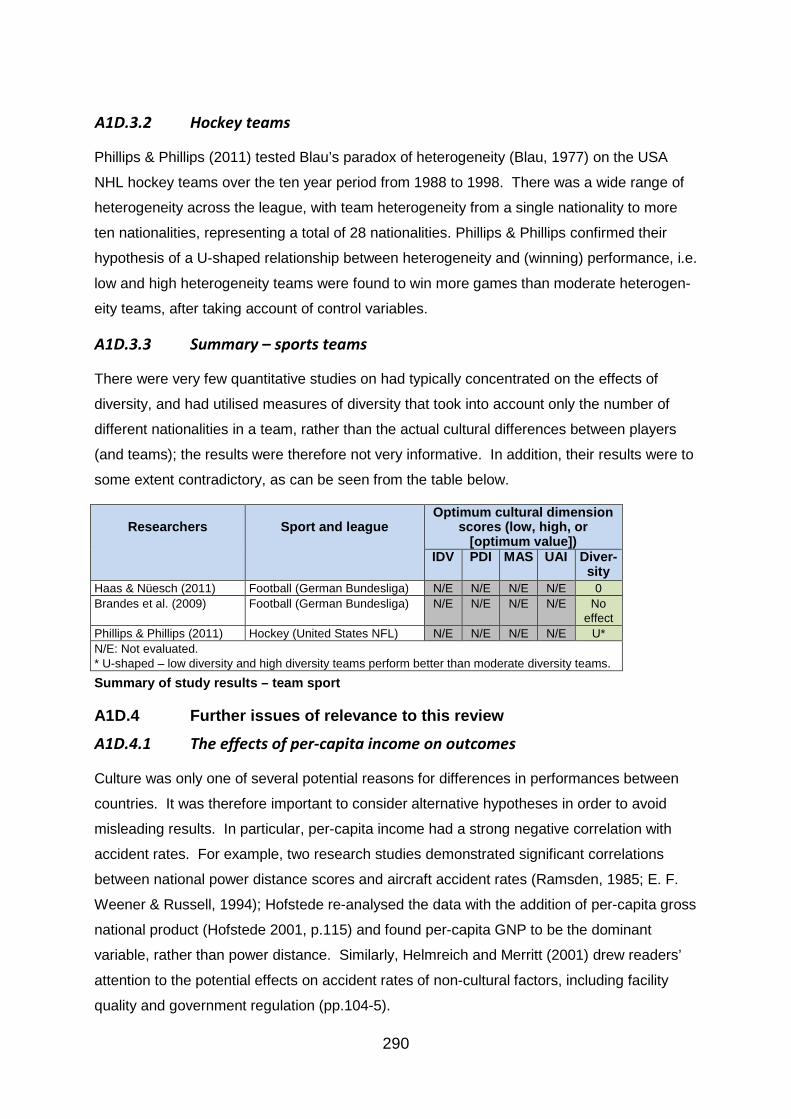
290
A1D.3.2 Hockey teams
Phillips & Phillips (2011) tested Blau’s paradox of heterogeneity (Blau, 1977) on the USA
NHL hockey teams over the ten year period from 1988 to 1998. There was a wide range of
heterogeneity across the league, with team heterogeneity from a single nationality to more
ten nationalities, representing a total of 28 nationalities. Phillips & Phillips confirmed their
hypothesis of a U-shaped relationship between heterogeneity and (winning) performance, i.e.
low and high heterogeneity teams were found to win more games than moderate heterogen-
eity teams, after taking account of control variables.
A1D.3.3 Summary – sports teams
There were very few quantitative studies on had typically concentrated on the effects of
diversity, and had utilised measures of diversity that took into account only the number of
different nationalities in a team, rather than the actual cultural differences between players
(and teams); the results were therefore not very informative. In addition, their results were to
some extent contradictory, as can be seen from the table below.
Researchers
Sport and league
Optimum cultural dimension scores (low, high, or
[optimum value]) IDV PDI MAS UAI Diver-
sity Haas & Nüesch (2011) Football (German Bundesliga) N/E N/E N/E N/E 0 Brandes et al. (2009) Football (German Bundesliga) N/E N/E N/E N/E No
effect Phillips & Phillips (2011) Hockey (United States NFL) N/E N/E N/E N/E U* N/E: Not evaluated. * U-shaped – low diversity and high diversity teams perform better than moderate diversity teams. Summary of study results – team sport
A1D.4 Further issues of relevance to this review
A1D.4.1 The effects of per-capita income on outcomes
Culture was only one of several potential reasons for differences in performances between
countries. It was therefore important to consider alternative hypotheses in order to avoid
misleading results. In particular, per-capita income had a strong negative correlation with
accident rates. For example, two research studies demonstrated significant correlations
between national power distance scores and aircraft accident rates (Ramsden, 1985; E. F.
Weener & Russell, 1994); Hofstede re-analysed the data with the addition of per-capita gross
national product (Hofstede 2001, p.115) and found per-capita GNP to be the dominant
variable, rather than power distance. Similarly, Helmreich and Merritt (2001) drew readers’
attention to the potential effects on accident rates of non-cultural factors, including facility
quality and government regulation (pp.104-5).
291
A1D.4.2 Studies that utilised multiple cultural frameworks Several published studies on national culture appeared to ‘mix-and-match’ cultural
dimensions from two or more cultural frameworks, for example that of Hasan & Ditsa (1999).
Because the introduction of non-orthogonal (i.e. overlapping) dimensions would tend to
reduce the strengths of relationships between cultural dimensions and outcomes, or even
reverse them, such studies were for the most part discarded.
292
APPENDIX 1E Tools that are available to evaluate ‘other culture’ teams and multicultural teams (expansion of Section 3.4)
The primary objective of this part of the literature review was to identify any existing
frameworks, tools etc., as a potential basis for the adaptation or development of a culture-
based team performance prediction tool, and to identify what gaps were present. A key
requirement was that any method or tool should not depend on knowledge about individuals
in post (e.g. actual team members) as, in most cases where the tool would be used, such
information would not be available; only team member national culture, organisation or
organisation type and, potentially, team member training or educational level would be
available in most cases.
In the case that the literature review revealed researchers that had devised a significantly
different approach (from that shown in Figure 3-5, see main text) to the prediction or
assessment of team performance of specific tasks or roles based on their cultural traits, then
such an approach would, of course, be examined in detail.
A1E.1 Methods, models and tools for the prediction of team performance or allocation of tasks based on national culture
The purpose of this section was to review methods, models and tools that could predict (or
could be adapted in whole or part to predict) team performances at key tasks based primarily
on national culture. Such tools would carry out most or all of the functions illustrated in
Figure 3-4. Due to the sparsity of material on national culture, the review was extended to
include organisational culture and safety culture-based models and tools.
A1E.1.1 National culture models and tools
Only one academic peer-reviewed publication was found on national culture-based methods,
models or tools for the prediction of team performance or the allocation of tasks. This
publication, by Sivakumar & Nakata (2003), split the product development process into two
stages (initiation and implementation) as recommended by Johne (1984). Using Hofstede’s
cultural framework75, Sivakumar & Nakata found that cultures with scores similar to those of
the Nordic countries performed best at the initiation stage, whereas cultures with scores
similar to those of the Japan, Taiwan and Mexico performed best at the implementation
stage. Sivakumar & Nakata then developed a series of mathematical models that optimised
75 Hofstede’s original cultural framework consisted of four cultural dimensions - individualism, power distance, uncertainty avoidance and masculinity; Hofstede provided national (average) numeric scores for these dimensions for many countries, enabling these countries to be compared on a cultural basis. Further details of Hofstede’s framework are provided later in this review, and in Chapter 4.
293
product development success, based on the relative weightings of the initiation and
implementation stages of product development; these models assumed that the same team
would carry out both stages, leading to significant compromise. Overall, the Sivakumar &
Nakata model was too limited (new product development only), only produced a set of values
for an ‘optimum culture’, and relied on a set of culture ‘slope coefficients’ that were not clearly
justified in the paper. A subsequent examination of all 17 citations of this paper revealed no
further culture modelling or culture tool related publications other than one by this author (A.
Hodgson, Hubbard, & Siemieniuch, 2013). A precursor paper by the above researchers
(Nakata & Sivakumar, 1996) reviewed the area and proposed a general framework for
relating national culture values to new product development; an examination of the abstracts
of the 470 citations of this paper revealed several studies of the effects of culture on various
forms of team performance, but no ‘culture tool’ related publications.
Earley and Gibson (2002) developed a qualitative, two-level model of multicultural teams that
incorporated six factors at the level of the individual team member (role identity processes,
trust and expectations of others, moral character and respect for self and others, inter-
personal affect, confidence and efficacy, and social awareness) and five factors at the group
level (within-group competition, fractionation, development of a hybrid culture, shared under-
standing and meaning, and shared goals and priorities). Some very general guidance was
provided that particular factors (e.g. high competitiveness) will tend to cause certain affects
(e.g. fragmentation), but little more.
As a result of the dearth of academic publications of relevance to national culture-based
tools, the search was widened to include non-academic sources, and to review
organisational culture and safety culture tools. These would not be directly utilisable, but
could perhaps offer insights into the measurement of culture, the construction of task
typologies and the effects of other factors on team performance.
An examination of non-academic sources of culture tools, in particular, commercial web sites
and business management books, revealed three ‘national culture’ tools. The first, ‘The
CULTURE Tool’ by Catholic Health was a very simple paper-based checklist; it appeared to
be targeted primarily at U.S. health workers travelling abroad. This tool was presented as a
table which, for three regions and eight countries, listed information under four headings –
belief practices, nutritional preferences, communication awareness and patient care. The
aim of the tool appeared to be the avoidance of the most obvious cultural blunders and, due
to its simplicity and limited coverage, it did not offer a basis for further development.
294
The second national culture tool was a software-based tool by Hofstede76 and the
consultancy company itim international, and was called ‘The Culture Compass Survey’ (see
http://geert-hofstede.com/cultural-survey.html); due to its commercial nature, only a limited
amount of information about its underlying methods could be gleaned. The Culture Compass
Survey enabled an individual to state his/her home country, country of interest and to select
one of eight roles, then to take a survey (consisting of 42 pairs of statements) that revealed
his/her cultural preferences. Scores were then produced internally that indicated cultural
differences between the individual and both his/her own country’s (default) national culture
and that of the country of interest; based on these differences, feedback comments were
generated that highlighted potential pitfalls and problems that might occur in both countries.
The ranking of these comments appeared to be based on the stated role of the participant.
This tool appeared to carry out, to some degree, several of the activities presented in Figure
3-4; it produced a cultural profile (for an individual, not a team), and took limited account of
the individual’s role (rather than tasks). The tool was aimed at the determination of the
degree of fit of an individual ‘outsider’ to another culture, rather than the degree of fit of a
team’s culture to a task set. Interestingly, Hofstede has in the past repeatedly warned about
the ecological fallacy arising from assigning cultural scores (or cultural preferences) to an
individual (Hofstede 2001, p.16). Note that the Culture Compass Survey was released at a
late stage of the work described in this thesis.
The third national culture tool, by DFA Intercultural Global Solutions, was an online software-
based tool called ‘CultureCompass’ (see http://dfaculturecompass.com/). As a commercial
tool, only a limited amount of information was available about the underlying methods, but it
appeared to utilise cultural dimensions from more than one cultural framework. This tool was
similar to the Hofstede-based Culture Compass Survey (above), it asked the user to select a
role, to take a survey consisting of ten questions (each with a sliding scale between two
extremes), and then to enter his/her nationality. The tool then displayed the differences
between the user and the national average, and reproduced standard material on the
particular dimensions.
A1E.1.2 Organisational culture models and tools
Two published reviews of organisational culture instruments for commerce and industry,
public administration (Jung et al., 2009) and health and social care (Scott, Mannion, Davies,
& Marshall, 2003) were initially examined. A number of the more interesting instruments
were assessed, for example, the Organizational Culture Inventory (Cooke & Szumal, 1993),
76 Hofstede’s academic contributions will be discussed later in this thesis.
295
Competing Values Framework (Cameron & Quinn, 2006). Typically, following the utilisation
of checklists, questionnaires, interviews, discussion groups or a combination of these, the
organisation’s current or proposed culture was allocated into one of several types (via a
taxonomic or dimensional scheme); these types were clearly related to or affected by
national culture, but very little reference was made as to the potential relationships to, and
effects of, national culture.
Most of the organisational tools appeared to employ checklists, questionnaires, interviews,
discussion groups or a combination of these, in some cases with computer support. There
was some overlap in the above reviews, but there were differing criteria, e.g. competitive
performance improvement in commerce and industry, vs. quality of care in healthcare and
intercultural competence in social care. Quantitative organisational culture measurement
tool assessments were typically based on typologies (i.e. allocating the culture to one of
several predefined types), or on dimensions, where the assessments resulted in scores
along each of several dimensions. None of the organisational culture tools contained
elements that could be adapted to a national-culture-based tool; in particular, these tools did
not enable the consideration of relationships between cultural elements and task
performance requirements.
The majority of non-academic sources presented commercial variants on organisational
culture tools. Examples included ‘lean culture’ tools, ‘cultural transformation’ tools, ‘culture
alignment’ tools and ‘customer culture’ tools; many of the commercial culture tool web sites
offered user training courses.
Only a minority of the publications on organisational culture acknowledged the overriding
influence of national culture on organisational culture and most of those that did
acknowledge it paid little more than ‘lip service’. For example, the book “Diagnosing and
Changing Organizational Culture based on the Competing Values Framework”, which goes
into considerable detail on the processes of assessing, diagnosing and changing culture,
does not allude to national culture.
Few (if any) of the commercial tools, took account of national cultural differences and, as a
result, would have little relevance outside western cultures. In addition, the organisational
culture tools appeared not to consider task-related requirements of organisations, rather a
target corporate culture that was thought to be conducive from specific viewpoints (e.g. ‘the
customer’).
296
A1E.1.3 Safety culture models and tools
Several published reviews of safety culture tools were examined. These included a safety
culture tool selection guide by the International Association of Oil & Gas Producers (OGP,
2010a), a review of the main safety culture assessment approaches and a selection of tools
by the European Agency for Safety and Health at Work (Eeckelaert, Starren, van
Scheppingen, Fox, & Bruck, 2011), and a review of patient-related safety culture tools as part
of a European Network for Patient Safety project (EUNetPaS, 2010). These tools had many
similarities to the organisational culture tools, again employing checklists, questionnaires,
interviews, discussion group, etc. However, none of the safety-related dimensions, nor any
task-related aspects, appeared to offer any contribution to the culture tool requirements of
the author’s research. As was the case with organisational culture, none of the safety culture
tools could be adapted to a national-culture-based tool, nor did these tools enable the
consideration of relationships between cultural elements and the task performance
requirements associated with the teams’ purposes.
A1E.1.4 Summary on culture tools
To summarise this section, no national culture-based models or tools were found that could
enable the prediction of the performance of a proposed or current team in a range of
team/task situations. No organizational or safety culture tools were found that could be
adapted effectively to meet the requirements of the research described in this thesis; indeed,
few of the academic or commercial publications on organisational culture appeared to
recognise the constraints that national cultures place on organisational and safety cultures.
The tool that came nearest to meeting the requirements was that of Hofstede and itim
international. There appears to be a significant gap, in both academia and commerce/-
industry, in the provision of tools or guidance for culture-based team selection, adaptation
and performance prediction for critical tasks.
A1E.2 Cultural frameworks
In the absence of national culture-based models, methods and tools for the estimation or
prediction of team performance, the purpose of this section was to ascertain the availability
and capabilities of frameworks, models, methods or tools for the capture of national cultural
traits of individuals and/or teams. These could form the basis of, or at least provide guidance
in the construction of, the ‘cultural side’ of a performance prediction model and tool .
Over the last half century, researchers in human culture have developed a variety of quanti-
tative instruments for the measurement of culture. Typically, these instruments or frame-
297
works encapsulated sets of cultural factors, attributes, orientations or dimensions that were
presented as a binary or ternary choice between qualitative alternatives, or in terms of a
quantitative scale between two extremes, and appeared to capture meaningful differences
between people of different nationalities. Although there was no universally-agreed set of
cultural dimensions, certain dimensions (and minor variations on them) appeared in several
of the cultural frameworks, and had been found to be statistically robust.
A review of cultural frameworks has been carried out by the author, for which the initially-
identified authors were Hofstede, House et al., Triandis and Schwartz. Academic books
detailing many of these frameworks represented a useful starting point; these initially-
perused academic books included “Culture’s Consequences” (G H Hofstede, 1980),
“Cultures and Organizations” (Geert Hofstede, 1991), “Culture, Leadership and Organi-
zations” (House et al., 2004), “Culture and Social Behavior” (Triandis, 1993), “Beyond
Individualism/Collectivism” (S H Schwartz, 1994) and “Multinational Work Teams: A New
Perspective” (Earley & Gibson, 2002). Academic papers by these authors, and reviews by
other authors of their work, were then retrieved and examined before expanding the review
via forward- and backward-citations. Following reading and commenting on these further
papers, sets of keywords and phrases were identified, and utilised via the databases/search
engines described in Subsection 3.2.2.
There were too many culture-measurement instruments (or frameworks) for all of them to be
detailed in this thesis, for example, a recent review paper (Taras et al., 2009) identified 121
such instruments. Therefore, this review was limited to the higher impact cultural frame-
works, as only these could offer the range of study results that would enable the researcher
to extract useful, predictive relationships between culture and performance.
In providing a form of ‘cultural location’ (see top box of Figure 3-5), the above frameworks
could, if combined with task/skill frameworks, provide the basis for a culture-based team
performance prediction methodology.
Note that most of the descriptions of cultural dimensions in this section are, of necessity,
limited; the references provide access to detailed definitions and explanations.
A1E.2.1 National or ethnic culture frameworks
National (or ethnic) culture typically reflects the most profound aspects of culture (compared
to occupational, organisational, etc.), as it is inculcated in individuals from a very age. This
section describes the higher impact frameworks.
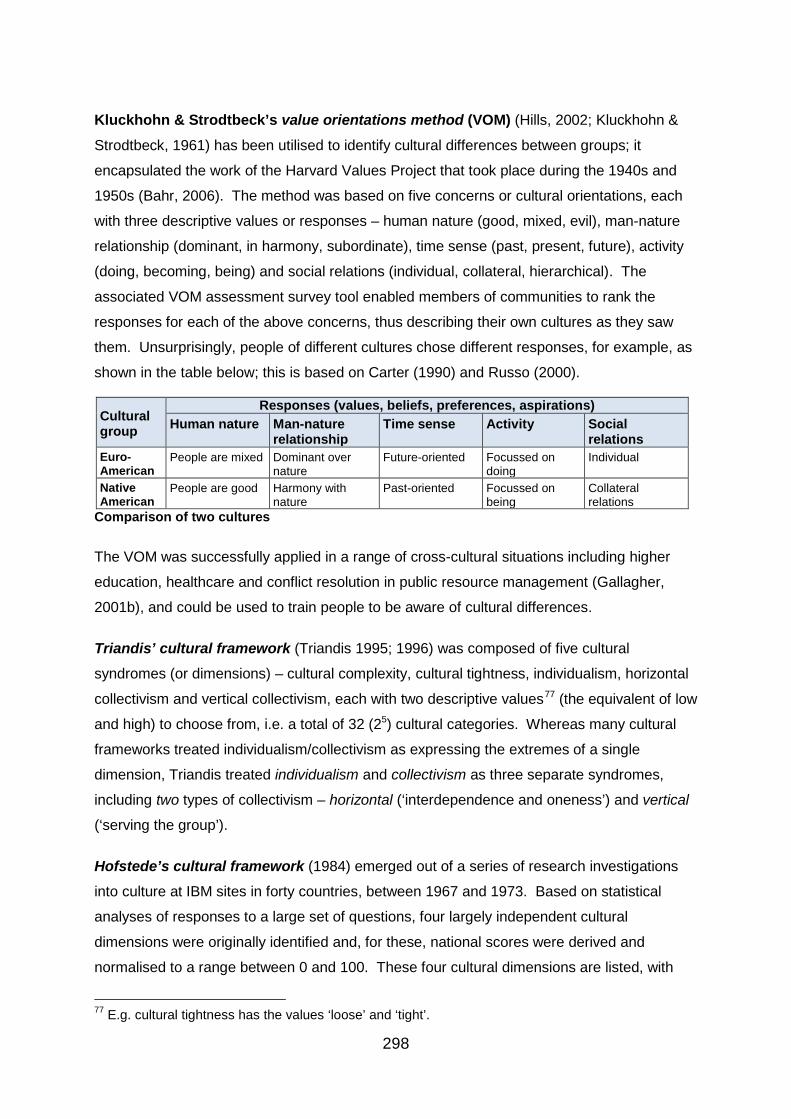
298
Kluckhohn & Strodtbeck’s value orientations method (VOM) (Hills, 2002; Kluckhohn &
Strodtbeck, 1961) has been utilised to identify cultural differences between groups; it
encapsulated the work of the Harvard Values Project that took place during the 1940s and
1950s (Bahr, 2006). The method was based on five concerns or cultural orientations, each
with three descriptive values or responses – human nature (good, mixed, evil), man-nature
relationship (dominant, in harmony, subordinate), time sense (past, present, future), activity
(doing, becoming, being) and social relations (individual, collateral, hierarchical). The
associated VOM assessment survey tool enabled members of communities to rank the
responses for each of the above concerns, thus describing their own cultures as they saw
them. Unsurprisingly, people of different cultures chose different responses, for example, as
shown in the table below; this is based on Carter (1990) and Russo (2000).
Cultural group
Responses (values, beliefs, preferences, aspirations) Human nature Man-nature
relationship Time sense Activity Social
relations Euro-American
People are mixed Dominant over nature
Future-oriented Focussed on doing
Individual
Native American
People are good Harmony with nature
Past-oriented Focussed on being
Collateral relations
Comparison of two cultures
The VOM was successfully applied in a range of cross-cultural situations including higher
education, healthcare and conflict resolution in public resource management (Gallagher,
2001b), and could be used to train people to be aware of cultural differences.
Triandis’ cultural framework (Triandis 1995; 1996) was composed of five cultural
syndromes (or dimensions) – cultural complexity, cultural tightness, individualism, horizontal
collectivism and vertical collectivism, each with two descriptive values77 (the equivalent of low
and high) to choose from, i.e. a total of 32 (25) cultural categories. Whereas many cultural
frameworks treated individualism/collectivism as expressing the extremes of a single
dimension, Triandis treated individualism and collectivism as three separate syndromes,
including two types of collectivism – horizontal (‘interdependence and oneness’) and vertical
(‘serving the group’).
Hofstede’s cultural framework (1984) emerged out of a series of research investigations
into culture at IBM sites in forty countries, between 1967 and 1973. Based on statistical
analyses of responses to a large set of questions, four largely independent cultural
dimensions were originally identified and, for these, national scores were derived and
normalised to a range between 0 and 100. These four cultural dimensions are listed, with
77 E.g. cultural tightness has the values ‘loose’ and ‘tight’.
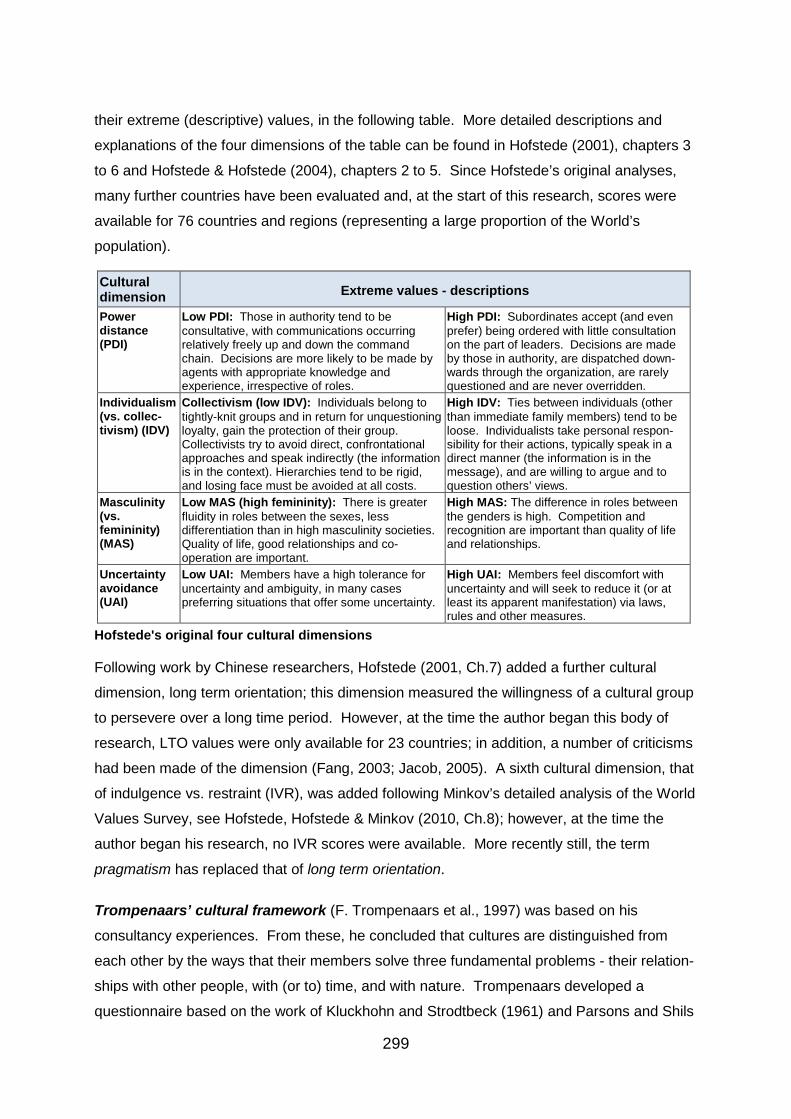
299
their extreme (descriptive) values, in the following table. More detailed descriptions and
explanations of the four dimensions of the table can be found in Hofstede (2001), chapters 3
to 6 and Hofstede & Hofstede (2004), chapters 2 to 5. Since Hofstede’s original analyses,
many further countries have been evaluated and, at the start of this research, scores were
available for 76 countries and regions (representing a large proportion of the World’s
population).
Cultural dimension Extreme values - descriptions
Power distance (PDI)
Low PDI: Those in authority tend to be consultative, with communications occurring relatively freely up and down the command chain. Decisions are more likely to be made by agents with appropriate knowledge and experience, irrespective of roles.
High PDI: Subordinates accept (and even prefer) being ordered with little consultation on the part of leaders. Decisions are made by those in authority, are dispatched down-wards through the organization, are rarely questioned and are never overridden.
Individualism (vs. collec-tivism) (IDV)
Collectivism (low IDV): Individuals belong to tightly-knit groups and in return for unquestioning loyalty, gain the protection of their group. Collectivists try to avoid direct, confrontational approaches and speak indirectly (the information is in the context). Hierarchies tend to be rigid, and losing face must be avoided at all costs.
High IDV: Ties between individuals (other than immediate family members) tend to be loose. Individualists take personal respon-sibility for their actions, typically speak in a direct manner (the information is in the message), and are willing to argue and to question others’ views.
Masculinity (vs. femininity) (MAS)
Low MAS (high femininity): There is greater fluidity in roles between the sexes, less differentiation than in high masculinity societies. Quality of life, good relationships and co-operation are important.
High MAS: The difference in roles between the genders is high. Competition and recognition are important than quality of life and relationships.
Uncertainty avoidance (UAI)
Low UAI: Members have a high tolerance for uncertainty and ambiguity, in many cases preferring situations that offer some uncertainty.
High UAI: Members feel discomfort with uncertainty and will seek to reduce it (or at least its apparent manifestation) via laws, rules and other measures.
Hofstede's original four cultural dimensions
Following work by Chinese researchers, Hofstede (2001, Ch.7) added a further cultural
dimension, long term orientation; this dimension measured the willingness of a cultural group
to persevere over a long time period. However, at the time the author began this body of
research, LTO values were only available for 23 countries; in addition, a number of criticisms
had been made of the dimension (Fang, 2003; Jacob, 2005). A sixth cultural dimension, that
of indulgence vs. restraint (IVR), was added following Minkov’s detailed analysis of the World
Values Survey, see Hofstede, Hofstede & Minkov (2010, Ch.8); however, at the time the
author began his research, no IVR scores were available. More recently still, the term
pragmatism has replaced that of long term orientation.
Trompenaars’ cultural framework (F. Trompenaars et al., 1997) was based on his
consultancy experiences. From these, he concluded that cultures are distinguished from
each other by the ways that their members solve three fundamental problems - their relation-
ships with other people, with (or to) time, and with nature. Trompenaars developed a
questionnaire based on the work of Kluckhohn and Strodtbeck (1961) and Parsons and Shils
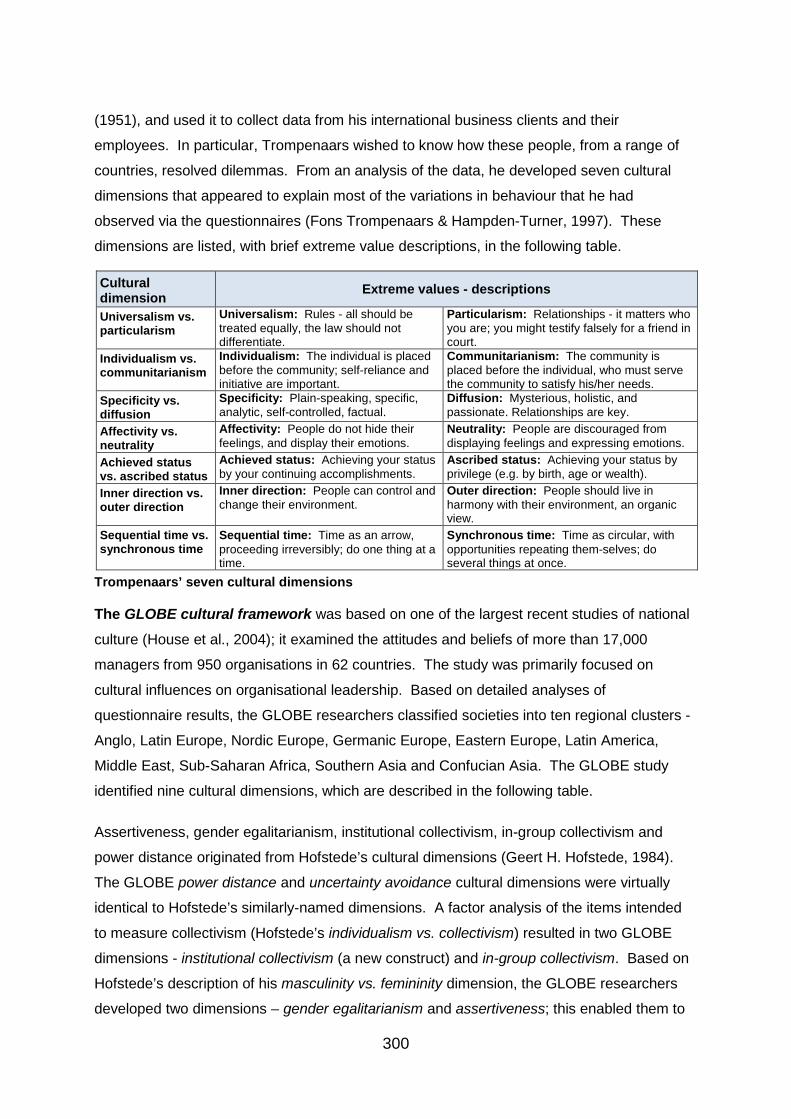
300
(1951), and used it to collect data from his international business clients and their
employees. In particular, Trompenaars wished to know how these people, from a range of
countries, resolved dilemmas. From an analysis of the data, he developed seven cultural
dimensions that appeared to explain most of the variations in behaviour that he had
observed via the questionnaires (Fons Trompenaars & Hampden-Turner, 1997). These
dimensions are listed, with brief extreme value descriptions, in the following table.
Cultural dimension Extreme values - descriptions
Universalism vs. particularism
Universalism: Rules - all should be treated equally, the law should not differentiate.
Particularism: Relationships - it matters who you are; you might testify falsely for a friend in court.
Individualism vs. communitarianism
Individualism: The individual is placed before the community; self-reliance and initiative are important.
Communitarianism: The community is placed before the individual, who must serve the community to satisfy his/her needs.
Specificity vs. diffusion
Specificity: Plain-speaking, specific, analytic, self-controlled, factual.
Diffusion: Mysterious, holistic, and passionate. Relationships are key.
Affectivity vs. neutrality
Affectivity: People do not hide their feelings, and display their emotions.
Neutrality: People are discouraged from displaying feelings and expressing emotions.
Achieved status vs. ascribed status
Achieved status: Achieving your status by your continuing accomplishments.
Ascribed status: Achieving your status by privilege (e.g. by birth, age or wealth).
Inner direction vs. outer direction
Inner direction: People can control and change their environment.
Outer direction: People should live in harmony with their environment, an organic view.
Sequential time vs. synchronous time
Sequential time: Time as an arrow, proceeding irreversibly; do one thing at a time.
Synchronous time: Time as circular, with opportunities repeating them-selves; do several things at once.
Trompenaars’ seven cultural dimensions
The GLOBE cultural framework was based on one of the largest recent studies of national
culture (House et al., 2004); it examined the attitudes and beliefs of more than 17,000
managers from 950 organisations in 62 countries. The study was primarily focused on
cultural influences on organisational leadership. Based on detailed analyses of
questionnaire results, the GLOBE researchers classified societies into ten regional clusters -
Anglo, Latin Europe, Nordic Europe, Germanic Europe, Eastern Europe, Latin America,
Middle East, Sub-Saharan Africa, Southern Asia and Confucian Asia. The GLOBE study
identified nine cultural dimensions, which are described in the following table.
Assertiveness, gender egalitarianism, institutional collectivism, in-group collectivism and
power distance originated from Hofstede’s cultural dimensions (Geert H. Hofstede, 1984).
The GLOBE power distance and uncertainty avoidance cultural dimensions were virtually
identical to Hofstede’s similarly-named dimensions. A factor analysis of the items intended
to measure collectivism (Hofstede’s individualism vs. collectivism) resulted in two GLOBE
dimensions - institutional collectivism (a new construct) and in-group collectivism. Based on
Hofstede’s description of his masculinity vs. femininity dimension, the GLOBE researchers
developed two dimensions – gender egalitarianism and assertiveness; this enabled them to
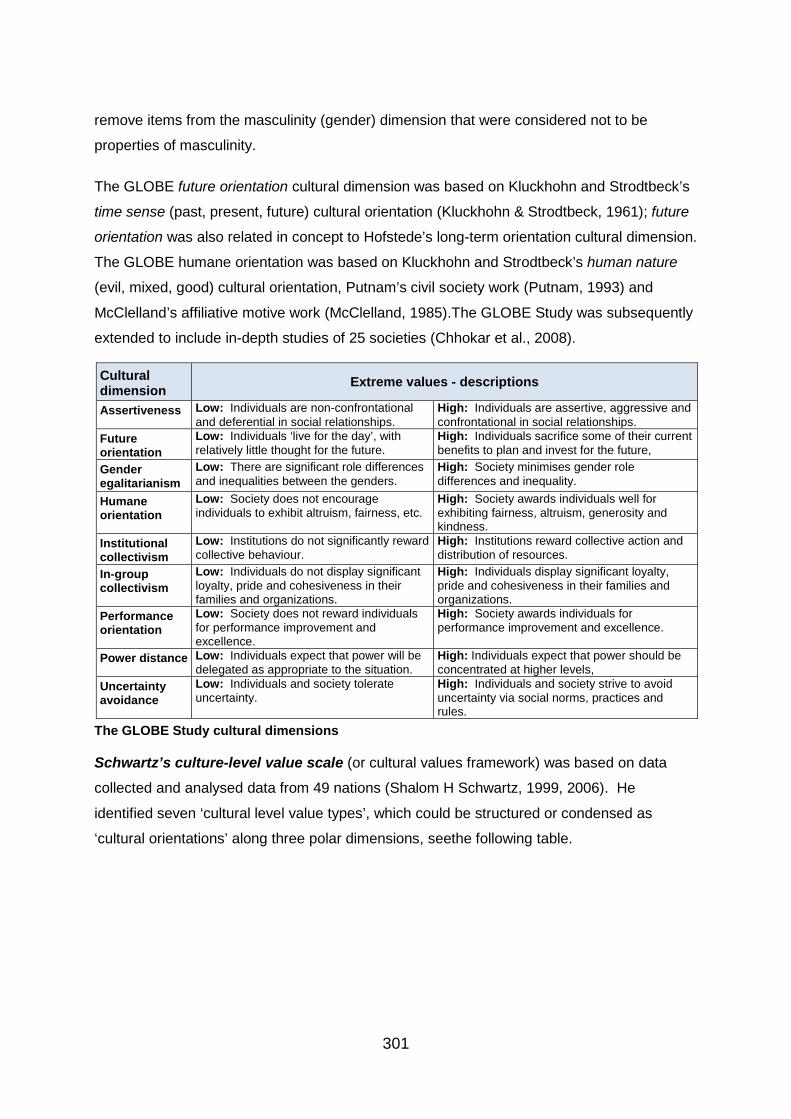
301
remove items from the masculinity (gender) dimension that were considered not to be
properties of masculinity.
The GLOBE future orientation cultural dimension was based on Kluckhohn and Strodtbeck’s
time sense (past, present, future) cultural orientation (Kluckhohn & Strodtbeck, 1961); future
orientation was also related in concept to Hofstede’s long-term orientation cultural dimension.
The GLOBE humane orientation was based on Kluckhohn and Strodtbeck’s human nature
(evil, mixed, good) cultural orientation, Putnam’s civil society work (Putnam, 1993) and
McClelland’s affiliative motive work (McClelland, 1985).The GLOBE Study was subsequently
extended to include in-depth studies of 25 societies (Chhokar et al., 2008).
Cultural dimension Extreme values - descriptions
Assertiveness Low: Individuals are non-confrontational and deferential in social relationships.
High: Individuals are assertive, aggressive and confrontational in social relationships.
Future orientation
Low: Individuals ‘live for the day’, with relatively little thought for the future.
High: Individuals sacrifice some of their current benefits to plan and invest for the future,
Gender egalitarianism
Low: There are significant role differences and inequalities between the genders.
High: Society minimises gender role differences and inequality.
Humane orientation
Low: Society does not encourage individuals to exhibit altruism, fairness, etc.
High: Society awards individuals well for exhibiting fairness, altruism, generosity and kindness.
Institutional collectivism
Low: Institutions do not significantly reward collective behaviour.
High: Institutions reward collective action and distribution of resources.
In-group collectivism
Low: Individuals do not display significant loyalty, pride and cohesiveness in their families and organizations.
High: Individuals display significant loyalty, pride and cohesiveness in their families and organizations.
Performance orientation
Low: Society does not reward individuals for performance improvement and excellence.
High: Society awards individuals for performance improvement and excellence.
Power distance Low: Individuals expect that power will be delegated as appropriate to the situation.
High: Individuals expect that power should be concentrated at higher levels,
Uncertainty avoidance
Low: Individuals and society tolerate uncertainty.
High: Individuals and society strive to avoid uncertainty via social norms, practices and rules.
The GLOBE Study cultural dimensions
Schwartz’s culture-level value scale (or cultural values framework) was based on data
collected and analysed data from 49 nations (Shalom H Schwartz, 1999, 2006). He
identified seven ‘cultural level value types’, which could be structured or condensed as
‘cultural orientations’ along three polar dimensions, seethe following table.
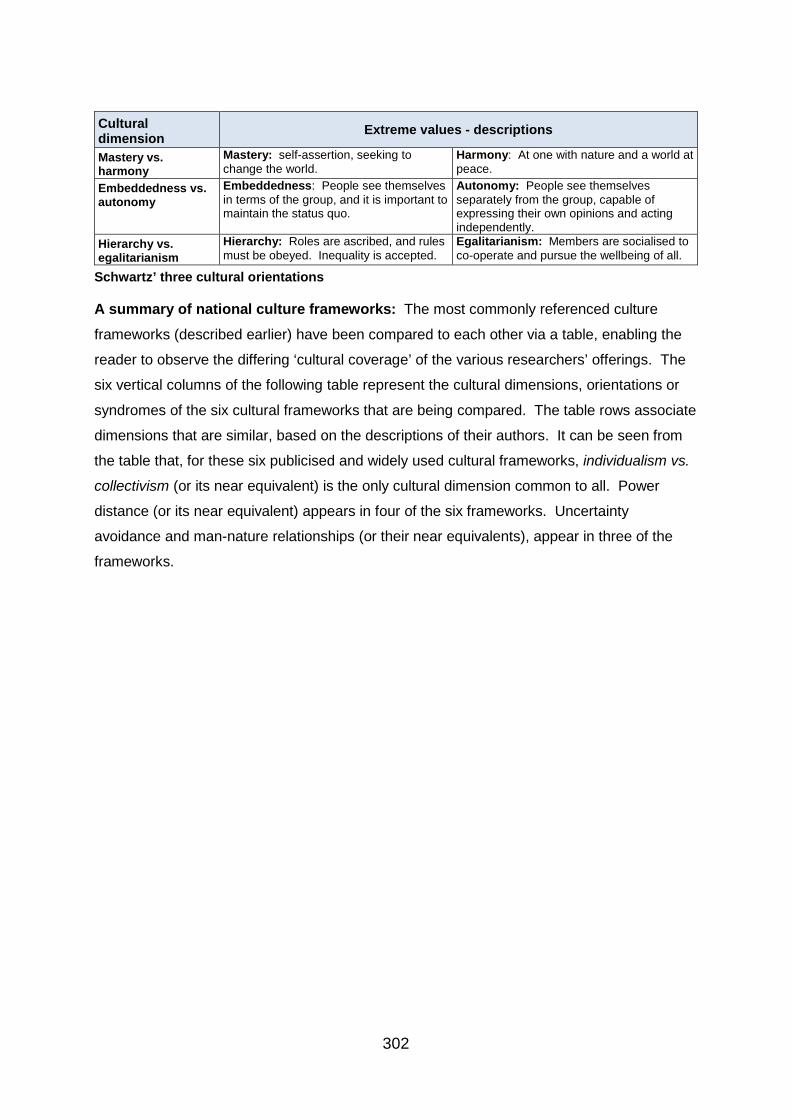
302
Cultural dimension Extreme values - descriptions
Mastery vs. harmony
Mastery: self-assertion, seeking to change the world.
Harmony: At one with nature and a world at peace.
Embeddedness vs. autonomy
Embeddedness: People see themselves in terms of the group, and it is important to maintain the status quo.
Autonomy: People see themselves separately from the group, capable of expressing their own opinions and acting independently.
Hierarchy vs. egalitarianism
Hierarchy: Roles are ascribed, and rules must be obeyed. Inequality is accepted.
Egalitarianism: Members are socialised to co-operate and pursue the wellbeing of all.
Schwartz’ three cultural orientations
A summary of national culture frameworks: The most commonly referenced culture
frameworks (described earlier) have been compared to each other via a table, enabling the
reader to observe the differing ‘cultural coverage’ of the various researchers’ offerings. The
six vertical columns of the following table represent the cultural dimensions, orientations or
syndromes of the six cultural frameworks that are being compared. The table rows associate
dimensions that are similar, based on the descriptions of their authors. It can be seen from
the table that, for these six publicised and widely used cultural frameworks, individualism vs.
collectivism (or its near equivalent) is the only cultural dimension common to all. Power
distance (or its near equivalent) appears in four of the six frameworks. Uncertainty
avoidance and man-nature relationships (or their near equivalents), appear in three of the
frameworks.
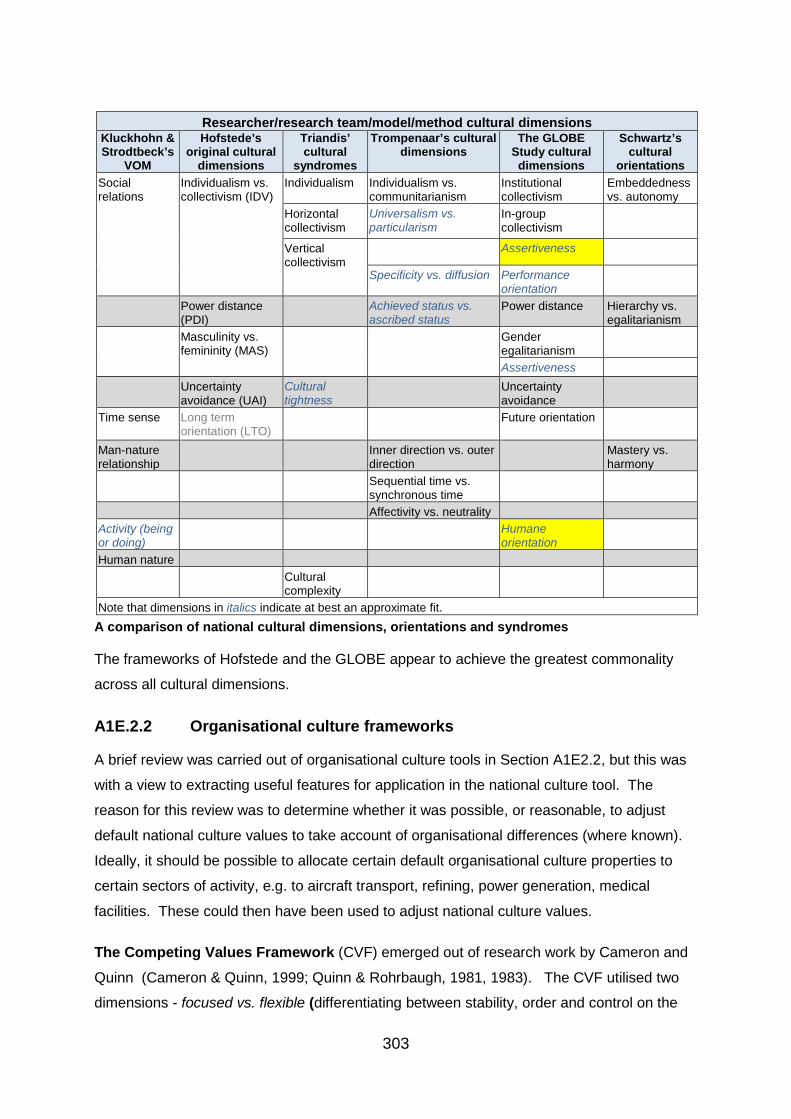
303
Researcher/research team/model/method cultural dimensions Kluckhohn & Strodtbeck’s
VOM
Hofstede’s original cultural
dimensions
Triandis’ cultural
syndromes
Trompenaar’s cultural dimensions
The GLOBE Study cultural dimensions
Schwartz’s cultural
orientations Social relations
Individualism vs. collectivism (IDV)
Individualism Individualism vs. communitarianism
Institutional collectivism
Embeddedness vs. autonomy
Horizontal collectivism
Universalism vs. particularism
In-group collectivism
Vertical collectivism
Assertiveness
Specificity vs. diffusion Performance orientation
Power distance (PDI)
Achieved status vs. ascribed status
Power distance Hierarchy vs. egalitarianism
Masculinity vs. femininity (MAS)
Gender egalitarianism
Assertiveness Uncertainty
avoidance (UAI) Cultural tightness
Uncertainty avoidance
Time sense Long term orientation (LTO)
Future orientation
Man-nature relationship
Inner direction vs. outer direction
Mastery vs. harmony
Sequential time vs. synchronous time
Affectivity vs. neutrality Activity (being or doing)
Humane orientation
Human nature Cultural
complexity
Note that dimensions in italics indicate at best an approximate fit. A comparison of national cultural dimensions, orientations and syndromes
The frameworks of Hofstede and the GLOBE appear to achieve the greatest commonality
across all cultural dimensions.
A1E.2.2 Organisational culture frameworks
A brief review was carried out of organisational culture tools in Section A1E2.2, but this was
with a view to extracting useful features for application in the national culture tool. The
reason for this review was to determine whether it was possible, or reasonable, to adjust
default national culture values to take account of organisational differences (where known).
Ideally, it should be possible to allocate certain default organisational culture properties to
certain sectors of activity, e.g. to aircraft transport, refining, power generation, medical
facilities. These could then have been used to adjust national culture values.
The Competing Values Framework (CVF) emerged out of research work by Cameron and
Quinn (Cameron & Quinn, 1999; Quinn & Rohrbaugh, 1981, 1983). The CVF utilised two
dimensions - focused vs. flexible (differentiating between stability, order and control on the
304
one hand, and flexibility, discretion and dynamism on the other) and internal vs. external (differentiating between an internally orientated focus on unity, integration and collaboration
on the one hand, and a focus on competition, rivalry and differentiation on the other). The
associated organization culture assessment instrument (OCAI) covered six categories of
organisation-related statements. By allocating a total of 100 points across the four
statements in each category (a total of 600 points), a set of scores emerged that located the
organisation within the four CVF quadrants. This allocation exercise was typically carried out
for the ‘as-is’ organisation, and again for the ‘would like to be’ organisation. The two
orthogonal dimensions produced four quadrants; companies falling into these four quadrants
were identified as hierarchy (focus/internal), market (focus/external), clan (flexible/internal)
and adhocracy (flexible/external).
Although the CVF was informative in terms of identifying broad organisational features, it was
difficult to see how it could be adapted (or linked in) to the national cultural traits of team
members for the purpose of the research work of this thesis.
Deal & Kennedy’s organisational culture framework (1988) utilised two cultural
dimensions - rapidity of feedback and reward (the speed with which companies learned
whether their actions and strategies have been successful), and degree of risk or uncertainty (the amount of risk (or uncertainty) associated with the organisation’s key activities). These
two dimensions produced four quadrants of culture (as with the earlier-presented CVF);
companies falling into these four quadrants were identified as possessing process culture
(slow/low-risk), bet-the-company culture (slow/high-risk), work-hard-play-hard culture
(rapid/low-risk) and tough-guy-macho culture (rapid/high-risk). Each of these company
cultures fitted a particular type of business. For example, the ‘tough-guy’, macho culture
(high risk, rapid feedback) was associated with high-stress organizations that focused
primarily on the present, facing constant risk of failing to achieve targets and losing rewards,
for example sports and hospital surgery. By way of contrast, the process culture (slow
feedback/reward, low risk) was typically a slow plodding bureaucracy intent on maintaining
the status quo (past=present=future).
As is the case with the earlier-presented CVF, it was difficult to see how the Deal & Kennedy
organisational culture framework could be adapted (or linked in) to the national cultural traits
of team members for the purpose of the research work of this thesis.
Harrison’s organisational culture framework: Harrison (1972) argued that there were six
‘interests’ associated with organisations, which formed the basis of ideological tension and
305
struggle. He proposed four organisational ideologies that emerged out of these:
• Power orientation: Power oriented organisations aspired to dominate their environ-
ments and eliminate all opposition. Those who were in positions of power attempted
to maintain total control over their subordinates. Although their autocratic structures
enabled power-oriented organisations to make quick decisions, the lack of rapid,
reliable information flow meant that they were not very flexible or responsive to
changes in complex environments.
• Role orientation: Role-oriented organisations aspired to rationality and orderliness,
and the maintenance of legality, legitimacy and responsibility. Rules and procedures
were developed and adhered to. Role oriented organisations were unable to respond
quickly to threats and changes in their environments because they were heavily
constrained by their rules and standard procedures.
• Task orientation: Task-oriented organisations were goal-driven, and all aspects of
such organisations were evaluated in terms of their contributions to the goal(s). They
typically had a decentralised structure, delegated decisions to those with the appro-
priate knowledge, and could react quickly to changes in complex environments.
• Person orientation: Person-oriented organisations existed to serve their members;
only a minimum level of authority was accepted over individual members. Person
oriented organisations tended to be slow to respond as they did not have adequate
means to organise their members to deal with threats.
Although Harrison did not specify any dimensions associated with the above orientations,
there was a degree of exclusivity between two pairs that have some of the qualities of
dimensions, i.e.:
• Role vs. task orientation: This was very similar to the CVS internal vs. external and
Hofstede’s process vs. results dimensions (see later).
• Person vs. power orientation: This was very similar to Hofstede’s organisational
culture dimension of employee vs. job-orientation (see later).
Looking to national culture dimensions, Harrison’s power orientation could (from its
description) be associated with high power distance, his role orientation could be associated
with uncertainty avoidance. However, in the absence of associations between the above
orientations and particular sectors, it was not feasible for it to be adopted for the research
work described in this thesis.
Hofstede’s six dimensional model of organisational culture (Hofstede et al. 1990) was
306
based on studies of organizational cultures in twenty units of ten companies in Denmark and
the Netherlands. Following a detailed analysis of the results Hofstede et al. developed a
model of organizational cultures consisting of the following dimensions:
• Process vs. results: Concern with means (processes, techniques, etc.) vs. concern
with the achievement of goals.
• Employee vs. job-oriented: Concern about people/employees, delegation of
decision-making vs. concern about getting the job done, centralized decision-making,
impersonal.
• Parochial vs. professional: Employees who derived their identities from the
organisation (e.g. ‘the company man’) vs. employees who derived their identities from
their professions (who separate their external lives from the job).
• Open vs. closed: Open, welcoming to new employees, easy to gain an insight vs.
closed to outsiders; people took a long time to fit in.
• Loose vs. tight: Flexible with regard to attitudes, times and budgets vs. highly
controlled, serious, adhere to times, budgets.
• Normative vs. pragmatic: Implementation of (inviolable) rules vs. maintaining
flexibility in order to serve the customer.
Hofstede et al. ( 2010), p.370, emphasized that, as the research data behind the above six
dimensions was based on twenty organisational units in two European countries, it could not
be claimed that that the above six dimensions adequately described all types of organis-
ations in all countries. However, they suggested that all organisational cultures could
usefully be described by a number of dimensions that would have some resemblance to the
above six dimensions.
The above six-dimensional framework was not sufficiently tested, nor were there sufficient
applications in the research literature for it to be adopted for the research work described in
this thesis.
Schein’s organisational culture framework (1996a; 1996b) consisted of the following six
dimensions:
• Relationship to the environment: The organisation was dominant vs. harmonising
vs. niche-seeking within its business environment.
• Nature of human activity within the organisation: The accepted model of
307
behaviour was to control via proactive behaviours vs. to harmonise relationships via
passive/fatalistic compromises.
• Nature of time within the organisation: Organisation members preferred looking to
the past vs. living for the present vs. looking to the future.
• Reality and truth in the organisation: Organisation members assessed reality and
truth via systematic formulae of motive, means and opportunity vs. experience,
wisdom and intuition.
• The nature of people: Organisation members assumed that people were good, evil
or lazy and perhaps able to change vs. assuming that people were trying to do their
best, even when they failed.
• Distribution of power and affiliation: Organisation members competed, grabbed
resources, worked primarily to further their own goals, and managers were autocratic
or paternalistic vs. members cooperated, worked in a team-oriented manner and
shared resources.
The reality in most organisations was that they were ‘somewhere in the middle’ for most of
the above dimensions and, also, there would be large differences across different levels and
functional areas. As with the other frameworks, there were insufficient applications, and no
relationship between the above and various industrial sectors, so it could not be adopted for
the research work described in this thesis.
A summary of organisational culture frameworks: The most commonly referenced
organisational culture frameworks (described earlier) are compared to each other via a table,
enabling the reader to observe the differing ‘organisational cultural coverage’ of the various
researchers’ offerings. The five vertical columns of the following table represent the cultural
dimensions, orientations or syndromes of the five organisational culture frameworks that are
being compared. The table rows associate dimensions that are similar, from the five frame-
works.
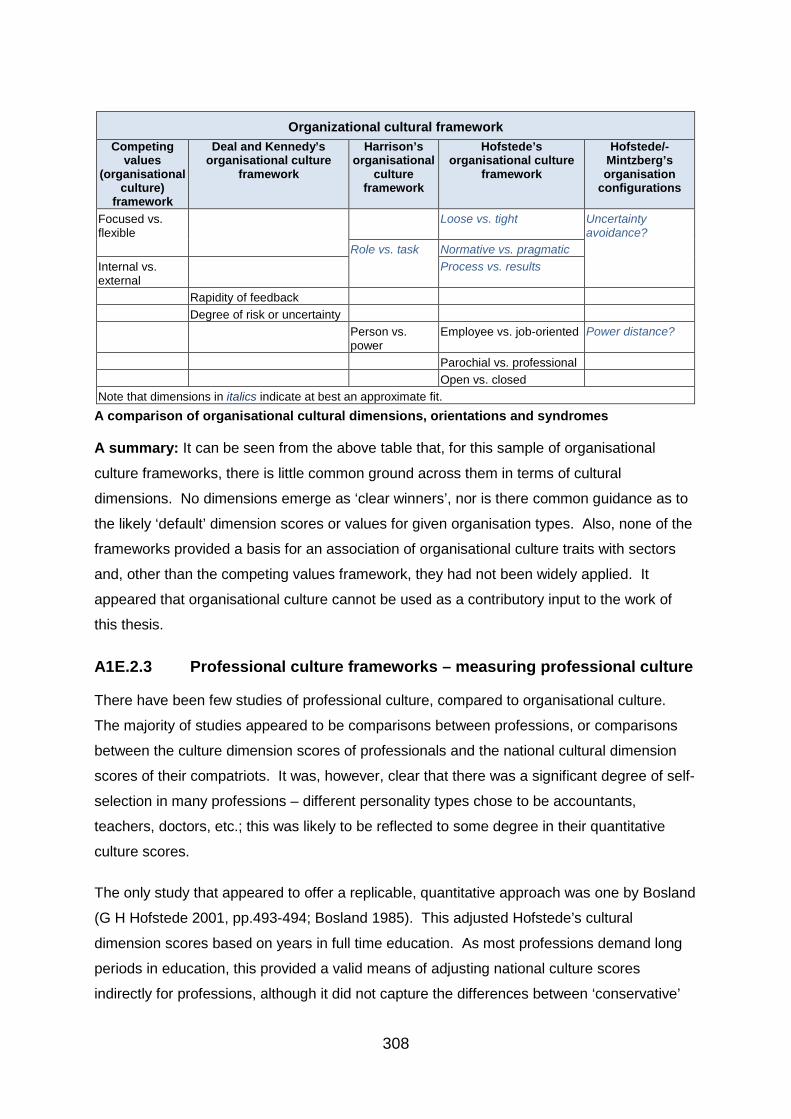
308
Organizational cultural framework Competing
values (organisational
culture) framework
Deal and Kennedy’s organisational culture
framework
Harrison’s organisational
culture framework
Hofstede’s organisational culture
framework
Hofstede/-Mintzberg’s organisation
configurations
Focused vs. flexible
Loose vs. tight Uncertainty avoidance?
Role vs. task
Normative vs. pragmatic Internal vs. external
Process vs. results
Rapidity of feedback Degree of risk or uncertainty Person vs.
power Employee vs. job-oriented Power distance?
Parochial vs. professional Open vs. closed Note that dimensions in italics indicate at best an approximate fit.
A comparison of organisational cultural dimensions, orientations and syndromes
A summary: It can be seen from the above table that, for this sample of organisational
culture frameworks, there is little common ground across them in terms of cultural
dimensions. No dimensions emerge as ‘clear winners’, nor is there common guidance as to
the likely ‘default’ dimension scores or values for given organisation types. Also, none of the
frameworks provided a basis for an association of organisational culture traits with sectors
and, other than the competing values framework, they had not been widely applied. It
appeared that organisational culture cannot be used as a contributory input to the work of
this thesis.
A1E.2.3 Professional culture frameworks – measuring professional culture
There have been few studies of professional culture, compared to organisational culture.
The majority of studies appeared to be comparisons between professions, or comparisons
between the culture dimension scores of professionals and the national cultural dimension
scores of their compatriots. It was, however, clear that there was a significant degree of self-
selection in many professions – different personality types chose to be accountants,
teachers, doctors, etc.; this was likely to be reflected to some degree in their quantitative
culture scores.
The only study that appeared to offer a replicable, quantitative approach was one by Bosland
(G H Hofstede 2001, pp.493-494; Bosland 1985). This adjusted Hofstede’s cultural
dimension scores based on years in full time education. As most professions demand long
periods in education, this provided a valid means of adjusting national culture scores
indirectly for professions, although it did not capture the differences between ‘conservative’
309
and ‘outgoing’ professions that both required degree-level qualifications.
A summary: Bosland’s adjustment of the four dimension scores of Hofstede’s original
national cultural framework was the only quantitative approach found that was related (via
years of full time education) to professional culture. As it adjusted Hofstede’s national culture
scores, it would be simple to incorporate into a method and tool that utilised Hofstede’s
national culture framework.
A1E.3 Measures of team cultural diversity
For the purposes of the work described in this thesis, a measure of cultural diversity of team
members was required that provided a quantitative value reflecting the mean cultural
differences between team members. It was important that any measure utilised by the
researcher would take account, not only of the number of different cultures (e.g. national
cultures) in a team, but also the degree of difference between each of those cultures. In
addition, it was important that such a measure would enable users of a tool incorporating the
measure to identify the diversity associated with each team member.
A review of the literature revealed three main approaches to the determination of diversity,
examples of which are briefly discussed below.
The Blau Index of racial and ethnic diversity (Blau, 1977) , the Herfindhal-Hirschmann Index (HHI) (Rhoades, 1993), the Shannon (or Shannon-Wiener) Diversity Index (SDI)
and Simpson’s Index (Simpson’s D) were based on the number of different types (e.g. plant
species, nationalities) and their relative weightings, not the degree of difference (diversity)
between types.
Greenberg’s Diversity Index (also known as the linguistic diversity index, LDI) was primarily
utilised to measure the diversity of a country’s languages. In his paper on the measurement
of linguistic diversity (Greenberg, 1956), Greenberg described a simple index based on the
probability of two speakers from the selected population speaking the same language,
GDI(A), and also described an alternative that included a weighting for each language pair
based on their linguistic similarities, GDI(B). He then described an approach that takes
account of multilingual speakers. The weighted monolingual index was defined as:
GDI(B) = 1 - ∑m,n (mn) (rMN)
where m, n were the proportions of speakers of languages M and N in the population,
and rMN was a measure of the resemblance between languages M and N.
310
The Greenberg monolingual weighted index (type B) took account of the level of disparity
between object types (species, languages, etc.). It was therefore able to distinguish between
teams with members of different but similar cultures from those of very different cultures.
The Stirling Index (Stirling, 1999; Stirling, 2007) took account of the level of disparity
between object types (different species, languages, cultures/countries, etc.) by assuming that
they were located in Euclidean space, and the distance between any two object types
represented their mutual disparity. The Stirling index was defined as:
SI = ∑i,j dij pi pj
for i,j = 1 to the number of species (or team member countries),
dij = distance (disparity) between species (or country) ‘i’ and ‘j’
and pi = the proportion of the population belonging to species or country ‘i’.
The Stirling index took account of the level of disparity between object types (species,
languages, etc.).
The standard statistical measures of mean and variance, as used by Elron (1997) could
be utilised to derive a value for team cultural diversity. Elron calculated the mean and
standard deviation of team members based on Hofstede’s default national culture scores for
team members, the standard deviation providing a measure of team cultural diversity.
To summarise the above: There appeared to be three main approaches to the derivation
of diversity within a team or population. The most common approach took account of the
number of different members based on some nominal value (e.g. gender, profession or
nationality); although this approach was accurate for binary differences such as gender, it
was unsatisfactory as a measure of cultural diversity because cultures could be very similar
(e.g. Germany, Czech Republic) or very different (e.g. Guatemala, Australia). The second
approach utilised a measure of distance or separation in Euclidean space between members
(e.g. based on their national culture scores, education and/or ages). However, to combine
(in our case) the cultural separation along several axes into a single (Euclidean) distance
was to imply that each cultural factor or dimension had a similar effect to each other in every
circumstance. The third, statistical approach to the derivation of team or population diversity
placed an overemphasis on outliers.
A1E.4 Team and task classifications
For the purposes of the work described in this thesis, it was necessary to be able to describe
teams and/or their tasks in terms of the behavioural capabilities required for successful
311
performance. Such behavioural capabilities (for want of a better term) could then be
associated with team member cultural scores to form the basis of an assessment
methodology and tool. The following five culture-modified areas of behaviour/behavioural
requirements were identified in Subsection 3.3.3: Management and decision-making,
creativity and innovation, interaction (communication and co-ordination), uncertainty handing
and achieving shared situation awareness. It was therefore important to examine the
literature in order to evaluate team and task typologies (taxonomies, classifications) in terms
of their abilities to represent the above culture-related requirements.
There have been many detailed reviews of the literature on team theory, in particular on
team classifications, for example Guzzo & Dickson (1996), DeMatteo et al. (1998), Wildman
et al. (2012) and Hollenbeck et al. (2012). It appeared from an examination of these reviews
that team classifications varied greatly depending on the ‘central’ team type (the classifier’s
starting point) and on the purpose of the classification. Some of the more interesting
approaches to team/task classification (from the point of view of the author’s research) are
briefly described below.
Cohen and Bailey (1997) carried out a review of research on teams and groups published
between January 1990 and April 1996. Their team classification was unsuitable for the
approach in this thesis, as they appeared to place some types of organised action team in
the same category as routine manufacturing teams. However, they defined team
performance along three dimensions – output quantity and quality, member attitudes, and
behavioural outcomes. The latter category was of interest, as it could contribute to a link
between culture and some aspects of performance. Marks, Mathieu and Zaccaro (2001)
appeared to concentrate on the classification of industrial and commercial work teams but
did not provide sufficient details on the task or behavioural aspects of teams to be useful to
the work of this thesis; however, their ‘team maintenance’ processes could perhaps offer a
basis for ‘layering’ the effects of culture onto team performance.
Fernandez et al.’s emergency medicine team taxonomy (2008) utilised the input-process-
output (I-P-O) model that was widely used in industry and academia. Inputs represented the
team member characteristics (abilities, experience, etc.), processes represented the
behaviours and collaborations required to achieve successful outputs in terms of task
outcomes and team performances; the various sets of ‘task-work’ went through the I-P-O
cycle, the output of one cycle being an input to the next. The emergency medicine process
model was proposed as having (in temporal sequence) a planning and preparation phase,
action processes and reflection processes. In particular, the taxonomy’s ‘action process’
312
phase and ‘support mechanisms’ might have been the locations for culture-affected
tasks/behaviours, but insufficient details were available to consider it further. Steiner (1972)
recognised that the task was one of the key factors in team or group performance. He split
unitary (indivisible) tasks into disjunctive, conjunctive, additive and discretionary tasks, and
divisible tasks into self-matching, (pre-)specified and organisationally (externally) allocated
tasks; however, the basis of his classification was to enable the optimum allocation of team
members on the basis of their technical or experience-based proficiencies, and it would be
difficult to associate such tasks with the effects of culture.
McGrath’s circumplex (McGrath 1984, Ch. 5) integrated the work of Hackman & Morris
(1975), Shaw (1973), Davis and Laughlin, to produce his ‘task circumplex’ classification
framework for group tasks. This circumflex was represented as a circle with eight segments,
each segment being one of eight mutually exclusive and collectively exhaustive task
categories - planning, creativity, intellective (have ‘correct’ answers), decision-making (have
no ‘correct’ answers), cognitive conflict, mixed motive, competitive and performance/psycho-
motor tasks. McGrath’s circumflex listed some of the areas where problems might occur in
teams due to the effects of culture, for example in creativity tasks, cognitive conflict tasks,
mixed motive tasks and competitive tasks.
Gluesing & Gibson (2003), Chapter 11: Designing and Forming Global Teams, pp. 199-
226, claimed that the complexity that global teams, in particular, faced could be described
along five dimensions – task, context, people, time and technology. Task complexity
appeared to be the most relevant for cultural issues, and could be described in terms of four
elements - workflow interdependence (based on the degree of interaction required between
team members), task environment (varying from a static, stable, predictable environment to
one that was highly dynamic and unpredictable, causing disruptions and re-evaluations of
activities), external coupling (which appeared to overlap task environment), and internal
coupling (which appeared to overlap workflow interdependence). Gluesing & Gibson’s
approach was extremely complex, but it was perhaps only the communication ramifications
of workflow interdependence and the uncertainty ramifications of task environment that had
clear links to culture.
Hollenbeck et al. (2012) reviewed the literature of team taxonomies and classifications, and
demonstrated the weaknesses of taxonomies and other categorical systems when
attempting to categorise concepts such as team types, which can be placed on a continuum.
They proposed three dimensions as forming the basis for a wide range of team types - skill
differentiation (the degree of knowledge or skill specialisation, which made it difficult to
313
substitute team members), authority differentiation (the degree to which decision-making was
concentrated, or distributed) and temporal stability (the degree to which team members had
a shared history and expectations of a shared future). This three-dimensional approach
offered a limited degree of flexibility in categorising industrial and commercial work teams,
but could not capture the key differences between teams that are related to culture, e.g.
creativity or handling uncertainty. Although the dimensions chosen by Hollenbeck et al. were
not suitable for a culture-based team performance prediction methodology, the authors
presented a very cogent case for a dimensional, rather than categorical (e.g. taxonomic)
approach to team/task classification.
To summarise the above: Most of the team/task classifications were concentrated on a
very small range of teams, and did not include the factors that were mediated by culture.
Steiner’s approach to task classification was valid for research and production-type teams,
but was not very relevant to rapid-reaction (and similar) teams. McGrath’s task circumplex
contained several potentially useful task categories, Gluesing & Gibson’s dimensions of
complexity covered too few of the factors that influence culture-related performance to be
usable. The multidimensional approaches of Hollenbeck et al. and Gluesing & Gibson
appeared to be the most flexible, but the chosen dimensions excluded most of the key team
types of relevance to this author’s research, and also did not capture nuances of relevance to
culture; however, the workflow interdependence and task environment of Gluesing and
Gibson’s approach could (in theory) be adapted. None of the team and task typologies
identified in the literature covered the range of factors required for this research work.
However, the reviews, in particular that of Hollenbeck et al., highlighted the severe limitations
of any taxonomic approach – some concepts fit into rigid taxonomic hierarchies (e.g. flora
and fauna), others do not (e.g. team and task types, games, word definitions). Therefore, it
was necessary to devise an alternative team/task typology, based on a non-taxonomic
classification.
314
Appendix 2: Anecdotal – interviews and personal conversations Note that, as the examples in this section are anecdotal, no claim is made to the effect that
they are typical or representative. The sources of most of the anecdotes below are the
conversations that the author has had with other research staff, foreign students, lecturers,
fellow footballers and others about their experiences on coming to Britain or travelling
elsewhere. In many cases, the anecdotes that the author obtained were potentially traceable
to their sources, and in other cases the author was asked not to quote them; such anecdotes
have not been listed in the selection below.
English indirectness: A Swedish PhD student who had spent some time in the USA
recounted his initial difficulties on coming to the UK. He commented to me that his British
supervisors or managers would never tell him to do anything, but would use phrases such as
“It would be useful if a summary of the data was available by …”, “It would be helpful …”.
Just tell me what you want me to do!
English yob culture: A Palestinian student commented on his shock at both the number of
young men and women behaving in a drunken manner most evenings near his UK Midlands
accommodation, and at the number of single young women with children. Middle-Eastern,
Indian and Chinese students have all asked me “Why do you allow this?”
Expectations violated: Two high power distance research colleagues have commented to
me (and to other British colleagues) that they found it offensive when people junior to them-
selves from the same region (typically research students who had spent several years in the
UK) did not acknowledge their seniority when addressing them.
Face and politeness (China): A Chinese fellow student/footballer remarked to me that I
would have difficulty obtaining useful answers from his countrymen because they would not
be willing to make critical comments about China, as that was an issue of losing face, nor
would they make critical comments about the UK as that would be considered to be rude to
their British hosts.
Face and politeness (Singapore): I lectured for many years on the topic of manufacturing
management; the second year course had a large intake of Singaporean students. Most UK
students would regularly ask questions, and would answer my questions; however, the
Singaporeans avoided such interaction in front of the class, even when encouraged by me.
However, during the break in the middle of a two hour lecture presentation, they would
315
quickly confer and send a delegate to me with a list of questions to be answered. I never
had time to grab that desperately needed cup of coffee! The issue was apparently about
face – no Singaporean student would risk asking a question for which, in retrospect, the
answer appeared obvious.
Face, meetings (China): When arranging academic and administrative meetings at a
Chinese mainland university, the Chinese secretary of an English professor that I worked for
had to plan the seating arrangements very carefully in order to avoid offence, which would
hinder the purpose of the meeting. Face issues were associated with where a person sat in
relation to the head of the table, whom he or she sat next to, and whether another person of
perceived lower status sat further up the table.
Jobs (China): A Chinese PhD student, who was completing his write-up, told me that he
hoped to obtain a lectureship at a university near his home. However, it all depended on
guanxi - the influence that his relatives would be able to bring to bear on the university
decision-makers.
Meetings (UK): I was the only British member of a multinational research group at a UK
university. It was difficult to persuade some Middle-Eastern student-members to contribute
to meetings, so we instigated a policy that every attendee at the meeting was required, in
turn, to state his or her views on each significant item discussed at the meeting. This had the
additional benefit that most of us made more effort to prepare for the meeting.
Meetings (UK and Eastern Europe): An Eastern European commented to me that when he
first came to this country, he was very surprised to find that things were achieved at meetings
in Britain; this had not been the case in his country, where meetings were somewhat of a
charade, and the real decisions were made elsewhere. He was also surprised, when he first
joined a university department, by the high level of concern that members of staff at meetings
showed for individual (usually struggling) students.
Rote education (Egypt): An Egyptian commented on the tradition of rote education in
Egypt – the need to score in the mid-90’s or better in order to gain a place at a prestigious
university resulted in parents and students concentrating on the ability to regurgitate the
material they had learned verbatim.
Trust (Egypt): An Egyptian former construction engineer commented to me that one of the
first things Egyptian workers would do when operating on a new construction site was to hide
vital construction-related items in order to ensure that they (the workers) could not be
316
dismissed without inflicting pain on the management.
Trust (UK): An East European colleague remarked that the British were too trusting, and the
opportunities for cheating were quite obvious; the British needed to adjust their tax and
welfare systems to accommodate immigrants, many of whom would have no compunction
about cheating the system.
Uncertainty avoidance - rules and regulations (Germany-1): A German former co-
researcher commented to me that the British seemed to consider any action legal unless a
rule forbad it, whereas the Germans considered any action illegal unless a rule allowed it.
He also commented that both the Germans and British made plans, but the British seemed to
abandon them almost as soon as work started. Note that the British and Germans have very
similar culture dimension scores except for uncertainty avoidance (UAI), where the Germans
score is much higher.
Uncertainty avoidance - rules and regulations (Germany-2): We had been ‘bumped off’
our regular slot on the University football pitches without warning. As we were all kitted up,
eight of us decided to play on a spare grass pitch; however, our German footballing
colleague was very nervous about this and insisted that we play on the grass next to the
pitch, as we did not have permission to play on the pitch.
Uncertainty avoidance? At a research establishment where I had previously worked, we
researchers were asked to attend a meeting to plan new research activities. A number of
research areas were considered, and researchers were asked to come up with general
topics and, within them, specific examples of potential research projects. Following
presentations, formation into groups and further discussions, the various topics were put to
the vote. I was disappointed to see that not a single radical proposal survived; all the
successful proposals seemed to contain nothing more mysterious than ‘known unknowns’,
usually continuations of current research activities. Perhaps I am reading too much into the
low individualism, high uncertainty avoidance cultures of the majority of our researchers at
that time.
Unfriendly British (1): A female Thai PhD student told me that Italian men seemed much
friendlier and open than British men. I made no comment.
Unfriendly British (2): A Scandinavian PhD student remarked that initial friendliness on the
part of the British never ‘carried through’ – they never invited one over to their house, and
seldom arranged out-of-work activities.
317
Unfriendly British (3): An East European PhD student commented similarly to the above, in
that raised expectations on the basis of initial friendliness never came to anything.
Unfriendly British (4): A Middle-Eastern colleague also commented on the fact that he was
never invited over to British colleagues’ homes whereas, when he had lived and worked in
the USA, he had frequently been invited to colleagues’ homes.
Internationally-shared stereotypes - the Euro (or EuroSwiss) joke – Heaven vs. Hell: National differences and stereotypes, widely recognised across Europe, are captured in
various versions of this joke; to avoid potential copyright issues, it will not be quoted here.
Please visit one of the following URLs:
http://ploum.net/post/the-european-joke
http://fistfulofeuros.net/afoe/european-stereotypes-and-jokes/
In the case of the latter URL, scroll down the page to “In Heaven, the police are British …”
The World’s most important inventions – the myth: A widely-quoted survey by MITI
(Japan’s DTI) concluded that, of the world’s most important inventions, 54% were British,
25% were American and 5% were Japanese.
The World’s most important inventions – a little closer to reality: The author carried out
a Web search to locate the original MITI survey, but was unsuccessful; the author did,
however, find an article in the New Scientist (Budworth, 1986) that traced the myth back to
an original 1976 article by the US National Science Foundation (NSF). The NSF article
presented innovation-related estimates for the period 1953 to 1973, split into “radical
breakthrough,”, “major technical shift”, “improvement” and “unclassified”. The UK’s
percentage split between these categories was 55/40/5/0, respectively, the USA 25/28/38/7,
West Germany 13/47/34/4, France 23/64/11/0 and Japan 7/51/37/3. Note that in actual
numbers of radical breakthrough innovations (the UK’s best performing category), the USA
produced almost six times as many innovations as the UK. However, the NSF based the
above figures on new introductions to the market – a stage in the invention/innovation chain
at which the UK appears to be particularly poor.
The interesting aspect of the invention myth is just how many UK publications and other
articles assumed the myth’s validity without checking the origin of the claims. I discovered
over fifty “… according to MITI … “ articles in a few minutes of ‘googling’.
318
A British pilot’s experiences – an unstructured interview
The author carried out an interview with a pilot with more than twenty years flying experience
on flag carriers, budget airlines and private flying services. As a regular trainer, the pilot
described one of his key tasks as attempting to minimise the ‘power slope’ in the cockpit as,
for crews of many nationalities, the captain was a considerable distance above the first
officer. Following further discussions it became clear that ‘power slope’ was the equivalent of
power distance.
The pilot also described the issues he had come across with regard to the issue of following
standard operational procedures (SOPs) yet retaining flexibility of action when needed. He
described the preparations to land at difficult airports in bad weather conditions, and how
some co-pilots would become agitated when he explained that he was going to deviate from
SOPs in order to maintain a safe margin of control. He went on to comment on the Swissair
MD-11 crash of 1998, which he considered likely to be due in part to the pilots’ decisions to
follow SOPs and to go through detailed checklists, rather than to turn immediately and head
for the nearest airport; interestingly Carley (1998) expressed the same view, which appeared
to be supported by Cocklin (2004). The pilot mentioned that the members of the civil aircrew
community frequently discussed accidents and read and commented on them on a range of
on-line blogs; in some cases, he and others had been at a loss to understand the behaviours
of pilots in the stages leading up to accidents. Following this part of the discussion, I
introduced and described the uncertainty avoidance dimension which, he suggested,
explained some of the above differences he had found between various nationalities of pilot.
The pilot commented on the increasing levels multinational employment in the aviation
industry, as a result of which some airlines employed more than seventy nationalities of flying
crews. In at least one such case, the company had implemented, very rigidly, a comprehen-
sive set of watertight SOPs in order to cope with crew national diversity; the pilot expressed
concerns about this SOP-fixation (as he saw it) and the safety issues that would arise when
internal or external conditions deviated excessively from the norm, resulting in a loss of
margins.
The pilot went on to describe issues of face that came to the fore when he had to correct
pilots of some nationalities, in particular when training or testing pilots; he also commented
on the ‘gungho’ attitudes of US pilots, in particular. We discussed this latter point further and
it appeared to relate to masculinity; this ‘gungho’ attitude was not common amongst other
nationalities. As the USA default masculinity score was lower than that of the UK and many
319
other countries, this supported Merritt’s findings that Hofstede’s masculinity scores were not
closely replicated amongst aircrew (A. C. Merritt, 2000).
I asked the pilot about automation preferences amongst his colleagues, and he said that he
had noticed that, whereas most British (plus other Anglos and North Europeans) preferred a
more hands-on approach, most other pilots were keen to utilise the FMC as much as
possible. He also commented, unprompted, about the loss of skill associated with
automation, particularly as the generation of pilots with pre- or low-automation experience
was retiring. Unlike the older generation of pilots, new recruits typically had no other
significant flying experience to fall back on.
To summarise the above, it appeared that national culture played a significant role in civil
aviation crewing, although the default masculinity scores appeared to be an unreliable
indicator of attitudes and behaviour.
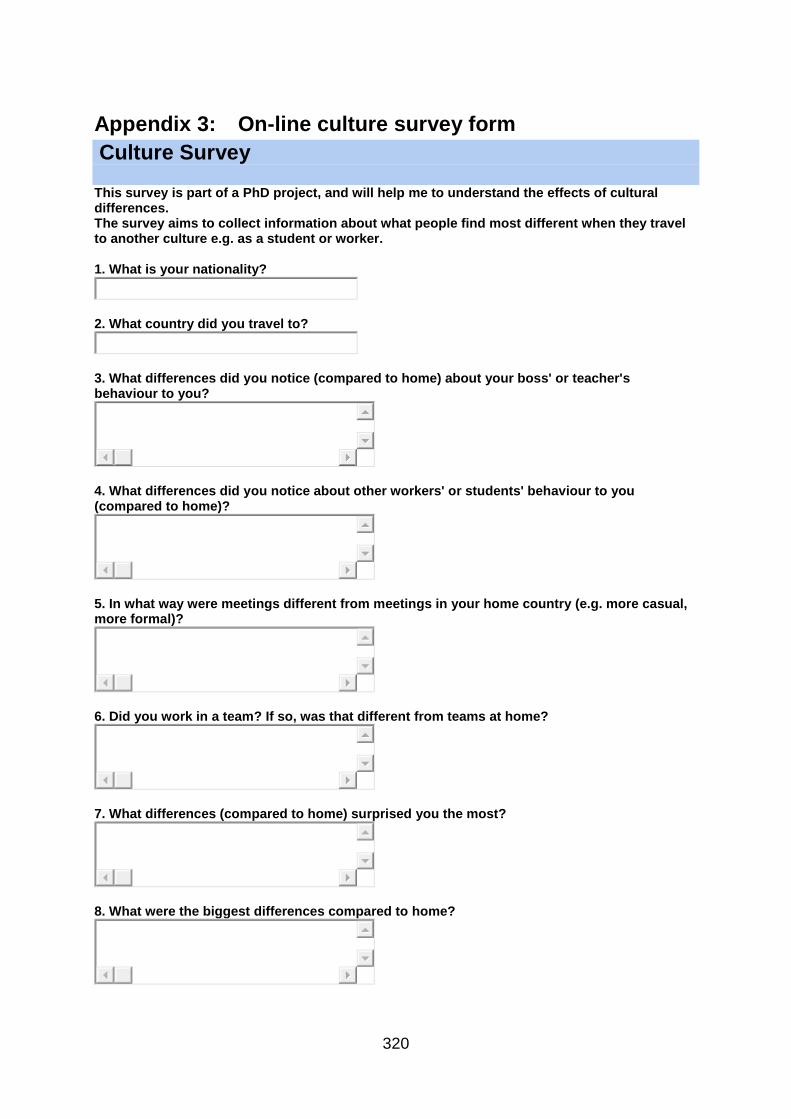
320
Appendix 3: On-line culture survey form Culture Survey This survey is part of a PhD project, and will help me to understand the effects of cultural differences. The survey aims to collect information about what people find most different when they travel to another culture e.g. as a student or worker. 1. What is your nationality?
2. What country did you travel to?
3. What differences did you notice (compared to home) about your boss' or teacher's behaviour to you?
4. What differences did you notice about other workers' or students' behaviour to you (compared to home)?
5. In what way were meetings different from meetings in your home country (e.g. more casual, more formal)?
6. Did you work in a team? If so, was that different from teams at home?
7. What differences (compared to home) surprised you the most?
8. What were the biggest differences compared to home?
321
9. What did you like about the country or the people that you met there? What did you DISLIKE?
10. Please add any other comments about your experiences
Done
Powered by SurveyMonkey
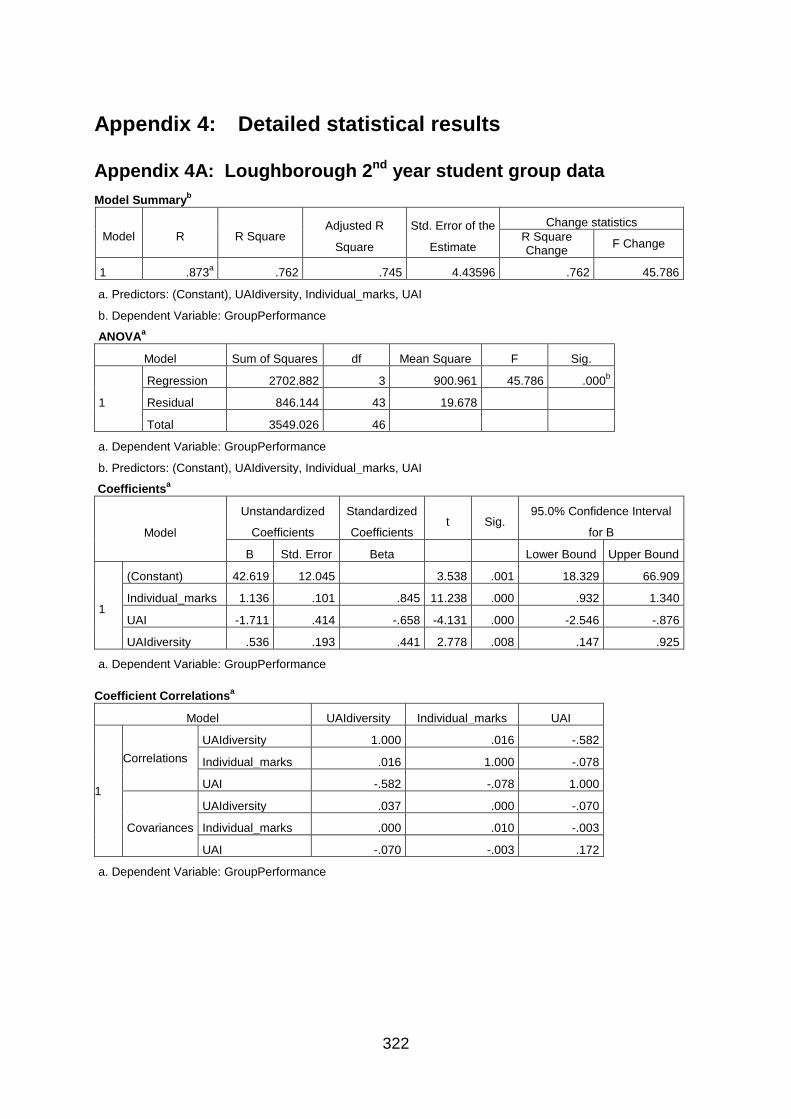
322
Appendix 4: Detailed statistical results
Appendix 4A: Loughborough 2nd year student group data Model Summaryb
Model R R Square Adjusted R
Square
Std. Error of the
Estimate
Change statistics R Square Change F Change
1 .873a .762 .745 4.43596 .762 45.786
a. Predictors: (Constant), UAIdiversity, Individual_marks, UAI
b. Dependent Variable: GroupPerformance
ANOVAa
Model Sum of Squares df Mean Square F Sig.
1
Regression 2702.882 3 900.961 45.786 .000b
Residual 846.144 43 19.678
Total 3549.026 46 a. Dependent Variable: GroupPerformance
b. Predictors: (Constant), UAIdiversity, Individual_marks, UAI
Coefficientsa
Model
Unstandardized
Coefficients
Standardized
Coefficients t Sig.
95.0% Confidence Interval
for B
B Std. Error Beta Lower Bound Upper Bound
1
(Constant) 42.619 12.045 3.538 .001 18.329 66.909
Individual_marks 1.136 .101 .845 11.238 .000 .932 1.340
UAI -1.711 .414 -.658 -4.131 .000 -2.546 -.876
UAIdiversity .536 .193 .441 2.778 .008 .147 .925
a. Dependent Variable: GroupPerformance Coefficient Correlationsa
Model UAIdiversity Individual_marks UAI
1
Correlations UAIdiversity 1.000 .016 -.582
Individual_marks .016 1.000 -.078
UAI -.582 -.078 1.000
Covariances
UAIdiversity .037 .000 -.070
Individual_marks .000 .010 -.003
UAI -.070 -.003 .172
a. Dependent Variable: GroupPerformance
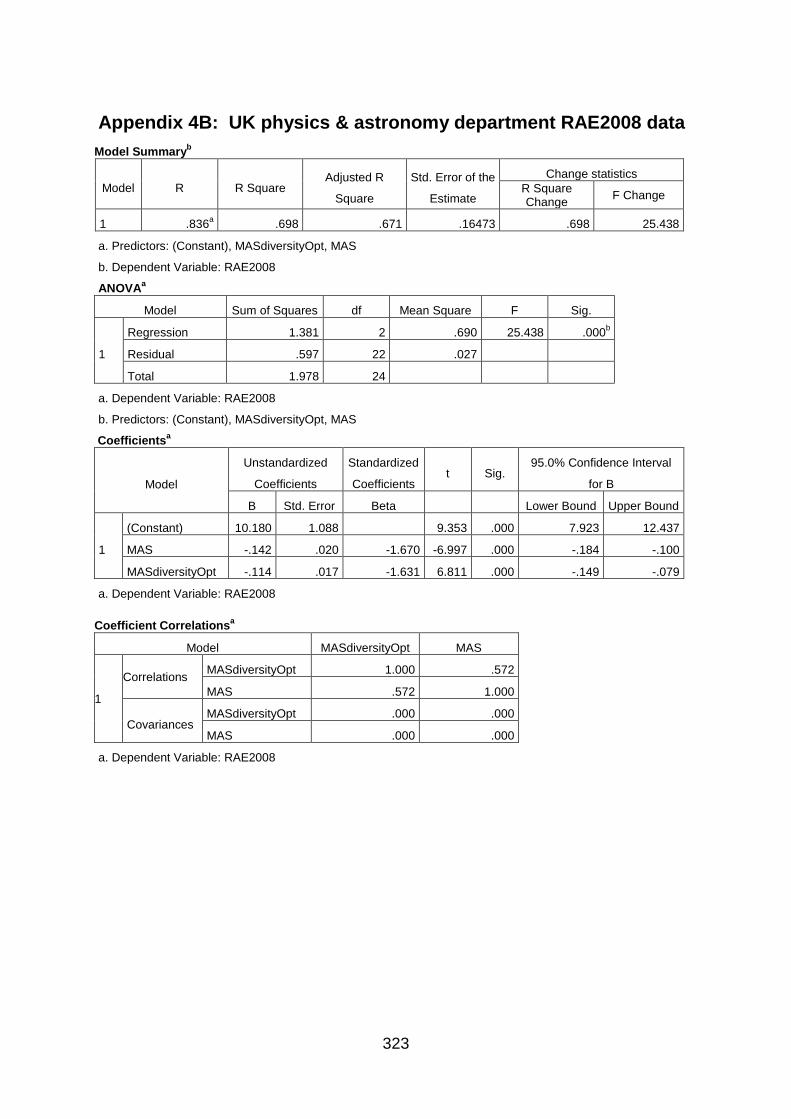
323
Appendix 4B: UK physics & astronomy department RAE2008 data Model Summaryb
Model R R Square Adjusted R
Square
Std. Error of the
Estimate
Change statistics R Square Change F Change
1 .836a .698 .671 .16473 .698 25.438
a. Predictors: (Constant), MASdiversityOpt, MAS
b. Dependent Variable: RAE2008
ANOVAa
Model Sum of Squares df Mean Square F Sig.
1
Regression 1.381 2 .690 25.438 .000b
Residual .597 22 .027
Total 1.978 24 a. Dependent Variable: RAE2008
b. Predictors: (Constant), MASdiversityOpt, MAS
Coefficientsa
Model
Unstandardized
Coefficients
Standardized
Coefficients t Sig.
95.0% Confidence Interval
for B
B Std. Error Beta Lower Bound Upper Bound
1
(Constant) 10.180 1.088 9.353 .000 7.923 12.437
MAS -.142 .020 -1.670 -6.997 .000 -.184 -.100
MASdiversityOpt -.114 .017 -1.631 6.811 .000 -.149 -.079
a. Dependent Variable: RAE2008 Coefficient Correlationsa
Model MASdiversityOpt MAS
1
Correlations MASdiversityOpt 1.000 .572
MAS .572 1.000
Covariances MASdiversityOpt .000 .000
MAS .000 .000
a. Dependent Variable: RAE2008
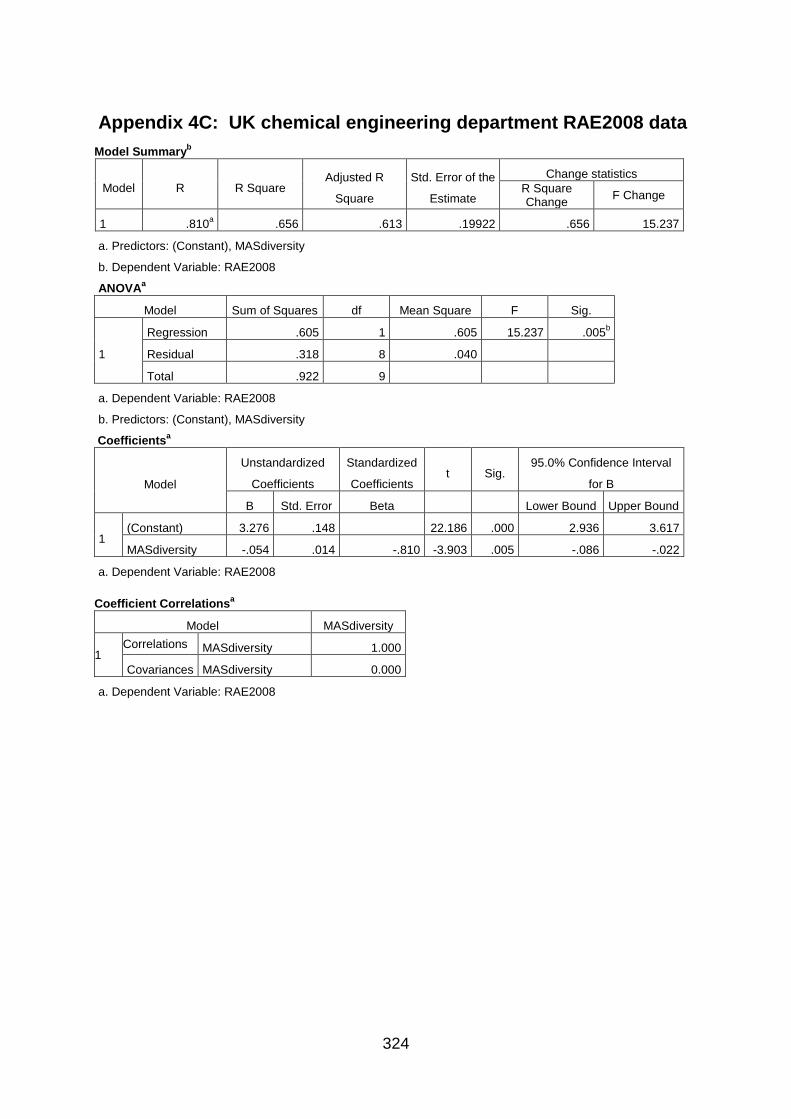
324
Appendix 4C: UK chemical engineering department RAE2008 data Model Summaryb
Model R R Square Adjusted R
Square
Std. Error of the
Estimate
Change statistics R Square Change F Change
1 .810a .656 .613 .19922 .656 15.237
a. Predictors: (Constant), MASdiversity
b. Dependent Variable: RAE2008
ANOVAa
Model Sum of Squares df Mean Square F Sig.
1
Regression .605 1 .605 15.237 .005b
Residual .318 8 .040
Total .922 9 a. Dependent Variable: RAE2008
b. Predictors: (Constant), MASdiversity
Coefficientsa
Model
Unstandardized
Coefficients
Standardized
Coefficients t Sig.
95.0% Confidence Interval
for B
B Std. Error Beta Lower Bound Upper Bound
1 (Constant) 3.276 .148 22.186 .000 2.936 3.617
MASdiversity -.054 .014 -.810 -3.903 .005 -.086 -.022
a. Dependent Variable: RAE2008 Coefficient Correlationsa
Model MASdiversity
1 Correlations MASdiversity 1.000
Covariances MASdiversity 0.000
a. Dependent Variable: RAE2008
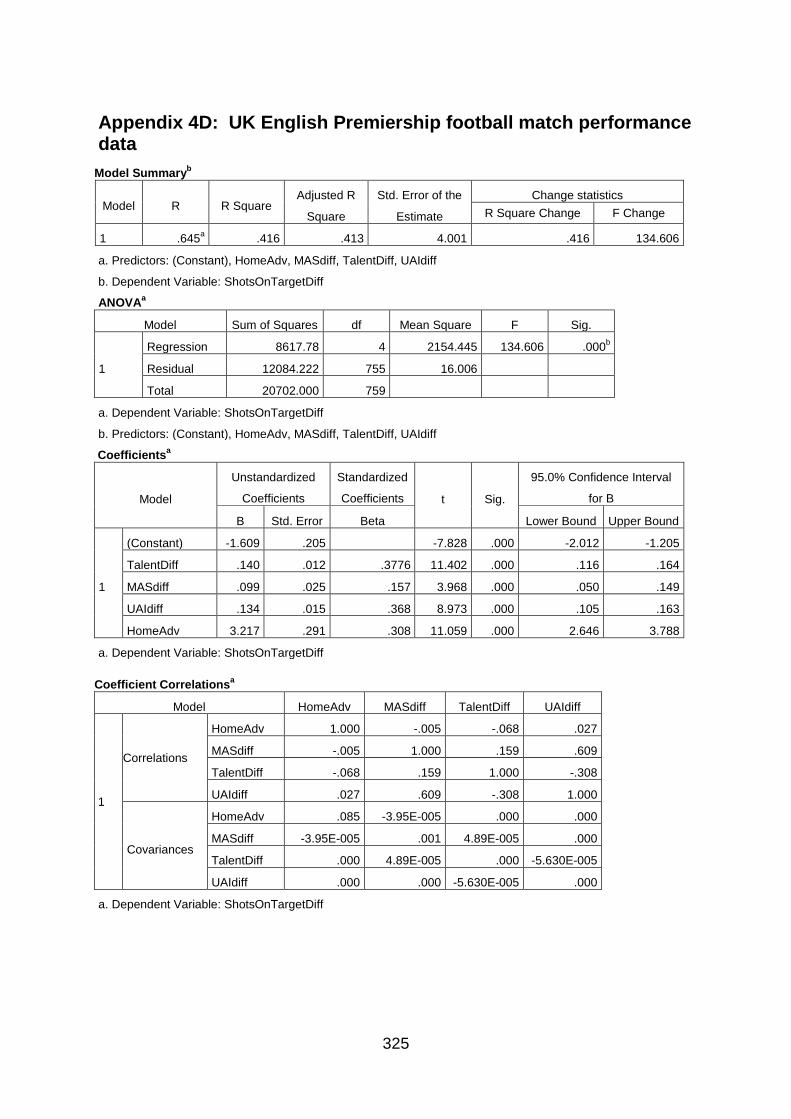
325
Appendix 4D: UK English Premiership football match performance data
Model Summaryb
Model R R Square Adjusted R
Square
Std. Error of the
Estimate
Change statistics R Square Change F Change
1 .645a .416 .413 4.001 .416 134.606
a. Predictors: (Constant), HomeAdv, MASdiff, TalentDiff, UAIdiff
b. Dependent Variable: ShotsOnTargetDiff
ANOVAa
Model Sum of Squares df Mean Square F Sig.
1
Regression 8617.78 4 2154.445 134.606 .000b
Residual 12084.222 755 16.006 Total 20702.000 759
a. Dependent Variable: ShotsOnTargetDiff
b. Predictors: (Constant), HomeAdv, MASdiff, TalentDiff, UAIdiff
Coefficientsa
Model
Unstandardized
Coefficients
Standardized
Coefficients t Sig.
95.0% Confidence Interval
for B
B Std. Error Beta Lower Bound Upper Bound
1
(Constant) -1.609 .205 -7.828 .000 -2.012 -1.205
TalentDiff .140 .012 .3776 11.402 .000 .116 .164
MASdiff .099 .025 .157 3.968 .000 .050 .149
UAIdiff .134 .015 .368 8.973 .000 .105 .163
HomeAdv 3.217 .291 .308 11.059 .000 2.646 3.788
a. Dependent Variable: ShotsOnTargetDiff Coefficient Correlationsa
Model HomeAdv MASdiff TalentDiff UAIdiff
1
Correlations
HomeAdv 1.000 -.005 -.068 .027
MASdiff -.005 1.000 .159 .609
TalentDiff -.068 .159 1.000 -.308
UAIdiff .027 .609 -.308 1.000
Covariances
HomeAdv .085 -3.95E-005 .000 .000
MASdiff -3.95E-005 .001 4.89E-005 .000
TalentDiff .000 4.89E-005 .000 -5.630E-005
UAIdiff .000 .000 -5.630E-005 .000
a. Dependent Variable: ShotsOnTargetDiff
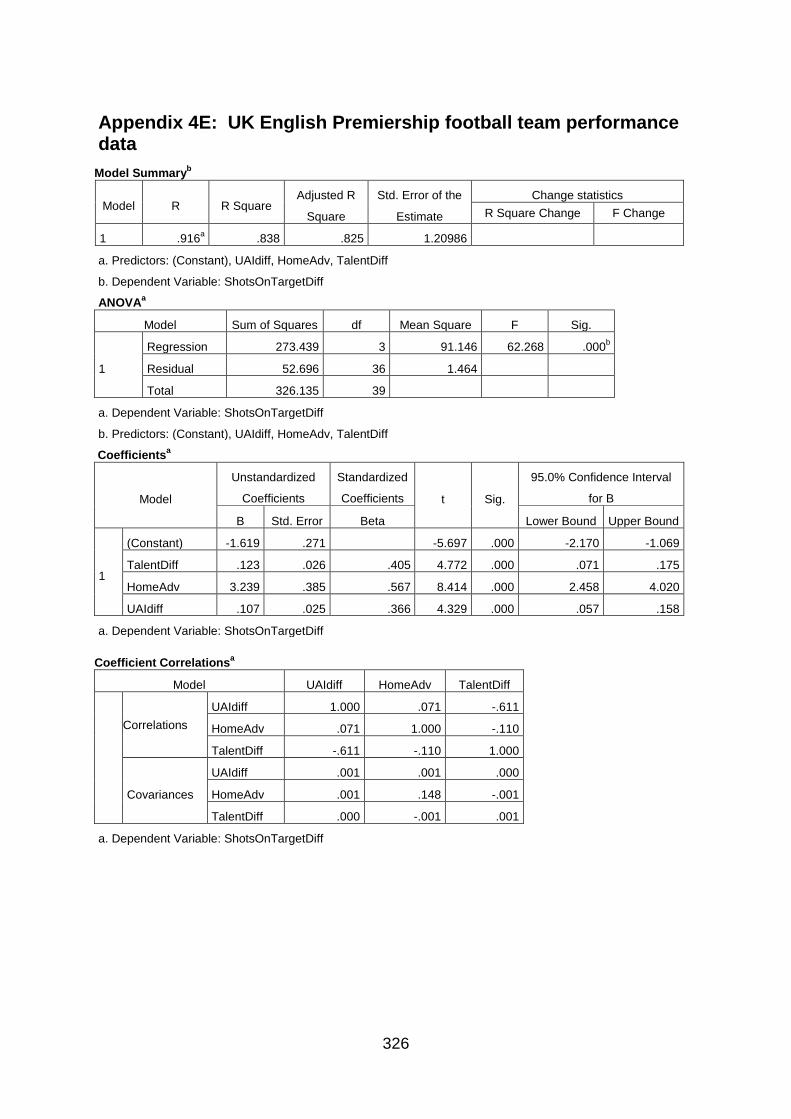
326
Appendix 4E: UK English Premiership football team performance data
Model Summaryb
Model R R Square Adjusted R
Square
Std. Error of the
Estimate
Change statistics R Square Change F Change
1 .916a .838 .825 1.20986
a. Predictors: (Constant), UAIdiff, HomeAdv, TalentDiff
b. Dependent Variable: ShotsOnTargetDiff
ANOVAa
Model Sum of Squares df Mean Square F Sig.
1
Regression 273.439 3 91.146 62.268 .000b
Residual 52.696 36 1.464 Total 326.135 39
a. Dependent Variable: ShotsOnTargetDiff
b. Predictors: (Constant), UAIdiff, HomeAdv, TalentDiff
Coefficientsa
Model
Unstandardized
Coefficients
Standardized
Coefficients t Sig.
95.0% Confidence Interval
for B
B Std. Error Beta Lower Bound Upper Bound
1
(Constant) -1.619 .271 -5.697 .000 -2.170 -1.069
TalentDiff .123 .026 .405 4.772 .000 .071 .175
HomeAdv 3.239 .385 .567 8.414 .000 2.458 4.020
UAIdiff .107 .025 .366 4.329 .000 .057 .158
a. Dependent Variable: ShotsOnTargetDiff Coefficient Correlationsa
Model UAIdiff HomeAdv TalentDiff
Correlations UAIdiff 1.000 .071 -.611
HomeAdv .071 1.000 -.110
TalentDiff -.611 -.110 1.000
Covariances
UAIdiff .001 .001 .000
HomeAdv .001 .148 -.001
TalentDiff .000 -.001 .001
a. Dependent Variable: ShotsOnTargetDiff
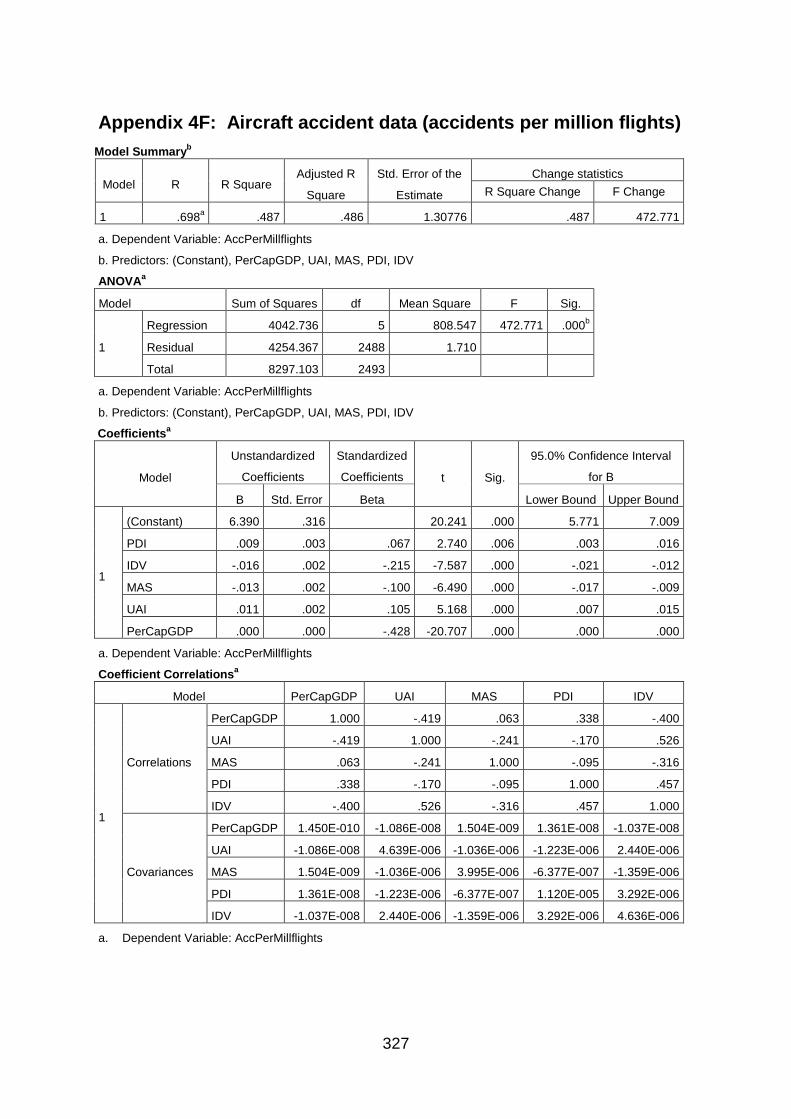
327
Appendix 4F: Aircraft accident data (accidents per million flights) Model Summaryb
Model R R Square Adjusted R
Square
Std. Error of the
Estimate
Change statistics R Square Change F Change
1 .698a .487 .486 1.30776 .487 472.771
a. Dependent Variable: AccPerMillflights
b. Predictors: (Constant), PerCapGDP, UAI, MAS, PDI, IDV
ANOVAa
Model Sum of Squares df Mean Square F Sig.
1
Regression 4042.736 5 808.547 472.771 .000b
Residual 4254.367 2488 1.710 Total 8297.103 2493
a. Dependent Variable: AccPerMillflights
b. Predictors: (Constant), PerCapGDP, UAI, MAS, PDI, IDV
Coefficientsa
Model
Unstandardized
Coefficients
Standardized
Coefficients t Sig.
95.0% Confidence Interval
for B
B Std. Error Beta Lower Bound Upper Bound
1
(Constant) 6.390 .316 20.241 .000 5.771 7.009
PDI .009 .003 .067 2.740 .006 .003 .016
IDV -.016 .002 -.215 -7.587 .000 -.021 -.012
MAS -.013 .002 -.100 -6.490 .000 -.017 -.009
UAI .011 .002 .105 5.168 .000 .007 .015
PerCapGDP .000 .000 -.428 -20.707 .000 .000 .000
a. Dependent Variable: AccPerMillflights
Coefficient Correlationsa
Model PerCapGDP UAI MAS PDI IDV
1
Correlations
PerCapGDP 1.000 -.419 .063 .338 -.400
UAI -.419 1.000 -.241 -.170 .526
MAS .063 -.241 1.000 -.095 -.316
PDI .338 -.170 -.095 1.000 .457
IDV -.400 .526 -.316 .457 1.000
Covariances
PerCapGDP 1.450E-010 -1.086E-008 1.504E-009 1.361E-008 -1.037E-008
UAI -1.086E-008 4.639E-006 -1.036E-006 -1.223E-006 2.440E-006
MAS 1.504E-009 -1.036E-006 3.995E-006 -6.377E-007 -1.359E-006
PDI 1.361E-008 -1.223E-006 -6.377E-007 1.120E-005 3.292E-006
IDV -1.037E-008 2.440E-006 -1.359E-006 3.292E-006 4.636E-006
a. Dependent Variable: AccPerMillflights
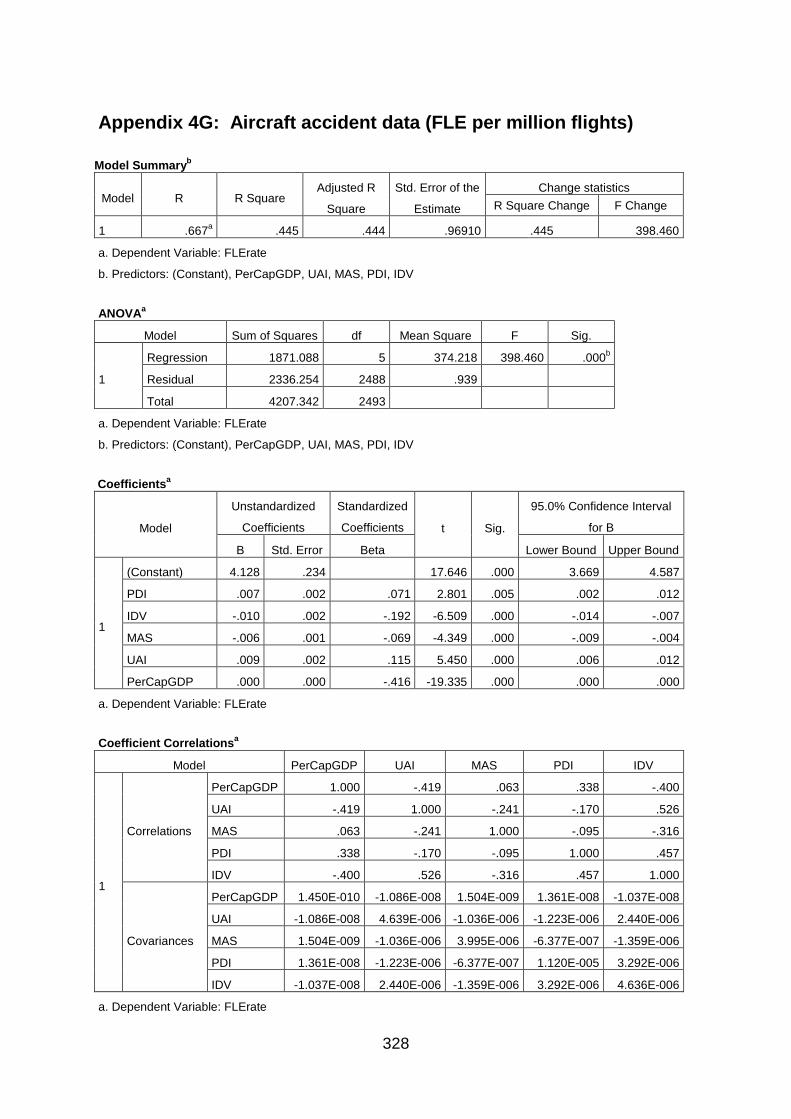
328
Appendix 4G: Aircraft accident data (FLE per million flights) Model Summaryb
Model R R Square Adjusted R
Square
Std. Error of the
Estimate
Change statistics R Square Change F Change
1 .667a .445 .444 .96910 .445 398.460
a. Dependent Variable: FLErate
b. Predictors: (Constant), PerCapGDP, UAI, MAS, PDI, IDV ANOVAa
Model Sum of Squares df Mean Square F Sig.
1
Regression 1871.088 5 374.218 398.460 .000b
Residual 2336.254 2488 .939
Total 4207.342 2493 a. Dependent Variable: FLErate
b. Predictors: (Constant), PerCapGDP, UAI, MAS, PDI, IDV Coefficientsa
Model
Unstandardized
Coefficients
Standardized
Coefficients t Sig.
95.0% Confidence Interval
for B
B Std. Error Beta Lower Bound Upper Bound
1
(Constant) 4.128 .234 17.646 .000 3.669 4.587
PDI .007 .002 .071 2.801 .005 .002 .012
IDV -.010 .002 -.192 -6.509 .000 -.014 -.007
MAS -.006 .001 -.069 -4.349 .000 -.009 -.004
UAI .009 .002 .115 5.450 .000 .006 .012
PerCapGDP .000 .000 -.416 -19.335 .000 .000 .000
a. Dependent Variable: FLErate Coefficient Correlationsa
Model PerCapGDP UAI MAS PDI IDV
1
Correlations
PerCapGDP 1.000 -.419 .063 .338 -.400
UAI -.419 1.000 -.241 -.170 .526
MAS .063 -.241 1.000 -.095 -.316
PDI .338 -.170 -.095 1.000 .457
IDV -.400 .526 -.316 .457 1.000
Covariances
PerCapGDP 1.450E-010 -1.086E-008 1.504E-009 1.361E-008 -1.037E-008
UAI -1.086E-008 4.639E-006 -1.036E-006 -1.223E-006 2.440E-006
MAS 1.504E-009 -1.036E-006 3.995E-006 -6.377E-007 -1.359E-006
PDI 1.361E-008 -1.223E-006 -6.377E-007 1.120E-005 3.292E-006
IDV -1.037E-008 2.440E-006 -1.359E-006 3.292E-006 4.636E-006
a. Dependent Variable: FLErate
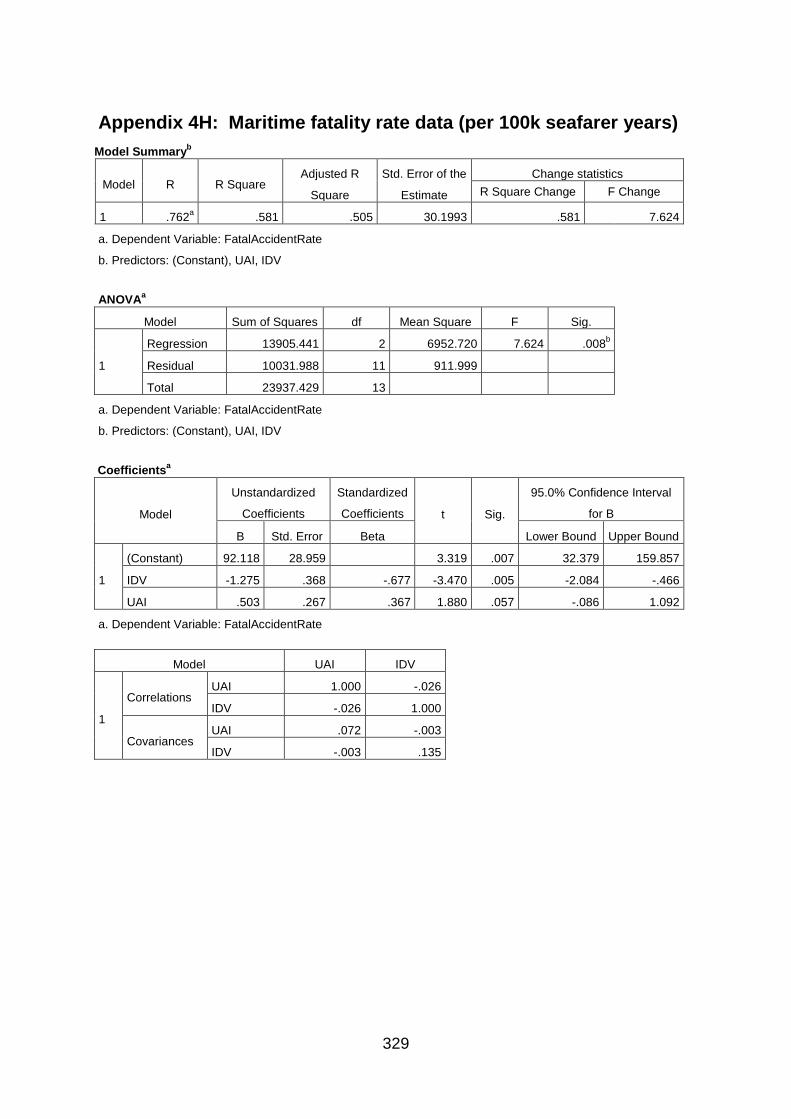
329
Appendix 4H: Maritime fatality rate data (per 100k seafarer years) Model Summaryb
Model R R Square Adjusted R
Square
Std. Error of the
Estimate
Change statistics R Square Change F Change
1 .762a .581 .505 30.1993 .581 7.624
a. Dependent Variable: FatalAccidentRate
b. Predictors: (Constant), UAI, IDV ANOVAa
Model Sum of Squares df Mean Square F Sig.
1
Regression 13905.441 2 6952.720 7.624 .008b
Residual 10031.988 11 911.999 Total 23937.429 13
a. Dependent Variable: FatalAccidentRate
b. Predictors: (Constant), UAI, IDV Coefficientsa
Model
Unstandardized
Coefficients
Standardized
Coefficients t Sig.
95.0% Confidence Interval
for B
B Std. Error Beta Lower Bound Upper Bound
1
(Constant) 92.118 28.959 3.319 .007 32.379 159.857
IDV -1.275 .368 -.677 -3.470 .005 -2.084 -.466
UAI .503 .267 .367 1.880 .057 -.086 1.092
a. Dependent Variable: FatalAccidentRate
Model UAI IDV
1
Correlations UAI 1.000 -.026
IDV -.026 1.000
Covariances UAI .072 -.003
IDV -.003 .135
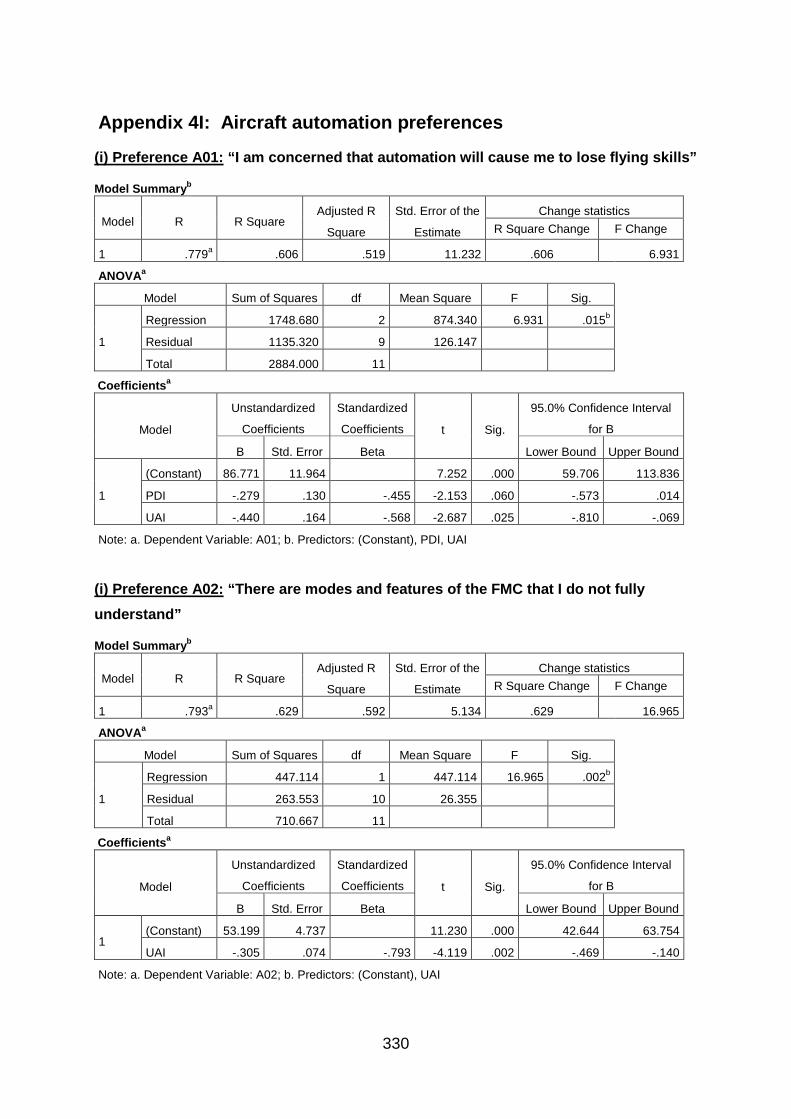
330
Appendix 4I: Aircraft automation preferences
(i) Preference A01: “I am concerned that automation will cause me to lose flying skills”
Model Summaryb
Model R R Square Adjusted R
Square
Std. Error of the
Estimate
Change statistics R Square Change F Change
1 .779a .606 .519 11.232 .606 6.931
ANOVAa
Model Sum of Squares df Mean Square F Sig.
1
Regression 1748.680 2 874.340 6.931 .015b
Residual 1135.320 9 126.147
Total 2884.000 11 Coefficientsa
Model
Unstandardized
Coefficients
Standardized
Coefficients t Sig.
95.0% Confidence Interval
for B
B Std. Error Beta Lower Bound Upper Bound
1
(Constant) 86.771 11.964 7.252 .000 59.706 113.836
PDI -.279 .130 -.455 -2.153 .060 -.573 .014
UAI -.440 .164 -.568 -2.687 .025 -.810 -.069
Note: a. Dependent Variable: A01; b. Predictors: (Constant), PDI, UAI
(i) Preference A02: “There are modes and features of the FMC that I do not fully understand”
Model Summaryb
Model R R Square Adjusted R
Square
Std. Error of the
Estimate
Change statistics R Square Change F Change
1 .793a .629 .592 5.134 .629 16.965
ANOVAa
Model Sum of Squares df Mean Square F Sig.
1
Regression 447.114 1 447.114 16.965 .002b
Residual 263.553 10 26.355 Total 710.667 11
Coefficientsa
Model
Unstandardized
Coefficients
Standardized
Coefficients t Sig.
95.0% Confidence Interval
for B
B Std. Error Beta Lower Bound Upper Bound
1 (Constant) 53.199 4.737 11.230 .000 42.644 63.754
UAI -.305 .074 -.793 -4.119 .002 -.469 -.140
Note: a. Dependent Variable: A02; b. Predictors: (Constant), UAI
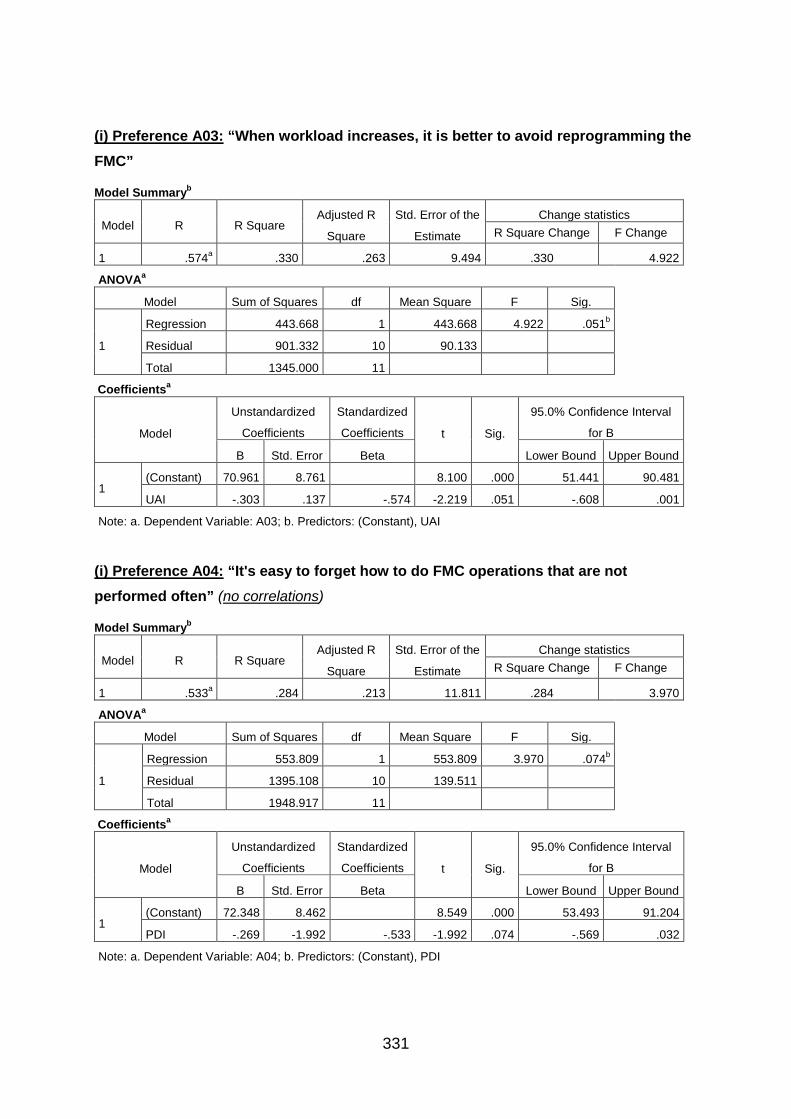
331
(i) Preference A03: “When workload increases, it is better to avoid reprogramming the FMC”
Model Summaryb
Model R R Square Adjusted R
Square
Std. Error of the
Estimate
Change statistics R Square Change F Change
1 .574a .330 .263 9.494 .330 4.922
ANOVAa
Model Sum of Squares df Mean Square F Sig.
1
Regression 443.668 1 443.668 4.922 .051b
Residual 901.332 10 90.133
Total 1345.000 11 Coefficientsa
Model
Unstandardized
Coefficients
Standardized
Coefficients t Sig.
95.0% Confidence Interval
for B
B Std. Error Beta Lower Bound Upper Bound
1 (Constant) 70.961 8.761 8.100 .000 51.441 90.481
UAI -.303 .137 -.574 -2.219 .051 -.608 .001
Note: a. Dependent Variable: A03; b. Predictors: (Constant), UAI
(i) Preference A04: “It's easy to forget how to do FMC operations that are not performed often” (no correlations)
Model Summaryb
Model R R Square Adjusted R
Square
Std. Error of the
Estimate
Change statistics R Square Change F Change
1 .533a .284 .213 11.811 .284 3.970
ANOVAa
Model Sum of Squares df Mean Square F Sig.
1
Regression 553.809 1 553.809 3.970 .074b
Residual 1395.108 10 139.511
Total 1948.917 11 Coefficientsa
Model
Unstandardized
Coefficients
Standardized
Coefficients t Sig.
95.0% Confidence Interval
for B
B Std. Error Beta Lower Bound Upper Bound
1 (Constant) 72.348 8.462 8.549 .000 53.493 91.204
PDI -.269 -1.992 -.533 -1.992 .074 -.569 .032
Note: a. Dependent Variable: A04; b. Predictors: (Constant), PDI
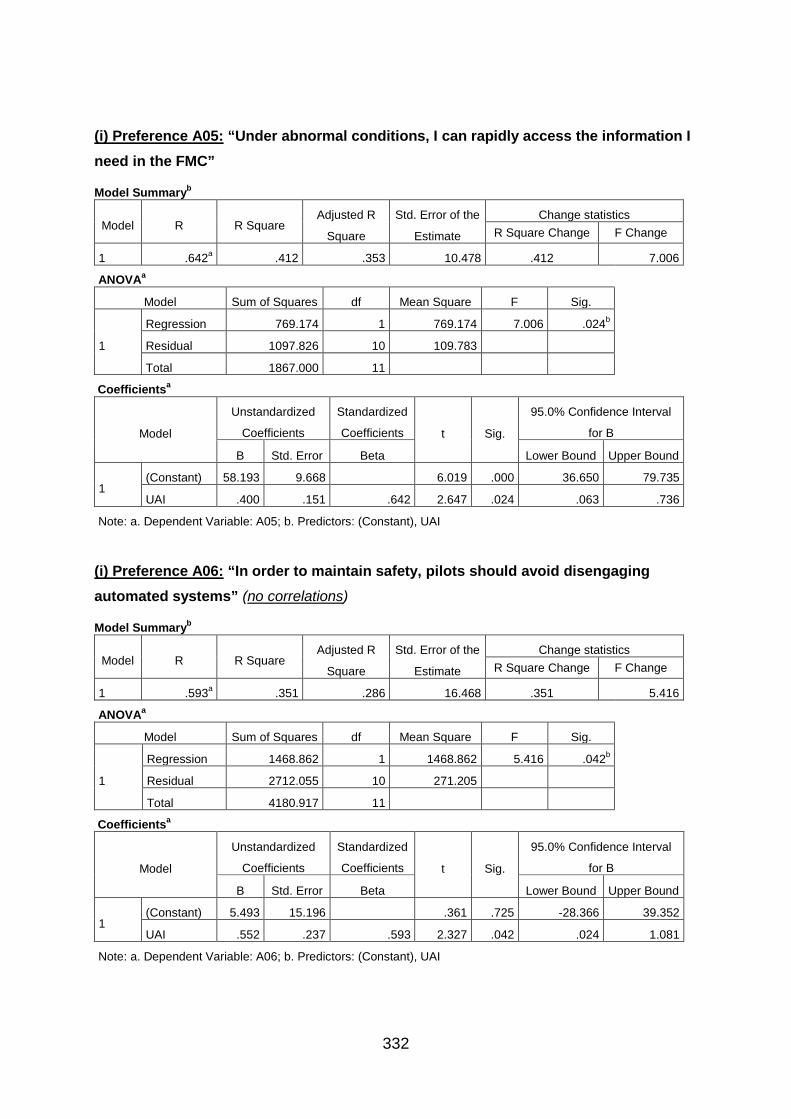
332
(i) Preference A05: “Under abnormal conditions, I can rapidly access the information I need in the FMC”
Model Summaryb
Model R R Square Adjusted R
Square
Std. Error of the
Estimate
Change statistics R Square Change F Change
1 .642a .412 .353 10.478 .412 7.006
ANOVAa
Model Sum of Squares df Mean Square F Sig.
1
Regression 769.174 1 769.174 7.006 .024b
Residual 1097.826 10 109.783
Total 1867.000 11 Coefficientsa
Model
Unstandardized
Coefficients
Standardized
Coefficients t Sig.
95.0% Confidence Interval
for B
B Std. Error Beta Lower Bound Upper Bound
1 (Constant) 58.193 9.668 6.019 .000 36.650 79.735
UAI .400 .151 .642 2.647 .024 .063 .736
Note: a. Dependent Variable: A05; b. Predictors: (Constant), UAI
(i) Preference A06: “In order to maintain safety, pilots should avoid disengaging automated systems” (no correlations)
Model Summaryb
Model R R Square Adjusted R
Square
Std. Error of the
Estimate
Change statistics R Square Change F Change
1 .593a .351 .286 16.468 .351 5.416
ANOVAa
Model Sum of Squares df Mean Square F Sig.
1
Regression 1468.862 1 1468.862 5.416 .042b
Residual 2712.055 10 271.205
Total 4180.917 11 Coefficientsa
Model
Unstandardized
Coefficients
Standardized
Coefficients t Sig.
95.0% Confidence Interval
for B
B Std. Error Beta Lower Bound Upper Bound
1 (Constant) 5.493 15.196 .361 .725 -28.366 39.352
UAI .552 .237 .593 2.327 .042 .024 1.081
Note: a. Dependent Variable: A06; b. Predictors: (Constant), UAI
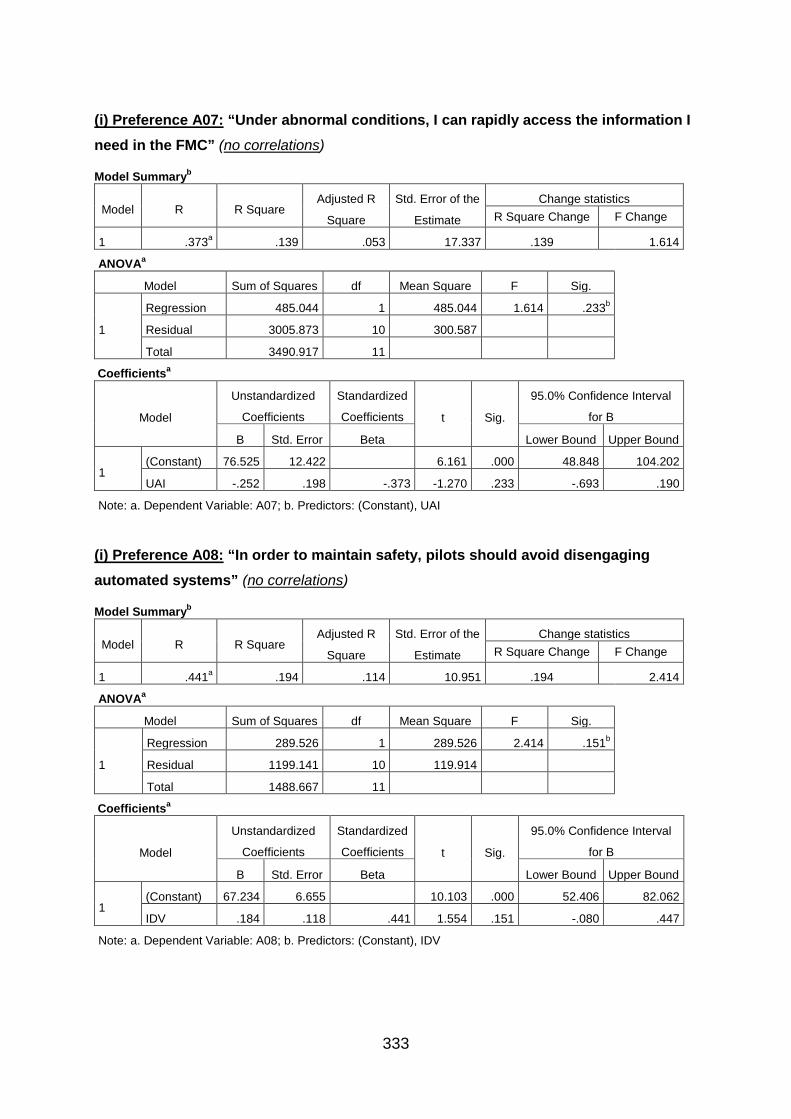
333
(i) Preference A07: “Under abnormal conditions, I can rapidly access the information I need in the FMC” (no correlations)
Model Summaryb
Model R R Square Adjusted R
Square
Std. Error of the
Estimate
Change statistics R Square Change F Change
1 .373a .139 .053 17.337 .139 1.614
ANOVAa
Model Sum of Squares df Mean Square F Sig.
1
Regression 485.044 1 485.044 1.614 .233b
Residual 3005.873 10 300.587
Total 3490.917 11 Coefficientsa
Model
Unstandardized
Coefficients
Standardized
Coefficients t Sig.
95.0% Confidence Interval
for B
B Std. Error Beta Lower Bound Upper Bound
1 (Constant) 76.525 12.422 6.161 .000 48.848 104.202
UAI -.252 .198 -.373 -1.270 .233 -.693 .190
Note: a. Dependent Variable: A07; b. Predictors: (Constant), UAI
(i) Preference A08: “In order to maintain safety, pilots should avoid disengaging automated systems” (no correlations)
Model Summaryb
Model R R Square Adjusted R
Square
Std. Error of the
Estimate
Change statistics R Square Change F Change
1 .441a .194 .114 10.951 .194 2.414
ANOVAa
Model Sum of Squares df Mean Square F Sig.
1
Regression 289.526 1 289.526 2.414 .151b
Residual 1199.141 10 119.914
Total 1488.667 11 Coefficientsa
Model
Unstandardized
Coefficients
Standardized
Coefficients t Sig.
95.0% Confidence Interval
for B
B Std. Error Beta Lower Bound Upper Bound
1 (Constant) 67.234 6.655 10.103 .000 52.406 82.062
IDV .184 .118 .441 1.554 .151 -.080 .447
Note: a. Dependent Variable: A08; b. Predictors: (Constant), IDV
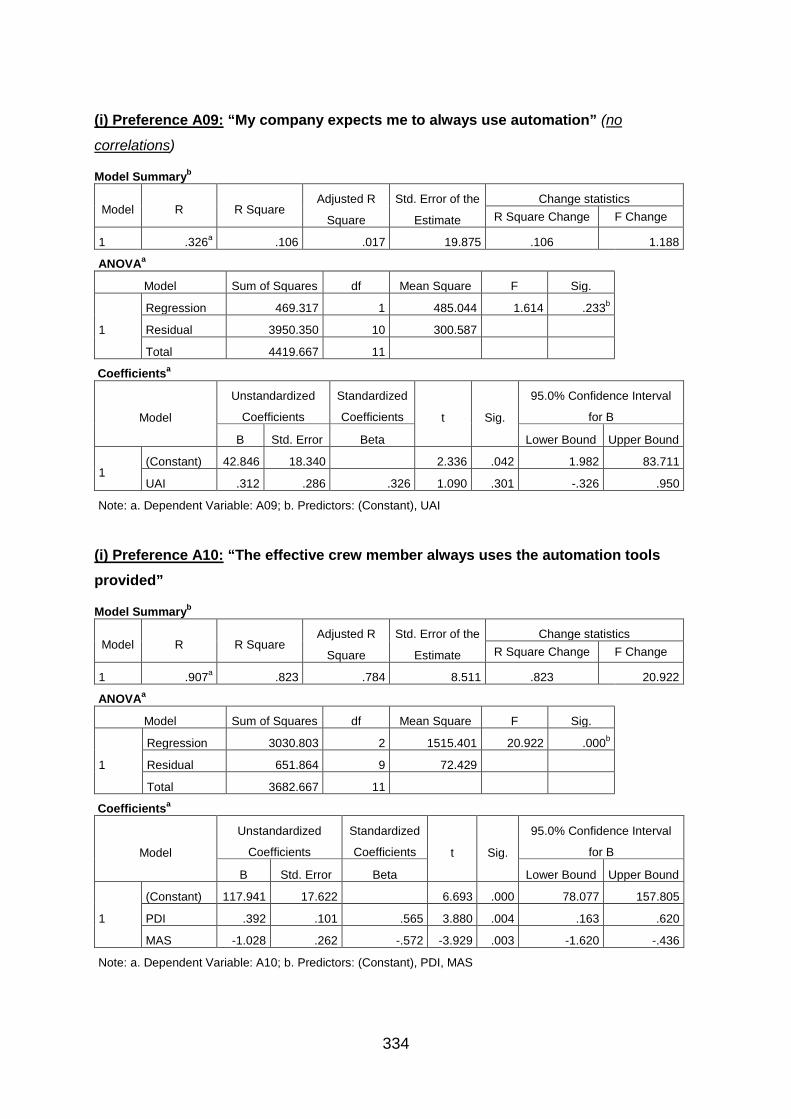
334
(i) Preference A09: “My company expects me to always use automation” (no
correlations)
Model Summaryb
Model R R Square Adjusted R
Square
Std. Error of the
Estimate
Change statistics R Square Change F Change
1 .326a .106 .017 19.875 .106 1.188
ANOVAa
Model Sum of Squares df Mean Square F Sig.
1
Regression 469.317 1 485.044 1.614 .233b
Residual 3950.350 10 300.587
Total 4419.667 11 Coefficientsa
Model
Unstandardized
Coefficients
Standardized
Coefficients t Sig.
95.0% Confidence Interval
for B
B Std. Error Beta Lower Bound Upper Bound
1 (Constant) 42.846 18.340 2.336 .042 1.982 83.711
UAI .312 .286 .326 1.090 .301 -.326 .950
Note: a. Dependent Variable: A09; b. Predictors: (Constant), UAI
(i) Preference A10: “The effective crew member always uses the automation tools provided”
Model Summaryb
Model R R Square Adjusted R
Square
Std. Error of the
Estimate
Change statistics R Square Change F Change
1 .907a .823 .784 8.511 .823 20.922
ANOVAa
Model Sum of Squares df Mean Square F Sig.
1
Regression 3030.803 2 1515.401 20.922 .000b
Residual 651.864 9 72.429
Total 3682.667 11 Coefficientsa
Model
Unstandardized
Coefficients
Standardized
Coefficients t Sig.
95.0% Confidence Interval
for B
B Std. Error Beta Lower Bound Upper Bound
1
(Constant) 117.941 17.622 6.693 .000 78.077 157.805
PDI .392 .101 .565 3.880 .004 .163 .620
MAS -1.028 .262 -.572 -3.929 .003 -1.620 -.436
Note: a. Dependent Variable: A10; b. Predictors: (Constant), PDI, MAS
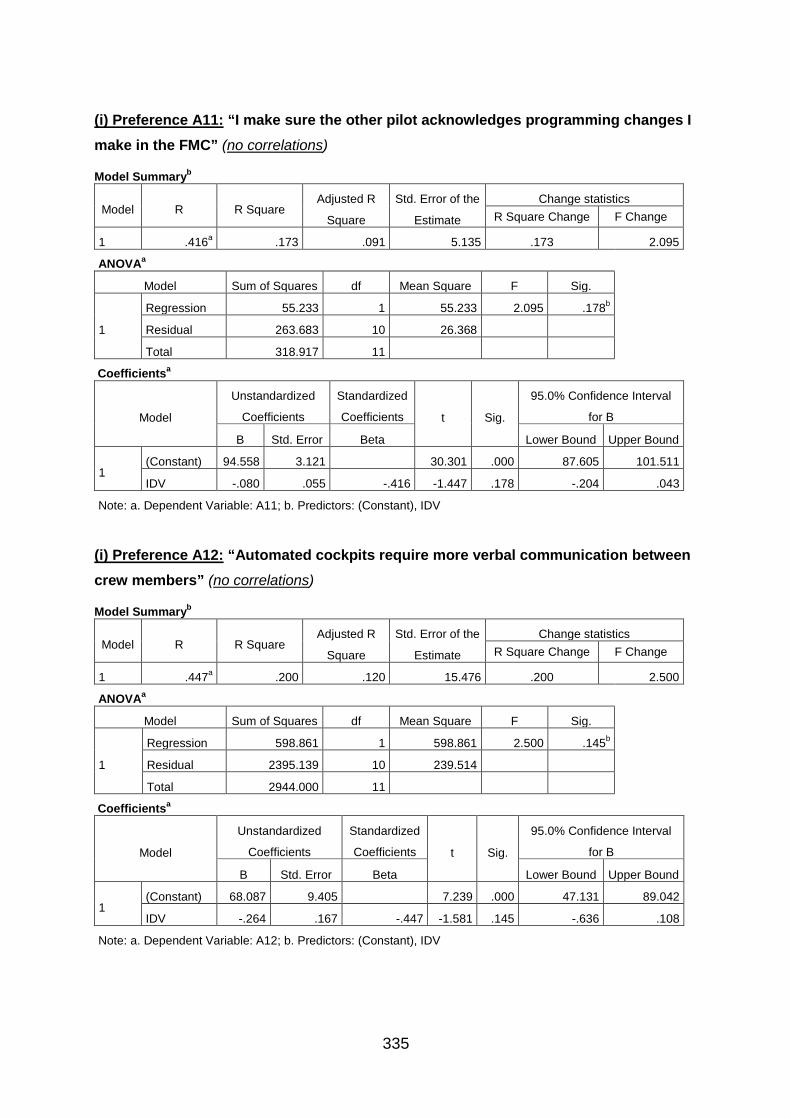
335
(i) Preference A11: “I make sure the other pilot acknowledges programming changes I make in the FMC” (no correlations)
Model Summaryb
Model R R Square Adjusted R
Square
Std. Error of the
Estimate
Change statistics R Square Change F Change
1 .416a .173 .091 5.135 .173 2.095
ANOVAa
Model Sum of Squares df Mean Square F Sig.
1
Regression 55.233 1 55.233 2.095 .178b
Residual 263.683 10 26.368
Total 318.917 11 Coefficientsa
Model
Unstandardized
Coefficients
Standardized
Coefficients t Sig.
95.0% Confidence Interval
for B
B Std. Error Beta Lower Bound Upper Bound
1 (Constant) 94.558 3.121 30.301 .000 87.605 101.511
IDV -.080 .055 -.416 -1.447 .178 -.204 .043
Note: a. Dependent Variable: A11; b. Predictors: (Constant), IDV
(i) Preference A12: “Automated cockpits require more verbal communication between crew members” (no correlations)
Model Summaryb
Model R R Square Adjusted R
Square
Std. Error of the
Estimate
Change statistics R Square Change F Change
1 .447a .200 .120 15.476 .200 2.500
ANOVAa
Model Sum of Squares df Mean Square F Sig.
1
Regression 598.861 1 598.861 2.500 .145b
Residual 2395.139 10 239.514
Total 2944.000 11 Coefficientsa
Model
Unstandardized
Coefficients
Standardized
Coefficients t Sig.
95.0% Confidence Interval
for B
B Std. Error Beta Lower Bound Upper Bound
1 (Constant) 68.087 9.405 7.239 .000 47.131 89.042
IDV -.264 .167 -.447 -1.581 .145 -.636 .108
Note: a. Dependent Variable: A12; b. Predictors: (Constant), IDV
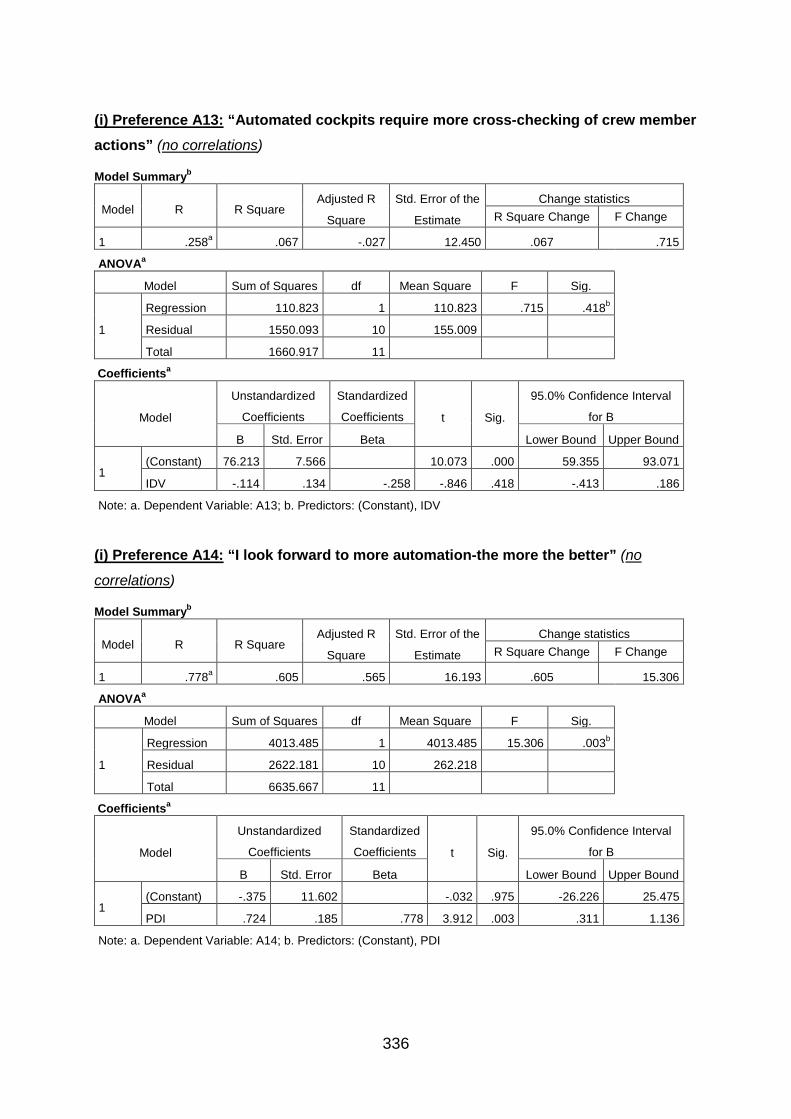
336
(i) Preference A13: “Automated cockpits require more cross-checking of crew member actions” (no correlations)
Model Summaryb
Model R R Square Adjusted R
Square
Std. Error of the
Estimate
Change statistics R Square Change F Change
1 .258a .067 -.027 12.450 .067 .715
ANOVAa
Model Sum of Squares df Mean Square F Sig.
1
Regression 110.823 1 110.823 .715 .418b
Residual 1550.093 10 155.009
Total 1660.917 11 Coefficientsa
Model
Unstandardized
Coefficients
Standardized
Coefficients t Sig.
95.0% Confidence Interval
for B
B Std. Error Beta Lower Bound Upper Bound
1 (Constant) 76.213 7.566 10.073 .000 59.355 93.071
IDV -.114 .134 -.258 -.846 .418 -.413 .186
Note: a. Dependent Variable: A13; b. Predictors: (Constant), IDV
(i) Preference A14: “I look forward to more automation-the more the better” (no
correlations)
Model Summaryb
Model R R Square Adjusted R
Square
Std. Error of the
Estimate
Change statistics R Square Change F Change
1 .778a .605 .565 16.193 .605 15.306
ANOVAa
Model Sum of Squares df Mean Square F Sig.
1
Regression 4013.485 1 4013.485 15.306 .003b
Residual 2622.181 10 262.218
Total 6635.667 11 Coefficientsa
Model
Unstandardized
Coefficients
Standardized
Coefficients t Sig.
95.0% Confidence Interval
for B
B Std. Error Beta Lower Bound Upper Bound
1 (Constant) -.375 11.602 -.032 .975 -26.226 25.475
PDI .724 .185 .778 3.912 .003 .311 1.136
Note: a. Dependent Variable: A14; b. Predictors: (Constant), PDI
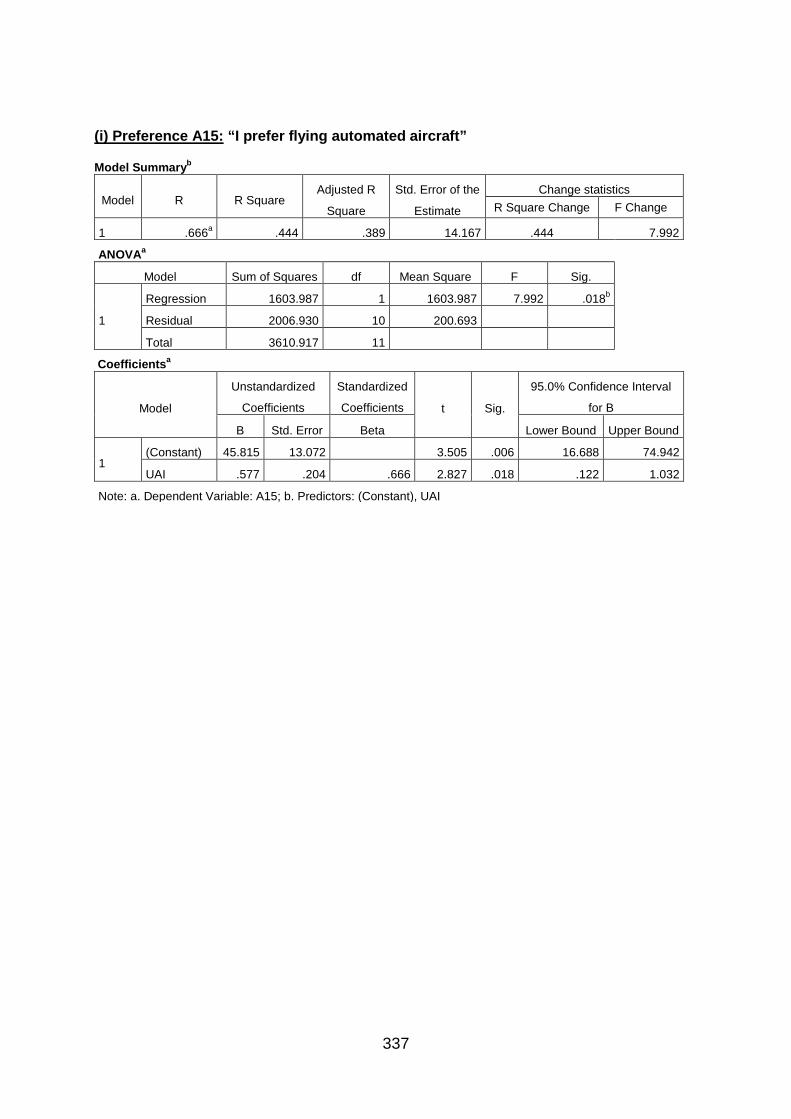
337
(i) Preference A15: “I prefer flying automated aircraft”
Model Summaryb
Model R R Square Adjusted R
Square
Std. Error of the
Estimate
Change statistics R Square Change F Change
1 .666a .444 .389 14.167 .444 7.992
ANOVAa
Model Sum of Squares df Mean Square F Sig.
1
Regression 1603.987 1 1603.987 7.992 .018b
Residual 2006.930 10 200.693
Total 3610.917 11 Coefficientsa
Model
Unstandardized
Coefficients
Standardized
Coefficients t Sig.
95.0% Confidence Interval
for B
B Std. Error Beta Lower Bound Upper Bound
1 (Constant) 45.815 13.072 3.505 .006 16.688 74.942
UAI .577 .204 .666 2.827 .018 .122 1.032
Note: a. Dependent Variable: A15; b. Predictors: (Constant), UAI
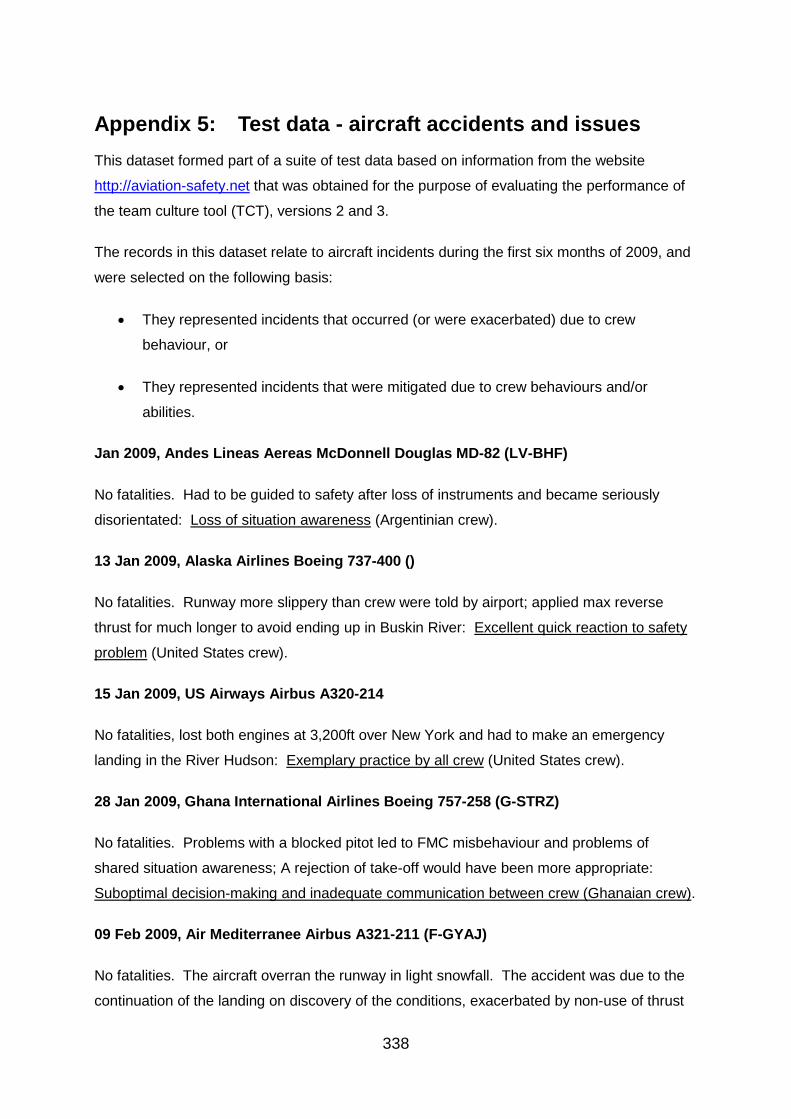
338
Appendix 5: Test data - aircraft accidents and issues This dataset formed part of a suite of test data based on information from the website
http://aviation-safety.net that was obtained for the purpose of evaluating the performance of
the team culture tool (TCT), versions 2 and 3.
The records in this dataset relate to aircraft incidents during the first six months of 2009, and
were selected on the following basis:
• They represented incidents that occurred (or were exacerbated) due to crew
behaviour, or
• They represented incidents that were mitigated due to crew behaviours and/or
abilities.
Jan 2009, Andes Lineas Aereas McDonnell Douglas MD-82 (LV-BHF)
No fatalities. Had to be guided to safety after loss of instruments and became seriously
disorientated: Loss of situation awareness (Argentinian crew).
13 Jan 2009, Alaska Airlines Boeing 737-400 ()
No fatalities. Runway more slippery than crew were told by airport; applied max reverse
thrust for much longer to avoid ending up in Buskin River: Excellent quick reaction to safety
problem (United States crew).
15 Jan 2009, US Airways Airbus A320-214
No fatalities, lost both engines at 3,200ft over New York and had to make an emergency
landing in the River Hudson: Exemplary practice by all crew (United States crew).
28 Jan 2009, Ghana International Airlines Boeing 757-258 (G-STRZ)
No fatalities. Problems with a blocked pitot led to FMC misbehaviour and problems of
shared situation awareness; A rejection of take-off would have been more appropriate:
Suboptimal decision-making and inadequate communication between crew (Ghanaian crew).
09 Feb 2009, Air Mediterranee Airbus A321-211 (F-GYAJ)
No fatalities. The aircraft overran the runway in light snowfall. The accident was due to the
continuation of the landing on discovery of the conditions, exacerbated by non-use of thrust
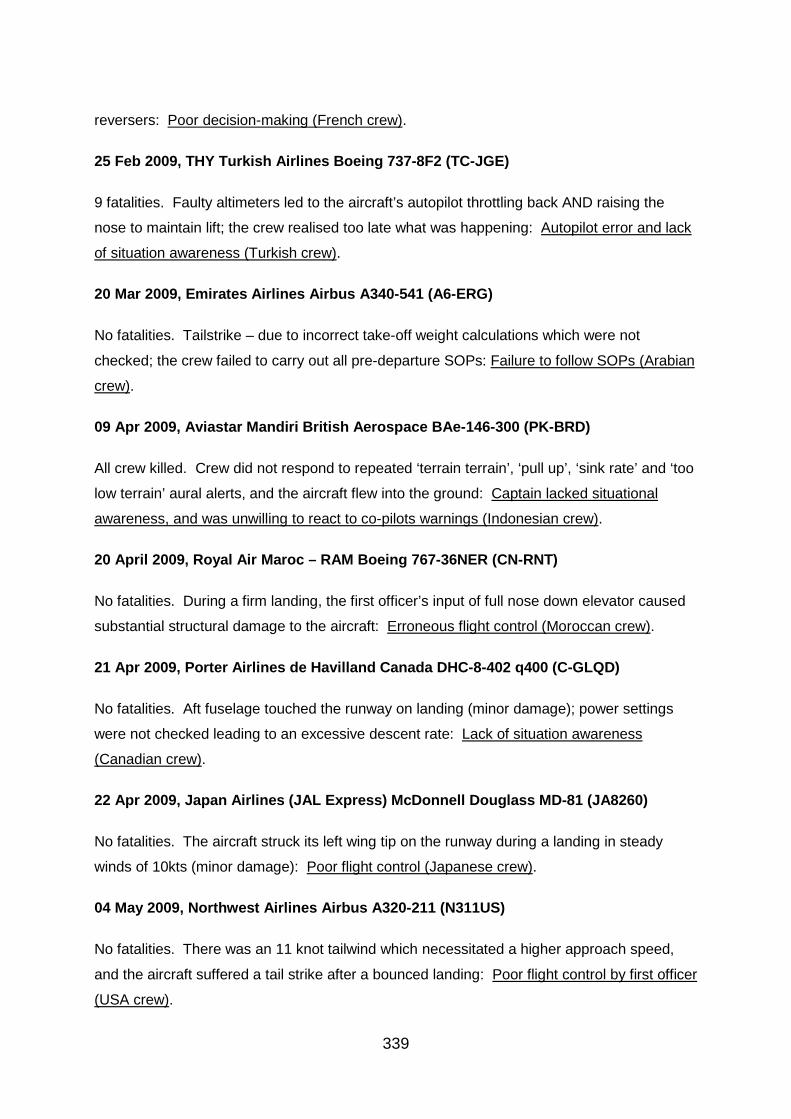
339
reversers: Poor decision-making (French crew).
25 Feb 2009, THY Turkish Airlines Boeing 737-8F2 (TC-JGE)
9 fatalities. Faulty altimeters led to the aircraft’s autopilot throttling back AND raising the
nose to maintain lift; the crew realised too late what was happening: Autopilot error and lack
of situation awareness (Turkish crew).
20 Mar 2009, Emirates Airlines Airbus A340-541 (A6-ERG)
No fatalities. Tailstrike – due to incorrect take-off weight calculations which were not
checked; the crew failed to carry out all pre-departure SOPs: Failure to follow SOPs (Arabian
crew).
09 Apr 2009, Aviastar Mandiri British Aerospace BAe-146-300 (PK-BRD)
All crew killed. Crew did not respond to repeated ‘terrain terrain’, ‘pull up’, ‘sink rate’ and ‘too
low terrain’ aural alerts, and the aircraft flew into the ground: Captain lacked situational
awareness, and was unwilling to react to co-pilots warnings (Indonesian crew).
20 April 2009, Royal Air Maroc – RAM Boeing 767-36NER (CN-RNT)
No fatalities. During a firm landing, the first officer’s input of full nose down elevator caused
substantial structural damage to the aircraft: Erroneous flight control (Moroccan crew).
21 Apr 2009, Porter Airlines de Havilland Canada DHC-8-402 q400 (C-GLQD)
No fatalities. Aft fuselage touched the runway on landing (minor damage); power settings
were not checked leading to an excessive descent rate: Lack of situation awareness
(Canadian crew).
22 Apr 2009, Japan Airlines (JAL Express) McDonnell Douglass MD-81 (JA8260)
No fatalities. The aircraft struck its left wing tip on the runway during a landing in steady
winds of 10kts (minor damage): Poor flight control (Japanese crew).
04 May 2009, Northwest Airlines Airbus A320-211 (N311US)
No fatalities. There was an 11 knot tailwind which necessitated a higher approach speed,
and the aircraft suffered a tail strike after a bounced landing: Poor flight control by first officer
(USA crew).
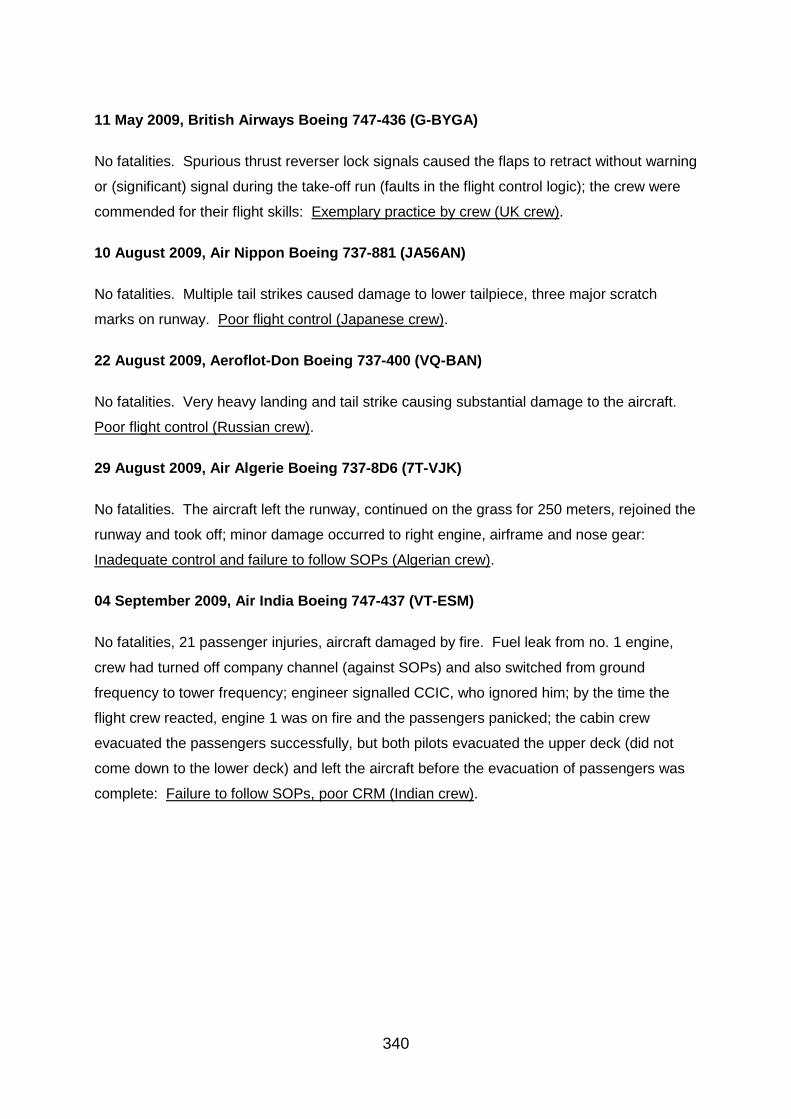
340
11 May 2009, British Airways Boeing 747-436 (G-BYGA)
No fatalities. Spurious thrust reverser lock signals caused the flaps to retract without warning
or (significant) signal during the take-off run (faults in the flight control logic); the crew were
commended for their flight skills: Exemplary practice by crew (UK crew).
10 August 2009, Air Nippon Boeing 737-881 (JA56AN)
No fatalities. Multiple tail strikes caused damage to lower tailpiece, three major scratch
marks on runway. Poor flight control (Japanese crew).
22 August 2009, Aeroflot-Don Boeing 737-400 (VQ-BAN)
No fatalities. Very heavy landing and tail strike causing substantial damage to the aircraft.
Poor flight control (Russian crew).
29 August 2009, Air Algerie Boeing 737-8D6 (7T-VJK)
No fatalities. The aircraft left the runway, continued on the grass for 250 meters, rejoined the
runway and took off; minor damage occurred to right engine, airframe and nose gear:
Inadequate control and failure to follow SOPs (Algerian crew).
04 September 2009, Air India Boeing 747-437 (VT-ESM)
No fatalities, 21 passenger injuries, aircraft damaged by fire. Fuel leak from no. 1 engine,
crew had turned off company channel (against SOPs) and also switched from ground
frequency to tower frequency; engineer signalled CCIC, who ignored him; by the time the
flight crew reacted, engine 1 was on fire and the passengers panicked; the cabin crew
evacuated the passengers successfully, but both pilots evacuated the upper deck (did not
come down to the lower deck) and left the aircraft before the evacuation of passengers was
complete: Failure to follow SOPs, poor CRM (Indian crew).
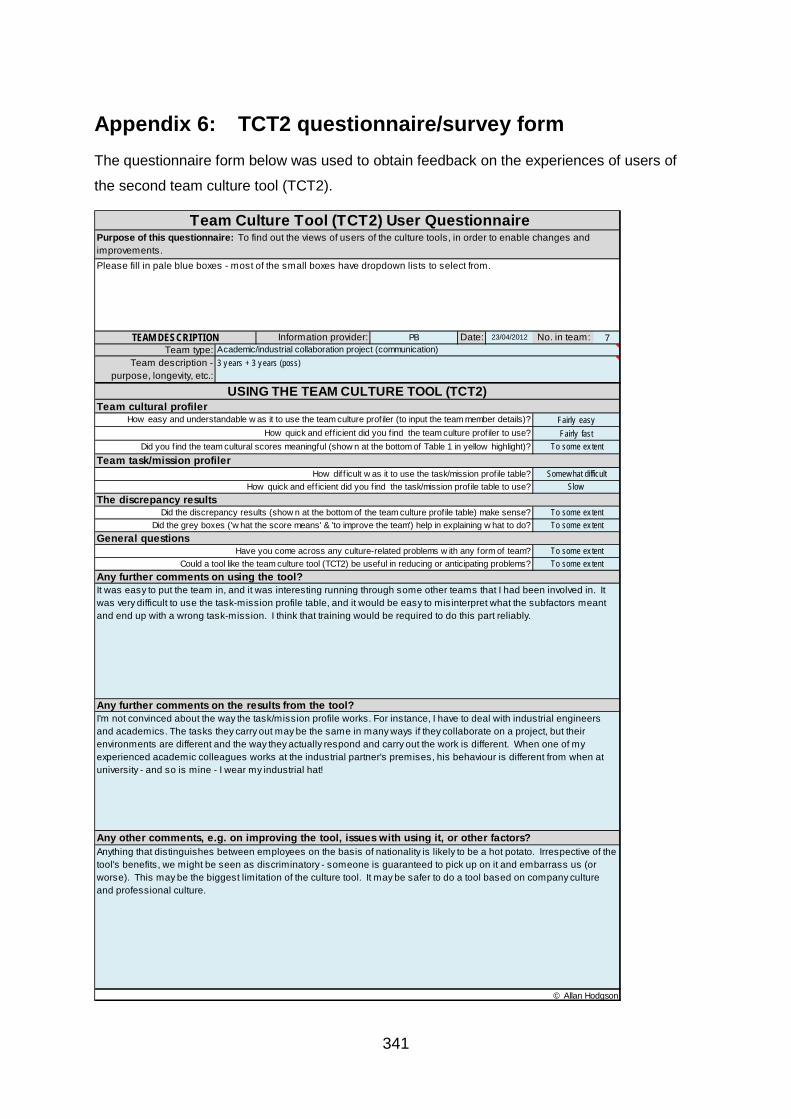
341
Appendix 6: TCT2 questionnaire/survey form The questionnaire form below was used to obtain feedback on the experiences of users of
the second team culture tool (TCT2).
Date: 7
© Allan Hodgson
Any other comments, e.g. on improving the tool, issues with using it, or other factors?Anything that distinguishes between employees on the basis of nationality is likely to be a hot potato. Irrespective of the tool's benefits, we might be seen as discriminatory - someone is guaranteed to pick up on it and embarrass us (or worse). This may be the biggest limitation of the culture tool. It may be safer to do a tool based on company culture and professional culture.
Any further comments on the results from the tool?I'm not convinced about the way the task/mission profile works. For instance, I have to deal with industrial engineers and academics. The tasks they carry out may be the same in many ways if they collaborate on a project, but their environments are different and the way they actually respond and carry out the work is different. When one of my experienced academic colleagues works at the industrial partner's premises, his behaviour is different from when at university - and so is mine - I wear my industrial hat!
Any further comments on using the tool?It was easy to put the team in, and it was interesting running through some other teams that I had been involved in. It was very difficult to use the task-mission profile table, and it would be easy to misinterpret what the subfactors meant and end up with a wrong task-mission. I think that training would be required to do this part reliably.
Did the grey boxes ('w hat the score means' & 'to improve the team') help in explaining w hat to do? To some ex tentGeneral questions
Have you come across any culture-related problems w ith any form of team? To some ex tentCould a tool like the team culture tool (TCT2) be useful in reducing or anticipating problems? To some ex tent
How quick and eff icient did you f ind the task/mission profile table to use? SlowThe discrepancy results
Did the discrepancy results (show n at the bottom of the team culture profile table) make sense? To some ex tent
Did you f ind the team cultural scores meaningful (show n at the bottom of Table 1 in yellow highlight)? To some ex tentTeam task/mission profiler
How diff icult w as it to use the task/mission profile table? Somew hat difficult
Team cultural profilerHow easy and understandable w as it to use the team culture profiler (to input the team member details)? Fairly easy
How quick and eff icient did you f ind the team culture profiler to use? Fairly fast
No. in team:Team type: Academic/industrial collaboration project (communication)
Team description - purpose, longevity, etc.:
3 y ears + 3 y ears (poss)
USING THE TEAM CULTURE TOOL (TCT2)
Team Culture Tool (TCT2) User QuestionnairePurpose of this questionnaire: To find out the views of users of the culture tools, in order to enable changes and improvements.Please fill in pale blue boxes - most of the small boxes have dropdown lists to select from.
TEAM DESCRIPTION Information provider: PB 23/04/2012
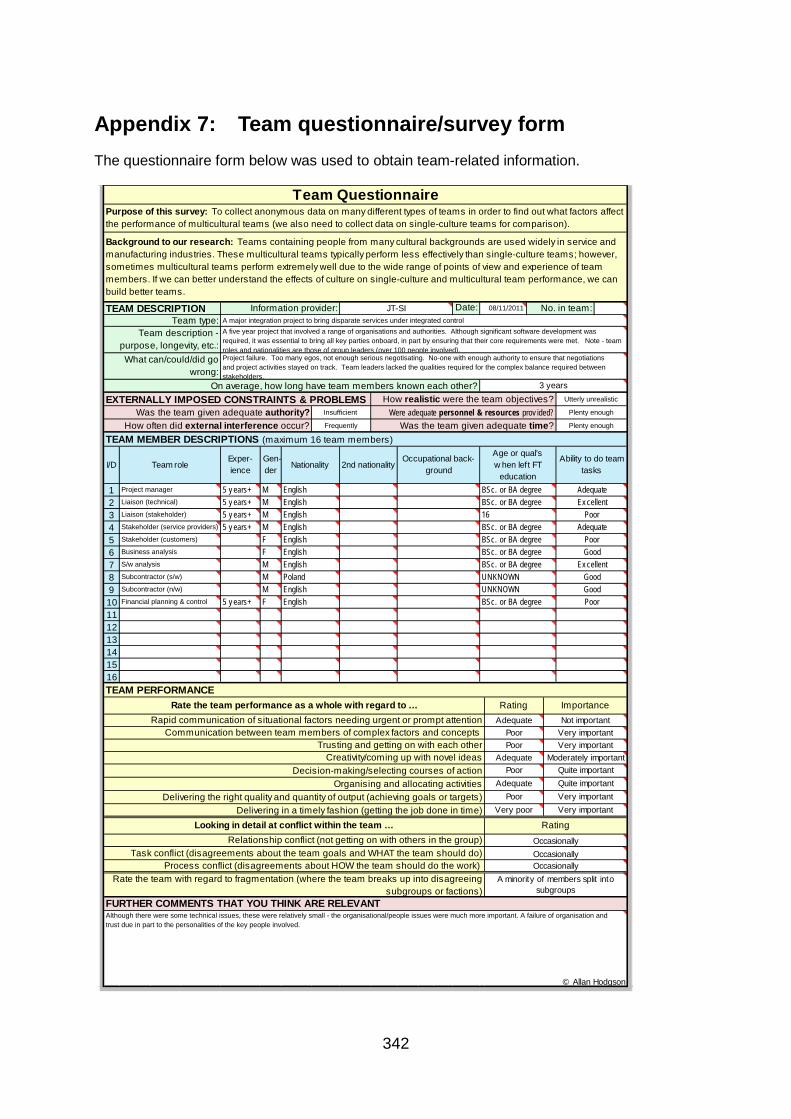
342
Appendix 7: Team questionnaire/survey form The questionnaire form below was used to obtain team-related information.
Date:
1 5 y ears+ M2 5 y ears+ M3 5 y ears+ M4 5 y ears+ M5 F6 F7 M8 M9 M10 5 y ears+ F111213141516
FURTHER COMMENTS THAT YOU THINK ARE RELEVANT Although there were some technical issues, these were relatively small - the organisational/people issues were much more important. A failure of organisation and trust due in part to the personalities of the key people involved.
© Allan Hodgson
Process conflict (disagreements about HOW the team should do the work) OccasionallyRate the team with regard to fragmentation (where the team breaks up into disagreeing
subgroups or factions)A minority of members split into
subgroups
Relationship conflict (not getting on with others in the group) OccasionallyTask conflict (disagreements about the team goals and WHAT the team should do) Occasionally
Looking in detail at conflict within the team … Rating
Delivering the right quality and quantity of output (achieving goals or targets) Poor Very importantDelivering in a timely fashion (getting the job done in time) Very poor Very important
Decision-making/selecting courses of action Poor Quite importantOrganising and allocating activities Adequate Quite important
Trusting and getting on with each other Poor Very importantCreativity/coming up with novel ideas Adequate Moderately important
Rapid communication of situational factors needing urgent or prompt attention Adequate Not importantCommunication between team members of complex factors and concepts Poor Very important
TEAM PERFORMANCERate the team performance as a whole with regard to … Rating Importance
Financial planning & control English BSc. or BA degree PoorSubcontractor (n/w) English UNKNOWN GoodSubcontractor (s/w) Poland UNKNOWN GoodS/w analysis English BSc. or BA degree Ex cellentBusiness analysis English BSc. or BA degree GoodStakeholder (customers) English BSc. or BA degree PoorStakeholder (service providers) English BSc. or BA degree AdequateLiaison (stakeholder) English 16 PoorLiaison (technical) English BSc. or BA degree Ex cellentProject manager English BSc. or BA degree Adequate
TEAM MEMBER DESCRIPTIONS (maximum 16 team members)
I/D Team roleExper-ience
Gen-der Nationality 2nd nationality
Occupational back-ground
Age or qual's w hen left FT
education
Ability to do team tasks
Insufficient Were adequate personnel & resources prov ided? Plenty enough
How often did external interference occur? Frequently Was the team given adequate time? Plenty enough
On average, how long have team members known each other? 3 years
EXTERNALLY IMPOSED CONSTRAINTS & PROBLEMS How realistic were the team objectives? Utterly unrealistic
Team Questionnaire
Purpose of this survey: To collect anonymous data on many different types of teams in order to find out what factors affect the performance of multicultural teams (we also need to collect data on single-culture teams for comparison).
Background to our research: Teams containing people from many cultural backgrounds are used widely in service and manufacturing industries. These multicultural teams typically perform less effectively than single-culture teams; however, sometimes multicultural teams perform extremely well due to the wide range of points of view and experience of team members. If we can better understand the effects of culture on single-culture and multicultural team performance, we can build better teams.
TEAM DESCRIPTION Information provider: JT-SI 08/11/2011 No. in team:Team type: A major integration project to bring disparate services under integrated control
Team description - purpose, longevity, etc.:
A five year project that involved a range of organisations and authorities. Although significant software development was required, it was essential to bring all key parties onboard, in part by ensuring that their core requirements were met. Note - team roles and nationalities are those of group leaders (over 100 people involved).
What can/could/did go wrong:
Project failure. Too many egos, not enough serious negotisating. No-one with enough authority to ensure that negotiations and project activities stayed on track. Team leaders lacked the qualities required for the complex balance required between stakeholders.
Was the team given adequate authority?
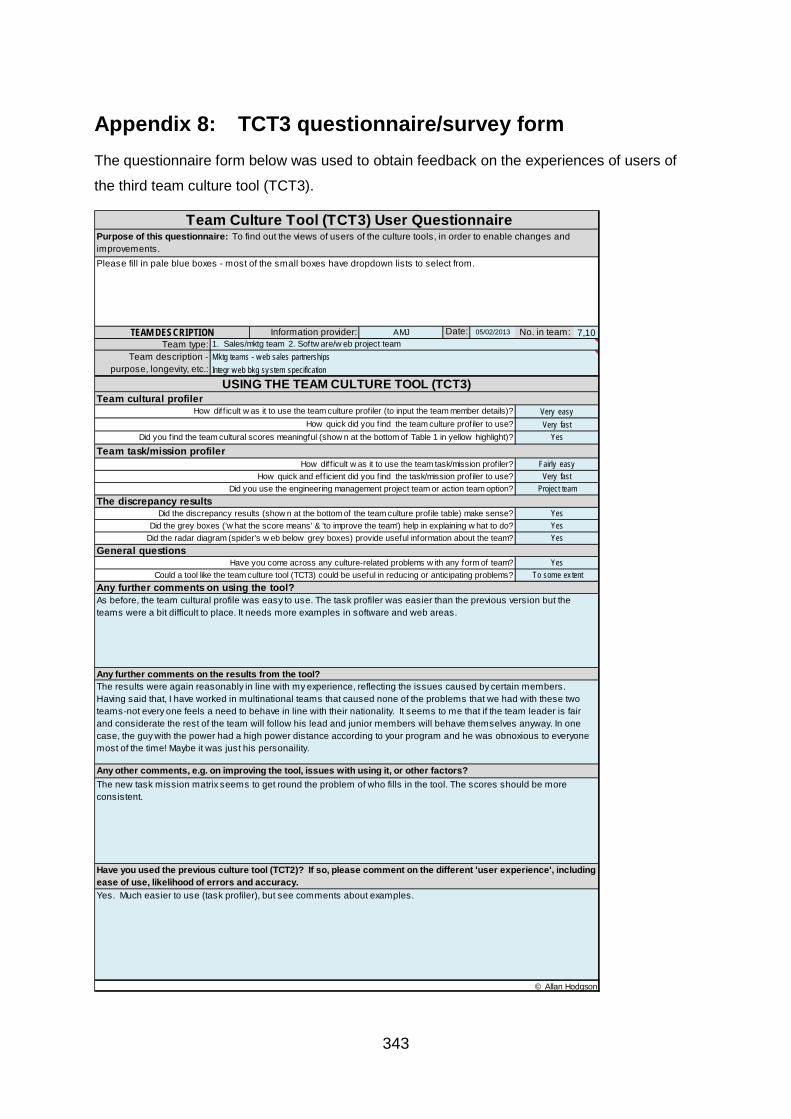
343
Appendix 8: TCT3 questionnaire/survey form The questionnaire form below was used to obtain feedback on the experiences of users of
the third team culture tool (TCT3).
Date: 7,10
Team Culture Tool (TCT3) User QuestionnairePurpose of this questionnaire: To find out the views of users of the culture tools, in order to enable changes and improvements.Please fill in pale blue boxes - most of the small boxes have dropdown lists to select from.
TEAM DESCRIPTION Information provider: AMJ 05/02/2013 No. in team:Team type: 1. Sales/mktg team 2. Softw are/w eb project team
Team description - purpose, longevity, etc.:
Mktg teams - w eb sales partnershipsIntegr w eb bkg sy stem specification
USING THE TEAM CULTURE TOOL (TCT3)
Did you f ind the team cultural scores meaningful (show n at the bottom of Table 1 in yellow highlight)? YesTeam task/mission profiler
How diff icult w as it to use the team task/mission profiler? Fairly easy
Did the grey boxes ('w hat the score means' & 'to improve the team') help in explaining w hat to do? YesDid the radar diagram (spider's w eb below grey boxes) provide useful information about the team?
Team cultural profilerHow diff icult w as it to use the team culture profiler (to input the team member details)? Very easy
How quick did you f ind the team culture profiler to use? Very fast
Did the discrepancy results (show n at the bottom of the team culture profile table) make sense? Yes
Yes
How quick and eff icient did you f ind the task/mission profiler to use? Very fastDid you use the engineering management project team or action team option? Project team
The discrepancy results
Could a tool like the team culture tool (TCT3) could be useful in reducing or anticipating problems? To some ex tentAny further comments on using the tool?
General questionsHave you come across any culture-related problems w ith any form of team? Yes
Any further comments on the results from the tool?The results were again reasonably in line with my experience, reflecting the issues caused by certain members. Having said that, I have worked in multinational teams that caused none of the problems that we had with these two teams-not every one feels a need to behave in line with their nationality. It seems to me that if the team leader is fair and considerate the rest of the team will follow his lead and junior members will behave themselves anyway. In one case, the guy with the power had a high power distance according to your program and he was obnoxious to everyone most of the time! Maybe it was just his personaility.
As before, the team cultural profile was easy to use. The task profiler was easier than the previous version but the teams were a bit difficult to place. It needs more examples in software and web areas.
© Allan Hodgson
Any other comments, e.g. on improving the tool, issues with using it, or other factors?The new task mission matrix seems to get round the problem of who fills in the tool. The scores should be more consistent.
Yes. Much easier to use (task profiler), but see comments about examples.
Have you used the previous culture tool (TCT2)? If so, please comment on the different 'user experience', including ease of use, likelihood of errors and accuracy.
344
Appendix 9: Generating the exemplars for the TCT3 The exemplars were an essential part of the TCT3 tool because they allowed users to place
their teams or missions in an appropriate context based on relative rather than absolute
assessments of that context – a much easier process that also reduced the likelihood of
gross errors of assignment.
In order to derive a set of exemplars and to locate them in each of the two mission areas
(project and operation), the researcher initially collected a set of mission exemplars for each
of the scenarios from the literature and from news articles and blogs. It was important that
these exemplars were as unambiguous as possible to the majority of users, so the
researcher discussed this set of exemplars with a colleague and, having made minor
changes, created two ‘grids’, similar in appearance to Figures 8-6 (projects) and 8-7
(crews/operators). Each of these grids was populated with just four ‘extreme’ exemplars; a
set of explanations of the placement of each exemplar was written, and a list was provided of
exemplars that might be placed on each grid.
The researcher then organised meetings with former industrial acquaintances or emailed the
project grids to them (as Excel files), and these acquaintances were persuaded (a) to revise
or add to the list of exemplars, (b) to place the set of revised exemplars on the grid, and (c)
to move or remove the originally-placed exemplars as seemed appropriate. The researcher
then produced a composite version of the project grid based on the returned, populated
‘mission grids’. Following comments from one of the exemplar providers about the paucity of
software projects, that provider was persuaded to produce a computer systems/software/-
webware grid; this was not used in this thesis, but was incorporated in an alternative version
of the TCT3 and sent back to him.
In the case of the crew/operator grid, there was less access to useful sources of information
and advice. The researcher utilised the earlier-interviewed pilot, who commented on his
views with regard to various crews, but the main sources were from the general and
academic literature, including comparative accident analyses.
From the comments of the above provider of software-related exemplars, it would appear
fruitful to produce more industry-focused mission grids, which would provide an enhanced
user experience.
345
Appendix 10: Hofstede’s fifth and sixth dimensions As stated elsewhere in this thesis, when the research began, sets of national cultural scores
covering the majority of nations were only available for four dimensions of Hofstede’s
framework – power distance (PDI), individualism (IDV), masculinity (MAS) and uncertainty
avoidance (UAI). For the fifth dimension, long vs. short term orientation (LTO), culture
scores were available for only twenty-three nations (primarily Eastern), and attempts to
extend the scores to other countries had produced disappointing results. For the sixth
dimension, indulgence vs. restraint (IVS), a full set of national scores was not presented in
any of Hofstede’s publications until the release of the third edition of Cultures and Organi-
zations (Geert H. Hofstede et al., 2010) approximately eighteen months after the start of this
PhD. However this dimension was included in the 2008 Values Survey Module (Geert
Hofstede, Hofstede, Minkov, & Vinken, 2008b), along with a seventh dimension,
monumentalism vs. flexhumility (MVF). This latter dimension was found to be inversely
correlated with long term orientation, see Chapter 4 of Minkov (Minkov, 2011). Therefore,
rather than adding MVF to the previous six dimensions, Hofstede introduced, in his 2010
book, a modified form of long term orientation, LTO- WVS78, which took account of the MVF
findings - see also Minkov’s analyses (Geert Hofstede, Hofstede, Minkov, & Vinken, 2008a) .
Due to time pressure, the author was not able retrospectively to include the fifth (revised)
dimension and sixth dimension of Hofstede’s framework into his statistical work; in addition,
there was very little published material on these dimensions that was of relevance to the
author’s studies. A further literature review at the time of thesis completion, revealed no
publications on LTO-WVS/pragmatism or IVS that were of relevance to the research work
described in this thesis.
78 This was later renamed ‘pragmatism’.
Copyright © 2022 FDOKUMEN

