


Bahasa
Halaman
Hukum


Population-E, 63 (1), 2008, 9-90
º»
JaCques Véron*
The Demography of South Asia from the 1950s to the 2000s
A Summary of Changes and a Statistical Assessment
SouthAsia,forthepurposesofthischronicle,iscomposedofeightcountries,namelyAfghanistan,Bangladesh,Bhutan,India,theMaldives,Nepal,PakistanandSriLanka(1).In2007thepopulationinthisregiontotallednearly1.6billioninhabitants(UnitedNations,2007a),representingnearly24%oftheworld’stotalpopulationspreadoverlessthan4%oftheworld’ssurface(2).Fromademographicpointofview,SouthAsiaisdominatedbyIndia,whichalonehasapopulationof1.17billion,buttherearetwootherdenselypopulatedcountriesinthisregion:PakistanandBangladesh,withpopulationsof164and159millionrespectivelyin2007.SouthAsiaalsoincludescountrieswithsmallpopulationssuchasBhutan,withonly658,000inhabitantsandtheMaldiveswithjust306,000.
Therearesharpcontrastsbetweenthesecountries,be it in termsofdemographicgrowth,populationdensity,mortalityandfertilityrates,urbanizationorliteracy.AndthesituationwithinIndia,thelargestcountryintheregion,is itselfoneofmajor internalcontrasts. Its28stateseachhavedistinctdemographictraits–populationsize,stageofdemographictransition,densityetc.–aswellasdifferenteconomic,socialandreligiouscharacteristics.
ThedemographicchallengesconfrontingSouthAsiaarethoseofdevelopingcountriesfacedwithamajorpopulationincrease.Theyarethechallengesofeducating,housing,caringforandemployingagrowing–sometimesrapidlygrowing–population.Thesecountrieshavetofightagainstpovertywhileensuringthattheeconomicgrowththeysobadlyneedtoimprovethelivesoftheirpeopledoesnotresultinseriousenvironmentaldamage.Thepopulations
*Institutnationald’étudesdémographiques,Paris.TranslatedbyKrystynaHorko,RosemaryKneipp,GodfreyRogers.(1)FortheUnitedNations,SouthAsiaismadeupofthesamecountriesexcludingAfghanistan,whichisconsideredtobeinCentralAsia.
(2)Thelandsurfaceisthedifference,ineachcountry,betweenthetotalsurfaceareaandtheinlandwaters(themainriversandlakes).SeePison(2007).
02_INE_Pop0108_007_090.indd 9 23/06/2008 14:36:15

J. Véron
10
ofSouthAsiaareveryvulnerablebotheconomically(especiallythechildrenwhostartworkingatanearlyage)andenvironmentally.Forinstance,aportionoftheBangladeshipopulationlivesatsealevelwithconsiderableexposuretofloodrisk,andseveralcountriesintheregionwereaffectedbythetsunamiinthewinterof2004.Incertainfragileorexposedareas,demographicgrowthandtheconsequentincreaseinpopulationdensityexacerbatethevulnerabilityofthepoorestpopulations.
I. South Asia in the world
Withjustunderonequarteroftheworld’spopulationintheearly2000s,SouthAsia’spopulationgrowthof2.1%overthepastthirtyyearsisfarhigherthantheworldaverageof1.6%betweentheyears1975-2005(Table1),butbelowthatofsub-SaharanAfrica(2.7%)ortheArabworld(2.6%).SouthAsiaislessadvancedinitsdemographictransitionthantheworldasawhole:thefertilityratewas3.2childrenperwomanbetween2000-2005comparedwithaglobalaverageof2.7,whilelifeexpectancyatbirthwas3.6yearsbelowtheworldaverage.SouthAsiaisquitedistinctfromEastAsiaandthePacificregion,
Map 1. South Asia
India
Pakis
tan
Bangladesh
BhutanNepal
Afghanistan
Sri Lanka
Maldives
02_INE_Pop0108_007_090.indd 10 23/06/2008 14:36:15

the deMograPhy of south asia froM the 1950s to the 2000s
11
Tab
le 1
. Sel
ecte
d s
oci
o-d
emo
gra
ph
ic c
har
acte
rist
ics
of
Sou
th A
sia
com
par
ed w
ith
oth
er w
orl
d r
egio
ns
Pop
ula
tio
n
in 2
004
(i
n m
illio
ns)
TFR
in
200
0-20
05
(ch
ildre
n
per
wo
man
)
Life
ex
pec
tan
cy
at b
irth
in
200
4
(in
yea
rs)
An
nu
al
po
pu
lati
on
g
row
th
1975
-200
5 (%
)
HD
I in
200
4
Per
cap
ita
GN
I in
USD
(PP
P)
in 2
004
Ad
ult
lite
racy
ra
te
in 2
004
(%)
Sub-
Saha
ran
Afr
ica
689.
65.
546
.12.
70.
472
1,94
663
.3
Nor
th A
fric
a an
d th
e M
iddl
e Ea
st31
0.5
3.7
67.3
2.6
0.68
05,
680
69.9
Latin
Am
eric
a an
d th
e C
arib
bean
548.
32.
672
.21.
90.
795
7,96
490
.2
Sout
h A
sia
1,52
8.1
3.2
63.7
2.1
0.59
93,
072
60.9
East
Asi
a an
d th
e Pa
cific
1,94
4.0
1.9
70.8
1.4
0.76
05,
872
90.7
OEC
D c
ount
ries
1,16
4.8
1.8
77.8
0.8
0.92
327
,571
–
Wor
ld t
otal
6,38
9.2
2.7
67.3
1.6
0.74
18,
833
–
TFR
: tot
al f
ertil
ity
rate
. H
DI:
Hum
an d
evel
opm
ent
inde
x.
PPP:
Pur
chas
ing
pow
er p
arit
y.So
urc
e: U
ND
P (2
00
6).
02_INE_Pop0108_007_090.indd 11 23/06/2008 14:36:15

J. Véron
12
wherefertilityisbelowreplacementlevelandlifeexpectancy7yearsabovethatofSouthAsia.ThehealthsituationinSouthAsiaisworsethaninotherregionsoftheworld,withtheexceptionofsub-SaharanAfrica.
SouthAsiaisalsothesecondleastdevelopedregionintheworldaftersub-SaharanAfrica.In2004,thehumandevelopmentindex(HDI)(3)was0.60comparedwithaworldaverageof0.74;percapitaGDP(USD3,072perheadintermsofpurchasingpowerparity)wasnearlythreetimesbelowtheworldaverage, andadult literacy the lowest in theworld, evenbelow thatofsub-SaharanAfrica.
II. Abundant demographic data in view of development levels
Overall,withtheexceptionofBhutanandAfghanistanforwhichdemographicinformation–apartfromUNdata–isfragmentary,richsourcesofdemographicdataareavailableforSouthAsiancountriesfrombothcensusesandsurveys(seeTable2a).Thethreemostdenselypopulatedcountries,India,PakistanandBangladesh,havetakenregularcensusessincetheendofthenineteenthcentury.Indiahasheldoneeverytenyearssince1871.Thefirstpost-Independencecensuswasconductedin1951,whilethemostrecentwasin2001.Pakistantookitsfirstpost-Partitioncensusin1951andintendedtoapplythesamedecennialprinciple.Thesecondcensuswasindeedheldin1961butthethirdwaspostponeduntil1972becauseofthewarwithIndia.Thefourthwasheldin1981butthefifthcensuswasdelayeduntil1998.AfteritsindependencefromPakistanin1971,Bangladeshheldfourcensusesin1974,1981,1991and2001respectively.Afghanistanheldapartialcensus in1979,but theoneplannedfor2004waspostponedandwillprobablytakeplacein2008.Nepalhasheldtencensusessince1911,themostrecentbeingin2001.Bhutanhastakenaseriesofcensusesbutthesearereallycitizenshipcensusesforcheckingthenationalityofpopulationsinthewakeofintensemigration.However,thegovernmentcarriedoutafullpopulationcensusin2005toobtainreliablesocio-demographicdataforthecountryasawhole.
Infivecountriesoutofeight,censusinformationiscomplementedbydemographicandhealthsurveys.InthepastfifteenyearsIndiahascarriedoutthreesuchsurveys,calledNationalFamilyandHealthSurveys,andhasjustpublishedtheresultsofthemostrecentoneheldin2005-2006.Sincetheearly1990s,Bangladeshhascarriedoutsevendemographicandhealthsurveys,fiveofwhichwerestandard,whileSriLankacarriedoutthree(Table2b).TwodemographicandhealthsurveyswerecarriedoutinPakistan:afirstonein1990-1991andasecondin2006,buttheresultsofthelatestonearenotyet
(3)ThehumandevelopmentindexwasintroducedbyUNDPin1990.Itisacompositeindexthatincludeslifeexpectancy,adultliteracyratesandschoolenrolmentratio,aswellaspercapitaGDP.Itrangesfrom0to1.
02_INE_Pop0108_007_090.indd 12 23/06/2008 14:36:16

the deMograPhy of south asia froM the 1950s to the 2000s
13
available.Theremainingcountriesintheregion(Afghanistan,BhutanandtheMaldives)haveneverconductedasurveyofthistype.
Themostdenselypopulatedcountryintheregionisalsotheoneforwhichwehavethemostdemographicdata,thanksinparttoIndia’sSampleRegistrationSystem(SRS)whichconstitutesavaluableadditionalsource.ThissystemforregisteringdemographiceventswassetupbytheRegistrarGeneralbetween1964-1965,originallyforafewstates,andthenextendedthroughoutIndia
Table 2a. Number of population censuses and national demographic surveys carried out since the 1960s in South Asia
1960-1969 1970-1979 1980-1989 1990-1999 2000-2007 Total
Census 4 7 6 6 6 29
Demographic and health surveys (DHS) – – 2 8 7 17
Other surveys – 4* – – 4** 8
Total 4 11 8 14 17 54
* 1975-1976 World Fertility Survey.** 2002-2003 World Health Survey.
Table 2b. Dates of DHS surveys in South Asian countries
Country Dates
Bangladesh 1993-1994 (standard)1996-1997 (standard)1999-2000 (standard)1999-2000 (MCH SPA)*2001 (maternal mortality)2004 (standard)2007 (standard)
India 1992-1993 (standard)1998-1999 (standard)2005-2006 (standard)
Nepal 1987 (in-depth)**1996 (standard)2001 (standard)2006 (standard)
Pakistan 1990-1991 (standard)2006 (standard)
Sri Lanka 1987 (standard)1993***2000***
* Maternal and Child Health, Services Provision Assessment Survey.** In-depth study to find out why women wanting to space births or limit family size were not using contraception.*** Surveys featured on the Sri Lanka Department of Census and Statistics website, but not on the Macro international site.Sources: www.measuresdhs.com/countries; www.statistics.gov.lk
02_INE_Pop0108_007_090.indd 13 23/06/2008 14:36:16

J. Véron
14
between1969-1970.Itisbasedonadualsystemofbirthanddeathrecords(4).TheSRSBulletins,publishedtwiceayear,provideestimatesofcrudebirthanddeathrates,naturalgrowthratesandinfantmortalityratesforbothurbanandruralareasaswellasbystate.
III. Demographic and socioeconomic heterogeneity
SouthAsiaisadiversifiedgeographiczone,withsharpcontrastsbetweenthemountainsofAfghanistanorNepal,forinstance,andthelowlandsoftheMaldivesIslandsortheGangesDelta inBangladesh.RegionalgeographicdiversityisalsotobefoundwithinIndiaproper:HimachalPradesh,aHimalayanstate,bearsnoresemblancetothecoastalregionsofKeralaorTamilNadu.Thisgeographicdiversitygoeshandinhandwithdemographic,economicandsocialheteregoneity.
Large demographic disparities
SouthAsiancountriesareofveryunequalsize(Table3).ThepopulationoftheMaldives(306,000inhabitants)bearsnocomparisonwiththatofIndia(1,169billioninhabitantsin2007).Threeoftheregion’seightcountriesaccountfor95%of thetotalpopulation,andnearly three-quartersof theregion’sinhabitantsliveinIndia.SouthAsiancountriesalsodifferintermsofpopulationdensity,whichrangesfrommorethan1,100inhabitantspersq.kminBangladesh,toanaverageofjust14inhabitantspersq.kminBhutan.
Thepopulationofthesecountriesisgrowingatavariablepace.AccordingtoUNestimates,theaveragerateofpopulationgrowthinAfghanistanwasnearly3.8%fortheperiod2000-2005,comparedwithscarcelymorethan0.4%forSriLanka.Theprogressofdemographictransitionisalsodifferent.Infantmortalitywasestimatedat11‰inSriLankaintheearly2000s,butexceeded160‰inAfghanistan,whereas fertility,whichfell toonly2childrenperwomaninSriLankaiscloserto7inAfghanistan.
WithinIndiaproper(Map2),thereareconsiderabledemographicdisparitiesintermsofpopulationsize,rateofpopulationgrowthandpopulationdensity,tonamejustthreecriteria.Forexample,inthe2001census,themostdenselypopulatedstateinthecountry,UttarPradesh,hadapopulationof166million–largerthanthatofPakistanorBangladesh–whereastheleastpopulatedstate,Sikkim,hadpopulationofscarcelymorethan540,000.TheUnion
(4)Thesystemisbasedonadualdatacollectionsystem:acontinuousprocessofbirthanddeathregistrationinasampleofvillagesandurbanenumerationblocks,andanindependentretrospectivesurveyovera six-monthperiod.Matching thedata from these two sourcesmakes itpossible todistinguish events registered by both sources, from those that are partially registered or notregisteredbyoneofthesources.Inthesetwocases,acheckiscarriedoutinthefieldbyavisittothehouseholdsconcerned.Thesystemdoesnotprovideameansforestimatingeventsthatmighthavebeenomittedbybothsources(MariBhatetal.,1984).
02_INE_Pop0108_007_090.indd 14 23/06/2008 14:36:16

the deMograPhy of south asia froM the 1950s to the 2000s
15
territory(5)oftheLakshadweepIslandshasthesmallestpopulation,withjustover60,000inhabitantsin2001(Table4).Intheperiod1991-2001,thepopulationinIndia’svariousstatesandterritoriesgrewatvariablerates,withanannualaverageof5%inNagaland,3.8%intheTerritoryofDelhi,1.8%inPunjab(arateclosetotheIndianaverage,whichis1.93%),1.3%inAndhraPradeshand1.1%inTamilNadu.Populationdensityalsovariessharplybetweenregions.In2001itstoodat324inhabitantspersq.kmforIndiaasawhole,butjust13persq.kminArunachalPradesh,astatethatstretchesfromtheHimalayanmountainstotheBrahmaputraValley,andexceeded900inhabitantspersq.km
inWestBengal,partlybecauseofthecityofCalcutta.Populationdensityisparticularlyhigh in the territoriesofDelhiandChandigarh,(9,294and7,903inhabitantspersq.kmrespectively)becauseofintenseurbanization.Buturbanizationisnotthesolereasonforhighpopulationdensity.InKerala,astatewhereonly26%ofthepopulationlivesinurbanareas,densityexceeded800inhabitantspersq.kmin2001.
Sharp socioeconomic inequalities
Anexaminationofthethreesignificantvariablesforacountry’sdevelopmentconsideredtoplayavitalroleinacountry’sdemographictransition,namelyliteracy,GDPandurbanization,revealssharpcontrastsbetweenthecountries.Forexample,whilenearlyallwomenovertheageof15yearsareliterateintheMaldives(96%)andinSriLanka(nearly90%),theliteracyrateisbelow50%inIndia,under40%inBangladesh,35%inPakistanandNepal,andaslowas13%inAfghanistan(Table5).Likewise,thereisathree-folddifferenceinpercapitaincomebetweenNepal(USD1,490intermsofpurchasingpower
(5)Indiaiscomposedof28statesand7unionterritories.Delhi,PuducherryandChandigarhareincludedamong the territories.Each state is administeredbyaGovernor andaprimeminister,whiletheterritoriesaregoverneddirectlyatfederallevel,representedbyaLieutenantGovernor.
Table 3. Population, surface area and density in South Asian countries in 2007
CountryNumber
of inhabitants(thousands)
Land area*(thousand sq.km)
Population density (inhab. per sq.km)
Maldives 306 0.3 1,020
Bhutan 658 47.0 14
Sri Lanka 19,299 66.0 292
Afghanistan 27,145 652.0 42
Nepal 28,196 147.0 192
Bangladesh 158,665 144.0 1,102
Pakistan 163,902 796.0 206
India 1,169,016 3,287.0 357
* Total surface area minus inland waters.Sources: United Nations (2007a) and Pison (2007).
02_INE_Pop0108_007_090.indd 15 23/06/2008 14:36:16

J. Véron
16
parity)andSriLanka(USD4,390).Andalthoughthecountriesintheregionarenotyetheavilyurbanized,considerablediscrepanciesexistnonetheless.Theproportionofcity-dwellersinPakistan,themosturbanizedcountryintheregion,isthreetimeshigherthaninBhutan(36%versus12%).
Likethedemographicindicators,thesocioeconomicindicatorsvaryfromoneregiontoanotherinIndia.Accordingtodatafromthe2001census,withrespecttotheIndianaverageof54%,femaleliteracyratesrangefrombelow34%inBiharandapproximately88%inKerala.Thewealthofthestatesvaries
Map 2. Administrative India (states, union territories and neighbouring countries)
Jharkhand
Hary
ana
Punjab Uttar-anchal
Jammu &Kashmir
HimachalPradesh
NEPALBHUTAN
CHINA
Assam
Arunachal
PradeshSikkim
Manipur
Nag
alan
d
Tripura
Meghalaya
Mizoram
MYANMAR(BURMA)
BAY OF BENGAL
ARABIAN SEA
INDIAN OCEAN
PAKISTAN
AFGHANISTAN
LAK
SHA
DW
EEP SEA
BANGLADESH
West Bengal
Ined 2008
Andhra Pradesh
Tam
il Na
du
SRILANKA
Kerala
Goa
Karnataka
MaharashtraOrissa
Uttar Pradesh
Madhya Pradesh
Rajasthan
Gujarat
Bihar
Chhattisg
arh
Delhi
Daman & DiuDadra &
Nagar Haveli
Pondicherry
AN
DA
MA
N &
NIC
OBA
R ISLAN
DS
LAKSH
AD
WEEP
(IND
IA)
400 km0
02_INE_Pop0108_007_090.indd 16 23/06/2008 14:36:17

the deMograPhy of south asia froM the 1950s to the 2000s
17
enormouslyasdoes theproportionofcity-dwellers. InGoa, India’smosturbanizedterritory,theproportionisnearly50%,comparedwiththeotherextremeof10%inHimachalPradesh.
Table 4. The 28 states and 7 union territories of India by population in 2001
State or union territory PopulationPopulation density
(Inhabitants per sq.km)
Lakshadweep Island* 60,650 1,894
Daman & Diu* 158,204 1,411
Dadra & Nagar Haveli* 220,490 449
Andaman & Nicobar Islands* 356,152 43
Sikkim 540,851 76
Mizoram 888,573 42
Chandigarh* 900,635 7,903
Puducherry* 974,345 2,029
Arunachal Pradesh 1,097,968 13
Goa 1,347,668 363
Nagaland 1,990,036 120
Manipur 2,166,788 107
Meghalaya 2,318,822 103
Tripura 3,199,203 304
Himachal Pradesh 6,077,900 109
Uttarakhand 8,489,349 159
Jammu and Kashmir 10,143,700 99
Delhi* 13,850,507 9,294
Chhattisgarh 20,833,803 154
Haryana 21,144,564 477
Punjab 24,358,999 482
Assam 26,655,528 340
Jharkhand 26,945,829 338
Kerala 31,841,374 819
Orissa 36,804,660 236
Gujarat 50,671,017 258
Karnataka 52,850,562 275
Rajasthan 56,507,188 165
Madhya Pradesh 60,348,023 196
Tamil Nadu 62,405,679 478
Andhra Pradesh 76,210,007 275
West Bengal 80,176,197 904
Bihar 82,998,509 880
Maharashtra 96,878,627 314
Uttar Pradesh 166,197,921 689
India 1,028,610,328 324
* Union territories.Source: Banthia (2001), http://www.censusindia.net
02_INE_Pop0108_007_090.indd 17 23/06/2008 14:36:17

J. Véron
18
PopulationbreakdownbyreligionisalsohighlydiverseinSouthAsiancountries,asshowninTable6.InBangladeshandPakistan,thevastmajorityofthepopulationisMuslim.In2001,90%ofBangladeshiswereMuslimand,in1998,morethan96%ofPakistanis.ThepopulationofNepalismorethan80%Hindu,whereasBuddhism,thesecondreligioninorderofimportance,nowonlyaccountsfor justover10%ofthetotalpopulation.HinduismisalsothemajorityreligioninIndia(81%).ThereareotherreligionsinIndiabutwiththeexceptionofIslam(13%ofthepopulation),theyareverymuchaminority.TheproportionofChristiansisjustabove2%andthatofSikhsisevenlower,whileBuddhistsaccountforlessthan1%ofthetotalIndianpopulation.
Theothercountriesdonothavedetailedstatisticsontheirreligiouscomposition.AfghanistanisanIslamicRepublicandapproximatelyfourfifths
Table 5. Literacy, standard of living and urbanization in South Asian countries
Literacy rate of women aged 15
or over in the 2000s (%)
Per capita GNI in USD (PPP)
in 2004
Percentage urbanized in 2005
(%)
Afghanistan 13 – 23
Bangladesh 41 1,870 26
Bhutan – 1,969 31
India 48 3,139 29
Maldives 96 – 34
Nepal 35 1,490 16
Pakistan 35 2,225 35
Sri Lanka 89 4,390 15
Sources: UNDP (2006), United Nations (2008).
Table 6. Population breakdown by religion in five South Asian countries (%)
CountryReligion
Hindu Muslim Buddhist Christian Sikh Jain Other(a)
Bangladesh (2001) 9.2 89.6 0.7 0.3 – – 0.2
India (2001) 80.5 13.4 0.8 2.3 1.9 0.4 0.7
Nepal (2001) 80.6 4.2 10.7 0.5 – – 4.0(b)
Pakistan (1998) 1.6 96.3 – 1.6 – – 0.5
Sri Lanka (2001) 7.8 8.5 76.7 7.0 – – –
(a) Other religion or non-specified.(b) Of which 3.6% Kiranti.Sources: Census of India, 2001; Census of Pakistan, 1998; Census of Sri Lanka, 2001; Census of Nepal, 2001.
02_INE_Pop0108_007_090.indd 18 23/06/2008 14:36:17

the deMograPhy of south asia froM the 1950s to the 2000s
19
ofitsinhabitantsareMuslim.InBhutan,MahayanaBuddhism(6)isthestatereligion.ThelawinBhutanguaranteesreligiousfreedom,andHinduismispracticedincertainareasofthecountry.Thisfreedomissomewhattheoretical,however,withthegovernmentpreventingtheestablishmentofnon-Buddhistmissionsinthecountryortheconstructionofnon-Buddhistreligiousbuildings.TheNepaleseconstitutiondescribesthecountryasa“HinduKingdom”butHinduismisnotastatereligionandin2006theHouseofRepresentativesdeclaredNepaltobea“secularstate”.IslamisthestatereligionintheMaldives,whereasinSriLankamorethanthree-quartersofthepopulationontheislandisBuddhist.HeretheMuslim,ChristianandHinducommunitieseachaccountforjust8%ofthetotalpopulation.
Althoughfour-fifthsofthepopulationofIndia isHindu,thereligiouscompositionvariesbetweenstates,andHinduismisnotthemajorityreligioneverywhere.Theproportionisover94%inOrissa,ChhattisgarhandinHimachalPradesh(whereitevenexceeds95%)butHindusonlyrepresent8%ofthepopulation inNagalandand4%inMizoramwhichbothhaveamajorityChristianpopulation.TheproportionofMuslims,whichwasslightlyover13%inthecountryasawholein2001,isunder2%inPunjab,butcloseto25%inKeralaandWestBengal,morethan30%inAssam,67%inJammuandKashmirand95%intheLakshadweepIslands.Thereare fewChristians inIndia;nationallythefigurestandsat2.3%,butthisrisesto19%inKerala,27%inGoa,70%inMeghalayaand90%inNagaland.Sikhs,whorepresentlessthan2%oftheIndianpopulation,constitute16%ofthepopulationinChandigarhand60%inPunjab.InIndialessthan1%ofthepopulationisBuddhist,butinSikkimBuddhistsaccountformorethan28%.
IV. A history strongly marked by population movements
Frequent migration waves in the past
MajorpopulationmovementshaveoccurredinthecourseofSouthAsia’shistory,whichexplainsthediversityofthepopulationsinthevariouscountriesof theregion.Afghanistan, locatedinthemainpathoftheCentralAsianinvasionsofsouthorsouthwestAsia(7),hasaPashtunmajoritybutisalsopeopledbyTajiks,Hazaras,Uzbeks,aswellasbyAimak,TurkmenandBaluch.
(6)MahayanaBuddhism,orthe“GreatVehicle”isaformofBuddhismthatappearedintheearlyChristianeraandreintroducescertainprinciplesBuddhahaddiscarded,suchassalvationthroughdevotionandritual.
(7)AroundthemiddleofthesecondcenturyBC,Indo-AryanpopulationscrossedAfghanistanontheirwaytotheIndusValley.In637AfghanistanwasinvadedbyArabs,thenbyGenghisKhanintheearlythirteenthcenturyandtakenbyTamerlaneinthefourteenthcentury.ForseveralcenturiesitwastheobjectofnumerousdisputesbetweenMongolsandPersians.
02_INE_Pop0108_007_090.indd 19 23/06/2008 14:36:17

J. Véron
20
TheNepalesearetheproductofthreemajormigrations(8)fromIndia,TibetandCentralAsia,whileBangladeshwassettledbyTurks,Arabs,PashtunandPersians.SriLankawasuninhabiteduntilaPrinceofBengalsettledtherearound540BCwithasuiteof700personswhobecametheancestorsoftheSinghalesepeoplefromwhommostcontemporarySriLankansaredescended(CICRED,1974b).
Fromancienttimes,manygreatcivilizationsoccupiedthevastterritorythatwas Indiabefore thepartitionofWestandEastPakistan in1947(9).Populationmovementshaveplayedamajorroleintheriseandfallofcivilizations.InthebeginningofthethirdmillenniumBC,theInduscivilizationflourishedandextendedfromtheIndianPunjabtotheArabianSea.Itderiveditsstrengthfromitsproductiveagriculturebasedontherichalluvialsoilandabundantwatersupplies,whichprovidednumerouscrops includingcotton.TownsdevelopedandtherewerenumerousexchangeswithWesterncivilizations,especiallywithSumerandEgypt.Thiscivilizationdisappearedaround1500BC,probablybecauseoftheAryaninvasionornaturaldisasters(10)(ESCAP,1982).Around500BC,theAryancivilizationdevelopedandspreadeastwardstotheGangesValley.Agriculturealsoflourishedandthepopulationgrew,partlyasaresultofnewwavesofAryanmigrationfromCentralAsia.TheAryanspushedtheDravidians,whooriginallyinhabitedtheIndusValley,furthersouthandtheDravidiancivilizationsubsequentlyflourishedinsouthernIndia.ForalongtimesouthernIndiawasdividedintonumerouskingdomsengagedinincessantwaragainsteachother.
InthenorthofIndia,theMauryaEmpireextendedfromAfghanistantoBengalviathesouthernHimalayas,andreacheditsapogeeunderAshoka(273-232BC).Then, fromtheearlyfourthcenturyAD,theGuptaEmpireextendedfromtheIndustotheBrahmaputraRiverstoincludealargepartoftheIndianpeninsula.Thisregionsubsequentlyenjoyed200yearsofpeaceandpoliticalstabilityuptotheinvasionoftheHunsattheendofthefifthcentury.TheMogulEmpirefollowedfromthesixteenthtoseventeenthcentury,afterwhichthePortuguese,Dutch,BritishandFrenchtradersarrived.TheEastIndiaCompany(11)establishedduringtheMogulperiodgreatlyadvancedBritain’sdominationofIndia.
(8)Australoid peoples came from the south in the fourth century BC, then Mongols speakingaTibeto-Burmanlanguageoccupiedtheeastandthecentreofthecountryafewcenturieslater.ThethirdmigrationinthesecondcenturyBCwastheIndo-AryanpopulationfromthesouthandthewestintothehillsandvalleysofKathmandu(Bista,1977).
(9)EastPakistanbecameBangladeshin1971.
(10)MajorearthquakesmayhaveledtoadryingoftheIndusvalleybecauseofthewatersbeingdivertedtotheGangesRivercatchment.
(11)TheBritishEastIndiaCompanywasatradingcompanythatobtainedthetradingmonopolyoftheIndianOceanfromQueenElisabethI.
02_INE_Pop0108_007_090.indd 20 23/06/2008 14:36:18

the deMograPhy of south asia froM the 1950s to the 2000s
21
The British influence
All thecountriesofSouthAsiahavebeensubjectedtostrongBritishinfluence.InAfghanistan,theBritishfoughttheRussiansforcontrolofthecountryfromtheendofthe1830s.Between1838and1842,thefirstAfghanwarendedwiththedefeatoftheBritisharmy,butinthesecondAfghanwarof1878-1880theBritisharmyconqueredKabulandfreedKandahar.In1919,athirdAfghanwarresultedinthatcountry’sindependence.AfterawarthatwasintendedtocontroltheexpansionistaimsoftheGurkhas,NepalcameunderBritishrulein1815andremainedsountil1923,whenGreatBritainrecognizedNepal’sindependence.TheannexationofAssambytheBritishinthe1820sstirreduptensionsontheBhutaneseborderandconflictsensueduntilatreatywassignedin1910thatmadeBhutanaBritishprotectorate.Fromthemidtwentiethcentury,BhutanwaslargelyunderIndiandominancewhileSriLankawasunderBritishrulefrom1815to1948.ItwastheBritishwhointroducedteaplantationstotheislandthatwasthencalledCeylon.TheMaldiveswereaBritishprotectoratefrom1887to1965.
Indiawasalmostentirelyadministeredby theBritish fromthemidnineteenthcenturyuntil independencein1947(12).TheBritishunifiedthecountry,inparticularbyconstructingarailwaynetwork.Theycarriedoutirrigationwork,setupcommunicationsnetworks,developedtheminingindustry,cultivatedjuteandtea,etc.Togetaclearerpictureofthepopulationonitsterritories,theBritishgovernmentconductedafirstcensus,knownasthe1872census,butwhichinfactstretchedovertheperiod1867-1872.Thefirstdetailed“instant”censuswasconductedin1881.Fromthattimeuntilthepresentday,colonialIndiaandlaterindependentIndiahastakenacensuseverydecade,themostrecentin2001.
Population diversity and political tensions
Thepoliticalhistoryofthisregion,likethediversityofitspopulationsintermsoforiginorreligion,hasgivenrisetonumerousconflicts,someofwhichcontinuetothisday.
TheindependenceofIndiaandthepartitionofEastandWestPakistanin1947,resultedinmajorpopulationmovements,withHindusmigratingfromPakistantoIndiaandMuslimssettlinginPakistan(13).In1971,EastPakistanfoughta“liberationwar”withWestPakistan,accusedofpoliticalandeconomicdominance,resultinginEastPakistan’ssecessionandtheformationofBangladeshinDecemberofthesameyear.TheproblemofKashmirremainsasourceoffrictionbetweenIndiaandPakistan,whohaveclashedthreetimesonthatissue.AnychangingorcrossingofbordersbetweenIndianandPakistani
(12)Upuntilthen,India’shistorywasalsothatofPakistanandBangladesh.
(13)Accordingtofiguresthataresometimesquotedbutwhichhaveyettobeverified,10millionpeopleweredisplacedduringPartition,and500,000diedintheconflict.
02_INE_Pop0108_007_090.indd 21 23/06/2008 14:36:18

J. Véron
22
Kashmiralwaysleadstoconfrontations,particularlysincetheMuslimsonthePakistanisidetendtobeincreasinglyradical.Afghanistanhasalsobeenattheheartofaseriesofconflictsoverthepastthirtyyears,withtheSovietinvasionof1979,thetakeoverbytheTalibanin1996,thetopplingoftheirregimeinthe2001war,andincessantguerrillawarfareeversince.SriLankahasseenviolentconfrontationsbetweenthemajoritySinghalesepopulationandtheTamils.TheMaldivesbecamearepublicin1968,butenduredacoup20yearslaterduringwhichtheMaldiviansobtainedhelpfromtheTamils,themselvesinconflictwiththeSriLankanauthorities.However,withIndianhelp,theMaldivesgovernmentresistedthecoup.Bhutansufferedfromethnicviolencebetween1991-1993andinIndiaviolenceregularlyeruptsbetweenvariouscommunities.TheIndiangovernmenthadtocontainseparatistSikhsinthe1980sandconsiderabletensionshaveexistedbetweenfundamentalistHindusandMuslims fornearly20years.Bangladesh isalsosubject to Islamistviolence.
V. Population and growth since 1950
Sustained population growth
Intheearly1950s,thedemographicgrowthrateintheSouthAsiancountries(AppendixTableA.3)wastwiceashighinsomecountriesasinothers,rangingfrom1.54%inAfghanistanto3.09%inBhutan.Severalcountrieswereatthehigherendofthescale–SriLanka,withannualpopulationgrowthof2.8%,wasnotfarbehindBhutan,andPakistan,thoughgrowingmoreslowly,wasstillabove2%.Duringthefollowingdecades,allthecountriesexceptSriLankawitnessedanaccelerationoftheirdemographicgrowth.TheannualgrowthrateinIndiarosefrom1.73%in1950-1955to2.26%thirtyyearslater,in1980-1985.Duringthesameperiod,thatofBangladeshincreasedfrom1.98%to2.47%andthatofPakistanfrom2.15%to3.63%.Between1980-1985and2000-2005,allthecountries,withtheexceptionofAfghanistan,recordedaslowdowninpopulationgrowth(Figure1).InAfghanistan,overtheperiod1980-1985,thenaturalgrowthratewaslargelypositive,butthewarwiththeSovietUnionpromptedmassivemigrationofrefugeestoPakistanandIranthatledtonegativetotalpopulationgrowth(14).
SriLankahasprovedtobeanexception,withasteadydecreaseinthepopulationgrowthratesincetheearly1950s: from2.8%in1950-1955, itdroppedto2.1%in1970-1975,1.4%in1980-1985,1.1%in1990-1995andfinally0.4%in2000-2005,i.e.adeclinetovirtuallyzeropopulationgrowthinthespaceoffiftyyears(AppendixTableA.3).
India,whichsetupitsfirstfamilyplanningprogrammeintheearly1950shasseenitspopulationgrowthrateslowdownoverthepasttwentyyears,
(14)Figureshavebeenputforwardof2.5to3millionrefugeesinPakistanand1.5millioninIran.
02_INE_Pop0108_007_090.indd 22 23/06/2008 14:36:18

the deMograPhy of south asia froM the 1950s to the 2000s
23
thoughin1990-1995itwasstillabove2%perannum.AlthoughtheIndianauthoritieshavebeentryingtostabilizethepopulationgrowthrateformanyyearsnow,thefigurewasstill1.62%perannumin2000-2005.Duringthesameperiod,thepopulationgrowthratesinPakistanandBangladeshremainedabove1.8%,whichmeansthatifthereisnochange,thepopulationofthesecountrieswilldouble in less than fortyyears.Asa resultof thesehighdemographicgrowthratesoveraperiodofahalfacentury,thepopulationofSouthAsiatripledbetween1950and2005,climbingfrom478millionto1,580millioninhabitants.
Figure 1. Population growth rate in South Asia between 1980-1985 and 2000-2005
Ined 004 08 Growth rate in 2000-2005 (%)
Growth rate in 1980-1985 (%)
– 3 – 1 43 1 – 2 2 0
Bhutan
Sri Lanka
2
1
0
3
4
Pakistan
Maldives India
Nepal Bangladesh
Afghanistan
Source: United Nations (2006a).
South Asia in 2040: a forecast increase of 600 million inhabitants
AccordingtothemediumvariantprojectionsoftheUnitedNations(2006revision),thepopulationintheregionwillcontinuetogrowduringthenextfewdecades,reachingatotal2,200millioninhabitantsin2040,i.e.600millioninhabitantsmorethantoday.Itsshareinthetotalworldpopulationwillincreaseslightly,from23.3%in2005to25.3%in2040.Accordingtothesemeanvariantprojections,inthirtyyearstime,Indiawillhaveapopulationof1,600millioninhabitants,Pakistan268million,Bangladesh239million,Afghanistan66million,Nepal47million,SriLankaabout20million,Bhutan900,000andtheMaldives476,000.Bythen,IndiawillbemorepopulatedthanChina,withitsestimated1,450millioninhabitants.
02_INE_Pop0108_007_090.indd 23 23/06/2008 14:36:19

J. Véron
24
Projections drawn up in India on the basis of the 2001 census andrevisedin2006leadtoaslightlylowerpopulationin2025thanthefigureput forward by the United Nations (1,389 million against 1,447 million),but the difference – nearly 60 million – needs to be put into perspective,as it only corresponds to slightly more than two years of births in India.In 2026, the final year of these projections, it is forecast that India willhave about 1,400 million inhabitants (Table7). The most populated state,UttarPradesh,willhaveapopulationof249millioninhabitants,equivalenttotheentirepopulationofIndiain1911.ThreeotherStateswillhavemorethan100millioninhabitants:Maharashtra(133million),Bihar(114million)andWesternBengal (101million).AndraPradesh,MadhyaPradesh(15) andRajasthan will have 94 million, 88million and 82 million inhabitants in2026.
Table 7. Population of Indian States of more than 20 million inhabitants in 2001 (in thousands) projected to 1 March 2026
State Projected population in 2026 (thousands)
Andhra Pradesh 94,073
Assam 35,602
Western Bengal 100,534
Bihar 113,847
Chhattisgarh 28,591
Gujerat 69,258
Haryana 31,087
Jharkhand 37,356
Karnataka 66,933
Kerala 37,254
Madhya Pradesh 87,729
Maharashtra 133,333
Punjab 31,345
Rajasthan 81,501
Tamil Nadu 71,857
Uttar Pradesh 248,763
India 1,399,838
Source: Office of Registrar General & Census Commissioner (2006). http://www.jsk.gov.in/projection_report_december2006.pdf
(15)Three new States were created after the 1991 census, namely Uttaranchal, Jharkhand andChhattigarh,bydividingupthehighlypopulousIndianstatesofUttarPradesh,BiharandMadhyaPradesh.
02_INE_Pop0108_007_090.indd 24 23/06/2008 14:36:19

the deMograPhy of south asia froM the 1950s to the 2000s
25
VI. Diversified demographic transitions
Acomparisonofdemographictransition“models”overhalfacentury(Figure2)doesnotindicatethatthereisatypeoftransitionspecifictotheregion;neitherdoesitshowanyhighlycontrastedtransitionsbetweenthedifferentcountries.TheonlymodelsthatreallystandoutarethoseofAfghanistanandSriLanka,thefirstbecauseofitshighbirthrateandthesecondbecauseofitssharpfertilitydecline.
AccordingtotheUnitedNationsdata–2006revision(2007a)–themortalityratesvaryconsiderablybetweenthetwomostextremecountries(AppendixTableA.3).Inthefirsthalfofthe1950s,theoverallmortalityratewasnearly37‰inAfghanistan,againstalittlemorethan11‰inSriLanka.Intheothercountriesoftheregion,itvariedfrom23‰to28‰atthebeginningofthe1950s.Ageneraldropinmortalityoccurredandthecrudemortalityratesforallcountriesin2000to2005werebetween6.5‰and8.7‰,withtheexceptionofAfghanistan,withanestimatedrateof21.6‰forthesameperiod.
AfghanistanandSriLankaalsorepresentextremesituationsintermsofbirthrates.TherehasbeenlittlechangeinAfghanistanoverthelastfiftyyears,withagrossestimatedrateof52.1‰in1950-1955and49.7‰in2000-2005.Ontheotherhand,duringthesameperiod,thebirthratecontinuedtofallinSriLankaandwasmorethanhalvedbetween1950-1955and2000-2005,droppingfrom39.9‰to16.3‰.Intheothercountriesintheregion,thebirthrate,stillveryhighatthebeginningofthe1950s(between43‰and49‰),alsodroppedbyhalfinfiftyyears,tobetween22‰and30‰in2000-2005,levelsthatremainwellabovethatofSriLanka.Onlythislastcountry(Figure1)isintheprocessofcompletingitsdemographictransition.
AlthoughIndiaregisteredadownwardtrendinitsbirthrateoverhalfacentury,itisstillfarshortofthetargetfixedbytheIndiangovernmentineachfive-yearplan,whichmeansthatbirthrateandfertilitytargetsarefrequentlyrevised(RajanandVéron,2006).ThefactthatIndiahasayoungpopulationmaintainsbirthratesathighlevels:thisagestructureeffect(thenumberofwomenofchild-bearingageishigh)explainswhytheoveralldropinfertilityonlypartiallyleadstoadecreaseinthebirthrate.Butobservedfertilityisalsohigherthantargetedfertility,duetolimitedaccesstocontraception,particularlyinthepoorestareaswherethepopulationislesseducated.
ThedemographictransitionintheSouthAsiancountriesoverthepasthalfcenturycanalsobeanalysedintermsofthedemographicgrowthratesatthebeginningandendoftheperiod.InAfghanistan,forexample,theannualpopulationgrowthrateincreasedfrom1.54%in1950-1955to2.81%in2000-2005,duetothefairlyregulardecreaseinthedeathrate,whilethebirthrateremainedpracticallyconstant(Figure2A).Ontheotherhand,inBangladesh(Figure2B), thegrowthrateremainedpractically thesame(1.99%at thebeginningand1.95%attheendoftheperiod).Thedownwardtrendinthe
02_INE_Pop0108_007_090.indd 25 23/06/2008 14:36:19

J. Véron
26
Figure 2. The demographic transition in South Asia (changes in birth and death rates)
0
30
40
10
50
20
60 Ined 005 08
Births
Deaths
A. Afghanistan
Rate (‰)
0
30
40
10
50
20
60 Ined 006 08
B. Bangladesh
Rate (‰)
0
30
40
10
50
20
60 Ined 007 08
C. Bhutan
Rate (‰)
0
30
40
10
50
20
60 Ined 008 08
D. India
Rate (‰)
0
30
40
10
50
20
60 Ined 009 08
E. Maldives
Rate (‰)
0
30
40
10
50
20
60 Ined 010 08
F. Nepal
Rate (‰)
0
30
40
10
50
20
60 Ined 011 08
G. Pakistan
Rate (‰)
0
30
40
10
50
20
60 Ined 012 08
H. Sri Lanka
Rate (‰)
1950
-55
1960
-65
1970
-75
1980
-85
1990
-95
2000
-05
1950
-55
1960
-65
1970
-75
1980
-85
1990
-95
2000
-05
r = 1.54%
r = 2.81% r = 1.99%
r = 1.96%
r = 1.46%
r = 1.99% r = 1.73%
r = 1.64%
r = 1.57%
r = 1.79%
r = 2.14%
r = 1.98%
r = 1.58%
r = 2.15%
r = 0.90%
r = 2.85%
Births
Deaths
Births
Deaths
Births
Deaths
Births
Deaths
Births
Deaths
Births
Deaths
Births
Deaths
n = 52.1
m = 36.7
n = 49.7
m = 21.6
n = 48.4
m = 28.5
n = 27.8
m = 8.2
n = 46.7
m = 26.8
n = 22.4
m = 7.8
n = 43.3
m = 26.0
n = 25.1
m = 8.7
n = 45.2
m = 27.3
n = 22.2
m = 6.5
n = 43.9
m = 28.1
n = 30.2
m = 8.7
n = 44.5
m = 23.1
n = 27.5
m = 7.7
n = 39.9
m = 11.4
n = 16.3
m = 7.3
Source: United Nations (2006)
02_INE_Pop0108_007_090.indd 26 23/06/2008 14:36:20

the deMograPhy of south asia froM the 1950s to the 2000s
27
deathandbirthrateswasofthesameorder,althoughthedropinmortalitytookplaceearlier.Thedecreaseinthebirthratewassubsequentlymorerapid,however.InBhutan(Figure2C),thegrowthratein1950-1955,thesameasthatofBangladesh(1.99%)atthebeginningoftheperiod,fellsharplyto1.46%in2000-2005.InBhutan,thebirthratedroppedmorequicklythanthedeathrate.InIndia(Figure2D),thegrowthrateislessthan0.1pointlowerthanitwasfiftyyearsago.Duringthelasthalf-century,infact,thepopulationgrowthofIndiaincreasedsubstantially,reaching2.3%in1980-1985,butthensloweddownconsiderably(decreaseofmorethan0.6points).IntheMaldives(Figure2E),thepopulationgrowthratedropped0.2pointsinthefiftyyearperiod:themortalityratedecreasedregularlywhilethebirthrateremainedhighforalongperiodbeforedroppingdrasticallyoverthelasttwentyyears.InNepal(Figure2F),thepopulationgrowthrateincreasedsharply,from1.58%to2.15%,withthedeathratedroppingmorequicklythanthebirthrate,evenifthelatterhaspickedupoverthelast tenyears.InPakistan(Figure2G),thepopulationgrowthratedroppedslightly, from2.14%atthebeginningofthe1950sto1.98%atthestartof2000.ThetransitionhadalreadybeguninSriLanka(Figure2H)inthe1950s,whichexplainstherapidpopulationgrowthatthattime(2.85%).Thedeathratewasalreadyonthedecline,whilethebirthratewasstillhigh.Today,thetransitionhasbeencompletedandthepopulationgrowthrateinSriLankaisbelow1%.
VII. A continuing tradition of early and intense nuptiality
Femalenuptiality,whichwasparticularlyearlyinIndiaattheendofthenineteenthcentury,withameanageatfirstmarriageofonly13in1886-1891,wasstillearlyinthe1950s,despiteamarkedincreaseinage(16intheperiodfrom1951-1961)(ESCAP,1982).Menmarriedmuchlater,atameanageof20in1886-1891and22.3in1951-1961.InBangladeshandPakistan,femalenuptialitywasstillveryearlyatthebeginningofthe1950s,withameanageatfirstmarriageof14.4years,differingconsiderablyfromthatofmen,whomarriedatameanageof22.4years(ESCAP,1981).Dataconcerningthe1960sinKarachiindicatemuchlaterfemalenuptialityinurbanareas(averageageof19in1962)andlittledifferencebetweensocialgroups(CICRED,1974a).Inthedecadefrom1961to1971,themeanageatfirstmarriageforwomenwasestimatedat17inIndia(16).InSriLanka,itwasalreadymuchhigherinthe1960sthanintheothercountries,withameanageof23in1961(CICRED,1974b).
Thecountrieswhererecentnuptialitydataisavailable(Bangladesh,IndiaandNepal)arecharacterizedbyacontinuingtraditionofveryearlyand
(16)Withlargeregionalvariationssincethedataestablishedperdistrictfor1971showameanageatfirstmarriageforwomenrangingfrom13to23yearsofage(Goyal,1988).
02_INE_Pop0108_007_090.indd 27 23/06/2008 14:36:20

J. Véron
28
practicallyuniversalfemalenuptiality(Tables8a,8band8c).Accordingtothe2004Bangladeshdemographicandhealthsurvey,themedianageofwomenatfirstmarriageisbelow15forthe20-49agegroup.Nuptialityonlyappearstobeslightlylaterinrecentcohorts(womenaged25-29atthetimeofthesurvey)–15yearsofageagainst14–evenifthedataarenotstrictlycomparablebecausefirstmarriageshavenotnecessarilyalltakenplaceinthemostrecentcohorts(iflatermarriagesarenumerous,themedianageatmarriagewillbehigher).InIndia,in2005-2006,themedianageatfirstmarriageforwomenaged20-50atthetimeofthesurveyis17.2,i.e.twoandahalfyearsmorethaninBangladesh.Onceagain,themedianageishigherforthemostrecentcohorts:forwomenaged20-24,itisnearlytwoyearshigherthanthatcalculatedfor
Table 8a. Percentage of married persons by age, and age at first marriage in Bangladesh, 2004
Age group (years)
Women
Percentage of women married for the first time by exact age (years)
Percentage of never-married
women
Median age at first
marriage15 18 20 22 25
15-19 26.7 – – – – 52.1 –
20-24 37.3 68.4 78.6 – – 15.2 16.0
25-29 50.5 79.7 87.6 91.3 94.4 4.2 15.0
30-34 54.2 83.7 90.5 94.1 97.1 1.2 14.7
35-39 58.7 84.6 93.5 96.3 97.8 0.4 14.5
40-44 61.6 88.7 95.0 97.2 98.3 0.3 14.2
45-49 71.4 91.7 95.8 97.5 99.0 0.0 13.9
20-49 52.4 80.5 88.4 – – 5.0 14.8
Age group (years)
Men
Percentage of men married for the first time by exact age (years)
Percentage of never-married
men
Median age at first
marriage15 18 20 22 25
15-19 0.2 – – – – 96.6 –
20-24 0.4 4.4 15.3 – – 65.6 –
25-29 1.1 5.3 14.9 30.1 54.0 29.4 24.4
30-34 0.4 5.7 15.9 28.7 52.8 9.5 24.6
35-39 0.3 6.9 14.9 28.1 48.5 4.0 25.1
40-44 0.5 5.1 13.1 29.3 49.7 0.2 25.0
45-49 0.2 5.8 18.0 32.8 56.6 0.3 23.7
50-54 0.8 10.3 29.2 47.6 64.8 0.0 22.3
25-54 0.5 6.1 16.5 31.3 53.5 8.8 24.5
Source: DHS 2004.
02_INE_Pop0108_007_090.indd 28 23/06/2008 14:36:20

the deMograPhy of south asia froM the 1950s to the 2000s
29
womenaged45-49.InNepal,themedianageatfirstmarriagewasalso17in2006.InSriLanka,ontheotherhand,thenuptialitymodelisradicallydifferent,andwomenmarryatamuchlatermeanage–22.9years–in2003.Infact,thisfigurehadalreadybeenreachedatthebeginningofthe1960s,andsincethen,themeanageatfirstmarriageforwomenhasfluctuatedaround23years(CICRED,1974b).
Anotherwayofappreciatingtheprevalenceofearlymarriageistoconsidertheproportionofwomenalreadymarriedataspecificage:15,18,20,etc.(Tables8a,8band8c).InBangladesh,halfofallwomenaged25-29in2004werealreadymarriedat15,againstonequarterofIndianwomenand13%ofNepalesewomenin thesameagegroup.Thesesurveysconductedat the
Table 8b. Percentage of persons married by age, and age at first marriage in India, 2005-2006
Age group(years)
Women
Percentage of women married for the first time per exact age (years)
Percentage of never-married
women
Median age at first
marriage15 18 20 21 25
15-19 11.9 – – – – 69.6 –
20-24 18.2 47.4 64.4 – – 24.3 18.3
25-29 25.4 55.4 72.4 78.6 91.3 5.8 17.4
30-34 28.5 61.2 76.5 82.0 93.2 1.8 16.8
35-39 31.0 63.4 79.1 84.3 83.8 1.1 16.6
40-44 32.4 64.6 79.8 85.5 94.6 0.8 16.5
45-49 32.9 64.2 79.1 85.1 94.5 0.6 16.5
20-49 26.9 57.9 74.0 – – 7.4 17.2
Age group (years)
Men
Percentage of men married for the first time by exact age (years)
Percentage of never-married
men
Median age at first
marriage15 18 20 21 25
15-19 1.3 – – – – 95.4 –
20-24 2.8 9.5 18.8 – – 66.1 –
25-29 4.1 13.3 25.6 32.3 58.5 29.4 23.7
30-34 6.3 18.1 31.0 38.8 63.6 8.7 22.7
35-39 6.2 18.5 31.9 41.0 66.3 3.0 22.3
40-44 8.0 19.9 34.7 43.6 68.2 1.9 22.0
45-49 6.6 18.5 31.9 41.3 67.1 1.1 22.4
50-54 7.1 17.9 31.7 39.9 65.3 1.6 22.5
20-49 5.4 15.7 28.2 – – 22.0 23.4
Source: NFHS, 2005-2006.
02_INE_Pop0108_007_090.indd 29 23/06/2008 14:36:20

J. Véron
30
beginningoftheyear2000showthat80%ofwomenaged25-29werealreadymarriedat18inBangladesh,60%inNepaland55%inIndia.Thegeneraltrendistowardsfemalemarriageatalaterage,withthepercentageofwomenmarriedat15,18,20,etc.decreasingfromonecohorttothenext.Formen,thedecreaseisnotasgeneralized,butacertainincreaseintheageofmalemarriagehasbeenobservedinIndiaandNepal.
Traditionally,menmarrylaterthanwomen,InBangladeshin2004,79%ofwomenaged20-24werealreadymarriedat20versusonly15%ofmenofthesameage;30%ofmenaged25-29weremarriedatage22whilethepercentageofwomenwasabove90%.The2006surveyinNepalshowsthatthedifferenceinmarriagebehaviourbetweenmenandwomenislessmarked:87%ofwomenaged25-29and56%ofmenwerealreadymarriedatage22.Thenuptiality
Table 8c. Percentage of persons married by age, and age at first marriage in Nepal, 2006
Age group (years)
Women
Percentage of women married for the first time by exact age (years)
Percentage of never-married
women
Median age at first
marriage15 18 20 22 25
15-19 5.5 – – – – 67.7 –
20-24 10.2 51.4 70.9 – – 17.9 17.9
25-29 13.3 60.2 77.3 87.3 93.6 4.4 17.3
30-34 15.3 59.9 79.0 88.4 94.0 1.6 17.3
35-39 15.4 65.0 81.3 90.2 96.4 1.4 16.9
40-44 19.7 65.0 81.9 90.7 94.9 1.3 16.8
45-49 24.7 69.4 84.7 91.9 95.6 1.2 16.5
20-49 15.3 60.4 78.1 – – 6.0 17.2
Age group(years)
Men
Percentage of men married for the first time by exact age
Percentage of never-married
men
Median age at first
marriage15 18 20 22 25
15-19 0.7 – – – – 89.5 –
20-24 1.8 15.5 32.9 – – 44.1 –
25-29 4.5 24.5 41.3 56.2 76.7 14.0 21.0
30-34 4.2 26.9 48.2 63.8 80.9 1.1 20.2
35-39 4.1 29.1 50.5 67.2 83.1 0.2 19.9
40-44 2.2 23.8 52.2 70.9 87.3 0.7 19.8
45-49 4.8 29.3 49.6 68.6 81.0 1.0 20.0
20-49 3.5 24.2 44.8 60.9 76.0 12.5 20.6
Source: DHS, 2006.
02_INE_Pop0108_007_090.indd 30 23/06/2008 14:36:21

the deMograPhy of south asia froM the 1950s to the 2000s
31
modelinIndiaissimilartothatinBangladesh,withmenmarryingmuchlaterthanwomen,althoughthenumberofmenalreadymarriedatage20ishigherinIndia(26%)thaninBangladesh(15%).RegionaldataonageatfirstmarriageshowabroaddiversityinnuptialitybehaviourinIndia(NFHS,2005-2006).WhileacrossIndia,46%ofwomenaged18-29werealreadymarriedatage18,thefigurewasmuchlowerinGoa(12%)andashighas64%inBihar.Thedifferencesarealsolargeformen:27%ofIndianmenaged21-29werealreadymarriedat21,witharangeextendingfromonly2%inKeralatomorethan49%inRajasthan.
InBangladesh,IndiaandNepal,femalecelibacyremainsextremelyrare:thehighestproportionofwomenaged45-49whohavenevermarriedisobservedinNepalwhereitstandsatjust1.2%.Celibacyalsoremainsexceptionalamongmen:theproportionofsinglemenaged45-49isinthesameorderofmagnitudeasthatofwomen.Thesefiguresapplytotheoldergenerations:anincreaseintheageofmarriagemaybeaccompaniedbyanincreaseinpermanentcelibacyamongthemostrecentcohorts.
VIII. An ongoing fertility transition
The mean number of children per woman varies by a factor of two
FertilityinallthecountriesofSouthAsiawasstillhighintheearly1950s,ranging from5.7childrenperwomaninSriLankato7.7inAfghanistan(AppendixTableA.5).Atthattime,fertilityrateswerecomparableinIndiaandNepal(5.9and6.1childrenperwoman),substantiallyhigherinPakistan,BangladeshandBhutan(6.6-6.7childrenperwoman),andevenhigherintheMaldives(7childrenperwoman)thoughstillbelowthelevelforAfghanistan(7.7).
Between1950-1955and2000-2005,fertilitydeclinedsharplyinallcountriesof theregion,except inAfghanistanwhere,accordingtoUnitedNationsestimates,itcontinuedtofluctuatebetween7.5and8childrenperwoman.Overthisfifty-yearperiod,themeannumberofchildrenperwomanfellbyaround40%inNepalandPakistan,by47%inIndia,byover50%inBangladeshandBhutan,by60%intheMaldivesandby65%inSriLanka.WomeninSriLankahadslightlyover2childrenonaveragein2000-2005andthefertilitytransitionthereiscomplete,whereasinAfghanistanithasyettostart.Intheothercountriesthefertilitytransitionisunderway,thoughtheprocessismoreorlessadvanceddependingonthecountry:today,themeannumberofchildrenperwomanis2.8intheMaldivesand2.9inBhutan,3.1inIndiaand3.2inBangladesh,3.7inNepaland4.0inPakistan.Afghanistanisverymuchtheexception(Figure3).
Inmostofthecountries,womenstillbegintheirreproductivelifeveryearly,afactrelatedtoearlymarriageandthenotableabsenceofout-of-wedlock
02_INE_Pop0108_007_090.indd 31 23/06/2008 14:36:21

J. Véron
32
births(Table9).In2004,medianageatfirstchildbirthinBangladeshwasbelow18,bywhichagenearly33%ofadolescentshavealreadystartedchildbearing.InIndia,onthebasisof theNFHS-3survey(2005-2006),medianageatfirstchildbirthis20.Theproportionofwomenaged15-19whohaveevergivenbirthrisesrapidlywithage:1.3%at15years,4.1%at16,8.6%at17,17.9%at18and29.7%at19(17). InSriLanka,however,childbearingbeginsmuchlaterandthisisnotarecentphenomenon:in1987,meanageatfirstchildbirthwasalready24years,andin2000itwas23years.
Table 9. Median age at first birth (women aged 20-49) and proportion of adolescents (women aged 15-19) who have started childbearing
Median age at first birth (in years) Proportion of adolescents who
have started childbearing (in %)25-29 40-49
Afghanistan – – –
Bangladesh (2004) 17.7 16.9 32.7
Bhutan – – –
India (2005-2006) 19.9 20.2 12.1
Maldives – – –
Nepal (2006) 19.6 20.1 21.4
Pakistan (1990-1991)* 21.0 22.6 15.7
Sri Lanka (2000) 23.2** –
* The most recent DHS survey for Pakistan dates from 2006 but the results are not yet available.** Mean age at first birth.Sources: DHS and NFHS-3 surveys.
Thepatternsofage-specificfertilityin2000-2005thatemergefromthe UnitedNationsdatarevealtheprogressofthefertilitytransitionineachcountryoftheregion(Table10andFigure4).Thetransitionhasnotyetbegunin
(17)Asever,theuseofregionaldatahighlightsthediversityofIndia:theproportionofwomenaged15-19whohavehadalivebirthis12.1%forIndiaasawhole;itisonly2.1%inHimachalPradeshandcloseto21%inJharkhand.
Figure 3. Total fertility rates from 1960-1965 to 2000-2005
Ined 013 08 8
0
2
6
4
TFR 2000-2005
8 0 2 6 4 TFR 1960-1965
Sri Lanka
Afghanistan
Pakistan Nepal
India Bangladesh
Maldives Bhutan
Source: United Nations (2007a).
02_INE_Pop0108_007_090.indd 32 23/06/2008 14:36:21

the deMograPhy of south asia froM the 1950s to the 2000s
33
Afghanistan,iscompleteinSriLanka,andisunderwayintheothercountriesofSouthAsia.Thetrendin age-specificfertilityfollowsasimilarcourseintheMaldives,India,Bangladesh,BhutanandNepal,althoughtheratesateachagemaydiffer.Pakistandiffersfromtheothercountriesinhavingasubstantiallyhigherleveloffertilityfromthe25-29agegrouponwards,reflectinglowerlevelsofcontraceptivepractice.
Betweenacountryattheendofthedemographictransition,likeSriLanka,andonestillengagedinit,likeIndia,thetrendsinage-specificfertilitypresent
Table 10. Age-specific fertility rates in 2000-2005 in the countries of South Asia (‰)
CountryAge
15-19Age
20-24Age
25-29Age
30-34Age
35-39Age
40-44Age
45-49
Afghanistan 131.9 356.9 378.3 276.9 195.8 101.3 54.7
Bangladesh 149.2 195.0 147.7 90.4 44.1 16.1 2.2
Bhutan 50.9 163.0 157.2 98.8 63.9 37.1 10.6
India 68.9 228.8 177.5 89.5 40.1 12.9 4.9
Maldives 26.2 146.2 162.6 123.7 75.2 22.7 4.8
Nepal 122.2 231.2 184.0 114.4 63.0 17.2 4.4
Pakistan 22.0 166.3 233.1 193.0 112.0 52.1 20.4
Sri Lanka 28.3 70.2 109.4 100.3 71.7 22.0 2.1
Source: United Nations, 2007a.
Figure 4. Age-specific fertility rates in 2000-2005 in the countries of South Asia
Ined 014 08Age-specific fertility rates (‰)
Age group15-19 25-29 45-4935-3920-24 40-4430-34
150
50
0
250
200
100
300
350
400
Afghanistan
BhutanBangladesh
India
NepalMaldives
Sri LankaPakistan
Source: United Nations (2007a).
02_INE_Pop0108_007_090.indd 33 23/06/2008 14:36:22

J. Véron
34
sharpcontrasts(Tables11aand11b;Figures5aand5b).InSriLanka,afertilitydeclineatallagesbetween1963and2000wasexplainedbyahighlevelofcontraceptivepractice(70%contraceptiveprevalencein2000),whilerelativelylowfertilityratesatyoungeragesareduetolatemarriage:thefertilityrateisbelow30perthousandatages15-19andslightlyabove80perthousandatages20-24.ThemainfeatureofthefertilitytrendinIndiaisadeclineafterage25.Theage-specificfertilityratestillstandsat90perthousandatages15-19in2005-2006andexceeds200perthousandatages20-24.Theage-specificfertilitycurveforIndia ischaracteristicofapopulationinwhichcontraceptivepracticeiswellestablishedbutwherelaterentryintochildbearing,resultingfromincreasedageatmarriageanduseofcontraceptionintheearlyyearsofunion,isnotyetwidespread.Wewillreturntothispointbelow.ThefertilityrateinBangladeshisevenhigherthaninIndiaatages15-19(135perthousandin2004)butslightlyloweratages20-24(192versus209perthousand)andsimilaratages25-29.InNepal,thefertilityratein2006islowerthaninBangladeshatages15-19(closeto100perthousand)butsubstantiallyhigher,however,atages20-24(234perthousand).Atages25-29,fertilityistenpointshigherthaninIndiaandBangladesh.
Table 11a. Age-specific fertility rates in Sri Lanka between 1963 and 2000 (‰)
Age groups 1963 1975 1987 1993 2000
15-19 52 31 38 35 27
20-24 228 146 147 110 83
25-29 278 161 161 134 118
30-34 240 158 122 104 98
35-39 157 126 71 54 40
40-44 46 43 23 14 8
45-49 7 6 3 4 1
Sources: World Fertility Survey for 1975; DHS surveys for 1987, 1993 and 2000.
Table 11b. Age-specific fertility rates in India between 1970-1972 and 2005-2006 (‰)
Age groups 1970-1972 1980-1982 1992-1993 1998-1999 2005-2006
15-19 103 89 116 107 90
20-24 254 246 231 210 209
25-29 259 231 170 143 139
30-34 203 165 97 69 62
35-39 134 100 44 28 25
40-44 63 46 15 8 7
45-49 27 21 5 3 3
Sources: SRS for 1970-1972 and 1980-1982; NFHS for 1992-1993, 1998-1999 and 2005-2006.
02_INE_Pop0108_007_090.indd 34 23/06/2008 14:36:22

the deMograPhy of south asia froM the 1950s to the 2000s
35
Thesurveysconductedsince2000revealfertilitydifferencesthatvarybyplaceofresidence,butmostmarkedlybywomen’seducationallevel(Table12).Whiletheurban-ruralfertilitydifferencesarenon-negligible:0.7childrenperwomaninBangladeshin2004,0.9inIndiain2005-2006and1.2inNepalin
Figure 5a. Age-specific fertility rates in Sri Lanka, 1963-2000 (‰)
Ined 015 08Rate (‰)
Age group
15-19 25-29 45-4935-3920-24 40-4430-34
150
50
0
250
200
100
300
1963
19871975
19932000
Sources: 1963 census; World Fertility Survey 1975; DHS surveys 1987, 1993 and 2000.
Figure 5b. Age-specific fertility rates in India between 1970-1972 and 2005-2006
Ined 016 08Rate (‰)
Age group
15-19 25-29 45-4935-3920-24 40-4430-34
150
50
0
250
200
100
300
SRS 1970-1972
NFHS 1992-1993SRS 1980-1982
NFHS 1998-1998NFHS 2005-2006
Sources: Véron, 1997, and NFHS, 2005-2006.
02_INE_Pop0108_007_090.indd 35 23/06/2008 14:36:23

J. Véron
36
2006,thedifferencesbywomen’seducationallevelareverywideeverywhere.InBangladesh,womenwithnoeducationhaveonaverage3.6childrenversusonly2.2forthemosteducatedwomen.InIndia,womenwithnoeducationhaveidenticalfertilitytocomparablewomeninBangladeshwhereashighlyeducatedwomen–with12yearsormoreofeducation–currentlyhaveonly1.8children.InNepalin2006,thereisadifferenceoftwochildrenbetweenwomenofthelowestandhighesteducationallevels.Inthisregionasintherestoftheworld,educationisakeyvariableinthefertilitytransition.
Thechangesinnetreproductionrates(18)summarizethechangesinmortalityandfertility.Withanetreproductionrateof0.96daughtersperwomanin2000-2005(TableA.5),itappearsthatthepopulationofSriLankaisnotquitereplacingitself.Overthesameperiod,thenetreproductionrateforAfghanistanremainedhigh,ataround2.3.Fortheothercountries,thenetreproductionrateisbetween1.2(MaldivesandBhutan)and1.7(Pakistan).
(18)Thenetreproductionrateofabirthcohortistheratioofthenumberofdaughtersborntothewomenofthiscohorttothenumberofthesewomenatbirth.Theperiodnetreproductionrateistheequivalentmeasurecalculatedusingcross-sectionaldata.Anetreproductionrateofonemeansthatthecohortexactlyreplacesitself(itssizeisconstant).
Table 12. Total fertility rate by women’s place of residence and educational level
Place of residence
Educational level
Urban Rural IlliterateIncomplete
primary
Completed primary or
intermediate level
Completed secondary or higher
At least 10 years of education
Bangladesh
1999-2000 2.45 3.54 4.12 3.30 3.42 2.40 – –
2004 2.50 3.20 3.60 3.30 2.90 2.20 – –
India
1993 2.70 3.67 4.03 3.01 2.49 2.15 – –
1998-1999 2.27 3.07 3.47 2.64 2.26 1.99 – –
2005-2006 2.06 2.98 3.55 2.45* 2.51** 2.23*** 2.08**** 1.8*****
Nepal
1996 2.85 4.83 5.08 – 3.78 2.51 – –
2006 2.10 3.30 3.90 2.80 2.30 1.80 – –
Pakistan
1990-1991 4.90 5.60 5.70 4.90 4.50 3.60 – –
* less than 5 years of education, ** 5-7 years of education, ***8-9 years of education, ****10-11 years of education, *****12 years or more of education.Sources: DHS and NFHS surveys.
02_INE_Pop0108_007_090.indd 36 23/06/2008 14:36:23

the deMograPhy of south asia froM the 1950s to the 2000s
37
Fertility is linked to social and health development
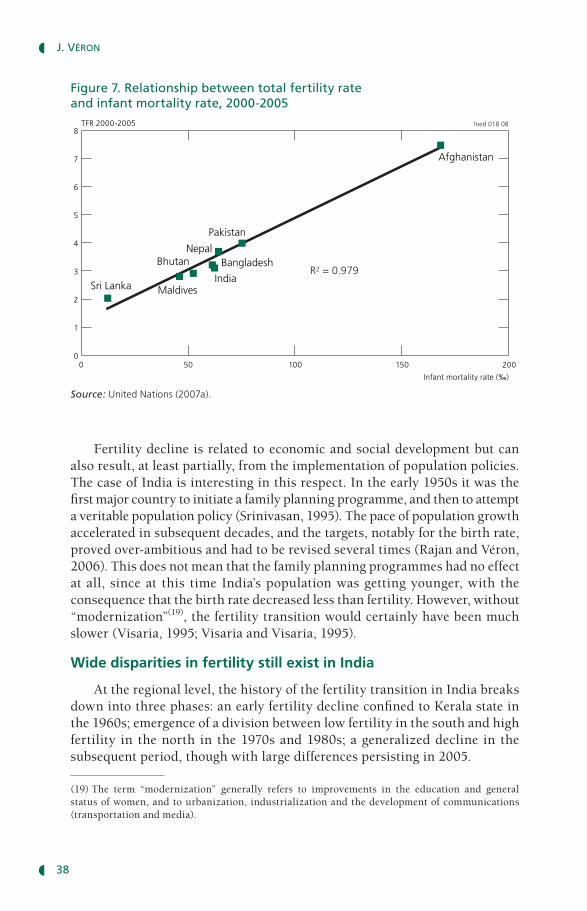
Theinverserelationshipbetweenfertilityanddevelopmentisgenerallyconfirmedbyacountry-by-countrycomparisonoftotalfertilityratesfortheperiod2000-2005withthehumandevelopmentindexfor2004.Thecountrieswherefertilityishighesttendtobethoseforwhichthedevelopmentindicatorsarelowest(Figure6).Forexample,fertilityinNepalandPakistanismuchhigherthaninSriLanka,whilethehumandevelopmentindexismuchlower.However,thisrelationshipisnotverystrong:thedevelopmentindicatorsforBhutanandPakistanarevirtuallyidenticalwhereasthefertilitydifferencebetweenthetwocountriesisofonechildperwoman;fertilityinBhutanispracticallythesameasintheMaldives(2.91and2.81childrenperwomanin2000-2005, respectively),while thehumandevelopment indexshowsasubstantialdifference(0.54inBhutan,0.74intheMaldives).ThecoefficientofdeterminationR2forthisrelationshipisslightlyabove0.6.
Thecorrelation–positivethistime–betweenfertilityandinfantmortalityisalsoobservedover theperiod2000-2005.InSriLanka, lowfertility iscombinedwithlowinfantmortality,whileinAfghanistanfertilityandinfantmortalityarebothhigh(Figure7).Thecoefficientofdeterminationiscloseto0.98, indicatingaparticularlystrongcorrelation.Thispositivecorrelationbetweenfertilityandinfantmortalityisobservedinallworldregions(TabutinandSchoumaker,2004;TabutinandSchoumaker,2005;Guzmanetal.,2006).
Figure 6. Relationship between total fertility rate in 2000-2005 and human development index in 2004
Ined 017 08TFR 2000-2005
HDI 2004
0.40 0.60 0.800.700.50 0.550.45 0.750.65
3.0
2.0
1.5
4.0
3.5
2.5
4.5
R2 = 0.6112
Sri Lanka
Pakistan
Nepal
IndiaBangladesh
MaldivesBhutan
Sources: United Nations (2007a) and UNDP (2006).
02_INE_Pop0108_007_090.indd 37 23/06/2008 14:36:24
J. Véron
38
Fertilitydeclineisrelatedtoeconomicandsocialdevelopmentbutcanalsoresult,atleastpartially,fromtheimplementationofpopulationpolicies.ThecaseofIndiaisinterestinginthisrespect.Intheearly1950sitwasthefirstmajorcountrytoinitiateafamilyplanningprogramme,andthentoattemptaveritablepopulationpolicy(Srinivasan,1995).Thepaceofpopulationgrowthacceleratedinsubsequentdecades,andthetargets,notablyforthebirthrate,provedover-ambitiousandhadtoberevisedseveraltimes(RajanandVéron,2006).Thisdoesnotmeanthatthefamilyplanningprogrammeshadnoeffectatall,sinceat this timeIndia’spopulationwasgettingyounger,withtheconsequencethatthebirthratedecreasedlessthanfertility.However,without“modernization”(19),thefertilitytransitionwouldcertainlyhavebeenmuchslower(Visaria,1995;VisariaandVisaria,1995).
Wide disparities in fertility still exist in India
Attheregionallevel,thehistoryofthefertilitytransitioninIndiabreaksdownintothreephases:anearlyfertilitydeclineconfinedtoKeralastateinthe1960s;emergenceofadivisionbetweenlowfertilityinthesouthandhighfertility inthenorthinthe1970sand1980s;ageneralizeddeclineinthesubsequentperiod,thoughwithlargedifferencespersistingin2005.
(19)The term “modernization” generally refers to improvements in the education and generalstatusofwomen,andtourbanization,industrializationandthedevelopmentofcommunications(transportationandmedia).
Figure 7. Relationship between total fertility rate and infant mortality rate, 2000-2005
Ined 018 08TFR 2000-2005
Infant mortality rate (‰)
0 200100 15050
5
2
0
7
6
4
1
3
8
R2 = 0.979
Sri Lanka
Pakistan
Nepal
India
Bangladesh
Maldives
Bhutan
Afghanistan
Source: United Nations (2007a).
02_INE_Pop0108_007_090.indd 38 23/06/2008 14:36:25

the deMograPhy of south asia froM the 1950s to the 2000s
39
Inthe1950s,fertilityinIndiaasawholestillstoodat6.3childrenperwoman(20),butitwasalreadyslightlylower–5.6children–inthesouthernIndianstateofKerala(Table13).Keralaisthestatewherefertilitydeclinedearliest.Thetotalfertilityratefellthereto5intheperiod1961-1971,whileforIndiaasawholeitheldsteadyat6childrenperwoman.Thegapwidenedinthefollowingyears.AccordingtotheNFHS-2,fertilityinKeralawasbelow2childrenperwomanintheperiod1996-1998.Indeed,for1994theSampleRegistrationSystemgaveavalueforfertilityhalfthatofthenationalvalue:1.7versus3.5.Themostrecentsurvey(NFHS-3)findsadifferenceof0.75childrenperwomanbetweenKeralaandIndiaasawhole.ManystudieshaveattemptedtoexplainthereasonsforthesingularcourseoffertilitychangeinKerala(ZachariahandPatel,1984;MariBhatandRajan,1997).ThehigheducationallevelofwomenandthepoliticalspecificityofKerala–astatethatbecamecommunistin1957withtheaimofreducingsocioeconomicinequalitiesandimprovingthehealthofthepopulation–haveoftenbeeninvokedtoaccountforthisearlierdemographictransition.Inreality,changewasofanextremelygeneralnature(RajanandVéron,2006).Improvementswereindeedmadeintheeducationofwomen,butbothageatmarriage(21)andcontraceptiveprevalencealsoincreasedconsiderably.Programmeswerealsosetuptopromotematernalandchildhealth,and in1985thegovernment launchedaprogrammeofuniversalvaccination,oneresultofwhichwastomakethepopulationmorefamiliarwiththehealthservices.Thisprogrammeseemstohavebeenasimportantasspecificfamilyplanninginitiativesinmakingcouplesgivemore
(20)Periodfertilityisestimatedat5.8childrenperwomanfortheyears1881-1891;itthenfluctuatesaroundthisvaluebeforeexceeding6childrenperwomanintheearly1950s(MariBhat,1989).
(21)ForZachariah,30%ofthefertilitydeclineintheperiod1968-1978resultedfromtheincreaseinageatmarriage(Zachariah,1997).
Table 13. Fertility changes in Kerala and in India (number of children per woman)
Year Kerala India
Censuses1951-19611961-19711971-1981
5.605.003.40
6.306.005.20
SRS1981-19851994
2.601.70
4.503.50
NFHS1990-19921996-19982005-2006
2.001.961.93
3.392.852.68
Sources: Mari Bhat and Rajan (1997), SRS, NFHS, NFHS-2 and NFHS-3.
02_INE_Pop0108_007_090.indd 39 23/06/2008 14:36:25

J. Véron
40
thoughttothe“quality”ofchildren,knowntobeafactorinfertilityreduction(Zachariahetal.,1994).ThestateofKeraladidnothaveaparticularlyadvancedlevelofeconomicdevelopment,norwasithighlyurbanized.Itoffersanexampleofatransitionlinkednottoeconomicdevelopmentorurbanizationbuttochangesinthesocialsphere,andinthissenseitdidnotfollowthestandardpatternoftransition.Thereafter,Kerala’sdemographicsingularitygavewaytoanorth-southdivisionofIndia.
ThefertilitytransitioninIndiaduringthe1990swascharacterizedbylargefertilitydifferencesbetweenthecountry’snorthernandsouthernstates(22)(NairandVéron,2002).Atthattime,fertilityinthesouthernstates–Kerala,TamilNadu,KarnatakaandAndhraPradesh–was2childrenperwoman,whereaswomeninthenorthernstates–UttarPradesh,Bihar,MadhyaPradeshandRajasthan–werestillproducing3-4childrenonaverage(Table14).Nosinglefactorcanaccountforthesecontrastsinfertility(Véron,2000).Levelsofinfantmortalityandfertilityarecertainlybothlowerinthesouthernstates,butthechangingrelationshipovertimebetweenthesetwoindicatorsvariesfromstate tostate,as thecovariation inthese indicatorsover theperiod1981-1994shows.OnFigure8,eachdotrepresentsacombinationoffertilityandinfantmortalityatagivenpointintime,andeachbrokenlineplotsthecovariationinfertilityandinfantmortalityinonestatebetween1981and1994.Overthisperiod,thecombinedfertilityandinfantmortalityvaluesareconsistentlylowerinthefoursouthernstatesthaninthenorthernstates,and
(22)The contrast between north and south is widely used, but a more precise classification ofIndianstatesdistinguishesthestatesofthenorth-east,thecentre,thenorth,etc.Referencehereistothestandarddistinction.
Table 14. Total fertility rate in the northern and southern states of India in the 1990s (number of children per woman)
Region and state 1980-1982 1990-1992 1996-1998
Northern states
Uttar Pradesh 5.8 4.82 3.99
Bihar 5.7 4.00 3.49
Madhya Pradesh 5.2 3.91 3.31
Rajasthan 5.4 3.63 3.78
Southern states
Andhra Pradesh 3.9 2.59 2.25
Karnataka 3.6 2.85 2.13
Tamil Nadu 3.4 2.48 2.19
Kerala 2.9 2.00 1.96
India 4.5 3.39 2.85
Sources: Visaria (2004), NFHS and NFHS-2.
02_INE_Pop0108_007_090.indd 40 23/06/2008 14:36:25

the deMograPhy of south asia froM the 1950s to the 2000s
41
thetwodistinctgroupsareidentifiedclearlyinFigure8.Thusthebrokenlinefurthest tothe leftonFigure8representsthiscovariationof fertilityandinfantmortalityinKeralabetween1981and1994.Itisseenthatinsomeyearsfertilityhasfallensubstantiallywithoutanyclearreductionininfantmortality.Generallyspeaking,atstatelevel,nocloserelationshipbetweenfertilityandinfantmortality isobserved.Variation inoneof these indicatorsmaybeaccompaniedbynoclearchange,orevenbyanincreaseintheother,thusproducingasomewhaterratictrajectoryovertime.Theothervariablesusuallyconsideredhaveequallylimitedexplanatorypower.ThoughthestatesinthenorthofIndiaare lessurbanizedthanthose inthesouth,andfertility isinvariablylowerinurbanthaninruralareas,thedegreeofurbanizationdoesnotexplainthefertilitylevel inastate:Biharis lessurbanizedthanUttarPradesh,yetfertilitywaslowerthereintheearly1990s,andKerala,thoughlessurbanizedthanTamilNadu,alsohadlowerfertility(Table15).Thescaleoffertilitydifferencesbetweenurbanandruralareasvarieswidelywithinstates.Ruralfertilityexceedsurbanfertilityby8%inTamilNaduwhilethedifferenceis45%inUttarPradesh.Arelationshipalsoexistsbetweenfemalelevelofeducationandfertility:moreeducatedwomenhavefewerchildren.Onitsown,however,theeducationallevelofmothersdoesnotexplainthefertilitydifferences:in1991-1992,fertilityamongilliteratewomenranged,foranationalaverageof4children,from2.31inKeralato5.36inUttarPradesh.Fertilityalsoriseswiththeproportionofpeoplelivingbelowthepovertyline.However,comparableproportionslivingbelowthepovertyline(43%inMadhya
Figure 8. Covariation in infant mortality and fertility in the northern and southern states of India, 1981-1994
Ined 019 08Mean number of children per woman
Infant mortality rate (‰)
0 180120 16080 100 14040 6020
5
2
0
6
4
1
3
7
Northern states
Southern states
Source: Véron and Naïr, 2000.
02_INE_Pop0108_007_090.indd 41 23/06/2008 14:36:26

J. Véron
42
Pradeshand45%inTamilNadu)canbeassociatedwithverydifferentfertilitylevels(3.9and2.5childrenperwoman,respectively).Equally,thedifferencesinfertilitybetweenstatesarenotexplainedbythereligiouscompositionofthepopulation,eventhoughatthenationallevelthenumberofchildrenperwomandoesvarybyreligion(withadifferenceofoneadditionalchildforMuslimsrelativetoHindusin1990-1992).InTamilNadu,MuslimandHinduwomenproducethesamenumberofchildren,whereasthefertilityofHindusin1990-1992rangedfrom1.7childrenperwomaninKeralato4.7inUttarPradesh(23).
ThemostrecentdataforIndia,takenfromNFHS-3,showpersistentlystrongspatialdisparitiesinfertility,rangingfrom1.79childrenperwomaninGoaandAndhraPradeshto4inBihar(Table16).Replacingthenorth-southdivisionofIndiabyafinergeographicalsubdivision–thatsplitsthecountryintonorth,centre,east,north-east,westandsouth–doesnotcauseanyhomogeneousregionstoappearalthoughthepreviousdemarcation linesdisappear.Thus,underthepartitioningforNFHS-3,whatistermedthenorthregioncontainsHimachalPradeshwherefertilitywas1.94childrenperwomanandRajasthanwhereitwas3.21childrenperwoman.Inthenorth-eastregion,fertilityrangesfrom2.02inSikkimto3.80inMeghalaya.Thesouthernstates,however,remainrelativelyhomogeneousintermsoffertility,whichiseverywhereatsub-replacementlevel.
(23)SeeGandotraetal.,1998foradetailedanalysisoftheseregionaldifferences.
Table 15. Urbanization and fertility in India in the early 1990s
Region and state
Percentage urban
Total fertility rate (number of children per woman)
Ratio of rural fertility to
urban fertility*Urban areas Rural areas
Northern States
Uttar Pradesh 19.9 3.58 5.19 145
Bihar 13.2 3.25 4.15 128
Madhya Pradesh 23.2 3.27 4.11 126
Rajasthan 22.9 2.77 3.87 140
Southern States
Andhra Pradesh 26.8 2.35 2.67 114
Karnataka 30.9 2.39 3.09 129
Tamil Nadu 34.2 2.36 2.54 108
Kerala 26.4 1.78 2.09 117
India 25.7 2.70 3.67 136
* Ratio of mean number of children per woman in rural areas to mean number of children per woman in urban areas (as a percentage).Sources: census of 1991; NFHS 1992-1993.
02_INE_Pop0108_007_090.indd 42 23/06/2008 14:36:26
the deMograPhy of south asia froM the 1950s to the 2000s
43
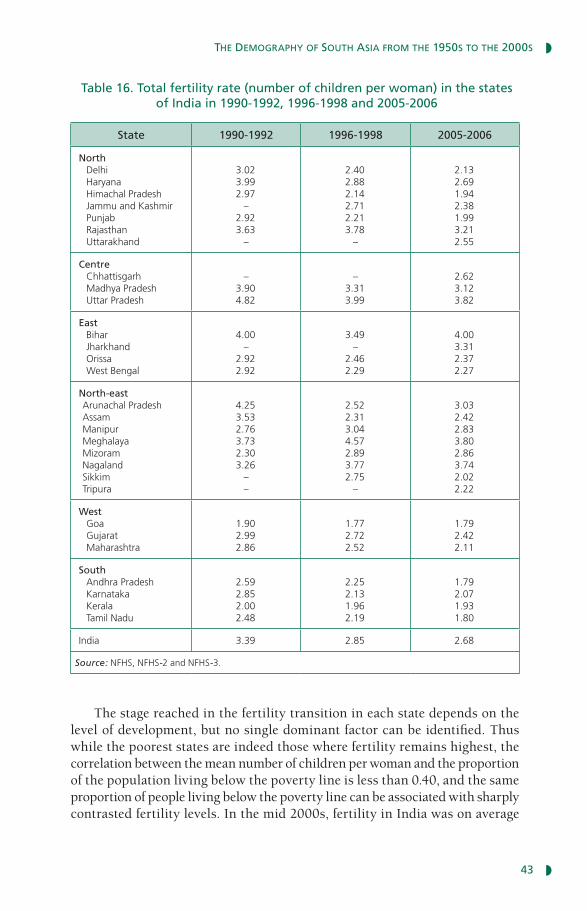
Thestagereachedinthefertilitytransitionineachstatedependsonthelevelofdevelopment,butnosingledominantfactorcanbeidentified.Thuswhilethepooreststatesareindeedthosewherefertilityremainshighest,thecorrelationbetweenthemeannumberofchildrenperwomanandtheproportionofthepopulationlivingbelowthepovertylineislessthan0.40,andthesameproportionofpeoplelivingbelowthepovertylinecanbeassociatedwithsharplycontrastedfertilitylevels.Inthemid2000s,fertilityinIndiawasonaverage
Table 16. Total fertility rate (number of children per woman) in the states of India in 1990-1992, 1996-1998 and 2005-2006
State 1990-1992 1996-1998 2005-2006
NorthDelhiHaryanaHimachal PradeshJammu and KashmirPunjabRajasthanUttarakhand
3.023.992.97
–2.923.63
–
2.402.882.142.712.213.78
–
2.132.691.942.381.993.212.55
CentreChhattisgarhMadhya PradeshUttar Pradesh
–3.904.82
–3.313.99
2.623.123.82
EastBiharJharkhandOrissaWest Bengal
4.00–
2.922.92
3.49–
2.462.29
4.003.312.372.27
North-eastArunachal PradeshAssamManipurMeghalayaMizoramNagalandSikkimTripura
4.253.532.763.732.303.26
––
2.522.313.044.572.893.772.75
–
3.032.422.833.802.863.742.022.22
WestGoaGujaratMaharashtra
1.902.992.86
1.772.722.52
1.792.422.11
SouthAndhra PradeshKarnatakaKeralaTamil Nadu
2.592.852.002.48
2.252.131.962.19
1.792.071.931.80
India 3.39 2.85 2.68
Source: NFHS, NFHS-2 and NFHS-3.
02_INE_Pop0108_007_090.indd 43 23/06/2008 14:36:26

J. Véron
44
2.68childrenperwomanand21.8%ofthepopulationlivedbelowthepovertyline,yetforsimilarfertilitylevels,asinGujaratandOrissa(2.42and2.37childrenperwoman,respectively)theassociatedproportionsinpovertydivergedwidely:12.5%ofthepopulationintheformerand39.9%inthelatter.
Thedifficultyofidentifyingsimpledeterminantsoffertilityattheaggregatelevelofstateswasclearlyillustratedseveralyearsagobyamultivariateanalysisoftherelationshipbetweenfertilityandwomen’seducation,whichalsoconsideredtheindirecteffectsoffemaleeducationviainfantmortalityandageatmarriage(SharmaandRetherford,1990).Themodel’sexplanatorypowerwasnotimprovedbyintroducingthelevelofurbanization.Whentheresidualsweremapped,thedeviationsfromthevalueexplainedbythemodelexhibitedgeographicalcontiguitybysize,suggestingtheinfluenceofregionalorlocalfactors(religion,customs,andsuchlike).Thecomplexityoftheprocessesatworkwashighlightedinageographicalanalysisof the fertility transition insouthernIndiabyC.Z.GuilmotoandI.S.Rajan(2005),whichshowedthattheexplanationneedstoincludefamilyplanningprogrammes,socioeconomictransformations,andchangingreproductiveattitudes,andtakeintoaccountlocalcontextsandthechangesaffectingthem.Theseauthorsalsoviewedthereductioninfertilityastheconsequenceofasocialchangethatdiffusedgraduallybetweenneighbouringpopulations(GuilmotoandRajan,1998and2001).
IX. Diversity in attitudes and behaviour towards contraception
Varying levels of contraceptive practice
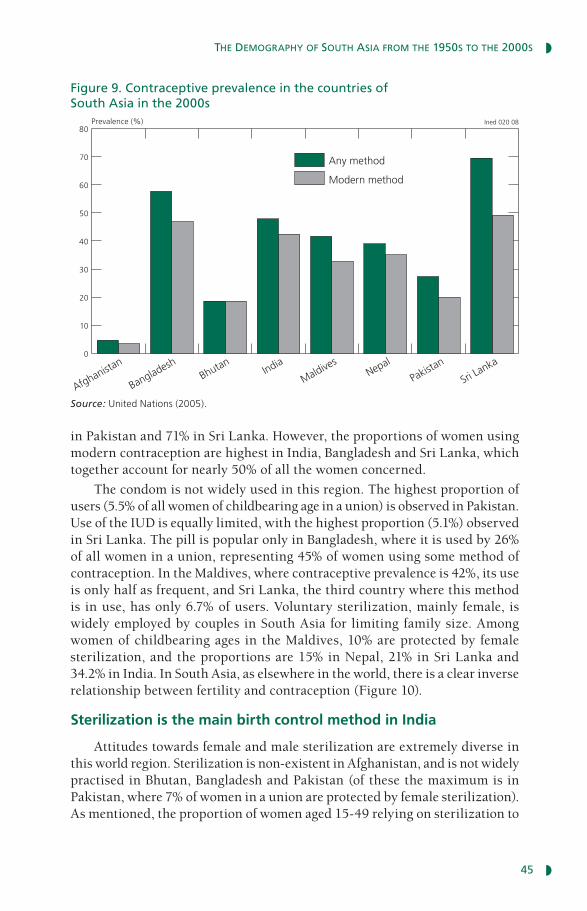
ThedataoncontraceptioninthecountriesofSouthAsia,thoughvariableinbothquantityandquality(UnitedNations,2005),areadequatetoshowthediversityofattitudesandbehaviourtowardscontraception(Figure9).Whilecontraceptionremainspracticallynon-existentinAfghanistan,wherefewerthan5%ofwomenaged15-49 inunionsuseanymethod,contraceptiveprevalenceinSriLankaalreadystoodatthehighlevelof70%in2000.Thesituationintheothercountriesisalsovaried:theproportionofwomen(24)usingsomeformofcontraceptionis18.8%inBhutan,27.6%inPakistan,39.3%inNepal,48.2%inIndiaand58.1%inBangladesh.
Theuseofmoderncontraceptionalsovariesconsiderablybetweencountries.InBhutan,barely19%ofwomeninaunionandofchildbearingageuseanymeansofcontraception(25),butmodernmethodsareusedexclusively:3%areprotectedbyfemalesterilization,8%bymalesterilization,2%bythepill,4%byinjectionorimplant,1%byIUD,andfewerthan0.5%byuseofthecondom.Bycontrast,moderncontraceptionrepresentsonly73%oftotalcontraception
(24)Asbefore,thesearewomenaged15-49,marriedorinaunion.
(25)Thedataarelessrecentthanthosefortheothercountries,anddatefrom1994.
02_INE_Pop0108_007_090.indd 44 23/06/2008 14:36:27
the deMograPhy of south asia froM the 1950s to the 2000s
45
inPakistanand71%inSriLanka.However,theproportionsofwomenusingmoderncontraceptionarehighestinIndia,BangladeshandSriLanka,whichtogetheraccountfornearly50%ofallthewomenconcerned.
Thecondomisnotwidelyusedinthisregion.Thehighestproportionofusers(5.5%ofallwomenofchildbearingageinaunion)isobservedinPakistan.UseoftheIUDisequallylimited,withthehighestproportion(5.1%)observedinSriLanka.ThepillispopularonlyinBangladesh,whereitisusedby26%ofallwomeninaunion,representing45%ofwomenusingsomemethodofcontraception.IntheMaldives,wherecontraceptiveprevalenceis42%,itsuseisonlyhalfasfrequent,andSriLanka,thethirdcountrywherethismethodisinuse,hasonly6.7%ofusers.Voluntarysterilization,mainlyfemale, iswidelyemployedbycouplesinSouthAsiaforlimitingfamilysize.AmongwomenofchildbearingagesintheMaldives,10%areprotectedbyfemalesterilization,andtheproportionsare15%inNepal,21%inSriLankaand34.2%inIndia.InSouthAsia,aselsewhereintheworld,thereisaclearinverserelationshipbetweenfertilityandcontraception(Figure10).
Sterilization is the main birth control method in India
Attitudestowardsfemaleandmalesterilizationareextremelydiverseinthisworldregion.Sterilizationisnon-existentinAfghanistan,andisnotwidelypractisedinBhutan,BangladeshandPakistan(ofthesethemaximumisinPakistan,where7%ofwomeninaunionareprotectedbyfemalesterilization).Asmentioned,theproportionofwomenaged15-49relyingonsterilizationto
Figure 9. Contraceptive prevalence in the countries of South Asia in the 2000s
Ined 020 08 Prevalence (%)
50
20
0
70
60
40
10
30
80
Sri Lanka
Pakistan
Nepal India
Bangladesh
Maldives
Bhutan
Afghanistan
Any method
Modern method
Source: United Nations (2005).
02_INE_Pop0108_007_090.indd 45 23/06/2008 14:36:27

J. Véron
46
regulatetheirfertilityissubstantiallyhigherelsewhere,butIndiastandsoutfromtheothercountries,sinceoverathirdofallwomenareconcerned(26).Malesterilizationforbirthcontrolpurposes,ontheotherhand,iseverywhereatalowlevel,withtheexceptionofBhutanwhere8%ofwomeninaunionareprotectedbythesterilizationoftheirspouseorpartnerand3%bytheirownsterilization.
Recoursetosterilization,andessentiallyfemalesterilization,hasbeenwidespreadinIndiasincethemid1980s(RajanandVéron,2006).In2005-2006,66%ofmarriedwomenaged15-49hadbeensterilized,andtheproportionwas77%amongthoseusingmoderncontraception,whereasonly1%wereprotectedbysterilizationoftheirhusband.TrendsoverthelastfifteenyearsincontraceptionandintherelativeimportanceofsterilizationcanbefollowedusingthethreeNFHS surveys conducted in India (Table17). Between1992-1993 and2005-2006,contraceptiveprevalenceincreasedby15percentagepoints,takingtooveronehalftheproportionofwomenofchildbearingageandinaunionwhonowusecontraception,against41%atthestartofthe1990s.Overalongperiod,sterilizationandinparticularmalesterilizationwasencouragedinIndia(27),
(26)The prevalence of female sterilization for contraception is slightly higher in India than inChina (34.2% and 33.5% respectively) but lower than in Brazil (40%), Puerto Rico (45.5%) andtheDominicanRepublic(45.8%).ThevalueforCanadais30.6%,makingitthedevelopedcountrywherecontroloffertilitythroughfemalesterilizationismostcommon.
(27)FormoredetailsonthehistoryofsterilizationinIndia,andinparticulartheapparentshiftawayfromstateprovisionofmalesterilizationtowardsfemalesterilizationsolicitedbycouples,seeRajanandVéron(2006).
Figure 10. Relationship between the total fertility rate and contraceptive prevalence (all methods) in the 2000s
Ined 021 08TFR
Contraceptive prevalence (%)
0 8040 6020
5
2
0
7
6
4
1
3
8
Sri Lanka (2000)
Pakistan (2000-2001)
Nepal (2006)India (2005-2006)
Bangladesh (2004)
Maldives (1999)
Afghanistan (2000)
Bhutan (1994)
Source: United Nations (2006a).
02_INE_Pop0108_007_090.indd 46 23/06/2008 14:36:28
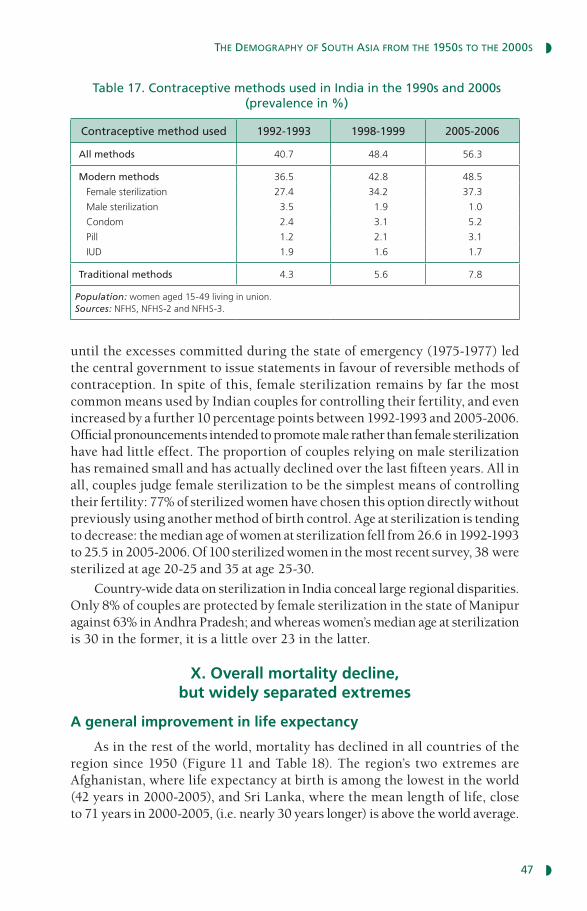
the deMograPhy of south asia froM the 1950s to the 2000s
47
untiltheexcessescommittedduringthestateofemergency(1975-1977)ledthecentralgovernmenttoissuestatementsinfavourofreversiblemethodsofcontraception.Inspiteofthis,femalesterilizationremainsbyfarthemostcommonmeansusedbyIndiancouplesforcontrollingtheirfertility,andevenincreasedbyafurther10percentagepointsbetween1992-1993and2005-2006.Officialpronouncementsintendedtopromotemaleratherthanfemalesterilizationhavehadlittleeffect.Theproportionofcouplesrelyingonmalesterilizationhasremainedsmallandhasactuallydeclinedoverthelastfifteenyears.Allinall,couplesjudgefemalesterilizationtobethesimplestmeansofcontrollingtheirfertility:77%ofsterilizedwomenhavechosenthisoptiondirectlywithoutpreviouslyusinganothermethodofbirthcontrol.Ageatsterilizationistendingtodecrease:themedianageofwomenatsterilizationfellfrom26.6in1992-1993to25.5in2005-2006.Of100sterilizedwomeninthemostrecentsurvey,38weresterilizedatage20-25and35atage25-30.
Country-widedataonsterilizationinIndiaconceallargeregionaldisparities.Only8%ofcouplesareprotectedbyfemalesterilizationinthestateofManipuragainst63%inAndhraPradesh;andwhereaswomen’smedianageatsterilizationis30intheformer,itisalittleover23inthelatter.
X. Overall mortality decline, but widely separated extremes
A general improvement in life expectancy
Asintherestoftheworld,mortalityhasdeclinedinallcountriesoftheregionsince1950(Figure11andTable18).Theregion’stwoextremesareAfghanistan,wherelifeexpectancyatbirthisamongthelowestintheworld(42yearsin2000-2005),andSriLanka,wherethemeanlengthoflife,closeto71yearsin2000-2005,(i.e.nearly30yearslonger)isabovetheworldaverage.
Table 17. Contraceptive methods used in India in the 1990s and 2000s (prevalence in %)
Contraceptive method used 1992-1993 1998-1999 2005-2006
All methods 40.7 48.4 56.3
Modern methods 36.5 42.8 48.5
Female sterilization 27.4 34.2 37.3
Male sterilization 3.5 1.9 1.0
Condom 2.4 3.1 5.2
Pill 1.2 2.1 3.1
IUD 1.9 1.6 1.7
Traditional methods 4.3 5.6 7.8
Population: women aged 15-49 living in union.Sources: NFHS, NFHS-2 and NFHS-3.
02_INE_Pop0108_007_090.indd 47 23/06/2008 14:36:28

J. Véron
48
Theothercountriesare inintermediatepositions.Althoughthemortalitytransitionsinthesecountriesdiffer insomerespects, theincreasesinlifeexpectancyatbirtharecloselycomparable,andin2000-2005thepopulationsofBangladesh,Bhutan,India,theMaldives,NepalandPakistanallhadlengthsoflifebetween61and66years.ThesecountriesareclosingthegapwithSriLanka,wheretherateofprogressisslowingsomewhat,althoughin2000-2005,lifeexpectancytherewasstillfiveyearslongerthanintheMaldives,thetop-rankingintermediategroupcountry.
Genderdifferencesinmortalityhavealsoevolvedsubstantiallyoverthelastfiftyyears.Intheearly1950s,lifeexpectancyatbirthwaslowerforwomenthanformenineverycountryoftheregionexceptBhutan,asisshownbytheindexbasedonthefemale/maleratiooflifeexpectanciesatbirth(Figure12).Thisresultwas indirectcontradictionwiththebiologicalnormsthatareresponsibleformenhavinghighermortalitythanwomenatallagesandthat,intheabsenceofsexdiscrimination,leadtoashorterlifeexpectancyformalesthanforfemales.In1950-1955,thisindexstoodattheparticularlylowlevelof94intheMaldivesandinPakistan, indicatinga largefemalemortalitydisadvantage.Themaleadvantagehasdisappearedineverycountryoverthelastfiftyyears.In2000-2005,thelifeexpectanciesatbirthofmenandwomeninAfghanistanandtheMaldiveswereidentical.Elsewhere,womenarelivinglongerthanmen.ThemostfavourablerelativesituationforwomenisinSriLanka,wheretheratiois112(Figure12).Inthepast,thefemalelifeexpectancy
Figure 11. Life expectancy at birth, 1950-2005 (in years)
Ined 022 08Life expectancy (years)
Years1950-1955 1970-1975 2000-20051990-19951960-1965 1980-1985
45
35
30
25
55
50
40
60
70
65
75
AfghanistanMaldives
BangladeshNepal
BhutanPakistan
IndiaSri Lanka
Source: United Nations (2006).
02_INE_Pop0108_007_090.indd 48 23/06/2008 14:36:29
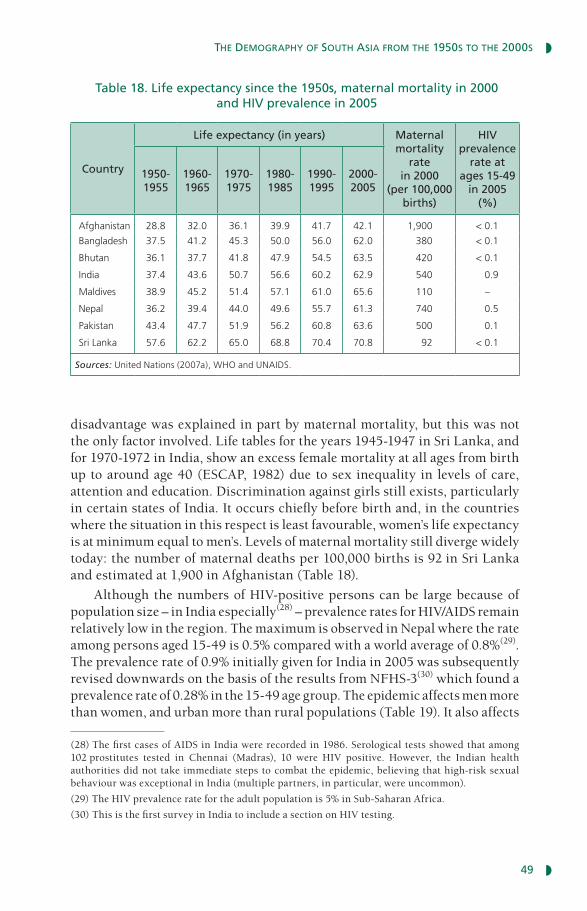
the deMograPhy of south asia froM the 1950s to the 2000s
49
disadvantagewasexplainedinpartbymaternalmortality,butthiswasnottheonlyfactorinvolved.Lifetablesfortheyears1945-1947inSriLanka,andfor1970-1972inIndia,showanexcessfemalemortalityatallagesfrombirthuptoaroundage40(ESCAP,1982)duetosexinequalityinlevelsofcare,attentionandeducation.Discriminationagainstgirlsstillexists,particularlyincertainstatesofIndia.Itoccurschieflybeforebirthand,inthecountrieswherethesituationinthisrespectisleastfavourable,women’slifeexpectancyisatminimumequaltomen’s.Levelsofmaternalmortalitystilldivergewidelytoday:thenumberofmaternaldeathsper100,000birthsis92inSriLankaandestimatedat1,900inAfghanistan(Table18).
AlthoughthenumbersofHIV-positivepersonscanbelargebecauseofpopulationsize–inIndiaespecially(28)–prevalenceratesforHIV/AIDSremainrelativelylowintheregion.ThemaximumisobservedinNepalwheretherateamongpersonsaged15-49is0.5%comparedwithaworldaverageof0.8%(29).Theprevalencerateof0.9%initiallygivenforIndiain2005wassubsequentlyreviseddownwardsonthebasisoftheresultsfromNFHS-3(30)whichfoundaprevalencerateof0.28%inthe15-49agegroup.Theepidemicaffectsmenmorethanwomen,andurbanmorethanruralpopulations(Table19).Italsoaffects
(28)ThefirstcasesofAIDSinIndiawererecordedin1986.Serologicaltestsshowedthatamong102prostitutes tested in Chennai (Madras), 10 were HIV positive. However, the Indian healthauthoritiesdidnottakeimmediatestepstocombattheepidemic,believingthathigh-risksexualbehaviourwasexceptionalinIndia(multiplepartners,inparticular,wereuncommon).
(29)TheHIVprevalenceratefortheadultpopulationis5%inSub-SaharanAfrica.
(30)ThisisthefirstsurveyinIndiatoincludeasectiononHIVtesting.
Table 18. Life expectancy since the 1950s, maternal mortality in 2000 and HIV prevalence in 2005
Country
Life expectancy (in years) Maternalmortality
rate in 2000
(per 100,000births)
HIV prevalence
rate at ages 15-49
in 2005 (%)
1950-1955
1960-1965
1970-1975
1980-1985
1990-1995
2000-2005
Afghanistan 28.8 32.0 36.1 39.9 41.7 42.1 1,900 < 0.1
Bangladesh 37.5 41.2 45.3 50.0 56.0 62.0 380 < 0.1
Bhutan 36.1 37.7 41.8 47.9 54.5 63.5 420 < 0.1
India 37.4 43.6 50.7 56.6 60.2 62.9 540 0.9
Maldives 38.9 45.2 51.4 57.1 61.0 65.6 110 –
Nepal 36.2 39.4 44.0 49.6 55.7 61.3 740 0.5
Pakistan 43.4 47.7 51.9 56.2 60.8 63.6 500 0.1
Sri Lanka 57.6 62.2 65.0 68.8 70.4 70.8 92 < 0.1
Sources: United Nations (2007a), WHO and UNAIDS.
02_INE_Pop0108_007_090.indd 49 23/06/2008 14:36:29

J. Véron
50
thestatesofIndiaindifferentways,asshownbytheregionalvariationsinprevalence(menandwomencombined):0.07%inUttarPradesh,0.34%inTamilNadu,0.62inMaharahtra,0.69%inKarnataka,0.97%inAndhraPradeshand1.13%inManipur(prevalenceintheotherstatesis0.13%)(31).Amongwomen,theprevalencerateislowerforthosewithnoeducationthanforthosewithatleastfiveyearsofeducation(0.27%and0.49%respectively)butthendeclinesaseducationallevelrises(0.07%forwomenwithatleast12yearsineducation).Amongmen,therateishighestforthosewithnoeducation(0.5%).Itislower
(31)InManipur,theHIVprevalencerateamongmenaged15-54isdoublethatamongwomenaged15-49(1.59%against0.79%).ExceptinTamilNaduwhereitislowerthanthatforwomen,themaleprevalencerateeverywhereelseishigherthanthefemalerate,thoughtoalesserdegree.
Figure 12. Differential mortality index in 1950-1955 and 2000-2005 (female/male ratio of life expectancies at birth)
Ined 023 08Index
100
85
80
110
105
95
90
115
Sri Lanka
Pakistan
NepalIndia
Bangladesh
Maldives
Bhutan
Afghanistan
1950-1955
2000-2005
Interpretation: The value 100 represents equality.Source: Based on United Nations (2006a) data.
Table 19. HIV/AIDS prevalence rate in the adult population (aged 15-49) in India, 2005-2006 (in %)
Women Men Overall
Urban areas 0.29 0.41 0.35
Rural areas 0.18 0.32 0.25
Total 0.22 0.36 0.28
Source: NFHS-3 survey.
02_INE_Pop0108_007_090.indd 50 23/06/2008 14:36:29

the deMograPhy of south asia froM the 1950s to the 2000s
51
forthosewithatleastfiveyearsofeducation(0.36%)thenrisesagainforthosewithbetweenfiveandsevenyearsofeducationandsubsequentlyfallswithlengthofeducation(theprevalencerateis0.16%formenwithmorethan12yearsineducation).Wenotethatthehighestprevalenceratesareobservedforwomenwhohadsexualintercoursewithahigh-riskpartnerinthe12monthsbeforethesurvey(rate2.23%)andforthosewhodidnotuseacondom(rate2.83%).Prevalenceratesformeninthesamecategoriesareconsiderablylower.
ForanumberofcountriesinSouthAsia,the2005UnitedNationsreportonmortalitygivesvaluesformaleandfemalelifeexpectancyatbirthandatages15and60at twoseparateperiods intime(Table20).Thedecline in
Table 20. Male and female life expectancy at birth, at age 15 and at age 60 (in years)
Country Years Men Women Years Men Women
Afghanistan – – – – – –
Bangladesh
At birth 1974 45.8 46.6 1994 58.7 58.3
Age 15 1974 46.3 46.1 1994 53.0 51.4
Age 60 1974 14.4 14.0 1994 15.1 15.0
Bhutan – – – – – –
India
At birth 1961-1970 46.4 44.7 1993-1997 60.4 61.8
Age 15 1961-1971 45.0 44.0 1993-1998 53.1 55.8
Age 60 1961-1972 13.6 13.8 1993-1999 15.5 17.5
Maldives
At birth 1982 53.4 49.5 1999 72.1 73.2
Age 15 1982 48.0 43.4 1999 59.2 60.2
Age 60 1982 9.2 8.2 1999 18.8 19.3
Nepal
At birth 1981 50.9 48.1 2001 60.1 60.7
Age 15 1981 47.3 46.9 – –
Age 60 1981 13.8 14.4 – –
Pakistan
At birth 1976-1978 59.0 59.2 2001 64.5 66.1
Age 15 1976-1979 56.8 56.3 2001 56.9 58.8
Age 60 1976-1980 19.3 19.3 2001 18.8 20.1
Sri Lanka
At birth 1967 64.8 66.9 1991 68.9 73.6
Age 15 1967 55.8 57.7 1991 – –
Age 60 1967 17.0 17.8 1991 – –
Source: United Nations (2006b).
02_INE_Pop0108_007_090.indd 51 23/06/2008 14:36:30

J. Véron
52
mortalityatyoungeragesaccountsforsomeoftheriseinlifeexpectancyatbirthbutisnottheonlyfactorinvolvedsincelifeexpectanciesatage15arealsorising.Lifeexpectanciesatage60arefollowingamoredisparatecoursethoughthetrendisupward.
Early-age mortality remains high in most countries
Infantmortalityfellthroughouttheregionbetween1960-1965and2000-2005(Table21andFigure13).SriLankaandAfghanistanareagain intheextremepositions:bythe1960s, infantmortality inSriLankawasalready
Figure 13. Infant mortality between 1960-1965 and 2000-2005
Ined 024 08260
0
80
240
160
60
220
140
40
200
120
20
180
100
Infant mortality 2000-2005 (‰)
2600 80 24016060 22014040 20012020 180100
Infant mortality 1960-2005 (‰)
Sri Lanka
Afghanistan
Pakistan
NepalIndiaBangladesh
Maldives Bhutan
Source: United Nations (2006).
Table 21. Infant mortality since the early 1950s
Infant mortality rate (‰) Change (%)
1952 1972 1992 2002 1952-1972 1972-1992 1992-2002
Afghanistan 275.3 211.6 171.1 168.1 – 23 – 19 – 2
Bangladesh 200.5 148.0 89.0 61.3 – 26 – 40 – 31
Bhutan 184.8 149.2 87.5 52.7 – 19 – 41 – 40
India 165.7 116.8 77.2 62.5 – 30 – 34 – 19
Maldives 185.2 120.6 65.1 45.8 – 35 – 46 – 30
Nepal 210.9 156.1 90.6 64.5 – 26 – 42 – 29
Pakistan 168.6 127.6 87.0 75.4 – 24 – 32 – 13
Sri Lanka 76.6 49.9 17.0 12.4 – 35 – 66 – 27
Source: United Nations (2007a).
02_INE_Pop0108_007_090.indd 52 23/06/2008 14:36:30

the deMograPhy of south asia froM the 1950s to the 2000s
53
muchlowerthaninmostcountriesofSouthAsia,whileinAfghanistaninfantmortality was among the highest in the world. Considerable progress hasbeenachievedintheothercountriesoftheregion,thoughinfantmortalitywasstill relativelyhigh in theearly2000s:46‰in theMaldives,53‰inBhutan, 61‰ in Bangladesh, 63‰ in India, 65‰ in Nepal and 75‰ inPakistan.
According toUnitedNationsestimates(2007a),under-fivemortality inAfghanistanhasnotdecreasedoverthelasttenyears:itwas257‰in1990-1995and252‰in2000-2005.At14‰in2000-2005,under-fivemortalityinSriLankabearsnocomparisonwiththatinAfghanistan(Table22).Thenext best level of under-five mortality is in the Maldives, where the ratedeclined considerably in the 1990s but still stood at 59‰ in 2000-2005.Infantandchildmortalitylevelsintheothercountrieswereverysimilarin1990-1995,withallratessituatedbetween124‰and128‰,buttenyearslaterhadbecomemoredisparate,rangingfrom108‰inPakistanto78‰inBhutan.
Child health is closely correlated with mother’s level of education
ChildmortalitylevelsreflectthepersistentdisparitiesinchildhealthinSouthAsia.Theproportionsofdeliveriesattendedbyskilledhealthpersonnel,thepercentageofmalnourishedchildrenandthelevelsofchildvaccinationcoverageprovidefurtherproofofthisdiversity(Table22).
Table 22. Child mortality, delivery conditions, malnutrition and vaccination
Country
Mortality rate (‰) Deliveries attended by skilled
health personnel
(%)
Children malnourished
(%)
Children vaccinated
(%)Neonatal
(2004)
Below1 year (2000-2005)
0-5 years
(2000-2005)
Afghanistan 60 168 252 14 (2003) 53.6 (1997) –
Bangladesh 36 61 83 13 (2004) 50.5 (2004) 73.1 (2004)
Bhutan 30 53 78 51(2005) 47.7 (1999) –
India 39 62 90 48 (2006) 51.0 (1998/99) 42.0 (1999)
Maldives 24 46 59 70 (2001) 31.9 (2001) –
Nepal 32 64 88 19 (2006) 57.1 (2001) 82.8 (2006)
Pakistan 53 75 108 31 (2005) 41.5 (2001) 35.1 (1991)
Sri Lanka 8 12 14 97 (2000) 18.4 (2000) 67.3 (1987)
(a) Children receiving the full set of vaccinations (BCG, DPT, polio and measles).(b) Children under five with stunted growth.Sources: United Nations, World Health Statistics 2007, DHS surveys and United Nations (2007a).
02_INE_Pop0108_007_090.indd 53 23/06/2008 14:36:31

J. Véron
54
Theconditionsofbirthvarywidely.InSriLanka,97%ofdeliveriesareattendedbyskilledhealthpersonnel,against70%intheMaldives,around50%inBhutanandIndia,14%inAfghanistanand13%inBangladesh.Theproportionofchildrenvaccinatedisalsoanindicatorofhealthconditions.Thoughtherelevantdataarenotavailableforallthecountriesoftheregionandsomeareoutofdate, inthe2000stheproportionofchildrenvaccinatedagainstthemaindiseasesexceeds70%inBangladeshand80%inNepal(32).
DataforIndiaoninfantmortalityin2005-2006highlighttheimpactofareaofresidenceandmother’slevelofeducationonchildhealth(Table23).Infantmortality,whichhasanaveragevalueforIndiaof57‰in2005-2006,variesby20pointsdependingonwhethertheareaofresidenceisurbanorrural.Forchildrenunderone,themortalityratevariesby44pointsaccordingtowhetherthemothershavereceivednoeducation(70‰)ormorethan12yearsofeducation(26‰).InIndiaaselsewhereintheworld,themortalitydifferentialsareevenlargeratages1-5.Theconditionsofdeliveryaremuchmorefavourableinurbanareasthaninruralareas,sincewellover70%ofurbanbirthsareattendedbytrainedhealthpersonnel,comparedwithlessthan40%ofruralbirths.Similarly,theconditionsofbirthvaryconsiderablywiththemother’seducationallevel,rangingfrom26%ofdeliveriesattendedbytrainedpersonnelforwomenwithnoeducationto91%forwomenwithat least12yearsofeducation.Thepercentageofchildrenreceivingthebasicvaccinationsvariesbyalmost20pointsdependingonwhetherthemotherlivesinanurbanorruralarea,andbynearly50pointsbetweenthe leastandmosteducatedwomen.
(32)InNepal,83%ofchildrenaged1-2arefullyimmunizedatthetimeofthesurvey,while93%areBCGvaccinatedagainsttuberculosis,85%arevaccinatedagainstmeaslesand89%havereceivedthefirstdoseoftheDPT(diphtheria,pertussis,tetanus)vaccine.
Table 23. Child mortality, delivery conditions and vaccination by area of residence and educational level of mother, India, 2005-2006
Total
Area of residence
Mother’s level of education (years of shooling)
Urban RuralNo
educationBelow
55-7 8-9 10-11 12+
Infant mortality (‰) 57.0 41.5 62.2 69.7 66.0 49.5 41.5 36.5 25.9
Mortality 1-5 years (‰) 18.4 10.6 21.0 29.9 13.8 11.5 5.6 3.6 3.9
Mortality 0-5 years (‰) 74.3 51.7 82.0 94.7 78.8 60.5 46.9 40.0 29.7
Deliveries attended by trained personnel (%) 46.6 73.5 37.5 26.1 45.0 56.9 67.1 80.3 91.0
Children aged 1 or 2 receiving the main vaccinations (%) 43.5 57.6 38.6 26.1 46.1 51.8 59.7 66.1 75.2
Source: NFHS-3.
02_INE_Pop0108_007_090.indd 54 23/06/2008 14:36:31

the deMograPhy of south asia froM the 1950s to the 2000s
55
HealthinequalitiesthusremainextremelylargeinSouthAsia,whethercomparisonisbetweencountriesorbetweensocioeconomicstrata inthepopulationofasinglecountry.Indiaintroducedanewhealthpolicyin2002(33).Amongitsclearlystatedobjectives,basedontheprincipleofequity,isthatofreducingtheinequalitiesinaccesstohealthcareassociatedwithurbanversusruralresidenceorwithdifferencesinthedevelopmentlevelofstatesorintheeconomicstatusofpopulations.However,itwillbesomeyearsbeforeitseffectsbecomevisible.
XI. Age structures: demographic windows of opportunity
Young populations
Medianage,acrude indicatorofagestructure, reveals threesharplycontrastingsituationsinheritedfrompasttrendsinmortalityandfertility(Table24).AcontrastisagainobservedbetweenAfghanistan,wherethefertilitytransitionhashardlystartedandthepopulationisparticularlyyoung(medianage16.4),andSriLanka,wherethetransitioniscompleteandthepopulationismucholder(medianage29.5).Intheothercountries,allofwhichareengagedinthefertilitytransition,medianagesrangefrom20to24.
In2005,allthecountriesofSouthAsiawiththeexceptionofSriLankahadpopulationswithlargeproportionsofyoungpeople.ExceptinSriLanka,wheretheproportionwas24%,theunder-15smakeupoverathirdofthepopulation(Table23).Theproportionofyoungpeopleunder15isaround40%inNepalandreaches47%inAfghanistan.
Table 24. Indicators of age-sex structure in the countries of South Asia, 2005
CountriesMedian age
(years)Under-15s
(%)Over-60s
(%)Sex ratio
(%)
Afghanistan 16.4 47.0 3.7 107.5
Bangladesh 22.2 35.2 5.7 104.9
Bhutan 22.3 33.0 6.9 111.1
India 23.8 33.0 7.5 107.5
Maldives 21.3 34.0 5.6 105.3
Nepal 20.1 39.0 5.8 98.2
Pakistan 20.3 37.2 5.9 106.0
Sri Lanka 29.5 24.2 9.7 97.7
Source: United Nations (2007a).
(33)Thepreviousnationalpolicyonhealthdatedfrom1983.
02_INE_Pop0108_007_090.indd 55 23/06/2008 14:36:31

J. Véron
56
Usingtheproportion–nottheabsolutenumber–ofpeopleover60asthecriterionofpopulationageing,itisclearthattheprocesshasmadelittleimpactsofarinthecountriesoftheregion.OnlyinSriLankaistheproportionofover-60scloseto10%,asaconsequenceofthelongstandingfertilitydecline,whereasitis7.5%inIndiaandbelow7%intheothercountries.
Populationprojectionsto2020showthatSriLankawillseeamarkedageingofitspopulationintheyearsahead,withtheproportionofover-60sexceeding17%bythatyear(AppendixTableA.11).Thenext“oldest”countrywillbeIndia,with10%ofitspopulationover60.Everywhereelse,theover-60swillstillrepresentless–insomecasesmuchless–thanone-tenthofthepopulation.Theproportionofpersonsaged60andoveriscurrentlyverylowinAfghanistan(4%)andisunlikelytochangebetweennowand2020.
ThepopulationsinthecountriesofSouthAsiaarealsodifferentiatedbytheirsexratios.ThelargestmalesurplusesarefoundinBhutan,AfghanistanandIndia;menareintheminorityinNepalandSriLanka,wheretherewere98malesfor100femalesin2005.
ThelargeseximbalanceatbirthaffectingseveralEastandSoutheastAsiancountries,amongthemChina,isnotobservedinthisregionexceptinIndia,andthenonlyinthecountry’snorth-weststates.Wewillreturnlatertothisseximbalancethatreflectsstrongdiscriminationagainstgirlchildreninthesestates.
Age distributions reflect the progress of the demographic transition
Thestageofdemographictransitionreachedbythecountriesoftheregionisillustratedbytheiragestructures(Figures14A-14H).ThefertilitydeclineinSriLankabeganmanyyearsago,asshownbythenarrowerbaseofthepyramidstartingfromthe35-39agegroup.Despitean“echo”effect(34),cohortsizehasfallencontinuouslysince1980-1985.ComparedwithSriLanka,thefertilitytransitionhascomelaterinBhutanandtheMaldives,butcohortsizehasbeenfallinginbothcountriesforthelasttwentyandtenyearsrespectively.ThebaseofthepopulationpyramidforPakistanisstartingtocontract,whilethepyramidsforBangladesh,IndiaandNepalareverysimilar,withasyetnomajordecreaseinnumbersatyoungages.Despiteadeclineinfertility,thenumbersofbirthsarenotyetfalling,becausethepopulationofchildbearingageisstilllarge.Afghanistan,finally,presentsanagestructurecharacteristicofacountrywithhighfertilityandhighmortality.
Between2005and2020,theproportionofpeopleaged15-60,i.e.intheworking-agepopulation,willincreaseinallthecountries(exceptAfghanistan).
(34)In2005,thelargersizeofthepopulationaged20-24relativetothoseaged25-29or30-34isaresultofhighbirthratesaroundtwentyyearsearlier,whentherelativelylargecohortsofwomenreachedchildbearingage.
02_INE_Pop0108_007_090.indd 56 23/06/2008 14:36:31

the deMograPhy of south asia froM the 1950s to the 2000s
57
Figure 14. Population pyramids of the countries of South Asia in 2005
20 10 0
Men
0 10 20
Women
Ined 027 08
C. BHUTAN
0-4
10-14
20-24
40-44
60-64
30-34
50-54
70-74
90-94
80-84
100 +Age
20 10 0
Men
0 10 20
Women
Ined 028 08
D. INDIA
0-4
10-14
20-24
40-44
60-64
30-34
50-54
70-74
90-94
80-84
100 +Age
20 10 0
Men
0 10 20
Women
Ined 025 08
A. AFGHANISTAN
0-4
10-14
20-24
40-44
60-64
30-34
50-54
70-74
90-94
80-84
100 +Age
20 10 0
Men
0 10 20
Women
Ined 026 08
B. BANGLADESH
0-4
10-14
20-24
40-44
60-64
30-34
50-54
70-74
90-94
80-84
100 +Age
20 10 0
Men
0 10 20
Women
Ined 029 08
E. MALDIVES
0-4
10-14
20-24
40-44
60-64
30-34
50-54
70-74
90-94
80-84
100 +Age
20 10 0
Men
0 10 20
Women
Ined 030 08
F. NEPAL
0-4
10-14
20-24
40-44
60-64
30-34
50-54
70-74
90-94
80-84
100 +Age
20 10 0
Men
0 10 20
Women
Ined 031 08
G. PAKISTAN
0-4
10-14
20-24
40-44
60-64
30-34
50-54
70-74
90-94
80-84
100 +Age
20 10 0
Men
0 10 20
%
Women
Ined 032 08
H. SRI LANKA
0-4
10-14
20-24
40-44
60-64
30-34
50-54
70-74
90-94
80-84
100 +Age
%% %
Source: United Nations, 2006a.
02_INE_Pop0108_007_090.indd 57 23/06/2008 14:36:32

J. Véron
58
Furtherincreasecanbeexpectedevenincountrieswheretheproportionofpeopleaged15-60wasalreadyhighin2005,likeBhutanandtheMaldives(60%).Thisrelativeincreaseintheworking-agepopulation,beforethereductionintheeconomicallyinactiveyoungpopulationiscancelledoutbytheincreaseintheinactiveolderpopulation,constitutesthe“demographicwindow”.Atthispointcountrieshaveanopportunityfordevelopment,sincethedependencyratioisfavourabletowealthcreation,thankstothereducedpublicburdenofeducationcostsfortheyoungandofhealthandpensioncostsforolderpeople.InBhutan,peopleaged15-60willrepresent67%ofthepopulationin2020.Forthecountriesinapositiontobenefit,thedemographicwindowrepresentsanopportunity.Buttheadvantageisapotentialone,andforittoberealized,theworking-agepopulationmustbeemployedinthefullsenseoftheterm,withlowunder-employmentorunemployment.SriLankadiffersfromtheothercountriesinthatitisalreadybenefitingfromthedemographicwindow(theproportionaged15-60iscurrently66%andwillprobablydescendto62%by2020).
XII. A relatively low urban-rural ratio
Moderate urbanization but strong urban growth
InSouthAsia,likeelsewhereintheworld,thecriteriausedforclassifyingpopulationsas“urban”arenotallthesame.ThedefinitionofurbaninIndiacanbeadministrative(localitiespossessingamunicipalcharter,etc.)orbasedonacombinationofcriteria:numberof inhabitants,populationdensity,proportionofmeninnon-agriculturaloccupations.InneighbouringSriLanka,onlypopulationsin“municipalzonesandzoneswithanurbancouncil”areclassifiedasurban(Table25).InPakistan,anurbansettlementisalsodefined
Table 25. Criteria for defining urban populations in four countries of South Asia
Country Definition of “urban”
India Towns and cities: localities possessing a municipal charter, a committee for a municipal zone or designated urban zone or grouped zone (cantonment) or localities with a population of 5,000 or more inhabitants, a population density of 1,000 or more inhabitants per square mile or 400 per sq.km, definite urban characteristics, and with three-quarters of adult males in non-agricultural employment.
Maldives Male (capital)
Pakistan Localities possessing a municipal charter or a municipal committee and grouped zones (cantonments)
Sri Lanka Urban sector: comprising all the municipal zones and zones possessing an urban council.
Source: United Nations (2007b).
02_INE_Pop0108_007_090.indd 58 23/06/2008 14:36:32

the deMograPhy of south asia froM the 1950s to the 2000s
59
inuniquelyadministrativeterms.InNepal,localitiesneeded5,000inhabitantstobeclassifiedasurbaninthe1961censusand9,000insubsequentcensuses.Thecriteria forpopulationsizeanddensity,continuousbuilt-upareaandoccupationalstructurehaveallchangedovertime,andsince1999thedefinitionbasedonpopulationsize,annualincomeandinfrastructurevariesbetweenecologicalzonesaccordingtocomplexrules(UnitedNations,2008)(35).ThedefinitionofurbaninBangladeshissimilartothatinIndiabutmorecomplexsince italso includespublicamenities,access towater,educational level,etc.
ThecountriesofSouthAsiaarestillnotheavilyurbanized(Table26).InPakistan,thecountrywiththeregion’shighestpercentageurbanin2005,only35%ofthepopulationlivedintownsorcities.ThelowestlevelsofurbanizationareobservedinSriLankaandNepal,wherebarely15%oftheinhabitantsareurbandwellers.InIndia,lessthan30%ofthepopulationtodaylivesintownsorcities,whichisthreetimesmorethanin1901andtwicethelevelin1941,butstillasmallproportioncomparedwiththeworldaverage(50%).
Table 26. Percentage urban, 1950-2005, and projections to 2030
Country 1950 1975 2005 2030
Afghanistan 5.8 13.3 22.9 36.2
Bangladesh 4.3 9.8 25.7 41.0
Bhutan 2.1 7.9 31.0 56.2
India 17.0 21.3 28.7 40.6
Maldives 10.6 17.3 33.9 60.7
Nepal 2.7 4.8 15.8 30.6
Pakistan 17.5 26.3 34.9 49.8
Sri Lanka 15.3 19.5 15.1 21.4
Source: United Nations (2008).
Althoughtheproportionofpeoplelivingintownsandcitiesisrisingatamoderatepace,thetotalurbanpopulationinSouthAsiahasgrownsharplyoverfiftyyears.Itnumbered73.7millionin1950and433.2millionin2005,representingnearlyasix-foldincrease(Figure15).Indiaaccountedformuchofthisurbangrowth,sinceofthe433.2millionurbandwellersinSouthAsiain2005,three-quarterslivedinIndia.Thepaceofchangeintheurbanpopulationdiffersbetweencountries,andinsomeinstancesvariesgreatlybetweenperiodswithinthesamecountry.InAfghanistan,inparticular,theurbanpopulationgrewatanannualrateof6%intheperiod2000-2005,buttheratewasnegativeintheperiod1980-1985(36)thenreached8.5%intheyears1990-1995.Forthe
(35)http://esa.un.org/wup/source/country.aspx
(36)Asmentioned,thewarwiththeSovietUnionledtolarge-scaleemigration,withmanypeopletakingrefugeinPakistanorIran.
02_INE_Pop0108_007_090.indd 59 23/06/2008 14:36:32
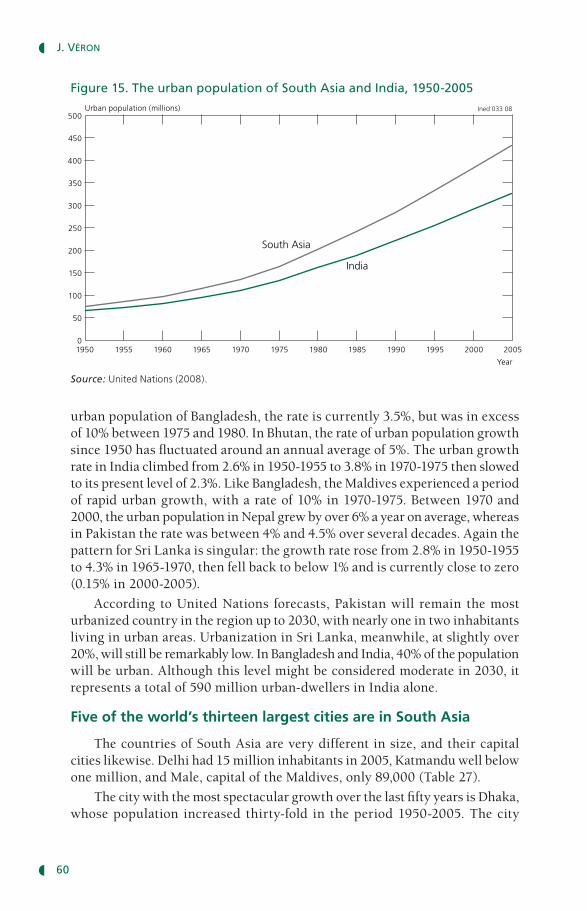
J. Véron
60
urbanpopulationofBangladesh,therateiscurrently3.5%,butwasinexcessof10%between1975and1980.InBhutan,therateofurbanpopulationgrowthsince1950hasfluctuatedaroundanannualaverageof5%.TheurbangrowthrateinIndiaclimbedfrom2.6%in1950-1955to3.8%in1970-1975thenslowedtoitspresentlevelof2.3%.LikeBangladesh,theMaldivesexperiencedaperiodofrapidurbangrowth,witharateof10%in1970-1975.Between1970and2000,theurbanpopulationinNepalgrewbyover6%ayearonaverage,whereasinPakistantheratewasbetween4%and4.5%overseveraldecades.AgainthepatternforSriLankaissingular:thegrowthraterosefrom2.8%in1950-1955to4.3%in1965-1970,thenfellbacktobelow1%andiscurrentlyclosetozero(0.15%in2000-2005).
AccordingtoUnitedNationsforecasts,Pakistanwillremainthemosturbanizedcountryintheregionupto2030,withnearlyoneintwoinhabitantslivinginurbanareas.UrbanizationinSriLanka,meanwhile,atslightlyover20%,willstillberemarkablylow.InBangladeshandIndia,40%ofthepopulationwillbeurban.Althoughthislevelmightbeconsideredmoderatein2030,itrepresentsatotalof590millionurban-dwellersinIndiaalone.
Five of the world’s thirteen largest cities are in South Asia
ThecountriesofSouthAsiaareverydifferentinsize,andtheircapitalcitieslikewise.Delhihad15millioninhabitantsin2005,Katmanduwellbelowonemillion,andMale,capitaloftheMaldives,only89,000(Table27).
ThecitywiththemostspectaculargrowthoverthelastfiftyyearsisDhaka,whosepopulationincreasedthirty-fold intheperiod1950-2005.Thecity
Figure 15. The urban population of South Asia and India, 1950-2005
Ined 033 08Urban population (millions)
Year
1950 20051990 20001980 1985 19951970 19751960 19651955
350
100
0
450
250
300
400
200
50
150
500
India
South Asia
Source: United Nations (2008).
02_INE_Pop0108_007_090.indd 60 23/06/2008 14:36:33

the deMograPhy of south asia froM the 1950s to the 2000s
61
Tab
le 2
7. P
op
ula
tio
n c
han
ge
in s
elec
ted
cap
ital
an
d la
rges
t ci
ties
bet
wee
n 1
950
and
200
0 an
d f
ore
cast
s fo
r 20
15
Co
un
try
Cit
ies
Pop
ula
tio
n (
in t
ho
usa
nd
s)R
atio
Perc
enta
ge
of
tota
l p
op
ula
tio
n
in 2
005
Perc
enta
ge
of
urb
an
po
pu
lati
on
in
200
519
5019
7520
0020
0520
1520
05/1
950
2005
/197
5
Afg
hani
stan
Kab
ul17
167
41,
963
2,99
44,
666
17.5
4.4
10.0
43.8
Bang
lade
shD
haka
417
2,17
310
,159
12,4
3016
,842
29.8
5.7
8.8
35.0
Bhut
anTh
imph
u3
860
8514
3
Indi
aD
elhi
1,36
94,
426
12,4
4115
,048
18,6
0411
.03.
41.
44.
7
Kol
kata
(C
alcu
tta)
4,51
37,
888
13,0
5814
,277
16,9
803.
21.
81.
34.
5
Mum
bai
(Bom
bay)
2,85
77,
082
16,0
8618
,196
21,8
696.
42.
61.
65.
7
Mal
dive
sM
ale
––
––
––
––
–
Nep
alK
athm
andu
104
180
644
815
1,28
07.
84.
53.
019
.1
Paki
stan
Isla
mab
ad36
107
595
736
1,00
820
.46.
9
Kar
achi
1,04
73,
989
10,0
2011
,608
15,1
5511
.12.
97.
421
.1
Sri L
anka
Col
ombo
400
572
639
652*
701
1.6
1.1
3.4
22.5
* es
timat
e.So
urc
e: U
nite
d N
atio
ns, W
orld
Urb
aniz
atio
n Pr
ospe
cts:
the
20
05 R
evis
ion.
02_INE_Pop0108_007_090.indd 61 23/06/2008 14:36:33

J. Véron
62
becamethecapitalofthenewlycreatedBangladeshin1971.Between1975and2005,theseven-foldincreaseinthepopulationofIslamabadwasfasterthanthatofDhaka,wherepopulationincreasedsix-fold.ThepopulationsofKabulandKatmandugrewbyafactorof4.4-4.5overthesameperiod.Infiftyyears,thepopulationofDelhihasgrownmorethanten-fold,increasingfrom1.4millionin1950to15millionin2005.
Thedemographicweightofthecapitalcitiesintheirrespectivecountriesalsovaries.Delhiishometolessthan2%ofthepopulationofIndia,whereas10%ofthatofAfghanistanlivesinKabul.TheinhabitantsoftheAfghancapitalrepresent44%ofthatcountry’surbanpopulation,whereasthepopulationofKathmandurepresentslessthan20%ofNepal’surbanpopulationandthatofDelhilessthan5%ofIndia’s.
TheurbanizationprocessissingularinIndiaonaccountofthepopulationsizeanditsrateofgrowthinthetwentiethcentury.Along-termcomparisonwiththeUnitedStateshasshownthatnotonlyisthepercentageurbanlowerinIndiabutitisnotcatchingupwiththeAmericanlevel,eventhoughIndiahasa largerurbanpopulationthantheUnitedStates(Véron,1987).Indiaalreadyhadanumberoflargecitiesattheendofthenineteenthcentury:in1891,744,000peoplelivedinCalcutta,822,000inBombay,453,000inMadrasand415,000inHyderabad(Davis,1951),Inthe2001census,Indiacounted34urbanagglomerationswithoveronemillioninhabitantsandsixwithoverfivemillioninhabitants:Mumbai(formerlyBombay,16.4million),Kolkata(Calcutta,13.2million),Delhi(12.9million),Chennai(formerlyMadras,6.6million),HyderabadandBangalore(eachwith5.7million).
Onagloballevel,of21urbanagglomerationswithover10millioninhabitantsin2005,fiveofthem–notallcapitalcities–wereinSouthAsia:Dhaka,Delhi,Kolkata,MumbaiandKarachi.Thesefiveurbanagglomerationsareamongthe13largestintheworld.
XIII. A lack of data on international migration
ThecountriesofSouthAsiaareemigrationcountries.Threetypesofmigrationcanbeidentified:migrationleadingtopermanentsettlementinEurope,AustraliaandNorthAmerica;labourmigrationtocountriesintheMiddleEast;andseasonalmigration,mostlylocalizedinborderregions,likethatintoIndiafromBangladeshandNepal(IOM,2005).ThelargestmigrationflowsaretotheGulfcountries.Whennovisaisrequiredtoenteraneighbouringcountry–asisthecasebetweenIndiaandNepal,betweenIndiaandBhutanandbetweenBhutanandNepal(Khadria,2005)–cross-bordermigrationisindistinctfrominternalmigration.Whereavisaisrequired,asisthecaseforBangladeshandIndia,aproportionof thismigrationis illegal.This localmigrationinvolvesprimarilythepoorestpopulations,suchasthefarmersfromtheNepalvalleyswhogotonorth-eastIndiaatharvesttime.
02_INE_Pop0108_007_090.indd 62 23/06/2008 14:36:33

the deMograPhy of south asia froM the 1950s to the 2000s
63
Inthelastfewyears,therangeofdestinationcountriesforSouthAsianmigrantshasbroadened(Khadria,2005).Increasingly,migrantsareattractedtoJapan,HongKong,SouthKorea,Malaysia,SingaporeandTaiwan.ExamplesincludeplantationworkersinMalaysia(manyBangladeshis),domesticstaffinSingaporeandconstructionworkersinSouthKorea(Nepaleseinparticular).Migrantsincludelargenumbersofwomen,mainlyinthedomesticservicesector.Highlyqualifiedmigrants,meanwhile,leaveforEurope,NorthAmericaorAustralia.
Afghanistanexperiencedlarge-scalepopulationmovementsduringthewarwiththeSovietUnionbetween1979and1989.Allthreemaintypesofmigration–correspondingtopermanentsettlementinEurope,NorthAmericaorAustralia;labourmigrationtotheMiddleEastandcertainSouth-EastAsiancountries;andcross-bordermoves,suchasmigrationtoIndia–occur inBangladeshthoughtherespectivescaleoftheseflowsisnotknown.PakistanisalsoleavetheircountrytosettleinEurope,NorthAmericaorEastAsia,enteringeitherlegally,orasstudents(someofwhomlaterseektostayon),or,forthepoorest, illegally.SriLankatoo isexperiencing large-scale internationalmigration.PoliticalreasonsarecausingTamilstoleavethecountryandseekpoliticalrefugeestatusintheWest(Etiemble,2004).TheGulfcountriesremainamajordestinationformigrantsfromSriLanka.Womenaccountfor70%ofthismigration,reflectingthehighdemandinthesecountriesforfemaledomesticworkers.
MigrationisagrowingphenomenoninIndia,thoughitsin-depthstudyislimitedessentiallytoKerala.Asurveyfromthelate1990shasbeenusedtoanalyse the impactofmigrationonpopulationagestructure, family life(temporaryseparationofspouses),averageeducational level(throughtheselectivityofmigration),poverty,unemployment,etc.(Zachariahetal.,2003).Itemerges,forexample,thatwomenwithamigranthusbandinaGulfcountryhavehighstatusbecausetheyreceiveremittancesintheirownnamebutareweigheddownbyincreasedresponsibilitiesduetotheirhusband’sabsence,andby loneliness:60%would like theirhusbandtocomehome.Returnmigrationisbecomingmuchmorecommon,raisingtheissueofreintegratingmigrantsintothesocietyoforigin.Fortypercentofreturnmigrantssetuptheirownbusiness,butaproportionofreturneeshavegreatdifficulty inreintegratingKeralasocietyand, thoughstillofworkingage,donotfindemploymentanduse theirsavings tomaintainahighstandardof living(Zachariahetal.,2002;Zachariahetal.,2006).
Theeconomicimportanceofinternationalmigrationforeachcountrycanbemeasuredfromthefinancialtransfersmadebyitscitizensresidentabroad.In2004,migration-relatedtransfersrepresentedavaryingbutinsomecaseslargeproportionofgrossnationalincomeinthecountriesofSouthAsia:12.1%inNepal,8%inSriLanka,5.5%inBangladesh,4.2%inPakistan,3.2%inIndiaand0.4%intheMaldives(UnitedNations,2006c).
02_INE_Pop0108_007_090.indd 63 23/06/2008 14:36:34

J. Véron
64
Sendingcountriescanalsobereceivingcountries.TheUnitedNationsestimatesthat191millionpeopleworldwidelivedoutsidetheircountryofbirthin2005,representing3%oftheworldpopulation(37)(UnitedNations,2006c).TheSouthAsiancountrywiththelargestnumberof foreign-bornpersonsisIndia,wheretheytotal3.7million(38).Thismigrantstockistheeighthlargestintheworld,thoughitrepresentsamere0.5%ofIndia’stotalpopulation(AppendixTableA.12).Pakistancurrentlyhassome3.3millionforeign-bornresidents,equivalentto2.1%ofthetotalpopulation.Themigrantstockthusdefinedis1millioninBangladesh(0.7%ofthepopulation),819,000inNepal(3%),368,000inSriLanka(1.8%),43,000inAfghanistan(0.1%),10,000inBhutan(0.5%)and3,000intheMaldives(1%).
XIV. Access to education remains unequal
Accesstoeducationplaysalargeroleinthepopulationdynamicsofallcountries,affecting factors suchas thepaceofdemographic transition,contraceptivepracticeorchildhealth.
ThecountriesofSouthAsiapresentcontrastingsituationsintermsofliteracy.Intheearly2000s,literacyamongadultsoverage15wasabove90%inSriLankaand96%intheMaldives(Table28).ThecontrastwithAfghanistan,whereonly28%oftheadultpopulationisliterate,isparticularlysharp.Literacylevelsarearound50%inBangladesh,NepalandPakistanandover60%inIndia.
Overlayingthesedifferencesinliteracylevelsarevaryingdegreesofgenderinequality(Figure16).ThesituationintheMaldivesandSriLankaisoneof
(37)In1960,thenumberofpeoplelivingoutsidetheircountryofbirthwasestimatedat75million,or2.5%oftheworldpopulation.
(38)TheIndiancensusof1991countednearly3.4millionmigrantsoriginatingfromBangladesh,with2.6millionsettledinWestBengal(Nanda,2005).
Table 28. Literacy rates of adults aged 15 and over in the 2000s
Rate (%)
Afghanistan (2000) 28.0
Bangladesh (2001) 47.5
Bhutan –
India (2001) 61.0
Maldives (2000) 96.3
Nepal (2001) 48.6
Pakistan (2005) 49.9
Sri Lanka (2001) 90.7
Source: Unesco (http://unesdoc.unesco.org/).
02_INE_Pop0108_007_090.indd 64 23/06/2008 14:36:34

the deMograPhy of south asia froM the 1950s to the 2000s
65
highequality,withliteracylevelsataround90%formenandwomenalike.InNepalandPakistan,ontheotherhand,inequalityismarkedandthefemaleadultliteracyrateislessthan60%ofthemaleadultrate.ThisformofinequalityisgreaterstillinAfghanistanwherefemaleliteracyratesrepresented29%ofthemaleratein2000.
ThepopulationofIndiahasahighereducationallevelthanneighbouringcountrieslikeBangladeshandPakistan,butinthisdomain,aselsewhere,thecountryhasextremeregionaldisparities(Banthia,2001).In2001,theaverageliteracyrateofthepopulationaged7andoverwas65%,butstoodatover90%inKeralaandbelow48%inBihar.Formen,theaverageliteracyrateis76%andvariesbetweenamaximumof94%inKeralaandaminimumof60%inBihar,whileforwomentheaverageis54%withamaximumof88%inKeralaandaminimumof34%inBihar.
XV. Increasing vulnerability
Insomecountriesoftheregion,violentconflictorextremetensionshavecreatedaclimateof insecuritythat isunfavourabletodevelopmentatthepresenttime.However,increasedvulnerabilityofthepopulationsofSouthAsiaineconomic,socialandecologicaltermsisalsoalegacyofrapidpopulationgrowthinthepast.
Economic and social vulnerability
Severalpopulations areparticularly vulnerable today in economic andsocial terms. In some regions of India, strong discrimination against girl
Figure 16. Literacy rates of men and women aged 15 and over in the 2000s
Ined 034 08100
0
40
20
80
60
Female literacy rates (%)
1000 4020 8060Male literacy rates (%)
Sri Lanka
Afghanistan
Pakistan
Nepal
India
Bangladesh
Maldives
Source: Unesco (http://stats.uis.unesco.org/unesco).
02_INE_Pop0108_007_090.indd 65 23/06/2008 14:36:34

J. Véron
66
childrenisreflectedinsex-selectiveabortionpractices.Resultsfromthe2001Indiancensusshowingahighsexratiointheyoungpopulationrevealedtheextent of discrimination against girl children in the north-west of thecountry(39).InthePunjabandinHaryana,whichcountamongIndia’smostdeveloped states, this discrimination was such that the sex ratio in thepopulationaged0-6reached130boysfor100girlsinsomedistrictsandevenhigher levels in the district of Fatehgarh Sahib (Nanda and Véron, 2004).Women’seducationallevelisrelativelyhighinthePunjab(thefemaleliteracyratewas64%in2001),yetfemalefoetusesarenonethelessabortedinlargenumbers, the result of a traditional boy preference that may have beenrekindledbyfallingbirthrates(40).Inrecentyears,thegovernmenthasmadeefforts to stamp out the practice of sex-selective abortion via informationcampaignsandsanctionsagainstpractitionerswhotellcouplesthesexofanunbornchild,butwithoutmuchapparentsuccess.ForIndiaasawhole,thesex ratio of the 0-6 age group was 108.9in the 2005-2006 NFHS, against107.9inthe2001census.Thesexratiohasnotchangedinurbanareasbuthasriseninruralareas.
Vulnerabilityalsotakesotherforms(41).Vulnerablepopulationsincludechild workers, unemployed adults, and those, particularly at older ages,withoutaccesstoasystemofsocialprotection.AlthoughthedemographicweightofolderpeopleremainslimitedinSouthAsia,theirnumberisrisingand,inIndiaforexample,thequestionofpopulationageingisanemergingconcern (Bose and Shankardass, 2004). The country today has more than80million people over age 60 and by 2016 is likely to have more than110million.Sincehalfofallmenoverage60,andmorethan70%ofwomen,areeconomicallydependentonotherpeople,theireconomicsecurityissettobecomeacrucialissue.
Anotherformofvulnerabilityislinkedtotheproblemofurbanhousingamongthepoorestpopulationsasevidencedbythespontaneoussettlementsandshantytownsthatspringuponcityoutskirts.UN-Habitatestimatesthatover230millionpeople lived inshanty towns inSouthAsia in2001(42).Accordingtothesamesource,shantytown-dwellersnumbered30millioninBangladesh,36millioninPakistanand158millioninIndia.Inadditiontoeconomicandsocialvulnerability,thepopulationsmayalsofaceecologicalvulnerability.
(39)The district-level map of sex ratios in the population aged 0-6 shows this phenomenon tobeverycircumscribed in India (Dysonetal.,2004).Foran in-depthanalysis, see thearticlebyGuilmotointhisissue.
(40)The role played by declining fertility in the emergence of this form of discrimination is amatterfordebate(DasGupta,1987;DasGuptaandBhat,1997;BhatandZavier,2003).ThisformofdiscriminationagainstgirlshasnotaccompaniedfertilitydeclineinSouthernIndia.
(41)Theproblemoffoodsecurityalsoarises(forIndia,seeUNFPA,1997).
(42)UN-Habitat,http://ww2.unhabitat.org/programmes/guo/statistics.asp
02_INE_Pop0108_007_090.indd 66 23/06/2008 14:36:35

the deMograPhy of south asia froM the 1950s to the 2000s
67
Environmental vulnerability
LivingconditionsforalargeproportionofthepopulationofBangladeshintheGanges-Brahmaputradeltaareparticularlyhazardous.Highpopulationdensitiesmeanthateachepisodeoffloodingproduceslargenumbersofvictims.ThehistoryofnaturaldisastersinBangladeshoverthelasttwohundredyearsrevealsthefullextentofthecountry’sexposuretoecologicalhazards(Table29).Inlate2007,theagriculturalsectorwasagainbadlyhitbyatropicalcyclone,withlossestonearly7millionpeople.
Table 29. Major disasters in Bangladesh over two centuries
Years Event Losses
1769-1776 Great famine of Bengal Nearly one-third reduction in the Bengal population, though impact was lighter in West Bengal
1784-1788 Floods and famine. Brahmaputra River changed its course
Unknown
1873-1874 Famine Unknown
1876 Bakerganj cycloneand tidal wave
Around 400,000 deaths
1884-1885 Famine Unknown
1897 Chittagong cyclone Around 175,000 deaths
1918-1919 Spanish influenza Around 400,000 deaths
1943 Bengal famine Between 2 and 2.5 million deaths
1947 Partition of India Unknown. Total deaths in partition numbered 1 million, but most occurred in the West
1970 Cyclone and tidal wave Between 200,000 and 500,000 deaths
1971 War of Independence Around 500,000 deaths
1974 Famine Official death toll 30,000, but some estimates are much higher (including reference to 500,000 deaths with 80,000 for the Rangpur district alone).
Source: W. Brian Arthur and Geoffrey McNicoll, “An analytical survey of population and development in Bangladesh”, Population and Development Review, 4(1), March 1978, p. 29, cited by Escap (1981).
Inothercountriesoftheregion,suchasIndia,theMaldivesorSriLanka,substantialproportionsofthepopulationareseverelyexposedtorisingwaterlevels.Theearlierperiodofrapidpopulationgrowthinthesecountriesbroughtalargeincreaseinpopulationdensities.InIndia,averagepopulationdensityrosefrom77inhabitantspersq.kmin1901to324in2001;itcurrentlystandsat over 800 inhabitants per sq.km in Kerala and 900in West Bengal. Theresultingpressureonlandhasledtoincreasedsettlementincoastalzones,whicharebarelyabovesealevel.Theconsequencesofthe2004tsunamiwereparticularlydisastrousinSriLanka,intheIndianstatesofTamilNaduandKerala,andintheMaldives,allofwhichhadlargepopulationslivingatsealevel. In India, it left 11,000 persons dead, 5,600 missing and around7,000injured. The worst affected Indian state, Tamil Nadu, alone counted
02_INE_Pop0108_007_090.indd 67 23/06/2008 14:36:35

J. Véron
68
8,000dead(43).InSriLanka,thetsunamicaused40,000deathsanddisplaced2.5 million persons. Rising water levels due to climate change threaten agrowing number of people in Bangladesh, India, the Maldives and SriLanka.
Conclusion
Todayhometoapopulationofaround1.6billionpeople,SouthAsiaisaregionofcontrastsinbothitsgeographyanddemography.WhereAfghanistaniscomposedmainlyofmountainsandincludesnumeroushighpeaks,mostofSriLankaisoccupiedbyplains.Itisbetweenthesetwocountriesalsothatthedemographiccontrastsaresharpest.MortalityinAfghanistan,thoughithasfallen,isstillextremelyhigh,sincelifeexpectancyatbirthscarcelyexceeds40years,whereas inSriLankamean lengthof lifewasover70years in2000-2005.AndwhereasdemographictransitionhasnotbeguninAfghanistan,inSriLankaitiscomplete.Oneconsequenceofthesechangesinmortalityandfertility isthatthepopulationofAfghanistanisstillextremelyyoung(medianage16in2005)whilethatofSriLankaismucholder(medianagecloseto30).Theothercountriesoftheregion–Bangladesh,Bhutan,India,theMaldives,NepalandPakistan–are in intermediatepositions foralldemographicindicators.Inallofthemthedemographictransitionisunderway.Mortalityhasfallenappreciablyandlifeexpectancyatbirthis62yearsminimum.Fertilityhasfalleneverywherethoughlargedifferencesremain:womeninBhutanandtheMaldivesproducefewerthanthreechildrenwhereasthefigureisstillfourinPakistan.
Fromademographicpointofview,SouthAsiaisheavilydominatedbyIndia,whoseterritorycontainsmorethantwo-thirdsoftheregion’spopulation.Afterafour-foldincreaseinitspopulationoverahundredyears,Indiasoughttolimitpopulationgrowththroughbirthcontrolprogrammesfromtheearly1950s,andtodaythecountry’sdemographictransitioniswelladvanced.Buttherearelargeregionaldisparities.TheNationalFamilyandHealthSurveyof2005-2006showsthatinfantmortality–average57‰forthecountryasawhole–rangesbystatebetween15‰(KeralaandGoa)and71‰(Chhattisgarh).Onfertility,theaverageforIndiais2.1childrenperwoman,andthevariationisbetween1.8(AndhraPradeshandGoa)and4(Bihar).
In terms of development, the different countries face broadly thesamechallenges:findingemployment for largeworking-agepopulations,reducingpoverty,creatingasystemofsocialprotectionforthepoorandtheold,andendingthevariousformsofdiscriminationagainstwomen.Otherchallengesaremorespecifictoparticularcountries.Bangladesh,PakistanandIndiamustfindwaystosustainthegrowthofurbanagglomerationswithover
(43)DatafromtheAsianDevelopmentBank.
02_INE_Pop0108_007_090.indd 68 23/06/2008 14:36:35

the deMograPhy of south asia froM the 1950s to the 2000s
69
10millioninhabitants,Thesameistrueforaccesstoeducation:inSriLankaandtheMaldivesthisisbarelyanissue–literacylevelsareabove90%–butthequestionofeducationis importantinBangladeshandPakistan(whereliteracyratesareonly48%and50%)andfundamentalinAfghanistan(whereliteracywasonly28%in2000).Thesecountriesalsofacethechallengeofreducinggenderinequalitiesinaccesstoeducation.
By2040,SouthAsiacanexpecttohave2.2billioninhabitants,representinganadditional600millioninhabitantswithrespecttoitspresentpopulation.Immensechallengeswillneedtobeovercomeifthecountriesofthisregionaretoachieveevenamodestdegreeofsustainabledevelopment.
Acknowledgements Theauthorwould liketothankCédricYaëlMathieuforhisvaluableandeffectiveassistanceincompilingthedatabase.
02_INE_Pop0108_007_090.indd 69 23/06/2008 14:36:35
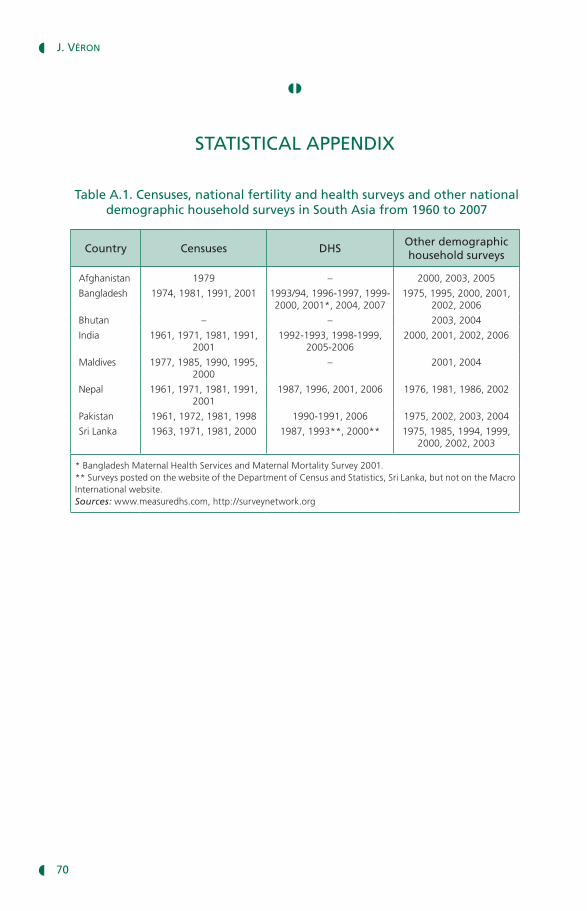
J. Véron
70
º»
STATISTICAL APPENDIX
Table A.1. Censuses, national fertility and health surveys and other national demographic household surveys in South Asia from 1960 to 2007
Country Censuses DHSOther demographic household surveys
Afghanistan 1979 – 2000, 2003, 2005
Bangladesh 1974, 1981, 1991, 2001 1993/94, 1996-1997, 1999-2000, 2001*, 2004, 2007
1975, 1995, 2000, 2001, 2002, 2006
Bhutan – – 2003, 2004
India 1961, 1971, 1981, 1991, 2001
1992-1993, 1998-1999, 2005-2006
2000, 2001, 2002, 2006
Maldives 1977, 1985, 1990, 1995, 2000
– 2001, 2004
Nepal 1961, 1971, 1981, 1991, 2001
1987, 1996, 2001, 2006 1976, 1981, 1986, 2002
Pakistan 1961, 1972, 1981, 1998 1990-1991, 2006 1975, 2002, 2003, 2004
Sri Lanka 1963, 1971, 1981, 2000 1987, 1993**, 2000** 1975, 1985, 1994, 1999, 2000, 2002, 2003
* Bangladesh Maternal Health Services and Maternal Mortality Survey 2001.** Surveys posted on the website of the Department of Census and Statistics, Sri Lanka, but not on the Macro International website.Sources: www.measuredhs.com, http://surveynetwork.org
02_INE_Pop0108_007_090.indd 70 23/06/2008 14:36:35

the deMograPhy of south asia froM the 1950s to the 2000s
71
Tab
le A
.2. L
and
are
a an
d d
ensi
ties
in 2
000,
an
d p
op
ula
tio
n o
f th
e co
un
trie
s o
f So
uth
Asi
a, 1
950-
2040
Co
un
try
His
tory
Lan
d a
rea
(th
ou
san
d
sq. k
m)
Gro
ss
den
sity
(i
nh
ab. p
er
sq.k
m)
Den
sity
per
sq
. km
of
arab
le la
nd
Nu
mb
er o
f in
hab
itan
ts (
in t
ho
usa
nd
s)
Co
lon
izin
g
cou
ntr
yIn
dep
end
ence
in
1950
1970
1990
2000
2010
2040
Afg
hani
stan
Uni
ted
Kin
gdom
1919
652
3226
28,
151
11,8
4012
,659
20,7
3730
,389
66,3
74
Bang
lade
shPa
kist
an19
7114
496
81,
725
43,8
5269
,817
113,
049
139,
434
166,
638
238,
600
Bhut
anU
nite
d K
ingd
om19
4947
1239
916
829
854
755
968
490
0
Indi
aU
nite
d K
ingd
om19
473,
287
318
652
371,
857
549,
312
860,
195
1,04
6,23
51,
220,
182
1,59
6,71
9
Mal
dive
sU
nite
d K
ingd
om19
650.
391
6–
8212
121
627
332
347
6
Nep
alU
nite
d K
ingd
om19
2314
716
61,
051
8,64
312
,155
19,1
1424
,419
29,8
9847
,185
Paki
stan
Uni
ted
Kin
gdom
1947
796
181
678
36,9
4459
,565
112,
991
144,
360
173,
351
268,
506
Sri L
anka
Uni
ted
Kin
gdom
1948
6628
52,
091
7,33
912
,342
17,1
1418
,714
19,5
7619
,671
Sou
rces
: Uni
ted
Nat
ions
Com
mon
Dat
abas
e (h
ttp
://u
nsta
ts.u
n.or
g/u
nsd
/cdb
/) a
nd W
orld
Pop
ulat
ion
Pros
pect
s: T
he 2
00
6 Re
visi
on (h
ttp
://w
ww
.un.
org
/esa
/pop
ulat
ion
/pub
licat
ions
/w
pp20
06
/wpp
200
6.ht
m);
FA
O S
tatis
tica
l Yea
rboo
k, 2
005
-20
06
for
arab
le la
nd; P
ison
(20
07),
“Th
e po
pula
tion
of
the
wor
ld”,
Pop
ulat
ion
& S
ocie
ties,
436
.
02_INE_Pop0108_007_090.indd 71 23/06/2008 14:36:35

J. Véron
72
Tab
le A
.3. B
irth
rat
e, d
eath
rat
e an
d t
ota
l gro
wth
rat
e in
th
e co
un
trie
s o
f So
uth
Asi
a, 1
950-
2005
Co
un
try
Cru
de
bir
th r
ate
(‰)
Cru
de
dea
th r
ate
(‰)
Mea
n a
nn
ual
gro
wth
rat
e (%
)
1950
- 19
5519
60-
1965
1970
- 19
7519
80-
1985
1990
- 19
9520
00-
2005
1950
- 19
5519
60-
1965
1970
- 19
7519
80-
1985
1990
- 19
9520
00-
2005
1950
- 19
5519
60-
1965
1970
- 19
7519
80-
1985
1990
- 19
9520
00-
2005
Afg
hani
stan
52.1
52.2
51.5
51.1
52.1
49.7
36.7
32.5
27.8
24.1
22.6
21.6
1.54
1.97
2.37
– 2.
467.
323.
79
Bang
lade
sh48
.448
.643
.639
.933
.627
.828
.523
.518
.915
.011
.18.
21.
982.
502.
472.
472.
221.
89
Bhut
an46
.747
.746
.442
.335
.722
.426
.825
.621
.917
.112
.67.
83.
092.
633.
682.
57–
1.53
2.63
Indi
a43
.340
.737
.334
.330
.725
.126
.020
.215
.111
.69.
88.
71.
732.
042.
222.
262.
081.
62
Mal
dive
s45
.240
.940
.541
.736
.622
.227
.320
.815
.911
.88.
96.
51.
772.
012.
462.
992.
781.
57
Nep
al43
.943
.642
.040
.138
.130
.228
.124
.620
.215
.912
.08.
71.
491.
772.
172.
302.
512.
08
Paki
stan
44.5
44.2
42.9
44.1
38.7
27.5
23.1
19.3
15.6
12.9
9.8
7.7
2.15
2.47
2.74
3.63
2.46
1.82
Sri L
anka
39.9
34.3
30.2
25.3
20.4
16.3
11.4
8.9
7.5
6.3
6.5
7.3
2.82
2.46
2.05
1.39
1.10
0.43
Sou
rce
: Uni
ted
Nat
ions
(20
07a)
.
02_INE_Pop0108_007_090.indd 72 23/06/2008 14:36:36

the deMograPhy of south asia froM the 1950s to the 2000s
73
Tab
le A
.4. M
edia
n a
ge
at fi
rst
mar
riag
e (m
en a
nd
wo
men
), p
reva
len
ce o
f p
oly
gyn
y an
d p
rop
ort
ion
of
nev
er-m
arri
ed w
om
en
in t
he
cou
ntr
ies
of
Sou
th A
sia
Co
un
try
Dat
e o
f la
test
D
HS
surv
ey
Med
ian
ag
e at
firs
t
mar
riag
e (y
ears
)A
ge
d
iffe
ren
ce
bet
wee
n
spo
use
s
Perc
enta
ge
of
wo
men
in
po
lyg
amo
us
un
ion
sPe
rcen
tag
e o
f
nev
er-m
arri
ed
wo
men
ag
ed
40-4
9M
enW
om
enag
e 15
-49
age
35-4
4
Afg
hani
stan
–
Bang
lade
sh20
0424
.514
.89.
7
0.
2
Bhut
an–
Indi
a20
05-2
006
23.4
17.2
6.2
0.6
(age
45-
49)
Mal
dive
s–
Nep
al20
0620
.617
.23.
44.
46.
21.
2 (a
ge 4
5-49
)
Paki
stan
1990
-199
1, 2
006*
18
.6
4.5
4.2
0.4
Sri L
anka
1987
22
.4
5.1
* A
naly
sis
in p
rogr
ess.
Sou
rce
: DH
S su
rvey
s.
02_INE_Pop0108_007_090.indd 73 23/06/2008 14:36:36

J. Véron
74
Tab
le A
.5. T
ota
l fer
tilit
y ra
te a
nd
net
rep
rod
uct
ion
rat
e in
th
e co
un
trie
s o
f So
uth
Asi
a
Co
un
try
Tota
l fer
tilit
y ra
te(a
)N
et r
epro
du
ctio
n r
ate(b
)
1950
- 19
5519
60-
1965
1970
- 19
7519
80-
1985
1990
- 19
9520
00-
2005
1950
- 19
5519
60-
1965
1970
- 19
7519
80-
1985
1990
- 19
9520
00-
2005
Afg
hani
stan
7.70
7.70
7.70
7.80
8.00
7.48
1.62
1.79
2.01
2.23
2.40
2.27
Bang
lade
sh6.
706.
856.
155.
254.
123.
221.
862.
072.
011.
871.
631.
38
Bhut
an6.
676.
676.
676.
425.
392.
911.
751.
832.
022.
192.
071.
25
Indi
a5.
915.
825.
264.
503.
863.
111.
631.
821.
861.
741.
561.
30
Mal
dive
s7.
007.
007.
006.
805.
552.
811.
902.
192.
452.
642.
281.
24
Nep
al6.
066.
065.
795.
515.
003.
681.
601.
741.
831.
931.
941.
55
Paki
stan
6.60
6.60
6.60
6.60
5.80
3.99
1.97
2.16
2.34
2.51
2.37
1.68
Sri L
anka
5.70
5.12
4.12
3.16
2.48
2.02
2.22
2.15
1.80
1.45
1.17
0.96
(a) S
um o
f age
-spe
cific
fert
ility
rate
s ob
serv
ed o
ver a
giv
en p
erio
d. T
he T
FR c
an b
e in
terp
rete
d as
the
aver
age
num
ber o
f chi
ldre
n th
at a
wom
an w
ould
bea
r thr
ough
out h
er re
prod
ucti
ve
life
if sh
e w
ere
to e
xper
ienc
e th
e fe
rtili
ty r
ates
of
the
peri
od a
t ea
ch a
ge. I
t do
es n
ot t
ake
mor
talit
y in
to a
ccou
nt.
(b) A
vera
ge n
umbe
r of
dau
ghte
rs t
hat
a w
oman
wou
ld b
ear
thro
ugho
ut h
er r
epro
duct
ive
life
if sh
e w
ere
to e
xper
ienc
e th
e fe
rtili
ty a
nd m
orta
lity
rate
s of
the
per
iod
at e
ach
age.
Sou
rce
: Uni
ted
Nat
ions
(20
07a)
, Wor
ld P
opul
atio
n Pr
ospe
cts:
The
20
06
Revi
sion
, htt
p:/
/ww
w.u
n.or
g/e
sa/p
opul
atio
n/p
ublic
atio
ns/w
pp20
06
/wpp
200
6.ht
m
02_INE_Pop0108_007_090.indd 74 23/06/2008 14:36:36

the deMograPhy of south asia froM the 1950s to the 2000s
75
Tab
le A
.6. M
ost
rec
ent
ind
ices
of
leve
l, ti
min
g a
nd
ch
arac
teri
stic
s o
f fe
rtili
ty in
th
e co
un
trie
s o
f So
uth
Asi
a
Co
un
try
Dat
e
of
la
test
av
aila
ble
D
HS
surv
ey
Tota
l fe
rtili
ty
rate
Nu
mb
er
of
ch
ildre
n
at a
ge
40-4
9
Idea
l nu
mb
er
of
ch
ildre
n
at a
ge
25-3
4
Med
ian
ag
e at
fi
rst
bir
th
Perc
enta
ge
o
f ad
ole
scen
t w
om
en w
ho
hav
e w
ho
hav
e b
egu
n
child
bea
rin
g
Perc
enta
ge
o
f fe
rtili
ty
ach
ieve
d
bef
ore
ag
e 25
Inte
rval
b
etw
een
b
irth
s(m
on
ths)
Afg
hani
stan
–
Bang
lade
sh20
043.
004.
202.
317
.632
.754
.039
.3
Bhut
an–
Indi
a20
05-2
006
2.68
3.48
2.4
20.0
55
.831
.1
Mal
dive
s–
Nep
al20
013.
104.
002.
819
.918
.553
.033
.6
Paki
stan
1990
-199
15.
405.
404.
121
.315
.729
.029
.1
Sri L
anka
1987
2.80
2.
924
.0
32.7
Sou
rce
: DH
S su
rvey
s.
02_INE_Pop0108_007_090.indd 75 23/06/2008 14:36:36

J. Véron
76
Tab
le A
.7. B
reas
tfee
din
g, p
ost
par
tum
sex
ual
ab
stin
ence
an
d c
on
trac
epti
on
in t
he
cou
ntr
ies
of
sou
th A
sia
Co
un
try
Dat
e
of
late
st
avai
lab
le
DH
S su
rvey
Med
ian
d
ura
tio
n
of
bre
astf
eed
ing
(m
on
ths)
Med
ian
d
ura
tio
n
of
po
stp
artu
m
abst
inen
ce
(mo
nth
s)
Co
ntr
acep
tive
pre
vale
nce
(%
)(w
om
en a
ged
15-
49, m
arri
ed o
r in
a u
nio
n)
Perc
enta
ge
o
f m
arri
ed
wo
men
ag
ed 4
0-49
re
mai
nin
g
child
less
All
met
ho
ds
Mo
der
n
met
ho
ds
Co
nd
om
Afg
hani
stan
–
4.
83.
60.
0
Bang
lade
sh20
0428
.82.
058
.147
.34.
31.
5
Bhut
an–
18.8
18.8
0.3
Indi
a20
05-2
006
24.4
2.3
48.2
42.8
3.1
2.2
Mal
dive
s–
42.0
33.0
6.0
Nep
al20
0129
.52.
139
.335
.42.
91.
8
Paki
stan
1990
-199
119
.82.
327
.620
.25.
53.
4
Sri L
anka
1987
22.7
4.2
70.0
49.6
3.7
2.7
Sou
rces
: DH
S su
rvey
s, S
tatc
ompi
ler;
Uni
ted
Nat
ions
, Sta
tisti
cs D
ivis
ion
(htt
p:/
/uns
tats
.un.
org
/uns
d/d
atab
ases
.htm
).
02_INE_Pop0108_007_090.indd 76 23/06/2008 14:36:36

the deMograPhy of south asia froM the 1950s to the 2000s
77
Tab
le A
.8. L
ife
exp
ecta
ncy
an
d in
fan
t m
ort
alit
y in
th
e co
un
trie
s o
f So
uth
Asi
a, 1
950-
2005
Co
un
try
Life
exp
ecta
ncy
(ye
ars)
Infa
nt
mo
rtal
ity
rate
(p
er t
ho
usa
nd
)
1950
- 19
5519
60-
1965
1970
- 19
7519
80-
1985
1990
- 19
9520
00-
2005
1950
- 19
5519
60-
1965
1970
- 19
7519
80-
1985
1990
- 19
9520
00-
2005
Afg
hani
stan
28.8
32.0
36.1
39.9
41.7
42.1
275.
324
5.6
211.
618
3.6
171.
116
8.1
Bang
lade
sh37
.541
.245
.350
.056
.062
.020
0.5
174.
114
8.0
120.
489
.061
.3
Bhut
an36
.137
.741
.847
.954
.563
.518
4.8
174.
114
9.2
117.
187
.552
.7
Indi
a37
.443
.650
.756
.660
.262
.916
5.7
140.
311
6.8
94.7
77.2
62.5
Mal
dive
s38
.945
.251
.457
.161
.065
.618
5.2
151.
812
0.6
93.6
65.1
45.8
Nep
al36
.239
.444
.049
.655
.761
.321
0.9
187.
015
6.1
122.
990
.664
.5
Paki
stan
43.4
47.7
51.9
56.2
60.8
63.6
168.
614
7.7
127.
610
8.0
87.0
75.4
Sri L
anka
57.6
62.2
65.0
68.8
70.4
70.8
76.6
62.6
49.
928
.917
.012
.4
Sou
rce
: Uni
ted
Nat
ions
(20
07a)
, Wor
ld P
opul
atio
n Pr
ospe
cts:
the
20
06
Revi
sion
, htt
p:/
/ww
w.u
n.or
g/e
sa/p
opul
atio
n/p
ublic
atio
ns/w
pp20
06
/wpp
200
6.ht
m
02_INE_Pop0108_007_090.indd 77 23/06/2008 14:36:36

J. Véron
78
Tab
le A
.9. C
on
dit
ion
s o
f d
eliv
ery,
mo
rtal
ity
and
hea
lth
of
child
ren
in t
he
cou
ntr
ies
of
Sou
th A
sia
Co
un
try
Pro
bab
ility
of
dyi
ng
(‰
)Pe
rcen
tag
e
of
bir
ths
wit
h a
t le
ast
on
e an
ten
atal
ex
amin
atio
n
Perc
enta
ge
o
f d
eliv
erie
s at
ten
ded
by
ski
lled
hea
lth
p
erso
nn
el
Perc
enta
ge
o
f ch
ildre
n
vacc
inat
ed(a
)
Perc
enta
ge
o
f ch
ildre
n
mal
no
uri
shed
(b)
Neo
nat
alB
elo
w o
ne
year
(200
5)A
ge
0-5
(200
5)
Afg
hani
stan
6016
525
752
(200
3)14
(200
3)
53.6
(199
7)
Bang
lade
sh36
5473
39(1
999-
2000
)13
(200
4)73
.1(2
004)
50.5
(200
4)
Bhut
an30
6575
51(2
005)
47
.7(1
999)
Indi
a39
5674
65(1
998-
1999
)48
(200
6)42
(199
9)51
(199
8-19
99)
Mal
dive
s24
3359
98(2
000)
70(2
001)
31
.9(2
001)
Nep
al32
5688
49(2
001)
19(2
006)
82.8
(200
6)57
.1(2
001)
Paki
stan
5380
100
31(2
005)
35.1
(199
1)41
.5(2
001)
Sri L
anka
812
1497
(200
0)67
.3(1
987)
18.4
(200
0)
(a) C
hild
ren
who
hav
e re
ceiv
ed a
ll va
ccin
es (
BCG
, DPT
, pol
io a
nd m
easl
es).
(b) C
hild
ren
unde
r 5
with
stu
nted
gro
wth
.So
urc
es: U
nite
d N
atio
ns, W
orld
Hea
lth S
tatis
tics
2007
, (ht
tp:/
/ww
w.w
ho.in
t/w
hosi
s/w
host
at20
07) ;
DH
S su
rvey
s.
02_INE_Pop0108_007_090.indd 78 23/06/2008 14:36:37

the deMograPhy of south asia froM the 1950s to the 2000s
79
Table A.10. Maternal mortality and HIV prevalence at ages 15-49 in the countries of South Asia
CountryMaternal mortality rate
in 2000(for 100,000 births)
Prevalence rate of HIV in 2005 in the population
aged 15-49 (%)
Afghanistan 1,900 < 0.1
Bangladesh 380 < 0.1
Bhutan 420 < 0.1
India 540 0.9
Maldives 110 –
Nepal 740 0.5
Pakistan 500 0.1
Sri Lanka 92 < 0.1
Sources: WHO, World Health Report 2005, p. 245 (http://www.who.int); UNAIDS, 2006 Report on the Global AIDS Epidemic, (http://www.unaids.org).
02_INE_Pop0108_007_090.indd 79 23/06/2008 14:36:37
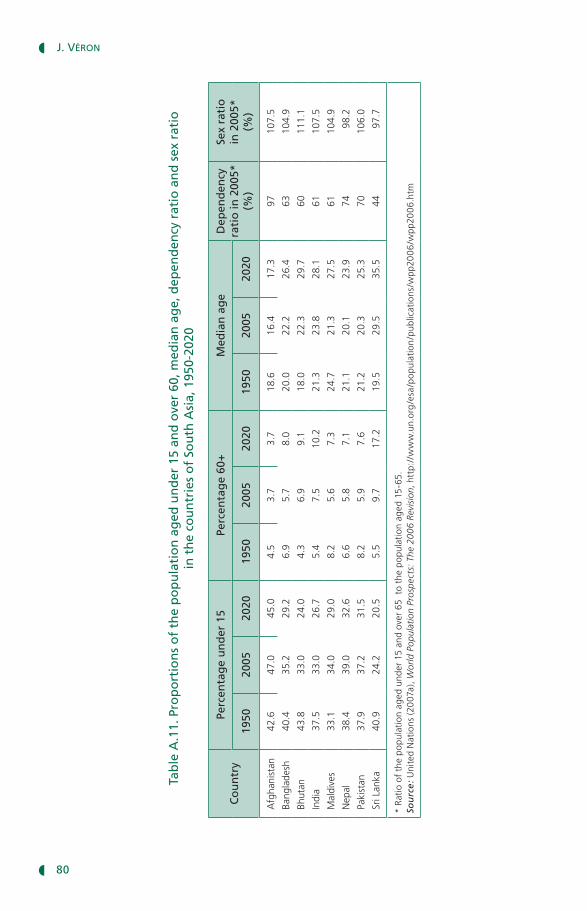
J. Véron
80
Tab
le A
.11.
Pro
po
rtio
ns
of
the
po
pu
lati
on
ag
ed u
nd
er 1
5 an
d o
ver
60, m
edia
n a
ge,
dep
end
ency
rat
io a
nd
sex
rat
io
in t
he
cou
ntr
ies
of
Sou
th A
sia,
195
0-20
20
Co
un
try
Perc
enta
ge
un
der
15
Perc
enta
ge
60+
Med
ian
ag
eD
epen
den
cy
rati
o in
200
5*
(%)
Sex
rati
o
in 2
005*
(%
) 19
5020
0520
2019
5020
0520
2019
5020
0520
20
Afg
hani
stan
42.6
47.0
45.0
4.5
3.7
3.7
18.6
16.4
17.3
9710
7.5
Bang
lade
sh40
.435
.229
.26.
95.
78.
020
.022
.226
.463
104.
9
Bhut
an43
.833
.024
.04.
36.
99.
118
.022
.329
.760
111.
1
Indi
a37
.533
.026
.75.
47.
510
.221
.323
.828
.161
107.
5
Mal
dive
s33
.134
.029
.08.
25.
67.
324
.721
.327
.561
104.
9
Nep
al38
.439
.032
.66.
65.
87.
121
.120
.123
.974
98.2
Paki
stan
37.9
37.2
31.5
8.2
5.9
7.6
21.2
20.3
25.3
7010
6.0
Sri L
anka
40.9
24.2
20.5
5.5
9.7
17.2
19.5
29.5
35.5
4497
.7
* Ra
tio
of t
he p
opul
atio
n ag
ed u
nder
15
and
over
65
to
the
popu
lati
on a
ged
15-6
5.So
urc
e: U
nite
d N
atio
ns (2
007
a), W
orld
Pop
ulat
ion
Pros
pect
s: T
he 2
00
6 Re
visi
on, h
ttp
://w
ww
.un.
org
/esa
/pop
ulat
ion
/pub
licat
ions
/wpp
200
6/w
pp20
06.
htm
02_INE_Pop0108_007_090.indd 80 23/06/2008 14:36:37

the deMograPhy of south asia froM the 1950s to the 2000s
81
Table A.12. International migration, refugees and displaced populations in the countries of South Asia
Country
Migrant stock(a) in 2005 Net migration
rate(b) 2000-2005
(%)
Number ofrefugees(c)
in 2005 (thousands)
Population under UNHCR
mandate(d) in 2005
(thousands)
Number (in thousands)
Percentage of total
population
Afghanistan 43 0.1 16.0 0.0 911.7
Bangladesh 1,032 0.7 – 0.5 21.1 271.2
Bhutan 10 1.6* 0 to
India 5,700 0.5 – 0.3 139.3 139.6
Maldives 3 1.0 0.0
Nepal 819 3.0 – 0.8 126.4 538.6
Pakistan 3,254 2.1 – 2.4 1,084.7 1,088.1
Sri Lanka 368 1.8 – 1.6 0.1 354.8
* Figure corrected in accordance with the population size given by the United Nations (2006a)(a) Defined as the number of people born outside the country.(b) Defined as the annual number of immigrants minus the annual number of emigrants between 2000 and 2005 divided by the average total population of the country.(c) Persons with refugee status under the various international conventions currently in force.(d) Total number of foreign refugees, asylum seekers, return refugees and internally displaced individuals under UNHCR protection.Sources: United Nations (2006), International Migration 2006; UNHCR (2006), Statistical Yearbook 2005 (http://www.unhcr.fr/cgi-bin/texis/vtx/statistics/).
02_INE_Pop0108_007_090.indd 81 23/06/2008 14:36:37

J. Véron
82
Tab
le A
.13.
Dev
elo
pm
ent
ind
icat
ors
in t
he
cou
ntr
ies
of
Sou
th A
sia
Co
un
try
Perc
enta
ge
urb
an(a
) in
200
4
GN
I per
ca
pit
a
(USD
PPP
)(b)
in 2
004
Perc
enta
ge
of
illit
erat
es
aged
15
and
o
ver
in 2
004
Net
rat
e
of
pri
mar
y sc
ho
ol
enro
lmen
t
in 2
004
Hu
man
dev
elo
pm
ent
ind
ex(c
)
Hu
man
p
ove
rty
in
dex
(H
PI-1
)(d)
Gen
der
- re
late
d
dev
elo
pm
ent
ind
ex(e
)19
8020
04W
orl
d
ran
kin
g
2004
Afg
hani
stan
(f)
– –
– –
– –
––
–
Bang
lade
sh24
.71,
870
58.4
(g)
940.
366
0.53
013
744
.20.
524
Bhut
an10
.8*
1,96
9 –
– –
0.53
813
539
.0–
Indi
a28
.53,
139
39.0
900.
439
0.61
112
631
.30.
591
Mal
dive
s29
.2 –
3.7
90 –
0.73
998
16.9
–
Nep
al15
.31,
490
51.4
780.
336
0.52
713
838
.10.
513
Paki
stan
34.5
2,22
550
.166
0.38
80.
539
134
36.3
0.51
3
Sri L
anka
15.2
4,39
09.
397
0.65
30.
755
93
17.7
0.74
9
*The
Uni
ted
Nat
ions
(20
08
) giv
e a
perc
enta
ge u
rban
of
31.0
% f
or 2
005
.(a
) Uni
ted
Nat
ions
cal
cula
tion
s ba
sed
on n
atio
nal d
efini
tion
s.(b
) Per
cap
ita
gros
s na
tion
al in
com
e ca
lcul
ated
by
the
Wor
ld B
ank
in t
erm
s of
pur
chas
ing
pow
er p
arit
y (P
PP).
(c) C
ompo
site
inde
x m
easu
ring
hum
an d
evel
opm
ent,
incl
udin
g lif
e ex
pect
ancy
, ad
ult
liter
acy
rate
s, s
choo
l enr
olm
ent
rati
os a
nd p
er c
apit
a G
DP.
The
clo
ser
it is
to
1, t
he b
ette
r th
e si
tuat
ion.
(d) N
ot d
ated
. Com
posi
te in
dex
mea
surin
g de
priv
atio
ns in
hea
lth, e
duca
tion
and
sta
ndar
d of
livi
ng.T
he c
lose
r it
is t
o 0,
the
bet
ter
the
situ
atio
n.(e
) Inde
x ba
sed
on t
he s
ame
crite
ria a
nd t
ypes
of
mea
sure
as
the
HD
I, bu
t re
flect
ing
ineq
ualit
ies
betw
een
men
and
wom
en.
(f) U
ND
P ha
s no
t ca
lcul
ated
indi
ces
for
this
cou
ntry
.(g
) In 2
003
.So
urc
es: U
ND
P (2
00
6),
Hum
an D
evel
opm
ent
Repo
rt 2
00
6, (
http
://h
dr.u
ndp.
org
) ; U
nite
d N
atio
ns, U
Nst
at.
02_INE_Pop0108_007_090.indd 82 23/06/2008 14:36:37

the deMograPhy of south asia froM the 1950s to the 2000s
83
Tab
le A
.14.
Sch
oo
l en
rolm
ent
and
ad
ult
lite
racy
by
sex
in t
he
cou
ntr
ies
of
Sou
th A
sia
Co
un
try
Lite
racy
rat
e at
ag
e 15
an
d o
ver
(2
000-
2004
)N
et p
rim
ary
sch
oo
l en
rolm
ent
rati
o
(sch
oo
l yea
r en
din
g in
200
4)
Men
Wo
men
Ove
rall
F/M
rat
ioM
ale
Fem
ale
Ove
rall
F/M
(%
)
Afg
hani
stan
4313
280.
30 –
– –
–
Bang
lade
sh52
3343
0.63
9396
941.
03
Bhut
an–
––
––
––
–
Indi
a73
4861
0.66
9287
900.
94
Mal
dive
s96
9696
1.00
8990
901.
01
Nep
al63
3549
0.56
8474
790.
87
Paki
stan
6336
500.
5776
5666
0.73
Sri L
anka
9289
910.
97–
–98
–
Sou
rce
: Une
sco
(20
07),
EFA
Glo
bal M
onito
ring
Repo
rt.
02_INE_Pop0108_007_090.indd 83 23/06/2008 14:36:37

J. Véron
84
Tab
le A
.15.
Ind
icat
ors
of
nu
pti
alit
y, f
erti
lity
and
sex
pre
fere
nce
in In
dia
, 199
8-19
99
Med
ian
ag
e
at fi
rst
mar
riag
e (y
ears
)
Tota
l fe
rtili
ty
rate
Med
ian
d
ura
tio
n
of
bre
ast-
fe
edin
g
(mo
nth
s)
Perc
enta
ge
of
child
ren
va
ccin
ated
Inte
rval
b
etw
een
b
irth
s(m
on
ths)
Idea
l n
um
ber
o
f ch
ildre
n
Pref
er t
o
hav
e m
ore
b
oys
th
an
gir
ls (
%)
Pref
er t
o
hav
e m
ore
g
irls
th
an
bo
ys (
%)
Perc
enta
ge
of
bir
ths
wit
h a
t
leas
t o
ne
ante
nat
al
exam
inat
ion
No
rth
Del
hi19
.02.
422
.669
.833
.62.
423
.12.
683
.5
Har
yana
16.9
2.9
24.3
62.7
30.0
2.5
37.5
0.5
58.1
Him
acha
l Pra
desh
18.6
2.1
24.1
83.4
29.4
2.2
25.9
0.6
86.8
Jam
mu
and
Kas
hmir
18.2
2.7
29.5
56.7
32.5
2.7
38.0
2.7
83.2
Penj
ab20
.02.
221
.272
.128
.02.
329
.10.
474
.0
Raja
stha
n15
.13.
825
.517
.329
.52.
847
.51.
347
.5
Cen
tre
Mad
hya
Prad
esh
14.7
3.3
36.0
22.4
30.2
2.9
42.5
2.9
61.0
Utt
ar P
rade
sh15
.04.
025
.821
.230
.43.
153
.31.
434
.6
East
Biha
r14
.93.
536
.011
.032
.33.
347
.92.
136
.3
Oris
sa17
.52.
536
.043
.732
.92.
737
.62.
179
.5
Wes
t Be
ngal
16.8
2.3
36.0
43.8
33.6
2.4
20.7
3.4
90.0
02_INE_Pop0108_007_090.indd 84 23/06/2008 14:36:38

the deMograPhy of south asia froM the 1950s to the 2000s
85
Tab
le A
.15
(co
nt’
d).
Ind
icat
ors
of
nu
pti
alit
y, f
erti
lity
and
sex
pre
fere
nce
in In
dia
, 199
8-19
99
Med
ian
ag
e
at fi
rst
mar
riag
e (y
ears
)
Tota
l fe
rtili
ty
rate
Med
ian
d
ura
tio
n
of
bre
ast-
fe
edin
g
(mo
nth
s)
Perc
enta
ge
of
child
ren
va
ccin
ated
Inte
rval
b
etw
een
b
irth
s(m
on
ths)
Idea
l n
um
ber
o
f ch
ildre
n
Pref
er t
o
hav
e m
ore
b
oys
th
an
gir
ls (
%)
Pref
er t
o
hav
e m
ore
g
irls
th
an
bo
ys (
%)
Perc
enta
ge
of
bir
ths
wit
h a
t
leas
t o
ne
ante
nat
al
exam
inat
ion
No
rth
-eas
t
Aru
nach
al P
rade
sh18
.72.
530
.820
.529
.93.
241
.92.
561
.6
Ass
am18
.12.
336
.017
.030
.62.
938
.22.
960
.1
Man
ipur
21.7
3.0
29.3
42.3
31.8
3.6
36.5
4.8
80.2
Meg
hala
ya19
.14.
622
.614
.328
.54.
720
.916
.953
.6
Miz
oram
22.0
2.9
21.8
59.6
28.4
4.0
26.0
19.0
91.8
Nag
alan
d20
.13.
823
.114
.127
.54.
032
.76.
360
.4
Sikk
im19
.82.
827
.347
.432
.62.
222
.42.
169
.9
Wes
t
Goa
23.2
1.8
23.3
82.6
34.8
2.3
17.0
5.1
99.0
Guj
arat
17.6
2.7
22.0
53.0
29.0
2.5
33.2
1.8
86.4
Mah
aras
htra
16.4
2.5
23.8
78.4
29.0
2.3
27.1
1.9
90.4
Sou
th
And
hra
Prad
esh
15.1
2.3
25.0
58.7
31.1
2.4
19.8
2.7
92.7
Kar
nata
ka16
.82.
120
.060
.029
.72.
213
.01.
986
.3
Ker
ala
20.2
2.0
24.5
79.7
38.1
2.5
14.6
5.2
98.8
Tam
il N
adu
18.7
2.2
16.1
88.8
30.5
2.0
9.6
1.9
98.5
Ind
ia16
.42.
925
.442
.030
.82.
733
.22.
265
.4
Sou
rce
: NFH
S-2,
199
8-1
999.
02_INE_Pop0108_007_090.indd 85 23/06/2008 14:36:38

J. Véron
86
º»
RefeRences
Banthia J.K., 2001, Census of India 2001, Provisional Population Totals, Paper 1 of 2001, Delhi.Bista D.B., 1977, “Patterns of Migration in Nepal”, Colloque international du CNRS 268. 1976,
Paris, CNRS, pp. 397-399.Bose a., shanKarDass M.K., 2004, Growing Old in India, Voices Reveal, Statistics Speak,
B. R. Publishing Corporation, Delhi.Census of inDia, 2001, Provisional Population Totals, Paper 1 of 2001, Series 1 India, Delhi.CiCreD, 1974a, The Population of Pakistan, Cicred Series, Paris.CiCreD, 1974b, The Population of Sri Lanka, Cicred Series, Paris.Das Gupta M., 1987, “Selective discrimination against females in rural Punjab”, Population and
Development Review, 13(1), pp. 77-100.Das Gupta M., Mari Bhat, p.n. M, 1997, “Fertility decline and increased manifestation of sex
bias in India”, Population Studies, 51(3), pp. 307-315.Davis K., 1951, The Population of India and Pakistan, Princeton, New Jersey, Princeton University
Press.Dyson t., Cassen r., visaria L., 2004, Twenty-First Century India. Population, Economy, Human
Development, and the Environment, Oxford University Press.esCap, 1981, Population of Bangladesh, Country Monograph Series No. 8, United Nations,
New York, 1981.esCap, 1982, Population of India, Country Monograph Series No. 10, United Nations, New York,
1982.etieMBLe a., 2004, “Les Tamouls du Sri Lanka en France. L’emprise du politique”, Revue française
des Affaires sociales, 2, pp. 145-164.GanDotra M.M., retherforD r.D., arwin p., Luther n.y., vinoD K.M., 1998,
“Fertility in India”, National Family Health Survey Subject Reports, 9, May, IIPS Bombay and East-West Center, Honolulu.
GoyaL r.p., 1988, Marriage Age in India, B.R. Publishing Corporation, Institute of Economic Growth, Delhi.
GuiLMoto C.Z., raJan i.s., 1998, “Regional Heterogeneity and fertility Behaviour in India”, Working Paper no. 290, Centre for Development Studies, Thiruvananthapuram.
GuiLMoto C.Z., raJan i.s., 2001, “Geographic Patterns of fertility Change”, in Srinivasan K. and Vlassoff M. (eds), Population-Development Nexus in India. Challenges for the New Millennium, Tata McGraw Hill, New Delhi, pp. 88-109.
GuiLMoto C.Z., raJan i.s., (eds), 2005, Fertility Transition in South India, Sage, New Delhi.GuZMán J.M., roDriGueZ J., MartíneZ J., Contreras J.M., GonZáLeZ, 2006, “La
démographie de l’Amérique latine et de la Caraïbe depuis 1950”, Population, 61(4-5), 623-734.internationaL institute for popuLation sCienCes (iips), 1995, National Family Health
Survey (MCH and Family Planning). India 1992-93. Bombay: IIPS.internationaL institute for popuLation sCienCes (iips) anD orC MaCro, 2000,
National Family Health Survey (NFHS-2), 1998-99, India, Mumbai, Bombay, IIPS.internationaL institute for popuLation sCienCes (iips) anD MaCro internationaL.
2007, National Family Health Survey (NFHS-3), 2005-06, India, Volume I., Mumbai, IIPS.ioM, 2005, World Migration. Costs and Benefits of International Migration, IOM, Geneva.KhaDria B., 2005, “Migration in South and South-West Asia”, Global Commission on
International Migration.Mari Bhat p.n. M., preston s., Dyson t., 1984, Vital Rates in India, 1961-1981, Committee
on Population and Development. Report No 24, National Academy Press, Washington.Mari Bhat p.n., 1989, “Mortality and Fertility in India, 1881-1961: A Reassessment”, in India’s
Historical Demography. Studies in Famine, Disease and Society, Dyson T. (ed.), Curzon Press, The Riverdale Company.
02_INE_Pop0108_007_090.indd 86 23/06/2008 14:36:38

the deMograPhy of south asia froM the 1950s to the 2000s
87
Mari Bhat p.n., raJan i.s., 1997, “Demographic Transition Since Independence”, in Kerala’s Demographic Transition, K.C. Zachariah and Rajan I.S., Eds, Sage, New Delhi, pp. 33-78.
Mari Bhat p.n., Zavier a.J., 2003, “Fertility Decline and Gender Bias in Northern India”, Demography, 40(4), pp. 637-657.
naïr p.s., véron J., 2002, “L’Inde: un milliard d’habitants en 2001”, in La Population du monde, Géants démographiques et défis internationaux, Les Cahiers de l’Ined 149, pp. 227-243.
nanDa a.K., véron J., 2004, “Child Sex Ratio Imbalances, Fertility Behaviour and Development in India: Recent Evidence from Haryana and Punjab”, Indian Social Science Review, Indian Council of Social Science Research, New Delhi, pp. 101-134.
nanDa a.K., 2005, “Population Movement from Bangladesh to India: What do the Census Data of 1981 and 1991 Reveal?”, India-Bangladesh. Strengthening the Partnership, CRRID, Chandigarh, pp. 85-128.
offiCe of reGistrar GeneraL & Census CoMMissioner, 2006, Census of India. Population Projections for India and States 2001-2026, Revised December 2006, Report of the technical group on population projections constituted by the National Commission on Population, New Delhi.
pison G., 2007, “The population of the world (2007)”, Population & Societies, 436.raJan i.s., véron J., 2006, “La politique de population de l’Inde face à l’inertie des évolutions
démographiques”, in Démographie : analyse et synthèse. Tome VII. Histoire des idées et politiques de population, Paris, INED, pp. 595-623.
sharMa o.p., retherforD r.D., 1990, Effect of Female Literacy on Fertility in India, Census of India 1981, New Delhi.
srinivasan K., 1995, Regulating Reproduction in India’s Population. Efforts. Results and Recommendations. Sage Publications. New Delhi.
taButin D., sChouMaKer B., 2004, “The demography of sub-Saharan Africa from the 1950s to the 2000s. A survey of changes and a statistical assessment”, Population, English Edition 59(3-4), 457-556.
taButin D., sChouMaKer B., 2005, “The demography of the Arab world and the Middle East from the 1950s to the 2000s. A survey of changes and a statistical assessment”, Population, English Edition, 60(5-6), 505-616.
unaiDs anD who, 2007, 2007, AIDS epidemic update (http://data.unaids.org/pub/EPISlides/2007/2007_epiupdate_en.pdf)
unfpa, 1997, India. Towards population and Development Goals, Oxford University Press, Delhi.uniteD nations, 2005, World Contraceptive Use 2005
(http://www.un.org/esa/population/publications/contraceptive2005/WCU2005.htm)uniteD nations, 2006a, World Population Prospects, United Nations, New York.uniteD nations, 2006b, World Mortality Report 2005, United Nations, New York.uniteD nations, 2006c, International Migration 2006, United Nations, New York.uniteD nations, 2007a, World Population Prospects. The 2006 Revision. Highlights. New York,
United Nations. http://esa.un.org/unpp/uniteD nations, 2007b, Demographic Yearbook 2004, United Nations, New York.uniteD nations, 2008, World Urbanization Prospects. The 2007 Revision Population Database
(.http://esa.un.org/unpp/)un-haBitat. United Nations Human Settlements Programme
http://ww2.unhabitat.org/programmes/guo/documents/Table1.pdfunDp, 2006, Human Development Report 2006.véron J., 1987, “L’urbanisation indienne (1901-1981)”, Population 42(3), pp. 485-502.véron J., 1997, “La transition démographique en Inde”, Espace, Populations, Sociétés, 2-3.
pp. 135-144.véron J., naïr p.s., 2000, “The demographic transition in India: How to explain the north-
south divide?”, Paper presented at the conference of the Population Association of America (PAA), Los Angeles, 19 p.
visaria p., 1995, “Demographic transition and policy responses in India”, Demography India. 24(1), pp. 1-12.
02_INE_Pop0108_007_090.indd 87 23/06/2008 14:36:38

J. Véron
88
visaria L., visaria p., 1995, “India’s population in transition”, Population Bulletin, PRB, 50(3), October, Washington.
who, 2007, World Health Statistics 2007, Geneva http://www.who.int/whosis/whostat2007.pdf
ZaChariah K.C., suLeKa pateL, 1984, “Determinants of fertility decline in India, an analysis”, World Bank staff working papers, 699, Population and Development Series, Number 24, The World Bank, Washington.
ZaChariah K.C., raJan. i.s., sarMa p.s., navaneethaM K., Gopinathan nair p.s., Misra u.s., 1994, Demographic Transition in Kerala in the 1980s, Centre for Development Studies Monograph Series, Thiruvananthapuram.
ZaChariah K.C., Kannan K.p., raJan i.s., 2002, Kerala’s Gulf Connection. CDS Studies on International Labour Migration from Kerala State in India, Centre for Development Studies Thiruvananthapuram.
ZaChariah K.C., Mathew raJan i.s., 2003, Dynamics of Migration in Kerala. Dimensions, Differentials and Consequences, Orient Longman, New Delhi.
ZaChariah K.C., nair p.r., Gopinathan raJan i.s., 2006, Return Emigrants in Kerala. Welfare, Rehabilitation and Development, IDPAD Manohar.
unesCo, http://stats.uis.unesco.org/unesco/TableViewer/tableView.aspx?ReportId=210
02_INE_Pop0108_007_090.indd 88 23/06/2008 14:36:38

the deMograPhy of south asia froM the 1950s to the 2000s
89
JaCques Véron • The Demography of SouTh aSia from The 1950S To The 2000S. a Summary of ChangeS anD a STaTiSTiCal aSSeSSmenT
The countries of South Asia (Afghanistan, Bangladesh, Bhutan, India, the Maldives, Nepal, Pakistan and Sri Lanka) cover less than 4% of the Earth’s surface, but their combined population of some 1.6 billion inhabitants in 2007 represents nearly a quarter of the world total. India, the largest country in the region, alone has 1.17 billion inhabitants. This chronicle charts the main demographic trends since the 1950s, which are explained in part by the countries’ diverse levels of development. Their demographic transitions also exhibit broad diversity. There is no single transition model specific to the region, just as there is no single transition in India, as the comparison of its states makes clear. Except in Sri Lanka, where the process is complete, the fertility transition is ongoing, and the mortality transition is in general very advanced. The potential for demographic growth remains high in South Asia, and the United Nations expects the region’s population to grow by 600 million inhabitants up to 2040. The future course of demographic change has major implications for development, since most of the countries need to reduce poverty and raise educational levels while at the same time coping with rapid urban growth and addressing environmental issues.
JaCques Véron • la Démographie De l’aSie Du SuD DeS annéeS 1950 aux annéeS 2000. SynThèSe DeS ChangemenTS eT bilan STaTiSTique
Avec quelque 1,6 milliard d’habitants en 2007, l’Asie du Sud (Afghanistan, Bangladesh, Bhoutan, Inde, Maldives, Népal, Pakistan et Sri Lanka) rassemble sur moins de 4 % de la superficie totale de la terre près du quart de la population mondiale et l’Inde, plus grand pays de cette région, compte à elle seule 1,17 milliard d’habitants. Cette chronique présente l’évolution, depuis les années 1950, des principaux indicateurs démographiques, qui s’explique en partie par le niveau de développement des différents pays. Les transitions démographiques apparaissent diversifiées : il n’existe pas un modèle de transition qui serait propre à la région, pas plus qu’il n’existe un modèle indien de transition comme le montrent, pour ce pays, les comparaisons entre États. À l’exclusion du Sri Lanka où elle est achevée, la transition de la fécondité est toujours en cours alors que celle de la mortalité est généralement bien avancée. Le potentiel de croissance démographique de l’Asie du Sud reste très élevé puisque, selon les Nations unies, la population de cette région devrait s’accroître de 600 millions d’habitants d’ici 2040. Les évolutions démographiques futures constituent un enjeu majeur de développement, puisque la plupart des pays doivent réduire la pauvreté, améliorer les niveaux d’instruction, gérer une forte croissance urbaine et mieux protéger l’environnement.
JaCques Véron • la Demografía De aSia Del Sur De loS añoS 1950 a loS añoS 2000. SínTeSiS De loS CambioS y balanCe eSTaDíSTiCo
Con cerca de 1 600 millones de habitantes en 2007, Asia del Sur (Afganistán, Bangladesh, Bhután, India, Maldivas, Nepal, Pakistán y Sri Lanka) reúne en menos del 4% de la superficie total de la tierra cerca de la cuarta parte de la población mundial y la India, país más grande de esta región, cuenta, éste sólo, con 1 170 millones de habitantes. Esta crónica presenta la evolución, desde los años 1950, de los principales indicadores demográficos, que se explica en parte por el nivel de desarrollo de los diferentes países. Las transiciones demográficas aparecen diversificadas. En efecto, no existe un modelo de transición específico de la región, ni tampoco existe un modelo indio de transición como lo muestran, para este país, las comparaciones entre Estados. Exceptuando a Sri Lanka en donde se encuentra acabada, la transición de la fecundidad está siempre en curso mientras que la de la mortalidad está generalmente bien avanzada. El potencial de crecimiento demográfico de Asia del Sur sigue siendo muy elevado puesto que, según las Naciones unidas, la población de esta región debería aumentar de 600 millones de habitantes de ahora a 2040. Las evoluciones demográficas futuras constituyen un reto mayor de desarrollo puesto que la mayoría de países deben reducir la pobreza, mejorar los niveles de instrucción, manejar un fuerte crecimiento urbano y proteger mejor el medio ambiente.
Jacques véron, Institut national d’études démographiques, 133 boulevard Davout, 75980 ParisCedex20,France,tel:33(0)156062176,e-mail:[email protected]
02_INE_Pop0108_007_090.indd 89 23/06/2008 14:36:39

02_INE_Pop0108_007_090.indd 90 23/06/2008 14:36:39
Top Related
Copyright © 2022 FDOKUMEN

