


Bahasa
Halaman
Hukum

UNITED STATES
SECURITIES AND EXCHANGE COMMISSION
WASHINGTON, D.C. 20549
FORM 10-Q
☒ QUARTERLY REPORT PURSUANT TO SECTION 13 OR 15(d) OF THE SECURITIES
EXCHANGE ACT OF 1934
For the quarterly period ended September 30, 2018
OR
☐ TRANSITION REPORT PURSUANT TO SECTION 13 OR 15(d) OF THE SECURITIES
EXCHANGE ACT OF 1934
Commission file number 001-16174
TEVA PHARMACEUTICAL INDUSTRIES LIMITED (Exact name of registrant as specified in its charter)
Israel Not Applicable
(State or other jurisdiction of incorporation or organization) (IRS Employer Identification Number)
5 Basel Street, Petach Tikva, ISRAEL 4951033
(Address of principal executive offices) (Zip code)
+972 (3) 914-8171
(Registrant’s telephone number, including area code)
Indicate by check mark whether the registrant (1) has filed all reports required to be filed by Section 13 or 15(d) of the Securities
Exchange Act of 1934 during the preceding 12 months (or for such shorter period that the registrant was required to file such reports),
and (2) has been subject to such filing requirements for the past 90 days. Yes ☒ No ☐
Indicate by check mark whether the registrant has submitted electronically every Interactive Data File required to be submitted pursuant
to Rule 405 of Regulation S-T (§232.405 of this chapter) during the preceding 12 months (or for such shorter period that the registrant
was required to submit such files). Yes ☒ No ☐
Indicate by check mark whether the registrant is a large accelerated filer, an accelerated filer, a non-accelerated filer, smaller reporting
company, or an emerging growth company. See the definitions of “large accelerated filer,” “accelerated filer,” “smaller reporting
company,” and “emerging growth company” in Rule 12b-2 of the Exchange Act.
Large accelerated filer ☒ Accelerated filer ☐
Non-accelerated filer ☐ Smaller reporting company ☐
Emerging growth company ☐
If an emerging growth company, indicate by check mark if the registrant has elected not to use the extended transition period for
complying with any new or revised financial accounting standards provided pursuant to Section 13(a) of the Exchange Act. ☐
Indicate by check mark whether the registrant is a shell company (as defined in Rule 12b-2 of the Act). Yes ☐ No ☒
As of October 30, 2018, the registrant had 1,018,711,443 ordinary shares outstanding.
TEVA PHARMACEUTICAL INDUSTRIES LIMITED
INDEX
PART I. FINANCIAL INFORMATION
Item 1. Financial Statements (unaudited)
Consolidated Balance Sheets 4
Consolidated Statements of Income (loss) 5
Consolidated Statements of Comprehensive Income (loss) 6
Consolidated Statements of Cash Flows 7
Notes to Consolidated Financial Statements 8
Item 2. Management’s Discussion and Analysis of Financial Condition and Results of Operations 44
Item 3. Quantitative and Qualitative Disclosures about Market Risk 77
Item 4. Controls and Procedures 78
PART II. OTHER INFORMATION
Item 1. Legal Proceedings 79
Item 1A. Risk Factors 79
Item 2. Unregistered Sales of Equity Securities and Use of Proceeds 79
Item 3. Defaults Upon Senior Securities 79
Item 4. Mine Safety Disclosures 79
Item 5. Other Information 79
Item 6. Exhibits 79
Signatures 80
INTRODUCTION AND USE OF CERTAIN TERMS
Unless otherwise indicated, all references to the “Company,” “we,” “our” and “Teva” refer to Teva Pharmaceutical Industries
Limited and its subsidiaries, and references to “revenues” refer to net revenues. References to “U.S. dollars,” “dollars,” “U.S. $” and
“$” are to the lawful currency of the United States of America, and references to “NIS” are to new Israeli shekels. References to “MS”
are to multiple sclerosis. Market data, including both sales and share data, is based on information provided by IQVIA (formerly IMS
Health Inc.), a provider of market research to the pharmaceutical industry (“IQVIA”), unless otherwise stated. References to “Actavis
Generics” are to the generic pharmaceuticals business we purchased from Allergan plc (“Allergan”) on August 2, 2016. References to
“R&D” are to Research and Development, references to “IPR&D” are to in-process R&D, references to “S&M” are to Selling and
Marketing and references to “G&A” are to General and Administrative. Some amounts in this report may not add up due to rounding.
All percentages have been calculated using unrounded amounts.
CAUTIONARY NOTE REGARDING FORWARD-LOOKING STATEMENTS
In addition to historical information, this Quarterly Report on Form 10-Q, and the reports and documents incorporated by
reference in this Quarterly Report on Form 10-Q, may contain forward-looking statements within the meaning of the Private Securities
Litigation Reform Act of 1995, which are based on management’s current beliefs and expectations and are subject to substantial risks
and uncertainties, both known and unknown, that could cause our future results, performance or achievements to differ significantly
2

from that expressed or implied by such forward-looking statements. You can identify these forward-looking statements by the use of
words such as “should,” “expect,” “anticipate,” “estimate,” “target,” “may,” “project,” “guidance,” “intend,” “plan,” “believe” and
other words and terms of similar meaning and expression in connection with any discussion of future operating or financial
performance. Important factors that could cause or contribute to such differences include risks relating to:
• our ability to successfully compete in the marketplace, including: that we are substantially dependent on our generic
products; competition for our specialty products, especially COPAXONE®, our leading medicine, which faces competition
from existing and potential additional generic versions and orally-administered alternatives; competition from companies
with greater resources and capabilities; efforts of pharmaceutical companies to limit the use of generics, including through
legislation and regulations; consolidation of our customer base and commercial alliances among our customers; the increase
in the number of competitors targeting generic opportunities and seeking U.S. market exclusivity for generic versions of
significant products; price erosion relating to our products, both from competing products and increased regulation; delays in
launches of new products and our ability to achieve expected results from investments in our product pipeline; our ability to
take advantage of high-value opportunities; the difficulty and expense of obtaining licenses to proprietary technologies; and
the effectiveness of our patents and other measures to protect our intellectual property rights;
• our substantial indebtedness, which may limit our ability to incur additional indebtedness, engage in additional transactions
or make new investments, may result in a further downgrade of our credit ratings; and our inability to raise debt or borrow
funds in amounts or on terms that are favorable to us;
• our business and operations in general, including: failure to effectively execute our restructuring plan announced in
December 2017; uncertainties related to, and failure to achieve, the potential benefits and success of our new senior
management team and organizational structure; harm to our pipeline of future products due to the ongoing review of our
R&D programs; our ability to develop and commercialize additional pharmaceutical products; potential additional adverse
consequences following our resolution with the U.S. government of our FCPA investigation; compliance with sanctions and
other trade control laws; manufacturing or quality control problems, which may damage our reputation for quality production
and require costly remediation; interruptions in our supply chain; disruptions of our or third party information technology
systems or breaches of our data security; the failure to recruit or retain key personnel; variations in intellectual property laws
that may adversely affect our ability to manufacture our products; challenges associated with conducting business globally,
including adverse effects of political or economic instability, major hostilities or terrorism; significant sales to a limited
number of customers in our U.S. market; our ability to successfully bid for suitable acquisition targets or licensing
opportunities, or to consummate and integrate acquisitions; and our prospects and opportunities for growth if we sell assets;
• compliance, regulatory and litigation matters, including: costs and delays resulting from the extensive governmental
regulation to which we are subject; the effects of reforms in healthcare regulation and reductions in pharmaceutical pricing,
reimbursement and coverage; governmental investigations into S&M practices; potential liability for patent infringement;
product liability claims; increased government scrutiny of our patent settlement agreements; failure to comply with
complex Medicare and Medicaid reporting and payment obligations; and environmental risks;
• other financial and economic risks, including: our exposure to currency fluctuations and restrictions as well as credit risks;
potential impairments of our intangible assets; potential significant increases in tax liabilities; and the effect on our overall
effective tax rate of the termination or expiration of governmental programs or tax benefits, or of a change in our business;
and other factors discussed in our Annual Report on Form 10-K for the year ended December 31, 2017, including the sections
thereof captioned “Risk Factors” and “Forward Looking Statements,” and in our subsequent quarterly reports on Form 10-Q and other
filings with the Securities and Exchange Commission, which are available at www.sec.gov and www.tevapharm.com. Forward-looking
statements speak only as of the date on which they are made, and we assume no obligation to update or revise any forward-looking
statements or other information contained herein, whether as a result of new information, future events or otherwise. You are cautioned
not to put undue reliance on these forward-looking statements.
3
PART I — FINANCIAL INFORMATION
ITEM 1. FINANCIAL STATEMENTS
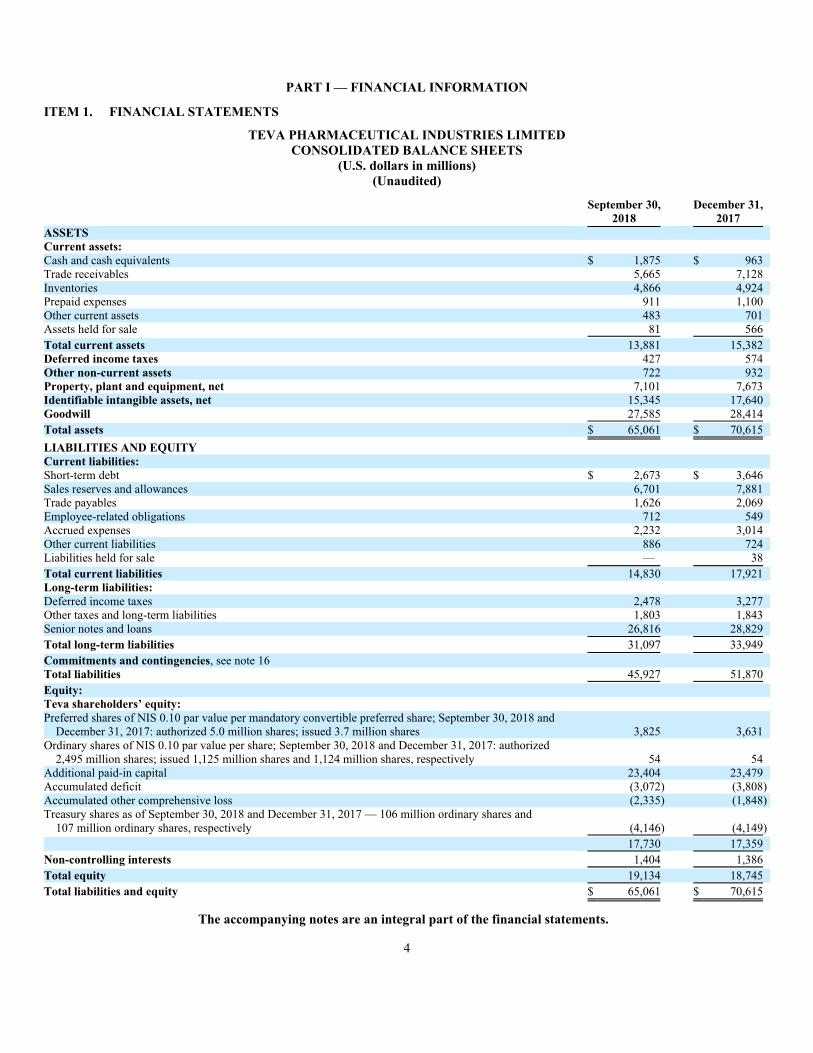
TEVA PHARMACEUTICAL INDUSTRIES LIMITED
CONSOLIDATED BALANCE SHEETS
(U.S. dollars in millions)
(Unaudited)
September 30, December 31,
2018 2017
ASSETS
Current assets:
Cash and cash equivalents $ 1,875 $ 963
Trade receivables 5,665 7,128
Inventories 4,866 4,924
Prepaid expenses 911 1,100
Other current assets 483 701
Assets held for sale 81 566
Total current assets 13,881 15,382
Deferred income taxes 427 574
Other non-current assets 722 932
Property, plant and equipment, net 7,101 7,673
Identifiable intangible assets, net 15,345 17,640
Goodwill 27,585 28,414
Total assets $ 65,061 $ 70,615
LIABILITIES AND EQUITY
Current liabilities:
Short-term debt $ 2,673 $ 3,646
Sales reserves and allowances 6,701 7,881
Trade payables 1,626 2,069
Employee-related obligations 712 549
Accrued expenses 2,232 3,014
Other current liabilities 886 724
Liabilities held for sale — 38
Total current liabilities 14,830 17,921
Long-term liabilities:
Deferred income taxes 2,478 3,277
Other taxes and long-term liabilities 1,803 1,843
Senior notes and loans 26,816 28,829
Total long-term liabilities 31,097 33,949
Commitments and contingencies, see note 16
Total liabilities 45,927 51,870
Equity:
Teva shareholders’ equity:
Preferred shares of NIS 0.10 par value per mandatory convertible preferred share; September 30, 2018 and
December 31, 2017: authorized 5.0 million shares; issued 3.7 million shares 3,825 3,631
Ordinary shares of NIS 0.10 par value per share; September 30, 2018 and December 31, 2017: authorized
2,495 million shares; issued 1,125 million shares and 1,124 million shares, respectively 54 54
Additional paid-in capital 23,404 23,479
Accumulated deficit (3,072) (3,808)
Accumulated other comprehensive loss (2,335) (1,848)
Treasury shares as of September 30, 2018 and December 31, 2017 — 106 million ordinary shares and
107 million ordinary shares, respectively (4,146) (4,149)
17,730 17,359
Non-controlling interests 1,404 1,386
Total equity 19,134 18,745
Total liabilities and equity $ 65,061 $ 70,615
The accompanying notes are an integral part of the financial statements.
4
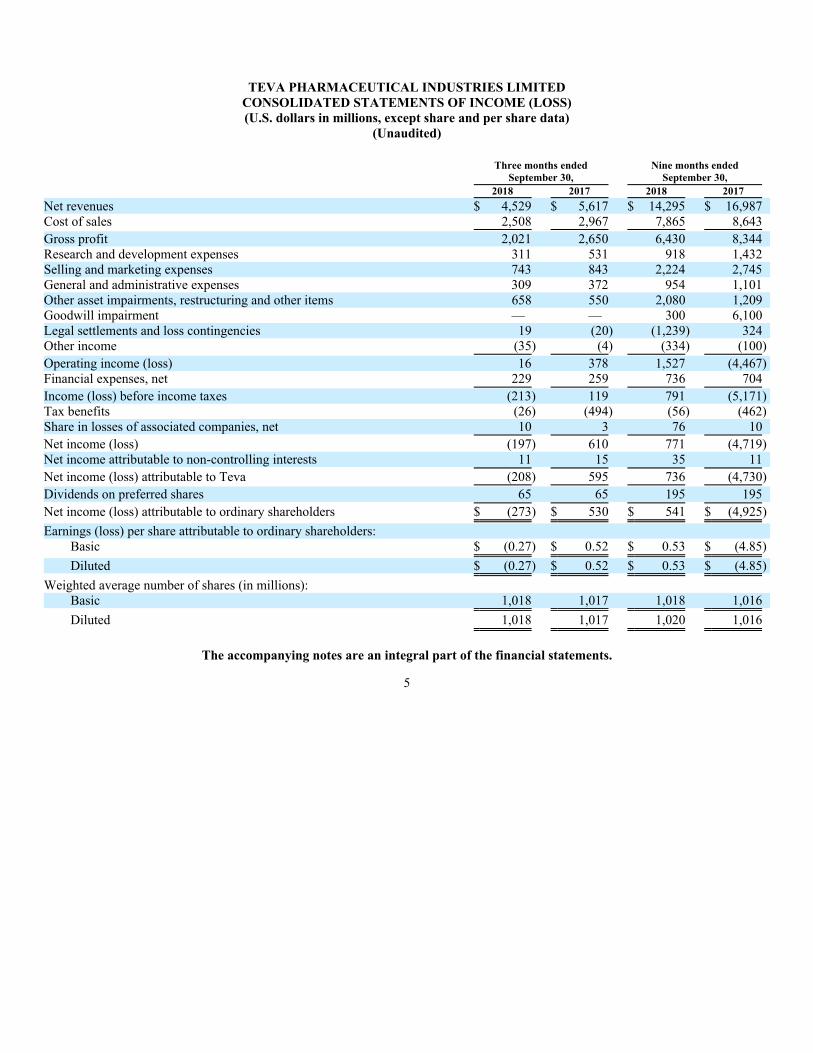
TEVA PHARMACEUTICAL INDUSTRIES LIMITED
CONSOLIDATED STATEMENTS OF INCOME (LOSS)
(U.S. dollars in millions, except share and per share data)
(Unaudited)
Three months ended Nine months ended
September 30, September 30,
2018 2017 2018 2017
Net revenues $ 4,529 $ 5,617 $ 14,295 $ 16,987
Cost of sales 2,508 2,967 7,865 8,643
Gross profit 2,021 2,650 6,430 8,344
Research and development expenses 311 531 918 1,432
Selling and marketing expenses 743 843 2,224 2,745
General and administrative expenses 309 372 954 1,101
Other asset impairments, restructuring and other items 658 550 2,080 1,209
Goodwill impairment — — 300 6,100
Legal settlements and loss contingencies 19 (20) (1,239) 324
Other income (35) (4) (334) (100)
Operating income (loss) 16 378 1,527 (4,467)
Financial expenses, net 229 259 736 704
Income (loss) before income taxes (213) 119 791 (5,171)
Tax benefits (26) (494) (56) (462)
Share in losses of associated companies, net 10 3 76 10
Net income (loss) (197) 610 771 (4,719)
Net income attributable to non-controlling interests 11 15 35 11
Net income (loss) attributable to Teva (208) 595 736 (4,730)
Dividends on preferred shares 65 65 195 195
Net income (loss) attributable to ordinary shareholders $ (273) $ 530 $ 541 $ (4,925)
Earnings (loss) per share attributable to ordinary shareholders:
Basic $ (0.27) $ 0.52 $ 0.53 $ (4.85)
Diluted $ (0.27) $ 0.52 $ 0.53 $ (4.85)
Weighted average number of shares (in millions):
Basic 1,018 1,017 1,018 1,016
Diluted 1,018 1,017 1,020 1,016
The accompanying notes are an integral part of the financial statements.
5
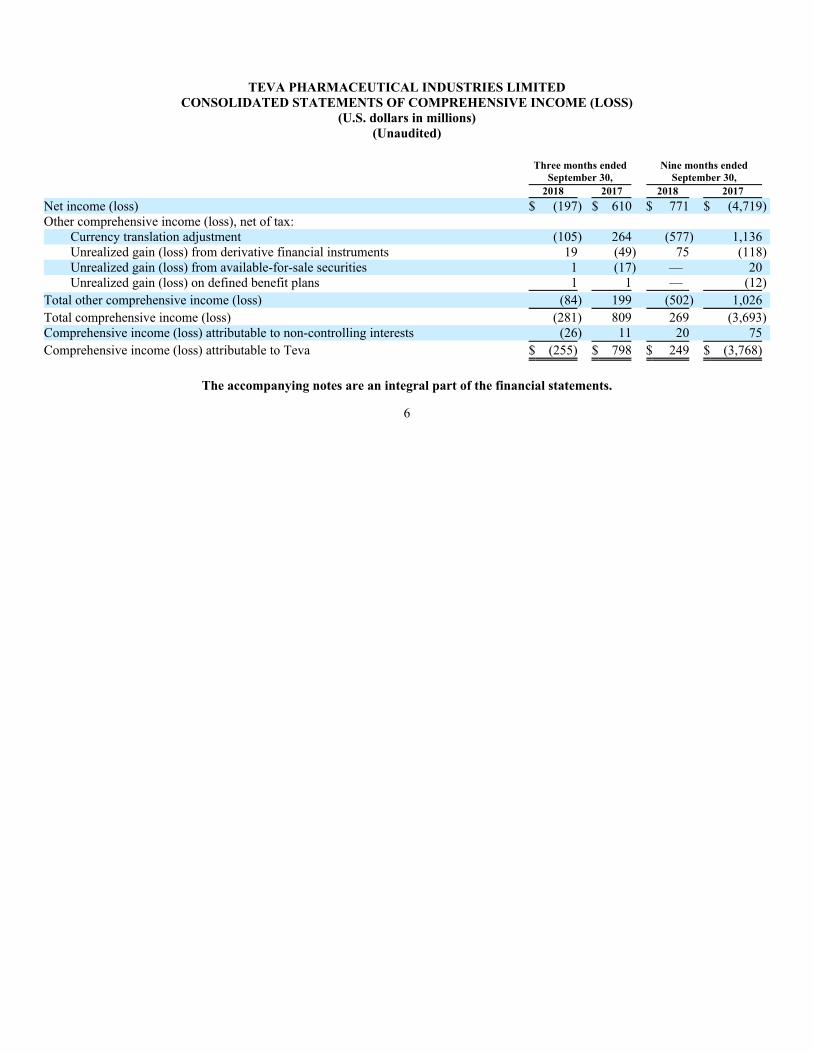
TEVA PHARMACEUTICAL INDUSTRIES LIMITED
CONSOLIDATED STATEMENTS OF COMPREHENSIVE INCOME (LOSS)
(U.S. dollars in millions)
(Unaudited)
Three months ended Nine months ended
September 30, September 30,
2018 2017 2018 2017
Net income (loss) $ (197) $ 610 $ 771 $ (4,719)
Other comprehensive income (loss), net of tax:
Currency translation adjustment (105) 264 (577) 1,136
Unrealized gain (loss) from derivative financial instruments 19 (49) 75 (118)
Unrealized gain (loss) from available-for-sale securities 1 (17) — 20
Unrealized gain (loss) on defined benefit plans 1 1 — (12)
Total other comprehensive income (loss) (84) 199 (502) 1,026
Total comprehensive income (loss) (281) 809 269 (3,693)
Comprehensive income (loss) attributable to non-controlling interests (26) 11 20 75
Comprehensive income (loss) attributable to Teva $ (255) $ 798 $ 249 $ (3,768)
The accompanying notes are an integral part of the financial statements.
6
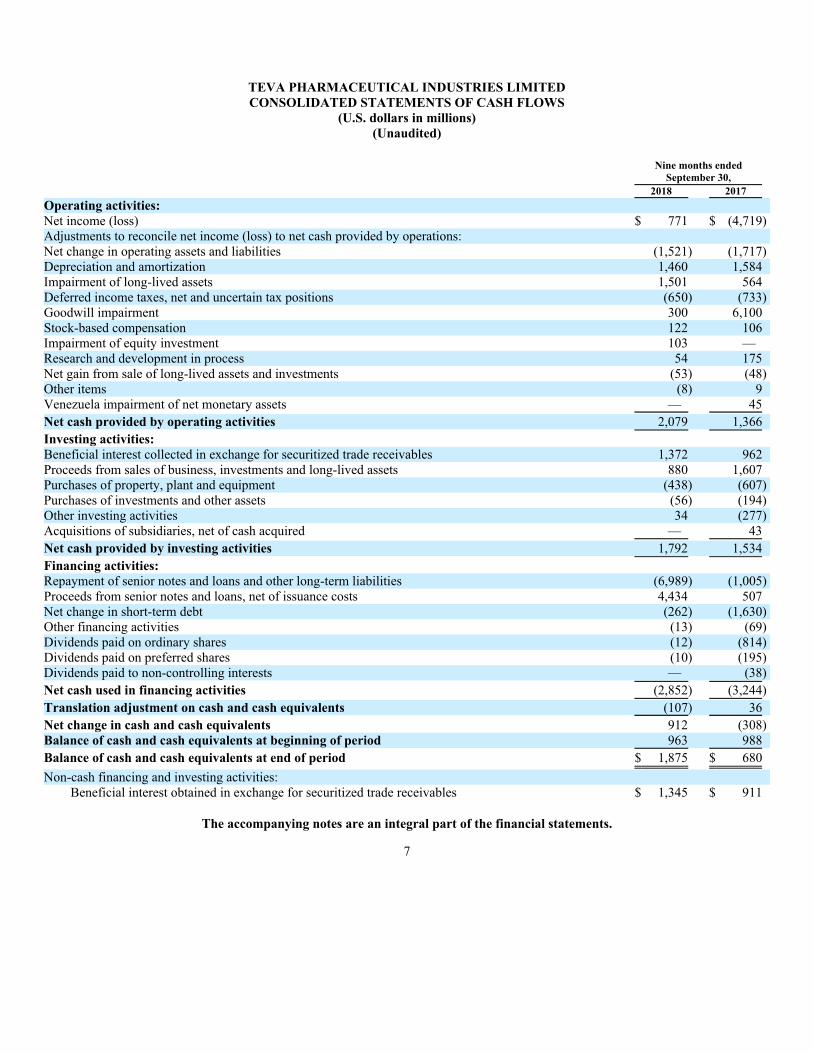
TEVA PHARMACEUTICAL INDUSTRIES LIMITED
CONSOLIDATED STATEMENTS OF CASH FLOWS
(U.S. dollars in millions)
(Unaudited)
Nine months ended
September 30,
2018 2017
Operating activities:
Net income (loss) $ 771 $ (4,719)
Adjustments to reconcile net income (loss) to net cash provided by operations:
Net change in operating assets and liabilities (1,521) (1,717)
Depreciation and amortization 1,460 1,584
Impairment of long-lived assets 1,501 564
Deferred income taxes, net and uncertain tax positions (650) (733)
Goodwill impairment 300 6,100
Stock-based compensation 122 106
Impairment of equity investment 103 —
Research and development in process 54 175
Net gain from sale of long-lived assets and investments (53) (48)
Other items (8) 9
Venezuela impairment of net monetary assets — 45
Net cash provided by operating activities 2,079 1,366
Investing activities:
Beneficial interest collected in exchange for securitized trade receivables 1,372 962
Proceeds from sales of business, investments and long-lived assets 880 1,607
Purchases of property, plant and equipment (438) (607)
Purchases of investments and other assets (56) (194)
Other investing activities 34 (277)
Acquisitions of subsidiaries, net of cash acquired — 43
Net cash provided by investing activities 1,792 1,534
Financing activities:
Repayment of senior notes and loans and other long-term liabilities (6,989) (1,005)
Proceeds from senior notes and loans, net of issuance costs 4,434 507
Net change in short-term debt (262) (1,630)
Other financing activities (13) (69)
Dividends paid on ordinary shares (12) (814)
Dividends paid on preferred shares (10) (195)
Dividends paid to non-controlling interests — (38)
Net cash used in financing activities (2,852) (3,244)
Translation adjustment on cash and cash equivalents (107) 36
Net change in cash and cash equivalents 912 (308)
Balance of cash and cash equivalents at beginning of period 963 988
Balance of cash and cash equivalents at end of period $ 1,875 $ 680
Non-cash financing and investing activities:
Beneficial interest obtained in exchange for securitized trade receivables $ 1,345 $ 911
The accompanying notes are an integral part of the financial statements.
7
TEVA PHARMACEUTICAL INDUSTRIES LIMITED
Notes to Consolidated Financial Statements
(Unaudited)
Note 1 – Basis of presentation:
The accompanying unaudited consolidated financial statements have been prepared on the same basis as the annual consolidated
financial statements. In the opinion of management, the financial statements reflect all recurring adjustments necessary to fairly state the
financial position and results of operations of Teva. The information included in this Quarterly Report on Form 10-Q should be read in
conjunction with the consolidated financial statements and accompanying notes included in the Company’s Form 10-K for the year
ended December 31, 2017, as filed with the Securities and Exchange Commission (“SEC”). Amounts as of December 31, 2017 were
derived from the audited balance sheet at that date, but not all disclosures required by generally accepted accounting principles in the
United States (“U.S. GAAP”) are included. Certain comparative figures have been reclassified to conform to current presentation. The
results of operations for the nine months ended September 30, 2018 are not necessarily indicative of results that could be expected for
the entire fiscal year.
Note 2 – Significant accounting policies:
Recently adopted accounting pronouncements
On January 1, 2018, Teva adopted the new accounting standard ASC 606, Revenue from Contracts with Customers, and all the
related amendments (“new revenue standard”) to all contracts using the modified retrospective method. The cumulative effect of
initially applying the new revenue standard was immaterial. See note 9 for further discussion.
In May 2017, the FASB issued guidance on changes to terms and conditions of share-based payment awards. The amendment
provides guidance about which changes to terms or conditions of a share-based payment award require an entity to apply modification
accounting. The guidance is effective for the fiscal year beginning on January 1, 2018, including interim periods within that year. Teva
adopted the provisions of this update in the first quarter of 2018. The impact that this new standard has on Teva’s financial statements
after adoption will depend on any future modification of share-based compensation.
In February 2017, the FASB issued guidance on de-recognition of nonfinancial assets. The amendments address the recognition of
gains and losses on the transfer (i.e., sale) of nonfinancial assets to counterparties other than customers. The guidance conforms
de-recognition on nonfinancial assets with the model for transactions in the new revenue standard. Teva adopted the provisions of this
update in the first quarter of 2018 with no material impact on its consolidated financial statements.
In August 2016, the FASB issued guidance on statements of cash flows. The guidance addresses eight specific issues: debt
prepayment or debt extinguishment costs; settlement of certain debt instruments; contingent consideration payments made after a
business combination; proceeds from the settlement of insurance claims; proceeds from the settlement of corporate-owned life
insurance policies; distributions received from equity method investees; beneficial interest in securitization transactions; and separately
identifiable cash flows and application of predominance principle. The amendments should be applied retrospectively. Teva adopted the
provisions of this update in the first quarter of 2018. This resulted in the reclassification of $962 million of beneficial interest in
securitization transactions from operating activities to investing activities for the nine month period ended September 30, 2017.
In January 2016, the FASB issued guidance which updates certain aspects of recognition, measurement, presentation and
disclosure of equity investments. The guidance requires entities to recognize changes in fair value in net income rather than in
accumulated other comprehensive income. Teva adopted the provisions of this update in the first quarter of 2018. Following the
adoption, the Company recorded a $5 million opening balance reclassification from accumulated other comprehensive loss to retained
earnings. See note 10.
Recently issued accounting pronouncements, not yet adopted
In August 2018, the FASB issued guidance that aligns the requirements for capitalizing implementation costs incurred in a hosting
arrangement that is a service contract with the requirements for capitalizing implementation costs incurred to develop or obtain
internal-use software. The guidance will be effective for fiscal years beginning after December 15, 2019, although early adoption is
permitted. The Company is currently evaluating this guidance to determine the impact it may have on its consolidated financial
statements.
In August 2018, the FASB issued guidance that removes certain disclosure requirements related to the fair value hierarchy,
modifies existing disclosure requirements related to measurement uncertainty and adds new disclosure requirements. The new
disclosure requirements include disclosing the changes in unrealized gains and losses for the period included in other comprehensive
8
income for recurring Level 3 fair value measurements held at the end of the reporting period and the range and weighted average of
significant unobservable inputs used to develop Level 3 fair value measurements. Certain disclosures required by this guidance will
need to be applied on a retrospective basis and others on a prospective basis. The guidance will be effective for fiscal years beginning
after December 15, 2019, although early adoption is permitted. The Company is currently evaluating this guidance to determine the
impact it may have on its consolidated financial statements.
In July 2018, the FASB issued a codification improvement, which does not prescribe any new accounting guidance, but instead
provides minor improvements and clarifications to various FASB accounting guidance. Certain updates are applicable immediately
while others provide for a transition period until the next fiscal year beginning after December 15, 2018. The Company is currently
evaluating this guidance to determine the impact it may have on its consolidated financial statements.
In June 2018, the FASB issued guidance which simplifies the accounting for non-employee share-based payment transactions. The
amendments specify that ASC 718 applies to all share-based payment transactions in which a grantor acquires goods or services to be
used or consumed in a grantor’s own operations by issuing share-based payment awards. The guidance will be effective for fiscal years
beginning after December 31, 2018, although early adoption is permitted. The Company does not expect that the adoption of this
guidance will have a significant impact on its consolidated financial statements.
In February 2018, the FASB issued guidance on the reclassification of certain tax effects from accumulated other comprehensive
income. The guidance allows reclassification of stranded tax effects resulting from the Tax Cuts and Jobs Act from accumulated other
comprehensive income to retained earnings. This guidance is effective for fiscal years beginning after December 15, 2018, with early
adoption permitted. The Company does not expect that the adoption of this guidance will have a significant impact on its consolidated
financial statements.
In August 2017, the FASB issued guidance on derivatives and hedging, which expands and refines hedge accounting for both
non-financial and financial risk components and aligns the recognition and presentation of the effects of the hedging instrument and the
hedged item in the financial statements. The guidance will be effective for fiscal years beginning after December 15, 2018, including
interim periods within those fiscal years (early adoption is permitted for any interim and annual financial statements that have not yet
been issued). Teva is currently evaluating the potential effect of the guidance on its consolidated financial statements.
In June 2016, the FASB issued guidance on financial instruments. The guidance replaces the current incurred loss impairment
methodology with a methodology that reflects expected credit losses and requires consideration of a broader range of reasonable and
supportable information to inform credit loss estimates. The guidance will be effective for the fiscal year beginning on January 1, 2020,
including interim periods within that year. Teva is currently evaluating the potential effect of the guidance on its consolidated financial
statements.
In February 2016, the FASB issued guidance on leases. The guidance requires entities to record lease assets and lease liabilities on
the balance sheet and disclose key information about leasing arrangements. In September 2017, the FASB issued additional
amendments providing clarification and implementation guidance. The guidance will become effective for interim and annual periods
beginning on January 1, 2019 (early adoption is permitted). In January 2018, the FASB issued an update that permits an entity to elect
an optional transition practical expedient to not evaluate land easements that existed or expired before the entity’s adoption of the new
standard and that were not previously accounted for as leases. In July 2018, the FASB issued both codification improvements, which
clarify how to apply certain aspects of the new lease standard and an update. The update provided to either adopt at the earliest period
presented using a modified retrospective approach, or to continue applying the guidance under the current lease standard in the
comparative periods presented in the consolidated financial statements. Companies that elect this option would record a cumulative-
effect adjustment to the opening balance of retained earnings on the date of adoption. The Company expects to apply the guidance using
the cumulative-effect approach, thereby applying the new guidance at the effective date, without adjusting the comparative periods and,
if necessary, recognizing a cumulative-effect adjustment to the opening balance of retained earnings in the period of adoption.
The Company is performing a comprehensive evaluation of the impact of the adoption of this guidance, which includes assessing
the Company’s lease portfolio, implementation of a new enterprise-wide lease management system to meet reporting requirements,
assessing the impact to business processes and implementation of internal controls over financial reporting and related disclosure
requirements. The Company is working closely with the software system developer, as the timely readiness of the lease software system
is critical to ensure an efficient and effective adoption of the standard. Although the Company has not finalized its process of evaluating
the impact of adoption of the ASU on its consolidated financial statements, the Company expects there will be a material increase to
assets and liabilities related to the recognition of new right-of-use assets and lease liabilities on the Company’s consolidated balance
sheet for leases currently classified as operating leases. The Company does not, however, expect a material impact to its consolidated
statements of income.
9
NOTE 3 – Certain transactions:
Business acquisitions:
Actavis Generics and Anda acquisitions
On August 2, 2016, Teva consummated its acquisition of Allergan plc’s (“Allergan”) worldwide generic pharmaceuticals business
(“Actavis Generics”). At closing, Teva transferred to Allergan consideration of approximately $33.4 billion in cash and approximately
100.3 million Teva shares.
On October 3, 2016, Teva consummated the acquisition of Anda Inc. (“Anda”), the fourth largest distributor of generic
pharmaceuticals in the United States, from Allergan, for cash consideration of $500 million. The purchase is a transaction related to the
Actavis Generics acquisition and as such the purchase price accounting and related disclosures were treated on a combined basis.
The final cash consideration for the Actavis Generics acquisition was subject to certain net working capital adjustments.
Following the terms of the agreement, Teva submitted an adjustment for $1.4 billion with regards to a working capital true up as well as
potential recoveries of purchase price related to certain tax items. On January 31, 2018, Teva and Allergan entered into a settlement
agreement and mutual releases for which Allergan made a one-time payment of $703 million to Teva. The Agreement also provides that
Teva and Allergan will jointly dismiss the working capital dispute arbitration, as well as actual or potential claims under the Master
Purchase Agreement, dated July 26, 2015, by and between Teva and Allergan, for breach of any representation, warranty or covenant
(other than any breach of a post-closing covenant not known as of the date of the settlement agreement). As the measurement period has
ended, this amount was recorded as a gain under legal settlements and loss contingencies in the first quarter of 2018.
Rimsa
On March 3, 2016, Teva completed the acquisition of Representaciones e Investigaciones Médicas, S.A. de C.V. (“Rimsa”), a
pharmaceutical manufacturing and distribution company in Mexico, for $2.3 billion, in a cash free, debt free set of transactions. Teva
financed the transaction using cash on hand.
Following the closing of the acquisition, Teva identified issues concerning Rimsa’s pre-acquisition quality, manufacturing and
other practices, at which point Teva began an assessment of the extent and cost of remediation required to return its products to the
market. In September 2016, two lawsuits were filed: a pre-emptive suit by the Rimsa sellers against Teva and Teva’s lawsuit alleging
fraud and breach of contract against the Rimsa sellers. The Rimsa sellers subsequently dismissed their lawsuit and the dismissal was
approved by court order on December 20, 2016.
On February 15, 2018, Teva and the Rimsa sellers entered into a settlement agreement and mutual releases on the breach of
contract claim for which the sellers made a one-time payment to Teva. As the measurement period has ended, this was recorded as a
gain under legal settlements and loss contingencies in the first quarter of 2018. This settlement was approved by the court and Teva’s
breach of contract claim was subsequently dismissed.
Assets and Liabilities Held For Sale:
Certain Women’s Health and Other Specialty Products
On September 17, 2017, Teva entered into a definitive agreement under which CVC Capital Partners Fund VI would acquire a
portfolio of products for $703 million in cash. The portfolio of products, which is marketed and sold outside of the United States,
includes the women’s health products OVALEAP®, ZOELY®, SEASONIQUE®, COLPOTROPHINE® and other specialty products
such as ACTONEL®.
As of December 31, 2017, the Company accounted for this transaction as assets and liabilities held for sale and determined that the
fair value less cost to sell exceeded the carrying value of the business. The Company disposed $329 million of goodwill associated with
the divested business.
On January 31, 2018, Teva completed the sale of the portfolio of products to CVC Capital Partners Fund VI. As a result of these
transactions, the Company recognized a net gain on sale of approximately $93 million in the first quarter of 2018 within other income in
the consolidated statement of income. The transaction expenses for these divestitures of approximately $2 million were recognized
concurrently and included as a reduction to the net gain on sale.
The Company determined that the sale of its global women’s health businesses did not constitute a strategic shift and that it did
not, and will not, have a major effect on its operations and financial results. Accordingly, the operations associated with the transactions
are not reported as discontinued operations.
10
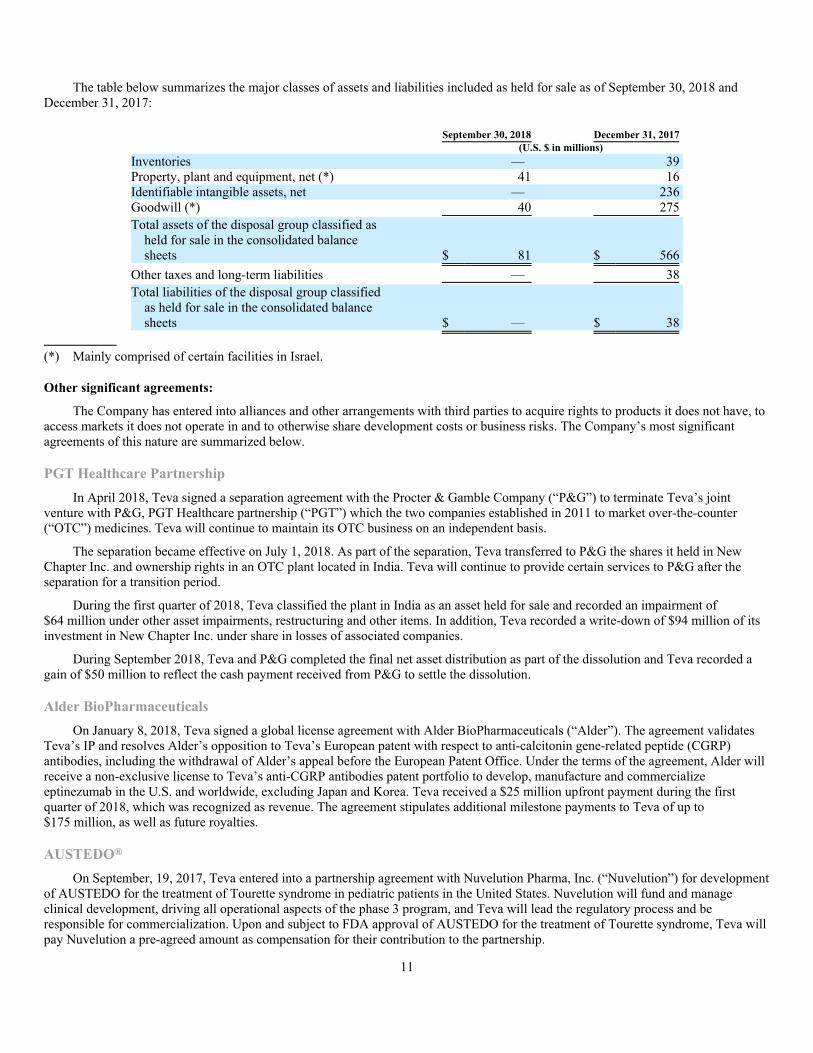
The table below summarizes the major classes of assets and liabilities included as held for sale as of September 30, 2018 and
December 31, 2017:
September 30, 2018 December 31, 2017
(U.S. $ in millions)
Inventories — 39
Property, plant and equipment, net (*) 41 16
Identifiable intangible assets, net — 236
Goodwill (*) 40 275
Total assets of the disposal group classified as
held for sale in the consolidated balance
sheets $ 81 $ 566
Other taxes and long-term liabilities — 38
Total liabilities of the disposal group classified
as held for sale in the consolidated balance
sheets $ — $ 38
(*) Mainly comprised of certain facilities in Israel.
Other significant agreements:
The Company has entered into alliances and other arrangements with third parties to acquire rights to products it does not have, to
access markets it does not operate in and to otherwise share development costs or business risks. The Company’s most significant
agreements of this nature are summarized below.
PGT Healthcare Partnership
In April 2018, Teva signed a separation agreement with the Procter & Gamble Company (“P&G”) to terminate Teva’s joint
venture with P&G, PGT Healthcare partnership (“PGT”) which the two companies established in 2011 to market over-the-counter
(“OTC”) medicines. Teva will continue to maintain its OTC business on an independent basis.
The separation became effective on July 1, 2018. As part of the separation, Teva transferred to P&G the shares it held in New
Chapter Inc. and ownership rights in an OTC plant located in India. Teva will continue to provide certain services to P&G after the
separation for a transition period.
During the first quarter of 2018, Teva classified the plant in India as an asset held for sale and recorded an impairment of
$64 million under other asset impairments, restructuring and other items. In addition, Teva recorded a write-down of $94 million of its
investment in New Chapter Inc. under share in losses of associated companies.
During September 2018, Teva and P&G completed the final net asset distribution as part of the dissolution and Teva recorded a
gain of $50 million to reflect the cash payment received from P&G to settle the dissolution.
Alder BioPharmaceuticals
On January 8, 2018, Teva signed a global license agreement with Alder BioPharmaceuticals (“Alder”). The agreement validates
Teva’s IP and resolves Alder’s opposition to Teva’s European patent with respect to anti-calcitonin gene-related peptide (CGRP)
antibodies, including the withdrawal of Alder’s appeal before the European Patent Office. Under the terms of the agreement, Alder will
receive a non-exclusive license to Teva’s anti-CGRP antibodies patent portfolio to develop, manufacture and commercialize
eptinezumab in the U.S. and worldwide, excluding Japan and Korea. Teva received a $25 million upfront payment during the first
quarter of 2018, which was recognized as revenue. The agreement stipulates additional milestone payments to Teva of up to
$175 million, as well as future royalties.
AUSTEDO®
On September, 19, 2017, Teva entered into a partnership agreement with Nuvelution Pharma, Inc. (“Nuvelution”) for development
of AUSTEDO for the treatment of Tourette syndrome in pediatric patients in the United States. Nuvelution will fund and manage
clinical development, driving all operational aspects of the phase 3 program, and Teva will lead the regulatory process and be
responsible for commercialization. Upon and subject to FDA approval of AUSTEDO for the treatment of Tourette syndrome, Teva will
pay Nuvelution a pre-agreed amount as compensation for their contribution to the partnership.
11
Otsuka
On May 12, 2017, Teva entered into a license and collaboration agreement with Otsuka Pharmaceutical Co. Ltd. (“Otsuka”),
providing Otsuka with an exclusive license to conduct phase 2 and 3 clinical trials for fremanezumab in Japan and, if approved, to
commercialize the product in Japan. Otsuka paid Teva an upfront payment of $50 million in consideration for the transaction. Teva may
receive additional milestone payments upon filing with Japanese regulatory authorities, receipt of regulatory approval and achievement
of certain revenue targets. Otsuka will also pay Teva royalties on fremanezumab sales in Japan.
AttenukineTM
In December 2016, Teva entered into a license agreement for research, development, manufacture and commercializing of
AttenukineTM with a subsidiary of Takeda Pharmaceutical Company Ltd. (“Takeda”). Teva received a $30 million upfront payment.
The agreement stipulates additional milestone payments to Teva of up to $280 million, as well as future royalties.
Ninlaro®
In November 2016, Teva entered into an agreement to sell its royalties and other rights in Ninlaro® (ixazomib) to a subsidiary of
Takeda, for a $150 million upfront payment to Teva and an additional $150 million payment based on sales during 2017. Teva was
entitled to these royalties pursuant to an agreement from 2014 assigning the Ninlaro® patents to an affiliate of Takeda in consideration
of milestone payments and sales royalties. In the first six months of 2017, Teva received payments in the amount of $150 million,
which were recognized as revenue for the period.
Celltrion
In October 2016, Teva and Celltrion, Inc. (“Celltrion”) entered into a collaborative agreement to commercialize two of Celltrion’s
biosimilar products in development for the U.S. and Canadian markets. Teva paid Celltrion $160 million, of which up to $60 million is
refundable or creditable under certain circumstances. Teva and Celltrion will share the profit from the commercialization of these
products.
Regeneron
In September 2016, Teva and Regeneron Pharmaceuticals, Inc. (“Regeneron”) entered into a collaborative agreement to develop
and commercialize Regeneron’s pain medication product, fasinumab. Teva and Regeneron share equally in the global commercial rights
to this product, as well as ongoing associated R&D costs of approximately $1 billion. Teva made an upfront payment of $250 million to
Regeneron in the third quarter of 2016 as part of the agreement. Milestone payments of $25 million and $35 million were paid in the
second quarter of 2017 and the first quarter of 2018, respectively, and a provision of $60 million was recorded in the third quarter of
2018.
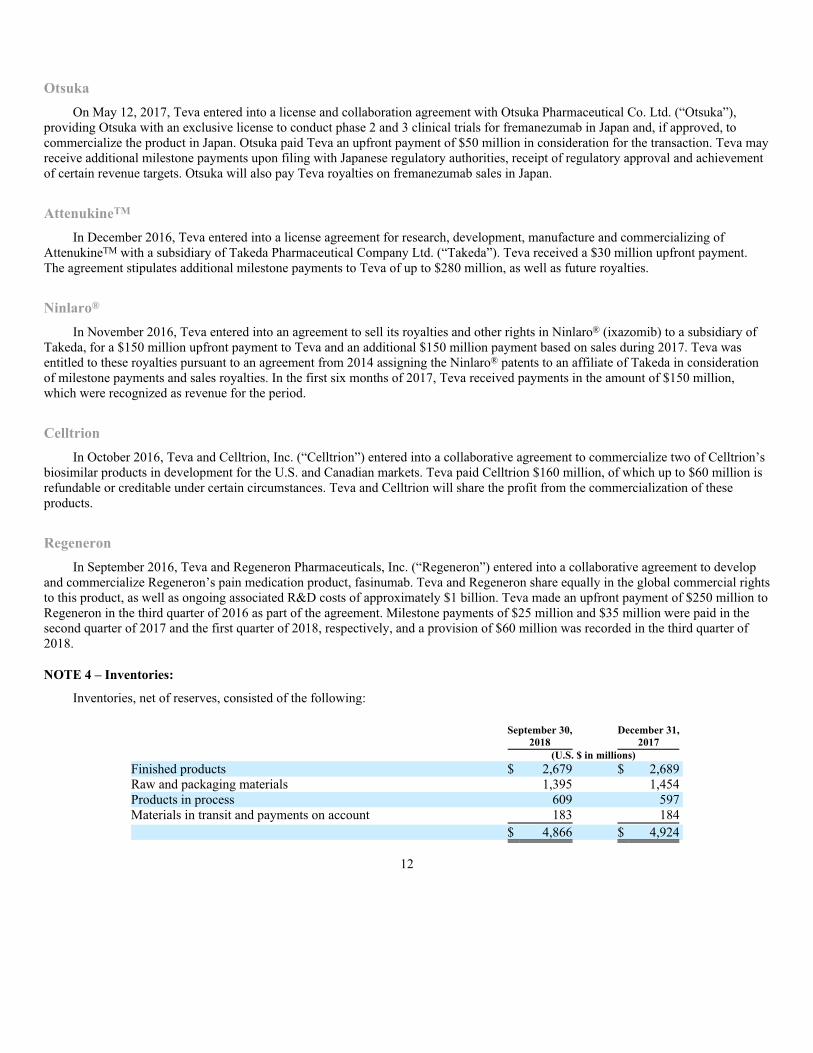
NOTE 4 – Inventories:
Inventories, net of reserves, consisted of the following:
September 30,
2018
December 31,
2017
(U.S. $ in millions)
Finished products $ 2,679 $ 2,689
Raw and packaging materials 1,395 1,454
Products in process 609 597
Materials in transit and payments on account 183 184
$ 4,866 $ 4,924
12

NOTE 5 – Property, plant and equipment:
Property, plant and equipment, net, consisted of the following:
September 30,
2018
December 31,
2017
(U.S. $ in millions)
Machinery and equipment $ 5,783 $ 5,809
Buildings 3,179 3,329
Computer equipment and other assets 2,115 2,016
Payments on account 538 634
Land (1) 361 390
11,976 12,178
Less—accumulated depreciation 4,875 4,505
$ 7,101 $ 7,673
(1) Land includes long-term leasehold rights in various locations, with useful lives between 30 and 99 years.
NOTE 6 – Identifiable intangible assets:
Identifiable intangible assets consisted of the following:
Gross carrying amount net of
impairment Accumulated amortization Net carrying amount
September 30, December 31, September 30, December 31, September 30, December 31,
2018 2017 2018 2017 2018 2017
(U.S. $ in millions)
Product rights $ 21,094 $ 21,011 $ 9,132 $ 8,276 $ 11,962 $ 12,735
Trade names 610 617 82 55 528 562
Research and development in process 2,855 4,343 — — 2,855 4,343
Total $ 24,559 $ 25,971 $ 9,214 $ 8,331 $ 15,345 $ 17,640
Product rights and trade names are assets presented at amortized cost. These assets represent a portfolio of pharmaceutical
products from various categories with a weighted average amortization life of approximately 11 years. Amortization of intangible assets
was $297 million and $357 million for the three months ended September 30, 2018 and 2017, respectively and $909 million and
$1,088 million for the nine months ended September 30, 2018 and 2017, respectively. Amortization is recorded under cost of sales or
S&M expenses, depending on the nature of the asset.
The fair value of acquired identifiable intangible assets is generally determined using an income approach. This method starts with
a forecast of all expected future net cash flows associated with the asset and then adjusts the forecast to present value by applying an
appropriate discount rate that reflects the risk factors associated with the cash flow streams.
Whenever impairment indicators are identified for definite life intangible assets, Teva reconsiders the asset’s estimated life,
calculates the undiscounted value of the asset’s or asset group’s cash flows and then calculates, if required, the discounted value of cash
flow by applying an appropriate discount rate to the undiscounted cash flow streams. Teva then compares such value against the asset’s
or asset group’s carrying amount. If the carrying amount is greater, Teva records an impairment loss for the excess of carrying value
over fair value based on the discounted cash flows.
The more significant estimates and assumptions inherent in the estimate of the fair value of identifiable intangible assets include
all assumptions associated with forecasting product profitability, including sales and cost to sell projections, R&D expenditure for
ongoing support of product rights or continued development of IPR&D, estimated useful lives and IPR&D expected launch dates.
Additionally, for IPR&D assets the risk of failure has been factored into the fair value measure.
Impairment of identifiable intangible assets of $519 million and $355 million for the three months ended September 30, 2018 and
2017, respectively and $1,246 million and $409 million for the nine months ended September 30, 2018 and 2017, respectively.
Impairments of identifiable intangible assets are recorded in earnings under other asset impairments, restructuring and other items. See
note 14.
13
Additional reductions to IPR&D intangibles relate to reclassification to product rights following regulatory approvals of generic
products and impairments of assets due to development status, changes in projected launch date or changes in commercial projections
related to products under development.
In the first nine months of 2018, Teva reclassified approximately $553 million relating to certain products from IPR&D to product
rights following regulatory approval, mainly $444 million in connection with AJOVY (fremanezumab) and $103 million in connection
with mesalamine.
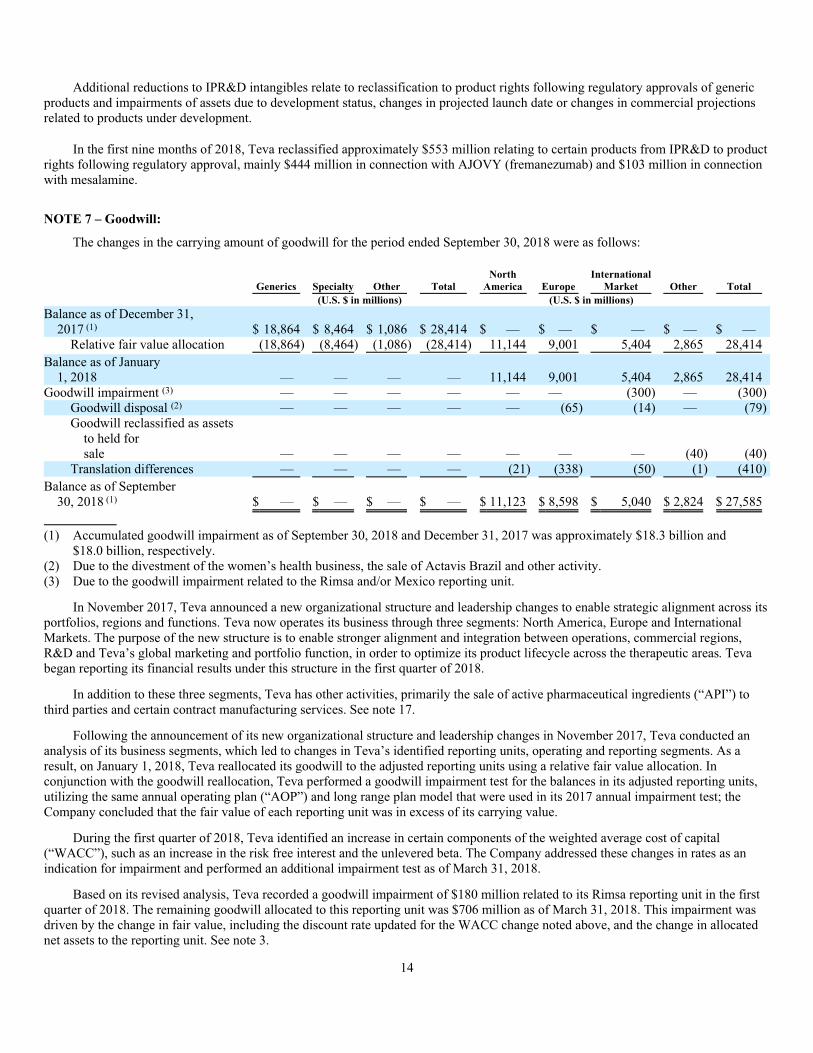
NOTE 7 – Goodwill:
The changes in the carrying amount of goodwill for the period ended September 30, 2018 were as follows:
Generics Specialty Other Total
North
America Europe
International
Market Other Total
(U.S. $ in millions) (U.S. $ in millions)
Balance as of December 31,
2017 (1) $ 18,864 $ 8,464 $ 1,086 $ 28,414 $ — $ — $ — $ — $ —
Relative fair value allocation (18,864) (8,464) (1,086) (28,414) 11,144 9,001 5,404 2,865 28,414
Balance as of January
1, 2018 — — — — 11,144 9,001 5,404 2,865 28,414
Goodwill impairment (3) — — — — — — (300) — (300)
Goodwill disposal (2) — — — — — (65) (14) — (79)
Goodwill reclassified as assets
to held for
sale — — — — — — — (40) (40)
Translation differences — — — — (21) (338) (50) (1) (410)
Balance as of September
30, 2018 (1) $ — $ — $ — $ — $ 11,123 $ 8,598 $ 5,040 $ 2,824 $ 27,585
(1) Accumulated goodwill impairment as of September 30, 2018 and December 31, 2017 was approximately $18.3 billion and
$18.0 billion, respectively.
(2) Due to the divestment of the women’s health business, the sale of Actavis Brazil and other activity.
(3) Due to the goodwill impairment related to the Rimsa and/or Mexico reporting unit.
In November 2017, Teva announced a new organizational structure and leadership changes to enable strategic alignment across its
portfolios, regions and functions. Teva now operates its business through three segments: North America, Europe and International
Markets. The purpose of the new structure is to enable stronger alignment and integration between operations, commercial regions,
R&D and Teva’s global marketing and portfolio function, in order to optimize its product lifecycle across the therapeutic areas. Teva
began reporting its financial results under this structure in the first quarter of 2018.
In addition to these three segments, Teva has other activities, primarily the sale of active pharmaceutical ingredients (“API”) to
third parties and certain contract manufacturing services. See note 17.
Following the announcement of its new organizational structure and leadership changes in November 2017, Teva conducted an
analysis of its business segments, which led to changes in Teva’s identified reporting units, operating and reporting segments. As a
result, on January 1, 2018, Teva reallocated its goodwill to the adjusted reporting units using a relative fair value allocation. In
conjunction with the goodwill reallocation, Teva performed a goodwill impairment test for the balances in its adjusted reporting units,
utilizing the same annual operating plan (“AOP”) and long range plan model that were used in its 2017 annual impairment test; the
Company concluded that the fair value of each reporting unit was in excess of its carrying value.
During the first quarter of 2018, Teva identified an increase in certain components of the weighted average cost of capital
(“WACC”), such as an increase in the risk free interest and the unlevered beta. The Company addressed these changes in rates as an
indication for impairment and performed an additional impairment test as of March 31, 2018.
Based on its revised analysis, Teva recorded a goodwill impairment of $180 million related to its Rimsa reporting unit in the first
quarter of 2018. The remaining goodwill allocated to this reporting unit was $706 million as of March 31, 2018. This impairment was
driven by the change in fair value, including the discount rate updated for the WACC change noted above, and the change in allocated
net assets to the reporting unit. See note 3.
14
In the second quarter of 2018, the Company completed its long-range planning (“LRP”) process. The LRP is part of Teva’s
internal financial planning and budgeting processes and is discussed and reviewed by Teva’s management and its board of directors.
Certain events and changes in circumstances, reflected in the LRP, indicated that it was more likely than not that the carrying value of
certain reporting units exceeded their fair value:
• Historically, Rimsa had been carved out as a separate reporting unit due to the significant operational challenges. Teva
wanted to ensure that any impairment related to Rimsa would be recorded, by separating it from the International Markets
reporting unit. During the second quarter of 2018, Rimsa and Teva Mexico substantially completed the integration process
and as a result Teva decided to utilize the combined Mexico reporting unit for goodwill impairment testing, as opposed to
“Rimsa only” in prior periods.
• Following the integration, and although the remediation plan is progressing in connection with Rimsa legacy products, Teva
estimates that the recovery time will be longer than initially planned, specifically in connection with the time to regain lost
market share. As a result, the Company recorded an additional goodwill impairment charge of $120 million related to its
Mexico reporting unit in the second quarter of 2018.
• Additionally, the Company identified further developments with respect to legislation proposed by the Russian Ministry of
Health. The draft legislation includes, among other items, amendments in the mechanism of regulating prices for vital and
essential medicines. The suggested amendments triggered a public discussion between authorities and pharmaceutical
companies, which ended in the second quarter of 2018, followed by an internal discussion by the relevant authorities. The
estimated impact of developments and uncertainties with respect to the final legislation in Russia were reflected in the LRP
and triggered an impairment test for the International Markets reporting unit and related intangible assets, significantly
decreasing the difference between the estimated fair value and estimated carrying value of the reporting unit, from 6% to 2%;
however no impairment was recorded.
• After assessing the totality of relevant events and circumstances, Teva determined that, as of the second quarter of 2018, it is
not more likely than not that the fair value of its remaining reporting units is less than their carrying amount.
In light of the integration and the progress toward operational remediation in Rimsa as discussed above, Teva concluded that
commencing July 1, 2018, it would no longer view Mexico separately from the International Markets reporting unit and accordingly
will no longer perform impairment testing on Mexico as a separate reporting unit.
During the third quarter of 2018, Teva identified an increase in the risk free interest rate, which caused an increase in WACC. In
addition, certain currencies in countries included in Teva’s International Markets reporting unit experienced significant devaluations.
Teva addressed these events as an indication for impairment and performed an additional impairment test for the International Markets
and Europe reporting units as of September 30, 2018. Teva assumed that the currency devaluations would cause price increases of its
imported goods to those countries which would not be completely offset by corresponding price adjustments to the selling price of
Teva’s goods. These changes decreased the difference between the estimated fair value and estimated carrying value of the International
Markets reporting unit from 2% to 1% and of the Europe reporting unit from 6% to 4%, however, no impairment charge was recorded
for either reporting unit.
In the third quarter of 2018, the fair value exceeded the estimated carrying value by 36% and 43% for North America and Other
reporting units, respectively.
Based on current macro-economic developments and capital markets assumptions and holding all other assumptions constant, an
increase in the risk free interest rate of 0.5% would result in an increase to Teva’s WACC by approximately the same amount and
consequently in a change in fair value of the International Markets reporting unit of $653 million, resulting in an impairment of
$605 million. In addition, the same change in the Europe reporting unit would result in a change in fair value of $871 million, resulting
in an impairment of $243 million.
Teva determines the fair value of its reporting units using a weighting of fair values derived from the income approach. The
income approach is a forward-looking approach for estimating fair value and utilizes the 2018 remaining year forecast, projections for
growth off that base with an associated price erosion, as well as terminal growth rate. Within the income approach, the method that was
used is the discounted cash flow method. Teva started with a forecast of all the expected net cash flows associated with the reporting
unit, which includes the application of a terminal value, and then applied a discount rate to arrive at a net present value amount. Cash
flow projections are based on Teva’s estimates of revenue growth rates and operating margins, taking into consideration industry and
market conditions. The discount rate used is based on the WACC, adjusted for the relevant risk associated with country-specific
characteristics. If any of these expectations were to vary materially from Teva’s assumptions, Teva could face impairment of goodwill
allocated to these reporting units in the future.
15

NOTE 8 – Earnings (Loss) per share:
Basic earnings and loss per share are computed by dividing net results attributable to Teva’s ordinary shareholders by the
weighted average number of ordinary shares outstanding (including fully vested restricted share units (“RSUs”)) during the period, net
of treasury shares.
In computing the diluted loss per share for the three months ended September 30, 2018, no account was taken of the potential
dilution by the assumed exercise of employee stock options and non-vested RSUs granted under employee stock compensation plans,
and convertible senior debentures, since they had an anti-dilutive effect on loss per share. Diluted earnings per share for the three
months ended September 30, 2017 take into account the potential dilution that could occur upon the exercise of options and non-vested
RSUs granted under employee stock compensation plans, using the treasury stock method.
Additionally, no account was taken of the potential dilution by the mandatory convertible preferred shares, amounting to
66 million (including shares that may be issued due to unpaid dividends to date) for the three months ended September 30, 2018 and
59 million for the three months ended September 30, 2017, as well as for the convertible senior debentures for the respective periods,
since both had an anti-dilutive effect on earnings (loss) per share.
Diluted earnings per share for the nine months ended September 30, 2018 take into account the potential dilution that could occur
upon the exercise of options and non-vested RSUs granted under employee stock compensation plans, using the treasury stock method.
In computing loss per share for the nine months ended September 30, 2017, no account was taken of the potential dilution by the
assumed exercise of employee stock options and non-vested RSUs granted under employee stock compensation plans, and convertible
senior debentures, since they had an anti-dilutive effect on loss per share.
Additionally, no account was taken of the potential dilution by the mandatory convertible preferred shares, amounting to
68 million (including shares that may be issued due to unpaid dividends to date) for the nine months ended September 30, 2018 and
59 million for the nine months ended September 30, 2017, as well as for the convertible senior debentures for the respective periods,
since both had an anti-dilutive effect on earnings (loss) per share.
NOTE 9 – Revenue from contracts with customers:
On January 1, 2018, Teva adopted the new revenue standard to all contracts using the modified retrospective method. The
cumulative effect of initially applying the new revenue standard was immaterial.
Revenue recognition prior to the adoption of the new revenue standard
Please refer to note 1 to the consolidated financial statements and critical accounting policies included in Teva’s Annual Report on
Form 10-K for the year ended December 31, 2017 for a summary of the significant accounting policies.
Revenue recognition following the adoption of the new revenue standard
A contract with a customer exists only when: the parties to the contract have approved it and are committed to perform their
respective obligations, the Company can identify each party’s rights regarding the distinct goods or services to be transferred
(“performance obligations”), the Company can determine the transaction price for the goods or services to be transferred, the contract
has commercial substance and it is probable that the Company will collect the consideration to which it will be entitled in exchange for
the goods or services that will be transferred to the customer.
Revenues are recorded in the amount of consideration to which the Company expects to be entitled in exchange for performance
obligations upon transfer of control to the customer, excluding amounts collected on behalf of other third parties and sales taxes.
The amount of consideration to which Teva expects to be entitled varies as a result of rebates, chargebacks, returns and other sales
reserve and allowances (“SR&A”) the Company offers its customers and their customers, as well as the occurrence or nonoccurrence of
future events, including milestone events. A minimum amount of variable consideration is recorded concurrently with the satisfaction of
performance obligations to the extent that it is probable that a significant reversal in the amount of cumulative revenue recognized will
not occur when the uncertainty associated with the variable consideration is subsequently resolved. Estimates of variable consideration
are based on historical experience and the specific terms in the individual agreements (which the Company believes approximates
expected value). Rebates and chargebacks are the largest components of SR&A. For further description of SR&A components and how
they are estimated, see “Variable Consideration” below.
Shipping and handling costs after control over a product has transferred to a customer are accounted for as a fulfillment cost and
are recorded under S&M expenses.
Teva does not adjust the promised amount of consideration for the effects of a significant financing component since the Company
expects, at contract inception, that the period between the time of transfer of the promised goods or services to the customer and the
time the customer pays for these goods or services to be generally one year or less, based on the practical expedient. The Company’s
credit terms to customers are in average between thirty and ninety days.
16
The Company generally recognizes the incremental costs of obtaining contracts as an expense since the amortization period of the
assets that the Company otherwise would have recognized is one year or less. The costs are recorded under S&M expenses. Similarly,
Teva does not disclose the value of unsatisfied performance obligations for contracts with original expected duration of one year or less.
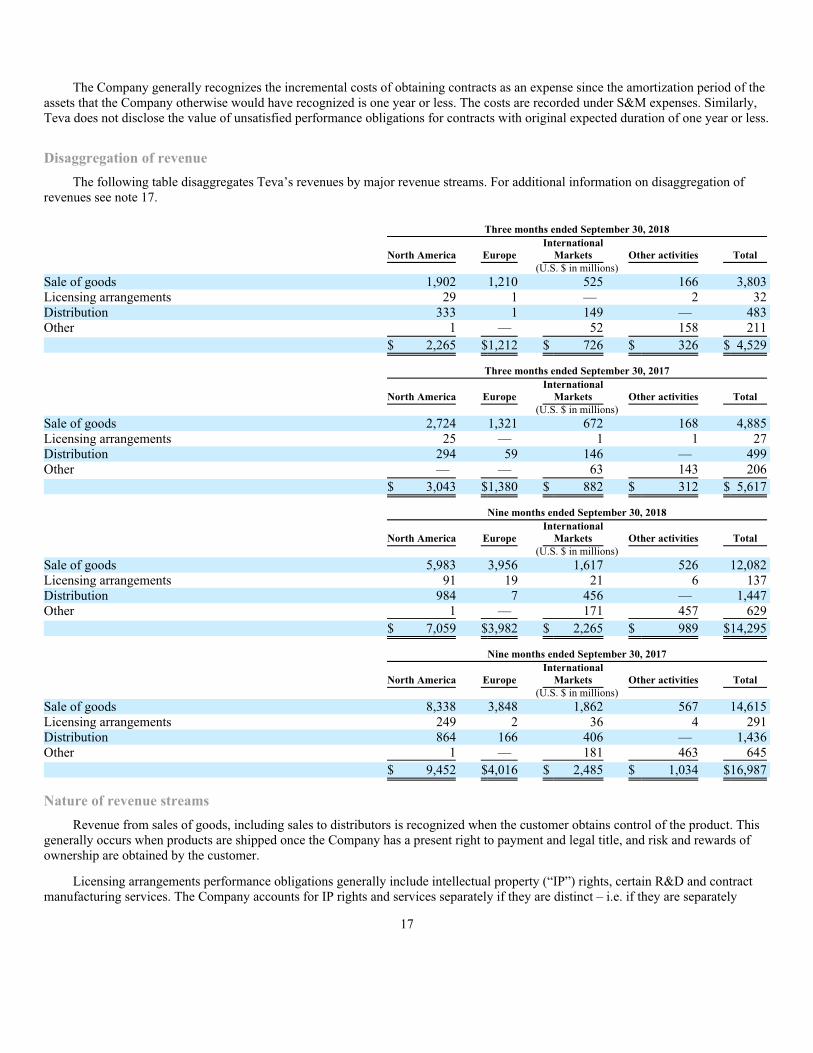
Disaggregation of revenue
The following table disaggregates Teva’s revenues by major revenue streams. For additional information on disaggregation of
revenues see note 17.
Three months ended September 30, 2018
North America Europe
International
Markets Other activities Total
(U.S. $ in millions)
Sale of goods 1,902 1,210 525 166 3,803
Licensing arrangements 29 1 — 2 32
Distribution 333 1 149 — 483
Other 1 — 52 158 211
$ 2,265 $1,212 $ 726 $ 326 $ 4,529
Three months ended September 30, 2017
North America Europe
International
Markets Other activities Total
(U.S. $ in millions)
Sale of goods 2,724 1,321 672 168 4,885
Licensing arrangements 25 — 1 1 27
Distribution 294 59 146 — 499
Other — — 63 143 206
$ 3,043 $1,380 $ 882 $ 312 $ 5,617
Nine months ended September 30, 2018
North America Europe
International
Markets Other activities Total
(U.S. $ in millions)
Sale of goods 5,983 3,956 1,617 526 12,082
Licensing arrangements 91 19 21 6 137
Distribution 984 7 456 — 1,447
Other 1 — 171 457 629
$ 7,059 $3,982 $ 2,265 $ 989 $14,295
Nine months ended September 30, 2017
North America Europe
International
Markets Other activities Total
(U.S. $ in millions)
Sale of goods 8,338 3,848 1,862 567 14,615
Licensing arrangements 249 2 36 4 291
Distribution 864 166 406 — 1,436
Other 1 — 181 463 645
$ 9,452 $4,016 $ 2,485 $ 1,034 $16,987
Nature of revenue streams
Revenue from sales of goods, including sales to distributors is recognized when the customer obtains control of the product. This
generally occurs when products are shipped once the Company has a present right to payment and legal title, and risk and rewards of
ownership are obtained by the customer.
Licensing arrangements performance obligations generally include intellectual property (“IP”) rights, certain R&D and contract
manufacturing services. The Company accounts for IP rights and services separately if they are distinct – i.e. if they are separately
17

identifiable from other items in the arrangement and if the customer can benefit from them on their own or with other resources that are
readily available to the customer. The consideration is allocated between IP rights and services based on their relative stand-alone
selling prices.
Revenue for distinct IP rights is accounted for based on the nature of the promise to grant the license. In determining whether the
Company’s promise is to provide a right to access its IP or a right to use its IP, the Company considers the nature of the IP to which the
customer will have rights. IP is either functional IP which has significant standalone functionality or symbolic IP which does not have
significant standalone functionality. Revenue from functional IP is recognized at the point in time when control of the distinct license is
transferred to the customer, when the Company has a present right to payment and risks and rewards of ownership are transferred to the
customer. Revenue from symbolic IP is recognized over the access period to the Company’s IP.
Revenue from sales based milestones and royalties promised in exchange for a license of IP is recognized only when, or as, the
later of subsequent sale or the performance obligation to which some or all of the sales-based royalty has been allocated, is satisfied.
Revenues from licensing arrangements included royalty income of $31 million and $27 million for the three months ended
September 30, 2018 and 2017, respectively. Revenues from licensing arrangements included royalty income of $82 million and
$239 million for the nine months ended September 30, 2018 and 2017, respectively. The amounts recognized in 2017 include royalty
income resulting from the Ninlaro® transaction.
Distribution revenues are derived from sales of third-party products for which the Company acts as distributor, mostly in the
United States via Anda and in Israel. The Company is the principal in these arrangements and therefore records revenue on a gross basis
as it controls the promised goods before transferring these goods to the customer. Revenue is recognized when the customer obtains
control of the products. This generally occurs when products are shipped once the Company has a present right to payment and legal
title, and risk and rewards of ownership are obtained by the customer.
Other revenues are primarily comprised of contract manufacturing services, sales of medical devices, and other miscellaneous
items. Revenue is recognized when the customer obtains control of the products. This generally occurs when products are shipped once
the Company has a present right to payment and legal title and risk and rewards of ownership are obtained by the customer.
Contract assets and liabilities
Contract assets are mainly comprised of trade receivables net of allowance for doubtful debts, which includes amounts billed and
currently due from customers.
Contract liabilities are mainly comprised of deferred revenues which were immaterial as of September 30, 2018 and December 31,
2017, respectively.
Variable consideration
Variable consideration mainly includes SR&A, comprised of rebates (including Medicaid and other governmental program
discounts), chargebacks, returns and other promotional (including shelf stock adjustments) items. Provisions for prompt payment
discounts are netted against trade receivables.
The Company recognizes these provisions at the time of sale and adjusts them if the actual amounts differ from the estimated
provisions. The following describes the nature of each deduction and how provisions are estimated:
Rebates
Rebates are primarily related to volume incentives and are offered to key customers to promote loyalty. These rebate programs
provide that, upon the attainment of pre-established volumes or the attainment of revenue milestones for a specified period, the
customer receives a rebate. Since rebates are contractually agreed upon, they are estimated based on the specific terms in each
agreement based on historical trends and expected sales. Externally obtained inventory levels are evaluated in relation to estimates
made for rebates payable to indirect customers.
Medicaid and Other Governmental Rebates
Pharmaceutical manufacturers whose products are covered by the Medicaid program are required to provide a rebate to each state
as a percentage of their average manufacturer’s price for the products dispensed. Many states have also implemented supplemental
rebate programs that obligate manufacturers to pay rebates in excess of those required under federal law. The Company estimates these
rebates based on historical trends of rebates paid, as well as on changes in wholesaler inventory levels and increases or decreases in
sales.
Chargebacks
The Company has arrangements with various third parties, such as managed care organizations and drug store chains, establishing
prices for certain of Teva’s products. While these arrangements are made between the Company and the customers, the customers
independently select a wholesaler from which they purchase the products. Alternatively, certain wholesalers may enter into
18
agreements with the customers, with Teva’s concurrence, which establish the pricing for certain products which the wholesalers
provide. Under either arrangement, Teva will issue a credit (referred to as a “chargeback”) to the wholesaler for the difference between
the invoice price to the wholesaler and the customer’s contract price. Provisions for chargebacks involve estimates of contract prices of
over 2,000 products and multiple contracts with multiple wholesalers. The provision for chargebacks varies in relation to changes in
product mix, pricing and the level of inventory at the wholesalers and therefore will not necessarily fluctuate in proportion to an
increase or decrease in sales. Provisions for estimating chargebacks are calculated using historical chargeback experience and/or
expected chargeback levels for new products and anticipated pricing changes. Teva considers current and expected price competition
when evaluating the provision for chargebacks. Chargeback provisions are compared to externally obtained distribution channel reports
for reasonableness. The Company regularly monitors the provision for chargebacks and makes adjustments when the Company believes
that actual chargebacks may differ from estimated provisions.
Other Promotional Arrangements
Other promotional or incentive arrangements are periodically offered to customers, specifically related to the launch of products or
other targeted promotions. Provisions are made in the period for which the Company can estimate the incentive earned by the customer,
in accordance with the contractual terms. The Company regularly monitors the provision for other promotional arrangements and makes
adjustments when Teva believes that the actual provision may differ from the estimated provisions.
Shelf Stock Adjustments
The custom in the pharmaceutical industry is generally to grant customers a shelf stock adjustment based on the customers’
existing inventory contemporaneously with decreases in the market price of the related product. The most significant of these relate to
products for which an exclusive or semi-exclusive period exists. Provisions for price reductions depend on future events, including price
competition, new competitive launches and the level of customer inventories at the time of the price decline. Teva regularly monitors
the competitive factors that influence the pricing of its products and customer inventory levels and adjust these estimates where
appropriate.
Returns
Returns primarily relate to customer returns of expired products which, the customer has the right to return up to one year
following the expiration date. Such returned products are destroyed and credits and/or refunds are issued to the customer for the value
of the returns. Accordingly, no returned assets are recoded in connection with those products. The returns provision is estimated by
applying a historical return rate to the amounts of revenue estimated to be subject to returns. Revenue subject to returns is estimated
based on the lag time from time of sale to date of return. The estimated lag time is developed by analyzing historical experience.
Additionally, The Company considers specific factors, such as levels of inventory in the distribution channel, product dating and
expiration, size and maturity of launch, entrance of new competitors, changes in formularies or packaging and any changes to customer
terms, for determining the overall expected levels of returns.
Prompt Pay Discounts
Prompt pay discounts are offered to most customers to encourage timely payment. Discounts are estimated at the time of invoice
based on historical discounts in relation to sales. Prompt pay discounts are almost always utilized by customers. As a result, the actual
discounts do not vary significantly from the estimated amount.
19
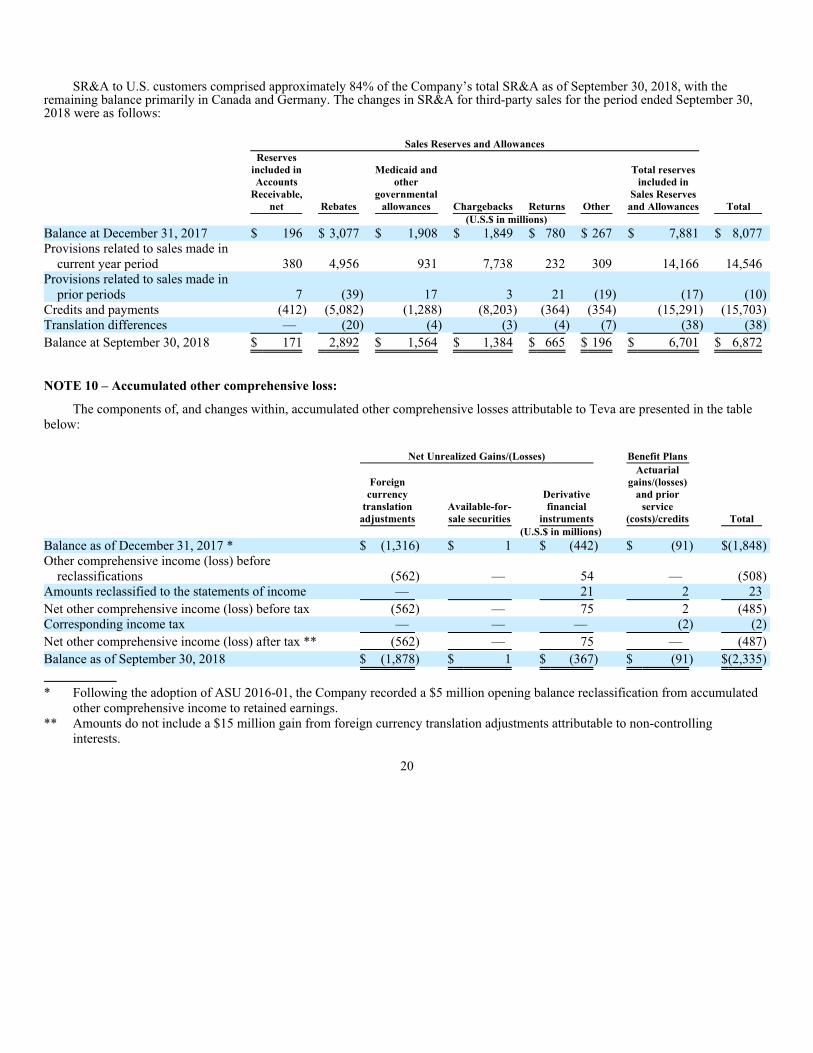
SR&A to U.S. customers comprised approximately 84% of the Company’s total SR&A as of September 30, 2018, with the
remaining balance primarily in Canada and Germany. The changes in SR&A for third-party sales for the period ended September 30,
2018 were as follows:
Sales Reserves and Allowances
Reserves
included in
Accounts
Receivable,
net Rebates
Medicaid and
other
governmental
allowances Chargebacks Returns Other
Total reserves
included in
Sales Reserves
and Allowances Total
(U.S.$ in millions)
Balance at December 31, 2017 $ 196 $ 3,077 $ 1,908 $ 1,849 $ 780 $ 267 $ 7,881 $ 8,077
Provisions related to sales made in
current year period 380 4,956 931 7,738 232 309 14,166 14,546
Provisions related to sales made in
prior periods 7 (39) 17 3 21 (19) (17) (10)
Credits and payments (412) (5,082) (1,288) (8,203) (364) (354) (15,291) (15,703)
Translation differences — (20) (4) (3) (4) (7) (38) (38)
Balance at September 30, 2018 $ 171 2,892 $ 1,564 $ 1,384 $ 665 $ 196 $ 6,701 $ 6,872
NOTE 10 – Accumulated other comprehensive loss:
The components of, and changes within, accumulated other comprehensive losses attributable to Teva are presented in the table
below:
Net Unrealized Gains/(Losses) Benefit Plans
Foreign
currency
translation
adjustments
Available-for-
sale securities
Derivative
financial
instruments
Actuarial
gains/(losses)
and prior
service
(costs)/credits Total
(U.S.$ in millions)
Balance as of December 31, 2017 * $ (1,316) $ 1 $ (442) $ (91) $(1,848)
Other comprehensive income (loss) before
reclassifications (562) — 54 — (508)
Amounts reclassified to the statements of income — 21 2 23
Net other comprehensive income (loss) before tax (562) — 75 2 (485)
Corresponding income tax — — — (2) (2)
Net other comprehensive income (loss) after tax ** (562) — 75 — (487)
Balance as of September 30, 2018 $ (1,878) $ 1 $ (367) $ (91) $(2,335)
* Following the adoption of ASU 2016-01, the Company recorded a $5 million opening balance reclassification from accumulated
other comprehensive income to retained earnings.
** Amounts do not include a $15 million gain from foreign currency translation adjustments attributable to non-controlling
interests.
20

Net Unrealized Gains/(Losses) Benefit Plans
Foreign
currency
translation
adjustments
Available-for-
sale securities
Derivative
financial
instruments
Actuarial
gains/(losses)
and prior
service
(costs)/credits Total
(U.S.$ in millions)
Balance, December 31, 2016 $ (2,769) $ (7) $ (302) $ (81) $(3,159)
Other comprehensive income (loss) before
reclassifications 1,124 56 (138) (9) 1,033
Amounts reclassified to the statements of income (52) (41) 20 2 (71)
Net other comprehensive income (loss) before tax 1,072 15 (118) (7) 962
Corresponding income tax — 5 — (5) —
Net other comprehensive income (loss) after tax * 1,072 20 (118) (12) 962
Balance, September 30, 2017 $ (1,697) $ 13 $ (420) $ (93) $(2,197)
* Amounts do not include a $64 million gain from foreign currency translation adjustments attributable to non-controlling
interests.
NOTE 11 – Debt obligations:
Short-term debt:
Weighted average interest rate as of
September 30, 2018 Maturity
September 30,
2018
December 31,
2017
(U.S. $ in millions)
Term loan JPY 28.3 billion (5) JPY LIBOR+0.25% 2018 $ — $ 251
Convertible debentures 0.25% 2026* 514 514
Other 9.37% 2018 1 1
Current maturities of long-term liabilities 2,158 2,880
Total short term debt $ 2,673 $ 3,646
* Net-share settlement feature exercisable at any time.
21
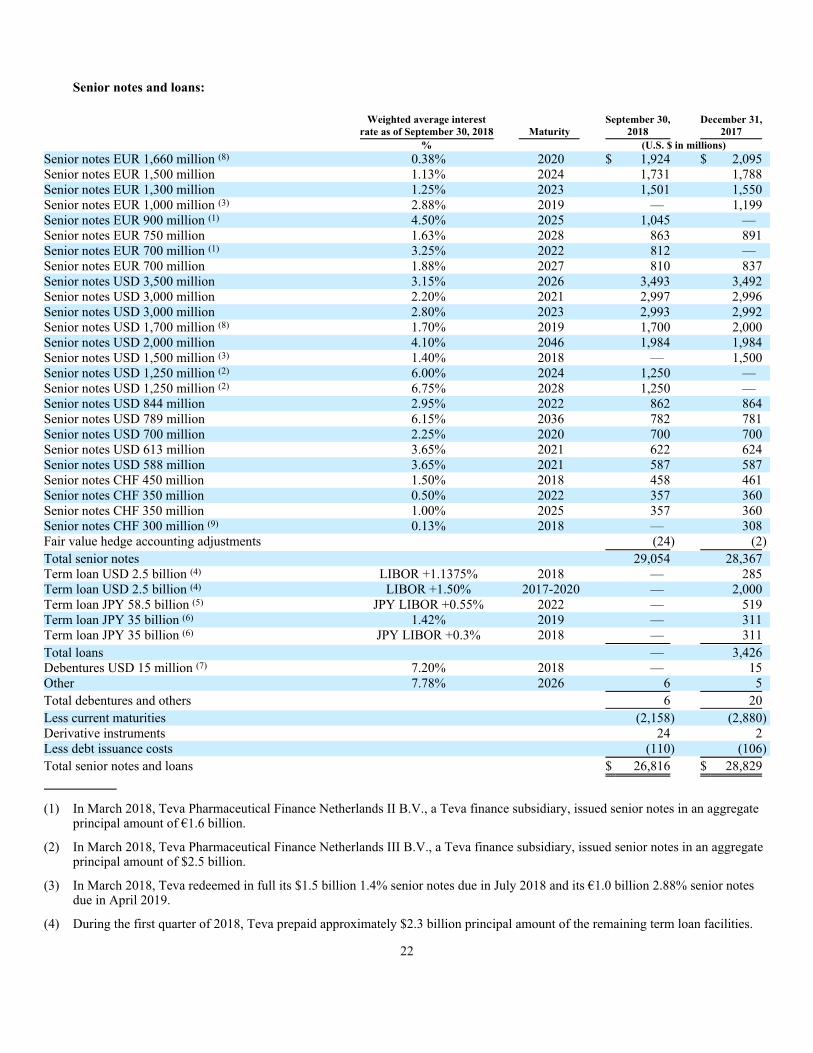
Senior notes and loans:
Weighted average interest
rate as of September 30, 2018 Maturity
September 30,
2018
December 31,
2017
% (U.S. $ in millions)
Senior notes EUR 1,660 million (8) 0.38% 2020 $ 1,924 $ 2,095
Senior notes EUR 1,500 million 1.13% 2024 1,731 1,788
Senior notes EUR 1,300 million 1.25% 2023 1,501 1,550
Senior notes EUR 1,000 million (3) 2.88% 2019 — 1,199
Senior notes EUR 900 million (1) 4.50% 2025 1,045 —
Senior notes EUR 750 million 1.63% 2028 863 891
Senior notes EUR 700 million (1) 3.25% 2022 812 —
Senior notes EUR 700 million 1.88% 2027 810 837
Senior notes USD 3,500 million 3.15% 2026 3,493 3,492
Senior notes USD 3,000 million 2.20% 2021 2,997 2,996
Senior notes USD 3,000 million 2.80% 2023 2,993 2,992
Senior notes USD 1,700 million (8) 1.70% 2019 1,700 2,000
Senior notes USD 2,000 million 4.10% 2046 1,984 1,984
Senior notes USD 1,500 million (3) 1.40% 2018 — 1,500
Senior notes USD 1,250 million (2) 6.00% 2024 1,250 —
Senior notes USD 1,250 million (2) 6.75% 2028 1,250 —
Senior notes USD 844 million 2.95% 2022 862 864
Senior notes USD 789 million 6.15% 2036 782 781
Senior notes USD 700 million 2.25% 2020 700 700
Senior notes USD 613 million 3.65% 2021 622 624
Senior notes USD 588 million 3.65% 2021 587 587
Senior notes CHF 450 million 1.50% 2018 458 461
Senior notes CHF 350 million 0.50% 2022 357 360
Senior notes CHF 350 million 1.00% 2025 357 360
Senior notes CHF 300 million (9) 0.13% 2018 — 308
Fair value hedge accounting adjustments (24) (2)
Total senior notes 29,054 28,367
Term loan USD 2.5 billion (4) LIBOR +1.1375% 2018 — 285
Term loan USD 2.5 billion (4) LIBOR +1.50% 2017-2020 — 2,000
Term loan JPY 58.5 billion (5) JPY LIBOR +0.55% 2022 — 519
Term loan JPY 35 billion (6) 1.42% 2019 — 311
Term loan JPY 35 billion (6) JPY LIBOR +0.3% 2018 — 311
Total loans — 3,426
Debentures USD 15 million (7) 7.20% 2018 — 15
Other 7.78% 2026 6 5
Total debentures and others 6 20
Less current maturities (2,158) (2,880)
Derivative instruments 24 2
Less debt issuance costs (110) (106)
Total senior notes and loans $ 26,816 $ 28,829
(1) In March 2018, Teva Pharmaceutical Finance Netherlands II B.V., a Teva finance subsidiary, issued senior notes in an aggregate
principal amount of €1.6 billion.
(2) In March 2018, Teva Pharmaceutical Finance Netherlands III B.V., a Teva finance subsidiary, issued senior notes in an aggregate
principal amount of $2.5 billion.
(3) In March 2018, Teva redeemed in full its $1.5 billion 1.4% senior notes due in July 2018 and its €1.0 billion 2.88% senior notes
due in April 2019.
(4) During the first quarter of 2018, Teva prepaid approximately $2.3 billion principal amount of the remaining term loan facilities.
22
(5) During the first quarter of 2018, Teva prepaid in full JPY 86.8 billion principal amount of the outstanding term loan facilities of
which JPY 28.3 billion were in short-term debt as of December 31, 2017.
(6) During the first quarter of 2018, Teva prepaid in full JPY 70 billion of its 1.42% and JPY LIBOR+0.3% outstanding term loans.
(7) During the first quarter of 2018, Teva prepaid in full $15 million of its outstanding debentures.
(8) In September 2018, Teva consummated a cash tender offer for certain of its outstanding senior notes. As a result of the offer, Teva
redeemed $300 million aggregate principal amount of its 1.7% senior notes and €90 million principal amount of its 0.38% senior
notes.
(9) In July 2018, Teva repaid at maturity CHF 300 million of its 0.13% senior notes.
Long term debt was issued by several indirect wholly-owned subsidiaries of the Company and is fully and unconditionally
guaranteed by the Company as to payment of all principal, interest, discount and additional amounts (as defined), if any.
Long term debt as of September 30, 2018 is effectively denominated (taking into consideration cross currency swap agreements)
in the following currencies: U.S. dollar 63%, euro 34% and Swiss franc 3%.
Teva’s principal sources of short-term liquidity are its existing cash investments, liquid securities and available credit facilities,
primarily its $3 billion syndicated revolving credit facility (“RCF”), which was not utilized as of September 30, 2018, as well as
internally generated funds. In connection with the requirements of the RCF, the Company entered into negative pledge agreements with
certain banks and institutional investors. Under the agreements, the Company and its subsidiaries have undertaken not to register
floating charges on assets in favor of any third parties without the prior consent of the banks, to maintain certain financial ratios,
including the requirement to maintain compliance with a net debt to EBITDA ratio, which becomes more restrictive over time, and to
fulfill other restrictions, as stipulated by the agreements. As of September 30, 2018, the Company did not have any outstanding debt
under the RCF, which is its only debt subject to the net debt to EBITDA covenant. Assuming utilization of the RCF, and under
specified circumstances, including non-compliance with such covenants and the unavailability of any waiver, amendment or other
modification thereto and the expiration of any applicable grace period thereto, substantially all of the Company’s debt could be
negatively impacted by non-compliance with such covenants. The Company has sufficient resources to meet its financial obligations in
the ordinary course of business for at least twelve months from the date of the release of this quarterly report.
NOTE 12 – Fair value measurement:
Teva’s financial instruments consist mainly of cash and cash equivalents, investment in securities, current and non-current
receivables, short-term debt, current and non-current payables, contingent consideration, senior notes and loans, convertible senior
debentures and derivatives.
The fair value of the financial instruments included in working capital and non-current receivables and payables approximates
their carrying value. The fair value of term loans and bank facilities mostly approximates their carrying value, since they bear interest at
rates close to the prevailing market rates.
Financial instruments measured at fair value
The Company measures fair value and discloses fair value measurements for financial assets and liabilities. Fair value is based on
the price that would be received to sell an asset or paid to transfer a liability in an orderly transaction between market participants at the
measurement date.
The accounting standard establishes a fair value hierarchy that prioritizes observable and unobservable inputs used to measure fair
value into three broad levels, which are described below:
Level 1: Quoted prices (unadjusted) in active markets that are accessible at the measurement date for assets or liabilities. The fair
value hierarchy gives the highest priority to Level 1 inputs.
Level 2: Observable inputs that are based on inputs not quoted on active markets, but corroborated by market data.
Level 3: Unobservable inputs are used when little or no market data is available.
23
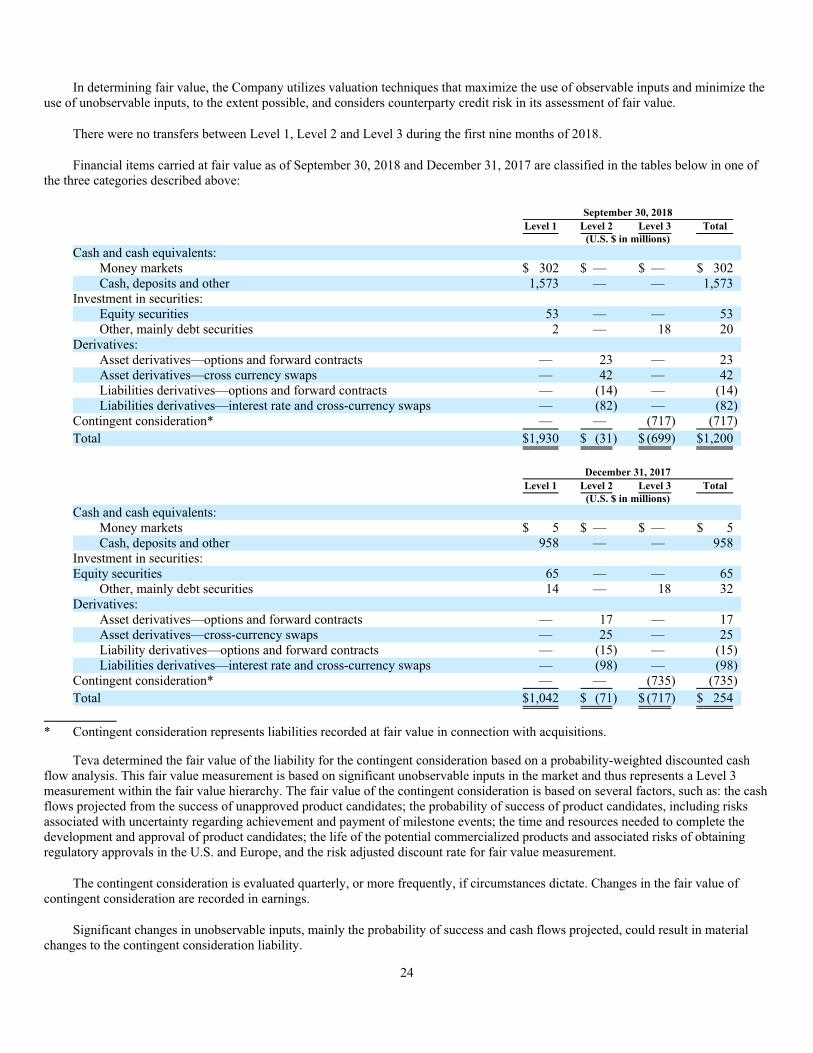
In determining fair value, the Company utilizes valuation techniques that maximize the use of observable inputs and minimize the
use of unobservable inputs, to the extent possible, and considers counterparty credit risk in its assessment of fair value.
There were no transfers between Level 1, Level 2 and Level 3 during the first nine months of 2018.
Financial items carried at fair value as of September 30, 2018 and December 31, 2017 are classified in the tables below in one of
the three categories described above:
September 30, 2018
Level 1 Level 2 Level 3 Total
(U.S. $ in millions)
Cash and cash equivalents:
Money markets $ 302 $ — $ — $ 302
Cash, deposits and other 1,573 — — 1,573
Investment in securities:
Equity securities 53 — — 53
Other, mainly debt securities 2 — 18 20
Derivatives:
Asset derivatives—options and forward contracts — 23 — 23
Asset derivatives—cross currency swaps — 42 — 42
Liabilities derivatives—options and forward contracts — (14) — (14)
Liabilities derivatives—interest rate and cross-currency swaps — (82) — (82)
Contingent consideration* — — (717) (717)
Total $1,930 $ (31) $ (699) $1,200
December 31, 2017
Level 1 Level 2 Level 3 Total
(U.S. $ in millions)
Cash and cash equivalents:
Money markets $ 5 $ — $ — $ 5
Cash, deposits and other 958 — — 958
Investment in securities:
Equity securities 65 — — 65
Other, mainly debt securities 14 — 18 32
Derivatives:
Asset derivatives—options and forward contracts — 17 — 17
Asset derivatives—cross-currency swaps — 25 — 25
Liability derivatives—options and forward contracts — (15) — (15)
Liabilities derivatives—interest rate and cross-currency swaps — (98) — (98)
Contingent consideration* — — (735) (735)
Total $1,042 $ (71) $ (717) $ 254
* Contingent consideration represents liabilities recorded at fair value in connection with acquisitions.
Teva determined the fair value of the liability for the contingent consideration based on a probability-weighted discounted cash
flow analysis. This fair value measurement is based on significant unobservable inputs in the market and thus represents a Level 3
measurement within the fair value hierarchy. The fair value of the contingent consideration is based on several factors, such as: the cash
flows projected from the success of unapproved product candidates; the probability of success of product candidates, including risks
associated with uncertainty regarding achievement and payment of milestone events; the time and resources needed to complete the
development and approval of product candidates; the life of the potential commercialized products and associated risks of obtaining
regulatory approvals in the U.S. and Europe, and the risk adjusted discount rate for fair value measurement.
The contingent consideration is evaluated quarterly, or more frequently, if circumstances dictate. Changes in the fair value of
contingent consideration are recorded in earnings.
Significant changes in unobservable inputs, mainly the probability of success and cash flows projected, could result in material
changes to the contingent consideration liability.
24
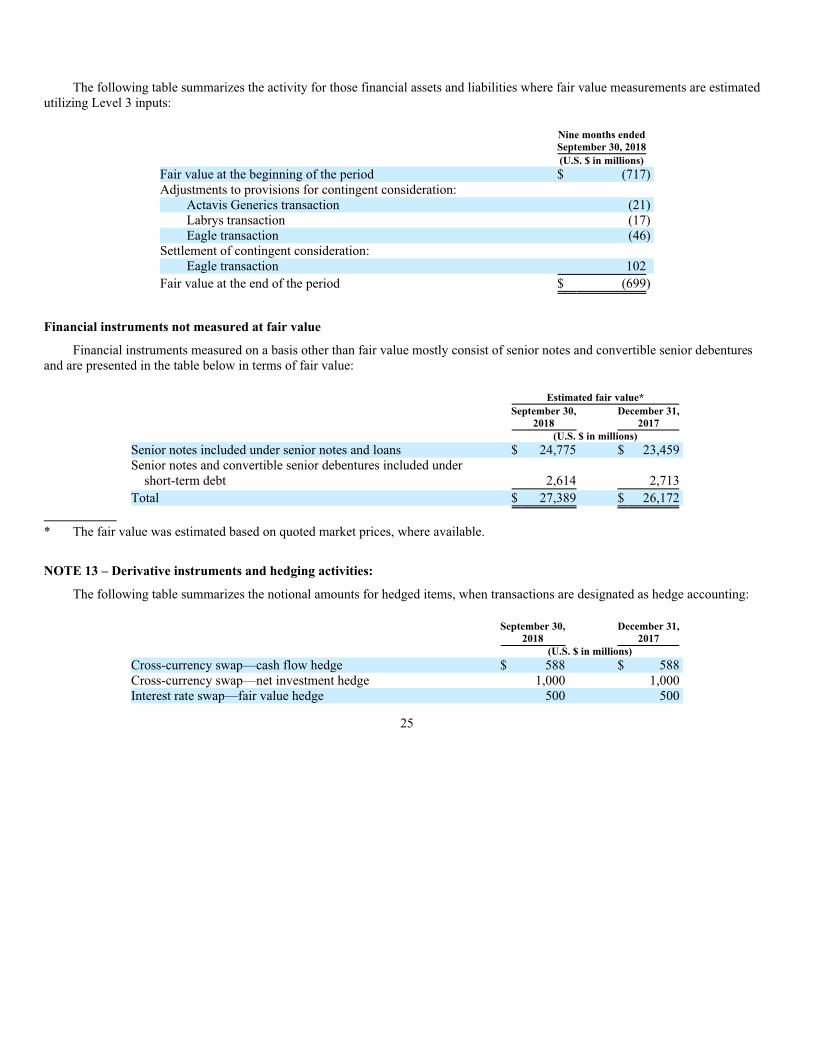
The following table summarizes the activity for those financial assets and liabilities where fair value measurements are estimated
utilizing Level 3 inputs:
Nine months ended
September 30, 2018
(U.S. $ in millions)
Fair value at the beginning of the period $ (717)
Adjustments to provisions for contingent consideration:
Actavis Generics transaction (21)
Labrys transaction (17)
Eagle transaction (46)
Settlement of contingent consideration:
Eagle transaction 102
Fair value at the end of the period $ (699)
Financial instruments not measured at fair value
Financial instruments measured on a basis other than fair value mostly consist of senior notes and convertible senior debentures
and are presented in the table below in terms of fair value:
Estimated fair value*
September 30, December 31,
2018 2017
(U.S. $ in millions)
Senior notes included under senior notes and loans $ 24,775 $ 23,459
Senior notes and convertible senior debentures included under
short-term debt 2,614 2,713
Total $ 27,389 $ 26,172
* The fair value was estimated based on quoted market prices, where available.
NOTE 13 – Derivative instruments and hedging activities:
The following table summarizes the notional amounts for hedged items, when transactions are designated as hedge accounting:
September 30,
2018
December 31,
2017
(U.S. $ in millions)
Cross-currency swap—cash flow hedge $ 588 $ 588
Cross-currency swap—net investment hedge 1,000 1,000
Interest rate swap—fair value hedge 500 500
25

The following table summarizes the classification and fair values of derivative instruments:
Fair value
Designated as hedging
instruments
Not designated as hedging
instruments
September 30,
2018
December 31,
2017
September 30,
2018
December 31,
2017
Reported under (U.S. $ in millions)
Asset derivatives:
Other current assets:
Option and forward contracts $ — $ — $ 23 $ 17
Other non-current assets:
Cross-currency swaps—cash flow hedge 42 25 — —
Liability derivatives:
Other current liabilities:
Option and forward contracts — — (14) (15)
Other taxes and long-term liabilities:
Cross-currency swaps—net investment hedge (58) (96) — —
Senior notes and loans:
Interest rate swaps—fair value hedge (24) (2) — —
Derivatives on foreign exchange contracts mainly hedge Teva’s balance sheet items from currency exposure but are not designated
as hedging instruments for accounting purposes. With respect to such derivatives, gains of $11 million and losses of $72 million were
recognized under financial expenses, net for the nine months ended September 30, 2018 and 2017, respectively, and gains of $6 million
and losses of $14 million were recognized under financial expenses, net for the three months ended September 30, 2018 and 2017,
respectively. Such losses and gains offset the revaluation of the balance sheet items which is also recorded under financial expenses,
net.
During the second quarter of 2018, the Company entered into option contracts and designed these transactions to limit the
exposure of foreign exchange fluctuations on the euro denominated revenues with respect to the quarter for which such instruments are
purchased. These derivative instruments do not meet the criteria for hedge accounting, however, they are accounted for as economic
hedge. These derivative instruments are recognized on the balance sheet at their fair value, with changes in the fair value recognized
under the same line item in the statements of income as the underlying exposure being hedged. The cash flows associated with these
derivatives are reflected as cash flows from operating activities in the consolidated statements of cash flows. During the third quarter of
2018, the impact of such derivative instruments was immaterial.
With respect to the interest rate and cross-currency swap agreements, gains of $1 million and $4 million were recognized under
financial expenses, net for the nine months ended September 30, 2018 and 2017, respectively, and gains of $0.5 million and $1 million
were recognized under financial expenses, net for the three months ended September 30, 2018 and 2017, respectively. Such gains
mainly reflect the differences between the fixed interest rate and the floating interest rate.
Commencing in the third quarter of 2015, Teva entered into forward starting interest rate swap and treasury lock agreements
designated as cash flow hedges of the U.S. dollar debt issuance in July 2016, with respect to $3.75 billion and $1.5 billion notional
amounts, respectively. These agreements hedged the variability in anticipated future interest payments due to possible changes in the
benchmark interest rate between the date the agreements were entered into and the actual date of the U.S. dollar debt issuance in July
2016 (in connection with the closing of the Actavis Generics acquisition).
Certain of the forward starting interest rate swaps and treasury lock agreements matured during the first half of 2016. In July 2016,
Teva terminated the remaining forward starting interest rate swaps and treasury lock agreements. The termination of these transactions
resulted in a loss position of $493 million, of which $242 million were settled on October 7, 2016 and the remaining amount was settled
in January 2017. The change in fair value of these instruments recorded as part of other comprehensive income is amortized under
financial expenses, net over the life of the debt. Such losses mainly reflect the changes in the benchmark interest rate between the date
the agreements were entered into and the actual date of the U.S. debt issuance in July 2016.
With respect to the forward starting interest rate swaps and treasury lock agreements, losses of $21 million and $20 million were
recognized under financial expenses, net for the nine months ended September 30, 2018 and 2017, respectively, and losses of $7 million
were recognized under financial expenses, net for each of the three months ended September 30, 2018 and 2017.
26
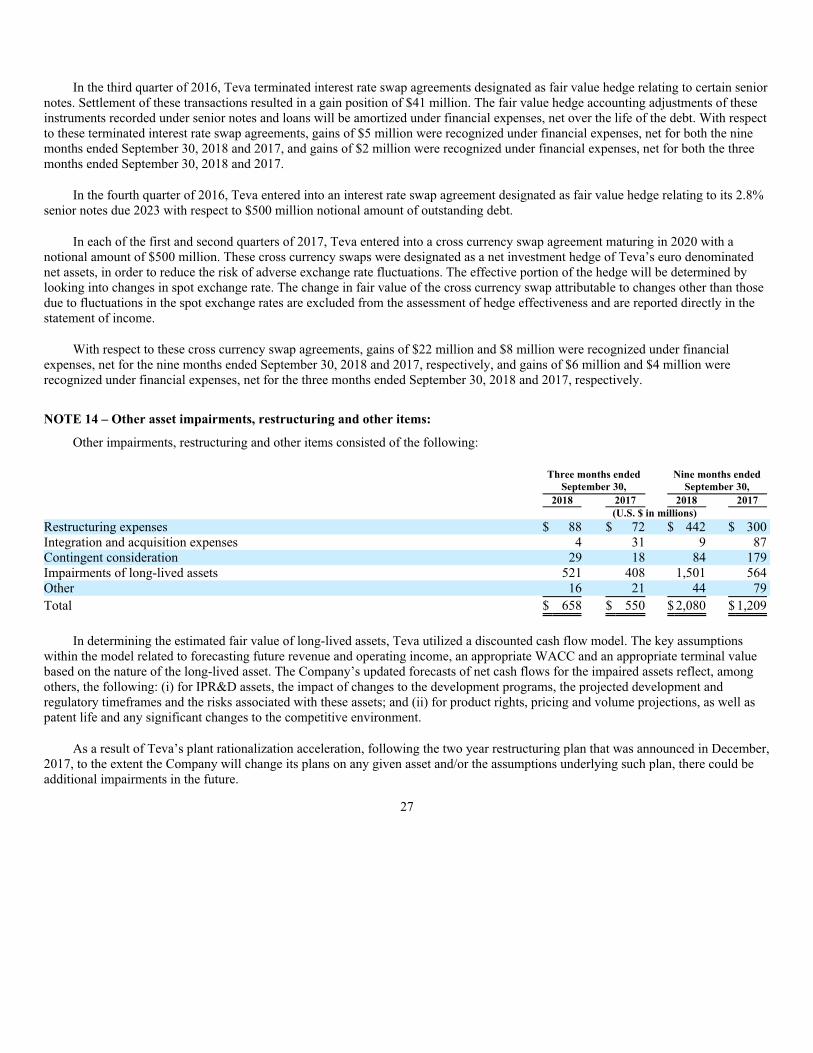
In the third quarter of 2016, Teva terminated interest rate swap agreements designated as fair value hedge relating to certain senior
notes. Settlement of these transactions resulted in a gain position of $41 million. The fair value hedge accounting adjustments of these
instruments recorded under senior notes and loans will be amortized under financial expenses, net over the life of the debt. With respect
to these terminated interest rate swap agreements, gains of $5 million were recognized under financial expenses, net for both the nine
months ended September 30, 2018 and 2017, and gains of $2 million were recognized under financial expenses, net for both the three
months ended September 30, 2018 and 2017.
In the fourth quarter of 2016, Teva entered into an interest rate swap agreement designated as fair value hedge relating to its 2.8%
senior notes due 2023 with respect to $500 million notional amount of outstanding debt.
In each of the first and second quarters of 2017, Teva entered into a cross currency swap agreement maturing in 2020 with a
notional amount of $500 million. These cross currency swaps were designated as a net investment hedge of Teva’s euro denominated
net assets, in order to reduce the risk of adverse exchange rate fluctuations. The effective portion of the hedge will be determined by
looking into changes in spot exchange rate. The change in fair value of the cross currency swap attributable to changes other than those
due to fluctuations in the spot exchange rates are excluded from the assessment of hedge effectiveness and are reported directly in the
statement of income.
With respect to these cross currency swap agreements, gains of $22 million and $8 million were recognized under financial
expenses, net for the nine months ended September 30, 2018 and 2017, respectively, and gains of $6 million and $4 million were
recognized under financial expenses, net for the three months ended September 30, 2018 and 2017, respectively.
NOTE 14 – Other asset impairments, restructuring and other items:
Other impairments, restructuring and other items consisted of the following:
Three months ended
September 30,
Nine months ended
September 30,
2018 2017 2018 2017
(U.S. $ in millions)
Restructuring expenses $ 88 $ 72 $ 442 $ 300
Integration and acquisition expenses 4 31 9 87
Contingent consideration 29 18 84 179
Impairments of long-lived assets 521 408 1,501 564
Other 16 21 44 79
Total $ 658 $ 550 $ 2,080 $ 1,209
In determining the estimated fair value of long-lived assets, Teva utilized a discounted cash flow model. The key assumptions
within the model related to forecasting future revenue and operating income, an appropriate WACC and an appropriate terminal value
based on the nature of the long-lived asset. The Company’s updated forecasts of net cash flows for the impaired assets reflect, among
others, the following: (i) for IPR&D assets, the impact of changes to the development programs, the projected development and
regulatory timeframes and the risks associated with these assets; and (ii) for product rights, pricing and volume projections, as well as
patent life and any significant changes to the competitive environment.
As a result of Teva’s plant rationalization acceleration, following the two year restructuring plan that was announced in December,
2017, to the extent the Company will change its plans on any given asset and/or the assumptions underlying such plan, there could be
additional impairments in the future.
27

Impairments
• Impairments of long-lived intangible assets in the third quarter of 2018 were $519 million, mainly consisting of:
a) IPR&D assets of $306 million, mainly related to revaluation of generic products acquired from Actavis Generics due to
development progress and changes in other key valuation indications (e.g., market size, legal landscape, launch date or
discount rate).
b) Identifiable product rights of $185 million, mainly due to updated market assumptions regarding price and volume of
products acquired from Actavis Generics currently marketed in the United States and supply constraints.
• Impairments of property, plant and equipment of $2 million.
• Impairments of long-lived intangible assets in the first nine months of 2018 were $1,246 million, mainly consisting of:
a) IPR&D assets of $867 million, mainly related to revaluation of generic products acquired from Actavis Generics due to
development progress and changes in other key valuation indications (e.g., market size, legal landscape, launch date or
discount rate).
b) Identifiable product rights of $328 million due to updated market assumptions regarding price and volume of products
acquired from Actavis Generics currently marketed in the United States and supply constraints.
• Impairments of property, plant and equipment in the first nine months of 2018 were $255 million, mainly consisting of:
a) $155 million related to the restructuring plan, including:
• $113 million related to site closures in Israel; and
• $42 million related to the consolidation of headquarters and distribution sites in the United States.
b) Other impairment costs, mainly $64 million related to a plant located in India in connection with the P&G separation
agreement. See note 3.
Restructuring
In the three months ended September 30, 2018, Teva recorded $88 million of restructuring expenses, compared to $72 million in
the three months ended September 30, 2017.
In the first nine months of 2018, Teva recorded $442 million of restructuring expenses, compared to $300 million in the first nine
months of 2017. The expenses in the first nine months of 2018 were primarily related to headcount reductions across all functions.
Since the announcement of its restructuring plan, Teva reduced its global headcount by approximately 9,100 full-time-equivalent
employees.
During the three months ended September 30, 2018, Teva recorded a $2 million impairment of property, plant and equipment
related to restructuring costs.
During the first nine months of 2018 Teva recorded a $155 million impairment of property, plant and equipment related to
restructuring costs as detailed in “— Impairments” above.
28
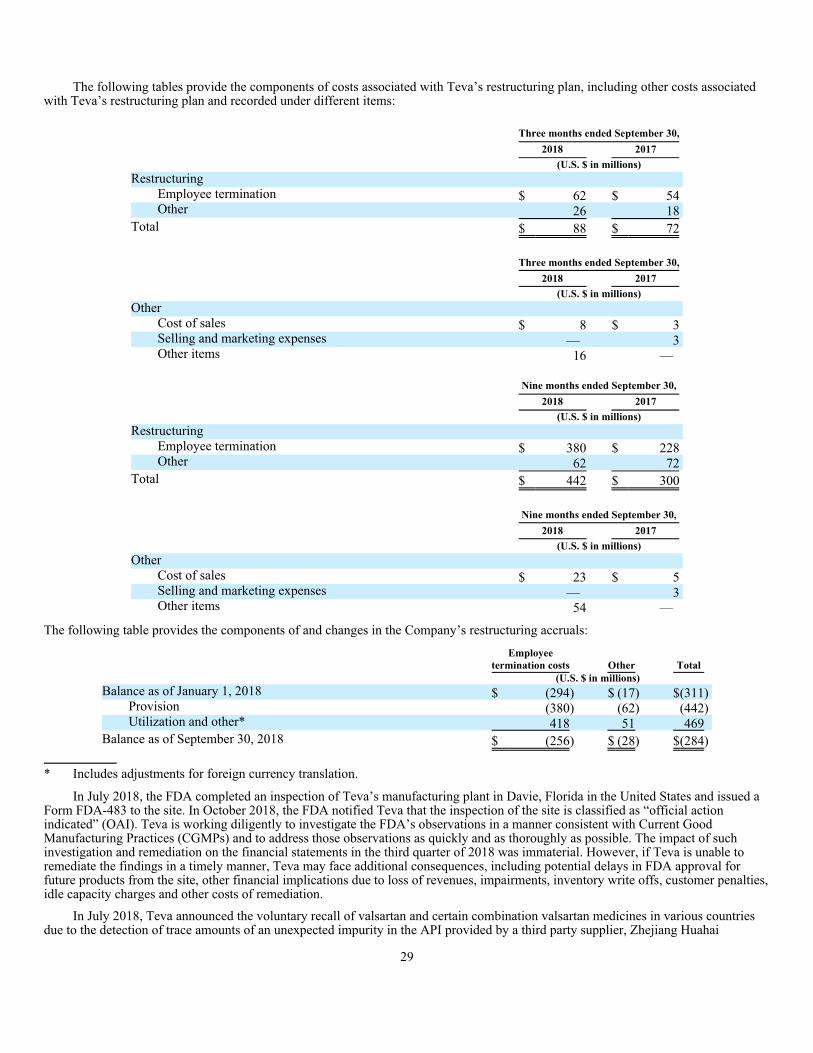
The following tables provide the components of costs associated with Teva’s restructuring plan, including other costs associated
with Teva’s restructuring plan and recorded under different items:
Three months ended September 30,
2018 2017
(U.S. $ in millions)
Restructuring
Employee termination $ 62 $ 54
Other 26 18
Total $ 88 $ 72
Three months ended September 30,
2018 2017
(U.S. $ in millions)
Other
Cost of sales $ 8 $ 3
Selling and marketing expenses — 3
Other items 16 —
Nine months ended September 30,
2018 2017
(U.S. $ in millions)
Restructuring
Employee termination $ 380 $ 228
Other 62 72
Total $ 442 $ 300
Nine months ended September 30,
2018 2017
(U.S. $ in millions)
Other
Cost of sales $ 23 $ 5
Selling and marketing expenses — 3
Other items 54 —
The following table provides the components of and changes in the Company’s restructuring accruals:
Employee
termination costs Other Total
(U.S. $ in millions)
Balance as of January 1, 2018 $ (294) $ (17) $(311)
Provision (380) (62) (442)
Utilization and other* 418 51 469
Balance as of September 30, 2018 $ (256) $ (28) $(284)
* Includes adjustments for foreign currency translation.
In July 2018, the FDA completed an inspection of Teva’s manufacturing plant in Davie, Florida in the United States and issued a
Form FDA-483 to the site. In October 2018, the FDA notified Teva that the inspection of the site is classified as “official action
indicated” (OAI). Teva is working diligently to investigate the FDA’s observations in a manner consistent with Current Good
Manufacturing Practices (CGMPs) and to address those observations as quickly and as thoroughly as possible. The impact of such
investigation and remediation on the financial statements in the third quarter of 2018 was immaterial. However, if Teva is unable to
remediate the findings in a timely manner, Teva may face additional consequences, including potential delays in FDA approval for
future products from the site, other financial implications due to loss of revenues, impairments, inventory write offs, customer penalties,
idle capacity charges and other costs of remediation.
In July 2018, Teva announced the voluntary recall of valsartan and certain combination valsartan medicines in various countries
due to the detection of trace amounts of an unexpected impurity in the API provided by a third party supplier, Zhejiang Huahai
29
Pharmaceutical (“Zhejiang”), used in the production of such medicines. On September 28, 2018, the FDA issued an import ban on all
APIs and other drug products made by Zhejiang in its Chuannan site into the United States. On the same date, the EU authorities issued
to Zhejiang a statement of non-compliance for the manufacture of valsartan (and its intermediates) for EU medicines produced in the
Chuannan site, thus prohibiting marketing authorization holders in the EU from using such valsartan materials in the production of
finished products. On October 15, 2018, the EU authorities announced that Zhejiang was under increased supervision with respect to
other APIs produced by Zhejiang. Many regulatory agencies around the world continue to review information relating to valsartan
medicines and the sartan products as a group. The impact of this recall on the Company’s financial statements in the first nine months of
2018 was $46 million, primarily related to recall and inventory reserves. Depending on the scope of regulatory actions, duration of the
API outage and severity of the impurity, Teva may face additional loss of revenues and profits, customer penalties, impairments and/or
other litigation costs.
NOTE 15 – Legal settlements and loss contingencies:
In the third quarter of 2018, the Company recorded expenses of $19 million for legal settlements and loss contingencies, compared
to income of $20 million in the third quarter of 2017.
In the first nine months of 2018, Teva recorded income of $1,239 million in connection with legal settlements, compared to an
expense of $324 million in the first nine months of 2017. The income in the first nine months of 2018 consisted primarily of the
working capital adjustment with Allergan, the Rimsa settlement and reversal of the reserve recorded in the second quarter of 2017 with
respect to the carvedilol patent litigation.
As of September 30, 2018 and December 31, 2017 Teva’s provision for legal settlements and loss contingencies recorded under
accrued expenses was $663 million and $1,232 million, respectively.
NOTE 16 – Commitments and Contingencies:
General
From time to time, Teva and/or its subsidiaries are subject to claims for damages and/or equitable relief arising in the ordinary
course of business. In addition, as described below, in large part as a result of the nature of its business, Teva is frequently subject to
litigation. Teva generally believes that it has meritorious defenses to the actions brought against it and vigorously pursues the defense or
settlement of each such action. Except as described below, Teva does not currently have a reasonable basis to estimate the loss, or range
of loss, that is reasonably possible with respect to matters disclosed in this note.
Teva records a provision in its financial statements to the extent that it concludes that a contingent liability is probable and the
amount thereof is estimable. Based upon the status of the cases described below, management’s assessments of the likelihood of
damages, and the advice of counsel, no provisions have been made regarding the matters disclosed in this note, except as noted below.
Litigation outcomes and contingencies are unpredictable, and excessive verdicts can occur. Accordingly, management’s assessments
involve complex judgments about future events and often rely heavily on estimates and assumptions. Teva continuously reviews the
matters described below and may, from time to time, remove previously disclosed matters that the Company has determined no longer
meet the materiality threshold for disclosure.
If one or more of such proceedings described below were to result in final judgments against Teva, such judgments could be
material to its results of operations and cash flows in a given period. In addition, Teva incurs significant legal fees and related expenses
in the course of defending its positions even if the facts and circumstances of a particular litigation do not give rise to a provision in the
financial statements.
In connection with third-party agreements, Teva may under certain circumstances be required to indemnify, and may be
indemnified by, in unspecified amounts, the parties to such agreements against third-party claims. Among other things, Teva’s
agreements with third parties may require Teva to indemnify them, or require them to indemnify Teva, for the costs and damages
incurred in connection with product liability claims, in specified or unspecified amounts.
Except as otherwise noted, all of the litigation matters disclosed below involve claims arising in the United States. Except as
otherwise noted, all third party sales figures given below are based on IQVIA (formerly IMS Health Inc.) data.
Intellectual Property Litigation
From time to time, Teva seeks to develop generic versions of patent-protected pharmaceuticals for sale prior to patent expiration
in various markets. In the United States, to obtain approval for most generics prior to the expiration of the originator’s patents, Teva
must challenge the patents under the procedures set forth in the Hatch-Waxman Act of 1984, as amended. To the extent that Teva seeks
to utilize such patent challenge procedures, Teva is and expects to be involved in patent litigation regarding the validity,
30
enforceability or infringement of the originator’s patents. Teva may also be involved in patent litigation involving the extent to which
its product or manufacturing process techniques may infringe other originator or third-party patents.
Additionally, depending upon a complex analysis of a variety of legal and commercial factors, Teva may, in certain
circumstances, elect to market a generic version even though litigation is still pending. To the extent Teva elects to proceed in this
manner, it could face substantial liability for patent infringement if the final court decision is adverse to Teva, which could be material
to its results of operations and cash flows in a given period.
The general rule for damages in patent infringement cases in the United States is that the patentee should be compensated by no
less than a reasonable royalty, and it may also be able in certain circumstances to be compensated for its lost profits. The amount of a
reasonable royalty award would generally be calculated based on the sales of Teva’s product. The amount of lost profits would
generally be based on the lost sales of the patentee’s product. In addition, the patentee may seek consequential damages as well as
enhanced damages of up to three times the profits lost by the patent holder for willful infringement, although courts have typically
awarded much lower multiples.
Teva is also involved in litigation regarding patents in other countries where it does business, particularly in Europe, where Teva
has in recent years increased the number of launches of its generic versions of branded pharmaceuticals prior to the expiration of the
innovator’s patents. The laws concerning generic pharmaceuticals and patents differ from country to country. Damages for patent
infringement in Europe may include lost profits or a reasonable royalty, but enhanced damages for willful infringement are generally
not available.
In July 2014, GlaxoSmithKline (“GSK”) sued Teva in Delaware federal court for infringement of a patent expiring in June 2015
directed to using carvedilol in a specified manner to decrease the risk of mortality in patients with congestive heart failure. Teva and
eight other generic producers began selling their carvedilol tablets (the generic version of GSK’s Coreg®) in September 2007. Teva
vigorously disputed GSK’s claims on the merits and also disputed the amount and nature of GSK’s alleged damages. A jury trial was
held and the jury returned a verdict in GSK’s favor finding Teva liable for induced infringement, including willful infringement, and
assessing damages of $235.5 million, not including pre- or post-judgment interest. Teva filed post-trial motions for judgment as a
matter of law asking the court to overturn the jury verdict on inducement, invalidity, and the award of lost profits damages, and GSK
filed post-trial motions asking the court to increase the damages amount in light of the willful infringement finding and to set the
interest rate(s) to be applied to the total damages amount. On March 28, 2018, the district court issued an opinion overturning the jury
verdict and instead found no induced infringement by Teva, thereby finding that Teva did not owe any damages. The district court
denied Teva’s motion seeking to overturn the jury verdict with respect to invalidity and denied GSK’s motion seeking to increase the
damages award. On May 25, 2018, GSK appealed the decision, and Teva filed an appeal of certain adverse rulings. If the appeal of the
district court’s decision is decided against Teva, the case would be remanded to the district court for it to consider Teva’s other legal
and equitable defenses that have not yet been considered by the district court. The provision that was included in the financial
statements for this matter has been reversed as the exposure is no longer considered probable.
In 2014, Teva Canada succeeded in its challenge of the bortezomib (the generic equivalent of Velcade®) product and mannitol
ester patents under the Patented Medicines (Notice Of Compliance) Regulations (“PM(NOC)”). Teva commenced sales in the first
quarter of 2015. At the time of Teva’s launch, annual sales of Velcade were approximately 94 million Canadian dollars. Teva
commenced an action under Section 8 of PM(NOC) to recover damages for being kept off of the market during the PM(NOC)
proceedings. Janssen and Millennium filed a counterclaim for infringement of the same two patents as well as a patent covering a
process to prepare bortezomib. The product patent expired in October 2015; the other patents expire in January 2022 and March 2025.
On December 20, 2017, Teva entered into an agreement with Janssen and Millennium which limits the damages payable by either party
depending on the outcome of the infringement/impeachment action. As a result, the most Janssen and Millennium could recover is
200 million Canadian dollars (approximately $159 million) plus post-judgment interest. The trial, which is limited to the issue of patent
validity and infringement, began on January 29, 2018 and concluded on March 8, 2018. On June 27, 2018, the court issued its opinion
in Teva’s favor and ruled that Janssen and Millennium are to pay Teva 5 million Canadian dollars in Section 8 damages. On
September 28, 2018, Janssen and Millennium filed an appeal of this decision with respect to two of the patents subject to the original
proceedings. If the decision is overturned on appeal, Teva could owe the capped damages set forth above. In addition to the potential
damages that could be awarded, if Janssen and Millennium are ultimately successful in this claim, Teva could be ordered to cease sales
of its bortezomib product.
On July 8, 2011, Helsinn sued Teva over its filing of an ANDA to market a generic version of palonosetron IV solution (the
generic equivalent of Aloxi®), and in November 2015, the District Court of New Jersey ruled against Teva. Teva appealed this decision,
and in May 2017, the Federal Circuit Court of Appeals reversed the district court’s ruling and found the asserted patents invalid. In
January 2018, full appellate review of that decision was denied. Helsinn filed an appeal with the US Supreme Court, which was granted
on June 25, 2018. Oral argument has been scheduled for December 4, 2018. If the Supreme Court reverses the appellate decision, the
case may be remanded to the district court. Separately, in October 2014, Helsinn filed an additional claim on later-acquired patents, but
that litigation was stayed pending the outcome of the original case. Following the appellate court’s decision in
31
Teva’s favor in the original case, Helsinn reopened the stayed case on the later-acquired patent and filed a motion for a preliminary
injunction based on that later-acquired patent. On January 30, 2018, the District Court of New Jersey denied Helsinn’s request for a
preliminary injunction. Teva launched its generic palonosetron IV solution after obtaining final regulatory approval on March 23, 2018.
If Teva ultimately loses either one of the cases discussed above, Teva may be ordered, by the court, to cease sales of its generic product
and/or pay damages to Helsinn. Aloxi® annual sales as of November 2017 were $459 million in the U.S.
Product Liability Litigation
Teva’s business inherently exposes it to potential product liability claims. Teva maintains a program of insurance, which may
include commercial insurance, self-insurance (including direct risk retention), or a combination of both approaches, in amounts and on
terms that it believes are reasonable and prudent in light of its business and related risks. However, Teva sells, and will continue to sell,
pharmaceuticals that are not covered by its product liability insurance; in addition, it may be subject to claims for which insurance
coverage is denied as well as claims that exceed its policy limits. Product liability coverage for pharmaceutical companies is becoming
more expensive and increasingly difficult to obtain. As a result, Teva may not be able to obtain the type and amount of commercial
insurance it desires, or any commercial insurance on reasonable terms, in all of its markets.
Competition Matters
As part of its generic pharmaceuticals business, Teva has challenged a number of patents covering branded pharmaceuticals, some
of which are among the most widely-prescribed and well-known drugs on the market. Many of Teva’s patent challenges have resulted
in litigation relating to Teva’s attempts to market generic versions of such pharmaceuticals under the federal Hatch-Waxman Act. Some
of this litigation has been resolved through settlement agreements in which Teva obtained a license to market a generic version of the
drug, often years before the patents expire.
Teva and its subsidiaries have increasingly been named as defendants in cases that allege antitrust violations arising from such
settlement agreements. The plaintiffs in these cases, which are usually direct and indirect purchasers of pharmaceutical products, and
often assert claims on behalf of classes of all direct and indirect purchasers, typically allege that (1) Teva received something of value
from the innovator in exchange for an agreement to delay generic entry, and (2) significant savings could have been realized if there had
been no settlement agreement and generic competition had commenced earlier. These class action cases seek various forms of
injunctive and monetary relief, including damages based on the difference between the brand price and what the generic price allegedly
would have been and disgorgement of profits, which are automatically trebled under the relevant statutes, plus attorneys’ fees and costs.
The alleged damages generally depend on the size of the branded market and the length of the alleged delay, and can be substantial –
potentially measured in multiples of the annual brand sales – particularly where the alleged delays are lengthy or branded drugs with
annual sales in the billions of dollars are involved.
Teva believes that its settlement agreements are lawful and serve to increase competition, and has defended them vigorously. In
Teva’s experience to date, these cases have typically settled for a fraction of the high end of the damages sought, although there can be
no assurance that such outcomes will continue.
In June 2013, the United States Supreme Court held, in Federal Trade Commission v. Actavis, Inc. (the “AndroGel case”), that a
rule of reason test should be applied in analyzing whether such settlements potentially violate the federal antitrust laws. The Supreme
Court held that a trial court must analyze each agreement in its entirety in order to determine whether it violates the antitrust laws.
This new test has resulted in increased scrutiny of Teva’s patent settlements, additional action by the FTC and state and local
authorities, and an increased risk of liability in Teva’s currently pending antitrust litigations.
In April 2006, certain subsidiaries of Teva were named in a class action lawsuit filed in the U.S. District Court for the Eastern
District of Pennsylvania. The case alleges that the settlement agreements entered into between Cephalon, Inc., now a Teva subsidiary
(“Cephalon”), and various generic pharmaceutical companies in late 2005 and early 2006 to resolve patent litigation involving certain
finished modafinil products (marketed as PROVIGIL®) were unlawful because they had the effect of excluding generic competition.
The case also alleges that Cephalon improperly asserted its PROVIGIL patent against the generic pharmaceutical companies. The first
lawsuit was brought by King Drug Company of Florence, Inc. on behalf of itself and as a proposed class action on behalf of any other
person or entity that purchased PROVIGIL directly from Cephalon. Similar allegations were made in other complaints, including those
filed on behalf of a proposed class of end payers of PROVIGIL, by certain individual end payers, by certain retail chain pharmacies and
by Apotex, Inc. (collectively, these cases are referred to as the “Philadelphia Modafinil Action”). Separately, Apotex challenged
Cephalon’s PROVIGIL patent, and in October 2011, the court found the patent to be invalid and unenforceable based on inequitable
conduct. This decision was affirmed on appeal in April 2013. Teva has either settled or reached agreements in principle to settle with all
of the plaintiffs in the Philadelphia Modafinil Action. However, one of the end payers, United Healthcare Services, took the position
that it is not bound by the settlement that was agreed to on its behalf and brought a separate action in Minnesota federal court, which
was transferred to the U.S. District Court for the Eastern District of Pennsylvania, where Teva had filed suit to enforce the settlement. A
bench trial was held in April 2018, and the court issued its opinion on September 19, 2018, ruling in Teva’s favor
32
and holding that United Healthcare is bound by the settlement. On October 16, 2018, United Healthcare moved the court to amend its
final judgment and to clarify that the final judgment does not address how settlement proceeds should be allocated among United
Healthcare and the other end payers. That motion was denied on October 30, 2018. Additionally, Cephalon and Teva have reached a
settlement with 48 state attorneys general, which was approved by the court on November 7, 2016. Certain other claimants, including
the State of California, have given notices of potential claims related to these settlement agreements. Teva has produced documents and
information in response to discovery requests issued by the California Attorney General’s office as part of its ongoing investigation of
generic competition to PROVIGIL.
In May 2015, Cephalon entered into a consent decree with the FTC under which the FTC dismissed its claims against Cephalon in
the FTC Modafinil Action in exchange for payment of $1.2 billion (less set-offs for prior settlements) by Cephalon and Teva into a
settlement fund. Under the consent decree, Teva also agreed to certain injunctive relief with respect to the types of settlement
agreements Teva may enter into to resolve patent litigation in the United States for a period of ten years. The settlement fund does not
cover any judgments or settlements outside the United States.
Following an investigation initiated by the European Commission in April 2011 regarding a modafinil patent settlement in Europe,
the Commission issued a Statement of Objections in July 2017 against both Cephalon and Teva alleging that the 2005 settlement
agreement between the parties had the object and effect of hindering the entry of generic modafinil. Teva submitted its defense in
writing and an oral hearing was held. No final decision regarding infringement has yet been taken by the Commission. The sales of
modafinil in the European Economic Area during the last full year of the alleged infringement amounted to EUR 46.5 million.
In January 2009, the FTC and the State of California filed a complaint for injunctive relief in California federal court alleging that
a September 2006 patent lawsuit settlement between Watson Pharmaceuticals, Inc. (“Watson”), now a Teva subsidiary, and Solvay
Pharmaceuticals, Inc. (“Solvay”) relating to AndroGel® 1% (testosterone gel) violated the antitrust laws. Additional lawsuits alleging
similar claims were later filed by private plaintiffs (including plaintiffs purporting to represent classes of similarly situated claimants as
well as direct purchaser plaintiffs filing separately) and the various actions were consolidated in a multidistrict litigation in Georgia
federal court. The defendants filed various summary judgment motions on September 29, 2017, which the district court granted in part,
and denied in part, on June 13, 2018. The direct-purchaser plaintiffs moved for class certification on February 9, 2018 and that motion
was denied on July 16, 2018. The direct-purchaser plaintiffs have not sought to immediately appeal the denial of such class
certification. As a result, the three direct purchasers that had sought class certification can proceed as individual plaintiffs, but any other
member of the proposed direct purchaser class will need to file a separate, individual lawsuit if it wishes to participate in the litigation.
The court has ordered a bench trial on the FTC’s claims to start on February 25, 2019, with a jury trial on the private plaintiffs’ claims
to be scheduled thereafter. Annual sales of AndroGel® 1% at the time of the settlement were approximately $350 million, and annual
sales of the AndroGel franchise (AndroGel® 1% and AndroGel® 1.62%) were approximately $140 million and $1.05 billion,
respectively, at the time Actavis launched its generic version of AndroGel® 1% in November 2015.
In December 2011, three groups of plaintiffs sued Wyeth and Teva for alleged violations of the antitrust laws in connection with
their settlement of patent litigation involving extended release venlafaxine (generic Effexor® XR) entered into in November 2005. The
cases were filed by a purported class of direct purchasers, by a purported class of indirect purchasers and by certain chain pharmacies in
the United States District Court for the District of New Jersey. The plaintiffs claim that the settlement agreement between Wyeth and
Teva unlawfully delayed generic entry. In October 2014, the court granted Teva’s motion to dismiss in the direct purchaser cases, after
which the parties agreed that the court’s reasoning applied equally to the indirect purchaser cases. Plaintiffs appealed, and on
August 21, 2017, the Third Circuit reversed the district court’s decision and remanded for further proceedings. On November 20, 2017,
Teva and Wyeth filed a petition for a writ of certiorari in the United States Supreme Court. That petition was denied on February 20,
2018, and litigation has resumed before the district court. Annual sales of Effexor® XR were approximately $2.6 billion at the time of
settlement and at the time generic versions were launched in July 2010.
In February 2012, two purported classes of direct-purchaser plaintiffs sued GSK and Teva in New Jersey federal court for alleged
violations of the antitrust laws in connection with their settlement of patent litigation involving lamotrigine (generic Lamictal®) entered
into in February 2005. The plaintiffs claim that the settlement agreement unlawfully delayed generic entry and seek unspecified
damages. In December 2012, the court dismissed the case, but in June 2015, the Third Circuit reversed and remanded for further
proceedings. On February 19, 2016, Teva and GSK filed a petition for a writ of certiorari in the United States Supreme Court, which
was denied on November 7, 2016. In the meantime, litigation has resumed before the district court, and direct-purchaser plaintiffs
moved for class certification in June 2018. That motion has been fully briefed and remains pending. Annual sales of Lamictal® were
approximately $950 million at the time of the settlement, and approximately $2.3 billion at the time generic competition commenced in
July 2008.
In April 2013, purported classes of direct purchasers of, and end payers for, Niaspan® (extended release niacin) sued Teva and
Abbott for violating the antitrust laws by entering into a settlement agreement in April 2005 to resolve patent litigation over the product.
A multidistrict litigation has been established in the U.S. District Court for the Eastern District of Pennsylvania. Throughout
33
2015 and in January 2016, several individual direct purchaser opt-out plaintiffs filed complaints with allegations nearly identical to
those of the direct purchaser class. In October 2016, the District Attorney for Orange County, California, filed a similar complaint,
which has since been amended, in California state court, alleging violations of state law. Defendants moved to strike the District
Attorney’s claims for restitution and civil penalties to the extent not limited to alleged activity occurring in Orange County. The
Superior Court denied that motion, but defendants appealed, and on May 31, 2018, the Court of Appeal, Fourth Appellate District,
reversed and instructed the Superior Court to grant defendants’ motion. The District Attorney petitioned the California Supreme Court
to review the Court of Appeal’s decision. The petition was granted on August 22, 2018, and the District Attorney filed its opening brief
before the California Supreme Court on September 21, 2018. Annual sales of Niaspan® were approximately $416 million at the time of
the settlement and approximately $1.1 billion at the time generic competition commenced in September 2013.
In November 2013, a putative class action was filed in Pennsylvania federal court against Actavis, Inc. and certain of its affiliates,
alleging that Watson’s 2012 patent lawsuit settlement with Endo Pharmaceuticals Inc. relating to Lidoderm® (lidocaine transdermal
patches) violated the antitrust laws. Additional lawsuits containing similar allegations followed on behalf of other classes of putative
direct purchaser and end-payer plaintiffs, as well as retailers acting in their individual capacities, and those cases were consolidated as a
multidistrict litigation in federal court in California. On February 21, 2017, the court granted both the indirect purchaser plaintiffs’ and
the direct purchaser plaintiffs’ motions for class certification. Teva reached an agreement to settle the multidistrict litigation with the
various plaintiff groups in the first quarter of 2018. A provision for these settlements has been included in the financial statements, and
in September 2018, the district court gave final approval for the settlements with the direct purchaser and end-payer plaintiffs. The FTC
has also filed suit to challenge the Lidoderm® settlement, initially bringing antitrust claims against Watson, Endo, and Allergan in
Pennsylvania federal court in March 2016. The FTC later voluntarily dismissed those claims and refiled them (along with a stipulated
order for permanent injunction to settle its claims against Endo) in the same California federal court in which the private multidistrict
litigation referenced above was pending. On February 3, 2017, the State of California filed its own complaint against Allergan and
Watson, and that complaint was also assigned to the California federal court presiding over the multidistrict litigation. After the FTC
dismissed its claims in Pennsylvania, but before it re-filed them in California, Watson and Allergan filed suit against the FTC in the
same Pennsylvania federal court where the agency had initially brought its lawsuit, seeking a declaratory judgment that the FTC’s
claims are not authorized by statute, or, in the alternative, that the FTC does not have statutory authority to pursue disgorgement. The
federal court in California stayed both the FTC’s claims and the State of California’s claims against Allergan and Watson, pending the
outcome of the declaratory judgment action in Pennsylvania. On October 29, 2018, the Pennsylvania court dismissed that declaratory
judgment action for lack of jurisdiction. Annual sales of Lidoderm® at the time of the settlement were approximately $1.2 billion, and
were approximately $1.4 billion at the time Actavis launched its generic version in September 2013.
Since November 2013, numerous lawsuits have been filed in various federal courts by purported classes of end payers for, and
direct purchasers of, Aggrenox® (dipyridamole/aspirin tablets) against Boehringer Ingelheim (“BI”), the innovator, and several Teva
subsidiaries. The lawsuits allege, among other things, that the settlement agreement between BI and Barr entered into in August 2008
violated the antitrust laws. A multidistrict litigation has been established in the U.S. District Court for the District of Connecticut. Teva
and BI’s motion to dismiss was denied in March 2015. On April 11, 2017, the Orange County District Attorney filed a complaint for
violations of California’s Unfair Competition Law based on the Aggrenox® patent litigation settlement. Teva has settled with the
putative classes of direct purchasers and end payers, as well as with the opt-out direct purchaser plaintiffs, and with two of the opt-out
end payer plaintiffs, Humana and Blue Cross/Blue Shield of Louisiana. A provision has been included in the financial statements for
this matter. The district court overruled certain objections to the end payer settlement, including objections made by the Orange County
District Attorney, and approved such settlement. The District Attorney subsequently appealed the court’s approval to the Second
Circuit. Opt-outs from the end payer class have also appealed certain aspects of the court’s approval order to the Second Circuit. Those
appeals remain pending. Annual sales of Aggrenox® were approximately $340 million at the time of the settlement and approximately
$455 million at the time generic competition began in July 2015.
Since January 2014, numerous lawsuits have been filed in the U.S. District Court for the Southern District of New York by
purported classes of end payers for and direct purchasers of Actos® and Acto plus Met® (pioglitazone and pioglitazone plus metformin)
against Takeda, the innovator, and several generic manufacturers, including Teva, Actavis and Watson. The lawsuits allege, among
other things, that the settlement agreements between Takeda and the generic manufacturers (including Takeda’s December 2010
settlement agreement with Teva) violated the antitrust laws. The Court dismissed the end payer lawsuits against all defendants in
September 2015. In October 2015, the end payers appealed that ruling, and on March 22, 2016, a stipulation was filed dismissing Teva
and the other generic defendants from the appeal. On February 8, 2017, the Court of Appeals for the Second Circuit affirmed the
dismissal in part and vacated and remanded the dismissal in part with respect to the claims against Takeda. The direct purchasers’ case
had been stayed pending resolution of the appeal in the end payer matter, and the direct purchasers amended their complaint for a
second time after the Court of Appeals for the Second Circuit’s decision. Defendants had moved to dismiss the direct purchasers’
original complaint. Supplemental briefing on that motion based on the new allegations in the amended complaint was completed on
June 29, 2017 and oral argument was held on October 23, 2018. At the time of the settlement, annual sales of Actos® were
approximately $3.7 billion and annual sales of ACTO plus Met® were approximately $500 million. At the time generic
34

competition commenced in August 2012, annual sales of Actos® were approximately $2.8 billion and annual sales of ACTO plus Met®
were approximately $430 million.
In June 2014, two groups of end payers sued AstraZeneca and Teva, as well as Ranbaxy and Dr. Reddy’s, in the Philadelphia
Court of Common Pleas for violating the antitrust laws by entering into settlement agreements to resolve the esomeprazole (generic
Nexium®) patent litigation (the “Philadelphia Esomeprazole Actions”). These end payers had opted out of a class action that was filed
in the Massachusetts federal court in September 2012 and resulted in a jury verdict in December 2014 in favor of AstraZeneca and
Ranbaxy (the “Massachusetts Action”). Prior to the jury verdict, Teva settled with all plaintiffs in the Massachusetts Action for
$24 million. The allegations in the Philadelphia Esomeprazole Actions are nearly identical to those in the Massachusetts Action. The
Philadelphia Esomeprazole Actions were stayed pending resolution of the Massachusetts Action, which was on appeal to the Court of
Appeals for the First Circuit with respect to the claims against the non-settling defendants, AstraZeneca and Ranbaxy. On
November 21, 2016, the First Circuit affirmed the district court’s judgment in favor of AstraZeneca and Ranbaxy, and the plaintiffs’
petitions for rehearing and rehearing en banc were denied on January 10, 2017.
In September 2014, the FTC sued AbbVie Inc. and certain of its affiliates (“AbbVie”) as well as Teva in the U.S. District Court
for the Eastern District of Pennsylvania alleging that they violated the antitrust laws when they entered into a settlement agreement to
resolve the AndroGel® patent litigation and a supply agreement under which AbbVie agreed to supply Teva with an authorized generic
version of TriCor®. The FTC alleges that Teva agreed to delay the entry of its generic testosterone gel product in exchange for entering
into the TriCor supply agreement. In May 2015, the court dismissed the FTC’s claim concerning the settlement and supply agreements,
and thus dismissed Teva from the case entirely. The FTC proceeded with a separate claim against AbbVie alone and in June 2018,
following a bench trial, the court held that AbbVie had violated the antitrust laws by filing sham patent infringement lawsuits against
both Teva and Perrigo in the underlying AndroGel patent litigation. The court ordered AbbVie to pay $448 million in disgorgement but
declined to award injunctive relief. The FTC has since filed a notice of appeal as to, among other things, the district court’s May 2015
dismissal of the FTC’s claim against Teva, referenced above.
Since May 2015, two lawsuits have been filed in the U.S. District Court for the Southern District of New York by a purported
class of direct purchasers of, and a purported class of end payers for, Namenda IR® (memantine hydrochloride) against Forest
Laboratories, LLC (“Forest”), the innovator, and several generic manufacturers, including Teva. Teva is only a defendant in the end
payer case, in which defendants moved to dismiss the claims made by the end payers. The lawsuits allege, among other things, that the
settlement agreements between Forest and the generic manufacturers (including Forest’s November 2009 settlement agreement with
Teva) violated the antitrust laws. On September 13, 2016, the court denied defendants’ motions to dismiss, but stayed the cases with
respect to the claims brought under state law, which are the only claims asserted against Teva. The court lifted the stay on
September 10, 2018 and has referred the parties to mediation. Annual sales of Namenda IR® at the time of the settlement were
approximately $1.1 billion, and are currently approximately $1.4 billion.
On March 8, 2016 and April 11, 2016, certain Actavis subsidiaries in the United Kingdom, including Auden Mckenzie Holdings
Limited, received notices from the U.K. Competition and Markets Authority (“CMA”) that it had launched formal investigations under
Section 25 of the Competition Act of 1998 (“Competition Act”) into suspected breaches of competition law in connection with the
supply of 10mg and 20mg hydrocortisone tablets. On December 16, 2016, the CMA issued a statement of objections (a provisional
finding of infringement of the Competition Act) in respect of certain allegations against Actavis UK and Allergan, which was later
reissued to include certain Auden Mckenzie entities. A response was submitted and an oral hearing was held. On December 18, 2017,
the CMA issued a Statement of Draft Penalty Calculation. A response was submitted and an oral hearing was held. No final decision
regarding infringement of competition law has yet been issued by the CMA. On March 3, 2017, the CMA issued a second statement of
objection in respect of certain additional allegations (relating to the same products and covering part of the same time period as for the
first statement of objections) against Actavis UK, Allergan, and a number of other companies, which was later reissued to include
certain Auden Mckenzie entities. A response was submitted and an oral hearing was held. On January 9, 2017, Teva completed the sale
of Actavis UK to Accord Healthcare Limited, pursuant to which Teva will indemnify Accord Healthcare for potential fines imposed by
the CMA and/or damages awarded by a court against Actavis UK as a result of the investigations in respect of conduct prior to the
closing date of the sale. In the event of any such fines or damages, Teva expects to assert claims, including claims for breach of
warranty, against the sellers of Auden Mckenzie. The terms of the purchase agreement may preclude a full recovery by Teva. A liability
for this matter has been recorded in purchase accounting related to the acquisition of Actavis Generics. Further to the Master Purchase
Agreement with Allergan whereby Teva agreed to indemnify Allergan for liabilities related to acquired assets, Teva agreed with
Allergan to settle and release Teva’s indemnity claim and Allergan’s potential losses arising from the CMA in connection with this
matter, pursuant to the agreement the parties entered into on January 31, 2018. See note 3.
In November 2016, three putative indirect purchaser class actions were filed in federal courts in Wisconsin, Massachusetts and
Florida against Shire U.S., Inc. and Shire LLC (collectively, “Shire”) and Actavis, alleging that Shire’s 2013 patent litigation settlement
with Actavis related to the ADHD drug Intuniv® (guanfacine) violated various state consumer protection and antitrust laws. On
December 30, 2016 and January 11, 2017, two additional similar actions were filed, also in Massachusetts federal court, against Shire
and Actavis or Teva (as successor to Actavis) by putative classes of direct purchaser plaintiffs. All five cases are now in Massachusetts
federal court and on March 10, 2017, both the indirect purchaser plaintiffs and the direct purchaser plaintiffs filed
35
consolidated amended complaints. Annual sales of Intuniv® were approximately $335 million at the time of the settlement, and
approximately $327 million at the time generic competition began in 2014.
Government Investigations and Litigation Relating to Pricing and Marketing
Teva is involved in government investigations and litigation arising from the marketing and promotion of its pharmaceutical
products in the United States. Many of these investigations originate through what are known as qui tam complaints, in which the
government reviews a complaint filed under seal by a whistleblower (a “relator”) that alleges violations of the federal False Claims Act.
The government considers whether to investigate the allegations and will, in many cases, issue subpoenas requesting documents and
other information, including conducting witness interviews. The government must decide whether to intervene and pursue the claims as
the plaintiff. Once a decision is made by the government, the complaint is unsealed. If the government decides not to intervene, then the
relator may decide to pursue the lawsuit on his own without the active participation of the government.
A number of state attorneys general have filed various actions against Teva and/or certain of its subsidiaries, including certain
Actavis subsidiaries, relating to reimbursements or drug price reporting under Medicaid or other programs. Such price reporting is
alleged to have caused states and others to pay inflated reimbursements for covered drugs. Teva and its subsidiaries have reached
settlements in most of these cases. On October 4, 2018, Teva settled longstanding litigation filed by the State of Illinois against
subsidiaries of Teva and Watson for a total settlement amount of $135 million, to be paid over time through January 2020. Teva
accepted the settlement while denying any liability with respect to the claims made by the state. Pending the final settlement payment,
the Illinois litigation is stayed. In August 2013, judgment was entered in a separate case brought by the State of Mississippi against
Watson, pursuant to which Watson was ordered to pay compensatory damages amounting to $12.4 million. In March of 2014, the
Mississippi court amended the judgment to also include punitive damages in the amount of $17.9 million. The judgment was affirmed
in all respects by the Mississippi Supreme Court in January of 2018 and has since been satisfied in full. The Actavis subsidiaries remain
parties to active litigation in Utah where previously dismissed claims against Watson are now on appeal. A provision for these cases has
been included in the financial statements.
Several qui tam complaints have been unsealed in recent years as a result of government decisions not to participate in the cases.
The following is a summary of certain government investigations, qui tam actions and related matters.
In January 2014, Teva received a civil investigative demand from the U.S. Attorney for the Southern District of New York seeking
documents and information from January 1, 2006 related to sales, marketing and promotion of COPAXONE and AZILECT, focusing
on educational and speaker programs. The demand states that the government is investigating possible civil violations of the federal
False Claims Act. In March 2015, the docket in this matter and a False Claims Act civil qui tam complaint concerning this matter were
unsealed by the court, which revealed that the U.S. Attorney had notified the court in November 2014 that it had declined to intervene
in and proceed with the lawsuit. The qui tam relators, however, are moving forward with the lawsuit. In June 2015, Teva filed motions
to dismiss the complaint. In February 2016, the court stayed its decision on the relators’ claims based on state and local laws, denied
Teva’s motions to dismiss the False Claims Act claims, and instructed the relators to amend their complaint with additional information.
In March 2016, the relators filed an amended complaint, which Teva answered in April 2016. The parties completed discovery. In
August 2018, Teva filed a motion for summary judgment on all claims, which is now pending before the court. No trial date has been
set.
In January 2014, a qui tam complaint was filed in Rhode Island federal court alleging that Teva and several other defendants,
including manufacturers of MS drugs and pharmacy benefit managers, violated the False Claims Act. The qui tam action was unsealed
on April 4, 2018 after the government declined to intervene. The relator alleges that Teva and the other defendants induced fraudulent
overpayments for illegitimate “Bona Fide Service Fees” in excess of fair market value to inflate prices for the Medicare Part D program.
Teva expects to move to dismiss the complaint in November 2018.
In May 2017, a qui tam action was filed against a number of Teva subsidiaries. The qui tam action was unsealed on June 13, 2018
after the government declined to intervene. The relator in the case alleges that Teva violated the False Claims Act by devising and
engaging in promotional schemes that violate the Anti-Kickback Statute (“AKS”), resulting in false certifications of compliance with
the AKS. Specifically, the relator alleges that Teva paid in-kind remuneration to physicians through reimbursement support and nursing
services in order to increase the number of Copaxone prescriptions. An amended complaint was filed on October 15, 2018. Teva will
move to dismiss in November 2018.
Beginning in May 2014, various complaints were filed with respect to opioid sales and distribution against various Teva affiliates,
along with several other pharmaceutical companies, by a number of cities, counties, states and agencies across the country. There are
actions currently pending against Teva and its affiliates that have been brought by various states, subdivisions and state agencies in both
state and federal courts. Most of the federal cases have been consolidated into a multidistrict litigation in the Northern District of Ohio
(“MDL Proceeding”). In addition to the complaints filed by states, state agencies and political subdivisions, over 1,500 total lawsuits
have been filed in various states, both in state and federal courts. Most of the federal class action cases, as well as
36
state cases that have been removed, have been consolidated into the MDL Proceeding. Complaints asserting claims under similar
provisions of different state law, generally contend that the defendants allegedly engaged in improper marketing and distribution of
opioids, including ACTIQ® and FENTORA. The complaints also assert claims related to Teva’s generic opioid products. In addition,
several dozen complaints filed by cities, counties and the State of Delaware have named Anda, Inc. (and other distributors and
manufacturers) alleging that Anda failed to develop and implement systems sufficient to identify suspicious orders of opioid products
and prevent the abuse and diversion of such products to individuals who used them for other than legitimate medical purposes. Plaintiffs
seek a variety of remedies, including restitution, civil penalties, disgorgement of profits, treble damages, attorneys’ fees and injunctive
relief. None of the complaints specify the exact amount of damages at issue. Teva and its affiliates that are defendants in the various
lawsuits deny all allegations asserted in these complaints and have filed or will file motions to dismiss where possible. On August 13,
2018, the judge in the MDL Proceeding issued a revised case management order setting the first trial for September 2019. The court has
also commenced motion to dismiss briefing on certain issues in bellwether cases and the first set of briefing was completed in July
2018. On October 5, 2018, the court issued a Report & Recommendation on the first motion to dismiss filed in the bellwether cases, in
which it denied defendants’ motions to dismiss except for the common law public nuisance claim, which was dismissed. Motions to
dismiss in eight additional similar cases remain pending. In addition, discovery has commenced in the MDL Proceeding for three cases
based in Ohio and fact discovery is ongoing. Other cases remain pending in various state courts, including Oklahoma, where a trial is
scheduled to begin in May 2019. In some jurisdictions, such as Connecticut, Illinois, New York, Pennsylvania and Texas, certain state
court cases have been transferred to a single court within their respective state court systems for coordinated pretrial proceedings.
Several state courts have allowed discovery to begin. On April 27, 2018, Teva received subpoena requests from the DOJ seeking
documents relating to the manufacture, marketing and sale of opioids. Teva is complying with this subpoena. In addition, a number of
state attorneys general, including a coordinated multistate effort, have initiated investigations into sales and marketing practices of Teva
and its affiliates with respect to opioids. Other states are conducting their own investigations outside of the multistate group. Teva is
cooperating with these ongoing investigations and cannot predict the outcome at this time.
On June 21, 2016, Teva USA received a subpoena from the Antitrust Division of the DOJ seeking documents and other
information relating to the marketing and pricing of certain Teva USA generic products and communications with competitors about
such products. Actavis received a similar subpoena in June 2015. Teva and Actavis are cooperating fully with the DOJ subpoena
requests. On July 12, 2016, Teva USA received a subpoena from the Connecticut Attorney General seeking documents and other
information relating to potential state antitrust law violations. In 2015, Actavis received a similar subpoena from the Connecticut
Attorney General.
On December 15, 2016, a civil action was brought by the attorneys general of twenty states against Teva USA and several other
companies asserting claims under federal antitrust law (specifically, section 1 of the Sherman Act) alleging price fixing of generic
products in the United States. An amended complaint was filed on March 1, 2017 adding twenty additional states to the named plaintiffs
and adding supplemental state law claims. The states seek a finding that the defendants’ actions violated federal antitrust law, and state
antitrust and consumer protection laws, as well as injunctive relief, disgorgement, damages on behalf of various state and governmental
entities and consumers, civil penalties and costs. On August 3, 2017, the Judicial Panel on Multidistrict Litigation (“JPML”) transferred
this action to the generic drug multidistrict litigation pending in federal court in Pennsylvania, which is discussed in greater detail
below. On July 17, 2017, a new complaint was filed in the District Court of Connecticut on behalf of four additional states – Arkansas,
Missouri, New Mexico and West Virginia, as well as the District of Columbia. These plaintiffs were not previously party to the State
Attorney General action that commenced in December 2016. This complaint, which the JPML has also transferred to the generic drug
multidistrict litigation discussed below, makes the same factual allegations and claims that are at issue in the earlier State Attorneys
General complaint. On October 31, 2017 the attorneys general of 45 states plus Puerto Rico and the District of Columbia filed a motion
for leave to file an amended complaint in this action. The proposed amended complaint names Actavis and Teva as defendants, and
adds new allegations and claims to those appearing in the prior complaints. Defendants have opposed the motion. On June 5, 2018, the
District Court for the Eastern District of Pennsylvania granted the attorneys general’s motion to amend.
Beginning on March 2, 2016, numerous complaints have been filed in the United States on behalf of putative classes of direct and
indirect purchasers of several generic drug products, as well as several individual direct purchaser opt-out plaintiffs. These complaints,
which allege that the defendants engaged in conspiracies to fix, increase, maintain and/or stabilize the prices of certain generic products,
and/or allocate market share of generic products, have been brought against various manufacturer defendants, including Teva and
Actavis. The plaintiffs generally seek injunctive relief and damages under federal antitrust law, and damages under various state laws.
On April 6, 2017, the JPML entered an order transferring such cases brought by classes of direct or indirect purchasers for coordination
or consolidation with the multidistrict litigation currently pending in the Eastern District of Pennsylvania. The panel subsequently
transferred further cases to that court and the plaintiffs filed consolidated amended complaints on August 15, 2017. Defendants moved
to dismiss certain of those consolidated amended complaints on October 6, 2017. On October 16, 2018, the pending motions to dismiss
were denied. Pursuant to orders dated February and April 2018, the court overseeing the multidistrict litigation lifted the stay of
discovery on a limited basis to allow for document discovery and non-merits based depositions. Teva and Actavis deny having engaged
in any conduct that would give rise to liability with respect to the above-mentioned subpoenas and civil suits.
37
In May 2018, Teva received a civil investigative demand from the DOJ Civil Division, pursuant to the federal False Claims Act,
seeking documents and information produced since January 1, 2009 relevant to the Civil Division’s investigation concerning allegations
that generic pharmaceutical manufacturers, including Teva, engaged in market allocation and price-fixing agreements, paid illegal
remuneration, and caused false claims to be submitted in violation of the False Claims Act. Teva is cooperating fully with this
subpoena.
On March 21, 2017, Teva received a subpoena from the U.S. Attorney’s office in Boston, Massachusetts requesting documents
related to Teva’s donations to patient assistance programs. Teva is cooperating fully in responding to the subpoena.
In December 2016, Teva resolved certain claims under the U.S. Foreign Corrupt Practices Act (“FCPA”) with the SEC and the
DOJ, as more fully described in Teva’s 2017 Annual Report. The settlement included a fine, disgorgement and prejudgment interest; a
three-year deferred prosecution agreement (“DPA”) for Teva; a guilty plea by Teva’s Russian subsidiary to criminal charges of
violations of the anti-bribery provisions of the FCPA; consent to entry of a final judgment against Teva resolving civil claims of
violations of the anti-bribery, internal controls and books and records provisions of the FCPA; and the retention of an independent
compliance monitor for a period of three years. If, during the term of the DPA (approximately three years, unless extended), the DOJ
determines that Teva has committed a felony under federal law, provided deliberately false or misleading information or otherwise
breached the DPA, Teva could be subject to prosecution and additional fines or penalties, including the deferred charges.
Following the above resolution with the SEC and DOJ, Teva has had requests for documents and information from various Russian
government entities. In addition, on January 14, 2018, Teva entered into an arrangement for the Contingent Cessation of Proceedings
pursuant to the Israeli Securities Law with the Government of Israel that ended the investigation of the Israeli government into the
conduct that was subject to the FCPA investigation, and provided a payment of approximately $22 million.
Shareholder Litigation
On November 6, 2016 and December 27, 2016, two putative securities class actions were filed in the U.S. District Court for the
Central District of California against Teva and certain of its current and former officers and directors. After those two lawsuits were
consolidated and transferred to the U.S. District Court for the District of Connecticut, the court appointed the Ontario Teachers’ Pension
Plan Board as lead plaintiff (the “Ontario Teachers Securities Litigation”). The lead plaintiff then filed a consolidated amended
complaint. On December 1, 2017, Teva and the current and former officer and director defendants subsequently filed motions to dismiss
the consolidated amended complaint, with prejudice. On April 3, 2018, the court granted the motions to dismiss without prejudice. Lead
plaintiff filed a second amended complaint on June 22, 2018, purportedly on behalf of purchasers of Teva’s securities between
February 6, 2014 and August 3, 2017. The second complaint asserts that Teva and certain of its current and former officers and
directors violated federal securities laws in connection with Teva’s alleged failure to disclose pricing strategies for various drugs in its
generic drug portfolio and by making allegedly false or misleading statements in certain offering materials issued during the class
period. The second complaint seeks unspecified damages, legal fees, interest, and costs. Teva and the current and former officer and
director defendants filed motions to dismiss the second complaint on September 14, 2018. Lead plaintiff’s opposition to the motions to
dismiss is due on November 9, 2018.
On July 17, 2017, a lawsuit was filed in the U.S. District Court for the Southern District of Ohio derivatively on behalf of the Teva
Employee Stock Purchase Plan, and alternatively as a putative class action lawsuit on behalf of individuals who purchased Teva stock
through that plan. That lawsuit seeks unspecified damages, legal fees, interest and costs. The complaint alleges that Teva failed to
maintain adequate financial controls based on the facts underpinning Teva’s FCPA DPA and also based on allegations substantially
similar to those in the Ontario Teachers Securities Litigation. On November 29, 2017, the court granted Teva’s motion to transfer the
litigation to the U.S. District Court for the District of Connecticut where the Ontario Teachers Securities Litigation is pending. On
February 12, 2018, the district court stayed the case pending resolution of the motions to dismiss filed in the consolidated putative
securities class action described above.
On August 3, 2017, a securities lawsuit was filed in the U.S. District Court for the District of Connecticut by OZ ELS Master
Fund, Ltd. and related entities. The complaint asserts that Teva and certain of its current and former officers violated the federal
securities laws in connection with Teva’s alleged failure to disclose Teva’s participation in an alleged anticompetitive scheme to fix
prices and allocate markets for generic drugs in the United States. On August 30, 2017, the court entered an order deferring all
deadlines pending the resolution of the motions to dismiss filed in the Ontario Teachers Securities Litigation described above.
On August 21 and 30, 2017, each of Elliot Grodko and Barry Baker filed a putative securities class action in the U.S. District
Court for the Eastern District of Pennsylvania purportedly on behalf of purchasers of Teva’s securities between November 15, 2016 and
August 2, 2017 seeking unspecified damages, legal fees, interest, and costs. The complaints allege that Teva and certain of its current
and former officers violated the federal securities laws and Israeli securities laws by making false and misleading statements in
connection with Teva’s acquisition and integration of Actavis Generics. On November 1, 2017, the court consolidated the Baker and
Grodko cases. On April 10, 2018, the court granted Teva’s motion to transfer the consolidated action to the District of Connecticut
where the Ontario Teachers Securities Litigation is currently pending.
38

Between August and October 2018, four complaints were filed against Teva and current and former officer and director
defendants seeking unspecified compensatory and rescissory damages, legal fees, costs and expenses. The allegations in these
complaints are substantially similar to the allegations in the Ontario Teachers Securities Litigation, but have been brought on behalf of
plaintiffs that have “opted out” of the putative class in the Ontario Teachers Securities Litigation. The plaintiffs in these “opt-out” cases
are Fir Tree Value Master Fund, L.P. and FT SOF V Holdings, LLC; The Phoenix Insurance Company Ltd., The Phoenix Pension Ltd.,
Excellence Gemel & Hishtalmut Ltd., Excellence Kesem ETNS and Excellence Mutual Fund; Nordea Investment Management AB; and
the State of Alaska Department of Revenue, Treasury Division and the Alaska Permanent Fund Corporation, and they filed their
complaints in the Court of Common Pleas of Montgomery County, Pennsylvania on August 3, 2018, the U.S. District Court for the
Eastern District of Pennsylvania on August 3, 2018 and the U.S. District Court for the District of Connecticut on October 10 and
October 16, 2018, respectively. In the two cases filed in August 2018, Teva and the current and former officer and director defendants
filed motions to transfer the cases to the U.S. District Court for the District of Connecticut, where the Ontario Teachers Securities
Litigation is pending. In the two cases filed in October 2018, the parties jointly moved to stay the case pending resolution of the
motions to dismiss filed in the consolidated putative securities class action described above.
Motions to approve derivative actions against certain past and present directors and officers have been filed in Israel with respect
to alleged negligence and recklessness with respect to the acquisition of the Rimsa business and the acquisition of Actavis Generics.
Motions for document disclosure prior to initiating derivative actions were filed with respect to dividend distribution, executive
compensation and several patent settlement agreements. Motions to approve securities class actions against Teva and certain of its
current and former directors and officers were filed in Israel based on allegations of improper disclosure of the above-mentioned pricing
investigation, as well as lack of disclosure of negative developments in the generic sector, including price erosion with respect to Teva’s
products. Other motions were filed in Israel to approve a derivative action, discovery and a class action related to claims regarding
Teva’s above-mentioned FCPA resolution with the SEC and DOJ.
Environmental Matters
Teva or its subsidiaries are party to a number of environmental proceedings, or have received claims, including under the federal
Superfund law or other federal, provincial or state and local laws, imposing liability for alleged noncompliance, or for the investigation
and remediation of releases of hazardous substances and for natural resource damages. Many of these proceedings and claims seek to
require the generators of hazardous wastes disposed of at a third party-owned site, or the party responsible for a release of hazardous
substances that impacted a site, to investigate and clean the site or to pay or reimburse others for such activities, including for oversight
by governmental authorities and any related damages to natural resources. Teva or its subsidiaries have received claims, or been made a
party to these proceedings, along with others, as an alleged generator of wastes that were disposed of or treated at third-party waste
disposal sites, or as a result of an alleged release from one of Teva’s facilities or former facilities.
Although liability among the responsible parties, under certain circumstances, may be joint and several, these proceedings are
frequently resolved so that the allocation of clean-up and other costs among the parties reflects the relative contributions of the parties
to the site conditions and takes into account other pertinent factors. Teva’s potential liability varies greatly at each of the sites; for some
sites the costs of the investigation, clean-up and natural resource damages have not yet been determined, and for others Teva’s allocable
share of liability has not been determined. At other sites, Teva has taken an active role in identifying those costs, to the extent they are
identifiable and estimable, which do not include reductions for potential recoveries of clean-up costs from insurers, indemnitors, former
site owners or operators or other potentially responsible parties. In addition, enforcement proceedings relating to alleged violations of
federal, state, commonwealth or local requirements at some of Teva’s facilities may result in the imposition of significant penalties (in
amounts not expected to materially adversely affect Teva’s results of operations) and the recovery of certain costs and natural resource
damages, and may require that corrective actions and enhanced compliance measures be implemented.
Other Matters
On February 1, 2018, former shareholders of Ception Therapeutics, Inc., a company that was acquired by and merged into
Cephalon in 2010, prior to Cephalon’s acquisition by Teva, filed breach of contract and other related claims against the Company, Teva
USA and Cephalon in the Delaware Court of Chancery. Among other things, the plaintiffs allege that Cephalon breached the terms of
the 2010 Ception-Cephalon merger agreement by failing to exercise commercially reasonable efforts to develop and commercialize
CINQAIR® (reslizumab) for the treatment of eosinophilic esophagitis (EE). The plaintiffs claim damages of at least $200 million, an
amount they allege is equivalent to the milestones payable to the former shareholders of Ception in the event Cephalon were to obtain
regulatory approval for EE in the United States ($150 million) and Europe ($50 million). All defendants have moved to dismiss the
complaint and those motions remain pending.
NOTE 17 – Segments:
In November 2017, Teva announced a new organizational structure and leadership changes to enable strategic alignment across its
portfolios, regions and functions. Teva now operates its business through three segments: North America, Europe and International
Markets. The purpose of the new structure is to enable stronger alignment and integration between operations, commercial regions,
39
R&D and Teva’s global marketing and portfolio function, in order to optimize its product lifecycle across the therapeutic areas. The
Company began reporting its financial results under this structure in the first quarter of 2018.
In addition to these three segments, Teva has other activities, primarily the sale of API to third parties and certain contract
manufacturing services.
All the above changes were reflected through retroactive revision of prior period segment information.
Since 2013 and until December 31, 2017, Teva had two reportable segments: generic and specialty medicines. The generic
medicines segment included Teva’s OTC and API businesses. Teva’s other activities included distribution activities, sales of medical
devices and certain contract manufacturing operation (“CMO”) services.
Teva now operates its business and reports its financial results in three segments:
(a) North America segment, which includes the United States and Canada.
(b) Europe segment, which includes the European Union and certain other European countries.
(c) International Markets segment, which includes all countries other than those in the North America and Europe segments.
Teva’s Chief Executive Officer (“CEO”), who is the chief operating decision maker (“CODM”), reviews financial information
prepared on a consolidated basis, accompanied by disaggregated information about revenues and contributed profit by the three
identified reportable segments, namely North America, Europe and International Markets, to make decisions about resources to be
allocated to the segments and assess their performance.
Segment profit is comprised of gross profit for the segment less R&D expenses, S&M expenses, G&A expenses and other income
related to the segment. Segment profit does not include amortization and certain other items.
Teva manages its assets on a company basis, not by segments, as many of its assets are shared or commingled. Teva’s CODM
does not regularly review asset information by reportable segment and, therefore, Teva does not report asset information by reportable
segment.
Teva’s CEO may review its strategy and organizational structure. Any changes in strategy may lead to a reevaluation of the
Company’s segments and goodwill allocation to reporting units, as well as fair value attributable to its reporting units. See note 7.
40
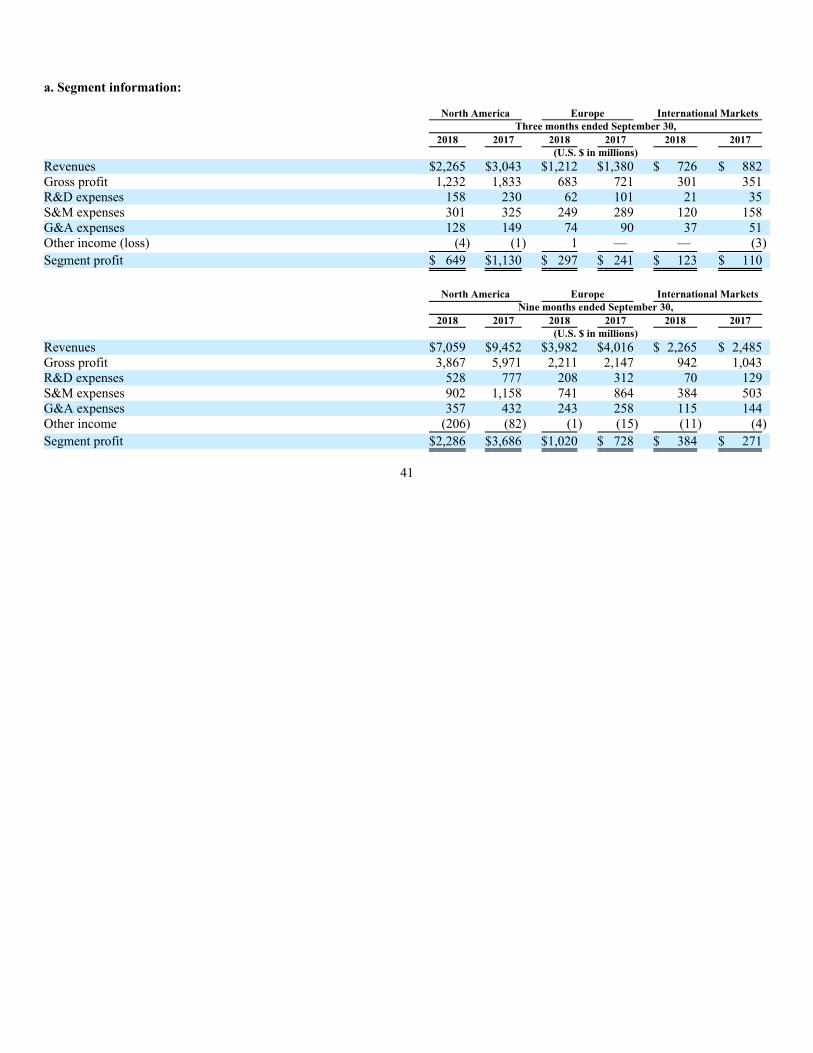
a. Segment information:
North America Europe International Markets
Three months ended September 30,
2018 2017 2018 2017 2018 2017
(U.S. $ in millions)
Revenues $2,265 $3,043 $1,212 $1,380 $ 726 $ 882
Gross profit 1,232 1,833 683 721 301 351
R&D expenses 158 230 62 101 21 35
S&M expenses 301 325 249 289 120 158
G&A expenses 128 149 74 90 37 51
Other income (loss) (4) (1) 1 — — (3)
Segment profit $ 649 $1,130 $ 297 $ 241 $ 123 $ 110
North America Europe International Markets
Nine months ended September 30,
2018 2017 2018 2017 2018 2017
(U.S. $ in millions)
Revenues $7,059 $9,452 $3,982 $4,016 $ 2,265 $ 2,485
Gross profit 3,867 5,971 2,211 2,147 942 1,043
R&D expenses 528 777 208 312 70 129
S&M expenses 902 1,158 741 864 384 503
G&A expenses 357 432 243 258 115 144
Other income (206) (82) (1) (15) (11) (4)
Segment profit $2,286 $3,686 $1,020 $ 728 $ 384 $ 271
41
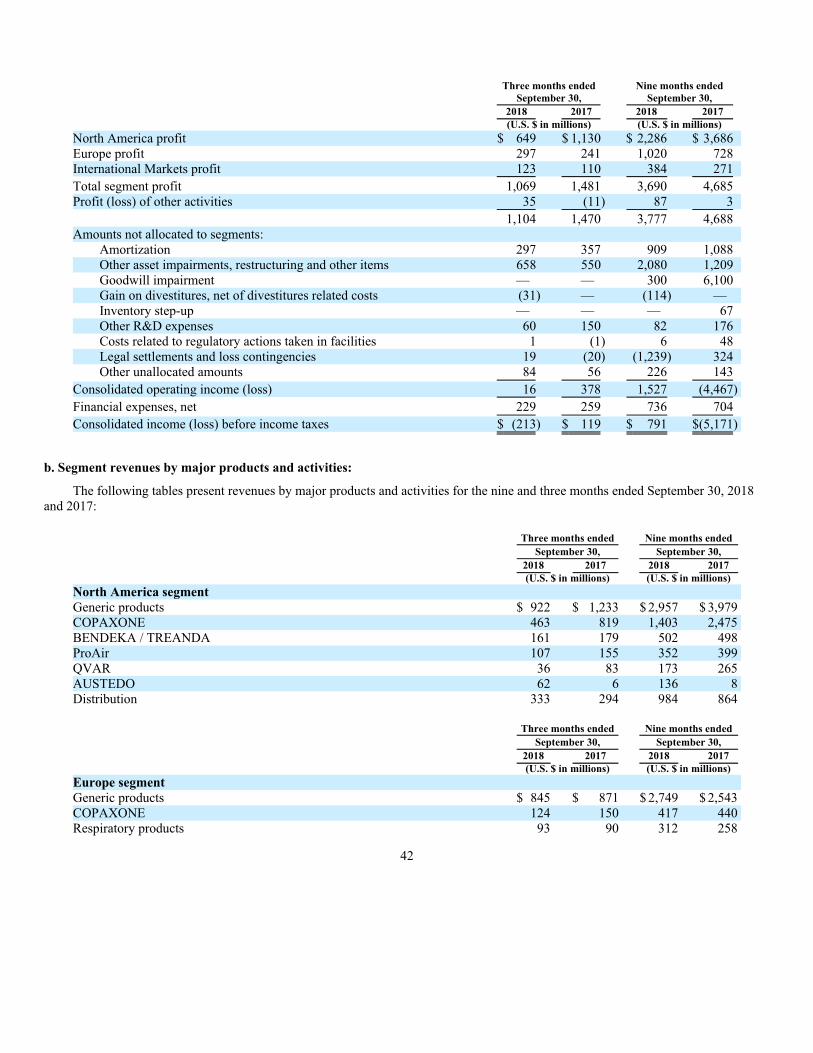
Three months ended
September 30,
Nine months ended
September 30,
2018 2017 2018 2017
(U.S. $ in millions) (U.S. $ in millions)
North America profit $ 649 $ 1,130 $ 2,286 $ 3,686
Europe profit 297 241 1,020 728
International Markets profit 123 110 384 271
Total segment profit 1,069 1,481 3,690 4,685
Profit (loss) of other activities 35 (11) 87 3
1,104 1,470 3,777 4,688
Amounts not allocated to segments:
Amortization 297 357 909 1,088
Other asset impairments, restructuring and other items 658 550 2,080 1,209
Goodwill impairment — — 300 6,100
Gain on divestitures, net of divestitures related costs (31) — (114) —
Inventory step-up — — — 67
Other R&D expenses 60 150 82 176
Costs related to regulatory actions taken in facilities 1 (1) 6 48
Legal settlements and loss contingencies 19 (20) (1,239) 324
Other unallocated amounts 84 56 226 143
Consolidated operating income (loss) 16 378 1,527 (4,467)
Financial expenses, net 229 259 736 704
Consolidated income (loss) before income taxes $ (213) $ 119 $ 791 $(5,171)
b. Segment revenues by major products and activities:
The following tables present revenues by major products and activities for the nine and three months ended September 30, 2018
and 2017:
Three months ended Nine months ended
September 30, September 30,
2018 2017 2018 2017
(U.S. $ in millions) (U.S. $ in millions)
North America segment
Generic products $ 922 $ 1,233 $ 2,957 $ 3,979
COPAXONE 463 819 1,403 2,475
BENDEKA / TREANDA 161 179 502 498
ProAir 107 155 352 399
QVAR 36 83 173 265
AUSTEDO 62 6 136 8
Distribution 333 294 984 864
Three months ended Nine months ended
September 30, September 30,
2018 2017 2018 2017
(U.S. $ in millions) (U.S. $ in millions)
Europe segment
Generic products $ 845 $ 871 $ 2,749 $ 2,543
COPAXONE 124 150 417 440
Respiratory products 93 90 312 258
42
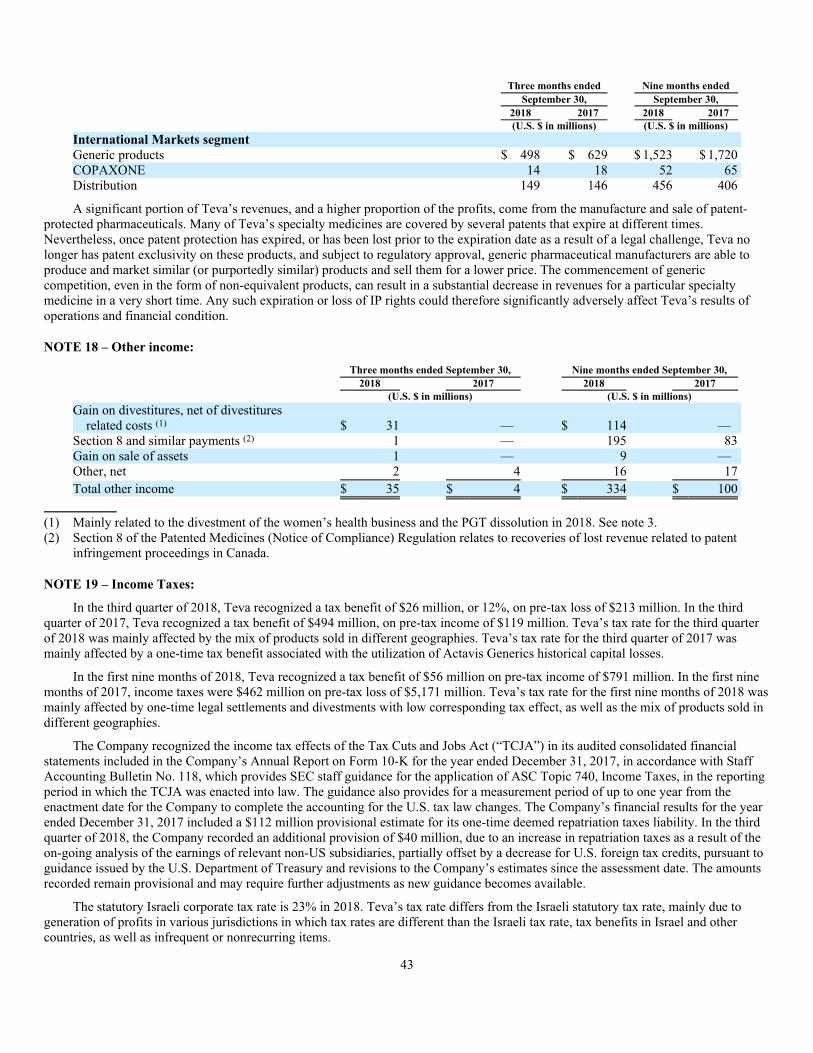
Three months ended Nine months ended
September 30, September 30,
2018 2017 2018 2017
(U.S. $ in millions) (U.S. $ in millions)
International Markets segment
Generic products $ 498 $ 629 $ 1,523 $ 1,720
COPAXONE 14 18 52 65
Distribution 149 146 456 406
A significant portion of Teva’s revenues, and a higher proportion of the profits, come from the manufacture and sale of patent-
protected pharmaceuticals. Many of Teva’s specialty medicines are covered by several patents that expire at different times.
Nevertheless, once patent protection has expired, or has been lost prior to the expiration date as a result of a legal challenge, Teva no
longer has patent exclusivity on these products, and subject to regulatory approval, generic pharmaceutical manufacturers are able to
produce and market similar (or purportedly similar) products and sell them for a lower price. The commencement of generic
competition, even in the form of non-equivalent products, can result in a substantial decrease in revenues for a particular specialty
medicine in a very short time. Any such expiration or loss of IP rights could therefore significantly adversely affect Teva’s results of
operations and financial condition.
NOTE 18 – Other income:
Three months ended September 30, Nine months ended September 30,
2018 2017 2018 2017
(U.S. $ in millions) (U.S. $ in millions)
Gain on divestitures, net of divestitures
related costs (1) $ 31 — $ 114 —
Section 8 and similar payments (2) 1 — 195 83
Gain on sale of assets 1 — 9 —
Other, net 2 4 16 17
Total other income $ 35 $ 4 $ 334 $ 100
(1) Mainly related to the divestment of the women’s health business and the PGT dissolution in 2018. See note 3.
(2) Section 8 of the Patented Medicines (Notice of Compliance) Regulation relates to recoveries of lost revenue related to patent
infringement proceedings in Canada.
NOTE 19 – Income Taxes:
In the third quarter of 2018, Teva recognized a tax benefit of $26 million, or 12%, on pre-tax loss of $213 million. In the third
quarter of 2017, Teva recognized a tax benefit of $494 million, on pre-tax income of $119 million. Teva’s tax rate for the third quarter
of 2018 was mainly affected by the mix of products sold in different geographies. Teva’s tax rate for the third quarter of 2017 was
mainly affected by a one-time tax benefit associated with the utilization of Actavis Generics historical capital losses.
In the first nine months of 2018, Teva recognized a tax benefit of $56 million on pre-tax income of $791 million. In the first nine
months of 2017, income taxes were $462 million on pre-tax loss of $5,171 million. Teva’s tax rate for the first nine months of 2018 was
mainly affected by one-time legal settlements and divestments with low corresponding tax effect, as well as the mix of products sold in
different geographies.
The Company recognized the income tax effects of the Tax Cuts and Jobs Act (“TCJA”) in its audited consolidated financial
statements included in the Company’s Annual Report on Form 10-K for the year ended December 31, 2017, in accordance with Staff
Accounting Bulletin No. 118, which provides SEC staff guidance for the application of ASC Topic 740, Income Taxes, in the reporting
period in which the TCJA was enacted into law. The guidance also provides for a measurement period of up to one year from the
enactment date for the Company to complete the accounting for the U.S. tax law changes. The Company’s financial results for the year
ended December 31, 2017 included a $112 million provisional estimate for its one-time deemed repatriation taxes liability. In the third
quarter of 2018, the Company recorded an additional provision of $40 million, due to an increase in repatriation taxes as a result of the
on-going analysis of the earnings of relevant non-US subsidiaries, partially offset by a decrease for U.S. foreign tax credits, pursuant to
guidance issued by the U.S. Department of Treasury and revisions to the Company’s estimates since the assessment date. The amounts
recorded remain provisional and may require further adjustments as new guidance becomes available.
The statutory Israeli corporate tax rate is 23% in 2018. Teva’s tax rate differs from the Israeli statutory tax rate, mainly due to
generation of profits in various jurisdictions in which tax rates are different than the Israeli tax rate, tax benefits in Israel and other
countries, as well as infrequent or nonrecurring items.
43

ITEM 2. MANAGEMENT’S DISCUSSION AND ANALYSIS OF FINANCIAL CONDITION AND RESULTS OF
OPERATIONS
Business Overview
We are a global pharmaceutical company, committed to increasing access to high-quality healthcare to patients around the world.
We operate worldwide, with headquarters in Israel and a significant presence in the United States, Europe and many other markets
around the world. Our key strengths include our world-leading generics expertise and portfolio, focused specialty portfolio and global
infrastructure and scale.
Teva was incorporated in Israel on February 13, 1944, and is the successor to a number of Israeli corporations, the oldest of which
was established in 1901.
In November 2017, we announced a new organizational structure and leadership changes to enable strategic alignment across our
portfolios, regions and functions. We now operate our business through three segments: North America, Europe and International
Markets. The purpose of the new structure is to enable stronger alignment and integration between operations, commercial regions,
R&D and our global marketing and portfolio function, in order to optimize our product lifecycle across therapeutic areas. We began
reporting our financial results under this structure in the first quarter of 2018.
In addition to these three segments, we have other activities, primarily the sale of active pharmaceutical ingredients (“API”) to
third parties and certain contract manufacturing services.
The data presented in this report for prior periods have been conformed to reflect the changes to our segment reporting
commencing in the first quarter of 2018.
Highlights
Significant highlights of the third quarter of 2018 included:
• On September 14, 2018, the FDA approved AJOVYTM (fremanezumab-vfrm) injection for the preventive treatment of
migraine in adults. We launched the product immediately upon approval.
• Revenues in the third quarter of 2018 were $4,529 million, a decrease of 19%, or 18% in local currency terms, compared to
the third quarter of 2017.
• Our North America segment generated revenues of $2,265 million and profit of $649 million in the third quarter of 2018.
Revenues decreased by 26% compared to the third quarter of 2017, mainly due to a decline in revenues of COPAXONE®, as
well as a decline in revenues in our U.S. generics business, a decline in revenues of ProAir® and QVAR® and the loss of
revenues from the sale of our women’s health business, partially offset by higher revenues from AUSTEDO® and our North
America distribution business. Profit decreased by 43% mainly due to lower revenues, partially offset by cost reductions and
efficiency measures as part of the restructuring plan.
• Our Europe segment generated revenues of $1,212 million and profit of $297 million in the third quarter of 2018. Revenues
decreased by 12%, or 11% in local currency terms, compared to the third quarter of 2017, mainly due to the loss of revenues
from the closure of our distribution business in Hungary, the sale of our women’s health business and a decline in
COPAXONE revenues due to the entry of competing glatiramer acetate products, partially offset by new generic product
launches. Profit increased by 23% mainly due to cost reductions and efficiency measures as part of the restructuring plan.
• Our International Markets segment generated revenues of $726 million and profit of $123 million in the third quarter of
2018. Revenues decreased by 18%, or 12% in local currency terms compared to the third quarter of 2017, mainly due to
lower sales in Japan and Russia, the effect of the deconsolidation of our subsidiaries in Venezuela and the loss of revenues
from the sale of our women’s health business. Profit increased by 12%, mainly due to cost reductions and efficiency
measures as part of the restructuring plan.
• Other asset impairments, restructuring and other items were $658 million in the third quarter of 2018, mainly comprised of a
$521 million impairment of long-lived assets and $88 million of restructuring expenses. Other asset impairments,
restructuring and other items were $550 million in the third quarter of 2017.
• Operating income was $16 million in the third quarter of 2018, compared to $378 million in the third quarter of 2017. The
decrease in operating income was mainly due to lower gross profit and higher impairment charges recorded in the third
quarter of 2018.
44
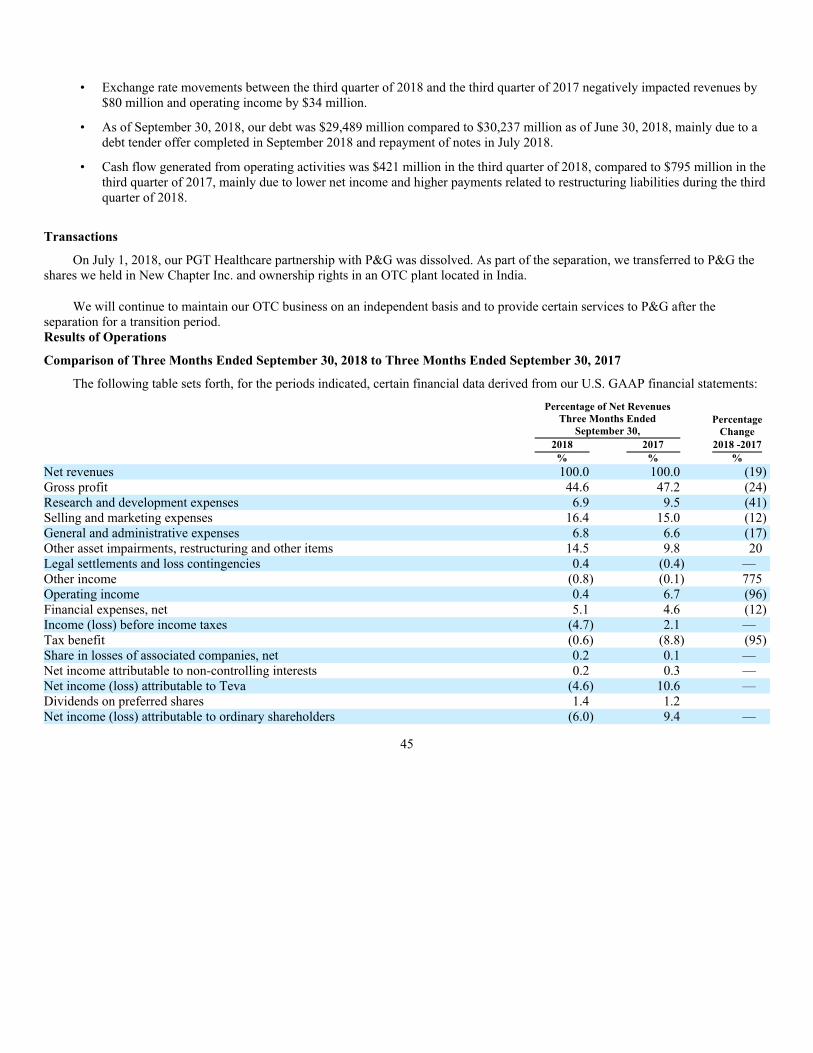
• Exchange rate movements between the third quarter of 2018 and the third quarter of 2017 negatively impacted revenues by
$80 million and operating income by $34 million.
• As of September 30, 2018, our debt was $29,489 million compared to $30,237 million as of June 30, 2018, mainly due to a
debt tender offer completed in September 2018 and repayment of notes in July 2018.
• Cash flow generated from operating activities was $421 million in the third quarter of 2018, compared to $795 million in the
third quarter of 2017, mainly due to lower net income and higher payments related to restructuring liabilities during the third
quarter of 2018.
Transactions
On July 1, 2018, our PGT Healthcare partnership with P&G was dissolved. As part of the separation, we transferred to P&G the
shares we held in New Chapter Inc. and ownership rights in an OTC plant located in India.
We will continue to maintain our OTC business on an independent basis and to provide certain services to P&G after the
separation for a transition period.
Results of Operations
Comparison of Three Months Ended September 30, 2018 to Three Months Ended September 30, 2017
The following table sets forth, for the periods indicated, certain financial data derived from our U.S. GAAP financial statements:
Percentage of Net Revenues
Three Months Ended
September 30,
Percentage
Change
2018 2017 2018 -2017
% % %
Net revenues 100.0 100.0 (19)
Gross profit 44.6 47.2 (24)
Research and development expenses 6.9 9.5 (41)
Selling and marketing expenses 16.4 15.0 (12)
General and administrative expenses 6.8 6.6 (17)
Other asset impairments, restructuring and other items 14.5 9.8 20
Legal settlements and loss contingencies 0.4 (0.4) —
Other income (0.8) (0.1) 775
Operating income 0.4 6.7 (96)
Financial expenses, net 5.1 4.6 (12)
Income (loss) before income taxes (4.7) 2.1 —
Tax benefit (0.6) (8.8) (95)
Share in losses of associated companies, net 0.2 0.1 —
Net income attributable to non-controlling interests 0.2 0.3 —
Net income (loss) attributable to Teva (4.6) 10.6 —
Dividends on preferred shares 1.4 1.2
Net income (loss) attributable to ordinary shareholders (6.0) 9.4 —
45
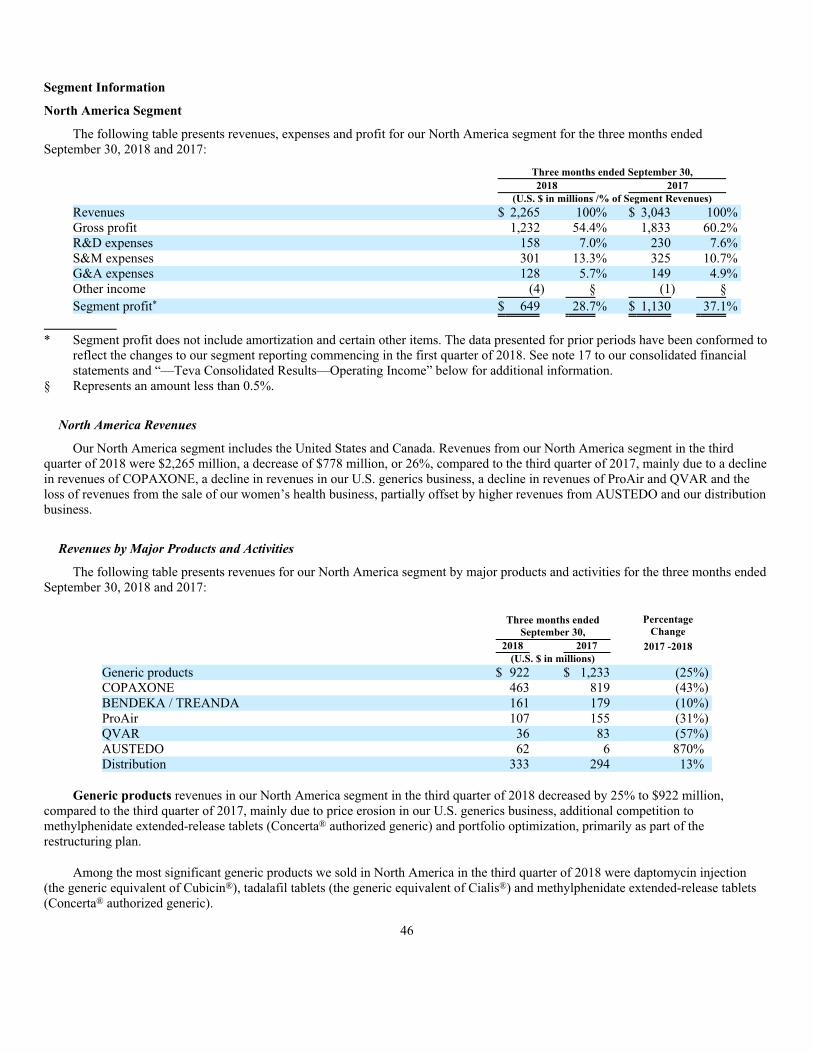
Segment Information
North America Segment
The following table presents revenues, expenses and profit for our North America segment for the three months ended
September 30, 2018 and 2017:
Three months ended September 30,
2018 2017
(U.S. $ in millions /% of Segment Revenues)
Revenues $ 2,265 100% $ 3,043 100%
Gross profit 1,232 54.4% 1,833 60.2%
R&D expenses 158 7.0% 230 7.6%
S&M expenses 301 13.3% 325 10.7%
G&A expenses 128 5.7% 149 4.9%
Other income (4) § (1) §
Segment profit* $ 649 28.7% $ 1,130 37.1%
* Segment profit does not include amortization and certain other items. The data presented for prior periods have been conformed to
reflect the changes to our segment reporting commencing in the first quarter of 2018. See note 17 to our consolidated financial
statements and “—Teva Consolidated Results—Operating Income” below for additional information.
§ Represents an amount less than 0.5%.
North America Revenues
Our North America segment includes the United States and Canada. Revenues from our North America segment in the third
quarter of 2018 were $2,265 million, a decrease of $778 million, or 26%, compared to the third quarter of 2017, mainly due to a decline
in revenues of COPAXONE, a decline in revenues in our U.S. generics business, a decline in revenues of ProAir and QVAR and the
loss of revenues from the sale of our women’s health business, partially offset by higher revenues from AUSTEDO and our distribution
business.
Revenues by Major Products and Activities
The following table presents revenues for our North America segment by major products and activities for the three months ended
September 30, 2018 and 2017:
Three months ended
September 30,
Percentage
Change
2018 2017 2017 -2018
(U.S. $ in millions)
Generic products $ 922 $ 1,233 (25%)
COPAXONE 463 819 (43%)
BENDEKA / TREANDA 161 179 (10%)
ProAir 107 155 (31%)
QVAR 36 83 (57%)
AUSTEDO 62 6 870%
Distribution 333 294 13%
Generic products revenues in our North America segment in the third quarter of 2018 decreased by 25% to $922 million,
compared to the third quarter of 2017, mainly due to price erosion in our U.S. generics business, additional competition to
methylphenidate extended-release tablets (Concerta® authorized generic) and portfolio optimization, primarily as part of the
restructuring plan.
Among the most significant generic products we sold in North America in the third quarter of 2018 were daptomycin injection
(the generic equivalent of Cubicin®), tadalafil tablets (the generic equivalent of Cialis®) and methylphenidate extended-release tablets
(Concerta® authorized generic).
46
In the third quarter of 2018, we led the U.S. generics market in total prescriptions and new prescriptions, with approximately
547 million total prescriptions, representing 14.1% of total U.S. generic prescriptions according to IQVIA data.
COPAXONE revenues in our North America segment in the third quarter of 2018 decreased by 43% to $463 million, compared
to the third quarter of 2017, mainly due to generic competition in the United States.
COPAXONE revenues in the United States were $446 million in the third quarter of 2018.
Revenues of COPAXONE in our North America segment were 77% of global COPAXONE revenues in the third quarter of 2018,
compared to 83% in the third quarter of 2017.
COPAXONE global sales accounted for approximately 13% of our global revenues in the third quarter of 2018 and a significantly
higher percentage of our profits and cash flow from operations during this period.
The FDA approved generic versions of COPAXONE 40 mg/mL in October 2017 and February 2018 and a second generic version
of COPAXONE 20 mg/mL in October 2017. Hybrid versions of COPAXONE 20 mg/mL and 40 mg/mL were also approved in the
European Union.
On October 12, 2018, the U.S. Court of Appeals for the Federal Circuit (“CAFC”) handed down its ruling in the consolidated
appeal of decisions from the U.S. District Court and Patent Trial and Appeal Board, relating to patents covering COPAXONE 40
mg/ml. The CAFC found all claims at issue to be invalid, and we are currently evaluating our options for further appeals. COPAXONE
40 mg/mL is protected by one European patent expiring in 2030. This patent is being challenged in Italy and Norway and has been
opposed at the European Patent Office. The U.K. High Court found this patent invalid and our application for permission to appeal this
decision was rejected.
The market for MS treatments continues to develop, particularly with the recent approvals of generic versions of COPAXONE
discussed above, as well as additional generic versions expected to be approved in the future. Oral treatments for MS, such as
Tecfidera®, Gilenya® and Aubagio®, continue to present significant and increasing competition. COPAXONE also continues to face
competition from existing injectable products, as well as from monoclonal antibodies.
BENDEKA and TREANDA combined revenues in our North America segment in the third quarter of 2018 decreased by 10% to
$161 million, compared to the third quarter of 2017, mainly due to lower volumes, partially offset by higher pricing. Our partner, Eagle
Pharmaceuticals, Inc. prevailed in its suit in the U.S. district court against the FDA to obtain seven years of orphan drug exclusivity in
the United States for BENDEKA. The FDA has appealed the district court’s decision, but barring a reversal by the appellate court, drug
applications referencing BENDEKA will not be approved by the FDA until the orphan drug exclusivity expires in December 2022.
ProAir revenues in our North America segment in the third quarter of 2018 decreased by 31% to $107 million, compared to the
third quarter of 2017, mainly due to lower net pricing. ProAir is the second-largest short-acting beta-agonist in the market, with an exit
market share of 45.2% in terms of total number of prescriptions during the third quarter of 2018, compared to 46.2% in the third quarter
of 2017. In June 2014, we settled a patent challenge to ProAir HFA with Perrigo Pharmaceuticals (“Perrigo”) permitting Perrigo to
launch its generic product in limited quantities once it receives FDA approval and without quantity limitations after June 2018. In
November 2017, we settled another patent challenge to ProAir HFA with Lupin Pharmaceuticals, Inc.
QVAR revenues in our North America segment in the third quarter of 2018 decreased by 57% to $36 million, compared to the
third quarter of 2017. The decrease in sales in the third quarter of 2018 was mainly due to lower volumes during this quarter following
wholesaler stocking in the first quarter of 2018 in connection with the launch of QVAR® RediHaler™. QVAR maintained its second-
place position in the inhaled corticosteroids category in the United States, with an exit market share of 21.7% in terms of total number
of prescriptions during the third quarter of 2018, compared to 37.9% in the third quarter of 2017.
AUSTEDO revenues in our North America segment in the third quarter of 2018 were $62 million. AUSTEDO was approved by
the FDA and launched in April 2017 in the United States for the treatment of chorea associated with Huntington disease. In August
2017, the FDA approved AUSTEDO for the treatment of tardive dyskinesia.
47
Distribution revenues in our North America segment, which are generated by Anda, increased by 13% to $333 million in the third
quarter of 2018, compared to the third quarter of 2017, mainly due to higher volumes. Our Anda business distributes generic, specialty
and OTC pharmaceutical products from various third party manufacturers to independent retail pharmacies, pharmacy retail chains,
hospitals and physician offices in the United States. Anda is able to compete in the secondary distribution market by maintaining high
inventory levels for a broad offering of products, next day delivery throughout the United States and competitive pricing.
Product Launches and Pipeline
In the third quarter of 2018, we launched the generic version of the following branded products in North America:
Product Name
Brand
Name
Launch
Date
Total Annual U.S.
Branded Sales at Time
of Launch
(U.S. $ in millions
(IQVIA))*
Budesonide Extended-Release Tablets, 9 mg Uceris® ER July $ 199
Romidepsin for Injection, 10 mg/vial Istodax® August $ 52
Cisatracurium Besylate Injection, USP 2 mg/mL,
10 mg, 10 mg/mL, 200 mg & 2 mg/mL, 20 mg Nimbex® September $ 49
Tadalafil Tablets, USP 2.5 mg, 5 mg, 10 mg & 20
mg Cialis® September $ 1,926
* The figures presented are for the twelve months ended in the calendar quarter immediately prior to our launch or re-launch.
Our generic products pipeline in the United States includes, as of September 30, 2018, 310 product applications awaiting FDA
approval, including 93 tentative approvals. This total reflects all pending ANDAs, supplements for product line extensions and
tentatively approved applications and includes some instances where more than one application was submitted for the same reference
product. Excluding overlaps, the branded products underlying these pending applications had U.S. sales for the twelve months ended
June 30, 2018 exceeding $120 billion, according to IQVIA. Approximately 70% of pending applications include a paragraph IV patent
challenge and we believe we are first to file with respect to 107 of these products, or 130 products including final approvals where
launch is pending a settlement agreement or court decision. Collectively, these first to file opportunities represent over $68 billion in
U.S. brand sales for the twelve months ended June 30, 2018, according to IQVIA.
IQVIA reported brand sales are one of the many indicators of future potential value of a launch, but equally important are the mix
and timing of competition, as well as cost effectiveness. The potential advantages of being the first filer with respect to some of these
products may be subject to forfeiture, shared exclusivity or competition from so-called “authorized generics,” which may ultimately
affect the value derived.
48
In the third quarter of 2018, we received tentative approvals for generic equivalents of the products listed in the table below,
excluding overlapping applications. A “tentative approval” indicates that the FDA has substantially completed its review of an
application and final approval is expected once the relevant patent expires, a court decision is reached, a 30-month regulatory stay
lapses or a 180-day exclusivity period awarded to another manufacturer either expires or is forfeited.
Generic Name Brand Name
Total U.S. Annual Branded
Market (U.S. $
in millions (IQVIA))*
Nicotine Polacrilex Mini Lozenges, 2
mg & 4 mg (Ice Mint) Nicorette® —
Azelaic Acid Foam, 15% Finacea® $ 58
Saxagliptin Tablets, 2.5mg & 5mg Onglyza® $383
Mesalamine Extended-Release Capsules
USP, 375 mg Apriso® $282
Oxcarbazepine Extended-Release Tablets,
150 mg, 300 mg & 600 mg Oxtellar®XR $123
Ingenol Mebutate Gel, 0.015% Picato® $ 61
Clindamycin Phosphate and Benzoyl
Peroxide Gel, 1.2%/3.75% Onexton® $125
Axitinib Tablets, 1 mg & 5 mg Inlyta® $120
Mesalamine Delayed-Release Capsules,
400mg Delzicol® $140
* For the twelve months ended in the calendar quarter immediately prior to the receipt of tentative approval.
In the third quarter of 2018, our pipeline consisted of the following products:
Product
Potential
Indication(s)
Route of
Administration
Development Phase
(date entered phase 3) Comments
Neurology and
Neuropsychiatry
AUSTEDO (deutetrabenazine) Tourette syndrome Oral 3 (December 2017)
Laquinimod Huntington disease Oral — Based on the negative outcome of the phase 2 clinical
trial, we will not continue the clinical development of
laquinimod. We terminated the development and
license agreement and returned the development and
commercialization rights to Active Biotech in
September 2018.
TV-46000 (risperidone LAI) Schizophrenia LAI 3 (April 2018)
49
Product Potential Indication(s)
Route of
Administration
Development Phase
(date entered phase 3) Comments
Migraine and Pain
AJOVY (fremanezumab)
(anti CGRP)
Chronic and episodic
migraine
Subcutaneous Approved by FDA
and launched
(September 2018);
Response package
submitted for
Marketing
Authorization
Application
(“MAA”) to the
European
Medicines Agency
(“EMA”)
(September 2018)
On September 14, 2018, the FDA approved AJOVY
(fremanezumab-vfrm) injection for the preventive
treatment of migraine in adults. We launched the product
immediately upon approval.
We filed a lawsuit in the U.S. District Court for the
District of Massachusetts alleging that Eli Lilly’s planned
marketing and sale of its galcanezumab product for the
treatment of migraine infringes nine Teva patents. Eli
Lilly has also submitted inter partes review petitions to
the Patent Trial and Appeal Board, challenging the
validity of the nine patents asserted against them in the
litigation.
Episodic
cluster headache
Subcutaneous 3 (November 2016)
Post traumatic
headache
Subcutaneous 2
Fasinumab Osteoarthritis pain Subcutaneous 3 (March 2016) Developed in collaboration with Regeneron
Pharmaceuticals, Inc. (“Regeneron”). In August 2018
Regeneron and Teva announced positive topline phase 3
results in patients with chronic pain from osteoarthritis of
the knee or hip with the remaining low dose 1mg every
month (1mg4W) and 1mg every two months (1mg8W).
Chronic lower
back pain
Subcutaneous 2
50
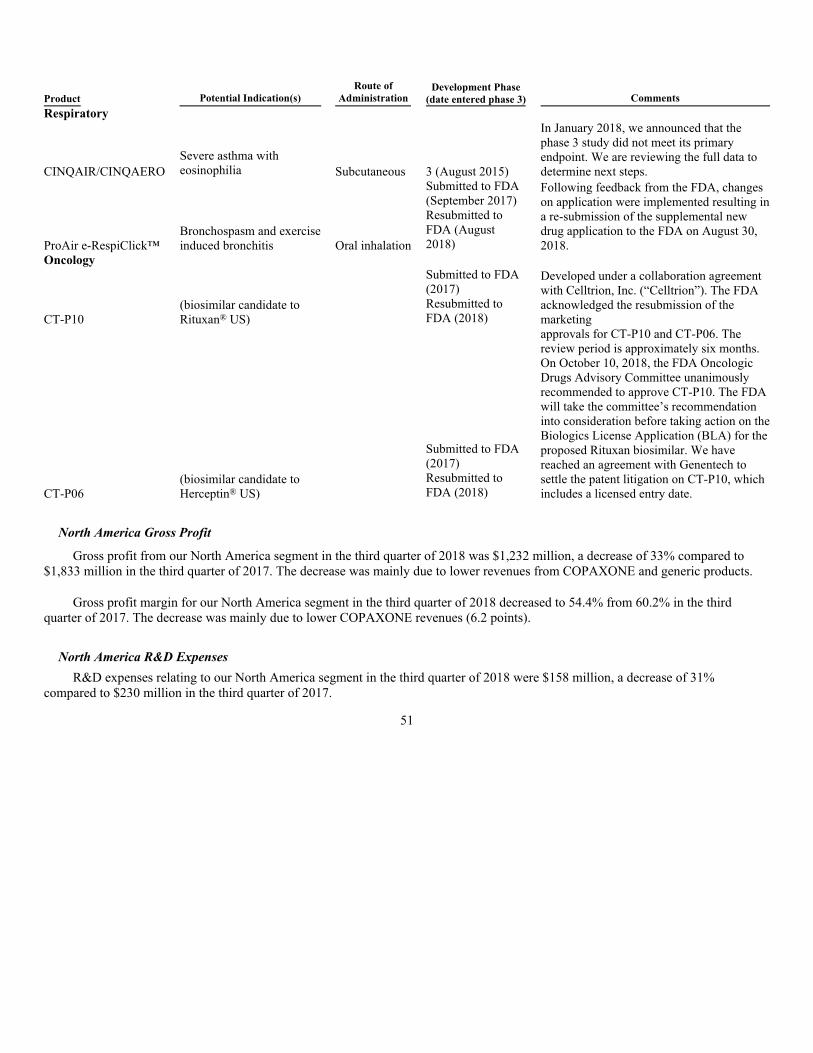
Product Potential Indication(s)
Route of
Administration
Development Phase
(date entered phase 3) Comments
Respiratory
CINQAIR/CINQAERO
Severe asthma with
eosinophilia Subcutaneous 3 (August 2015)
In January 2018, we announced that the
phase 3 study did not meet its primary
endpoint. We are reviewing the full data to
determine next steps.
ProAir e-RespiClick™
Bronchospasm and exercise
induced bronchitis Oral inhalation
Submitted to FDA
(September 2017)
Resubmitted to
FDA (August
2018)
Following feedback from the FDA, changes
on application were implemented resulting in
a re-submission of the supplemental new
drug application to the FDA on August 30,
2018.
Oncology
CT-P10
(biosimilar candidate to
Rituxan® US)
Submitted to FDA
(2017)
Resubmitted to
FDA (2018)
Developed under a collaboration agreement
with Celltrion, Inc. (“Celltrion”). The FDA
acknowledged the resubmission of the
marketing
CT-P06
(biosimilar candidate to
Herceptin® US)
Submitted to FDA
(2017)
Resubmitted to
FDA (2018)
approvals for CT-P10 and CT-P06. The
review period is approximately six months.
On October 10, 2018, the FDA Oncologic
Drugs Advisory Committee unanimously
recommended to approve CT-P10. The FDA
will take the committee’s recommendation
into consideration before taking action on the
Biologics License Application (BLA) for the
proposed Rituxan biosimilar. We have
reached an agreement with Genentech to
settle the patent litigation on CT-P10, which
includes a licensed entry date.
North America Gross Profit
Gross profit from our North America segment in the third quarter of 2018 was $1,232 million, a decrease of 33% compared to
$1,833 million in the third quarter of 2017. The decrease was mainly due to lower revenues from COPAXONE and generic products.
Gross profit margin for our North America segment in the third quarter of 2018 decreased to 54.4% from 60.2% in the third
quarter of 2017. The decrease was mainly due to lower COPAXONE revenues (6.2 points).
North America R&D Expenses
R&D expenses relating to our North America segment in the third quarter of 2018 were $158 million, a decrease of 31%
compared to $230 million in the third quarter of 2017.
51
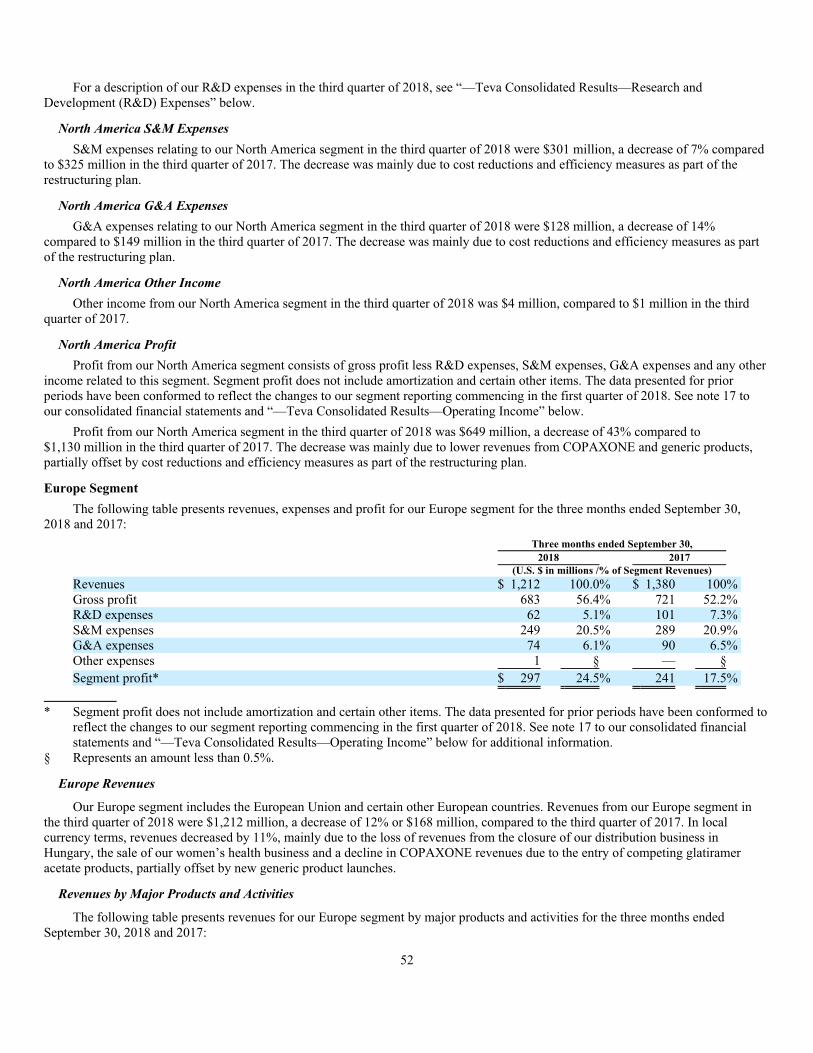
For a description of our R&D expenses in the third quarter of 2018, see “—Teva Consolidated Results—Research and
Development (R&D) Expenses” below.
North America S&M Expenses
S&M expenses relating to our North America segment in the third quarter of 2018 were $301 million, a decrease of 7% compared
to $325 million in the third quarter of 2017. The decrease was mainly due to cost reductions and efficiency measures as part of the
restructuring plan.
North America G&A Expenses
G&A expenses relating to our North America segment in the third quarter of 2018 were $128 million, a decrease of 14%
compared to $149 million in the third quarter of 2017. The decrease was mainly due to cost reductions and efficiency measures as part
of the restructuring plan.
North America Other Income
Other income from our North America segment in the third quarter of 2018 was $4 million, compared to $1 million in the third
quarter of 2017.
North America Profit
Profit from our North America segment consists of gross profit less R&D expenses, S&M expenses, G&A expenses and any other
income related to this segment. Segment profit does not include amortization and certain other items. The data presented for prior
periods have been conformed to reflect the changes to our segment reporting commencing in the first quarter of 2018. See note 17 to
our consolidated financial statements and “—Teva Consolidated Results—Operating Income” below.
Profit from our North America segment in the third quarter of 2018 was $649 million, a decrease of 43% compared to
$1,130 million in the third quarter of 2017. The decrease was mainly due to lower revenues from COPAXONE and generic products,
partially offset by cost reductions and efficiency measures as part of the restructuring plan.
Europe Segment
The following table presents revenues, expenses and profit for our Europe segment for the three months ended September 30,
2018 and 2017:
Three months ended September 30,
2018 2017
(U.S. $ in millions /% of Segment Revenues)
Revenues $ 1,212 100.0% $ 1,380 100%
Gross profit 683 56.4% 721 52.2%
R&D expenses 62 5.1% 101 7.3%
S&M expenses 249 20.5% 289 20.9%
G&A expenses 74 6.1% 90 6.5%
Other expenses 1 § — §
Segment profit* $ 297 24.5% 241 17.5%
* Segment profit does not include amortization and certain other items. The data presented for prior periods have been conformed to
reflect the changes to our segment reporting commencing in the first quarter of 2018. See note 17 to our consolidated financial
statements and “—Teva Consolidated Results—Operating Income” below for additional information.
§ Represents an amount less than 0.5%.
Europe Revenues
Our Europe segment includes the European Union and certain other European countries. Revenues from our Europe segment in
the third quarter of 2018 were $1,212 million, a decrease of 12% or $168 million, compared to the third quarter of 2017. In local
currency terms, revenues decreased by 11%, mainly due to the loss of revenues from the closure of our distribution business in
Hungary, the sale of our women’s health business and a decline in COPAXONE revenues due to the entry of competing glatiramer
acetate products, partially offset by new generic product launches.
Revenues by Major Products and Activities
The following table presents revenues for our Europe segment by major products and activities for the three months ended
September 30, 2018 and 2017:
52
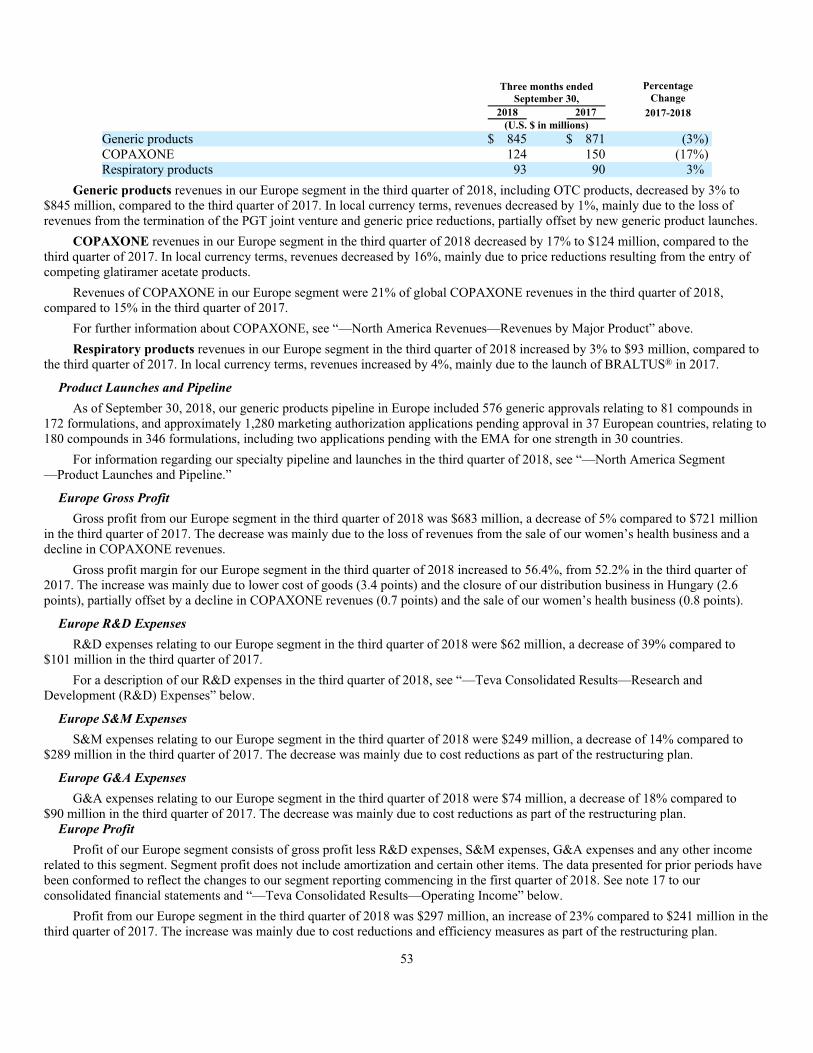
Three months ended
September 30,
Percentage
Change
2018 2017 2017-2018
(U.S. $ in millions)
Generic products $ 845 $ 871 (3%)
COPAXONE 124 150 (17%)
Respiratory products 93 90 3%
Generic products revenues in our Europe segment in the third quarter of 2018, including OTC products, decreased by 3% to
$845 million, compared to the third quarter of 2017. In local currency terms, revenues decreased by 1%, mainly due to the loss of
revenues from the termination of the PGT joint venture and generic price reductions, partially offset by new generic product launches.
COPAXONE revenues in our Europe segment in the third quarter of 2018 decreased by 17% to $124 million, compared to the
third quarter of 2017. In local currency terms, revenues decreased by 16%, mainly due to price reductions resulting from the entry of
competing glatiramer acetate products.
Revenues of COPAXONE in our Europe segment were 21% of global COPAXONE revenues in the third quarter of 2018,
compared to 15% in the third quarter of 2017.
For further information about COPAXONE, see “—North America Revenues—Revenues by Major Product” above.
Respiratory products revenues in our Europe segment in the third quarter of 2018 increased by 3% to $93 million, compared to
the third quarter of 2017. In local currency terms, revenues increased by 4%, mainly due to the launch of BRALTUS® in 2017.
Product Launches and Pipeline
As of September 30, 2018, our generic products pipeline in Europe included 576 generic approvals relating to 81 compounds in
172 formulations, and approximately 1,280 marketing authorization applications pending approval in 37 European countries, relating to
180 compounds in 346 formulations, including two applications pending with the EMA for one strength in 30 countries.
For information regarding our specialty pipeline and launches in the third quarter of 2018, see “—North America Segment
—Product Launches and Pipeline.”
Europe Gross Profit
Gross profit from our Europe segment in the third quarter of 2018 was $683 million, a decrease of 5% compared to $721 million
in the third quarter of 2017. The decrease was mainly due to the loss of revenues from the sale of our women’s health business and a
decline in COPAXONE revenues.
Gross profit margin for our Europe segment in the third quarter of 2018 increased to 56.4%, from 52.2% in the third quarter of
2017. The increase was mainly due to lower cost of goods (3.4 points) and the closure of our distribution business in Hungary (2.6
points), partially offset by a decline in COPAXONE revenues (0.7 points) and the sale of our women’s health business (0.8 points).
Europe R&D Expenses
R&D expenses relating to our Europe segment in the third quarter of 2018 were $62 million, a decrease of 39% compared to
$101 million in the third quarter of 2017.
For a description of our R&D expenses in the third quarter of 2018, see “—Teva Consolidated Results—Research and
Development (R&D) Expenses” below.
Europe S&M Expenses
S&M expenses relating to our Europe segment in the third quarter of 2018 were $249 million, a decrease of 14% compared to
$289 million in the third quarter of 2017. The decrease was mainly due to cost reductions as part of the restructuring plan.
Europe G&A Expenses
G&A expenses relating to our Europe segment in the third quarter of 2018 were $74 million, a decrease of 18% compared to
$90 million in the third quarter of 2017. The decrease was mainly due to cost reductions as part of the restructuring plan.
Europe Profit
Profit of our Europe segment consists of gross profit less R&D expenses, S&M expenses, G&A expenses and any other income
related to this segment. Segment profit does not include amortization and certain other items. The data presented for prior periods have
been conformed to reflect the changes to our segment reporting commencing in the first quarter of 2018. See note 17 to our
consolidated financial statements and “—Teva Consolidated Results—Operating Income” below.
Profit from our Europe segment in the third quarter of 2018 was $297 million, an increase of 23% compared to $241 million in the
third quarter of 2017. The increase was mainly due to cost reductions and efficiency measures as part of the restructuring plan.
53
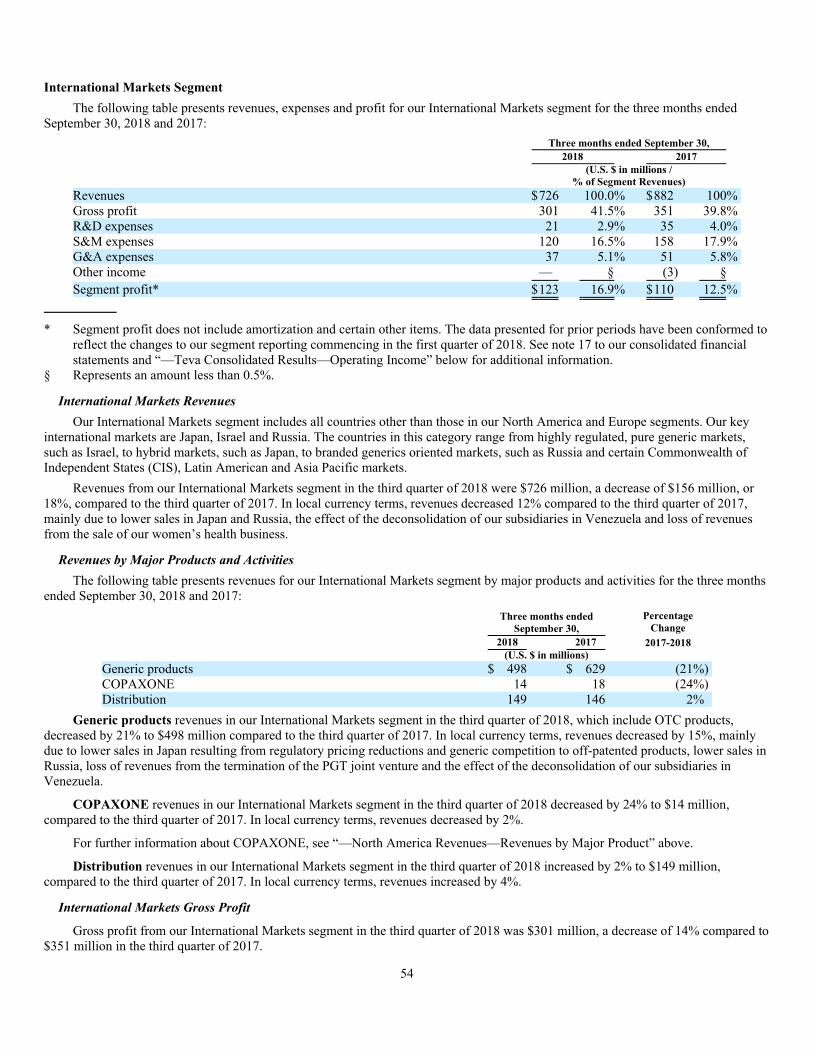
International Markets Segment
The following table presents revenues, expenses and profit for our International Markets segment for the three months ended
September 30, 2018 and 2017:
Three months ended September 30,
2018 2017
(U.S. $ in millions /
% of Segment Revenues)
Revenues $726 100.0% $882 100%
Gross profit 301 41.5% 351 39.8%
R&D expenses 21 2.9% 35 4.0%
S&M expenses 120 16.5% 158 17.9%
G&A expenses 37 5.1% 51 5.8%
Other income — § (3) §
Segment profit* $123 16.9% $110 12.5%
* Segment profit does not include amortization and certain other items. The data presented for prior periods have been conformed to
reflect the changes to our segment reporting commencing in the first quarter of 2018. See note 17 to our consolidated financial
statements and “—Teva Consolidated Results—Operating Income” below for additional information.
§ Represents an amount less than 0.5%.
International Markets Revenues
Our International Markets segment includes all countries other than those in our North America and Europe segments. Our key
international markets are Japan, Israel and Russia. The countries in this category range from highly regulated, pure generic markets,
such as Israel, to hybrid markets, such as Japan, to branded generics oriented markets, such as Russia and certain Commonwealth of
Independent States (CIS), Latin American and Asia Pacific markets.
Revenues from our International Markets segment in the third quarter of 2018 were $726 million, a decrease of $156 million, or
18%, compared to the third quarter of 2017. In local currency terms, revenues decreased 12% compared to the third quarter of 2017,
mainly due to lower sales in Japan and Russia, the effect of the deconsolidation of our subsidiaries in Venezuela and loss of revenues
from the sale of our women’s health business.
Revenues by Major Products and Activities
The following table presents revenues for our International Markets segment by major products and activities for the three months
ended September 30, 2018 and 2017:
Three months ended
September 30,
Percentage
Change
2018 2017 2017-2018
(U.S. $ in millions)
Generic products $ 498 $ 629 (21%)
COPAXONE 14 18 (24%)
Distribution 149 146 2%
Generic products revenues in our International Markets segment in the third quarter of 2018, which include OTC products,
decreased by 21% to $498 million compared to the third quarter of 2017. In local currency terms, revenues decreased by 15%, mainly
due to lower sales in Japan resulting from regulatory pricing reductions and generic competition to off-patented products, lower sales in
Russia, loss of revenues from the termination of the PGT joint venture and the effect of the deconsolidation of our subsidiaries in
Venezuela.
COPAXONE revenues in our International Markets segment in the third quarter of 2018 decreased by 24% to $14 million,
compared to the third quarter of 2017. In local currency terms, revenues decreased by 2%.
For further information about COPAXONE, see “—North America Revenues—Revenues by Major Product” above.
Distribution revenues in our International Markets segment in the third quarter of 2018 increased by 2% to $149 million,
compared to the third quarter of 2017. In local currency terms, revenues increased by 4%.
International Markets Gross Profit
Gross profit from our International Markets segment in the third quarter of 2018 was $301 million, a decrease of 14% compared to
$351 million in the third quarter of 2017.
54

Gross profit margin for our International Markets segment in the third quarter of 2018 increased to 41.5%, from 39.8% in the third
quarter of 2017. The increase was mainly due to higher gross profit resulting from changes in product mix in certain countries, mainly
Israel, Russia and Mexico, as well as lower cost of goods (6.4 points), partially offset by the Venezuela deconsolidation (3.2 points) and
lower revenues in Japan (1.5 points).
International Markets R&D Expenses
R&D expenses relating to our International Markets segment in the third quarter of 2018 were $21 million, a decrease of 40%
compared to $35 million in the third quarter of 2017.
For a description of our R&D expenses in the third quarter of 2018, see “—Teva Consolidated Results—Research and
Development (R&D) Expenses” below.
International Markets S&M Expenses
S&M expenses relating to our International Markets segment in the third quarter of 2018 were $120 million, a decrease of 24%
compared to $158 million in the third quarter of 2017. The decrease was mainly due to cost reductions and efficiency measures as part
of the restructuring plan.
International Markets G&A Expenses
G&A expenses relating to our International Markets segment in the third quarter of 2018 were $37 million, a decrease of 27%
compared to $51 million in the third quarter of 2017. The decrease was mainly due to cost reductions as part of the restructuring plan.
International Markets Profit
Profit of our International Markets segment consists of gross profit less R&D expenses, S&M expenses, G&A expenses and any
other income related to this segment. Segment profit does not include amortization and certain other items. The data presented for prior
periods have been conformed to reflect the changes to our segment reporting commencing in the first quarter of 2018. See note 17 to
our consolidated financial statements and “—Teva Consolidated Results—Operating Income” below.
Profit from our International Markets segment in the third quarter of 2018 was $123 million, compared to $110 million in the third
quarter of 2017. The increase was mainly due to cost reductions and efficiency measures as part of the restructuring plan.
During the fourth quarter of 2017, we deconsolidated our subsidiaries in Venezuela from our financial results after concluding that
we did not meet the accounting criteria for control over our wholly-owned subsidiaries in Venezuela and that we no longer had
significant influence over such subsidiaries. Consequently, results of operations of our subsidiaries in Venezuela are not included in our
financial results for the third quarter of 2018. We recorded $38 million in revenues and $24 million in operating income in the third
quarter of 2017 with respect to our subsidiaries in Venezuela. We exclude these changes in revenues and operating profit in Venezuela
from any discussion of local currency results.
Other Activities
We have other sources of revenues, primarily the sale of API to third parties and certain contract manufacturing services. Our
other activities are not included in our North America, Europe or International Markets segments described above.
Our revenues from other activities in the third quarter of 2018 increased by 4% to $326 million compared to the third quarter of
2017. In local currency terms, revenues increased by 7%.
API sales to third parties in the third quarter of 2018 were $171 million, flat compared to the third quarter of 2017. In local
currency terms, revenues increased by 1%.
Teva Consolidated Results
Revenues
Revenues in the third quarter of 2018 were $4,529 million, a decrease of 19%, or 18% in local currency terms, compared to the
third quarter of 2017, mainly due to generic competition to COPAXONE, price erosion in our U.S. generics business and loss of
revenues following the divestment of certain products and discontinuation of certain activities. See “—North America Revenues,”
“—Europe Revenues,” “—International Markets Revenues” and “—Other Activities” above.
Exchange rate movements during the third quarter of 2018 negatively impacted revenues by $80 million, compared to the third
quarter of 2017.
55
Gross Profit
Gross profit in the third quarter of 2018 was $2,021 million, a decrease of 24% compared to the third quarter of 2017. The
decrease was mainly a result of the factors discussed above under “—North America Gross Profit,” “—Europe Gross Profit” and
“—International Markets Gross Profit.”
Gross profit as a percentage of revenues was 44.6% in the third quarter of 2018, compared to 47.2% in the third quarter of 2017.
The decrease in gross profit as a percentage of revenues was mainly due to lower profitability in North America resulting from a
decline in COPAXONE revenues due to generic competition and price erosion in our U.S. generics business (4.3 points), the sale of our
women’s health business (1.0 points) and higher accelerated depreciation (0.3 points), partially offset by lower amortization expenses
(1.4 points), higher profitability in Europe (1.1 points) and International Markets (0.6 points).
Research and Development (R&D) Expenses
Net R&D expenses in the third quarter of 2018 were $311 million, a decrease of 41% compared to the third quarter of 2017.
Our R&D activities for generic products in each of our segments include both (i) direct expenses relating to product formulation,
analytical method development, stability testing, management of bioequivalence and other clinical studies and regulatory filings; and
(ii) indirect expenses, such as costs of internal administration, infrastructure and personnel.
Our R&D activities for specialty products in each of our segments include costs of discovery research, preclinical development,
early- and late-clinical development and drug formulation, clinical trials and product registration costs. These expenditures are reported
net of contributions received from collaboration partners. Our spending takes place throughout the development process, including
(i) early-stage projects in both discovery and preclinical phases; (ii) middle-stage projects in clinical programs up to phase 3; (iii) late-
stage projects in phase 3 programs, including where a new drug application is currently pending approval; (iv) life cycle management
and post-approval studies for marketed products; and (v) indirect expenses that support our overall specialty R&D efforts but are not
allocated by product or to specific R&D projects, such as the costs of internal administration, infrastructure and personnel.
In the third quarter of 2018, our R&D expenses were primarily related to generic products in our North America segment, as well
as specialty product candidates in the pain, migraine, headache and respiratory therapeutic areas, with additional activities in selected
other areas.
Our lower R&D expenses in the third quarter of 2018 compared to the third quarter of 2017 primarily resulted from pipeline
optimization and project terminations, phase 3 studies that have ended and related headcount reductions, partially offset by a provision
related to the Regeneron collaboration. See note 3 to our consolidated financial statements.
R&D expenses as a percentage of revenues were 6.9% in the third quarter of 2018, compared to 9.5% in the third quarter of 2017.
Selling and Marketing (S&M) Expenses
S&M expenses in the third quarter of 2018 were $743 million, a decrease of 12% compared to the third quarter of 2017. Our S&M
expenses were primarily the result of the factors discussed above under “—North America Segment— S&M Expenses,” “—Europe
Segment— S&M Expenses” and “—International Markets Segment— S&M Expenses.”
S&M expenses as a percentage of revenues were 16.4% in the third quarter of 2018, compared to 15% in the third quarter of 2017.
General and Administrative (G&A) Expenses
G&A expenses in the third quarter of 2018 were $309 million, a decrease of 17% compared to the third quarter of 2017. Our G&A
expenses were primarily the result of the factors discussed above under “—North America Segment— G&A Expenses,” “—Europe
Segment— G&A Expenses” and “—International Markets Segment— G&A Expenses,” as well as cost reductions in certain corporate
functions as part of the restructuring plan.
G&A expenses as a percentage of revenues were 6.8% in the third quarter of 2018, compared to 6.6% in the third quarter of 2017.
Other Asset Impairments, Restructuring and Other Items
We recorded expenses of $658 million for other asset impairments, restructuring and other items in the third quarter of 2018,
compared to expenses of $550 million in the third quarter of 2017. See note 14 to our consolidated financial statements.
56
In July 2018, the FDA completed an inspection of our manufacturing plant in Davie, Florida in the United States and issued a
Form FDA-483 to the site. In October 2018, the FDA notified us that the inspection of the site is classified as “official action
indicated” (OAI). We are working diligently to investigate the FDA’s observations in a manner consistent with Current Good
Manufacturing Practices (CGMPs) and to address those observations as quickly and as thoroughly as possible. The impact of such
investigation and remediation on the financial statements in the third quarter of 2018 was immaterial. However, if we are unable to
remediate the findings in a timely manner, we may face additional consequences, including delays in FDA approval for future products
from the site, other financial implications due to loss of revenues, impairments, inventory write offs, customer penalties, idle capacity
charges and other costs of remediation.
In July 2018, we announced the voluntary recall of valsartan and certain combination valsartan medicines in various countries due
to the detection of trace amounts of an unexpected impurity in the API provided by a third party supplier, Zhejiang Huahai
Pharmaceutical (“Zhejiang”), used in the production of such medicines. On September 28, 2018, the FDA issued an import ban on all
APIs and other drug products made by Zhejiang in its Chuannan site into the U.S. On the same date, the EU authorities issued to
Zhejiang a statement of non-compliance for the manufacture of valsartan (and its intermediates) for EU medicines in the Chuannan site,
thus prohibiting marketing authorization holders in the EU from using such valsartan materials in the production of finished
products. On October 15, 2018, the EU authorities announced that Zhejiang was under increased supervision with respect to other APIs
produced by Zhejiang. Many regulatory agencies around the world continue to review information relating to valsartan medicines and
the sartan products as a group. The impact of this recall on the financial statements in the first nine months of 2018 was $46 million,
primarily related to recall and inventory reserves. Depending on the scope of regulatory actions, duration of the API outage and severity
of the impurity, we may face additional loss of revenues and profits, customer penalties, impairments and/or other litigation costs.
Restructuring
In the third quarter of 2018, we recorded $88 million of restructuring expenses, compared to $72 million in the third quarter of
2017. The expenses in the third quarter of 2018 were primarily related to headcount reductions across all functions, as part of the
restructuring plan announced in 2017.
The two-year restructuring plan announced in 2017 is intended to reduce our total cost base by $3 billion by the end of 2019.
Since the announcement, we reduced our global headcount by approximately 9,100 full-time-equivalent employees.
Legal Settlements and Loss Contingencies
In the third quarter of 2018, we recorded an expense of $19 million in legal settlements and loss contingencies compared to
income of $20 million in the third quarter of 2017.
Other Income
Other income in the third quarter of 2018 was $35 million, compared to $4 million in the third quarter of 2017. Other income was
primarily the result of the final net asset distribution as part of the PGT dissolution.
Other income as a percentage of revenues was 0.8% in the third quarter of 2018, compared to 0.1% in the third quarter of 2017.
Operating Income
Operating income was $16 million in the third quarter of 2018, compared to $378 million in the third quarter of 2017. The
decrease in operating income was mainly due to lower gross profit and higher impairment charges recorded in the third quarter of 2018.
The following table presents a reconciliation of our segment profits to our consolidated operating income and to consolidated
income (loss) before income taxes for the three months ended September 30, 2018 and 2017:
57

Three months ended
September 30,
2018 2017
(U.S. $ in millions)
North America profit $ 649 $ 1,130
Europe profit 297 241
International Markets profit 123 110
Total segment profit 1,069 1,481
Profit (loss) of other activities 35 (11)
1,104 1,470
Amounts not allocated to segments:
Amortization 297 357
Other asset impairments, restructuring and other items 658 550
Goodwill impairment — —
Gain on divestitures, net of divestitures related costs (31) —
Inventory step-up — —
Other R&D expenses 60 150
Costs related to regulatory actions taken in facilities 1 (1)
Legal settlements and loss contingencies 19 (20)
Other unallocated amounts 84 56
Consolidated operating income (loss) 16 378
Financial expenses, net 229 259
Consolidated income (loss) before income taxes $ (213) $ 119
The decrease in operating margin was 6.4 points, mainly due a decline in gross profit (1.8 points) and higher impairment charges
recorded in the third quarter of 2018 (4.7 points).
During the fourth quarter of 2017, we deconsolidated our subsidiaries in Venezuela from our financial results. Consequently,
results of operations of our subsidiaries in Venezuela are not included in our financial results for the third quarter of 2018.
Financial Expenses, Net
Financial expenses were $229 million in the third quarter of 2018, compared to $259 million in the third quarter of 2017.
Financial expenses in the third quarter of 2018 were mainly comprised of interest expenses of $240 million. Financial expenses in
the third quarter of 2017 were mainly comprised of interest expenses of $219 million and an approximately $30 million impairment of
our net monetary assets in Venezuela.
Tax Rate
In the third quarter of 2018, we recognized a tax benefit of $26 million, or 12%, on pre-tax loss of $213 million. In the third
quarter of 2017, we recognized a tax benefit of $494 million, on pre-tax income of $119 million. Our tax rate for the third quarter of
2018 was mainly affected by the mix of products sold in different geographies.
The statutory Israeli corporate tax rate is 23% in 2018. Our tax rate differs from the Israeli statutory tax rate mainly due to
generation of profits in various jurisdictions in which tax rates are different than the Israeli tax rate, tax benefits in Israel and other
countries, as well as infrequent or nonrecurring items.
Share in Losses of Associated Companies, Net
Share in losses of associated companies, net in the third quarter of 2018 was $10 million, compared to $3 million in the third
quarter of 2017.
Net Income (Loss)
Net loss attributable to Teva was $208 million in the third quarter of 2018, compared to net income of $595 million in the third
quarter of 2017.
58
Net loss attributable to ordinary shareholders was $273 million in the third quarter of 2018, compared to net income of
$530 million in the third quarter of 2017.
Diluted Shares Outstanding and Earnings (Loss) per Share
The weighted average diluted shares outstanding used for the fully diluted share calculation for the three months ended
September 30, 2018 and 2017 were 1,018 million and 1,017 million shares, respectively.
In computing loss per share for the three months ended September 30, 2018, no account was taken of the potential dilution by the
assumed exercise of employee stock options and non-vested RSUs granted under employee stock compensation plans and convertible
senior debentures, since they had an anti-dilutive effect on loss per share.
Additionally, no account was taken of the potential dilution by the mandatory convertible preferred shares, amounting to
66 million shares (including shares that may be issued due to unpaid dividends to date) for the three months ended September 30, 2018
and 59 million shares for the three months ended September 30, 2017, as well as for the convertible senior debentures for the respective
periods, since both had an anti-dilutive effect on loss per share.
Diluted loss per share was $0.27 in the third quarter of 2018, compared to earnings per share of $0.52 in the third quarter of 2017.
Share Count for Market Capitalization
We calculate share amounts using the outstanding number of shares (i.e., excluding treasury shares) plus shares that would be
outstanding upon the exercise of options and vesting of RSUs and performance share units (“PSUs”), as well as the conversion of our
convertible senior debentures and mandatory convertible preferred shares, in each case, at period end.
As of September 30, 2018 and 2017, the fully diluted share count for purposes of calculating our market capitalization was
approximately 1,111 million and 1,083 million, respectively.
Impact of Currency Fluctuations on Results of Operations
In the third quarter of 2018, approximately 51% of our revenues came from sales outside of the United States. Because our results
are reported in U.S. dollars, we are subject to significant foreign currency risks and, accordingly, changes in the exchange rate between
the U.S. dollar and local currencies in the markets in which we operate (primarily the euro, British pound, Japanese yen, Polish zloty,
Argentinean peso, Turkish lira and Russian ruble) impact our results. During the third quarter of 2018, the following main currencies
relevant to our operations decreased in value against the U.S. dollar (each on an annual average compared to annual average basis):
Argentinean peso by 45%, Turkish lira by 37%, Russian ruble by 10%, Hungarian forint by 6%, Canadian dollar by 4%, Israeli shekel
by 2%, Polish zloty by 2%, Swiss franc by 2%, euro by 1%, Japanese yen by 0.5% and British pound by 0.4%.
As a result, exchange rate movements during the third quarter of 2018 negatively impacted overall revenues by $80 million and
our operating income by $34 million, in comparison with the third quarter of 2017.
Commencing in the third quarter of 2018, the cumulative inflation in Argentina exceeded 100% or more over a 3-year period.
Although this triggered highly inflationary accounting treatment, it did not have a material impact on our results of operations.
59
Comparison of Nine Months Ended September 30, 2018 to Nine Months Ended September 30, 2017
The factors used to explain quarterly changes on a year-over-year basis are also generally relevant to a comparison of the results
for the nine months ended September 30, 2018 and 2017. Additional factors affecting the nine months comparison are described below.
The following table sets forth, for the periods indicated, certain financial data derived from our U.S. GAAP financial statements:
Percentage of Net Revenues
Nine months ended
September 30,
Percentage
Change
2018-20172018 2017
% % %
Net revenues 100.0 100.0 (16)
Gross profit 45.0 49.1 (23)
Research and development expenses 6.4 8.4 (36)
Selling and marketing expenses 15.6 16.2 (19)
General and administrative expenses 6.7 6.5 (13)
Other asset impairments, restructuring and other items 14.6 7.1 72
Goodwill impairment 2.1 36 (95)
Legal settlements and loss contingencies (8.7) 1.9 —
Other income (2.3) (0.6) 234
Operating income (loss) 10.7 (26.2) —
Financial expenses, net 5.1 4.1 5
Income (loss) before income taxes 5.5 (30.3) —
Tax benefit (0.4) (2.7) (88)
Share in losses of associated companies, net 0.5 0.1 660
Net income (loss) attributable to non-controlling interests (0.2) 0.1 —
Net income (loss) attributable to Teva 5.1 (27.8) —
Dividends on preferred shares 1.4 1.1 —
Net income (loss) attributable to ordinary shareholders 3.8 (29.0) —
Segment Information
North America Segment
The following table presents revenues, expenses and profit for our North America segment for the nine months ended
September 30, 2018 and 2017:
Nine months ended September 30,
2018 2017
(U.S. $ in millions /% of Segment Revenues)
Revenues $ 7,059 100% $ 9,452 100.0%
Gross profit 3,867 54.8% 5,971 63.2%
R&D expenses 528 7.4% 777 8.2%
S&M expenses 902 12.8% 1,158 12.3%
G&A expenses 357 5.1% 432 4.6%
Other income (206) (2.9%) (82) (0.9%)
Segment profit* $ 2,286 32.4% $ 3,686 39.0%
* Segment profit does not include amortization and certain other items. The data presented for prior periods have been conformed to
reflect the changes to our segment reporting commencing in the first quarter of 2018. See note 17 to our consolidated financial
statements and “—Teva Consolidated Results—Operating Income” below for additional information.
60
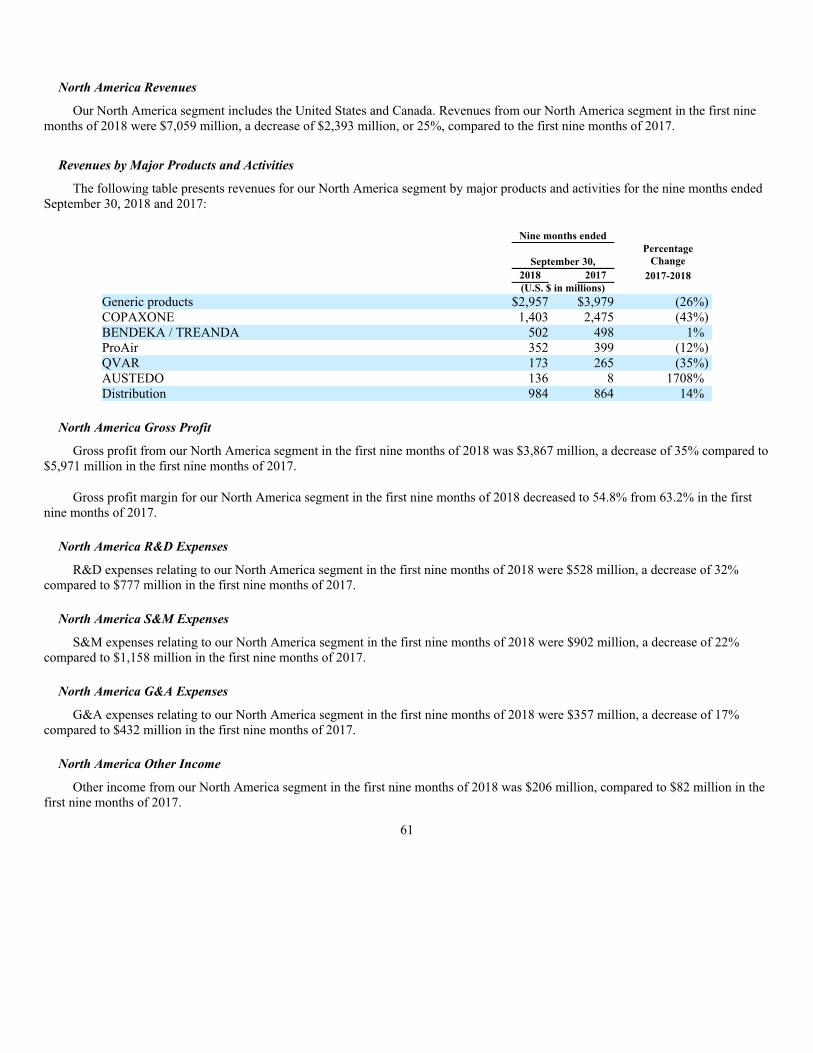
North America Revenues
Our North America segment includes the United States and Canada. Revenues from our North America segment in the first nine
months of 2018 were $7,059 million, a decrease of $2,393 million, or 25%, compared to the first nine months of 2017.
Revenues by Major Products and Activities
The following table presents revenues for our North America segment by major products and activities for the nine months ended
September 30, 2018 and 2017:
Nine months ended
September 30,
Percentage
Change
2018 2017 2017-2018
(U.S. $ in millions)
Generic products $2,957 $3,979 (26%)
COPAXONE 1,403 2,475 (43%)
BENDEKA / TREANDA 502 498 1%
ProAir 352 399 (12%)
QVAR 173 265 (35%)
AUSTEDO 136 8 1708%
Distribution 984 864 14%
North America Gross Profit
Gross profit from our North America segment in the first nine months of 2018 was $3,867 million, a decrease of 35% compared to
$5,971 million in the first nine months of 2017.
Gross profit margin for our North America segment in the first nine months of 2018 decreased to 54.8% from 63.2% in the first
nine months of 2017.
North America R&D Expenses
R&D expenses relating to our North America segment in the first nine months of 2018 were $528 million, a decrease of 32%
compared to $777 million in the first nine months of 2017.
North America S&M Expenses
S&M expenses relating to our North America segment in the first nine months of 2018 were $902 million, a decrease of 22%
compared to $1,158 million in the first nine months of 2017.
North America G&A Expenses
G&A expenses relating to our North America segment in the first nine months of 2018 were $357 million, a decrease of 17%
compared to $432 million in the first nine months of 2017.
North America Other Income
Other income from our North America segment in the first nine months of 2018 was $206 million, compared to $82 million in the
first nine months of 2017.
61
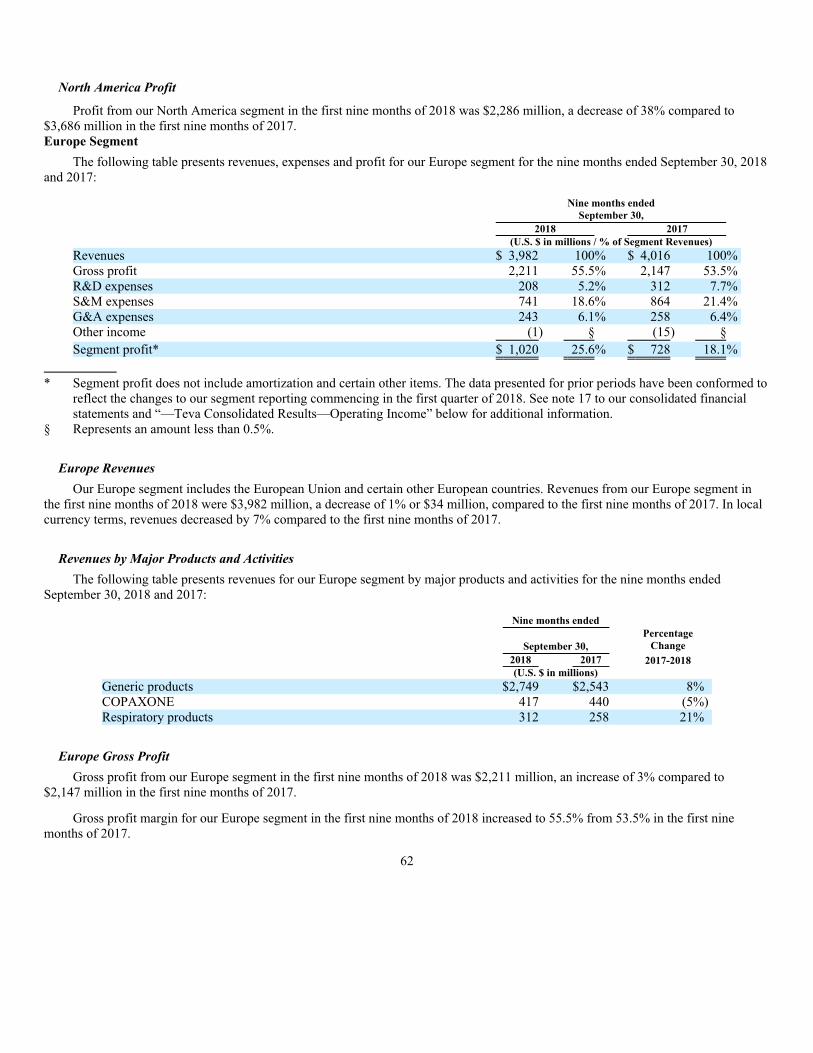
North America Profit
Profit from our North America segment in the first nine months of 2018 was $2,286 million, a decrease of 38% compared to
$3,686 million in the first nine months of 2017.
Europe Segment
The following table presents revenues, expenses and profit for our Europe segment for the nine months ended September 30, 2018
and 2017:
Nine months ended
September 30,
2018 2017
(U.S. $ in millions / % of Segment Revenues)
Revenues $ 3,982 100% $ 4,016 100%
Gross profit 2,211 55.5% 2,147 53.5%
R&D expenses 208 5.2% 312 7.7%
S&M expenses 741 18.6% 864 21.4%
G&A expenses 243 6.1% 258 6.4%
Other income (1) § (15) §
Segment profit* $ 1,020 25.6% $ 728 18.1%
* Segment profit does not include amortization and certain other items. The data presented for prior periods have been conformed to
reflect the changes to our segment reporting commencing in the first quarter of 2018. See note 17 to our consolidated financial
statements and “—Teva Consolidated Results—Operating Income” below for additional information.
§ Represents an amount less than 0.5%.
Europe Revenues
Our Europe segment includes the European Union and certain other European countries. Revenues from our Europe segment in
the first nine months of 2018 were $3,982 million, a decrease of 1% or $34 million, compared to the first nine months of 2017. In local
currency terms, revenues decreased by 7% compared to the first nine months of 2017.
Revenues by Major Products and Activities
The following table presents revenues for our Europe segment by major products and activities for the nine months ended
September 30, 2018 and 2017:
Nine months ended
September 30,
Percentage
Change
2018 2017 2017-2018
(U.S. $ in millions)
Generic products $2,749 $2,543 8%
COPAXONE 417 440 (5%)
Respiratory products 312 258 21%
Europe Gross Profit
Gross profit from our Europe segment in the first nine months of 2018 was $2,211 million, an increase of 3% compared to
$2,147 million in the first nine months of 2017.
Gross profit margin for our Europe segment in the first nine months of 2018 increased to 55.5% from 53.5% in the first nine
months of 2017.
62
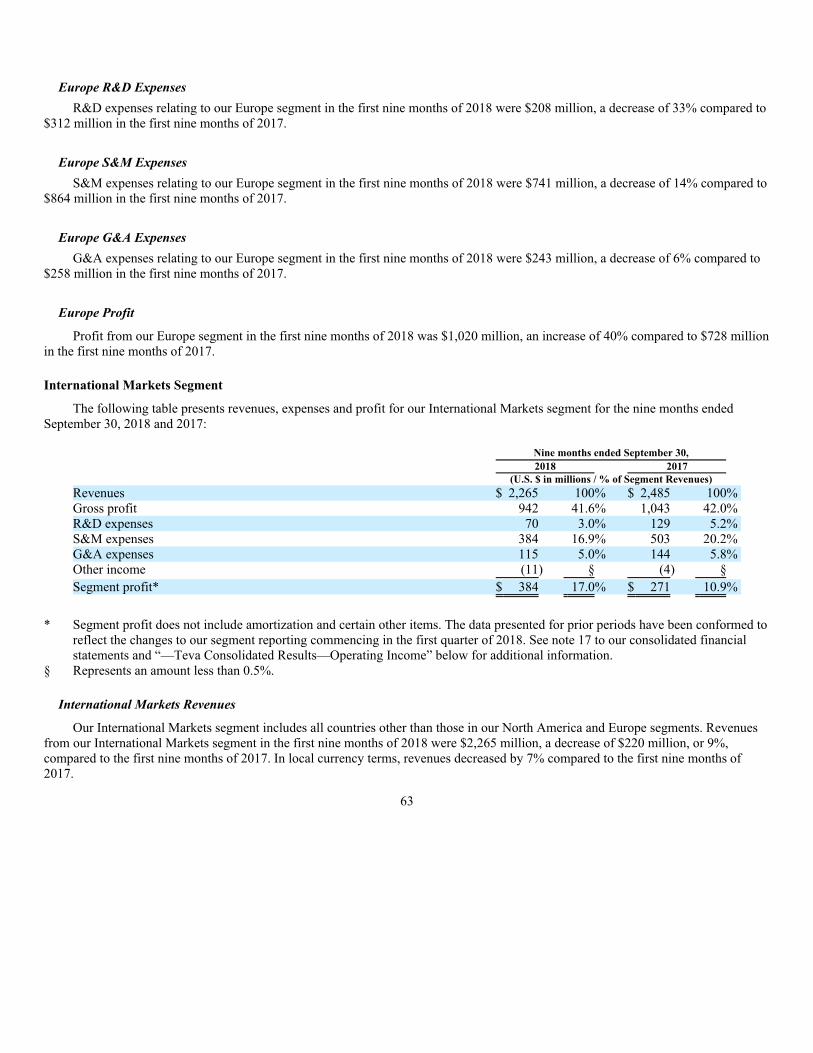
Europe R&D Expenses
R&D expenses relating to our Europe segment in the first nine months of 2018 were $208 million, a decrease of 33% compared to
$312 million in the first nine months of 2017.
Europe S&M Expenses
S&M expenses relating to our Europe segment in the first nine months of 2018 were $741 million, a decrease of 14% compared to
$864 million in the first nine months of 2017.
Europe G&A Expenses
G&A expenses relating to our Europe segment in the first nine months of 2018 were $243 million, a decrease of 6% compared to
$258 million in the first nine months of 2017.
Europe Profit
Profit from our Europe segment in the first nine months of 2018 was $1,020 million, an increase of 40% compared to $728 million
in the first nine months of 2017.
International Markets Segment
The following table presents revenues, expenses and profit for our International Markets segment for the nine months ended
September 30, 2018 and 2017:
Nine months ended September 30,
2018 2017
(U.S. $ in millions / % of Segment Revenues)
Revenues $ 2,265 100% $ 2,485 100%
Gross profit 942 41.6% 1,043 42.0%
R&D expenses 70 3.0% 129 5.2%
S&M expenses 384 16.9% 503 20.2%
G&A expenses 115 5.0% 144 5.8%
Other income (11) § (4) §
Segment profit* $ 384 17.0% $ 271 10.9%
* Segment profit does not include amortization and certain other items. The data presented for prior periods have been conformed to
reflect the changes to our segment reporting commencing in the first quarter of 2018. See note 17 to our consolidated financial
statements and “—Teva Consolidated Results—Operating Income” below for additional information.
§ Represents an amount less than 0.5%.
International Markets Revenues
Our International Markets segment includes all countries other than those in our North America and Europe segments. Revenues
from our International Markets segment in the first nine months of 2018 were $2,265 million, a decrease of $220 million, or 9%,
compared to the first nine months of 2017. In local currency terms, revenues decreased by 7% compared to the first nine months of
2017.
63
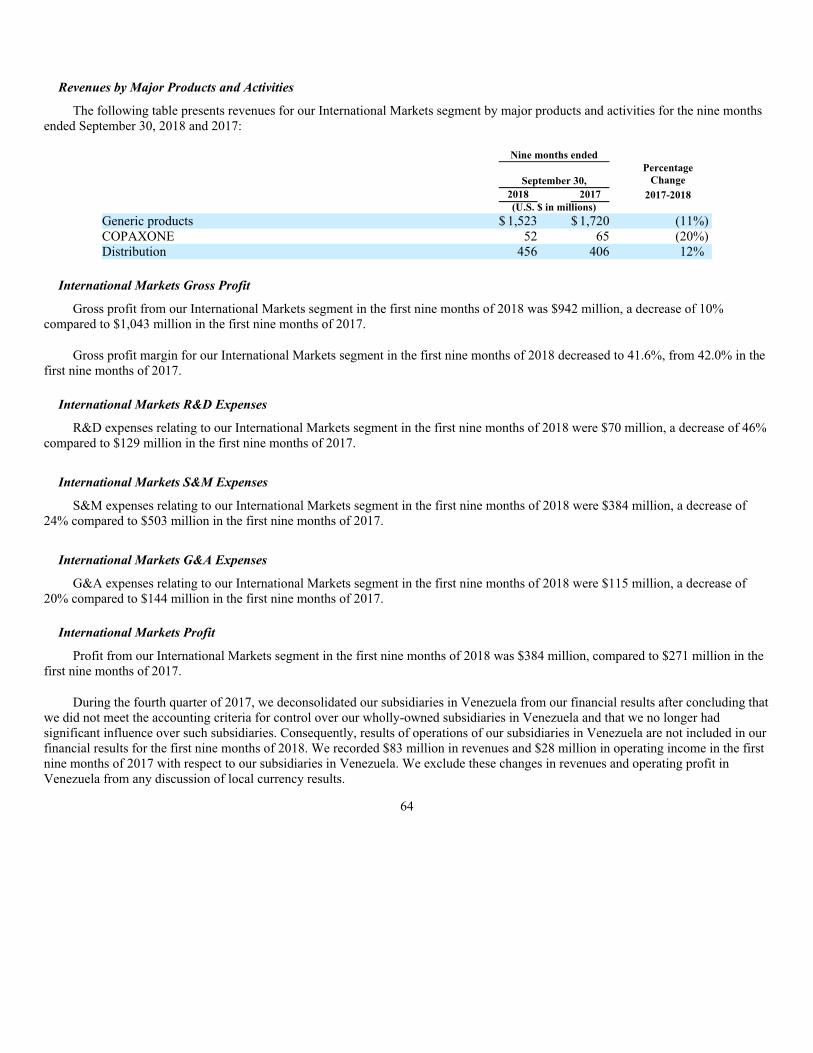
Revenues by Major Products and Activities
The following table presents revenues for our International Markets segment by major products and activities for the nine months
ended September 30, 2018 and 2017:
Nine months ended
September 30,
Percentage
Change
2018 2017 2017-2018
(U.S. $ in millions)
Generic products $ 1,523 $ 1,720 (11%)
COPAXONE 52 65 (20%)
Distribution 456 406 12%
International Markets Gross Profit
Gross profit from our International Markets segment in the first nine months of 2018 was $942 million, a decrease of 10%
compared to $1,043 million in the first nine months of 2017.
Gross profit margin for our International Markets segment in the first nine months of 2018 decreased to 41.6%, from 42.0% in the
first nine months of 2017.
International Markets R&D Expenses
R&D expenses relating to our International Markets segment in the first nine months of 2018 were $70 million, a decrease of 46%
compared to $129 million in the first nine months of 2017.
International Markets S&M Expenses
S&M expenses relating to our International Markets segment in the first nine months of 2018 were $384 million, a decrease of
24% compared to $503 million in the first nine months of 2017.
International Markets G&A Expenses
G&A expenses relating to our International Markets segment in the first nine months of 2018 were $115 million, a decrease of
20% compared to $144 million in the first nine months of 2017.
International Markets Profit
Profit from our International Markets segment in the first nine months of 2018 was $384 million, compared to $271 million in the
first nine months of 2017.
During the fourth quarter of 2017, we deconsolidated our subsidiaries in Venezuela from our financial results after concluding that
we did not meet the accounting criteria for control over our wholly-owned subsidiaries in Venezuela and that we no longer had
significant influence over such subsidiaries. Consequently, results of operations of our subsidiaries in Venezuela are not included in our
financial results for the first nine months of 2018. We recorded $83 million in revenues and $28 million in operating income in the first
nine months of 2017 with respect to our subsidiaries in Venezuela. We exclude these changes in revenues and operating profit in
Venezuela from any discussion of local currency results.
64
Other Activities
Our revenues from other activities in the first nine months of 2018 decreased by 4% to $989 million. In local currency terms,
revenues decreased by 6%.
API sales to third parties in the first nine months of 2018 decreased by 6% to $537 million. In local currency terms, revenues
decreased by 7%.
Teva Consolidated Results
Revenues
Revenues in the first nine months of 2018 were $14,295 million, a decrease of 16%, or 17% in local currency terms, compared to
the first nine months of 2017.
Exchange rate movements during the first nine months of 2018 compared to the first nine months of 2017 positively impacted
revenues by $253 million.
Gross Profit
Gross profit in the first nine months of 2018 was $6,430 million, a decrease of $1,914 million, compared to the first nine months
of 2017.
Gross profit as a percentage of revenues was 45.0% in the first nine months of 2018, compared to 49.1% in the first nine months
of 2017.
Research and Development (R&D) Expenses
Net R&D expenses in the first nine months of 2018 were $918 million, a decrease of 36% compared to the first nine months of
2017.
R&D expenses as a percentage of revenues were 6.4% in the first nine months of 2018, compared to 8.4% in the first nine months
of 2017.
Selling and Marketing (S&M) Expenses
S&M expenses in the first nine months of 2018 were $2,224 million, a decrease of 19% compared to the first nine months of 2017.
S&M expenses as a percentage of revenues were 15.6% in the first nine months of 2018, compared to 16.2% in the first nine
months of 2017.
General and Administrative (G&A) Expenses
G&A expenses in the first nine months of 2018 were $954 million, a decrease of 13% compared to the first nine months of 2017.
G&A expenses as a percentage of revenues were 6.7% in the first nine months of 2018, compared to 6.5% in the first nine months
of 2017.
Other Asset Impairments, Restructuring and Other Items
We recorded expenses of $2,080 million for other asset impairments, restructuring and other items in the first nine months of
2018, compared to expenses of $1,209 million in the first nine months of 2017. See note 14 to our consolidated financial statements.
65
Goodwill Impairment
In the first nine months of 2018, we recorded goodwill impairments of $300 million compared to a $6.1 billion goodwill
impairment charge recorded in the first nine months of 2017. See note 7 to our consolidated financial statements.
Legal Settlements and Loss Contingencies
In the first nine months of 2018, we recorded income of $1,239 million, compared to an expense of $324 million in the first nine
months of 2017. The income in the first nine months of 2018 consisted primarily of the working capital adjustment settlement with
Allergan, the Rimsa settlement and reversal of the reserve recorded in the second quarter of 2017 with respect to the carvedilol patent
litigation, following reversal of the verdict in GSK’s favor (see note 15 to our consolidated financial statements).
Other Income
Other income in the first nine months of 2018 was $334 million, compared to $100 million in the first nine months of 2017.
Other income as a percentage of revenues was 2.3% in the first nine months of 2018, compared to 0.6% in the first nine months of
2017.
Operating Income (Loss)
Operating income was $1,527 million in the first nine months of 2018, compared to a loss of $4,467 million in the first nine
months of 2017.
The following table presents a reconciliation of our segment profits to our consolidated operating income (loss) and to
consolidated income (loss) before income taxes for the nine months ended September 30, 2018 and 2017:
Nine months ended
September 30,
2018 2017
(U.S. $ in millions)
North America profit $ 2,286 $ 3,686
Europe profit 1,020 728
International Markets profit 384 271
Total segment profit 3,690 4,685
Profit of other activities 87 3
3,777 4,688
Amounts not allocated to segments:
Amortization 909 1,088
Other asset impairments, restructuring and other items 2,080 1,209
Goodwill impairment 300 6,100
Gain on divestitures, net of divestitures related costs (114) —
Inventory step-up — 67
Other R&D expenses 82 176
Costs related to regulatory actions taken in facilities 6 48
Legal settlements and loss contingencies (1,239) 324
Other unallocated amounts 226 143
Consolidated operating income (loss) 1,527 (4,467)
Financial expenses, net 736 704
Consolidated income (loss) before income taxes $ 791 $(5,171)
66
Financial Expenses, Net
Financial expenses were $736 million in the first nine months of 2018, compared to $704 million in the first nine months of 2017.
Financial expenses in the first nine months of 2018 were mainly comprised of interest expenses of $689 million and $60 million of
early redemption charges and accelerated amortization related to the repayment of senior notes and term loans in the first quarter of
2018. Financial expenses in the first nine months of 2017 were mainly comprised of interest expenses of $654 million and $61 million
loss from net foreign exchange fluctuations and financial derivatives.
Tax Rate
In the first nine months of 2018, we recognized a tax benefit of $56 million, on pre-tax income of $791 million. In the first nine
months of 2017, we recognized a tax benefit of $462 million, on pre-tax loss of $5,171 million. Our tax rate for the first nine months of
2018 was mainly affected by one-time legal settlements and divestments with a low corresponding tax effect as well as the mix of
products sold in different geographies.
Share in Losses of Associated Companies, Net
Share in losses of associated companies, net in the first nine months of 2018 was $76 million, compared to share in losses of
$10 million in the first nine months of 2017.
Net Income (Loss)
Net income attributable to Teva was $736 million in the first nine months of 2018, compared to net loss of $4,730 million in the
first nine months of 2017.
Net income attributable to ordinary shareholders was $541 million in the first nine months of 2018, compared to net loss of
$4,925 million in the first nine months of 2017.
Diluted Shares Outstanding and Earnings (Loss) per Share
The weighted average diluted shares outstanding used for the fully diluted share calculation for the nine months ended
September 30, 2018 and 2017 were 1,020 million and 1,016 million shares, respectively.
Diluted earnings per share for the nine months ended September 30, 2018, take into account the potential dilution that could occur
upon the exercise of options and non-vested RSUs granted under employee stock compensation plans, using the treasury stock method.
In computing loss per share for the nine months ended September 30, 2017, no account was taken of the potential dilution by the
assumed exercise of employee stock options and non-vested RSUs granted under employee stock compensation plans, and convertible
senior debentures, since they had an anti-dilutive effect on loss per share.
Additionally, no account was taken of the potential dilution by the mandatory convertible preferred shares, amounting to
68 million shares (including shares that may be issued due to unpaid dividends to date) for the nine months ended September 30, 2018
and 59 million shares for the nine months ended September 30, 2017, as well as for the convertible senior debentures for the respective
periods, since both had an anti-dilutive effect on earnings (loss) per share.
Diluted earnings per share were $0.53 in the first nine months of 2018, compared to a loss per share of $4.85 in the first nine
months of 2017.
67
Impact of Currency Fluctuations on Results of Operations
In the first nine months of 2018, approximately 52% of our revenues came from sales outside of the United States. Because our
results are reported in U.S. dollars, we are subject to significant foreign currency risks and, accordingly, changes in the exchange rate
between the U.S. dollar and local currencies in the markets in which we operate (primarily the euro, British pound, Japanese yen, Polish
zloty, Argentinean peso, Turkish lira and Russian ruble) impact our results. During the first nine months of 2018, the following main
currencies relevant to our operations decreased in value against the U.S. dollar: Argentinean peso by 35%, Turkish lira by 22% and
Russian ruble by 5% (compared on a nine-monthly average basis). During the first nine months of 2018, the following main currencies
relevant to our operations increased in value against the U.S. dollar: Polish zloty by 8%, euro by 7%, British pound by 6%, Hungarian
forint by 4%, new Israeli shekel by 2% and Japanese yen by 2% (all compared on a nine-monthly average basis).
As a result, exchange rate movements during the first nine months of 2018 positively impacted overall revenues by $253 million
and increased our operating income by $17 million, in comparison to the first nine months of 2017.
Liquidity and Capital Resources
Total balance sheet assets were $65,061 million as of September 30, 2018, compared to $67,030 million as of June 30, 2018.
Our working capital balance, which includes trade receivables net of SR&A, inventories, prepaid expenses and other current
assets, trade payables, employee-related obligations, accrued expenses and other current liabilities, was negative $232 million as of
September 30, 2018, compared to negative $121 million as of June 30, 2018.
Investment in property, plant and equipment in the third quarter of 2018 was approximately $139 million, compared to
$136 million in the second quarter of 2018. Depreciation was $171 million in each of the third quarter and second quarter of 2018.
Cash and cash equivalents and short-term and long-term investments as of September 30, 2018 were $1,948 million, compared to
$1,942 million as of June 30, 2018, mainly due to utilization of total cash generated for debt repayment.
Our cash on hand that is not used for ongoing operations is generally invested in bank deposits as well as liquid securities that bear
fixed and floating rates.
Our principal sources of short-term liquidity are our existing cash investments, liquid securities and available credit facilities,
primarily our $3 billion syndicated revolving line of credit, which was not utilized as of September 30, 2018, as well as internally
generated funds, which we believe are sufficient to meet our financial obligations in the ordinary course of business for at least twelve
months.
Debt Balance and Movements
As of September 30, 2018, our debt was $29,489 million, compared to $30,237 million as of June 30, 2018. The decrease was
mainly due to the $405 million debt tender offer completed in September 2018 as well as repayment at maturity of our CHF 300 million
0.13% senior note.
In January 2018, we prepaid in full $15 million of our U.S. dollar debentures.
During the first quarter of 2018, we prepaid in full $2.3 billion of our 3-year and 5-year U.S. dollar term loans, as well as JPY
156.8 billion of our term loans.
In March 2018, we completed debt issuances for an aggregate principal amount of $4.4 billion, consisting of senior notes with
aggregate principal amounts of $2.5 billion and EUR 1.6 billion with maturities ranging from four to ten years. The effective average
interest rate of the notes issued is 5.3% per annum. See note 11 to our consolidated financial statements.
68
In March 2018, we redeemed in full our $1.5 billion 1.4% senior notes due in July 2018 and our Euro 1.0 billion 2.875% senior
notes due in April 2019.
In July 2018, we repaid at maturity our CHF 300 million 0.13% senior notes.
In September 2018, we completed a debt tender offer which resulted in a decrease of $405 million, comprised of:
• $300 million of our $2.0 billion 1.7% senior notes due in July 2019
• EUR 90 million of our EUR 1.75 billion 0.38% senior notes due in July 2020
In October 2018, we repaid at maturity our CHF 450 million 1.5% senior notes.
Our debt as of September 30, 2018 was effectively denominated in the following currencies: 65% in U.S. dollars, 31% in euros
and 4% in Swiss francs.
The portion of total debt classified as short-term as of September 30, 2018 was 9%, compared to 4% as of June 30, 2018, due to a
net increase in current maturities.
Our financial leverage was 61% as of September 30, 2018, the same as of June 30, 2018.
Our average debt maturity was approximately 6.9 years as of September 30, 2018, compared to 7.0 years as of June 30, 2018.
Total Equity
Total equity was $19,134 million as of September 30, 2018, compared to $19,368 million as of June 30, 2018. The decrease was
mainly due to a net loss of $197 million for the three months ended September 30, 2018 and a negative impact of $105 million due to
currency devaluations against the U.S. dollar, partially offset by an increase of $44 million in stock based compensation expenses and
$19 million in unrealized gain associated with hedging activities.
Exchange rate fluctuations affected our balance sheet, as approximately 53% of our net assets in the third quarter of 2018
(including both non-monetary and monetary assets) were in currencies other than the U.S. dollar. When compared to June 30, 2018,
changes in currency rates had a negative impact of $105 million on our equity as of September 30, 2018, mainly due to the changes in
value against the U.S. dollar of: the Japanese yen by 1%, the Indian rupee by 14%, the Turkish lira by 60%, the Russian ruble by 14%
and the Argentinean peso by 122%. All comparisons are on a quarter-end to quarter-end basis.
Cash Flow
Cash flow generated from operating activities during the third quarter of 2018 was $421 million, compared to $795 million in the
third quarter of 2017. The decrease was mainly due to lower net income and higher payments related to restructuring liabilities during
the third quarter of 2018.
Cash flow generated from operating activities in the third quarter of 2018, net of cash used for capital investments and beneficial
interest collected in exchange for securitized trade receivables, was $704 million, compared to $920 million in the third quarter of 2017.
The decrease in cash flow generated from operating activities net of cash used for capital investments and beneficial interest
collected in exchange for securitized trade receivables is lower compared to the decrease in cash flow generated from operating
activities, mainly due to lower capital expenditures.
Dividends
In December 2017, we announced an immediate suspension of dividends on our ordinary shares and ADSs and that dividends on
our mandatory convertible preferred shares will be evaluated on a quarterly basis per current practice.
69

We have suspended cash dividends on our mandatory convertible preferred shares in the third quarter of 2018 due to our
accumulated deficit.
Commitments
In addition to financing obligations under short-term debt and long-term senior notes and loans, debentures and convertible
debentures, our major contractual obligations and commercial commitments include leases, royalty payments, contingent payments
pursuant to acquisition agreements and participation in joint ventures associated with R&D activities.
In September 2016, we entered into an agreement to develop and commercialize Regeneron’s pain medication product, fasinumab.
We paid Regeneron $250 million upfront and will share equally with Regeneron in the global commercial benefits of this product, as
well as ongoing associated R&D costs of approximately $1.0 billion. Milestone payments of $25 million and $35 million were paid in
the second quarter of 2017 and the first quarter of 2018, respectively, and a provision of $60 million was recorded in the third quarter of
2018.
In October 2016, we entered into an exclusive partnership with Celltrion to commercialize two of Celltrion’s biosimilar products
in development for the U.S. and Canadian markets. We paid Celltrion $160 million, of which up to $60 million is refundable or
creditable under certain circumstances. We will share the profit from the commercialization of these products with Celltrion.
In September 2017, we entered into a partnership agreement with Nuvelution for development of AUSTEDO for the treatment of
Tourette syndrome in pediatric patients in the United States. Nuvelution will fund and manage clinical development, driving all
operational aspects of the phase 3 program, and we will lead the regulatory process and be responsible for commercialization. Upon and
subject to FDA approval of AUSTEDO for Tourette syndrome, we will pay Nuvelution a pre-agreed return.
Dividends on our mandatory convertible preferred shares (aggregate liquidation preference of approximately $3.7 billion) are
payable on a cumulative basis when, as and if declared by our Board of Directors at an annual rate of 7% on the liquidation preference
of $1,000 per mandatory convertible preferred share. Declared dividends are paid in cash on March 15, June 15, September 15 and
December 15 of each year to and including December 15, 2018. We have suspended cash dividend payments on our mandatory
convertible preferred shares.
We are committed to pay royalties to owners of know-how, partners in alliances and certain other arrangements, and to parties that
financed R&D at a wide range of rates as a percentage of sales of certain products, as defined in the agreements. In some cases, the
royalty period is not defined; in other cases, royalties will be paid over various periods not exceeding 20 years.
In connection with certain development, supply and marketing, and research and collaboration or services agreements, we are
required to indemnify, in unspecified amounts, the parties to such agreements against third-party claims relating to (i) infringement or
violation of intellectual property or other rights of such third party; or (ii) damages to users of the related products. Except as described
in our financial statements, we are not aware of any material pending action that may result in the counterparties to these agreements
claiming such indemnification.
Our principal sources of short-term liquidity are our existing cash investments, liquid securities and available credit facilities,
primarily our $3 billion syndicated revolving credit facility (“RCF”), which was not utilized as of September 30, 2018, as well as
internally generated funds.
Pursuant to the requirements of the RCF, we have entered into negative pledge agreements with certain banks and institutional
investors. Under the agreements, we and certain subsidiaries have undertaken not to register floating charges on assets in favor of any
third parties without the prior consent of the banks, to maintain certain financial ratios, including the requirement to maintain
compliance with a net debt to EBITDA ratio, which becomes more restrictive over time, and to fulfill other restrictions, as stipulated by
the agreements. As of September 30, 2018, we did not have any outstanding debt under the RCF, which is our only debt subject to the
net debt to EBITDA covenant. Assuming utilization of the RCF and under specified circumstances, including non-compliance with
such covenants and the unavailability of any waiver, amendment or other modification thereto and the expiration of any applicable
grace period thereto, substantially all of our other debt could be negatively impacted by non-compliance with such covenants. We have
sufficient resources to meet our financial obligations in the ordinary course of business for at least twelve months from the date of the
release of this Quarterly Report.
70
2018 Aggregated Contractual Obligations
There have not been any material changes in our assessment of material contractual obligations and commitments as set forth in
our Quarterly Report on Form 10-Q for the period ended March 31, 2018 and in Item 7 of our Annual Report on Form 10-K for the year
ended December 31, 2017, other than as set forth below. These changes are the result of debt movements during the third quarter of
2018, as described under “—2018 Debt Balance and Movements” above.
In the third quarter of 2018, we completed a debt tender offer which resulted in a decrease of $405 million to our debt. As of
September 30, 2018, our debt was $29,489 million. See note 11 to our consolidated financial statements.
Supplemental Non-GAAP Income Data
We utilize certain non-GAAP financial measures to evaluate performance, in conjunction with other performance metrics. The
data presented in the tables below are the results used by management and our board of directors to evaluate our operational
performance, to compare against work plans and budgets, and ultimately to evaluate the performance of management. For example,
each year we prepare a detailed work plan for the next fiscal year. This work plan is used to manage the business and to measure the
performance of management. All such plans are prepared on a basis comparable to the presentation below, without taking into account
those elements that are excluded from our non-GAAP financial measures. In addition, when management presents financial updates to
the board of directors at its quarterly meetings, presentations are made comparing the current fiscal quarterly results against: (i) the
comparable quarter of the prior year, (ii) the immediately preceding fiscal quarter and (iii) the work plan. Such presentations are based
on the non-GAAP financial measures reflected in the tables below. Moreover, while there are always qualitative factors and elements of
judgment involved in the granting of annual cash bonuses, the principal quantitative element in the determination of such bonuses is
performance targets tied to our work plan, which are based on the same non-GAAP financial measures set forth below.
The data presented below are non-GAAP financial measures and should not be considered replacements for GAAP results. We
provide such non-GAAP data because management believes that it provides useful information to investors. However, investors are
cautioned that non-GAAP financial measures may not be comparable with the calculation of similar measures for other companies,
unlike financial measures prepared in accordance with GAAP. These non-GAAP financial measures are presented solely to permit
investors to better understand how management assesses our performance. The limitations of using these non-GAAP financial measures
as performance measures are that they provide a view of our results of operations without including all events during a period, such as
the effects of mergers and acquisitions, related restructuring and other charges, and may not provide a comparable view of our
performance to other companies in the pharmaceutical industry.
In determining our non-GAAP financial measures, we have excluded items in the past, and would expect to continue to exclude
items in the future, that either have a non-recurring impact on the income statement or which, in the judgment of our management, are
items that, either as a result of their nature or size, could, were they not singled out, potentially cause investors to extrapolate future
performance from an improper base. While not all inclusive, examples of these items include:
• acquisition or divestment related items, including changes in contingent consideration, integration costs, banker and other
professional fees, inventory step-up and in-process R&D acquired in development arrangements;
• amortization of purchased intangible assets;
• restructuring expenses, including severance, retention costs, contract cancellation costs and certain accelerated depreciation
expenses primarily related to the rationalization of our plants, or to certain other strategic activities such as the realignment
of R&D focus or other similar activities;
• significant one-time financing costs and devaluation losses;
• expenses related to our equity compensation;
• costs related to significant regulatory actions taken at our facilities (such as uncapitalized production costs, consulting
expenses or write-offs of inventory related to remediation);
• legal settlements and/or loss contingencies, due to the difficulty in predicting their timing and amounts;
• impairments of long-lived assets, including intangibles, property, plant and equipment and goodwill;
• deconsolidation charges;
71
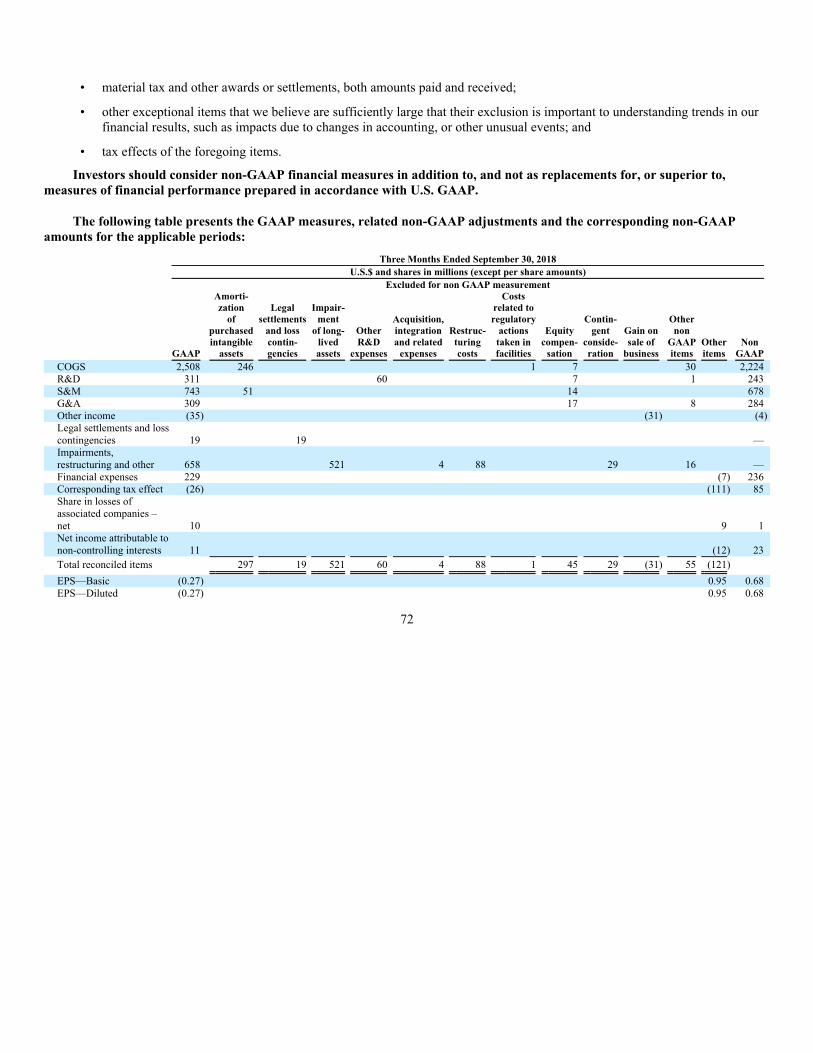
• material tax and other awards or settlements, both amounts paid and received;
• other exceptional items that we believe are sufficiently large that their exclusion is important to understanding trends in our
financial results, such as impacts due to changes in accounting, or other unusual events; and
• tax effects of the foregoing items.
Investors should consider non-GAAP financial measures in addition to, and not as replacements for, or superior to,
measures of financial performance prepared in accordance with U.S. GAAP.
The following table presents the GAAP measures, related non-GAAP adjustments and the corresponding non-GAAP
amounts for the applicable periods:
Three Months Ended September 30, 2018
U.S.$ and shares in millions (except per share amounts)
Excluded for non GAAP measurement
GAAP
Amorti-
zation
of
purchased
intangible
assets
Legal
settlements
and loss
contin-
gencies
Impair-
ment
of long-
lived
assets
Other
R&D
expenses
Acquisition,
integration
and related
expenses
Restruc-
turing
costs
Costs
related to
regulatory
actions
taken in
facilities
Equity
compen-
sation
Contin-
gent
conside-
ration
Gain on
sale of
business
Other
non
GAAP
items
Other
items
Non
GAAP
COGS 2,508 246 1 7 30 2,224
R&D 311 60 7 1 243
S&M 743 51 14 678
G&A 309 17 8 284
Other income (35) (31) (4)
Legal settlements and loss
contingencies 19 19 —
Impairments,
restructuring and other 658 521 4 88 29 16 —
Financial expenses 229 (7) 236
Corresponding tax effect (26) (111) 85
Share in losses of
associated companies –
net 10 9 1
Net income attributable to
non-controlling interests 11 (12) 23
Total reconciled items 297 19 521 60 4 88 1 45 29 (31) 55 (121)
EPS—Basic (0.27) 0.95 0.68
EPS—Diluted (0.27) 0.95 0.68
72
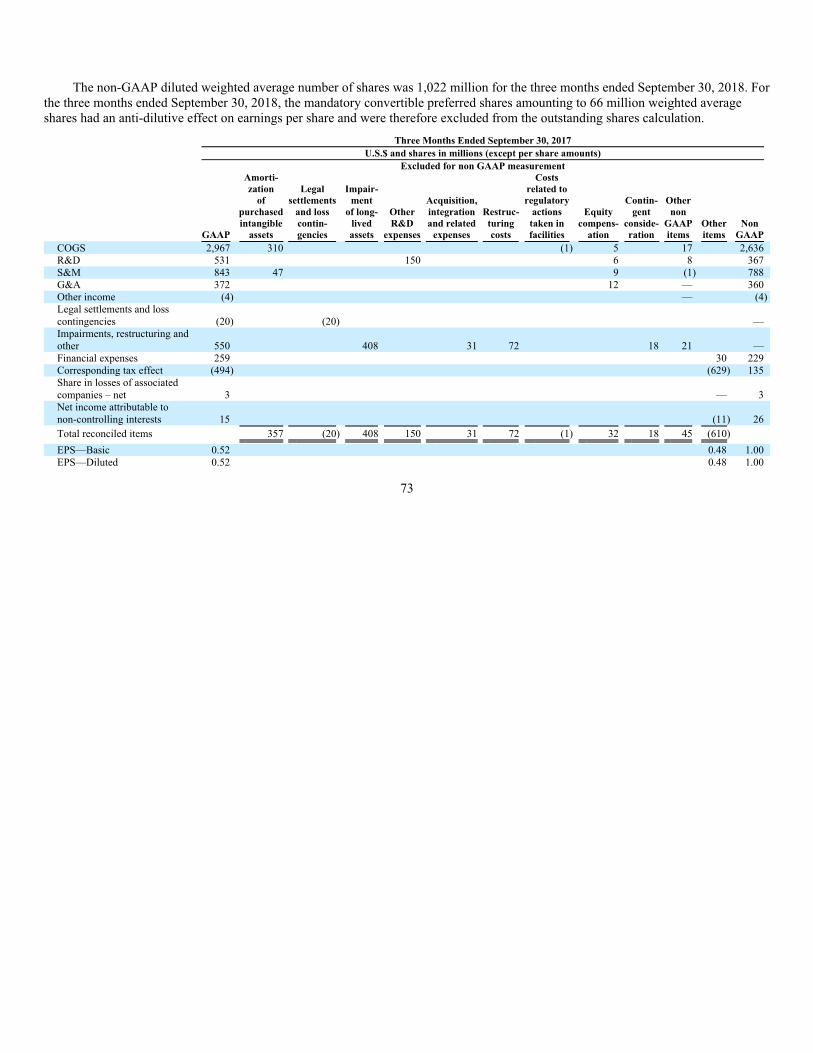
The non-GAAP diluted weighted average number of shares was 1,022 million for the three months ended September 30, 2018. For
the three months ended September 30, 2018, the mandatory convertible preferred shares amounting to 66 million weighted average
shares had an anti-dilutive effect on earnings per share and were therefore excluded from the outstanding shares calculation.
Three Months Ended September 30, 2017
U.S.$ and shares in millions (except per share amounts)
Excluded for non GAAP measurement
GAAP
Amorti-
zation
of
purchased
intangible
assets
Legal
settlements
and loss
contin-
gencies
Impair-
ment
of long-
lived
assets
Other
R&D
expenses
Acquisition,
integration
and related
expenses
Restruc-
turing
costs
Costs
related to
regulatory
actions
taken in
facilities
Equity
compens-
ation
Contin-
gent
conside-
ration
Other
non
GAAP
items
Other
items
Non
GAAP
COGS 2,967 310 (1) 5 17 2,636
R&D 531 150 6 8 367
S&M 843 47 9 (1) 788
G&A 372 12 — 360
Other income (4) — (4)
Legal settlements and loss
contingencies (20) (20) —
Impairments, restructuring and
other 550 408 31 72 18 21 —
Financial expenses 259 30 229
Corresponding tax effect (494) (629) 135
Share in losses of associated
companies – net 3 — 3
Net income attributable to
non-controlling interests 15 (11) 26
Total reconciled items 357 (20) 408 150 31 72 (1) 32 18 45 (610)
EPS—Basic 0.52 0.48 1.00
EPS—Diluted 0.52 0.48 1.00
73
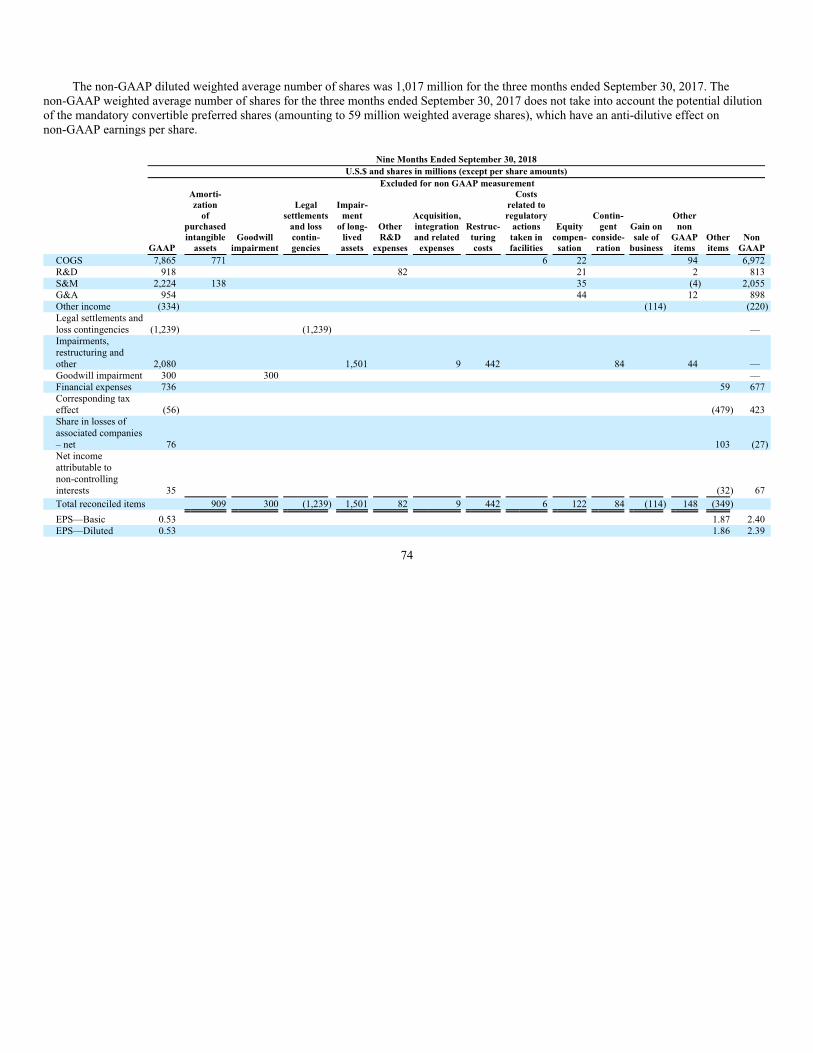
The non-GAAP diluted weighted average number of shares was 1,017 million for the three months ended September 30, 2017. The
non-GAAP weighted average number of shares for the three months ended September 30, 2017 does not take into account the potential dilution
of the mandatory convertible preferred shares (amounting to 59 million weighted average shares), which have an anti-dilutive effect on
non-GAAP earnings per share.
Nine Months Ended September 30, 2018
U.S.$ and shares in millions (except per share amounts)
Excluded for non GAAP measurement
GAAP
Amorti-
zation
of
purchased
intangible
assets
Goodwill
impairment
Legal
settlements
and loss
contin-
gencies
Impair-
ment
of long-
lived
assets
Other
R&D
expenses
Acquisition,
integration
and related
expenses
Restruc-
turing
costs
Costs
related to
regulatory
actions
taken in
facilities
Equity
compen-
sation
Contin-
gent
conside-
ration
Gain on
sale of
business
Other
non
GAAP
items
Other
items
Non
GAAP
COGS 7,865 771 6 22 94 6,972
R&D 918 82 21 2 813
S&M 2,224 138 35 (4) 2,055
G&A 954 44 12 898
Other income (334) (114) (220)
Legal settlements and
loss contingencies (1,239) (1,239) —
Impairments,
restructuring and
other 2,080 1,501 9 442 84 44 —
Goodwill impairment 300 300 —
Financial expenses 736 59 677
Corresponding tax
effect (56) (479) 423
Share in losses of
associated companies
– net 76 103 (27)
Net income
attributable to
non-controlling
interests 35 (32) 67
Total reconciled items 909 300 (1,239) 1,501 82 9 442 6 122 84 (114) 148 (349)
EPS—Basic 0.53 1.87 2.40
EPS—Diluted 0.53 1.86 2.39
74
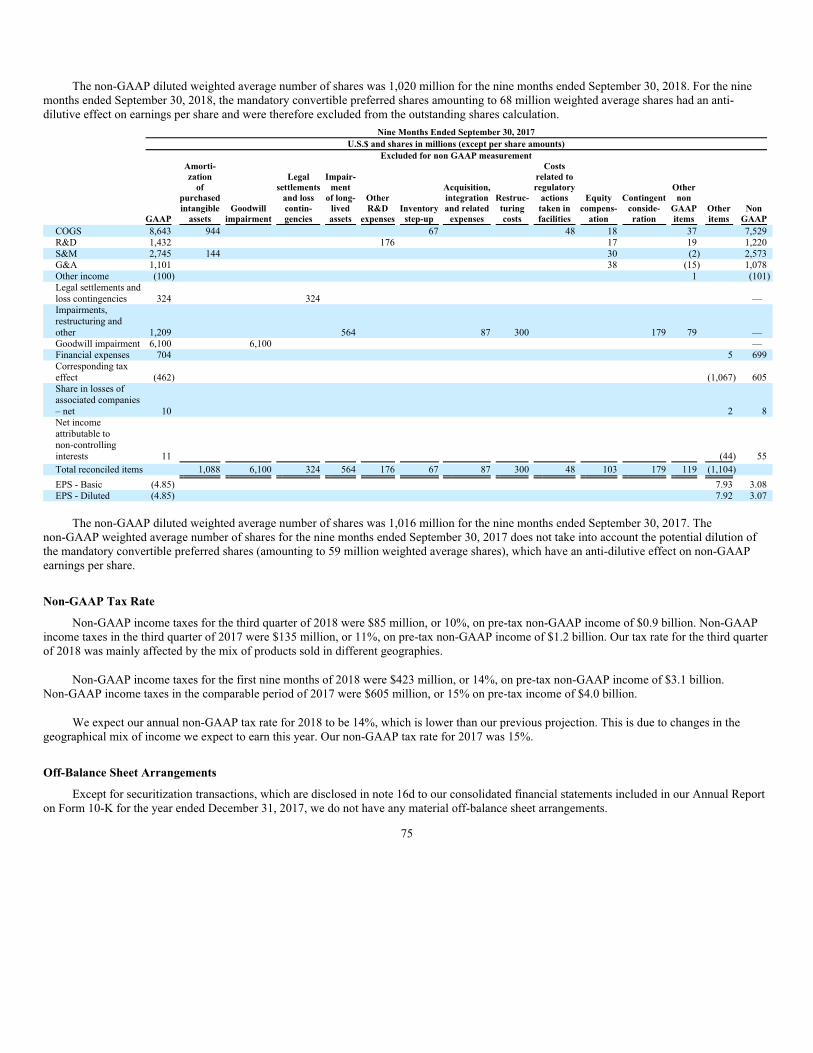
The non-GAAP diluted weighted average number of shares was 1,020 million for the nine months ended September 30, 2018. For the nine
months ended September 30, 2018, the mandatory convertible preferred shares amounting to 68 million weighted average shares had an anti-
dilutive effect on earnings per share and were therefore excluded from the outstanding shares calculation.
Nine Months Ended September 30, 2017
U.S.$ and shares in millions (except per share amounts)
Excluded for non GAAP measurement
GAAP
Amorti-
zation
of
purchased
intangible
assets
Goodwill
impairment
Legal
settlements
and loss
contin-
gencies
Impair-
ment
of long-
lived
assets
Other
R&D
expenses
Inventory
step-up
Acquisition,
integration
and related
expenses
Restruc-
turing
costs
Costs
related to
regulatory
actions
taken in
facilities
Equity
compens-
ation
Contingent
conside-
ration
Other
non
GAAP
items
Other
items
Non
GAAP
COGS 8,643 944 67 48 18 37 7,529
R&D 1,432 176 17 19 1,220
S&M 2,745 144 30 (2) 2,573
G&A 1,101 38 (15) 1,078
Other income (100) 1 (101)
Legal settlements and
loss contingencies 324 324 —
Impairments,
restructuring and
other 1,209 564 87 300 179 79 —
Goodwill impairment 6,100 6,100 —
Financial expenses 704 5 699
Corresponding tax
effect (462) (1,067) 605
Share in losses of
associated companies
– net 10 2 8
Net income
attributable to
non-controlling
interests 11 (44) 55
Total reconciled items 1,088 6,100 324 564 176 67 87 300 48 103 179 119 (1,104)
EPS - Basic (4.85) 7.93 3.08
EPS - Diluted (4.85) 7.92 3.07
The non-GAAP diluted weighted average number of shares was 1,016 million for the nine months ended September 30, 2017. The
non-GAAP weighted average number of shares for the nine months ended September 30, 2017 does not take into account the potential dilution of
the mandatory convertible preferred shares (amounting to 59 million weighted average shares), which have an anti-dilutive effect on non-GAAP
earnings per share.
Non-GAAP Tax Rate
Non-GAAP income taxes for the third quarter of 2018 were $85 million, or 10%, on pre-tax non-GAAP income of $0.9 billion. Non-GAAP
income taxes in the third quarter of 2017 were $135 million, or 11%, on pre-tax non-GAAP income of $1.2 billion. Our tax rate for the third quarter
of 2018 was mainly affected by the mix of products sold in different geographies.
Non-GAAP income taxes for the first nine months of 2018 were $423 million, or 14%, on pre-tax non-GAAP income of $3.1 billion.
Non-GAAP income taxes in the comparable period of 2017 were $605 million, or 15% on pre-tax income of $4.0 billion.
We expect our annual non-GAAP tax rate for 2018 to be 14%, which is lower than our previous projection. This is due to changes in the
geographical mix of income we expect to earn this year. Our non-GAAP tax rate for 2017 was 15%.
Off-Balance Sheet Arrangements
Except for securitization transactions, which are disclosed in note 16d to our consolidated financial statements included in our Annual Report
on Form 10-K for the year ended December 31, 2017, we do not have any material off-balance sheet arrangements.
75
Critical Accounting Policies
The preparation of our consolidated financial statements in conformity with U.S. GAAP requires management to make estimates
and assumptions in certain circumstances that affect the amounts reported in the accompanying consolidated financial statements and
related footnotes. Actual results may differ from these estimates. We base our judgments on our experience and on various assumptions
that we believe to be reasonable under the circumstances.
As applicable to our consolidated financial statements, the most significant estimates and assumptions relate to purchase price
allocation on acquisitions, including determination of useful lives and contingent consideration; determining the valuation and
recoverability of intangible assets and goodwill; and assessing sales reserves and allowances, uncertain tax positions, valuation
allowances, contingencies, restructuring costs and inventory valuation.
Please refer to note 1 in the consolidated financial statements and critical accounting policies included in our Annual Report on
Form 10-K for the year ended December 31, 2017 for a summary of our significant accounting policies.
Recently Issued Accounting Pronouncements
See note 2 to our consolidated financial statements.
76
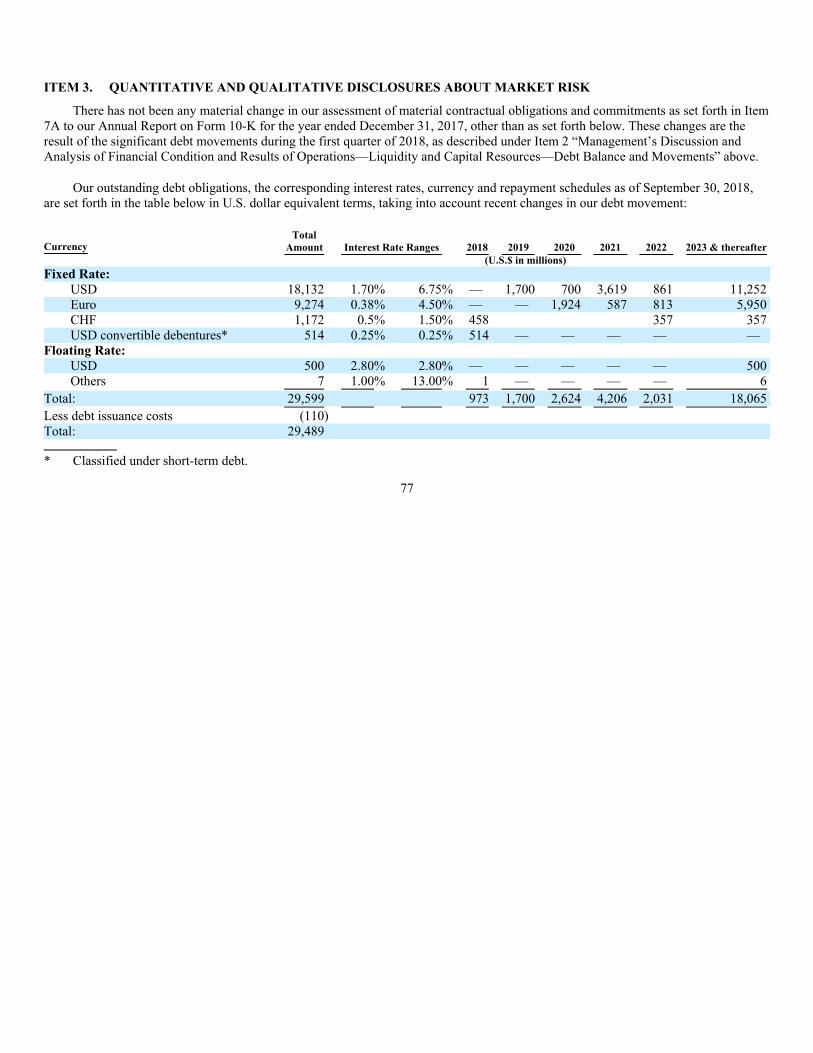
ITEM 3. QUANTITATIVE AND QUALITATIVE DISCLOSURES ABOUT MARKET RISK
There has not been any material change in our assessment of material contractual obligations and commitments as set forth in Item
7A to our Annual Report on Form 10-K for the year ended December 31, 2017, other than as set forth below. These changes are the
result of the significant debt movements during the first quarter of 2018, as described under Item 2 “Management’s Discussion and
Analysis of Financial Condition and Results of Operations—Liquidity and Capital Resources—Debt Balance and Movements” above.
Our outstanding debt obligations, the corresponding interest rates, currency and repayment schedules as of September 30, 2018,
are set forth in the table below in U.S. dollar equivalent terms, taking into account recent changes in our debt movement:
Currency
Total
Amount Interest Rate Ranges 2018 2019 2020 2021 2022 2023 & thereafter
(U.S.$ in millions)
Fixed Rate:
USD 18,132 1.70% 6.75% — 1,700 700 3,619 861 11,252
Euro 9,274 0.38% 4.50% — — 1,924 587 813 5,950
CHF 1,172 0.5% 1.50% 458 357 357
USD convertible debentures* 514 0.25% 0.25% 514 — — — — —
Floating Rate:
USD 500 2.80% 2.80% — — — — — 500
Others 7 1.00% 13.00% 1 — — — — 6
Total: 29,599 973 1,700 2,624 4,206 2,031 18,065
Less debt issuance costs (110)
Total: 29,489
* Classified under short-term debt.
77
ITEM 4. CONTROLS AND PROCEDURES
Disclosure Controls and Procedures
Teva maintains “disclosure controls and procedures” (as defined in Rules 13a-15(e) and 15d-15(e) under the Securities Exchange
Act of 1934) that are designed to provide reasonable assurance that information required to be disclosed in Teva’s reports filed or
submitted under the Securities Exchange Act of 1934 is recorded, processed, summarized and reported within the time periods specified
in the SEC’s rules and forms, and that such information is accumulated and communicated to Teva’s management, including our Chief
Executive Officer and Chief Financial Officer, as appropriate, to allow timely decisions regarding required disclosure. In designing and
evaluating the disclosure controls and procedures, management recognizes that any controls and procedures, no matter how well
designed and operated, can provide only reasonable assurance of achieving the desired control objective.
Consistent with our conclusion in our Form 10-Q for the quarter ended June 30, 2018, after evaluating the effectiveness of our
disclosure controls and procedures as of September 30, 2018, our Chief Executive Officer and Chief Financial Officer concluded that,
due to the existence of a material weakness in internal control over financial reporting described below, as of such date, Teva’s
disclosure controls and procedures were not effective. As described below, the material weakness relates to our control designed to
validate the allocation of businesses between the International Markets and Rimsa reporting units with respect to our interim goodwill
impairment testing not operating effectively.
Notwithstanding the material weakness, Teva’s Chief Executive Officer and Chief Financial Officer have concluded that the
interim financial statements included in the Form 10-Q for the quarter ended September 30, 2018 presented fairly, in all material
respects, Teva’s financial position, results of operations and cash flows for the periods presented in conformity with U.S. GAAP.
Material Weakness
A material weakness is a deficiency, or a combination of deficiencies, in internal control over financial reporting, such that there is
a reasonable possibility that a material misstatement of the company’s annual or interim financial statements will not be prevented or
detected on a timely basis.
Our internal controls did not operate effectively with respect to our interim goodwill impairment testing. Specifically, our control
designed to validate the allocation of businesses between the International Markets and Rimsa reporting units did not operate
effectively. This control deficiency did not result in a material misstatement of our annual or interim consolidated financial statements,
account balances or disclosures. However, this control deficiency could have resulted in a misstatement of the goodwill balances and
disclosures which would have resulted in a material misstatement of the consolidated financial statements that would not have been
prevented or detected. Accordingly, management has concluded that this control deficiency constitutes a material weakness.
Remediation Plans
As disclosed in note 7 to our consolidated financial statements, for the purpose of future goodwill impairment testing,
management combined the Rimsa/Mexico reporting unit within the International Markets reporting unit commencing July 1, 2018, and
the control design will no longer incorporate the allocation process discussed above.
Management reassessed the precision of controls and the timing of internal processes relating to the performance of goodwill
impairment. During the quarter ended September 30, 2018, we implemented controls according to this remediation plan. These controls
will be tested when we perform our annual goodwill impairment testing for the year ending December 31, 2018, or earlier should an
interim impairment assessment become necessary.
Changes in Internal Control over Financial Reporting
During the period covered by this Quarterly Report, the change described in “Remediation Plans” above was considered a change
in Teva’s internal control over financial reporting that materially affected, or is reasonably likely to materially affect, Teva’s internal
control over financial reporting.
78
PART II — OTHER INFORMATION
ITEM 1. LEGAL PROCEEDINGS
We are subject to various litigation and other legal proceedings. For a discussion of these matters, see “Commitments and
Contingencies” included in note 16 to the consolidated financial statements included in Part I, Item 1 of this Quarterly Report on Form
10-Q.
ITEM 1A. RISK FACTORS
There are no material changes to the risk factors previously disclosed in our Annual Report on Form 10-K for the year ended
December 31, 2017.
ITEM 2. UNREGISTERED SALES OF EQUITY SECURITIES AND USE OF PROCEEDS
Unregistered Sales of Equity Securities
There were no sales of unregistered equity securities during the three months ended September 30, 2018.
Repurchase of Shares
In December 2011, our Board of Directors authorized us to repurchase up to an aggregate amount of $3.0 billion of our ordinary
shares or ADSs, of which $1.3 billion remained available for purchase, when in October 2014, the Board of Directors authorized us to
increase our share repurchase program by $1.7 billion to $3.0 billion, of which $2.1 billion remained available as of September 30,
2018. We did not repurchase any of our shares during the three months ended September 30, 2018 and currently cannot do so due to our
accumulated deficit. The repurchase program has no time limit. Repurchases may be commenced or suspended at any time, subject to
applicable law.
ITEM 3. DEFAULTS UPON SENIOR SECURITIES
Not applicable.
ITEM 4. MINE SAFETY DISCLOSURES
Not applicable.
ITEM 5. OTHER INFORMATION
None.
ITEM 6. EXHIBITS
10.1 Long-Term Assignment Letter for Michael McClellan dated August 9, 2018 *
31.1 Certification of the Chief Executive Officer pursuant to Section 302 of the Sarbanes-Oxley Act of 2002 *
31.2 Certification of the Chief Financial Officer pursuant to Section 302 of the Sarbanes-Oxley Act of 2002 *
32 Certification of the Chief Executive Officer and Chief Financial Officer pursuant to 18 U.S.C. Section 1350, as adopted
pursuant to Section 906 of the Sarbanes-Oxley Act of 2002 *
101.INS XBRL Taxonomy Instance Document
101.SCH XBRL Taxonomy Extension Schema Document
101.CAL XBRL Taxonomy Calculation Linkbase Document
101.DEF XBRL Taxonomy Extension Definition Linkbase Document
101.LAB XBRL Taxonomy Label Linkbase Document
101.PRE XBRL Taxonomy Presentation Linkbase Document
* Filed herewith.
79
SIGNATURES
Pursuant to the requirements of the Securities Exchange Act of 1934, the registrant has duly caused this report to be signed on its
behalf by the undersigned, thereunto duly authorized.
TEVA PHARMACEUTICAL INDUSTRIES LIMITED
Date: November 1, 2018 By: /s/ Michael McClellan
Name: Michael McClellan
Title: Executive Vice President,
Chief Financial Officer
(Duly Authorized Officer)
80
Exhibit 10.1
Private & Confidential
August 9, 2018
To: Michael McClellan
Dear Michael,
Reference: Your Home Based Long Term International Assignment to Israel
Below is a summary of your proposed assignment terms (the “Terms”). To the extent there is a conflict between the Terms and any term
in the employment agreement between you and Teva Pharmaceuticals USA dated February 8, 2018 (the “Agreement”), the terms of the
Agreement shall prevail.
ASSIGNMENT SUMMARY
• Home Country: The United States
• Host Country: Israel
• Employer (Legal Entity): Teva Pharmaceuticals USA Inc.
• Host Site Entity: Teva Pharmaceutical Industries Ltd
• Citizenship/Permanent Resident Status: USA
• Estimated Assignment Start Date*: September 1, 2018
• Scheduled Assignment End Date: August 31, 2021
• Assignment Policy: 2015 Long Term International Assignment
• Home or Host Based Assignment: Home Based Assignment
• Family Size at Host (including Employee): 2
*Your actual effective date of assignment will be determined following receipt of your authorization to work and reside in the Host
country. The Company reserves the right to end your assignment at any time and subject to its sole discretion.
You shall be eligible to all benefits applicable to Home Based assignees under Teva’s Long Term International Assignment Policy
(“Policy”). In connection with the Policy, please note the following:
• Your housing allowance shall be up to a maximum of 21,500 ILS net per month;
• Your cost of living allowance shall be US$1,981.92 net per month;
• You and your spouse will be provided one home leave every 12 months on assignment between your home country and your
host country and your children will be provided one home leave every 12 months on assignment between your home country
and your host country.
Please note that Teva reserves the right to modify the global assignment policies and procedures, including the Policy, at its sole
discretion and at any time in whole or in part, with or without notice. Either you or the Company remains free to terminate the
employment relationship in accordance with the Agreement.
We wish you success in your new location.
1

Sincerely,
Mark Sabag
Executive Vice President
Global Human Resources
/s/ Mark Sabag
Please indicate your agreement by signing below and returning this letter.
I have reviewed the terms and conditions of my assignment outlined above and in the Policy, including any repayment owed due
to termination of employment by employee, and by signing below, accept these conditions.
/S/ Michael McClellan August 9, 2018
Michael McClellan Date
CC: Regional Global Mobility Leader
Exhibit 31.1
CERTIFICATION OF CHIEF EXECUTIVE OFFICER
PURSUANT TO SECTION 302 OF THE SARBANES-OXLEY ACT
I, Kåre Schultz, certify that:
1. I have reviewed this quarterly report on Form 10-Q of Teva Pharmaceutical Industries Limited;
2. Based on my knowledge, this report does not contain any untrue statement of a material fact or omit to state a material fact
necessary to make the statements made, in light of the circumstances under which such statements were made, not misleading with
respect to the period covered by this report;
3. Based on my knowledge, the financial statements, and other financial information included in this report, fairly present in all
material respects the financial condition, results of operations and cash flows of the company as of, and for, the periods presented
in this report;
4. The company’s other certifying officer and I are responsible for establishing and maintaining disclosure controls and procedures
(as defined in Exchange Act Rules 13a-15(e) and 15d-15(e)) and internal control over financial reporting (as defined in Exchange
Act Rules 13a-15(f) and 15d-15(f)) for the company and have:
a. designed such disclosure controls and procedures, or caused such disclosure controls and procedures to be designed under
our supervision, to ensure that material information relating to the company, including its consolidated subsidiaries, is made
known to us by others within those entities, particularly during the period in which this report is being prepared;
b. designed such internal control over financial reporting, or caused such internal control over financial reporting to be designed
under our supervision, to provide reasonable assurance regarding the reliability of financial reporting and the preparation of
financial statements for external purposes in accordance with generally accepted accounting principles;
c. evaluated the effectiveness of the company’s disclosure controls and procedures and presented in this report our conclusions
about the effectiveness of the disclosure controls and procedures, as of the end of the period covered by this report based on
such evaluation; and
d. disclosed in this report any change in the company’s internal control over financial reporting that occurred during the
company’s most recent fiscal quarter (the registrant’s fourth fiscal quarter in the case of an annual report) that has materially
affected, or is reasonably likely to materially affect, the company’s internal control over financial reporting; and
5. The company’s other certifying officer and I have disclosed, based on our most recent evaluation of internal control over financial
reporting, to the company’s auditors and the audit committee of the company’s board of directors (or persons performing the
equivalent functions):
a. all significant deficiencies and material weaknesses in the design or operation of internal control over financial reporting
which are reasonably likely to adversely affect the company’s ability to record, process, summarize and report financial
information; and
b. any fraud, whether or not material, that involves management or other employees who have a significant role in the
company’s internal control over financial reporting.
Date: November 1, 2018
/s/ Kåre Schultz
Kåre Schultz
President and Chief Executive Officer
Exhibit 31.2
CERTIFICATION OF CHIEF FINANCIAL OFFICER
PURSUANT TO SECTION 302 OF THE SARBANES-OXLEY ACT
I, Michael McClellan, certify that:
1. I have reviewed this quarterly report on Form 10-Q of Teva Pharmaceutical Industries Limited;
2. Based on my knowledge, this report does not contain any untrue statement of a material fact or omit to state a material fact
necessary to make the statements made, in light of the circumstances under which such statements were made, not misleading with
respect to the period covered by this report;
3. Based on my knowledge, the financial statements, and other financial information included in this report, fairly present in all
material respects the financial condition, results of operations and cash flows of the company as of, and for, the periods presented
in this report;
4. The company’s other certifying officer and I are responsible for establishing and maintaining disclosure controls and procedures
(as defined in Exchange Act Rules 13a-15(e) and 15d-15(e)) and internal control over financial reporting (as defined in Exchange
Act Rules 13a-15(f) and 15d-15(f)) for the company and have:
a. designed such disclosure controls and procedures, or caused such disclosure controls and procedures to be designed under
our supervision, to ensure that material information relating to the company, including its consolidated subsidiaries, is made
known to us by others within those entities, particularly during the period in which this report is being prepared;
b. designed such internal control over financial reporting, or caused such internal control over financial reporting to be designed
under our supervision, to provide reasonable assurance regarding the reliability of financial reporting and the preparation of
financial statements for external purposes in accordance with generally accepted accounting principles;
c. evaluated the effectiveness of the company’s disclosure controls and procedures and presented in this report our conclusions
about the effectiveness of the disclosure controls and procedures, as of the end of the period covered by this report based on
such evaluation; and
d. disclosed in this report any change in the company’s internal control over financial reporting that occurred during the
company’s most recent fiscal quarter (the registrant’s fourth fiscal quarter in the case of an annual report) that has materially
affected, or is reasonably likely to materially affect, the company’s internal control over financial reporting; and
5. The company’s other certifying officer and I have disclosed, based on our most recent evaluation of internal control over financial
reporting, to the company’s auditors and the audit committee of the company’s board of directors (or persons performing the
equivalent functions):
a. all significant deficiencies and material weaknesses in the design or operation of internal control over financial reporting
which are reasonably likely to adversely affect the company’s ability to record, process, summarize and report financial
information; and
b. any fraud, whether or not material, that involves management or other employees who have a significant role in the
company’s internal control over financial reporting.
Date: November 1, 2018
/s/ Michael McClellan
Michael McClellan
Executive Vice President, Chief Financial Officer
Exhibit 32
CERTIFICATION OF THE CHIEF EXECUTIVE OFFICER AND CHIEF FINANCIAL OFFICER
PURSUANT TO 18 U.S.C. SECTION 1350,
AS ADOPTED PURSUANT TO SECTION 906 OF THE SARBANES-OXLEY ACT OF 2002
In connection with the Quarterly Report of Teva Pharmaceutical Industries Limited (the “Company”) on Form 10-Q for the period
ended September 30, 2018 as filed with the Securities and Exchange Commission on the date hereof (the “Report”), we, Kåre Schultz,
President and Chief Executive Officer of the Company, and Michael McClellan, Chief Financial Officer of the Company, certify,
pursuant to 18 U.S.C. §1350, as adopted pursuant to §906 of the Sarbanes-Oxley Act of 2002, that:
(1) The Report fully complies with the requirements of section 13(a) or 15(d) of the Securities Exchange Act of 1934; and
(2) The information contained in the Report fairly presents, in all material respects, the financial condition and results of
operations of the Company.
Dated: November 1, 2018
/s/ Kåre Schultz
Kåre Schultz
President and Chief Executive Officer
/s/ Michael McClellan
Michael McClellan
Executive Vice President, Chief Financial Officer
Top Related
Copyright © 2022 FDOKUMEN

