


Bahasa
Halaman
Hukum


TECHNOLOGY AND SERVICE QUALITY AMONG COFFEE
SHOPS IN NAIROBI, KENYA
BY
JUDITH MAOSA
A RESEARCH PROJECT PRESENTED IN PARTIAL
FULFILLMENT OF THE REQUIREMENTS FOR AWARD OF
MASTER OF BUSINESS ADMINSTRATION, SCHOOL OF
BUSINESS, UNIVERSITY OF NAIROBI
OCTOBER 2013
ii
DECLARATION
This research project is my own work and has not been submitted for award of any
degree in any other university and / or higher learning institution and where people’
research work has been used, they have been duly acknowledged.
Signature………………………… Date…………….….………..
MS. JUDITH MORAA MAOSA
D61/72770/2012
This research project has been submitted for examination with my approval as the
University Supervisor.
Signature………………………… Date…………….….………..
MRS. ZIPPORAH N. KIRUTHU
LECTURER
DEPARTMENT OF MANAGEMENT SCIENCE
SCHOOL OF BUSINESS
UNIVERSITY OF NAIROBI

iii
ACKNOWLEDGMENT
It has been an exciting and instructive study session in the University of Nairobi and I
feel privileged to have had the opportunity to carry out this study as a demonstration of
knowledge gained during the period that I was taking my master’s degree.
I would like to take this opportunity to thank the almighty lord for giving me the chance
and strength to pull through even in difficult situations.
To my lovely son Fide Samuel Omoti who gave me the reason to aim higher because he
lookup to me and I will not want to let him down. I also appreciate my Dad, Mum and
siblings no granting me the opportunity to study.
Above all I acknowledge Mr. Joash Mageto for being my mentor and for his support all
along my MBA studies, finally my supervisor Zipporah Kiruthu for her generous guide in
my project.
iv
DEDICATION
I dedicate this to my lovely son Fidel Omoti .I love you so so much.

v
ABSTRACT
In the backdrop of the immense challenges faced by coffee shops in Nairobi, Kenya in
terms of changing customer demands, increased competition, changes in price of inputs,
many coffee shops have adopted technology in service delivery in order to mitigate these
challenges. This study had a two pronged approach; one, to establish the extent of
adoption of technology among coffee shops in Nairobi, Kenya, and two, to establish the
relationship between service quality and technology among coffee shops in Nairobi,
Kenya. A descriptive survey was used to answer the research questions on the current
status of the subject of the study and in reference to the objectives of the study. The target
population of the study was all coffee shops in Nairobi, Kenya totalling two hundred and
forty eight (248). A sample of 100 coffee shops was taken out of this sampling frame.
Questionnaires were used to collect primary data from the respondents. The data was
quantitatively and qualitatively analyzed and presented as frequency and percentage
tables. The study found out that coffee shops have adopted technology measures to
enhance their competitiveness. The technology variables were correlated with the service
quality variables. It was found that micros order processing, electronic payment modes;
WI-FI provision and online ordering were found to be statistically significant.

vi
TABLE OF CONTENTS
DECLARATION ................................................................................................................ ii
ACKNOWLEDGMENT.................................................................................................... iii
DEDICATION ................................................................................................................... iv
ABSTRACT .........................................................................................................................v
LIST OF TABLES ............................................................................................................. ix
LIST OF FIGURES .............................................................................................................x
LIST OF ABBREVIATIONS AND ACRONYMS .......................................................... xi
CHAPTER ONE: INTRODUCTION ..............................................................................1
1.1 Background of the Study ...............................................................................................1
1.1.1 Technology ............................................................................................................. 2
1.1.2 Service Quality ....................................................................................................... 2
1.1.3 Coffee Shops in Kenya ........................................................................................... 4
1.2 Statement of the Problem .............................................................................................5
1.3 Objectives of the Study ..................................................................................................7
1.4 Purpose of the Study ......................................................................................................7
CHAPTER TWO: LITERATURE REVIEW .................................................................8
2.1 Technology in Service Facilities ....................................................................................8
2.2 Service Quality...............................................................................................................9
2.3 Application of Technology ..........................................................................................11
2.4 Servqual Model ............................................................................................................13

vii
2.5 Conceptual Framework ................................................................................................15
CHAPTER THREE: RESEARCH METHODOLOGY...............................................17
3.1 Research Design...........................................................................................................17
3.2 Study Population ..........................................................................................................17
3.3 Sample Design .............................................................................................................17
3.4 Data Collection ............................................................................................................18
3.5 Data Analysis ...............................................................................................................18
CHAPTER FOUR: DATA ANALYSIS, INTERPRETATIONS AND
DISCUSSIONS .................................................................................................................19
4.1 Introduction ..................................................................................................................19
4.2 Demographic Profile of Respondents. .........................................................................19
4.3 Service rating and Technology ....................................................................................21
4.4 Technology Adoption ..................................................................................................24
4.5 Service Quality.............................................................................................................25
4.6 Relationship between Technology and Service Quality ..............................................26
4.6.1 Correlation Analysis ............................................................................................. 28
4.7 Regression of Service Quality Against Technology ....................................................29
CHAPTER FIVE: SUMMARY CONCLUSIONS AND RECOMMENDATIONS ..32
5.1 Introduction ..................................................................................................................32
5.2 Summary .....................................................................................................................32
5.3 Conclusions ..................................................................................................................33

viii
REFERENCES .................................................................................................................34
APPENDICES ..................................................................................................................38
Appendix I: Research Questionnaire .................................................................................38
Appendix II: List of Coffee Houses ...................................................................................41

ix
LIST OF TABLES
Table 4.1: Age brackets .....................................................................................................20
Table 4.2: No of Years .......................................................................................................20
Table 4.3: No. of Times of Visitation ................................................................................21
Table 4.4: No of Times ......................................................................................................21
Table 4.5: Service Rating ...................................................................................................22
Table 4.6: Rate of Service Quality .....................................................................................22
Table 4.7: Incorporation of Technology in Offering Service ............................................23
Table 4.8: Technology Adoption Rate ...............................................................................23
Table 4.9: Technology Adoption .......................................................................................24
Table 4.10: Service Quality Ranking .................................................................................25
Table 4.11: Service Time ...................................................................................................30
Table 4.12: Timely Inquiry ................................................................................................30
Table 4.13: Staff Willingness to Serve ..............................................................................31

x
LIST OF FIGURES
Figure 2.1: Conceptual Framework ...................................................................................16
Figure 4.2 Gender Presentation..........................................................................................19
xi
LIST OF ABBREVIATIONS AND ACRONYMS
QMS - Quality management systems
WIFI - Wireless internet
M-pesa - Mobile phone money transaction
Masala chai - Spicy Tea

1
CHAPTER ONE
INTRODUCTION
1.1 Background of the Study
The adoption of technology into service industries is becoming a strong trend as service
providers are now being urged by industry bodies to invest in technology (Australian
Coalition of Services Industries Annual Review, 1997a; 1997b) as a way of securing their
future in the electronic age. The role of technology in service organizations as discussed
by Kelley (1989) has been predominantly employed to reduce costs and eliminate
uncertainties. In the service sector, technology has been used to standardize services by
reducing the employee/customer interface (Quinn, 1996). Service delivery in the hotel
industry has improved gradually due to the adoption of new technologies. These
technologies can be used to serve customers or help customers to access other services.
Some of the notable technologies include: payment technologies, order placement
technologies and order tracking, point of sale, provision of Wi-Fi networks for internet
access, offering tablets to customers instead of newspapers, and availability of tech
games for children. This study would therefore seek to establish the relationship between
the use of the aforementioned technologies and the level of service offered by a coffee
shop. The following sections discuss service quality and technology in service facilities.
2
1.1.1 Technology
Technology is the making, modification, usage, and knowledge of tools, machines,
techniques, crafts, systems, and methods of organization, in order to solve a problem,
improve a preexisting solution to a problem, achieve a goal, handle an applied
input/output relation or perform a specific function.
Technology has been used as a productive, tactical, and strategic resource, as a tool and
as a change agent. Technology has revolutionized the management of service
organizations by changing the way in which people work and interact. Walker and Craig-
Lees (2002) stated that technology can facilitate service delivery to the benefit of
customers and providers. In addition to providing opportunity for new service offerings,
technology is providing vehicle for delivering existing services in more accessible,
convenient and productive ways. Technology facilitates basic customer service functions
such as paying bills, questions, checking accounts records for both local and globally.
Advancement of technology as made it easy to pay bills by use of electronic visa cards.
1.1.2 Service Quality
Services are acts, deeds or performances which are intangible; therefore they are
economic activities that produce time, place, form or psychological utility. The elements
of service encounter include: customer, service provider, delivery systems and physical
evidence.

3
Quality is much desired and often talked about but somewhat difficult to define. The
problem lies not on finding definition as many definitions exist, but in ensuring that both
the service provider and the customer understand each other in their definitions.
Quality has been defined from different perspectives and ornamentals according to the
person making the decision, the measures applied and the context within which it is
considered (Tapiero, 1996).It has been defined as “excellence” Peters and Waterman,
1995 “value” Freigenbaum, 1995, “fitness for use” Juran and Gryana,
1988“Conformance to requirement “Crosby 1979 and meeting and /or exceeding
customers’ expectations Parasuraman et al. ,1985.
More often than not customers demand quality experience and their resultant behavior is
replicated in terms of an attitude towards consumption behavior, which as lead
researchers and analysts to regard quality as a single most important factor for long term
success and survival for any organization. Due to this Deming (1985) asserts that quality
aims at the needs of the customer at present and future.
Therefore quality of service is the ability to provide different priority to different
applications, users, or to guarantee a certain level of performance. Service quality can be
defined as “the collective effect of service performances which determine the degree of
satisfaction of a user of the service”. In other words, quality is the customer’s perception
of a delivered service.

4
1.1.3 Coffee Shops in Kenya
Traditional brick-and-mortar companies are embracing the use of technologies to enhance
the services they offer and to gain customer loyalty. The objectives are to stay in the
forefront of today’s marketplace and to improve service, efficiency, and profitability. The
hospitality industry has transformed itself into a global industry, and, as one of the largest
industries in the world, it serves as an excellent example of an industry that has
transformed itself in response to changes in customer requirements and demands.
Continuous technological developments and their adoption in the hospitality industry
have provided numerous opportunities and challenges.
Across the world, coffee houses command a significant portion of market share as
relaxing joints for customers either at mid-morning or evening. For example Starbucks
opened their first store in 1971, in Seattle and have taken the world by storm with more
than 8,000 locations. They sell espresso and espresso drinks such as a latte, cappuccino,
mocha, as well as dinner. In Kenya and specifically in Nairobi there has been an
emergence of coffee shops recently. For instance Nairobi java House, Dormans, Art
Caffe, and Savannah. These coffee houses have distinguished themselves from the
traditional restaurants by adopting new technologies to enable them deliver quality
service to their customers.
Coffee shops refer to an establishment which serves prepared coffee and other hot and
cold beverage. It shares some of the same characteristics of a bar or restaurant, since they
serve alcoholic beverages such as coffee plus sambuca: for example beilyschino but it is

5
different from a cafeteria. As the name suggests, coffee shops focus on providing coffee
and tea as well as light snacks and a display case containing pastries and occasionally
savory items such as sandwiches.
Typical pastries include scones, muffins, croissants, and even doughnuts. There is usually
a large selection of teas as well, and the Indian spiced tea drink masala chai. Iced drinks
are also popular and they include both iced tea and iced coffee as well as blended drinks
such as Frappucino, smoothies and milkshakes.
Coffee shops largely serve as centers of social interaction that provides social members
with a place to congregate, talk, write, read, entertain one another, or pass the time,
whether individually or in small groups of two or three people. They have a widespread
adoption of public Wi-Fi access points to provide Internet services to people doing work
on laptop computers and mobile phones on the premises. Some upscale coffee shops even
offer alcoholic beverages such as grappa, aperitifs, gins, vodka, beers and alcoholic
cocktails.
1.2 Statement of the Problem
Research has shown that quality of service is essential for customer satisfaction (Cronin
and Taylor, 1992), repeat purchases and winning customer loyalty (Zeithaml et al., 1990)
and customer retention and it also affects company’s market share and thus profitability
(Kandampully and Duddy, 1999). Heskett et al. (1994) suggested that quality
management systems (QMS) are the critical link with customers. It can, for example,
ensure effective use of technology to the satisfaction of customers.

6
Integrating technology into a product or service can improve customer satisfaction
(Kandampully and Duddy, 1999) . A major benefit of technology in service industries is
quicker access to better information, particularly when accessing customers’ needs.
However, to ensure that the desired benefits are achieved, Small and Yasin (1997)
recommended that technology is implemented in association with an appropriate QMS.
Competitive advantage is enhanced if there is synergy between management strategies
and employees’ understanding of those strategies. There must be strategic consistency
with respect to structural and infrastructure decisions (Smith and Reece, 1999).
Implementing technology and a QMS can therefore improve service quality as perceived
by both internal and external customers.
Mathew et al. (1999) carried out a study on the impact of technology on service delivery
in the banking industry in Australia. They concluded that banks that offered electronic
banking were perceived to be offering quality service. Ombati (2007) carried out a study
on impact of technology on service quality in the banking industry in Kenya and
concluded that technology led to improved customer satisfaction through accessibility
and convenience.
Although many studies have focused on technology and service quality, relatively little
attention has been paid to the relationship between the use of technology and service
quality in coffee shops in Kenya. This study therefore seeks to answer the question; what
is the relationship between technology and service quality among coffee shops in Kenya?

7
1.3 Objectives of the Study
i. The specific objectives for this study are;
ii. To establish the extent of adoption of technology among coffee shops in Nairobi,
Kenya.
iii. To establish the relationship between service quality and technology among
coffee shops in Nairobi, Kenya.
1.4 Purpose of the Study
This study will be useful to all coffee shops and it will majorly help them to improve
service quality through adoption of new technologies and implement the same.
The research will also be meaningful to academicians in their subsequent studies, in that
they will further their researches from this study gaps.
8
CHAPTER TWO
LITERATURE REVIEW
2.1 Technology in Service Facilities
Technology has been used as a productive, tactical, and strategic resource, as a tool and
as a change agent. Technology has revolutionized the management of service
organizations by changing the way in which people work and interact. In health care,
Kunst and Lemmink (2000) suggested that technological developments had important
effects on medical care, surgical techniques, drugs, equipment and health services.
In the banking industry technology is the vehicle of advancement: it led to electronic
banking where the internet is used as a remote delivery channel for providing services
such as transferring money into different accounts as well as opening savings accounts,
paying bills, viewing balance and paying mortgages. Mobile banking where by one is
able to withdraw of deposit cash using mobile phones and ATMs (Automated Teller
Machines).
Dabholkar (1994) claims that when the customer is in direct contact with the technology
there is greater control such as with Internet banking. However, if there is an absence of
direct contact, such as with telephone banking (since the technology itself is not visible to
customers who are able only to press numbers on their telephone keypad) it is assumed
that there is less control perceived by the customer during this transaction. Bateson
(1984) has conducted a number of studies on the need for consumers to have control
during service encounters. When a consumer freely chooses to use technology as a form
of service delivery the impact is high in terms of quality attributes. Some of the quality

9
attributes that are highly important to consumers are efficiency and speed (Bateson,
1984). This concept is supported by Weatherall et al. (1984), who state that consumers
are thought to have a positive perception of technology based service attributes since they
believe technology will deliver a faster and more efficient service than that of the
employee. Gummesson (1991) also stresses that reliability and user-friendliness are
important attributes in the evaluation of technology-based services.
The technology used in service delivery should offer flexibility to allow customers to
make changes during the transaction and make available a customer service adviser if
required, with “minimum waiting” (Dabholkar, 1994).
2.2 Service Quality
In a service-oriented business, service quality (along with unit productivity and
administrative effectiveness), is a critical performance indicator. Although many
organizations consider customer perceptions to be good indicators of service quality or
performance these perceptions are often imprecise.
Regarding service quality, recent research has shown that globally across the service
sector, many people are concerned that the level of service quality has been declining
over the last two decades customers sometimes feel service employees are too busy,
under-paid, and under-trained and under motivated to provide good service (Barta and
Chalker 2001.

10
Service can be divided into high-touch or high-tech services. High touch services are
mostly dependent on people in the service process producing the service, whereas high
tech services are predominantly based on the use of automated systems information
technology and other types of physical resources. However, one should always remember
that high touch also includes physical resources and technology based systems that have
to be managed and integrated into service process in a customer oriented fashion(
Gronross, 2001).Thus in this study, technology in coffee shops service include both high
tech and high-touch service.
For coffee houses to offer quality services they should provide for enough space for
customers to avoid congestion, quality air conditioning for the comfort of customers, not
forgetting clean bathrooms which should be maintained regularly at an interval of ten
minutes depending on how busy the restaurant is.
Once a guest walks in to the coffee shop he/she should be warmly welcomed and given a
menu immediately; this saves on time taken to take orders and process ensuring the
customer gets the order on time. A good starting goes hand in hand with a good finishing,
customers should receive error free bill so as to build trust and be satisfied with the
service offered.
In order for service organizations to differentiate themselves from their competitors and
to attract new and repeat customers, they must offer service quality (Rowley, 1998).
Service quality is determined by the difference between the customers' expectations of

11
the service and perceptions of the service they actually receive (Parasuraman et al.,
1985). Understanding the attributes of service that customers use to evaluate and define
quality service can help organizations develop more effective ways of improving services
(Rowley, 1998). Parasuraman et al. (1985) have referred to these attributes as
“determinants of quality'' and have identified ten general characteristics which constitute
quality in service: reliability, responsiveness, competence, access, courtesy,
communication, credibility, security, understanding the customer, and tangibles.
Parasuraman et al. (1988) have also developed a generic instrument called SERVQUAL
to measure service quality based on five dimensions distilled from the original ten
determinants by factor analysis. Although the SERVQUAL is widely known to
academicians as well as practitioners, the dimensions used in the instrument are
inadequate for certain industries.
2.3 Application of Technology
As with most other service providers)., coffee houses have moved quickly to invest in
technology as a way of controlling costs, attracting new customers and meeting the
convenience and technical innovation expectations of their existing customer. In coffee
shops technology provides for online menu for customers, making orders through phone
and processing of orders by use of IPSOS micros systems. Entertainment of guests
through online coffee magazines and offering of free Wi-Fi is the courtesy of technology.

12
Technology enables customers to make orders online which are to be delivered to their
residential places or offices. This saves time and effort to move from one place to
another. Technology also provides for online reservation of big tables, this increases the
customers satisfaction since they need not to wait for tables to open up.
Technology facilitates basic customer service functions transactions the information
seeking and has changed the face of customer service, but many organizations now offer
human contact as the ultimate form customer service, such as a “live chart” opinion or
phone contact when people have a problem with an internet based service (Bitner 2001).
Technology enables both customers and employees to be more effective in receiving and
providing the service (Bitner et al., 2000).Self-service technology (SSTs) can enhance
customer relationships management and service customization but they must be well
designed and appropriate. Mike and Founier (1998) have however, highlighted paradoxes
in technology product and services: technology can both assimilate people while at the
same time isolating them: It can provide a sense of control with a sense of ineptitude: it
can facilitate involvement and activity between people while leading to dis-connectivity
and passivity: it can result in greater efficiency and productivity and can result in wasted
time and effort.
The question of acceptability is crucial one. Research looking into “customer technology
readiness” suggests there are segment of customers simply not interested or ready to use
technology (Parasuraman and Colby, 2001). Employees can also be reluctant to accept

13
and integrate technology into their working lives either because they do not wish to
change or do not perceive any value in learning the new technology (Bitner, 2001).
Walker et al. (2002) view a customer’s decision to adopt or reject technological
facilitated service delivery as dependent on and conditioned by their individual capacity
and willingness. Capacity implies a perceived ability to use (Davis et.al. (1989).Adaptors
of technology based services will tend to be convinced by ease of use and convenience.
In technology based encounters dissatisfaction is most commonly related to failure in
technology service design or in the service process. Most technology based complains
tend to be with internet service, about which customers are more likely than no to be
more unfamiliar. It could be argued that technology related complains should diminish
over time with increased familiarity and hence technology has the advantage of being
more consistent than the behavior of individual staff.
2.4 Servqual Model
Parasuraman’s five dimensions and SERVQUAL instrument are one of the most
influential and widely used service quality models because they have a number of
advantages in application.

14
First of all, SERVQUAL allows organizations to understand their customers’
expectations and perceptions or their service quality. Organizations can periodically track
the service quality trends and thus, improve their service accordingly. Studies of a
number of researchers did prove this (Fitzsimmons & Fitzsimmons, 2001).
Second, SERVQUAL allows organizations to assess their quality along each of the five
service dimensions by averaging the difference scores on items making up the
dimensions (Robinson, 1999). Overall perceived service quality can also simply be
measured by averaging the dimension scores (Robinson, 1999).
Third, SERVQUAL can be used to categorize an organization’s customers into several
perceived-quality segments, such as high, medium, or low, on the basis of their individual
SERVQUAL scores (Parasuraman, 1988). This facilitates an organization’s customer
segmentation. This approach will be used in the research.
Forth, SERVQUAL can be applied across a broad range of service industries and can be
easily modified for specific requirements of an organization (Dabholkar et al.,
1996).After SERVQUAL was developed, a lot of studies successfully used SERVQUAL
to measure the service quality in various service industries, such as banks, hospitals and
hotels (Babakus & Mangold, 1989; Lau et al., 2005; Lee & Hwan, 2005). In this paper,
tangibles, reliability, responsiveness, assurance, and empathy are identified as the popular
SERVQUAL scale units for quality measurements.
15
2.5 Conceptual Framework
Service quality construct has been researched by quite a number of researchers. Service
quality definition revolve around the idea that it is the result of the comparison that
customers make between their expectations about a service and their perception of the
way the service has been performed. Service quality can be seen from three dimensions:
it consists of “interaction”, “physical” and “corporate” quality. At a higher level, and
essentially from a customer’s perspective, quality is seen as being two-dimensional,
consisting of “process” and “output” quality. The emphasis on two main dimensions of
service quality is: first “technical” quality or “what” is received by the customer and the
other “functional” quality or “how” a service is provided. The latter is the most critical
aspect and is concerned with the psychological interaction taking place during the
exchange transaction. It is based on the customer’s perception and is therefore extremely
subjective and encompasses all the cues that the customer picks up during the transaction.
These are by no means limited to cues emanating from the server but also from the entire
service environment.
A number of dimensions of service quality identified in the health care industry include:
access, technical management both at an administrative and at a clinical level,
interpersonal management and continuity of care. Access refers to such aspects as
location, hours, telephone and waiting and appointment times. The administrative side of
technical management focuses on general ambience and amenities, meals and the
efficiency of billing. This study has been conceptualized as shown in figure 2.1.

16
Figure 2.1: Conceptual Framework
Independent variables Dependent variable
Source: Author, 2013
Technology
Accessibility
New service
delivery options
Cost reduction
flexibility
Service Quality

17
CHAPTER THREE
RESEARCH METHODOLOGY
3.1 Research Design
This study was carried out through a descriptive survey research design. The purpose of
survey research in description was to find out what situations, events, attitudes opinions
were occurring in a population. Survey research aimed at description asking simply
about the distribution of some phenomena in a population or among subgroups of a
population. This study specifically focused at meeting the following objectives. To
establish the extent of adoption of technology among coffee shops in Kenya and to
determine the relationship between service quality and technology among coffee shops in
Kenya. This research design was also used by Ombati (2007).Norizan (2005) and Gakuo
(2003).
3.2 Study Population
The population of study was drawn from coffee shops in Nairobi, Kenya. This mainly
constituted of coffee shops within Nairobi. The population constituted of 248 coffee
shops listed by free business listing provided for Kenya Coffee House Guide as at 26th
July 2013.
3.3 Sample Design
A sample of all the coffee houses within Nairobi region was selected using simple
random sampling procedure. A sample of 100 coffee shops in Nairobi CBD was selected.
The respondents were mainly regular customers visiting the sampled coffee shops. The
18
respondents were drawn mainly from the customers within the service facility. One
customer was selected randomly within each service facility.
3.4 Data collection
The study used primary data which was captured though semi-structured questionnaires,
which consisted of both closed and open ended questions. The questionnaire had three
sections. Section A captured demographic data of the respondent, Section B captured data
on extent of adoption of technology among coffee shops in Kenya and section C collected
data on the relationship between service quality and technology. The questions were
presented in form of statements on a 1-5 scale for respondents to score and open ended
questions, the questionnaires were dropped and picked later by the researcher.
3.5 Data Analysis
The data collected was subjected to Statistical analysis and content analysis to establish
the relationship between technology and service quality among coffee shops in Kenya.
Frequency tables and the percentage proportions of the statement describing the
relationship were also used. Means were calculated from the same scores to determine the
perceived relationship due to the degree of relation. Correlation analysis was also used to
measure the relationship between technology and service quality. Data was also
regressed. SPSS tool was used for Statistical analysis.
19
CHAPTER FOUR
DATA ANALYSIS, INTERPRETATIONS AND DISCUSSIONS
4.1 Introduction
This chapter presents the analysis and interpretation of the data from the field as set out in
the research methodology. The questionnaire was designed in line with the objectives of
the study. The study sampled 100 respondents from the target population. Out of the 100
target population 58 respondents filled in and returned the questionnaire contributing
to58%.The data was analyzed using SPSS analysis tool and the content examined
critically to help in drawing conclusions.
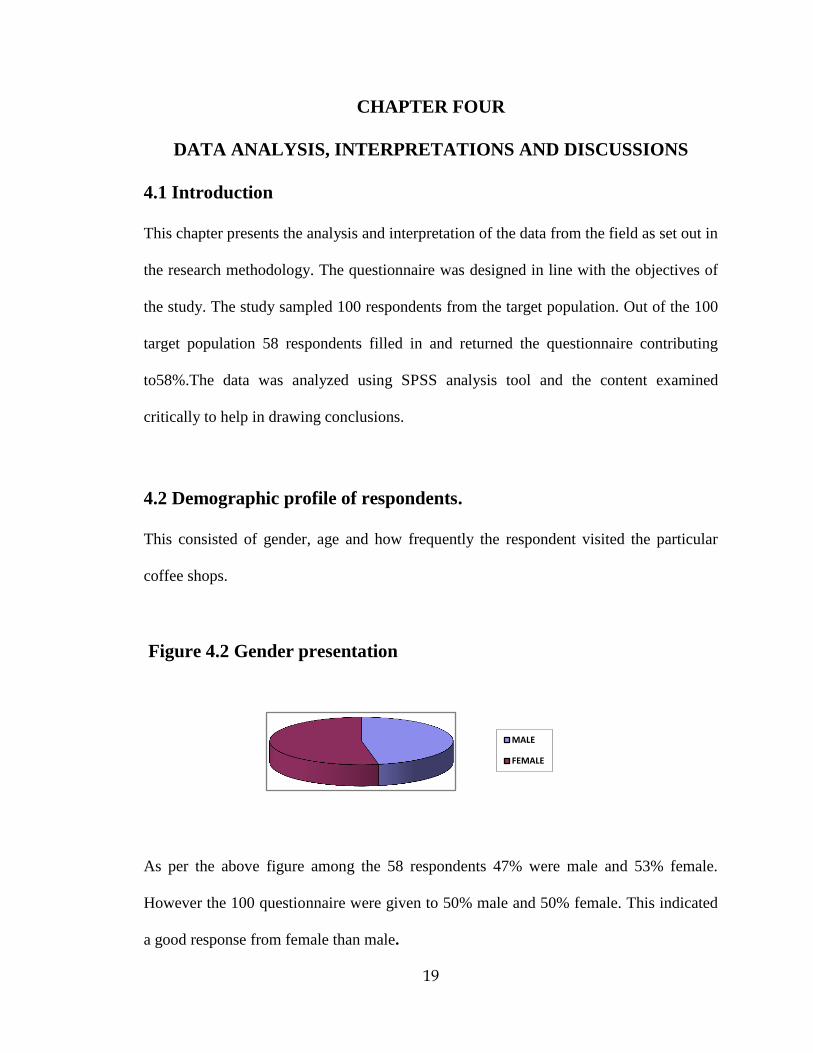
4.2 Demographic profile of respondents.
This consisted of gender, age and how frequently the respondent visited the particular
coffee shops.
Figure 4.2 Gender presentation
As per the above figure among the 58 respondents 47% were male and 53% female.
However the 100 questionnaire were given to 50% male and 50% female. This indicated
a good response from female than male.
MALE
FEMALE

20
Table 4.1: Age brackets
Frequency Percent
Cumulative
Percent
Valid 12<25 14 24.1 24.1
25<35 20 34.5 58.6
35<45 17 29.3 87.9
45<55 6 10.3 98.3
55 AND ABOVE 1 1.7 100.0
Total 58 100.0
As shown above age set of 12<25 was presented by 24.1% of the data collected, 25<35
by 34.5% which indicated the highest age bracket of the guest in the coffee houses.35<45
showed 29.3%, 45<55 registered 10.3% and 55 and above indicated 1.7%. This shows
that the majority of customers in Nairobi, Kenya coffee shops ranges between 25 to35
years of age.
Table 4.2: No of Years
N Valid 58
Missing 0
Mean 2.31
Std. Deviation 1.012
This gave a mean of 2.31 on the visitors’ age, indicating on average the customers
visiting the coffee shops are age between 25 to 35 years.

21
Table 4.3: No. of Times of Visitation
Frequency Percent
Cumulative
Percent
Valid DAILY 13 22.4 22.4
2<6DAYS PER WEEK 21 36.2 58.6
WEEKLY 24 41.4 100.0
Total 58 100.0
Table 4.4: No of Times
N Valid 58
Missing 0
Mean 2.19
Std. Deviation .783
The study also sought to establish how regularly the customers visited the coffee shops.
Results showed that 22% of the respondents visited those specific coffee shops on a daily
basis, 36% 2 to 6 days a week and 41% on a weekly basis respectively.
4.3 Service Rating and Technology
The study further sought to evaluate and determine how the customers perceived the
coffee shops incorporated technology during service offering and rating of the service
quality of those coffee shops. The respondents provided the following views.

22
Table 4.5: Service Rating
Frequency Percent
Cumulative
Percent
Valid VERY GOOD 2 3.4 3.4
GOOD 39 67.2 70.7
MODERATE 17 29.3 100.0
Total 58 100.0
Table 4.6: Rate of Service Quality
N Valid 58
Missing 0
Mean 3.74
Std. Deviation .515
The above two tables present the customer’s views on service offered by the coffee
shops in Nairobi. Table b. gave on average a mean of 3.74 on a deviation of .515 which
was very valid. Table a, showed that 67.2% of the respondents felt that the service was
good that a mark of four on a scale of 1to 5, while 29.3% experienced an average service
and only 3.4% had a very good encounter. Meaning none had poor or very poor service.
Therefore coffee shops service providers in Nairobi give good service to their customers.
23
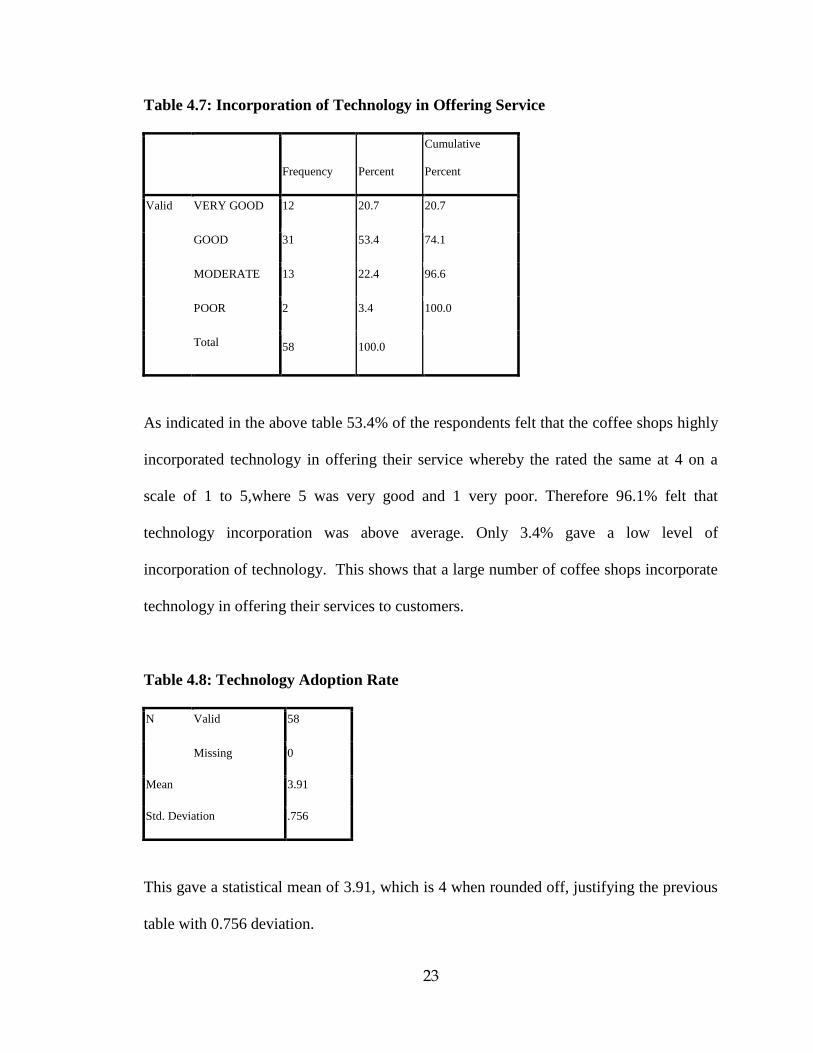
Table 4.7: Incorporation of Technology in Offering Service
Frequency Percent
Cumulative
Percent
Valid VERY GOOD 12 20.7 20.7
GOOD 31 53.4 74.1
MODERATE 13 22.4 96.6
POOR 2 3.4 100.0
Total 58 100.0
As indicated in the above table 53.4% of the respondents felt that the coffee shops highly
incorporated technology in offering their service whereby the rated the same at 4 on a
scale of 1 to 5,where 5 was very good and 1 very poor. Therefore 96.1% felt that
technology incorporation was above average. Only 3.4% gave a low level of
incorporation of technology. This shows that a large number of coffee shops incorporate
technology in offering their services to customers.
Table 4.8: Technology Adoption Rate
N Valid 58
Missing 0
Mean 3.91
Std. Deviation .756
This gave a statistical mean of 3.91, which is 4 when rounded off, justifying the previous
table with 0.756 deviation.
24
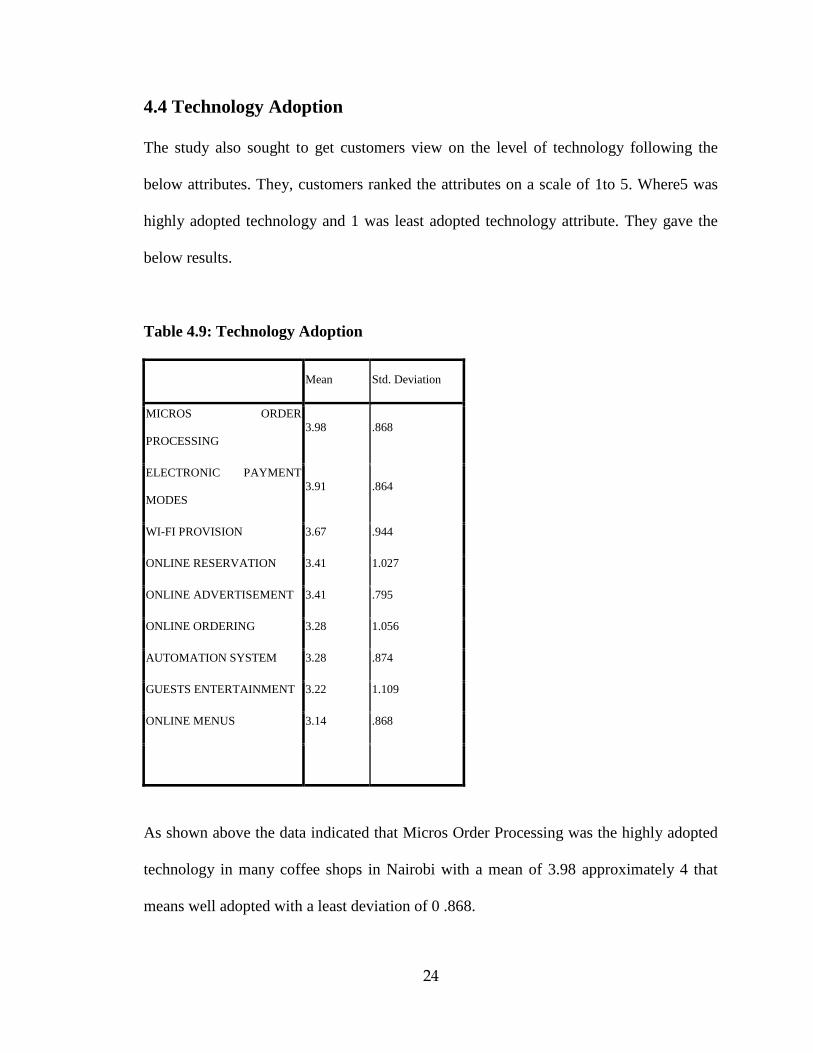
4.4 Technology Adoption
The study also sought to get customers view on the level of technology following the
below attributes. They, customers ranked the attributes on a scale of 1to 5. Where5 was
highly adopted technology and 1 was least adopted technology attribute. They gave the
below results.
Table 4.9: Technology Adoption
Mean Std. Deviation
MICROS ORDER
PROCESSING
3.98 .868
ELECTRONIC PAYMENT
MODES
3.91 .864
WI-FI PROVISION 3.67 .944
ONLINE RESERVATION 3.41 1.027
ONLINE ADVERTISEMENT 3.41 .795
ONLINE ORDERING 3.28 1.056
AUTOMATION SYSTEM 3.28 .874
GUESTS ENTERTAINMENT 3.22 1.109
ONLINE MENUS 3.14 .868
As shown above the data indicated that Micros Order Processing was the highly adopted
technology in many coffee shops in Nairobi with a mean of 3.98 approximately 4 that
means well adopted with a least deviation of 0 .868.

25
4.5 Service Quality
The study also sought to know the level of service quality in the coffee shops in Nairobi,
this was done by use of the Servqual scale units of quality measurement .Five common
Servqual attributes namely: Reliability, Assurance, Responsiveness, Empathy and
Tangibles were use to collect data on a rating of 1-5, where 1 meant below customer’s
expectation and 5 above customer’s expectation. The following results were generated.
Table 4.10: Service Quality Ranking
Mean Std. Deviation
CLEAN PREMISES 4.17 .729
SMART STAFF 4.10 .693
WILLING SERVICE STAFF 4.02 .737
CONVINIENT TIME 4.00 .749
COURTEOUS STAFF 3.97 .700
PROMPT SERVICE 3.91 .601
ACCURACY BILLING 3.86 .760
KNOWLEDGEABLE STAFF 3.79 .695
CONVINIENT PAYMENT
MODES 3.79 .767
TIMELY ENQUIRY 3.76 .683
SERVICE TIME 3.74 .609
CUSTOMER FEEDBACK 3.71 .838
CORRECT RECORD 3.64 .765
STAFF GUEST
UNDERSTANDING 3.62 .875
STAFF GUEST BONDING 3.47 .922
STAFF XTRA MILE 3.41 .956

26
As shown by the above table clean premises had the highest ranking with a mean of 4.17
followed by smartness of the staff with a mean of 4.10.All the service quality attributes
were ranked slightly higher than expected by customers. This implies that service offered
by coffee shops in Nairobi is above customers’ expectation.
4.6 Relationship between Technology and Service Quality
The technology variables were correlated with the service quality variables. This resulted
into a correlation matrix shown below. From the matrix, the micros order processing was
found to be significant as it had a correlation of 0.549 with staff willingness to serve
customers. This implied that when staff uses this system orders are processed faster and
accurately and customers perceive the staff to be willing to assist hence quality service.
This variable had a moderate relationship with variable Y14 (staff going extra mile to ask
the wear about of customers), Y13 (staff guest bonding) and Y7 (convenient opening
time).However, the strength with other variables was weak.
Electronic payment modes was also significant with Y10 (willingness of staff to serve
customers) and Y9 (providers offering prompt services).
WI-FI provision was also slightly significant with Y2 (service time as promised), Y9(
providers offering prompt services), and Y10 (willingness of staff to serve customers)
Online ordering was only significant with Y2 (service time as promised) at
p=0.04.However online reservation was statistically significant with Y2 (service time as
promised) and Y12 (staff understanding the guests)

27
All the other variables were not statistically significant therefore the coffee shops should
concentrate on using the micros order processing or improve their order entry method,
electronic ordering, WI-FI provision, online ordering and online reservation. The online
menus and online advertisement were not statistically significant therefore, do not
influence service quality to a great extend as per this study.

28
4.6.1 Correlation Analysis
Correlations
Y1 Y2 Y3 Y4 Y5 Y6 Y7 Y8 Y9 Y10 Y11 Y12 Y13 Y14 Y15 Y16
AUTOMATION SYSTEM
Pearson Correlation
.099 .038 .138 .130 -.020 .160 .107 .231 .213 .319* .008 .070 .077 .176 .155 .172
Sig. (2-tailed)
.458 .780 .303 .329 .882 .230 .424 .081 .108 .015 .952 .600 .564 .187 .246 .197
ONLINE MENUS Pearson Correlation
.077 .268* .003 .066 .019 .226 .027 .116 .124 .133 -.115 .232 .138 .163 -.112 .045
Sig. (2-tailed)
.568 .042 .984 .624 .887 .089 .841 .385 .353 .318 .392 .080 .303 .222 .404 .737
ONLINE ADVERTISEMENT
Pearson Correlation
.020 .044 .038 .184 .158 -.157 -.029 .155 .039 .077 -.145 .053 .092 .140 -.174 .056
Sig. (2-tailed)
.882 .744 .777 .168 .237 .239 .826 .246 .770 .564 .278 .693 .494 .294 .190 .674
MICROS ORDER PROCESING
Pearson Correlation
.070 .191 .023 .316* .256 .186 .324
* .318
* .333
* .549
** -.005 .384
** .405
** .432
** .324
* .282
*
Sig. (2-tailed)
.604 .152 .864 .016 .053 .163 .013 .015 .011 .000 .968 .003 .002 .001 .013 .032
ELECTRONIC PAYMENT MODES
Pearson Correlation
.191 .024 .115 .169 .233 .134 .108 .142 .391** .415
** .079 .258 .183 .278
* .162 .275
*
Sig. (2-tailed)
.152 .861 .389 .205 .079 .316 .418 .286 .002 .001 .558 .051 .168 .035 .226 .037
GUESTS ENTERTAINMENT
Pearson Correlation
-.027 .113 -.004 -.058 .198 .223 .106 -.228 .135 -.005 -.089 .071 .016 .076 -.190 -.027
Sig. (2-tailed)
.842 .397 .974 .667 .137 .092 .430 .085 .313 .971 .507 .596 .903 .568 .152 .841
WI-FI PROVISION Pearson Correlation
.124 .400** .058 .142 .216 .076 .298
* .256 .321
* .311
* .002 .123 .199 .172 -.055 .160
Sig. (2-tailed)
.352 .002 .664 .288 .104 .570 .023 .052 .014 .018 .990 .357 .135 .196 .684 .230
ONLINE ORDERING
Pearson Correlation
.191 .304* .048 .084 .151 .192 .200 .070 .038 -.006 -.080 .210 .082 .163 -.064 .119
Sig. (2-tailed)
.151 .020 .719 .529 .258 .149 .133 .604 .776 .963 .551 .113 .540 .221 .635 .372
ONLINE RESERVATION
Pearson Correlation
.239 .371** .074 -.029 .098 .164 .205 .170 .030 .129 -.023 .373
** .127 .234 .013 .184
Sig. (2-tailed)
.071 .004 .579 .831 .466 .219 .122 .202 .821 .333 .864 .004 .344 .077 .924 .166

29
KEY
Y1 Y2 Y3 Y4 Y5 Y6 Y7 Y8 Y9
Y1
0 Y11 Y12 Y13
Y
14
Y1
5 Y16
CO
RR
EC
T
RE
CO
RD
SE
RV
ICE
TI
ME
ACC
URA
CY
BIL
LIN
G
COU
RTE
OUS
STA
FF
KNOW
LEDGE
ABLE
STAFF
CUS
TO
MER
FEE
DBA
CK
CON
VINI
ENT
TIME
TI
ME
LY
EN
QUI
RY
PR
OM
PT
SE
RV
ICE
WI
LLI
NG
SE
RV
ICE
ST
AF
F
CON
VINI
ENT
PAY
MEN
T
MOD
ES
STAFF
GUEST
UNDE
RSTAN
DING
ST
AFF
GU
EST
BO
NDI
NG
ST
A
FF
X
T
R
A
M
IL
E
S
M
A
RT
ST
AF
F
CLE
AN
PRE
MIS
ES
4.7 Regression of Service Quality Against Technology
Each of the service quality variables was regressed against all the technology variables. It
was established that only service time, timely enquiry and staff willingness were found to
be statistically significant table 4.7.1, table 4.7.2 and table 4.7.3. This meant that only
these three variables could be significantly predicted using the listed technology
variables.

30
Table 4.11: Service Time
ANOVAb
Model Sum of Squares df Mean Square F Sig.
1 Regression 7.543 8 .943 3.403 .003a
Residual 13.578 49 .277
Total 21.121 57
a. Predictors: (Constant), ONLINE RESERVATION, ELECTRONIC PAYMENT MODES, ONLINE
ADVERTISEMENT, WI-FI PROVISION, ONLINE MENUS, GUESTS ENTERTAINMENT , MICROS
ORDER PROCESING, ONLINE ORDERING
b. Dependent Variable: SERVICE TIME
F(58,95)=3.403, P<0.003
Table 4.12: Timely Inquiry
ANOVAb
Model Sum of Squares df Mean Square F Sig.
1 Regression 10.336 8 1.292 3.887 .001a
Residual 16.285 49 .332
Total 26.621 57
a. Predictors: (Constant), ONLINE RESERVATION, ELECTRONIC PAYMENT MODES, ONLINE
ADVERTISEMENT, WI-FI PROVISION, ONLINE MENUS, GUESTS ENTERTAINMENT , MICROS
ORDER PROCESING, ONLINE ORDERING
b. Dependent Variable: TIMELY ENQUIRY
F(58,95) =3.887, P< 0.001

31
Table 4.13: Staff Willingness to Serve
ANOVAb
Model Sum of Squares df Mean Square F Sig.
1 Regression 12.252 8 1.531 4.006 .001a
Residual 18.731 49 .382
Total 30.983 57
a. Predictors: (Constant), ONLINE RESERVATION, ELECTRONIC PAYMENT MODES, ONLINE
ADVERTISEMENT, WI-FI PROVISION, ONLINE MENUS, GUESTS ENTERTAINMENT , MICROS
ORDER PROCESING, ONLINE ORDERING
b. Dependent Variable: WILLING SERVICE STAFF
F(58,95)= 4.006,P<0.001

32
CHAPTER FIVE
SUMMARY CONCLUSIONS AND RECOMMENDATIONS
5.1 Introduction
This chapter provides the summary of the findings from chapter four, giving conclusions
and recommendations of the study based on the objectives of the study. The objective this
study was to establish the extent of adoption of technology among coffee shops in Kenya
and service quality in the coffee shops and hence establish the relationship between
service quality and technology among coffee shops in Nairobi, Kenya.
5.2 Summary
The objectives of this study were to establish the extent of adoption of technology among
coffee shops in Nairobi, Kenya and to establish the relationship between service quality
and technology among coffee shops in Nairobi, Kenya. As per the study technology as
been widely adopted by coffee shops in Nairobi Kenya, such technologies include: online
menus, online reservation, micros order processing system, provision on free internet to
customers and office automation systems. The study further clarifies the relationship
between technology and service quality with the correlation which was regressed to
indicate how the service quality varies with technology.

33
5.3 Conclusions
In conclusion, technology as become the nature of the globe hence it drives the
operations of the universe, it is the key to success of any business, in specific in the
service industry technology is the stepping step to improvement of service quality .As per
this study technology plays a major role in coffee shop’s service quality. Provision of Wi-
Fi, Electronic payment modes, Micros order processing systems, service time,
willingness of the staff to serve as well as online reservation influence service quality in
coffee shops.

34
REFERENCES
Australian Coalition of Service Industries Annual Review (1997), Spectator or Serious
Player? Competitiveness of Australia’s Information Industries, pp.20
Australian Coalition of Service Industries Annual Review (1997), The Global
Information Economy: The Way Ahead, pp.21.
Barta, P. and Chalker, A.M. (2001), Consumers Voice Rising Dissatisfaction With
Companies. The Wall Street journal, May21 pg 42
Bateson, J.E. (1984), Perceived Control and the Service Encounter.
Bitner and Hubert (1994) Technology Infusion In Service Encounters. Journal of the
Academy of Marketing Science Vol. 28.No 1,pp 138-49
Bitner, M .J (2001), “Self-service technology: what do customers expect? Marketing
Management, Spring, pp. 10-11.
Cronin J.T. and Tayol S. A. (1992) Measuring Service Quality: An Examination Of
Extension. Journal of Marketing, 56(3):55-69
Dabholkar, P (1994), "Technology based service delivery", Advances in Services
Marketing and Management, Vol. 3 pp.241-71.
Donabedian, A. (1980), The Definition of Quality and Approaches to its Assessment,
Health Administration Press
Ann, A. Grönroos, C. (1984), A Service Quality Model And Its Market
Implications. European Journal of Marketing, Vol. 18 No.4, pp.36-44.
35
Gronroos, C. (2001), Strategic Management and Marketing in the Service Sector.
Swedish School of Economics and Business Administration, Helsingfors.
Gummeson, E. (1991), Qualitative Methods in Management Research, Sage Publications.
Heskett, J.L., Jones, T., Lovemen, G., Sasser, W.E. and Schlesinger, L. (1994), Putting
the Service Profit Chain To Work”, Harvard Business Review, March/April
Kandampully, J. and Duddy, R. (1999), Relationship Marketing: A Concept Beyond The
Primary Relationship”, Marketing Intelligence & Planning, Vol. 17 No. 7, pp.
315-23.
Kelley, S. (1989), Efficiency in Service Delivery: Technology or Humanistic
Approaches? The Journal of Services Marketing, Vol. 3 No.3, pp.43-51.
Kunst, P.E.J. and Lemmink, J. (2000), Quality Management and Business Performance in
Hospitals: A Search for Success Parameters”, Total Quality Management, Vol. 11
No. 8, pp. 1123-33.
Lehtinen, U., Lehtinen, J.R. (1982), Service Quality – A Study Of Dimensions, Service
Management Institute. Helsinki, Unpublished Working Paper, pp.439-60
Mathew, J., Cindy, M. and Beatriz J. (1999), Service Quality in the Banking Sector: The
Impact of Technology on Service Delivery. International Journal of Bank
Marketing, Vol. 17 Iss: 4, pp.182 – 193.
Mick, D. G and Fournier, S. (1998), Paradoxes of Technology: Consumer Cognizance,
Emotions, and Coping Strategies, Journal of consumer Research, Vol.25,
September, pp. 123-43.
Ombati T. (2007). A Survey on the Relationship between Technology and Service
Quality in the Banking Industry in Kenya.

36
Parasuraman, A. and Colby, C.L. (2001), Techno-Ready Marketing: How and Why
Customers Adopt Technology, The Free Press, New York, NY.
Parasuraman, A., Zeithaml, V. and Berry, L.L. (1985), A conceptual Model of Service
Quality and its Implications for Future Research', Journal of Marketing, Vol. 49
No. 4, pp. 41-50.
Parasuraman, A., Zeithaml, V.A., Berry, L.L. (1994), Alternative Scales for Measuring
Service Quality: A Comparative Assessment Based on Psychometric and
Diagnostic Criteria", Journal of Retailing, Vol. 70 No.3, pp.201-30.
Parasuraman, A., Berry, L.L., Zeithaml, V.A. (1991), Refinement and Reassessment of
the SERVQUAL Scale, Journal of Retailing, Vol. 67 No.4, pp.420-50.
Parasuraman, A., Zeithaml, V. and Berry, L.L. (1988), ``SERVQUAL: A Consumer
Perceptions of Service Quality, Journal of Retailing, Vol. 64 No. 1,
Quinn, B. (1996), The Productivity Paradox Is False: Information Technology Improves
Service Performance, Advances in Services Marketing and Management, Vol. 5
pp.16-21.
Rowley, J. (1998), Quality Measurement in the Public Sector: Some Perspectives from
the Service Quality Literature, Total Quality Management, Vol. 9 No. 2/3, pp.
321-333.
Small, M.H. and Yasin, M.M. (1997), Developing a Framework for the Effective
Planning and Implementation of Advance Manufacturing Technology,
International Journal for Operations & Production Management, pp. 468-89.

37
Smith, T.M. and Reece, J.S. (1999), The Relationship of Strategy, Fit, Productivity and
Business Performance in a Service Setting. Journal of Operations Management,
Vol. 17, pp. 145-6
Walker, R.H. and Craig-Lees, M. (2002), Technology-Enabled Service Delivery: An
Investigation of Reason Affecting Customer Adoption and Rejection,
International Journal of Service Industry Management, Vol. 13, pp. 91-106.
Weatherall, D.J., Ledingham, J.G.G, and Worrell, D.A (1984), Oxford Textbook of
Medicine, Oxford University Press, Oxford.
Zeithaml, V. A, Parasuraman A., and Berry L. L. (1990), Delivering Service Quality. N
Y: The Free Press, New York.
38
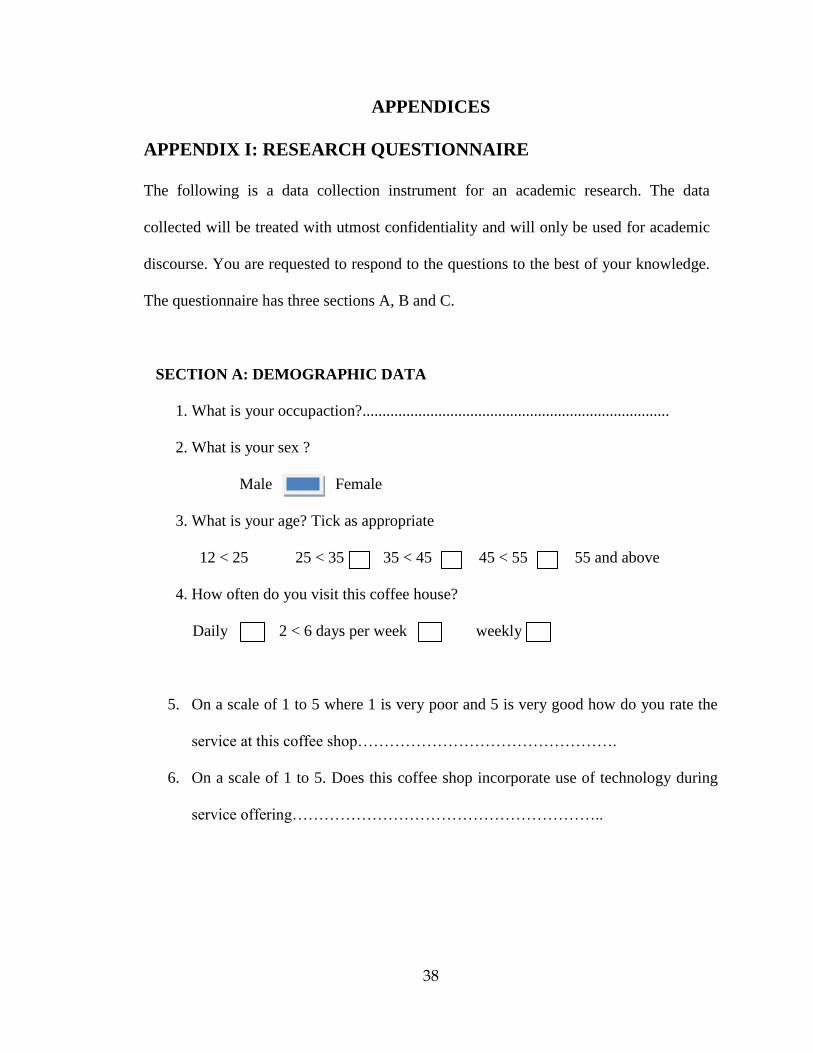
APPENDICES
APPENDIX I: RESEARCH QUESTIONNAIRE
The following is a data collection instrument for an academic research. The data
collected will be treated with utmost confidentiality and will only be used for academic
discourse. You are requested to respond to the questions to the best of your knowledge.
The questionnaire has three sections A, B and C.
SECTION A: DEMOGRAPHIC DATA
1. What is your occupaction?.............................................................................
2. What is your sex ?
Male Female
3. What is your age? Tick as appropriate
12 < 25 25 < 35 35 < 45 45 < 55 55 and above
4. How often do you visit this coffee house?
Daily 2 < 6 days per week weekly
5. On a scale of 1 to 5 where 1 is very poor and 5 is very good how do you rate the
service at this coffee shop………………………………………….
6. On a scale of 1 to 5. Does this coffee shop incorporate use of technology during
service offering…………………………………………………..

39
SECTION B: TECHNOLOGY ADOPTION
Using a scale of 1-5, please rank the attributes below on the level of technology
adoption by the coffee shops that you have received service from as per your
opinion.(Where 1 means least adoption and 5 –highly adopted)
SN Attribute 1 2 3 4 5
Availability of office automation system
Online menus
Online advertisement
Micros order processing system
Electronic visa payment of bills/mpesa payments
Provision of entertainment while waiting for orders to be processed
Provision of Wi-Fi
Online ordering
`Online reservation

40
C: SERVICE QUALITY
Using a scale of 1-5, please rank the attributes below on the level of service quality in
this coffee shop as per your opinion.(Where 1 means below customer’s expectation,3-
as expected by customer and 5 –above customer’s expectation.)
SN Attribute 1 2 3 4 5
1)Reliability:
Correct record keeping
Service is completed at promised time
Accuracy of billing
2)Assurance
Courtesy of service staff
A bunch of knowledgeable staff
Provides customer feedback services
Operates on the best time scale for customers
3)Responsiveness
Timely response to customer enquiry( online, telephone)
Prompt service to customers
Willingness of staff to serve customers
4)Empathy
Convenient payment modes
Employee understanding of the customer
Creating a bond with the guest
5)Tangibles
Going an extra mile asking the guest whether he/she
enjoyed the stay
Smartly dressed staff
`Availability of clean physical facilities(tables, lounge)
******THANK YOU******

41
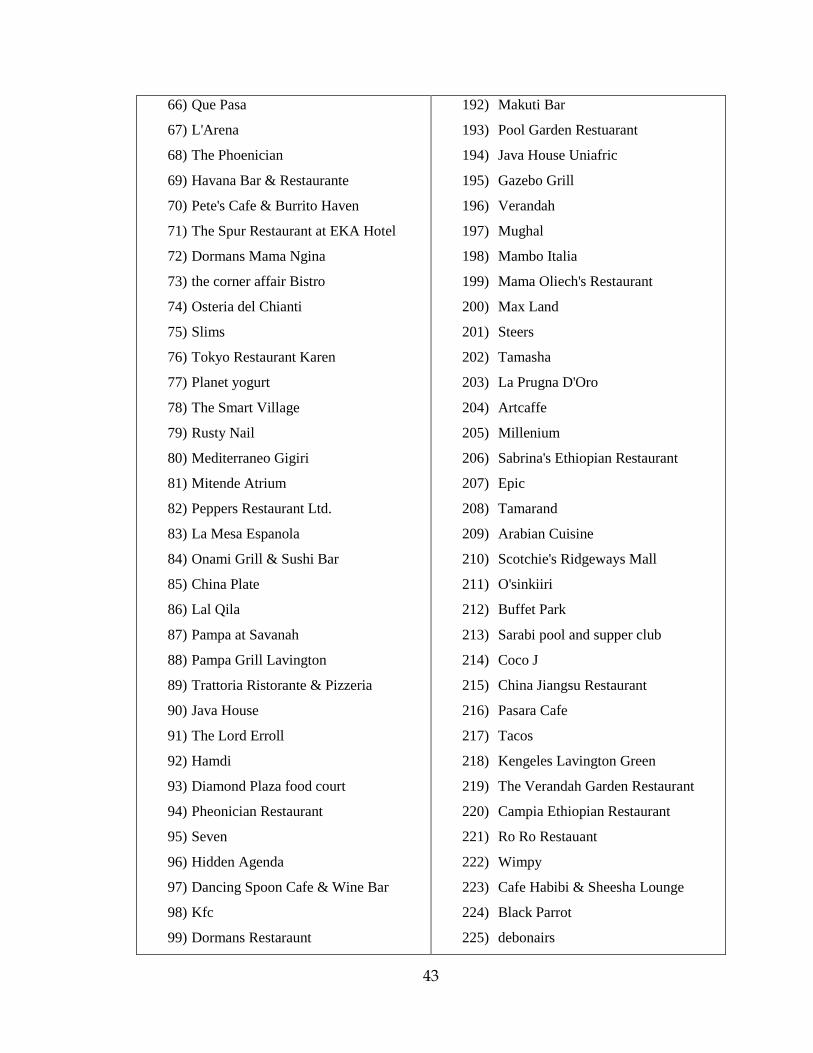
APPENDIX II: LIST OF COFFEE HOUSES
1) Talisman
2) Open House
3) Pango Brasserie at the Fairview
4) Purdy Arms
5) Fogo Gaucho Churrascaria
6) Tamarind Restaurant
7) Haandi
8) Seven Seafood & Grill
9) Tamambo Karen Blixen
10) Thai Chi Restaurant - The Stanley
Hotel
11) Aero Club of East Africa Restaurant
12) Abyssinia
13) Naked Pizza
14) Norfolk Hotel
15) Hashmi`s Restaurant
16) For you chines resturant
17) Java coffee house
18) La Salumeria
19) Furasato
20) Zen Garden Restaurant
21) Village Market
22) Pampa Churrascaria
23) Brew Bistro & Lounge
24) TASTE OF CHINA
25) WWW Shop and Bar Ltd - The Wine
Expert in East Africa
26) The Carnivore Restaurant
27) Habesha
28) Nairobi Java House Downtown
29) Bridges Organic Health Restaurant
30) THORN TREE CAFE
126) Riya's Delicious Corner
127) Havanna
128) aladdin
129) Plaza Cafe
130) Shamururas Bar
131) Zaytoon
132) Upperhill Springs
133) Zapata mexican
134) Ankara food court
135) California Cookies
136) Malindi Dishes
137) Tropez
138) Highland Annexe
139) Vamus
140) Spring Garden
141) Jamia Plate
142) Amaica The Restaurant
143) Rangers
144) Porterhouse Restaurant
145) Urban Gourmet Burgers
146) Vineyard Restaurant And Wine Bar
147) Big Five Restaurant & Bar
148) Royal Kitchen
149) Velvet Bar & Grill
150) Heartz restaurant
151) Dilitante Pizza
152) Greenview Restaurant
153) Njugunas
154) Nairobi Nihonjin Club
155) Siam Thai
156) Corner Bistro
157) Sarit Centre

42
31) Ambiance
32) Mediterraneo
33) Moonflower
34) Ranalo Foods
35) Yaya Centre
36) Hashmi Barbeque
37) Cedars
38) Anghiti Restaurant
39) Bar B. Q. Tonight
40) Monikos
41) Brew Bisttro pub and lodge
42) Oro Restaurant and Lounge
43) Mukutan Garden Cafe
44) Osteria Gigiri
45) Trattoria
46) Furusato Japanese Restaurant
47) Rolf's Place
48) Artcaffe
49) Tatu
50) Haveli
51) Pwani pool restaurant
52) Mandhari Restaurant
53) Mediterraneo
54) Bangkok Chinese Restaurant
55) Chowpaty
56) Panda Chinese Restaurant
57) Nairobi Java house
58) Exchange Bar
59) Le Rustique
61) Misono
62) Blanco's Lounge & Grill
63) Pool Deck Restaurant
64) Osteria Karen
65) La dolce vita
158) Langi Langi Restaurant & Bar
159) Nyama Choma Stalls
160) Remenisce
161) Nyama Choma Place
162) Prime Cuts Butchery and Bistro
163) Legends Restaurant
164) Oleader Cafe
165) Kentmere Club
166) Dormans Westgate
167) Urban coffee
168) McFrys
169) Visa Place
170) Try My Thai & Sushi Restaurant
171) Secret Garden nairobi
172) Hong Kong
173) Seasons restaurant
174) Java House Jomo Kenyatta Airport
175) Under The Radar
176) Galileo's
177) Rayan Hotel & Restaurant
178) Kengeles Bar & Restaurant
179) Al Pasha
180) Lord Delamere Terrace
181) Mystique Gardens
182) Alan Bobbe's Bistro
183) Divino Restaurant & Wine Bar
184) The Mug Restaurant
185) Mercury, The Last Drop
186) Fiesta Restaurant & Bar
187) Flame Tree Restaurant
188) Valencia Garden
189) Nargis
190) Ashiana Vegetarian Restaurant
191) Rendezvous Restaurant
43
66) Que Pasa
67) L'Arena
68) The Phoenician
69) Havana Bar & Restaurante
70) Pete's Cafe & Burrito Haven
71) The Spur Restaurant at EKA Hotel
72) Dormans Mama Ngina
73) the corner affair Bistro
74) Osteria del Chianti
75) Slims
76) Tokyo Restaurant Karen
77) Planet yogurt
78) The Smart Village
79) Rusty Nail
80) Mediterraneo Gigiri
81) Mitende Atrium
82) Peppers Restaurant Ltd.
83) La Mesa Espanola
84) Onami Grill & Sushi Bar
85) China Plate
86) Lal Qila
87) Pampa at Savanah
88) Pampa Grill Lavington
89) Trattoria Ristorante & Pizzeria
90) Java House
91) The Lord Erroll
92) Hamdi
93) Diamond Plaza food court
94) Pheonician Restaurant
95) Seven
96) Hidden Agenda
97) Dancing Spoon Cafe & Wine Bar
98) Kfc
99) Dormans Restaraunt
192) Makuti Bar
193) Pool Garden Restuarant
194) Java House Uniafric
195) Gazebo Grill
196) Verandah
197) Mughal
198) Mambo Italia
199) Mama Oliech's Restaurant
200) Max Land
201) Steers
202) Tamasha
203) La Prugna D'Oro
204) Artcaffe
205) Millenium
206) Sabrina's Ethiopian Restaurant
207) Epic
208) Tamarand
209) Arabian Cuisine
210) Scotchie's Ridgeways Mall
211) O'sinkiiri
212) Buffet Park
213) Sarabi pool and supper club
214) Coco J
215) China Jiangsu Restaurant
216) Pasara Cafe
217) Tacos
218) Kengeles Lavington Green
219) The Verandah Garden Restaurant
220) Campia Ethiopian Restaurant
221) Ro Ro Restauant
222) Wimpy
223) Cafe Habibi & Sheesha Lounge
224) Black Parrot
225) debonairs

44
100) Cafe Maghreb
101) Sierra Brasserie
102) Muhibbah
103) The River Cafe
104) About Thyme
105) Jiko
106) Kahawa
107) Mercury Lounge
108) casablanca bar
109) Oasis Restaurant - Southern Sun
Mayfair Nairobi
110) Gipsy Bar
111) Azalea
112) Artcaffe
113) Bobos
114) Macushla
115) Pitcher & Butch
116) Mac Frys
117) Pizza Inn
118) Zafferano
119) Benares nivina towers westlands
road nairobi
120) panari hotel
121) Tamambo Bar and Grill
122) Tapas Ceviche Bar Nairobi
123) Emerald Garden
124) Blanco's Sports Grill
125) Hot Dishes restaurant
226) Tanager Bar & Restaurant
227) Bonds Garden Restaurant
228) Masrawy Restaurant
229) Beneve Coffee Houses
230) Taj Seasons Restaurant
231) Supreme Restaurant
232) Etouch Food Court
233) Mister Wok Chinese Restaurant
234) FK Restaurant
235) Rudy's Chic Joint
236) Ibis Restaurant
237) Haru Japanese Restaurant
238) Kowloon Garden Chinese Restaurant
239) Blue Plate Ren Ren Chinese
Restaurant
240) The Restaurant @ The Crown Place
241) AL Caputo Italian Restaurant
Pizzeria
242) Tipuana Garden Restaurant
243) The Waterhole, Nairobi Didi's
Resturant
244) The Orchid Lounge
245) Palacina Dinner Court
246) Sippers Absolute Juice
247) Art cafe Azalea-Caribea
248) The Royal Terrace Coffee Shop
Top Related
Copyright © 2022 FDOKUMEN

