


Bahasa
Halaman
Hukum

44thESReDA Seminar RAMS impact on Asset Management Stakeholders and Risk Assessment
Methodologies 9th and 10th May 2013, Faculty of Engineering, University of Porto, Portugal
205
Technical lifetime of HVAC installations, an opportunity or a threat for installation
contractors? C.F.H. (Cyp) van Rijn, Asset Management Consultancy (AMC), R.G. (Ronald) Kollaard, The Government Buildings Agency (GBA, Rgd) and C.M. (Coen) van de Sande, project manager FME-NVKL (the Dutch Association of Enterprises in the field of Refrigeration and Air Treatment).
Abstract
The technical lifetime of (components of) building installations is a fundamental parameter in building maintenance, both for the owner, the manufacturer and for installation contractors. For the latter, long-term performance contracts are a new market, with risks that are very different from the traditional, market-based effort commitments. Building managers are increasingly demanding a substantiation of sustainable medium-term contracts. In general, the implementation of the EU directive on conformity in the New Civil Code makes producers liable for unexpected early failure of their products. Lifetime data in the built environment are very scarce. The Government Buildings Agency (RGD), in cooperation with Asset Management Consultancy and branch organisations NVKL and VLA, has therefore developed a technique to determine such data in a reasoned manner using the condition code NEN 2767 and expert opinions. The results of two pilot projects show that these experts can provide reliable estimates of the degradation of NEN conditions over time including the inherent distribution (probability aspects). With this knowledge, maintenance decisions in terms of cost - benefit over the life cycle can be supported. The studies revealed that the degradation in time differs significantly from the hitherto used theoretical lifetime curve. Maintenance based on NEN 5 instead of 4 conditions can lead to a saving of 30-40% in replacement, but requires shorter inspection intervals than used by the current “Boei” method. The Rgd, on the basis of these important results, sponsored the development of a cloud-based software package that allows branch organisations to build their own databases. Keywords – CREAM, Corporate Real Estate Management, lifetime, building maintenance, HVAC installations, decision support, expert opinion Introduction. Building owners more and more contract out their real estate management to contractors via long-term performance contracts such as PPP (public-private partnerships), DBFMO (design, build, finance, maintain and operate) or main contracting. For these contractors, many of the SME (small and medium sized enterprises) type, this is a major expansion of their market. However, since they then become accountable for the technical condition of building components, accepting such a type of contract leads to substantial economic risks. Given that replacement investments are about seven times the costs of (preventive, corrective) maintenance, information on the remaining technical lifetime of the system is critical in contract negotiations.

44thESReDA Seminar RAMS impact on Asset Management Stakeholders and Risk Assessment
Methodologies 9th and 10th May 2013, Faculty of Engineering, University of Porto, Portugal
206
This is also true for the building owner; for evaluation purposes he will expect the contractor to use substantiated lifetimes in the tender. In this philosophy, the owner is supported by legal measures like the EU Directive w.r.t product conformity laid down in the national Civil Code. In contractual conflict situations, the ruling of the court will eventually be based on a "generally accepted" technical lifetime. However, accepted and substantiated data on lifetimes are generally missing. The Government Buildings Agency (Rijksgebouwendienst, Rgd) has therefore asked AMC to develop a technique to determine such data in a reasoned manner based on the existing concept of condition codes in the NEN 2767 standard and expert opinions. In contrast with the pseudo deterministic approach in Ref. 1, the new method inherently addresses the stochastic aspects (uncertainty) of these values, caused by the initial quality of the materials, that of the construction and assembly, the operational load and the applied maintenance strategy. With such a probabilistic description, business risks may better be estimated and the inherent uncertainty better be accepted by contract parties and in conflict situations. Background. The Government Buildings Agency (Rgd) manages approximately 2,000 objects ranging from 350 monuments to buildings of various kinds, such as palaces, offices, prisons, museums, and totalling approximately 7,000,000 m2 of gross floor area. To effectively manage this complex portfolio, the Rgd traditionally is active in the development of standards and management strategies. They use the NEN 2767 standard, as co-developer, to establish a multi-year maintenance schedule (MOP) on the basis of building inspections, user needs and the current real estate vision. The Rgd encourages medium-term contracts and public private partnerships (PPP). RGD and developed RgdBOEI ®1 to organize the inspection process of a building on the basis of integrated, efficient and effective consideration of various aspects in the field of fire safety, maintenance, energy and the notion of regulations. The multi-annual maintenance (± 130 M€ / y) is managed on the basis of risk assessments. In all projects, alternatives are evaluated in terms of lifecycle costs and sustainability. Despite these efforts, expected investments, as outlined in the MOP, turn out to deviate from practice, causing unacceptable multiannual budget under and overruns. The branch organisations NVKL and VLA represent the interests of approved suppliers, installers and maintenance contractors of building-related cooling, climate and air handling systems. In this sector in the Netherlands, about 2.5 billion € per year is spent on replacement maintenance compared to 350 million € in preventive and corrective maintenance. For these companies, the long-term contracts form a new market, significantly different from the traditional contracts where obligations are based on effort only. However, they now run a greater risk of having to replace (parts of) installations during a contract period at their own expense. In all the above examples, reliable estimates of the technical life of systems and their elements are needed, both for the supplier, the maintenance contractor and building manager; when does the need arise to replace components, elements and / or the entire system?
1 http://www.rgdboei.nl (in Dutch)

44thESReDA Seminar RAMS impact on Asset Management Stakeholders and Risk Assessment
Methodologies 9th and 10th May 2013, Faculty of Engineering, University of Porto, Portugal
207
A comparison with industry. In the large-scale industry, maintenance based on risk (Risk Based Maintenance, RBM) is already commonplace for decades. Industrial designs are by default evaluated on total lifetime costs that is: from acquisition, operational use and maintenance to disposal and ultimately demolition. In this process, the costs of technical failure play an important role, often exceeding the cost of maintenance by a factor of 10-100. Dedicated software packages are used to calculate the probability of fulfilling a functional requirement, such as a defined volume of production per hour, given a process design, selection of components and selected maintenance strategy. The required data (mean time to failure (MTTF) and its time-dependent nature, the Weibull shape factor) are found in databases like OREDA and EIREDA, besides the in-house databases of manufacturers and maintenance contractors. For a meaningful statistical determination, extensive datasets of well-identified system components over the total life are necessary. In principle, a similar approach can be used for building-related elements. Also here, system components are clearly distinguishable and each system has to fulfil specific functional requirements. However, even within large real estate organisations as the Rgd and in branch organizations, data on failure behaviour are not properly stored and hence information on the technical lifetimes of building components is missing. Even if such data would be available, a statistical approach is difficult; given the long lifetimes of 10- 60 years, the required period of data collection becomes that long that the statistical results are readily overtaken by technical innovations. Organisation of the pilot tests. The project started with a national kick-of meeting organised by the Rgd where major contractors working for the Rgd were invited. The Rgd management expressed their needs to receive better-substantiated acquisition and maintenance proposals, especially in the area of building installations. An outline of the proposed technique and its potential results was presented. Based on the positive response two pilot projects were sub sequentially started. In each case, we followed the same strategy. First, a meeting was organised with staff at managerial level of equipment suppliers and contractors focussing on the commercial aspects; how do they value the availability of substantiated data on lifetime distributions and of techniques to use that information to evaluate contracts? The reply was unanimously positive; in fact, the project addressed a long-time felt need.
44thESReDA Seminar RAMS impact on Asset Management Stakeholders and Risk Assessment
Methodologies 9th and 10th May 2013, Faculty of Engineering, University of Porto, Portugal
208
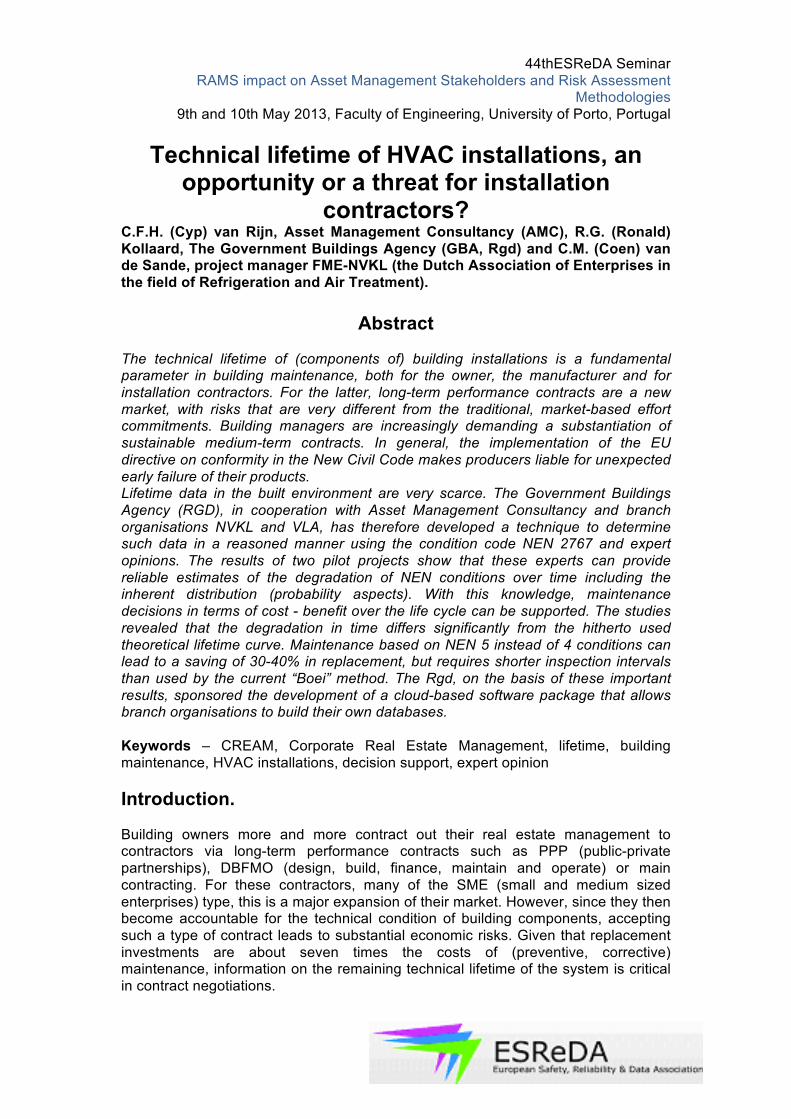
Each company provided one or more experts for a next round of meetings. It was known that these experts have an extensive hands-on experience with the systems in question, but virtually no background in systems or reliability engineering concepts. Therefore they were trained in a one-day workshop on the principles of system representation and stochastic failure behaviour. For the latter, one should realise that engineers and mechanics typically dislike uncertainty. The following approach was quite successful:
Fig. 1 From a deterministic to a stochastic approach
A designer of an installation or building chooses materials and dimensions such that under standard conditions a predefined rejection value (fitness level) is reached within an accepted time interval as outlined in the left part of Fig. 1. He can extend the life of curve A by adding additional material (curve B), or by choosing a material with higher resistance (curve C). Due to natural variations in load and environmental factors, however, this decrease in condition will fluctuate around an average value. The right-hand side of Fig. 1 shows the results of a large number of simulations with clearly different times to failure (reaching the rejection level). If we look at the number of crossings per unit of time we will eventually arrive at the dotted red probability distribution showing the average time to failure (MTTF) and its dispersion.
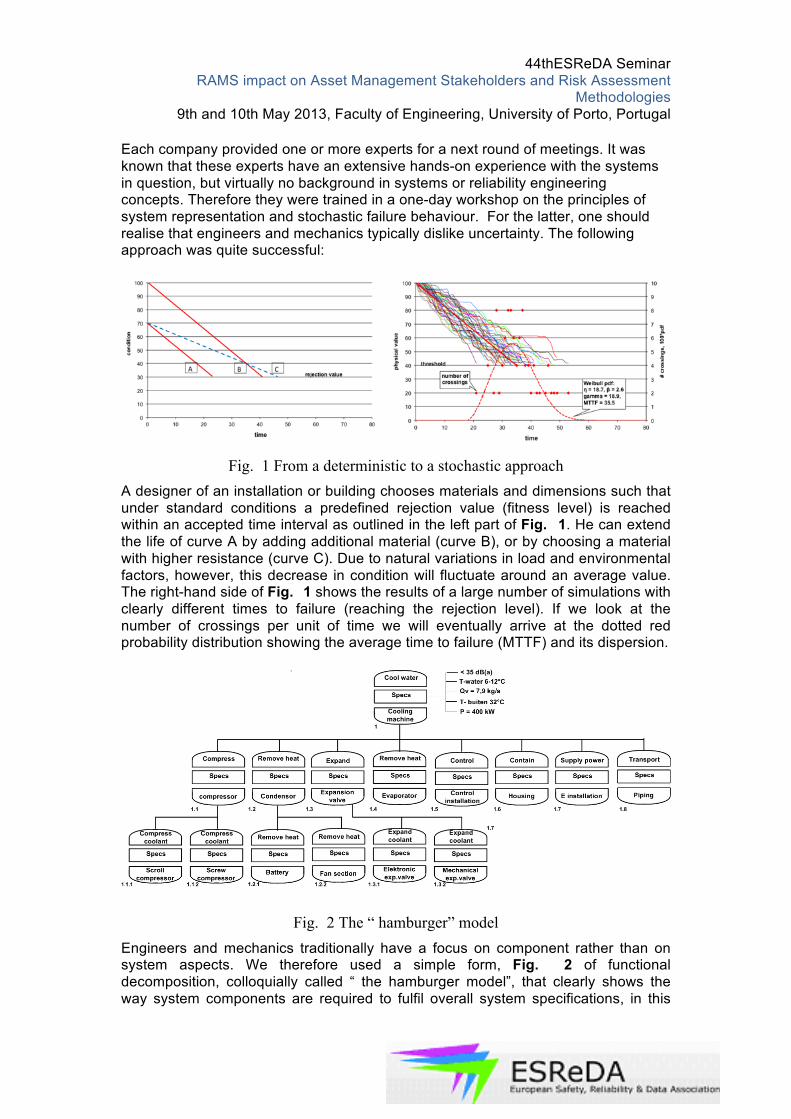
Fig. 2 The “ hamburger” model Engineers and mechanics traditionally have a focus on component rather than on system aspects. We therefore used a simple form, Fig. 2 of functional decomposition, colloquially called “ the hamburger model”, that clearly shows the way system components are required to fulfil overall system specifications, in this
44thESReDA Seminar RAMS impact on Asset Management Stakeholders and Risk Assessment
Methodologies 9th and 10th May 2013, Faculty of Engineering, University of Porto, Portugal
209
case of a chiller. Its discussion in the group of experts also provided an accepted scope of the model and a basis for a simplified RBD (Fig. 3) and FMEA.
Fig. 3 In this way, the consequences of component failure on system performance could easily be evaluated.
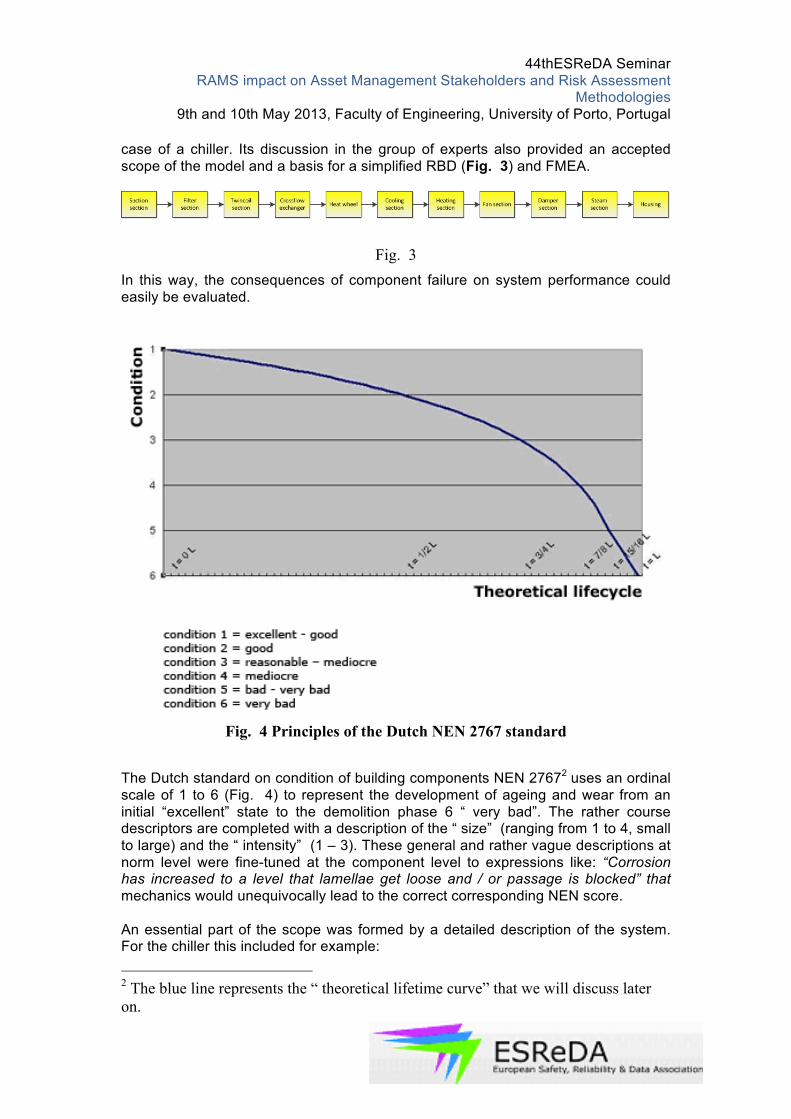
Fig. 4 Principles of the Dutch NEN 2767 standard
The Dutch standard on condition of building components NEN 27672 uses an ordinal scale of 1 to 6 (Fig. 4) to represent the development of ageing and wear from an initial “excellent” state to the demolition phase 6 “ very bad”. The rather course descriptors are completed with a description of the “ size” (ranging from 1 to 4, small to large) and the “ intensity” (1 – 3). These general and rather vague descriptions at norm level were fine-tuned at the component level to expressions like: “Corrosion has increased to a level that lamellae get loose and / or passage is blocked” that mechanics would unequivocally lead to the correct corresponding NEN score. An essential part of the scope was formed by a detailed description of the system. For the chiller this included for example:
2 The blue line represents the “ theoretical lifetime curve” that we will discuss later on.
44thESReDA Seminar RAMS impact on Asset Management Stakeholders and Risk Assessment
Methodologies 9th and 10th May 2013, Faculty of Engineering, University of Porto, Portugal
210
Location Central in the Netherlands, neighbourhood of Utrecht Situation Open air Application Office building Design Standard good quality Maintenance Good quality; all necessary care, repair and
replacement in time Office hours 5 days a week, from 8 am – 6 pm Run hours / y 1100 Full /partial load 50 / 50 % Capacity 400 kW cooling Temperature range -18 degr C (30% glycol) Condenser type air-cooled Material condenser copper / aluminium (coated) Material evaporator copper/steel (shell and tube) Compressor type 1 Scroll (configuration 1* small, 1 * large) Compressor type 2 Screw (configuration 1* small, 1 * large) Expansion valves electronic
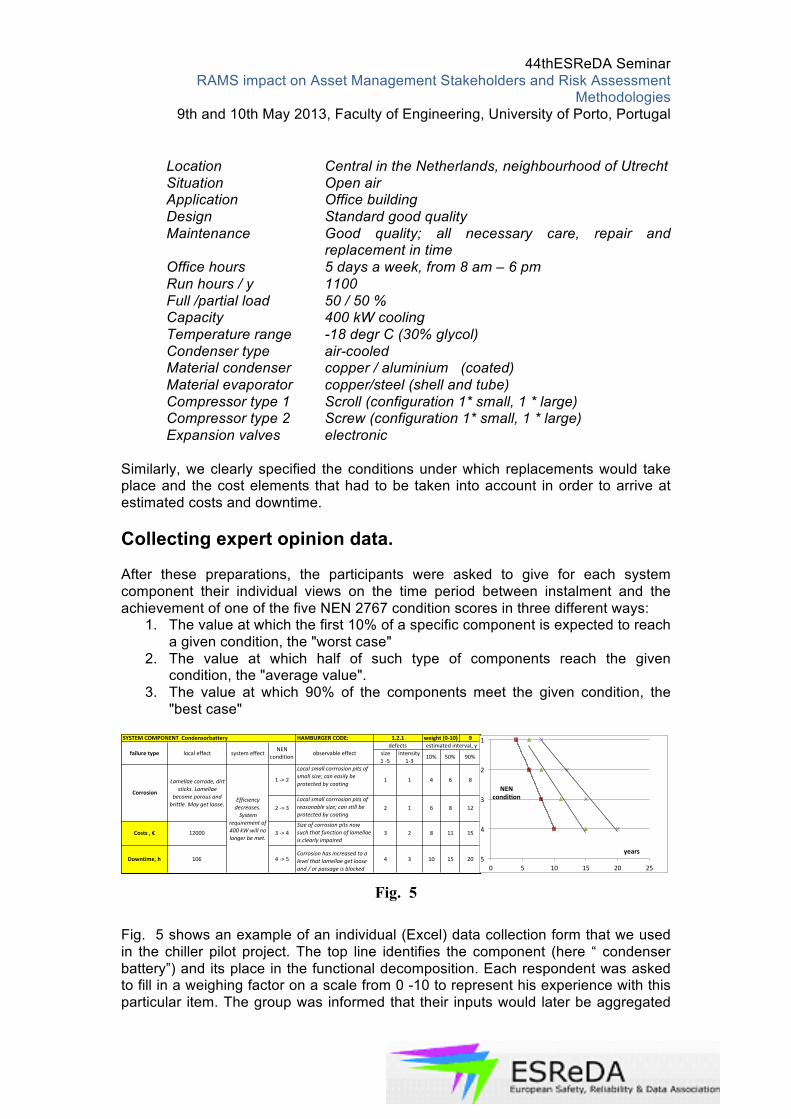
Similarly, we clearly specified the conditions under which replacements would take place and the cost elements that had to be taken into account in order to arrive at estimated costs and downtime. Collecting expert opinion data. After these preparations, the participants were asked to give for each system component their individual views on the time period between instalment and the achievement of one of the five NEN 2767 condition scores in three different ways:
1. The value at which the first 10% of a specific component is expected to reach a given condition, the "worst case"
2. The value at which half of such type of components reach the given condition, the "average value".
3. The value at which 90% of the components meet the given condition, the "best case"
Fig. 5
Fig. 5 shows an example of an individual (Excel) data collection form that we used in the chiller pilot project. The top line identifies the component (here “ condenser battery”) and its place in the functional decomposition. Each respondent was asked to fill in a weighing factor on a scale from 0 -10 to represent his experience with this particular item. The group was informed that their inputs would later be aggregated
HAMBURGER)CODE:) 9
size%%%%%%%%%%%%1%'5
intensity%%%%%1'3
10% 50% 90%
1%'>%2
Local&small&corrrosion&pits&of&small&size;&can&easily&be&protected&by&coating
1 1 4 6 8
2%'>%3Local&small&corrrosion&pits&of&reasonable&size;&can&still&be&protected&by&coating
2 1 6 8 12
Costs),)€ 12000 3%'>%4Size&of&corrosion&pits&now&such&that&function&of&lamellae&is&clearly&impaired
3 2 8 11 15
Downtime,)h 106 4%'>%5Corrosion&has&increased&to&a&level&that&lamellae&get&loose&and&/&or&passage&is&blocked
4 3 10 15 20
Corrosion
Lamellae&corrode,&dirt&sticks.&Lamellae&
become&porous&and&brittle.&May&get&loose.
Efficiency&decreases.&System&
requirement&of&400&kW&will&no&longer&be&met.
SYSTEM)COMPONENT))Condensorbattery 1.2.1 weight)(0J10)
failure)type local%effect system%effectNEN%
condition observable%effectdefects estimated%interval,%y
1%
2%
3%
4%
5%0% 5% 10% 15% 20% 25%
NEN)condiQon)
years)
44thESReDA Seminar RAMS impact on Asset Management Stakeholders and Risk Assessment
Methodologies 9th and 10th May 2013, Faculty of Engineering, University of Porto, Portugal
211
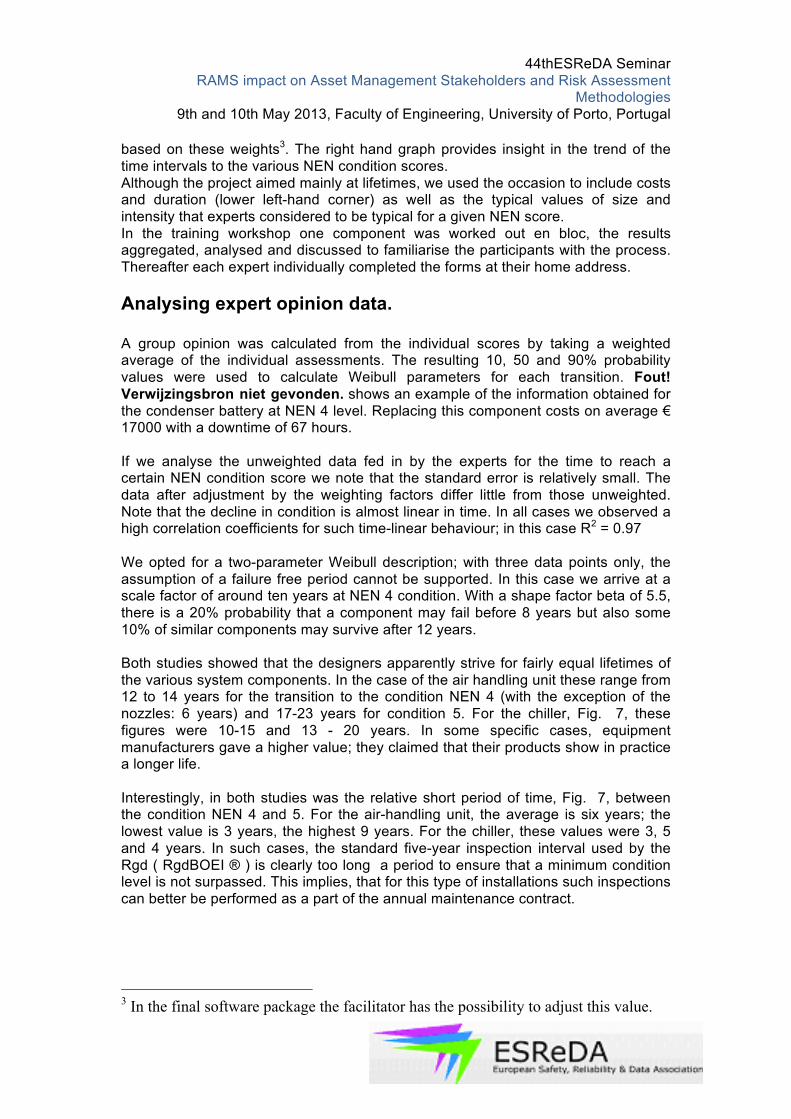
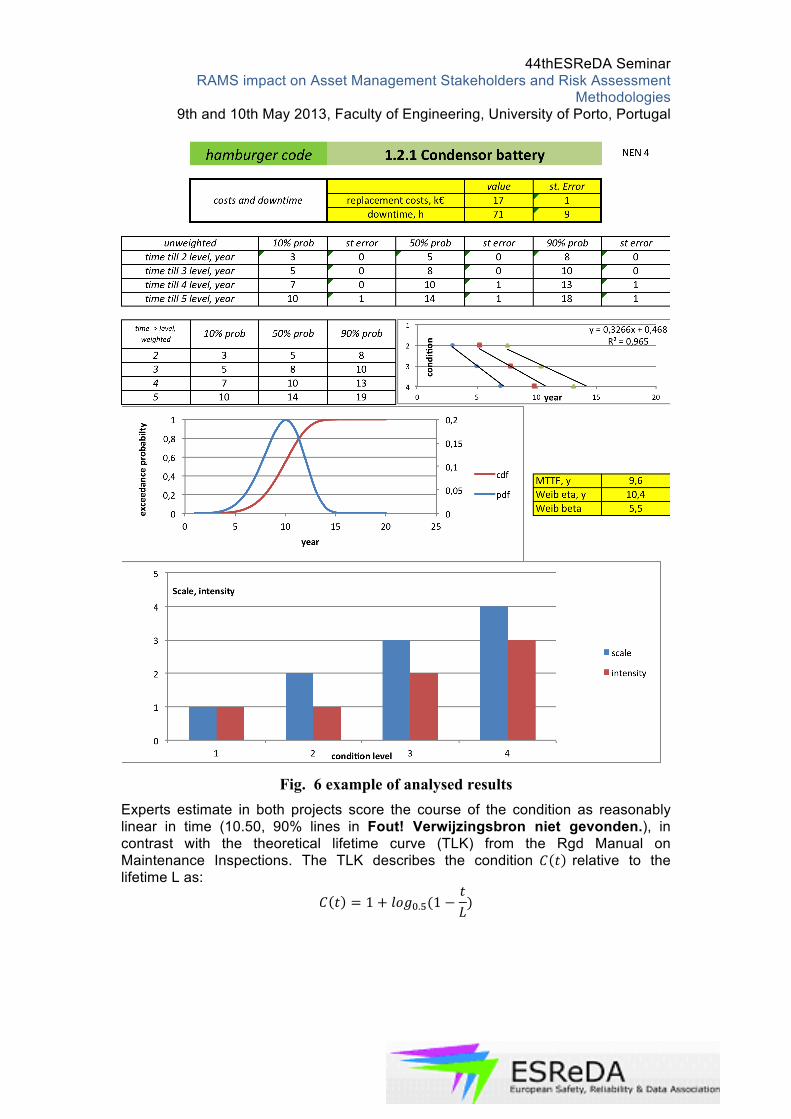
based on these weights3. The right hand graph provides insight in the trend of the time intervals to the various NEN condition scores. Although the project aimed mainly at lifetimes, we used the occasion to include costs and duration (lower left-hand corner) as well as the typical values of size and intensity that experts considered to be typical for a given NEN score. In the training workshop one component was worked out en bloc, the results aggregated, analysed and discussed to familiarise the participants with the process. Thereafter each expert individually completed the forms at their home address. Analysing expert opinion data. A group opinion was calculated from the individual scores by taking a weighted average of the individual assessments. The resulting 10, 50 and 90% probability values were used to calculate Weibull parameters for each transition. Fout! Verwijzingsbron niet gevonden. shows an example of the information obtained for the condenser battery at NEN 4 level. Replacing this component costs on average € 17000 with a downtime of 67 hours. If we analyse the unweighted data fed in by the experts for the time to reach a certain NEN condition score we note that the standard error is relatively small. The data after adjustment by the weighting factors differ little from those unweighted. Note that the decline in condition is almost linear in time. In all cases we observed a high correlation coefficients for such time-linear behaviour; in this case R2 = 0.97 We opted for a two-parameter Weibull description; with three data points only, the assumption of a failure free period cannot be supported. In this case we arrive at a scale factor of around ten years at NEN 4 condition. With a shape factor beta of 5.5, there is a 20% probability that a component may fail before 8 years but also some 10% of similar components may survive after 12 years. Both studies showed that the designers apparently strive for fairly equal lifetimes of the various system components. In the case of the air handling unit these range from 12 to 14 years for the transition to the condition NEN 4 (with the exception of the nozzles: 6 years) and 17-23 years for condition 5. For the chiller, Fig. 7, these figures were 10-15 and 13 - 20 years. In some specific cases, equipment manufacturers gave a higher value; they claimed that their products show in practice a longer life. Interestingly, in both studies was the relative short period of time, Fig. 7, between the condition NEN 4 and 5. For the air-handling unit, the average is six years; the lowest value is 3 years, the highest 9 years. For the chiller, these values were 3, 5 and 4 years. In such cases, the standard five-year inspection interval used by the Rgd ( RgdBOEI ® ) is clearly too long a period to ensure that a minimum condition level is not surpassed. This implies, that for this type of installations such inspections can better be performed as a part of the annual maintenance contract.
3 In the final software package the facilitator has the possibility to adjust this value.
44thESReDA Seminar RAMS impact on Asset Management Stakeholders and Risk Assessment
Methodologies 9th and 10th May 2013, Faculty of Engineering, University of Porto, Portugal
212
Fig. 6 example of analysed results
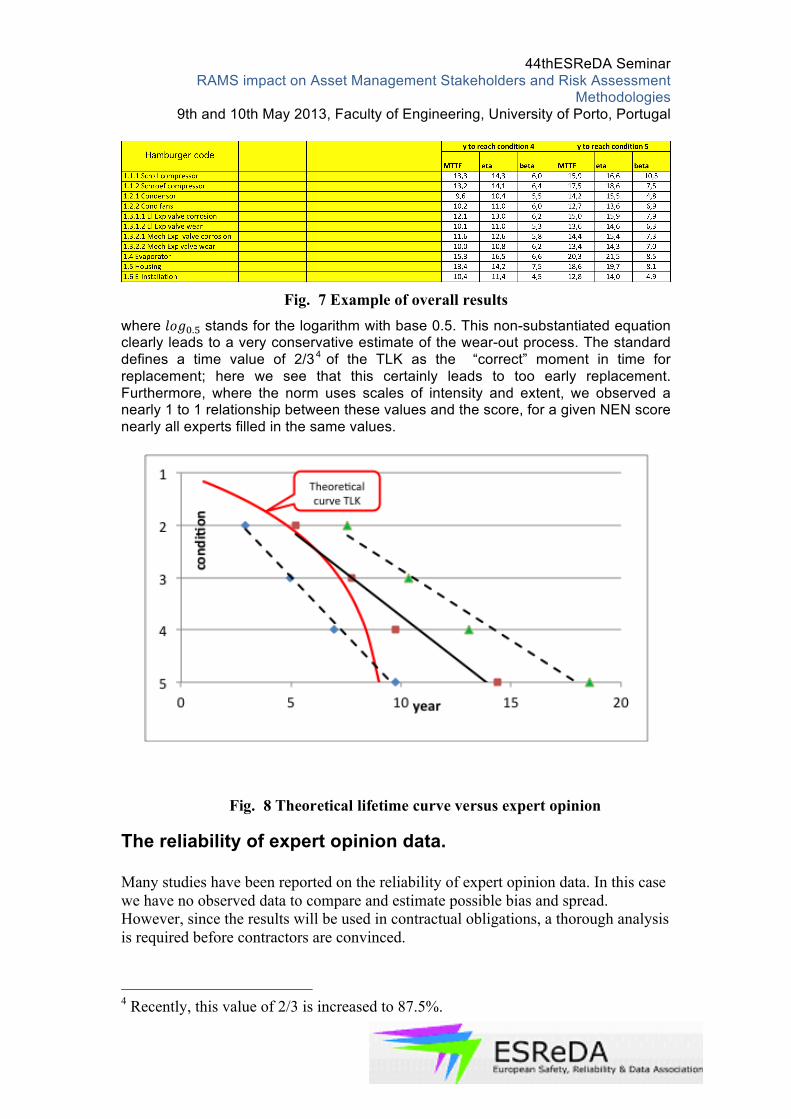
Experts estimate in both projects score the course of the condition as reasonably linear in time (10.50, 90% lines in Fout! Verwijzingsbron niet gevonden.), in contrast with the theoretical lifetime curve (TLK) from the Rgd Manual on Maintenance Inspections. The TLK describes the condition 𝐶 𝑡 relative to the lifetime L as:
𝐶 𝑡 = 1 + 𝑙𝑜𝑔!.!(1 −𝑡𝐿)
44thESReDA Seminar RAMS impact on Asset Management Stakeholders and Risk Assessment
Methodologies 9th and 10th May 2013, Faculty of Engineering, University of Porto, Portugal
213
Fig. 7 Example of overall results
where 𝑙𝑜𝑔!.! stands for the logarithm with base 0.5. This non-substantiated equation clearly leads to a very conservative estimate of the wear-out process. The standard defines a time value of 2/34 of the TLK as the “correct” moment in time for replacement; here we see that this certainly leads to too early replacement. Furthermore, where the norm uses scales of intensity and extent, we observed a nearly 1 to 1 relationship between these values and the score, for a given NEN score nearly all experts filled in the same values.
The reliability of expert opinion data. Many studies have been reported on the reliability of expert opinion data. In this case we have no observed data to compare and estimate possible bias and spread. However, since the results will be used in contractual obligations, a thorough analysis is required before contractors are convinced.
4 Recently, this value of 2/3 is increased to 87.5%.
Fig. 8 Theoretical lifetime curve versus expert opinion
44thESReDA Seminar RAMS impact on Asset Management Stakeholders and Risk Assessment
Methodologies 9th and 10th May 2013, Faculty of Engineering, University of Porto, Portugal
214
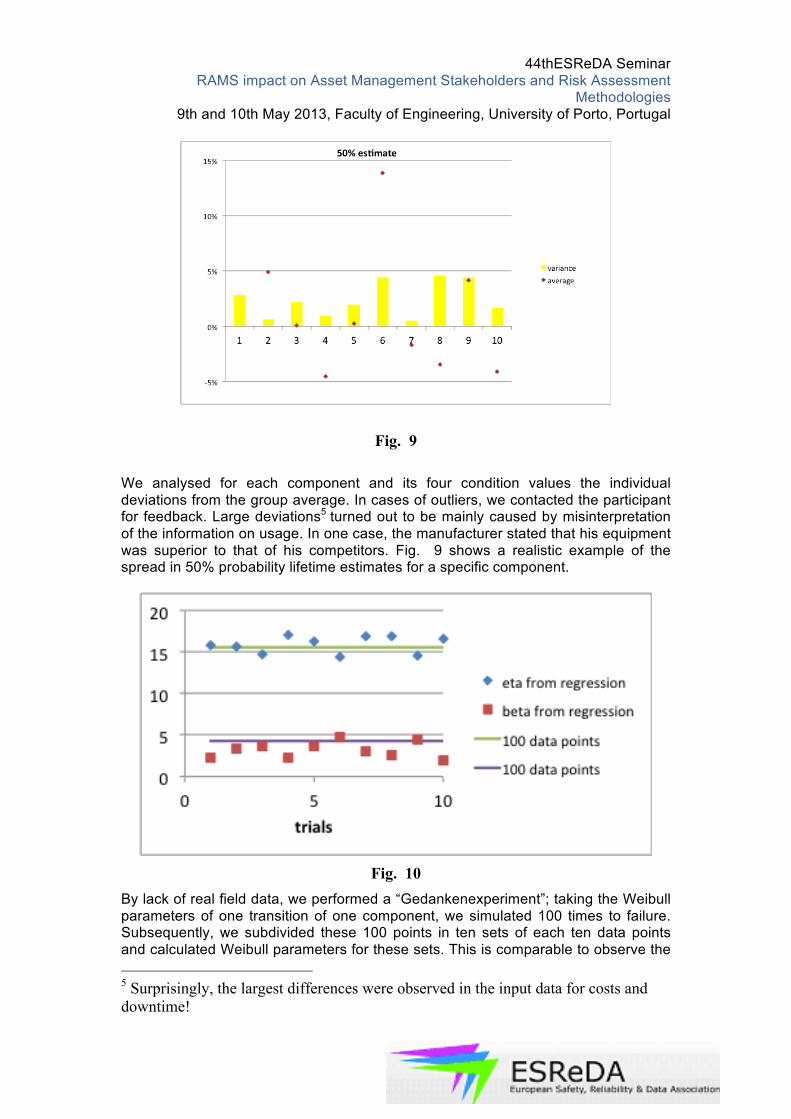
Fig. 9 We analysed for each component and its four condition values the individual deviations from the group average. In cases of outliers, we contacted the participant for feedback. Large deviations5 turned out to be mainly caused by misinterpretation of the information on usage. In one case, the manufacturer stated that his equipment was superior to that of his competitors. Fig. 9 shows a realistic example of the spread in 50% probability lifetime estimates for a specific component.
Fig. 10
By lack of real field data, we performed a “Gedankenexperiment”; taking the Weibull parameters of one transition of one component, we simulated 100 times to failure. Subsequently, we subdivided these 100 points in ten sets of each ten data points and calculated Weibull parameters for these sets. This is comparable to observe the 5 Surprisingly, the largest differences were observed in the input data for costs and downtime!
44thESReDA Seminar RAMS impact on Asset Management Stakeholders and Risk Assessment
Methodologies 9th and 10th May 2013, Faculty of Engineering, University of Porto, Portugal
215
time to failure of ten times ten identical components used under laboratory conditions. Fig. 10 shows the results; even under these unlikely ideal conditions the spread in outcomes compared with the Weibull values for the whole group of 100 is comparable with that of the, in this case, ten experts. Commercial value of lifetime data. With known lifetimes and their distribution we may obtain substantiated information about the expected behaviour of a system. In practice, the average annual cost is often calculated by the replacement cost divided by an assumed lifetime. At the inception of a project for a certain part of the total expected lifetime, however, such long-term averages are grossly misleading as we could show by standard maintenance modelling.
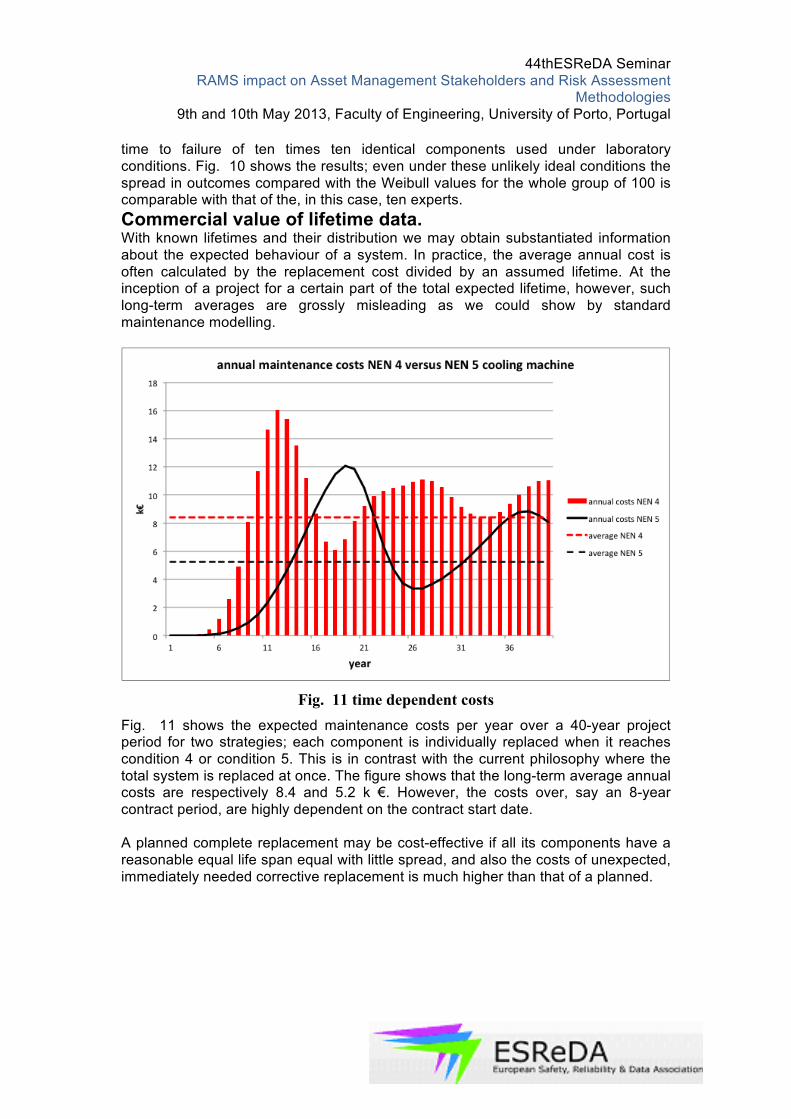
Fig. 11 time dependent costs
Fig. 11 shows the expected maintenance costs per year over a 40-year project period for two strategies; each component is individually replaced when it reaches condition 4 or condition 5. This is in contrast with the current philosophy where the total system is replaced at once. The figure shows that the long-term average annual costs are respectively 8.4 and 5.2 k €. However, the costs over, say an 8-year contract period, are highly dependent on the contract start date. A planned complete replacement may be cost-effective if all its components have a reasonable equal life span equal with little spread, and also the costs of unexpected, immediately needed corrective replacement is much higher than that of a planned.
44thESReDA Seminar RAMS impact on Asset Management Stakeholders and Risk Assessment
Methodologies 9th and 10th May 2013, Faculty of Engineering, University of Porto, Portugal
216
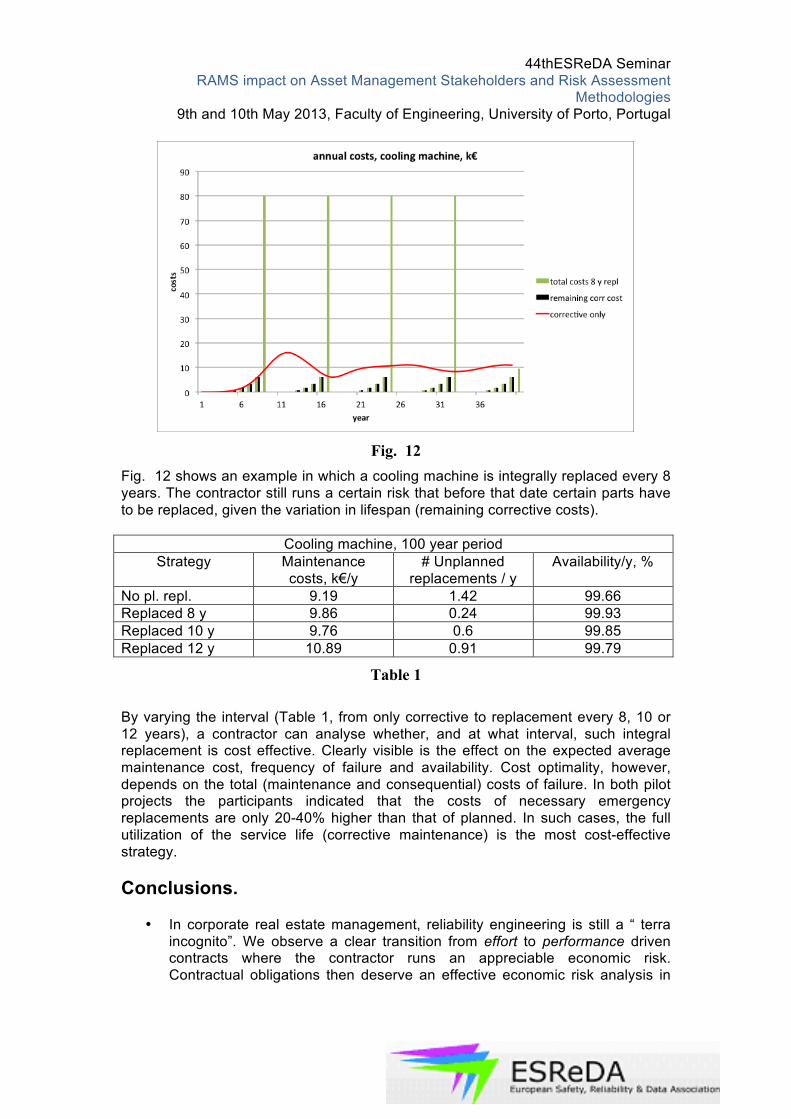
Fig. 12
Fig. 12 shows an example in which a cooling machine is integrally replaced every 8 years. The contractor still runs a certain risk that before that date certain parts have to be replaced, given the variation in lifespan (remaining corrective costs).
Cooling machine, 100 year period Strategy Maintenance
costs, k€/y # Unplanned
replacements / y Availability/y, %
No pl. repl. 9.19 1.42 99.66 Replaced 8 y 9.86 0.24 99.93 Replaced 10 y 9.76 0.6 99.85 Replaced 12 y 10.89 0.91 99.79
Table 1 By varying the interval (Table 1, from only corrective to replacement every 8, 10 or 12 years), a contractor can analyse whether, and at what interval, such integral replacement is cost effective. Clearly visible is the effect on the expected average maintenance cost, frequency of failure and availability. Cost optimality, however, depends on the total (maintenance and consequential) costs of failure. In both pilot projects the participants indicated that the costs of necessary emergency replacements are only 20-40% higher than that of planned. In such cases, the full utilization of the service life (corrective maintenance) is the most cost-effective strategy. Conclusions.
• In corporate real estate management, reliability engineering is still a “ terra incognito”. We observe a clear transition from effort to performance driven contracts where the contractor runs an appreciable economic risk. Contractual obligations then deserve an effective economic risk analysis in
44thESReDA Seminar RAMS impact on Asset Management Stakeholders and Risk Assessment
Methodologies 9th and 10th May 2013, Faculty of Engineering, University of Porto, Portugal
217
which the technical lifetime of system components is a critical parameter. However, these data are grossly missing in this field.
• Two pilot tests showed that querying experts in a structured way for their insights and experiences can provide this information. The results, in terms of accuracy and uncertainty, are comparable with those based on the collection of field data over a prolonged period of time (30 - 50 years).
• An important aspect here is to give direct attention to the inherent scatter caused by uncertainties in material properties, load and use. Lifetimes will then be regarded as outcomes of a chance process; the risks for an asset manager and for a (main) contractor will be made visible. This insight can be used in contract specifications and plays a role in possible legal settlement of conflicts.
• With regard to the NEN 2767 norm the two pilot projects showed that: o A more specific / unequivocal definition is necessary of the
observable phenomena associated with the different conditions, compared with the broad descriptions in the standard. This will also result in fewer differences in interpretation between inspectors, contractors and owners.
o The time dependent decrease in condition is, according to the experts, fairly linear in contrast to the predictions of the currently used theoretical lifetime curve (TLK).
o Where the standard uses two additional scales on extent and intensity it was found that these are strongly correlated with the NEN score in case.
o The decline in condition from NEN 4 to 5 is that fast that the existing inspection interval of 5 years in the RgdBOEI ® is too long for this process to manage. It is therefore recommended to include such inspection tasks in the regular maintenance contract.
• With the thus obtained data on the probability distribution of the lifetimes of components, systems can be analysed in terms of frequency and cost of necessary repairs / replacements in a specific contract period.
• The pilot studies showed that maintenance at NEN 5 instead of NEN 4 condition will lead to a saving of 30-40% in replacement costs.
Post scriptum Based on these two successful pilot projects (air handling unit, chiller) the Rgd has financed the development of a web-based (SharePoint) software package that industry / branch organizations may freely use to build a sector-specific database. A necessary condition is that the generic results are made publicly available to parties, such as equipment designers, maintenance contractors and building owners to underpin investment, replacement and maintenance decisions. By providing this software the RGD highlights its social role in improving building-related maintenance, both for owners and main contractors. References
1. Stichting Bouw Research (SBR) (2011). Levensduur van Bouwproducten (Lifetime of building products) ISBN 978-90-5367-538-0
Top Related
Copyright © 2022 FDOKUMEN

