


Bahasa
Halaman
Hukum


TM
Technical Brief for the
THOMAS-KILMANN CONFLICT MODE INSTRUMENT
Description of the Updated Normative Sample and Implications for Use
Nancy A. Schaubhut CPP Research Department
800-624-1765 | www.cpp.com
Technical Brief for the Thomas-Kilmann Conflict Mode Instrument Copyright 2007 by CPP, Inc. All rights reserved. SkillsOne and the CPP logo are registered trademarks and the TKI logo is a trademark of CPP, Inc. O*NET is a trademark of the U.S. Department of Labor, Employment and Training Administration. Myers-Briggs Type Indicator and MBTI are trademarks or registered trademarks of the Myers-Briggs Type Indicator Trust in the United States and other countries.

INTRODUCTION
The Thomas-Kilmann Conflict Mode Instrument (TKI) has been used successfully for more than 30 years to help individuals in a variety of settings understand how different conflict styles affect personal and group dynamics. The TKI measures five “conflict-handling modes,” or ways of dealing with conflict: competing, collaborating, compromising, avoiding, and accommodating. These five modes can be described along two dimensions, assertiveness and cooperativeness. Assertiveness refers to the extent to which one tries to satisfy his or her own concerns, and cooperativeness refers to the extent to which one tries to satisfy the concerns of another person (Thomas & Kilmann, 1974, 2007). Competing is assertive and not cooperative, and accommodating is cooperative and not assertive. Avoiding is neither assertive nor cooperative, while collaborating is both assertive and cooperative. Compromising falls in the middle on both dimensions. (To view a diagram of the dimensions and the conflict-handling modes, see Figure 1, on page 8.)
Individuals respond to the 30 items on the TKI tool, the items are scored, and respondents see which of the five conflict-handling modes they tend to use relatively often and which modes they use less frequently. Their percentile scores compare how frequently they use a mode with how frequently members of the norm group use the mode. Scores are grouped in three categories: high (scores that fit in the top 25% of the norm group’s scores on a conflict-handling mode), medium (scores that fit in the middle 50%), and low (scores that fit in the bottom 25%).
CPP, Inc., publisher of the TKI assessment, recently updated the norm sample and the percentile ranks used to describe the conflict modes as measured by the TKI. The goal of this effort was to broaden the representativeness of the norm group and ensure that changes in occupational and respondent diversity were reflected in the TKI’s norm sample. This technical brief describes the renorming process and analyzes the results of the renorming. It also briefly explains minor changes in how TKI results are reported to clients.
TKI RENORMING
Updated norms for the TKI assessment were desired for several reasons. First, the TKI norm sample had not been updated since the instrument was first developed. The original norm group was modest in size, with fewer than 400 participants (Kilmann & Thomas, 1977). Also, the
original group did not reflect the diversity of the current U.S. workforce, which has undergone substantial change over the past several decades. In addition, workplaces have shifted from a more centralized organizational structure to one that is more decentralized and team based. The use of teams in the United States has vastly increased over the past two decades. Now, almost all U.S. (Huszczo, 1996; Parker, 1996) and international organizations (Marquardt & Horvath, 2001) utilize or emphasize teamwork. The impact of this change on how individuals in organizations deal with conflict is not clearly known.
Goals of the renorming effort included the following:
• Increasing the diversity of the norm sample to better reflect the gender and ethnic composition of the U.S. workforce
• Reflecting conflict preferences at all levels of organizations, from entry-level worker to top executive
• Including individuals with varied levels of educational attainment, from high school graduates to those with advanced degrees
• Collecting a sample large enough to allow generalization to other populations and groups
Method
Over the 30-year publication history of the TKI, renorming had not been conducted in part because the selfscorable paper-and-pencil format of the assessment made it difficult to retrieve a large group of client results and conduct analyses on those results. In 2002, the TKI assessment became available via the Internet using CPP’s online assessment delivery system, the SkillsOne® Web site. With online administration, data are collected as part of CPP’s ongoing commercial operations, and over time these operations created a large archive of completed TKI assessments. This archive provided a vast pool of participants from which a large, representative norm sample could be developed. The Web site collected not only client responses to the 30 TKI items, but also demographic data, so that the sample could be balanced and made representative of the U.S. employed population.
Selection of Respondents
The respondents included in the updated TKI norm sample were chosen from an archival database of nearly 60,000 TKI assessments completed during 2002 through 2005. Various selection criteria were applied to this archive to arrive at the updated norm group, with respondents first being screened based on their answers to key demographic questions. Only full-time employees ages 20 to 70 years—the range representative of most
Technical Brief for the Thomas-Kilmann Conflict Mode Instrument Copyright 2007 by CPP, Inc. All rights reserved. 1

working adults in the United States—were selected. More than 33,000 respondents remained in the data set after these initial selection criteria were applied.
Next, the sample was pared further by randomly selecting an equal number of men and women. Some Caucasian respondents were then randomly selected for removal and replaced with other randomly selected non-Caucasian respondents in order to better reflect the diversity of the U.S. workforce. This was also done to adjust the distribution of organizational levels (see description below) to achieve the desired mix that accurately represents the organizational levels of CPP’s customer base. The updated norm sample is more inclusive than the previous norm sample in terms of gender, age, ethnicity, and occupations, and better reflects the U.S. workforce in general.
Updated Norm Sample Description
The updated TKI norm sample consists of 8,000 individuals (50% women) who are currently employed full-time in a variety of fields. Forty-six percent are employed in business and financial operations, and 12% in computer and mathematical occupations. Over 450 specific occupational titles are represented.1 Almost all (96%) are satisfied with their current job. The average number of years employed in their current field is 11.8 (SD = 9.4), and average age is 40.4 years (SD = 9.7). The organizational levels of respondents are 35% management, 20% nonsupervisory, 20% supervisor, 15% executive, and 5%
each for both top executive and entry level. This distribution of organizational levels was chosen because it roughly approximates that of users of the TKI assessment.
Additionally, when asked why they were taking the TKI assessment, 75% of respondents indicated they were completing the TKI for training purposes, 15% for personal growth, 8% for education, and 2% for career counseling. Among respondents the highest level of education completed is bachelor’s degree (40%), followed by master’s degree (24%), some college but no degree (14%), associate degree (6%), and professional degree (5%).
The updated norm sample is ethnically diverse and was selected to mirror the racial and ethnic distribution of the U.S. workforce as closely as possible. The percentage of employed persons by ethnicity in 2005 included 10.8% African Americans, 4.4% Asians, and 13.1% Hispanics/Latinos (United States Department of Labor Bureau of Labor Statistics, n.d.). Table 1 shows the distribution of ethnicity in the updated norm sample, which approximates the BLS statistics.
The respondents in the sample also represent all regions of the United States. The ten regions shown in Table 2 were identified by the first digit in each respondent’s zip code, a method that has been used by other researchers (Gasser, Larson, & Borgen, 2007). The distribution shows fair representation of each region.
1. These occupational titles are based on the O*NET™ classification scheme. See the O*NET Web site, http://online.onetcenter.org/
TABLE 1. RACIAL AND ETHNIC DISTRIBUTION BY GENDER IN THE UPDATED TKI NORM SAMPLE
Women Men Combined
Race or Ethnicity n Percent n Percent N Percent
African American 420 10.5 383 9.6 803 10.0
American Indian 49 1.2 43 1.1 92 1.2
Asian 193 4.8 221 5.5 414 5.2
Caucasian 2,780 69.5 2,800 70.0 5,580 69.8
Indian 60 1.5 91 2.3 151 1.9
Latino, Latina/Hispanic 311 7.8 344 8.6 655 8.2
Mideastern 14 .4 44 1.1 58 .7
Multiple ethnicities 114 2.9 46 1.2 160 2.0
Other 54 1.4 28 .7 82 1.0
Not reported 5 .1 0 0 5 .1
Note: N = 8,000. Percentages may not add up to 100 due to rounding.
Technical Brief for the Thomas-Kilmann Conflict Mode Instrument Copyright 2007 by CPP, Inc. All rights reserved. 2

TABLE 2. DISTRIBUTION BY GEOGRAPHICAL REGION IN THE UPDATED TKI NORM SAMPLE
Region N Percent States/District Included
Northeast 541 7.9 CT, MA, ME, NH, NJ, RI, VT
Greater New York 586 8.5 DE, NY, PA
Atlantic 1,065 15.5 DC, MD, NC, SC, VA, WV
Southeast 636 9.3 AL, FL, GA, MS, TN
Eastern Plains 636 9.3 IN, KY, MI, OH
Northern Plains 508 7.4 IA, MN, MT, ND, SD, WI
Central Plains 642 9.4 IL, KS, MS, NE
Southern Plains 691 10.1 AR, LA, OK, TX
Rocky Mountains 418 6.1 AZ, CO, ID, NM, NV, UT, WY
Pacific 1,136 16.6 AK, CA, HI, OR, WA
Note: N = 6,859 respondents who provided their zip code. Percentages may not add up to 100 due to rounding.
TABLE 3. TKI RAW SCORES AND PERCENTILES FOR THE UPDATED TKI NORM SAMPLE
Competing Collaborating Compromising Avoiding Accommodating
Raw Score Percentile Percentile Percentile Percentile Percentile
0 3 0 0 1 0
1 10 1 0 2 2
2 20 3 1 6 7
3 31 7 3 12 16
4 44 15 7 22 30
5 57 26 15 34 46
6 69 41 27 49 62
7 79 58 41 65 76
8 87 74 58 78 87
9 93 87 75 88 94
10 96 95 87 95 98
11 98 99 95 98 100
12 100 100 99 100 100
PERCENTILE RANKS FROM THE UPDATED NORMS
The original 30 items on the TKI remain the same, as does the manner of scoring. The same method of calculating percentiles was also used.2 However, the percentiles that correspond to the raw scores have shifted slightly in the updated norm sample for some of the
modes (see Table 3). Table 4 shows the raw scores whose percentile values fall into the top 25%, middle 50%, and bottom 25% for both the original norms and the updated norms. The updated norms are exactly the same as those from the original norm sample for two of the five modes—avoiding and accommodating. The raw scores 2. Percentile values for a given raw score were calculated as the median point (or middle) of the range of cumulative frequency covered by that score. For example, if a raw score of 5 on a given conflict mode had a cumulative frequency of 40% and a 6 had a cumulative frequency of 60%, then a 6 would be seen as covering the range from 40% to 60% and the percentile assigned would be the median value of 50%.
Technical Brief for the Thomas-Kilmann Conflict Mode Instrument Copyright 2007 by CPP, Inc. All rights reserved. 3
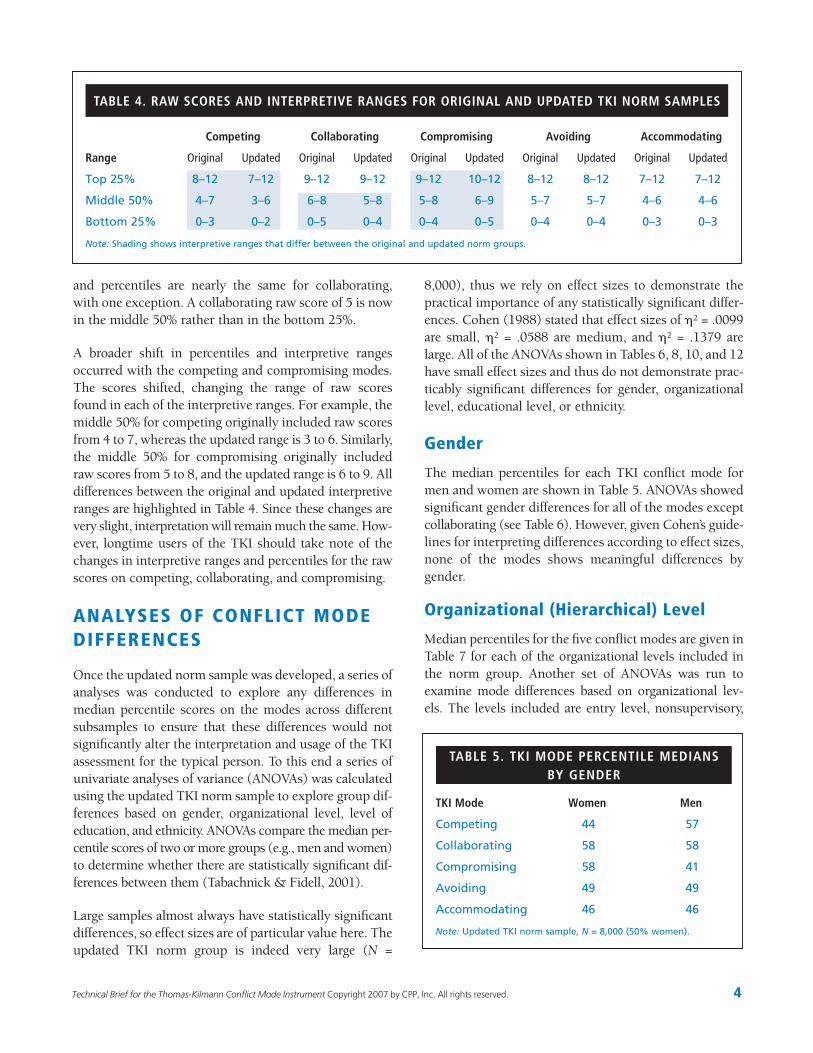
TABLE 4. RAW SCORES AND INTERPRETIVE RANGES FOR ORIGINAL AND UPDATED TKI NORM SAMPLES
Competing Collaborating Compromising Avoiding Accommodating
Range Original Updated Original Updated Original Updated Original Updated Original Updated
Top 25% 8–12 7–12 9–12 9–12 9–12 10–12 8–12 8–12 7–12 7–12
Middle 50% 4–7 3–6 6–8 5–8 5–8 6–9 5–7 5–7 4–6 4–6
Bottom 25% 0–3 0–2 0–5 0–4 0–4 0–5 0–4 0–4 0–3 0–3
Note: Shading shows interpretive ranges that differ between the original and updated norm groups.
and percentiles are nearly the same for collaborating, with one exception. A collaborating raw score of 5 is now in the middle 50% rather than in the bottom 25%.
A broader shift in percentiles and interpretive ranges occurred with the competing and compromising modes. The scores shifted, changing the range of raw scores found in each of the interpretive ranges. For example, the middle 50% for competing originally included raw scores from 4 to 7, whereas the updated range is 3 to 6. Similarly, the middle 50% for compromising originally included raw scores from 5 to 8, and the updated range is 6 to 9. All differences between the original and updated interpretive ranges are highlighted in Table 4. Since these changes are very slight, interpretation will remain much the same. However, longtime users of the TKI should take note of the changes in interpretive ranges and percentiles for the raw scores on competing, collaborating, and compromising.
ANALYSES OF CONFLICT MODE DIFFERENCES
Once the updated norm sample was developed, a series of analyses was conducted to explore any differences in median percentile scores on the modes across different subsamples to ensure that these differences would not significantly alter the interpretation and usage of the TKI assessment for the typical person. To this end a series of univariate analyses of variance (ANOVAs) was calculated using the updated TKI norm sample to explore group differences based on gender, organizational level, level of education, and ethnicity. ANOVAs compare the median percentile scores of two or more groups (e.g., men and women) to determine whether there are statistically significant differences between them (Tabachnick & Fidell, 2001).
Large samples almost always have statistically significant differences, so effect sizes are of particular value here. The updated TKI norm group is indeed very large (N =
8,000), thus we rely on effect sizes to demonstrate the practical importance of any statistically significant differences. Cohen (1988) stated that effect sizes of �2 = .0099 are small, �2 = .0588 are medium, and �2 = .1379 are large. All of the ANOVAs shown in Tables 6, 8, 10, and 12 have small effect sizes and thus do not demonstrate practicably significant differences for gender, organizational level, educational level, or ethnicity.
Gender
The median percentiles for each TKI conflict mode for men and women are shown in Table 5. ANOVAs showed significant gender differences for all of the modes except collaborating (see Table 6). However, given Cohen’s guidelines for interpreting differences according to effect sizes, none of the modes shows meaningful differences by gender.
Organizational (Hierarchical) Level
Median percentiles for the five conflict modes are given in Table 7 for each of the organizational levels included in the norm group. Another set of ANOVAs was run to examine mode differences based on organizational levels. The levels included are entry level, nonsupervisory,
TABLE 5. TKI MODE PERCENTILE MEDIANS BY GENDER
TKI Mode Women Men
Competing 44 57
Collaborating 58 58
Compromising 58 41
Avoiding 49 49
Accommodating 46 46
Note: Updated TKI norm sample, N = 8,000 (50% women).
Technical Brief for the Thomas-Kilmann Conflict Mode Instrument Copyright 2007 by CPP, Inc. All rights reserved. 4
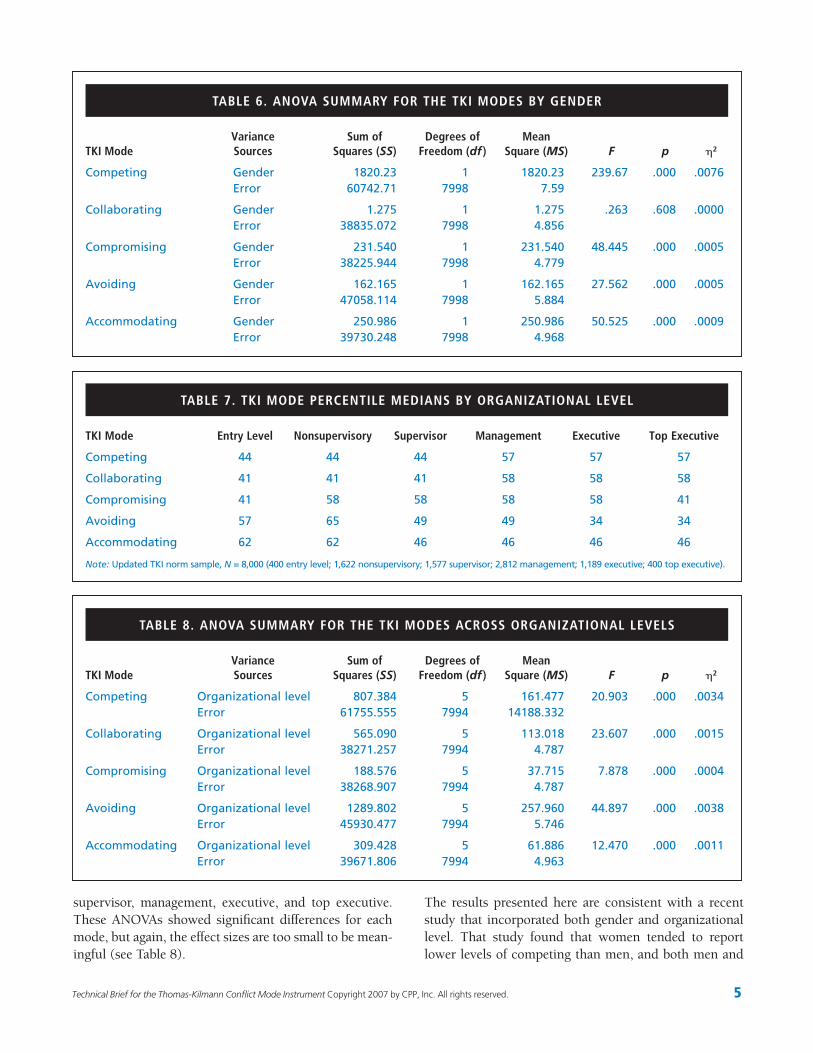
TABLE 6. ANOVA SUMMARY FOR THE TKI MODES BY GENDER
Variance Sum of Degrees of Mean TKI Mode Sources Squares (SS) Freedom (df ) Square (MS) F p �2
Competing Gender 1820.23 1 1820.23 239.67 .000 .0076 Error 60742.71 7998 7.59
Collaborating Gender 1.275 1 1.275 .263 .608 .0000 Error 38835.072 7998 4.856
Compromising Gender 231.540 1 231.540 48.445 .000 .0005 Error 38225.944 7998 4.779
Avoiding Gender 162.165 1 162.165 27.562 .000 .0005 Error 47058.114 7998 5.884
Accommodating Gender 250.986 1 250.986 50.525 .000 .0009 Error 39730.248 7998 4.968
TABLE 7. TKI MODE PERCENTILE MEDIANS BY ORGANIZATIONAL LEVEL
TKI Mode Entry Level Nonsupervisory Supervisor Management Executive Top Executive
Competing 44 44 44 57 57 57
Collaborating 41 41 41 58 58 58
Compromising 41 58 58 58 58 41
Avoiding 57 65 49 49 34 34
Accommodating 62 62 46 46 46 46
Note: Updated TKI norm sample, N = 8,000 (400 entry level; 1,622 nonsupervisory; 1,577 supervisor; 2,812 management; 1,189 executive; 400 top executive).
TABLE 8. ANOVA SUMMARY FOR THE TKI MODES ACROSS ORGANIZATIONAL LEVELS
Variance Sum of Degrees of Mean TKI Mode Sources Squares (SS) Freedom (df ) Square (MS) F p �2
Competing Organizational level 807.384 5 161.477 20.903 .000 .0034 Error 61755.555 7994 14188.332
Collaborating Organizational level 565.090 5 113.018 23.607 .000 .0015 Error 38271.257 7994 4.787
Compromising Organizational level 188.576 5 37.715 7.878 .000 .0004 Error 38268.907 7994 4.787
Avoiding Organizational level 1289.802 5 257.960 44.897 .000 .0038 Error 45930.477 7994 5.746
Accommodating Organizational level 309.428 5 61.886 12.470 .000 .0011 Error 39671.806 7994 4.963
supervisor, management, executive, and top executive. The results presented here are consistent with a recent These ANOVAs showed significant differences for each study that incorporated both gender and organizational mode, but again, the effect sizes are too small to be mean- level. That study found that women tended to report ingful (see Table 8). lower levels of competing than men, and both men and
Technical Brief for the Thomas-Kilmann Conflict Mode Instrument Copyright 2007 by CPP, Inc. All rights reserved. 5

TABLE 9. TKI MODE PERCENTILE MEDIANS BY HIGHEST LEVEL OF EDUCATION COMPLETED
High School Trade/ Some Professional Doctorate Diploma/ Technical College Associate Bachelor’s Master’s Degree (e.g., (e.g.,
TKI Mode GED Training (No Degree) Degree Degree Degree (DDS, JD, MD) PhD, EdD)
Competing 44 44 44 44 57 57 57 57
Collaborating 58 58 58 58 58 58 58 58
Compromising 41 58 41 41 58 58 58 58
Avoiding 65 65 65 49 49 49 49 49
Accommodating 46 62 46 46 46 46 46 46
Note: N = 7,942 (341 high school diploma/GED; 141 trade/technical training; 1,117 some college [no degree]; 453 associate degree; 3,229 bachelor’s degree; 1,935 master’s degree; 423 professional degree; and 301 doctorate). Not all respondents reported their educational level.
TABLE 10. ANOVA SUMMARY FOR THE TKI MODES ACROSS EDUCATIONAL LEVELS
Variance Sum of Degrees of Mean TKI Mode Sources Squares (SS) Freedom (df ) Square (MS) F p �2
Competing Educational level 373.985 2 186.992 24.054 .000 .0016 Error 61934.160 7967 7.774
Collaborating Educational level 12.589 2 6.294 1.295 .274 .0000 Error 38726.013 7967 4.861
Compromising Educational level 209.431 2 104.716 21.923 .000 .0004
Error 38054.228 7967 4.776
Avoiding Educational level 854.629 2 427.315 73.623 .000 .0025 Error 46241.253 7967 5.804
Accommodating Educational level 35.784 2 17.892 3.579 .028 .0001 Error 39824.068 7967 4.999
Note: Educational groups selected from updated TKI norm sample, n = 2,082 less than bachelor’s degree; 3,229 bachelor’s degree; 2,659 degree higher than bachelor’s degree.
women at higher organizational levels more often used assertive modes (competing and collaborating) and less often used unassertive modes (avoiding and accommodating; Thomas, Merriam, Schaubhut, Donnay, & Thomas, 2006). While that study examined mean differences in raw scores, the present study showed that for the updated TKI norm sample, no meaningful differences existed between groups in median percentile scores, as demonstrated by small effect sizes (�2 = .0099).
Level of Education
Median percentiles for each TKI conflict mode for the different levels of education are shown in Table 9. To examine TKI mode differences based on educational level, three groups were created from the updated TKI norm sample, based on highest level of education completed.
The three groups were as follows: completed less than a bachelor’s degree, completed a bachelor’s degree, and completed a degree higher than a bachelor’s degree. Results indicated significant differences between the educational groups on competing, compromising, avoiding, and accommodating (see Table 10). Again, however, these differences are relatively insignificant, as shown by the small effect sizes (�2 = .0099).
Ethnicity
Another important issue when using the TKI or similar assessments in employment settings is whether they are valid for use with different populations, such as those from diverse ethnic groups. Median percentiles on each conflict mode for four ethnic groups are presented in Table 11. Table 12 shows significant differences on com-
Technical Brief for the Thomas-Kilmann Conflict Mode Instrument Copyright 2007 by CPP, Inc. All rights reserved. 6

TABLE 11. TKI MODE PERCENTILE MEDIANS BY ETHNICITY
Latino, African Latina/
TKI Mode American Asian Caucasian Hispanic
Competing 44 44 57 57
Collaborating 41 41 58 41
Compromising 58 41 41 58
Avoiding 65 65 49 49
Accommodating 46 62 46 46 Note: Ethnic groups selected from updated TKI norm sample, n = 803 African Americans; 414 Asians; 5,580 Caucasians; and 655 Latinos, Latinas/Hispanics.
peting, avoiding, and accommodating among the four ethnic groups studied—African Americans; Asians; Caucasians; and Latinos, Latinas/Hispanics. However, the small effect sizes (�2 = .0099) demonstrate that the differences are too small to be practicably meaningful.
INTERPRETATION AND REPORTING OF TKI RESULTS
When first introduced to clients, the conflict-handling modes are listed in a sequence that follows the illustration in the “Five Conflict-Handling Modes” section of the self-scorable booklet and online report. That sequence is competing, collaborating, compromising, avoiding, and accommodating (see Figure 1). TKI results are graphed by the client in the self-scorable booklet or are printed as a personalized Profile & Interpretive Report for individu
als who respond to the TKI items online via the SkillsOne Web site.
Both formats provide interpretive information on the uses of each conflict mode as well as questions to consider about possible overuse or underuse of the conflict modes. The online report customizes interpretive content in two ways. First, it presents client results in rank order, from top conflict mode to least-used conflict mode. Second, it provides additional information on typical characteristics and contributions of people who score highest on the client’s top conflict mode.
Because conflict-handling modes are presented in the online report in the client’s rank order, a tiebreaker rule is necessary. The ranking is by percentiles—a comparison of the client’s results with the updated norm group’s—and if two percentiles are tied, the tie is broken using a reverse social desirability sort. For example, avoiding ranks higher than collaborating, since collaborating is the more socially approved behavior. The tiebreaker sort is as follows:
• Avoiding • Accommodating • Competing • Compromising • Collaborating
In the case of a tied percentile result on the top two conflict modes, the online report provides additional information on typical characteristics and contributions of people who score highest on the client’s top two conflict modes (resulting in a somewhat longer printed report). It is possible but not likely that the client’s results show a three-way tie in conflict modes. Out of over 6,000 cases
TABLE 12. ANOVA SUMMARY FOR THE TKI MODES ACROSS FOUR ETHNIC GROUPS
Variance Sum of Degrees of Mean TKI Mode Sources Squares (SS) Freedom (df ) Square (MS) F p �2
Competing Ethnic group 291.131 3 97.044 12.450 .000 .0013 Error 58053.489 7448 7.795
Collaborating Ethnic group 30.504 3 10.168 2.087 .100 .0001 Error 36288.045 7448 4.872
Compromising Ethnic group 22.314 3 7.438 1.541 .202 .0000 Error 35948.563 7448 4.827
Avoiding Ethnic group 338.301 3 112.767 19.229 .000 .0011 Error 43677.612 7448 5.864
Accommodating Ethnic group 46.508 3 15.503 3.103 .026 .0002 Error 37215.643 7448 4.997
Technical Brief for the Thomas-Kilmann Conflict Mode Instrument Copyright 2007 by CPP, Inc. All rights reserved. 7

Figure 1. Dimensions and Conflict-Handling Modes for the TKI Assessment
in a portion of the publisher’s database, fewer than 15, or less than 0.05%, had a three-way tie. In the rare instances in which the percentiles on the top three conflict-handling modes are tied, the tiebreaker rule above applies. The online report provides the extra detailed information on the top two conflict modes as determined by the tiebreaker.
Both the online report and self-scorable booklet group clients’ percentile scores into three ranges. Percentile scores of 0 to 25 are considered low, percentile scores of 26 to 75 inclusive are considered medium, and percentile scores of 76 to 100 are considered high. A score of 75 (possible only on the compromising scale) is considered medium for interpretation purposes. The high-medium-low labels are meant to give clients an easy way to understand how their use of conflict modes compares with others’ use of the modes. Note that a client’s top conflict-handling mode may fall in either the high or medium range.
Clients seeking more information about conflict styles may be referred to the booklet Introduction to Conflict Management (Thomas, 2002). When the TKI is being used as part of team building, a useful booklet is Introduction to Conflict and Teams (Thomas & Thomas, 2004).
USES OF THE TKI ASSESSMENT
Many researchers have studied the TKI on a wide range of topics, including its validity (Ben-Yoav & Banai, 1992; Van de Vliert & Kabanoff, 1990), relationship with the
Myers-Briggs Type Indicator® (MBTI®) assessment (Johnson, 1997; Percival, Smitheram, & Kelly, 1992), political party affiliation differences (Nelson & Lubin, 1991), gender differences (Shockley-Zalabak & Morley, 1984b; Brahnam, Margavio, Hignite, Barrier, & Chin, 2005), behavioral patterns (Volkema & Bergmann, 1995), and relationship with organizational communication styles (Morley & Shockley-Zalabak, 1986).
Use of the TKI’s conflict modes has also been examined in a number of different occupational samples. Mills, Robey, & Smith (1985) found relationships between the TKI and the MBTI assessment in a sample of project managers. Specifically, Judging was related to a preference for compromising, and Extraversion was related to a preference for collaboration. A study of legislators failed to find significant differences between political parties (Nelson & Lubin, 1991). Another study found that women in information systems were more likely than men to employ the collaborating conflict mode (Brahnam et al., 2005). Other research has shown that nurses tend to use only one or two conflict modes and focus primarily on compromising (Hendel, Fish, & Galon, 2005) or avoiding and compromising (Valentine, 2001).
The TKI’s conflict modes have also been researched in conjunction with a number of other organizationally relevant concepts. Shockley-Zalabak and Morley (1984a) found relationships between communication apprehension and preferences for conflict modes. In particular, they found that people with high communication apprehension are less likely to prefer assertive conflict styles. Shell (2001) developed thumbnail sketches to describe typical bargaining behaviors for those with a very strong or a very weak preference for each of the five conflict modes. A study of nurses showed that transformational leadership significantly affected which conflict mode was chosen (Hendel et al., 2005). A 2002 study by Jordan and Troth found that people with high emotional intelligence preferred the collaborating conflict mode when facing conflict. Studies like these empirically demonstrate the TKI’s utility in organizational settings for a variety of applications beyond conflict management per se, including communication and negotiation.
CONCLUSION
For more than 30 years organizations and individuals have used the Thomas-Kilmann Conflict Mode Instrument to manage conflict, aid in individual and team development, coach employees, and train leaders. This technical brief provides a description of the development of
Technical Brief for the Thomas-Kilmann Conflict Mode Instrument Copyright 2007 by CPP, Inc. All rights reserved. 8

updated norms for this widely used assessment and shows that the TKI can provide a variety of insights into organizations, as well as being a useful tool for organizational conflict interventions.
The analyses reported show that the TKI has stood the test of time quite well. The renorming resulted in minimal changes to the underlying percentiles for each of the conflict modes from the original norm group to the updated larger and more diverse norm group. This suggests that the changes to the percentiles and the norm sample should have a minimal impact on professionals who make use of this versatile and stable assessment. The TKI norms are applicable across age, ethnic groups, and gender, and work well at many organizational levels and across a broad range of occupational categories.
The revised percentiles for each of the conflict-handling modes changed only slightly, with the noticeable changes occurring in the competing and compromising modes. Compared to the original norm sample, the updated norm sample has somewhat lower raw scores on these two modes, so that slightly lower raw scores on competing or compromising are now assigned to a higher interpretive range. This slight shift is likely due to simply having more accurate estimates of the distribution of the modes in the larger, more diverse norm sample, and not due to changes in the usage of the modes over time. Had there been fundamental changes in how people prefer to deal with conflict, it is likely that there would have been larger changes across the entire set of modes and not the slight shifts seen here.
The updated norm sample upon which the revised percentiles were developed now encompasses a diverse, more representative group of individuals. Initial analyses on this sample indicate that differences on median TKI scores between men and women, as well as between different ethnic groups, organizational levels, and educational levels, are negligible in terms of practical importance. Based on the newly updated norm sample, the TKI may be used with confidence to successfully aid conflict management in organizational and educational settings among people from diverse groups.
REFERENCES
Ben-Yoav, O., & Banai, M. (1992). Measuring conflict management styles: A comparison between the MODE and ROCIII instruments using self and peer ratings. International Journal of Conflict Management, 3(3), 237–247.
Brahnam, S. D., Margavio, T. M., Hignite, M. A., Barrier, T. B., & Chin, J. M. (2005). A gender-based categorization for conflict resolution. Journal of Management Development, 24(3), 197–208.
Cohen, J. (1988). Statistical power for the behavioral sciences (2nd ed.). Hillsdale, NJ: Lawrence Erlbaum Associates, Publishers.
Gasser, C. E., Larson, L. M., & Borgen, F. H. (2007). Concurrent validity of the 2005 Strong Interest Inventory®: An examination of gender and major field of study. Journal of Career Assessment, 15(23), 23–43.
Hendel, T., Fish, M., & Galon, V. (2005). Leadership style and choice of strategy in conflict management among Israeli nurse managers in general hospitals. Journal of Nursing Management, 13(2), 137–146.
Huszczo, G. E. (1996). Tools for team excellence. Mountain View, CA: Davies-Black Publishing.
Johnson, A. K. (1997). Conflict-handling intentions and the MBTI®: A construct validity study. Journal of Psychological Type, 43, 29–39.
Jordan, P. J., & Troth, A. C. (2002). Emotional intelligence and conflict resolution: Implications for human resource development. Advances in Developing Human Resources, 4(1), 62–79.
Kilmann, R. H., & Thomas, K. W. (1977). Developing a forced-choice measure of conflict-handling behavior: The “mode” instrument. Educational and Psychological Measurement, 37(2), 309–325.
Marquardt, M. J., & Horvath, L. (2001). Global teams. Mountain View, CA: Davies-Black Publishing.
Mills, J., Robey, D., & Smith, L. (1985). Conflict-handling and personality dimensions of project-management personnel. Psychological Reports, 57(3), 1135–1143.
Morley, D. D., & Shockley-Zalabak, P. (1986). Conflict avoiders and compromisers: Toward an understanding of their organizational communication style. Group & Organization Studies, 11(4), 387–402.
Nelson, D. T., & Lubin, B. (1991). Performance of state legislators on the Conflict Mode Instrument. Organization Development Journal, 9(1), 79–80.
Parker, G. M. (1996). Team players and teamwork. San Francisco: Jossey-Bass.
Percival, T. Q., Smitheram, V., & Kelly, M. (1992). Myers-Briggs Type Indicator® and conflict-handling intention: An interactive approach. Journal of Psychological Type, 23, 10–16.
Shell, G. R. (2001). Bargaining styles and negotiation: The Thomas-Kilmann Conflict Mode Instrument in negotiation training. Negotiation Journal, 17(2), 155–174.
Shockley-Zalabak, P. S., & Morley, D. D. (1984a). An exploratory study of relationships between preferences for conflict styles and communication apprehension. Journal of Language and Social Psychology, 3(3), 213–218.
Shockley-Zalabak, P. S., & Morley, D. D. (1984b). Sex differences in conflict style preferences. Communication Research Reports, 1(1), 28–32.
Technical Brief for the Thomas-Kilmann Conflict Mode Instrument Copyright 2007 by CPP, Inc. All rights reserved. 9

Tabachnick, B. G., & Fidell, L. S. (2001). Using multivariate statistics. Needham Heights, MA: Allyn & Bacon.
Thomas, K. W. (2002). Introduction to conflict management: Improving performance using the TKI. Mountain View, CA: CPP, Inc.
Thomas, K. W., & Kilmann, R. H. (1974, 2007). Thomas-Kilmann Conflict Mode Instrument. Mountain View, CA: Xicom, a subsidiary of CPP, Inc.
Thomas, K. W., Merriam, J., Schaubhut, N., Donnay, D., & Thomas, G. F. (2006). More competitive at the top: A large-sample study of organizational level, gender, and conflict styles. Paper presented at the annual meeting of the Academy of Management, Atlanta.
Thomas, K. W., & Thomas, G. F. (2004). Introduction to conflict and teams: Enhancing team performance using the TKI. Mountain View, CA: CPP, Inc.
United States Department of Labor Bureau of Labor Statistics. (n.d.). Household data annual averages, table 18. Retrieved August 15, 2006, from http://www.bls.gov/cps/cpsaat18.pdf
Valentine, P. E. B. (2001). A gender perspective on conflict management strategies of nurses. Journal of Nursing Scholarship, 33(1), 69–74.
Van de Vliert, E., & Kabanoff, B. (1990). Toward theory-based measures of cognitive management. Academy of Management Journal, 33(1), 199–209.
Volkema, R. J., & Bergmann, T. J. (1995). Conflict styles as indicators of behavioral patterns in interpersonal conflicts. Journal of Social Psychology, 135(1), 5–15.
Technical Brief for the Thomas-Kilmann Conflict Mode Instrument Copyright 2007 by CPP, Inc. All rights reserved. 10
Copyright © 2022 FDOKUMEN

