


Bahasa
Halaman
Hukum

Journal of Inorganic Biochemistry 102 (2008) 1644–1653
Contents lists available at ScienceDirect
Journal of Inorganic Biochemistry
journal homepage: www.elsevier .com/locate / j inorgbio
Synthesis, structural characteristics, DNA binding properties and cytotoxicitystudies of a series of Ru(III) complexes
Caiping Tan, Jie Liu *, Lanmei Chen, Shuo Shi, Liangnian Ji *
MOE Laboratory of Bioinorganic and Synthetic Chemistry, School of Chemistry and Chemical Engineering, Sun Yat-Sen University, Xingang Road, Guangzhou 510275, PR China
a r t i c l e i n f o a b s t r a c t
Article history:Received 12 November 2007Received in revised form 18 March 2008Accepted 20 March 2008Available online 1 April 2008
Keywords:Ru(III) complexesAnticancer drugDNA binding
0162-0134/$ - see front matter � 2008 Elsevier Inc. Adoi:10.1016/j.jinorgbio.2008.03.005
* Corresponding authors. Tel.: +86 20 31745729; fatel./fax: +86 20 84035497 (L. Ji).
E-mail addresses: [email protected] (J. LiuJi).
Four related ruthenium(III) complexes, with the formula mer-[RuCl3(dmso)(N�N)] (dmso = dimethylsulfoxide; N�N = 2,20-bipyridine (1), 1,10-phenantroline (2), dipyrido[3,2-f:20 ,30-h]quinoxaline (3) anddipyrido[3,2-a:20 ,30-c]phenazine (4)), have been reported. Complexes 3 and 4 are newly synthesizedand characterized by X-ray diffraction. The hydrolysis process of 1–4 has been studied by UV–vis mea-surement, and it has been found that the extension of the N�N ligands can increase the stability ofthe complexes. The binding of these complexes with DNA has been investigated by plasmid cleavageassay, competitive binding with ethidium bromide (EB), DNA melting experiments and viscosity mea-surements. The DNA binding affinity is increased with the extension of the planar area of the N�Nligands, and complex 4 shows an intercalative mode of interaction with DNA. The in vitro anticanceractivities of these compounds are moderate on the five human cancer cell lines screened.
� 2008 Elsevier Inc. All rights reserved.
1. Introduction anticancer agents, e.g. a-[Ru(II)(azpy) Cl ] (azpy = 2-phenylazopy-
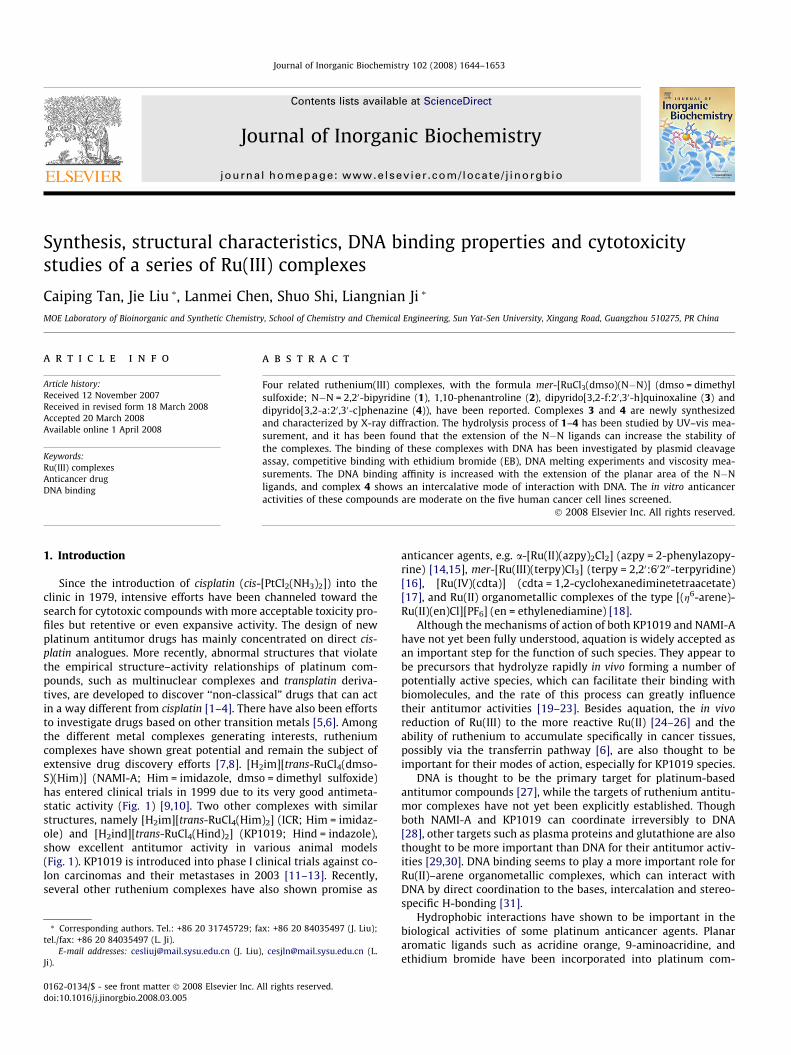
Since the introduction of cisplatin (cis-[PtCl2(NH3)2]) into theclinic in 1979, intensive efforts have been channeled toward thesearch for cytotoxic compounds with more acceptable toxicity pro-files but retentive or even expansive activity. The design of newplatinum antitumor drugs has mainly concentrated on direct cis-platin analogues. More recently, abnormal structures that violatethe empirical structure–activity relationships of platinum com-pounds, such as multinuclear complexes and transplatin deriva-tives, are developed to discover ‘‘non-classical” drugs that can actin a way different from cisplatin [1–4]. There have also been effortsto investigate drugs based on other transition metals [5,6]. Amongthe different metal complexes generating interests, rutheniumcomplexes have shown great potential and remain the subject ofextensive drug discovery efforts [7,8]. [H2im][trans-RuCl4(dmso-S)(Him)] (NAMI-A; Him = imidazole, dmso = dimethyl sulfoxide)has entered clinical trials in 1999 due to its very good antimeta-static activity (Fig. 1) [9,10]. Two other complexes with similarstructures, namely [H2im][trans-RuCl4(Him)2] (ICR; Him = imidaz-ole) and [H2ind][trans-RuCl4(Hind)2] (KP1019; Hind = indazole),show excellent antitumor activity in various animal models(Fig. 1). KP1019 is introduced into phase I clinical trials against co-lon carcinomas and their metastases in 2003 [11–13]. Recently,several other ruthenium complexes have also shown promise as
ll rights reserved.
x: +86 20 84035497 (J. Liu);
), [email protected] (L.
2 2
rine) [14,15], mer-[Ru(III)(terpy)Cl3] (terpy = 2,20:60200-terpyridine)[16], [Ru(IV)(cdta)] (cdta = 1,2-cyclohexanediminetetraacetate)[17], and Ru(II) organometallic complexes of the type [(g6-arene)-Ru(II)(en)Cl][PF6] (en = ethylenediamine) [18].
Although the mechanisms of action of both KP1019 and NAMI-Ahave not yet been fully understood, aquation is widely accepted asan important step for the function of such species. They appear tobe precursors that hydrolyze rapidly in vivo forming a number ofpotentially active species, which can facilitate their binding withbiomolecules, and the rate of this process can greatly influencetheir antitumor activities [19–23]. Besides aquation, the in vivoreduction of Ru(III) to the more reactive Ru(II) [24–26] and theability of ruthenium to accumulate specifically in cancer tissues,possibly via the transferrin pathway [6], are also thought to beimportant for their modes of action, especially for KP1019 species.
DNA is thought to be the primary target for platinum-basedantitumor compounds [27], while the targets of ruthenium antitu-mor complexes have not yet been explicitly established. Thoughboth NAMI-A and KP1019 can coordinate irreversibly to DNA[28], other targets such as plasma proteins and glutathione are alsothought to be more important than DNA for their antitumor activ-ities [29,30]. DNA binding seems to play a more important role forRu(II)–arene organometallic complexes, which can interact withDNA by direct coordination to the bases, intercalation and stereo-specific H-bonding [31].
Hydrophobic interactions have shown to be important in thebiological activities of some platinum anticancer agents. Planararomatic ligands such as acridine orange, 9-aminoacridine, andethidium bromide have been incorporated into platinum com-
NH
N
RuCl
Cl Cl
Cl
S
NHHN
OMe
Me
NHN
NNH
RuCl
Cl Cl
Cl
HN
HN
Fig. 1. Structures of [H2ind][trans-RuCl4(Hind)2] (KP1019; left) and [H2im][trans-RuCl4(dmso-S)(Him)] (NAMI-A; right).
C. Tan et al. / Journal of Inorganic Biochemistry 102 (2008) 1644–1653 1645
plexes as potential intercalators [32–34]. The antitumor activity oftrans-[PtCl2(NH3)L] (L = planar aromatic N donor such as pyridine,thiazole, or quinoline) is much higher than that of transplatin,which has been attributed to the additional intercalation or hydro-phobic interaction after covalent binding of Pt(II) to nucleobases[35,36]. It is also well known that the presence of intercalative li-gands in coordinatively saturated octahedral Ru(II), Os(II), andRh(III) complexes can increase their DNA binding affinity, and giverise to highly specific recognition of DNA base sequences via shapeselection [37].
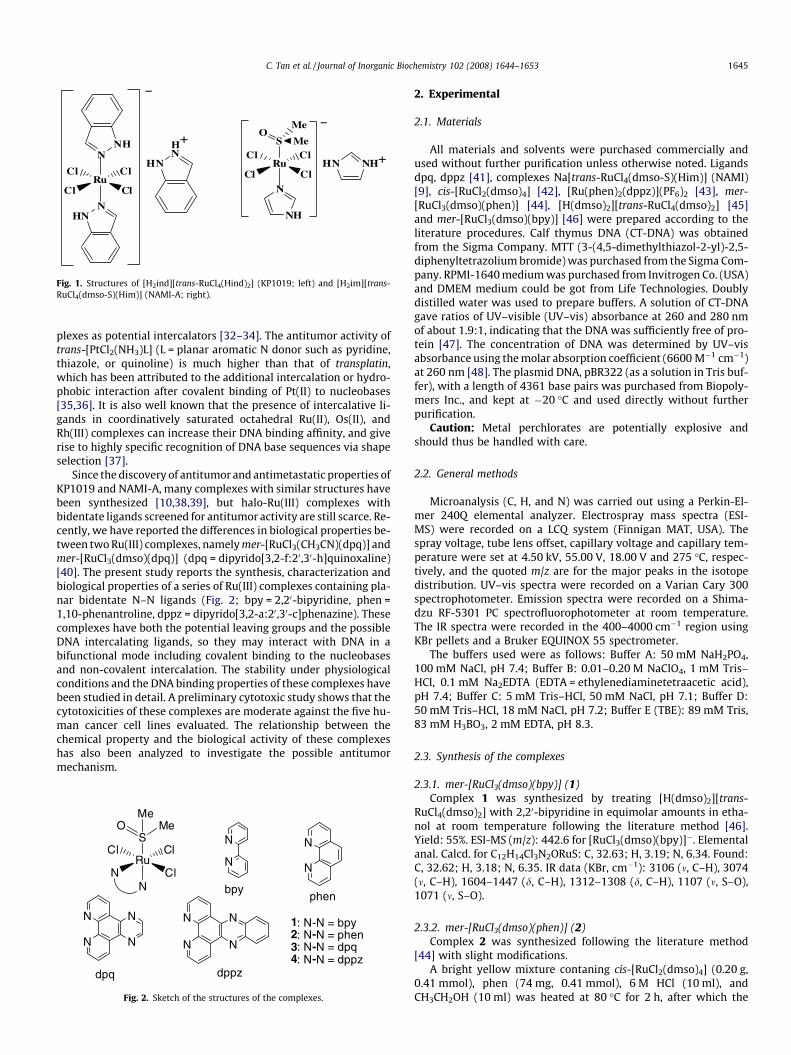
Since the discovery of antitumor and antimetastatic properties ofKP1019 and NAMI-A, many complexes with similar structures havebeen synthesized [10,38,39], but halo-Ru(III) complexes withbidentate ligands screened for antitumor activity are still scarce. Re-cently, we have reported the differences in biological properties be-tween two Ru(III) complexes, namely mer-[RuCl3(CH3CN)(dpq)] andmer-[RuCl3(dmso)(dpq)] (dpq = dipyrido[3,2-f:20,30-h]quinoxaline)[40]. The present study reports the synthesis, characterization andbiological properties of a series of Ru(III) complexes containing pla-nar bidentate N–N ligands (Fig. 2; bpy = 2,20-bipyridine, phen =1,10-phenantroline, dppz = dipyrido[3,2-a:20,30-c]phenazine). Thesecomplexes have both the potential leaving groups and the possibleDNA intercalating ligands, so they may interact with DNA in abifunctional mode including covalent binding to the nucleobasesand non-covalent intercalation. The stability under physiologicalconditions and the DNA binding properties of these complexes havebeen studied in detail. A preliminary cytotoxic study shows that thecytotoxicities of these complexes are moderate against the five hu-man cancer cell lines evaluated. The relationship between thechemical property and the biological activity of these complexeshas also been analyzed to investigate the possible antitumormechanism.
N
N
bpy
N
N
N
N N
N N
N N
N
RuN
Cl Cl
Cl
S
Nphen
dpq dppz
1: N-N = bpy2: N-N = phen3: N-N = dpq4: N-N = dppz
O MeMe
Fig. 2. Sketch of the structures of the complexes.
2. Experimental
2.1. Materials
All materials and solvents were purchased commercially andused without further purification unless otherwise noted. Ligandsdpq, dppz [41], complexes Na[trans-RuCl4(dmso-S)(Him)] (NAMI)[9], cis-[RuCl2(dmso)4] [42], [Ru(phen)2(dppz)](PF6)2 [43], mer-[RuCl3(dmso)(phen)] [44], [H(dmso)2][trans-RuCl4(dmso)2] [45]and mer-[RuCl3(dmso)(bpy)] [46] were prepared according to theliterature procedures. Calf thymus DNA (CT-DNA) was obtainedfrom the Sigma Company. MTT (3-(4,5-dimethylthiazol-2-yl)-2,5-diphenyltetrazolium bromide) was purchased from the Sigma Com-pany. RPMI-1640 medium was purchased from Invitrogen Co. (USA)and DMEM medium could be got from Life Technologies. Doublydistilled water was used to prepare buffers. A solution of CT-DNAgave ratios of UV–visible (UV–vis) absorbance at 260 and 280 nmof about 1.9:1, indicating that the DNA was sufficiently free of pro-tein [47]. The concentration of DNA was determined by UV–visabsorbance using the molar absorption coefficient (6600 M�1 cm�1)at 260 nm [48]. The plasmid DNA, pBR322 (as a solution in Tris buf-fer), with a length of 4361 base pairs was purchased from Biopoly-mers Inc., and kept at �20 �C and used directly without furtherpurification.
Caution: Metal perchlorates are potentially explosive andshould thus be handled with care.
2.2. General methods
Microanalysis (C, H, and N) was carried out using a Perkin-El-mer 240Q elemental analyzer. Electrospray mass spectra (ESI-MS) were recorded on a LCQ system (Finnigan MAT, USA). Thespray voltage, tube lens offset, capillary voltage and capillary tem-perature were set at 4.50 kV, 55.00 V, 18.00 V and 275 �C, respec-tively, and the quoted m/z are for the major peaks in the isotopedistribution. UV–vis spectra were recorded on a Varian Cary 300spectrophotometer. Emission spectra were recorded on a Shima-dzu RF-5301 PC spectrofluorophotometer at room temperature.The IR spectra were recorded in the 400–4000 cm�1 region usingKBr pellets and a Bruker EQUINOX 55 spectrometer.
The buffers used were as follows: Buffer A: 50 mM NaH2PO4,100 mM NaCl, pH 7.4; Buffer B: 0.01–0.20 M NaClO4, 1 mM Tris–HCl, 0.1 mM Na2EDTA (EDTA = ethylenediaminetetraacetic acid),pH 7.4; Buffer C: 5 mM Tris–HCl, 50 mM NaCl, pH 7.1; Buffer D:50 mM Tris–HCl, 18 mM NaCl, pH 7.2; Buffer E (TBE): 89 mM Tris,83 mM H3BO3, 2 mM EDTA, pH 8.3.
2.3. Synthesis of the complexes
2.3.1. mer-[RuCl3(dmso)(bpy)] (1)Complex 1 was synthesized by treating [H(dmso)2][trans-
RuCl4(dmso)2] with 2,20-bipyridine in equimolar amounts in etha-nol at room temperature following the literature method [46].Yield: 55%. ESI-MS (m/z): 442.6 for [RuCl3(dmso)(bpy)]�. Elementalanal. Calcd. for C12H14Cl3N2ORuS: C, 32.63; H, 3.19; N, 6.34. Found:C, 32.62; H, 3.18; N, 6.35. IR data (KBr, cm�1): 3106 (m, C–H), 3074(m, C–H), 1604–1447 (d, C–H), 1312–1308 (d, C–H), 1107 (m, S–O),1071 (m, S–O).
2.3.2. mer-[RuCl3(dmso)(phen)] (2)Complex 2 was synthesized following the literature method
[44] with slight modifications.A bright yellow mixture contaning cis-[RuCl2(dmso)4] (0.20 g,
0.41 mmol), phen (74 mg, 0.41 mmol), 6 M HCl (10 ml), andCH3CH2OH (10 ml) was heated at 80 �C for 2 h, after which the
1646 C. Tan et al. / Journal of Inorganic Biochemistry 102 (2008) 1644–1653
resulting clear red solution was concentrated in a rotary evapora-tor and then dried in vacuo. The crude product was purified by col-umn chromatography on a neutral alumina with dried CH2Cl2 andCH3OH (10:1, v/v) as eluent, which gave 3 as a dark red solid. Yield:134 mg (70%). The structure is the same as that reported in the lit-erature [44]. ESI-MS (m/z): 466.7 for [RuCl3(dmso)(phen)]�. Ele-mental anal. Calcd. for C14H14Cl3N2ORuS: C, 36.10; H, 3.03; N,6.01. Found: C, 36.07; H, 3.05; N, 6.03.
2.3.3. mer-[RuCl3(dmso)(dpq)] (3)The complex was obtained by using dpq (96 mg, 0.41 mmol) in-
stead of phen in 2. The crude product was purified by column chro-matography on a neutral alumina with dried CH2Cl2 and CH3OH(10:1, v/v) as eluent, which gave 3 as a dark red solid. Yield:0.160 g (72%). Brown prism-shaped crystals were obtained by slowevaporation of the concentrated CH3OH or CH3CH2OH solution of 3at room temperature. Yield: 0.114 g (50%). ESI-MS (m/z): 518.9 for[RuCl3(dmso)(dpq)]�. Elemental anal. Calcd. for C16H14Cl3N2ORuS:C, 37.11; H, 2.73; N, 10.82. Found: C, 37.10; H, 2.76; N, 10.80. IRdata (KBr, cm�1): 3074 (m, C–H), 2920 (m, C–H), 1607–1483 (d, C–H), 1385–1308(d, C–H), 1111(m, S–O), 1083 (m, S–O).
2.3.4. mer-[RuCl3(dmso)(dppz)] (4)The complex was obtained by the exchange of the phen in 2
with dppz (112 mg, 0.41 mmol). The crude product was purifiedby column chromatography on a neutral alumina with driedCH2Cl2 and CH3OH (10:1, v/v) as eluent, which gave 4 as a darkred solid. Yield: 0.149 g (60%). Red needle-like crystals were ob-tained by slow evaporation of the concentrated CH3CN solutionof 4 at room temperature. Yield: 0.087 g (35%). ESI-MS (m/z):568.9 for [RuCl3(dmso)(dppz)]�. Elemental anal. Calcd. forC20H16Cl3N4ORuS: C, 42.30; H, 2.84; N, 9.87. Found: C, 42.33; H,2.82; N, 9.86. IR data (KBr, cm�1): 3076 (m, C–H), 2938 (m, C–H),1613–1489 (d, C–H), 1356–1309 (d, C–H), 1131 (m, S–O), 1076 (m,S–O), 3499 (m, N–H).
2.4. Crystal structure determination and refinement of complexes 3and 4
X-ray diffraction measurements were performed on a BruckerSmart 1000 CCD diffractometer with Mo Ka radiation(k = 0.71073 Å) at 293 K for 3 and 4. All empirical absorption cor-rections were applied by using the SADABS program [49]. Thestructures were determined using direct methods, which yieldedthe positions of all non-hydrogen atoms. These were refined, first,isotropically and, then, anisotropically. All the hydrogen atoms ofthe ligands were placed in calculated positions with fixed isotropicthermal parameters and the structure factor calculations were in-cluded in the final stage of full-matrix least-squares refinement.All calculations were performed using the SHELXTL-97 system ofthe computer programs [50].
2.5. Solution chemistry and stability studies
The absorption spectra in the UV–vis region were recorded at25 �C. The Ru(III) complexes were first dissolved in a minimumamount of dmso (0.5% of the final volume), and then diluted withphosphate buffer (buffer A) or Tris–HCl buffer (buffer C). The sta-bility studies were carried out by monitoring the electronic spectraof the resulting mixtures over 24 h.
2.6. DNA interactions
2.6.1. DNA cleavage studyThe cleavage reactions were carried out in a total volume of
10 ll containing pBR322 DNA (0.1 lg) and different amounts of
Ru(III) complexes, sodium ascorbate and reduced glutathione inbuffer D. The mixture was incubated at 37 �C for 24 h. A coveredheating block was used to prevent solvent evaporation duringthe experiment. A dye solution (bromophenol blue 0.05%, glycerol5%, and 2 mM EDTA) was added to the reaction mixture prior toelectrophoresis. The samples were analyzed by electrophoresisfor 3 h at 70 V on a 1% agarose gel in buffer E. Then the gel wasstained with 1 lg/ml EB (ethidium bromide) and photographedon an Alpha Innotech IS-5500 fluorescence chemiluminescenceand visible imaging system.
2.6.2. Competitive binding with EBThe experiments of DNA competitive binding with EB were car-
ried out in buffer C by keeping [DNA]/[EB] = 5 and varying the con-centrations of the Ru(III) complexes. The fluorescence spectra of EBwere measured using excitation wavelength at 537 nm and theemission range was set between 550 and 750 nm. The controlexperiments were performed by keeping [EB] = 20 lM (in the ab-sence of DNA, [Ru] = 0–20 lM). The spectra were analyzed accord-ing to the classical Stern–Volmer equation (1), where I0 and I arethe fluorescence intensities at 590 nm in the absence and presenceof the complexes, respectively, Ksv is the linear Stern–Volmerquenching constant, r is the ratio of the total concentration ofthe complexes to that of DNA ([Ru]/[DNA]).
I0=I ¼ 1þ Ksvr ð1Þ
2.6.3. Thermal denaturization of CT-DNAThermal denaturization experiments were performed on a
UV–vis spectrophotometer equipped with a Peltier temperaturecontroller in buffer B. The temperature of the cell containing thecuvette was ramped from 50 to 100 �C at 1 �C/min rate, and theabsorbance at 260 nm was measured every 1 �C. The Tm valueswere determined from the maximum of the first derivative or tan-gentially from the graphs at midpoint of the transition curves. DTm
values were calculated by subtracting Tm of the nucleic acid withcomplex from Tm of the free CT-DNA.
2.6.4. Viscosity measurementsViscosity measurements were carried out using an Ubbdlodhe
viscometer maintained at a constant temperature of 30.0 ± 0.1 �Cin a thermostatic bath. CT-DNA samples with an approximate aver-age length of 200 base pairs were prepared by sonication in orderto minimize complexities arising from DNA flexibility [51]. Flowtime was measured with a digital stopwatch. Each sample wasmeasured at least three times and an average flow time was calcu-lated. Data were presented as (N/N0)1/3 versus binding ratio ([Ru]/[DNA]) [52]. Viscosity values were calculated from the observedflow time of DNA-containing solutions corrected for the flow timeof buffer alone (t0), N = t�t0.
2.7. Cell culture and cytotoxicity assay
Cells were supplied by Center of Experimental Animal Sun Yat-Sen University (Guangzhou, China). Cells were routinely kept inRPMI-1640 medium or DMEM medium supplemented with 10%fetal bovine serum, penicillin G (100 U/ml) and streptomycin(100 lg/ml) at 37 �C in a humidified atmosphere containing 5%CO2. After a confluent cell layer was formed, the cells were har-vested from the adherent cultures using 0.125% trypsin + 0.01%EDTA in phosphate buffered saline or D-Hank’s buffer for 5 min.Suspensions were adjusted to cell densities of 5 � 104 cells/ml inorder to ensure exponential growth throughout drug exposure. Ali-quots of these suspensions were seeded into 96-well microcultures(100 ll/well). After incubation for 24 h cells were exposed to thetested compounds of serial concentrations. The compounds were
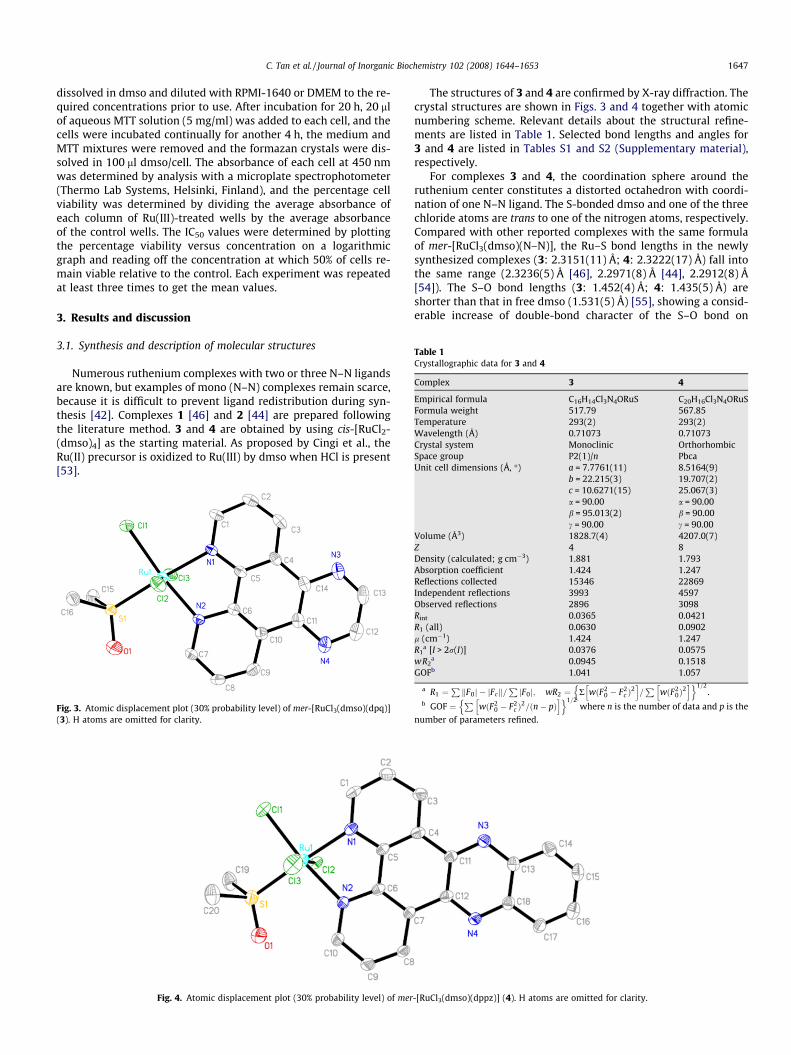
Table 1Crystallographic data for 3 and 4
Complex 3 4
Empirical formula C16H14Cl3N4ORuS C20H16Cl3N4ORuSFormula weight 517.79 567.85Temperature 293(2) 293(2)Wavelength (Å) 0.71073 0.71073Crystal system Monoclinic OrthorhombicSpace group P2(1)/n PbcaUnit cell dimensions (Å, �) a = 7.7761(11) 8.5164(9)
b = 22.215(3) 19.707(2)
C. Tan et al. / Journal of Inorganic Biochemistry 102 (2008) 1644–1653 1647
dissolved in dmso and diluted with RPMI-1640 or DMEM to the re-quired concentrations prior to use. After incubation for 20 h, 20 llof aqueous MTT solution (5 mg/ml) was added to each cell, and thecells were incubated continually for another 4 h, the medium andMTT mixtures were removed and the formazan crystals were dis-solved in 100 ll dmso/cell. The absorbance of each cell at 450 nmwas determined by analysis with a microplate spectrophotometer(Thermo Lab Systems, Helsinki, Finland), and the percentage cellviability was determined by dividing the average absorbance ofeach column of Ru(III)-treated wells by the average absorbanceof the control wells. The IC50 values were determined by plottingthe percentage viability versus concentration on a logarithmicgraph and reading off the concentration at which 50% of cells re-main viable relative to the control. Each experiment was repeatedat least three times to get the mean values.
3. Results and discussion
3.1. Synthesis and description of molecular structures
Numerous ruthenium complexes with two or three N–N ligandsare known, but examples of mono (N–N) complexes remain scarce,because it is difficult to prevent ligand redistribution during syn-thesis [42]. Complexes 1 [46] and 2 [44] are prepared followingthe literature method. 3 and 4 are obtained by using cis-[RuCl2-(dmso)4] as the starting material. As proposed by Cingi et al., theRu(II) precursor is oxidized to Ru(III) by dmso when HCl is present[53].
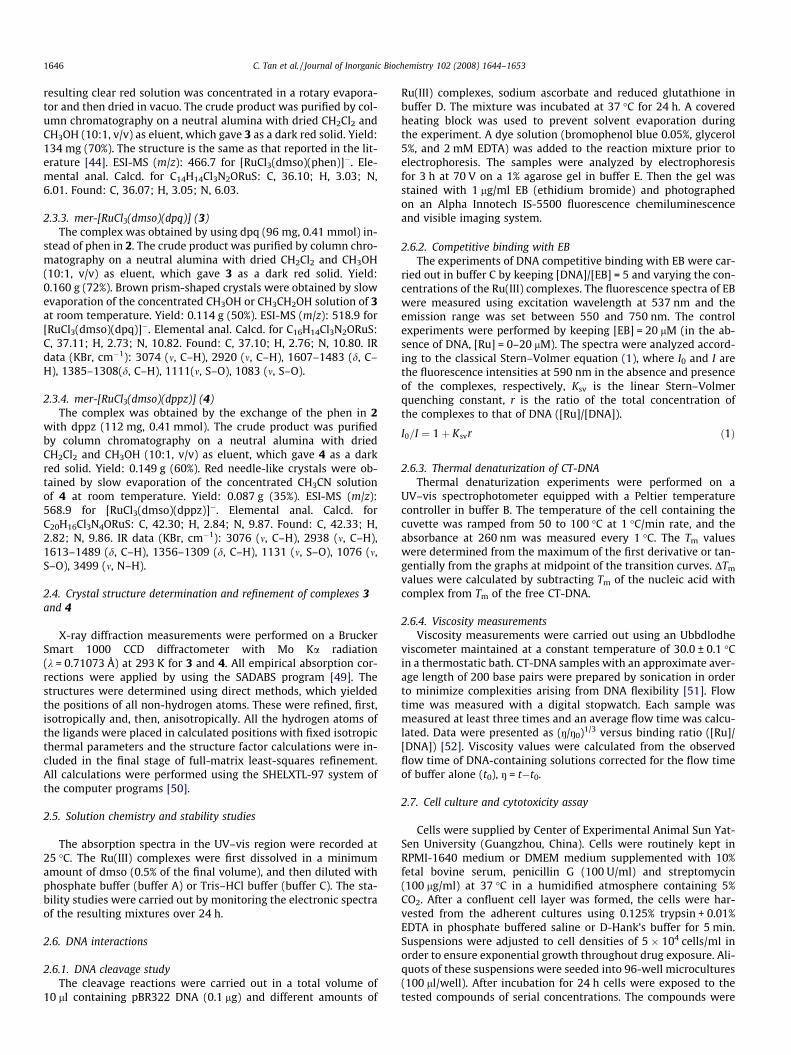
Fig. 3. Atomic displacement plot (30% probability level) of mer-[RuCl3(dmso)(dpq)](3). H atoms are omitted for clarity.
Fig. 4. Atomic displacement plot (30% probability level) of mer
The structures of 3 and 4 are confirmed by X-ray diffraction. Thecrystal structures are shown in Figs. 3 and 4 together with atomicnumbering scheme. Relevant details about the structural refine-ments are listed in Table 1. Selected bond lengths and angles for3 and 4 are listed in Tables S1 and S2 (Supplementary material),respectively.
For complexes 3 and 4, the coordination sphere around theruthenium center constitutes a distorted octahedron with coordi-nation of one N–N ligand. The S-bonded dmso and one of the threechloride atoms are trans to one of the nitrogen atoms, respectively.Compared with other reported complexes with the same formulaof mer-[RuCl3(dmso)(N–N)], the Ru–S bond lengths in the newlysynthesized complexes (3: 2.3151(11) Å; 4: 2.3222(17) Å) fall intothe same range (2.3236(5) Å [46], 2.2971(8) Å [44], 2.2912(8) Å[54]). The S–O bond lengths (3: 1.452(4) Å; 4: 1.435(5) Å) areshorter than that in free dmso (1.531(5) Å) [55], showing a consid-erable increase of double-bond character of the S–O bond on
-[RuCl3(dmso)(dppz)] (4). H atoms are omitted for clarity.
c = 10.6271(15) 25.067(3)a = 90.00 a = 90.00b = 95.013(2) b = 90.00c = 90.00 c = 90.00
Volume (Å3) 1828.7(4) 4207.0(7)Z 4 8Density (calculated; g cm�3) 1.881 1.793Absorption coefficient 1.424 1.247Reflections collected 15346 22869Independent reflections 3993 4597Observed reflections 2896 3098Rint 0.0365 0.0421R1 (all) 0.0630 0.0902l (cm�1) 1.424 1.247R1
a [I > 2r(I)] 0.0376 0.0575wR2
a 0.0945 0.1518GOFb 1.041 1.057
a R1 ¼PkF0j � jFck=
PjF0j; wR2 ¼ R wðF2
0 � F2c Þ
2h i
=P
wðF20Þ
2h in o1=2
.b GOF ¼
PwðF2
0 � F2c Þ
2=ðn� pÞh in o1=2
where n is the number of data and p is the
number of parameters refined.
1648 C. Tan et al. / Journal of Inorganic Biochemistry 102 (2008) 1644–1653
coordination to ruthenium through the sulfur atom. The bonds be-tween Ru(III) ion and the N–N bidentate ligands are similar tothose found in other ruthenium(II) polypyridine complexes [56].
3.2. Solution chemistry
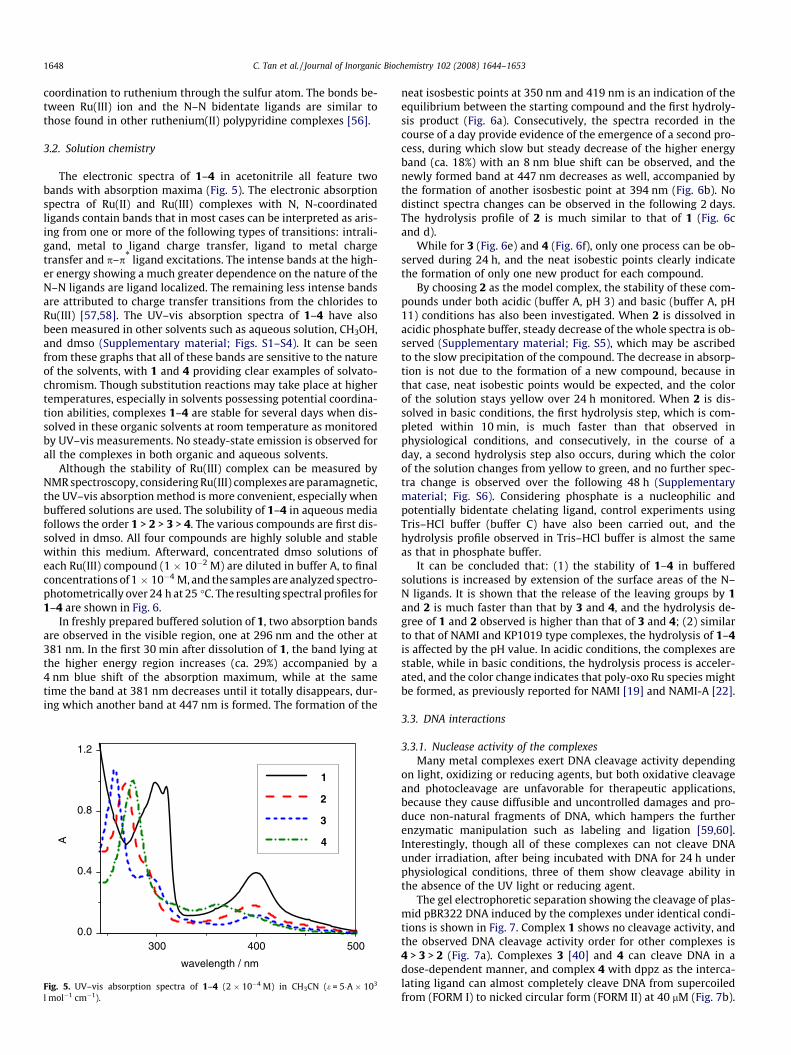
The electronic spectra of 1–4 in acetonitrile all feature twobands with absorption maxima (Fig. 5). The electronic absorptionspectra of Ru(II) and Ru(III) complexes with N, N-coordinatedligands contain bands that in most cases can be interpreted as aris-ing from one or more of the following types of transitions: intrali-gand, metal to ligand charge transfer, ligand to metal chargetransfer and p–p* ligand excitations. The intense bands at the high-er energy showing a much greater dependence on the nature of theN–N ligands are ligand localized. The remaining less intense bandsare attributed to charge transfer transitions from the chlorides toRu(III) [57,58]. The UV–vis absorption spectra of 1–4 have alsobeen measured in other solvents such as aqueous solution, CH3OH,and dmso (Supplementary material; Figs. S1–S4). It can be seenfrom these graphs that all of these bands are sensitive to the natureof the solvents, with 1 and 4 providing clear examples of solvato-chromism. Though substitution reactions may take place at highertemperatures, especially in solvents possessing potential coordina-tion abilities, complexes 1–4 are stable for several days when dis-solved in these organic solvents at room temperature as monitoredby UV–vis measurements. No steady-state emission is observed forall the complexes in both organic and aqueous solvents.
Although the stability of Ru(III) complex can be measured byNMR spectroscopy, considering Ru(III) complexes are paramagnetic,the UV–vis absorption method is more convenient, especially whenbuffered solutions are used. The solubility of 1–4 in aqueous mediafollows the order 1 > 2 > 3 > 4. The various compounds are first dis-solved in dmso. All four compounds are highly soluble and stablewithin this medium. Afterward, concentrated dmso solutions ofeach Ru(III) compound (1 � 10�2 M) are diluted in buffer A, to finalconcentrations of 1 � 10�4 M, and the samples are analyzed spectro-photometrically over 24 h at 25 �C. The resulting spectral profiles for1–4 are shown in Fig. 6.
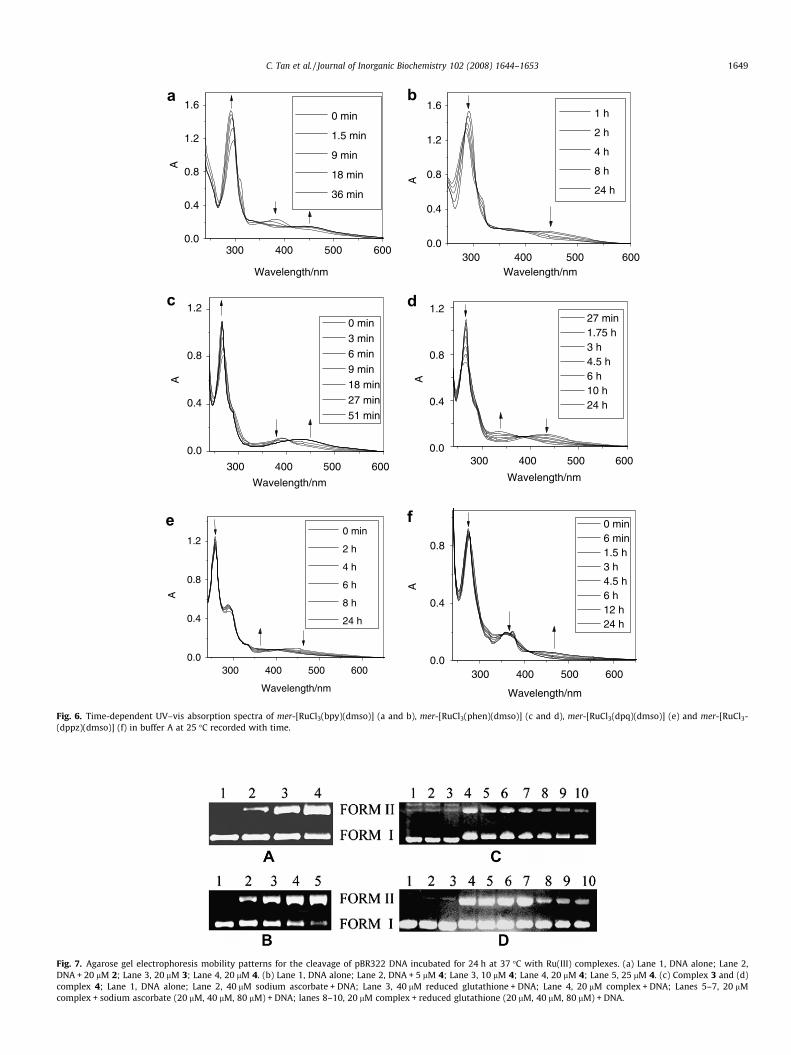
In freshly prepared buffered solution of 1, two absorption bandsare observed in the visible region, one at 296 nm and the other at381 nm. In the first 30 min after dissolution of 1, the band lying atthe higher energy region increases (ca. 29%) accompanied by a4 nm blue shift of the absorption maximum, while at the sametime the band at 381 nm decreases until it totally disappears, dur-ing which another band at 447 nm is formed. The formation of the
300 400 5000.0
0.4
0.8
1.2
A
wavelength / nm
1
2
3
4
Fig. 5. UV–vis absorption spectra of 1–4 (2 � 10�4 M) in CH3CN (e = 5�A � 103
l mol�1 cm�1).
neat isosbestic points at 350 nm and 419 nm is an indication of theequilibrium between the starting compound and the first hydroly-sis product (Fig. 6a). Consecutively, the spectra recorded in thecourse of a day provide evidence of the emergence of a second pro-cess, during which slow but steady decrease of the higher energyband (ca. 18%) with an 8 nm blue shift can be observed, and thenewly formed band at 447 nm decreases as well, accompanied bythe formation of another isosbestic point at 394 nm (Fig. 6b). Nodistinct spectra changes can be observed in the following 2 days.The hydrolysis profile of 2 is much similar to that of 1 (Fig. 6cand d).
While for 3 (Fig. 6e) and 4 (Fig. 6f), only one process can be ob-served during 24 h, and the neat isobestic points clearly indicatethe formation of only one new product for each compound.
By choosing 2 as the model complex, the stability of these com-pounds under both acidic (buffer A, pH 3) and basic (buffer A, pH11) conditions has also been investigated. When 2 is dissolved inacidic phosphate buffer, steady decrease of the whole spectra is ob-served (Supplementary material; Fig. S5), which may be ascribedto the slow precipitation of the compound. The decrease in absorp-tion is not due to the formation of a new compound, because inthat case, neat isobestic points would be expected, and the colorof the solution stays yellow over 24 h monitored. When 2 is dis-solved in basic conditions, the first hydrolysis step, which is com-pleted within 10 min, is much faster than that observed inphysiological conditions, and consecutively, in the course of aday, a second hydrolysis step also occurs, during which the colorof the solution changes from yellow to green, and no further spec-tra change is observed over the following 48 h (Supplementarymaterial; Fig. S6). Considering phosphate is a nucleophilic andpotentially bidentate chelating ligand, control experiments usingTris–HCl buffer (buffer C) have also been carried out, and thehydrolysis profile observed in Tris–HCl buffer is almost the sameas that in phosphate buffer.
It can be concluded that: (1) the stability of 1–4 in bufferedsolutions is increased by extension of the surface areas of the N–N ligands. It is shown that the release of the leaving groups by 1and 2 is much faster than that by 3 and 4, and the hydrolysis de-gree of 1 and 2 observed is higher than that of 3 and 4; (2) similarto that of NAMI and KP1019 type complexes, the hydrolysis of 1–4is affected by the pH value. In acidic conditions, the complexes arestable, while in basic conditions, the hydrolysis process is acceler-ated, and the color change indicates that poly-oxo Ru species mightbe formed, as previously reported for NAMI [19] and NAMI-A [22].
3.3. DNA interactions
3.3.1. Nuclease activity of the complexesMany metal complexes exert DNA cleavage activity depending
on light, oxidizing or reducing agents, but both oxidative cleavageand photocleavage are unfavorable for therapeutic applications,because they cause diffusible and uncontrolled damages and pro-duce non-natural fragments of DNA, which hampers the furtherenzymatic manipulation such as labeling and ligation [59,60].Interestingly, though all of these complexes can not cleave DNAunder irradiation, after being incubated with DNA for 24 h underphysiological conditions, three of them show cleavage ability inthe absence of the UV light or reducing agent.
The gel electrophoretic separation showing the cleavage of plas-mid pBR322 DNA induced by the complexes under identical condi-tions is shown in Fig. 7. Complex 1 shows no cleavage activity, andthe observed DNA cleavage activity order for other complexes is4 > 3 > 2 (Fig. 7a). Complexes 3 [40] and 4 can cleave DNA in adose-dependent manner, and complex 4 with dppz as the interca-lating ligand can almost completely cleave DNA from supercoiledfrom (FORM I) to nicked circular form (FORM II) at 40 lM (Fig. 7b).
300 400 500 6000.0
0.4
0.8
1.2
1.6
A
Wavelength/nm
0 min
1.5 min
9 min
18 min
36 min
300 400 500 6000.0
0.4
0.8
1.2
1.6
A
Wavelength/nm
1 h
2 h
4 h
8 h
24 h
300 400 500 600
0.0
0.4
0.8
1.2
A
0 min
3 min
6 min
9 min
18 min
27 min
51 min
300 400 500 6000.0
0.4
0.8
1.2
A
Wavelength/nm
27 min 1.75 h 3 h 4.5 h 6 h 10 h 24 h
300 400 500 6000.0
0.4
0.8
1.2
A
Wavelength/nm
0 min
2 h
4 h
6 h
8 h
24 h
300 400 500 6000.0
0.4
0.8
A
Wavelength/nm
0 min 6 min 1.5 h 3 h 4.5 h 6 h 12 h 24 h
Wavelength/nm
Fig. 6. Time-dependent UV–vis absorption spectra of mer-[RuCl3(bpy)(dmso)] (a and b), mer-[RuCl3(phen)(dmso)] (c and d), mer-[RuCl3(dpq)(dmso)] (e) and mer-[RuCl3-(dppz)(dmso)] (f) in buffer A at 25 �C recorded with time.
Fig. 7. Agarose gel electrophoresis mobility patterns for the cleavage of pBR322 DNA incubated for 24 h at 37 �C with Ru(III) complexes. (a) Lane 1, DNA alone; Lane 2,DNA + 20 lM 2; Lane 3, 20 lM 3; Lane 4, 20 lM 4. (b) Lane 1, DNA alone; Lane 2, DNA + 5 lM 4; Lane 3, 10 lM 4; Lane 4, 20 lM 4; Lane 5, 25 lM 4. (c) Complex 3 and (d)complex 4; Lane 1, DNA alone; Lane 2, 40 lM sodium ascorbate + DNA; Lane 3, 40 lM reduced glutathione + DNA; Lane 4, 20 lM complex + DNA; Lanes 5–7, 20 lMcomplex + sodium ascorbate (20 lM, 40 lM, 80 lM) + DNA; lanes 8–10, 20 lM complex + reduced glutathione (20 lM, 40 lM, 80 lM) + DNA.
C. Tan et al. / Journal of Inorganic Biochemistry 102 (2008) 1644–1653 1649
550 600 650 700 7500
200
400
600
800
0.0 0.2 0.4 0.6 0.81.0
1.5
2.0
2.5
Ksv
= 1.73
I 0/
I
[Ru]/[DNA]Em
issi
on In
tens
ity
2
550 600 650 700 7500
200
400
600
800
0.0 0.1 0.2 0.3 0.4
1.0
1.5
2.0
2.5
3.0
[Ru]/[DNA]
I 0/ I
Ksv
= 4.47
Em
issi
on In
tens
ity
4
Wavelength/nm
Wavelength/nm
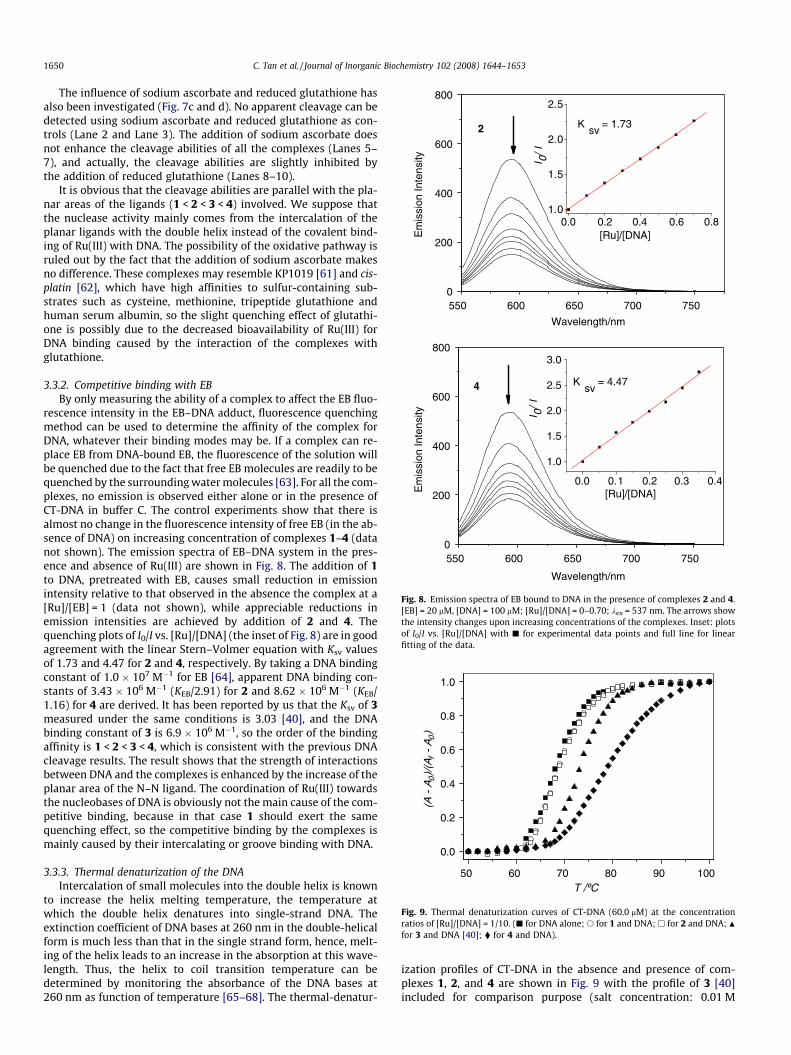
Fig. 8. Emission spectra of EB bound to DNA in the presence of complexes 2 and 4.[EB] = 20 lM, [DNA] = 100 lM; [Ru]/[DNA] = 0–0.70; kex = 537 nm. The arrows showthe intensity changes upon increasing concentrations of the complexes. Inset: plotsof I0/I vs. [Ru]/[DNA] with j for experimental data points and full line for linearfitting of the data.
50 60 70 80 90 100
0.0
0.2
0.4
0.6
0.8
1.0
T /ºC
(A -
A0)/
(Af -
A0)
Fig. 9. Thermal denaturization curves of CT-DNA (60.0 lM) at the concentrationratios of [Ru]/[DNA] = 1/10. (j for DNA alone; s for 1 and DNA; h for 2 and DNA; Nfor 3 and DNA [40]; � for 4 and DNA).
1650 C. Tan et al. / Journal of Inorganic Biochemistry 102 (2008) 1644–1653
The influence of sodium ascorbate and reduced glutathione hasalso been investigated (Fig. 7c and d). No apparent cleavage can bedetected using sodium ascorbate and reduced glutathione as con-trols (Lane 2 and Lane 3). The addition of sodium ascorbate doesnot enhance the cleavage abilities of all the complexes (Lanes 5–7), and actually, the cleavage abilities are slightly inhibited bythe addition of reduced glutathione (Lanes 8–10).
It is obvious that the cleavage abilities are parallel with the pla-nar areas of the ligands (1 < 2 < 3 < 4) involved. We suppose thatthe nuclease activity mainly comes from the intercalation of theplanar ligands with the double helix instead of the covalent bind-ing of Ru(III) with DNA. The possibility of the oxidative pathway isruled out by the fact that the addition of sodium ascorbate makesno difference. These complexes may resemble KP1019 [61] and cis-platin [62], which have high affinities to sulfur-containing sub-strates such as cysteine, methionine, tripeptide glutathione andhuman serum albumin, so the slight quenching effect of glutathi-one is possibly due to the decreased bioavailability of Ru(III) forDNA binding caused by the interaction of the complexes withglutathione.
3.3.2. Competitive binding with EBBy only measuring the ability of a complex to affect the EB fluo-
rescence intensity in the EB–DNA adduct, fluorescence quenchingmethod can be used to determine the affinity of the complex forDNA, whatever their binding modes may be. If a complex can re-place EB from DNA-bound EB, the fluorescence of the solution willbe quenched due to the fact that free EB molecules are readily to bequenched by the surrounding water molecules [63]. For all the com-plexes, no emission is observed either alone or in the presence ofCT-DNA in buffer C. The control experiments show that there isalmost no change in the fluorescence intensity of free EB (in the ab-sence of DNA) on increasing concentration of complexes 1–4 (datanot shown). The emission spectra of EB–DNA system in the pres-ence and absence of Ru(III) are shown in Fig. 8. The addition of 1to DNA, pretreated with EB, causes small reduction in emissionintensity relative to that observed in the absence the complex at a[Ru]/[EB] = 1 (data not shown), while appreciable reductions inemission intensities are achieved by addition of 2 and 4. Thequenching plots of I0/I vs. [Ru]/[DNA] (the inset of Fig. 8) are in goodagreement with the linear Stern–Volmer equation with Ksv valuesof 1.73 and 4.47 for 2 and 4, respectively. By taking a DNA bindingconstant of 1.0 � 107 M�1 for EB [64], apparent DNA binding con-stants of 3.43 � 106 M�1 (KEB/2.91) for 2 and 8.62 � 106 M�1 (KEB/1.16) for 4 are derived. It has been reported by us that the Ksv of 3measured under the same conditions is 3.03 [40], and the DNAbinding constant of 3 is 6.9 � 106 M�1, so the order of the bindingaffinity is 1 < 2 < 3 < 4, which is consistent with the previous DNAcleavage results. The result shows that the strength of interactionsbetween DNA and the complexes is enhanced by the increase of theplanar area of the N–N ligand. The coordination of Ru(III) towardsthe nucleobases of DNA is obviously not the main cause of the com-petitive binding, because in that case 1 should exert the samequenching effect, so the competitive binding by the complexes ismainly caused by their intercalating or groove binding with DNA.
3.3.3. Thermal denaturization of the DNAIntercalation of small molecules into the double helix is known
to increase the helix melting temperature, the temperature atwhich the double helix denatures into single-strand DNA. Theextinction coefficient of DNA bases at 260 nm in the double-helicalform is much less than that in the single strand form, hence, melt-ing of the helix leads to an increase in the absorption at this wave-length. Thus, the helix to coil transition temperature can bedetermined by monitoring the absorbance of the DNA bases at260 nm as function of temperature [65–68]. The thermal-denatur-
ization profiles of CT-DNA in the absence and presence of com-plexes 1, 2, and 4 are shown in Fig. 9 with the profile of 3 [40]included for comparison purpose (salt concentration: 0.01 M
0.00 0.04 0.08 0.12 0.16
1.0
1.1
1.2
1.3
(η/η
0)1/
3
[Ru]/[D
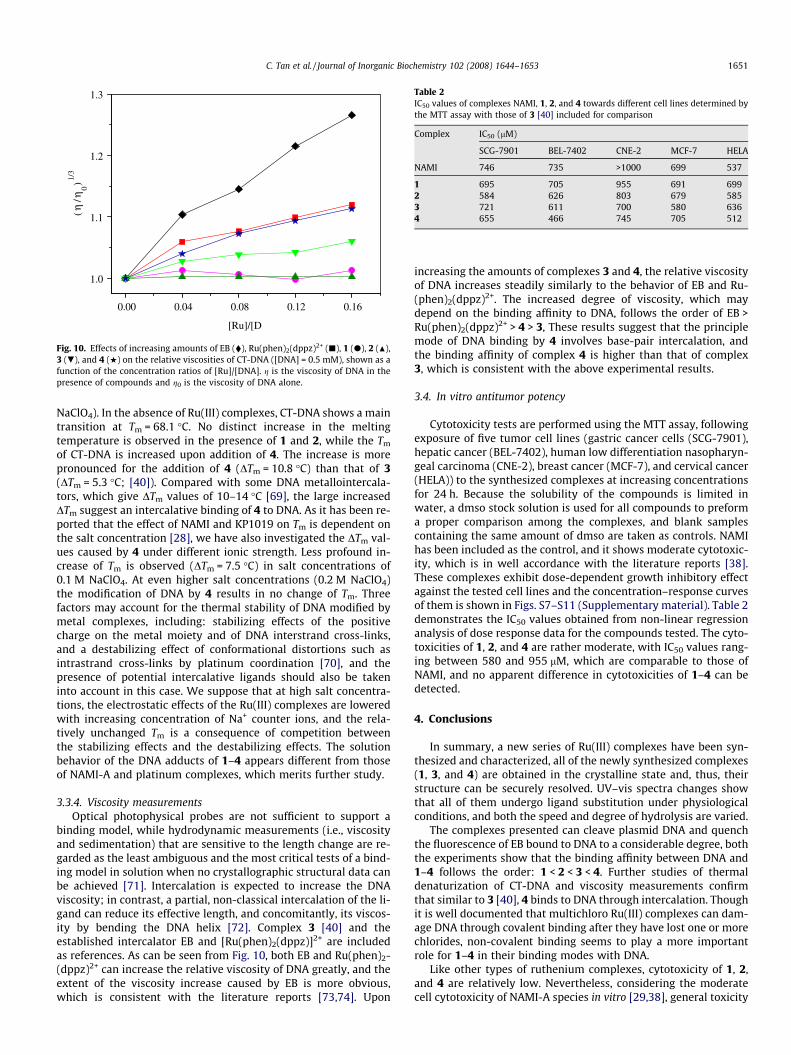
Fig. 10. Effects of increasing amounts of EB (�), Ru(phen)2(dppz)2+ (j), 1 (d), 2 (N),3 (.), and 4 (w) on the relative viscosities of CT-DNA ([DNA] = 0.5 mM), shown as afunction of the concentration ratios of [Ru]/[DNA]. g is the viscosity of DNA in thepresence of compounds and g0 is the viscosity of DNA alone.
Table 2IC50 values of complexes NAMI, 1, 2, and 4 towards different cell lines determined bythe MTT assay with those of 3 [40] included for comparison
Complex IC50 (lM)
SCG-7901 BEL-7402 CNE-2 MCF-7 HELA
NAMI 746 735 >1000 699 537
1 695 705 955 691 6992 584 626 803 679 5853 721 611 700 580 6364 655 466 745 705 512
C. Tan et al. / Journal of Inorganic Biochemistry 102 (2008) 1644–1653 1651
NaClO4). In the absence of Ru(III) complexes, CT-DNA shows a maintransition at Tm = 68.1 �C. No distinct increase in the meltingtemperature is observed in the presence of 1 and 2, while the Tm
of CT-DNA is increased upon addition of 4. The increase is morepronounced for the addition of 4 (DTm = 10.8 �C) than that of 3(DTm = 5.3 �C; [40]). Compared with some DNA metallointercala-tors, which give DTm values of 10–14 �C [69], the large increasedDTm suggest an intercalative binding of 4 to DNA. As it has been re-ported that the effect of NAMI and KP1019 on Tm is dependent onthe salt concentration [28], we have also investigated the DTm val-ues caused by 4 under different ionic strength. Less profound in-crease of Tm is observed (DTm = 7.5 �C) in salt concentrations of0.1 M NaClO4. At even higher salt concentrations (0.2 M NaClO4)the modification of DNA by 4 results in no change of Tm. Threefactors may account for the thermal stability of DNA modified bymetal complexes, including: stabilizing effects of the positivecharge on the metal moiety and of DNA interstrand cross-links,and a destabilizing effect of conformational distortions such asintrastrand cross-links by platinum coordination [70], and thepresence of potential intercalative ligands should also be takeninto account in this case. We suppose that at high salt concentra-tions, the electrostatic effects of the Ru(III) complexes are loweredwith increasing concentration of Na+ counter ions, and the rela-tively unchanged Tm is a consequence of competition betweenthe stabilizing effects and the destabilizing effects. The solutionbehavior of the DNA adducts of 1–4 appears different from thoseof NAMI-A and platinum complexes, which merits further study.
3.3.4. Viscosity measurementsOptical photophysical probes are not sufficient to support a
binding model, while hydrodynamic measurements (i.e., viscosityand sedimentation) that are sensitive to the length change are re-garded as the least ambiguous and the most critical tests of a bind-ing model in solution when no crystallographic structural data canbe achieved [71]. Intercalation is expected to increase the DNAviscosity; in contrast, a partial, non-classical intercalation of the li-gand can reduce its effective length, and concomitantly, its viscos-ity by bending the DNA helix [72]. Complex 3 [40] and theestablished intercalator EB and [Ru(phen)2(dppz)]2+ are includedas references. As can be seen from Fig. 10, both EB and Ru(phen)2-(dppz)2+ can increase the relative viscosity of DNA greatly, and theextent of the viscosity increase caused by EB is more obvious,which is consistent with the literature reports [73,74]. Upon
increasing the amounts of complexes 3 and 4, the relative viscosityof DNA increases steadily similarly to the behavior of EB and Ru-(phen)2(dppz)2+. The increased degree of viscosity, which maydepend on the binding affinity to DNA, follows the order of EB >Ru(phen)2(dppz)2+ > 4 > 3, These results suggest that the principlemode of DNA binding by 4 involves base-pair intercalation, andthe binding affinity of complex 4 is higher than that of complex3, which is consistent with the above experimental results.
3.4. In vitro antitumor potency
Cytotoxicity tests are performed using the MTT assay, followingexposure of five tumor cell lines (gastric cancer cells (SCG-7901),hepatic cancer (BEL-7402), human low differentiation nasopharyn-geal carcinoma (CNE-2), breast cancer (MCF-7), and cervical cancer(HELA)) to the synthesized complexes at increasing concentrationsfor 24 h. Because the solubility of the compounds is limited inwater, a dmso stock solution is used for all compounds to preforma proper comparison among the complexes, and blank samplescontaining the same amount of dmso are taken as controls. NAMIhas been included as the control, and it shows moderate cytotoxic-ity, which is in well accordance with the literature reports [38].These complexes exhibit dose-dependent growth inhibitory effectagainst the tested cell lines and the concentration–response curvesof them is shown in Figs. S7–S11 (Supplementary material). Table 2demonstrates the IC50 values obtained from non-linear regressionanalysis of dose response data for the compounds tested. The cyto-toxicities of 1, 2, and 4 are rather moderate, with IC50 values rang-ing between 580 and 955 lM, which are comparable to those ofNAMI, and no apparent difference in cytotoxicities of 1–4 can bedetected.
4. Conclusions
In summary, a new series of Ru(III) complexes have been syn-thesized and characterized, all of the newly synthesized complexes(1, 3, and 4) are obtained in the crystalline state and, thus, theirstructure can be securely resolved. UV–vis spectra changes showthat all of them undergo ligand substitution under physiologicalconditions, and both the speed and degree of hydrolysis are varied.
The complexes presented can cleave plasmid DNA and quenchthe fluorescence of EB bound to DNA to a considerable degree, boththe experiments show that the binding affinity between DNA and1–4 follows the order: 1 < 2 < 3 < 4. Further studies of thermaldenaturization of CT-DNA and viscosity measurements confirmthat similar to 3 [40], 4 binds to DNA through intercalation. Thoughit is well documented that multichloro Ru(III) complexes can dam-age DNA through covalent binding after they have lost one or morechlorides, non-covalent binding seems to play a more importantrole for 1–4 in their binding modes with DNA.
Like other types of ruthenium complexes, cytotoxicity of 1, 2,and 4 are relatively low. Nevertheless, considering the moderatecell cytotoxicity of NAMI-A species in vitro [29,38], general toxicity
1652 C. Tan et al. / Journal of Inorganic Biochemistry 102 (2008) 1644–1653
are low, but the prospect of clinical applications can not be elimi-nated completely. Comparison of the cytotoxicities of 1–4 showsno apparent differences. The lack of correlation between cellgrowth inhibition, DNA binding affinity, and hydrolysis stabilitysuggests that differences in cellular uptake, subcellular distribu-tion, and additional biological targets may play even more impor-tant roles in their antitumor activity. The in vivo test and proteinbinding studies of these complexes are ongoing in our laboratory.
5. Abbreviations
bpy 2,20-bipyridinephen 1,10-phenantroline 1,10-phenanthrolinedpq dipyrido[3,2-f:20,30-h]quinoxalinedppz dipyrido[3,2-a:20,30-c]phenazinedmso dimethyl sulfoxideEB ethidium bromideNAMI-A [H2im][trans-RuCl4(dmso-S)(Him)] (Him = imidazole)ICR [H2im][trans-RuCl4(Him)2] (Him = imidazole)KP1019 [H2ind][trans-RuCl4(Hind)2] (Hind = indazole)CT-DNA calf thymus DNAazpy 2-phenylazopyrineterpy 2,20:60200-terpyridinecdta 1,2-cyclohexanediminetetraacetateen ethylenediamineMTT 3-(4,5-dimethylthiazol-2-yl)-2,5-diphenyltetrazolium
bromideRPMI Roswell park memorial institute mediumDMEM Dulbecco’s modified Eagle’s mediumEDTA ethylenediaminetetraacetic acid
Acknowledgments
We are grateful to the National Natural Science Foundation ofChina, The Research Fund for the Doctoral Program of Higher Edu-cation, the Natural Science Foundation of Guangdong Province, thePlanned Item of Science and Technology of Guangdong Province,and the Item of Tackle Key Problem of Science and Technology ofGuangzhou City.
Appendix A. Supplementary data
Supplementary data associated with this article can be found, inthe online version, at doi:10.1016/j.jinorgbio.2008.03.005.
References
[1] C.X. Zhang, S.J. Lippard, Curr. Opin. Chem. Biol. 7 (2003) 481–489.[2] G. Momekov, A. Bakalova, M. Karaivanova, Curr. Med. Chem. 9 (2005) 2177–
2191.[3] E. Wong, C.M. Giandomenico, Chem. Rev. 99 (1999) 2451–2466.[4] N.J. Wheate, J.G. Collins, Coord. Chem. Rev. 241 (2003) 133–145.[5] M.J. Clark, F.C. Zhu, D.R. Frasca, Chem. Rev. 99 (1999) 2511–2533.[6] M.J. Clarke, Coord. Chem. Rev. 236 (2003) 209–233.[7] G. Zhao, H. Lin, Curr. Med. Chem. Anticancer Agents 5 (2005) 137–147.[8] I. Kostova, Curr. Med. Chem. 13 (2006) 1085–1107.[9] E. Alessio, G. Balducci, A. Lutman, G. Mestroni, H. Calligaris, W.M. Attia, Inorg.
Chim. Acta 203 (1993) 205–217.[10] E. Alessio, G. Mestroni, A. Bergamo, G. Sava, Curr. Top. Med. Chem. 4 (2004)
1525–1535.[11] A. Galeano, M.R. Berger, B.K. Keppler, Arzneim.-Forsch. 42 (1992) 821–824.[12] H. Depenbrock, S. Schmelcher, R. Peter, B.K. Keppler, G. Weirich, T. Block, J.
Rastetter, A.R. Hanauske, Eur. J. Cancer 33 (1997) 2404–2410.[13] C.G. Hartinger, S. Zorbas-Seifried, M.A. Jakupec, H. Zorbas, B.K. Keppler, J. Inorg.
Biochem. 100 (2006) 891–904.[14] A.H. Velders, H. Kooijman, A.L. Spek, J.G. Haasnoot, D.D. Vos, J. Reedijk, Inorg.
Chem. 39 (2000) 2966–2967.[15] A.C.G. Hotze, M. Bacac, A.H. Velders, B.A.J. Jansen, H. Kooijman, A.L. Spek, J.G.
Haasnoot, J. Reedijk, J. Med. Chem. 46 (2003) 1743–1750.[16] O. Novakova, J. Kasparkova, O. Vrana, P.M. Van Vliet, J. Reedijk, V. Brabec,
Biochemistry 34 (1995) 12369–12378.
[17] R.A. Vilaplana, F. Gonzalez-Vichez, E. Gutierrez-Puebla, C. Ruiz-Valero, Inorg.Chim. Acta 224 (1994) 15–18.
[18] R.E. Morris, R.E. Aird, P.delS. Murdoch, H. Chen, J. Cummings, N.D. Hughes, S.Parsons, A. Parkin, G. Boyd, D.I. Jodrell, P.J. Sadler, J. Med. Chem. 44 (2001)3616–3621.
[19] G. Mestroni, E. Alessio, G. Sava, S. Pacor, M. Coluccia, A. Bocarelli, Metal-BasedDrugs 1 (1993) 41–63.
[20] G. Sava, A. Bergamo, S. Zorzet, B. Gava, C. Casarsa, M. Cocchietto, A. Furlani, V.Scarcia, B. Serli, E. Iengo, E. Alessio, G. Mestroni, Eur. J. Cancer 38 (2002) 427–435.
[21] M. Bouma, B. Nuijen, M.T. Jansen, G. Sava, A. Flaibani, A. Bult, J. Beijnen, Int. J.Pharm. 248 (2002) 239–246.
[22] M. Bacac, A. Hotze, K. Schilden, J. Haasnoot, S. Pacor, E. Alessio, G. Sava, J.Reedijk, J. Inorg. Biochem. 98 (2004) 402–412.
[23] A. Küng, T. Pieper, R. Wissiack, E. Rosenberg, B.K. Keppler, J. Biol. Inorg. Chem. 6(2001) 292–299.
[24] M. Ravera, S. Baracco, C. Cassino, P. Zanello, D. Osella, Dalton Trans. 7 (2004)2347–2351.
[25] M. Brindell, D. Piotrowska, A.A. Shoukry, G. Stochel, R. van Eldik, J. Biol. Inorg.Chem. 12 (2007) 5023–5033.
[26] M.A. Jakupec, E. Reisner, A. Eichinger, M. Pongratz, V.B. Arion, M. Galanski, C.G.Hartinger, B.K. Keppler, J. Med. Chem. 48 (2005) 2831–2837.
[27] E.R. Jamieson, S.J. Lippard, Chem. Rev. 99 (1999) 2467–2498.[28] J. Malina, O. Novakova, B.K. Keppler, E. Alessio, V. Brabec, J. Biol. Inorg. Chem. 6
(2001) 435–445.[29] P.G. Dyson, G. Sava, Dalton Trans. 16 (2006) 1929–1933.[30] A. Bergamo, G. Sava, Dalton Trans. 13 (2007) 1267–1272.[31] Y.K. Yan, M. Melchart, A. Habtemariam, P.J. Sadler, Chem. Commun. 38 (2005)
4764–4776.[32] B.E. Bowler, K.J. Ahmed, W.I. Sundquist, L.S. Hollis, E.E. Whang, S.J. Lippard, J.
Am. Chem. Soc. 111 (1989) 1299–1306.[33] W.I. Sundquist, D.P. Bancroft, S.J. Lippard, J. Am. Chem. Soc. 112 (1990) 1590–
1596.[34] M.V. Keck, S.J. Lippard, J. Am. Chem. Soc. 114 (1992) 3386–3390.[35] N. Farrell, T.T.B. Ha, J.P. Souchard, F.L. Wimmer, S. Cros, N.P. Johnson, J. Med.
Chem. 32 (1989) 2240–2241.[36] U. Bierbach, Y. Qu, T.W. Hambley, J. Peroutka, H.L. Nguyen, M. Doedee, N.
Farrell, Inorg. Chem. 38 (1999) 3535–3542.[37] K.E. Erkkila, D.T. Odom, J.K. Barton, Chem. Rev. 99 (1999) 2777–2796.[38] M. Groessl, E. Reisner, C.G. Hartinger, R. Eichinger, O. Semenova, A.R.
Timerbaev, M.A. Jakupec, V.B. Arion, B.K. Keppler, J. Med. Chem. 50 (2007)2185–2193.
[39] P. Mura, M. Camalli, L. Messori, F. Piccioli, P. Zanello, M. Corsini, Inorg. Chem.43 (2004) 3863–3870.
[40] C.P. Tan, J. Liu, H. Li, W.J. Zheng, S. Shi, L.M. Chen, L.N. Ji, J. Inorg. Biochem. 102(2008) 347–358.
[41] J.E. Dickenson, L.A. Summers, Aust. J. Chem. 23 (1970) 1023–1027.[42] I.P. Evans, A. Spencer, G. Wilkinson, J. Chem. Soc., Dalton Trans. (1973) 204–
209.[43] R.M. Hartshorn, J.K. Barton, J. Am. Chem. Soc. 114 (1992) 5919–5925.[44] R.C. Drift, J.W. Sprengers, E. Bouwman, W.P. Mul, H. Kooijman, A.L. Spek, E.
Drent, Eur. J. Inorg. Chem. (2002) 2147–2155.[45] E. Alessio, G. Balducci, M. Calligaris, G. Costa, W.M. Attia, G. Mestroni, Inorg.
Chem. 30 (1991) 609–618.[46] R.S. Srivastava, F.R. Fronczek, N.R. Tarvera, R.S. Perkins, Polyhedron 26 (2007)
5389–5397.[47] J. Marmur, J. Mol. Biol. 3 (1961) 208–211.[48] M.E. Reichmann, S.A. Rice, C.A. Thomas, P. Doty, J. Am. Chem. Soc. 76 (1954)
3047–3053.[49] G.M. Sheldrick, in: SADABS, Program for Empirical Absorption Correction of
Area Detector Data, University of G}ottingen, Germany, 1996.[50] G.M. Sheldrick, in: SHELXL-97, Program for Crystal Structure Refinement,
University of G}ottingen, Germany, 1997.[51] J.B. Chaires, N. Dattagupta, D.M. Crothers, Biochemistry 21 (1982) 3933–3940.[52] G. Cohen, H. Eisenberg, Biopolymers 8 (1969) 45–55.[53] M.B. Cingi, M. Lanfranchi, M.A. Pellinghelli, M. Tegoni, Eur. J. Inorg. Chem.
(2000) 703–711.[54] H.B. Gray, Inorg. Chem. 38 (1999) 2–3.[55] M. Calligaris, O. Carugo, Coord. Chem. Rev. 153 (1996) 83–154.[56] J.G. Liu, Q.L. Zhang, X.F. Shi, L.N. Ji, Inorg. Chem. 40 (2001) 5045–5050.[57] C.M. Duff, G.A. Heath, Inorg. Chem. 30 (1991) 2528–2535.[58] C.M. Duff, G.A. Heath, J. Chem. Soc., Dalton Trans. 9 (1991) 2401–2411.[59] C. Sissi, F. Mancin, M. Gatos, M. Palumbo, P. Tecilla, U. Tonellato, Inorg. Chem.
44 (2005) 2310–2317.[60] E.L. Hegg, K.A. Deal, L.L. Kiessling, J.N. Buestyn, Inorg. Chem. 36 (1997) 1715–
1718.[61] M.E. Oehlsen, Y. Qu, N. Farrell, Inorg. Chem. 42 (2003) 5498–5506.[62] A.M.J. Fichtinger-Schepman, J.L. van der Veer, J.H.J. den Hartog, P.H.M. Lohman,
J. Reedijk, Biochemistry 24 (1985) 707–713.[63] J.B. LePecq, C. Paoletti, J. Mol. Biol. 27 (1967) 87–106.[64] D.L. Boger, B.E. Fink, S.R. Brunette, W.C. Tse, M.P. Hedrick, J. Am. Chem. Soc. 123
(2001) 5878–5891.[65] M. Cory, D.D. Mckee, J. Kagan, D.W. Henry, J.A. Miller, J. Am. Chem. Soc. 107
(1985) 2528–2536.[66] P.U. Maheswari, M. Palaniandavar, J. Inorg. Biochem. 98 (2004) 219–230.[67] C.M. Dupureur, J.K. Barton, Inorg. Chem. 36 (1997) 33–43.[68] C.V. Kumar, E.H. Asuncion, J. Am. Chem. Soc. 115 (1993) 8547–8553.

C. Tan et al. / Journal of Inorganic Biochemistry 102 (2008) 1644–1653 1653
[69] G.A. Neyhart, N. Grover, S.R. Smith, W.A. Kalsbeck, T.A. Fairley, M. Cory, H.H.Thorp, J. Am. Chem. Soc. 115 (1993) 4423–4428.
[70] R. Zaludova, V. Kleinwachter, V. Brabec, Biophys. Chem. 60 (1996) 135–142.[71] X.H. Zou, B.H. Ye, H. Li, Q.L. Zhang, H. Chao, J.G. Liu, L.N. Ji, X.Y. Li, J. Biol. Inorg.
Chem. 6 (2001) 143–150.
[72] S. Satyanarayana, J.C. Dabrowiak, J.B. Chaires, Biochemistry 31 (1992) 9319–9324.
[73] I. Haq, P. Lincoln, D. Suh, B. Norden, B.Z. Chowdhry, J.B. Chaires, J. Am. Chem.Soc. 117 (1995) 4788–4796.
[74] P.P. Pellegrini, J.R. Aldrich-Wright, Dalton Trans. 3 (2003) 176–183.
Top Related
Copyright © 2022 FDOKUMEN

