


Bahasa
Halaman
Hukum


Sustainable Construction
A Life Cycle Approach in Engineering
Proceedings
International Symposium
Malta, 23 - 25 July 2010
COST Action C25
Sustainability of Constructions
Integrated Approach to Life-time Structural Engineering

Sustainable Construction
A Life Cycle Approach in Engineering
Proceedings
International Symposium
Malta, 23 - 25 July 2010
Editors
Luís Bragança, Heli Koukkari, Milan Veljkovic, Ruben Paul Borg
COST Action C25
Sustainability of Constructions
Integrated Approach to Life-time Structural Engineering
Department of Building & Civil Engineering
Faculty for the Built Environment
University of Malta
COST is supported by the EU RTD Framework programme. ESF provides the COST Office through an EC contract.
COST- the acronym for European COoperation in the field of Scientific and Technical Research- is the oldest
and widest European intergovernmental network for cooperation in research. Established by the Ministerial
Conference in November 1971, COST is presently used by the scientific communities of 35 European countries
to cooperate in common research projects supported by national funds.
The funds provided by COST - less than 1% of the total value of the projects - support the COST cooperation
networks (COST Actions) through which, with only around €20 million per year, more than 30.000 European
scientists are involved in research having a total value which exceeds €2 billion per year. This is the financial
worth of the European added value which COST achieves.
A “bottom up approach” (the initiative of launching a COST Action comes from the European scientists
themselves), “à la carte participation” (only countries interested in the Action participate), “equality of access”
(participation is open also to the scientific communities of countries not belonging to the European Union) and
“flexible structure” (easy implementation and light management of the research initiatives ) are the main
characteristics of COST.
As precursor of advanced multidisciplinary research COST has a very important role for the realisation of the
European Research Area (ERA) anticipating and complementing the activities of the Framework Programmes,
constituting a “bridge” towards the scientific communities of emerging countries, increasing the mobility of
researchers across Europe and fostering the establishment of “Networks of Excellence” in many key scientific
domains such as: Biomedicine and Molecular Biosciences; Food and Agriculture; Forests, their Products and
Services; Materials, Physics and Nanosciences; Chemistry and Molecular Sciences and Technologies; Earth
System Science and Environmental Management; Information and Communication Technologies; Transport and
Urban Development; Individuals, Society, Culture and Health. It covers basic and more applied research and
also addresses issues of pre-normative nature or of societal importance.
Sustainable Construction: A Life Cycle Approach in Engineering
Proceedings - International Symposium
Malta, 23 - 25 July 2010
COST Action C25
Sustainability of Constructions: Integrated Approach to life-time Structural Engineering
The production of this publication was supported by COST: www.cost.esf.org
Editors: Luís Bragança, Heli Koukkari, Milan Veljkovic, Ruben Paul Borg
Cover Design: Ruben Paul Borg (Il-ħasira, The reed screen)
© 2010 The Authors and The Editors
All rights reserved. No part of this publication may be reproduced, stored in a retrieval system, or transmitted, in
any form or by any means, without prior written permission from the publisher.
The Editors, the Authors and the Publisher are not responsible for the use which might be made of the
information contained in this publication.
Publisher: Faculty for the Built Environment, University of Malta.
Printed in Malta by Gutenberg Press, 2010
July 2010
ISBN 9 7 8 9 9 3 2 0 9 1 7 1 9
The content of each paper is the responsibility of the respective author/s.
The papers published in this book, have been reviewed by the Scientific & Editorial Committee. The
papers were presented during the International Symposium, held in Malta, from the 2 25th July
2010.
3 rd
to
v
COST Action C25
Sustainability of Constructions
Integrated Approach to life-time Structural Engineering
International Symposium Malta 2010
The Editors:
Ruben Paul Borg University of Malta, Malta
Milan Veljkovic Luleå University of Technology, Sweden
Heli Koukkari VTT Technical Research Centre of Finland, Finland
Luís Bragança University of Minho, Portugal

vi
vii
The COST Action C25 "Sustainability of Constructions - Integrated Approach to Life-time
Structural Engineering" is a network of scientists and researchers from 28 European countries
and the EU Joint Research Centre in Ispra. It was established to promote science-based
developments in sustainable construction in Europe through research on life-time structural
engineering. The Action is in its fourth year of activity.
The Action concentrates on R&D issues that are fundamental for sustainable construction
processes and technologies. These include methods to assess environmental, social and
economic impacts of construction activities; methods to analyse eco-efficiency of materials,
components, buildings and infrastructures; methods to integrate research approaches from
various disciplines; and methods of structural design that incorporate holistic understanding of
safety, eco-efficiency and sustainability.
The Action has organised three major events, an event every year, where the findings of joint
efforts of the Members have been discussed and published:
1st Workshop in Lisbon, Portugal, on 13, 14 and 15 September 2007;
the Midterm Seminar in Dresden, Germany, on 6-7 October 2008;
International Workshop in Timisoara, Romania, on 23-24 October 2009.
Some of the Action results were already applied through the dissemination of the life-time
engineering approach to the sustainability issues in tasks carried out by C25 members.
However, a short investigation of university syllabuses, completed by an add-hoc C25 group on
educational issues, has shown clearly the need for a new approach in teaching structural
engineers on sustainability issues. One of the important aspects in filling this gap is the training
of young research students. So far, two very successful Training Schools were organised:
The first Training School was “The LCA Training School” and was organised for 16
participants in Eindhoven, Netherlands, on 13-15 February 2008. The participants were
mainly Early Stage Researchers from C25 who could learn and deepen their knowledge
on the use of Life Cycle Analysis theories and tools;
The second Training School “Sustainability in structures and structural interventions:
Improving the contemporary and historical urban habitat constructions within a
sustainability and risk assessment framework” was held in Thessaloniki, Greece, on 17-
24 May 2009. It was jointly organised by C25 and C26 and the number of Early Stage
Researchers was 40, from these two Actions.
The third C25 Training School, organised under the theme “Sustainable Construction: A Life
Cycle Approach in Structural Engineering”, aims at providing C25 and non-C25 Early Stage
Researchers and PhD students with theories, tools and assignments to address sustainability in
engineering and the life-cycle approach in structural engineering.
This Training School is hosted by the Department of Building and Civil Engineering, Faculty
for the Built Environment of the University of Malta and offers excellent opportunities for
collaboration among the researchers.
Foreword
viii
The whole event consists of two complementary activities:
The International Early Stage Researchers Symposium, from the 23
rd of July till the 25
th
of July 2010;
The International Training School, from the 26th of July till the 1
st of August 2010.
The programme and the scientific content of the Malta Training School were prepared with the
support of an international group of experts and were approved by the Management Committee
of the COST Action C25. The group of experienced lecturers were selected to teach and
supervise the group work during the school.
The aim of the International Early Stage Researchers Symposium is to give the opportunity to the participants to present their own work and to get an overview of the research work that is being done by the other researchers all around Europe. The Symposium will be also an important forum for the discussion of new ideas in the field of Sustainable Construction and will bring together all those who are interested in collaborating on common projects. These Proceedings cover a wide range of up-to-date issues that reflect the research areas of the participating Early Stage Researchers in the Sustainable Construction field. The issues presented include:
Sustainable Building: design guidelines and assessment tools; Eco-efficiency: eco-efficient use of natural resources in construction and processes; Life-time Structural Engineering: life-cycle performance, design for durability,
maintenance and deconstruction.
This publication represents one more exciting milestone in the fulfilment of the main aims of the COST Action C25. The organisers of the Training School hope that this initiative will promote further the sustainability of construction industry and of the built environment.
The Organisers would like to warmly thank all the participants who have contributed with their
time, efforts, commitment and dedication to COST Action C25 and who made it possible to turn
the Malta Training School into another outstanding event in the field of Sustainable
Construction. The contribution of the Core Group of the C25 Management Committee in the
preparation for the Training School is gratefully acknowledged:
Luís Bragança & Heli Koukkari (COST Action C25 Chair & Vice-chair)
Rijk Blok & Helena Gervásio (WG1 Chair & Vice-chair)
Milan Veljkovic & Zbigniew Plewako (WG2 Chair & Vice-chair)
Raffaele Landolfo & Viorel Ungureanu (WG3 Chair & Vice-chair)
A special gratitude is also addressed to Dr. Thierry Goger and Ms. Carmencita Malimban from
COST Office for their help in administrative matters and COST financial support.
The Chair of the Organising Committee,
Ruben Paul Borg
The Editorial Board,
Ruben Paul Borg (University of Malta, Malta)
Milan Veljkovic (Luleå University of Technology, Sweden)
Heli Koukkari (VTT Technical Research Centre of Finland, Finland)
Luís Bragança (University of Minho, Portugal)
ix
Contents
Sustainability of Constructions:
Integrated Approach to Life-time Structural Engineering 1
Bragança L., Koukkari H., Blok R., Gervásio H., Veljkovic
M., Plewako Z., Landolfo R., Ungureanu V.
Chapter 1 15
Sustainable Construction
The Role of Environmental Assessment of Buildings 17
Haapio A.
Building Sustainability Assessment: System SBToolPT 25
Mateus R., Bragança L.
Green Building Design Guideline 33
Kahraman İ.
Chapter 2 41
Eco-efficiency
Structural, economic and environmental performance 43
of fibre reinforced wood profiles vs. Solutions made of steel and concrete
Manthey C. & Guenther E., Heiduschke A. & Haller P.,
Heistermann T. & Veljkovic M., Hájek P.
Comparative Life-Cycle Impact Assessment of Short RC Coloumns 59
and Composite Columns
Lukic I.
Life Cycle Inventory of Stainless Steel: 67
A Review of Challenges, Methods and Applications
Rossi B.
The potential use of Waste Tyre Fibres in Concrete. 77
Borg R.P., Farrugia C.
Sustainable Planning of Renewal of Buildings in Public Ownership 91
Kusar M., Selih J.
Perceptions of Sustainable Housing Design: Current Strategies for Zero Carbon 97
McCullough J.E.
Sustainable design in the neighbourhood scale: 105
Analysis of planning issues and case studies.
Tsirigoti D.
x
Energy Saving in Lithuanian Building Sector 115
NorvaišieneR.
Examination of Photovoltaic (PV) Component Use in Architecture 121
from the Viewpoint of Energy Efficiency
Altin M.
An acoustical and visual evaluation approach 129
for the proscenium type of drama theatres.
Yilmaz Karaman O.
Chapter 3 139
Life-time Structural Engineering
Structural Flexibility: Inventory and Qualification of Parameters 141
Koopman E.F., Blok R.., Moonen S.P.G.
A Literature Review of Life Cycle Assessment for Bridge Infrastructure 147
Du G.L.
Inflation Adjusted LCCA of a Comparative Study of an Integral Abutment Bridge 151
and a Concrete Bridge with Expansion Joints
Iqbal N., Gervasio H., Eriksen J., Veljkovic M., Simoes da SilvaL.
Embodied energy in the „Flexiarch‟ relative to other types of short span bridges. 163
Cregg D., Long A. & Magee B.
Refurbishment of Multi-dwelling Building Based on the LCC Principles 171
Mirtič M.
Multi-criteria Decision Making Methods in Refurbishment, Deconstruction 177
and Demolition of Existing Structures
Portioli F., Cascini L. Ungureanu V.
The Use of Timber Tenon Joints with Pegs: Sustainable Solution for 185
Improving Deconstruction
Marmo R.
Sustainable Conservation of Heritage at Risk: 193
Strategies for Proactive Preservation and Maintenance
Robinson L.

1 INTRODUCTION TO COST ACTION C25 – SUSTAINABILITY OF CONSTRUCTIONS
1.1 Aims and objectives
The Action C25 aims to promote a scientific understanding of life-time engineering and to boost science-based advancement of sustainable construction in Europe.
The Action is focused on an integrated approach to deal with the end-products of construc-tion, clearly targeted at the development of R&D and engineering methods from structural points of view. It aims at providing the construction sector with a new framework and ideas based on the integration of approaches and results of ongoing research and development pro-jects.
The Action establish a broad network of European universities and other research centres in the field of structural engineering in order to transfer the state-of-the-art of technologies, design methods and practices through the existing and new links of members of the Action in several international organisations.
The Action involves collaborative analysis of results concerning design and assessment methods and tools, advanced materials and technologies as well as construction processes, both for new constructions and the rehabilitation of the existing ones.
1.2 Background
The urban and natural environments are inseparably linked. Energy, materials, water and land are all consumed in the construction and operation of buildings and infrastructure to such an ex-tent that sustainable development can be said to decisively depend on the built environment. The urban environment itself influences our living conditions, social well-being and health. The European Commission has adopted a thematic strategy on the urban environment; one of the four priority themes is sustainable construction. All themes are cross-cutting in nature and have strong links with many environmental issues.
Environmental, socio-economic and cultural issues in the construction sector are character-ised by their complexity, the diversity of actors concerned and the need for innovative and mul-tidisciplinary solutions. As the largest and most fragmented industry, the sector faces huge chal-
Sustainability of Constructions Integrated Approach to Life-time Structural Engineering
Luís Bragança1 & Heli Koukkari
2 (COST Action C25 Chair & Vice-chair)
1 University of Minho, Guimarães, Portugal. [email protected]
2 VTT Technical Research Centre of Finland, Espoo, Finland. [email protected]
Rijk Blok3 & Helena Gervásio
4 (WG1 Chair & Vice-chair)
3 University of Technology Eindhoven, Netherlands [email protected]
4 GIPAC, Lda., Portugal. [email protected]
Milan Veljkovic5 & Zbigniew Plewako
6 (WG2 Chair & Vice-chair)
5 Luleå University of Technology, Sweden. [email protected]
6 Rzeszów University of Technology, Poland. [email protected]
Raffaele Landolfo7 & Viorel Ungureanu
8 (WG3 Chair & Vice-chair)
7 University of Naples “Federico II”, Italy. [email protected]
8 “Politehnica” University of Timisoara, Romania. [email protected]
ABSTRACT: The main objective of the COST Action C25 “Sustainability of Constructions: Integrated Approach to Life-time Structural Engineering” is to promote science-based devel-opments in sustainable construction in Europe through the collection and collaborative analysis of scientific results concerning life-time structural engineering and especially integration of en-vironmental assessment methods and tools of structural engineering.
1
lenges in the pursuit of sustainability. Enhanced sustainability can be met only through innovations in technologies. Technological
progress is both a global super-trend and a super-force that promotes economic growth, im-provement of health and the increase of mobility but also the decline of the environment. Sci-ence-based development is essential for transforming the potential of the enabling technologies into practice. The information and communication technology, biotechnology and advanced in-dustrial materials represent an opportunity to move towards more sustainable construction processes and products.
Innovations in construction to cope with sustainability demands require knowledge on tech-nology foresight and industrial product development methods, and also tools to assess and manage the evolution. Fundamental changes in construction technologies and design practices concern the whole sector and various stakeholders. The role of universities and other research organisations is crucial in establishing excellence in sustainable construction. Structural engi-neering is beginning to develop an integrated design approach in which advanced tools are used to analyse and verify the various performance aspects and sustainability demands. Performance characteristics and the structural quality of buildings are of fundamental importance to urban sustainability as well as to environmental sustainability.
1.3 State-of-the-art
The first steps on developing a method for assessing a product's environmental impacts were taken in the late 1960s. The first methods to assess environmental impacts of a product consid-ering a life-cycle approach were undertaken in the beginning of the 1970s; however practical applications did not begin until the 1990s.
The need for standardisation in environmental reporting became clear by the end of the 1980s, when environmental reports on similar products often contained conflicting results be-cause they were based on different methods, data and terminology. This resulted in the first in-ternational formulation of a Code of Practice for Life-cycle Assessment (LCA), under the um-brella of the Society of Environmental Toxicology and Chemistry (SETAC). Starting in 1990, SETAC took the lead in LCA development.
Since 1993, the International Standards Organization (ISO) is also working to establish a uni-form framework, uniform methods and procedures, and a uniform terminology for LCA. These efforts produced a series of international standards for environmental performance analysis and management – the ISO standards series 14040.
In 1995, the International Council for Research and Innovation in Building and Construction (CIB) decided to make sustainable construction the focal point of the three-year period up to the 1998 World Building Congress. In 1999 the Agenda 21 on Sustainable Construction was published (Report Publication 237) in order to create a consensus-based framework and to give a detailed overview of the concepts, issues and challenges of sustainable development and sus-tainable construction, and posed certain challenges to the construction industry.
Researchers and practitioners together have been developing environmental assessment and classification systems for buildings in some European countries (Finland, France, Germany, Norway, Sweden and the United Kingdom,). These tools provide a wide coverage of environ-mental, economic and building performance issues that are deemed to be relevant to sustain-ability. In the USA, the Green Building Council developed the tool “Leadership in Energy and Environmental Design (LEED™) Green Building Rating System” which is a first step towards the certification of “green buildings”.
In Europe, the United Nations Environmental Programme is promoting the implementation of life-cycle management tools in its programmes in order to provide the world community with improved access to meaningful environmental data and information, and to increase the capac-ity of governments to use environmental information for decision making and action planning for sustainable human development.
Today, knowledge of how to carry out a life-cycle analysis is improving rapidly. The value of the technique is being increasingly recognised and it is now being used for strategic decision making and for designing environmental policies.
Recently, new models for integrated life-cycle design have been developed and proposed with the aim of combining all the different aspects of sustainability in the same analysis.
2
1.4 Raising the level of Sustainable Construction
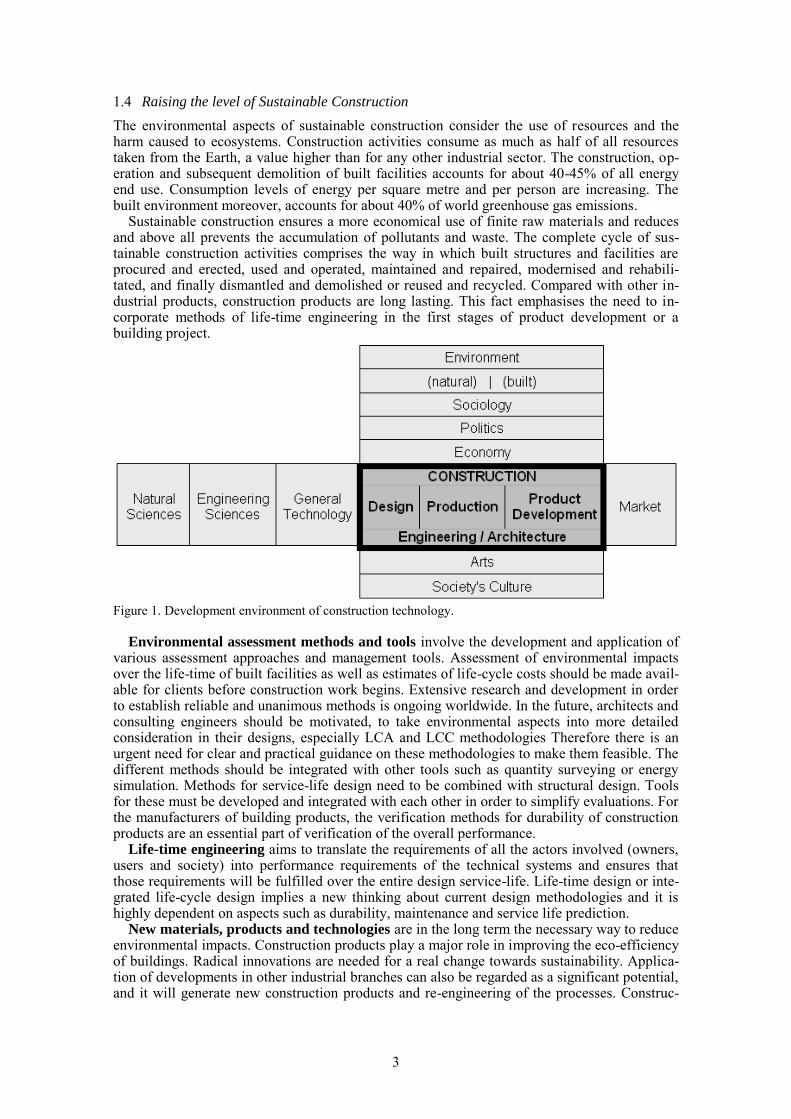
The environmental aspects of sustainable construction consider the use of resources and the harm caused to ecosystems. Construction activities consume as much as half of all resources taken from the Earth, a value higher than for any other industrial sector. The construction, op-eration and subsequent demolition of built facilities accounts for about 40-45% of all energy end use. Consumption levels of energy per square metre and per person are increasing. The built environment moreover, accounts for about 40% of world greenhouse gas emissions.
Sustainable construction ensures a more economical use of finite raw materials and reduces and above all prevents the accumulation of pollutants and waste. The complete cycle of sus-tainable construction activities comprises the way in which built structures and facilities are procured and erected, used and operated, maintained and repaired, modernised and rehabili-tated, and finally dismantled and demolished or reused and recycled. Compared with other in-dustrial products, construction products are long lasting. This fact emphasises the need to in-corporate methods of life-time engineering in the first stages of product development or a building project.
Figure 1. Development environment of construction technology.
Environmental assessment methods and tools involve the development and application of
various assessment approaches and management tools. Assessment of environmental impacts over the life-time of built facilities as well as estimates of life-cycle costs should be made avail-able for clients before construction work begins. Extensive research and development in order to establish reliable and unanimous methods is ongoing worldwide. In the future, architects and consulting engineers should be motivated, to take environmental aspects into more detailed consideration in their designs, especially LCA and LCC methodologies Therefore there is an urgent need for clear and practical guidance on these methodologies to make them feasible. The different methods should be integrated with other tools such as quantity surveying or energy simulation. Methods for service-life design need to be combined with structural design. Tools for these must be developed and integrated with each other in order to simplify evaluations. For the manufacturers of building products, the verification methods for durability of construction products are an essential part of verification of the overall performance.
Life-time engineering aims to translate the requirements of all the actors involved (owners, users and society) into performance requirements of the technical systems and ensures that those requirements will be fulfilled over the entire design service-life. Life-time design or inte-grated life-cycle design implies a new thinking about current design methodologies and it is highly dependent on aspects such as durability, maintenance and service life prediction.
New materials, products and technologies are in the long term the necessary way to reduce environmental impacts. Construction products play a major role in improving the eco-efficiency of buildings. Radical innovations are needed for a real change towards sustainability. Applica-tion of developments in other industrial branches can also be regarded as a significant potential, and it will generate new construction products and re-engineering of the processes. Construc-
3
tion products need to be viewed in terms of functional units, how they perform throughout the life-time of a built facility and what happens to them when deconstruction or demolition takes place. Focusing on integrated and holistic research is necessary as the associated problems are interrelated and wide. Further, a single building may consist of tens of basic materials and thou-sands of separate products. The challenge is how to measure and manage the impact of con-struction products. Generic performance-based design and product development technologies offer tools for management of research and development work.
Reuse and recycling of materials and components achieve a rate of over 80% in some OECD countries, but it should be noted that much of the material is used in a low value-added form. Increasing the use of recycled waste as building materials is one of the steps to positively address the environmental impacts.
Environmental management of a construction project for a new building or for a renova-tion project incorporates an integrated and performance-based approach for management of the overall functional properties of a facility. There is a need to develop methods to integrate envi-ronmental and fiscal analyses that take into account the different phases of the life-cycle.
Energy-efficiency in buildings is the most environmentally benign way to improve eco-efficiency of construction. From the viewpoint of EU policy, it is one of the three key issues identified as an area of necessary action. The influence of the EU Energy Performance of Buildings Directive (EPBD) is expected to grow more and more. Technical systems and enve-lopes of the existing building stock are especially critical. From a product-related point of view the actions include designing and selling more energy-efficient products that use fewer or new or different materials with an equivalent or superior performance. Improvement of energy effi-ciency also brings several benefits for urban sustainability.
1.5 Relationship with other COST Actions
The impetus for this COST Action resulted from the work within COST C12 “Improvement of Buildings’ Structural Quality by New Technologies”, where the need to create a specific Action on sustainability of constructions emerged. The Action C25 has also some complementary ob-jectives to the COST Action C16 “Improving the Quality of Existing Urban Building Enve-lopes”. The relevant results achieved in C16 are taken into consideration as a base of knowl-edge and, to some extent, have been further developed within C25.
Additionally, there are also a few complementary objectives with the COST Actions C23 “Strategies for a Low Carbon Urban Built Environment” and C24 “COSTeXergy”. The main objectives of these two Actions are focused on the direct or indirect energy impacts of infra-structure developments on energy issues.
This Sustainability of Constructions Action does not focus its research work on energy is-sues. However, the integrated approach to life-time structural engineering needs to take into ac-count energy-related issues such as building energy performance and building energy saving as well as the thermal comfort in buildings. In order to avoid overlapping activities and to coordi-nate the cooperation of complementary activities with C23 and C24 Actions, close contacts with COST Actions C23 and C24 have been established, particularly regarding the coordination of complementary activities, avoiding overlaps and fostering synergies.
Sustainability of Constructions has a broad scope, that can be divided into two main dimen-sions: Structural Life-time (where the main focus is on the construction itself, taking into ac-count, in an integrated way, the environmental, economic and social life-cycle impacts of the structure), and Energy Efficiency of the Construction (where the energy consumption due to occupancy by people is the main focus), as illustrated in Figure 2.
This Action is focused on an integrated approach to deal with the end-products of construc-tion, clearly targeted at development of methods and practices of life-time engineering from a structural engineering point of view. It aims to provide the construction sector with a new framework and ideas based on the integration of approaches and results from a diversity of on-going research and development projects. It also aims at improved interaction between different disciplines such as the development of assessment methods and energy-efficiency of technical service systems.
4
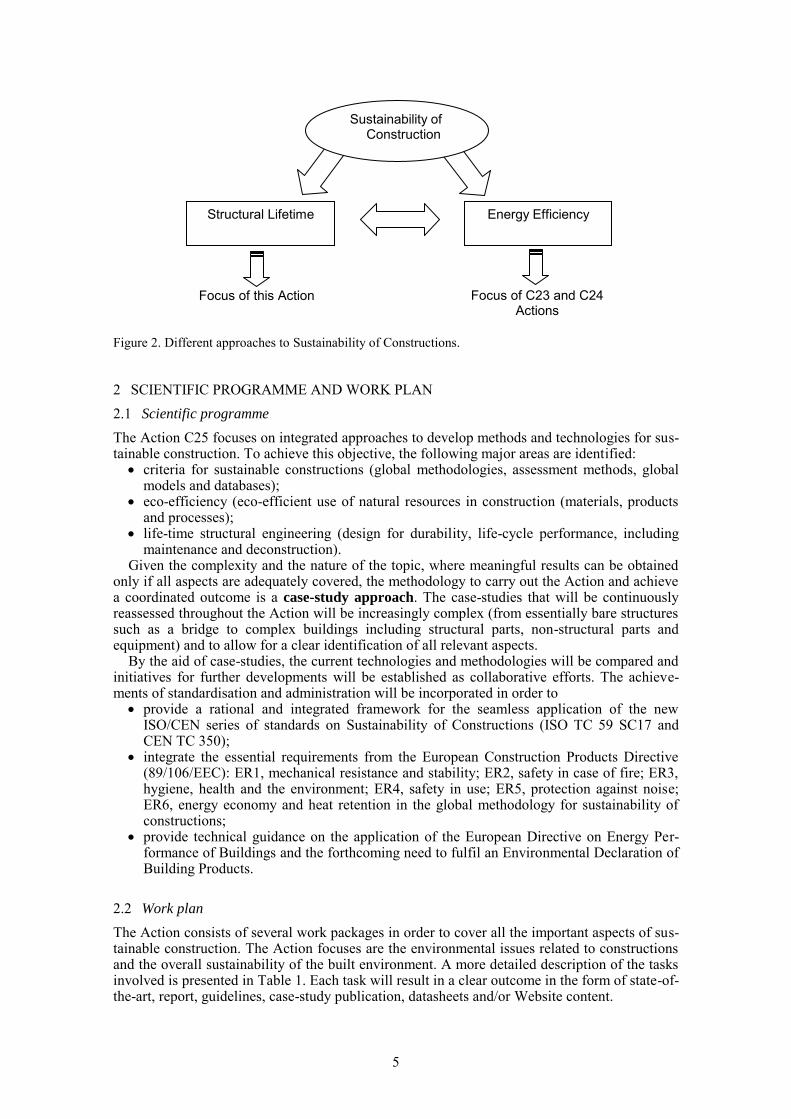
Figure 2. Different approaches to Sustainability of Constructions.
2 SCIENTIFIC PROGRAMME AND WORK PLAN
2.1 Scientific programme
The Action C25 focuses on integrated approaches to develop methods and technologies for sus-tainable construction. To achieve this objective, the following major areas are identified:
criteria for sustainable constructions (global methodologies, assessment methods, global models and databases);
eco-efficiency (eco-efficient use of natural resources in construction (materials, products and processes);
life-time structural engineering (design for durability, life-cycle performance, including maintenance and deconstruction).
Given the complexity and the nature of the topic, where meaningful results can be obtained only if all aspects are adequately covered, the methodology to carry out the Action and achieve a coordinated outcome is a case-study approach. The case-studies that will be continuously reassessed throughout the Action will be increasingly complex (from essentially bare structures such as a bridge to complex buildings including structural parts, non-structural parts and equipment) and to allow for a clear identification of all relevant aspects.
By the aid of case-studies, the current technologies and methodologies will be compared and initiatives for further developments will be established as collaborative efforts. The achieve-ments of standardisation and administration will be incorporated in order to
provide a rational and integrated framework for the seamless application of the new ISO/CEN series of standards on Sustainability of Constructions (ISO TC 59 SC17 and CEN TC 350);
integrate the essential requirements from the European Construction Products Directive (89/106/EEC): ER1, mechanical resistance and stability; ER2, safety in case of fire; ER3, hygiene, health and the environment; ER4, safety in use; ER5, protection against noise; ER6, energy economy and heat retention in the global methodology for sustainability of constructions;
provide technical guidance on the application of the European Directive on Energy Per-formance of Buildings and the forthcoming need to fulfil an Environmental Declaration of Building Products.
2.2 Work plan
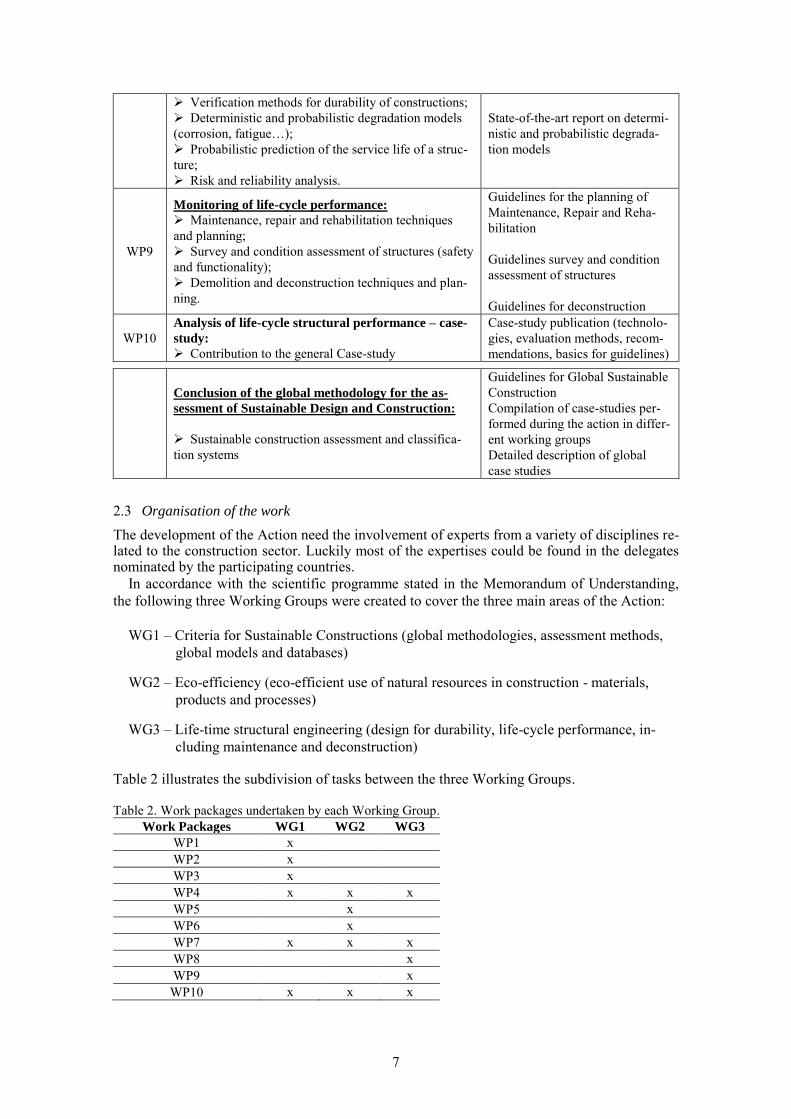
The Action consists of several work packages in order to cover all the important aspects of sus-tainable construction. The Action focuses are the environmental issues related to constructions and the overall sustainability of the built environment. A more detailed description of the tasks involved is presented in Table 1. Each task will result in a clear outcome in the form of state-of-the-art, report, guidelines, case-study publication, datasheets and/or Website content.
Structural Lifetime Energy Efficiency
Sustainability of Construction
Focus of this Action Focus of C23 and C24 Actions
5
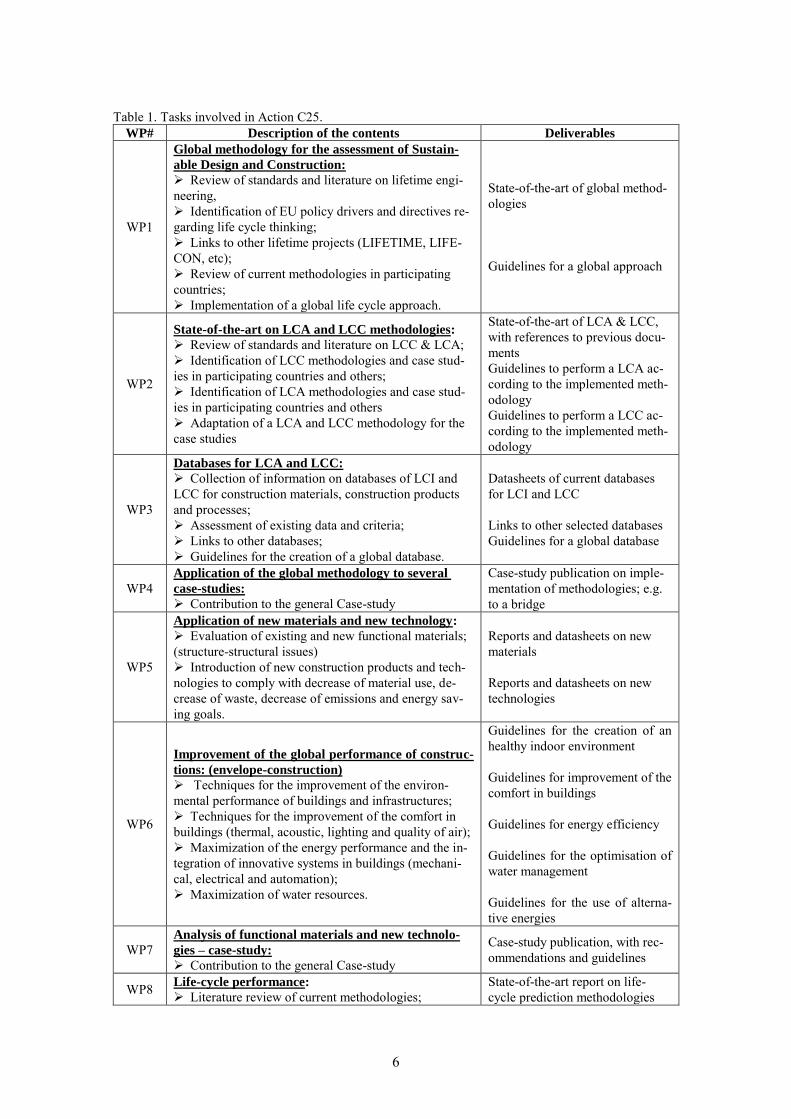
Table 1. Tasks involved in Action C25.
WP# Description of the contents Deliverables
WP1
Global methodology for the assessment of Sustain-
able Design and Construction:
Review of standards and literature on lifetime engi-
neering,
Identification of EU policy drivers and directives re-
garding life cycle thinking;
Links to other lifetime projects (LIFETIME, LIFE-
CON, etc);
Review of current methodologies in participating
countries;
Implementation of a global life cycle approach.
State-of-the-art of global method-
ologies
Guidelines for a global approach
WP2
State-of-the-art on LCA and LCC methodologies:
Review of standards and literature on LCC & LCA;
Identification of LCC methodologies and case stud-
ies in participating countries and others;
Identification of LCA methodologies and case stud-
ies in participating countries and others
Adaptation of a LCA and LCC methodology for the
case studies
State-of-the-art of LCA & LCC,
with references to previous docu-
ments
Guidelines to perform a LCA ac-
cording to the implemented meth-
odology
Guidelines to perform a LCC ac-
cording to the implemented meth-
odology
WP3
Databases for LCA and LCC:
Collection of information on databases of LCI and
LCC for construction materials, construction products
and processes;
Assessment of existing data and criteria;
Links to other databases;
Guidelines for the creation of a global database.
Datasheets of current databases
for LCI and LCC
Links to other selected databases
Guidelines for a global database
WP4
Application of the global methodology to several
case-studies:
Contribution to the general Case-study
Case-study publication on imple-
mentation of methodologies; e.g.
to a bridge
WP5
Application of new materials and new technology:
Evaluation of existing and new functional materials;
(structure-structural issues)
Introduction of new construction products and tech-
nologies to comply with decrease of material use, de-
crease of waste, decrease of emissions and energy sav-
ing goals.
Reports and datasheets on new
materials
Reports and datasheets on new
technologies
WP6
Improvement of the global performance of construc-
tions: (envelope-construction)
Techniques for the improvement of the environ-
mental performance of buildings and infrastructures;
Techniques for the improvement of the comfort in
buildings (thermal, acoustic, lighting and quality of air);
Maximization of the energy performance and the in-
tegration of innovative systems in buildings (mechani-
cal, electrical and automation);
Maximization of water resources.
Guidelines for the creation of an
healthy indoor environment
Guidelines for improvement of the
comfort in buildings
Guidelines for energy efficiency
Guidelines for the optimisation of
water management
Guidelines for the use of alterna-
tive energies
WP7
Analysis of functional materials and new technolo-
gies – case-study:
Contribution to the general Case-study
Case-study publication, with rec-
ommendations and guidelines
WP8 Life-cycle performance:
Literature review of current methodologies;
State-of-the-art report on life-
cycle prediction methodologies
6
Verification methods for durability of constructions;
Deterministic and probabilistic degradation models
(corrosion, fatigue…);
Probabilistic prediction of the service life of a struc-
ture;
Risk and reliability analysis.
State-of-the-art report on determi-
nistic and probabilistic degrada-
tion models
WP9
Monitoring of life-cycle performance:
Maintenance, repair and rehabilitation techniques
and planning;
Survey and condition assessment of structures (safety
and functionality);
Demolition and deconstruction techniques and plan-
ning.
Guidelines for the planning of
Maintenance, Repair and Reha-
bilitation
Guidelines survey and condition
assessment of structures
Guidelines for deconstruction
WP10
Analysis of life-cycle structural performance – case-
study:
Contribution to the general Case-study
Case-study publication (technolo-
gies, evaluation methods, recom-
mendations, basics for guidelines)
Conclusion of the global methodology for the as-
sessment of Sustainable Design and Construction:
Sustainable construction assessment and classifica-
tion systems
Guidelines for Global Sustainable
Construction
Compilation of case-studies per-
formed during the action in differ-
ent working groups
Detailed description of global
case studies
2.3 Organisation of the work
The development of the Action need the involvement of experts from a variety of disciplines re-lated to the construction sector. Luckily most of the expertises could be found in the delegates nominated by the participating countries.
In accordance with the scientific programme stated in the Memorandum of Understanding,
the following three Working Groups were created to cover the three main areas of the Action:
WG1 – Criteria for Sustainable Constructions (global methodologies, assessment methods,
global models and databases)
WG2 – Eco-efficiency (eco-efficient use of natural resources in construction - materials,
products and processes)
WG3 – Life-time structural engineering (design for durability, life-cycle performance, in-
cluding maintenance and deconstruction)
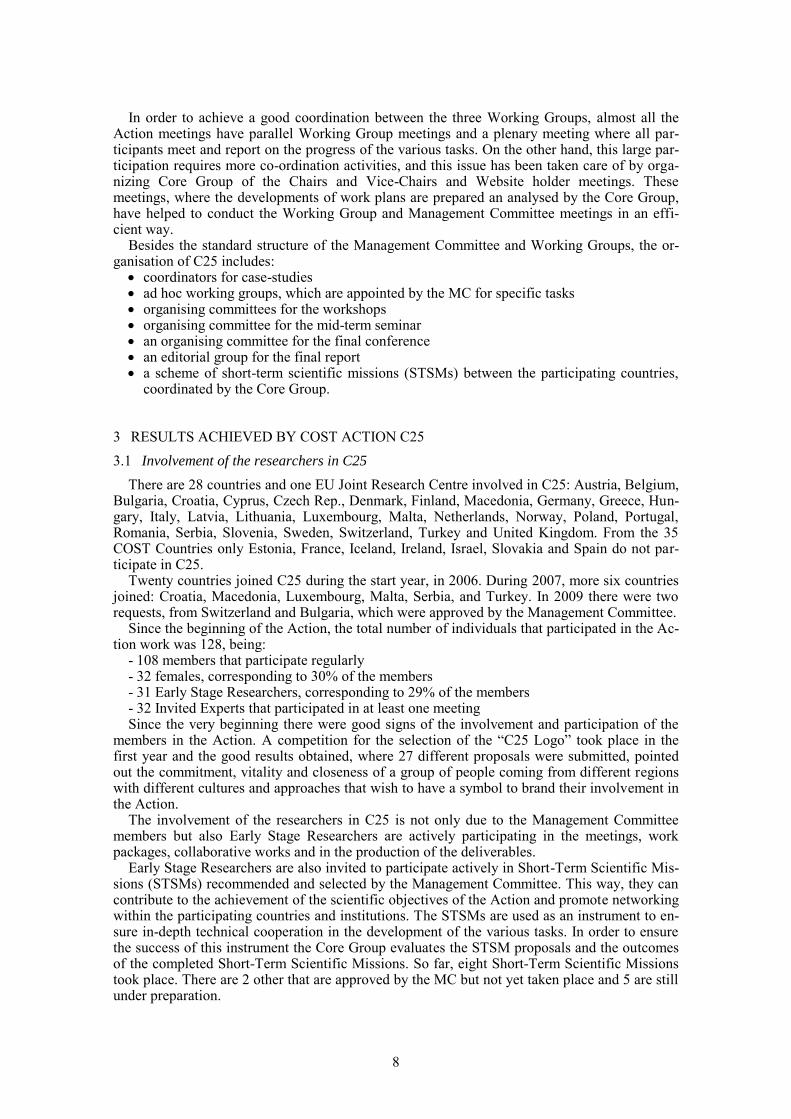
Table 2 illustrates the subdivision of tasks between the three Working Groups.
Table 2. Work packages undertaken by each Working Group.
Work Packages WG1 WG2 WG3
WP1 x
WP2 x
WP3 x
WP4 x x x
WP5 x
WP6 x
WP7 x x x
WP8 x
WP9 x
WP10 x x x
7
In order to achieve a good coordination between the three Working Groups, almost all the
Action meetings have parallel Working Group meetings and a plenary meeting where all par-ticipants meet and report on the progress of the various tasks. On the other hand, this large par-ticipation requires more co-ordination activities, and this issue has been taken care of by orga-nizing Core Group of the Chairs and Vice-Chairs and Website holder meetings. These meetings, where the developments of work plans are prepared an analysed by the Core Group, have helped to conduct the Working Group and Management Committee meetings in an effi-cient way.
Besides the standard structure of the Management Committee and Working Groups, the or-ganisation of C25 includes:
coordinators for case-studies ad hoc working groups, which are appointed by the MC for specific tasks organising committees for the workshops organising committee for the mid-term seminar an organising committee for the final conference an editorial group for the final report a scheme of short-term scientific missions (STSMs) between the participating countries,
coordinated by the Core Group.
3 RESULTS ACHIEVED BY COST ACTION C25
3.1 Involvement of the researchers in C25
There are 28 countries and one EU Joint Research Centre involved in C25: Austria, Belgium, Bulgaria, Croatia, Cyprus, Czech Rep., Denmark, Finland, Macedonia, Germany, Greece, Hun-gary, Italy, Latvia, Lithuania, Luxembourg, Malta, Netherlands, Norway, Poland, Portugal, Romania, Serbia, Slovenia, Sweden, Switzerland, Turkey and United Kingdom. From the 35 COST Countries only Estonia, France, Iceland, Ireland, Israel, Slovakia and Spain do not par-ticipate in C25.
Twenty countries joined C25 during the start year, in 2006. During 2007, more six countries joined: Croatia, Macedonia, Luxembourg, Malta, Serbia, and Turkey. In 2009 there were two requests, from Switzerland and Bulgaria, which were approved by the Management Committee.
Since the beginning of the Action, the total number of individuals that participated in the Ac-tion work was 128, being:
- 108 members that participate regularly - 32 females, corresponding to 30% of the members - 31 Early Stage Researchers, corresponding to 29% of the members - 32 Invited Experts that participated in at least one meeting Since the very beginning there were good signs of the involvement and participation of the
members in the Action. A competition for the selection of the “C25 Logo” took place in the first year and the good results obtained, where 27 different proposals were submitted, pointed out the commitment, vitality and closeness of a group of people coming from different regions with different cultures and approaches that wish to have a symbol to brand their involvement in the Action.
The involvement of the researchers in C25 is not only due to the Management Committee members but also Early Stage Researchers are actively participating in the meetings, work packages, collaborative works and in the production of the deliverables.
Early Stage Researchers are also invited to participate actively in Short-Term Scientific Mis-sions (STSMs) recommended and selected by the Management Committee. This way, they can contribute to the achievement of the scientific objectives of the Action and promote networking within the participating countries and institutions. The STSMs are used as an instrument to en-sure in-depth technical cooperation in the development of the various tasks. In order to ensure the success of this instrument the Core Group evaluates the STSM proposals and the outcomes of the completed Short-Term Scientific Missions. So far, eight Short-Term Scientific Missions took place. There are 2 other that are approved by the MC but not yet taken place and 5 are still under preparation.
8
In the context of the Action a competition among students for the design of an Office Build-ing according to the aims of Sustainable Construction was approved by the MC in 2007, and was concluded successfully in May 2009. This competition was initially started by the Working Group 1; however it has been taken over and brought forward by many other COST C25 mem-bers. The competition has contributed to a greater awareness about the main topics of the C25 action and increased the interest of young students and researchers in the fields of integrated life cycle design of sustainable constructions. This competition provided an opportunity for students to demonstrate their sustainability design skills in an international competition against their peers. Design programs in universities around Europe were encouraged to participate in this competition and to consider it into their academic curriculum for interested students. Early Stage Researchers also had actively participated in the “Student Competition” organized by COST C25. About 40 students expressed their interest in participating in. At the end 23 stu-dents belonging to 8 teams submitted their projects. The 3 first prizes offered by the Associa-tion of Architects of Naples were awarded to 4 teams (2 teams in the 3rd place ex aequo) during the C25 Naples Symposium (11-12 May 2009).
The competition was very successful in attracting a big number of student groups to partici-pate and it has further enlarged the awareness about the COST C25 topics at the universities and at the student’s level and brought extra publicity of the C25 activities.
Another good indicator of the involvement of the researchers is the participation of members in the C25 case-studies. The complexity of the topic “sustainability of constructions” and the holistic approach needed to deal with it stimulated the members in concentrate efforts in seven case-studies. For “Bridges” there three on going case-studies:
Integral abutment bridge Three-span motorway viaduct Existing 30 years old bridge and four on going case-studies for “Buildings”: Light steel frame residential building Concrete structure multifamily house SPEAR Building Virtual Office building. These case-studies are being continuously reassessed throughout the Action and the com-
plexity is being increased from essentially bare structures such as simple bridges to complex buildings including structural parts, non-structural parts and equipment and to allow for a clear identification of all relevant aspects.
For each case-study, a coordinator was nominated by the working group. The case-study co-ordinators are in charge of:
establishing the appropriate structural applications providing information to the participants proposing a programme of the activities to the Management Committee collection of task forces for specific duties follow-up of the activities in the Working Groups reporting to the Management Committee and organising workshops together with the WG Chairs.
3.2 Key scientific and technical outcomes
The Action C25 developed an innovative networking aiming to promote a scientific understand-ing of life-time engineering and to boost science-based advancement of sustainable construction in Europe. The combination of expertises and research fields has resulted to new research and educational strategies and new mixed research methods to understand interaction of users, soci-ety and technologies. Some specific examples of innovative knowledge resulting from the net-working through the Action are:
- Integration of LCA in sustainability rating methodologies - Recognition of LCA as an integral part of structural engineering - Integration of degradation models in methods of lifetime engineering - Finding weighting methods for global assessment - Development of recycled construction materials In this context, significant scientific breakthroughs were achieved and for the first time there
9
is a methodology to assess sustainability of bridges and guidelines on how to perform life-cycle analysis in construction projects (both bridges and buildings). Science based approaches (mod-elling and simulation) to lifetime engineering including maintenance scenarios are also bring developed as part of the COST Action.
Other important “Key outcomes” are also the socio-economic impacts achieved so far. Many members of C25 are now regarded as frontrunners in the particular field of expertise of “Sus-tainable Construction”. Local authorities like e.g. the city of Eindhoven (NL) and the city of Espoo (FI) are asking advices about sustainability of constructions to local C25 members. Other members are being asked to join advisory panels of EU FP7 Projects.
National assessment and rating systems like e.g. in PT, FI, UK and DE are integrating meth-ods of lifetime engineering and some C25 members are being invited to participate EU’s Enter-prise Construction LCA Workshops.
Some other tangible positive impact is the participation of “New Member States” and “Can-didate States” in the harmonization process and knowledge transfer, through the participation of several new C25 members in the European networks. Another example is the 1st National Con-ference on Sustainable Civil Engineering in Belgrade on 4-5 June 2009, organised by the Fac-ulty of Civil Engineering of University of Belgrade and the Faculty of Technical Sciences of University of Novi Sad, which helped to disseminate the C25 scientific and technical outcomes.
In the medium term it is expected the uptake of advanced science-based methods and tools in everyday design processes (bridges and buildings), like e.g. assessment method of flexibil-ity/adaptability to be used building design process. Also several members are planning new educational courses and programmes in their universities that will bring environmentally liter-ate workforce to companies and society.
3.3 Spin off of new projects
Almost all the members have their own projects that support the research activity that is needed to carry to contribute to C25. Nevertheless, C25 also helped in creating new networks and stimulated the capacity of the Action members to raise research funds.
As an example, the following lists show the efforts of C25 members in the spin off of new projects.
EC RTD Framework Programme proposals/projects: FP7 2007: Proposal ProSEED - Processes and Technologies for Energy Efficient and Sus-
tainable Construction (C25 participants: VTT – FI, U of Luleå – SE, U of Coimbra – PT, U of Timisoara – RO, Aristotle U of Thessaloniki – GR, U of Ljubljana – SI, U of Liege – BE, U of Stuttgart – DE and U of Minho – PT)
RFCS 2008: Project SBRI - Sustainable Steel-Composite Bridges in Built Environment (C25 participants: University of Stuttgart – DE, University of Coimbra – PT and Arcelor-Mittal S.A. – LU)
FP7 2008: Coordination Action PERFECTION - Performance Indicators for Health, Com-fort and Safety of the Indoor Environment (C25 participants: VTT – FI and TU Prague – CZ. C25 members of expert panel: U of Ljubljana – SI, U of Karlsruhe – DE and U. of Minho – PT)
ERASMUS MUNDUS 2009-2013: EMJD, Joint doctorate programme, Proposal for a doc-torate course in sustainable steel constructions (C25 participants: University of Coimbra – PT, Lulea University of Technology – SE, "Politehnica" University of Timisoara – RO, University of Stuttgart – DE, University of Naples Federico II – IT)
FP7 2009: Project OPEN HOUSE- Benchmarking and mainstreaming building sustainabil-ity in the EU based on transparency and openness (open source and availability) from model to implementation (C25 participants: University of Ljubljana – SI. C25 members of expert panel: VTT – FI, University of Naples – IT, Aalborg University – DK and Univer-sity of Minho – PT)
RFCS 2009: Proposal SB_Steel - Conceptual decision making tool for a sustainable steel framed building (C25 participants: VTT – FI, U of Coimbra – PT, Aristotle U of Thessa-loniki – GR and U of Minho – PT)
National Programme proposals/projects: 31042/2007 PNCDI2 – PROACTEX. Structural systems and innovative technologies for
protection of buildings under extreme actions taking into account sustainable design crite-
10
ria. (“Politehnica” University of Timisoara – RO) Joint Nordic Call 2008: Methods and Concepts for Sustainable Renovation (VTT – FI) FI 2008: Adopting new processes for sustainable building and built environment (VTT) Serbia 2008: Project Recycled Aggregate Concrete Technology Properties and Application
in Reinforced Concrete Structures (C25 participants: Faculty of Civil Engineering of Uni-versity of Belgrade and the Faculty of Technical Sciences of University of Novi Sad)
SE 2009: Project Application on Integral abutment bridges (C25 participants: University of Luleå)
FORGIARE Project; Proposal for a post-doc grant in the field of sustainability of con-struction (C25 Participants: University of Naples – IT)
FUTURO IN RICERCA 2009 call. Proposal for a national funding programme devoted to sustainability of constructions. “Methods and criteria for the decision making in sustain-able seismic protection of constructions” (C25 participants: University of Naples – IT)
FCT-PT 2010: Proposal INNOVCOMP - Innovative and sustainable floor and wall sys-tems for light steel residential buildings (C25 participants: University of Coimbra – PT and University of Minho – PT)
FCT-PT 2010: Proposal SSB2All - Sustainable Steel Building Affordable to All (C25 par-ticipants: University of Coimbra – PT and University of Minho – PT)
SE 2010: Climate and environmentally related life cycle modelling and optimized struc-tural design of sustainable civil and building structures SELCO (C25 participants: Univer-sity of Luleå)
4 DISSEMINATION OF RESULTS
4.1 Conferences and workshops
The outcome of the work developed during the first three years of activity of the Action was, respectively, disseminated in three major events, one in each year.
The first event was the 1st Workshop of C25 on “Sustainability of Constructions” that took
place in Lisbon, Portugal, on 13, 14 and 15 September 2007. The second event was the Seminar on Sustainability of Constructions that took place in
Dresden, Germany, on 6-7 October 2008. The third event was the International Workshop on Sustainability of Constructions - Inte-
grated Approach to Life-time Structural Engineering that took place in Timisoara, Romania, on 23-24 October 2009.
The Seminar and the two Workshops main topics covered a wide range of up-to-date issues and the contributions received from the delegates reflect critical research and the best available practices in the Sustainable Construction and Life-time Structural Engineering fields. Due to the efforts and commitment of C25 members, three books could already be published. Figure 3 shows the front covers of the three books.
First Book Second Book Third Book
Figure 3. Front covers of the three C25 books.
11
The full references of the C25 books are the following: L. Bragança, H. Koukkari, R. Blok, H. Gervásio, M. Veljkovic, Z. Plewako, R. Landolfo,
V. Ungureanu, L.S. Silva, (eds). Sustainability of Constructions - Integrated Approach to Life-time Structural Engineering. Proceedings of the First Workshop. Lisbon, Portugal. September 2007. 41 papers; 328 pages; ISBN: 978-989-20-0787-8.
L. Bragança, H. Koukkari, R. Blok, H. Gervásio, M. Veljkovic, Z. Plewako, R. Landolfo, V. Ungureanu, L.S. Silva, P. Haller (eds). Sustainability of Constructions - Integrated Ap-proach to Life-time Structural Engineering. Proceedings of the Seminar. Dresden, Ger-many. October 2008. 55 papers; 436 pages; ISBN 978-3-86780-094-5.
L. Bragança, H. Koukkari, R. Blok, H. Gervásio, M. Veljkovic, Z. Plewako, R. Landolfo, V. Ungureanu, L.S. Silva, (eds). Sustainability of Constructions - Integrated Approach to Life-time Structural Engineering. Proceedings of the International Workshop. Timisoara, Romania. October 2009. 38 papers; 390 pages; ISBN: 978-973-638-428-8.
The Final Conference of C25 will take place in Innsbruk, Austria, on 03-05 February 2011. It will be organised as an open international conference and it is expected to gather about 200-250 people interested in learning and sharing knowledge in Life-time Structural Engineering.
4.2 Action related publications
Considering the originality and the high level of the work done so far in the Action, contacts with editors of international journals were established in order to publish and disseminate a se-lection of results achieved by C25.
The MDPI Journals on Environmental Issues of Built Environment agreed to publish a Spe-cial Issue on "Sustainability of Constructions - Integrated Approach to Life-time Structural En-gineering" of the International Journal “Sustainability” a selection of the papers from C25 members in 2010:
http://www.mdpi.com/journal/sustainability/special_issues/sustainability-constructions
4.3 Training Schools
Some of the good results achieved by the Action were already disseminated and brought to use due to the Training Schools organised by C25. So far, two very successful Training Schools were organised; the first one was “The LCA Training School” that was organised for 16 par-ticipants in Eindhoven, Netherlands, on 13-15 February 2008. The participants were mainly Early Stage Researchers from C25.
The second Training School “Sustainability in structures and structural interventions: Im-proving the contemporary and historical urban habitat constructions within a sustainability and risk assessment framework” was held in Thessaloniki, Greece, on 17-24 May 2009. It was jointly organised by C25 and C26 and the number of Early Stage Researchers was 40, from these two Actions.
A third Training School is being organised under the theme “Sustainability in Engineering: A Life Cycle Approach in Structural Engineering”. The aim of the International School is to ad-dress Sustainability in Engineering, and the Life Cycle Approach in Structural Engineering. The Training School is intended for Early Stage Researchers and PhD students. An interna-tional group of lecturers and experts in this field was selected for the preparation of the Pro-gramme and a group was selected to deliver lectures during the duration of the School. The sci-entific content of the School was prepared with the support of experts from COST Action C25. The Training School is hosted by the Department of Building & Civil Engineering of the Uni-versity of Malta and offers various opportunities for collaboration among the researchers taking part. It will also serve as an important forum for the development of new ideas in the emerging field of Life Cycle Analysis in construction.
4.4 Website
The website of C25 was established in the beginning of 2007 and since then has been continu-ously updated in order to be easy to navigate and provide useful information for C25 Members and Non-members. The website contains the information that has been produced by members of the Action and turns it publicly available to other interested stakeholders. It includes the sec-tions:
12
- Introduction to the aims and objectives of the Action “Sustainability of Constructions: Inte-grated Approach to Life-time Structural Engineering” and the Memorandum of Understanding;
- Management Committee and Working Groups, including Lists of Members, Meeting Agen-das and Minutes, Presentations given in all meeting and additional documents;
- Case Studies descriptions; - Student Competition description and rules of the competition; - Logo Competition containing the 27 proposals for the C25 Logo; - Database (to be available as soon as this task is finished); - Links to LCIA Methodologies, Databases, Tools and other useful links - A Glossary containing a list of “sustainability” related terms and the respective definitions. The Action website can be found at: http://www.cmm.pt/costc25
5 CONCLUSIONS The Action has achieved such a great number of members that it is one of the largest in TUD Domain. It proves that the scientists have needs and interests for European level co-operation in life-time engineering and other sustainability issues. The new Member States are well present, and that was also one of the original targets of the proposal. The Action has brought together European experts in material and structural engineering as was the plan of the proposers. Also, architecture is well represented adding valuable insight to design processes and applications of LCA methods.
On the other hand, this large participation requires more co-ordination activities, and this is-sue has been taken care of by organizing Core Group of the Chairs and Vice-Chairs and Web-site holder meetings. These meetings have helped to plan and conduct the Working Group and Management Committee meetings in an efficient way as well as the other Action activities like Training courses. Based upon the MoU, a more detailed work plan was prepared by the Core Group and presented to the Management Committee in the second meeting and approved also by the Working Groups as their basis to plan their activities.
The core members of C25 have contributed in writing "ECCS resolution for improvement of current draft of CEN TC 350 prEN 15978". This document was circulated among the wider group of members for the consultation. The main message of the resolution was the inconsis-tency of this draft with the latest development. Fortunately, the documented did not pass voting. It is, of course, difficult to estimate the impact of the action of C25 members, but awareness of importance of the network was evident.
The Action has fostered the fruitful interaction between performance-based design, life-cycle assessment processes and structural engineering within the framework of sustainability. Life-time engineering itself adopts and develops new approaches of interdisciplinary methods. Sus-tainable construction aims at balanced results of construction projects in which life-cycle as-sessments are the way to value and steer decisions. During the Action, combination of these ap-proaches has been the basic line that was also expressed as a main objective in the MoU. The fundamental meaning of durability and structural service life design for the reliability of LCA results has been shown and methods have been developed. Members are now able to apply LCA methods to structural design. LCA methods are mainly with architectural background and they are quite far from the classic background of structural engineer. Thanks to the interdisci-plinary networking, structural engineers are now involved in case studies devoted to integrate the environmental performances of structures with the structural design requirements.
Among members of the Working Groups and MC, new European project proposals for the Seventh Framework Programme and for the Research Fund for Coal and Steel Programme have been initiated. Although this achievement is one of the secondary objectives of the Action it is very important to show the high level of the work that is being carried out in COST Action C25.
13

14
COST Action C25
International Symposium
Sustainable Construction: A Life Cycle Approach in Engineering
Chapter 1
Sustainable Construction
15

16
1 INTRODUCTION The building environmental assessment tools are not normally well integrated into the design and decision making process. Lützkendorf and Lorenz (2006) suspect the tools are not easily applied during the design phase. Thus, the assessment tools are typically used towards the end of the design to evaluate the environmental results. Consequently, the later the assessment in the design process is done, the fewer possibilities it has to influence the design itself. (Haapio, 2008) Occasionally, a comparative study of alternative building structures is conducted (e.g. Häkkinen & Wirtanen, 2006; Trusty & Meil, 1999). These studies are beneficial when they are accomplished during the design phase, and the results can be utilised in the decision making. When the comparison is made after the decision has already been made, the significance of the comparison is minor. Unavoidably, the real intensions of the comparisons are questionable.
The Role of Environmental Assessment of Buildings
A.Haapio VTT Research Centre of Finland, Finland [email protected]
ABSTRACT: Since the building sector started to recognise the impact of their activities on the environment in the 1990s, environmentally related issues have been extremely popular research area. Over the past decade, the development of the tools has been active, and the tools have gained considerable success. Numerous tools have been developed for the building sector to help decision making, and to improve the environmental performance of buildings and building stocks. The variety of the tools is wide; LCA based tools, rating systems, technical guidelines, assessment frameworks, checklists and certificates. However, assessment tools are not used si-multaneously with design tools.
Awareness of environmental and energy efficiency issues relating to building design and construction is increasing. A wider perspective is needed – optimising one thing is not always the best solution considering the whole. Thus, it is essential to integrate environmental assess-ment of building to a wider concept – the design process right from the beginning. Through simulations, for example, the building performance could be continually refined and improved. The earlier the simulations are done, the more possibilities they have to influence the design it-self. Moreover, the costs of changes are lower in the early design phase. Including the environ-mental aspect to the design process from the beginning would be a competitive strength. Build-ing information modelling (BIM) could be seen as an integrative element between sustainable building, and decision making.
The requirements for the assessment tools of buildings have increased tremendously. The environmental assessment of building components or separate buildings is not enough. In addi-tion to analysis of environmental aspects, the other aspects of sustainability; economical and social aspects, have to be considered. Moreover, the neighbourhoods, built environment, public transportations, and services, should be considered and analysed simultaneously. The focus seems to be on developing frameworks and assessment tools for urban neighbourhoods and communities, such as BREEAM Communities, CASBEE for Urban Development, and LEED for Neigborhood Development.
17
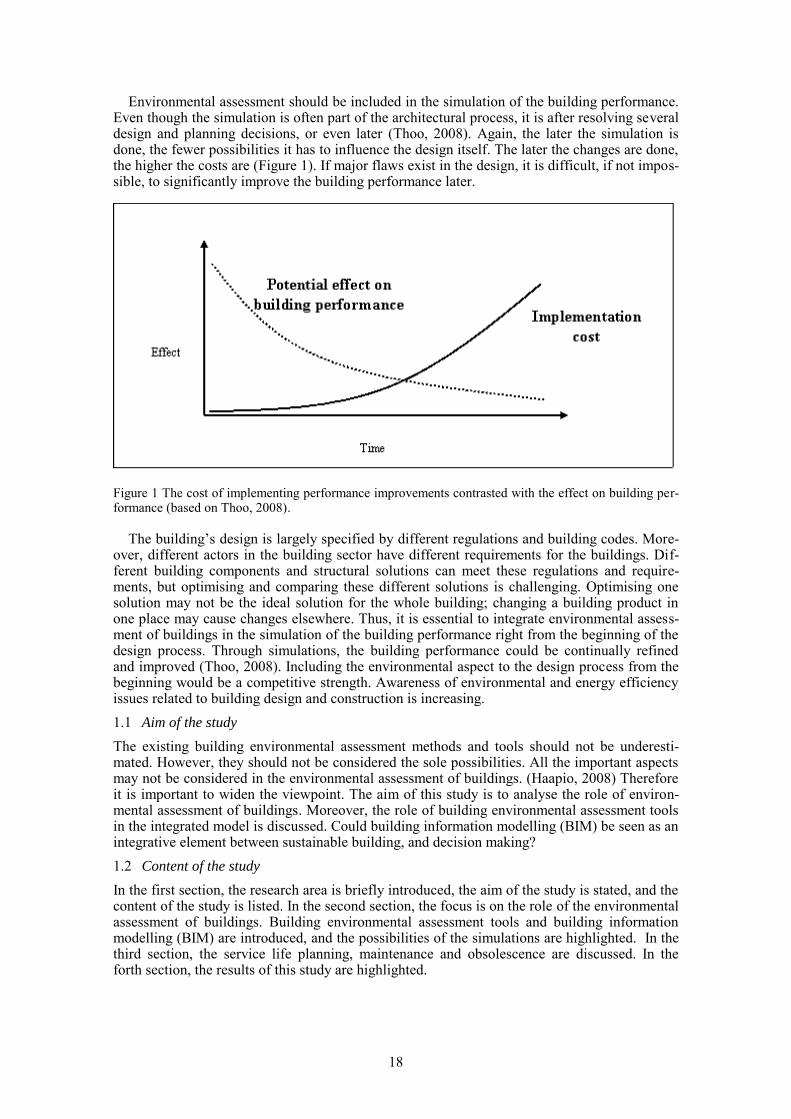
Environmental assessment should be included in the simulation of the building performance. Even though the simulation is often part of the architectural process, it is after resolving several design and planning decisions, or even later (Thoo, 2008). Again, the later the simulation is done, the fewer possibilities it has to influence the design itself. The later the changes are done, the higher the costs are (Figure 1). If major flaws exist in the design, it is difficult, if not impos-sible, to significantly improve the building performance later.
Figure 1 The cost of implementing performance improvements contrasted with the effect on building per-formance (based on Thoo, 2008).
The building’s design is largely specified by different regulations and building codes. More-
over, different actors in the building sector have different requirements for the buildings. Dif-ferent building components and structural solutions can meet these regulations and require-ments, but optimising and comparing these different solutions is challenging. Optimising one solution may not be the ideal solution for the whole building; changing a building product in one place may cause changes elsewhere. Thus, it is essential to integrate environmental assess-ment of buildings in the simulation of the building performance right from the beginning of the design process. Through simulations, the building performance could be continually refined and improved (Thoo, 2008). Including the environmental aspect to the design process from the beginning would be a competitive strength. Awareness of environmental and energy efficiency issues related to building design and construction is increasing.
1.1 Aim of the study
The existing building environmental assessment methods and tools should not be underesti-mated. However, they should not be considered the sole possibilities. All the important aspects may not be considered in the environmental assessment of buildings. (Haapio, 2008) Therefore it is important to widen the viewpoint. The aim of this study is to analyse the role of environ-mental assessment of buildings. Moreover, the role of building environmental assessment tools in the integrated model is discussed. Could building information modelling (BIM) be seen as an integrative element between sustainable building, and decision making?
1.2 Content of the study
In the first section, the research area is briefly introduced, the aim of the study is stated, and the content of the study is listed. In the second section, the focus is on the role of the environmental assessment of buildings. Building environmental assessment tools and building information modelling (BIM) are introduced, and the possibilities of the simulations are highlighted. In the third section, the service life planning, maintenance and obsolescence are discussed. In the forth section, the results of this study are highlighted.
18
2 ENVIRONMENTAL ASSESSMENT OF BUILDINGS
In the 1990s, industrial sectors, including the building sector, started to recognise the impact of their activities on the environment. Public policy and a growing market demand for environ-mentally sound products and services forced the building sector to focus on the environmental performance of buildings. When aiming to reduce environmental impact, a yardstick for meas-uring environmental performance was needed (Crawley & Aho, 1999). The specific definition of the term “building performance” is complex, since different actors in the building sector have differing interests and requirements (Cole, 1998). Economic performance, for example, in-terests investors, whereas the tenants are more interested in health and comfort related issues. (Haapio & Viitaniemi, 2008a)
Separate environmental indicators were developed for the needs of relevant interest groups. (Haapio, 2009) The first real attempt to establish a comprehensive means of simultaneously as-sessing a broad range of environmental considerations in buildings was the Building Research Establishment Environmental Assessment Methods (BREEAM) in 1990 (Cole, 2005; Crawley & Aho, 1999; Grace, 2000). Over the past decade, the development of the tools has been ac-tive. Different organisations and research groups have contributed new knowledge through ex-perience. The tools have gained considerable success (e.g. CRISP, 2005,Haapio & Viitaniemi, 2008a; IEA Annex 31, 2001; Khasreen et al., 2009; Reijnders & van Roekel, 1999). Cole (2005), however, suspects the success of the tools has dwarfed all other mechanisms for instill-ing environmental awareness.
2.1 Building environmental assessment tools
Over the past decade, the development of the tools has been active, and the tools have gained considerable success. Numerous tools have been developed for the building sector to help deci-sion making, and to improve the environmental performance of buildings and building stocks. The variety of the tools is wide; LCA based tools, rating systems, technical guidelines, assess-ment frameworks, checklists and certificates.
However, building environmental assessment tools are not all commensurable. The compari-son of the tools and their results is difficult. Different tools have been developed to assess new and existing buildings, residential buildings (single family, multi unit), office buildings, and other types of buildings. (Haapio & Viitaniemi, 2008a) Different building environmental as-sessment tools use different criteria in the assessment of buildings, and different indicators to correspond to these criteria. Unfortunately, criteria and indicators are not always differentiated; but rather confusingly used as synonyms. (Haapio & Viitaniemi, 2007)
Building environmental assessment tools emphasise the life cycle of a building differently; some tools cover the whole life cycle whereas other tools are more focused on the maintenance and the use of the buildings. Even if the tools cover the same phases of the life cycle in the as-sessment, they may cover the phases differently. One tool uses several criteria for a phase while the other uses only a few criteria for the same phase in question. Moreover, the tools may use the same criteria, but different indicators to correspond to these criteria. (Haapio & Viitaniemi, 2007, 2008a)
Some building environmental assessment tools utilise well known databases in calculation, the other rely more on guidelines and questionnaires. Due to different data sources and collec-tion methods, the comparison of the environmental impact of materials is impossible (Trusty & Meil, 2002). This impedes the comparison of the results of the buildings’ environmental as-sessment. In addition to the results (graphs, tables, reports) some of the tools hand out different labels and certificates. The development of the building environmental assessment tools is chal-lenging in the future. It is more practical to have a tool which clarifies ~80% of the significant issues, than a tool which clarifies ~90% of irrelevant environmental issues. (Haapio & Viita-niemi, 2007) As Ding (2008) points out, “Striking a balance between completeness in the cov-erage and simplicity of use is one of the challenges in developing an effective and efficient en-vironmental building assessment method”.
2.2 Integration of assessment tools and design tools
Currently, most building environmental assessment tools are used towards the end of the design process to evaluate the environmental results. Often, these assessment tools are used by an ex-
19
ternal user (Lützkendorf & Lorenz, 2006), such as AEC professionals (architects, engineers, and constructors), producers, investors, consultants, tenants, authorities, and researchers (Haapio & Viitaniemi, 2008a).
The building environmental assessment tools are not used simultaneously with the design tools. Consequently, the later the assessment in the design process is done, the fewer possibili-ties it has to influence the design itself. The design of the building is largely specified by differ-ent regulations, building codes and standards. In addition, different actors in the building sector have different requirements for the building. Different building components and structural solu-tions can meet these regulations and requirements, but optimizing and comparing these differ-ent solutions is challenging. Optimising one solution may not be the ideal solution for the whole building; changing a building product in one place may cause changes elsewhere. A window with the best U-value, for example, is not always the best solution in northern Europe. In cold weather, water may condense on the surface of the window’s glass, causing problems if the condensed water stays there for too long or is absorbed into the structures. (Haapio, 2008)
The integration of the assessment and design tools would facilitate the situation. Lützkendorf and Lorenz (2006) are expecting it to happen in the future. However, the integration of the tool is challenging. The variety of the building environmental assessment tools is wide; LCA based tools, rating systems, technical guidelines, assessment frameworks, checklists and certificates. (e.g. Khasreen et al., 2009; Haapio & Viitaniemi, 2008a) The tools cover different phases of the building’s life cycle and take different environmental issues into account. Where the LCA based tools use databases, the environmental assessment frameworks rely more on guidelines and questionnaires.
2.3 Building Information Modelling (BIM)
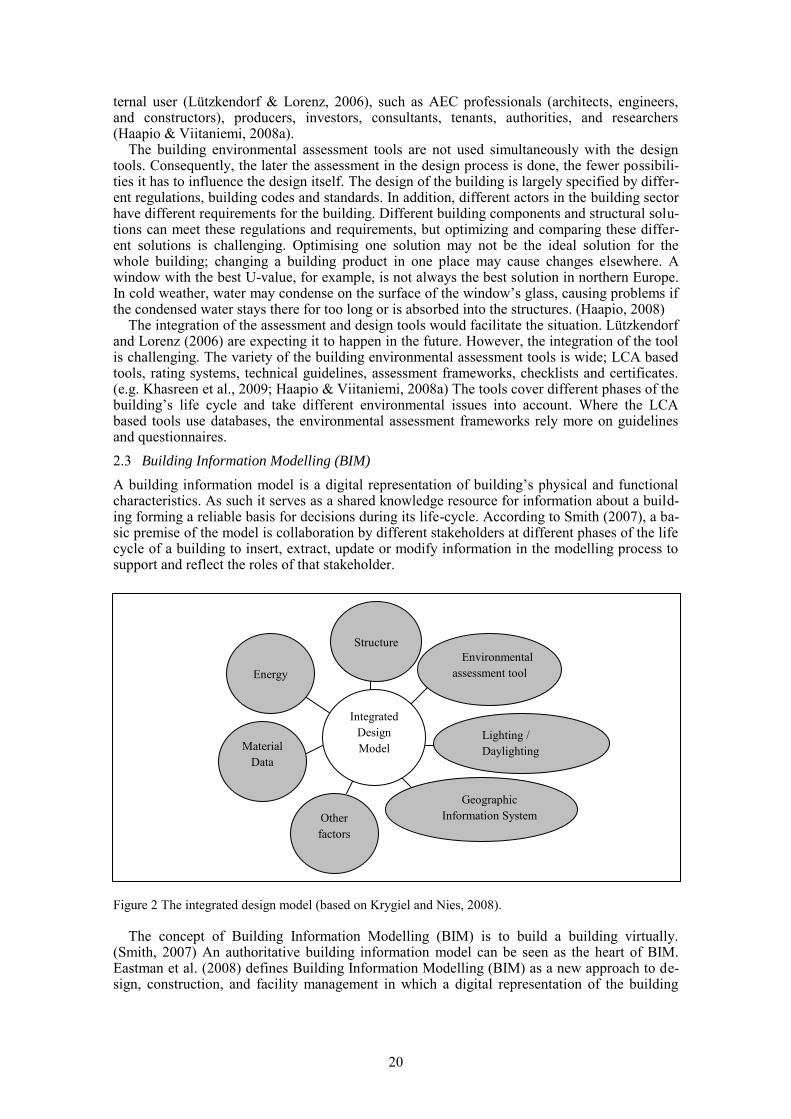
A building information model is a digital representation of building’s physical and functional characteristics. As such it serves as a shared knowledge resource for information about a build-ing forming a reliable basis for decisions during its life-cycle. According to Smith (2007), a ba-sic premise of the model is collaboration by different stakeholders at different phases of the life cycle of a building to insert, extract, update or modify information in the modelling process to support and reflect the roles of that stakeholder.
Figure 2 The integrated design model (based on Krygiel and Nies, 2008).
The concept of Building Information Modelling (BIM) is to build a building virtually.
(Smith, 2007) An authoritative building information model can be seen as the heart of BIM. Eastman et al. (2008) defines Building Information Modelling (BIM) as a new approach to de-sign, construction, and facility management in which a digital representation of the building
Structure
Energy
Lighting /
Daylighting Material
Data
Other
factors
Integrated
Design
Model
Geographic
Information System
Environmental
assessment tool
20
process is used to facilitate the exchange and interoperability of information in digital format. Within the model, all the information is stored in an integrated database. The information is pa-rametric and therefore interconnected. Any change to an object is directly reflected throughout the rest of the project in all views. (Krygiel & Nies, 2008)
Integrated design model was the first model of a BIM –based method. Figure 2 shows how various components begin to create that model, and how different factors begin to inform de-sign direction. The links between different factors can also been found. Some of these links would have not been so obvious in a traditional based approach. (Krygiel & Nies, 2008) Geo-graphic Information System (GIS), for example, provides climate information which affects to the heating energy consumption among other things.
2.4 Simulations
Even though BIM contains a lot of information about the building, it has a long way of becom-ing an analysis tool. Krygiel and Nies (2008) point out the need for better interoperability be-tween different software packages. The ability to move data from BIM to an analysis tool is critical. Most beneficial would be the ability to go back to BIM with the changes from the analysis tool. Throughout analyses, redefinitions and simulations the building performance could be improved tremendously.
The earlier the simulations are done, the more possibilities they have to influence the design itself. Moreover, the costs of changes are lower in the early design phase (Figure 1). Simula-tions would facilitate the decision making. There are enormous amount of issues that could be simulated, some of the most important ones are highlighted here. Conducting them in the simu-lation would an enormous benefit for the building sector and for the tenants as well.
Comparison of different building materials and structural solutions Energy consumption (production of materials and components, construction, use and op-
eration of building, maintenance, demolition, disposal) Maintenance and renovations Safety and rescuing Environmental impact of different decisions A single building, blocks of building, residential area The challenge is to manage all the different simulations, and their relationships. The amount
of information may be problematic – there might be too much of it. It is challenging to identify the fundamental information, and to utilise it beneficially. Moreover, emphasising all three as-pects of sustainability equally is demanding.
3 SERVICE LIFE PLANNING
Many of the building environmental assessment tools require an estimation of building’s lifetime. The service life of a building, however, has not been emphasised within the tools. Rather, the ser-vice life is taken as given without further analysis (Haapio & Viitaniemi, 2008a, b). And yet, a single building may comprise over 60 basic materials and circa 2000 separate products. Their ser-vice lives are different, and they have unique production / repair / disposal processes (Kohler & Moffatt, 2003).
3.1 Maintenance of a building
During the building’s service life, the building needs to be maintained, and some components need to be replaced. The service lives of the components are different. The service life of the inaccessible parts should be the same as the service life of the building (ISO, 2000). In other words, the service life of the accessible parts can be shorter than the service life of the building. If the service life of a component is shorter than the building’s service life, the components needs replacement. (Haapio & Viitaniemi, 2008c) As an example, if the design life (intended service life) of a building is 150 years, the suggested design lives are (ISO, 2000):
21
150 years for inaccessible or structural components 100 years for components where replacement is expensive or difficult 40 years for major replaceable components 25 years for building services (easy-to-replace components may have design lives of 3 or 6 years). Maintenance and replacements have environmental impacts. The maintenance can be proac-
tive or reactive. In proactive maintenance, the action is taken in advance – before the damage occurs. In reactive maintenance, the action is taken afterwards – after the damage has occurred. There is a possibility the remaining service live of the components is lost, if the replacement is done proactively. If the replacement is done reactively, the component may have damaged its surroundings. The maintenance of these damaged surroundings has economical and environ-mental consequences. (Haapio & Viitaniemi, 2008c)
The time between the needed maintenance and replacements differs between different com-ponents, and also, the demands for the maintenances are different. In addition, the quality of the maintenance, i.e. workmanship, influences the forthcoming maintenances and may reduce the remaining service life. Poor maintenance, or disregarded maintenance, may cause damage elsewhere, and thus influence the whole building. For example, as a consequence of missing out the oil change of a car, the engine of the car may seize up. The repair of the engine is far more expensive than the oil change would have been. Also, wide repair is always more challenging, and exposed to further damages. (Haapio & Viitaniemi, 2008c)
The maintenance and renovations of existing buildings are critical issues for sustainable building, especially in Europe. The service life of a building can be decades, even centuries. The service lives of components vary from a few years up to the service life of a whole build-ing. But during the building’s long service life, manufacturing processes and products are de-veloped. Matching old and new techniques and products could be challenging, especially con-sidering the lack of professional workers.
3.2 Obsolescence
Although service life and obsolescence are related issues, they need to be differentiated. Obso-lescence should be distinguished from the replacement due to defective performance (ISO, 2000). Obsolescence is a condition of being antiquated, old-fashioned, or out-of-date. An obso-lete item does not meet a condition of the current requirements or expectations (Lemer, 1996). However, this does not indicate the item is broken or dysfunctional. In other words, the service live of the item is not necessarily over, even if the item is obsolete.
Currently, the number of renovations caused by obsolescence is increasing, as the require-ments and needs of tenants grow. These renovations have environmental impact; if the compo-nent is replaced before its service life is finished, the remaining service life is wasted. It seems a waste, especially if the replaced building materials and components are not recycled. In a case like this, the environmental viewpoint is often forgotten. Issues related to obsolescence should be taken into consideration already in the design phase. The accessibility to the components during the maintenance and the replacement should be considered already in the design phase, in order to minimize the possible damage to the surroundings. (Haapio & Viitaniemi, 2008c)
4 DISCUSSION AND CONCLUSION
Numerous tools have been developed for the building sector help decision making and improve the environmental performance of buildings and building stocks. The field on building envi-ronmental assessment tools is vast, and the use of the tools is diverse. Different building com-ponents can be compared separately or as a part of a building. The buildings can be analysed as a construction, focusing on the structure of the building, or as a residence, focusing on the use of the building. The existing building environmental assessment methods and tools should not be underestimated. Nonetheless, they should not be considered the sole possibilities. It is vital to widen the viewpoint. The role of the building environmental assessment tools in the inte-grated model needs to be analysed more thoroughly.
22
With assistance of information technology, millions of subjects are measured, values calcu-lated and processed. The amount of acquired data is enormous. This may also be a problem – there might be too much information. The challenge is to identify the fundamental information, and moreover, to utilise that information beneficially. Building information modelling could be seen as an integrative element. Throughout analyses, redefinition and simulations the building performance could be improved tremendously. The earlier the simulations are done, the more possibilities they have to influence the design itself. In addition, the costs of changes would be lower in the early design phase. The challenge is to manage the different simulations, and their relationships.
Moreover, the requirements for the assessment of buildings have increased. The assessment of building components or separate buildings is not enough. In addition to analysis of environ-mental aspects, the other aspects of sustainability; economical and social aspects, have to be considered. Moreover, the neighbourhoods, built environment, public transportations, and ser-vices, should be considered simultaneously. Currently, the focus is on developing assessment frameworks and tools for urban communities, such as BREEAM Communities (BREEAM, 2009), CASBEE for Urban Development (CASBEE, 2007) and LEED for Neigborhood Devel-opment(LEED, 2009).
REFERENCES
BREEAM Communities. 2009. SD5065B Technical Manual. BREEAM Communities Assessor Manual Development Planning Application Stage. BRE Global Ltd. UK.
CASBEE 2007. CASBEE for Urban Development, Technical manual 2007 Edition. Institute for Building Environment and Energy Conservation (IBEC). Japan.
Cole, RJ. 2005. Building Environmental Assessment Methods; Redefining Intensions and Roles. Building Research Information 33(5): 455-467.
Crawley, D. & Aho, I. 1999. Building Environmental Assessment Methods: applications and development trends. Building Research Information 27(4/5): 300-308.
CRISP. 2004. A European Thematic Network on Construction and City Related Indicators. Available: http://crisp.cstb.fr/ . Accessed May 2010.
Ding, G.K.C. 2009. Sustainable construction – The role of environmental assessment tools. Journal of Environmental Management 86(3): 451-464.
Eastman, C., Teicholz, P., Sacks, R. & Liston, K. 2008. BIM Handbook, a guide to building information modeling for owners, managers, designers, and contractors. John Wiley & Sons, Inc., USA.
Grace, M. 2000. Building criteria and indicators used in environmental assessment of buildings. Proceed-ings of Sustainable Building 2000. 22-25 Oct, 200o. the Netherlands.
Haapio, A. 2008. Environmental assessment of buildings. Doctoral dissertation. Helsinki University of Technology. [available] http://lib.tkk.fi/Diss/2008/isbn9789512295043/
Haapio, A. & Viitaniemi, P. 2007. Building criteria and indicators used in environmental assessment of buildings. Proceedings of CIB World Building Congress, 2007, Construction for Development. 14-17 May, 2007. South Africa.
Haapio, A. & Viitaniemi, P. 2008a. A Critical Review of Building Environmental Assessment Tools. En-vironmental Impact Assessment Review 28(7): 469-482.
Haapio, A. & Viitaniemi, P. 2008b. Environmental effect of structural solutions and building materials to a building. Environmental Impact Assessment Review 28(8): 587-600.
Haapio, A. & Viitaniemi, P. 2008c. Service life of a building in environmental assessment of buildings. Proceedings of 11
th DBMC International Conference on Durability of Building Materials and Com-
ponents. 11-14 May, 2008. Turkey. Häkkinen, T. & Wirtanen, L. 2006. Environmental and life cycle assessment of the Finnish, Forest Re-
search Institute’s (Metla) research centre in Joensuu. VTT Research Notes 2342. (In Finnish) Avail-able: http://www.vtt.fi/inf/pdf/tiedotteet/2006/T2342.pdf Accessed Oct 2009.
IEA Annex 31. 2001. Energy related environmental impact of buildings. Available: http://www.iisbe.org/annex31/index.html Accessed May 2010.
ISO, International Organization for Standardisation. 2000. Buildings and Constructed assets – Service life planning – Part 1: General principles. ISO 15686-1:2000(E).
Khasreen, M.M., Banfill, P.F.G. & Menzies, G.F. 2009. Life-cycle assessment and the environmental im-pact of buildings; a review. Sustainability 1:674-701. Available: http://www.mdpi.com/2071-1050/1/3/674
23
Kohler, N. & Moffatt, S.2003. Life-cycle analysis of the built environment. UNEP Industry and Environ-ment 26(2/3): 17-21.
Krygiel, E. & Nies, B. 2008. Green BIM: successful sustainable design with building information model-ing, Wiley Publishing, Inc., USA.
LEED. 2009. LEED for Neighborhood Development. The U.S. Green Building Council, Inc. USA. Lemer, A.C. 1996. Infrastructure obsolescence and design service life. Journal of Infrastructure Systems
2(4):153-161. Lützkendorf, T. & Lorenz, D.P. 2006.Using an integrated performance approach in building assessment
tools. Building Research & Information 34(4): 334-56. Reijnders, L. & van Roekel, A. 1999. Comprehensive and Adequacy of Tools for the Environmental Im-
provement of Buildings. Journal of Cleaner Production 7(3): 221-225. Smith, D. 2007. An introduction to Building Information Modeling (BIM). Journal of Building Informa-
tion Modelling Fall; 12-14. Available: http://www.wbdg.org/pdfs/jbim_fall07.pdf. Thoo, S. 2008. Interoperability and Sustainable Design. AECbytes Featur 14
th Aug. Available:
http://www.aecbytes.com/feature/2008/Interoperability_SustainableDesign.html. Trusty, W.B. & Meil, J.K 1999. Building life cycle assessment: residential case study. Proceedings of
Mainstreaming Green: Sustainable Design for Buildings and Communities. 14-17 Oct, 1999. USA. Trusty, W.B. & Meil, J.K 2002. Introducing ATHENATM v.2.0: an LCA based decision support tool for
assessing the environmental impact of the built environment. Proceedings of eSims 2002, the Cana-dian conference on building energy simulation. 2002. Canada.
24
1 INTRODUCTION
In the construction and real estate sector, the sustainability issues are related to those with global features but as well to those with local and sectorial features. The sector has a great influence on economies and societies, and thus it is linked in global environmental sustainability indexes, like e.g. the ESI scores by Universities of Yale and Columbia that benchmarks the ability of na-tions to protect the environment worldwide (2005). The Agenda 21 on sustainable construction (1999) emphasized the significance to proceed with related non-technical issues, when im-provement strategies are to be successfully implemented. The fundamental differences between the dimensions have been described by Ronchi, Federico and Musmeci (2002) in a way that ―the quality of life is recognised as the non-physical and non-ecosystem counterpart of any suitable model of sustainable development‖. A building project can be regarded as sustainable only when all the various dimensions of sus-tainability –environmental, economic, social and cultural ones - are dealt with. The various sus-tainability issues are interwoven, and the interaction of a building and its surroundings is also important. They are in common those which cope with reducing use of non-renewable materials
Building Sustainability Assessment: System SBToolPT®
Ricardo Mateus University of Minho, Guimarães, Portugal [email protected]
Luis Bragança University of Minho, Guimarães, Portugal braganç[email protected]
ABSTRACT: The multidimensional concept of sustainable building is often related solely to
environmental indicators although the social, economic and cultural indicators are of substantial
importance. The weight of various indicators depends on the context of a building project and
further, interpretation of the assessment results depends on the sustainability strategies of the
society. The recent Portuguese research on the applicability of assessment methods developed
abroad shows, that modifications are necessary and local factors are crucial for each indicator as
such but also for their relative meaning. Assessment of sustainability of buildings involves sev-
eral interrelated and partly contradictory aspects. The different methods give insights to basics
and cause-consequences instead of clear-cut results. For this reason, the use of assessment re-
sults (scores, indexes and profiles) in decision-making presupposes transparency and clarity.
Based on the case studies of building sustainability assessment using various tools, the envi-
ronmental indicators were shown to be often of lesser importance than the other, soft ones.
This paper aims to present a novel approach to develop building sustainability assessment
and rating and contributes to the evolution of generic methodology and international under-
standing by introducing an approach to take the different dimensions of sustainability into ac-
count. This methodology is based in the adaptation of the international Sustainable Building
Tool (SBTool) to the Portuguese’s environmental, societal and economy contexts. The scope of
the methodology that is going to be presented (SBToolPT®
) is to assess the sustainability of ex-
isting, new and renovated buildings in the urban areas and especially in the Portuguese context.
This new methodology is intended to foster the awareness of the Portuguese construction mar-
ket stakeholders and to allow adequate policy implementation on sustainable construction.
25

and water as well as production of emissions, waste and pollutants. The following goals can be found in several agendas: optimization of site potential, preservation of regional and cultural identity, minimization of energy consumption, protection and conservation of water resources, use of environmentally friendly materials and products, healthy and convenient indoor climate and optimized operational and maintenance practices.
A variety of sustainability assessment tools is available on the construction market, and they are widely used as a basis for environmental product declarations. The majority of tools for building level assessment has then been developed by summing up results of building materials and components to a building. There are LCA-based tools available that are especially devel-oped to address the building as whole, like e.g. Eco-Quantum (Netherlands), EcoEffect (Swe-den), ENVEST (U.K.), BEES (U.S.), ATHENA (Canada) and LCA House (Finland). A compar-ison of contextual and methodological aspects of tools has been made e.g. by Forsberg and Malmborg (Forsberg, 2004).
Three major building rating and certification systems are providing the basis for the other ap-plications throughout the world. They are Building Research Establishment Environmental As-sessment Method BREEAM, developed in U.K.; Sustainable Building Challenge Framework SBTool, developed by the collaborative work of the International Initiative for a Sustainable Built Environment (iiSBE); and Leadership in Energy and Environmental design LEED, devel-oped in U.S.A.
In the Sustainable Building Tool (SBTool) the approach is to weight different criteria, consi-dering weighting factors that are fixed at national level. Each ―score‖ results from the compari-son between the studied building and national reference. This scheme allows an international comparison of buildings from different countries. Other tools, like for instance BREEAM and LEED, are based upon credits. The maximum number of credits available for each indicator it is related to its weight in the overall score, that is expressed by a rating (e.g. from Pass to Excel-lent in BREEAM).
This paper presents a novel approach to develop building sustainability assessment and rat-ing. The main objective of a systematic methodology is to support building design that achieves the most appropriate balance between the different sustainability dimensions, and that is at the same time practical, transparent and flexible enough to be easily adapted to different kinds of buildings and to technology. This new approach, Sustainable Building Tool for Portugal (SBTool
PT®), is adapted to the Portuguese construction context, and as first step is developed to
support the sustainable design and the sustainability assessment of new and renovated residen-tial buildings SBTool
PT® – H).
2 SCOPE AND OBJECTIVE OF THIS NEW METHODOLOGY
The scope of the research work performed in the iiSBE Portugal, was to develop and propose a generic methodology to assess the sustainability of existing, new and renovated buildings in the urban areas and especially in the Portuguese context. It is intended to foster the awareness of the Portuguese construction market stakeholders and to allow adequate policy implementation on sustainable construction.
As a first step, a methodology to assess the sustainability of residential buildings has been developed. Reasoning for this priority is due to the fact that most of the impacts related to the construction sector are related to the housing sector. The acronym of the methodology is SBTool
PT® - H (Sustainable Building Tool for Sustainable Housing in Portugal).
The following priorities were approached in the development of the SBTool
PT®:
To develop a list of parameters wide enough to be meaningful and to comprise the most relevant building impacts and at the same time limited enough to be practical; To develop a building-level assessment method, based upon the state-of-the-art of methodologies and considering ongoing standardization; To be balanced between all different dimensions of sustainable development (envi-ronment, societal and economics); To limit or exclude the subjective and/or qualitative criteria that is hard to validate (e.g. aesthetics and technical innovation);
26
To improved reliability through the use of accepted LCA methods for environmental performance; To have an assessment output and certification label that is easy for building users to interpret and understand but is also one which clients and designers can work with.
As a result of the research work, the SBToolPT®
is based in the SBTool approach and is har-monized with the CEN/TC350 draft standards ―Sustainability of Construction Works – Assess-ment of Environmental Performance of Buildings‖ (CEN, 2009). This methodology allows fu-ture rating and labelling of buildings, in analogy with the Energy Performance of Buildings Directive.
Although the interaction between a building and its surroundings is of importance for sustai-nability (e.g. energy performance, social indicators) it was decided to exclude this aspect. The main reason was that in an urban environment, the decisions concerning the surroundings and networks of a site are mostly made by the local and regional authorities. However, some publi-cations have concluded that restricted scales of study (corresponding for a single building for example) are too limited to take into account sustainable development objectives correctly (Bus-semey-Buhe, 1997).
3 FRAMEWORK OF THE SBToolPT®
3.1 Categories, Indicators and Parameters
The Portuguese version of SBTool - SBToolPT®
- was developed by the Portuguese chapter of iiSBE, with the support of University of Minho and the company Ecochoice. In this methodolo-gy all the three dimensions of the sustainable development are considered and the final rate of a building depends on the comparison of its performance with two benchmarks: conventional practice and best practice. This methodology has a specific module for each type of building and in this paper the module to assess residential buildings (SBTool
PT® – H) is presented.
The physical boundary of this methodology includes the building, its foundations and the external works in the building site. Issues as the urban impact in the surroundings, the construc-tion of communication, energy and transport networks are excluded. Regarding the time boun-dary, it includes the whole life cycle, from cradle to grave.
Table 1 lists the categories (global indicators) and indicators that are used in the methodology to access residential buildings. It has a total of nine sustainability categories (summarizes the building performance at the level of some key-sustainability aspects) and 25 sustainability indi-cators within the three sustainability dimensions.
The methodology is supported by an evaluation guide and its framework is structures in the following steps (Figure 1):
1 Quantification of performance of the building at the level of each indicator presented in a evaluation guide;
2 Normalization and aggregation of parameters; 3 Sustainable score calculation and global assessment. 4 In order to facilitate the interpretation of the results of this study the main steps of the
SBToolPT®
approach will be presented in the next sections.
3.2 Quantification of Parameters
The evaluation guide presents the methodologies that should be used in order to quantify the performance of the building at level of each sustainability indicator.
SBToolPT®
uses the same environmental categories that are declared in the Environmental Product Declarations. At the moment, there are limitations with this approach due to the small number of available EPD. Therefore, authors decided to develop a Life-cycle Assessment (LCA) database that covers many of the building technologies conventionally used in buildings. This database covers the most used building technologies for each building element (walls, floors, windows, doors, etc.) and it is built-in in the SBTool
PT® methodology. The database cov-
ers the parameters presented in Table 2. The values of the parameters are presented for two life-cycle stages: ―cradle to gate‖ and ―demolition/disposal‖ (Bragança, 2008).
27
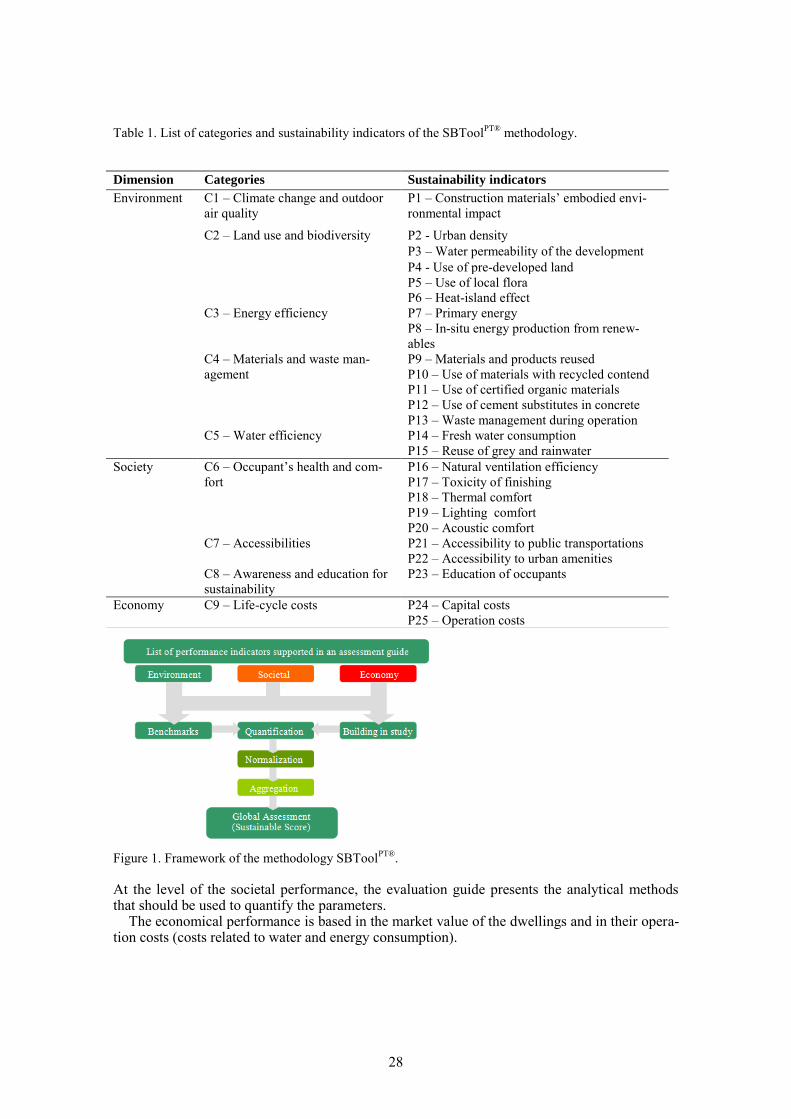
Table 1. List of categories and sustainability indicators of the SBToolPT®
methodology.
Figure 1. Framework of the methodology SBTool
PT®.
At the level of the societal performance, the evaluation guide presents the analytical methods that should be used to quantify the parameters.
The economical performance is based in the market value of the dwellings and in their opera-tion costs (costs related to water and energy consumption).
Dimension Categories Sustainability indicators
Environment C1 – Climate change and outdoor
air quality
P1 – Construction materials’ embodied envi-
ronmental impact
C2 – Land use and biodiversity P2 - Urban density
P3 – Water permeability of the development
P4 - Use of pre-developed land
P5 – Use of local flora
P6 – Heat-island effect
C3 – Energy efficiency P7 – Primary energy
P8 – In-situ energy production from renew-
ables
C4 – Materials and waste man-
agement
P9 – Materials and products reused
P10 – Use of materials with recycled contend
P11 – Use of certified organic materials
P12 – Use of cement substitutes in concrete
P13 – Waste management during operation
C5 – Water efficiency P14 – Fresh water consumption
P15 – Reuse of grey and rainwater
Society C6 – Occupant’s health and com-
fort
P16 – Natural ventilation efficiency
P17 – Toxicity of finishing
P18 – Thermal comfort
P19 – Lighting comfort
P20 – Acoustic comfort
C7 – Accessibilities P21 – Accessibility to public transportations
P22 – Accessibility to urban amenities
C8 – Awareness and education for
sustainability
P23 – Education of occupants
Economy C9 – Life-cycle costs P24 – Capital costs
P25 – Operation costs
28
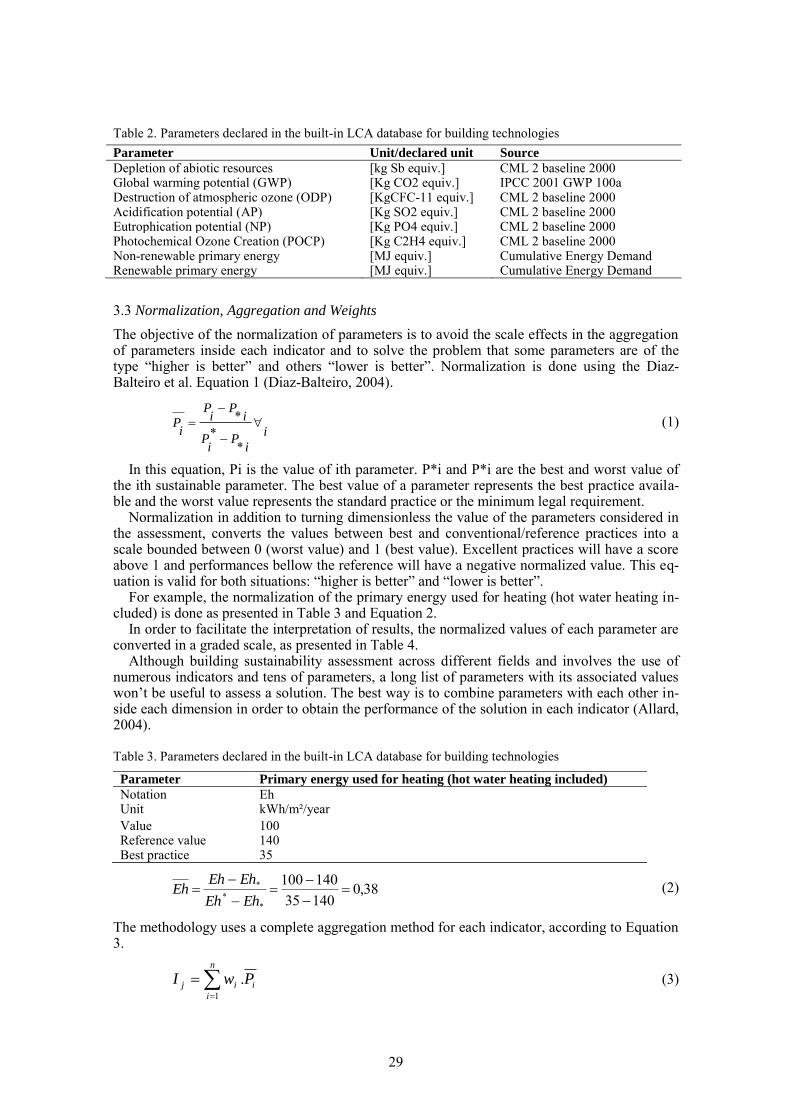
Table 2. Parameters declared in the built-in LCA database for building technologies
Parameter Unit/declared unit Source
Depletion of abiotic resources [kg Sb equiv.] CML 2 baseline 2000 Global warming potential (GWP) [Kg CO2 equiv.] IPCC 2001 GWP 100a Destruction of atmospheric ozone (ODP) [KgCFC-11 equiv.] CML 2 baseline 2000 Acidification potential (AP) [Kg SO2 equiv.] CML 2 baseline 2000 Eutrophication potential (NP) [Kg PO4 equiv.] CML 2 baseline 2000 Photochemical Ozone Creation (POCP) [Kg C2H4 equiv.] CML 2 baseline 2000 Non-renewable primary energy [MJ equiv.] Cumulative Energy Demand Renewable primary energy [MJ equiv.] Cumulative Energy Demand
3.3 Normalization, Aggregation and Weights
The objective of the normalization of parameters is to avoid the scale effects in the aggregation of parameters inside each indicator and to solve the problem that some parameters are of the type ―higher is better‖ and others ―lower is better‖. Normalization is done using the Diaz-Balteiro et al. Equation 1 (Diaz-Balteiro, 2004).
i
iP
iP
iP
iP
iP
**
* (1)
In this equation, Pi is the value of ith parameter. P*i and P*i are the best and worst value of the ith sustainable parameter. The best value of a parameter represents the best practice availa-ble and the worst value represents the standard practice or the minimum legal requirement.
Normalization in addition to turning dimensionless the value of the parameters considered in the assessment, converts the values between best and conventional/reference practices into a scale bounded between 0 (worst value) and 1 (best value). Excellent practices will have a score above 1 and performances bellow the reference will have a negative normalized value. This eq-uation is valid for both situations: ―higher is better‖ and ―lower is better‖.
For example, the normalization of the primary energy used for heating (hot water heating in-cluded) is done as presented in Table 3 and Equation 2.
In order to facilitate the interpretation of results, the normalized values of each parameter are converted in a graded scale, as presented in Table 4.
Although building sustainability assessment across different fields and involves the use of numerous indicators and tens of parameters, a long list of parameters with its associated values won’t be useful to assess a solution. The best way is to combine parameters with each other in-side each dimension in order to obtain the performance of the solution in each indicator (Allard, 2004).
Table 3. Parameters declared in the built-in LCA database for building technologies
38,014035
140100
*
*
*
EhEh
EhEhEh (2)
The methodology uses a complete aggregation method for each indicator, according to Equation 3.
i
n
i
ij PwI .1
(3)
Parameter Primary energy used for heating (hot water heating included)
Notation Eh Unit kWh/m²/year
Value 100 Reference value 140 Best practice 35
29
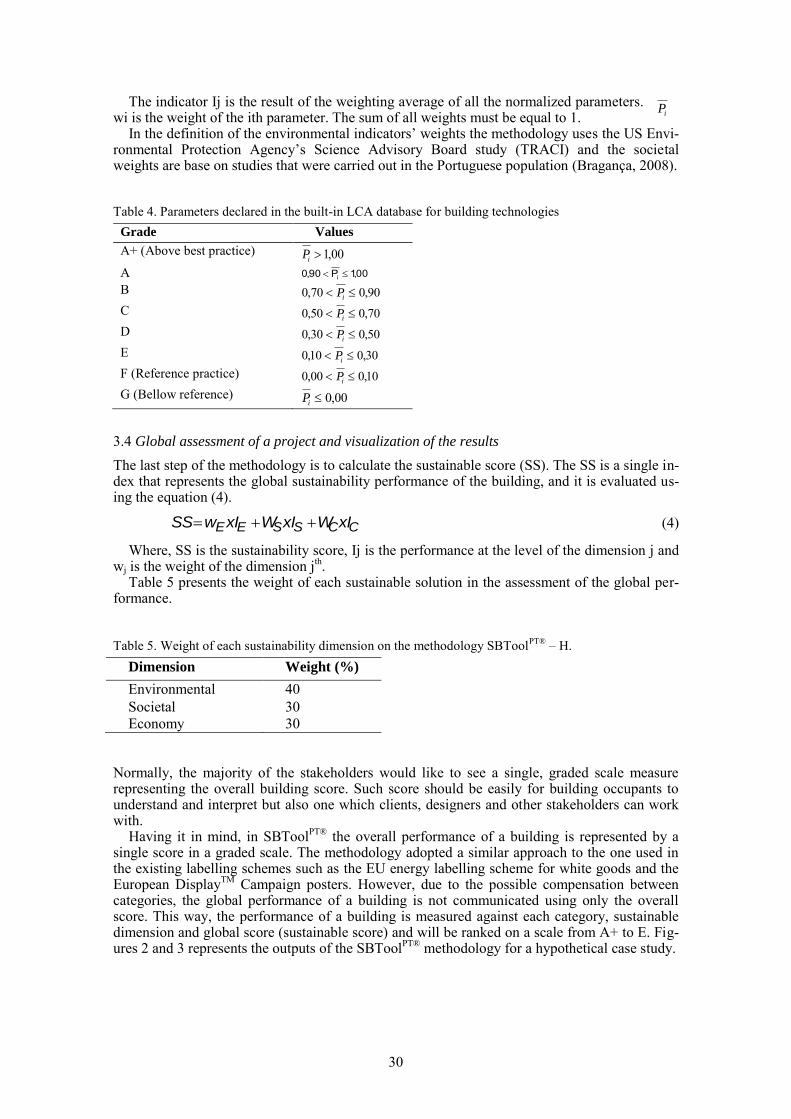
The indicator Ij is the result of the weighting average of all the normalized parameters. wi is the weight of the ith parameter. The sum of all weights must be equal to 1.
In the definition of the environmental indicators’ weights the methodology uses the US Envi-ronmental Protection Agency’s Science Advisory Board study (TRACI) and the societal weights are base on studies that were carried out in the Portuguese population (Bragança, 2008).
Table 4. Parameters declared in the built-in LCA database for building technologies
Grade Values
A+ (Above best practice) 00,1iP
A 00,1P90,0 i
B 90,070,0 iP
C 70,050,0 iP
D 50,030,0 iP
E 30,010,0 iP
F (Reference practice) 10,000,0 iP
G (Bellow reference) 00,0iP
3.4 Global assessment of a project and visualization of the results
The last step of the methodology is to calculate the sustainable score (SS). The SS is a single in-dex that represents the global sustainability performance of the building, and it is evaluated us-ing the equation (4).
CCSSEE xIWxIWxIwSS (4)
Where, SS is the sustainability score, Ij is the performance at the level of the dimension j and wj is the weight of the dimension j
th.
Table 5 presents the weight of each sustainable solution in the assessment of the global per-formance.
Table 5. Weight of each sustainability dimension on the methodology SBToolPT®
– H.
Dimension Weight (%)
Environmental 40
Societal 30
Economy 30
Normally, the majority of the stakeholders would like to see a single, graded scale measure representing the overall building score. Such score should be easily for building occupants to understand and interpret but also one which clients, designers and other stakeholders can work with.
Having it in mind, in SBToolPT®
the overall performance of a building is represented by a single score in a graded scale. The methodology adopted a similar approach to the one used in the existing labelling schemes such as the EU energy labelling scheme for white goods and the European Display
TM Campaign posters. However, due to the possible compensation between
categories, the global performance of a building is not communicated using only the overall score. This way, the performance of a building is measured against each category, sustainable dimension and global score (sustainable score) and will be ranked on a scale from A+ to E. Fig-ures 2 and 3 represents the outputs of the SBTool
PT® methodology for a hypothetical case study.
iP
30
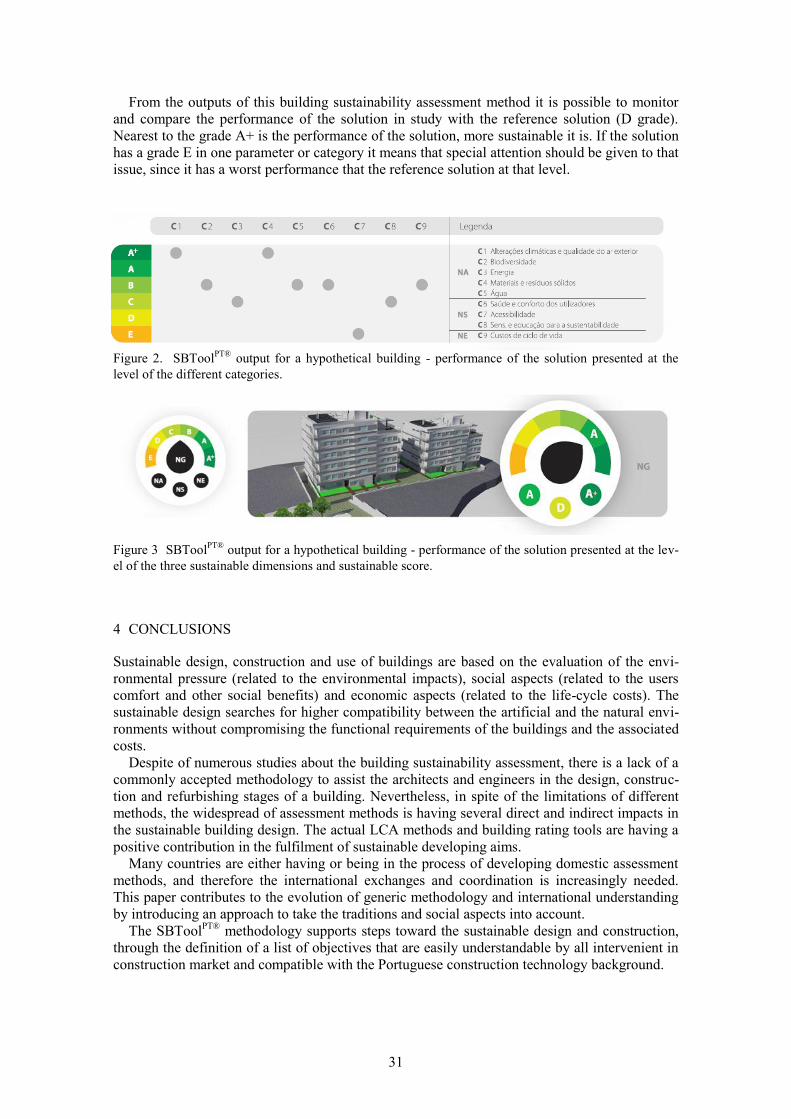
From the outputs of this building sustainability assessment method it is possible to monitor
and compare the performance of the solution in study with the reference solution (D grade).
Nearest to the grade A+ is the performance of the solution, more sustainable it is. If the solution
has a grade E in one parameter or category it means that special attention should be given to that
issue, since it has a worst performance that the reference solution at that level.
Figure 2. SBToolPT®
output for a hypothetical building - performance of the solution presented at the
level of the different categories.
Figure 3 SBToolPT®
output for a hypothetical building - performance of the solution presented at the lev-
el of the three sustainable dimensions and sustainable score.
4 CONCLUSIONS
Sustainable design, construction and use of buildings are based on the evaluation of the envi-
ronmental pressure (related to the environmental impacts), social aspects (related to the users
comfort and other social benefits) and economic aspects (related to the life-cycle costs). The
sustainable design searches for higher compatibility between the artificial and the natural envi-
ronments without compromising the functional requirements of the buildings and the associated
costs.
Despite of numerous studies about the building sustainability assessment, there is a lack of a
commonly accepted methodology to assist the architects and engineers in the design, construc-
tion and refurbishing stages of a building. Nevertheless, in spite of the limitations of different
methods, the widespread of assessment methods is having several direct and indirect impacts in
the sustainable building design. The actual LCA methods and building rating tools are having a
positive contribution in the fulfilment of sustainable developing aims.
Many countries are either having or being in the process of developing domestic assessment
methods, and therefore the international exchanges and coordination is increasingly needed.
This paper contributes to the evolution of generic methodology and international understanding
by introducing an approach to take the traditions and social aspects into account.
The SBToolPT®
methodology supports steps toward the sustainable design and construction,
through the definition of a list of objectives that are easily understandable by all intervenient in
construction market and compatible with the Portuguese construction technology background.
31
REFERENCES
Kibert, Charles J. 2005. Sustainable construction: green building design and delivery, John Wiley & Sons,
New Jersey, United States of America.
Forsberg A. & Malmborg von F. 2004. Tools for environmental assessment of the built environment,
Building and Environment 39(2004) Issue 2, pages 223-228.
prEN 15643-2. Sustainability of Construction Works — Integrated assessment of building performance
— part 2: framework for the assessment of environmental performance. CEN/TC 350/ Task Group
“framework” n 049. European Committee of Standardization (CEN).
Bussemey-Buhe C. 1997. Dévelopment d’une méthode de conception environmental des bâtiments pre-
nant en compte l’environnement de proximité. Ph. D. Thesis, Université de Savoie, Savoie, France.
Bragança, L.; Mateus, R. 2008. New Approach to Environmental Life-Cyle Analysis in Sustainability
Rating Systems. Proceedings of the international conference “CINCOS’08: congresso de inovação na
construção sustentável”. Curia, Portugal: October, ISBN 978-989-95978-0-8. p. 331-345.
Diaz-Balteiro L. & Romero C. 2004. In search of a natural systems sustainability index, Ecological Eco-
nomics, 49, pp 401-405.
Allard, F., Chéqui, F., Wurtz, E. & Mora, L. 2004. A Methodology To Assess The Sustainability Of Re-
habilitations Projects In Urban Buildings, LEPTAB, University Of La Rochelle, France.
32
ABSTRACT: With the climate change we have started to interrogate our way of living. But do we really need to do this? Stern report answered this question and according to Stern report :
• Climate change threatens the basic elements of life for people around the world —
access to water, food production, health, and use of land and the environment.
• The impacts of climate change are not evenly distributed — the poorest countries and
people will suffer earliest and most. And if and when the damages appear it will be too
late to reverse the process. Thus we are forced to look a long way ahead.
• Emissions have been, and continue to be, driven by economic growth; yet stabilization
of greenhouse-gas concentrations in the atmosphere is consistent with continued
growth.
• The transition to a low-carbon energy economy will bring challenges for competitive-
ness but also opportunities for growth. Policies to support the development of a range
of low-carbon and high-efficiency technologies are required urgently.
What is the role of building sector? It is frequently said that the building sector is responsi-ble for anywhere from 30% to 40% of global resource consumption and energy use; however, this could be increased up to 60% if we include building-related transport
50 % usage for energy
40 % usage for raw materials
50% usage for harmful gases
80% loss of agriculture areas
50% usage of clean water are being used in buildings. (Ayaz,2004)
The aim of this research is preparing a green building design guideline in order to minimize the effect of construction sector. For preparing this guideline well known assessment tools’ evaluation methods has been investigated.
1.0 INTRODUCTION
A green building is a structure that is designed, built, renovated, operated, or reused in an eco-
logical and resource-efficient manner. (Yudelson,2007)
'Sustainability' is becoming a central concern for us all. It is a concern that has grown out of wider recognition that rising populations and economic development are threatening a progres-sive degradation of the earth's resources.
Green Building Design Guideline
İ.Kahraman Yasar University, İzmir, Turkey [email protected]
33
The Construction, maintenance and use of buildings impacts substantially on our environ-
ment and is currently contributing significantly to irreversible changes in the world's climate, atmosphere and ecosystem.
Energy is consumed when: • Extracting raw materials. • Producing materials (Manufacturing process). • Transporting materials. • Transporting workforce. • Building structures. • Using and powering structures. • Maintaining structures and demolishing structures.(Sobek,2005)
Alternative energy resources may help us for energy saving; such as PV panels, wind energy.
Also the heat pumps are useful for saving energy
2. PRINCIPLES FOR A GREEN BUILDING 2.1 Planning and site selection principles
1. Select a site nearby the public transportation.
2. Select a site nearby the commercial, cultural facilities and recreation areas.
3. Try to encourage walking or bicycle use
4. Try to encourage alternative transportation ( low emitting and fuel efficient cars) .
For example there can be more parking lots for vehicles mentioned above
5. While sitting the building on the selected site north, south, east, west directions and
also the main wind direction must be considered ( by the help of daylight usage you can
reduce electrical energy demand)
6. Protect and retain existing landscaping and natural features. Select plants that have
low water and pesticide needs, and generate minimum plant trimmings.(Larsson, 2009) 2.2. Energy efficiency principles
1. Passive design strategies can dramatically affect building energy performance. These
measures include building shape and orientation, passive solar design, and the use of
natural lighting.
2. Develop strategies to provide natural lighting.
3. Use a properly sized and energy-efficient heating/cooling system in conjunction with
a thermally efficient building shell. Maximize light colors for roofing and wall finish
materials, install high R-value wall and ceiling insulation, and use minimal glass on
east and west exposures.
4. Minimize the electric loads from lighting, equipment, and appliances.
5. Install high-efficiency lighting systems with advanced lighting controls. Include mo-
tion sensors tied to dimmable lighting controls. Task lighting reduces general overhead
light levels.
6. Consider alternative energy sources, such as photovoltaics and fuel cells, that are
now available in new products and applications. Renewable energy sources provide a
great symbol of emerging technologies for the future.
7. Computer modeling is an extremely useful tool in optimizing design of electrical and
mechanical systems and the building shell.( IWMB,2000)
34
2.2.1. Solar shading
Solar shading is an effective energy saver all year round. In summer it can cut the amount of
heat entering a building and in winter it can decrease heat loss. In both cases, the need for addi-
tional climate control measures is substantially reduced.
In winter, intelligent solar blinds will remain open to let free solar energy into the building
during the day, reducing energy requirements for heating. Once the sun has set, these will close,
reducing heat loss and thus continuing to save on the energy required for heating.
During the day in summer, solar shading will help to keep excessive heat out of the building,
which can dramatically cut the need for air conditioning. In the evening, opening the windows
and the solar shading allows the building to flush any heat build-up, again reducing the need for
air conditioning. ( RICS 2003)
2.2.2 Innovative day-lighting systems
Light shelves:
It is possible by means of comparatively inexpensive building construction, to provide
light shelves.
The light above reflected to the ceiling to redistribute daylight further into the room. It
must be recognized that light shelves do not increase the daylight factors in a room, but
they alter the distribution, assisting in getting light further towards the back of the room
so that uniformity is improved. Light shelves are relatively cheap to install, and are less
subject to damage than those used externally, but do require cleaning on a regular basis.
Light pipes:
Of all the methods of innovative day lighting, the light pipe has had the most universal applica-
tion. It is basically a method of roof lighting, which by means of association with reflective
tubes, directs the light to a lower level. It can be employed to direct light through several floors,
this has the disadvantage of locating the pipes through the upper floors, taking up useful floor
space. Light-pipe installations can be associated with a means of ventilation and also with
sources of artificial light which take over after dark or when the daylight outside is insufficient,
using a light control system. (Littlefair,1994) 2.2.3. Triple zero concept Triple Zero itself takes 3 messages, namely
1. Zero Energy Building
The building requires no (ZERO) energy. The energy generated from regenerative sources on
and in the building or the immediate piece of property upon which the building stands is at least
equal to the entire primary energy requirements of the building for heating, cooling, hot water,
auxiliary power and power for all typical domestic applications.
2. Zero Emission Building
The building produces no (ZERO) CO2 emissions. The reference value is the total primary
energy demand, which is then converted to CO2 emissions. No burning processes are permitted
in the building or on the property.
3. Zero Waste Building
No waste (ZERO) is produced when the building is being converted or deconstructed. At the
end of their life cycle all building elements can be fully recycled without any components need-
35
ing to be burnt or sent to a disposal site. The plot of land can be returned to nature without any
fear of contamination or residual waste.( Sobek.2005)
2.3 Material selection principles Around 50% of all global resources go into the construction industry, with a specific example being that 70% of all timber is used for building.( Hyett 2001) It is therefore very important that a sustainable approach to choosing and using materials is adopted, in order that the indus-try can meet the target of, '...providing for people of today and not endangering the generations of tomorrow...'. The environmental and economic benefits of sustainability are inherently linked when consider-ing building materials, due to the long-term financial advantages of recycling, using recycled products and sourcing heavy materials locally. The 20th century has seen remarkable developments in material technology and the two dozen materials which were used by Victorian forebears has been replaced by anything between 40000 and 80000 different materials.(Asby,2003) Whereas two dozen materials of 19th century would be used to meet all known applications builders and engineers have to be wildering array to choose from. In general construction does not use high –technology materials, but a larger range of materials are now available than ever before. (Gmoriconi,2004). For example UK construction consumes something over 400 million tonnes of material per annum, and the total value of UK construction materials is 20 billion pounds. This includes new built and repairs and refurbishment. (Gmoriconi,2004) Concrete is one of the most widely used construction materials in the world. However, the pro-duction of porland cement, an essencitial constituent of concrete, leads to the release of signifi-cant amount of CO2, a green house gas ; one ton of porland cement clinker production is said to creates approximately one ton of CO2 and other green house gases. (GHGs) ( Sturges,2006) A variety of decision-aiding tools exist, which can help to evaluate the environmental cost of a manufactured product in the context of social and economic benefit. These include Life-Cycle Assessment, Eco-Labelling and Embodied Energy Audits, all of which could help when choos-ing materials and suppliers to assess the balance between short-term costs and long-term envi-ronmental, social and financial benefits.
Materials Efficiency
Select sustainable construction materials and products by evaluating several charac-
teristics such as reused and recycled content, zero or low off-gassing of harmful air
emissions, zero or low toxicity, sustainably harvested materials, high recyclability, du-
rability, longevity, and local production.
Use dimensional planning and other material efficiency strategies. These strategies
reduce the amount of building materials needed and cut construction costs
Reuse and recycle construction and demolition materials.
Require plans for managing materials through deconstruction, demolition, and con-
struction.
Design with adequate space to facilitate recycling collection and to incorporate a sol-
id waste management program that prevents waste generation.( Davoudi 2001)
2.4. Water efficiency principles
Design for dual plumbing to use recycled water for toilet flushing or a gray water
system that recovers rainwater or other nonpotable water for site irrigation.
Minimize wastewater by using ultra low-flush toilets, low-flow shower heads, and
other water-conserving fixtures.
Use recirculating systems for centralized hot water distribution.
Install point-of-use water heating systems for more distant locations.
36
Use state-of-the-art irrigation controllers and self-closing nozzles on hoses.
(IWMB,2003) Water use like energy use is easily quantifiable. Unfortunately, the cost applied to the use of water is often far below the true value of a liter. However, similar strategies of conservation apply. The first step is to reduce overall water usage. This can be achieved by stopping and preventing leaks in piping, installing or converting to water conserving fixtures, insulating hot water pipes, recycling grey water, collecting rainwater, and installing water meters.
2.5 Natural ventilation principles
With an increased awareness of the cost and environmental impacts of energy use, natural ven-tilation has become an increasingly attractive method for reducing energy use. Natural ventilation systems rely on pressure differences to move fresh air through buildings. The amount of ventilation will depend critically on the size and placement of openings in the building. It is useful to think of a natural ventilation system as a circuit, with equal considera-tion given to supply and exhaust ( Stefan,2001) It is possible to design a building in such a way that the wind sucks the stale air out and draws fresh air in, using the difference in air pressure at different heights to create a flow of air. When this is done as part of an overall energy strategy for a building, it can help cut the electricity needed to keep the building running. 2.6 Waste management principles "Sustainable waste management means using material resources efficiently, to cut down on the amount of waste we produce. And where waste is produced, dealing with it in a way that active-ly contributes to the economic, social and environmental goals of sustainable development."
(ESPON,2007)
The Construction Industry Research and Information Association (CIRIA) have reported that an estimated 72.5 million tonnes of construction and demolition waste are produced annually. This is around 17.5 % of the total waste produced in the U.K. Furthermore, 13 million tonnes of construction materials are delivered to sites in the U.K. and thrown away unused every year. This is not sustainable. (Davoudi,2001)
3.0 THE ROLE OF LABELING SYSTEMS The improvement of energy efficiency can sensitively prevent the waste of energy and operate for the respect of the goals established in the protocol of Kyoto on climatic changes. The construction sector represents a strategically important sector providing building and infra-structure on which all sectors of the economy depend. Performance ratings and labeling are important because by the help of these results we can have an opinion about the effects of the building to the environment. By the help of these results people can take the advantage of correcting the results by having insulations, etc.; or can im-prove the results for example by using solar energy. These labeling systems are also affecting the market there for it is becoming a must for a fi-nancer to construct the building in a sustainable way in order to sell or rent it. This kind of atti-tude will be helpful for the planet we live in. Performance assessment systems, such as LEED, BREEAM, CASBEE and others can provide performance ratings and labels. Most rating systems are developed within a specific region and contain assumptions about the relative importance of issues and appropriate performance benchmarks. And labels are only meaningful when the performance assessment has been certified by a reputable third par-ty.(Larsson,2009)
37
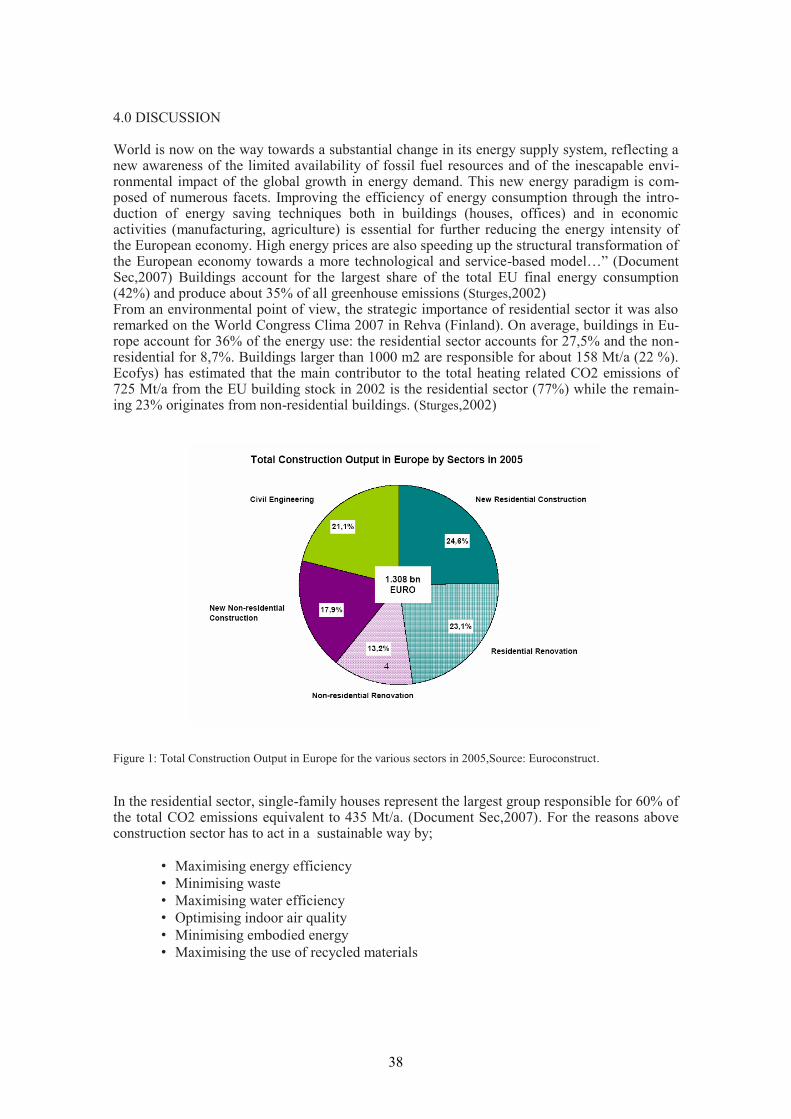
4.0 DISCUSSION World is now on the way towards a substantial change in its energy supply system, reflecting a new awareness of the limited availability of fossil fuel resources and of the inescapable envi-ronmental impact of the global growth in energy demand. This new energy paradigm is com-posed of numerous facets. Improving the efficiency of energy consumption through the intro-duction of energy saving techniques both in buildings (houses, offices) and in economic activities (manufacturing, agriculture) is essential for further reducing the energy intensity of the European economy. High energy prices are also speeding up the structural transformation of the European economy towards a more technological and service-based model…‖ (Document Sec,2007) Buildings account for the largest share of the total EU final energy consumption (42%) and produce about 35% of all greenhouse emissions (Sturges,2002)
From an environmental point of view, the strategic importance of residential sector it was also remarked on the World Congress Clima 2007 in Rehva (Finland). On average, buildings in Eu-rope account for 36% of the energy use: the residential sector accounts for 27,5% and the non-residential for 8,7%. Buildings larger than 1000 m2 are responsible for about 158 Mt/a (22 %). Ecofys) has estimated that the main contributor to the total heating related CO2 emissions of 725 Mt/a from the EU building stock in 2002 is the residential sector (77%) while the remain-ing 23% originates from non-residential buildings. (Sturges,2002)
Figure 1: Total Construction Output in Europe for the various sectors in 2005,Source: Euroconstruct.
In the residential sector, single-family houses represent the largest group responsible for 60% of the total CO2 emissions equivalent to 435 Mt/a. (Document Sec,2007). For the reasons above construction sector has to act in a sustainable way by;
• Maximising energy efficiency
• Minimising waste
• Maximising water efficiency
• Optimising indoor air quality
• Minimising embodied energy
• Maximising the use of recycled materials
38
REFERENCES: Ayaz ,E. Mimarist periodical,2002/3
Ashby, M. F. , ―Materials and the Environment: Eco-Informed Material Choice‖, 2003
Davoudi,Simon,2001,Plannnning for sustainable waste management
Document SEC (2007) 1730 – Commission of the European Communities. www.eurofound.eu.int).
Edwards B and Hyett P , ―Rough Guide to Sustainability‖ , London: RIBA Companies Ltd, 2001.
ESPON Project, 2007). APAT, Study for the development of European Ecolabel criteria for buildings,
Product group definition August 2008
IWMB publication , Publication # 400-99-014 ,April 2000
Lechtenböhmer Stefan & Thomas, Stefan,2001, Wuppertal Institute for Climate, Environment, Energy,
Brussels
Natural ventilation ( allard, Francis,Natural Ventilation in buildings- A design handbook,2003,Paris
Ludwig,Art, Create an oasis with grey water, 2006, Oasis Design,
Nils Larsson (Personal contact)
P.J. Littlefair, M.E. Aizlewood and A.B. Birtles, The performance of innovative daylighting systems , Re-
newable Energy ,Volume 5, Issues 5-8, August 1994, Pages 920-934
RICS, Design for Improved Solar Shading Control,2003,London
Sobek, Werner 2005, The art of Engineering,Berlin,Birkhauser.
Sturges, John, ―Towards sustainable construction materials for the new millennium‖,2002, Leeds Metro-
politan University
Yudelson,Jerry, ―Green Building Through Integrated Design‖,2006,New Jersey
Waste Management: A Reference Handbook (Contemporary World Issues Series) by Jacqueline Vaughn
(Hardcover - 15 Feb 2009
http://www.rics.org/site/scripts/documents_info.aspx?categoryID=236&documentID=477 T.R Naik,
Gmoriconi , visited at 12nd of June 2010
http://www.water.ca.gov/wateruseefficiency/ visited at 16th
of June 2010
www.actionenergy.org.uk, visited at 14th
of August 2008
www.wernersobek.de, visited at 23rd
of May 2009
39

40

COST Action C25
International Symposium
Sustainable Construction: A Life Cycle Approach in Engineering
Chapter 2
Eco-efficiency
41

42
1 INTRODUCTION
Having been used for centuries as a traditional construction material, wood is currently gaining technological importance. In an interdisciplinary research project, carrying out by research insti-tutes of Technical University Dresden from the fields of steel and timber structures, architecture and construction as well as from material science, a new composite building material, fiber rein-forced wood profiles are designing. Additionally the ecological and economic performance is examined, using the conceptional framework of environmental Life Cycle Costing (eLCC) as described in (Hunkeler et al. 2008).
At first glance using wood as a renewable resource appears to be sustainable material and thus one could expect a good ecological performance. But due to its different technological drawbacks like low strength spectrum perpendicular to grain or low durability at outdoor cli-mates other construction materials like steel or concrete are often preferred as they surpass these properties of wood (Haller 2007). From an ecological point of view it is of interest, how differ-ent additional materials and processes, that make wood more competitive to steel or concrete, influence the environmental performance of such fibre reinforced timber structures.
For some technological background the production phase of the reinforced wood profiles is shortly described. The outcomes of a life cycle assessment based on the ISO 14044 are widely discussed for the fibre reinforced wood profile. Additionally the economic aspects covered by environmental life cycle costing are shortly discussed. Finally, comparison of columns made of steel and concrete with the similar structural performance at the room temperature as the column made of fibre reinforced wood is made.
Structural, economic and environmental performance of fibre reinforced wood profiles vs. solutions made of steel and concrete
C. Manthey & E. Guenther, TU Dresden, Chair of Business Administration, especially Environmental Management and Accounting
A. Heiduschke & P. Haller, TU Dresden, Institute for Steel and Timber Structures
T. Heistermann & M. Veljkovic Luleå University of Technology, Division of Structural Engineering – Steel Structures
P. Hájek Czech Technical University in Prague, Department of Building Structures
ABSTRACT: As stated in the memorandum of understanding of the COST Action C25 new building materials, new products and technologies are in the long term a necessary way to re-duce environmental impacts. The paper investigates the environmental performance of a new building material based on renewable resource wood. It presents the outcomes of a life cycle as-sessment (LCA) showing the most important drivers (phases during the life cycle as well as specific inputs) for environmental impacts and the important impact categories for which envi-ronmental impacts are expected if fiber reinforced wood profiles are used. A preliminary case study, comparison between columns made of fibre reinforced wood, hot finished steel section and hollow core section is presented. The case study was conceived considering experimental data available for the reinforced wood columns.
43
2 BACKGROUND
2.1 Structural behaviour of fibre reinforced wood profiles
The general objective of research is to provide engineered wood products on the basis of formed wood profiles for structural applications. The formed profiles can be optionally reinforced with technical fibres and/or textiles laminated to the outer wood surface. The purpose of such com-posite confinement is to strengthen the relatively thin-walled sections and to protect the wood against environmental induced damage. In a previous paper (Heiduschke et al. 2008) the load-carrying behaviour of light-weight columns with circular hollow cross section was discussed. Full-scale axial compression tests were conducted to evaluate the performance of the tubes. The investigated parameters were: (1) the length of the tubes and (2) the type of reinforcement – var-ious fibre angles and thicknesses. The static tests have shown that wooden tubes are capable to sustain high buckling loads as far as brittle failure modes can be prevented. Such failure type was observed for non-reinforced columns. The longitudinal splitting of the profiles was due to the expansion of the tubes in circumferential direction resulting into a tension perpendicular to grain failure. The tests on reinforced tubes demonstrated that load-carrying resistance and duc-tility of timber profiles can be significantly enhanced by the composite confinement. The failure mode that caused the damage of the reinforced columns was compression failure in wood. The experimental results reveal that the relatively thin-walled sections do not tend to local buckling failures due to geometrical discontinuities or imperfections. The innovative developments may set the basis for the future of high resistance timber structures, especially in cases of highly loaded members with large cross sections.
2.2 Environmental performance measurement (LCA)
The environmental performance measurement is conducted mostly following requirements of ISO 14040 and ISO 14044. The theoretical concept of LCA is assumed to be known and there-fore not introduced. For better understanding the international norms as mentioned above may serve as best reference. The implementation of the concept of LCA for fibre reinforced wood profiles is the main focus of this paper and described more detailed in chapter 3.
2.3 Ecologic performance measurement
As for sustainability also the economic performance is of interest, for further researches a new concept introduced by the SETAC initiative (Society of Environmental Toxicology and Chemi-stry) shall be applied: the concept of environmental life cycle costing. To provide information for decision making in order to optimize cash outflows, cash inflows and timing over the life cycle is the main objective of conventional Life Cycle Costing. (Woodward 1997). If the total life-cycle costs of alternatives are known a decision maker is able to evaluate trade-offs between the initial investment and follow-up costs and thus chose a better alternative considering the whole life cycle. Economic aspects of different factors at different periods of time have to be considered during a product life cycle.
LCC is particularly applicable when dynamic information is incorporated into decision mak-ing processes, how it is the case for the fibre reinforced wood profiles. As an instrument for in-vestment decisions it can be applied from the perspective of a customer on an ad hoc basis for decisions between different construction materials.
The following data will be collected for the fibre reinforced wood profiles: planned cash in-flows for the products sold, cash outflows for the development and production, operation, main-tenance and finally waste disposal of the profiles, timing of the cash flows, useful life and the discount rate. The step of data collection is considered as the most important because of time and resources necessary.
Combining both the economic and the environmental perspective leads to the concept of en-vironmental life cycle costing. As it is the case for environmental data also economic data can be collected and allocated based on process flow diagrams. On the one hand costs of different material or energy inputs have to considered and on the other hand the "non physical" costs like i.e. labour costs have to be added.
44
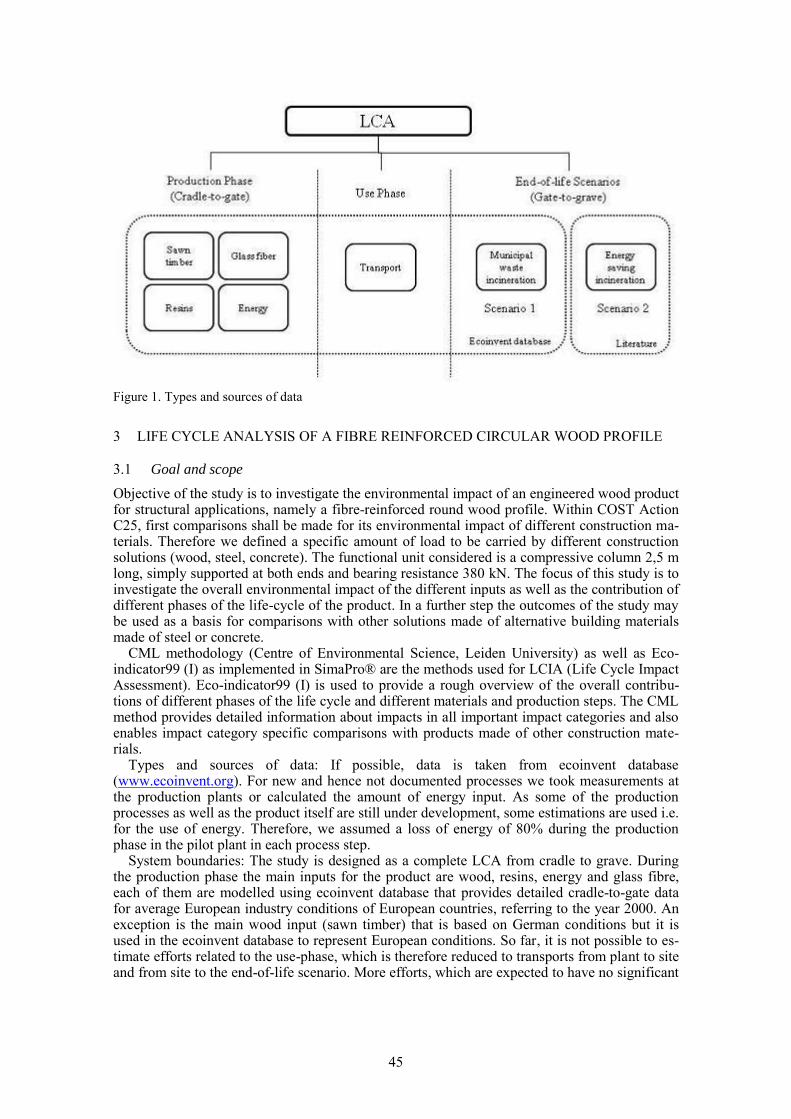
Figure 1. Types and sources of data
3 LIFE CYCLE ANALYSIS OF A FIBRE REINFORCED CIRCULAR WOOD PROFILE
3.1 Goal and scope
Objective of the study is to investigate the environmental impact of an engineered wood product for structural applications, namely a fibre-reinforced round wood profile. Within COST Action C25, first comparisons shall be made for its environmental impact of different construction ma-terials. Therefore we defined a specific amount of load to be carried by different construction solutions (wood, steel, concrete). The functional unit considered is a compressive column 2,5 m long, simply supported at both ends and bearing resistance 380 kN. The focus of this study is to investigate the overall environmental impact of the different inputs as well as the contribution of different phases of the life-cycle of the product. In a further step the outcomes of the study may be used as a basis for comparisons with other solutions made of alternative building materials made of steel or concrete.
CML methodology (Centre of Environmental Science, Leiden University) as well as Eco-indicator99 (I) as implemented in SimaPro® are the methods used for LCIA (Life Cycle Impact Assessment). Eco-indicator99 (I) is used to provide a rough overview of the overall contribu-tions of different phases of the life cycle and different materials and production steps. The CML method provides detailed information about impacts in all important impact categories and also enables impact category specific comparisons with products made of other construction mate-rials.
Types and sources of data: If possible, data is taken from ecoinvent database (www.ecoinvent.org). For new and hence not documented processes we took measurements at the production plants or calculated the amount of energy input. As some of the production processes as well as the product itself are still under development, some estimations are used i.e. for the use of energy. Therefore, we assumed a loss of energy of 80% during the production phase in the pilot plant in each process step.
System boundaries: The study is designed as a complete LCA from cradle to grave. During the production phase the main inputs for the product are wood, resins, energy and glass fibre, each of them are modelled using ecoinvent database that provides detailed cradle-to-gate data for average European industry conditions of European countries, referring to the year 2000. An exception is the main wood input (sawn timber) that is based on German conditions but it is used in the ecoinvent database to represent European conditions. So far, it is not possible to es-timate efforts related to the use-phase, which is therefore reduced to transports from plant to site and from site to the end-of-life scenario. More efforts, which are expected to have no significant
45
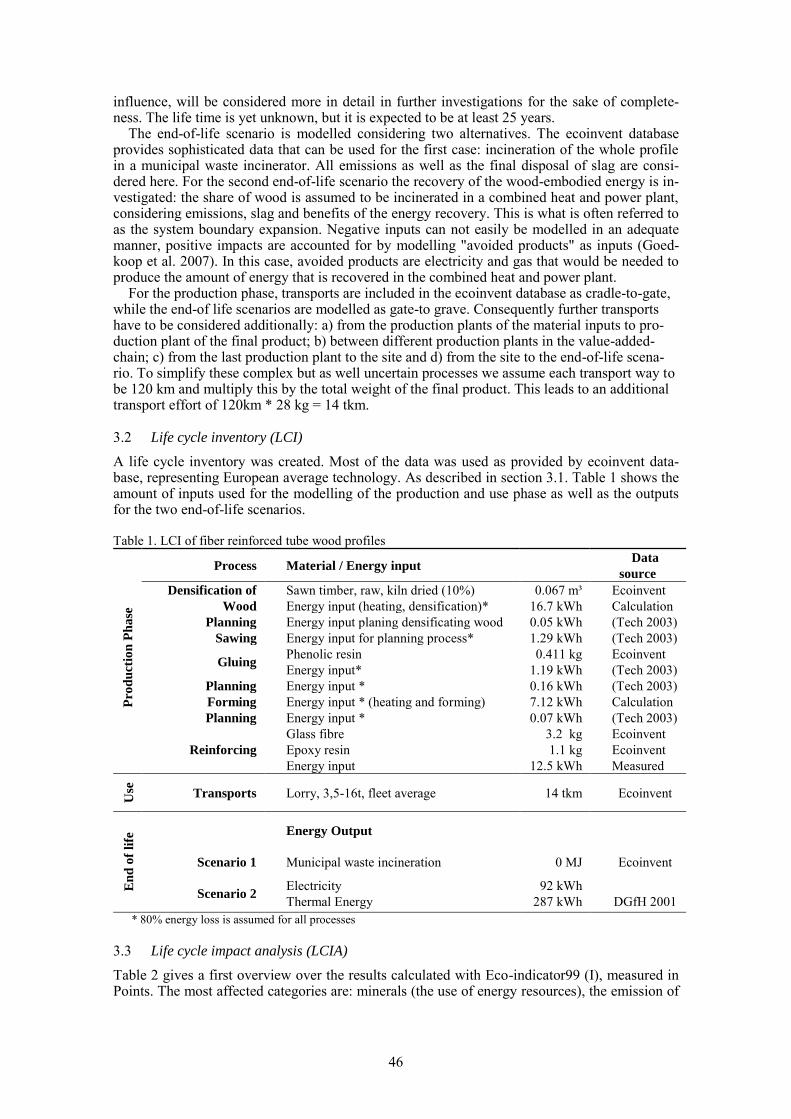
influence, will be considered more in detail in further investigations for the sake of complete-ness. The life time is yet unknown, but it is expected to be at least 25 years.
The end-of-life scenario is modelled considering two alternatives. The ecoinvent database provides sophisticated data that can be used for the first case: incineration of the whole profile in a municipal waste incinerator. All emissions as well as the final disposal of slag are consi-dered here. For the second end-of-life scenario the recovery of the wood-embodied energy is in-vestigated: the share of wood is assumed to be incinerated in a combined heat and power plant, considering emissions, slag and benefits of the energy recovery. This is what is often referred to as the system boundary expansion. Negative inputs can not easily be modelled in an adequate manner, positive impacts are accounted for by modelling "avoided products" as inputs (Goed-koop et al. 2007). In this case, avoided products are electricity and gas that would be needed to produce the amount of energy that is recovered in the combined heat and power plant.
For the production phase, transports are included in the ecoinvent database as cradle-to-gate, while the end-of life scenarios are modelled as gate-to grave. Consequently further transports have to be considered additionally: a) from the production plants of the material inputs to pro-duction plant of the final product; b) between different production plants in the value-added-chain; c) from the last production plant to the site and d) from the site to the end-of-life scena-rio. To simplify these complex but as well uncertain processes we assume each transport way to be 120 km and multiply this by the total weight of the final product. This leads to an additional transport effort of 120km * 28 kg = 14 tkm.
3.2 Life cycle inventory (LCI)
A life cycle inventory was created. Most of the data was used as provided by ecoinvent data-base, representing European average technology. As described in section 3.1. Table 1 shows the amount of inputs used for the modelling of the production and use phase as well as the outputs for the two end-of-life scenarios.
Table 1. LCI of fiber reinforced tube wood profiles
Pro
du
ctio
n P
ha
se
Process Material / Energy input Data
source
Densification of
Wood
Sawn timber, raw, kiln dried (10%)
Energy input (heating, densification)*
0.067 m³
16.7 kWh
Ecoinvent
Calculation
Planning Energy input planing densificating wood 0.05 kWh (Tech 2003)
Sawing Energy input for planning process* 1.29 kWh (Tech 2003)
Gluing Phenolic resin
Energy input*
0.411 kg
1.19 kWh
Ecoinvent
(Tech 2003)
Planning Energy input * 0.16 kWh (Tech 2003)
Forming Energy input * (heating and forming) 7.12 kWh Calculation
Planning Energy input * 0.07 kWh (Tech 2003)
Reinforcing
Glass fibre
Epoxy resin
Energy input
3.2 kg
1.1 kg
12.5 kWh
Ecoinvent
Ecoinvent
Measured
Use
Transports Lorry, 3,5-16t, fleet average 14 tkm Ecoinvent
En
d o
f li
fe Energy Output
Scenario 1 Municipal waste incineration 0 MJ Ecoinvent
Scenario 2 Electricity
Thermal Energy
92 kWh
287 kWh
DGfH 2001
* 80% energy loss is assumed for all processes
3.3 Life cycle impact analysis (LCIA)
Table 2 gives a first overview over the results calculated with Eco-indicator99 (I), measured in Points. The most affected categories are: minerals (the use of energy resources), the emission of
46
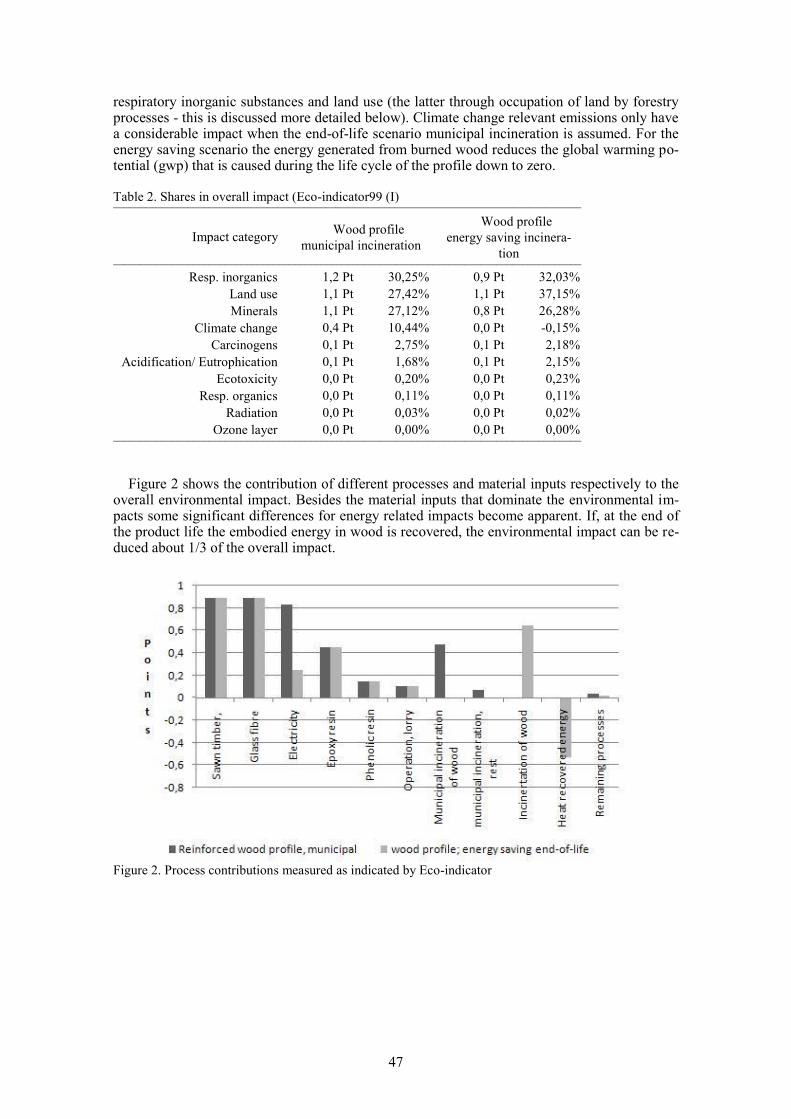
respiratory inorganic substances and land use (the latter through occupation of land by forestry processes - this is discussed more detailed below). Climate change relevant emissions only have a considerable impact when the end-of-life scenario municipal incineration is assumed. For the energy saving scenario the energy generated from burned wood reduces the global warming po-tential (gwp) that is caused during the life cycle of the profile down to zero. Table 2. Shares in overall impact (Eco-indicator99 (I) ________________________________________________________________________________________
Impact category Wood profile
municipal incineration
Wood profile
energy saving incinera-
tion ________________________________________________________________________________________
Resp. inorganics 1,2 Pt 30,25% 0,9 Pt 32,03%
Land use 1,1 Pt 27,42% 1,1 Pt 37,15%
Minerals 1,1 Pt 27,12% 0,8 Pt 26,28%
Climate change 0,4 Pt 10,44% 0,0 Pt -0,15%
Carcinogens 0,1 Pt 2,75% 0,1 Pt 2,18%
Acidification/ Eutrophication 0,1 Pt 1,68% 0,1 Pt 2,15%
Ecotoxicity 0,0 Pt 0,20% 0,0 Pt 0,23%
Resp. organics 0,0 Pt 0,11% 0,0 Pt 0,11%
Radiation 0,0 Pt 0,03% 0,0 Pt 0,02%
Ozone layer 0,0 Pt 0,00% 0,0 Pt 0,00% ________________________________________________________________________________________
Figure 2 shows the contribution of different processes and material inputs respectively to the
overall environmental impact. Besides the material inputs that dominate the environmental im-pacts some significant differences for energy related impacts become apparent. If, at the end of the product life the embodied energy in wood is recovered, the environmental impact can be re-duced about 1/3 of the overall impact.
Figure 2. Process contributions measured as indicated by Eco-indicator
47
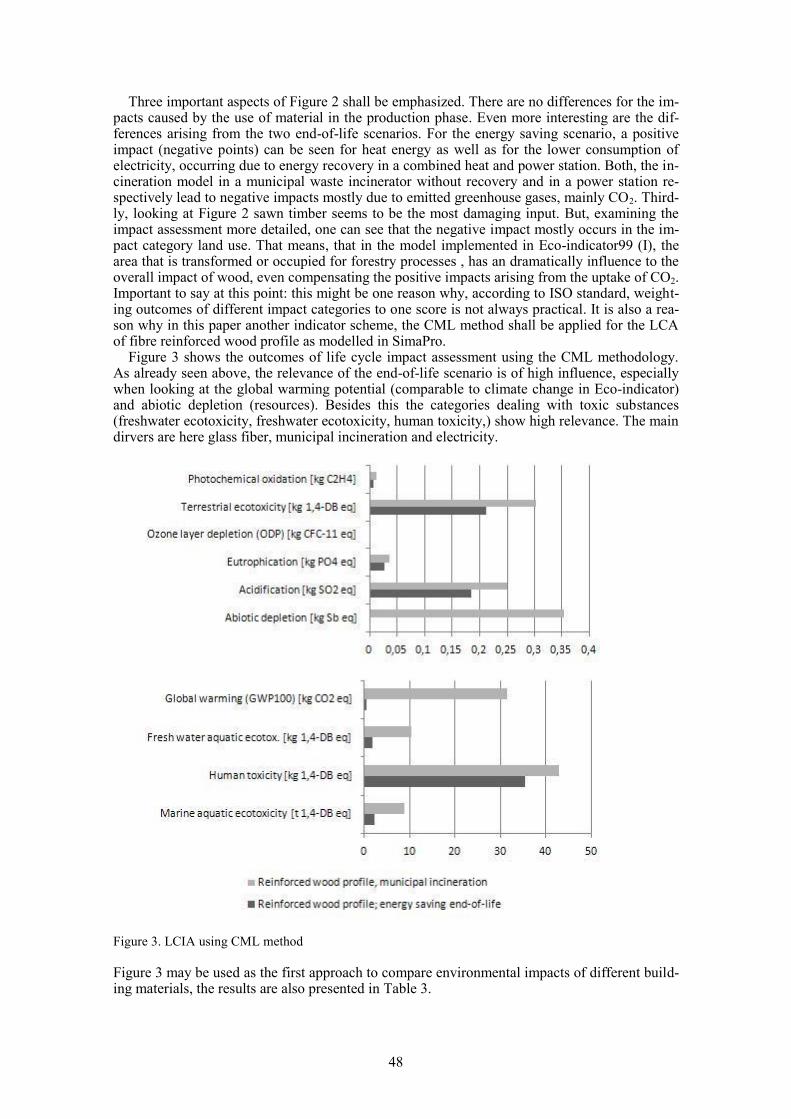
Three important aspects of Figure 2 shall be emphasized. There are no differences for the im-pacts caused by the use of material in the production phase. Even more interesting are the dif-ferences arising from the two end-of-life scenarios. For the energy saving scenario, a positive impact (negative points) can be seen for heat energy as well as for the lower consumption of electricity, occurring due to energy recovery in a combined heat and power station. Both, the in-cineration model in a municipal waste incinerator without recovery and in a power station re-spectively lead to negative impacts mostly due to emitted greenhouse gases, mainly CO2. Third-ly, looking at Figure 2 sawn timber seems to be the most damaging input. But, examining the impact assessment more detailed, one can see that the negative impact mostly occurs in the im-pact category land use. That means, that in the model implemented in Eco-indicator99 (I), the area that is transformed or occupied for forestry processes , has an dramatically influence to the overall impact of wood, even compensating the positive impacts arising from the uptake of CO2. Important to say at this point: this might be one reason why, according to ISO standard, weight-ing outcomes of different impact categories to one score is not always practical. It is also a rea-son why in this paper another indicator scheme, the CML method shall be applied for the LCA of fibre reinforced wood profile as modelled in SimaPro.
Figure 3 shows the outcomes of life cycle impact assessment using the CML methodology. As already seen above, the relevance of the end-of-life scenario is of high influence, especially when looking at the global warming potential (comparable to climate change in Eco-indicator) and abiotic depletion (resources). Besides this the categories dealing with toxic substances (freshwater ecotoxicity, freshwater ecotoxicity, human toxicity,) show high relevance. The main dirvers are here glass fiber, municipal incineration and electricity.
Figure 3. LCIA using CML method
Figure 3 may be used as the first approach to compare environmental impacts of different build-ing materials, the results are also presented in Table 3.
48
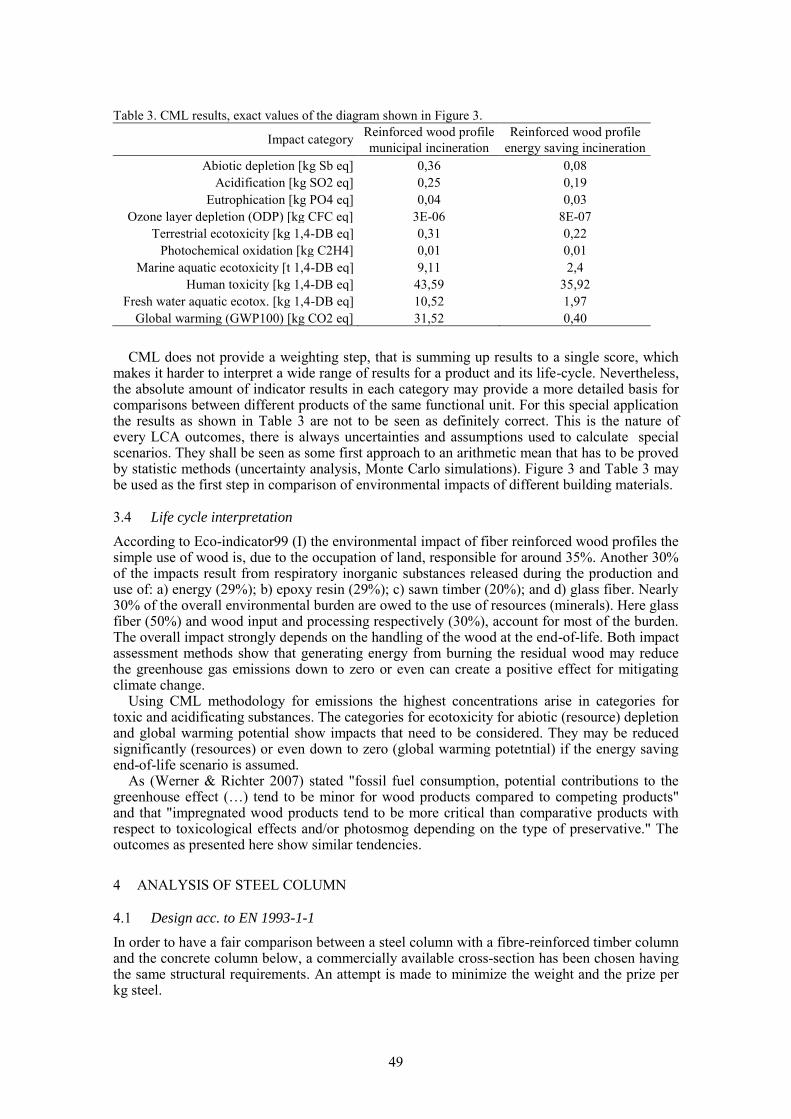
Table 3. CML results, exact values of the diagram shown in Figure 3.
Impact category Reinforced wood profile
municipal incineration
Reinforced wood profile
energy saving incineration
Abiotic depletion [kg Sb eq] 0,36 0,08
Acidification [kg SO2 eq] 0,25 0,19
Eutrophication [kg PO4 eq] 0,04 0,03
Ozone layer depletion (ODP) [kg CFC eq] 3E-06 8E-07
Terrestrial ecotoxicity [kg 1,4-DB eq] 0,31 0,22
Photochemical oxidation [kg C2H4] 0,01 0,01
Marine aquatic ecotoxicity [t 1,4-DB eq] 9,11 2,4
Human toxicity [kg 1,4-DB eq] 43,59 35,92
Fresh water aquatic ecotox. [kg 1,4-DB eq] 10,52 1,97
Global warming (GWP100) [kg CO2 eq] 31,52 0,40
CML does not provide a weighting step, that is summing up results to a single score, which
makes it harder to interpret a wide range of results for a product and its life-cycle. Nevertheless, the absolute amount of indicator results in each category may provide a more detailed basis for comparisons between different products of the same functional unit. For this special application the results as shown in Table 3 are not to be seen as definitely correct. This is the nature of every LCA outcomes, there is always uncertainties and assumptions used to calculate special scenarios. They shall be seen as some first approach to an arithmetic mean that has to be proved by statistic methods (uncertainty analysis, Monte Carlo simulations). Figure 3 and Table 3 may be used as the first step in comparison of environmental impacts of different building materials.
3.4 Life cycle interpretation
According to Eco-indicator99 (I) the environmental impact of fiber reinforced wood profiles the simple use of wood is, due to the occupation of land, responsible for around 35%. Another 30% of the impacts result from respiratory inorganic substances released during the production and use of: a) energy (29%); b) epoxy resin (29%); c) sawn timber (20%); and d) glass fiber. Nearly 30% of the overall environmental burden are owed to the use of resources (minerals). Here glass fiber (50%) and wood input and processing respectively (30%), account for most of the burden. The overall impact strongly depends on the handling of the wood at the end-of-life. Both impact assessment methods show that generating energy from burning the residual wood may reduce the greenhouse gas emissions down to zero or even can create a positive effect for mitigating climate change.
Using CML methodology for emissions the highest concentrations arise in categories for toxic and acidificating substances. The categories for ecotoxicity for abiotic (resource) depletion and global warming potential show impacts that need to be considered. They may be reduced significantly (resources) or even down to zero (global warming potetntial) if the energy saving end-of-life scenario is assumed.
As (Werner & Richter 2007) stated "fossil fuel consumption, potential contributions to the greenhouse effect (…) tend to be minor for wood products compared to competing products" and that "impregnated wood products tend to be more critical than comparative products with respect to toxicological effects and/or photosmog depending on the type of preservative." The outcomes as presented here show similar tendencies.
4 ANALYSIS OF STEEL COLUMN
4.1 Design acc. to EN 1993-1-1
In order to have a fair comparison between a steel column with a fibre-reinforced timber column and the concrete column below, a commercially available cross-section has been chosen having the same structural requirements. An attempt is made to minimize the weight and the prize per kg steel.
49
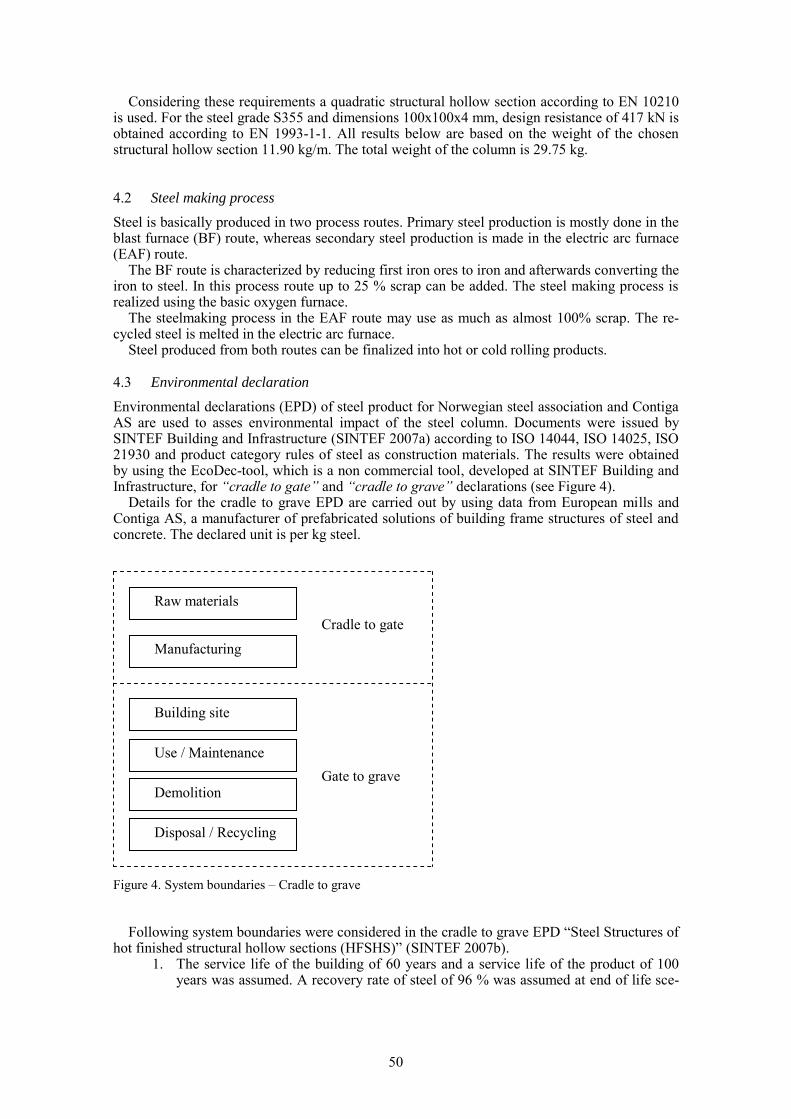
Considering these requirements a quadratic structural hollow section according to EN 10210 is used. For the steel grade S355 and dimensions 100x100x4 mm, design resistance of 417 kN is obtained according to EN 1993-1-1. All results below are based on the weight of the chosen structural hollow section 11.90 kg/m. The total weight of the column is 29.75 kg.
4.2 Steel making process
Steel is basically produced in two process routes. Primary steel production is mostly done in the blast furnace (BF) route, whereas secondary steel production is made in the electric arc furnace (EAF) route.
The BF route is characterized by reducing first iron ores to iron and afterwards converting the iron to steel. In this process route up to 25 % scrap can be added. The steel making process is realized using the basic oxygen furnace.
The steelmaking process in the EAF route may use as much as almost 100% scrap. The re-cycled steel is melted in the electric arc furnace.
Steel produced from both routes can be finalized into hot or cold rolling products.
4.3 Environmental declaration
Environmental declarations (EPD) of steel product for Norwegian steel association and Contiga AS are used to asses environmental impact of the steel column. Documents were issued by SINTEF Building and Infrastructure (SINTEF 2007a) according to ISO 14044, ISO 14025, ISO 21930 and product category rules of steel as construction materials. The results were obtained by using the EcoDec-tool, which is a non commercial tool, developed at SINTEF Building and Infrastructure, for “cradle to gate” and “cradle to grave” declarations (see Figure 4).
Details for the cradle to grave EPD are carried out by using data from European mills and Contiga AS, a manufacturer of prefabricated solutions of building frame structures of steel and concrete. The declared unit is per kg steel. Figure 4. System boundaries – Cradle to grave
Following system boundaries were considered in the cradle to grave EPD “Steel Structures of hot finished structural hollow sections (HFSHS)” (SINTEF 2007b).
1. The service life of the building of 60 years and a service life of the product of 100 years was assumed. A recovery rate of steel of 96 % was assumed at end of life sce-
Raw materials
Manufacturing
Building site
Use / Maintenance
Demolition
Disposal / Recycling
Cradle to gate
Gate to grave
50
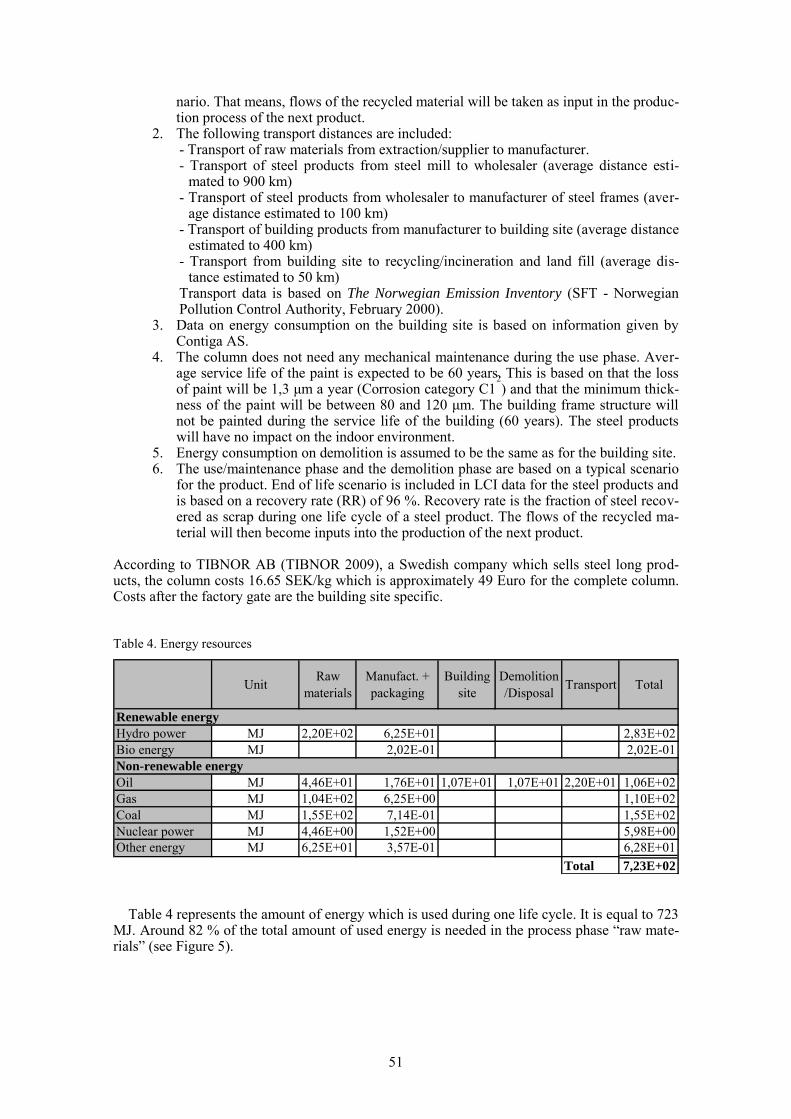
nario. That means, flows of the recycled material will be taken as input in the produc-tion process of the next product.
2. The following transport distances are included: - Transport of raw materials from extraction/supplier to manufacturer. - Transport of steel products from steel mill to wholesaler (average distance esti-
mated to 900 km) - Transport of steel products from wholesaler to manufacturer of steel frames (aver-
age distance estimated to 100 km) - Transport of building products from manufacturer to building site (average distance
estimated to 400 km) - Transport from building site to recycling/incineration and land fill (average dis-
tance estimated to 50 km) Transport data is based on The Norwegian Emission Inventory (SFT - Norwegian Pollution Control Authority, February 2000).
3. Data on energy consumption on the building site is based on information given by Contiga AS.
4. The column does not need any mechanical maintenance during the use phase. Aver-age service life of the paint is expected to be 60 years. This is based on that the loss of paint will be 1,3 μm a year (Corrosion category C1
2
) and that the minimum thick-ness of the paint will be between 80 and 120 μm. The building frame structure will not be painted during the service life of the building (60 years). The steel products will have no impact on the indoor environment.
5. Energy consumption on demolition is assumed to be the same as for the building site. 6. The use/maintenance phase and the demolition phase are based on a typical scenario
for the product. End of life scenario is included in LCI data for the steel products and is based on a recovery rate (RR) of 96 %. Recovery rate is the fraction of steel recov-ered as scrap during one life cycle of a steel product. The flows of the recycled ma-terial will then become inputs into the production of the next product.
According to TIBNOR AB (TIBNOR 2009), a Swedish company which sells steel long prod-ucts, the column costs 16.65 SEK/kg which is approximately 49 Euro for the complete column. Costs after the factory gate are the building site specific. Table 4. Energy resources
Table 4 represents the amount of energy which is used during one life cycle. It is equal to 723
MJ. Around 82 % of the total amount of used energy is needed in the process phase “raw mate-rials” (see Figure 5).
UnitRaw
materials
Manufact. +
packaging
Building
site
Demolition
/DisposalTransport Total
Renewable energy
Hydro power MJ 2,20E+02 6,25E+01 2,83E+02
Bio energy MJ 2,02E-01 2,02E-01
Non-renewable energy
Oil MJ 4,46E+01 1,76E+01 1,07E+01 1,07E+01 2,20E+01 1,06E+02
Gas MJ 1,04E+02 6,25E+00 1,10E+02
Coal MJ 1,55E+02 7,14E-01 1,55E+02
Nuclear power MJ 4,46E+00 1,52E+00 5,98E+00
Other energy MJ 6,25E+01 3,57E-01 6,28E+01
Total 7,23E+02
51
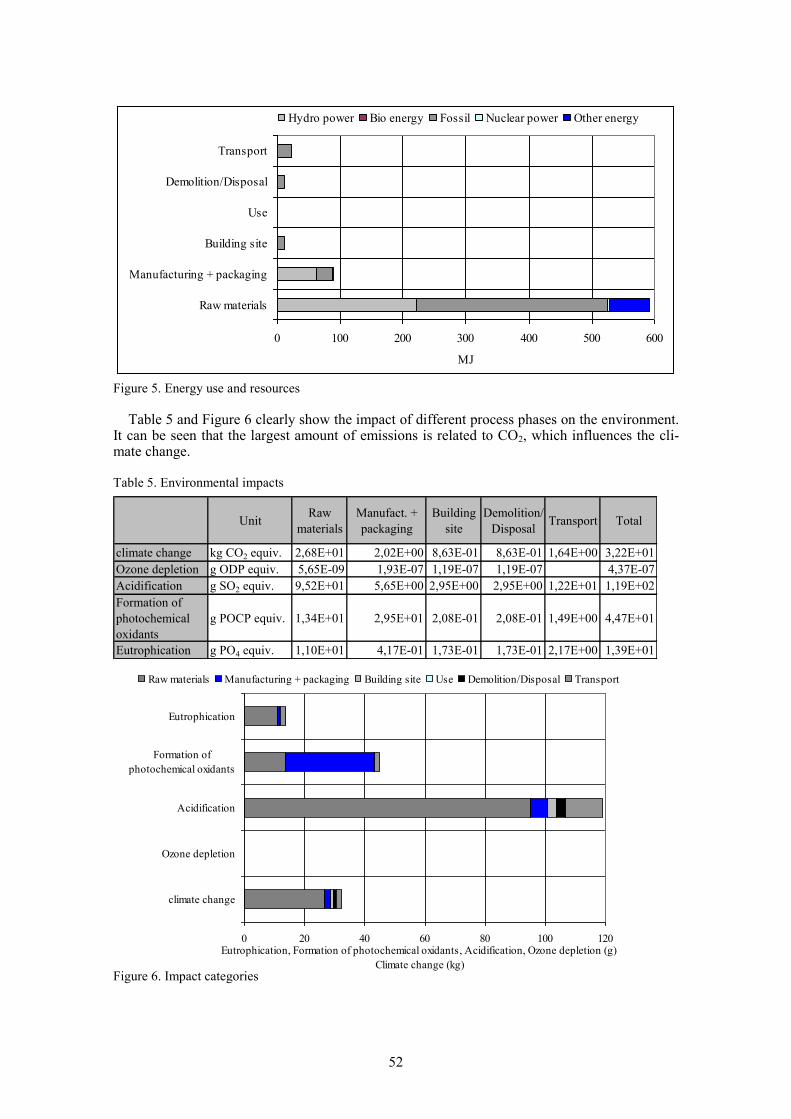
Figure 5. Energy use and resources
Table 5 and Figure 6 clearly show the impact of different process phases on the environment.
It can be seen that the largest amount of emissions is related to CO2, which influences the cli-mate change. Table 5. Environmental impacts
Figure 6. Impact categories
0 100 200 300 400 500 600
Raw materials
Manufacturing + packaging
Building site
Use
Demolition/Disposal
Transport
MJ
Hydro power Bio energy Fossil Nuclear power Other energy
0 20 40 60 80 100 120
climate change
Ozone depletion
Acidification
Formation of
photochemical oxidants
Eutrophication
Eutrophication, Formation of photochemical oxidants, Acidification, Ozone depletion (g)
Climate change (kg)
Raw materials Manufacturing + packaging Building site Use Demolition/Disposal Transport
UnitRaw
materials
Manufact. +
packaging
Building
site
Demolition/
DisposalTransport Total
climate change kg CO2 equiv. 2,68E+01 2,02E+00 8,63E-01 8,63E-01 1,64E+00 3,22E+01
Ozone depletion g ODP equiv. 5,65E-09 1,93E-07 1,19E-07 1,19E-07 4,37E-07
Acidification g SO2 equiv. 9,52E+01 5,65E+00 2,95E+00 2,95E+00 1,22E+01 1,19E+02
Formation of
photochemical
oxidants
g POCP equiv. 1,34E+01 2,95E+01 2,08E-01 2,08E-01 1,49E+00 4,47E+01
Eutrophication g PO4 equiv. 1,10E+01 4,17E-01 1,73E-01 1,73E-01 2,17E+00 1,39E+01
52
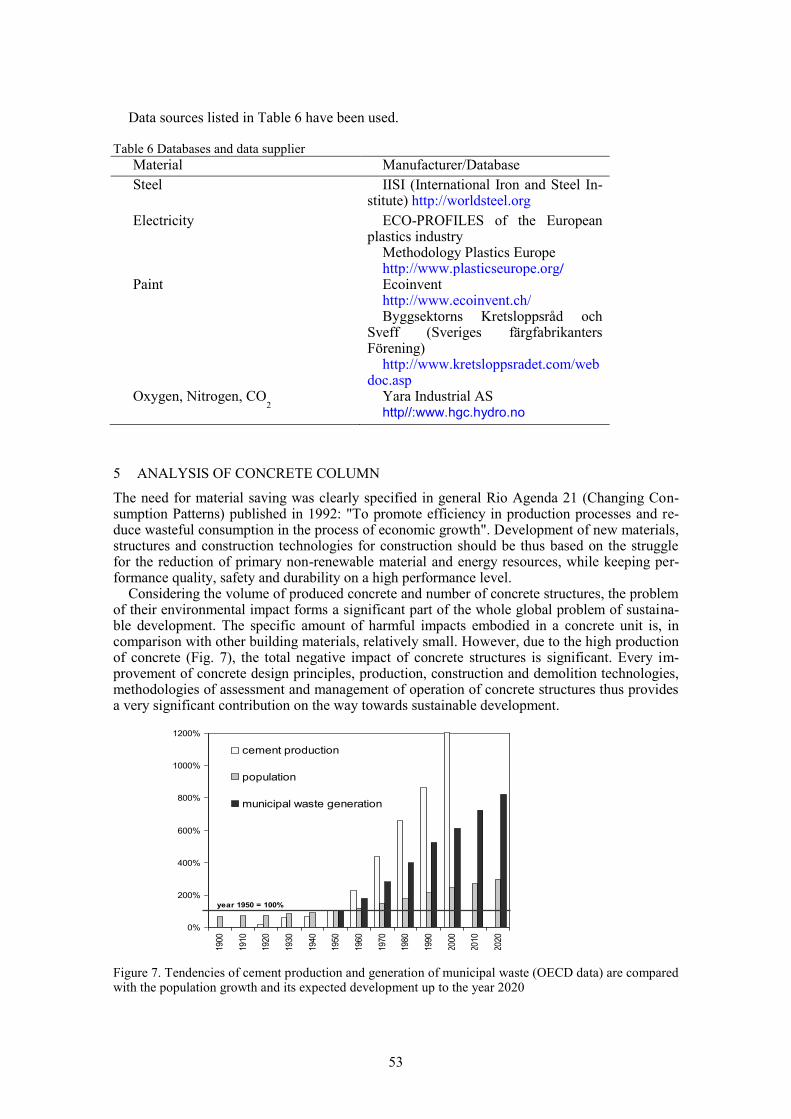
Data sources listed in Table 6 have been used.
Table 6 Databases and data supplier
Material Manufacturer/Database
Steel IISI (International Iron and Steel In-stitute) http://worldsteel.org
Electricity ECO-PROFILES of the European plastics industry
Methodology Plastics Europe http://www.plasticseurope.org/
Paint Ecoinvent http://www.ecoinvent.ch/ Byggsektorns Kretsloppsråd och
Sveff (Sveriges färgfabrikanters Förening)
http://www.kretsloppsradet.com/webdoc.asp
Oxygen, Nitrogen, CO2 Yara Industrial AS
http//:www.hgc.hydro.no
5 ANALYSIS OF CONCRETE COLUMN
The need for material saving was clearly specified in general Rio Agenda 21 (Changing Con-sumption Patterns) published in 1992: "To promote efficiency in production processes and re-duce wasteful consumption in the process of economic growth". Development of new materials, structures and construction technologies for construction should be thus based on the struggle for the reduction of primary non-renewable material and energy resources, while keeping per-formance quality, safety and durability on a high performance level.
Considering the volume of produced concrete and number of concrete structures, the problem of their environmental impact forms a significant part of the whole global problem of sustaina-ble development. The specific amount of harmful impacts embodied in a concrete unit is, in comparison with other building materials, relatively small. However, due to the high production of concrete (Fig. 7), the total negative impact of concrete structures is significant. Every im-provement of concrete design principles, production, construction and demolition technologies, methodologies of assessment and management of operation of concrete structures thus provides a very significant contribution on the way towards sustainable development.
Figure 7. Tendencies of cement production and generation of municipal waste (OECD data) are compared with the population growth and its expected development up to the year 2020
0%
200%
400%
600%
800%
1000%
1200%
1900
1910
1920
1930
1940
1950
1960
1970
1980
1990
2000
2010
2020
cement production
population
municipal waste generation
year 1950 = 100%
53
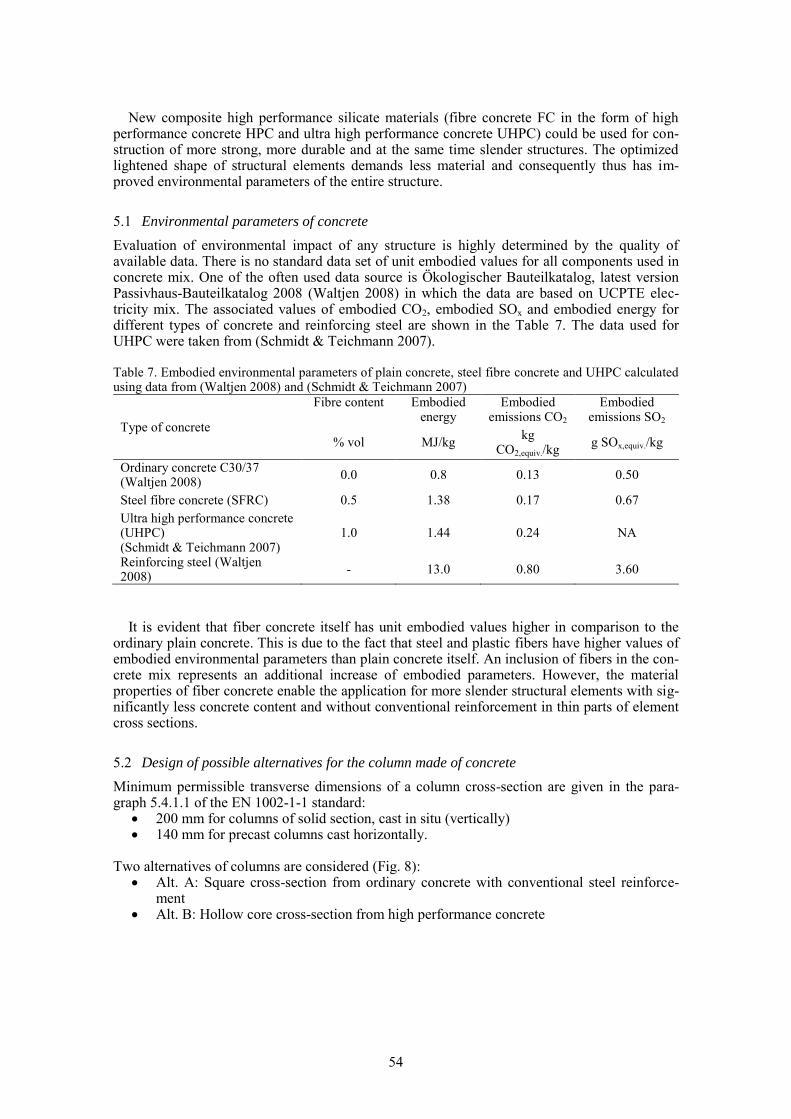
New composite high performance silicate materials (fibre concrete FC in the form of high
performance concrete HPC and ultra high performance concrete UHPC) could be used for con-struction of more strong, more durable and at the same time slender structures. The optimized lightened shape of structural elements demands less material and consequently thus has im-proved environmental parameters of the entire structure.
5.1 Environmental parameters of concrete
Evaluation of environmental impact of any structure is highly determined by the quality of available data. There is no standard data set of unit embodied values for all components used in concrete mix. One of the often used data source is Ökologischer Bauteilkatalog, latest version Passivhaus-Bauteilkatalog 2008 (Waltjen 2008) in which the data are based on UCPTE elec-tricity mix. The associated values of embodied CO2, embodied SOx and embodied energy for different types of concrete and reinforcing steel are shown in the Table 7. The data used for UHPC were taken from (Schmidt & Teichmann 2007). Table 7. Embodied environmental parameters of plain concrete, steel fibre concrete and UHPC calculated using data from (Waltjen 2008) and (Schmidt & Teichmann 2007)
Type of concrete
Fibre content Embodied energy
Embodied emissions CO2
Embodied emissions SO2
% vol MJ/kg kg
CO2,equiv./kg g SOx,equiv./kg
Ordinary concrete C30/37 (Waltjen 2008)
0.0 0.8 0.13 0.50
Steel fibre concrete (SFRC) 0.5 1.38 0.17 0.67
Ultra high performance concrete (UHPC) (Schmidt & Teichmann 2007)
1.0 1.44 0.24 NA
Reinforcing steel (Waltjen 2008)
- 13.0 0.80 3.60
It is evident that fiber concrete itself has unit embodied values higher in comparison to the
ordinary plain concrete. This is due to the fact that steel and plastic fibers have higher values of embodied environmental parameters than plain concrete itself. An inclusion of fibers in the con-crete mix represents an additional increase of embodied parameters. However, the material properties of fiber concrete enable the application for more slender structural elements with sig-nificantly less concrete content and without conventional reinforcement in thin parts of element cross sections.
5.2 Design of possible alternatives for the column made of concrete
Minimum permissible transverse dimensions of a column cross-section are given in the para-graph 5.4.1.1 of the EN 1002-1-1 standard:
200 mm for columns of solid section, cast in situ (vertically) 140 mm for precast columns cast horizontally.
Two alternatives of columns are considered (Fig. 8): Alt. A: Square cross-section from ordinary concrete with conventional steel reinforce-
ment Alt. B: Hollow core cross-section from high performance concrete
54
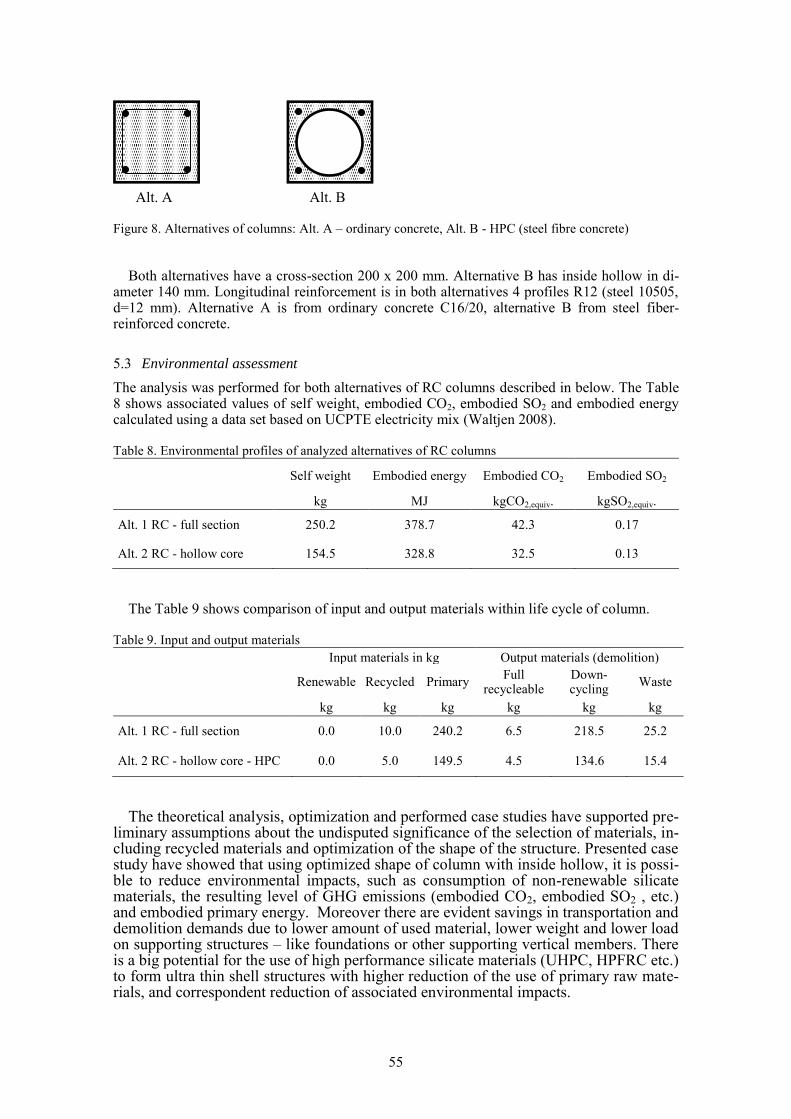
Alt. A Alt. B
Figure 8. Alternatives of columns: Alt. A – ordinary concrete, Alt. B - HPC (steel fibre concrete)
Both alternatives have a cross-section 200 x 200 mm. Alternative B has inside hollow in di-
ameter 140 mm. Longitudinal reinforcement is in both alternatives 4 profiles R12 (steel 10505, d=12 mm). Alternative A is from ordinary concrete C16/20, alternative B from steel fiber-reinforced concrete.
5.3 Environmental assessment
The analysis was performed for both alternatives of RC columns described in below. The Table 8 shows associated values of self weight, embodied CO2, embodied SO2 and embodied energy calculated using a data set based on UCPTE electricity mix (Waltjen 2008).
Table 8. Environmental profiles of analyzed alternatives of RC columns
Self weight Embodied energy Embodied CO2 Embodied SO2
kg MJ kgCO2,equiv. kgSO2,equiv.
Alt. 1 RC - full section 250.2 378.7 42.3 0.17
Alt. 2 RC - hollow core 154.5 328.8 32.5 0.13
The Table 9 shows comparison of input and output materials within life cycle of column.
Table 9. Input and output materials
Input materials in kg Output materials (demolition)
Renewable Recycled Primary
Full recycleable
Down-cycling
Waste
kg kg kg kg kg kg
Alt. 1 RC - full section 0.0 10.0 240.2 6.5 218.5 25.2
Alt. 2 RC - hollow core - HPC 0.0 5.0 149.5 4.5 134.6 15.4
The theoretical analysis, optimization and performed case studies have supported pre-liminary assumptions about the undisputed significance of the selection of materials, in-cluding recycled materials and optimization of the shape of the structure. Presented case study have showed that using optimized shape of column with inside hollow, it is possi-ble to reduce environmental impacts, such as consumption of non-renewable silicate materials, the resulting level of GHG emissions (embodied CO2, embodied SO2 , etc.) and embodied primary energy. Moreover there are evident savings in transportation and demolition demands due to lower amount of used material, lower weight and lower load on supporting structures – like foundations or other supporting vertical members. There is a big potential for the use of high performance silicate materials (UHPC, HPFRC etc.) to form ultra thin shell structures with higher reduction of the use of primary raw mate-rials, and correspondent reduction of associated environmental impacts.
55
However, the considered column resistance, 380 kN, is rather low for the design of effective concrete alternative. The expected load-bearing capacity in the case of HPC and UHPC is sig-nificantly higher than in preset requirements defined for this study. The evident advantages of the use of high performance concrete would be more significant in the case of higher loads.
6 CONCLUDING REMARKS
First outcomes of a LCA for fibre reinforced wood profiles have been presented. They are
mostly based on sophisticated data from the well-known ecoinvent database. With the results from life cycle impact analysis environmentally sound process engineering can be developed.
Two impact assessment methods have been applied whereas CML method seems to be more applicable for comparisons between products. For the steel and concrete alternatives published references were used.
The preliminary study of the simple column design considering alternative solutions,
three main building materials, considering environmental impact of the structural ele-ment illustrates importance and problems associated with this approach. The main con-clusions are:
More efforts should be put in the synchronization of the system boundaries for
all alternative solutions. With the existing knowledge and tools available it is possible to define the
best environmental and economical solution for a very specific building site conditions. However, these two separate criteria may be satisfied by different material solutions.
It is important that design for the life time become the accepted approach de-spite of problems that are rather obvious. This will improve environmental awareness and certainly open new possibilities for innovative solutions in construction sector, increasing variety of material choices and structural solu-tions.
Comparable results of the analysis of three building materials are show in Table 10.
Table 10. Comparison of basic categories of the environmental impact for alternative building materials
Performance Unit Building material
Timber (fibre reinforced)
Steel RC hollow core
weight kg 28.2 29.75 154.5
energy MJ 140.7 723 328.8
climate change kg CO2 equiv. 0.40 32.2 32.5
acidification kg SO2 equiv. 0.19 0.12 0.13
56

ACKNOWLEDGMENT
Authors from Technical University, Dresden, would like to thank to the German Federal Minis-try of Education and Research (BMBF - Project-Nr. 0330722A) for the financial support of re-search. A part of the paper regarding the concrete as a possible structural material has been achieved with the financial support of the Ministry of Education, Youth and Sports of the Czech Republic, project No. 1M0579, within activities of the CIDEAS research centre and support of the Grant Agency of the Czech Republic Grant Project N. 103/07/0400.
All supports are gratefully acknowledged.
REFERENCES
CIB. 1999. Agenda 21 on Sustainable Construction. CIB Report Publication 237, Rotterdam. DGfH / Deutsche Gesellschaft für Holzforschung (eds.) 2001: Ökobilanzen Holz. EN 1993-1-1. 2005. Eurocode 3 - Design of steel structures - Part 1-1: General rules and rules for build-
ings. European Committee for Standardization, Brussels, Belgium. EN 10210. 2006. Hot finished structural hollow sections of non-alloy and fine grain steels. European
Committee for Standardization, Brussels, Belgium. Goedkoop, M. & de Schryver, A. & Oele, M. 2007. Introduction to LCA with SimaPro. Hájek, P. & Fiala, C. 2008. Environmentally optimized floor slab using UHPC – contribution to sustaina-
ble building. In Proc. of UHPC Conf. Kassel 2008, Germany, p. 879-886. Haller, P. 2007. From tree trunk to tube or the quadrature of the circle. In: Braganca et al. (Eds.) 2007.
Sustainability of Constructions (Proceedings of Workshop), Portugal, p.2.29 – 2.35. Heiduschke, A. & Cabrero, J. M. & Manthey, C. & Haller, P. & Guenther, E. 2008. Mechanical Behavior
and Life Cycle Assessment of Fibre-Reinforced Timber Profiles. In: Braganca et al. (eds): Sustainabil-ity of Constructions. COST Action C25. Proceedings of Seminar, 3.38, Dresden.
Hunkeler, D. & Rebitzer, G. & Lichenvort, K. (eds.). 2008. Environmental Life Cycle Costing. CRC Press; SETAC, Pensacola, Florida.
ISO 14040. 2006. Environmental management - Life cycle assessment - Principles and framework ISO 14044. 2006. Environmental management – Life cycle assessment – Requirements and guidelines.
European Committee for Standardization, Brussels, Belgium ISO 14025. 2006. Environmental labels and declarations – Type III environmental declarations – Prin-ciples and procedures. ISO 21930. 2007. Sustainability in building construction – Environmental declaration of building prod-
ucts. Rebitzer, G. & Hunkeler, D. 2003. International Journal for Life Cycle Assessment 5(8): p.254[ Schießl, P. & Stengel, T. 2007. Der kumulierte Energieaufwand ausgewählter Baustoffe für die
ökologische Bewertung von Betonbauteilen. Wissenschaftl. Kurzbericht Nr.13. Schmidt, M. & Teichmann, T. 2007. Ultra-high-performance concrete: Basis for sustainable structures. In
Proc. of CESB07 Prague, p. 83-88. SINTEF Building and Infrastructure. 2007a. Environmental Declaration of steel products for the Norwe-
gian Steel Association and Contiga AS. Assignment Report. SINTEF Building and Infrastructure. 2007b. Steel structures of hot finished structural hollow sections
(HFSHS). Environmental declaration ISO 14025 and ISO 21930. Tech, T. & Bodden, P. & Albert, J. 2003. Rationelle Energienutzung im Holzbe- und verarbeitenden
Gewerbe. Braunschweig: Vieweg. TIBNOR AB. 2009. http://www.tibnor.se , last visit: 2009-09-10. Waltjen, T. 2008. Passivhaus-Bauteilkatalog 2008 – Ökologisch bewertete Konstruktionen. Springer-
Verlag. Wien, Austria. Werner, F. & Richter, K. 2007. Wooden building products in comparative LCA. In:International Journal
for Life Cycle Assessment (12) 7, p.470-479. Woodward, D.G. 1997. International Journal of Project Management 15(6): p.335-344. www.bauteilkatalog.ch. 2007
57

58
1 INTRODUCTION
During last few decades, raising awareness about the negative consequences of human activities on the environment caused increased engagement in studying the effects on depletion of natural resources, climate changes, soil, water and air pollution, degradation of eco-systems. Sustaina-ble development of civil engineering is based on decreasing the energy use and use of natural resources, lowering the pollutant emissions into soil, air and water, increasing the durability and service life of the structures, utilization of by-products, recycling and reuse. The use of composite elements show several advantages compared with the elements made only of steel or concrete. In composite elements, steel tube acts as a permanent formwork and can have different cross-sections: circular, rectangular, square, polygonal... Hollow steel sections are the most effective of all the sections in terms of stiffness of the pressure. By filling tubes with concrete we can significantly increase the capacity or reduce size of cross section, which direct-ly affects the amount of materials used and therefore the impact on the environment.
Comparative Life Cycle Impact Assessment of Short RC Columns and Composite Columns
I. Lukic Department of Civil Engineering, Faculty of Technical Sciences, University of Novi Sad, Serbia
ABSTRACT: This paper presents the results of the comparative analysis of load bearing capaci-ty of axially compressed short composite columns made of different types of concrete: normal concrete, light-weight concrete, high strength concrete and fiber reinforced concrete. The aim of this research was to determine the effect of these types of concrete infill on the behavior of the composite columns. Forty eight specimens were divided into two groups: steel tubes filled with varying types of concrete, with or without reinforcement, and classic RC columns with same dimensions and shape made of the same four types of concrete and tested to axial compression. For the experiment, eight different series of columns have been prepared. Four series were clas-sically reinforced columns with ribbed reinforcement and four series were steel tubes filled with above-mentioned concrete. All the specimens were tested to the point of failure under axial compression. The tests have shown that the bearing capacity of composite columns is about two to five times higher than classically reinforced concrete columns, depending on the type of con-crete. Also, composite columns have higher ductility. These results were a starting point for the LCIA analysis of two selected types of columns: columns with normal reinforced concrete and composite columns with normal concrete, where 1p of column was adopted as a functional unit, assuming that columns have same dimensions. Given the fact that there is no usable database for Serbia to conduct detailed LCIA analysis (last update was circa 15 years ago, and it is insuffi-cient, this paper provides the results obtained on the basis of simplified LCIA analysis where impacts of component materials were analyzed separately and then the results were summa-rized. This simplified analysis is used as the initial analysis to determine whether there is a need for more detailed analysis. Most of the data for raw material production, concrete production and steel production were provided from the local, Serbian, suppliers and manufacturers and SimaPro7 database. The environmental impact categories which were studied were the follow-ing: Global Warming Potential (GWP), Eutrophication Potential (EP), Acidification Potential (AP) and Photochemical Oxidant Creation Potential (POCP).
59
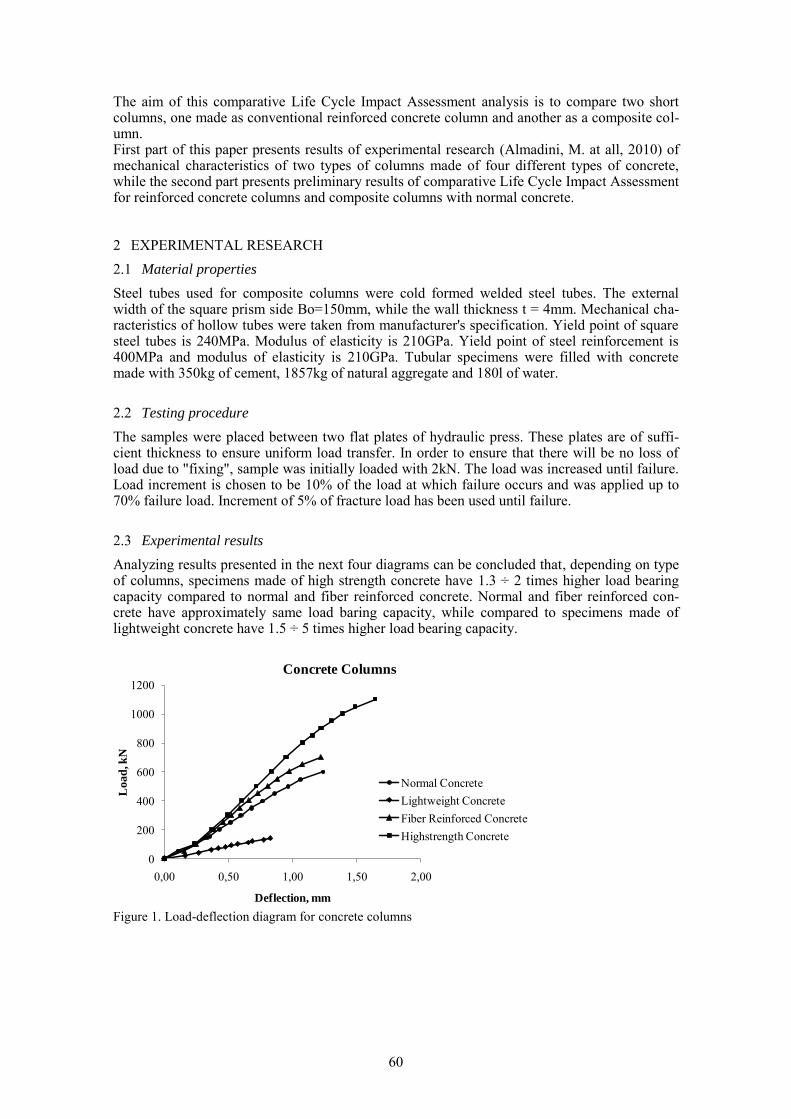
The aim of this comparative Life Cycle Impact Assessment analysis is to compare two short columns, one made as conventional reinforced concrete column and another as a composite col-umn. First part of this paper presents results of experimental research (Almadini, M. at all, 2010) of mechanical characteristics of two types of columns made of four different types of concrete, while the second part presents preliminary results of comparative Life Cycle Impact Assessment for reinforced concrete columns and composite columns with normal concrete.
2 EXPERIMENTAL RESEARCH
2.1 Material properties
Steel tubes used for composite columns were cold formed welded steel tubes. The external width of the square prism side Bo=150mm, while the wall thickness t = 4mm. Mechanical cha-racteristics of hollow tubes were taken from manufacturer's specification. Yield point of square steel tubes is 240MPa. Modulus of elasticity is 210GPa. Yield point of steel reinforcement is 400MPa and modulus of elasticity is 210GPa. Tubular specimens were filled with concrete made with 350kg of cement, 1857kg of natural aggregate and 180l of water.
2.2 Testing procedure
The samples were placed between two flat plates of hydraulic press. These plates are of suffi-cient thickness to ensure uniform load transfer. In order to ensure that there will be no loss of load due to "fixing", sample was initially loaded with 2kN. The load was increased until failure. Load increment is chosen to be 10% of the load at which failure occurs and was applied up to 70% failure load. Increment of 5% of fracture load has been used until failure.
2.3 Experimental results
Analyzing results presented in the next four diagrams can be concluded that, depending on type of columns, specimens made of high strength concrete have 1.3 ÷ 2 times higher load bearing capacity compared to normal and fiber reinforced concrete. Normal and fiber reinforced con-crete have approximately same load baring capacity, while compared to specimens made of lightweight concrete have 1.5 ÷ 5 times higher load bearing capacity.
0
200
400
600
800
1000
1200
0,00 0,50 1,00 1,50 2,00
Lo
ad
, kN
Deflection, mm
Concrete Columns
Normal Concrete
Lightweight Concrete
Fiber Reinforced Concrete
Highstrength Concrete
Figure 1. Load-deflection diagram for concrete columns
60
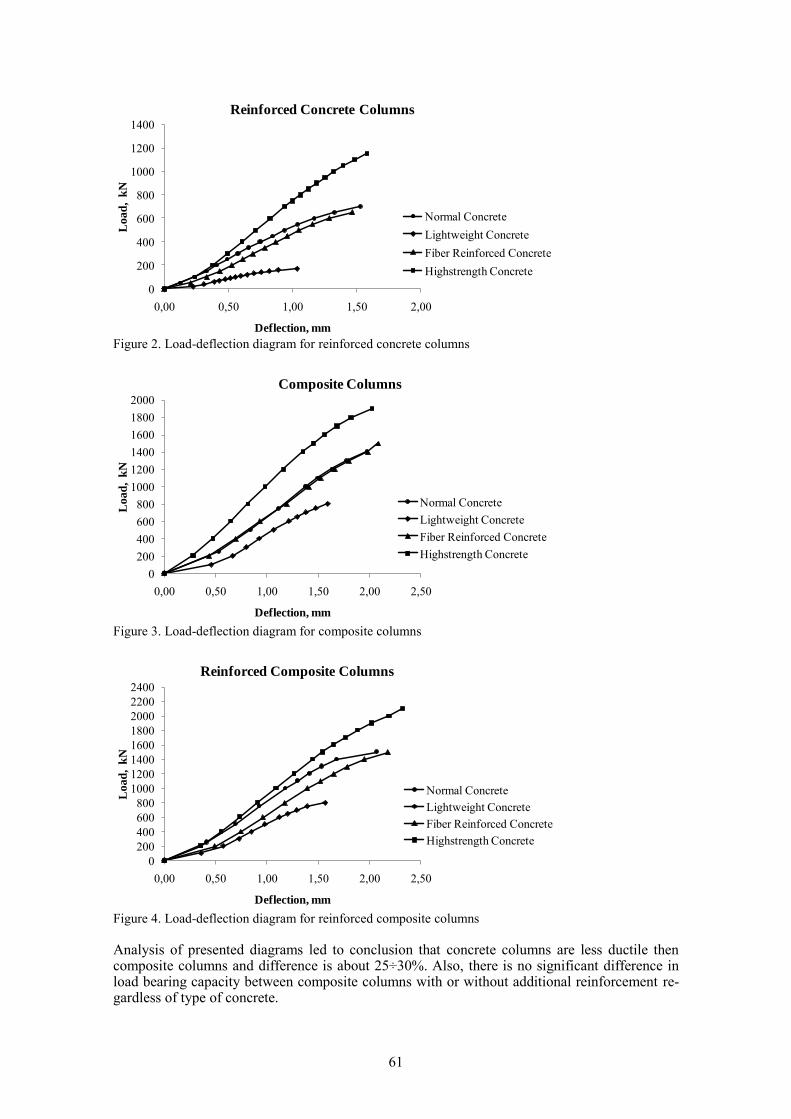
0
200
400
600
800
1000
1200
1400
0,00 0,50 1,00 1,50 2,00
Load
, k
N
Deflection, mm
Reinforced Concrete Columns
Normal Concrete
Lightweight Concrete
Fiber Reinforced Concrete
Highstrength Concrete
Figure 2. Load-deflection diagram for reinforced concrete columns
0
200
400
600
800
1000
1200
1400
1600
1800
2000
0,00 0,50 1,00 1,50 2,00 2,50
Lo
ad
, k
N
Deflection, mm
Composite Columns
Normal Concrete
Lightweight Concrete
Fiber Reinforced Concrete
Highstrength Concrete
Figure 3. Load-deflection diagram for composite columns
0
200
400
600
800
1000
1200
1400
1600
1800
2000
2200
2400
0,00 0,50 1,00 1,50 2,00 2,50
Lo
ad
, k
N
Deflection, mm
Reinforced Composite Columns
Normal Concrete
Lightweight Concrete
Fiber Reinforced Concrete
Highstrength Concrete
Figure 4. Load-deflection diagram for reinforced composite columns
Analysis of presented diagrams led to conclusion that concrete columns are less ductile then composite columns and difference is about 25÷30%. Also, there is no significant difference in load bearing capacity between composite columns with or without additional reinforcement re-gardless of type of concrete.
61
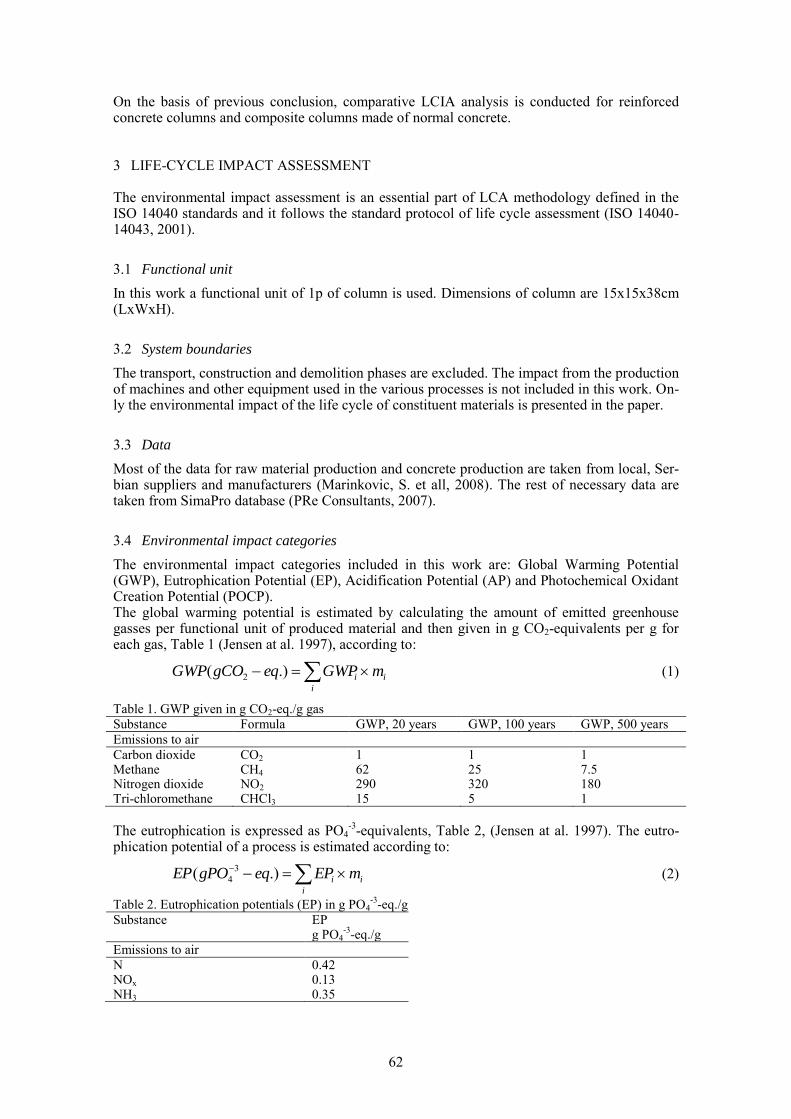
On the basis of previous conclusion, comparative LCIA analysis is conducted for reinforced concrete columns and composite columns made of normal concrete.
3 LIFE-CYCLE IMPACT ASSESSMENT
The environmental impact assessment is an essential part of LCA methodology defined in the ISO 14040 standards and it follows the standard protocol of life cycle assessment (ISO 14040-14043, 2001).
3.1 Functional unit
In this work a functional unit of 1p of column is used. Dimensions of column are 15x15x38cm (LxWxH).
3.2 System boundaries
The transport, construction and demolition phases are excluded. The impact from the production of machines and other equipment used in the various processes is not included in this work. On-ly the environmental impact of the life cycle of constituent materials is presented in the paper.
3.3 Data
Most of the data for raw material production and concrete production are taken from local, Ser-bian suppliers and manufacturers (Marinkovic, S. et all, 2008). The rest of necessary data are taken from SimaPro database (PRe Consultants, 2007).
3.4 Environmental impact categories
The environmental impact categories included in this work are: Global Warming Potential (GWP), Eutrophication Potential (EP), Acidification Potential (AP) and Photochemical Oxidant Creation Potential (POCP). The global warming potential is estimated by calculating the amount of emitted greenhouse gasses per functional unit of produced material and then given in g CO2-equivalents per g for each gas, Table 1 (Jensen at al. 1997), according to:
i
i
i mGWPeqgCOGWP .)( 2 (1)
Table 1. GWP given in g CO2-eq./g gas
Substance Formula GWP, 20 years GWP, 100 years GWP, 500 years
Emissions to air
Carbon dioxide CO2 1 1 1 Methane CH4 62 25 7.5 Nitrogen dioxide NO2 290 320 180 Tri-chloromethane CHCl3 15 5 1
The eutrophication is expressed as PO4
-3-equivalents, Table 2, (Jensen at al. 1997). The eutro-
phication potential of a process is estimated according to:
i
i
i mEPeqgPOEP .)( 3
4 (2)
Table 2. Eutrophication potentials (EP) in g PO4-3
-eq./g
Substance EP g PO4
-3-eq./g
Emissions to air
N 0.42 NOx 0.13 NH3 0.35
62
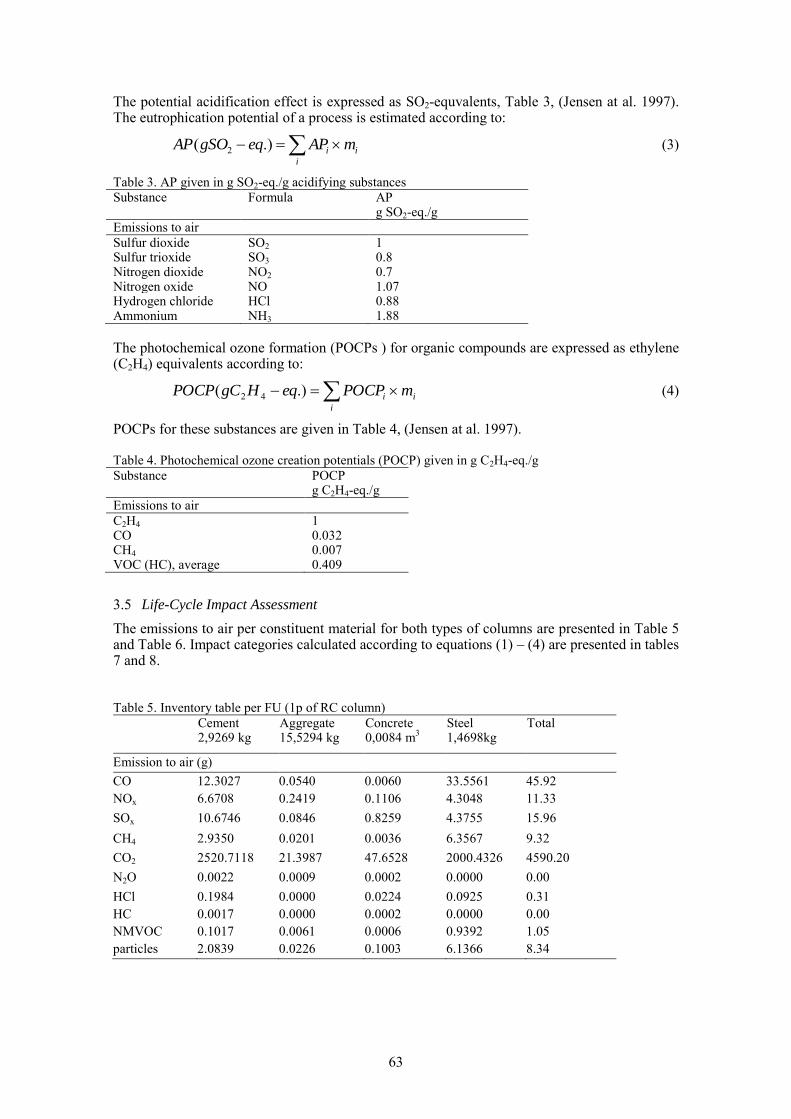
The potential acidification effect is expressed as SO2-equvalents, Table 3, (Jensen at al. 1997). The eutrophication potential of a process is estimated according to:
i
i
i mAPeqgSOAP .)( 2 (3)
Table 3. AP given in g SO2-eq./g acidifying substances
Substance Formula AP g SO2-eq./g
Emissions to air
Sulfur dioxide SO2 1 Sulfur trioxide SO3 0.8 Nitrogen dioxide NO2 0.7 Nitrogen oxide NO 1.07 Hydrogen chloride HCl 0.88 Ammonium NH3 1.88
The photochemical ozone formation (POCPs ) for organic compounds are expressed as ethylene (C2H4) equivalents according to:
i
i
i mPOCPeqHgCPOCP .)( 42 (4)
POCPs for these substances are given in Table 4, (Jensen at al. 1997). Table 4. Photochemical ozone creation potentials (POCP) given in g C2H4-eq./g
Substance POCP g C2H4-eq./g
Emissions to air
C2H4 1 CO 0.032 CH4 0.007 VOC (HC), average 0.409
3.5 Life-Cycle Impact Assessment
The emissions to air per constituent material for both types of columns are presented in Table 5 and Table 6. Impact categories calculated according to equations (1) – (4) are presented in tables 7 and 8. Table 5. Inventory table per FU (1p of RC column)
Cement 2,9269 kg
Aggregate 15,5294 kg
Concrete 0,0084 m
3
Steel 1,4698kg
Total
Emission to air (g)
CO 12.3027 0.0540 0.0060 33.5561 45.92
NOx 6.6708 0.2419 0.1106 4.3048 11.33
SOx 10.6746 0.0846 0.8259 4.3755 15.96
CH4 2.9350 0.0201 0.0036 6.3567 9.32
CO2 2520.7118 21.3987 47.6528 2000.4326 4590.20
N2O 0.0022 0.0009 0.0002 0.0000 0.00
HCl 0.1984 0.0000 0.0224 0.0925 0.31
HC 0.0017 0.0000 0.0002 0.0000 0.00
NMVOC 0.1017 0.0061 0.0006 0.9392 1.05
particles 2.0839 0.0226 0.1003 6.1366 8.34
63
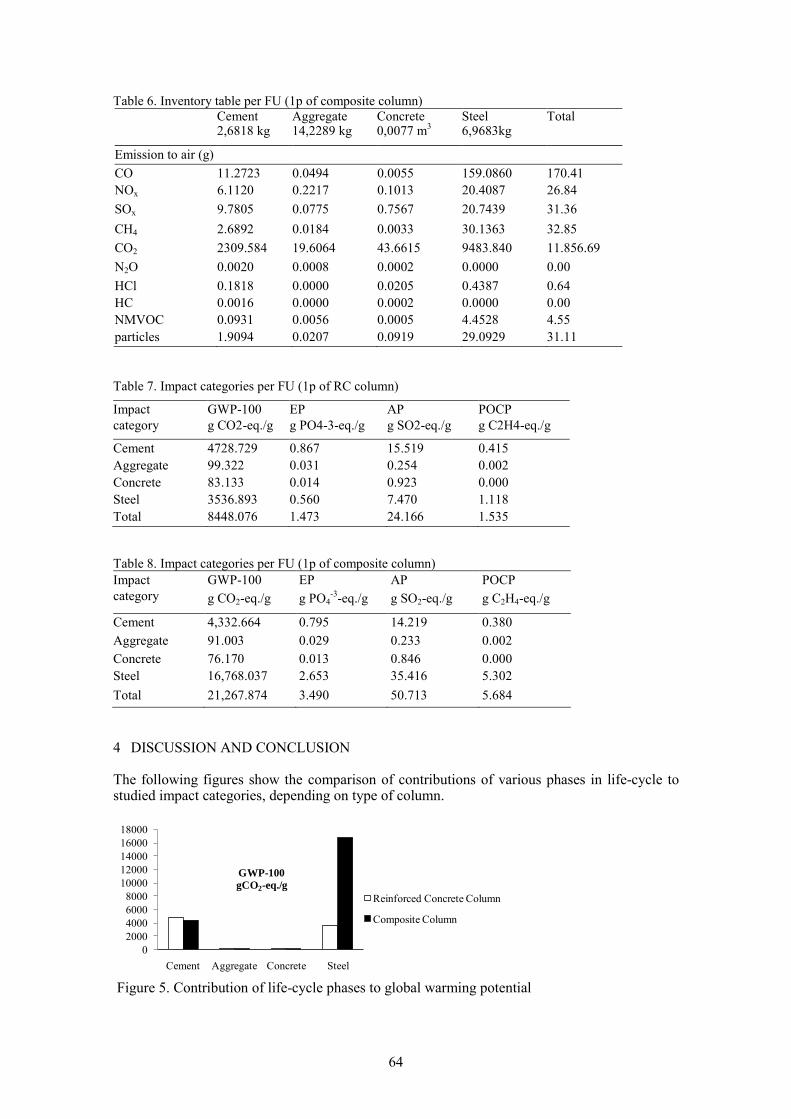
Table 6. Inventory table per FU (1p of composite column)
Cement 2,6818 kg
Aggregate 14,2289 kg
Concrete 0,0077 m
3
Steel 6,9683kg
Total
Emission to air (g)
CO 11.2723 0.0494 0.0055 159.0860 170.41
NOx 6.1120 0.2217 0.1013 20.4087 26.84
SOx 9.7805 0.0775 0.7567 20.7439 31.36
CH4 2.6892 0.0184 0.0033 30.1363 32.85
CO2 2309.584 19.6064 43.6615 9483.840 11.856.69
N2O 0.0020 0.0008 0.0002 0.0000 0.00
HCl 0.1818 0.0000 0.0205 0.4387 0.64
HC 0.0016 0.0000 0.0002 0.0000 0.00
NMVOC 0.0931 0.0056 0.0005 4.4528 4.55
particles 1.9094 0.0207 0.0919 29.0929 31.11
Table 7. Impact categories per FU (1p of RC column)
Impact
category
GWP-100
g CO2-eq./g
EP
g PO4-3-eq./g
AP
g SO2-eq./g
POCP
g C2H4-eq./g
Cement 4728.729 0.867 15.519 0.415
Aggregate 99.322 0.031 0.254 0.002
Concrete 83.133 0.014 0.923 0.000
Steel 3536.893 0.560 7.470 1.118
Total 8448.076 1.473 24.166 1.535
Table 8. Impact categories per FU (1p of composite column)
Impact
category
GWP-100 EP AP POCP
g CO2-eq./g g PO4-3
-eq./g g SO2-eq./g g C2H4-eq./g
Cement 4,332.664 0.795 14.219 0.380
Aggregate 91.003 0.029 0.233 0.002
Concrete 76.170 0.013 0.846 0.000
Steel 16,768.037 2.653 35.416 5.302
Total 21,267.874 3.490 50.713 5.684
4 DISCUSSION AND CONCLUSION
The following figures show the comparison of contributions of various phases in life-cycle to studied impact categories, depending on type of column.
0
2000
4000
6000
8000
10000
12000
14000
16000
18000
Cement Aggregate Concrete Steel
GWP-100
gCO2-eq./g
Reinforced Concrete Column
Composite Column
Figure 5. Contribution of life-cycle phases to global warming potential
64
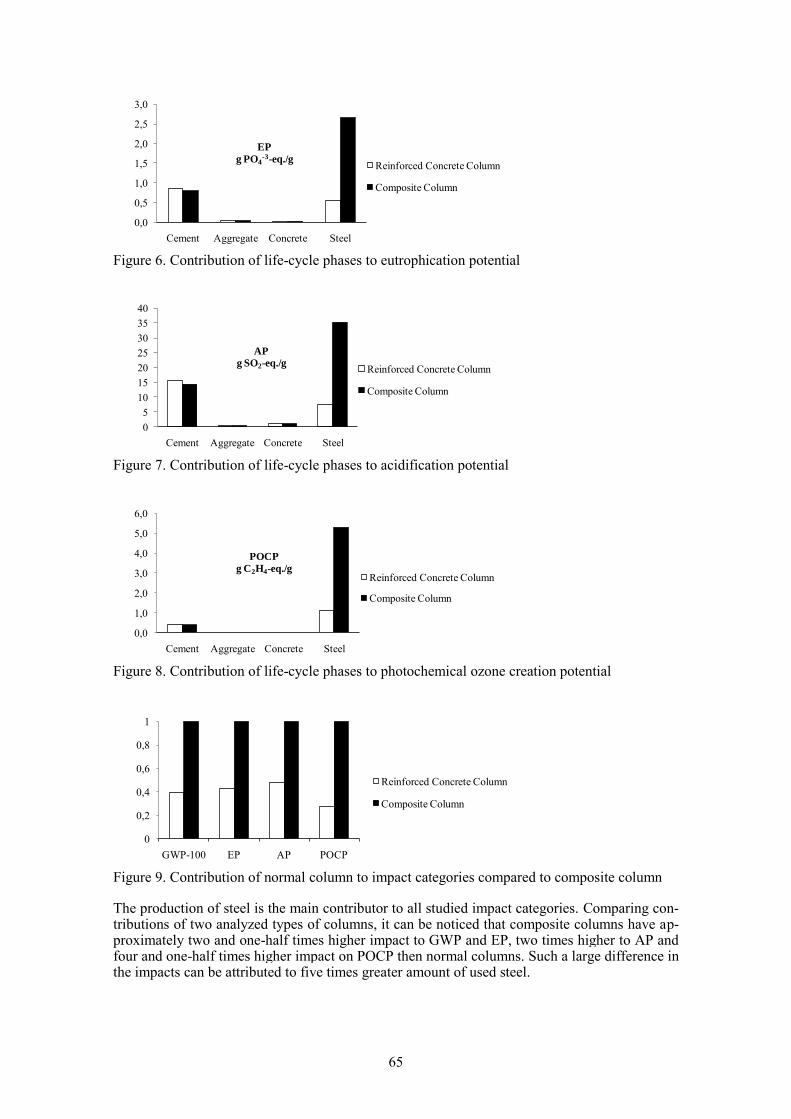
0,0
0,5
1,0
1,5
2,0
2,5
3,0
Cement Aggregate Concrete Steel
EP
g PO4-3-eq./g
Reinforced Concrete Column
Composite Column
Figure 6. Contribution of life-cycle phases to eutrophication potential
0
5
10
15
20
25
30
35
40
Cement Aggregate Concrete Steel
AP
g SO2-eq./gReinforced Concrete Column
Composite Column
Figure 7. Contribution of life-cycle phases to acidification potential
0,0
1,0
2,0
3,0
4,0
5,0
6,0
Cement Aggregate Concrete Steel
POCP
g C2H4-eq./gReinforced Concrete Column
Composite Column
Figure 8. Contribution of life-cycle phases to photochemical ozone creation potential
0
0,2
0,4
0,6
0,8
1
GWP-100 EP AP POCP
Reinforced Concrete Column
Composite Column
Figure 9. Contribution of normal column to impact categories compared to composite column
The production of steel is the main contributor to all studied impact categories. Comparing con-tributions of two analyzed types of columns, it can be noticed that composite columns have ap-proximately two and one-half times higher impact to GWP and EP, two times higher to AP and four and one-half times higher impact on POCP then normal columns. Such a large difference in the impacts can be attributed to five times greater amount of used steel.
65
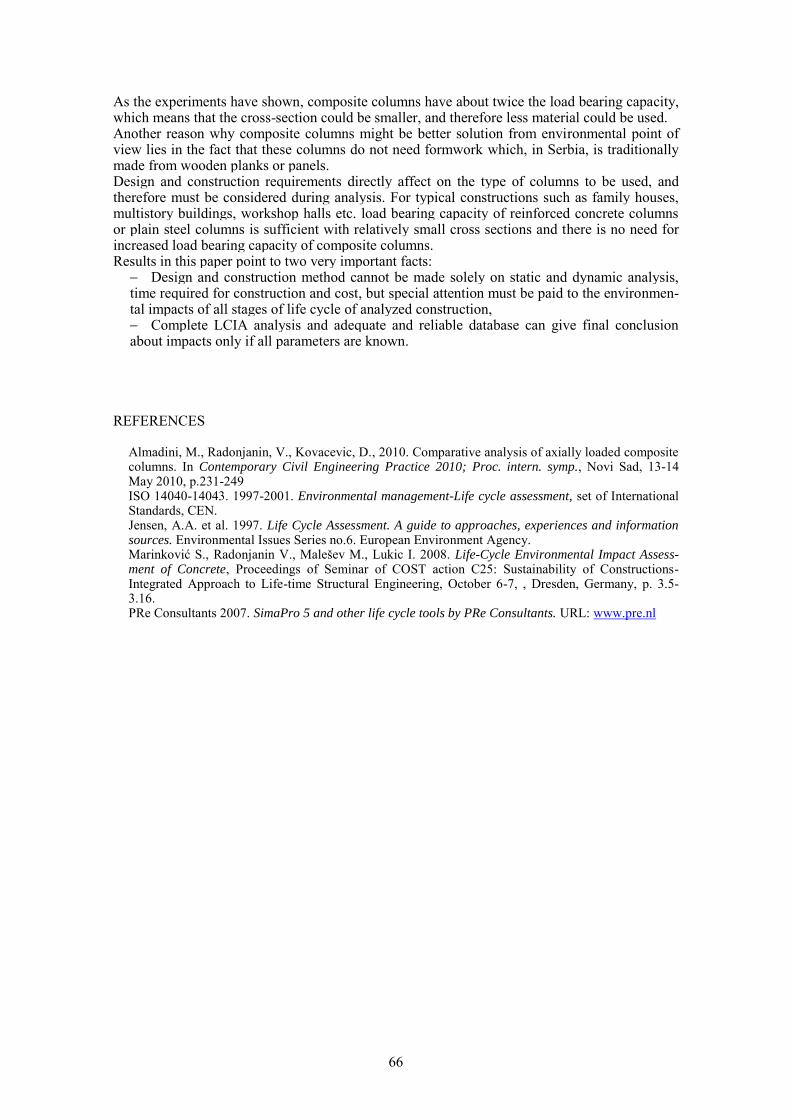
As the experiments have shown, composite columns have about twice the load bearing capacity, which means that the cross-section could be smaller, and therefore less material could be used. Another reason why composite columns might be better solution from environmental point of view lies in the fact that these columns do not need formwork which, in Serbia, is traditionally made from wooden planks or panels. Design and construction requirements directly affect on the type of columns to be used, and therefore must be considered during analysis. For typical constructions such as family houses, multistory buildings, workshop halls etc. load bearing capacity of reinforced concrete columns or plain steel columns is sufficient with relatively small cross sections and there is no need for increased load bearing capacity of composite columns. Results in this paper point to two very important facts:
Design and construction method cannot be made solely on static and dynamic analysis, time required for construction and cost, but special attention must be paid to the environmen-tal impacts of all stages of life cycle of analyzed construction, Complete LCIA analysis and adequate and reliable database can give final conclusion about impacts only if all parameters are known.
REFERENCES
Almadini, M., Radonjanin, V., Kovacevic, D., 2010. Comparative analysis of axially loaded composite columns. In Contemporary Civil Engineering Practice 2010; Proc. intern. symp., Novi Sad, 13-14 May 2010, p.231-249 ISO 14040-14043. 1997-2001. Environmental management-Life cycle assessment, set of International Standards, CEN. Jensen, A.A. et al. 1997. Life Cycle Assessment. A guide to approaches, experiences and information sources. Environmental Issues Series no.6. European Environment Agency. Marinković S., Radonjanin V., Malešev M., Lukic I. 2008. Life-Cycle Environmental Impact Assess-ment of Concrete, Proceedings of Seminar of COST action C25: Sustainability of Constructions-Integrated Approach to Life-time Structural Engineering, October 6-7, , Dresden, Germany, p. 3.5-3.16. PRe Consultants 2007. SimaPro 5 and other life cycle tools by PRe Consultants. URL: www.pre.nl
66
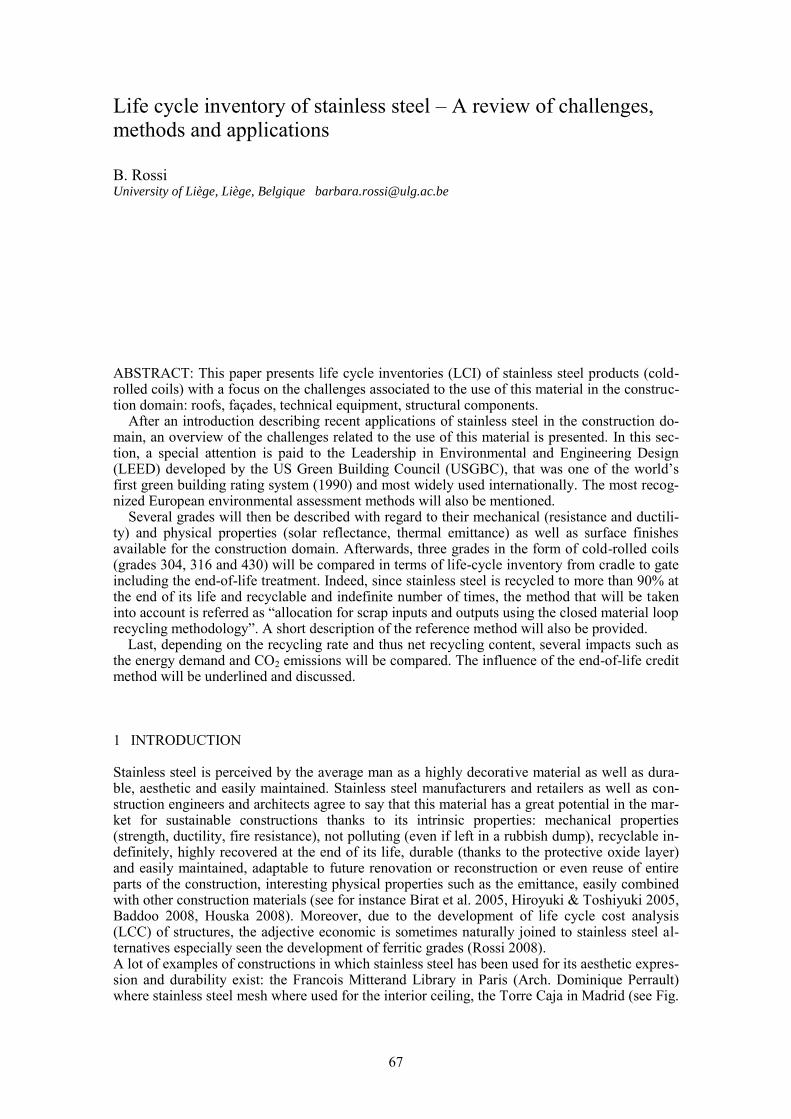
1 INTRODUCTION
Stainless steel is perceived by the average man as a highly decorative material as well as dura-ble, aesthetic and easily maintained. Stainless steel manufacturers and retailers as well as con-struction engineers and architects agree to say that this material has a great potential in the mar-ket for sustainable constructions thanks to its intrinsic properties: mechanical properties (strength, ductility, fire resistance), not polluting (even if left in a rubbish dump), recyclable in-definitely, highly recovered at the end of its life, durable (thanks to the protective oxide layer) and easily maintained, adaptable to future renovation or reconstruction or even reuse of entire parts of the construction, interesting physical properties such as the emittance, easily combined with other construction materials (see for instance Birat et al. 2005, Hiroyuki & Toshiyuki 2005, Baddoo 2008, Houska 2008). Moreover, due to the development of life cycle cost analysis (LCC) of structures, the adjective economic is sometimes naturally joined to stainless steel al-ternatives especially seen the development of ferritic grades (Rossi 2008). A lot of examples of constructions in which stainless steel has been used for its aesthetic expres-sion and durability exist: the Francois Mitterand Library in Paris (Arch. Dominique Perrault) where stainless steel mesh where used for the interior ceiling, the Torre Caja in Madrid (see Fig.
Life cycle inventory of stainless steel – A review of challenges, methods and applications
B. Rossi University of Liège, Liège, Belgique [email protected]
ABSTRACT: This paper presents life cycle inventories (LCI) of stainless steel products (cold-rolled coils) with a focus on the challenges associated to the use of this material in the construc-tion domain: roofs, façades, technical equipment, structural components.
After an introduction describing recent applications of stainless steel in the construction do-main, an overview of the challenges related to the use of this material is presented. In this sec-tion, a special attention is paid to the Leadership in Environmental and Engineering Design (LEED) developed by the US Green Building Council (USGBC), that was one of the world’s first green building rating system (1990) and most widely used internationally. The most recog-nized European environmental assessment methods will also be mentioned.
Several grades will then be described with regard to their mechanical (resistance and ductili-ty) and physical properties (solar reflectance, thermal emittance) as well as surface finishes available for the construction domain. Afterwards, three grades in the form of cold-rolled coils (grades 304, 316 and 430) will be compared in terms of life-cycle inventory from cradle to gate including the end-of-life treatment. Indeed, since stainless steel is recycled to more than 90% at the end of its life and recyclable and indefinite number of times, the method that will be taken into account is referred as “allocation for scrap inputs and outputs using the closed material loop recycling methodology”. A short description of the reference method will also be provided. Last, depending on the recycling rate and thus net recycling content, several impacts such as the energy demand and CO2 emissions will be compared. The influence of the end-of-life credit method will be underlined and discussed.
67
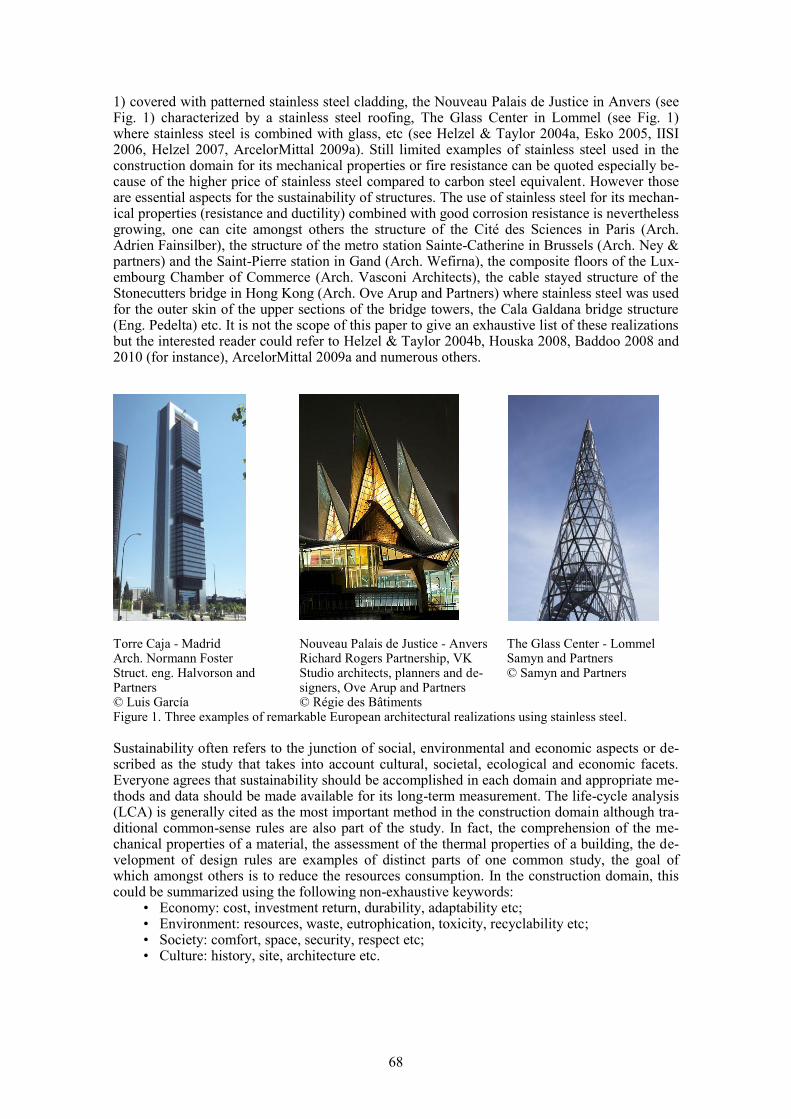
1) covered with patterned stainless steel cladding, the Nouveau Palais de Justice in Anvers (see Fig. 1) characterized by a stainless steel roofing, The Glass Center in Lommel (see Fig. 1) where stainless steel is combined with glass, etc (see Helzel & Taylor 2004a, Esko 2005, IISI 2006, Helzel 2007, ArcelorMittal 2009a). Still limited examples of stainless steel used in the construction domain for its mechanical properties or fire resistance can be quoted especially be-cause of the higher price of stainless steel compared to carbon steel equivalent. However those are essential aspects for the sustainability of structures. The use of stainless steel for its mechan-ical properties (resistance and ductility) combined with good corrosion resistance is nevertheless growing, one can cite amongst others the structure of the Cité des Sciences in Paris (Arch. Adrien Fainsilber), the structure of the metro station Sainte-Catherine in Brussels (Arch. Ney & partners) and the Saint-Pierre station in Gand (Arch. Wefirna), the composite floors of the Lux-embourg Chamber of Commerce (Arch. Vasconi Architects), the cable stayed structure of the Stonecutters bridge in Hong Kong (Arch. Ove Arup and Partners) where stainless steel was used for the outer skin of the upper sections of the bridge towers, the Cala Galdana bridge structure (Eng. Pedelta) etc. It is not the scope of this paper to give an exhaustive list of these realizations but the interested reader could refer to Helzel & Taylor 2004b, Houska 2008, Baddoo 2008 and 2010 (for instance), ArcelorMittal 2009a and numerous others. Torre Caja - Madrid Arch. Normann Foster Struct. eng. Halvorson and Partners © Luis García
Nouveau Palais de Justice - Anvers Richard Rogers Partnership, VK Studio architects, planners and de-signers, Ove Arup and Partners © Régie des Bâtiments
The Glass Center - Lommel Samyn and Partners © Samyn and Partners
Figure 1. Three examples of remarkable European architectural realizations using stainless steel.
Sustainability often refers to the junction of social, environmental and economic aspects or de-scribed as the study that takes into account cultural, societal, ecological and economic facets. Everyone agrees that sustainability should be accomplished in each domain and appropriate me-thods and data should be made available for its long-term measurement. The life-cycle analysis (LCA) is generally cited as the most important method in the construction domain although tra-ditional common-sense rules are also part of the study. In fact, the comprehension of the me-chanical properties of a material, the assessment of the thermal properties of a building, the de-velopment of design rules are examples of distinct parts of one common study, the goal of which amongst others is to reduce the resources consumption. In the construction domain, this could be summarized using the following non-exhaustive keywords:
• Economy: cost, investment return, durability, adaptability etc; • Environment: resources, waste, eutrophication, toxicity, recyclability etc; • Society: comfort, space, security, respect etc; • Culture: history, site, architecture etc.
68
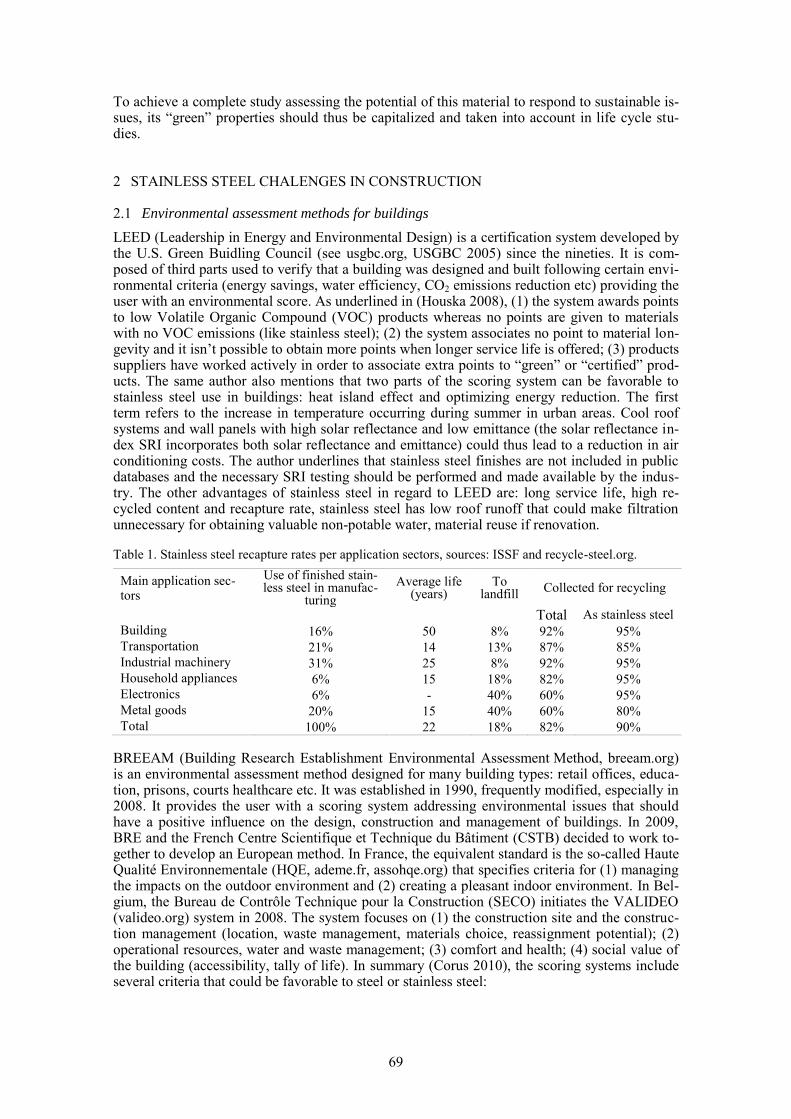
To achieve a complete study assessing the potential of this material to respond to sustainable is-sues, its “green” properties should thus be capitalized and taken into account in life cycle stu-dies.
2 STAINLESS STEEL CHALENGES IN CONSTRUCTION
2.1 Environmental assessment methods for buildings
LEED (Leadership in Energy and Environmental Design) is a certification system developed by the U.S. Green Buidling Council (see usgbc.org, USGBC 2005) since the nineties. It is com-posed of third parts used to verify that a building was designed and built following certain envi-ronmental criteria (energy savings, water efficiency, CO2 emissions reduction etc) providing the user with an environmental score. As underlined in (Houska 2008), (1) the system awards points to low Volatile Organic Compound (VOC) products whereas no points are given to materials with no VOC emissions (like stainless steel); (2) the system associates no point to material lon-gevity and it isn’t possible to obtain more points when longer service life is offered; (3) products suppliers have worked actively in order to associate extra points to “green” or “certified” prod-ucts. The same author also mentions that two parts of the scoring system can be favorable to stainless steel use in buildings: heat island effect and optimizing energy reduction. The first term refers to the increase in temperature occurring during summer in urban areas. Cool roof systems and wall panels with high solar reflectance and low emittance (the solar reflectance in-dex SRI incorporates both solar reflectance and emittance) could thus lead to a reduction in air conditioning costs. The author underlines that stainless steel finishes are not included in public databases and the necessary SRI testing should be performed and made available by the indus-try. The other advantages of stainless steel in regard to LEED are: long service life, high re-cycled content and recapture rate, stainless steel has low roof runoff that could make filtration unnecessary for obtaining valuable non-potable water, material reuse if renovation. Table 1. Stainless steel recapture rates per application sectors, sources: ISSF and recycle-steel.org.
Main application sec-tors
Use of finished stain-less steel in manufac-
turing
Average life (years)
To landfill
Collected for recycling
Total As stainless steel
Building 16% 50 8% 92% 95% Transportation 21% 14 13% 87% 85% Industrial machinery 31% 25 8% 92% 95% Household appliances 6% 15 18% 82% 95% Electronics 6% - 40% 60% 95% Metal goods 20% 15 40% 60% 80% Total 100% 22 18% 82% 90%
BREEAM (Building Research Establishment Environmental Assessment Method, breeam.org) is an environmental assessment method designed for many building types: retail offices, educa-tion, prisons, courts healthcare etc. It was established in 1990, frequently modified, especially in 2008. It provides the user with a scoring system addressing environmental issues that should have a positive influence on the design, construction and management of buildings. In 2009, BRE and the French Centre Scientifique et Technique du Bâtiment (CSTB) decided to work to-gether to develop an European method. In France, the equivalent standard is the so-called Haute Qualité Environnementale (HQE, ademe.fr, assohqe.org) that specifies criteria for (1) managing the impacts on the outdoor environment and (2) creating a pleasant indoor environment. In Bel-gium, the Bureau de Contrôle Technique pour la Construction (SECO) initiates the VALIDEO (valideo.org) system in 2008. The system focuses on (1) the construction site and the construc-tion management (location, waste management, materials choice, reassignment potential); (2) operational resources, water and waste management; (3) comfort and health; (4) social value of the building (accessibility, tally of life). In summary (Corus 2010), the scoring systems include several criteria that could be favorable to steel or stainless steel:
69
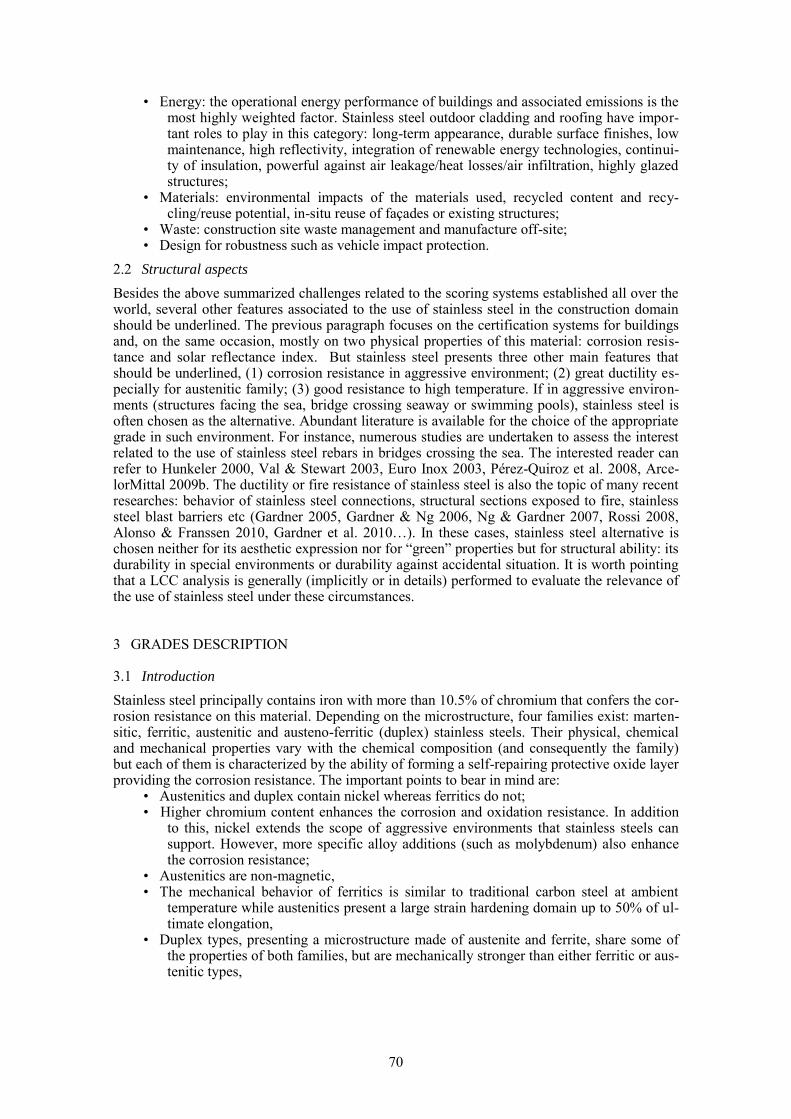
• Energy: the operational energy performance of buildings and associated emissions is the most highly weighted factor. Stainless steel outdoor cladding and roofing have impor-tant roles to play in this category: long-term appearance, durable surface finishes, low maintenance, high reflectivity, integration of renewable energy technologies, continui-ty of insulation, powerful against air leakage/heat losses/air infiltration, highly glazed structures;
• Materials: environmental impacts of the materials used, recycled content and recy-cling/reuse potential, in-situ reuse of façades or existing structures;
• Waste: construction site waste management and manufacture off-site; • Design for robustness such as vehicle impact protection.
2.2 Structural aspects
Besides the above summarized challenges related to the scoring systems established all over the world, several other features associated to the use of stainless steel in the construction domain should be underlined. The previous paragraph focuses on the certification systems for buildings and, on the same occasion, mostly on two physical properties of this material: corrosion resis-tance and solar reflectance index. But stainless steel presents three other main features that should be underlined, (1) corrosion resistance in aggressive environment; (2) great ductility es-pecially for austenitic family; (3) good resistance to high temperature. If in aggressive environ-ments (structures facing the sea, bridge crossing seaway or swimming pools), stainless steel is often chosen as the alternative. Abundant literature is available for the choice of the appropriate grade in such environment. For instance, numerous studies are undertaken to assess the interest related to the use of stainless steel rebars in bridges crossing the sea. The interested reader can refer to Hunkeler 2000, Val & Stewart 2003, Euro Inox 2003, Pérez-Quiroz et al. 2008, Arce-lorMittal 2009b. The ductility or fire resistance of stainless steel is also the topic of many recent researches: behavior of stainless steel connections, structural sections exposed to fire, stainless steel blast barriers etc (Gardner 2005, Gardner & Ng 2006, Ng & Gardner 2007, Rossi 2008, Alonso & Franssen 2010, Gardner et al. 2010…). In these cases, stainless steel alternative is chosen neither for its aesthetic expression nor for “green” properties but for structural ability: its durability in special environments or durability against accidental situation. It is worth pointing that a LCC analysis is generally (implicitly or in details) performed to evaluate the relevance of the use of stainless steel under these circumstances.
3 GRADES DESCRIPTION
3.1 Introduction
Stainless steel principally contains iron with more than 10.5% of chromium that confers the cor-rosion resistance on this material. Depending on the microstructure, four families exist: marten-sitic, ferritic, austenitic and austeno-ferritic (duplex) stainless steels. Their physical, chemical and mechanical properties vary with the chemical composition (and consequently the family) but each of them is characterized by the ability of forming a self-repairing protective oxide layer providing the corrosion resistance. The important points to bear in mind are:
• Austenitics and duplex contain nickel whereas ferritics do not; • Higher chromium content enhances the corrosion and oxidation resistance. In addition
to this, nickel extends the scope of aggressive environments that stainless steels can support. However, more specific alloy additions (such as molybdenum) also enhance the corrosion resistance;
• Austenitics are non-magnetic, • The mechanical behavior of ferritics is similar to traditional carbon steel at ambient
temperature while austenitics present a large strain hardening domain up to 50% of ul-timate elongation,
• Duplex types, presenting a microstructure made of austenite and ferrite, share some of the properties of both families, but are mechanically stronger than either ferritic or aus-tenitic types,
70
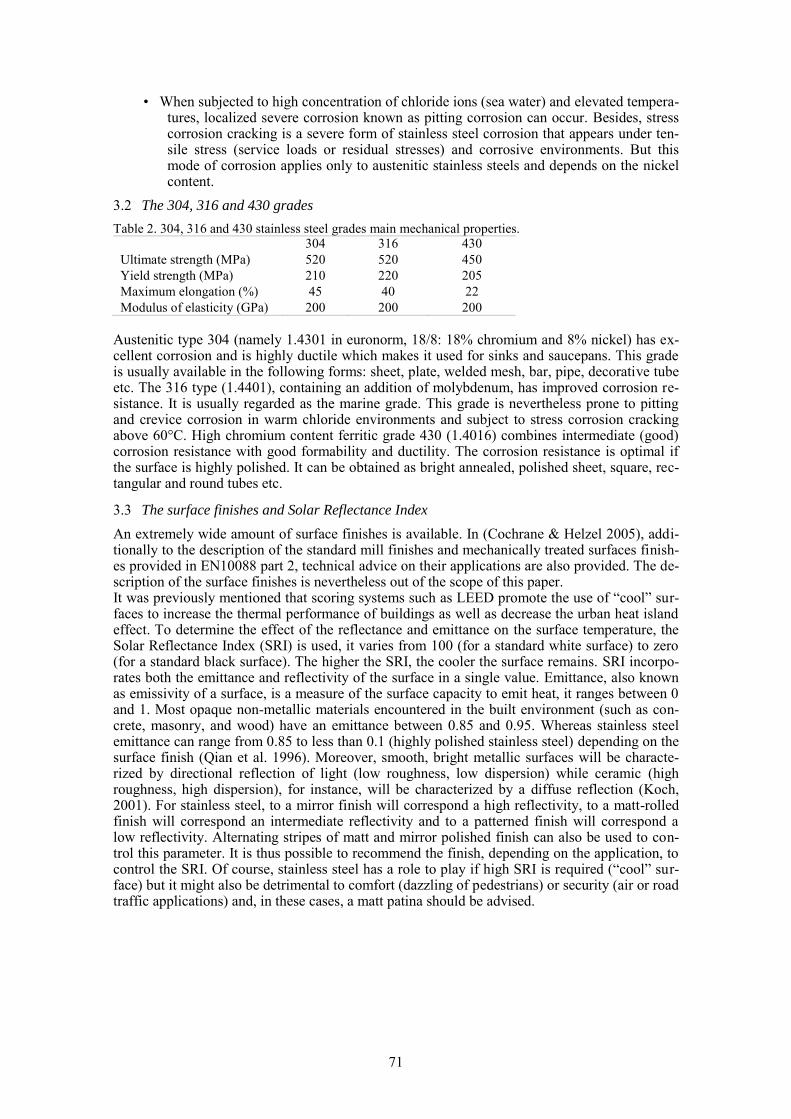
• When subjected to high concentration of chloride ions (sea water) and elevated tempera-tures, localized severe corrosion known as pitting corrosion can occur. Besides, stress corrosion cracking is a severe form of stainless steel corrosion that appears under ten-sile stress (service loads or residual stresses) and corrosive environments. But this mode of corrosion applies only to austenitic stainless steels and depends on the nickel content.
3.2 The 304, 316 and 430 grades
Table 2. 304, 316 and 430 stainless steel grades main mechanical properties.
304 316 430
Ultimate strength (MPa) 520 520 450
Yield strength (MPa) 210 220 205
Maximum elongation (%) 45 40 22
Modulus of elasticity (GPa) 200 200 200
Austenitic type 304 (namely 1.4301 in euronorm, 18/8: 18% chromium and 8% nickel) has ex-cellent corrosion and is highly ductile which makes it used for sinks and saucepans. This grade is usually available in the following forms: sheet, plate, welded mesh, bar, pipe, decorative tube etc. The 316 type (1.4401), containing an addition of molybdenum, has improved corrosion re-sistance. It is usually regarded as the marine grade. This grade is nevertheless prone to pitting and crevice corrosion in warm chloride environments and subject to stress corrosion cracking above 60°C. High chromium content ferritic grade 430 (1.4016) combines intermediate (good) corrosion resistance with good formability and ductility. The corrosion resistance is optimal if the surface is highly polished. It can be obtained as bright annealed, polished sheet, square, rec-tangular and round tubes etc.
3.3 The surface finishes and Solar Reflectance Index
An extremely wide amount of surface finishes is available. In (Cochrane & Helzel 2005), addi-tionally to the description of the standard mill finishes and mechanically treated surfaces finish-es provided in EN10088 part 2, technical advice on their applications are also provided. The de-scription of the surface finishes is nevertheless out of the scope of this paper. It was previously mentioned that scoring systems such as LEED promote the use of “cool” sur-faces to increase the thermal performance of buildings as well as decrease the urban heat island effect. To determine the effect of the reflectance and emittance on the surface temperature, the Solar Reflectance Index (SRI) is used, it varies from 100 (for a standard white surface) to zero (for a standard black surface). The higher the SRI, the cooler the surface remains. SRI incorpo-rates both the emittance and reflectivity of the surface in a single value. Emittance, also known as emissivity of a surface, is a measure of the surface capacity to emit heat, it ranges between 0 and 1. Most opaque non-metallic materials encountered in the built environment (such as con-crete, masonry, and wood) have an emittance between 0.85 and 0.95. Whereas stainless steel emittance can range from 0.85 to less than 0.1 (highly polished stainless steel) depending on the surface finish (Qian et al. 1996). Moreover, smooth, bright metallic surfaces will be characte-rized by directional reflection of light (low roughness, low dispersion) while ceramic (high roughness, high dispersion), for instance, will be characterized by a diffuse reflection (Koch, 2001). For stainless steel, to a mirror finish will correspond a high reflectivity, to a matt-rolled finish will correspond an intermediate reflectivity and to a patterned finish will correspond a low reflectivity. Alternating stripes of matt and mirror polished finish can also be used to con-trol this parameter. It is thus possible to recommend the finish, depending on the application, to control the SRI. Of course, stainless steel has a role to play if high SRI is required (“cool” sur-face) but it might also be detrimental to comfort (dazzling of pedestrians) or security (air or road traffic applications) and, in these cases, a matt patina should be advised.
71
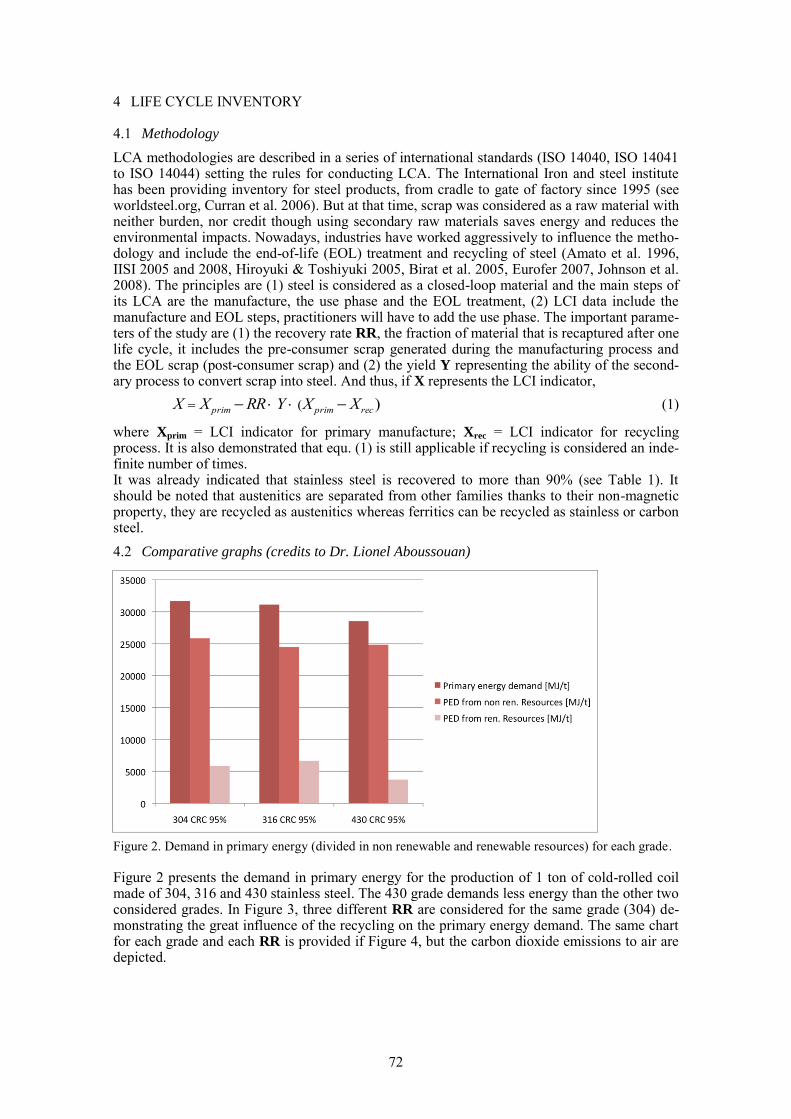
4 LIFE CYCLE INVENTORY
4.1 Methodology
LCA methodologies are described in a series of international standards (ISO 14040, ISO 14041 to ISO 14044) setting the rules for conducting LCA. The International Iron and steel institute has been providing inventory for steel products, from cradle to gate of factory since 1995 (see worldsteel.org, Curran et al. 2006). But at that time, scrap was considered as a raw material with neither burden, nor credit though using secondary raw materials saves energy and reduces the environmental impacts. Nowadays, industries have worked aggressively to influence the metho-dology and include the end-of-life (EOL) treatment and recycling of steel (Amato et al. 1996, IISI 2005 and 2008, Hiroyuki & Toshiyuki 2005, Birat et al. 2005, Eurofer 2007, Johnson et al. 2008). The principles are (1) steel is considered as a closed-loop material and the main steps of its LCA are the manufacture, the use phase and the EOL treatment, (2) LCI data include the manufacture and EOL steps, practitioners will have to add the use phase. The important parame-ters of the study are (1) the recovery rate RR, the fraction of material that is recaptured after one life cycle, it includes the pre-consumer scrap generated during the manufacturing process and the EOL scrap (post-consumer scrap) and (2) the yield Y representing the ability of the second-ary process to convert scrap into steel. And thus, if X represents the LCI indicator,
X Xprim RR Y (Xprim Xrec) (1)
where Xprim = LCI indicator for primary manufacture; Xrec = LCI indicator for recycling process. It is also demonstrated that equ. (1) is still applicable if recycling is considered an inde-finite number of times. It was already indicated that stainless steel is recovered to more than 90% (see Table 1). It should be noted that austenitics are separated from other families thanks to their non-magnetic property, they are recycled as austenitics whereas ferritics can be recycled as stainless or carbon steel.
4.2 Comparative graphs (credits to Dr. Lionel Aboussouan)
Figure 2. Demand in primary energy (divided in non renewable and renewable resources) for each grade.
Figure 2 presents the demand in primary energy for the production of 1 ton of cold-rolled coil made of 304, 316 and 430 stainless steel. The 430 grade demands less energy than the other two considered grades. In Figure 3, three different RR are considered for the same grade (304) de-monstrating the great influence of the recycling on the primary energy demand. The same chart for each grade and each RR is provided if Figure 4, but the carbon dioxide emissions to air are depicted.
72
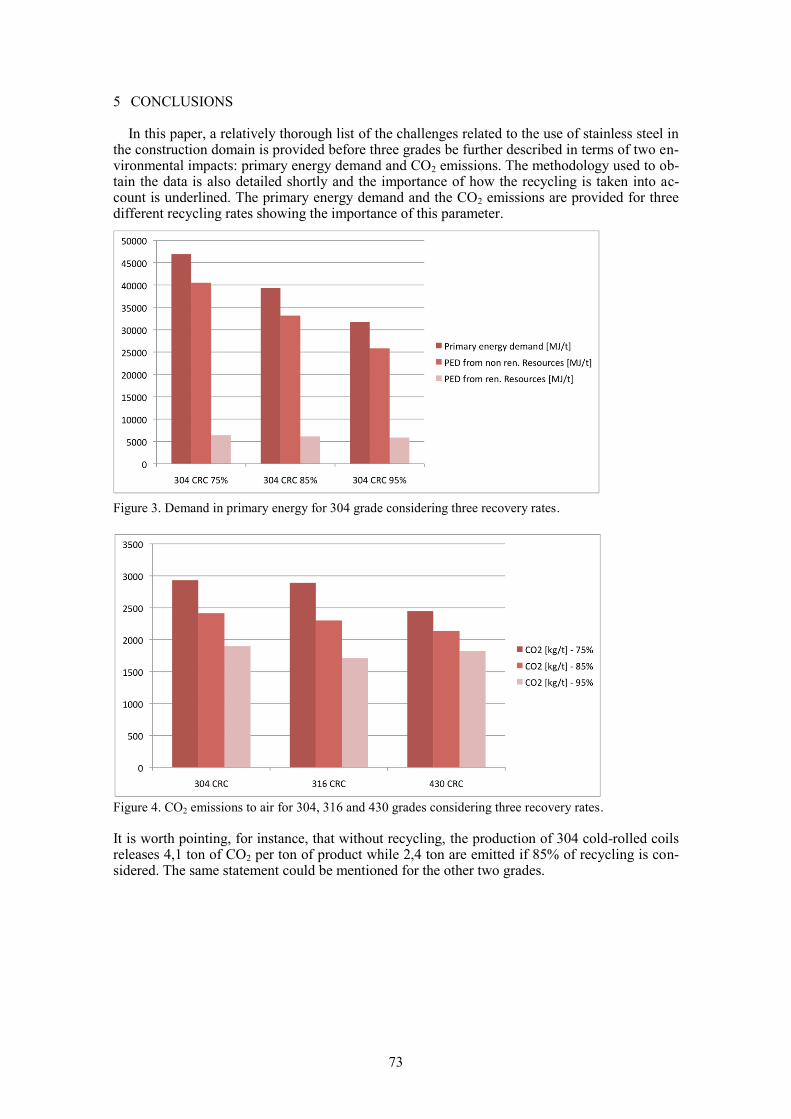
5 CONCLUSIONS
In this paper, a relatively thorough list of the challenges related to the use of stainless steel in the construction domain is provided before three grades be further described in terms of two en-vironmental impacts: primary energy demand and CO2 emissions. The methodology used to ob-tain the data is also detailed shortly and the importance of how the recycling is taken into ac-count is underlined. The primary energy demand and the CO2 emissions are provided for three different recycling rates showing the importance of this parameter.
Figure 3. Demand in primary energy for 304 grade considering three recovery rates.
Figure 4. CO2 emissions to air for 304, 316 and 430 grades considering three recovery rates.
It is worth pointing, for instance, that without recycling, the production of 304 cold-rolled coils releases 4,1 ton of CO2 per ton of product while 2,4 ton are emitted if 85% of recycling is con-sidered. The same statement could be mentioned for the other two grades.
73
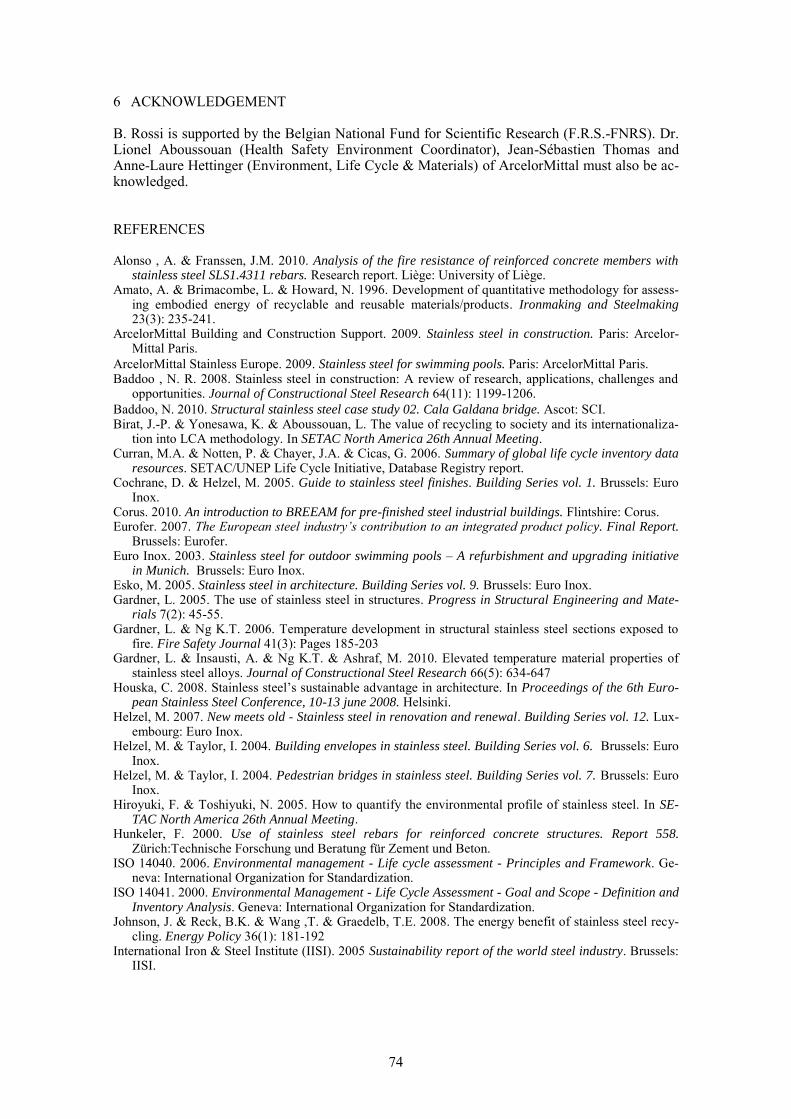
6 ACKNOWLEDGEMENT
B. Rossi is supported by the Belgian National Fund for Scientific Research (F.R.S.-FNRS). Dr. Lionel Aboussouan (Health Safety Environment Coordinator), Jean-Sébastien Thomas and Anne-Laure Hettinger (Environment, Life Cycle & Materials) of ArcelorMittal must also be ac-knowledged.
REFERENCES
Alonso , A. & Franssen, J.M. 2010. Analysis of the fire resistance of reinforced concrete members with stainless steel SLS1.4311 rebars. Research report. Liège: University of Liège.
Amato, A. & Brimacombe, L. & Howard, N. 1996. Development of quantitative methodology for assess-ing embodied energy of recyclable and reusable materials/products. Ironmaking and Steelmaking 23(3): 235-241.
ArcelorMittal Building and Construction Support. 2009. Stainless steel in construction. Paris: Arcelor-Mittal Paris.
ArcelorMittal Stainless Europe. 2009. Stainless steel for swimming pools. Paris: ArcelorMittal Paris. Baddoo , N. R. 2008. Stainless steel in construction: A review of research, applications, challenges and
opportunities. Journal of Constructional Steel Research 64(11): 1199-1206.
Baddoo, N. 2010. Structural stainless steel case study 02. Cala Galdana bridge. Ascot: SCI. Birat, J.-P. & Yonesawa, K. & Aboussouan, L. The value of recycling to society and its internationaliza-
tion into LCA methodology. In SETAC North America 26th Annual Meeting. Curran, M.A. & Notten, P. & Chayer, J.A. & Cicas, G. 2006. Summary of global life cycle inventory data
resources. SETAC/UNEP Life Cycle Initiative, Database Registry report. Cochrane, D. & Helzel, M. 2005. Guide to stainless steel finishes. Building Series vol. 1. Brussels: Euro
Inox. Corus. 2010. An introduction to BREEAM for pre-finished steel industrial buildings. Flintshire: Corus. Eurofer. 2007. The European steel industry’s contribution to an integrated product policy. Final Report.
Brussels: Eurofer. Euro Inox. 2003. Stainless steel for outdoor swimming pools – A refurbishment and upgrading initiative
in Munich. Brussels: Euro Inox. Esko, M. 2005. Stainless steel in architecture. Building Series vol. 9. Brussels: Euro Inox. Gardner, L. 2005. The use of stainless steel in structures. Progress in Structural Engineering and Mate-
rials 7(2): 45-55. Gardner, L. & Ng K.T. 2006. Temperature development in structural stainless steel sections exposed to
fire. Fire Safety Journal 41(3): Pages 185-203 Gardner, L. & Insausti, A. & Ng K.T. & Ashraf, M. 2010. Elevated temperature material properties of
stainless steel alloys. Journal of Constructional Steel Research 66(5): 634-647 Houska, C. 2008. Stainless steel’s sustainable advantage in architecture. In Proceedings of the 6th Euro-
pean Stainless Steel Conference, 10-13 june 2008. Helsinki. Helzel, M. 2007. New meets old - Stainless steel in renovation and renewal. Building Series vol. 12. Lux-
embourg: Euro Inox. Helzel, M. & Taylor, I. 2004. Building envelopes in stainless steel. Building Series vol. 6. Brussels: Euro
Inox. Helzel, M. & Taylor, I. 2004. Pedestrian bridges in stainless steel. Building Series vol. 7. Brussels: Euro
Inox. Hiroyuki, F. & Toshiyuki, N. 2005. How to quantify the environmental profile of stainless steel. In SE-
TAC North America 26th Annual Meeting. Hunkeler, F. 2000. Use of stainless steel rebars for reinforced concrete structures. Report 558.
Zürich:Technische Forschung und Beratung für Zement und Beton. ISO 14040. 2006. Environmental management - Life cycle assessment - Principles and Framework. Ge-
neva: International Organization for Standardization. ISO 14041. 2000. Environmental Management - Life Cycle Assessment - Goal and Scope - Definition and
Inventory Analysis. Geneva: International Organization for Standardization. Johnson, J. & Reck, B.K. & Wang ,T. & Graedelb, T.E. 2008. The energy benefit of stainless steel recy-
cling. Energy Policy 36(1): 181-192 International Iron & Steel Institute (IISI). 2005 Sustainability report of the world steel industry. Brussels:
IISI.
74

International Iron & Steel Institute (IISI). 2008. Steel and you: The life of steel. Brussels: IISI. International Iron & Steel Institute (IISI). 2006. Yearbook of stainless steel applications Brussels: IISI. Koch, H. & Otto, A. & Schlump, W. 2001. Stainless steel and the challenge of time. Brussels: Euro Inox. Ng, K.T. & Gardner, L. 2007. Buckling of stainless steel columns and beams in fire. Engineering Struc-
tures 29(5): 717-730 Pérez-Quiroz, J.T. & Terán, J. & Herrera, M.J. & Martínez, M. & Genescá, J. 2008. Assessment of stain-
less steel reinforcement for concrete structures rehabilitation. Journal of Constructional Steel Re-search 64(11): 1317-1324
Qian, J. & Yueyan, S. & Zhiqiang, Y. 1996. Studies on the emittance of stainless steel surface. Renewable Energy 8(1-4): 555-558
Rossi, B. 2008. Mechanical properties, residual stresses and structural behavior of thin-walled stainless steel profiles. PhD thesis. Liège: University of Liège.
US Green Building Council (USGBC). 2005. Version 2.2 Rating System, LEED for New Construction and Major Renovations. Washington: US Green Building Council.
Val, D. & Stewart, M. 2003. Life-cycle cost analysis of reinforced concrete structures in marine environ-ments. Structural safety 25(4): 343-362
75

76
1 INTRODUCTION Sustainable waste management practice promotes the use of waste material as a resource. Until recently tyres were considered as consumables, and once their service life was over and were no longer road-worthy, they were stockpiled in dumping sites or landfills and were replaced by new ones. Legislation in Malta (Laws of Malta 2001 CAP 435 Environment Protection Act) and EU legislation (Landfill Directive 1999/31/EC) no longer permit land filling of scrap (whole or shredded) tyres. At present, scrap tyres generated in Malta are being processed by a private tyre processing facility, with shredded rubber granules being used for the production of other prod-ucts. Tyre derived steel and fibres are not being utilized locally at present since costs for repro-cessing or exportation are considered high.
This paper describes an experimental study carried out to investigate the behaviour and the effect of the addition of tyre derived steel fibres to concrete. The compressive and flexural prop-erties of hardened concrete reinforced with steel fibres from shredded tyres were analysed. The properties of waste tyre fibre concrete were then compared to similar properties from unrein-forced concrete and concrete reinforced with industrial fibres.
The potential use of Waste Tyre Fibres in concrete
Ruben Paul Borg Faculty for the Built Environment, University of Malta, Malta. [email protected]
C. Farrugia Faculty for the Built Environment, University of Malta, Malta
ABSTRACT: This paper presents a preliminary investigation on the potential utilization of
waste tyre fibres, obtained from a tyre recycling plant, as fibre reinforcement in concrete. For
this purpose thirteen mixes, a plain control mix and twelve fibre reinforced mixes were pre-
pared. Three of the mixes were reinforced with shredded tyre fibres, the rest with other indus-
trial fibres available on the market. These were purposely chosen with particular aspect ratios
and geometric shapes. These were added to fresh concrete at three different volume fractions –
1.0, 1.5 and 2.0%. Compressive and flexural tensile strength tests were carried out on different
samples from each mix, to determine the performance of the concrete in the hardened state. The
results obtained indicate that shredded tyre fibres can be favourably used as concrete fibre rein-
forcement. Flexural tests on shredded tyre fibre reinforced concrete show improved perform-
ance over certain industrial fibres available on the market.
77
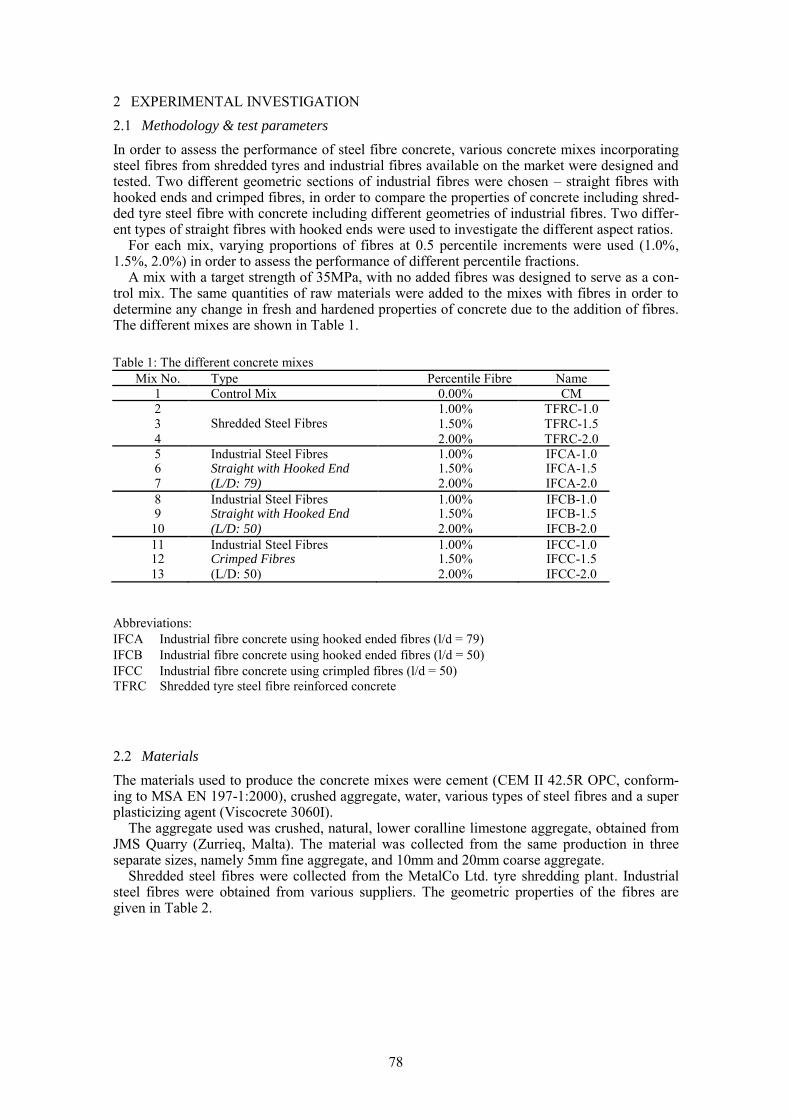
2 EXPERIMENTAL INVESTIGATION
2.1 Methodology & test parameters
In order to assess the performance of steel fibre concrete, various concrete mixes incorporating steel fibres from shredded tyres and industrial fibres available on the market were designed and tested. Two different geometric sections of industrial fibres were chosen – straight fibres with hooked ends and crimped fibres, in order to compare the properties of concrete including shred-ded tyre steel fibre with concrete including different geometries of industrial fibres. Two differ-ent types of straight fibres with hooked ends were used to investigate the different aspect ratios.
For each mix, varying proportions of fibres at 0.5 percentile increments were used (1.0%, 1.5%, 2.0%) in order to assess the performance of different percentile fractions.
A mix with a target strength of 35MPa, with no added fibres was designed to serve as a con-trol mix. The same quantities of raw materials were added to the mixes with fibres in order to determine any change in fresh and hardened properties of concrete due to the addition of fibres. The different mixes are shown in Table 1.
Table 1: The different concrete mixes
Mix No. Type Percentile Fibre Name
1 Control Mix 0.00% CM
2 Shredded Steel Fibres
1.00% TFRC-1.0 3 1.50% TFRC-1.5
4 2.00% TFRC-2.0 5 Industrial Steel Fibres 1.00% IFCA-1.0 6 Straight with Hooked End 1.50% IFCA-1.5 7 (L/D: 79) 2.00% IFCA-2.0
8 Industrial Steel Fibres 1.00% IFCB-1.0 9 Straight with Hooked End 1.50% IFCB-1.5
10 (L/D: 50) 2.00% IFCB-2.0
11 Industrial Steel Fibres 1.00% IFCC-1.0 12 Crimped Fibres 1.50% IFCC-1.5
13 (L/D: 50) 2.00% IFCC-2.0
Abbreviations:
IFCA Industrial fibre concrete using hooked ended fibres (l/d = 79)
IFCB Industrial fibre concrete using hooked ended fibres (l/d = 50)
IFCC Industrial fibre concrete using crimpled fibres (l/d = 50)
TFRC Shredded tyre steel fibre reinforced concrete
2.2 Materials
The materials used to produce the concrete mixes were cement (CEM II 42.5R OPC, conform-ing to MSA EN 197-1:2000), crushed aggregate, water, various types of steel fibres and a super plasticizing agent (Viscocrete 3060I).
The aggregate used was crushed, natural, lower coralline limestone aggregate, obtained from JMS Quarry (Zurrieq, Malta). The material was collected from the same production in three separate sizes, namely 5mm fine aggregate, and 10mm and 20mm coarse aggregate.
Shredded steel fibres were collected from the MetalCo Ltd. tyre shredding plant. Industrial steel fibres were obtained from various suppliers. The geometric properties of the fibres are given in Table 2.
78

Table 2: Geometric properties of the fibres used
Fibre Type
Length
(l) [mm]
Diameter
(d) [mm]
Aspect
Ratio l/d
Tensile
Strength
[MPa]
Shredded Steel Fibre 34a 0.28
a 132 2677
a
Dramix RC-80/30-BP (IFCA) 30 0.38 79 2300
La Gramigna 100 x 50 (IFCB) 50 1 50 1100
Fibeton 8-40 (IFCC) 40 0.8 50 1050 a average
2.3 Assessment of shredded tyre steel fibres
The fibre geometric properties
A random sample, weighing 5.08 grams was obtained through quartering, to carry out investiga-
tions on the geometric properties of the waste tyre steel fibres. The sample consisted of 212 fi-
bres, where each fibre was separately measured. A micrometer was used to establish the diame-
ter of the fibres. The length and thickness of the fibres were then used to compile information
about the aspect ratio of the fibres. A distribution of the results obtained is given in Figures 2-4.
Figure 2: The distribution of fibre length
Figure 1: The different types of fibres used
79
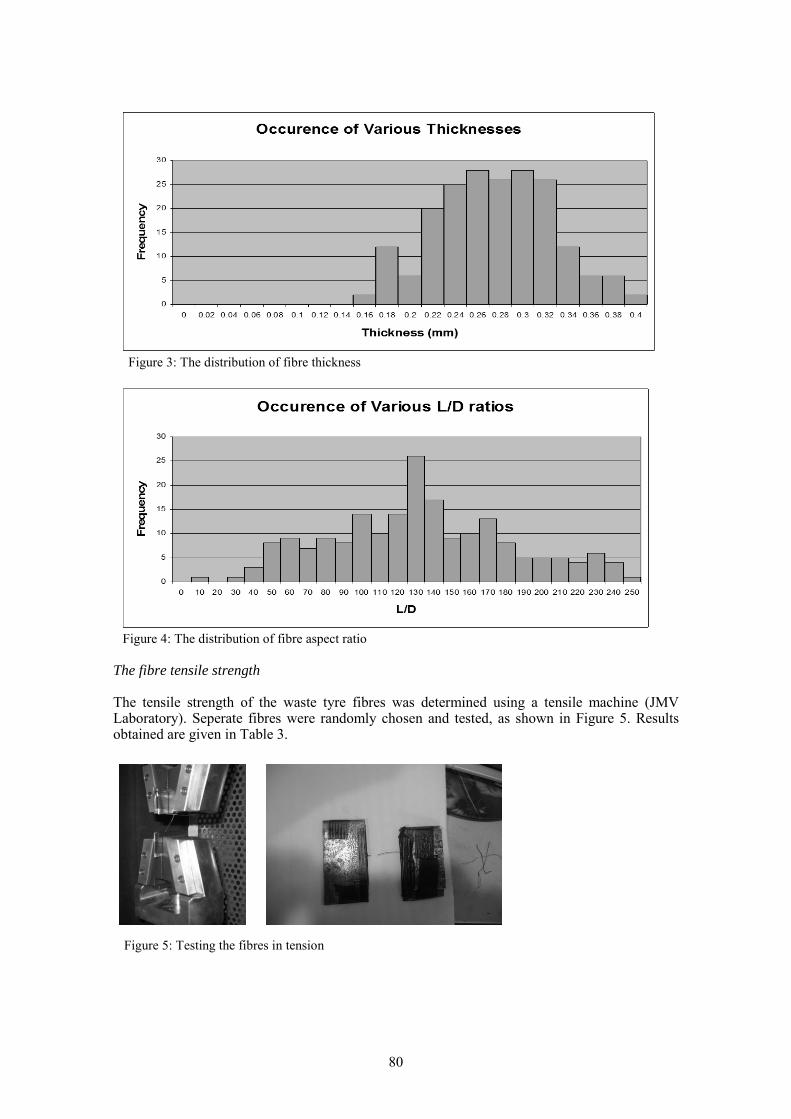
Figure 3: The distribution of fibre thickness
Figure 4: The distribution of fibre aspect ratio
The fibre tensile strength
The tensile strength of the waste tyre fibres was determined using a tensile machine (JMV Laboratory). Seperate fibres were randomly chosen and tested, as shown in Figure 5. Results obtained are given in Table 3.
Figure 5: Testing the fibres in tension
80
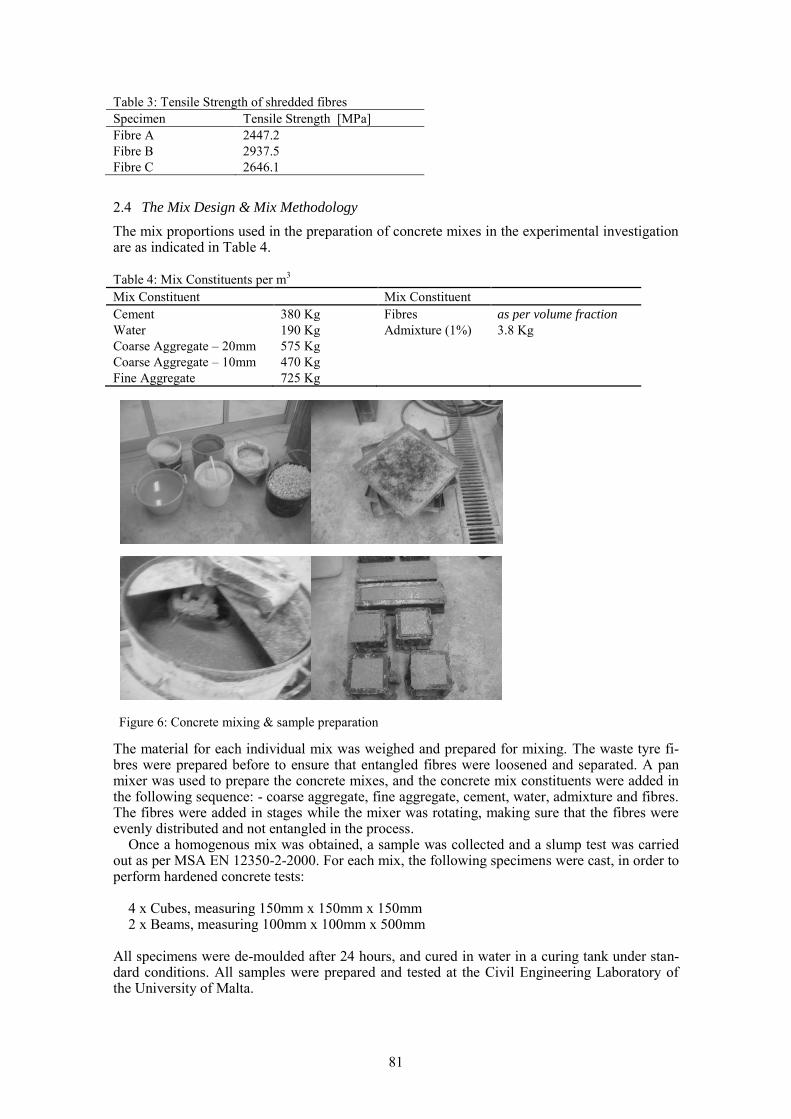
Table 3: Tensile Strength of shredded fibres
Specimen Tensile Strength [MPa] Fibre A 2447.2 Fibre B 2937.5 Fibre C 2646.1
2.4 The Mix Design & Mix Methodology
The mix proportions used in the preparation of concrete mixes in the experimental investigation are as indicated in Table 4. Table 4: Mix Constituents per m
3
Mix Constituent Mix Constituent
Cement 380 Kg Fibres as per volume fraction
Water 190 Kg Admixture (1%) 3.8 Kg
Coarse Aggregate – 20mm 575 Kg
Coarse Aggregate – 10mm 470 Kg
Fine Aggregate 725 Kg
The material for each individual mix was weighed and prepared for mixing. The waste tyre fi-bres were prepared before to ensure that entangled fibres were loosened and separated. A pan mixer was used to prepare the concrete mixes, and the concrete mix constituents were added in the following sequence: - coarse aggregate, fine aggregate, cement, water, admixture and fibres. The fibres were added in stages while the mixer was rotating, making sure that the fibres were evenly distributed and not entangled in the process.
Once a homogenous mix was obtained, a sample was collected and a slump test was carried out as per MSA EN 12350-2-2000. For each mix, the following specimens were cast, in order to perform hardened concrete tests:
4 x Cubes, measuring 150mm x 150mm x 150mm 2 x Beams, measuring 100mm x 100mm x 500mm
All specimens were de-moulded after 24 hours, and cured in water in a curing tank under stan-dard conditions. All samples were prepared and tested at the Civil Engineering Laboratory of the University of Malta.
Figure 6: Concrete mixing & sample preparation
81
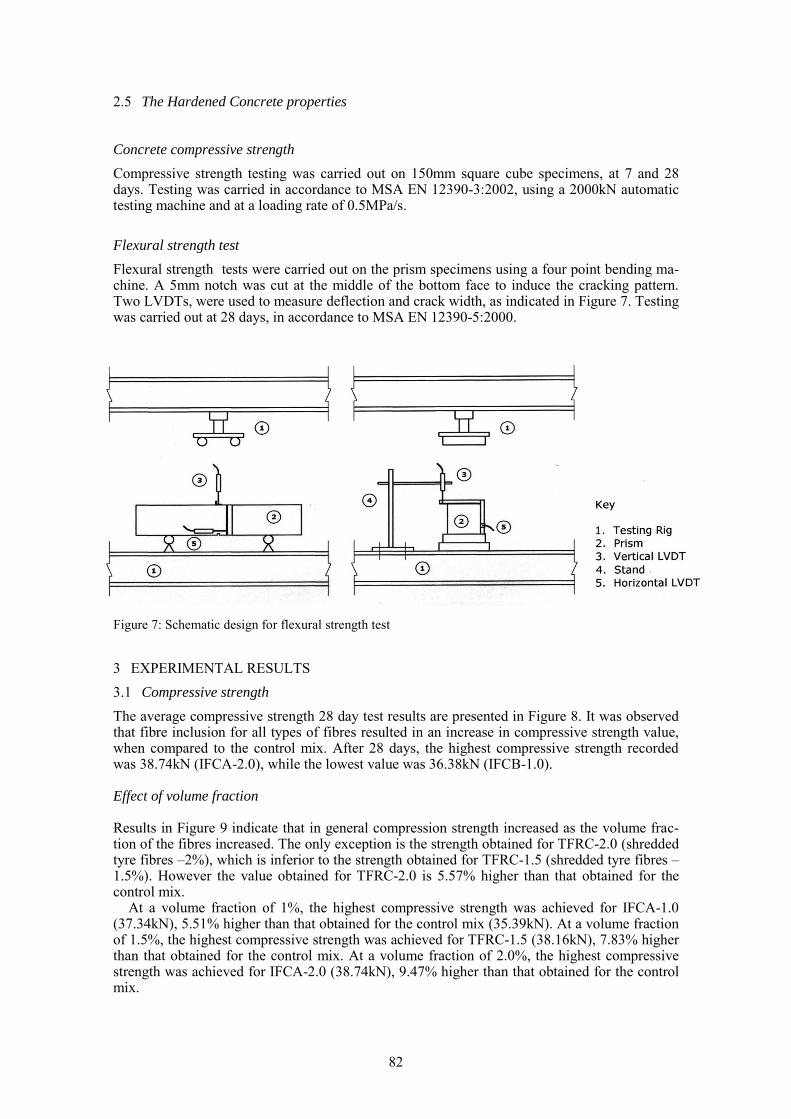
2.5 The Hardened Concrete properties
Concrete compressive strength
Compressive strength testing was carried out on 150mm square cube specimens, at 7 and 28 days. Testing was carried in accordance to MSA EN 12390-3:2002, using a 2000kN automatic testing machine and at a loading rate of 0.5MPa/s.
Flexural strength test
Flexural strength tests were carried out on the prism specimens using a four point bending ma-chine. A 5mm notch was cut at the middle of the bottom face to induce the cracking pattern. Two LVDTs, were used to measure deflection and crack width, as indicated in Figure 7. Testing was carried out at 28 days, in accordance to MSA EN 12390-5:2000.
3 EXPERIMENTAL RESULTS
3.1 Compressive strength
The average compressive strength 28 day test results are presented in Figure 8. It was observed that fibre inclusion for all types of fibres resulted in an increase in compressive strength value, when compared to the control mix. After 28 days, the highest compressive strength recorded was 38.74kN (IFCA-2.0), while the lowest value was 36.38kN (IFCB-1.0).
Effect of volume fraction Results in Figure 9 indicate that in general compression strength increased as the volume frac-tion of the fibres increased. The only exception is the strength obtained for TFRC-2.0 (shredded tyre fibres –2%), which is inferior to the strength obtained for TFRC-1.5 (shredded tyre fibres – 1.5%). However the value obtained for TFRC-2.0 is 5.57% higher than that obtained for the control mix.
At a volume fraction of 1%, the highest compressive strength was achieved for IFCA-1.0 (37.34kN), 5.51% higher than that obtained for the control mix (35.39kN). At a volume fraction of 1.5%, the highest compressive strength was achieved for TFRC-1.5 (38.16kN), 7.83% higher than that obtained for the control mix. At a volume fraction of 2.0%, the highest compressive strength was achieved for IFCA-2.0 (38.74kN), 9.47% higher than that obtained for the control mix.
Figure 7: Schematic design for flexural strength test
82
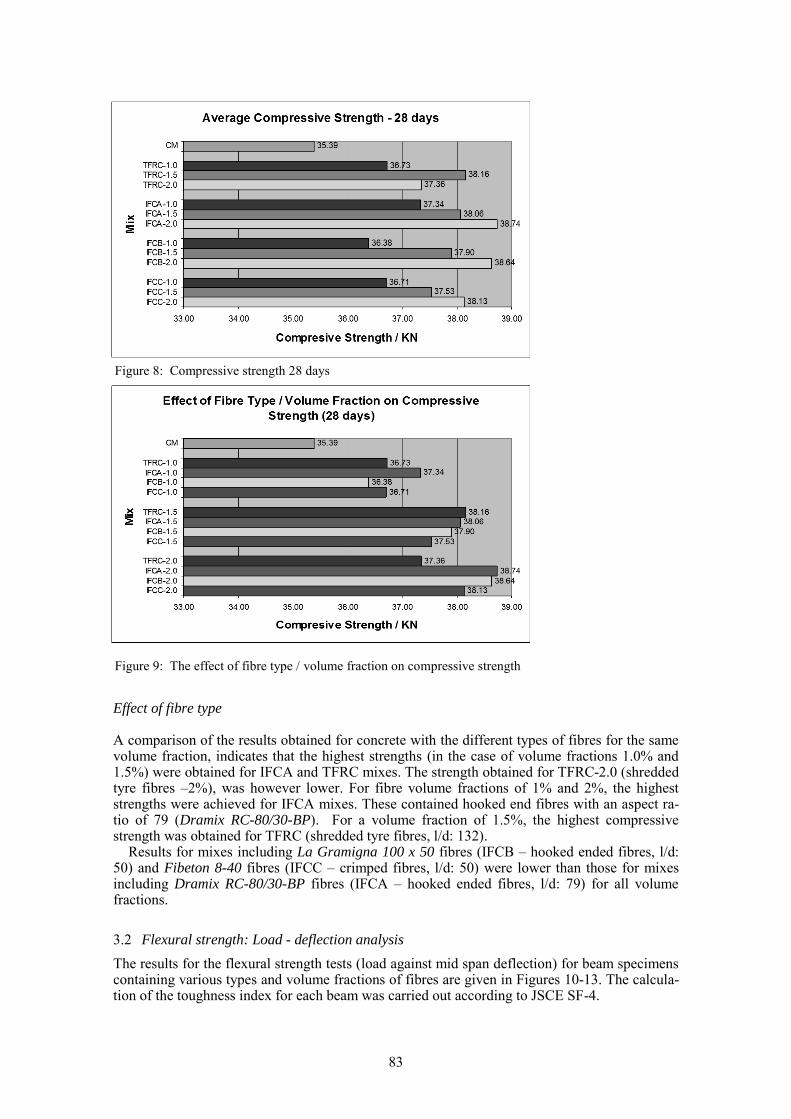
Effect of fibre type
A comparison of the results obtained for concrete with the different types of fibres for the same volume fraction, indicates that the highest strengths (in the case of volume fractions 1.0% and 1.5%) were obtained for IFCA and TFRC mixes. The strength obtained for TFRC-2.0 (shredded tyre fibres –2%), was however lower. For fibre volume fractions of 1% and 2%, the highest strengths were achieved for IFCA mixes. These contained hooked end fibres with an aspect ra-tio of 79 (Dramix RC-80/30-BP). For a volume fraction of 1.5%, the highest compressive strength was obtained for TFRC (shredded tyre fibres, l/d: 132).
Results for mixes including La Gramigna 100 x 50 fibres (IFCB – hooked ended fibres, l/d: 50) and Fibeton 8-40 fibres (IFCC – crimped fibres, l/d: 50) were lower than those for mixes including Dramix RC-80/30-BP fibres (IFCA – hooked ended fibres, l/d: 79) for all volume fractions.
3.2 Flexural strength: Load - deflection analysis
The results for the flexural strength tests (load against mid span deflection) for beam specimens containing various types and volume fractions of fibres are given in Figures 10-13. The calcula-tion of the toughness index for each beam was carried out according to JSCE SF-4.
Figure 8: Compressive strength 28 days
Figure 9: The effect of fibre type / volume fraction on compressive strength
83
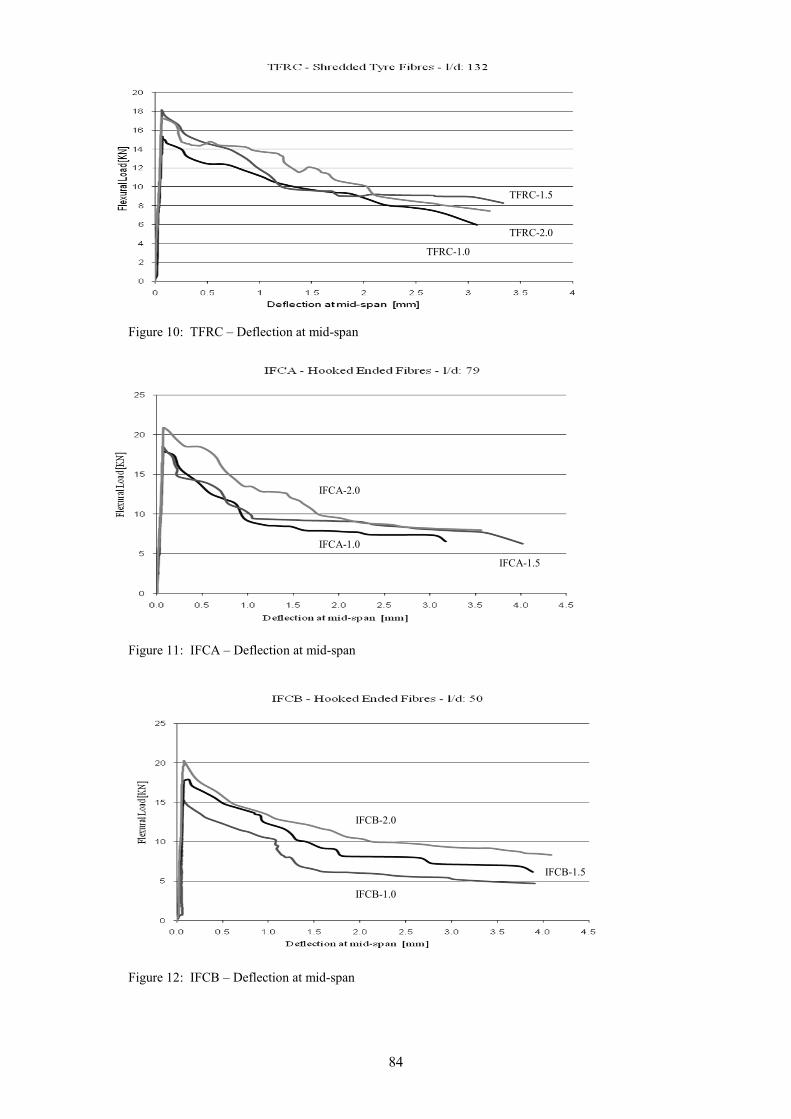
Figure 10: TFRC – Deflection at mid-span
Figure 11: IFCA – Deflection at mid-span
Figure 12: IFCB – Deflection at mid-span
TFRC-1.5
IFCA-1.0
IFCA-1.5
TFRC-2.0
TFRC-1.0
IFCA-2.0
IFCB-2.0
IFCB-1.5
IFCB-1.0
84
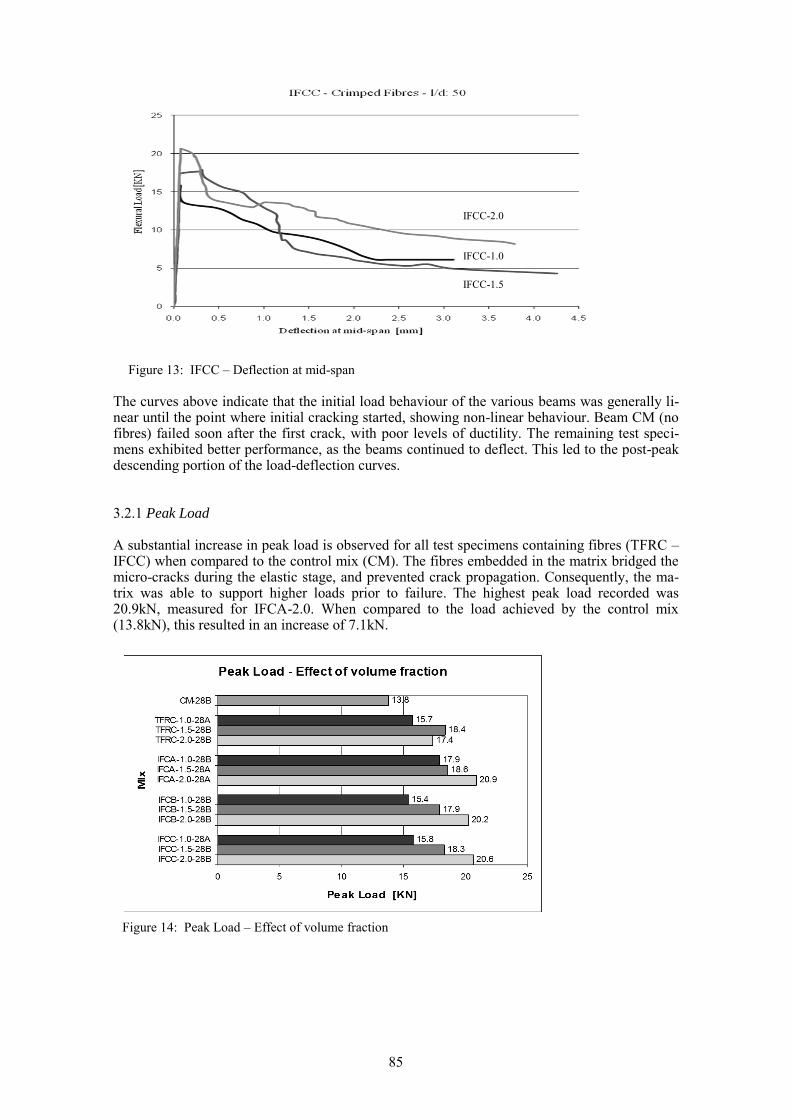
Figure 13: IFCC – Deflection at mid-span
The curves above indicate that the initial load behaviour of the various beams was generally li-near until the point where initial cracking started, showing non-linear behaviour. Beam CM (no fibres) failed soon after the first crack, with poor levels of ductility. The remaining test speci-mens exhibited better performance, as the beams continued to deflect. This led to the post-peak descending portion of the load-deflection curves.
3.2.1 Peak Load A substantial increase in peak load is observed for all test specimens containing fibres (TFRC – IFCC) when compared to the control mix (CM). The fibres embedded in the matrix bridged the micro-cracks during the elastic stage, and prevented crack propagation. Consequently, the ma-trix was able to support higher loads prior to failure. The highest peak load recorded was 20.9kN, measured for IFCA-2.0. When compared to the load achieved by the control mix (13.8kN), this resulted in an increase of 7.1kN.
Figure 14: Peak Load – Effect of volume fraction
IFCC-2.0
IFCC-1.0
IFCC-1.5
85
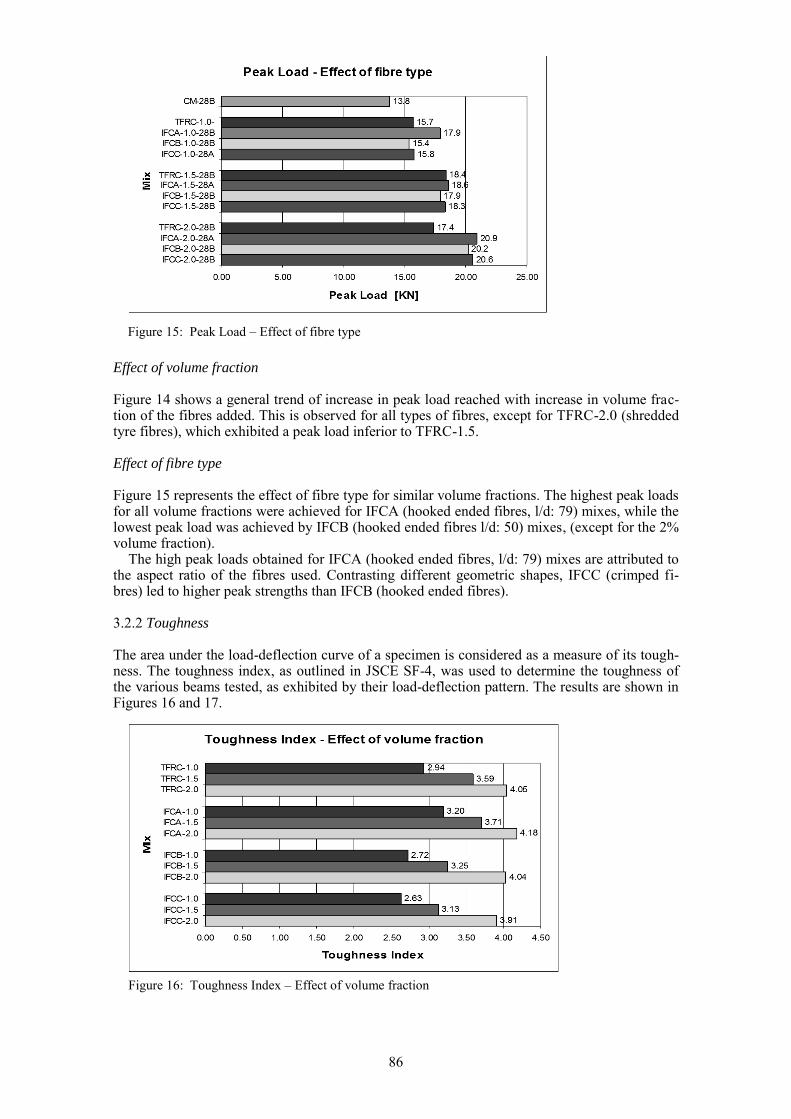
Effect of volume fraction Figure 14 shows a general trend of increase in peak load reached with increase in volume frac-tion of the fibres added. This is observed for all types of fibres, except for TFRC-2.0 (shredded tyre fibres), which exhibited a peak load inferior to TFRC-1.5. Effect of fibre type Figure 15 represents the effect of fibre type for similar volume fractions. The highest peak loads for all volume fractions were achieved for IFCA (hooked ended fibres, l/d: 79) mixes, while the lowest peak load was achieved by IFCB (hooked ended fibres l/d: 50) mixes, (except for the 2% volume fraction).
The high peak loads obtained for IFCA (hooked ended fibres, l/d: 79) mixes are attributed to the aspect ratio of the fibres used. Contrasting different geometric shapes, IFCC (crimped fi-bres) led to higher peak strengths than IFCB (hooked ended fibres). 3.2.2 Toughness The area under the load-deflection curve of a specimen is considered as a measure of its tough-ness. The toughness index, as outlined in JSCE SF-4, was used to determine the toughness of the various beams tested, as exhibited by their load-deflection pattern. The results are shown in Figures 16 and 17.
Figure 16: Toughness Index – Effect of volume fraction
Figure 15: Peak Load – Effect of fibre type
86
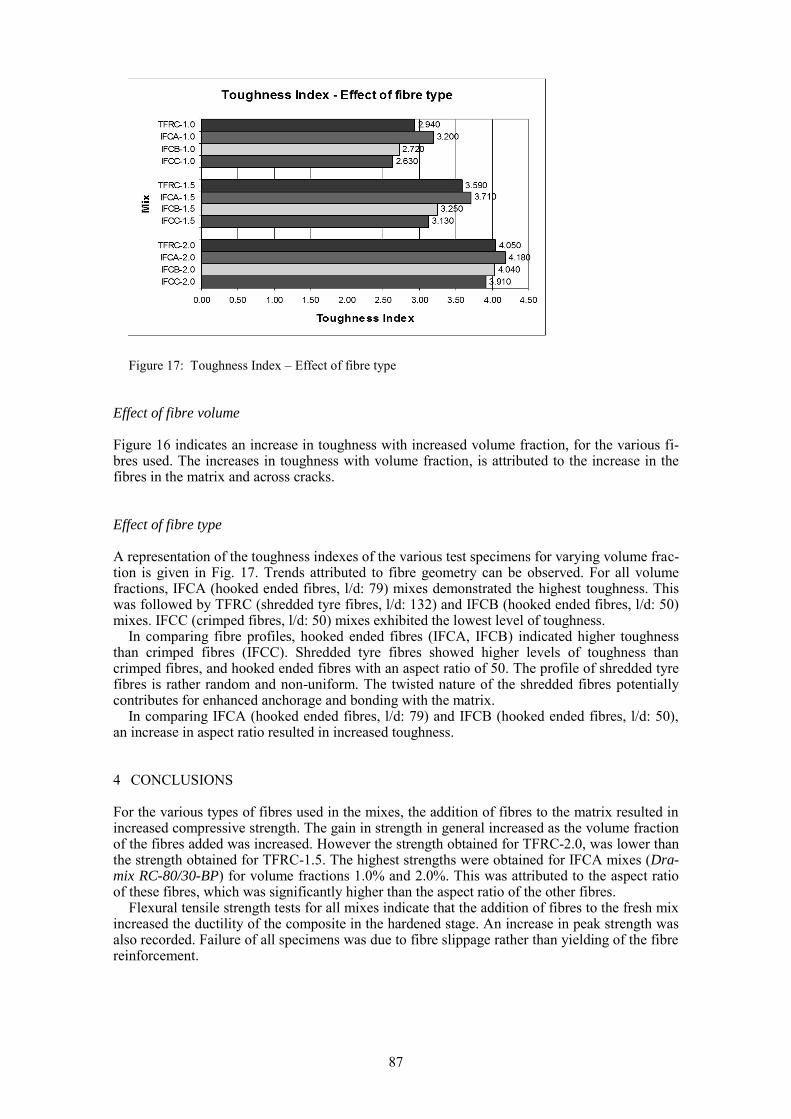
Figure 17: Toughness Index – Effect of fibre type
Effect of fibre volume Figure 16 indicates an increase in toughness with increased volume fraction, for the various fi-bres used. The increases in toughness with volume fraction, is attributed to the increase in the fibres in the matrix and across cracks.
Effect of fibre type A representation of the toughness indexes of the various test specimens for varying volume frac-tion is given in Fig. 17. Trends attributed to fibre geometry can be observed. For all volume fractions, IFCA (hooked ended fibres, l/d: 79) mixes demonstrated the highest toughness. This was followed by TFRC (shredded tyre fibres, l/d: 132) and IFCB (hooked ended fibres, l/d: 50) mixes. IFCC (crimped fibres, l/d: 50) mixes exhibited the lowest level of toughness.
In comparing fibre profiles, hooked ended fibres (IFCA, IFCB) indicated higher toughness than crimped fibres (IFCC). Shredded tyre fibres showed higher levels of toughness than crimped fibres, and hooked ended fibres with an aspect ratio of 50. The profile of shredded tyre fibres is rather random and non-uniform. The twisted nature of the shredded fibres potentially contributes for enhanced anchorage and bonding with the matrix.
In comparing IFCA (hooked ended fibres, l/d: 79) and IFCB (hooked ended fibres, l/d: 50), an increase in aspect ratio resulted in increased toughness.
4 CONCLUSIONS For the various types of fibres used in the mixes, the addition of fibres to the matrix resulted in increased compressive strength. The gain in strength in general increased as the volume fraction of the fibres added was increased. However the strength obtained for TFRC-2.0, was lower than the strength obtained for TFRC-1.5. The highest strengths were obtained for IFCA mixes (Dra-mix RC-80/30-BP) for volume fractions 1.0% and 2.0%. This was attributed to the aspect ratio of these fibres, which was significantly higher than the aspect ratio of the other fibres.
Flexural tensile strength tests for all mixes indicate that the addition of fibres to the fresh mix increased the ductility of the composite in the hardened stage. An increase in peak strength was also recorded. Failure of all specimens was due to fibre slippage rather than yielding of the fibre reinforcement.
87
Interpretation of the various load deflection curves indicates a similar behaviour in general for the different types of fibres. Beyond peak load, a reduction of the stiffness of the composite was observed, supplemented by a quasi ductile behaviour. The area under the load deflection curves increased as the volume fraction of the fibres added increased.
The highest peak loads for all volume fractions were recorded for IFCA (Dramix RC-80/30-BP - hooked ended fibres, l/d: 79) mixes, while the lowest peak load was achieved by IFCB (La Gramigna 100x50 - hooked ended fibres l/d: 50) mixes, (except for the 2% volume fraction).
Assessment of the energy absorption up to failure for all mixes gave insight on the toughness of the various specimens tested. Toughness increased as more fibres were added to the fresh mix. IFCA (Dramix RC-80/30-BP) mixes exhibited the highest level of toughness for all vo-lume fractions. The toughness exhibited by TFRC (shredded tyre fibres) mixes was higher than that for IFCB (La Gramigna 100x50) and IFCC (Fibeton 8-40) mixes for all fibre volume fractions. This is attributed to the aspect ratio of the fibres. An investigation of the crack open-ing indicated that waste tyre fibres develop cracks at a load lower than other fibres. The investigation indicated that the use of shredded tyre fibres leads to a small contribution with respect to compressive strength. Gains of up to 2.8kN (7.83%) with respect to the control mix, were recorded when using a volume fraction of 1.5%. A more significant improvement was noted when testing in flexure. In the case of the 1.5% volume fraction, a higher peak load (4.6kN – 33%) with respect to the control mix was observed for TFRC. Composites containing shredded tyre fibres showed a higher level of toughness than La Gramigna 100x50 (IFCB - hooked ended fibres, l/d: 50) and Fibeton 8-40 (IFCC - crimped fibres, l/d: 50) fibres. However due to the lack of end anchorage, fibre slippage resulted in the development of wider cracks.
The current research can be considered as a preliminary investigation to determine the potential use of the shredded waste tyre fibres in concrete. The outcome of the experimental investigation, and supporting literature, indicate that various aspects that can be considered in further detail. These include the consideration of a larger number of test samples; consideration of a larger number of test variables; the inclusion of different volume fractions; assessment of the fibre aspect ratio; the assessment of fresh concrete properties and mixing methodology; consideraion of additional tests on hardened concrete; durability assessment; the potential use in different types of concrete mixes; and the assessment of potential applications of waste tyre fibres. REFERENCES ACI Committee 544. 1993. Guide for Specifying, Proportioning, Mixing, Placing, and Finishing Steel Fi-
ber Reinforced Concrete. A.C.I. Materials Journal, 90 (1), pp 94-103. Al-Ghamdy, D. O., Wight, J. K. & Tons, E. 1994. Flexural toughness of steel fibre reinforced concrete.
Journal of King Abdul-Aziz University: engineering sciences, 6 pp 81-97. Basel Convention Technical Committee. October 2000. Technical Guidelines on the Identification and
Management of Used Tyres. Basel: UNEP. Bentur, A., & Mindness, S. 1990. Fibre Reinforced Cementitious Composites. Albany, NY: Elsevier Pub-
lishing. Blumenthal, M. 2006. Scrap Tyre markets in the United States. Washington, DC: Rubber Manufacturers
Association. ETRMA. 2007. End of Life Tyres – A valuable resource with growing potential 2007 Edition. Brussels:
European Tyre & Rubber Manufacturers Association. Farrugia, C. 2009. Waste Tyre Fibres – Investigating the potential use in concrete. B.E. & A. (Hons.) Un-
published dissertation, University of Malta. Inga, S. & Inga, K. 2006. Comparison of End-of-life Tyre Treatment Technologies: Life Cycle Inventory
Analysis. Environmental research, engineering and management, 35 (1), pp. 52-60. Integrated Waste Management Board. 2003. Assessment of Markets for Fibre and Steel Produced From
Recycling Waste Tires. Sacramento, CA: California Environmental Protection Agency. Laskar, A., & Talukdar, S. 2008. Rheology of Steel Fibre Reinforced Concrete. Asian Journal of Civil
Engineering (Building and Housing), 9 (2), pp. 167-177.
88
Laws of Malta. 2001. CAP 435 Environment Protection Act Malta Standards Authority. 2000. MSA EN 12390-5. Testing hardened concrete. Flexural strength of test
specimens. Malta Standards Authority. 2002. MSA EN 12390-3. Testing hardened concrete. Compressive strength of
test specimens. Malta Standards Authority. 2004. MSA EN 14243. Post-consumer tyre. Materials and applications. MEPA. 2008. State of the Environment Indicators 2007. Malta Environment & Planning Authority. Ministry for the Environment 2001. A Solid Waste Management Strategy for the Maltese Islands. Valletta Pilakoutas, K., Neocleous, K. & Tlemat, H. 2004. Reuse of steel fibres as concrete reinforcement. Pro-
ceedings of the Institution of Civil Engineers, Engineering Sustainability, 157 (3), pp. 131-138. Sekar, T. 2004. Fibre Reinforced Concrete from Industrial Waste Products – A Feasibility Study. IE(I)
Journal-CV 84 (2), pp 287-290. Siddique, R. 2008. Waste Materials and By-Products in Concrete. Helderberg: Springer. Sukontasukkul, P. 2004. Toughness Evaluation of Steel and Polyproylene Fibre Reinforced Beams under
Bending. Thammasat International Journal of Science and Technology. 9 (3), pp. 35-41. The Council of the European Union, 1999; Council Directive 1999/31/EC of 26 April 1999 on the landfill
of waste. Veasey, J. T., Wilson, R. J., & Squires, D. M. 1993. The Physical Separation and Recovery of Metals
from Waste. Singapore: Taylor & Francis. WasteServ Malta. 2008. Sustainable Waste Management for the Maltese Islands - 5 Years of Achieve-
ments, St. Venera: WasteServ Malta WRAP. June 2007. Markets for steel and fibre from used tyre processing. Oxon: Waste and Resource Ac-
tion Programme.
89

90
1 INTRODUCTION Today, in almost all types of projects we strive to optimization, which means that we are trying to achieve optimal results with limited (usually financial) input resources. Solutions for some problems encountered in everyday life are obvious and commonly known, but in most cases we need to use or develop certain tools that help us to determine the best solution. When deciding on the type and extent of the renewal of buildings, an appropriate decision model (tool) must be used. This model needs to be based on appropriate and objectively determinable criteria if use-ful results are expected. The conducted literature review shows that despite the desire to develop a universal decision model for the determination of optimal solutions in the field of renewal of all buildings, this was not feasible. During the development it has become clear that the same form of decision model will not be able to address all types of buildings. Therefore, the priority was to develop a model which can be applied to public buildings (eg. schools, administrative buildings, hospitals). The proposed model can only be used for analyzing public buildings, but it is designed general-ly enough in order to apply it to other types of buildings with relatively small adjustments. In
Sustainable planning of renewal of buildings in public ownership
M. Kusar Faculty of Civil and Geodetic Engineering, University of Ljubljana, Ljubljana, Slovenia, [email protected]
J. Selih Faculty of Civil and Geodetic Engineering, University of Ljubljana, Ljubljana, Slovenia, [email protected]
ABSTRACT: Research and development of the decision support tools in the field of the buildings’ renewal has so far predominantly been focused on the single criteria decision models, where solely earthquake resistance was considered. These models did not provide a complete picture of the state of the buildings to be renewed as well as a comprehensive list of all neces-sary renewal measures.
The proposed model combines the most important criteria that are relevant for the renewal of buildings, into a single multi-criteria model. In general, multi-criteria models form a good sup-port tool for situations where a large number of factors influence the decision. They are based on decomposition of the problem into smaller and more easily manageable components.
Renewal costs, life cycle costs and improved earthquake resistance are criteria used in the proposed multi-criteria model. The developed tool enables us to cover all the listed aspects of renewal of buildings and yields an optimal solution in terms of costs and benefits.
As all the considered costs as well as benefits in the model are distributed over a longer pe-riod of time, the discounting of their future value must be taken into account. The net present value of the individual solution is obtained in this way.
The present multi-criteria decision model can only be applied to selected types of buildings (in public ownership), but forms a good starting point for the development of new models that will be used for other types of construction.
91
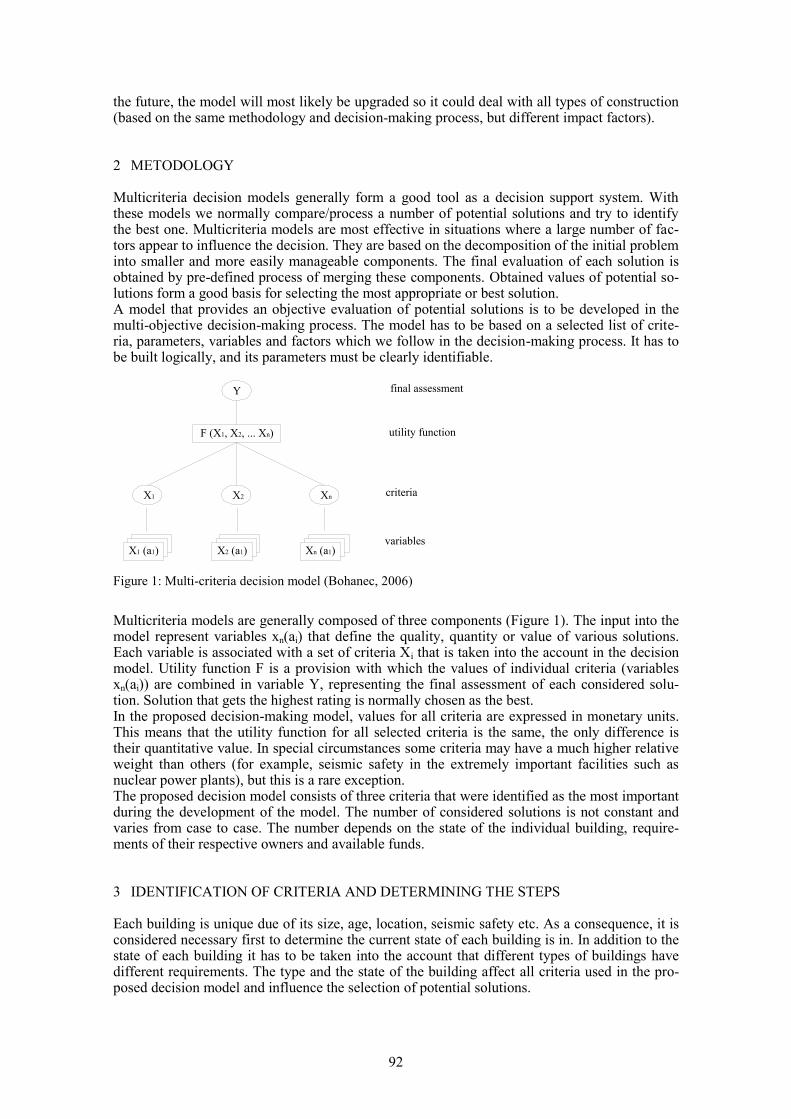
the future, the model will most likely be upgraded so it could deal with all types of construction (based on the same methodology and decision-making process, but different impact factors).
2 METODOLOGY Multicriteria decision models generally form a good tool as a decision support system. With these models we normally compare/process a number of potential solutions and try to identify the best one. Multicriteria models are most effective in situations where a large number of fac-tors appear to influence the decision. They are based on the decomposition of the initial problem into smaller and more easily manageable components. The final evaluation of each solution is obtained by pre-defined process of merging these components. Obtained values of potential so-lutions form a good basis for selecting the most appropriate or best solution. A model that provides an objective evaluation of potential solutions is to be developed in the multi-objective decision-making process. The model has to be based on a selected list of crite-ria, parameters, variables and factors which we follow in the decision-making process. It has to be built logically, and its parameters must be clearly identifiable.
Figure 1: Multi-criteria decision model (Bohanec, 2006)
Multicriteria models are generally composed of three components (Figure 1). The input into the model represent variables xn(ai) that define the quality, quantity or value of various solutions. Each variable is associated with a set of criteria Xi that is taken into the account in the decision model. Utility function F is a provision with which the values of individual criteria (variables xn(ai)) are combined in variable Y, representing the final assessment of each considered solu-tion. Solution that gets the highest rating is normally chosen as the best. In the proposed decision-making model, values for all criteria are expressed in monetary units. This means that the utility function for all selected criteria is the same, the only difference is their quantitative value. In special circumstances some criteria may have a much higher relative weight than others (for example, seismic safety in the extremely important facilities such as nuclear power plants), but this is a rare exception. The proposed decision model consists of three criteria that were identified as the most important during the development of the model. The number of considered solutions is not constant and varies from case to case. The number depends on the state of the individual building, require-ments of their respective owners and available funds.
3 IDENTIFICATION OF CRITERIA AND DETERMINING THE STEPS
Each building is unique due of its size, age, location, seismic safety etc. As a consequence, it is considered necessary first to determine the current state of each building is in. In addition to the state of each building it has to be taken into the account that different types of buildings have different requirements. The type and the state of the building affect all criteria used in the pro-posed decision model and influence the selection of potential solutions.
Y
F (X1, X2, ... Xn)
X1 X2 Xn
X1 (a1) X2 (a1) Xn (a1)
final assessment
utility function
criteria
variables
(Bohanec, Rajkovic, 1995)
92
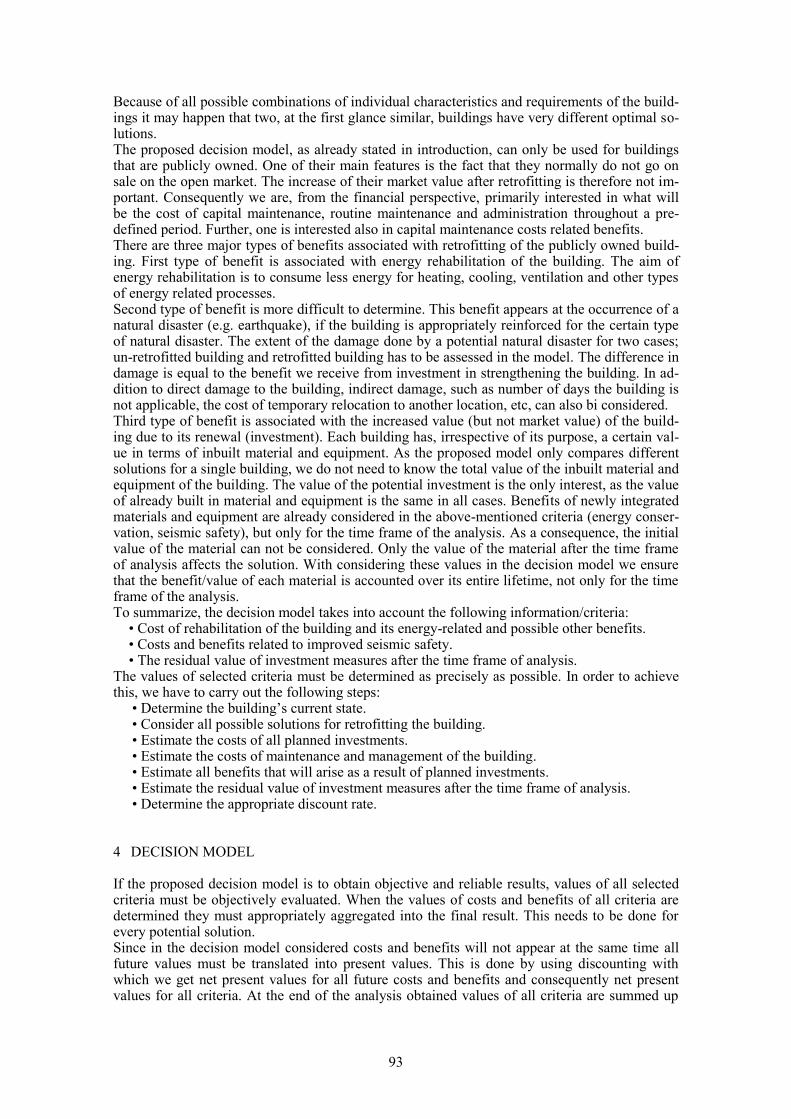
Because of all possible combinations of individual characteristics and requirements of the build-ings it may happen that two, at the first glance similar, buildings have very different optimal so-lutions. The proposed decision model, as already stated in introduction, can only be used for buildings that are publicly owned. One of their main features is the fact that they normally do not go on sale on the open market. The increase of their market value after retrofitting is therefore not im-portant. Consequently we are, from the financial perspective, primarily interested in what will be the cost of capital maintenance, routine maintenance and administration throughout a pre-defined period. Further, one is interested also in capital maintenance costs related benefits. There are three major types of benefits associated with retrofitting of the publicly owned build-ing. First type of benefit is associated with energy rehabilitation of the building. The aim of energy rehabilitation is to consume less energy for heating, cooling, ventilation and other types of energy related processes. Second type of benefit is more difficult to determine. This benefit appears at the occurrence of a natural disaster (e.g. earthquake), if the building is appropriately reinforced for the certain type of natural disaster. The extent of the damage done by a potential natural disaster for two cases; un-retrofitted building and retrofitted building has to be assessed in the model. The difference in damage is equal to the benefit we receive from investment in strengthening the building. In ad-dition to direct damage to the building, indirect damage, such as number of days the building is not applicable, the cost of temporary relocation to another location, etc, can also bi considered. Third type of benefit is associated with the increased value (but not market value) of the build-ing due to its renewal (investment). Each building has, irrespective of its purpose, a certain val-ue in terms of inbuilt material and equipment. As the proposed model only compares different solutions for a single building, we do not need to know the total value of the inbuilt material and equipment of the building. The value of the potential investment is the only interest, as the value of already built in material and equipment is the same in all cases. Benefits of newly integrated materials and equipment are already considered in the above-mentioned criteria (energy conser-vation, seismic safety), but only for the time frame of the analysis. As a consequence, the initial value of the material can not be considered. Only the value of the material after the time frame of analysis affects the solution. With considering these values in the decision model we ensure that the benefit/value of each material is accounted over its entire lifetime, not only for the time frame of the analysis. To summarize, the decision model takes into account the following information/criteria:
• Cost of rehabilitation of the building and its energy-related and possible other benefits. • Costs and benefits related to improved seismic safety. • The residual value of investment measures after the time frame of analysis.
The values of selected criteria must be determined as precisely as possible. In order to achieve this, we have to carry out the following steps:
• Determine the building’s current state. • Consider all possible solutions for retrofitting the building. • Estimate the costs of all planned investments. • Estimate the costs of maintenance and management of the building. • Estimate all benefits that will arise as a result of planned investments. • Estimate the residual value of investment measures after the time frame of analysis. • Determine the appropriate discount rate.
4 DECISION MODEL
If the proposed decision model is to obtain objective and reliable results, values of all selected criteria must be objectively evaluated. When the values of costs and benefits of all criteria are determined they must appropriately aggregated into the final result. This needs to be done for every potential solution. Since in the decision model considered costs and benefits will not appear at the same time all future values must be translated into present values. This is done by using discounting with which we get net present values for all future costs and benefits and consequently net present values for all criteria. At the end of the analysis obtained values of all criteria are summed up
93
for each of the potential solutions, giving us their net present value. This enables us to objective-ly compare them. A solution with the highest net present value (which actually represents the most favorable cost/benefit ratio) is selected as the best. The decision-making process employed is presented in Figure 2.
Figure 2: Multi-criteria decision model for comparing different solutions in the renewal of buildings
Let us now look the decision model from the computational aspect. As already mentioned, the net present value of all future costs and benefits is obtained by discounting their values. Invest-ments made in the first year are already represented as present values. To these values, the resi-dual value (value in the last year of the analysis) of the investment measures (inbuilt material and equipment) is added. It is also discounted to net present value. Net present value of each po-tential solution can therefore be written as:
T
T
T
T
d
V
d
C
d
C
d
CINVNPV
)1()1()1(1 2
21
(1)
where NPV = net present value; INV = estimated investment costs; t = specific time period (t=1, 2 …T), T = number of years analyzed; Ct = total cost of maintenance, use of the building and possible rehabilitation costs due to natural disasters; Vt = residual value of the investment in the last year of analysis; and d = discount rate. Although only costs are represented in the equation, it has to be outlined that there are also ben-efits hidden in these costs. Benefits are exhibited as lower costs of heating, cooling, mainten-ance and lower earthquake damage in case of investment in seismic safety of the building. In the first step of calculation, the number of years to be taken into the account needs to be de-termined. The second step is the determination of the appropriate discount rate. Next, all costs must be distributed over the time period under consideration. The residual value of the invest-ment in the last year of analysis is added at the end. As costs associated with different criteria can only be determined by different methodologies, it is much easier and more manageable (because of relatively high amount of data) to determine the net present value of these costs separately for each criteria. However the calculation off as-sociated values for criteria is still based on equation (1). Determination of the individual values
Buy SmartDraw!- purchased copies print this
document without a watermark .
Visit www.smartdraw.com or call 1-800-768-3729.
94
of criteria is the most difficult and challenging part of the proposed decision model and is beyond the scope of this article. At the end of the analysis, net present value (NPV) of each considered solution is obtained simply by summing up the net present values of selected criteria:
..... VRESISSLCC NPVNPVNPVNPV (1)
Where NPV = net present value of each considered solution; NPVLCC = net present value of costs of energy rehabilitation, costs of heating, cooling, maintenance and etc.; NPVS.S.I. = net present value of costs of seismic safety improvement and costs of possible earthquake damage; and NPVRES.V. = net present value of residual value of material and equipment in the last year of analysis. The solution with the highest net present value is selected as the best one, as it represents the most favorable cost/benefit ratio.
5 CONCLUSION
The paper presents a comprehensive decision model that is to be used to assess the condition of a publicly owned building. Earthquake resistance, life cycle costs and residual value of the building of the building under consideration are taken as criteria. Testing the model has shown that the criterion that predominantly affects the benefit to cost ra-tio are life cycle costs (LCC). This occurs due to the fact that they are generated through a long-er time period (i.e. life cycle) on a daily basis. When summarized at the end of the period under consideration, they can be very high. The criterion that affects the solution least is the residual value. Nevertheless, it should be emphasized that the earthquake resistance has to be checked (and appropriately upgraded) for every case (regardless of the alternative proposed as the result of the decision process), as this is the criterion that affects lives and health of the occupants. The developed model shows that it is extremely important to view the planned refurbishment from various angles and then aggregate all relevant decision elements, as only this approach leads to a comprehensive understanding and selection of the most appropriate solution.
REFERENCES
Amjad, A. 2005. Cost Benefit Analysis for Construction Projects. IEP_SAC Journal 2004-2005: 85-90.
Barringer, H. P. 2003. A Life Cycle Cost Summary. International Conference of Maintenance Societies
(ICOMS 2003): 10.
Barringer, H. P. & Weber, D. P. 1996. Life Cycle Cost Tutorial. Fifth International Conference on
Process Plant Reliability: 58.
Bohanec, M. 2006. Odločanje in modeli. Društvo matematikov, fizikov in astronomov Slovenije: 312.
Bovcon, E. 2005. Uporaba metode vrednotenja stroškov življenjskega cikla (LCC) pri prenovi stavb. Dip-
lomska naloga. Ljubljana, Univerza v Ljubljani, Fakulteta za gradbeništvo in geodezijo: 69.
Boylu, M. 2005. A Benefit/Cost Analysis for the Seismic Rehabilitation of Existing Reinforced Concrete
Buildings in Izmir. Izmir Institute of Technology: 103.
Dong, B. et al. 2005. Comparing Life Cycle Implications of Building Retrofit and Replacement Options.
Canadian Journal of Civil Engineering. Volume 32: str. 1051-1063.
Fuller, S. 2005. Guidance on Life Cycle Cost Analysis. National Institute of Standards and Technology:
27.
Ghesquiere, F. et al. 2006. Earthquake Vulnerability Reduction Program in Colombia. A Probabilistic
Cost-benefit Analysis. World Bank Policy Research Working Paper 3939: 21.
Kušar, M. 2006. Določitev meje pri kateri postane nadomestitev močneje poškodovane stavbe z novo-
gradnjo ekonomsko upravičena. Seminarska naloga. Ljubljana, Univerza v Ljubljani, Fakulteta za
gradbeništvo in geodezijo: 31.
Kušar, M. 2009. Razvoj večkriterijskega odločitvenega modela za izbiro ukrepov pri obnovi
95
stavb. Magistrsko delo. Ljubljana, Univerza v Ljubljani, Fakulteta za gradbeništvo in geodezijo:
130.
Langevine, R. et al. 2006. Decision Support Tool for the Maintenance Management of Buildings. Joint
International Conference on Computing and Decision Making in Civil and Building Engineering.
Montreal – Canada. 14. – 16. June, 2006: 2292-2301.
Myers, D. 2004. Construction Economics – A New Approach. Spon Press: 283.
Poznič, M. 2007. Analiza življenjskih stroškov stavb s poudarkom na vzdrževanju. Diplomska naloga.
Ljubljana, Univerza v Ljubljani, Fakulteta za gradbeništvo in geodezijo: 85.
Smyth, A.W. et al. 2004. Probabilistic Benefit-Cost Analysis for Earthquake Damage Mitigation: Eva-
luating Measures for Apartment Houses in Turkey. Earthquake Spectra, Volume 20: 171-203
Tomšič, M. & Šijanec Zavrl, M. 2004. LCC Management. Priročnik za uporabo LCCA metod za investi-
torje in vodje projektov. Izdano v okviru mednarodnega projekta OPET stavbe: 35.
Trusty, W. B. & Meil, J.K. 2000. The Enviromental Implications of Building New Versus Renovating an
Existing Structure. Durability of Building Materials and Components 8. Ottawa, Canada, 1999: 2113-
2121.
Vanier, D. et al. 2006. Decision Models to Prioritize Maintenance and Renewal Alternatives. Joint Inter-
national Conference on Computing and Decision Making in Civil and Building Engineering. Montreal
– Canada. 14. – 16. June, 2006: 2549-2604.
96
1 SCENE SETTING
1.1 Carbon Emissions
Transport is often portrayed as the largest contributor to carbon emissions, and therefore cli-mate change, but buildings are the UK’s largest source of carbon emissions, in both use and construction. Buildings are accountable for over 50 per cent of total carbon emissions (Roaf, 2003). Energy used for domestic heating, lighting and appliances in the home account for 27 per cent of the UK’s carbon emissions (Stevenson et al., 2006). 21 per cent of these emissions are directly linked to user behaviours and 79 per cent are caused by space and water heating and lighting which are largely affected by design and construction. This is clearly a major hur-dle in meeting the carbon reduction (Penson, 2005) necessary to reduce our impact on climate change, yet engaging people in energy efficiency measures proves difficult. (Stevenson et al., 2006) As one third of the homes we will be residing in by 2050 are not yet built. This offers potential for us to significantly reduce long term emissions through construction methods, today and over the coming years. (CLG, 2009)
Perceptions of sustainable housing design: Current strategies for zero carbon
J.E.McCullough Queen’s University, Belfast, Northern Ireland. [email protected]
ABSTRACT: In this paper the researcher will discuss a current study which investigates awareness and perceptions’ of what it means to design environmentally sustainable homes. This research is timely with the recent introduction of the UK’s Code for Sustainable Homes and obligatory Zero Carbon Homes by 2016 as achieving these aims will require end users to adapt to a new sustainable lifestyle and designers to change their design approach. If the UK is to achieve the stringent zero carbon target for all new housing by 2016 the con-struction industry must develop a better understanding of human action and behaviors other-wise actual carbon emissions may be much higher than planned. This is a twofold issue where the perceptions, awareness and behaviors of both the designer and the end user must be col-lected and analysed to find the adaptations required to design or live in a sustainable home. There are few known projects that have looked at perceptions’ and awareness of the adaptations required to live in and design environmentally sustainable homes and therefore, this research must be completed before a successful method for achieving nationwide zero carbon housing can be developed. The research will be conducted with rigorous qualitative and quantitative re-search methodologies including desk-based studies, questionnaires and focus groups; working closely with the housing developers, designers and potential house purchasers to ensure appli-cability. Although the focus of this project is regional, the outcomes of the research will be re-levant internationally and will be disseminated widely. In this paper the researcher outlines and discusses this project in relation to the designer and in particular current perceptions’ and awareness of sustainable design.
97
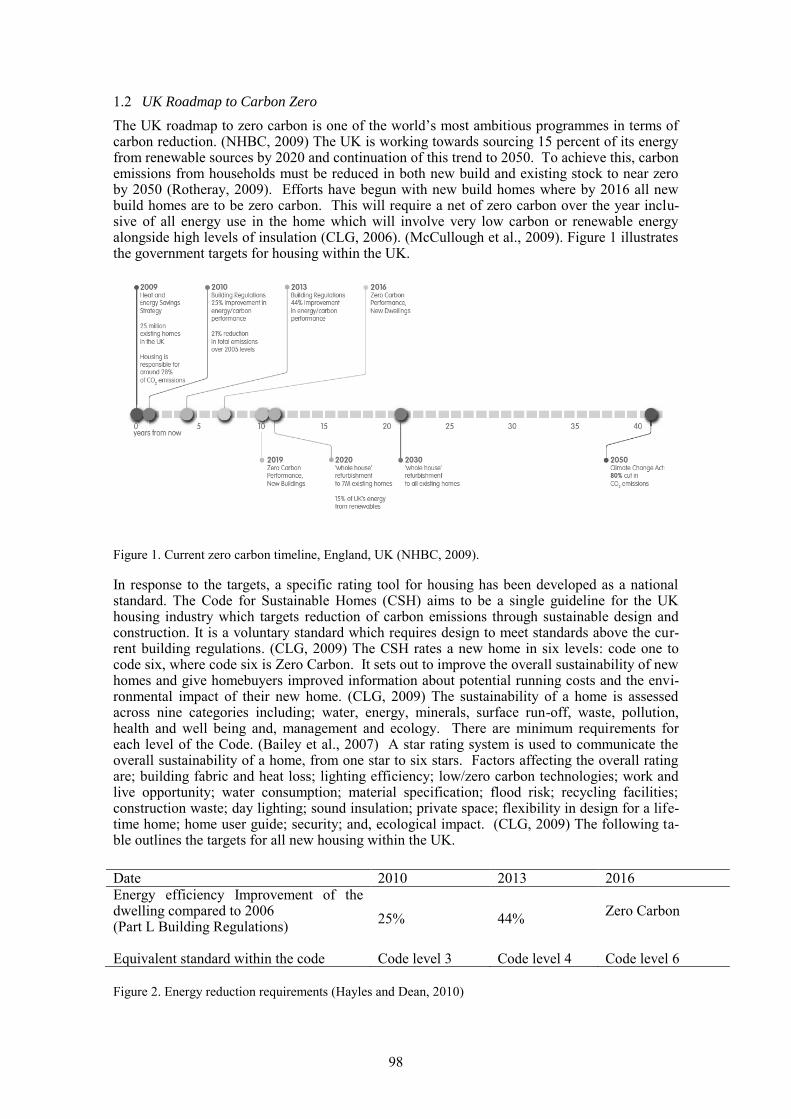
1.2 UK Roadmap to Carbon Zero
The UK roadmap to zero carbon is one of the world’s most ambitious programmes in terms of carbon reduction. (NHBC, 2009) The UK is working towards sourcing 15 percent of its energy from renewable sources by 2020 and continuation of this trend to 2050. To achieve this, carbon emissions from households must be reduced in both new build and existing stock to near zero by 2050 (Rotheray, 2009). Efforts have begun with new build homes where by 2016 all new build homes are to be zero carbon. This will require a net of zero carbon over the year inclu-sive of all energy use in the home which will involve very low carbon or renewable energy alongside high levels of insulation (CLG, 2006). (McCullough et al., 2009). Figure 1 illustrates the government targets for housing within the UK.
Figure 1. Current zero carbon timeline, England, UK (NHBC, 2009).
In response to the targets, a specific rating tool for housing has been developed as a national standard. The Code for Sustainable Homes (CSH) aims to be a single guideline for the UK housing industry which targets reduction of carbon emissions through sustainable design and construction. It is a voluntary standard which requires design to meet standards above the cur-rent building regulations. (CLG, 2009) The CSH rates a new home in six levels: code one to code six, where code six is Zero Carbon. It sets out to improve the overall sustainability of new homes and give homebuyers improved information about potential running costs and the envi-ronmental impact of their new home. (CLG, 2009) The sustainability of a home is assessed across nine categories including; water, energy, minerals, surface run-off, waste, pollution, health and well being and, management and ecology. There are minimum requirements for each level of the Code. (Bailey et al., 2007) A star rating system is used to communicate the overall sustainability of a home, from one star to six stars. Factors affecting the overall rating are; building fabric and heat loss; lighting efficiency; low/zero carbon technologies; work and live opportunity; water consumption; material specification; flood risk; recycling facilities; construction waste; day lighting; sound insulation; private space; flexibility in design for a life-time home; home user guide; security; and, ecological impact. (CLG, 2009) The following ta-ble outlines the targets for all new housing within the UK.
Figure 2. Energy reduction requirements (Hayles and Dean, 2010)
Date 2010 2013 2016 Energy efficiency Improvement of the dwelling compared to 2006 (Part L Building Regulations)
25% 44%
Zero Carbon
Equivalent standard within the code Code level 3 Code level 4 Code level 6
98
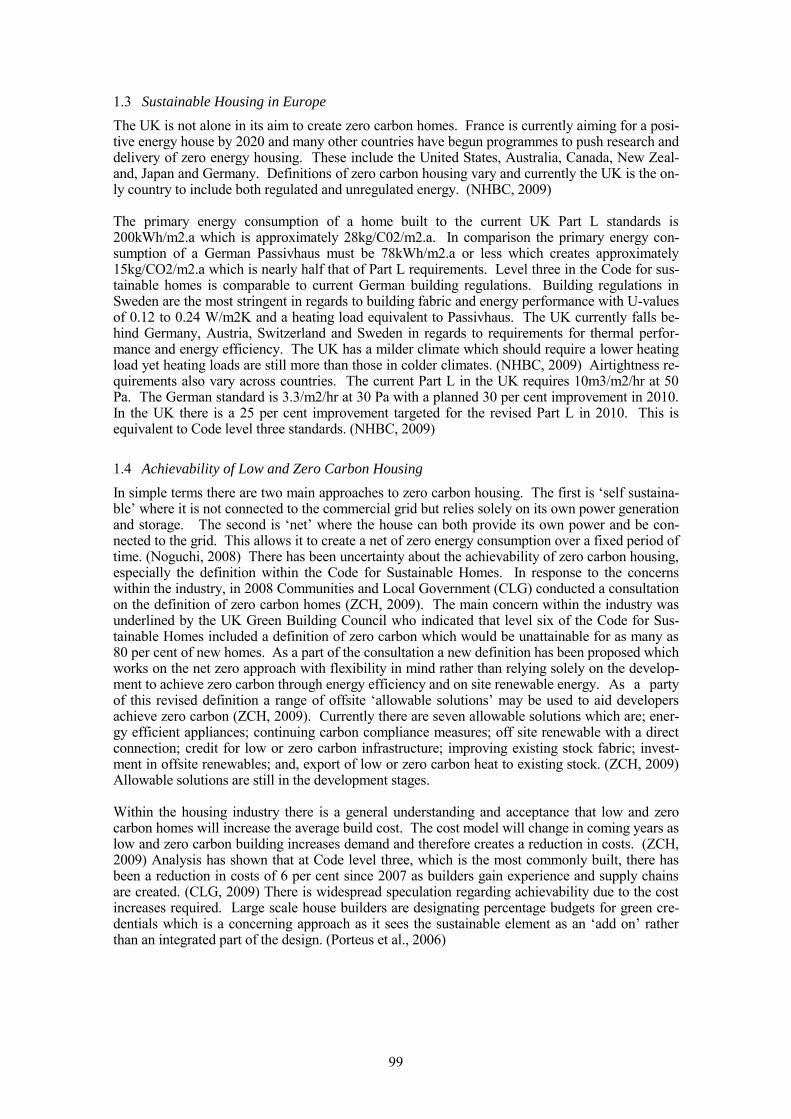
1.3 Sustainable Housing in Europe
The UK is not alone in its aim to create zero carbon homes. France is currently aiming for a posi-tive energy house by 2020 and many other countries have begun programmes to push research and delivery of zero energy housing. These include the United States, Australia, Canada, New Zeal-and, Japan and Germany. Definitions of zero carbon housing vary and currently the UK is the on-ly country to include both regulated and unregulated energy. (NHBC, 2009) The primary energy consumption of a home built to the current UK Part L standards is 200kWh/m2.a which is approximately 28kg/C02/m2.a. In comparison the primary energy con-sumption of a German Passivhaus must be 78kWh/m2.a or less which creates approximately 15kg/CO2/m2.a which is nearly half that of Part L requirements. Level three in the Code for sus-tainable homes is comparable to current German building regulations. Building regulations in Sweden are the most stringent in regards to building fabric and energy performance with U-values of 0.12 to 0.24 W/m2K and a heating load equivalent to Passivhaus. The UK currently falls be-hind Germany, Austria, Switzerland and Sweden in regards to requirements for thermal perfor-mance and energy efficiency. The UK has a milder climate which should require a lower heating load yet heating loads are still more than those in colder climates. (NHBC, 2009) Airtightness re-quirements also vary across countries. The current Part L in the UK requires 10m3/m2/hr at 50 Pa. The German standard is 3.3/m2/hr at 30 Pa with a planned 30 per cent improvement in 2010. In the UK there is a 25 per cent improvement targeted for the revised Part L in 2010. This is equivalent to Code level three standards. (NHBC, 2009)
1.4 Achievability of Low and Zero Carbon Housing
In simple terms there are two main approaches to zero carbon housing. The first is ‘self sustaina-ble’ where it is not connected to the commercial grid but relies solely on its own power generation and storage. The second is ‘net’ where the house can both provide its own power and be con-nected to the grid. This allows it to create a net of zero energy consumption over a fixed period of time. (Noguchi, 2008) There has been uncertainty about the achievability of zero carbon housing, especially the definition within the Code for Sustainable Homes. In response to the concerns within the industry, in 2008 Communities and Local Government (CLG) conducted a consultation on the definition of zero carbon homes (ZCH, 2009). The main concern within the industry was underlined by the UK Green Building Council who indicated that level six of the Code for Sus-tainable Homes included a definition of zero carbon which would be unattainable for as many as 80 per cent of new homes. As a part of the consultation a new definition has been proposed which works on the net zero approach with flexibility in mind rather than relying solely on the develop-ment to achieve zero carbon through energy efficiency and on site renewable energy. As a party of this revised definition a range of offsite ‘allowable solutions’ may be used to aid developers achieve zero carbon (ZCH, 2009). Currently there are seven allowable solutions which are; ener-gy efficient appliances; continuing carbon compliance measures; off site renewable with a direct connection; credit for low or zero carbon infrastructure; improving existing stock fabric; invest-ment in offsite renewables; and, export of low or zero carbon heat to existing stock. (ZCH, 2009) Allowable solutions are still in the development stages. Within the housing industry there is a general understanding and acceptance that low and zero carbon homes will increase the average build cost. The cost model will change in coming years as low and zero carbon building increases demand and therefore creates a reduction in costs. (ZCH, 2009) Analysis has shown that at Code level three, which is the most commonly built, there has been a reduction in costs of 6 per cent since 2007 as builders gain experience and supply chains are created. (CLG, 2009) There is widespread speculation regarding achievability due to the cost increases required. Large scale house builders are designating percentage budgets for green cre-dentials which is a concerning approach as it sees the sustainable element as an ‘add on’ rather than an integrated part of the design. (Porteus et al., 2006)
99

1.5 Design Team
Cabe, the government’s advisor on architecture, urban design and public space completed a UK housing audit in 2009. The results demonstrate that most consumers are getting a raw deal in re-gards to new homes. Only 18 per cent were found to be ‘good’ or ‘very good’, 53 per cent were average and the design quality of 29 per cent was so poor that planning permission should not have been granted. (Cabe, 2009) It is suggested that the house building industry should take some responsibility as they are guilty of having pursued maximum profitability at the expense of social and environmental responsibility. (Maliene et al., 2009) An urgent improvement is required. (Cabe, 2010) A study by Bailey et al. (2007) found that 10 per cent of participants were willing to pay a substantial premium for a sustainable home whereas 59 per cent were willing to pay a pre-mium and 32 per cent would be willing to pay marginally more. A survey by NHBC found the re-sponse to sustainable community infrastructure was that 33 per cent would want to pay less to live there and 21 per cent would want to pay more (NHBC, 2009). The Architecture profession is often wary of sustainability due to its seeming limitations. Similar to developers, designers frequently see sustainability as another required addition to the design process instead of an integral part of it (Ryhaug, 2005). With this outlook on sustainability the discipline of Architecture has often retreated into visual and spatial innovation rather than at-tempting to lead the way in sustainable specification. Design factors considered in the design process could be summarised as: functionality; aesthetics; symbolic value; availability; and cost. Sustainability and the consideration of environmental, economic and social concern is only an ad-dition to this list. Often when Architects do integrate sustainability in the design process their strategy is to copy the ecological processes involved, without having a true understanding of them (Stevenson, 2006). (McCullough et al., 2010) Architects must understand that rules of thumb used to guide the design process may no longer be valid in this context. Design guides are often used to optimise building performance but these are dependent on the climate where they are developed and the local technologies. They are also mostly developed under ideal conditions whereas real sites may not be south facing or may be in shade along with other site specific factors (Charron, 2008). The Zero Carbon Hub have sug-gested that designers must begin to change their language and start to talk in the preferred metric of KWh/m2/yr in regards to space heating and space cooling energy demand (ZCH, 2009). Build-ing professionals significantly influence the decision making processes in housing construction. This suggests that the perceptions of building professionals will have an influence on the future of sustainable development. Although governments provide guidelines for sustainable construction the implementation process will be influenced and determined by the perceptions and awareness of building professionals (Lo et al, 2006). (McCullough et al., 2010)
1.6 Research Project
Hayles and Dean (2010) explain that perceptions of climate change in the UK vary greatly: In a public attitude survey (Curry et al., 2005) 28% of participants stated that ‘we will have to change our lifestyles to reduce energy consumption’, whereas 27% of respondents stated that ‘global warming is a problem but the UK won’t do anything about it’. 27% stated that ‘researchers will develop new technologies to solve the problem’, which means that a large number of those participating in the survey did not feel they had a responsibility to change their environmental behaviour, relying solely on centralised mitigation to address the problem.
To create designs which achieve their low carbon emissions targets in reality, designers must be informed in regards to the perceptions and behaviours’ of end users and how they adapt to living with sustainable design strategies and therefore develop an understanding of how design strategies perform in reality. This is a twofold issue where the perceptions, awareness and behaviours of both the designer and the end user must be collected and analysed to find the adaptations required to design or live in a sustainable home. There are few known projects that have looked at perceptions’ and awareness of the adaptations required to live in and design environmentally sustainable homes and therefore, this research must be completed before a successful method for achieving nationwide zero carbon housing can be developed. (McCullough et al., 2010)
100
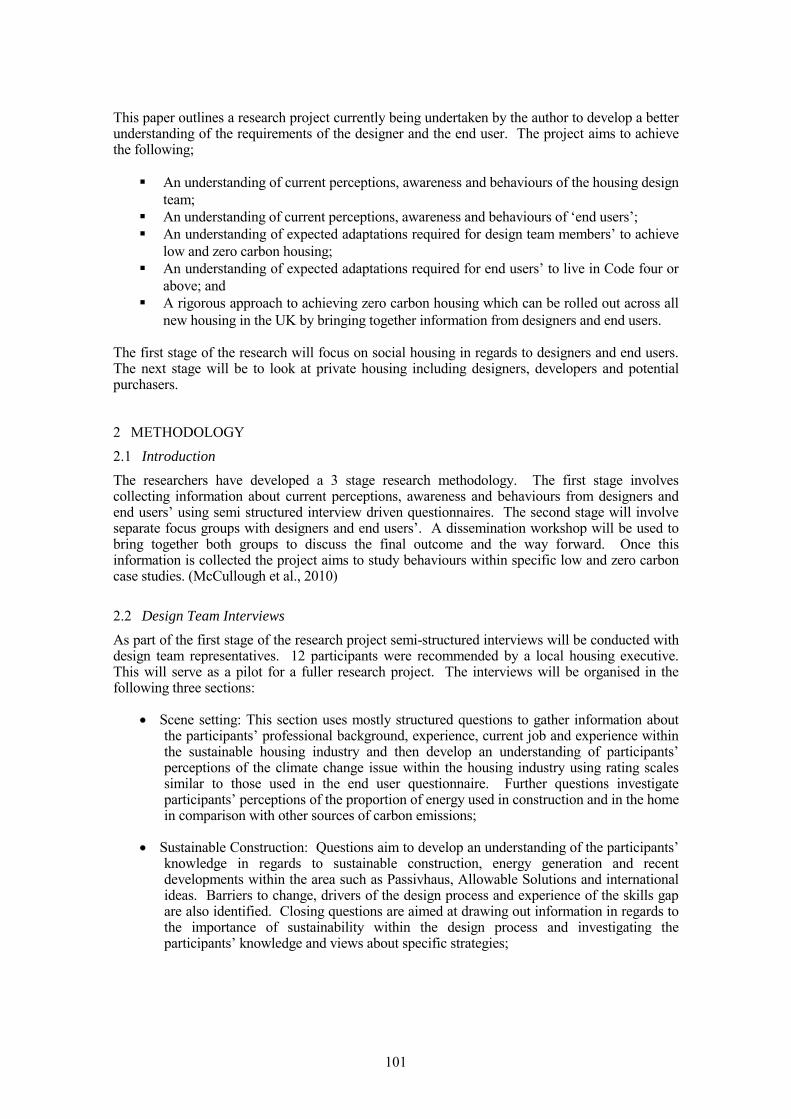
This paper outlines a research project currently being undertaken by the author to develop a better understanding of the requirements of the designer and the end user. The project aims to achieve the following;
An understanding of current perceptions, awareness and behaviours of the housing design
team;
An understanding of current perceptions, awareness and behaviours of ‘end users’;
An understanding of expected adaptations required for design team members’ to achieve
low and zero carbon housing;
An understanding of expected adaptations required for end users’ to live in Code four or
above; and
A rigorous approach to achieving zero carbon housing which can be rolled out across all
new housing in the UK by bringing together information from designers and end users.
The first stage of the research will focus on social housing in regards to designers and end users. The next stage will be to look at private housing including designers, developers and potential purchasers.
2 METHODOLOGY
2.1 Introduction
The researchers have developed a 3 stage research methodology. The first stage involves collecting information about current perceptions, awareness and behaviours from designers and end users’ using semi structured interview driven questionnaires. The second stage will involve separate focus groups with designers and end users’. A dissemination workshop will be used to bring together both groups to discuss the final outcome and the way forward. Once this information is collected the project aims to study behaviours within specific low and zero carbon case studies. (McCullough et al., 2010)
2.2 Design Team Interviews
As part of the first stage of the research project semi-structured interviews will be conducted with design team representatives. 12 participants were recommended by a local housing executive. This will serve as a pilot for a fuller research project. The interviews will be organised in the following three sections:
Scene setting: This section uses mostly structured questions to gather information about the participants’ professional background, experience, current job and experience within the sustainable housing industry and then develop an understanding of participants’ perceptions of the climate change issue within the housing industry using rating scales similar to those used in the end user questionnaire. Further questions investigate participants’ perceptions of the proportion of energy used in construction and in the home in comparison with other sources of carbon emissions;
Sustainable Construction: Questions aim to develop an understanding of the participants’ knowledge in regards to sustainable construction, energy generation and recent developments within the area such as Passivhaus, Allowable Solutions and international ideas. Barriers to change, drivers of the design process and experience of the skills gap are also identified. Closing questions are aimed at drawing out information in regards to the importance of sustainability within the design process and investigating the participants’ knowledge and views about specific strategies;
101
Perceptions of End Users: Discussion is focused on developing an understanding of participants’ perceptions of end users in regards to the changes required to live in a Code 4 or above home and the likeliness of behaviour change; and
Design Guides: Questions aim to investigate the effectiveness of design guides and the
extent to which they are used by the design team. (McCullough et al., 2010)
2.3 End User Questionnaire
The questionnaire is focused on gaining information about end users’ current environmental behaviours and their awareness and perceptions of environmental strategies which may be used to achieve higher levels of the CSH and zero carbon housing design. The questionnaire is split into the following seven sections:
Scene Setting: Questions aim to develop an understanding of each participants’ perceptions of the climate change issue by asking how they feel when they hear climate change discussed and who, if anyone, they think is responsible for solving the problem. Participants are also asked to rank the key issues facing society today to gain an understanding of how important they perceive climate change to be in comparison to other global issues (Lo et al., 2006). Finally questions seek to develop an understanding of the participants’ perceptions and experiences of living in their current home;
Transport: This section identifies each participant’s behaviours in regards to mode of
transport and distance traveled and differentiates between public and private transport use;
Energy use in the home: Questions focus on: recording participants’ use of energy
through appliances; behaviours in relation to energy use, for example, by asking if they regularly turn off lights when leaving rooms; energy saving behaviours such as voluntary installation of energy saving bulbs or what influences participants’ to buy a specific appliance, for example, trusted manufacturer, aesthetics, cost, recommendation by friend or family or by energy rating. Space heating behaviour is also investigated;
Energy strategies: This section investigates scenarios of energy saving strategies and uses
rating scales to identify how happy or unhappy each participant would be if they had that strategy installed their home and if they would be happy to change their behaviours to save energy;
Food: Questions gather information to identify consumer habits and eating habits;
Water: This section investigates participants perceptions’ of how much water they think
they could save and gathers information about perception of risks associated with use of recycled water in the home, recycled from rainwater, grey water and black water for use, in washing machines, WC’s and garden taps; and
Consumer behaviour: Questions identify consumer behaviour in regards to what or who
influences the participants’ consumer behaviour, how often they replace goods, and their waste and recycling behaviours. (McCullough et al., 2010)
Within these sections enough information is gathered about behaviours and consumer patterns to calculate a carbon and wider ecological footprint for each household. The questionnaire has been piloted with a small sample of respondents. The researchers were then able to identify questions which were not provoking the required information. A series of pilots and improvements were completed to ensure ease of understanding and return of the desired information. Twelve households from three demographic groups are to be included in the social housing study. Four households from each group will be from a rural, suburban and urban situation respectively. This will give a sample of 36. A further survey will include more participants to facilitate comparison
102
between the sub sections of home location as well as demographic group. Interviews will begin during summer 2010. (McCullough et al., 2010)
2.4 Focus Groups
The second stage of the project will use focus groups to collect further information which could not be attained by a questionnaire or interview (Kruger, 1988). Focus groups will be conducted with both end users and design team members to develop a more focused and in-depth understanding of the changes required to adapt to living in a home which meets the higher levels of the CSH. Focus groups with end user participants will facilitate exploration of scenarios relating to design strategies which could be used to achieve the higher levels of the CSH. The scenarios will focus specifically on perceptions of living with and adapting to these strategies. Scenarios will also be developed to gather further information in regards to issues arising from the questionnaires. Focus groups with design team members will be used to identify barriers to change as well as exploring design strategies. Similarly to the end user focus groups it will offer an opportunity to expand on issues arising from the interviews. (McCullough et al., 2010) Topics covered within the focus group setting will be prompted by a schedule with eight to ten questions that are thought to be most appropriate, because in a group environment, a question could last for a long period of time compared to an interview (Krueger, 1988). The questions posed will be open ended to offer the opportunity for the respondent to answer from a variety of dimensions without the researcher influencing the perceptions or the manner of response. Similarly to the questionnaire and interview questions, the questions used in the focus group schedule will be tested ahead of time to avoid unforeseen problems (Granger, 2002). (McCullough et al., 2010)
2.5 Dissemination Workshop
Finally a dissemination workshop will take place. This will be an opportunity to represent both end users and design team members. The discussion will focus on the information gathered from the previous stages in regards to perceptions, awareness and behaviours and will aim at developing understanding between the two groups and therefore, a clear way forward. This will follow the same format as the focus groups. The demographic factors will be an influencing factor in selection of participants for the workshop (Granger, 2002). (McCullough et al., 2010)
3 CONCLUSION AND WAY FORWARD
Current design approaches to Code four and above are often focused on achieving points within the assessment method rather than a holistic approach to sustainability. If the construction industry are to provide homes that are truly sustainable and achieve Zero Carbon, strategies must be focused on understanding the adaptations required of designers and end users when designing and living in homes which meet Code four and above of the CSH. This methodology will provide the information on which designers can then base decision making. It will allow them to develop a method for achieving Zero Carbon housing in which the end user can easily achieve net zero carbon emissions. This would then offer a way forward grounded in the perceptions, awareness and behaviours of end users and designers which could be rolled out across the UK to meet the 2016 Zero Carbon target. (McCullough et al., 2010)
103
REFERENCES
BAILEY L, TOLMIE-THOMSON R, MILES-BROWN S, MARRIS I, JONES R, FARMER M. (2007) Eco-homes, economically
sustainable? EC Harris & Knight Frank
CABE (2009) Better buildings and spaces improve quality of life, says the public. http://www.cabe.org.uk/news/better-buildings-
and-spaces-improve-quality-of-life Accessed 25.01.10CHARRON R (2008) Review of Design Processes for Low Energy
Solar Homes. Open House International. Vol.33 no.3
CABE (2010) Housing audit results. http://www.cabe.org.uk/housing/audit-results Accessed 04.02.10CURRY T E, REINER D M,
DE FIGUEIREDO M A, HERTZOG H J (2005) A survey of Public Attitudes towards Energy and Environment in Great
Britain. Publication No. LFEE 2005-001 WP http://Ifee.mit.edu/publications/
COMMUNITIES AND LOCAL GOVERNMENT (2009) Sustainable new homes – The Road to Zero Carbon. Consultation on the
Code for Sustainable Homes and the Energy Efficiency Standard for Zero Carbon Homes. Crown Copyright.
COMMUNITES AND LOCAL GOVERNMENT(2006) Building a greener future : Towards Zero Carbon Development.
http://www.communities.gov.uk/archived/publications/planningandbuilding/buildinggreener
GRANGER M M, FISCHHOFF B, BOSTROM A, ATMAN C (2002) Risk Communication – A Mental Models Approach.
Cambridge University Press. UK.
HAYLES, C. S. and DEAN, M. (2010) A methodology to investigate adaption for zero carbon living. Proceedings of the CIB 2010
World Congress: Building a better world. The Lowry, Salford Quays, United Kingdom, May 10th - 13th 2010.
HAYLES, C. S., DEAN, M. and McCULLOUGH, J. (2010) Methodology for assessing changes to tenants’ perceptions, awareness
and behaviours around sustainable living, in response to proactive sustainable technology interventions in social housing.
Proceedings of SB10: Sustainable building affordable to all, Vilamoura Hilton, Portugal, 17th-19th March 2010.
KRUEGER R (1988) Focus Groups - A practical guide for Applied Research. Sage Publications. London.
LO S M, ZHAO C M, CHENG W Y. (2006) Perceptions of building professionals in sustainable development: A comparative
study between Hong Kong and Shenyang. Energy and Buildings vol.38 pp1327 – 1334
MALIENE V, RUZINSKAITE J. (2009)Development of sustainable dwelling in Lithuania.
XXIII FIG congress, Munich, 2006. p. 1–15.
McCULLOUGH J E, HAYLES C S, DEAN M. (2010) Methodology for Assessing End Users and Design Teams’ Perceptions,
Awareness and Behaviours around Sustainable Housing Design. Proceedings for SB10 Sustainable Community
Conference, Espoo, Finland. September 22nd – 24th 2010. Submitted but not yet accepted.
NHBC (2009)Zero Carbon Compendium – Who’s doing what in housing worldwide. NHBC Foundation
NOGUCHI M (2008) The Quest for Zero Carbon Housing Solutions. Open House International. Vol.33 no.3
PENSON S (2005) Car and Household Emissions Threaten UK’s CO2 Goals. Reuters/Planetark,
/http://www.planetark.com/dailynewsstory.cfm/newsid/32537/story.htmS, 2005/10/06.ROAF S. (2003) Solar Oxford
Initiative. Oxford Energy Forum. Pp9-10.
http://www.planetark.com/dailynewsstory.cfm/newsid/32537/story.htms, Accessed. 2005/10/06.
PORTEUS C D A, MENON R. (2006) Problems of the Scottish / UK Building Industry vs. energy-efficicient new build passive
housing. Passive houses in Cold and Mediterranean Climates. Working group 8. Internaitonal House Conference pp211-
216.ROTHERAY (2009) Zero Carbon Homes – The Way Forward. Micro Power Document.
RYHAUG M (2005) Policing Sustainability: Strategies towards a sustainable architecture in Norway. Sustainable Architectures:
Cultures and Natures in Europe and North America. Ed. Guy S &Moore S A. Spon press: Abingdon and New York.
Pp145-161
STEVENSON F (2006) Natural Materiality – The people’s choice. WIT Transactions on the Built Environment. Vol 86 pp257 –
266.
ZERO CARBON HUB (2009) Defining a Fabric Energy Efficiency Standard: for zero carbon homes.
104
1 INTRODUCTION
The present paper intends to investigate issues of sustainable development on the urban neigh-borhood level. The relationship between the city and the neighborhood and their interaction are very important for the achievement of sustainability in urban systems.
Important parameters that define the sustainability of an urban neighborhood are: the location of the neighborhood into the urban tissue, the population density, the transportation network, the energy consumption, the layout of the buildings, the orientation of the basic axis of the neigh-borhood, and the economic parameter as well. Initially, some basic theoretical and methodolog-ical issues will be presented that refer mostly to European countries.
Theoretical issues concerning the sustainability of the urban neighborhood will be analyzed in a specific framework of case studies; in order to diagnose the way theoretical conclusions for the urban neighborhood can be implemented in real constructions. Three case studies of urban neighborhood in three different European countries will be examined. The comparative analysis of these case studies intends to recognize common elements of the urban neighborhoods, and to point out which are the elements that are related to the particular circumstances that contributed
Sustainable design in the neighborhood scale: Analysis of planning issues and case studies
D. Tsirigoti Aristotle University of Thessaloniki, Thessaloniki, Greece. [email protected]
ABSTRACT: This paper examines issues of sustainable development on the urban neighbor-hood level. Nowadays, the demand for lower energy consumption is urgent due to the decrease of non renewable energy sources and secondly and the indisputable impact of the CO2 emissions on climate change and on human health. The residential sector consumes a large amount of energy and methods for its reduction have been implemented recently in the building and the city scale. The urban neighborhood constitutes a part of the city that can be easily planned and managed. This study focuses on the analysis of the factors that influence the sustainable development of the urban neighborhood: location, population density, transportation network, energy consump-tion, urban form, building orientation and economics as well. Firstly, some theoretical issues of the corresponding international literature are presented concerning the sustainability of the ur-ban neighborhood. Secondly, three case studies of new urban neighborhoods in Europe are ex-amined (Vauban in Germany, Bed Zed in UK, and GWL in the Netherlands) where the prin-ciples of sustainable development have been applied. The presentation of these case studies intends to reinforce the theoretical conclusions and to clarify the transition from theory to prac-tice. The comparison of these neighborhoods intends to underline their common elements and to recognize the particularities that lead to the formation of each specific urban space.
105
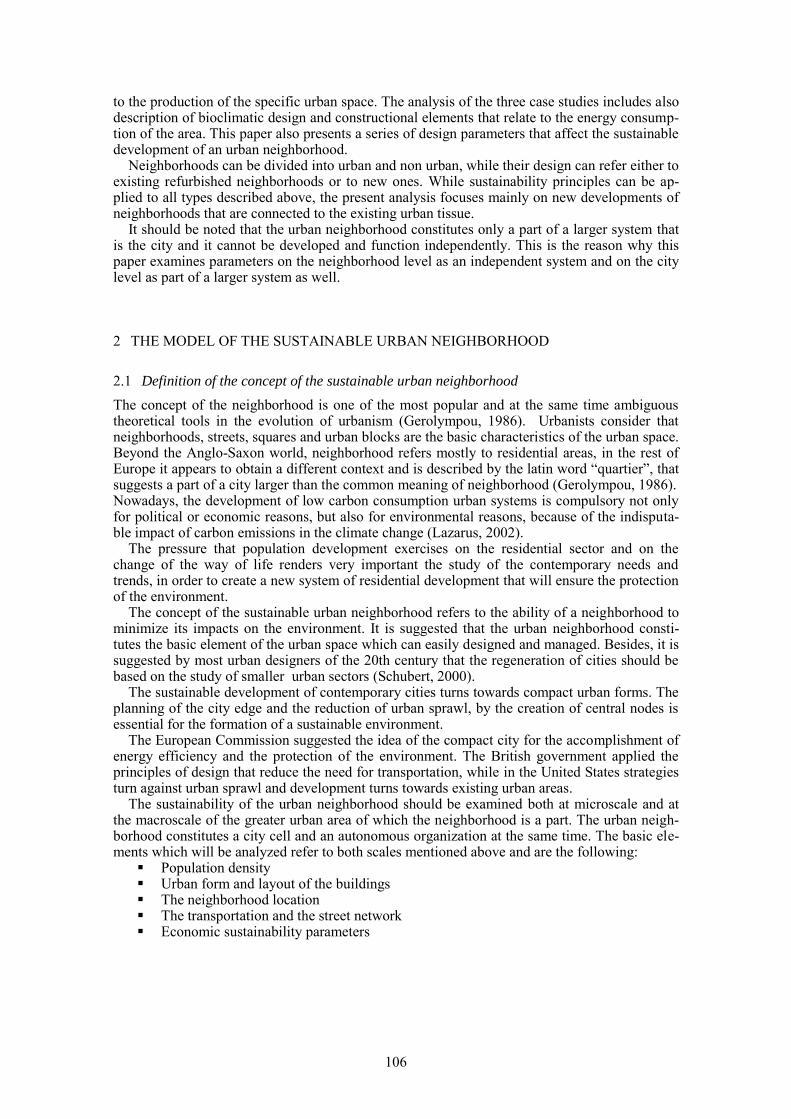
to the production of the specific urban space. The analysis of the three case studies includes also description of bioclimatic design and constructional elements that relate to the energy consump-tion of the area. This paper also presents a series of design parameters that affect the sustainable development of an urban neighborhood.
Neighborhoods can be divided into urban and non urban, while their design can refer either to existing refurbished neighborhoods or to new ones. While sustainability principles can be ap-plied to all types described above, the present analysis focuses mainly on new developments of neighborhoods that are connected to the existing urban tissue.
It should be noted that the urban neighborhood constitutes only a part of a larger system that is the city and it cannot be developed and function independently. This is the reason why this paper examines parameters on the neighborhood level as an independent system and on the city level as part of a larger system as well.
2 THE MODEL OF THE SUSTAINABLE URBAN NEIGHBORHOOD
2.1 Definition of the concept of the sustainable urban neighborhood
The concept of the neighborhood is one of the most popular and at the same time ambiguous theoretical tools in the evolution of urbanism (Gerolympou, 1986). Urbanists consider that neighborhoods, streets, squares and urban blocks are the basic characteristics of the urban space. Beyond the Anglo-Saxon world, neighborhood refers mostly to residential areas, in the rest of Europe it appears to obtain a different context and is described by the latin word “quartier”, that suggests a part of a city larger than the common meaning of neighborhood (Gerolympou, 1986). Nowadays, the development of low carbon consumption urban systems is compulsory not only for political or economic reasons, but also for environmental reasons, because of the indisputa-ble impact of carbon emissions in the climate change (Lazarus, 2002).
The pressure that population development exercises on the residential sector and on the change of the way of life renders very important the study of the contemporary needs and trends, in order to create a new system of residential development that will ensure the protection of the environment.
The concept of the sustainable urban neighborhood refers to the ability of a neighborhood to minimize its impacts on the environment. It is suggested that the urban neighborhood consti-tutes the basic element of the urban space which can easily designed and managed. Besides, it is suggested by most urban designers of the 20th century that the regeneration of cities should be based on the study of smaller urban sectors (Schubert, 2000).
The sustainable development of contemporary cities turns towards compact urban forms. The planning of the city edge and the reduction of urban sprawl, by the creation of central nodes is essential for the formation of a sustainable environment.
The European Commission suggested the idea of the compact city for the accomplishment of energy efficiency and the protection of the environment. The British government applied the principles of design that reduce the need for transportation, while in the United States strategies turn against urban sprawl and development turns towards existing urban areas.
The sustainability of the urban neighborhood should be examined both at microscale and at the macroscale of the greater urban area of which the neighborhood is a part. The urban neigh-borhood constitutes a city cell and an autonomous organization at the same time. The basic ele-ments which will be analyzed refer to both scales mentioned above and are the following:
Population density Urban form and layout of the buildings The neighborhood location The transportation and the street network Economic sustainability parameters
106
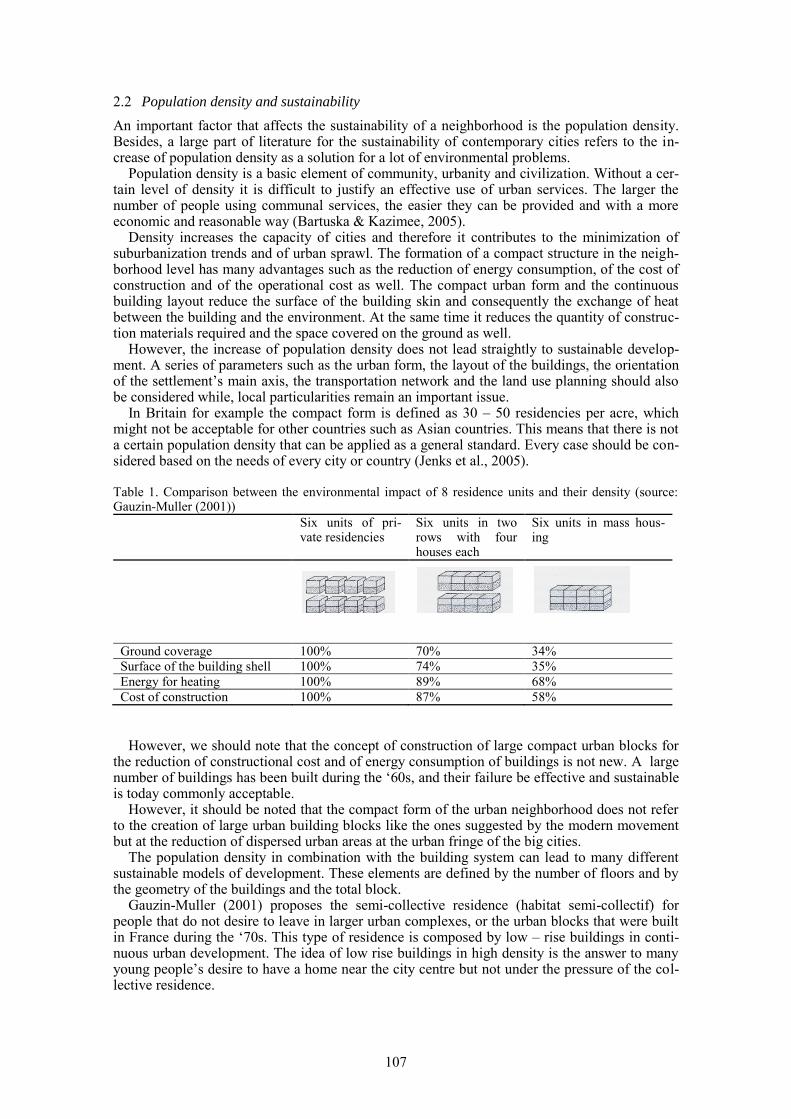
2.2 Population density and sustainability
An important factor that affects the sustainability of a neighborhood is the population density. Besides, a large part of literature for the sustainability of contemporary cities refers to the in-crease of population density as a solution for a lot of environmental problems.
Population density is a basic element of community, urbanity and civilization. Without a cer-tain level of density it is difficult to justify an effective use of urban services. The larger the number of people using communal services, the easier they can be provided and with a more economic and reasonable way (Bartuska & Kazimee, 2005).
Density increases the capacity of cities and therefore it contributes to the minimization of suburbanization trends and of urban sprawl. The formation of a compact structure in the neigh-borhood level has many advantages such as the reduction of energy consumption, of the cost of construction and of the operational cost as well. The compact urban form and the continuous building layout reduce the surface of the building skin and consequently the exchange of heat between the building and the environment. At the same time it reduces the quantity of construc-tion materials required and the space covered on the ground as well.
However, the increase of population density does not lead straightly to sustainable develop-ment. A series of parameters such as the urban form, the layout of the buildings, the orientation of the settlement‟s main axis, the transportation network and the land use planning should also be considered while, local particularities remain an important issue.
In Britain for example the compact form is defined as 30 – 50 residencies per acre, which might not be acceptable for other countries such as Asian countries. This means that there is not a certain population density that can be applied as a general standard. Every case should be con-sidered based on the needs of every city or country (Jenks et al., 2005). Table 1. Comparison between the environmental impact of 8 residence units and their density (source: Gauzin-Muller (2001))
Six units of pri-vate residencies
Six units in two rows with four houses each
Six units in mass hous-ing
Ground coverage 100% 70% 34%
Surface of the building shell 100% 74% 35%
Energy for heating 100% 89% 68%
Cost of construction 100% 87% 58%
However, we should note that the concept of construction of large compact urban blocks for the reduction of constructional cost and of energy consumption of buildings is not new. A large number of buildings has been built during the „60s, and their failure be effective and sustainable is today commonly acceptable.
However, it should be noted that the compact form of the urban neighborhood does not refer to the creation of large urban building blocks like the ones suggested by the modern movement but at the reduction of dispersed urban areas at the urban fringe of the big cities.
The population density in combination with the building system can lead to many different sustainable models of development. These elements are defined by the number of floors and by the geometry of the buildings and the total block.
Gauzin-Muller (2001) proposes the semi-collective residence (habitat semi-collectif) for people that do not desire to leave in larger urban complexes, or the urban blocks that were built in France during the „70s. This type of residence is composed by low – rise buildings in conti-nuous urban development. The idea of low rise buildings in high density is the answer to many young people‟s desire to have a home near the city centre but not under the pressure of the col-lective residence.
107
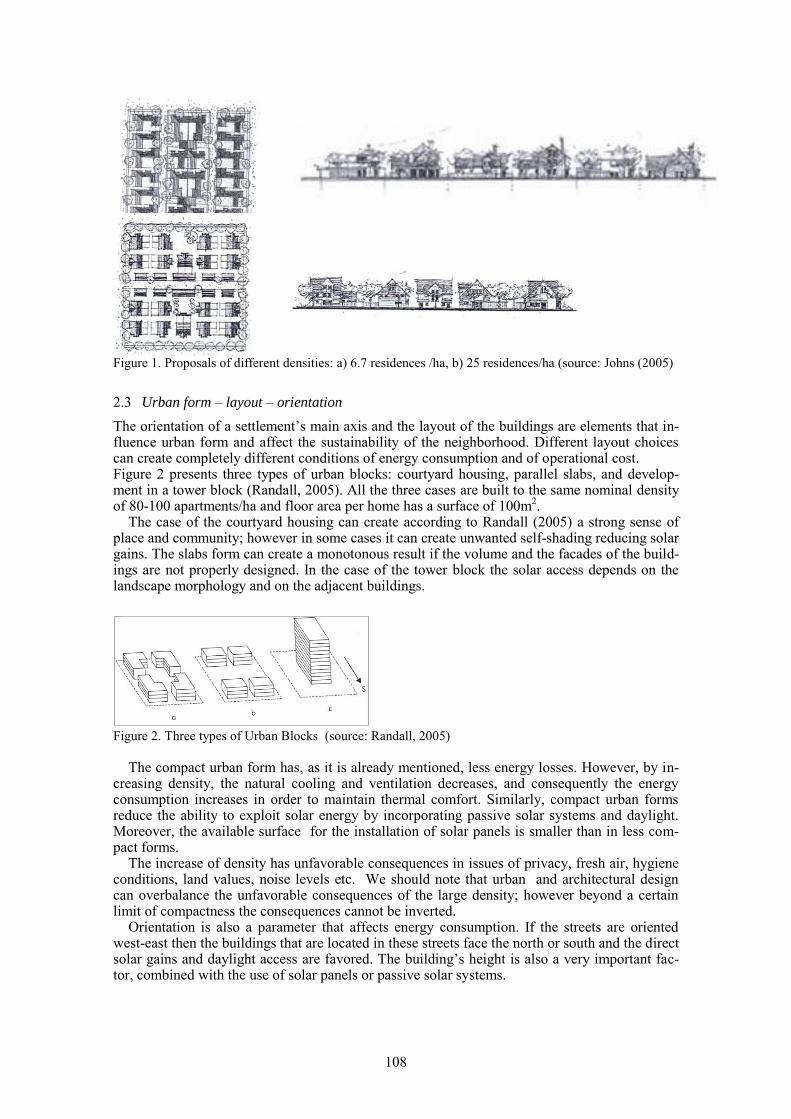
Figure 1. Proposals of different densities: a) 6.7 residences /ha, b) 25 residences/ha (source: Johns (2005)
2.3 Urban form – layout – orientation
The orientation of a settlement‟s main axis and the layout of the buildings are elements that in-fluence urban form and affect the sustainability of the neighborhood. Different layout choices can create completely different conditions of energy consumption and of operational cost. Figure 2 presents three types of urban blocks: courtyard housing, parallel slabs, and develop-ment in a tower block (Randall, 2005). All the three cases are built to the same nominal density of 80-100 apartments/ha and floor area per home has a surface of 100m
2.
The case of the courtyard housing can create according to Randall (2005) a strong sense of place and community; however in some cases it can create unwanted self-shading reducing solar gains. The slabs form can create a monotonous result if the volume and the facades of the build-ings are not properly designed. In the case of the tower block the solar access depends on the landscape morphology and on the adjacent buildings.
Figure 2. Three types of Urban Blocks (source: Randall, 2005)
The compact urban form has, as it is already mentioned, less energy losses. However, by in-
creasing density, the natural cooling and ventilation decreases, and consequently the energy consumption increases in order to maintain thermal comfort. Similarly, compact urban forms reduce the ability to exploit solar energy by incorporating passive solar systems and daylight. Moreover, the available surface for the installation of solar panels is smaller than in less com-pact forms.
The increase of density has unfavorable consequences in issues of privacy, fresh air, hygiene conditions, land values, noise levels etc. We should note that urban and architectural design can overbalance the unfavorable consequences of the large density; however beyond a certain limit of compactness the consequences cannot be inverted.
Orientation is also a parameter that affects energy consumption. If the streets are oriented west-east then the buildings that are located in these streets face the north or south and the direct solar gains and daylight access are favored. The building‟s height is also a very important fac-tor, combined with the use of solar panels or passive solar systems.
108
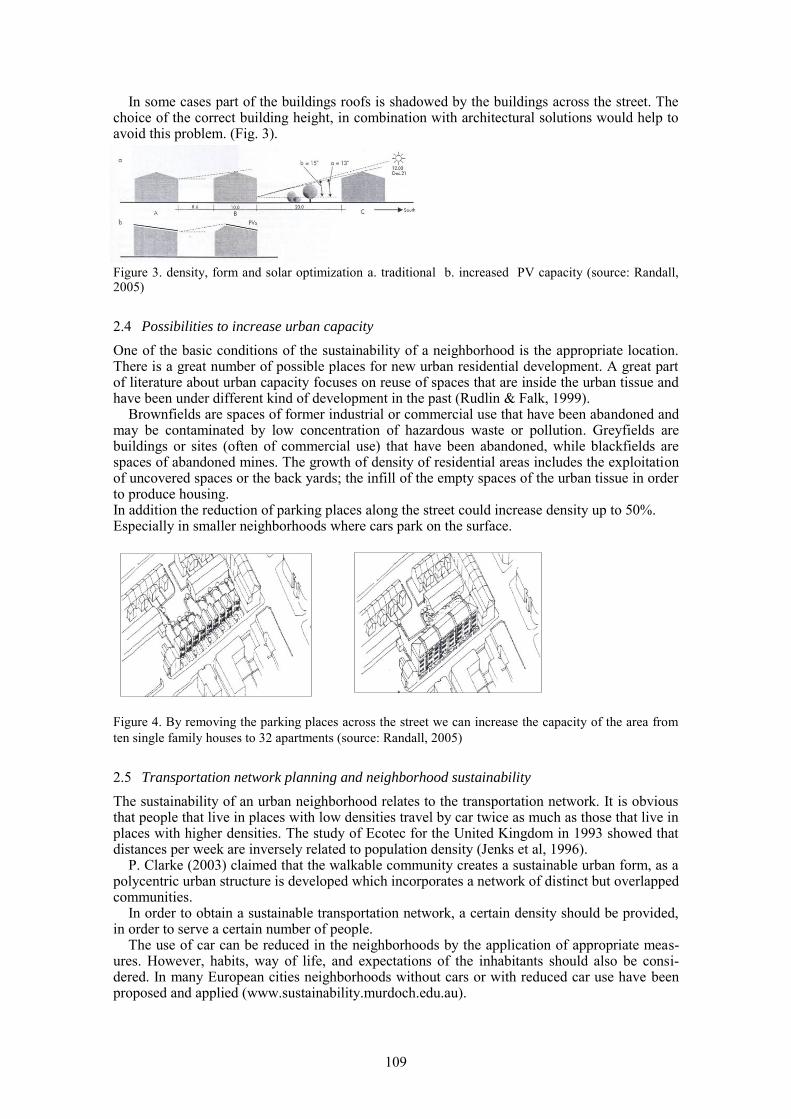
In some cases part of the buildings roofs is shadowed by the buildings across the street. The choice of the correct building height, in combination with architectural solutions would help to avoid this problem. (Fig. 3).
Figure 3. density, form and solar optimization a. traditional b. increased PV capacity (source: Randall, 2005)
2.4 Possibilities to increase urban capacity
One of the basic conditions of the sustainability of a neighborhood is the appropriate location. There is a great number of possible places for new urban residential development. A great part of literature about urban capacity focuses on reuse of spaces that are inside the urban tissue and have been under different kind of development in the past (Rudlin & Falk, 1999).
Brownfields are spaces of former industrial or commercial use that have been abandoned and may be contaminated by low concentration of hazardous waste or pollution. Greyfields are buildings or sites (often of commercial use) that have been abandoned, while blackfields are spaces of abandoned mines. The growth of density of residential areas includes the exploitation of uncovered spaces or the back yards; the infill of the empty spaces of the urban tissue in order to produce housing. In addition the reduction of parking places along the street could increase density up to 50%. Especially in smaller neighborhoods where cars park on the surface.
Figure 4. By removing the parking places across the street we can increase the capacity of the area from
ten single family houses to 32 apartments (source: Randall, 2005)
2.5 Transportation network planning and neighborhood sustainability
The sustainability of an urban neighborhood relates to the transportation network. It is obvious that people that live in places with low densities travel by car twice as much as those that live in places with higher densities. The study of Ecotec for the United Kingdom in 1993 showed that distances per week are inversely related to population density (Jenks et al, 1996).
P. Clarke (2003) claimed that the walkable community creates a sustainable urban form, as a polycentric urban structure is developed which incorporates a network of distinct but overlapped communities.
In order to obtain a sustainable transportation network, a certain density should be provided, in order to serve a certain number of people.
The use of car can be reduced in the neighborhoods by the application of appropriate meas-ures. However, habits, way of life, and expectations of the inhabitants should also be consi-dered. In many European cities neighborhoods without cars or with reduced car use have been proposed and applied (www.sustainability.murdoch.edu.au).
109
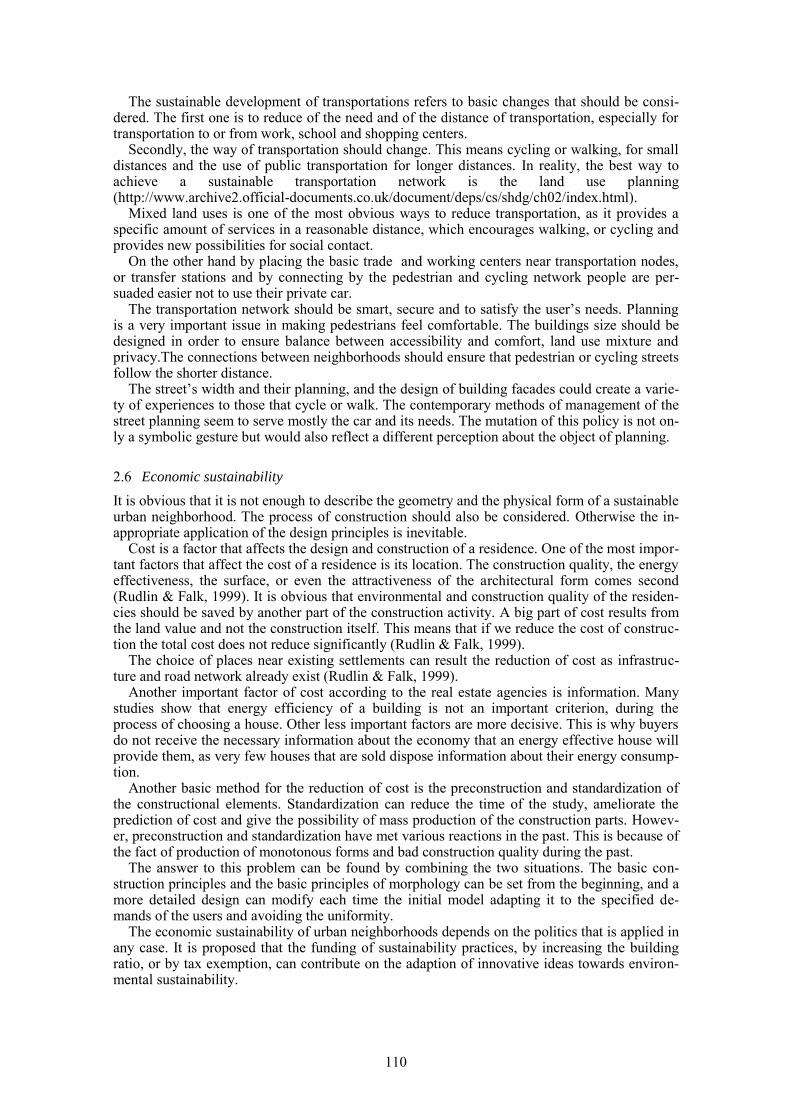
The sustainable development of transportations refers to basic changes that should be consi-dered. The first one is to reduce of the need and of the distance of transportation, especially for transportation to or from work, school and shopping centers.
Secondly, the way of transportation should change. This means cycling or walking, for small distances and the use of public transportation for longer distances. In reality, the best way to achieve a sustainable transportation network is the land use planning (http://www.archive2.official-documents.co.uk/document/deps/cs/shdg/ch02/index.html).
Mixed land uses is one of the most obvious ways to reduce transportation, as it provides a specific amount of services in a reasonable distance, which encourages walking, or cycling and provides new possibilities for social contact.
On the other hand by placing the basic trade and working centers near transportation nodes, or transfer stations and by connecting by the pedestrian and cycling network people are per-suaded easier not to use their private car.
The transportation network should be smart, secure and to satisfy the user‟s needs. Planning is a very important issue in making pedestrians feel comfortable. The buildings size should be designed in order to ensure balance between accessibility and comfort, land use mixture and privacy.The connections between neighborhoods should ensure that pedestrian or cycling streets follow the shorter distance.
The street‟s width and their planning, and the design of building facades could create a varie-ty of experiences to those that cycle or walk. The contemporary methods of management of the street planning seem to serve mostly the car and its needs. The mutation of this policy is not on-ly a symbolic gesture but would also reflect a different perception about the object of planning.
2.6 Economic sustainability
It is obvious that it is not enough to describe the geometry and the physical form of a sustainable urban neighborhood. The process of construction should also be considered. Otherwise the in-appropriate application of the design principles is inevitable.
Cost is a factor that affects the design and construction of a residence. One of the most impor-tant factors that affect the cost of a residence is its location. The construction quality, the energy effectiveness, the surface, or even the attractiveness of the architectural form comes second (Rudlin & Falk, 1999). It is obvious that environmental and construction quality of the residen-cies should be saved by another part of the construction activity. A big part of cost results from the land value and not the construction itself. This means that if we reduce the cost of construc-tion the total cost does not reduce significantly (Rudlin & Falk, 1999).
The choice of places near existing settlements can result the reduction of cost as infrastruc-ture and road network already exist (Rudlin & Falk, 1999).
Another important factor of cost according to the real estate agencies is information. Many studies show that energy efficiency of a building is not an important criterion, during the process of choosing a house. Other less important factors are more decisive. This is why buyers do not receive the necessary information about the economy that an energy effective house will provide them, as very few houses that are sold dispose information about their energy consump-tion.
Another basic method for the reduction of cost is the preconstruction and standardization of the constructional elements. Standardization can reduce the time of the study, ameliorate the prediction of cost and give the possibility of mass production of the construction parts. Howev-er, preconstruction and standardization have met various reactions in the past. This is because of the fact of production of monotonous forms and bad construction quality during the past.
The answer to this problem can be found by combining the two situations. The basic con-struction principles and the basic principles of morphology can be set from the beginning, and a more detailed design can modify each time the initial model adapting it to the specified de-mands of the users and avoiding the uniformity.
The economic sustainability of urban neighborhoods depends on the politics that is applied in any case. It is proposed that the funding of sustainability practices, by increasing the building ratio, or by tax exemption, can contribute on the adaption of innovative ideas towards environ-mental sustainability.
110
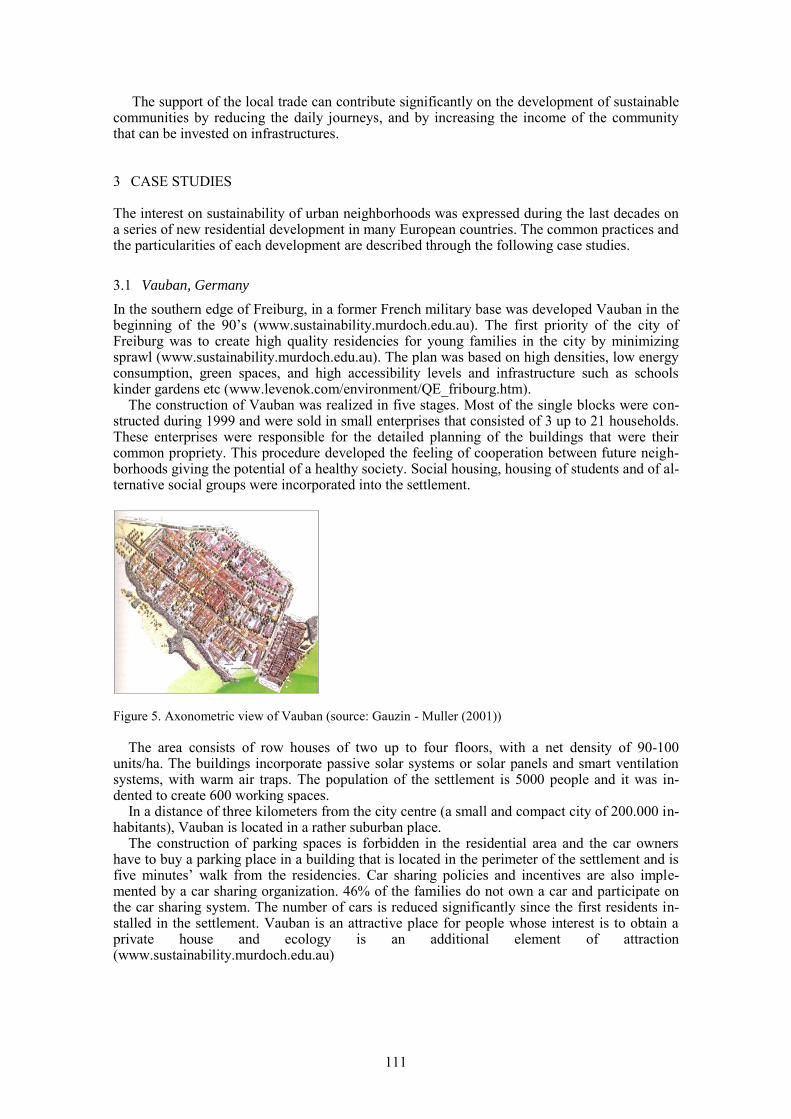
The support of the local trade can contribute significantly on the development of sustainable communities by reducing the daily journeys, and by increasing the income of the community that can be invested on infrastructures.
3 CASE STUDIES
The interest on sustainability of urban neighborhoods was expressed during the last decades on a series of new residential development in many European countries. The common practices and the particularities of each development are described through the following case studies.
3.1 Vauban, Germany
In the southern edge of Freiburg, in a former French military base was developed Vauban in the beginning of the 90‟s (www.sustainability.murdoch.edu.au). The first priority of the city of Freiburg was to create high quality residencies for young families in the city by minimizing sprawl (www.sustainability.murdoch.edu.au). The plan was based on high densities, low energy consumption, green spaces, and high accessibility levels and infrastructure such as schools kinder gardens etc (www.levenok.com/environment/QE_fribourg.htm).
The construction of Vauban was realized in five stages. Most of the single blocks were con-structed during 1999 and were sold in small enterprises that consisted of 3 up to 21 households. These enterprises were responsible for the detailed planning of the buildings that were their common propriety. This procedure developed the feeling of cooperation between future neigh-borhoods giving the potential of a healthy society. Social housing, housing of students and of al-ternative social groups were incorporated into the settlement.
Figure 5. Axonometric view of Vauban (source: Gauzin - Muller (2001))
The area consists of row houses of two up to four floors, with a net density of 90-100
units/ha. The buildings incorporate passive solar systems or solar panels and smart ventilation systems, with warm air traps. The population of the settlement is 5000 people and it was in-dented to create 600 working spaces.
In a distance of three kilometers from the city centre (a small and compact city of 200.000 in-habitants), Vauban is located in a rather suburban place.
The construction of parking spaces is forbidden in the residential area and the car owners have to buy a parking place in a building that is located in the perimeter of the settlement and is five minutes‟ walk from the residencies. Car sharing policies and incentives are also imple-mented by a car sharing organization. 46% of the families do not own a car and participate on the car sharing system. The number of cars is reduced significantly since the first residents in-stalled in the settlement. Vauban is an attractive place for people whose interest is to obtain a private house and ecology is an additional element of attraction (www.sustainability.murdoch.edu.au)
111
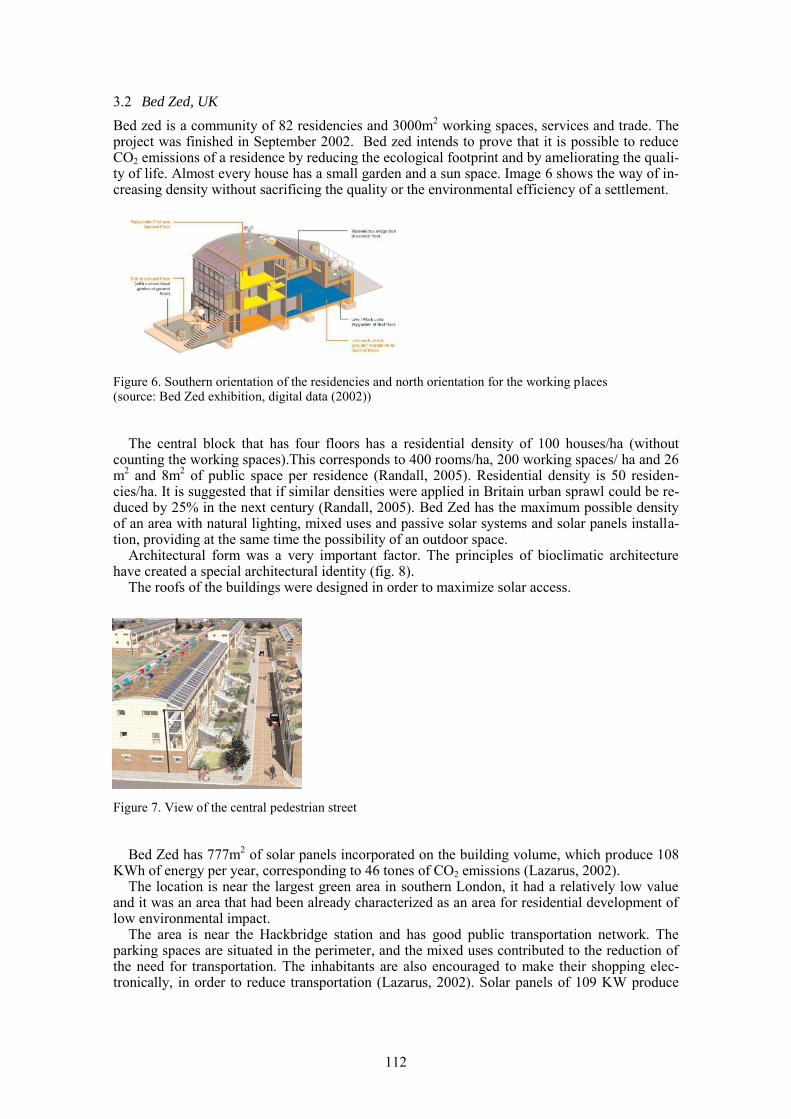
3.2 Bed Zed, UK
Bed zed is a community of 82 residencies and 3000m2 working spaces, services and trade. The
project was finished in September 2002. Bed zed intends to prove that it is possible to reduce CO2 emissions of a residence by reducing the ecological footprint and by ameliorating the quali-ty of life. Almost every house has a small garden and a sun space. Image 6 shows the way of in-creasing density without sacrificing the quality or the environmental efficiency of a settlement.
Figure 6. Southern orientation of the residencies and north orientation for the working places (source: Bed Zed exhibition, digital data (2002))
The central block that has four floors has a residential density of 100 houses/ha (without
counting the working spaces).This corresponds to 400 rooms/ha, 200 working spaces/ ha and 26 m
2 and 8m
2 of public space per residence (Randall, 2005). Residential density is 50 residen-
cies/ha. It is suggested that if similar densities were applied in Britain urban sprawl could be re-duced by 25% in the next century (Randall, 2005). Bed Zed has the maximum possible density of an area with natural lighting, mixed uses and passive solar systems and solar panels installa-tion, providing at the same time the possibility of an outdoor space.
Architectural form was a very important factor. The principles of bioclimatic architecture have created a special architectural identity (fig. 8).
The roofs of the buildings were designed in order to maximize solar access.
Figure 7. View of the central pedestrian street
Bed Zed has 777m
2 of solar panels incorporated on the building volume, which produce 108
KWh of energy per year, corresponding to 46 tones of CO2 emissions (Lazarus, 2002). The location is near the largest green area in southern London, it had a relatively low value
and it was an area that had been already characterized as an area for residential development of low environmental impact.
The area is near the Hackbridge station and has good public transportation network. The parking spaces are situated in the perimeter, and the mixed uses contributed to the reduction of the need for transportation. The inhabitants are also encouraged to make their shopping elec-tronically, in order to reduce transportation (Lazarus, 2002). Solar panels of 109 KW produce
112
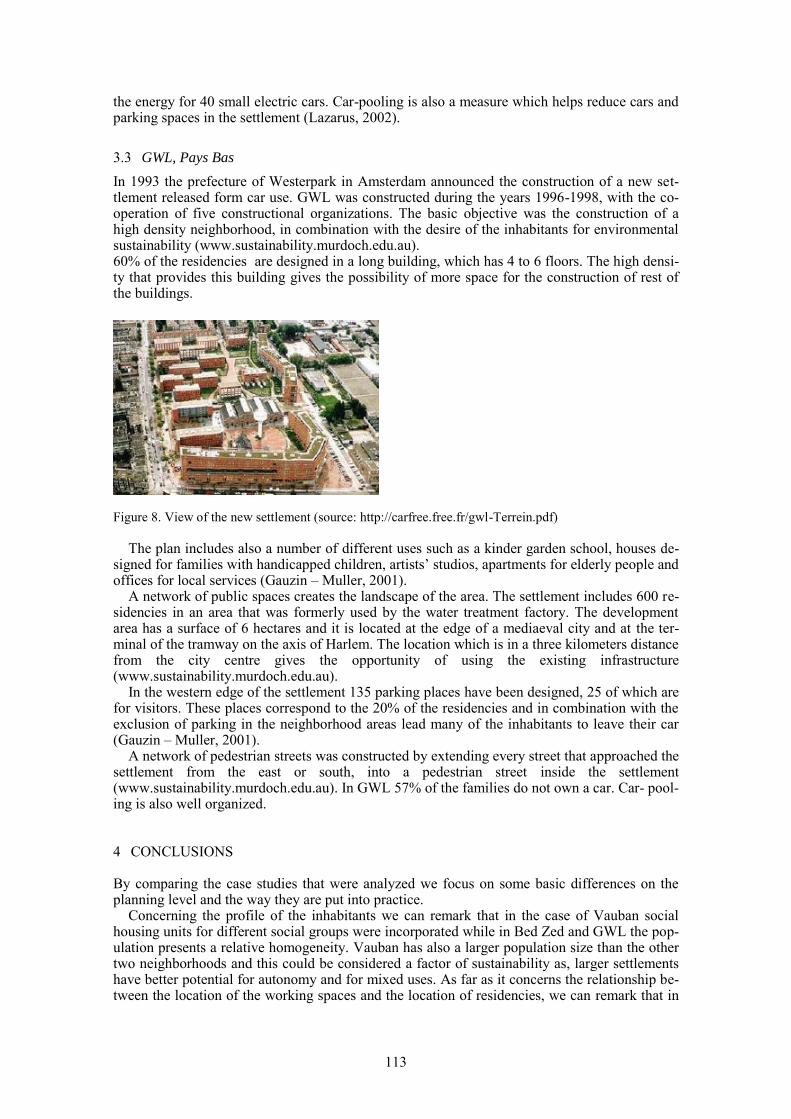
the energy for 40 small electric cars. Car-pooling is also a measure which helps reduce cars and parking spaces in the settlement (Lazarus, 2002).
3.3 GWL, Pays Bas
In 1993 the prefecture of Westerpark in Amsterdam announced the construction of a new set-tlement released form car use. GWL was constructed during the years 1996-1998, with the co-operation of five constructional organizations. The basic objective was the construction of a high density neighborhood, in combination with the desire of the inhabitants for environmental sustainability (www.sustainability.murdoch.edu.au). 60% of the residencies are designed in a long building, which has 4 to 6 floors. The high densi-ty that provides this building gives the possibility of more space for the construction of rest of the buildings.
Figure 8. View of the new settlement (source: http://carfree.free.fr/gwl-Terrein.pdf)
The plan includes also a number of different uses such as a kinder garden school, houses de-signed for families with handicapped children, artists‟ studios, apartments for elderly people and offices for local services (Gauzin – Muller, 2001).
A network of public spaces creates the landscape of the area. The settlement includes 600 re-sidencies in an area that was formerly used by the water treatment factory. The development area has a surface of 6 hectares and it is located at the edge of a mediaeval city and at the ter-minal of the tramway on the axis of Harlem. The location which is in a three kilometers distance from the city centre gives the opportunity of using the existing infrastructure (www.sustainability.murdoch.edu.au).
In the western edge of the settlement 135 parking places have been designed, 25 of which are for visitors. These places correspond to the 20% of the residencies and in combination with the exclusion of parking in the neighborhood areas lead many of the inhabitants to leave their car (Gauzin – Muller, 2001).
A network of pedestrian streets was constructed by extending every street that approached the settlement from the east or south, into a pedestrian street inside the settlement (www.sustainability.murdoch.edu.au). In GWL 57% of the families do not own a car. Car- pool-ing is also well organized.
4 CONCLUSIONS
By comparing the case studies that were analyzed we focus on some basic differences on the planning level and the way they are put into practice.
Concerning the profile of the inhabitants we can remark that in the case of Vauban social housing units for different social groups were incorporated while in Bed Zed and GWL the pop-ulation presents a relative homogeneity. Vauban has also a larger population size than the other two neighborhoods and this could be considered a factor of sustainability as, larger settlements have better potential for autonomy and for mixed uses. As far as it concerns the relationship be-tween the location of the working spaces and the location of residencies, we can remark that in
113
GWL these uses are separated while inn Vauban and Bed Zed working spaces and residencies have been mixed in order to create a more sustainable space.
Concerning the architectural form, Bed Zed seems to have a more interesting and coherent architectural idea, with more intense architectural elements, that render the settlement unique. However, the gradual planning and construction of Vauban and GWL is a factor that contributes at the better assimilation and the evolution of a settlement.
At the level of the application of common methods and targets we can mention the incorpora-tion of passive solar systems, solar panels, and energy saving strategies on the architectural de-sign of buildings and public spaces, which created in many cases interesting architectural de-tails.
The management of transportation tends to the development of car free settlements and to the development of parking spaces out of the settlements edge. Car sharing or car-pooling seem to be innovative ideas that are implemented in the three settlements, while the connection with public transportation seems indispensible strategy for the limitation of car use.
The European trend towards innovation and experimentation in the sustainable neighbor-hoods sector is obvious by the large amount of examples of new urban development and of re-habilitation of existing settlements as well.
In conclusion we can say that the basic characteristics of the case studies described above that should be considered for the development of a sustainable urban neighborhood which are cost, location, energy effectiveness and population density are factors that affect and complete each other in the process of the development of a neighborhood.
Finally, we should note that the sustainable urban neighborhood constitutes a system of func-tions, uses and procedures and that sustainability can be achieved only by incorporating all these factors.
REFERENCES
Gerolympou – Karadimou, A. 1986. Neighborhood, district, urban district: The evolution of their design concept. In A. Gerolympou et al, About the city, paper collection. Thessaloniki.
Lazarus, N. 2002. Beddiington Zero (Fossil) Energy Development: toolkit for Carbon Neutral Develop-ments - part I & II
Schubert, D. 2000. The Neighbourhood Paradigm From Garden Cities to Gated Communities, in Frees-tone Robert (ed.), Urban planning in a changing world, the twentieth century experience: 118-138. London, New York: E & FN Spon
Bartuska, T. and Kazimee B. 2005. Sustainable Cells of Urbanism: Regenerative Theory and Practice. In Jenks M., Dempsey N., Future Forms and Design for Sustainable Cities: 221-244. Amsterdam, Boston: Elsevier
Jenks Mike, Burton Elizabeth, Williams Katie (eds). 1996. The Compact City: A Sustainable Urban Form?. Oxford, UK: Oxford Brookes University
Gauzin - Muller, Dominique. 2001. L’Architecture écologique, 29 exemples européens. Paris: Le Moni-teur
Johns, F. 2005. Sustainable urbanity in a powerful but fragile landscape. In Jenks, M., Dempsey, N., Fu-ture Forms and Design for Sustainable Cities: 245-262. Amsterdam, Boston: Elsevier
Randall, Thomas (ed.). 2005. Sustainable Urban Design: an environmental approach. London, N.Y.: Spon Press
Bierens de Haan, C. 2006. Entre écovillages et projets d‟ architectes: les écoquartiers, Urbanisme 348: 41-44
Scheurer, Jan. 2006. Urban ecology, innovations in housing policy and the future of cities: Towards sus-tainability in neighbourhood communities. PhD thesis. (www.sustainability.murdoch.edu.au)
Rudlin D., Falk N. 1999. Building the 21st century home, the sustainable urban neighbourhood, Oxford, Boston: Architectural Press
Clarke, P. 2003. Urban planning and design in sustainable urban design: An environmental approach. In Randall Thomas (ed.), Sustainable urban design: an environmental approach. London, New York: Spon Press
http://www.archive2.official-documents.co.uk/document/deps/cs/shdg/ch02/index.html, Sustainable Housing Design Guide for Scotland, revised in December 2007
114
1 EXISTING HOUSING STOCK IN LITHUANIA
Many thousands of Soviet-era buildings in Lithuania need renovation for better energy
efficiency. The renovation program carried out by the government will allow energy losses and
carbon emissions to be reduced as well as help create new jobs during the economic downturn.
After the break-up of the Soviet Union, Lithuania inherited housing with space heating intensity
significantly higher than that of the Western European countries. Lithuania is largely dependent
on imported fuel and rapidly increasing energy prices made the wasteful energy consumption an
unaffordable burden for income-constrained consumers.
About 45 % of total final energy consumption is used in housing sector. Whereas more than
60% of the Lithuanian population resides in multi-apartment buildings constructed during 1961-
1990, which are not complied with the effective requirements, this sector has great energy
saving potential. Heat consumption depends on building design, construction quality and
materials, indoor installations, energy management (or absence of that), indoor comfort level
and householder's response to a set of incentives. Therefore, the same type of buildings can
consume different quantities of energy.
Previously, inexpensive gas imports from the Soviet Union did not require much attention to
energy efficiency, but the situation has changed and energy prices that have been artificially
kept low with subsidies are expected to rise (Klevas, 2009). All the accession countries have a
large stock of pre-fabricated concrete housing with reinforced concrete foundations, double-
glazed windows with wooden frames, flat roofs and lightweight concrete external walls, built in
Energy saving in Lithuanian building sector
R. Norvaišiene Kaunas University of Technology, Institute of Architecture and Construction, Lithuania
ABSTRACT: This paper analyses a problem, which exist not only in Lithuania but also in most
Central and East European countries. After the break-up of the Soviet Union, Lithuania
inherited housing with space heating intensity significantly higher than that of the Western
European countries. Many thousands of Soviet-era buildings in Lithuania need renovation for
better energy efficiency. The renovation program carried out by the government will allow
energy losses and carbon emissions to be reduced as well as help create new jobs during the
economic downturn.
Heat consumption depends on building design, construction quality and materials, indoor
installations, energy management (or absence of that), indoor comfort level and householder's
response to a set of incentives. Therefore, the same type of buildings can consume different
quantities of energy.
This article is based on the national progress rapport of the energy saving potential in
residential buildings in Kaunas city.
115
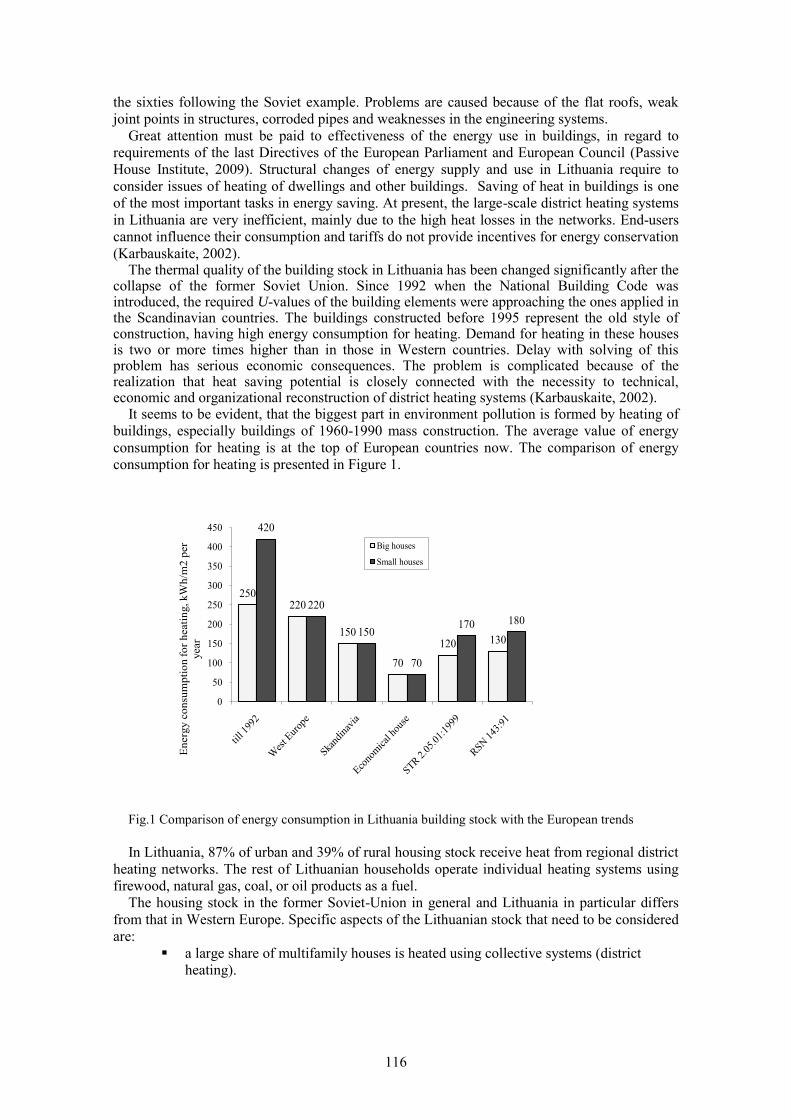
the sixties following the Soviet example. Problems are caused because of the flat roofs, weak
joint points in structures, corroded pipes and weaknesses in the engineering systems.
Great attention must be paid to effectiveness of the energy use in buildings, in regard to
requirements of the last Directives of the European Parliament and European Council (Passive
House Institute, 2009). Structural changes of energy supply and use in Lithuania require to
consider issues of heating of dwellings and other buildings. Saving of heat in buildings is one
of the most important tasks in energy saving. At present, the large-scale district heating systems
in Lithuania are very inefficient, mainly due to the high heat losses in the networks. End-users
cannot influence their consumption and tariffs do not provide incentives for energy conservation
(Karbauskaite, 2002). The thermal quality of the building stock in Lithuania has been changed significantly after the
collapse of the former Soviet Union. Since 1992 when the National Building Code was introduced, the required U-values of the building elements were approaching the ones applied in the Scandinavian countries. The buildings constructed before 1995 represent the old style of construction, having high energy consumption for heating. Demand for heating in these houses is two or more times higher than in those in Western countries. Delay with solving of this problem has serious economic consequences. The problem is complicated because of the realization that heat saving potential is closely connected with the necessity to technical, economic and organizational reconstruction of district heating systems (Karbauskaite, 2002).
It seems to be evident, that the biggest part in environment pollution is formed by heating of
buildings, especially buildings of 1960-1990 mass construction. The average value of energy
consumption for heating is at the top of European countries now. The comparison of energy
consumption for heating is presented in Figure 1.
250220
150
70
120 130
420
220
150
70
170 180
0
50
100
150
200
250
300
350
400
450
En
erg
y c
on
sum
pti
on f
or
heati
ng, kW
h/m
2 p
er
year
Big houses
Small houses
Fig.1 Comparison of energy consumption in Lithuania building stock with the European trends
In Lithuania, 87% of urban and 39% of rural housing stock receive heat from regional district
heating networks. The rest of Lithuanian households operate individual heating systems using
firewood, natural gas, coal, or oil products as a fuel.
The housing stock in the former Soviet-Union in general and Lithuania in particular differs
from that in Western Europe. Specific aspects of the Lithuanian stock that need to be considered
are:
a large share of multifamily houses is heated using collective systems (district
heating).
116
only a small percentage of the apartment owners is organized in a home-owners
association (20%).
the current, deteriorating, status of the building stock provides ample scope for
improvement.
the share of new dwellings built is very small compared to the existing building
stock.
energy efficiency improvement is only one of several urgent issues in building
renovation.
the level of awareness on energy consumption and the possibilities of increasing
efficiency among the general public is very low.
the economical situation does not allow for significant government funding. Non-
public
funding for building renovation is also very difficult to find.
the costs for heating are high in terms of share of total household budget.
2 THE NATIONAL ENERGY EFFICIENCY PROGRAMME
The majority of residential buildings are physically worn and their condition does not satisfy the
resident’s needs. The tendency of decrease of energy consumption in buildings is reflected in
the new technical regulations on construction in Lithuania. On the base of energy audits, the
local renovation programmes determine energy saving measures and economically feasible
decisions can be elaborated. It would allow energy efficiency increasing as well as improving
the quality and value of buildings.
The Lithuanian Government is approved the National Energy Efficiency Programme. The
Programme's revised priorities are as follows:
development of a legal and regulatory framework for stimulation of energy
efficiency;
renovation and insulation of buildings, modernization of the heating systems in
houses;
restructuring of building materials industry and production of insulation materials;
provision of devices and systems for water, gas, electricity and metering and control;
use of renewable and domestic fuel resources. The analysis of energy consumption in the apartment buildings connected to the district
heating system was provided in detail by the Institute of Architecture and Construction, and Vilnius Gediminas Technical University.
Heat energy saving potential in Lithuania would be under these assumptions:
1. The total living stock in Lithuania on 01.01.1996 was about 73.2 million m2.
2. After the additional insulation (with Tind=20°C, z=220 days, Tout=0.5°C) the heat energy
losses would be:
through the enclosures (walls, floors and ceilings) — about 8.28 PJ/year;
total heat energy losses – about 12.82 TWh/year, i.e. could be reduced by 44.7%
(with the same heating conditions).
3 HEAT CHARACTERISTICS OF BUILDINGS BEFORE AND AFTER RENOVATION
The additional thermal insulation of buildings partitions allow saving up to 50 % of heat energy.
There are no possibilities to assess all the residential buildings due their variety. Whereas the
five-storied and nine-storied buildings are in the majority in Kaunas city, the analysis of heat
saving possibilities was made in these typical multi-apartment buildings. The exploitation of
energy saving possibilities in this sector allows to facilitate the solution of environmental prob-
lems as well as to decrease the state budget expenses for subsidies for energy-costs for low-
income families. Estimating the amount of Kaunas city multi-storied residential buildings and
117
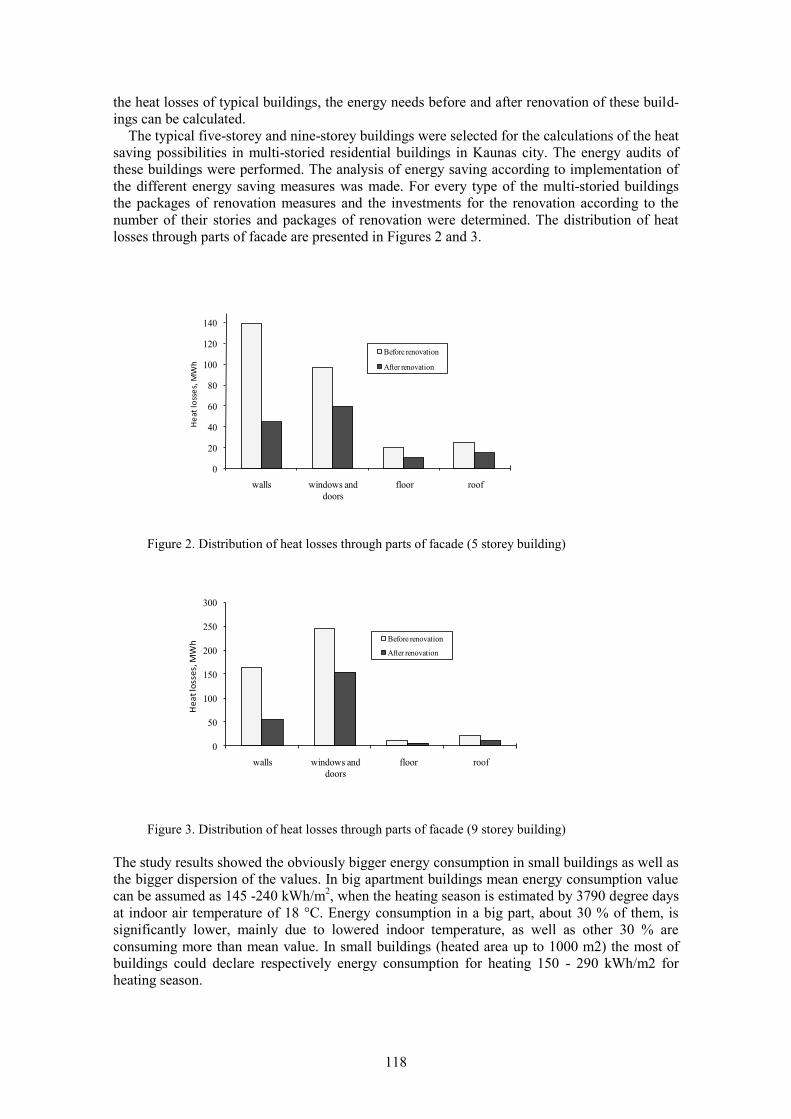
the heat losses of typical buildings, the energy needs before and after renovation of these build-
ings can be calculated.
The typical five-storey and nine-storey buildings were selected for the calculations of the heat
saving possibilities in multi-storied residential buildings in Kaunas city. The energy audits of
these buildings were performed. The analysis of energy saving according to implementation of
the different energy saving measures was made. For every type of the multi-storied buildings
the packages of renovation measures and the investments for the renovation according to the
number of their stories and packages of renovation were determined. The distribution of heat
losses through parts of facade are presented in Figures 2 and 3.
0
20
40
60
80
100
120
140
walls windows and
doors
floor roof
He
at lo
sse
s, M
Wh
Before renovation
After renovation
Figure 2. Distribution of heat losses through parts of facade (5 storey building)
0
50
100
150
200
250
300
walls windows and
doors
floor roof
He
at
loss
es,
MW
h Before renovation
After renovation
Figure 3. Distribution of heat losses through parts of facade (9 storey building)
The study results showed the obviously bigger energy consumption in small buildings as well as
the bigger dispersion of the values. In big apartment buildings mean energy consumption value
can be assumed as 145 -240 kWh/m2, when the heating season is estimated by 3790 degree days
at indoor air temperature of 18 °C. Energy consumption in a big part, about 30 % of them, is
significantly lower, mainly due to lowered indoor temperature, as well as other 30 % are
consuming more than mean value. In small buildings (heated area up to 1000 m2) the most of
buildings could declare respectively energy consumption for heating 150 - 290 kWh/m2 for
heating season.
118

Reduction of energy consumption in buildings shall be performed by renovation of building
envelope with especially emphasis in improvement of management, maintenance and control of
heating and ventilation systems. At present the mentioned improvements are of big interest in
Lithuania because of economical and environmental efficiency.
4 CURRENT STANDARTIZATION AND CERTIFICATION PRACTICIES
Lithuania does have an experience with energy-use related standards. In the form of the thermal
norms for separate building elements they were part of the old soviet-time building codes and
were more or less directly adopted by the new governmental bodies after the country gained
independence (Stankevicius et al, 2001). However, the requirements of such standards were
much lower compared to the corresponding western norms (IEA 1997). Moreover, the actual
energy performance of new dwellings often failed to meet those standards because of the poor
compliance resulting from wrong incentives. The focus was placed on meeting the development
plan even at the cost of the building quality. In addition, the initial achievement has been rapidly
deteriorating because of the lack of appropriate maintenance (IEA 1997). Recently there have
been changes towards tightening of the standards for new constructions but the problems of
compliance and maintenance remain. Lithuania is also making progress towards harmonization
of its construction and building standards with the EU requirements, e.g. in the newest building
code the simple normative heat transmission values have been integrated into the heat loss
standard that also takes into account the thermal bridges. It should be noted however that,
although there are certain achievements in the area of energy standardization, Lithuania is still
lagging far behind the developments in the countries with developed market economies.
5 CONCLUSIONS
Lithuania, like other EU countries, must be examined for the use of the low energy building
design and construction experience, the existing concepts of low energy buildings should be
adapted or new concepts of low energy building responding to the region's climate should be
created. At present, with the co-operation of civil engineers from Sweden and Estonia new
codes of building are prepared. The new codes which will be based on the standards and
approaches used within the European standards will comply with the Western European ones. It
will improve the mutual understanding between experts from various countries and will be one
of the steps towards the European Union.
According to prognoses the 113 five storied and 55 nine-storied buildings would be
renovated and in 2010 the heat energy consumption in them would be decreased by 29 115
MWh or 7, 7 % of the consumption in 2004. The total possible heat energy saving potential in
all five and nine-storied residential buildings is 266 258 MWh. The total possible heat energy
saving potential in ―housing sector‖ in Kaunas city is 437 241 MWh. The pollution of CO2
would be decreased by 83 950 tons per year. It is a great energy saving potential in this sector.
However it is technical possible energy saving potential and sometimes not all of the energy
saving measures are economically expedient comparing their payback time with their life cycle.
In some cases the payback time exceeds the life cycle of measure.
There are about 300 projects for renovation of residential buildings in the pipeline. The
situation is complicated, as the buildings belong to home owner associations. According to the
rules, the state provides a grant for no more than half of the investment necessary for renovating
a private residential building. The other half needs to be financed by the home owners
themselves. Also it is very important to create the public awareness raising and education
system on the issues of energy efficiency and housing maintenance.
119
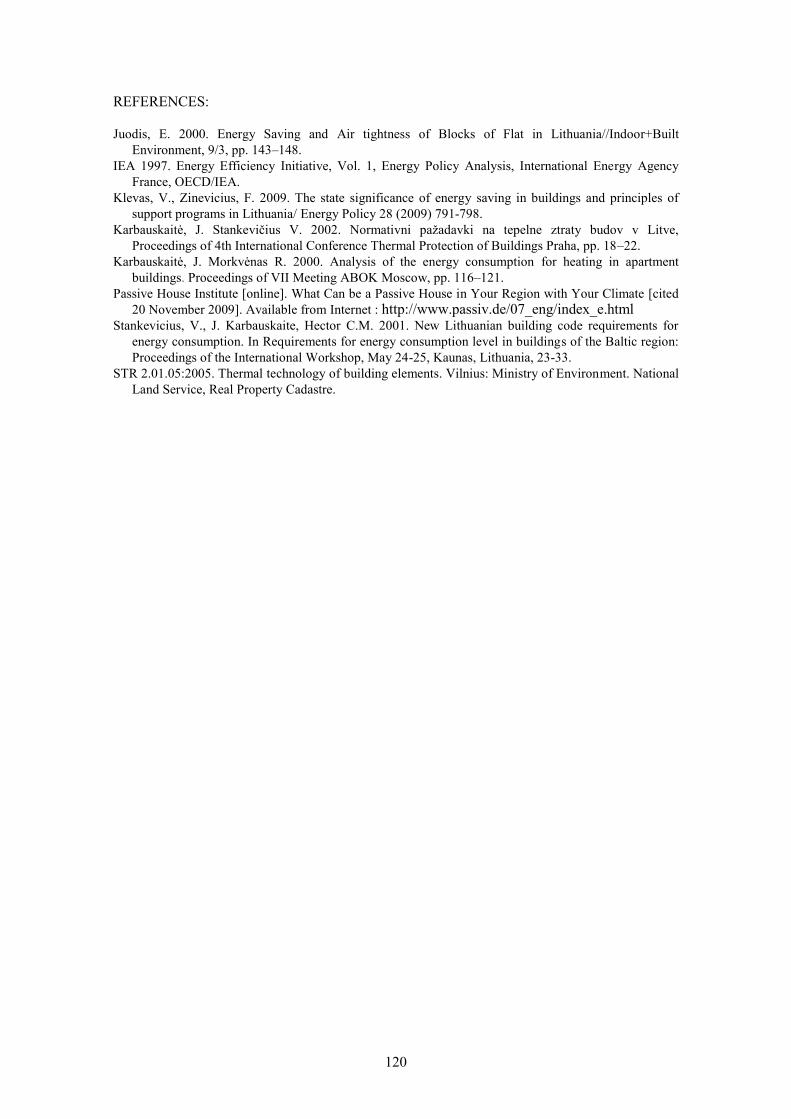
REFERENCES:
Juodis, E. 2000. Energy Saving and Air tightness of Blocks of Flat in Lithuania//Indoor+Built
Environment, 9/3, pp. 143–148.
IEA 1997. Energy Efficiency Initiative, Vol. 1, Energy Policy Analysis, International Energy Agency
France, OECD/IEA.
Klevas, V., Zinevicius, F. 2009. The state significance of energy saving in buildings and principles of
support programs in Lithuania/ Energy Policy 28 (2009) 791-798.
Karbauskaitė, J. Stankevičius V. 2002. Normativni pažadavki na tepelne ztraty budov v Litve,
Proceedings of 4th International Conference Thermal Protection of Buildings Praha, pp. 18–22.
Karbauskaitė, J. Morkvėnas R. 2000. Analysis of the energy consumption for heating in apartment
buildings. Proceedings of VII Meeting ABOK Moscow, pp. 116–121.
Passive House Institute [online]. What Can be a Passive House in Your Region with Your Climate [cited
20 November 2009]. Available from Internet : http://www.passiv.de/07_eng/index_e.html Stankevicius, V., J. Karbauskaite, Hector C.M. 2001. New Lithuanian building code requirements for
energy consumption. In Requirements for energy consumption level in buildings of the Baltic region:
Proceedings of the International Workshop, May 24-25, Kaunas, Lithuania, 23-33.
STR 2.01.05:2005. Thermal technology of building elements. Vilnius: Ministry of Environment. National
Land Service, Real Property Cadastre.
120
1 INTRODUCTION
Renewable energy resources should be used in architecture in order to protect the environment and to have a sustainable future. That is due to the fact that the buildings are responsible for about half of the energy use in a country and therefore they pollute the environment with the fossil-sourced energy they use. There are several kinds of renewable energy resources, but when it is buildings to talk about, the best renewable energy resource to be integrated into ar-chitecture is the SUN. “Solar Energy” can be used in the buildings in different ways. These ways can be summarized in two categories in general: “Passive” use of solar energy and “Ac-tive” use of solar energy. Passive use of solar energy can be called as “passive solar design”. In passive solar design, almost no technology is used. But technology is the main element in active solar design.
PV components which are one of the uses of renewable energy resources are very important
since they produce electricity without damaging the environment. Building integration is one of
the best uses of PV components due to the fact that electricity is produced and used where it is
needed which means that it is not transported. Free space to put them is ready in buildings and
they have the installation tools necessary for the PV modules.
There are different ways of using PV modules in architecture. They can either be used in the
retrofit of existing buildings, or be used in the design of new buildings. They can be used as an
attachment to the building elements or building components, or they can be used instead of
them. PV modules are used on the building envelope; on facade, on roof, or on different build-
ing components. The building envelope is the interface between the outside and the inside of
the building. It protects people from the weather conditions outside, helps to keep inside air
comfortable constantly in spite of the changing weather conditions outside.
Examination of photovoltaic (PV) component use in architecture from the viewpoint of energy efficiency
M. Altin Dokuz Eylul University, Izmir, Turkey. [email protected]
ABSTRACT: Renewable energy resources should be used in architecture in order to protect the
environment and to have a sustainable future. That is due to the fact that the buildings are re-
sponsible for about half of the energy use in a country and therefore they pollute the environ-
ment with the fossil-sourced energy they use. One of the renewable energy use ways on build-
ings is PV panel use. Therefore, the aim of this study is to examine the possibilities of
photovoltaic component use on buildings and its energy efficiency. This is going to be done by
calculating the energy efficiency of BIPV modules by using both the orientation of the building
and the tilt angle of the PV modules. Hence, the energy efficiency tables produced within this
study could be used for all of the building skin elements produced by PV modules. In the end,
this study will put forward the possibilities of the PV component use on buildings more effi-
ciently.
121
Facades form the biggest part of the building‟s outer surface. Therefore enough area is ready
on a façade for the use of PV components. If they are used on big and prestigous office build-
ings (e.g. administration buildings of big companies) they already begin to payback due to the
fact that they would be used instead of prestigious and expensive façade claddings and in addi-
tion they produce electricity. A facade gives the first impression to the visitors. Architects try to
tell their aspects and their clients‟ wishes on the facade with a suitable form and color. There-
fore the design of the facade of a building has an important part in the design of the whole
building. And it is an aesthetical element for the architect. Therefore PV module use on the
building facade needs a special and careful design. At the same time, PV module use on the
building facade is an easy way of show of technology use in the construction industry, by being
seen from the street easier than its use on the roof. Therefore, PV modules can make buildings
more prestigious when used properly. PV modules on facades provide multiple functions. One
is the aesthetic as told above. They also produce electricity. They may be used as transparent or
semitransparent elements to provide light to the interior. They provide solar control when used
as a shading element. But first of all, they separate the interior of the building from the outside.
Therefore, the aim of this study is to examine the possibilities of photovoltaic component use
on buildings and its energy efficiency. This is going to be done by calculating the energy effi-
ciency of BIPV modules by using both the orientation of the building and the tilt angle of the
PV modules. Hence, the energy efficiency tables produced within this study could be used for
all of the building skin elements, and especially for the design of the shading elements pro-
duced by PV modules. In the end, this study will put forward the possibilities of the PV compo-
nent use on buildings more efficiently and help produce energy-efficient buildings.
2 SHADING ANALYSIS
When “PV - Sun - Radiation - Building” words are thought together, the forming of buildings with the help of passive design system principles according to the sun is recognized. That is due to the fact that climatic comfort conditions could be achieved in the interior by the use of the differences in the angles of the sun-rays. If PV elements are going to be used instead of roof or wall cladding elements, they are going to take the solar radiation instead of them, but in spite, they are going to use most of this solar radiation to produce electricity.
The maximum efficiency in Building Integrated PV (BIPV) modules could be achieved while shading a building, because there is an unwanted solar radiation. This unwanted solar radiation will occur in every situation as long as the sun shines. And the building must be protected from this unwanted solar radiation as part of the passive system. Therefore if these shading devices are composed of PV elements, then electricity is going to be produced from this unwanted solar radiation which in turn decreases the electricity demand of the building. Therefore this use is one of the most efficient ways of electricity production by BIPV modules.
In order to reach the optimum result in the use of BIPV modules, it is not going to be enough to set the PV elements with the suitable tilt angles. It is necessary to determine the best location in which the radiation is received maximum in the field. Otherwise, the best result could not be achieved. So, the building envelope is going to be formed according to:
1. the tilt angle which the PV panels require for the maximum energy output, and
2. the orientation angle at which solar radiation is received as optimum for providing the comfort conditions.
Because of this, how to design a shading element (in horizontal and in vertical) could be reached by the use of the “Shading Analysis” and determining the tilt angle could be done with the use of a simulation program.
It could be said that the “skin” of the building helps controlling the comfort conditions in the building. This is important since human beings are not as fortunate as animals against the envi-
122
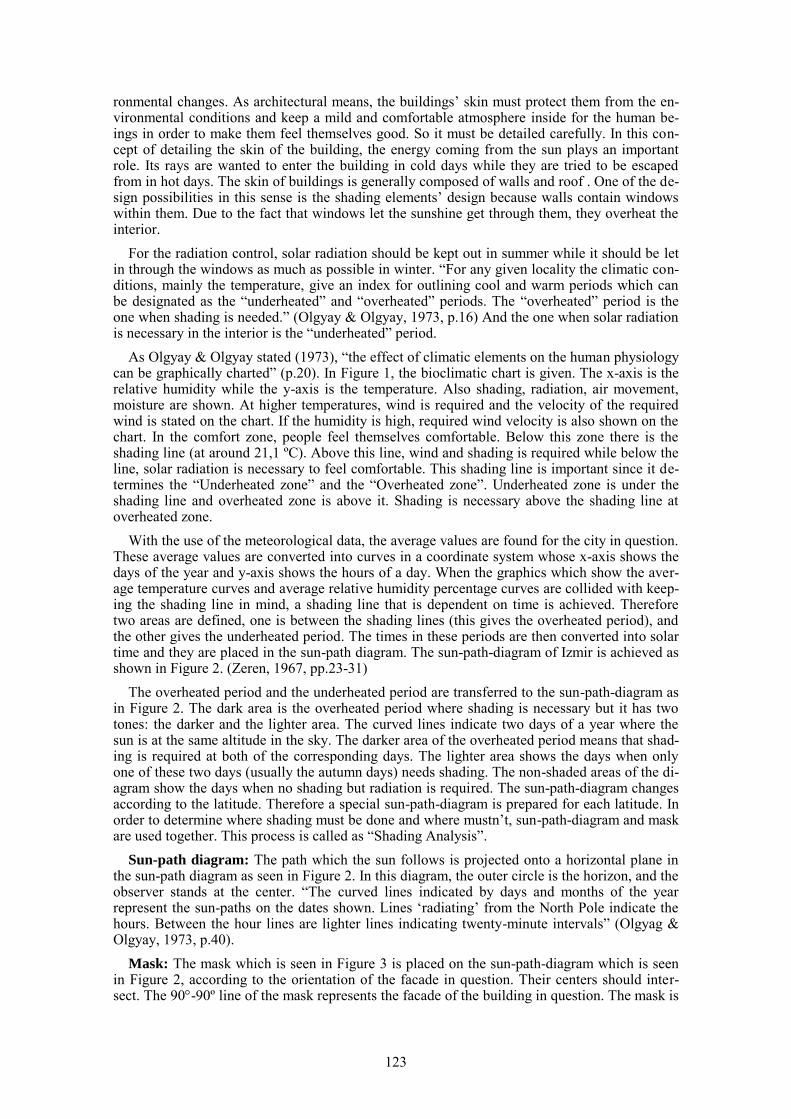
ronmental changes. As architectural means, the buildings‟ skin must protect them from the en-vironmental conditions and keep a mild and comfortable atmosphere inside for the human be-ings in order to make them feel themselves good. So it must be detailed carefully. In this con-cept of detailing the skin of the building, the energy coming from the sun plays an important role. Its rays are wanted to enter the building in cold days while they are tried to be escaped from in hot days. The skin of buildings is generally composed of walls and roof . One of the de-sign possibilities in this sense is the shading elements‟ design because walls contain windows within them. Due to the fact that windows let the sunshine get through them, they overheat the interior.
For the radiation control, solar radiation should be kept out in summer while it should be let in through the windows as much as possible in winter. “For any given locality the climatic con-ditions, mainly the temperature, give an index for outlining cool and warm periods which can be designated as the “underheated” and “overheated” periods. The “overheated” period is the one when shading is needed.” (Olgyay & Olgyay, 1973, p.16) And the one when solar radiation is necessary in the interior is the “underheated” period.
As Olgyay & Olgyay stated (1973), “the effect of climatic elements on the human physiology can be graphically charted” (p.20). In Figure 1, the bioclimatic chart is given. The x-axis is the relative humidity while the y-axis is the temperature. Also shading, radiation, air movement, moisture are shown. At higher temperatures, wind is required and the velocity of the required wind is stated on the chart. If the humidity is high, required wind velocity is also shown on the chart. In the comfort zone, people feel themselves comfortable. Below this zone there is the shading line (at around 21,1 ºC). Above this line, wind and shading is required while below the line, solar radiation is necessary to feel comfortable. This shading line is important since it de-termines the “Underheated zone” and the “Overheated zone”. Underheated zone is under the shading line and overheated zone is above it. Shading is necessary above the shading line at overheated zone.
With the use of the meteorological data, the average values are found for the city in question. These average values are converted into curves in a coordinate system whose x-axis shows the days of the year and y-axis shows the hours of a day. When the graphics which show the aver-age temperature curves and average relative humidity percentage curves are collided with keep-ing the shading line in mind, a shading line that is dependent on time is achieved. Therefore two areas are defined, one is between the shading lines (this gives the overheated period), and the other gives the underheated period. The times in these periods are then converted into solar time and they are placed in the sun-path diagram. The sun-path-diagram of Izmir is achieved as shown in Figure 2. (Zeren, 1967, pp.23-31)
The overheated period and the underheated period are transferred to the sun-path-diagram as in Figure 2. The dark area is the overheated period where shading is necessary but it has two tones: the darker and the lighter area. The curved lines indicate two days of a year where the sun is at the same altitude in the sky. The darker area of the overheated period means that shad-ing is required at both of the corresponding days. The lighter area shows the days when only one of these two days (usually the autumn days) needs shading. The non-shaded areas of the di-agram show the days when no shading but radiation is required. The sun-path-diagram changes according to the latitude. Therefore a special sun-path-diagram is prepared for each latitude. In order to determine where shading must be done and where mustn‟t, sun-path-diagram and mask are used together. This process is called as “Shading Analysis”.
Sun-path diagram: The path which the sun follows is projected onto a horizontal plane in the sun-path diagram as seen in Figure 2. In this diagram, the outer circle is the horizon, and the observer stands at the center. “The curved lines indicated by days and months of the year represent the sun-paths on the dates shown. Lines „radiating‟ from the North Pole indicate the hours. Between the hour lines are lighter lines indicating twenty-minute intervals” (Olgyag & Olgyay, 1973, p.40).
Mask: The mask which is seen in Figure 3 is placed on the sun-path-diagram which is seen in Figure 2, according to the orientation of the facade in question. Their centers should inter-sect. The 90-90º line of the mask represents the facade of the building in question. The mask is
123
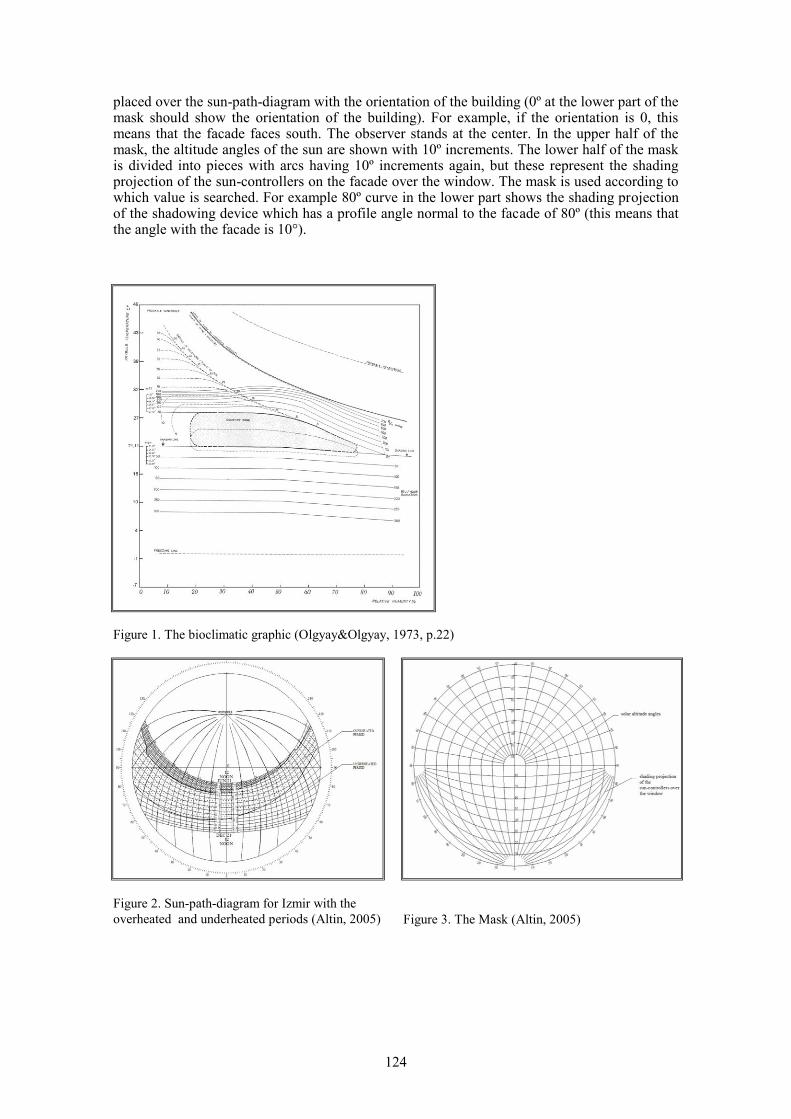
placed over the sun-path-diagram with the orientation of the building (0º at the lower part of the mask should show the orientation of the building). For example, if the orientation is 0, this means that the facade faces south. The observer stands at the center. In the upper half of the mask, the altitude angles of the sun are shown with 10º increments. The lower half of the mask is divided into pieces with arcs having 10º increments again, but these represent the shading projection of the sun-controllers on the facade over the window. The mask is used according to which value is searched. For example 80º curve in the lower part shows the shading projection of the shadowing device which has a profile angle normal to the facade of 80º (this means that the angle with the facade is 10°).
Figure 1. The bioclimatic graphic (Olgyay&Olgyay, 1973, p.22)
Figure 2. Sun-path-diagram for Izmir with the
overheated and underheated periods (Altin, 2005) Figure 3. The Mask (Altin, 2005)
124
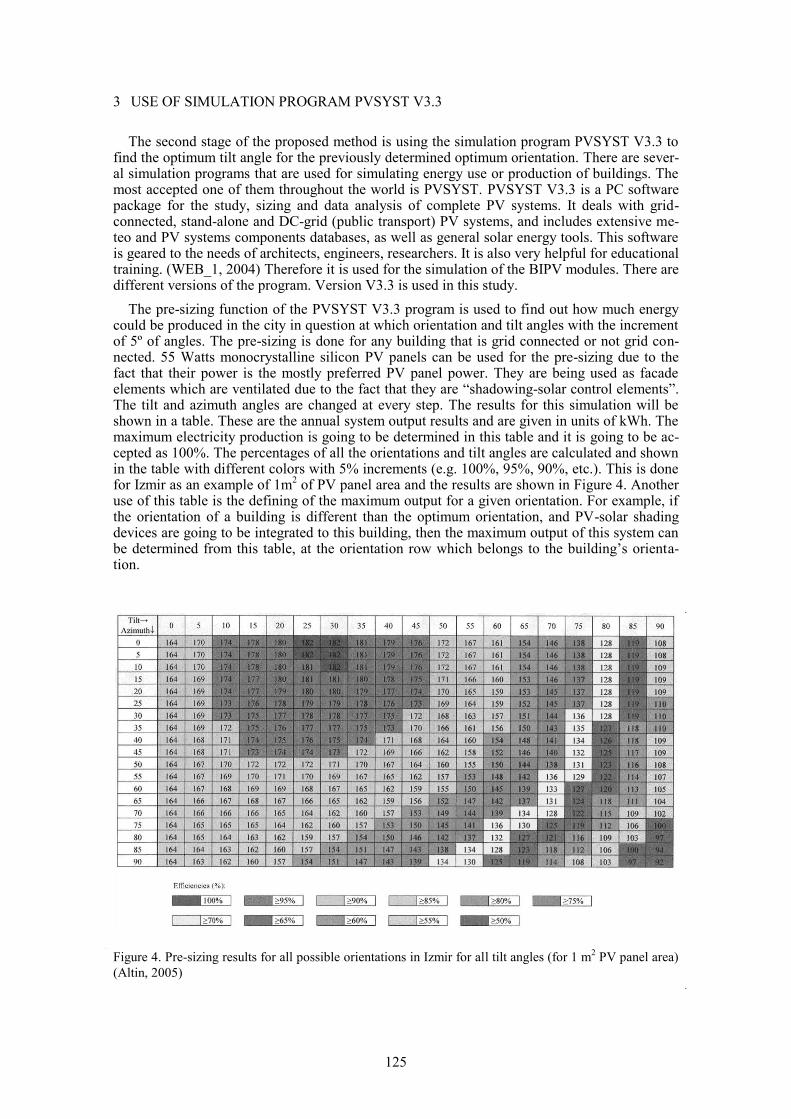
3 USE OF SIMULATION PROGRAM PVSYST V3.3
The second stage of the proposed method is using the simulation program PVSYST V3.3 to find the optimum tilt angle for the previously determined optimum orientation. There are sever-al simulation programs that are used for simulating energy use or production of buildings. The most accepted one of them throughout the world is PVSYST. PVSYST V3.3 is a PC software package for the study, sizing and data analysis of complete PV systems. It deals with grid-connected, stand-alone and DC-grid (public transport) PV systems, and includes extensive me-teo and PV systems components databases, as well as general solar energy tools. This software is geared to the needs of architects, engineers, researchers. It is also very helpful for educational training. (WEB_1, 2004) Therefore it is used for the simulation of the BIPV modules. There are different versions of the program. Version V3.3 is used in this study.
The pre-sizing function of the PVSYST V3.3 program is used to find out how much energy could be produced in the city in question at which orientation and tilt angles with the increment of 5º of angles. The pre-sizing is done for any building that is grid connected or not grid con-nected. 55 Watts monocrystalline silicon PV panels can be used for the pre-sizing due to the fact that their power is the mostly preferred PV panel power. They are being used as facade elements which are ventilated due to the fact that they are “shadowing-solar control elements”. The tilt and azimuth angles are changed at every step. The results for this simulation will be shown in a table. These are the annual system output results and are given in units of kWh. The maximum electricity production is going to be determined in this table and it is going to be ac-cepted as 100%. The percentages of all the orientations and tilt angles are calculated and shown in the table with different colors with 5% increments (e.g. 100%, 95%, 90%, etc.). This is done for Izmir as an example of 1m
2 of PV panel area and the results are shown in Figure 4. Another
use of this table is the defining of the maximum output for a given orientation. For example, if the orientation of a building is different than the optimum orientation, and PV-solar shading devices are going to be integrated to this building, then the maximum output of this system can be determined from this table, at the orientation row which belongs to the building‟s orienta-tion.
Figure 4. Pre-sizing results for all possible orientations in Izmir for all tilt angles (for 1 m
2 PV panel area)
(Altin, 2005)
125
In the table, when the simulation program is executed, it is seen that, the results of the pre-sizing for an orientation degree is just the same with the result of the negative of that orienta-tion angle, e.g. the result of the orientation of 15º is the same as the result of the orientation of -15º. So the table is prepared for 0º-90º quarter only. The color change shows the differentiation of the efficiency percentage. The annual system output results are given in units of kWh. The maximum electricity production is 182 kWh. This is taken as 100%. And it is achieved at 25º-30º tilt angles, 0º-5º orientation, also at 30º tilt angle and 10º orientation. The output energy is at the maximum at this range.
4 APPLICATION OF THE METHOD ON THE CASE-STUDY: THE BUILDING OF DEU FACULTY OF ARCHITECTURE
In this study, the “Building of Izmir Dokuz Eylul University Faculty of Architecture” is taken
as a case study and shading analysis are done on this building. The windows on the Dean Floor facing south are the case study windows. The exact orientation of these windows is 23º West from South. First of all, shading analysis is done with the use of sun-path-diagram and the mask for the orientation of 23º West from South (the actual orientation of the building). In these ana-lyses, lighter-tone gray-color is used to indicate part of the overheated period which is being shaded (this is wanted). Darker-tone gray-color is used to indicate part of the underheated pe-riod which is being shaded (this is not wanted). The profile angle of 25° normal to the facade is used for the examination. After this process, the angle of the shading-PV-panels is discussed in the section of the windows with the use of shading analysis result. In these sections, the mea-surements for the mounting are shown outside the building. The shading-PV-panels are mounted on a steel structure which is mounted to the wall. 38 PV panels which are made up of monocrystalline silicon solar cells and have a power of 55 Watts are planned to be used in this building, whose total area is 16,13 m
2. The tilt angle of the PV-panels can be changed and is
taken as 30º which is found as result of the PVSYST V3.3 simulation program‟s pre-sizing function, done for Izmir in Figure 4.
The examination is done for the angles of 25° and 40° which the PV panels have with the fa-cade. This is due to the reason that the maximum solar altitude angle for Izmir is 74,99º through all year round when calculated (the required angle with the facade is: 90º - 74,99º = 15,01º). This means that there is no time when the sun has an altitude angle of higher than 75º. So this element having angle with the facade of lower than 15º cannot protect any window. But 15º is not enough for a good protection. Even if it has an angle of 15º with the facade, it could only protect the window from noon radiation only at mid-June. But the solar radiation of July is greater and much disturbing. Therefore, at least the dark shaded areas of the overheated period should be protected by the shading-PV element and the minimum angle should be 25º. And the maximum angle is taken as 40º. After this angle, it would be better to construct vertical fins due to the difficulty of constructing shading devices having higher angles. Due to the fact that the building is a school, the working hour of the building is between 9:00 AM and 17:00 PM. Therefore, the analyzing hours should be between these hours. The results of the 25° are shown in Figures 5 & 6 to give an idea.
After this examination, the tilt angle of the shading-PV panels must be determined. In order to do this, the simulation program PVSYST V3.3 is used. Therefore, the PV system elements are selected carefully and they are detailed in the simulation. This result also intersects with the result of the pre-sizing function of the PVSYST V3.3. As a result it could be said that 27º panel inclination is the optimum inclination angle for this specific building (building of DEU Faculty of Architecture) in Izmir, according to the simulation program of “PVSYST V3.3”. This result also intersects with the result of the pre-sizing function of the PVSYST V3.3. After this, “pre-sizing” function of the simulation program PVSYST V3.3 is used again for the total PV m
2 of
the case-study. It is seen that, the efficiency isn‟t much affected between the tilt angles of 10º-45º and the orientations of 0º-25º. The efficiency is equal to and greater than 95% in this ar-range. When the orientation gets bigger, the efficiency decreases. To keep the efficiency high, the tilt angle should be lowered as the orientation gets bigger. From the table, the optimum orientation and tilt angles are seen to be 0º and 30º respectively.
126
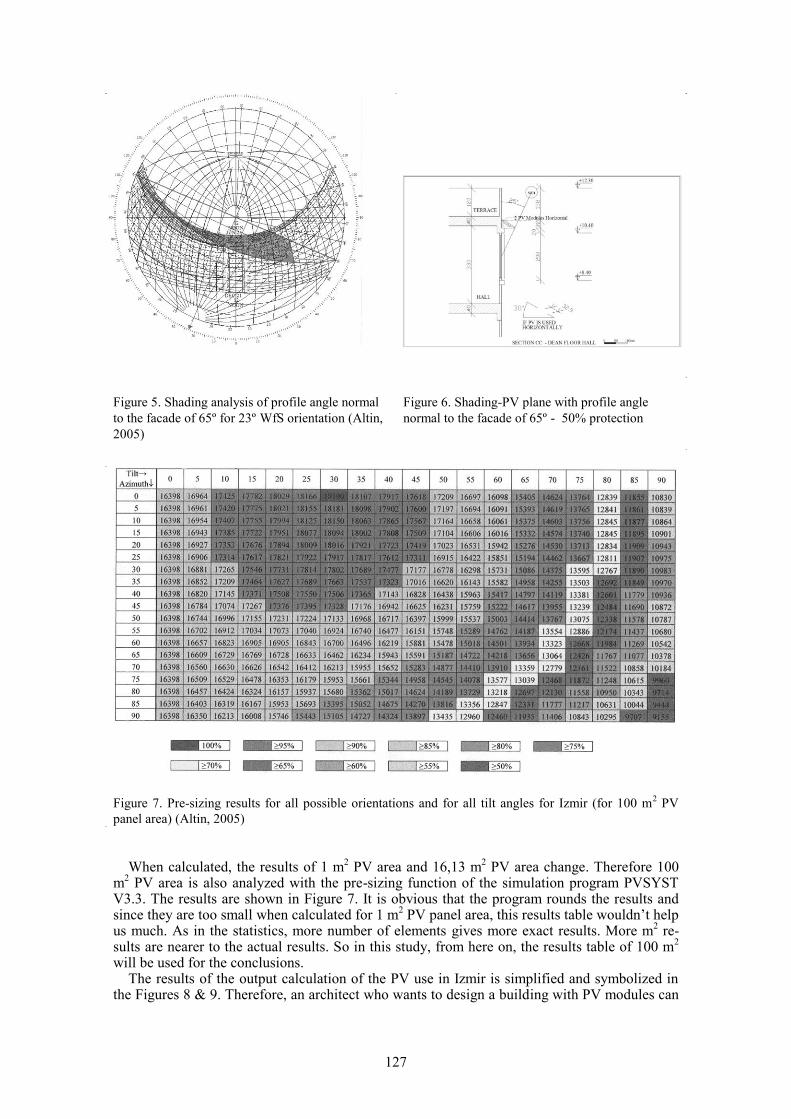
Figure 5. Shading analysis of profile angle normal
to the facade of 65º for 23º WfS orientation (Altin,
2005)
Figure 6. Shading-PV plane with profile angle
normal to the facade of 65º - 50% protection
Figure 7. Pre-sizing results for all possible orientations and for all tilt angles for Izmir (for 100 m2 PV
panel area) (Altin, 2005)
When calculated, the results of 1 m
2 PV area and 16,13 m
2 PV area change. Therefore 100
m2 PV area is also analyzed with the pre-sizing function of the simulation program PVSYST
V3.3. The results are shown in Figure 7. It is obvious that the program rounds the results and since they are too small when calculated for 1 m
2 PV panel area, this results table wouldn‟t help
us much. As in the statistics, more number of elements gives more exact results. More m2 re-
sults are nearer to the actual results. So in this study, from here on, the results table of 100 m2
will be used for the conclusions. The results of the output calculation of the PV use in Izmir is simplified and symbolized in
the Figures 8 & 9. Therefore, an architect who wants to design a building with PV modules can
127
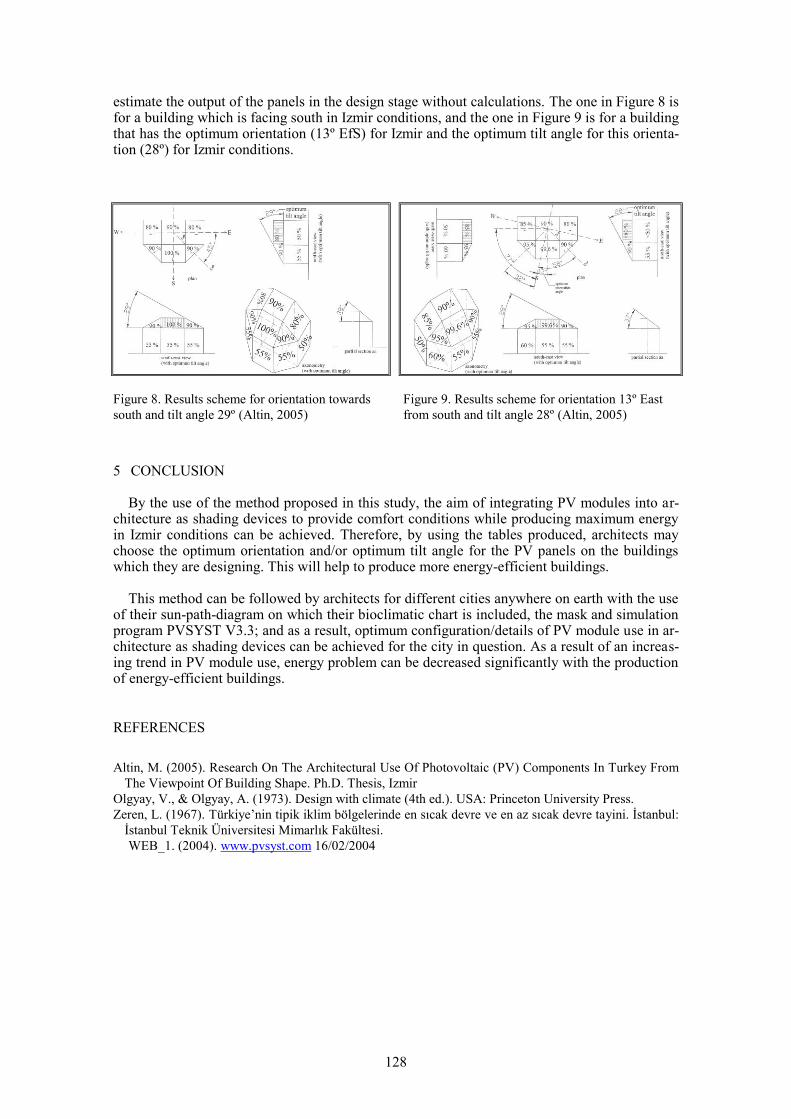
estimate the output of the panels in the design stage without calculations. The one in Figure 8 is for a building which is facing south in Izmir conditions, and the one in Figure 9 is for a building that has the optimum orientation (13º EfS) for Izmir and the optimum tilt angle for this orienta-tion (28º) for Izmir conditions.
Figure 8. Results scheme for orientation towards
south and tilt angle 29º (Altin, 2005)
Figure 9. Results scheme for orientation 13º East
from south and tilt angle 28º (Altin, 2005)
5 CONCLUSION
By the use of the method proposed in this study, the aim of integrating PV modules into ar-
chitecture as shading devices to provide comfort conditions while producing maximum energy in Izmir conditions can be achieved. Therefore, by using the tables produced, architects may choose the optimum orientation and/or optimum tilt angle for the PV panels on the buildings which they are designing. This will help to produce more energy-efficient buildings.
This method can be followed by architects for different cities anywhere on earth with the use of their sun-path-diagram on which their bioclimatic chart is included, the mask and simulation program PVSYST V3.3; and as a result, optimum configuration/details of PV module use in ar-chitecture as shading devices can be achieved for the city in question. As a result of an increas-ing trend in PV module use, energy problem can be decreased significantly with the production of energy-efficient buildings.
REFERENCES
Altin, M. (2005). Research On The Architectural Use Of Photovoltaic (PV) Components In Turkey From
The Viewpoint Of Building Shape. Ph.D. Thesis, Izmir
Olgyay, V., & Olgyay, A. (1973). Design with climate (4th ed.). USA: Princeton University Press.
Zeren, L. (1967). Türkiye‟nin tipik iklim bölgelerinde en sıcak devre ve en az sıcak devre tayini. İstanbul:
İstanbul Teknik Üniversitesi Mimarlık Fakültesi.
WEB_1. (2004). www.pvsyst.com 16/02/2004
128
An acoustical and visual evaluation approach for the proscenium
type of drama theatres
O. Yilmaz Karaman Dokuz Eylul University, Faculty of Architecture, Izmir, Turkey. [email protected]
ABSTRACT: Although there have been many buildings designed for the performing arts during
the history, it is not possible to say that the development of the theatre architecture has ended.
Although it is common to built multi-purpose auditoria mostly because of the economical
reasons, every kind of performing art requires different characteristics. Drama theatres
distinguish from the other spaces for performing arts, for example concert halls, since the both
acoustical and visual conditions are equally important to make the spectators enjoy/understand
the play. With this idea, it is aimed to examine acoustical and visual properties of drama
theatres. By this way, it is aimed to get some results to be used as a design guide at the
beginning of a theatre design process. To achieve the evaluation process, eight different rooms
are designed to be simulated. Then, the designed rooms are evaluated in terms of both visual
and acoustical comfort conditions. Also, by designing different cases it is aimed to evaluate the
effect of geometrical design of rooms on the visual and acoustical conditions of rooms.
1. INTRODUCTION
Expression of feelings with theatrical or/and musical performances dates back to the ancient
times and continues to develop with diversifications till today. Also in course of time,
architecture for performing arts continues its development according to the changing needs of
the performances; because every kind of performance (music, opera, drama, dance...etc.) needs
different acoustic environment as well as stage to audience relationship. To create the desired
atmosphere in an auditorium is quite a complicated process which includes professionals from
different disciplines. Studies show that even non-acoustic phenomena such as the view from the
occupied seat, the comfort of the seat itself, the thermal comfort of the environment etc. can also
influence the overall judgment. (Cocchi, Farina, Fausti, & Tronchin)
Although, today, multi-use spaces are becoming more popular because of the economic
conditions, every performance needs different conditions as mentioned before. With this idea, in
this study, the scope is limited to theatre buildings, especially for drama, where the visual
comfort conditions are as important as acoustic requirements. Drama theatres differ from other
performing arts buildings with this feature.
To achieve this aim, design of different types of rooms as cases is chosen as evaluation method.
It is thought that this kind of work methodology makes possible comparing different types of
rooms.
After design of the cases, acoustical and visual evaluations are based on the simulated results of
the rooms and each room is evaluated according to results obtained by receiver points. As a
final step, it is aimed to examine if there are some correlations between the acoustical
parameters and geometrical properties of rooms.
2. DEFINITION OF CASES
In the study, to be able to make some comparisons there are 3 types of fan shaped auditoria
designed with same volume, they are different from each other with their splaying angles in
129
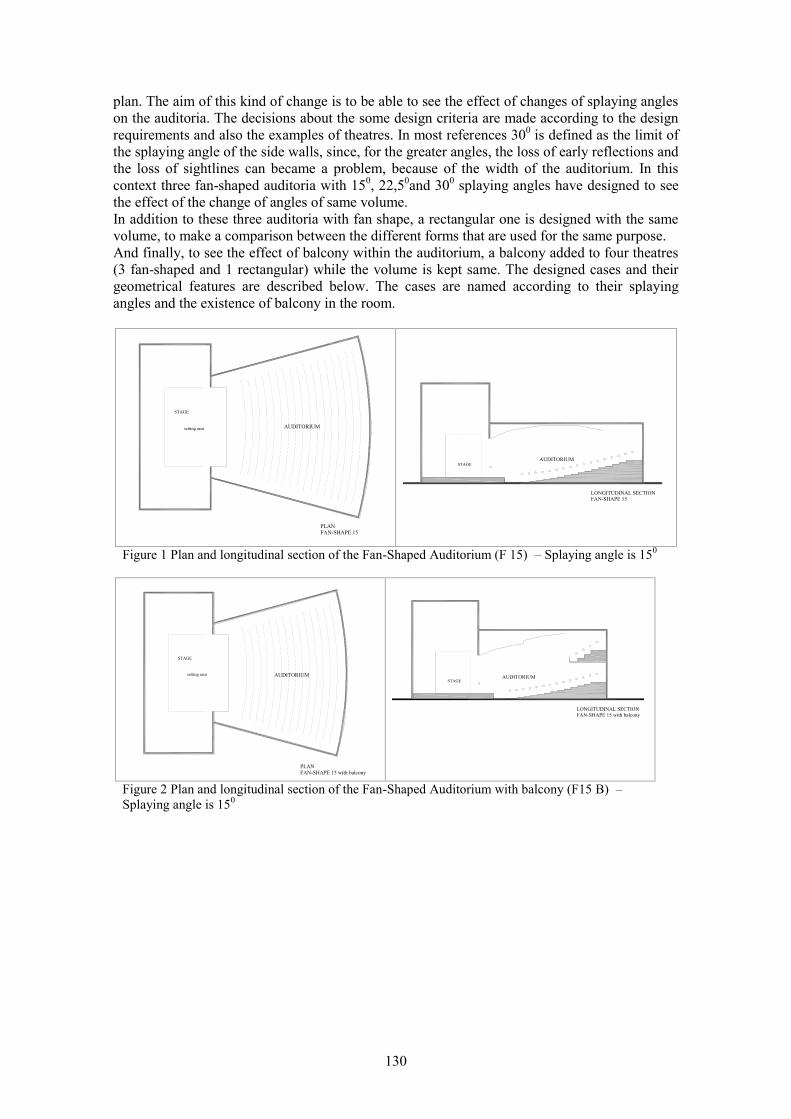
plan. The aim of this kind of change is to be able to see the effect of changes of splaying angles
on the auditoria. The decisions about the some design criteria are made according to the design
requirements and also the examples of theatres. In most references 300 is defined as the limit of
the splaying angle of the side walls, since, for the greater angles, the loss of early reflections and
the loss of sightlines can became a problem, because of the width of the auditorium. In this
context three fan-shaped auditoria with 150, 22,5
0and 30
0 splaying angles have designed to see
the effect of the change of angles of same volume.
In addition to these three auditoria with fan shape, a rectangular one is designed with the same
volume, to make a comparison between the different forms that are used for the same purpose.
And finally, to see the effect of balcony within the auditorium, a balcony added to four theatres
(3 fan-shaped and 1 rectangular) while the volume is kept same. The designed cases and their
geometrical features are described below. The cases are named according to their splaying
angles and the existence of balcony in the room.
setting area
STAGE
PLANFAN-SHAPE 15
AUDITORIUM
STAGE
LONGITUDINAL SECTION
AUDITORIUM
Figure 1 Plan and longitudinal section of the Fan-Shaped Auditorium (F 15) – Splaying angle is 150
setting area
STAGE
PLAN
FAN-SHAPE 15 with balcony
AUDITORIUM
STAGE
LONGITUDINAL SECTION
FAN-SHAPE 15 with balcony
AUDITORIUM
Figure 2 Plan and longitudinal section of the Fan-Shaped Auditorium with balcony (F15 B) –
Splaying angle is 150
130
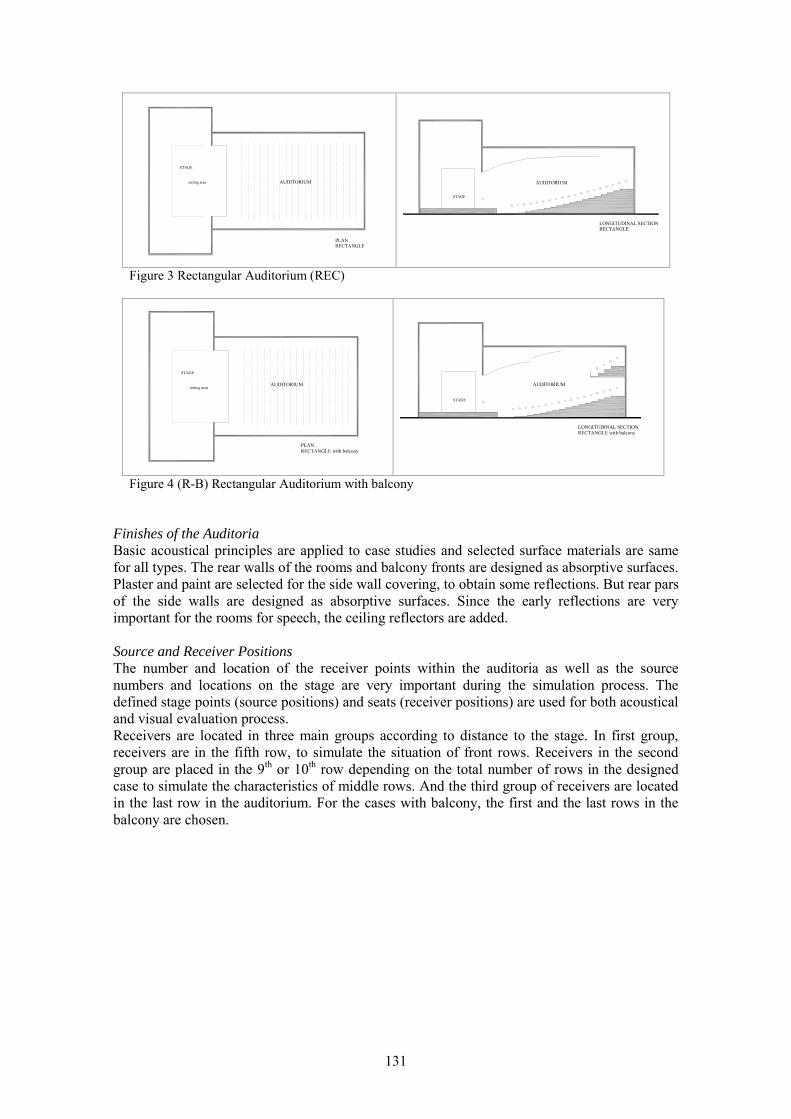
setting area
STAGE
PLANRECTANGLE
AUDITORIUM
STAGE
LONGITUDINAL SECTIONRECTANGLE
AUDITORIUM
Figure 3 Rectangular Auditorium (REC)
AUDITORIUMsetting area
STAGE
PLAN
RECTANGLE with balcony
STAGE
LONGITUDINAL SECTION
RECTANGLE with balcony
AUDITORIUM
Figure 4 (R-B) Rectangular Auditorium with balcony
Finishes of the Auditoria
Basic acoustical principles are applied to case studies and selected surface materials are same
for all types. The rear walls of the rooms and balcony fronts are designed as absorptive surfaces.
Plaster and paint are selected for the side wall covering, to obtain some reflections. But rear pars
of the side walls are designed as absorptive surfaces. Since the early reflections are very
important for the rooms for speech, the ceiling reflectors are added.
Source and Receiver Positions
The number and location of the receiver points within the auditoria as well as the source
numbers and locations on the stage are very important during the simulation process. The
defined stage points (source positions) and seats (receiver positions) are used for both acoustical
and visual evaluation process.
Receivers are located in three main groups according to distance to the stage. In first group,
receivers are in the fifth row, to simulate the situation of front rows. Receivers in the second
group are placed in the 9th or 10
th row depending on the total number of rows in the designed
case to simulate the characteristics of middle rows. And the third group of receivers are located
in the last row in the auditorium. For the cases with balcony, the first and the last rows in the
balcony are chosen.
131
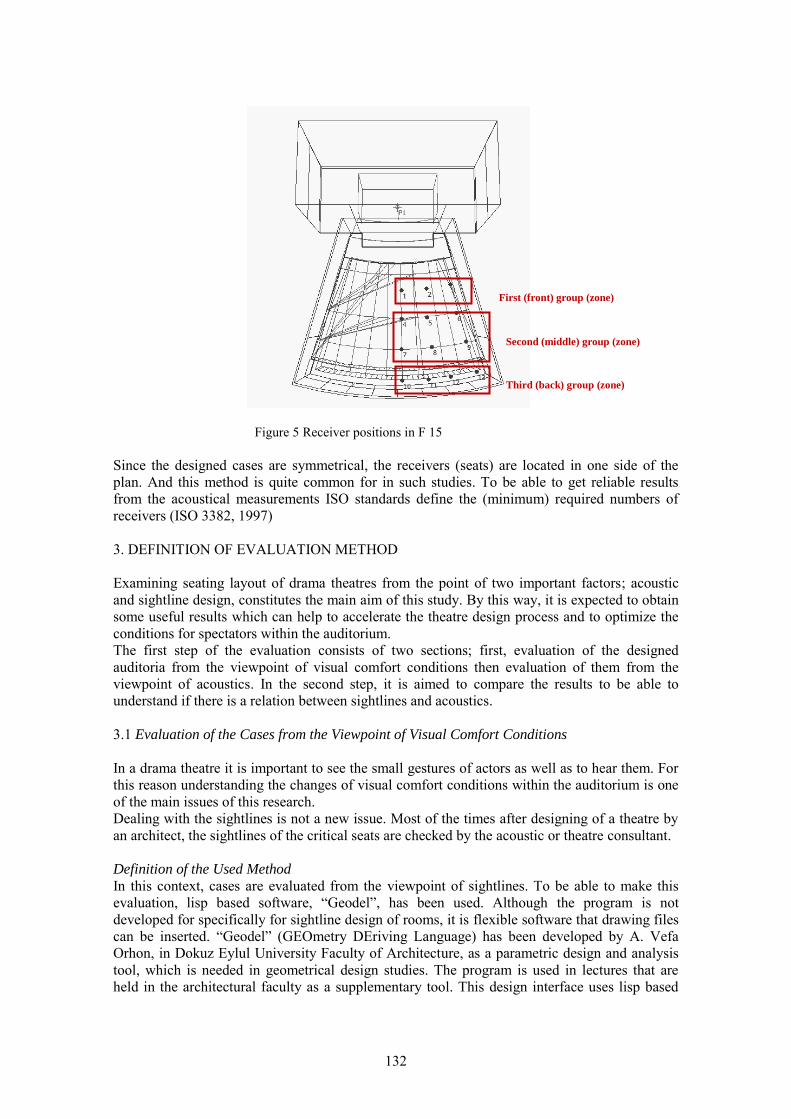
Figure 5 Receiver positions in F 15
Since the designed cases are symmetrical, the receivers (seats) are located in one side of the
plan. And this method is quite common for in such studies. To be able to get reliable results
from the acoustical measurements ISO standards define the (minimum) required numbers of
receivers (ISO 3382, 1997)
3. DEFINITION OF EVALUATION METHOD
Examining seating layout of drama theatres from the point of two important factors; acoustic
and sightline design, constitutes the main aim of this study. By this way, it is expected to obtain
some useful results which can help to accelerate the theatre design process and to optimize the
conditions for spectators within the auditorium.
The first step of the evaluation consists of two sections; first, evaluation of the designed
auditoria from the viewpoint of visual comfort conditions then evaluation of them from the
viewpoint of acoustics. In the second step, it is aimed to compare the results to be able to
understand if there is a relation between sightlines and acoustics.
3.1 Evaluation of the Cases from the Viewpoint of Visual Comfort Conditions
In a drama theatre it is important to see the small gestures of actors as well as to hear them. For
this reason understanding the changes of visual comfort conditions within the auditorium is one
of the main issues of this research.
Dealing with the sightlines is not a new issue. Most of the times after designing of a theatre by
an architect, the sightlines of the critical seats are checked by the acoustic or theatre consultant.
Definition of the Used Method
In this context, cases are evaluated from the viewpoint of sightlines. To be able to make this
evaluation, lisp based software, “Geodel”, has been used. Although the program is not
developed for specifically for sightline design of rooms, it is flexible software that drawing files
can be inserted. “Geodel” (GEOmetry DEriving Language) has been developed by A. Vefa
Orhon, in Dokuz Eylul University Faculty of Architecture, as a parametric design and analysis
tool, which is needed in geometrical design studies. The program is used in lectures that are
held in the architectural faculty as a supplementary tool. This design interface uses lisp based
First (front) group (zone)
Third (back) group (zone)
Second (middle) group (zone)
132
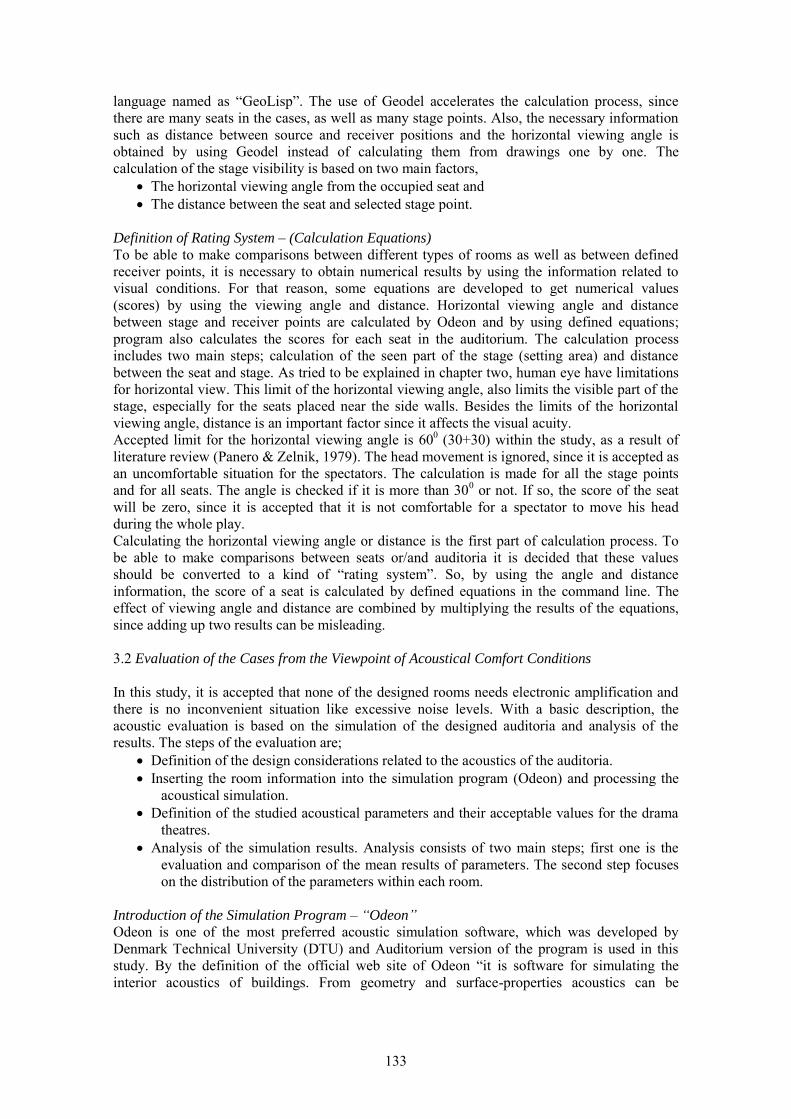
language named as “GeoLisp”. The use of Geodel accelerates the calculation process, since
there are many seats in the cases, as well as many stage points. Also, the necessary information
such as distance between source and receiver positions and the horizontal viewing angle is
obtained by using Geodel instead of calculating them from drawings one by one. The
calculation of the stage visibility is based on two main factors,
The horizontal viewing angle from the occupied seat and
The distance between the seat and selected stage point.
Definition of Rating System – (Calculation Equations)
To be able to make comparisons between different types of rooms as well as between defined
receiver points, it is necessary to obtain numerical results by using the information related to
visual conditions. For that reason, some equations are developed to get numerical values
(scores) by using the viewing angle and distance. Horizontal viewing angle and distance
between stage and receiver points are calculated by Odeon and by using defined equations;
program also calculates the scores for each seat in the auditorium. The calculation process
includes two main steps; calculation of the seen part of the stage (setting area) and distance
between the seat and stage. As tried to be explained in chapter two, human eye have limitations
for horizontal view. This limit of the horizontal viewing angle, also limits the visible part of the
stage, especially for the seats placed near the side walls. Besides the limits of the horizontal
viewing angle, distance is an important factor since it affects the visual acuity.
Accepted limit for the horizontal viewing angle is 600 (30+30) within the study, as a result of
literature review (Panero & Zelnik, 1979). The head movement is ignored, since it is accepted as
an uncomfortable situation for the spectators. The calculation is made for all the stage points
and for all seats. The angle is checked if it is more than 300 or not. If so, the score of the seat
will be zero, since it is accepted that it is not comfortable for a spectator to move his head
during the whole play.
Calculating the horizontal viewing angle or distance is the first part of calculation process. To
be able to make comparisons between seats or/and auditoria it is decided that these values
should be converted to a kind of “rating system”. So, by using the angle and distance
information, the score of a seat is calculated by defined equations in the command line. The
effect of viewing angle and distance are combined by multiplying the results of the equations,
since adding up two results can be misleading.
3.2 Evaluation of the Cases from the Viewpoint of Acoustical Comfort Conditions
In this study, it is accepted that none of the designed rooms needs electronic amplification and
there is no inconvenient situation like excessive noise levels. With a basic description, the
acoustic evaluation is based on the simulation of the designed auditoria and analysis of the
results. The steps of the evaluation are;
Definition of the design considerations related to the acoustics of the auditoria.
Inserting the room information into the simulation program (Odeon) and processing the
acoustical simulation.
Definition of the studied acoustical parameters and their acceptable values for the drama
theatres.
Analysis of the simulation results. Analysis consists of two main steps; first one is the
evaluation and comparison of the mean results of parameters. The second step focuses
on the distribution of the parameters within each room.
Introduction of the Simulation Program – “Odeon”
Odeon is one of the most preferred acoustic simulation software, which was developed by
Denmark Technical University (DTU) and Auditorium version of the program is used in this
study. By the definition of the official web site of Odeon “it is software for simulating the
interior acoustics of buildings. From geometry and surface-properties acoustics can be
133
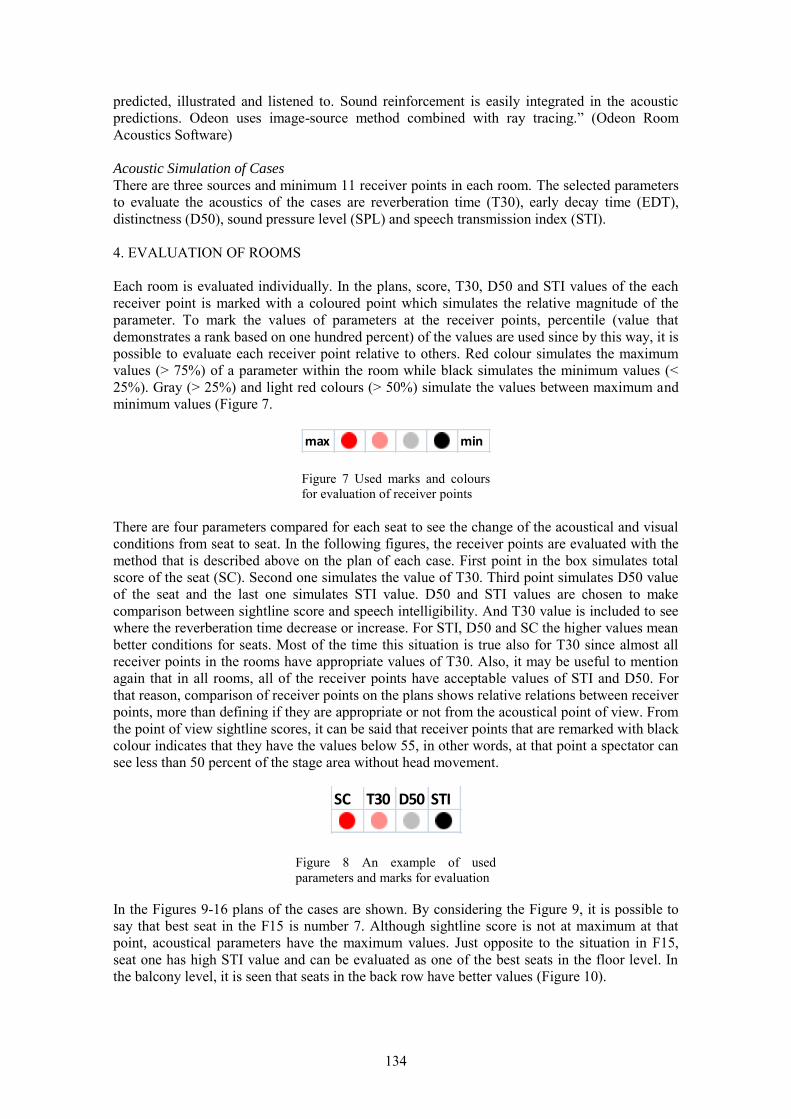
predicted, illustrated and listened to. Sound reinforcement is easily integrated in the acoustic
predictions. Odeon uses image-source method combined with ray tracing.” (Odeon Room
Acoustics Software)
Acoustic Simulation of Cases
There are three sources and minimum 11 receiver points in each room. The selected parameters
to evaluate the acoustics of the cases are reverberation time (T30), early decay time (EDT),
distinctness (D50), sound pressure level (SPL) and speech transmission index (STI).
4. EVALUATION OF ROOMS
Each room is evaluated individually. In the plans, score, T30, D50 and STI values of the each
receiver point is marked with a coloured point which simulates the relative magnitude of the
parameter. To mark the values of parameters at the receiver points, percentile (value that
demonstrates a rank based on one hundred percent) of the values are used since by this way, it is
possible to evaluate each receiver point relative to others. Red colour simulates the maximum
values (> 75%) of a parameter within the room while black simulates the minimum values (<
25%). Gray (> 25%) and light red colours (> 50%) simulate the values between maximum and
minimum values (Figure 7.
max min
Figure 7 Used marks and colours
for evaluation of receiver points
There are four parameters compared for each seat to see the change of the acoustical and visual
conditions from seat to seat. In the following figures, the receiver points are evaluated with the
method that is described above on the plan of each case. First point in the box simulates total
score of the seat (SC). Second one simulates the value of T30. Third point simulates D50 value
of the seat and the last one simulates STI value. D50 and STI values are chosen to make
comparison between sightline score and speech intelligibility. And T30 value is included to see
where the reverberation time decrease or increase. For STI, D50 and SC the higher values mean
better conditions for seats. Most of the time this situation is true also for T30 since almost all
receiver points in the rooms have appropriate values of T30. Also, it may be useful to mention
again that in all rooms, all of the receiver points have acceptable values of STI and D50. For
that reason, comparison of receiver points on the plans shows relative relations between receiver
points, more than defining if they are appropriate or not from the acoustical point of view. From
the point of view sightline scores, it can be said that receiver points that are remarked with black
colour indicates that they have the values below 55, in other words, at that point a spectator can
see less than 50 percent of the stage area without head movement.
SC T30 D50 STI
Figure 8 An example of used
parameters and marks for evaluation
In the Figures 9-16 plans of the cases are shown. By considering the Figure 9, it is possible to
say that best seat in the F15 is number 7. Although sightline score is not at maximum at that
point, acoustical parameters have the maximum values. Just opposite to the situation in F15,
seat one has high STI value and can be evaluated as one of the best seats in the floor level. In
the balcony level, it is seen that seats in the back row have better values (Figure 10).
134
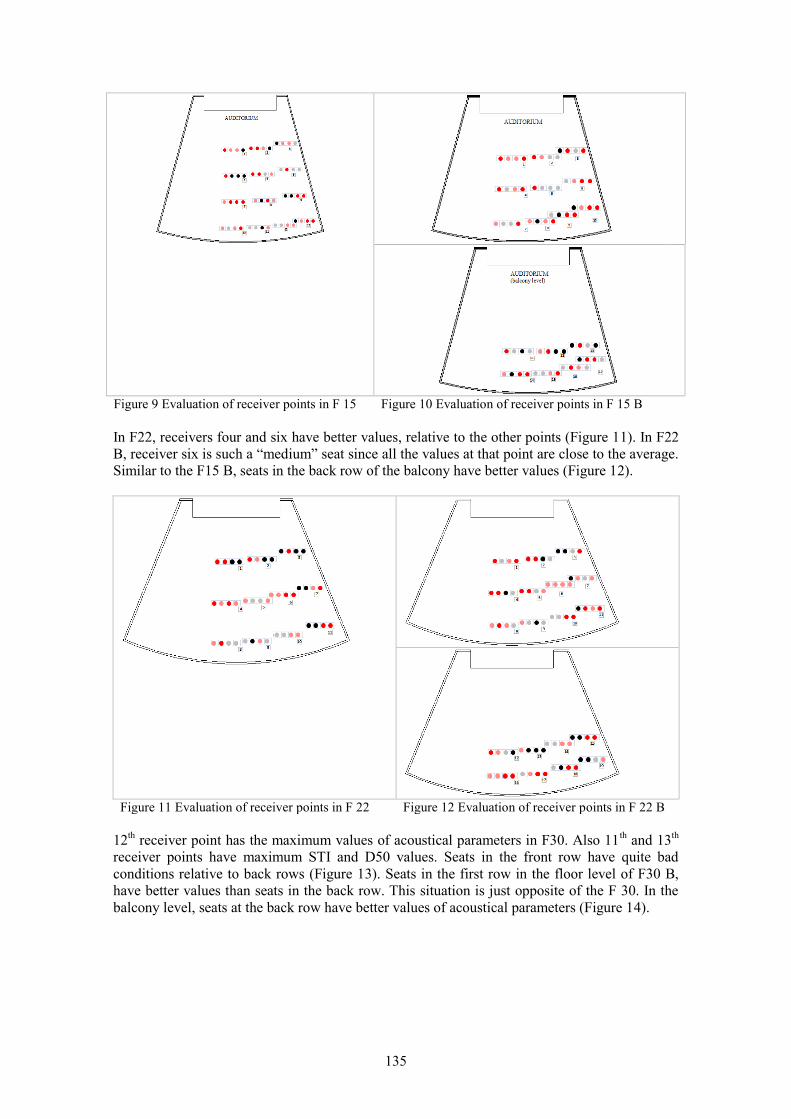
Figure 9 Evaluation of receiver points in F 15 Figure 10 Evaluation of receiver points in F 15 B
In F22, receivers four and six have better values, relative to the other points (Figure 11). In F22
B, receiver six is such a “medium” seat since all the values at that point are close to the average.
Similar to the F15 B, seats in the back row of the balcony have better values (Figure 12).
Figure 11 Evaluation of receiver points in F 22 Figure 12 Evaluation of receiver points in F 22 B
12th receiver point has the maximum values of acoustical parameters in F30. Also 11
th and 13
th
receiver points have maximum STI and D50 values. Seats in the front row have quite bad
conditions relative to back rows (Figure 13). Seats in the first row in the floor level of F30 B,
have better values than seats in the back row. This situation is just opposite of the F 30. In the
balcony level, seats at the back row have better values of acoustical parameters (Figure 14).
135
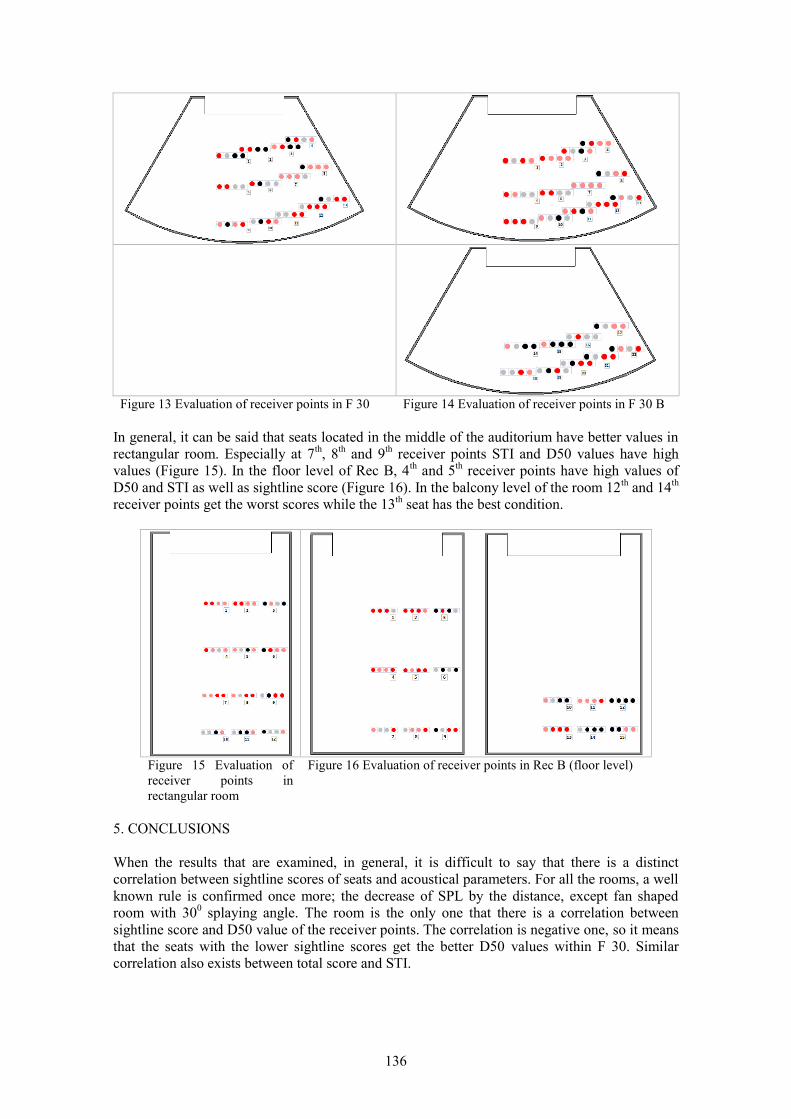
Figure 13 Evaluation of receiver points in F 30 Figure 14 Evaluation of receiver points in F 30 B
In general, it can be said that seats located in the middle of the auditorium have better values in
rectangular room. Especially at 7th, 8
th and 9
th receiver points STI and D50 values have high
values (Figure 15). In the floor level of Rec B, 4th and 5
th receiver points have high values of
D50 and STI as well as sightline score (Figure 16). In the balcony level of the room 12th and 14
th
receiver points get the worst scores while the 13th seat has the best condition.
Figure 15 Evaluation of
receiver points in
rectangular room
Figure 16 Evaluation of receiver points in Rec B (floor level)
5. CONCLUSIONS
When the results that are examined, in general, it is difficult to say that there is a distinct
correlation between sightline scores of seats and acoustical parameters. For all the rooms, a well
known rule is confirmed once more; the decrease of SPL by the distance, except fan shaped
room with 300 splaying angle. The room is the only one that there is a correlation between
sightline score and D50 value of the receiver points. The correlation is negative one, so it means
that the seats with the lower sightline scores get the better D50 values within F 30. Similar
correlation also exists between total score and STI.
136
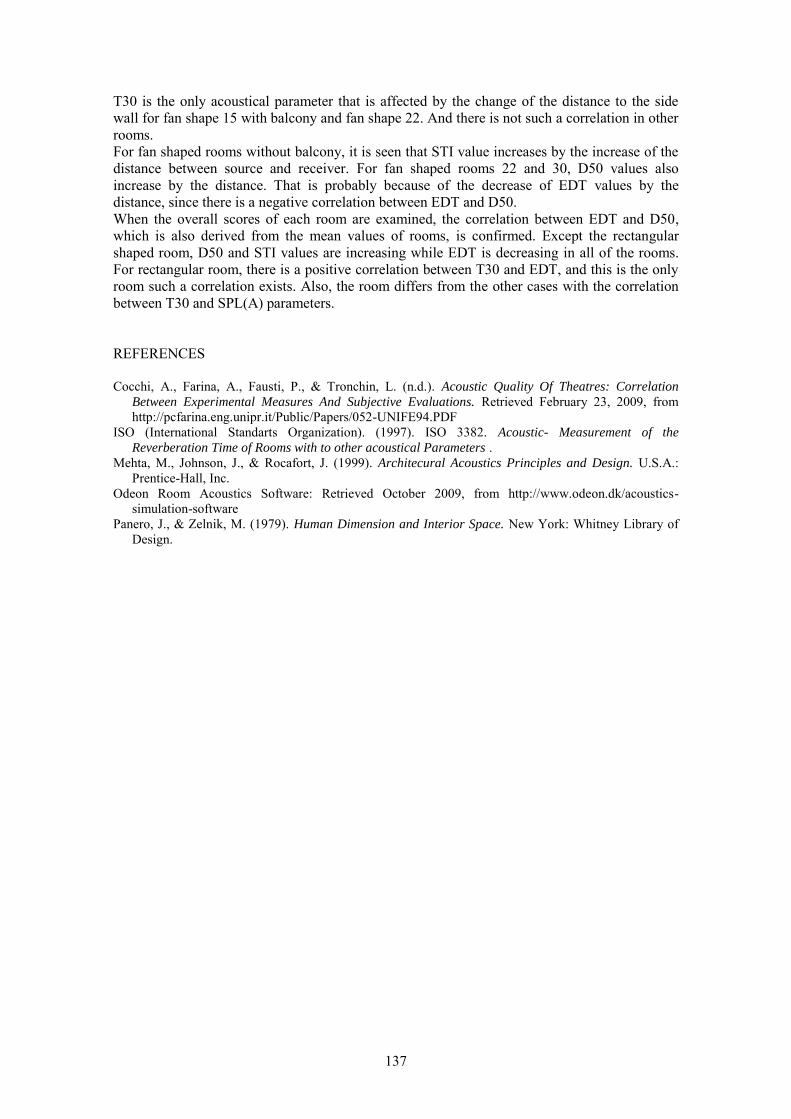
T30 is the only acoustical parameter that is affected by the change of the distance to the side
wall for fan shape 15 with balcony and fan shape 22. And there is not such a correlation in other
rooms.
For fan shaped rooms without balcony, it is seen that STI value increases by the increase of the
distance between source and receiver. For fan shaped rooms 22 and 30, D50 values also
increase by the distance. That is probably because of the decrease of EDT values by the
distance, since there is a negative correlation between EDT and D50.
When the overall scores of each room are examined, the correlation between EDT and D50,
which is also derived from the mean values of rooms, is confirmed. Except the rectangular
shaped room, D50 and STI values are increasing while EDT is decreasing in all of the rooms.
For rectangular room, there is a positive correlation between T30 and EDT, and this is the only
room such a correlation exists. Also, the room differs from the other cases with the correlation
between T30 and SPL(A) parameters.
REFERENCES
Cocchi, A., Farina, A., Fausti, P., & Tronchin, L. (n.d.). Acoustic Quality Of Theatres: Correlation
Between Experimental Measures And Subjective Evaluations. Retrieved February 23, 2009, from
http://pcfarina.eng.unipr.it/Public/Papers/052-UNIFE94.PDF
ISO (International Standarts Organization). (1997). ISO 3382. Acoustic- Measurement of the
Reverberation Time of Rooms with to other acoustical Parameters .
Mehta, M., Johnson, J., & Rocafort, J. (1999). Architecural Acoustics Principles and Design. U.S.A.:
Prentice-Hall, Inc.
Odeon Room Acoustics Software: Retrieved October 2009, from http://www.odeon.dk/acoustics-
simulation-software
Panero, J., & Zelnik, M. (1979). Human Dimension and Interior Space. New York: Whitney Library of
Design.
137

138
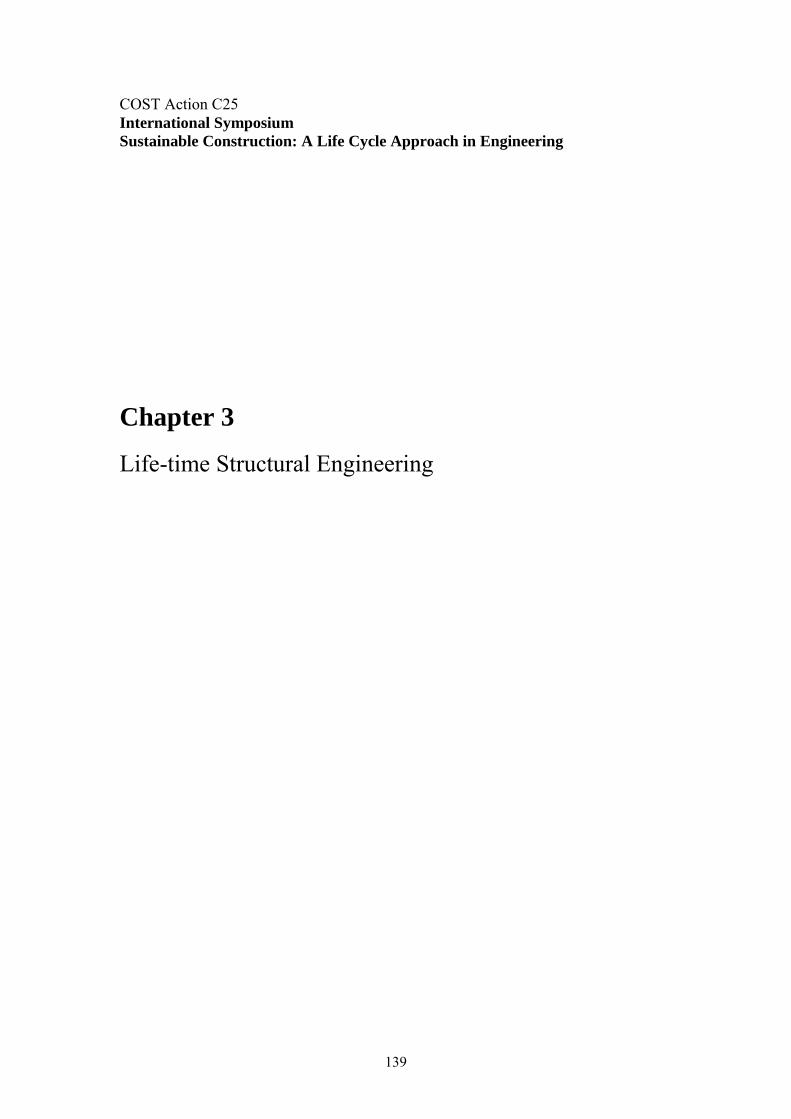
COST Action C25
International Symposium
Sustainable Construction: A Life Cycle Approach in Engineering
Chapter 3
Life-time Structural Engineering
139

140
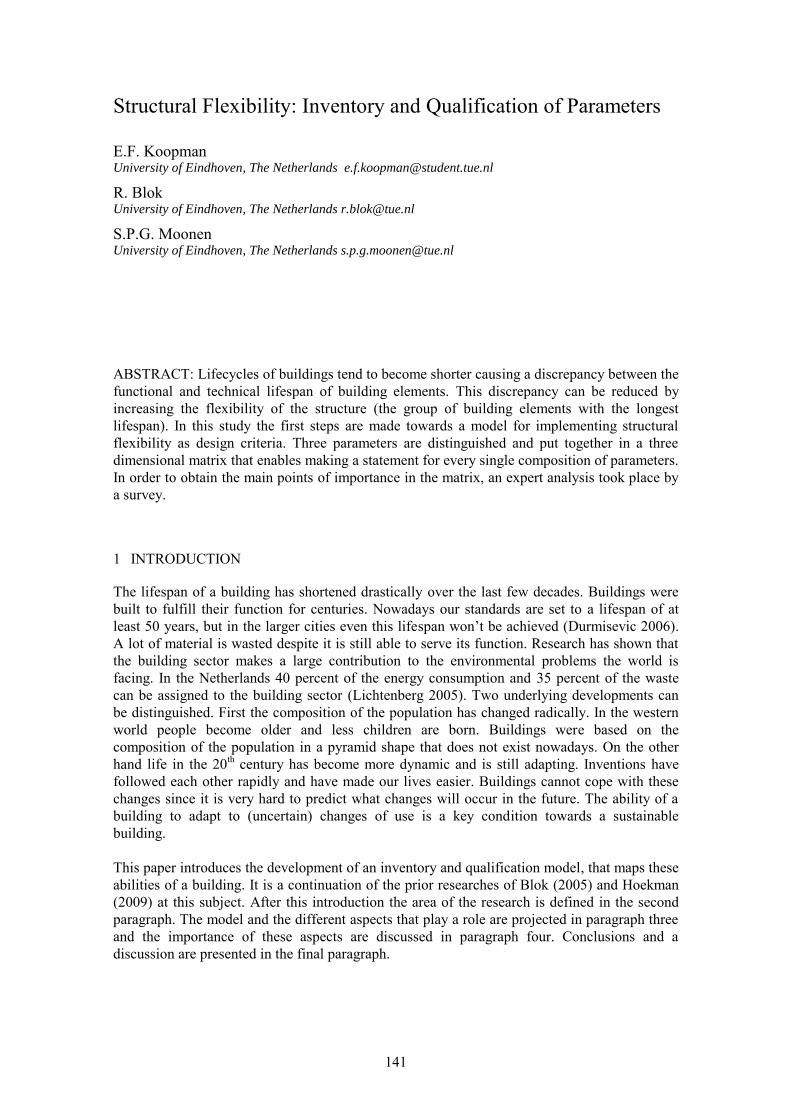
1 INTRODUCTION
The lifespan of a building has shortened drastically over the last few decades. Buildings were
built to fulfill their function for centuries. Nowadays our standards are set to a lifespan of at
least 50 years, but in the larger cities even this lifespan won’t be achieved (Durmisevic 2006).
A lot of material is wasted despite it is still able to serve its function. Research has shown that
the building sector makes a large contribution to the environmental problems the world is
facing. In the Netherlands 40 percent of the energy consumption and 35 percent of the waste
can be assigned to the building sector (Lichtenberg 2005). Two underlying developments can
be distinguished. First the composition of the population has changed radically. In the western
world people become older and less children are born. Buildings were based on the
composition of the population in a pyramid shape that does not exist nowadays. On the other
hand life in the 20th century has become more dynamic and is still adapting. Inventions have
followed each other rapidly and have made our lives easier. Buildings cannot cope with these
changes since it is very hard to predict what changes will occur in the future. The ability of a
building to adapt to (uncertain) changes of use is a key condition towards a sustainable
building.
This paper introduces the development of an inventory and qualification model, that maps these
abilities of a building. It is a continuation of the prior researches of Blok (2005) and Hoekman
(2009) at this subject. After this introduction the area of the research is defined in the second
paragraph. The model and the different aspects that play a role are projected in paragraph three
and the importance of these aspects are discussed in paragraph four. Conclusions and a
discussion are presented in the final paragraph.
Structural Flexibility: Inventory and Qualification of Parameters
E.F. Koopman University of Eindhoven, The Netherlands [email protected]
R. Blok University of Eindhoven, The Netherlands [email protected]
S.P.G. Moonen University of Eindhoven, The Netherlands [email protected]
ABSTRACT: Lifecycles of buildings tend to become shorter causing a discrepancy between the
functional and technical lifespan of building elements. This discrepancy can be reduced by
increasing the flexibility of the structure (the group of building elements with the longest
lifespan). In this study the first steps are made towards a model for implementing structural
flexibility as design criteria. Three parameters are distinguished and put together in a three
dimensional matrix that enables making a statement for every single composition of parameters.
In order to obtain the main points of importance in the matrix, an expert analysis took place by
a survey.
141

2 POSITIONING STRUCTURAL FLEXIBILITY
Different strategies are developed within the building sector to reduce its effect on the
environment. Moffat and Russell (2001) have distinguished three different strategies to
implement long-term environmental performance in a design: durability, disassembly and
accommodation capacity. Durability reflects the search for materials and assemblies that
require less maintenance and replacement. Designing for disassembly makes is easier to take
products apart, in order to reuse or recycle these products. When a building has more capacity
to accommodate changes the building can be used more efficiently.
Within the accommodation capacity the flexibility and adaptability are important terms. Since
these words are widely used in very different purposes strict definitions are made. Adaptability
is the capacity of an element or element group to change without requiring adjustments of other
elements or element groups. When talking about flexibility the same situation is put in the
opposite perspective. Flexibility is the capacity of an element or element group to modify an
other element or element group without the need to change itself.
The importance of the flexibility of the structure comes forward, when looking to the attempts
to simplify the building into certain element groups. Many people have tried to identify certain
layers within the building. Duffy (1993) distinguished shell, services and scenery. Brand (1994)
made a more detailed separation in site, structure, skin, services, space plan and stuff.
Furthermore a link was made between the different layers and their lifespan. The structure has a
lifespan that approaches the lifespan of the building itself, which is larger than the lifespan of
any of the other layers. Before the structure reaches its technical lifespan other layers have been
replaced several times. Only when the structure can facilitate these replacements, the building
can reach its functional lifespan.
Figure 1: The building layers according to Brand.
3 PARAMETERS AND THE 3D-MATRIX
3.1 Matrix
The model presented in this paper is made with the goal to evaluate the current building stock
on structural flexibility. This enables us to look into the problem and point out the bottlenecks
in the way new buildings are built. Thereby future research towards flexibility can be focused
more efficiently on the important subjects. In this paper the base of this future goal is made by
framing the subject and determining what output the model should generate.
142
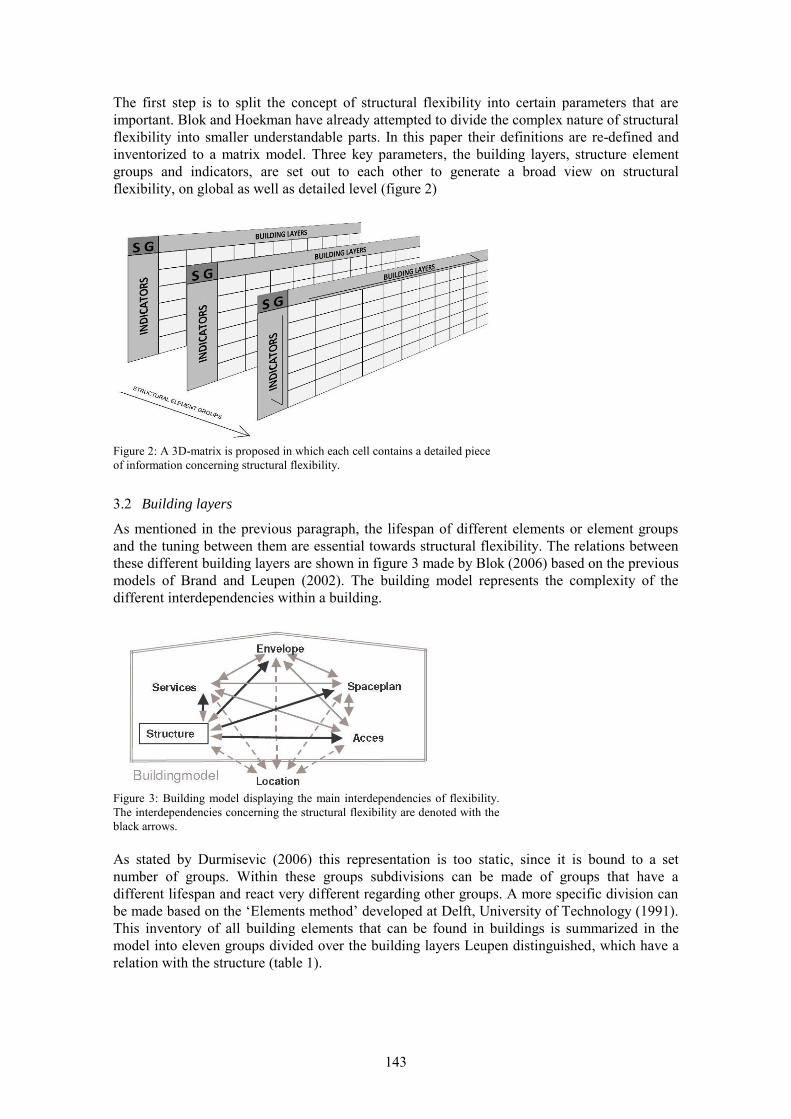
The first step is to split the concept of structural flexibility into certain parameters that are
important. Blok and Hoekman have already attempted to divide the complex nature of structural
flexibility into smaller understandable parts. In this paper their definitions are re-defined and
inventorized to a matrix model. Three key parameters, the building layers, structure element
groups and indicators, are set out to each other to generate a broad view on structural
flexibility, on global as well as detailed level (figure 2)
Figure 2: A 3D-matrix is proposed in which each cell contains a detailed piece
of information concerning structural flexibility.
3.2 Building layers
As mentioned in the previous paragraph, the lifespan of different elements or element groups
and the tuning between them are essential towards structural flexibility. The relations between
these different building layers are shown in figure 3 made by Blok (2006) based on the previous
models of Brand and Leupen (2002). The building model represents the complexity of the
different interdependencies within a building.
Figure 3: Building model displaying the main interdependencies of flexibility.
The interdependencies concerning the structural flexibility are denoted with the
black arrows.
As stated by Durmisevic (2006) this representation is too static, since it is bound to a set
number of groups. Within these groups subdivisions can be made of groups that have a
different lifespan and react very different regarding other groups. A more specific division can
be made based on the ‘Elements method’ developed at Delft, University of Technology (1991).
This inventory of all building elements that can be found in buildings is summarized in the
model into eleven groups divided over the building layers Leupen distinguished, which have a
relation with the structure (table 1).
143
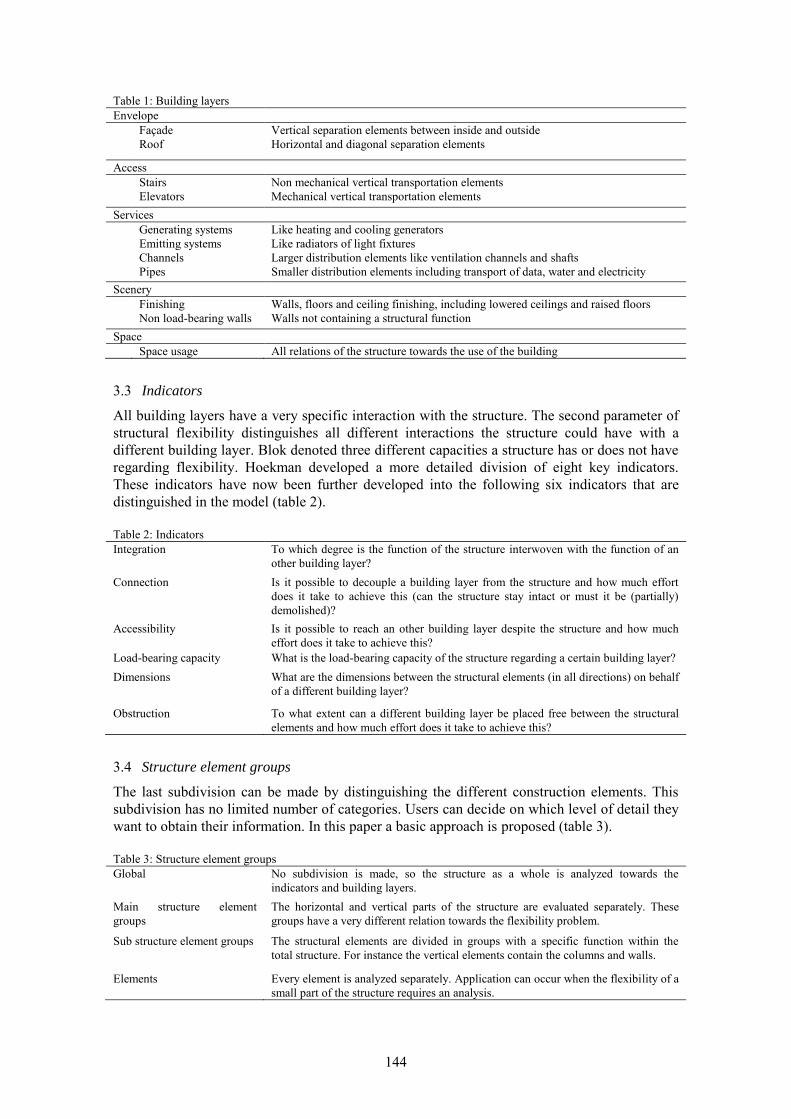
Table 1: Building layers
Envelope
Façade Vertical separation elements between inside and outside
Roof Horizontal and diagonal separation elements
Access
Stairs Non mechanical vertical transportation elements
Elevators Mechanical vertical transportation elements
Services
Generating systems Like heating and cooling generators
Emitting systems Like radiators of light fixtures
Channels Larger distribution elements like ventilation channels and shafts
Pipes Smaller distribution elements including transport of data, water and electricity
Scenery
Finishing Walls, floors and ceiling finishing, including lowered ceilings and raised floors
Non load-bearing walls Walls not containing a structural function
Space
Space usage All relations of the structure towards the use of the building
3.3 Indicators
All building layers have a very specific interaction with the structure. The second parameter of
structural flexibility distinguishes all different interactions the structure could have with a
different building layer. Blok denoted three different capacities a structure has or does not have
regarding flexibility. Hoekman developed a more detailed division of eight key indicators.
These indicators have now been further developed into the following six indicators that are
distinguished in the model (table 2).
Table 2: Indicators
Integration To which degree is the function of the structure interwoven with the function of an
other building layer?
Connection Is it possible to decouple a building layer from the structure and how much effort
does it take to achieve this (can the structure stay intact or must it be (partially)
demolished)?
Accessibility Is it possible to reach an other building layer despite the structure and how much
effort does it take to achieve this?
Load-bearing capacity What is the load-bearing capacity of the structure regarding a certain building layer?
Dimensions What are the dimensions between the structural elements (in all directions) on behalf
of a different building layer?
Obstruction To what extent can a different building layer be placed free between the structural
elements and how much effort does it take to achieve this?
3.4 Structure element groups
The last subdivision can be made by distinguishing the different construction elements. This
subdivision has no limited number of categories. Users can decide on which level of detail they
want to obtain their information. In this paper a basic approach is proposed (table 3).
Table 3: Structure element groups
Global No subdivision is made, so the structure as a whole is analyzed towards the
indicators and building layers.
Main structure element
groups
The horizontal and vertical parts of the structure are evaluated separately. These
groups have a very different relation towards the flexibility problem.
Sub structure element groups The structural elements are divided in groups with a specific function within the
total structure. For instance the vertical elements contain the columns and walls.
Elements Every element is analyzed separately. Application can occur when the flexibility of a
small part of the structure requires an analysis.
144
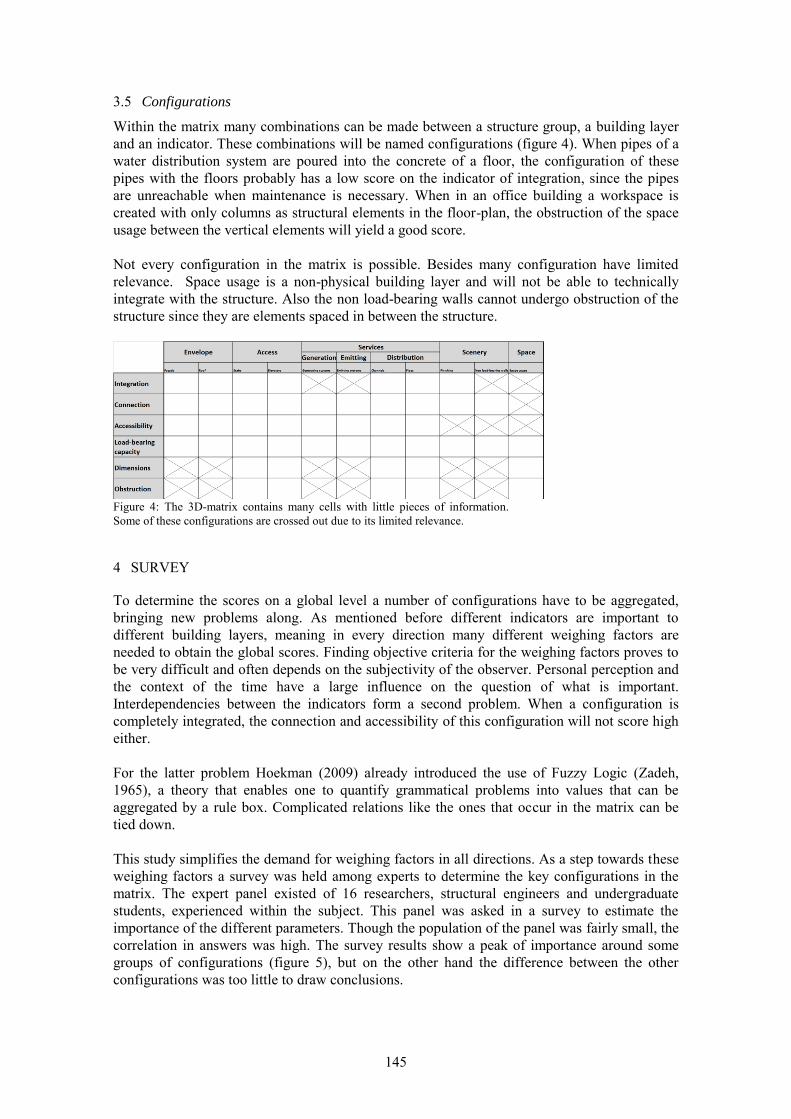
3.5 Configurations
Within the matrix many combinations can be made between a structure group, a building layer
and an indicator. These combinations will be named configurations (figure 4). When pipes of a
water distribution system are poured into the concrete of a floor, the configuration of these
pipes with the floors probably has a low score on the indicator of integration, since the pipes
are unreachable when maintenance is necessary. When in an office building a workspace is
created with only columns as structural elements in the floor-plan, the obstruction of the space
usage between the vertical elements will yield a good score.
Not every configuration in the matrix is possible. Besides many configuration have limited
relevance. Space usage is a non-physical building layer and will not be able to technically
integrate with the structure. Also the non load-bearing walls cannot undergo obstruction of the
structure since they are elements spaced in between the structure.
Figure 4: The 3D-matrix contains many cells with little pieces of information.
Some of these configurations are crossed out due to its limited relevance.
4 SURVEY
To determine the scores on a global level a number of configurations have to be aggregated,
bringing new problems along. As mentioned before different indicators are important to
different building layers, meaning in every direction many different weighing factors are
needed to obtain the global scores. Finding objective criteria for the weighing factors proves to
be very difficult and often depends on the subjectivity of the observer. Personal perception and
the context of the time have a large influence on the question of what is important.
Interdependencies between the indicators form a second problem. When a configuration is
completely integrated, the connection and accessibility of this configuration will not score high
either.
For the latter problem Hoekman (2009) already introduced the use of Fuzzy Logic (Zadeh,
1965), a theory that enables one to quantify grammatical problems into values that can be
aggregated by a rule box. Complicated relations like the ones that occur in the matrix can be
tied down.
This study simplifies the demand for weighing factors in all directions. As a step towards these
weighing factors a survey was held among experts to determine the key configurations in the
matrix. The expert panel existed of 16 researchers, structural engineers and undergraduate
students, experienced within the subject. This panel was asked in a survey to estimate the
importance of the different parameters. Though the population of the panel was fairly small, the
correlation in answers was high. The survey results show a peak of importance around some
groups of configurations (figure 5), but on the other hand the difference between the other
configurations was too little to draw conclusions.
145
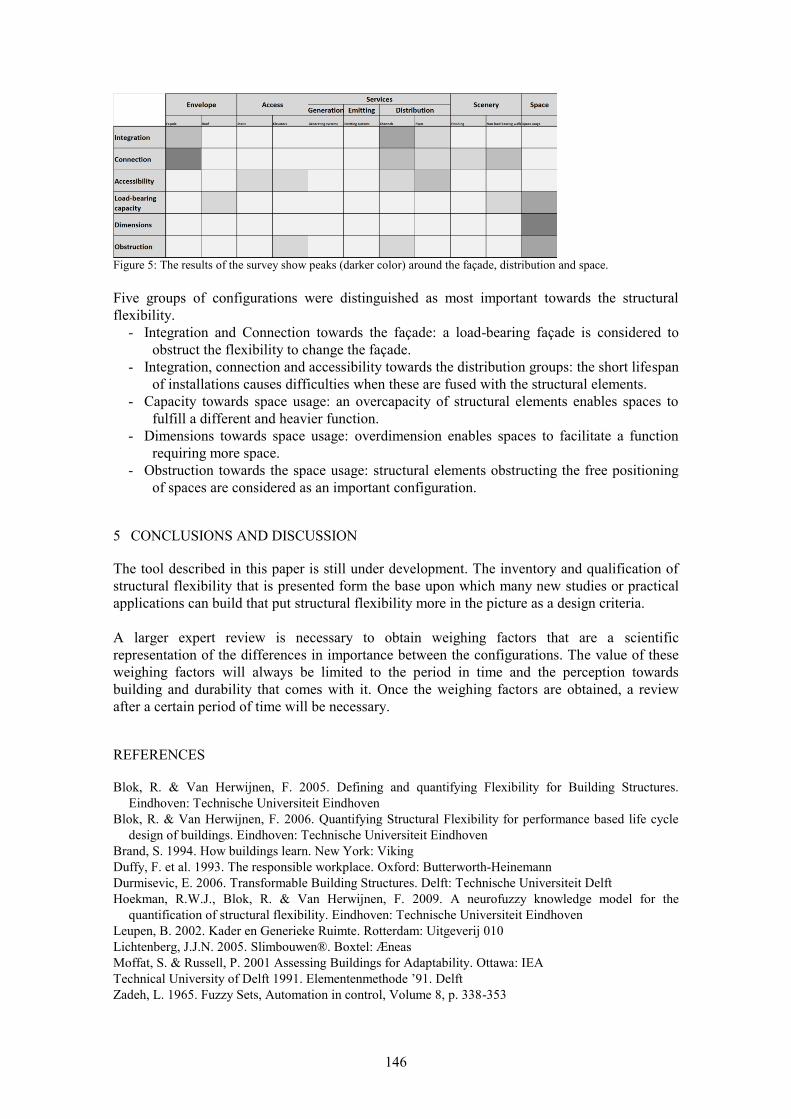
Figure 5: The results of the survey show peaks (darker color) around the façade, distribution and space.
Five groups of configurations were distinguished as most important towards the structural
flexibility.
- Integration and Connection towards the façade: a load-bearing façade is considered to
obstruct the flexibility to change the façade.
- Integration, connection and accessibility towards the distribution groups: the short lifespan
of installations causes difficulties when these are fused with the structural elements.
- Capacity towards space usage: an overcapacity of structural elements enables spaces to
fulfill a different and heavier function.
- Dimensions towards space usage: overdimension enables spaces to facilitate a function
requiring more space.
- Obstruction towards the space usage: structural elements obstructing the free positioning
of spaces are considered as an important configuration.
5 CONCLUSIONS AND DISCUSSION
The tool described in this paper is still under development. The inventory and qualification of
structural flexibility that is presented form the base upon which many new studies or practical
applications can build that put structural flexibility more in the picture as a design criteria.
A larger expert review is necessary to obtain weighing factors that are a scientific
representation of the differences in importance between the configurations. The value of these
weighing factors will always be limited to the period in time and the perception towards
building and durability that comes with it. Once the weighing factors are obtained, a review
after a certain period of time will be necessary.
REFERENCES
Blok, R. & Van Herwijnen, F. 2005. Defining and quantifying Flexibility for Building Structures.
Eindhoven: Technische Universiteit Eindhoven
Blok, R. & Van Herwijnen, F. 2006. Quantifying Structural Flexibility for performance based life cycle
design of buildings. Eindhoven: Technische Universiteit Eindhoven
Brand, S. 1994. How buildings learn. New York: Viking
Duffy, F. et al. 1993. The responsible workplace. Oxford: Butterworth-Heinemann
Durmisevic, E. 2006. Transformable Building Structures. Delft: Technische Universiteit Delft
Hoekman, R.W.J., Blok, R. & Van Herwijnen, F. 2009. A neurofuzzy knowledge model for the
quantification of structural flexibility. Eindhoven: Technische Universiteit Eindhoven
Leupen, B. 2002. Kader en Generieke Ruimte. Rotterdam: Uitgeverij 010
Lichtenberg, J.J.N. 2005. Slimbouwen®. Boxtel: Æneas
Moffat, S. & Russell, P. 2001 Assessing Buildings for Adaptability. Ottawa: IEA
Technical University of Delft 1991. Elementenmethode ’91. Delft
Zadeh, L. 1965. Fuzzy Sets, Automation in control, Volume 8, p. 338-353
146
A Literature review of life cycle assessment for bridge
infrastructure
G.L. Du Royal Institute of Technology, Stockholm, Sweden [email protected]
ABSTRACT: Life cycle assessment (LCA) is a comprehensive framework for assessing the
environmental impacts of a product system through its life cycle, with the concept of ‘’cradle to
grave’’. Currently the whole world is confronting with the challenges for preventing the
environmental degradations. The infrastructure industry which represents enormous material
consumption and considerable environmental impact can never stay out of the responsibility.
Specifically, for the purpose of establishing the high-speed transportation network, the railway
bridge infrastructure keeps an increasing growth number in Europe. Despite the long life span
and enormous material consumption of each project, those bridge infrastructure requires
consistent maintenance and final demolish during its life time, which in turn lead to tremendous
material flows, significant energy consumption and considerable environmental impact.
However, the present management of bridge projects is primarily oriented on the technique and
economic perspective, while the environmental impact are rarely considered and incorporated. It
has been realized that there are limited research and literature regarding the environmental
assessment for railway bridge infrastructure. This paper is a review of the current knowledge
associate with LCA of bridge infrastructures. Based on this state of the art study, it has been
found that there is no specific environmental feature for a certain bridge type. The
environmental burden is actually a combined effect related to the material selection, bridge type
and its location, the frequency of maintenance activities, and demolishes strategy. The major
environmental impact is generated from the material manufacture, the construction phase and
the traffic disturbance due to the closure of the traffic. Generally, more complex structure
components attribute to more environmental burden, in behalf of their frequent maintenance and
correlated traffic disturbance.
Key words: Life cycle assessment, Environmental impact assessment, Bridge LCA, Sustainable
construction
147
1 INTRODUCTION
Bridges are important links in transportation network which keeps an increasing construction
growth in Europe. Nowadays, the environmental issues attract more and more concern,
bridge infrastructures as tremendous project involves continuous activities can never stay out
of the responsibility. Despite the long life span and enormous material consumption, bridge
infrastructure requires consistent maintenance and final demolish during its whole life time,
which in turn accounts for huge material flows, significant energy consumption and
considerable environmental impact. However, in present management of bridge projects,
decision-making are primarily oriented on the technique and economic perspective, while the
environmental impact are rarely considered and incorporated. It has been recognized that
there are limit research and literature existing regarding the environmental evaluation for
bridge infrastructure. In order to achieve the target of ‘’environmental assessment’’, the
analysis framework for quantifying and comparing the environmental impacts of railway
bridges must be developed and integrated into the present management network. The Life
cycle assessment (LCA) is a comprehensive framework for analyzing the environmental
impact of product or services by considering the flow of raw materials and energy into a
system over a life cycle.
The purpose of this paper is to review the current knowledge and methodological approaches
regarding the LCA applications for bridge infrastructures; determine the environmental
feature of a certain bridge type; based on the LCA analysis; recognize the unfavorable life
stage through the whole life of the bridge. Therefore, provide the guidance to the project
manager from the environmental perspective.
2 LITERATURE REVIEW OF LIFE CYCLE ASSESSMENT FOR BRIDGE
2.1 The framework of Life cycle assessment
Life cycle assessment is a comprehensive framework for assessing environmental impacts of
a product or service through its total life cycle (ISO14040, 2006). The term ‘life cycle’ refers
to the sense that a holistic assessment of the product is performed from the raw material
extraction phase, through manufacture phase, use phase until the final disposal phase,
including all related transportation process. The methodology of LCA is standardized by the
ISO 14040 and ISO14044 series guidelines, it includes four phases: Goal and Scope phase,
life cycle inventory phase, life cycle impact assessment phase, and result interpretation
(ISO14040, 2006).
148
2.2 Existing research of Life cycle assessment for bridge
Nowadays, the increasing transportation demand has concerned people to look into the
environmental performance of different transportation infrastructures in a life-cycle
perspective. Although LCA has been widely applied in industrial domain, there is limit
implementation in bridge infrastructure field, thus it has high potential for the further
research. A literature review of the studies focused on the environmental assessment of
bridge infrastructure is presented in the following part.
D. Collings (2006) compared the embodied energy and CO2 emissions for three basic bridge
forms: cantilever, cable stayed and tied-arch bridge. For each bridge type three material
alternatives were considered: steel, concrete and steel–concrete composite. The assessment is
performed for the construction process and the operation process in 120 years assumed life
span of the bridge. Result indicated that the consumption of the embodied energy increases
with the span length. The well engineered longer span bridge can be almost as environmental
friendly as shorter span bridge which has no environmental consideration. The architectural
solutions have a higher environmental burden for the same bridge forms. The CO2 emission
is almost the same for three bridge materials during the operation process.
In order to improve the environmental performance of concrete infrastructure, Gregory A.
Keoleian, et al. (2005) applied a comparative life cycle assessment (LCA) of two bridge
deck systems over a 60 years’ service life. One deck system is containing the conventional
steel expansion joints, while the alternative one is a link slab using the engineered
cementitious composite (ECC). ECC is an alternative promising material for extending the
service life and reducing the maintenance activities. The results of LCA model indicate that:
the ECC bridge deck system has significant advantages for all pollutants categories.
Compare to the conventional joints, the consumption of life cycle energy for ECC is 40%
less, the generation of solid waste decreased 50%, and the raw material consumption is 38%
less. The construction related traffic congestion is the greatest contributor to most life cycle
impact categories.
Lee et al. (2008) applied the life cycle assessment method on two rail track systems: gravel
ballast and the concrete track system. Those track system are constructed between Seoul and
Busan in South Korea. The analysis compasses the whole life-cycle of the system from the
raw material extraction to the maintenance activities, within a service life of 20 years. The
result shows that the ballast track system had a better environmental performance than the
concrete track system. The major environmental contributor was the ties, the fasteners and
the ballast for the ballasted track, and the ready mixed concrete, the ties and the fasteners for
the concrete track.
149
3 CONCLUSION
This paper reviewed state of the art regarding the life cycle assessment framework and
existing research on infrastructures. The following conclusions can be drawn from the
study:
1. Based on the reviewing of current LCA methodologies and study cases, we find that
there is no general conclusion for a certain bridge type from the environmental
aspects. The environmental feature of the bridge cannot be determined without
applying the life cycle assessment.
2. The environmental burden is actually a combined effect influenced by several
factors: the material selection, bridge type and its location, the frequency of
maintenance activities, and demolishes strategy.
3. The major environmental impact is generated from the material manufacture, the
construction and the traffic disturbance due to the closure of the infrastructure.
4. More complex structure components as joints, bearings and torsion, usually attribute
to more environmental burden, in behalf of their frequent maintenance and
correlated traffic disturbance. Therefore, the engineer should avoid complex
solutions during the design.
REFERENCES
ISO14040. (2006). – life cycle assessment – Principles and framework. International Orgnization
for Standadization .
Collings, D. (December, 2006). An environmental comparison of bridge forms. Bridge Engineering
159 , 163–168.
Gregory A. Keoleian, Alissa Kendall,Jonathan E. Dettling, Vanessa M. Smith, Richard F. Chandler,
Michael D. Lepech,Victor C. Li. (March, 2005). Life Cycle Modeling of Concrete Bridge Design:
Comparison of Engineered Cementitious Composite Link Slabs and Conventional Steel Expansion
Joints. Journal of Infrastructure Systems, Vol. 11, No. 1 , 51-60.
Lee C. K., Lee J. Y., Kim Y. K. ( 2008). Comparison of environmental loads with rail track systems
using simplified life cycle assessment (LCA). WIT Transactions on the Built Environment, Vol 101 ,
367 - 372.
150
1 INTRODUCTION The study explained in this paper is part of an ongoing research project at the LTU regarding comparative life cycle analysis of Integral abutment composite bridges and concrete bridges with expansion joints. Gervasio H. et al [1] made a comparative life cycle analysis of an integral abutment composite bridge and a reinforced concrete bridge with expansion joints and concluded that the integral bridge offered the most suitable solution in terms of both economy and its impact on the environment. Bearings and bridge expansion joints are an important part of a bridge structure. Their location in the bridge always exposes them to the detrimental ef-fects of water and gravel, which cause their wear and corrosion. Any solution whereby it is possible to do away with these components in the bridge would considerably reduce the cost of maintenance and repair, which would otherwise be required and would induce heavy life cycle costs. An integral abutment bridge consists of the bridge deck being monolithically cast with the abutments. This arrangement produces a nearly rigid moment connection where the abutments are supported by piles driven into the supporting soil [2]. There is no requirement for any bear-ings and expansion joints, which therefore makes an integral abutment bridge a much more economical and environmentally safe solution. This case study focuses on an integral abutment bridge built over the river Leduån, in north-ern Sweden, having a 40 meter span length. A comparative life cycle analysis is performed be-
Inflation adjusted LCCA of a comparative study of an Integral abutment bridge and a Concrete bridge with expansion joints
N. Iqbal Luleå University of Technology, Luleå, Sweden
H. Gervasio ISISE, Civil Engineering Department, Universidade de Coimbra, Coimbra, Portugal
J. Eriksen Luleå University of Technology, Luleå, Sweden
M. Veljkovic Luleå University of Technology, Luleå, Sweden
L. Simoes da Silva ISISE, Civil Engineering Department, Universidade de Coimbra, Coimbra, Portugal
H. Gervasio ISISE, Civil Engineering Department, Universidade de Coimbra, Coimbra, Portugal
J. Eriksen Luleå University of Technology, Luleå, Sweden
M. Veljkovic Luleå University of Technology, Luleå, Sweden
L. Simoes da Silva
ISISE, Civil Engineering Department, Universidade de Coimbra, Coimbra, Portugal
ABSTRACT: Gervasio H. et al [1]in there comparative life cycle analysis of an integral abut-ment composite bridge and concrete bridge have established the advantages of integral bridge due to its limited initial construction cost and maintenance and repair costs during its life cycle. This paper is based on the same data with a modification to the life cycle cost analysis of the bridge by using an inflation adjusted discount rate. In standard bridge structures, expansion joints are one of the most expensive components to maintain. In this regard, joint less bridge have major advantages. Integral bridges are built without joints, they span from one abutment to the other abutment, possibly over intermediate piers, without any joints in the deck. The ab-sence of joints and bearings results in savings in initial costs and reduce maintenance efforts. Apart from economic benefits, the reduction of maintenance leads to less disturbance of the traffic over the bridge and thus to smaller environmental and social impacts. In this paper a case study is presented with the purpose of making a comparative life cycle analysis between an integral composite bridge and a concrete bridge with expansion joints. The result of this life cycle analysis will enhance the advantages of the former solution in regards to the economic and environmental aspects..
151
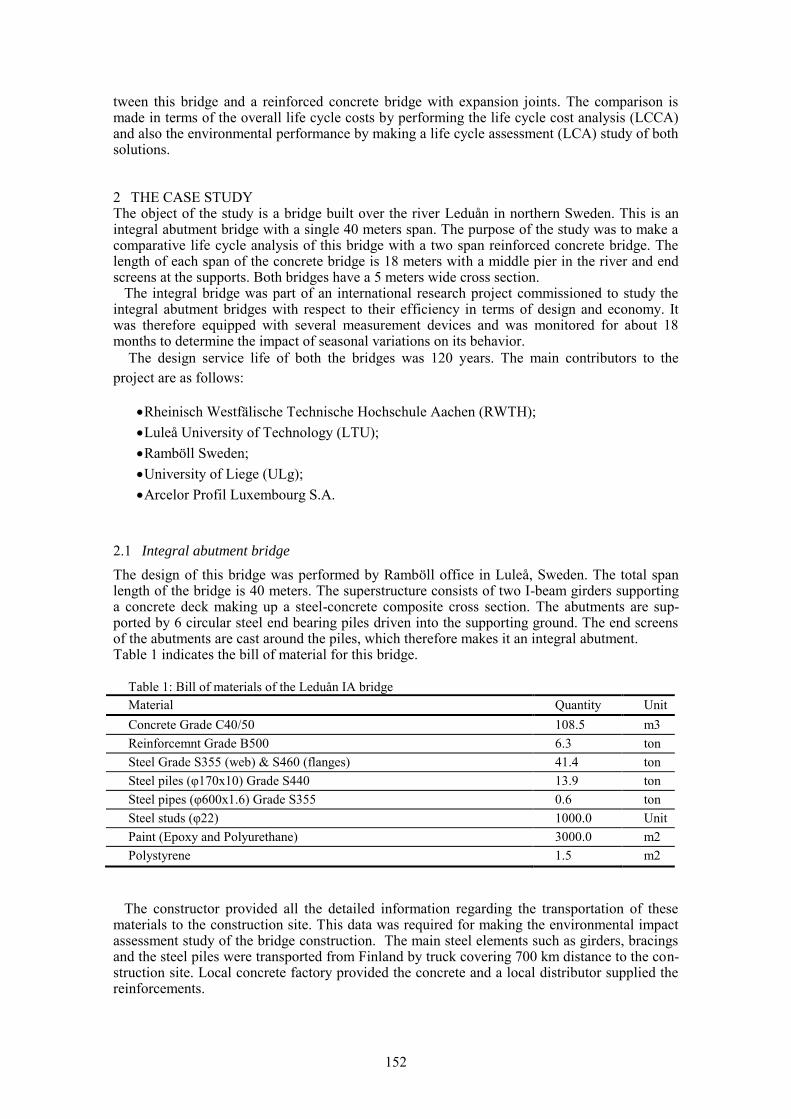
tween this bridge and a reinforced concrete bridge with expansion joints. The comparison is made in terms of the overall life cycle costs by performing the life cycle cost analysis (LCCA) and also the environmental performance by making a life cycle assessment (LCA) study of both solutions.
2 THE CASE STUDY The object of the study is a bridge built over the river Leduån in northern Sweden. This is an integral abutment bridge with a single 40 meters span. The purpose of the study was to make a comparative life cycle analysis of this bridge with a two span reinforced concrete bridge. The length of each span of the concrete bridge is 18 meters with a middle pier in the river and end screens at the supports. Both bridges have a 5 meters wide cross section. The integral bridge was part of an international research project commissioned to study the integral abutment bridges with respect to their efficiency in terms of design and economy. It was therefore equipped with several measurement devices and was monitored for about 18 months to determine the impact of seasonal variations on its behavior.
The design service life of both the bridges was 120 years. The main contributors to the
project are as follows:
Rheinisch Westfälische Technische Hochschule Aachen (RWTH);
Luleå University of Technology (LTU);
Ramböll Sweden;
University of Liege (ULg);
Arcelor Profil Luxembourg S.A.
2.1 Integral abutment bridge
The design of this bridge was performed by Ramböll office in Luleå, Sweden. The total span length of the bridge is 40 meters. The superstructure consists of two I-beam girders supporting a concrete deck making up a steel-concrete composite cross section. The abutments are sup-ported by 6 circular steel end bearing piles driven into the supporting ground. The end screens of the abutments are cast around the piles, which therefore makes it an integral abutment. Table 1 indicates the bill of material for this bridge.
Table 1: Bill of materials of the Leduån IA bridge
Material Quantity Unit
Concrete Grade C40/50 108.5 m3
Reinforcemnt Grade B500 6.3 ton
Steel Grade S355 (web) & S460 (flanges) 41.4 ton
Steel piles (φ170x10) Grade S440 13.9 ton
Steel pipes (φ600x1.6) Grade S355 0.6 ton
Steel studs (φ22) 1000.0 Unit
Paint (Epoxy and Polyurethane) 3000.0 m2
Polystyrene 1.5 m2
The constructor provided all the detailed information regarding the transportation of these materials to the construction site. This data was required for making the environmental impact assessment study of the bridge construction. The main steel elements such as girders, bracings and the steel piles were transported from Finland by truck covering 700 km distance to the con-struction site. Local concrete factory provided the concrete and a local distributor supplied the reinforcements.
152
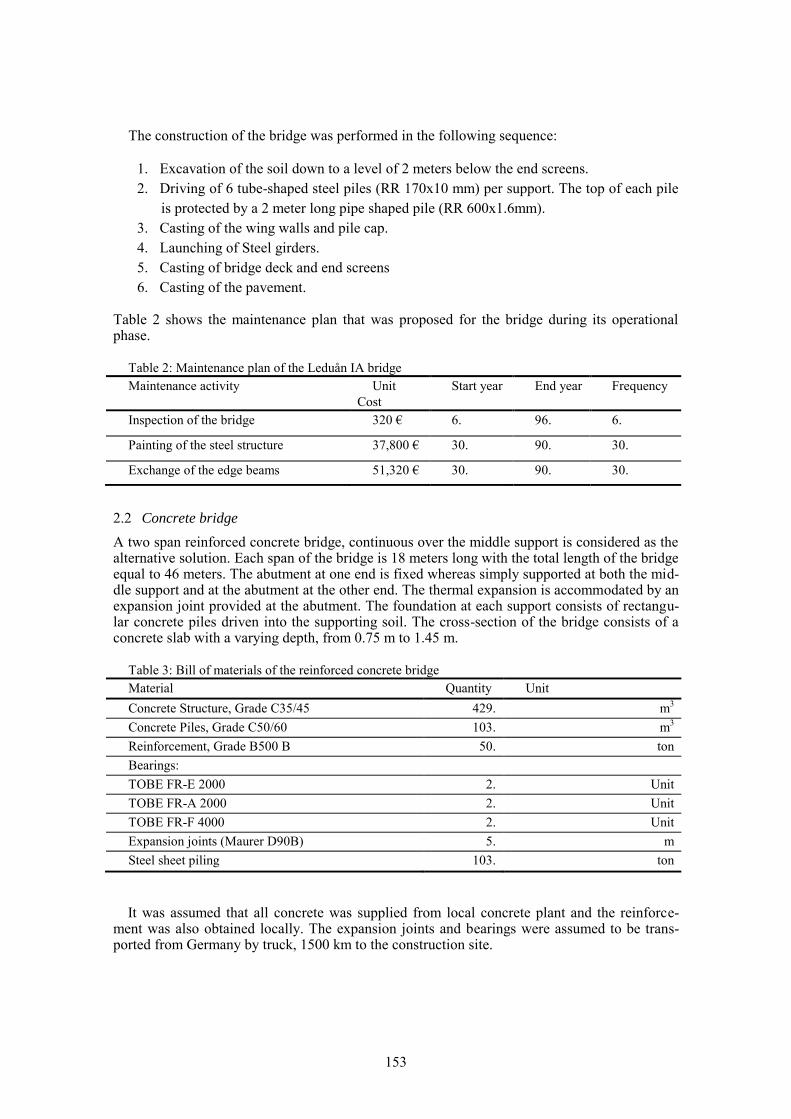
The construction of the bridge was performed in the following sequence:
1. Excavation of the soil down to a level of 2 meters below the end screens.
2. Driving of 6 tube-shaped steel piles (RR 170x10 mm) per support. The top of each pile
is protected by a 2 meter long pipe shaped pile (RR 600x1.6mm).
3. Casting of the wing walls and pile cap.
4. Launching of Steel girders.
5. Casting of bridge deck and end screens
6. Casting of the pavement.
Table 2 shows the maintenance plan that was proposed for the bridge during its operational phase.
Table 2: Maintenance plan of the Leduån IA bridge
Maintenance activity Unit
Cost
Start year End year Frequency
Inspection of the bridge 320 € 6. 96. 6.
Painting of the steel structure 37,800 € 30. 90. 30.
Exchange of the edge beams 51,320 € 30. 90. 30.
2.2 Concrete bridge
A two span reinforced concrete bridge, continuous over the middle support is considered as the alternative solution. Each span of the bridge is 18 meters long with the total length of the bridge equal to 46 meters. The abutment at one end is fixed whereas simply supported at both the mid-dle support and at the abutment at the other end. The thermal expansion is accommodated by an expansion joint provided at the abutment. The foundation at each support consists of rectangu-lar concrete piles driven into the supporting soil. The cross-section of the bridge consists of a concrete slab with a varying depth, from 0.75 m to 1.45 m.
Table 3: Bill of materials of the reinforced concrete bridge
Material Quantity Unit
Concrete Structure, Grade C35/45 429. m3
Concrete Piles, Grade C50/60 103. m3
Reinforcement, Grade B500 B 50. ton
Bearings:
TOBE FR-E 2000 2. Unit
TOBE FR-A 2000 2. Unit
TOBE FR-F 4000 2. Unit
Expansion joints (Maurer D90B) 5. m
Steel sheet piling 103. ton
It was assumed that all concrete was supplied from local concrete plant and the reinforce-ment was also obtained locally. The expansion joints and bearings were assumed to be trans-ported from Germany by truck, 1500 km to the construction site.
153
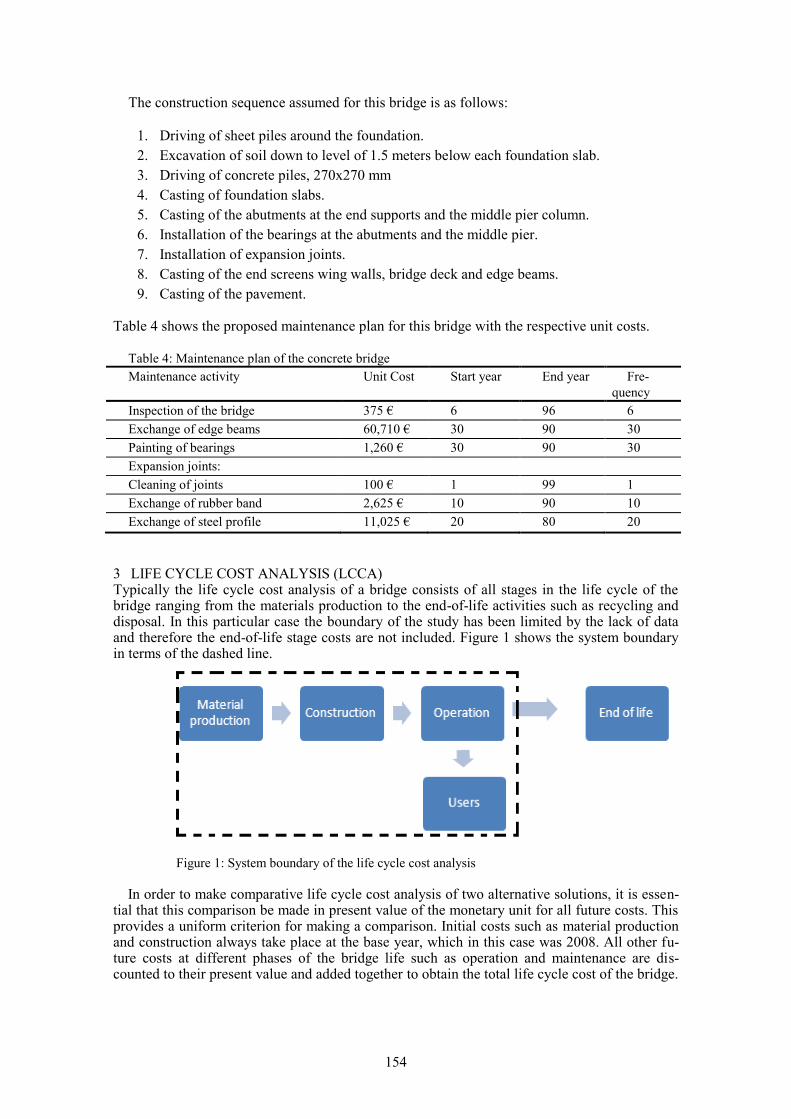
The construction sequence assumed for this bridge is as follows:
1. Driving of sheet piles around the foundation.
2. Excavation of soil down to level of 1.5 meters below each foundation slab.
3. Driving of concrete piles, 270x270 mm
4. Casting of foundation slabs.
5. Casting of the abutments at the end supports and the middle pier column.
6. Installation of the bearings at the abutments and the middle pier.
7. Installation of expansion joints.
8. Casting of the end screens wing walls, bridge deck and edge beams.
9. Casting of the pavement.
Table 4 shows the proposed maintenance plan for this bridge with the respective unit costs. Table 4: Maintenance plan of the concrete bridge
Maintenance activity Unit Cost Start year End year Fre-
quency
Inspection of the bridge 375 € 6 96 6
Exchange of edge beams 60,710 € 30 90 30
Painting of bearings 1,260 € 30 90 30
Expansion joints:
Cleaning of joints 100 € 1 99 1
Exchange of rubber band 2,625 € 10 90 10
Exchange of steel profile 11,025 € 20 80 20
3 LIFE CYCLE COST ANALYSIS (LCCA) Typically the life cycle cost analysis of a bridge consists of all stages in the life cycle of the bridge ranging from the materials production to the end-of-life activities such as recycling and disposal. In this particular case the boundary of the study has been limited by the lack of data and therefore the end-of-life stage costs are not included. Figure 1 shows the system boundary in terms of the dashed line.
Figure 1: System boundary of the life cycle cost analysis
In order to make comparative life cycle cost analysis of two alternative solutions, it is essen-tial that this comparison be made in present value of the monetary unit for all future costs. This provides a uniform criterion for making a comparison. Initial costs such as material production and construction always take place at the base year, which in this case was 2008. All other fu-ture costs at different phases of the bridge life such as operation and maintenance are dis-counted to their present value and added together to obtain the total life cycle cost of the bridge.
154
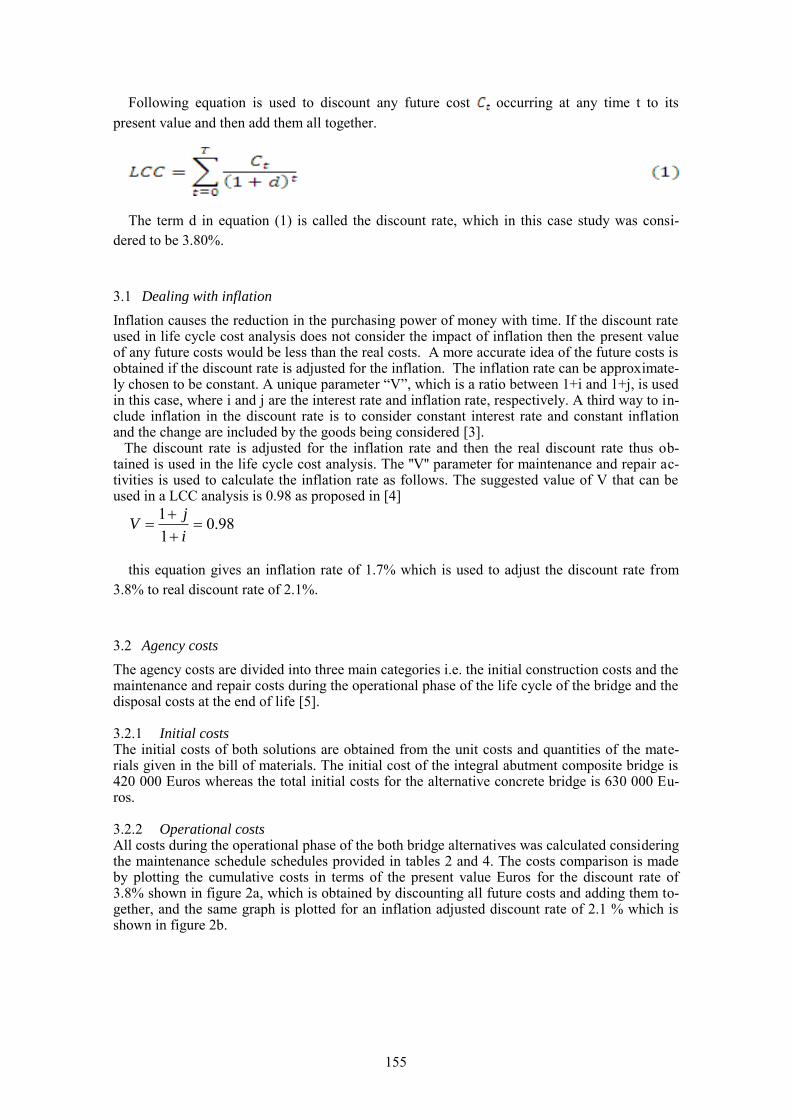
Following equation is used to discount any future cost occurring at any time t to its
present value and then add them all together.
The term d in equation (1) is called the discount rate, which in this case study was consi-
dered to be 3.80%.
3.1 Dealing with inflation
Inflation causes the reduction in the purchasing power of money with time. If the discount rate used in life cycle cost analysis does not consider the impact of inflation then the present value of any future costs would be less than the real costs. A more accurate idea of the future costs is obtained if the discount rate is adjusted for the inflation. The inflation rate can be approximate-ly chosen to be constant. A unique parameter “V”, which is a ratio between 1+i and 1+j, is used in this case, where i and j are the interest rate and inflation rate, respectively. A third way to in-clude inflation in the discount rate is to consider constant interest rate and constant inflation and the change are included by the goods being considered [3]. The discount rate is adjusted for the inflation rate and then the real discount rate thus ob-tained is used in the life cycle cost analysis. The ''V'' parameter for maintenance and repair ac-tivities is used to calculate the inflation rate as follows. The suggested value of V that can be used in a LCC analysis is 0.98 as proposed in [4]
98.01
1
i
jV
this equation gives an inflation rate of 1.7% which is used to adjust the discount rate from
3.8% to real discount rate of 2.1%.
3.2 Agency costs
The agency costs are divided into three main categories i.e. the initial construction costs and the maintenance and repair costs during the operational phase of the life cycle of the bridge and the disposal costs at the end of life [5].
3.2.1 Initial costs The initial costs of both solutions are obtained from the unit costs and quantities of the mate-rials given in the bill of materials. The initial cost of the integral abutment composite bridge is 420 000 Euros whereas the total initial costs for the alternative concrete bridge is 630 000 Eu-ros.
3.2.2 Operational costs All costs during the operational phase of the both bridge alternatives was calculated considering the maintenance schedule schedules provided in tables 2 and 4. The costs comparison is made by plotting the cumulative costs in terms of the present value Euros for the discount rate of 3.8% shown in figure 2a, which is obtained by discounting all future costs and adding them to-gether, and the same graph is plotted for an inflation adjusted discount rate of 2.1 % which is shown in figure 2b.
155
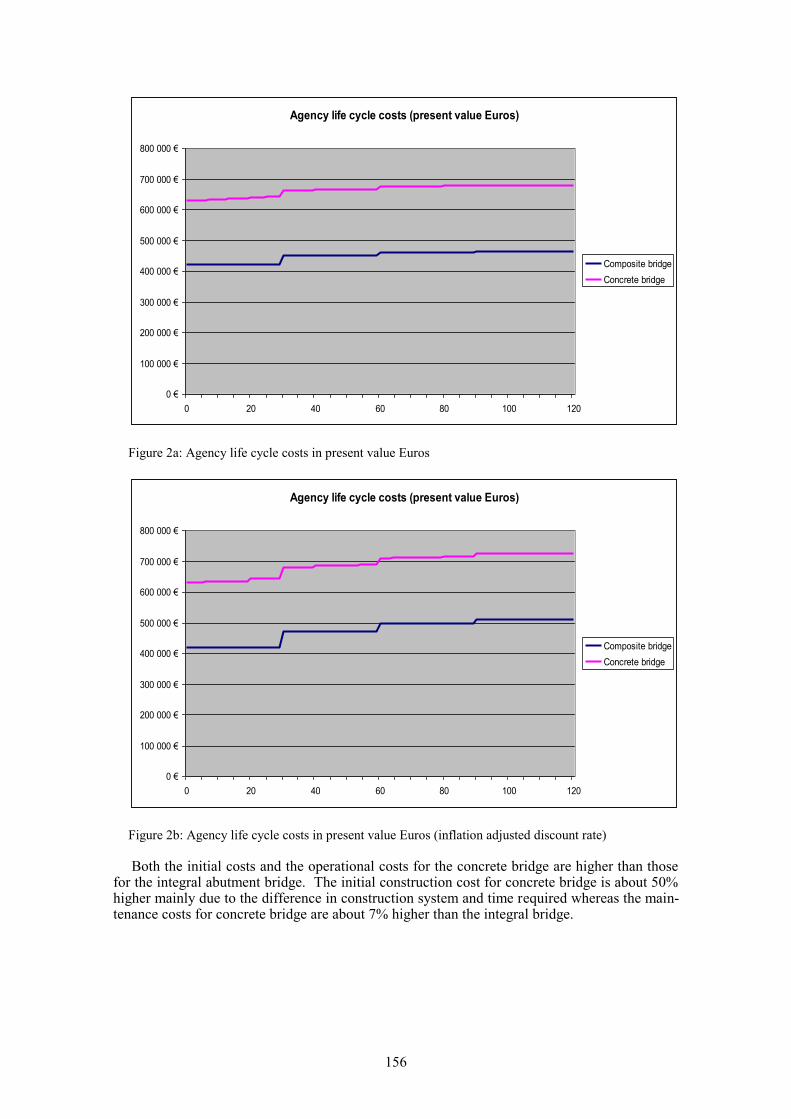
Agency life cycle costs (present value Euros)
0 €
100 000 €
200 000 €
300 000 €
400 000 €
500 000 €
600 000 €
700 000 €
800 000 €
0 20 40 60 80 100 120
Composite bridge
Concrete bridge
Figure 2a: Agency life cycle costs in present value Euros
Agency life cycle costs (present value Euros)
0 €
100 000 €
200 000 €
300 000 €
400 000 €
500 000 €
600 000 €
700 000 €
800 000 €
0 20 40 60 80 100 120
Composite bridge
Concrete bridge
Figure 2b: Agency life cycle costs in present value Euros (inflation adjusted discount rate)
Both the initial costs and the operational costs for the concrete bridge are higher than those for the integral abutment bridge. The initial construction cost for concrete bridge is about 50% higher mainly due to the difference in construction system and time required whereas the main-tenance costs for concrete bridge are about 7% higher than the integral bridge.
156
3.3 User costs
The impact on the users due to the bridge considered in this case study will only be during its operational phase. The major repairs and maintenance activities hinder the normal flow of traf-fic and therefore cause delay to the drivers as well as increase the likelihood of an accident. A computer program BridgeLCC[6] is used to calculate the costs due to traffic delay and acci-dents during road work activities.
Only two type of user costs have been considered in this study:
1. Driver delay costs
2. Accident costs
It is assumed that during maintenance activities one lane of the road is closed down and the other is open for the flow of traffic. The disruption caused to the normal flow of traffic is measured in terms of days and table 5 gives the details of these estimated times in days for var-ious maintenance activities for both bridge types.
Table 5: Time esitmated for maintenance activities
Bridge type Maintenance activity Time (days)
Composite bridge Exchange and repair of concrete 2
Concrete bridge Exchange and repair of concrete 2
Painting of bearings 1
Expansion joints:
Cleaning of joint 0.5
Cleaning of rubber band 1
Exchange of steel profile 1
To calculate the cost due to driver delay and accidents the following assumptions were taken for both alternatives:
Average daily traffic (ADT) in the base year of the study iss 5000 vehicles and its is as-
sumed to be growing exponentially at the rate of 0.5%;
The length of the roadway affected by the maintenance activities is 1.0 km;
Accident rate (per million vehicle-kilometer) under normal driving conditions is 1.9
which increases to 2.2 under workzone conditions;
Speed under normal driving conditions is 80 km/h and under workzone conditions it is
30 km/h;
The cost of driver delay is 5.00€ per hour and the cost per accident is 10000 €.
The cumulative costs in terms of present value euros both for the discount rate of 3.8% and
the inflation adjusted discount rate of 2.1% are presented in the graphs in figure 3 (a,b).
157
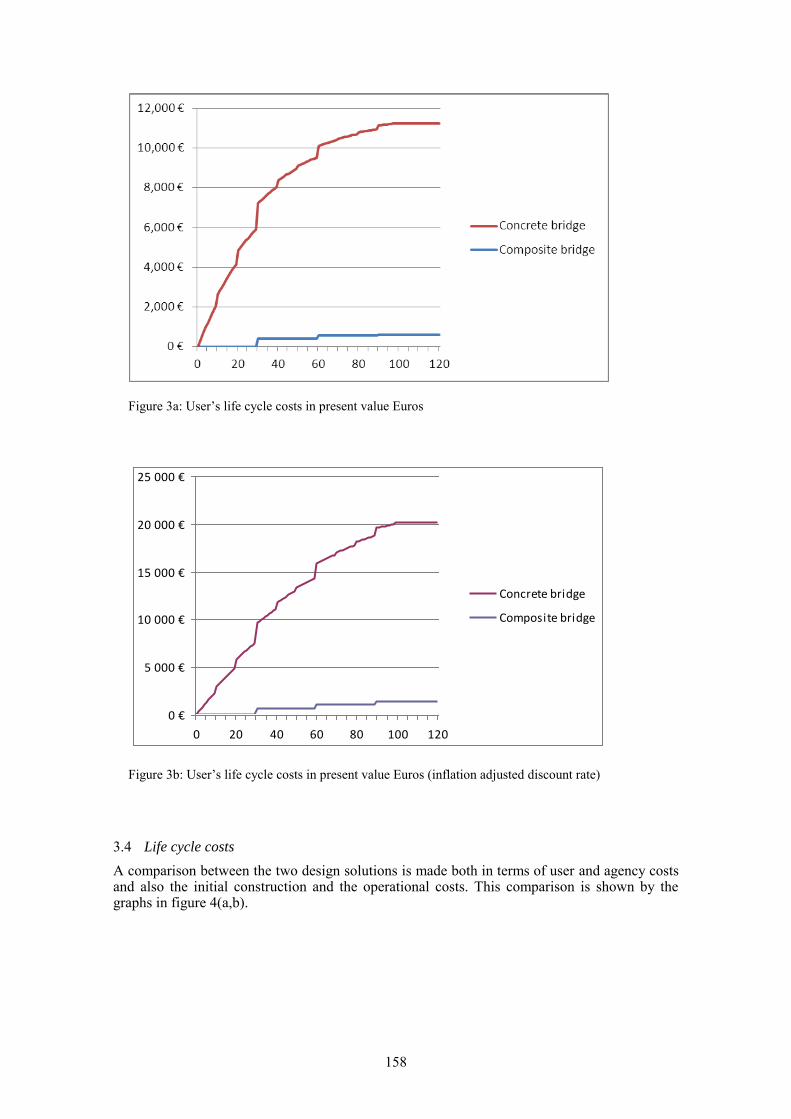
Figure 3a: User’s life cycle costs in present value Euros
0 €
5 000 €
10 000 €
15 000 €
20 000 €
25 000 €
0 20 40 60 80 100 120
Concrete bridge
Composite bridge
Figure 3b: User’s life cycle costs in present value Euros (inflation adjusted discount rate)
3.4 Life cycle costs
A comparison between the two design solutions is made both in terms of user and agency costs and also the initial construction and the operational costs. This comparison is shown by the graphs in figure 4(a,b).
158
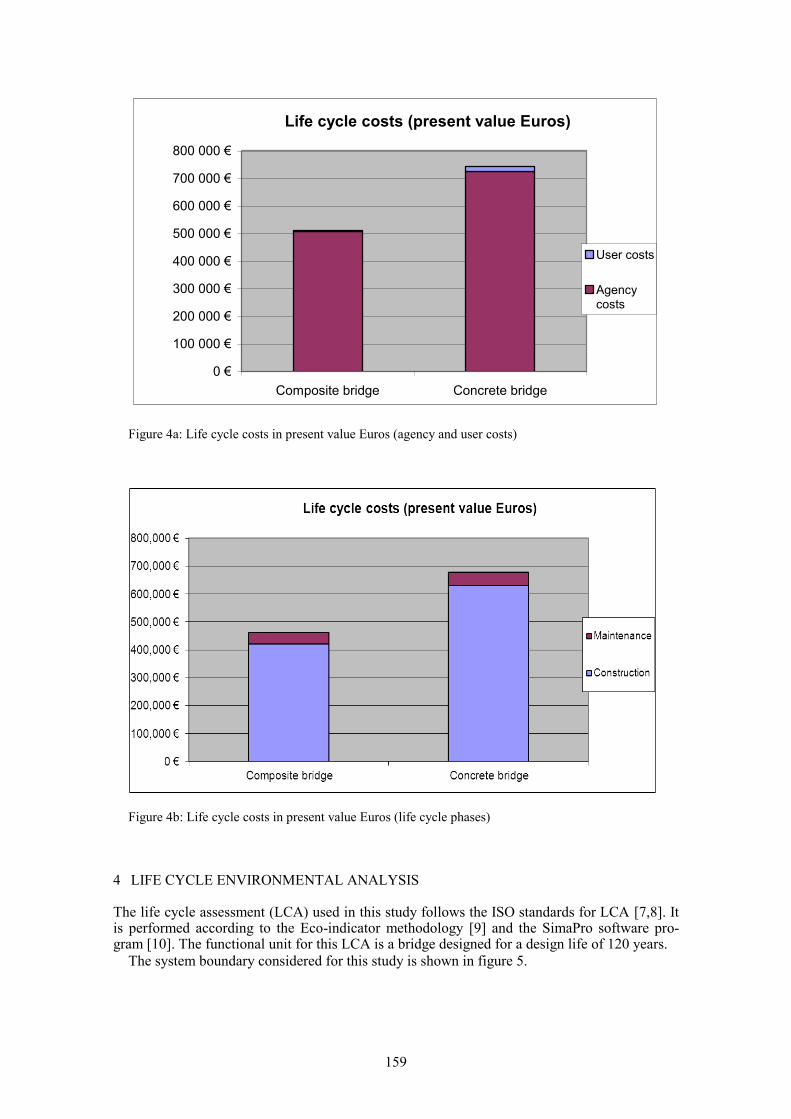
Life cycle costs (present value Euros)
0 €
100 000 €
200 000 €
300 000 €
400 000 €
500 000 €
600 000 €
700 000 €
800 000 €
Composite bridge Concrete bridge
User costs
Agencycosts
Figure 4a: Life cycle costs in present value Euros (agency and user costs)
Figure 4b: Life cycle costs in present value Euros (life cycle phases)
4 LIFE CYCLE ENVIRONMENTAL ANALYSIS
The life cycle assessment (LCA) used in this study follows the ISO standards for LCA [7,8]. It is performed according to the Eco-indicator methodology [9] and the SimaPro software pro-gram [10]. The functional unit for this LCA is a bridge designed for a design life of 120 years.
The system boundary considered for this study is shown in figure 5.
159
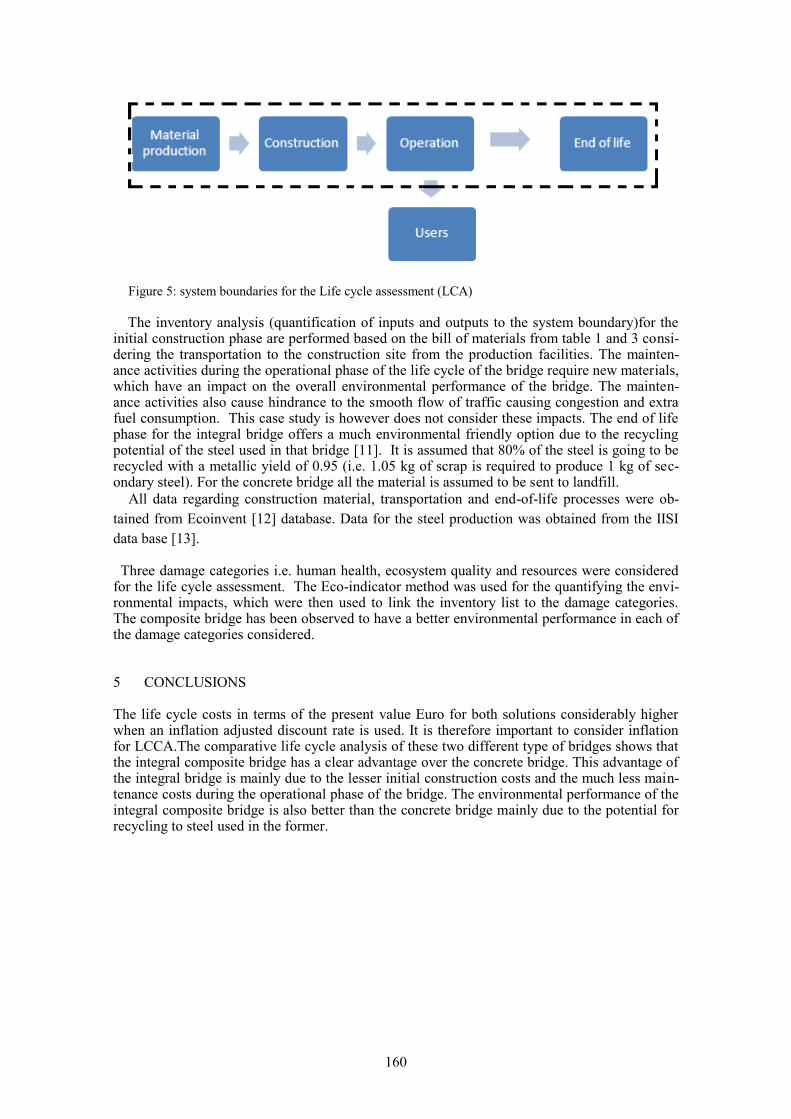
Figure 5: system boundaries for the Life cycle assessment (LCA)
The inventory analysis (quantification of inputs and outputs to the system boundary)for the initial construction phase are performed based on the bill of materials from table 1 and 3 consi-dering the transportation to the construction site from the production facilities. The mainten-ance activities during the operational phase of the life cycle of the bridge require new materials, which have an impact on the overall environmental performance of the bridge. The mainten-ance activities also cause hindrance to the smooth flow of traffic causing congestion and extra fuel consumption. This case study is however does not consider these impacts. The end of life phase for the integral bridge offers a much environmental friendly option due to the recycling potential of the steel used in that bridge [11]. It is assumed that 80% of the steel is going to be recycled with a metallic yield of 0.95 (i.e. 1.05 kg of scrap is required to produce 1 kg of sec-ondary steel). For the concrete bridge all the material is assumed to be sent to landfill.
All data regarding construction material, transportation and end-of-life processes were ob-
tained from Ecoinvent [12] database. Data for the steel production was obtained from the IISI
data base [13].
Three damage categories i.e. human health, ecosystem quality and resources were considered for the life cycle assessment. The Eco-indicator method was used for the quantifying the envi-ronmental impacts, which were then used to link the inventory list to the damage categories. The composite bridge has been observed to have a better environmental performance in each of the damage categories considered.
5 CONCLUSIONS
The life cycle costs in terms of the present value Euro for both solutions considerably higher when an inflation adjusted discount rate is used. It is therefore important to consider inflation for LCCA.The comparative life cycle analysis of these two different type of bridges shows that the integral composite bridge has a clear advantage over the concrete bridge. This advantage of the integral bridge is mainly due to the lesser initial construction costs and the much less main-tenance costs during the operational phase of the bridge. The environmental performance of the integral composite bridge is also better than the concrete bridge mainly due to the potential for recycling to steel used in the former.
160
REFERENCES
[1] Gervasio H. et. al. ''Comparative life cycle analysis of an integral abutment composite bridge and a
concrete bridge with expansion joints''. 7th international conference on Steel bridges.
[2] Nilsson M. “Evaluation of In-situ Measurements of Composite Bridge with integral abutments”, Li-
centiate Thesis, Lulea University of Technology, Lulea, Sweden, 2008.
[3] Ditrani M. “Improving Transportation Investment Decision Through Life-Cycle Cost Analysis –
Case Study on some Bridges in the North of Sweden”.
[4] Ditrani M. “Improving Transportation Investment Decision Through Life-Cycle Cost Analysis-
comparative LCCA of bridges'', masters Thesis, Lulea University of Technology, Lulea, Sweden,
2008
[5] Gervasio, H. Smoes da Silva, L. “Comparative life-cycle analysis of steel-concrete composite
bridges”, in Structure and Infrastructure Engineering: Maintenance, Management, Life-Cycle De-
sign and Performance, pp. 1-17, 2007.
[6] Ehlen M. “BridgeLCC 2.0 User’s Manual”, NISTIR 6298, Gaithersburg, MD: National Institute
of Standard and Technology, 2003.
[7] ISO 14040. “Environmental management-life cycle assessment-Principles and framework”, Inter-
national Organization for Standardization, Geneva, Switzerland, 2006
[8] ISO 14040. “Environmental management-life cycle assessment-Requirements and guidelines”, In-
ternational Organization for Standardization, Geneva, Switzerland, 2006
[9] Goedkoop M and Spriensma R. “The Eco-indicator 99. A damage oriented method for Life Cycle
Impact Assessment”, Pre Consultants, Amersfoort, The Netherlands, 2000.
[10] SimaPro 7. “Software and database manual”, Pre Consultants, Amersfoort, The Netherlands, 2008.
[11] Gervasio, H. and Simoes da Silva, L. “Influence of end-of-life scenarios on the environmental per-
formance of a low-rise residential dwelling”, in L. Branganca, M. Pinheiro, S. Jaladi, R. Mateus,
R. Amoeda, M. Guedes (eds.), Proceedings of SB07-International Conference on Sustainable Build-
ing, pp 1126-1133, Lisboa, Portugal, 12-14 September, 2007.
[12] Ecoinvent Centre, “Ecoinvent data v2.0. Ecoinvent reports 2000 No. 1-25”, Swiss Centre for Life
Cycle Inventories, Dubendorf, 2007. Retrieved from: www.ecoinvent.org.
[13] International Iron and Steel Institute (IISI), “World Steel Life Cycle Inventory. Methodology report
1999/2000”, Committee on environmental affairs, Brussels, Belgium, 2002.
161

162
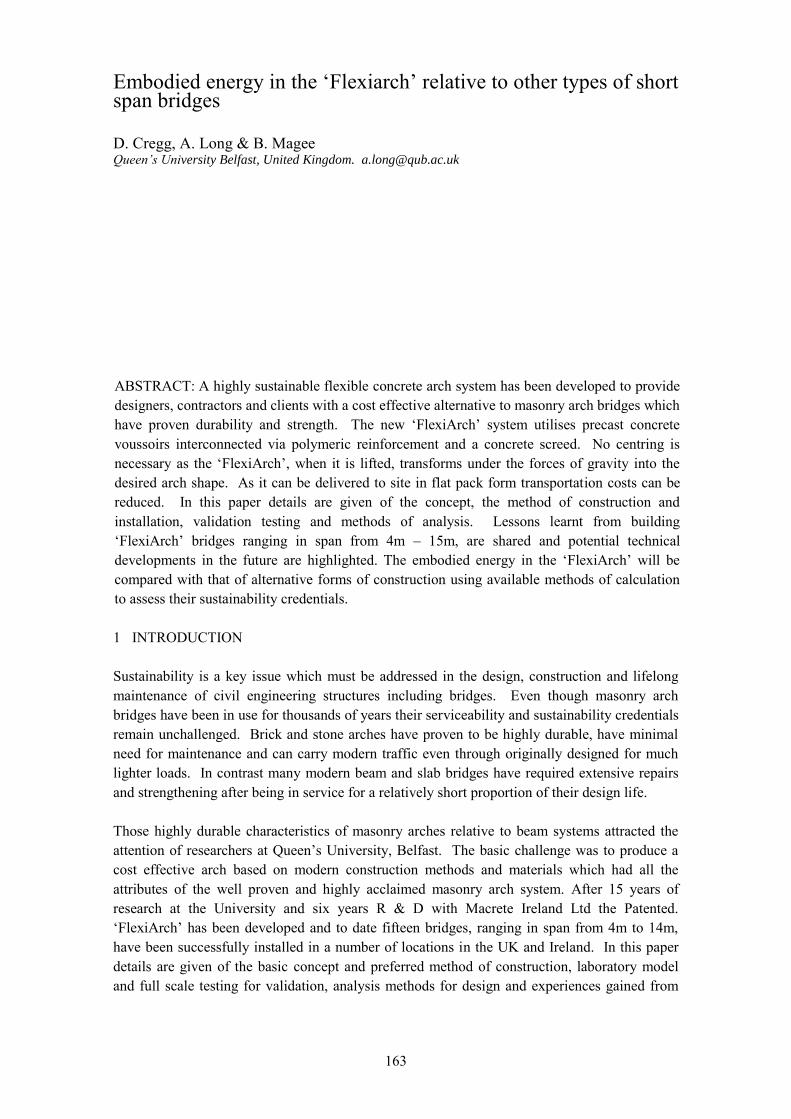
1 INTRODUCTION
Sustainability is a key issue which must be addressed in the design, construction and lifelong
maintenance of civil engineering structures including bridges. Even though masonry arch
bridges have been in use for thousands of years their serviceability and sustainability credentials
remain unchallenged. Brick and stone arches have proven to be highly durable, have minimal
need for maintenance and can carry modern traffic even through originally designed for much
lighter loads. In contrast many modern beam and slab bridges have required extensive repairs
and strengthening after being in service for a relatively short proportion of their design life.
Those highly durable characteristics of masonry arches relative to beam systems attracted the
attention of researchers at Queen‟s University, Belfast. The basic challenge was to produce a
cost effective arch based on modern construction methods and materials which had all the
attributes of the well proven and highly acclaimed masonry arch system. After 15 years of
research at the University and six years R & D with Macrete Ireland Ltd the Patented.
„FlexiArch‟ has been developed and to date fifteen bridges, ranging in span from 4m to 14m,
have been successfully installed in a number of locations in the UK and Ireland. In this paper
details are given of the basic concept and preferred method of construction, laboratory model
and full scale testing for validation, analysis methods for design and experiences gained from
Embodied energy in the „Flexiarch‟ relative to other types of short span bridges
D. Cregg, A. Long & B. Magee Queen’s University Belfast, United Kingdom. [email protected]
ABSTRACT: A highly sustainable flexible concrete arch system has been developed to provide
designers, contractors and clients with a cost effective alternative to masonry arch bridges which
have proven durability and strength. The new „FlexiArch‟ system utilises precast concrete
voussoirs interconnected via polymeric reinforcement and a concrete screed. No centring is
necessary as the „FlexiArch‟, when it is lifted, transforms under the forces of gravity into the
desired arch shape. As it can be delivered to site in flat pack form transportation costs can be
reduced. In this paper details are given of the concept, the method of construction and
installation, validation testing and methods of analysis. Lessons learnt from building
„FlexiArch‟ bridges ranging in span from 4m – 15m, are shared and potential technical
developments in the future are highlighted. The embodied energy in the „FlexiArch‟ will be
compared with that of alternative forms of construction using available methods of calculation
to assess their sustainability credentials.
163
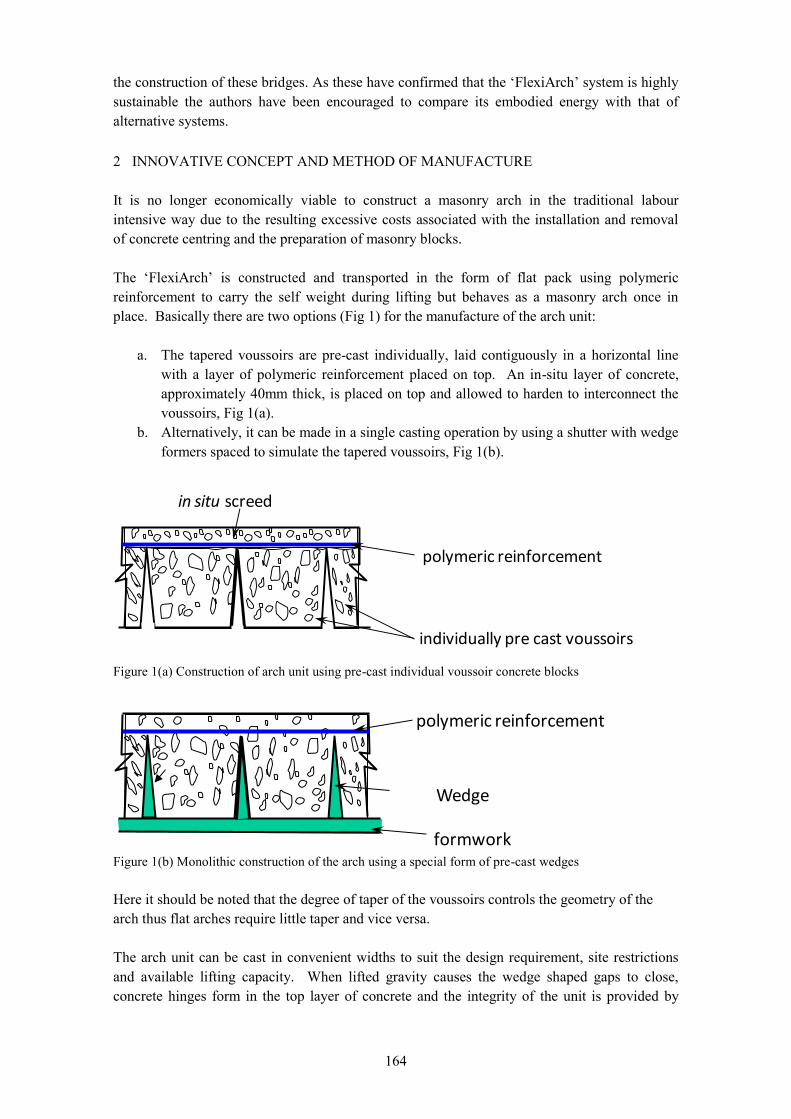
the construction of these bridges. As these have confirmed that the „FlexiArch‟ system is highly
sustainable the authors have been encouraged to compare its embodied energy with that of
alternative systems.
2 INNOVATIVE CONCEPT AND METHOD OF MANUFACTURE
It is no longer economically viable to construct a masonry arch in the traditional labour
intensive way due to the resulting excessive costs associated with the installation and removal
of concrete centring and the preparation of masonry blocks.
The „FlexiArch‟ is constructed and transported in the form of flat pack using polymeric
reinforcement to carry the self weight during lifting but behaves as a masonry arch once in
place. Basically there are two options (Fig 1) for the manufacture of the arch unit:
a. The tapered voussoirs are pre-cast individually, laid contiguously in a horizontal line
with a layer of polymeric reinforcement placed on top. An in-situ layer of concrete,
approximately 40mm thick, is placed on top and allowed to harden to interconnect the
voussoirs, Fig 1(a).
b. Alternatively, it can be made in a single casting operation by using a shutter with wedge
formers spaced to simulate the tapered voussoirs, Fig 1(b).
individually pre cast voussoirs
in situ screed
polymeric reinforcement
Figure 1(a) Construction of arch unit using pre-cast individual voussoir concrete blocks
formwork
Wedge
polymeric reinforcement
Figure 1(b) Monolithic construction of the arch using a special form of pre-cast wedges
Here it should be noted that the degree of taper of the voussoirs controls the geometry of the
arch thus flat arches require little taper and vice versa.
The arch unit can be cast in convenient widths to suit the design requirement, site restrictions
and available lifting capacity. When lifted gravity causes the wedge shaped gaps to close,
concrete hinges form in the top layer of concrete and the integrity of the unit is provided by
164
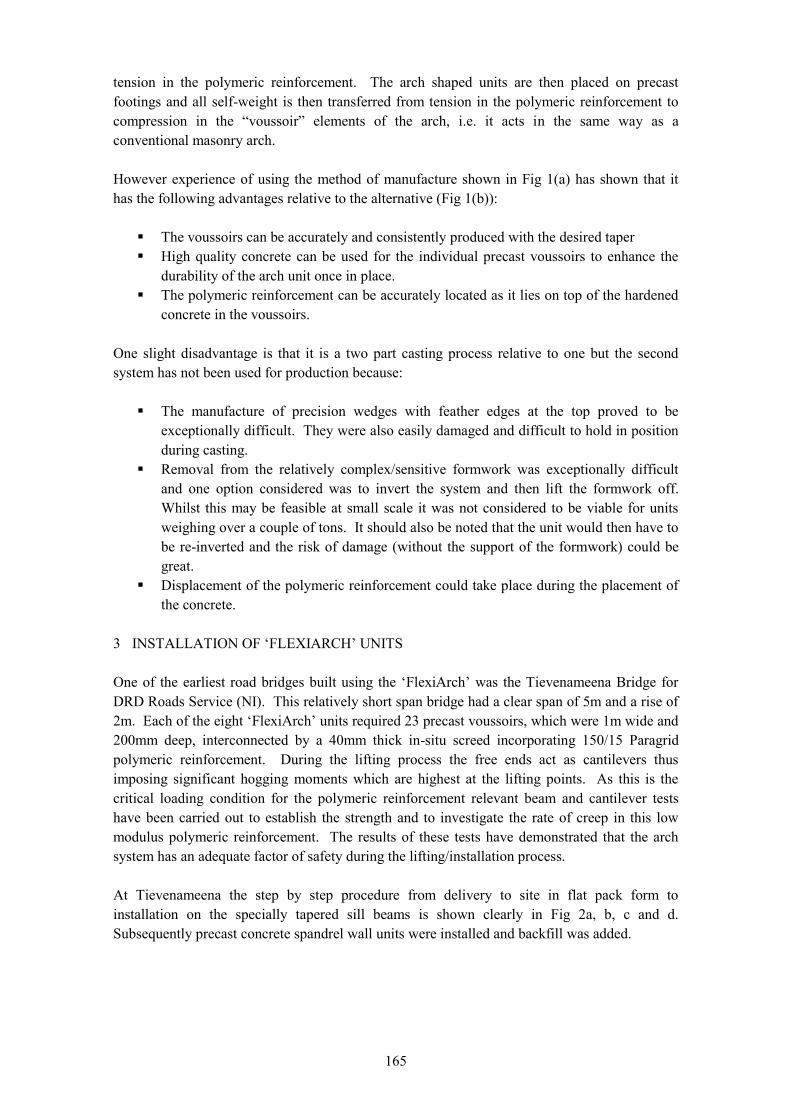
tension in the polymeric reinforcement. The arch shaped units are then placed on precast
footings and all self-weight is then transferred from tension in the polymeric reinforcement to
compression in the “voussoir” elements of the arch, i.e. it acts in the same way as a
conventional masonry arch.
However experience of using the method of manufacture shown in Fig 1(a) has shown that it
has the following advantages relative to the alternative (Fig 1(b)):
The voussoirs can be accurately and consistently produced with the desired taper
High quality concrete can be used for the individual precast voussoirs to enhance the
durability of the arch unit once in place.
The polymeric reinforcement can be accurately located as it lies on top of the hardened
concrete in the voussoirs.
One slight disadvantage is that it is a two part casting process relative to one but the second
system has not been used for production because:
The manufacture of precision wedges with feather edges at the top proved to be
exceptionally difficult. They were also easily damaged and difficult to hold in position
during casting.
Removal from the relatively complex/sensitive formwork was exceptionally difficult
and one option considered was to invert the system and then lift the formwork off.
Whilst this may be feasible at small scale it was not considered to be viable for units
weighing over a couple of tons. It should also be noted that the unit would then have to
be re-inverted and the risk of damage (without the support of the formwork) could be
great.
Displacement of the polymeric reinforcement could take place during the placement of
the concrete.
3 INSTALLATION OF „FLEXIARCH‟ UNITS
One of the earliest road bridges built using the „FlexiArch‟ was the Tievenameena Bridge for
DRD Roads Service (NI). This relatively short span bridge had a clear span of 5m and a rise of
2m. Each of the eight „FlexiArch‟ units required 23 precast voussoirs, which were 1m wide and
200mm deep, interconnected by a 40mm thick in-situ screed incorporating 150/15 Paragrid
polymeric reinforcement. During the lifting process the free ends act as cantilevers thus
imposing significant hogging moments which are highest at the lifting points. As this is the
critical loading condition for the polymeric reinforcement relevant beam and cantilever tests
have been carried out to establish the strength and to investigate the rate of creep in this low
modulus polymeric reinforcement. The results of these tests have demonstrated that the arch
system has an adequate factor of safety during the lifting/installation process.
At Tievenameena the step by step procedure from delivery to site in flat pack form to
installation on the specially tapered sill beams is shown clearly in Fig 2a, b, c and d.
Subsequently precast concrete spandrel wall units were installed and backfill was added.
165
Figure 2a „Flat-Pack‟ arch system Figure 2b Arch unit during lifting
Figure 2c Transfer to bridge location Figure 2d Locating unit on precast sill beams
4 VALIDATION
4.1 Validation tests
Even though the „FlexiArch‟ system has all the characteristics of a conventional masonry arch it
was decided that a thorough testing programme should be carried out to demonstrate its
strength/stiffness and viability for a range of applications.
Model tests (mostly third scale) were carried out in the laboratory and these allowed the
ultimate capacities and stiffness to be determined. Both conventional granular backfill and lean
mix concrete (preferred system for arches up to 6m span) were assessed for the following
prototypes (5m x2m rise, 8m x 3m rise and 10m x 2m rise). The results were in line with those
for conventional arches.
In parallel it was decided that full scale tests should be carried out mostly at the precasting
facility in Toomebirdge. These FlexiArch‟ systems were constructed by Macrete to the same
rigorous standards used for all their commercial products. At full scale the loading on the units
during lifting, backfilling and under applied loads accurately simulated those which would
occur in practice.
Macrete supplied the test sites, the kentledge and loading beams which allowed point loads of
up to 74t to be applied using hydraulic jacks. The University calibrated the hydraulic jacks,
166
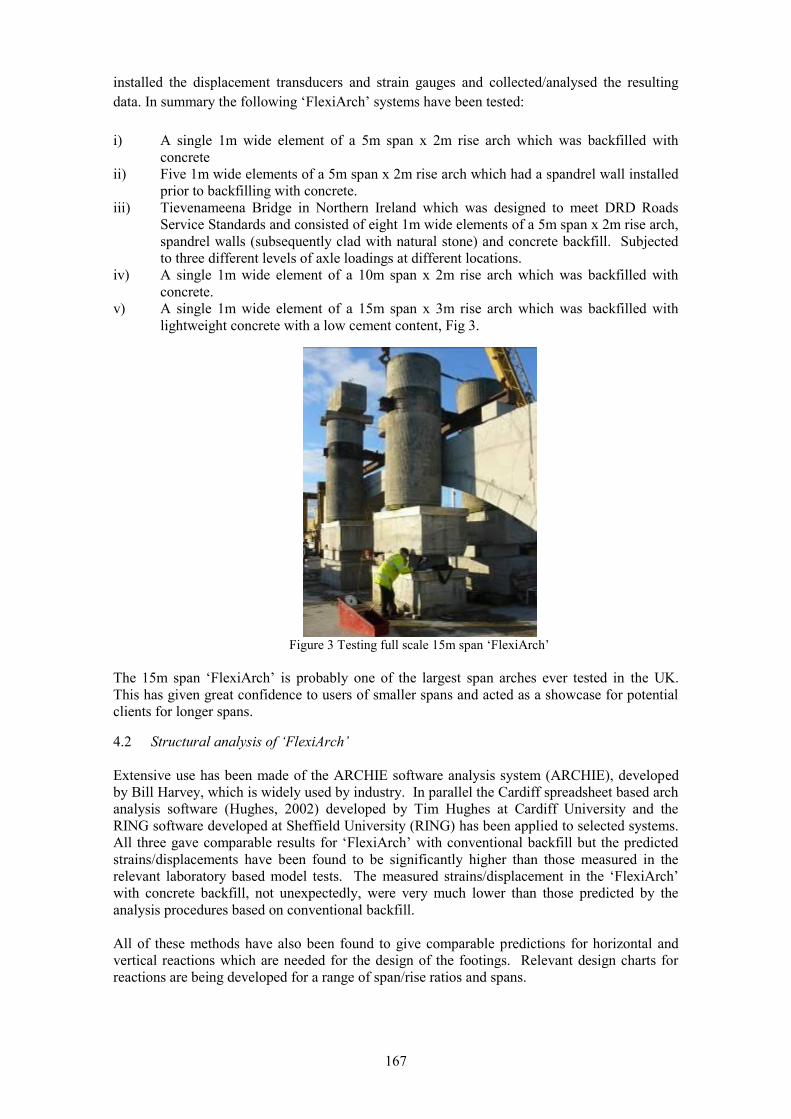
installed the displacement transducers and strain gauges and collected/analysed the resulting
data. In summary the following „FlexiArch‟ systems have been tested:
i) A single 1m wide element of a 5m span x 2m rise arch which was backfilled with
concrete
ii) Five 1m wide elements of a 5m span x 2m rise arch which had a spandrel wall installed
prior to backfilling with concrete.
iii) Tievenameena Bridge in Northern Ireland which was designed to meet DRD Roads
Service Standards and consisted of eight 1m wide elements of a 5m span x 2m rise arch,
spandrel walls (subsequently clad with natural stone) and concrete backfill. Subjected
to three different levels of axle loadings at different locations.
iv) A single 1m wide element of a 10m span x 2m rise arch which was backfilled with
concrete.
v) A single 1m wide element of a 15m span x 3m rise arch which was backfilled with
lightweight concrete with a low cement content, Fig 3.
Figure 3 Testing full scale 15m span „FlexiArch‟
The 15m span „FlexiArch‟ is probably one of the largest span arches ever tested in the UK.
This has given great confidence to users of smaller spans and acted as a showcase for potential
clients for longer spans.
4.2 Structural analysis of ‘FlexiArch’
Extensive use has been made of the ARCHIE software analysis system (ARCHIE), developed
by Bill Harvey, which is widely used by industry. In parallel the Cardiff spreadsheet based arch
analysis software (Hughes, 2002) developed by Tim Hughes at Cardiff University and the
RING software developed at Sheffield University (RING) has been applied to selected systems.
All three gave comparable results for „FlexiArch‟ with conventional backfill but the predicted
strains/displacements have been found to be significantly higher than those measured in the
relevant laboratory based model tests. The measured strains/displacement in the „FlexiArch‟
with concrete backfill, not unexpectedly, were very much lower than those predicted by the
analysis procedures based on conventional backfill.
All of these methods have also been found to give comparable predictions for horizontal and
vertical reactions which are needed for the design of the footings. Relevant design charts for
reactions are being developed for a range of span/rise ratios and spans.
167
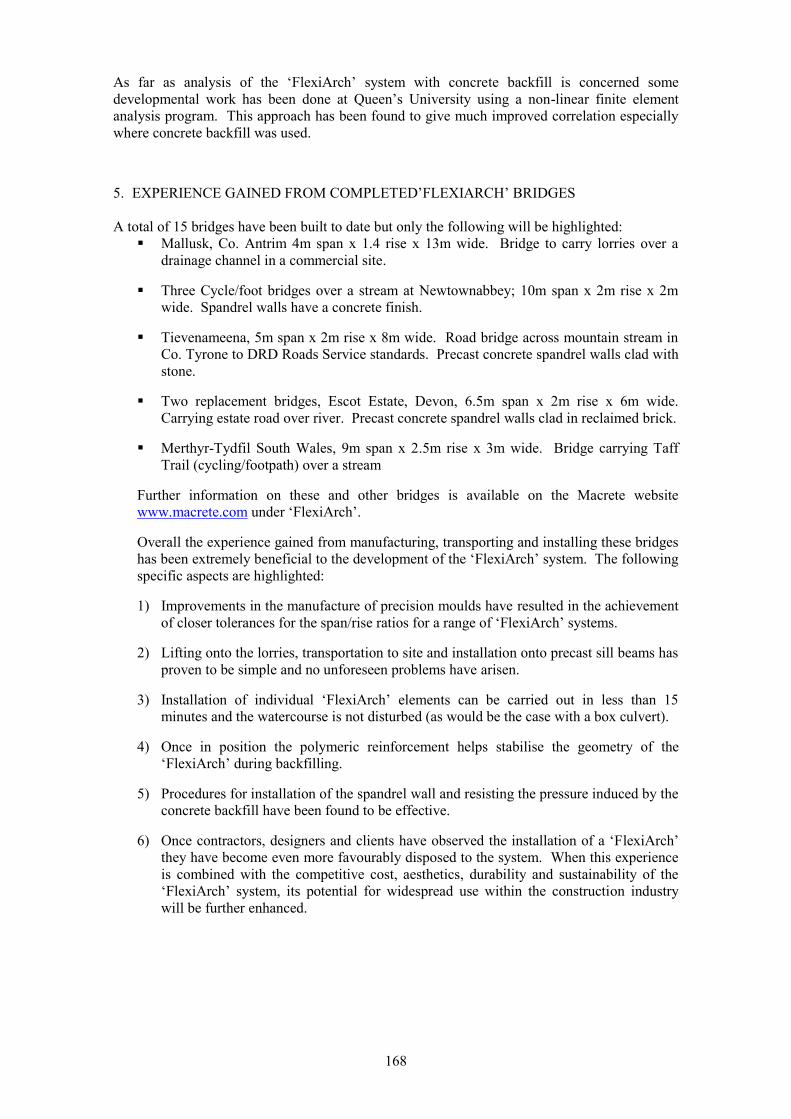
As far as analysis of the „FlexiArch‟ system with concrete backfill is concerned some
developmental work has been done at Queen‟s University using a non-linear finite element
analysis program. This approach has been found to give much improved correlation especially
where concrete backfill was used.
5. EXPERIENCE GAINED FROM COMPLETED‟FLEXIARCH‟ BRIDGES
A total of 15 bridges have been built to date but only the following will be highlighted:
Mallusk, Co. Antrim 4m span x 1.4 rise x 13m wide. Bridge to carry lorries over a
drainage channel in a commercial site.
Three Cycle/foot bridges over a stream at Newtownabbey; 10m span x 2m rise x 2m
wide. Spandrel walls have a concrete finish.
Tievenameena, 5m span x 2m rise x 8m wide. Road bridge across mountain stream in
Co. Tyrone to DRD Roads Service standards. Precast concrete spandrel walls clad with
stone.
Two replacement bridges, Escot Estate, Devon, 6.5m span x 2m rise x 6m wide.
Carrying estate road over river. Precast concrete spandrel walls clad in reclaimed brick.
Merthyr-Tydfil South Wales, 9m span x 2.5m rise x 3m wide. Bridge carrying Taff
Trail (cycling/footpath) over a stream
Further information on these and other bridges is available on the Macrete website
www.macrete.com under „FlexiArch‟.
Overall the experience gained from manufacturing, transporting and installing these bridges
has been extremely beneficial to the development of the „FlexiArch‟ system. The following
specific aspects are highlighted:
1) Improvements in the manufacture of precision moulds have resulted in the achievement
of closer tolerances for the span/rise ratios for a range of „FlexiArch‟ systems.
2) Lifting onto the lorries, transportation to site and installation onto precast sill beams has
proven to be simple and no unforeseen problems have arisen.
3) Installation of individual „FlexiArch‟ elements can be carried out in less than 15
minutes and the watercourse is not disturbed (as would be the case with a box culvert).
4) Once in position the polymeric reinforcement helps stabilise the geometry of the
„FlexiArch‟ during backfilling.
5) Procedures for installation of the spandrel wall and resisting the pressure induced by the
concrete backfill have been found to be effective.
6) Once contractors, designers and clients have observed the installation of a „FlexiArch‟
they have become even more favourably disposed to the system. When this experience
is combined with the competitive cost, aesthetics, durability and sustainability of the
„FlexiArch‟ system, its potential for widespread use within the construction industry
will be further enhanced.
168
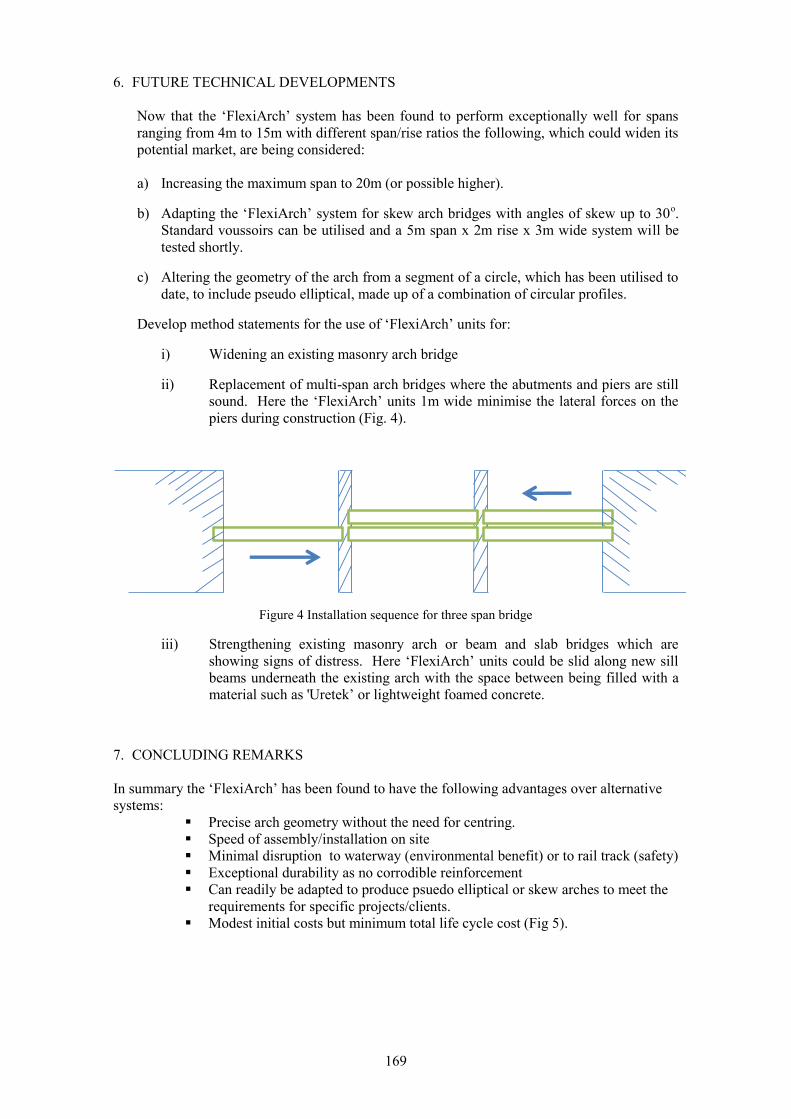
6. FUTURE TECHNICAL DEVELOPMENTS
Now that the „FlexiArch‟ system has been found to perform exceptionally well for spans
ranging from 4m to 15m with different span/rise ratios the following, which could widen its
potential market, are being considered:
a) Increasing the maximum span to 20m (or possible higher).
b) Adapting the „FlexiArch‟ system for skew arch bridges with angles of skew up to 30o.
Standard voussoirs can be utilised and a 5m span x 2m rise x 3m wide system will be
tested shortly.
c) Altering the geometry of the arch from a segment of a circle, which has been utilised to
date, to include pseudo elliptical, made up of a combination of circular profiles.
Develop method statements for the use of „FlexiArch‟ units for:
i) Widening an existing masonry arch bridge
ii) Replacement of multi-span arch bridges where the abutments and piers are still
sound. Here the „FlexiArch‟ units 1m wide minimise the lateral forces on the
piers during construction (Fig. 4).
Figure 4 Installation sequence for three span bridge
iii) Strengthening existing masonry arch or beam and slab bridges which are
showing signs of distress. Here „FlexiArch‟ units could be slid along new sill
beams underneath the existing arch with the space between being filled with a
material such as 'Uretek‟ or lightweight foamed concrete.
7. CONCLUDING REMARKS
In summary the „FlexiArch‟ has been found to have the following advantages over alternative
systems:
Precise arch geometry without the need for centring.
Speed of assembly/installation on site
Minimal disruption to waterway (environmental benefit) or to rail track (safety)
Exceptional durability as no corrodible reinforcement
Can readily be adapted to produce psuedo elliptical or skew arches to meet the
requirements for specific projects/clients.
Modest initial costs but minimum total life cycle cost (Fig 5).
169
Figure 5 Initial/whole life cycle costs of alternative systems
Considerable development has taken place since 2006 (Taylor, et. al., 2006) and in this
presentation initial estimates of the embodied energy in the „FlexiArch‟ will be compared with
those for alternative forms of constructions (such as box culverts, beam and slab systems) used
for short span bridges. Available methods of calculation of the embodied energy – carbon
footprint have been applied in order to assess the sustainability credentials of the various
systems. Consideration has also been given to the method of construction, site preparation
required, ease of transportation and speed of installation.
8. ACKNOWLEDGEMENTS
The financial support provided by ICE, KTP, Invest Northern Ireland, DRD Roads Service and
the Leverhulme Trust is gratefully acknowledged.
REFERENCES
ARCHIE – M, a unique masonry arch bridge and viaduct assessment tool, OBVIS Ltd, Exeter UK,
HUGHES T. G. 2002. Load carrying capacity of masonry arch bridges estimated from multi-span model
tests, Proc. ICE, Structures and Buildings, pp 407-8.
RING 2 - a rapid analysis tool for masonry arch bridges, University of Sheffield, [email protected].
Taylor, S.E., Gupta, A., Kirkpatrick, J., Long, A.E, Rankin, G.I.B. and Hogg, I., 2006. “Development of a
novel flexible concrete arch system” Proc. Inter. Conf. on Structural Faults and Repairs, Edinburgh,
June.
170
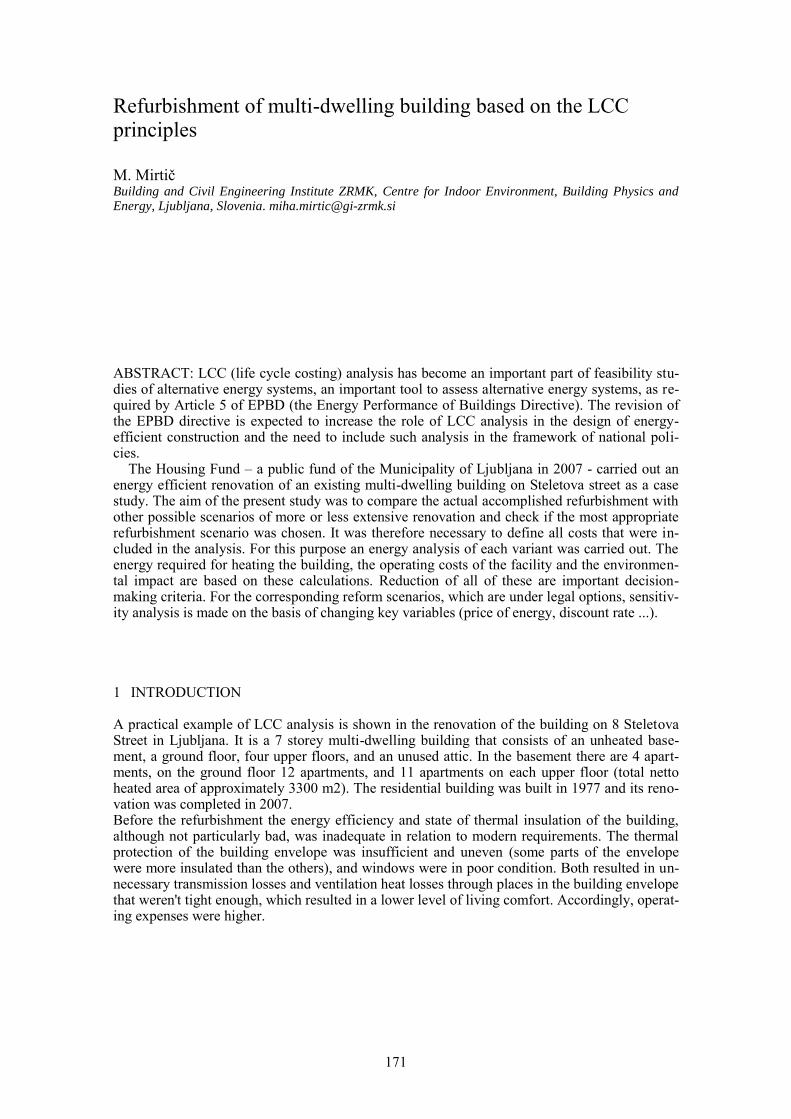
1 INTRODUCTION A practical example of LCC analysis is shown in the renovation of the building on 8 Steletova Street in Ljubljana. It is a 7 storey multi-dwelling building that consists of an unheated base-ment, a ground floor, four upper floors, and an unused attic. In the basement there are 4 apart-ments, on the ground floor 12 apartments, and 11 apartments on each upper floor (total netto heated area of approximately 3300 m2). The residential building was built in 1977 and its reno-vation was completed in 2007. Before the refurbishment the energy efficiency and state of thermal insulation of the building, although not particularly bad, was inadequate in relation to modern requirements. The thermal protection of the building envelope was insufficient and uneven (some parts of the envelope were more insulated than the others), and windows were in poor condition. Both resulted in un-necessary transmission losses and ventilation heat losses through places in the building envelope that weren't tight enough, which resulted in a lower level of living comfort. Accordingly, operat-ing expenses were higher.
Refurbishment of multi-dwelling building based on the LCC principles
M. Mirtič Building and Civil Engineering Institute ZRMK, Centre for Indoor Environment, Building Physics and Energy, Ljubljana, Slovenia. [email protected]
ABSTRACT: LCC (life cycle costing) analysis has become an important part of feasibility stu-dies of alternative energy systems, an important tool to assess alternative energy systems, as re-quired by Article 5 of EPBD (the Energy Performance of Buildings Directive). The revision of the EPBD directive is expected to increase the role of LCC analysis in the design of energy-efficient construction and the need to include such analysis in the framework of national poli-cies.
The Housing Fund – a public fund of the Municipality of Ljubljana in 2007 - carried out an energy efficient renovation of an existing multi-dwelling building on Steletova street as a case study. The aim of the present study was to compare the actual accomplished refurbishment with other possible scenarios of more or less extensive renovation and check if the most appropriate refurbishment scenario was chosen. It was therefore necessary to define all costs that were in-cluded in the analysis. For this purpose an energy analysis of each variant was carried out. The energy required for heating the building, the operating costs of the facility and the environmen-tal impact are based on these calculations. Reduction of all of these are important decision-making criteria. For the corresponding reform scenarios, which are under legal options, sensitiv-ity analysis is made on the basis of changing key variables (price of energy, discount rate ...).
171
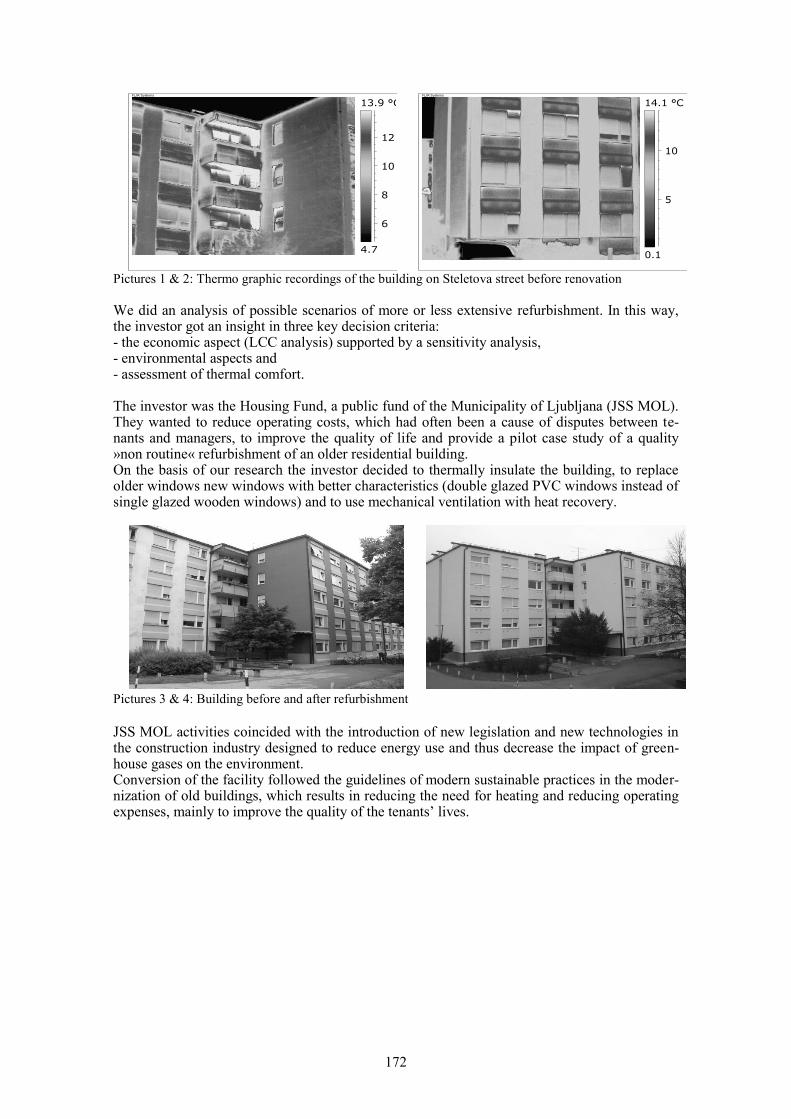
sp1
4.7
13.9 °C
6
8
10
12
FLIR Systems
0.1
14.1 °C
5
10
FLIR Systems
Pictures 1 & 2: Thermo graphic recordings of the building on Steletova street before renovation
We did an analysis of possible scenarios of more or less extensive refurbishment. In this way, the investor got an insight in three key decision criteria: - the economic aspect (LCC analysis) supported by a sensitivity analysis, - environmental aspects and - assessment of thermal comfort. The investor was the Housing Fund, a public fund of the Municipality of Ljubljana (JSS MOL). They wanted to reduce operating costs, which had often been a cause of disputes between te-nants and managers, to improve the quality of life and provide a pilot case study of a quality »non routine« refurbishment of an older residential building. On the basis of our research the investor decided to thermally insulate the building, to replace older windows new windows with better characteristics (double glazed PVC windows instead of single glazed wooden windows) and to use mechanical ventilation with heat recovery.
Pictures 3 & 4: Building before and after refurbishment
JSS MOL activities coincided with the introduction of new legislation and new technologies in the construction industry designed to reduce energy use and thus decrease the impact of green-house gases on the environment. Conversion of the facility followed the guidelines of modern sustainable practices in the moder-nization of old buildings, which results in reducing the need for heating and reducing operating expenses, mainly to improve the quality of the tenants’ lives.
172
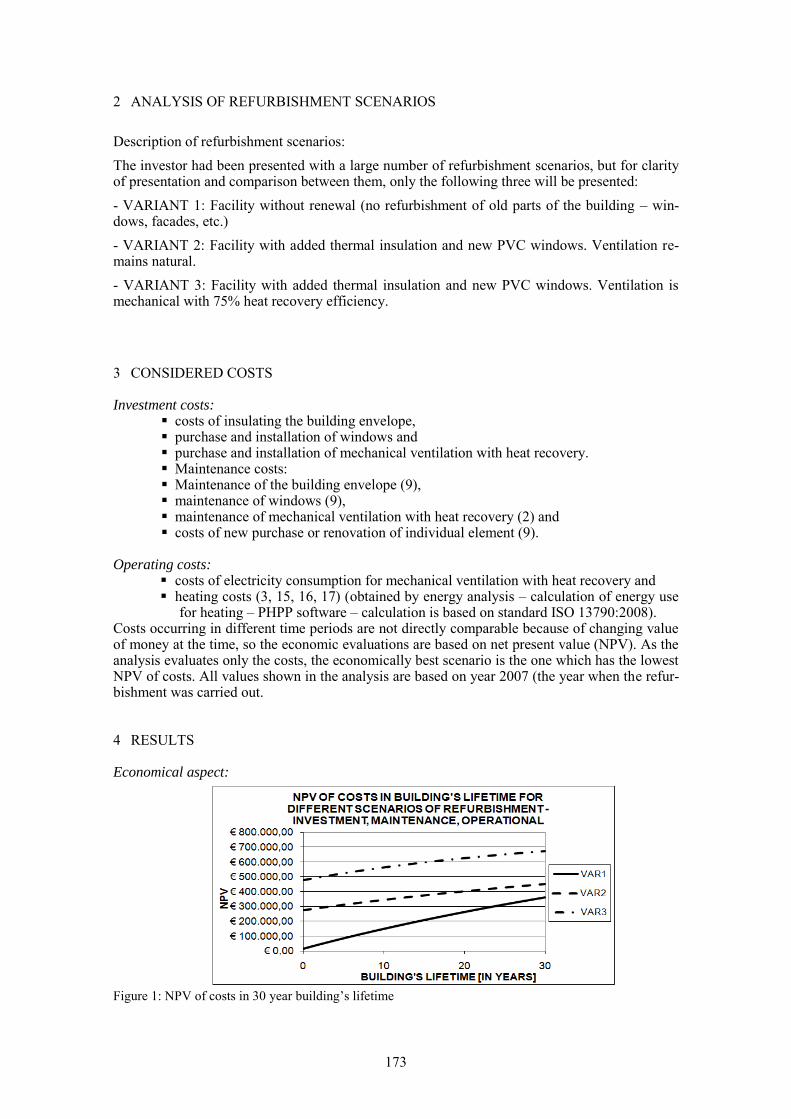
2 ANALYSIS OF REFURBISHMENT SCENARIOS
Description of refurbishment scenarios:
The investor had been presented with a large number of refurbishment scenarios, but for clarity of presentation and comparison between them, only the following three will be presented:
- VARIANT 1: Facility without renewal (no refurbishment of old parts of the building – win-dows, facades, etc.)
- VARIANT 2: Facility with added thermal insulation and new PVC windows. Ventilation re-mains natural.
- VARIANT 3: Facility with added thermal insulation and new PVC windows. Ventilation is mechanical with 75% heat recovery efficiency.
3 CONSIDERED COSTS Investment costs:
costs of insulating the building envelope, purchase and installation of windows and purchase and installation of mechanical ventilation with heat recovery. Maintenance costs: Maintenance of the building envelope (9), maintenance of windows (9), maintenance of mechanical ventilation with heat recovery (2) and costs of new purchase or renovation of individual element (9).
Operating costs:
costs of electricity consumption for mechanical ventilation with heat recovery and heating costs (3, 15, 16, 17) (obtained by energy analysis – calculation of energy use
for heating – PHPP software – calculation is based on standard ISO 13790:2008). Costs occurring in different time periods are not directly comparable because of changing value of money at the time, so the economic evaluations are based on net present value (NPV). As the analysis evaluates only the costs, the economically best scenario is the one which has the lowest NPV of costs. All values shown in the analysis are based on year 2007 (the year when the refur-bishment was carried out.
4 RESULTS Economical aspect:
Figure 1: NPV of costs in 30 year building’s lifetime
173
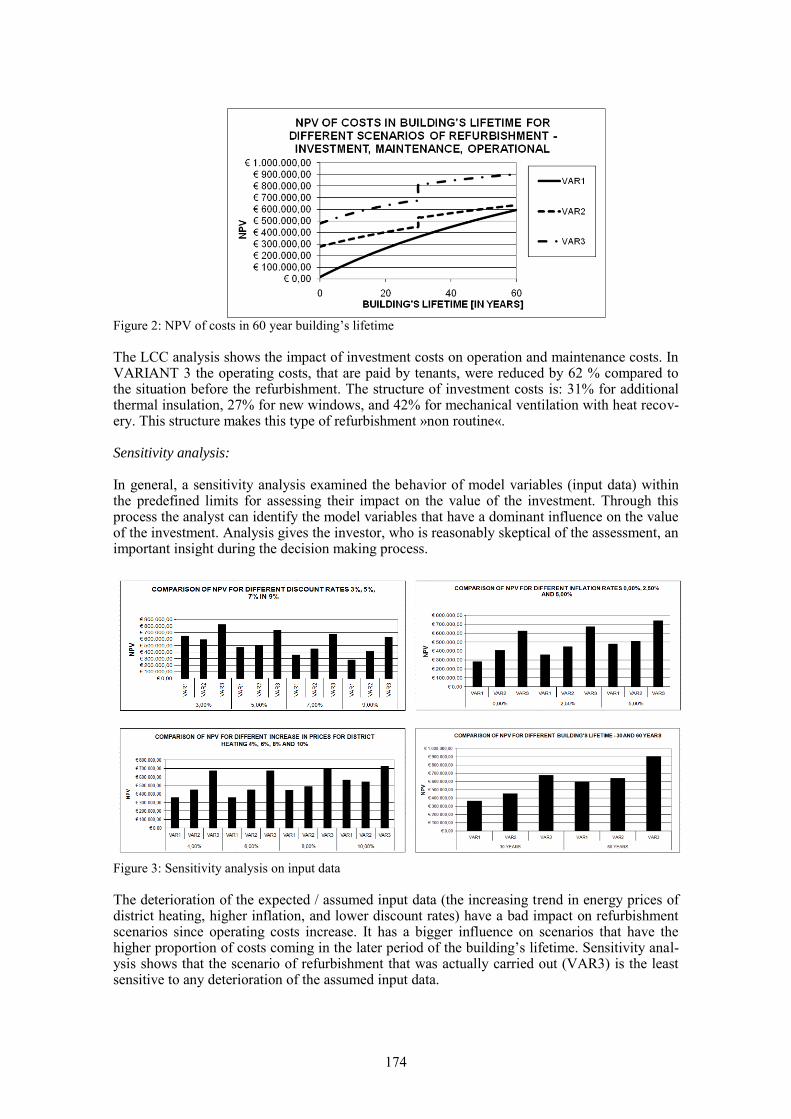
Figure 2: NPV of costs in 60 year building’s lifetime
The LCC analysis shows the impact of investment costs on operation and maintenance costs. In VARIANT 3 the operating costs, that are paid by tenants, were reduced by 62 % compared to the situation before the refurbishment. The structure of investment costs is: 31% for additional thermal insulation, 27% for new windows, and 42% for mechanical ventilation with heat recov-ery. This structure makes this type of refurbishment »non routine«. Sensitivity analysis: In general, a sensitivity analysis examined the behavior of model variables (input data) within the predefined limits for assessing their impact on the value of the investment. Through this process the analyst can identify the model variables that have a dominant influence on the value of the investment. Analysis gives the investor, who is reasonably skeptical of the assessment, an important insight during the decision making process.
Figure 3: Sensitivity analysis on input data The deterioration of the expected / assumed input data (the increasing trend in energy prices of district heating, higher inflation, and lower discount rates) have a bad impact on refurbishment scenarios since operating costs increase. It has a bigger influence on scenarios that have the higher proportion of costs coming in the later period of the building’s lifetime. Sensitivity anal-ysis shows that the scenario of refurbishment that was actually carried out (VAR3) is the least sensitive to any deterioration of the assumed input data.
174
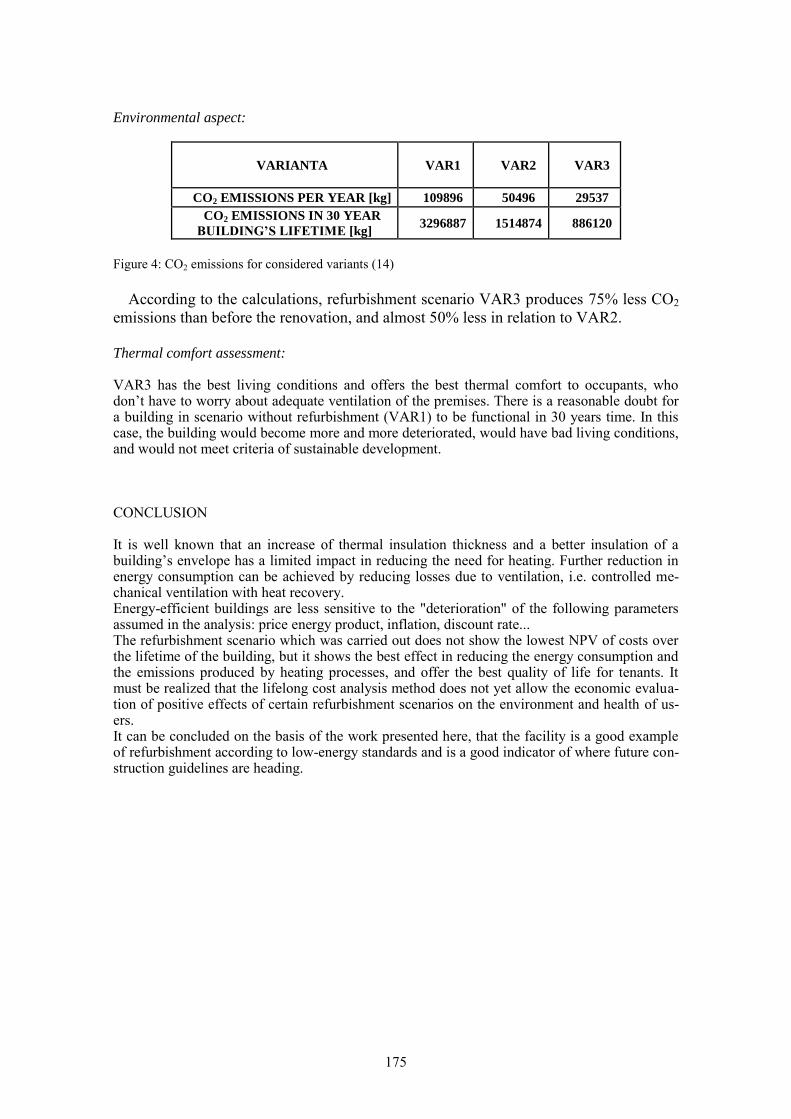
Environmental aspect:
VARIANTA VAR1 VAR2 VAR3
CO2 EMISSIONS PER YEAR [kg] 109896 50496 29537
CO2 EMISSIONS IN 30 YEAR
BUILDING’S LIFETIME [kg] 3296887 1514874 886120
Figure 4: CO2 emissions for considered variants (14)
According to the calculations, refurbishment scenario VAR3 produces 75% less CO2
emissions than before the renovation, and almost 50% less in relation to VAR2.
Thermal comfort assessment: VAR3 has the best living conditions and offers the best thermal comfort to occupants, who don’t have to worry about adequate ventilation of the premises. There is a reasonable doubt for a building in scenario without refurbishment (VAR1) to be functional in 30 years time. In this case, the building would become more and more deteriorated, would have bad living conditions, and would not meet criteria of sustainable development.
CONCLUSION
It is well known that an increase of thermal insulation thickness and a better insulation of a building’s envelope has a limited impact in reducing the need for heating. Further reduction in energy consumption can be achieved by reducing losses due to ventilation, i.e. controlled me-chanical ventilation with heat recovery. Energy-efficient buildings are less sensitive to the "deterioration" of the following parameters assumed in the analysis: price energy product, inflation, discount rate... The refurbishment scenario which was carried out does not show the lowest NPV of costs over the lifetime of the building, but it shows the best effect in reducing the energy consumption and the emissions produced by heating processes, and offer the best quality of life for tenants. It must be realized that the lifelong cost analysis method does not yet allow the economic evalua-tion of positive effects of certain refurbishment scenarios on the environment and health of us-ers. It can be concluded on the basis of the work presented here, that the facility is a good example of refurbishment according to low-energy standards and is a good indicator of where future con-struction guidelines are heading.
175
REFERENCES
1. ATTMA – The Air Tightness Testing and Measurement Association. Measuring air permeability of
building envelopes – 16/01/06
2. www.attma.org (April 10th 2009)
3. Elektro Ljubljana. Electricity prices.
http://www.elektro-ljubljana.si/slo/Ceniki (May 20th 2009)
4. Energetika Ljubljana. District heating prices.
http://www.jh-lj.si/index.php?p=2&m=56&k=392 (May 20th 2009)
5. Inženirska Zbornica Slovenije. Primeri dobre prakse – Steletova 8.
http://www.izs.si/index.php?id=642 (June 2nd 2009)
6. Feist, W. Pfluger, R. Kaufmann, B. Schneiders, J. Kah, O. 2007. Passive House Planning Package 2007
– Requirements for Quality Approved Passive Houses. Darmstadt, Passivhaus Institut: 205 pages
7. Langdon, D. 2007. Life cycle costing (LCC) as a contribution to sustainable construction: A common
methodology. Literature review: 113 pages
8. Ministerstvo za okolje in prostor – Agrencija RS za okolje. Klimatski podatki in sončni pritoki za
Ljubljano, 2009.
9. Projekt Adaptacija objekta na Steletovi 8 v Ljubljani, faza PZI, April 2006, investitor: Mestna občina
Ljubljana, projektant: Metric d.o.o.
10. Šijanec Zavrl, M. 2002. Izdelava pravilnika o vzdrževanju stanovanj, stanovanjskih stavb in
funkcionalnega zemljišča. Ljubljana, GI ZRMK: 56 pages
11. Šijanec Zavrl, M. Kolšek, J. 2009. LCC kot osnova za trajnostno načrtovanje stavb in gospodarjenje z
njimi. Ljubljana, GI ZRMK: 4 pages
12. Pravilnik o prezračevanju in klimatizaciji stavb. UL RS št. 42/02:2013
13. Pravilnik o učinkoviti rabi energije v stavbah. UL RS št. 93/2008
14. Uredba o enotni metodologiji za pripravo in obravnavo investicijske dokumentacije na področju
javnih financ. UL RS št. 60, 9.6.2006
15. Specifični izpusti CO2 za posamezne nosilce energije. UL RS št. 93 / 30.9.2008, str. 12710
16. SIST EN ISO 13370 – Toplotne karakteristike stavb – Prenos toplote skozi zemljo – Računske
metode (ISO 13370:2007) – Thermal performance of buildings – Heat transfer via the ground –
Calculation methods (ISO 13370:2007)
17. SIST EN ISO 13790:2008 – Toplotne značilnosti stavb – Računanje potrebne energije za gretje in
hlajenje prostora (ISO 13790:2008) - Thermal performance of buildings – Calculation of energy use for
space heating and cooling (ISO 13790:2008)
18. SIST EN ISO 14683:2005 – Toplotni mostovi v stavbah – Linearna toplotna prehodnost –
Poenostavljena metoda in privzete vrednosti (ISO 14683:2005) – Thermal bridges in building
construction – Linear thermal transmittance – Simplified methods and default values (ISO 14683:2005)
176
1 INTRODUCTION A number of techniques and design principles are available in the literature on refurbishment, deconstruction and demolition of existing structures.
The practices involved in these types of interventions strongly influence sustainability of buildings, as for example possibility of reusing and recycling of materials in demolition and de-construction.
The selection of the type of intervention to be undertaken is dependant on several factors, or criteria, including the assessment of structural performance, the location of the building, the type of structure and materials involved and, of course, on the time and money available. In case of demolition other factors should be taken into account as the space available on site for segregation and storage, health and safety of operatives undertaking demolition work and per-mitted levels of nuisance (Portioli and Ungureanu, 2008).
The different methods available for structural retrofitting and for tackling a demolition present various advantages related to the factors above. The main issue is to identify and to eva-luate the factors relevant to the choice of the intervention, with reference in particular to the sustainability of considered solution.
On the basis of these factors, one of the main questions for designers is related to the selec-tion of the optimal solution.
In general, the first step in defining intervention strategy should be to assess whether the building has to be demolished or retrofitted. Each solution, or alternative, should be evaluated on the basis of several criteria, as installation, maintenance and demolition cost and damage risk.
Since different criteria and alternatives are involved, a multi-criteria decision-making (MCDM) approach is required to select the type of the intervention to be undertaken on exist-ing buildings.
To show the capability of application of multi-criteria decision making methods to the refur-bishment, demolition and deconstruction of existing buildings, a state-of-the-art report is pre-sented in this paper, focusing on most common used methods and considered criteria and alter-natives.
Multi-criteria decision making methods in refurbishment, deconstruction and demolition of existing structures
F. Portioli, L. Cascini University of Naples “Federico II”, Naples e-mails: [email protected], [email protected]
V. Ungureanu “Politehnica” University of Timisoara, Romania e-mail: [email protected]
ABSTRACT: In this paper, the issues related to the application of multi-criteria decision mak-ing methods to the refurbishment, demolition and deconstruction of existing buildings are dis-cussed. In particular, an overview of most common methods available to decision maker is pre-sented. Example of applications taken from the literature are shown in order to provide information on types of alternatives and criteria that can be considered to select the best solu-tion, with particular reference to sustainable interventions.
177
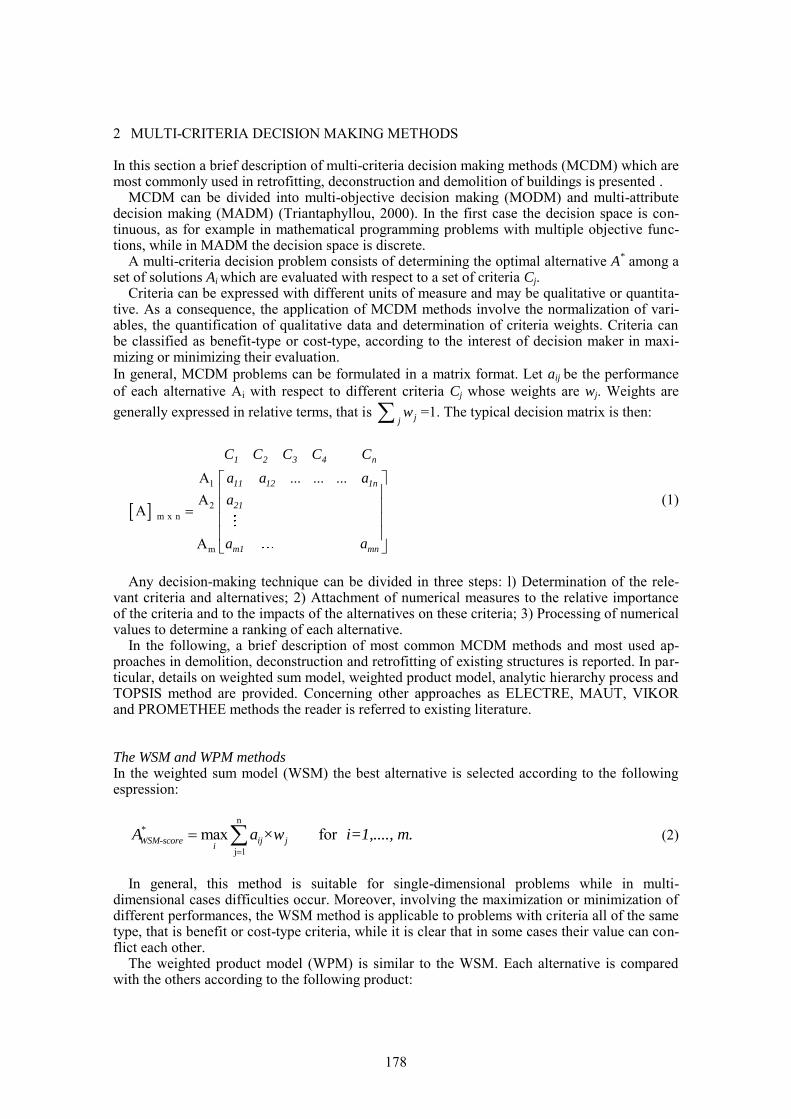
2 MULTI-CRITERIA DECISION MAKING METHODS
In this section a brief description of multi-criteria decision making methods (MCDM) which are most commonly used in retrofitting, deconstruction and demolition of buildings is presented .
MCDM can be divided into multi-objective decision making (MODM) and multi-attribute decision making (MADM) (Triantaphyllou, 2000). In the first case the decision space is con-tinuous, as for example in mathematical programming problems with multiple objective func-tions, while in MADM the decision space is discrete.
A multi-criteria decision problem consists of determining the optimal alternative A* among a
set of solutions Ai which are evaluated with respect to a set of criteria Cj. Criteria can be expressed with different units of measure and may be qualitative or quantita-
tive. As a consequence, the application of MCDM methods involve the normalization of vari-ables, the quantification of qualitative data and determination of criteria weights. Criteria can be classified as benefit-type or cost-type, according to the interest of decision maker in maxi-mizing or minimizing their evaluation.
In general, MCDM problems can be formulated in a matrix format. Let aij be the performance
of each alternative Ai with respect to different criteria Cj whose weights are wj. Weights are
generally expressed in relative terms, that is jjw =1. The typical decision matrix is then:
1
2
m x n
m
... ... ...A
AA
A
1 2 3 4 n
11 12 1n
21
m1 mn
C C C C C
a a a
a
a a
(1)
Any decision-making technique can be divided in three steps: l) Determination of the rele-
vant criteria and alternatives; 2) Attachment of numerical measures to the relative importance of the criteria and to the impacts of the alternatives on these criteria; 3) Processing of numerical values to determine a ranking of each alternative.
In the following, a brief description of most common MCDM methods and most used ap-proaches in demolition, deconstruction and retrofitting of existing structures is reported. In par-ticular, details on weighted sum model, weighted product model, analytic hierarchy process and TOPSIS method are provided. Concerning other approaches as ELECTRE, MAUT, VIKOR and PROMETHEE methods the reader is referred to existing literature.
The WSM and WPM methods In the weighted sum model (WSM) the best alternative is selected according to the following espression:
n
j 1
max for*
WSM-score ij ji
A a ×w i=1,...., m.
(2)
In general, this method is suitable for single-dimensional problems while in multi-
dimensional cases difficulties occur. Moreover, involving the maximization or minimization of different performances, the WSM method is applicable to problems with criteria all of the same type, that is benefit or cost-type criteria, while it is clear that in some cases their value can con-flict each other.
The weighted product model (WPM) is similar to the WSM. Each alternative is compared with the others according to the following product:
178
nwj
k L Kj Lj
j 1
R(A / A ) (a / a )
(3)
In the maximization case, the alternative Ak is to be preferred with respect to AL if the term R is greater than or equal to one. The best alternative is the one that maximizes the value of R.
The calculation of the ratios of different performances allows the elimination of units of measure and for this reason the method id called dimensionless analysis. However, limitations concerning the types of criteria are similar to WSM method.
The AHP method The analytic hierarchy process (AHP) was developed by Saaty. The decision matrix is con-structed by using the relative importance of the alternatives with respect to considered criterion.
Each entry aij in the m x n matrix [A] represents the relative value of alternative Ai in terms of
the criterion Cj. In general, it is assumed that n
i 1
1ija
. As a consequence, in the AHP method
the columns of decision matrix are normalized to add up one. The relationship used to evaluate the best alternative is similar to WSM but it is based on
relative values instead of actual ones and as a consequence in this case the method may be ap-plied to multi-dimensional problems.
n
j 1
max for*WSM-score ij j
iA a ×w i=1,...., m.
(4)
In the AHP method the columns of decision matrix are defined on the basis of a series of pairwise comparisons of alternatives with respect to a selected criterion. The pairwise compari-son approach allows to quantify qualitative data and to decompose a complex MCDM problem into a system of hierarchies. The same comparisons can be carried out on considered criteria as well, to define relative weights. The value of pairwise comparison is expressed by means of a linguistic judgment, as “A is more important than B” or “A is of the same importance as B” and so on. The quantification of linguistic choices is determined on the basis of proper scales, as the linear one proposed by Saaty (Table 1).
Table 1. Fundamental Scale of Relative Importances (Saaty, 2008).
Intensity of Importance
Definition Explanation
1 Equal Importance Two activities contribute equally to the objective
2 Weak or slight
3 Moderate importance Experience and judgment slightly favor one activity over another
4 Moderate plus
5 Strong importance Experience and judgment strongly favor one activity over another
6 Strong plus
7 Very strong or demonstrated importance An activity is favored very strongly over another; its dominance demonstrated in practice
8 Very,very strong
9 Extreme importance The evidence favoring one activity over another is of the highest possible order of affirmation
Reciprocals of above
If activity i has one of the above nonzero numbers assigned to it when compared with activity j, then j has the reciprocal value when compared with i
A logical assumption
179
The results of pairwise comparisons are used to define judgment matrices, also called Pair-
wise matrices or P matrices. Each entry pij of these matrices corresponds to the number that estimates according to se-
lected scale the relative performance (or weights of importance) of entity Ei when it is com-pared with Ej. Entities can be represented by alternatives Ai or criteria Ci that have to be com-pared in terms of selected criterion or decision goal.
n x n
... ... ...
P
1 2 3 4 n
1 11 12 1n
2 21
n m1 mn
E E E E E
E p p p
E p
E p p
(5)
The matrix of pairwise comparisons is reciprocal, being pij=1/pij and pii=1. In case it is possi-
ble to have exact value of pij = wi/wj, with wi actual weigth of importance of entity Ei, the matrix [P] is consistent, that is pij=pik·pkj. It can be shown that for real values of pij the rank of [P] is 1 and that λ=n is the principal eigenvalue. When the values of pij are close to actual ones but dif-ferent, which is the most common case in applications, the [P] matrix is not consistent, the rank is greater than 1 and the maximum eigenvalue λmax is greater than or equal to n.
It can be demonstrated that the normalized principal eigenvector w of P matrix that corre-sponds to the maximum eigenvalue λmax represents the vector (ai1, ai2,…., ain) with relative per-formance, or weights, of compared entities, that is the i-th colum of matrix [A] or the vector of relative weights of criteria.
In particular, it results:
maxP w w with max n (6)
,..., )i1 i2 inw=(a , a a (7)
A simplified calculation of eigenvector w can be performed by multiplying the entries in
each row of matrix P together and taking the n-th root. In order to have values that add up to 1, a normalization by the sum of obtained values has to be carried out. A simplified procedure to obtain λmax is to add the columns of matrix P and the multiplying the resulting vector with w.
To estimate the consistency of pairwise comparison matrix, Saaty proposed the Consistency Ratio CR, obtained dividing the consistency index by the Random Consistency Index RCI given in table 2.
CI is defined as follows:
maxCI ( n) /(n 1) (8)
RCI is an average random consistency index derived from randomly generated reciprocal ma-
trices. According to Saaty, the CR should be less than 10% in order to have consistency in pairwise
judgments.
Table 2. RCI values of sets of different order n.
n 1 2 3 4 5 6 7 8 9
RCI 0 0 0.58 0.9 1.12 1.24 1.32 1.41 1.45
180
The TOPSIS method TOPSIS method is based on the assumption that the best alternative should have the shortest distance from an ideal solution and the farthest distance from the negative-ideal solution. It is assumed that each criterion has a tendency of monotonically increasing or decreasing utility. The preference order of the alternatives is obtained on the basis of these relative distances. The method is organized in different steps as follows. In the first step the normalized decision ma-trix R is constructed.
m x n
... ... ... ...
R
11 1n
21
ij
ij m2kj
k=1
m1 mn
r r
r
ar
a
r r
(9)
In the following step, the weighted normalized decision matrix [V] is generated, by multiply-
ing the columns of matrix R with weights of criteria (w1, w2, …, wn) estimated by the decision maker.
m x n
... ... ... ...
V
1 11 n 1n
1 21
ij i ij
1 m1 n mn
w r w r
w r
v w r
w r w r
(10)
In the third step, the ideal and negative ideal solutions are determined, denoted as A
* and A
-,
respectively:
ii
(max ), (min ), ,....,* b cij ij 1* n*A v j J v j J i=1,..., m v v (11)
i i
(min ), (max ), ,....,- b cij ij 1- n-A v j J v j J i=1,..., m v v (12)
where indexes J
b and J
c are associated to benefit and cost criteria.
To measure the separation Si* and Si- of different alternatives from ideal solutions, the n-
dimensional Euclidean distance is determined according to the following expressions:
2( )n
i* ij j*
j=1
S v v for i=1,…,m (13)
2( )n
i- ij j-
j=1
S v v (14)
The best alternative is the one with the shortest distance from ideal solution, that is the one which maximizes the relative closeness index Ci*, calculated as follows:
i-i*
i* i-
SC
S S
(15)
181
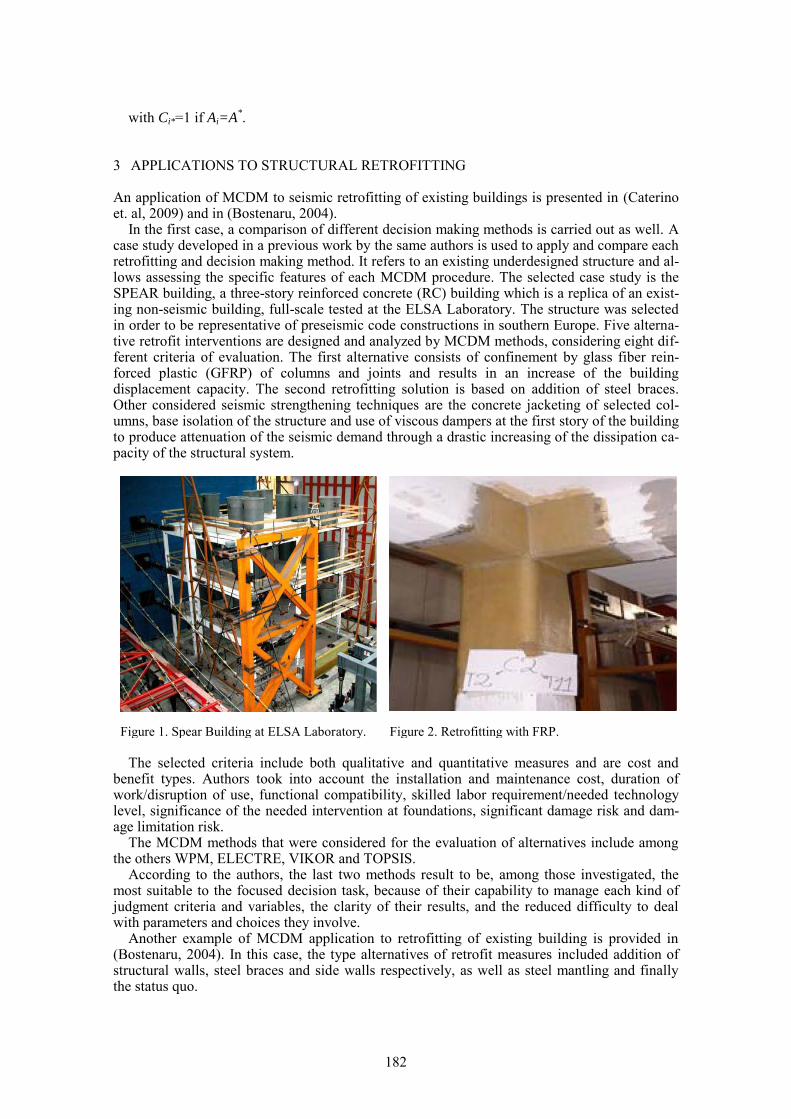
with Ci*=1 if Ai=A
*.
3 APPLICATIONS TO STRUCTURAL RETROFITTING An application of MCDM to seismic retrofitting of existing buildings is presented in (Caterino et. al, 2009) and in (Bostenaru, 2004).
In the first case, a comparison of different decision making methods is carried out as well. A case study developed in a previous work by the same authors is used to apply and compare each retrofitting and decision making method. It refers to an existing underdesigned structure and al-lows assessing the specific features of each MCDM procedure. The selected case study is the SPEAR building, a three-story reinforced concrete (RC) building which is a replica of an exist-ing non-seismic building, full-scale tested at the ELSA Laboratory. The structure was selected in order to be representative of preseismic code constructions in southern Europe. Five alterna-tive retrofit interventions are designed and analyzed by MCDM methods, considering eight dif-ferent criteria of evaluation. The first alternative consists of confinement by glass fiber rein-forced plastic (GFRP) of columns and joints and results in an increase of the building displacement capacity. The second retrofitting solution is based on addition of steel braces. Other considered seismic strengthening techniques are the concrete jacketing of selected col-umns, base isolation of the structure and use of viscous dampers at the first story of the building to produce attenuation of the seismic demand through a drastic increasing of the dissipation ca-pacity of the structural system.
Figure 1. Spear Building at ELSA Laboratory. Figure 2. Retrofitting with FRP.
The selected criteria include both qualitative and quantitative measures and are cost and
benefit types. Authors took into account the installation and maintenance cost, duration of work/disruption of use, functional compatibility, skilled labor requirement/needed technology level, significance of the needed intervention at foundations, significant damage risk and dam-age limitation risk.
The MCDM methods that were considered for the evaluation of alternatives include among the others WPM, ELECTRE, VIKOR and TOPSIS.
According to the authors, the last two methods result to be, among those investigated, the most suitable to the focused decision task, because of their capability to manage each kind of judgment criteria and variables, the clarity of their results, and the reduced difficulty to deal with parameters and choices they involve.
Another example of MCDM application to retrofitting of existing building is provided in (Bostenaru, 2004). In this case, the type alternatives of retrofit measures included addition of structural walls, steel braces and side walls respectively, as well as steel mantling and finally the status quo.
182
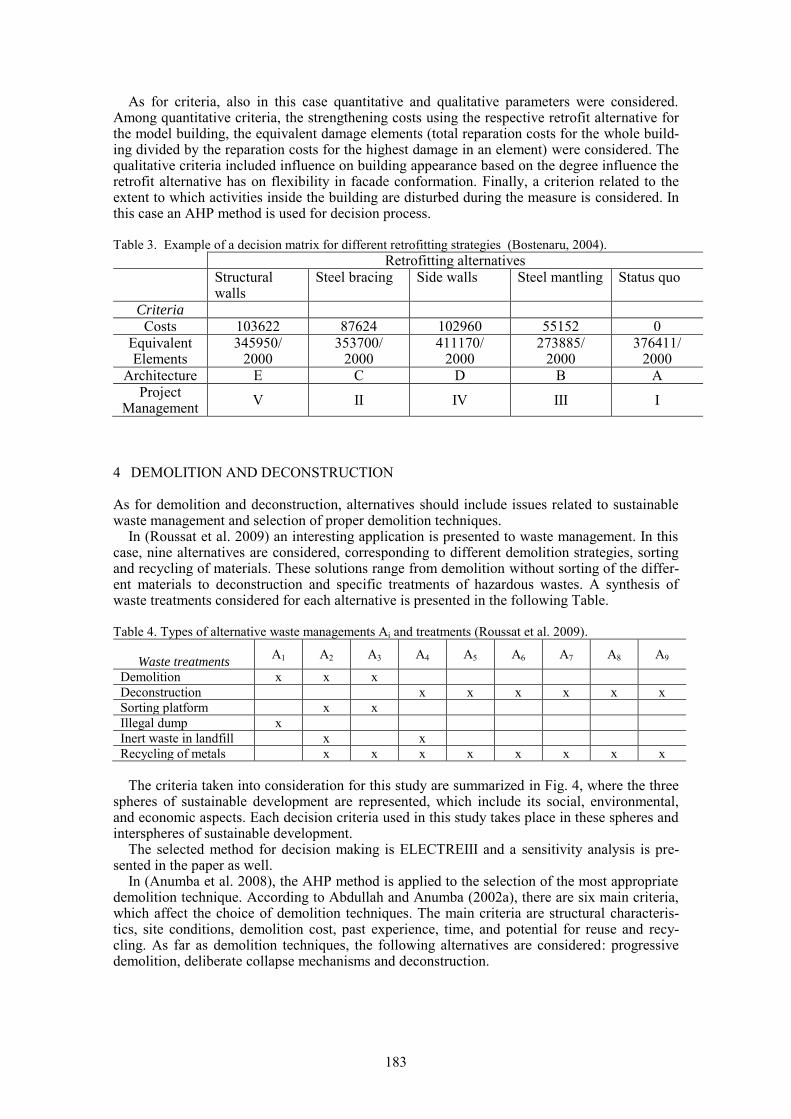
As for criteria, also in this case quantitative and qualitative parameters were considered. Among quantitative criteria, the strengthening costs using the respective retrofit alternative for the model building, the equivalent damage elements (total reparation costs for the whole build-ing divided by the reparation costs for the highest damage in an element) were considered. The qualitative criteria included influence on building appearance based on the degree influence the retrofit alternative has on flexibility in facade conformation. Finally, a criterion related to the extent to which activities inside the building are disturbed during the measure is considered. In this case an AHP method is used for decision process.
Table 3. Example of a decision matrix for different retrofitting strategies (Bostenaru, 2004).
Retrofitting alternatives
Structural walls
Steel bracing Side walls Steel mantling Status quo
Criteria Costs 103622 87624 102960 55152 0
Equivalent Elements
345950/ 2000
353700/ 2000
411170/ 2000
273885/ 2000
376411/ 2000
Architecture E C D B A Project
Management V II IV III I
4 DEMOLITION AND DECONSTRUCTION
As for demolition and deconstruction, alternatives should include issues related to sustainable waste management and selection of proper demolition techniques.
In (Roussat et al. 2009) an interesting application is presented to waste management. In this case, nine alternatives are considered, corresponding to different demolition strategies, sorting and recycling of materials. These solutions range from demolition without sorting of the differ-ent materials to deconstruction and specific treatments of hazardous wastes. A synthesis of waste treatments considered for each alternative is presented in the following Table. Table 4. Types of alternative waste managements Ai and treatments (Roussat et al. 2009).
Waste treatments
A1 A2 A3 A4 A5 A6 A7 A8 A9
Demolition x x x
Deconstruction x x x x x x
Sorting platform x x
Illegal dump x
Inert waste in landfill x x
Recycling of metals x x x x x x x x
The criteria taken into consideration for this study are summarized in Fig. 4, where the three
spheres of sustainable development are represented, which include its social, environmental, and economic aspects. Each decision criteria used in this study takes place in these spheres and interspheres of sustainable development.
The selected method for decision making is ELECTREIII and a sensitivity analysis is pre-sented in the paper as well.
In (Anumba et al. 2008), the AHP method is applied to the selection of the most appropriate demolition technique. According to Abdullah and Anumba (2002a), there are six main criteria, which affect the choice of demolition techniques. The main criteria are structural characteris-tics, site conditions, demolition cost, past experience, time, and potential for reuse and recy-cling. As far as demolition techniques, the following alternatives are considered: progressive demolition, deliberate collapse mechanisms and deconstruction.
183
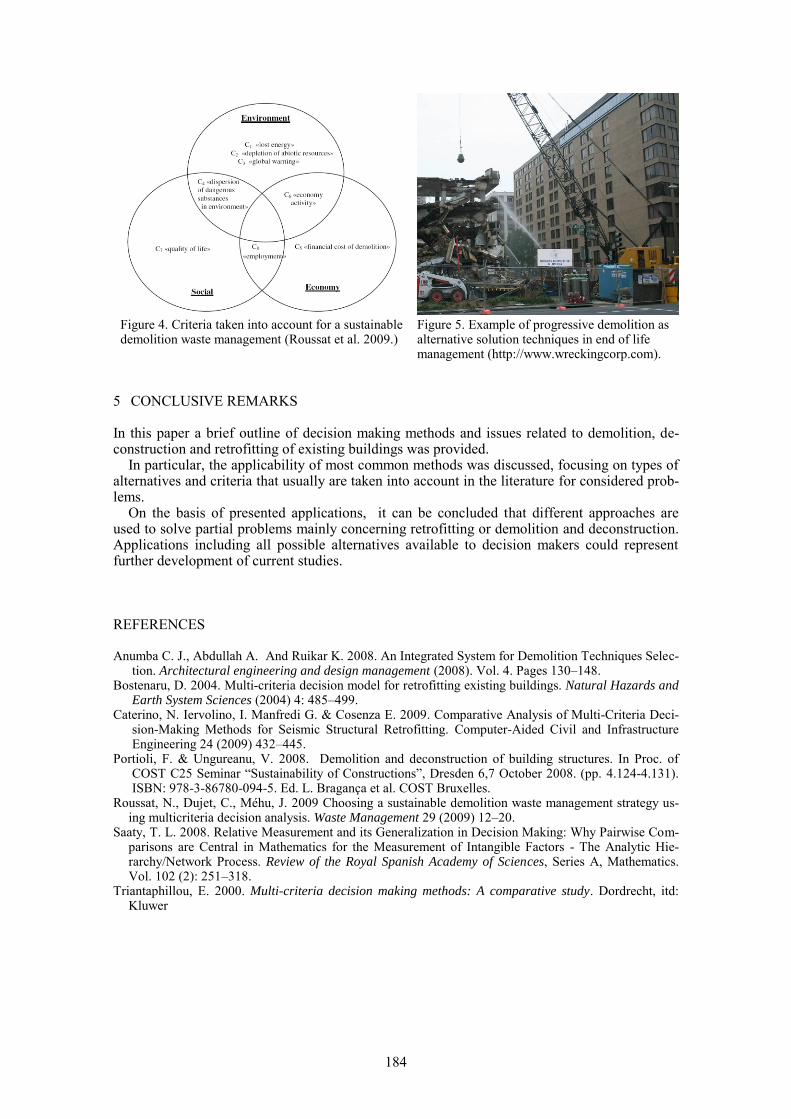
Figure 4. Criteria taken into account for a sustainable demolition waste management (Roussat et al. 2009.)
Figure 5. Example of progressive demolition as alternative solution techniques in end of life management (http://www.wreckingcorp.com).
5 CONCLUSIVE REMARKS
In this paper a brief outline of decision making methods and issues related to demolition, de-construction and retrofitting of existing buildings was provided.
In particular, the applicability of most common methods was discussed, focusing on types of alternatives and criteria that usually are taken into account in the literature for considered prob-lems.
On the basis of presented applications, it can be concluded that different approaches are used to solve partial problems mainly concerning retrofitting or demolition and deconstruction. Applications including all possible alternatives available to decision makers could represent further development of current studies.
REFERENCES
Anumba C. J., Abdullah A. And Ruikar K. 2008. An Integrated System for Demolition Techniques Selec-tion. Architectural engineering and design management (2008). Vol. 4. Pages 130–148.
Bostenaru, D. 2004. Multi-criteria decision model for retrofitting existing buildings. Natural Hazards and Earth System Sciences (2004) 4: 485–499.
Caterino, N. Iervolino, I. Manfredi G. & Cosenza E. 2009. Comparative Analysis of Multi-Criteria Deci-sion-Making Methods for Seismic Structural Retrofitting. Computer-Aided Civil and Infrastructure Engineering 24 (2009) 432–445.
Portioli, F. & Ungureanu, V. 2008. Demolition and deconstruction of building structures. In Proc. of COST C25 Seminar “Sustainability of Constructions”, Dresden 6,7 October 2008. (pp. 4.124-4.131). ISBN: 978-3-86780-094-5. Ed. L. Bragança et al. COST Bruxelles.
Roussat, N., Dujet, C., Méhu, J. 2009 Choosing a sustainable demolition waste management strategy us-ing multicriteria decision analysis. Waste Management 29 (2009) 12–20.
Saaty, T. L. 2008. Relative Measurement and its Generalization in Decision Making: Why Pairwise Com-parisons are Central in Mathematics for the Measurement of Intangible Factors - The Analytic Hie-rarchy/Network Process. Review of the Royal Spanish Academy of Sciences, Series A, Mathematics. Vol. 102 (2): 251–318.
Triantaphillou, E. 2000. Multi-criteria decision making methods: A comparative study. Dordrecht, itd: Kluwer
184
1 INTRODUCTION
Nowadays the construction sector is oriented towards the promotion of sustainable life cycle design practices due to the huge impacts that constructions play on planet, people and economy. According to the current trend, the main goal to achieve is the optimization of performances, over the whole life cycle, with respect to environmental, economic and social requirements also considering the problems related to the end of life of a construction (Landolfo, 2008). The effi-cient use of the raw materials, the reduction of energy consumptions, the minimization of im-pacts and pollutions, the problem related to the reduction of construction waste produced dur-ing the demolition of buildings are thus becoming key topics for the sustainable management of constructions. In line with that, the use of timber structures represents a great challenge for de-signers. Wood structures are considered sustainable choices, due to the low carbon dioxide emissions released into the atmosphere if compared to other building materials. The production of timber elements, by the nature of the industry, uses a third of the energy consumption from renewable resources and the remainder from fossil-based, non-renewable resources than the other materials, when the system boundaries consider forest regeneration and harvesting, wood products and resin production, and transportation. Furthermore, although timbers commonly used in construction, particularly softwoods, are treated to improve durability, even natural wood could achieve a satisfactory durability level. In fact, according to Shanks (2005) “some kinds of wood are naturally durable when used in suitably detailed structures, as the historic building stock demonstrates, with no need for chemical preservative treatment or energy inten-sive kiln drying.” The overall embodied energy and environmental impact of this kind of timber structures is favorably low.
The use of timber tenon joints with pegs: a sustainable solution for improving deconstruction.
R. Marmo University of Naples ”Federico II”, Italy. [email protected]
ABSTRACT: Nowadays, the current trend in the construction sector is oriented to the optimiza-tion of performances, over the whole life cycle, with respect to environmental, economic and social requirements also considering the problems related to the end of life of a construction. Furthermore the rising cost of landfill space and the adoption of new rules to reduce waste have encouraged construction waste recovery strategies. One the most challenging practice that has been developing in the recent years is the selective deconstruction of building. To this end, the use of standardized structural connections can facilitate the assembly and disassembly process. Indeed, for timber structures, mortise and tenon joints with timber pegs are advised, due to the possibility to deconstruct them without damaging structural elements. To ensure their reliabili-ty, a finite element modeling of these joints is carried out on the basis of the results of the expe-rimental activity carried out at the Department of Constructions and Mathematical Methods in Architecture of the University of Naples “Federico II”.
185
As far as the problem of the construction waste at the end of service life is concerned, the re-use of structural components, when the service life of the original construction is expired, represents a great challenge in the spite of sustainability. In line with that, the use of wood products is also important for the possibility to realize dry constructions. Indeed the connection of timber components by means of dry joints represents a very suitable technical solution to de-construct and reuse the building component at the end of service life. The study of dry connec-tions becomes, therefore, a critical issue to design sustainable structures but, according to the current state of the art, further studies are required to characterize the reliability and the beha-vior of dry timber connections under mechanical loading. The work presented in this paper starts with a study of the possibility to apply design for deconstruction to timber structures, and focuses on the necessity to use dry joints to allow the disassembly. Afterwards, a detailed study on mortise and tenon joint is carried out, taking into account the necessity to guarantee the re-liability of these connections. To this end, a numerical model of double shear joints is imple-mented, as part of the research activities carried out at the Department of Constructions and Mathematical Methods in Architecture of the University of Naples “Federico II”. The numeri-cal model of the connection was calibrated on the basis of experimental tests on wood materials in compression, bending and cutting shear tested by Ceraldi et al. 2008. Afterwards, the pre-dicted behaviour of the double shear joint has been validated against experimental results in terms of load-displacement curves and failure modes.
2 DESIGN FOR DECONSTRUCTION
The rising cost of landfill space and the adoption of new rules to reduce waste have encouraged construction waste recovery strategies. As far as timber structures are concerned, the dominant trend is to recover the wood material from a construction and use it as mulch and fuel, but the recovery for higher value applications is gaining prominence due to an increasing demand for reclaimed construction materials in the market (Geller, 1998). One the most challenging practice that has been developing in the recent years is the selective deconstruction of building. Deconstruction consists in taking a building or a structure apart, se-lectively dismantling and removing elements before the structure is demolished, or avoiding demolition altogether, and disassembling the entire structure, in the reverse order in which it was constructed (Portioli, 2008). In order to make the deconstruction of a structure feasible at the end of service life, a particular care should be devoted to methods and materials used during the construction stage. As for as-sembled structural components, the presence of chemical treatments or fixed joints make diffi-cult or impossible the recovery of the structural elements. With the aim deconstructing a struc-ture at the end of service life, the problem of disassembly should be regarded since the initial stage of a building project. Indeed, in the recent years, a new design philosophy, named Design for Deconstruction (DfD), is growing up. According to Falk (2002) “DfD borrows from the fields of design for disassembly and recy-cling, and reverse manufacturing in the consumer products industries. Its overall goal is to re-duce pollution impacts and increase resource and economic efficiency in the adaptation and eventual removal of buildings, and recovery of individual components and materials for reuse, re-manufacturing, and recycling”. In fact, the entire life cycle of the building is considered in the design, starting from construction and operation, taking into account maintenance and re-pair, and enhancing major adaptations, like whole-building removal from the site (Falk, 2002). According to DfD it is essential to reduce the use of chemically disparate binders, adhesives, or coatings, encourage the adoption of dry joints and enhance the use of more modular construc-tion (Falk, 2002). On the basis of component and types of material of building and taking into account the amount of component to be recovered after deconstruction, it is possible to approach design for decon-struction as “hierarchical design” including; 1) design for reuse, 2) design for remanufacturing, and 3) design for recycling, with the intent to work within a series of constraints. According to Guy (2002), it is possible to ensure that “deconstruction per se implies a high de-gree of refinement in the separation of building components ”.
186
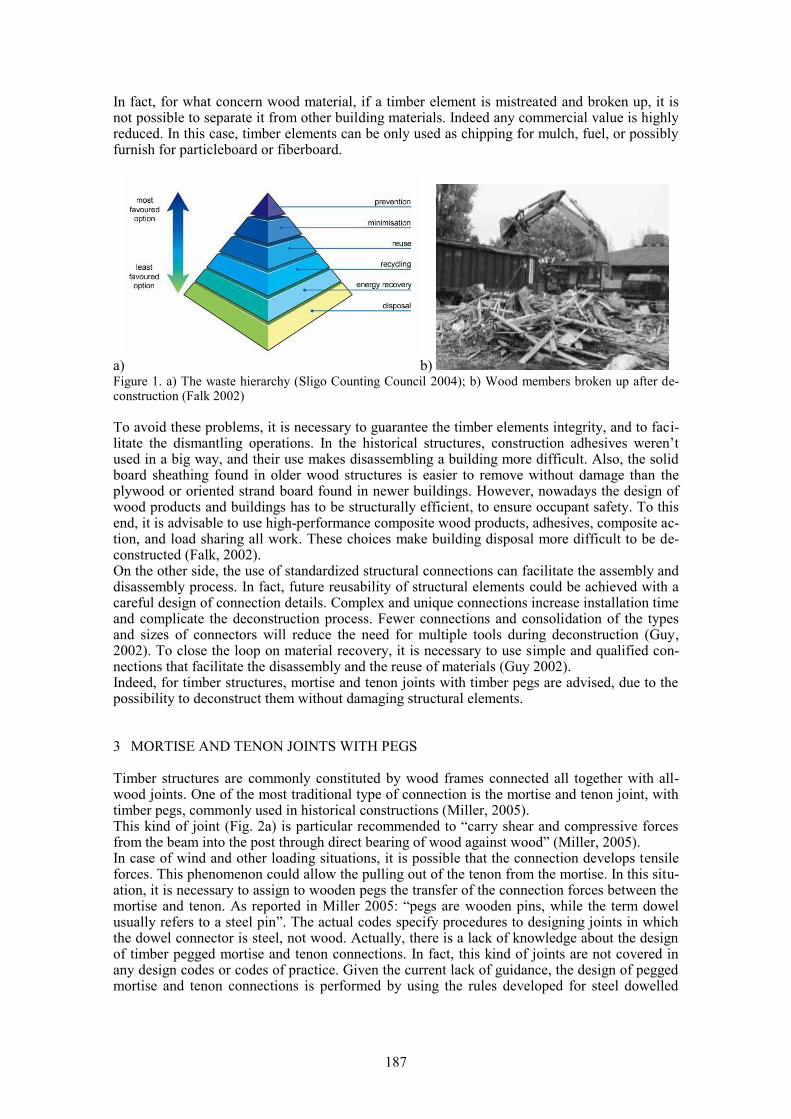
In fact, for what concern wood material, if a timber element is mistreated and broken up, it is not possible to separate it from other building materials. Indeed any commercial value is highly reduced. In this case, timber elements can be only used as chipping for mulch, fuel, or possibly furnish for particleboard or fiberboard.
a) b) Figure 1. a) The waste hierarchy (Sligo Counting Council 2004); b) Wood members broken up after de-construction (Falk 2002)
To avoid these problems, it is necessary to guarantee the timber elements integrity, and to faci-litate the dismantling operations. In the historical structures, construction adhesives weren’t used in a big way, and their use makes disassembling a building more difficult. Also, the solid board sheathing found in older wood structures is easier to remove without damage than the plywood or oriented strand board found in newer buildings. However, nowadays the design of wood products and buildings has to be structurally efficient, to ensure occupant safety. To this end, it is advisable to use high-performance composite wood products, adhesives, composite ac-tion, and load sharing all work. These choices make building disposal more difficult to be de-constructed (Falk, 2002). On the other side, the use of standardized structural connections can facilitate the assembly and disassembly process. In fact, future reusability of structural elements could be achieved with a careful design of connection details. Complex and unique connections increase installation time and complicate the deconstruction process. Fewer connections and consolidation of the types and sizes of connectors will reduce the need for multiple tools during deconstruction (Guy, 2002). To close the loop on material recovery, it is necessary to use simple and qualified con-nections that facilitate the disassembly and the reuse of materials (Guy 2002). Indeed, for timber structures, mortise and tenon joints with timber pegs are advised, due to the possibility to deconstruct them without damaging structural elements.
3 MORTISE AND TENON JOINTS WITH PEGS
Timber structures are commonly constituted by wood frames connected all together with all-wood joints. One of the most traditional type of connection is the mortise and tenon joint, with timber pegs, commonly used in historical constructions (Miller, 2005). This kind of joint (Fig. 2a) is particular recommended to “carry shear and compressive forces from the beam into the post through direct bearing of wood against wood” (Miller, 2005). In case of wind and other loading situations, it is possible that the connection develops tensile forces. This phenomenon could allow the pulling out of the tenon from the mortise. In this situ-ation, it is necessary to assign to wooden pegs the transfer of the connection forces between the mortise and tenon. As reported in Miller 2005: “pegs are wooden pins, while the term dowel usually refers to a steel pin”. The actual codes specify procedures to designing joints in which the dowel connector is steel, not wood. Actually, there is a lack of knowledge about the design of timber pegged mortise and tenon connections. In fact, this kind of joints are not covered in any design codes or codes of practice. Given the current lack of guidance, the design of pegged mortise and tenon connections is performed by using the rules developed for steel dowelled
187
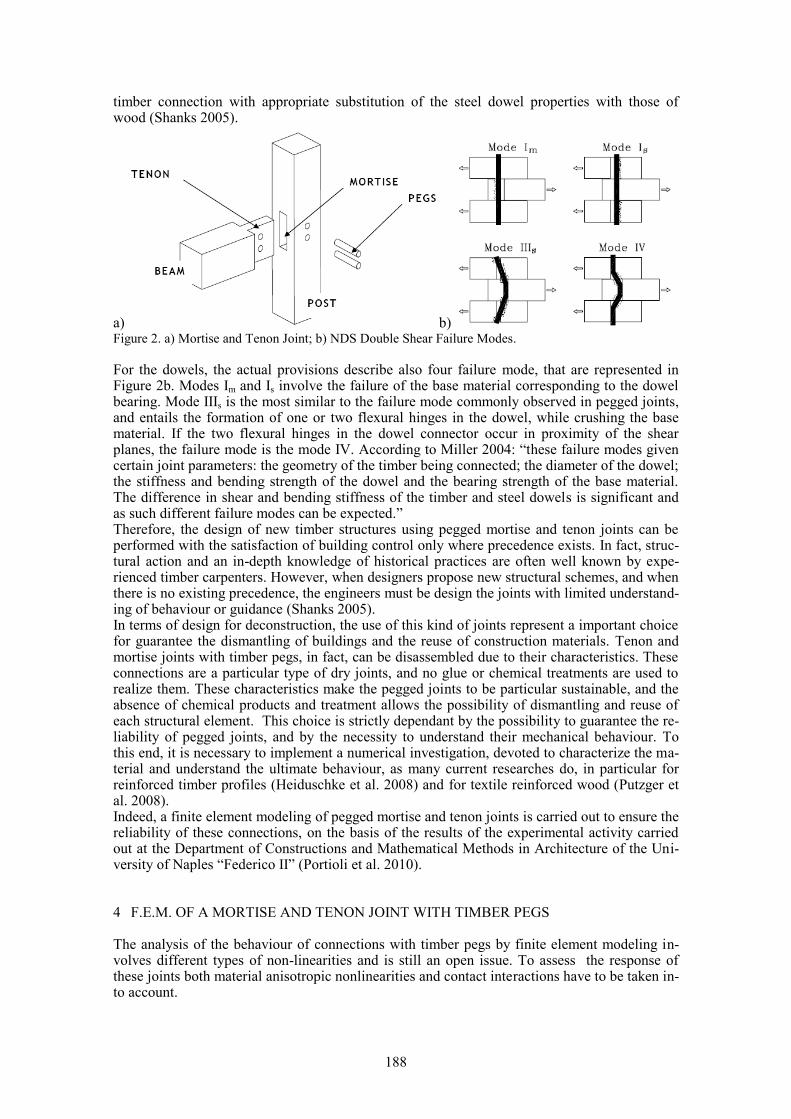
timber connection with appropriate substitution of the steel dowel properties with those of wood (Shanks 2005).
a) b) Figure 2. a) Mortise and Tenon Joint; b) NDS Double Shear Failure Modes.
For the dowels, the actual provisions describe also four failure mode, that are represented in Figure 2b. Modes Im and Is involve the failure of the base material corresponding to the dowel bearing. Mode IIIs is the most similar to the failure mode commonly observed in pegged joints, and entails the formation of one or two flexural hinges in the dowel, while crushing the base material. If the two flexural hinges in the dowel connector occur in proximity of the shear planes, the failure mode is the mode IV. According to Miller 2004: “these failure modes given certain joint parameters: the geometry of the timber being connected; the diameter of the dowel; the stiffness and bending strength of the dowel and the bearing strength of the base material. The difference in shear and bending stiffness of the timber and steel dowels is significant and as such different failure modes can be expected.” Therefore, the design of new timber structures using pegged mortise and tenon joints can be performed with the satisfaction of building control only where precedence exists. In fact, struc-tural action and an in-depth knowledge of historical practices are often well known by expe-rienced timber carpenters. However, when designers propose new structural schemes, and when there is no existing precedence, the engineers must be design the joints with limited understand-ing of behaviour or guidance (Shanks 2005). In terms of design for deconstruction, the use of this kind of joints represent a important choice for guarantee the dismantling of buildings and the reuse of construction materials. Tenon and mortise joints with timber pegs, in fact, can be disassembled due to their characteristics. These connections are a particular type of dry joints, and no glue or chemical treatments are used to realize them. These characteristics make the pegged joints to be particular sustainable, and the absence of chemical products and treatment allows the possibility of dismantling and reuse of each structural element. This choice is strictly dependant by the possibility to guarantee the re-liability of pegged joints, and by the necessity to understand their mechanical behaviour. To this end, it is necessary to implement a numerical investigation, devoted to characterize the ma-terial and understand the ultimate behaviour, as many current researches do, in particular for reinforced timber profiles (Heiduschke et al. 2008) and for textile reinforced wood (Putzger et al. 2008). Indeed, a finite element modeling of pegged mortise and tenon joints is carried out to ensure the reliability of these connections, on the basis of the results of the experimental activity carried out at the Department of Constructions and Mathematical Methods in Architecture of the Uni-versity of Naples “Federico II” (Portioli et al. 2010).
4 F.E.M. OF A MORTISE AND TENON JOINT WITH TIMBER PEGS
The analysis of the behaviour of connections with timber pegs by finite element modeling in-volves different types of non-linearities and is still an open issue. To assess the response of these joints both material anisotropic nonlinearities and contact interactions have to be taken in-to account.
188
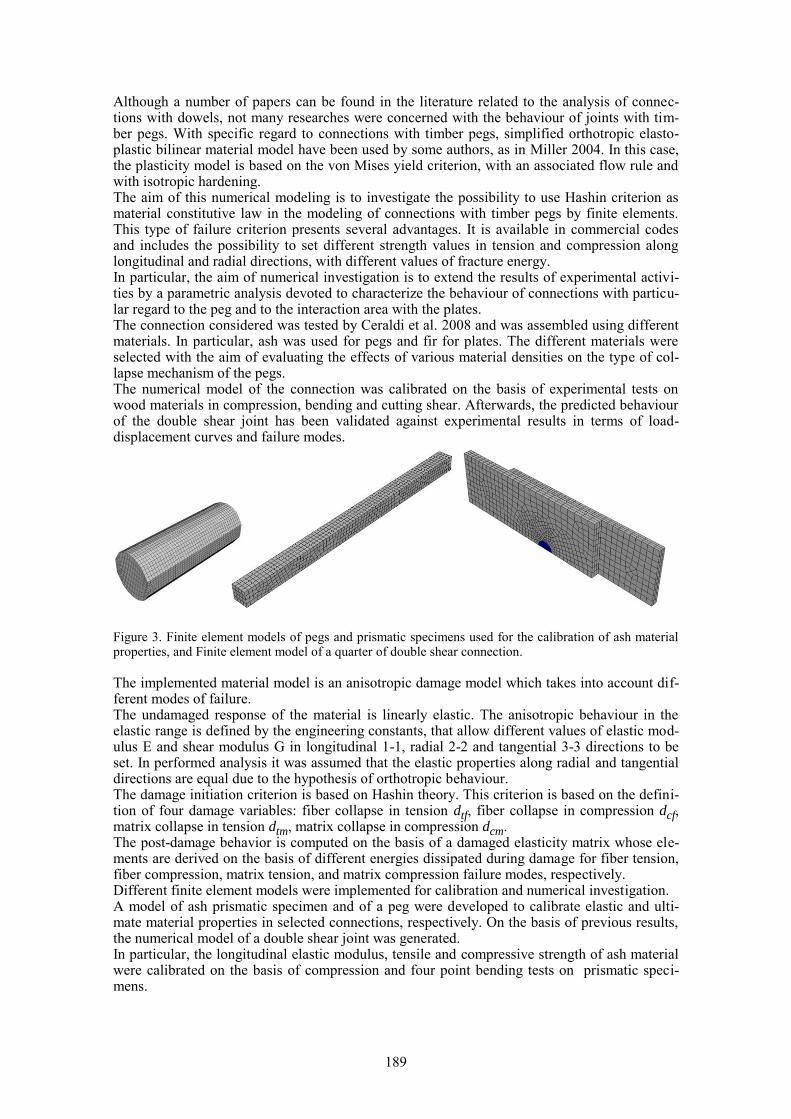
Although a number of papers can be found in the literature related to the analysis of connec-tions with dowels, not many researches were concerned with the behaviour of joints with tim-ber pegs. With specific regard to connections with timber pegs, simplified orthotropic elasto-plastic bilinear material model have been used by some authors, as in Miller 2004. In this case, the plasticity model is based on the von Mises yield criterion, with an associated flow rule and with isotropic hardening. The aim of this numerical modeling is to investigate the possibility to use Hashin criterion as material constitutive law in the modeling of connections with timber pegs by finite elements. This type of failure criterion presents several advantages. It is available in commercial codes and includes the possibility to set different strength values in tension and compression along longitudinal and radial directions, with different values of fracture energy. In particular, the aim of numerical investigation is to extend the results of experimental activi-ties by a parametric analysis devoted to characterize the behaviour of connections with particu-lar regard to the peg and to the interaction area with the plates. The connection considered was tested by Ceraldi et al. 2008 and was assembled using different materials. In particular, ash was used for pegs and fir for plates. The different materials were selected with the aim of evaluating the effects of various material densities on the type of col-lapse mechanism of the pegs. The numerical model of the connection was calibrated on the basis of experimental tests on wood materials in compression, bending and cutting shear. Afterwards, the predicted behaviour of the double shear joint has been validated against experimental results in terms of load-displacement curves and failure modes.
Figure 3. Finite element models of pegs and prismatic specimens used for the calibration of ash material properties, and Finite element model of a quarter of double shear connection.
The implemented material model is an anisotropic damage model which takes into account dif-ferent modes of failure. The undamaged response of the material is linearly elastic. The anisotropic behaviour in the elastic range is defined by the engineering constants, that allow different values of elastic mod-ulus E and shear modulus G in longitudinal 1-1, radial 2-2 and tangential 3-3 directions to be set. In performed analysis it was assumed that the elastic properties along radial and tangential directions are equal due to the hypothesis of orthotropic behaviour. The damage initiation criterion is based on Hashin theory. This criterion is based on the defini-tion of four damage variables: fiber collapse in tension dtf, fiber collapse in compression dcf, matrix collapse in tension dtm, matrix collapse in compression dcm. The post-damage behavior is computed on the basis of a damaged elasticity matrix whose ele-ments are derived on the basis of different energies dissipated during damage for fiber tension, fiber compression, matrix tension, and matrix compression failure modes, respectively. Different finite element models were implemented for calibration and numerical investigation. A model of ash prismatic specimen and of a peg were developed to calibrate elastic and ulti-mate material properties in selected connections, respectively. On the basis of previous results, the numerical model of a double shear joint was generated. In particular, the longitudinal elastic modulus, tensile and compressive strength of ash material were calibrated on the basis of compression and four point bending tests on prismatic speci-mens.
189
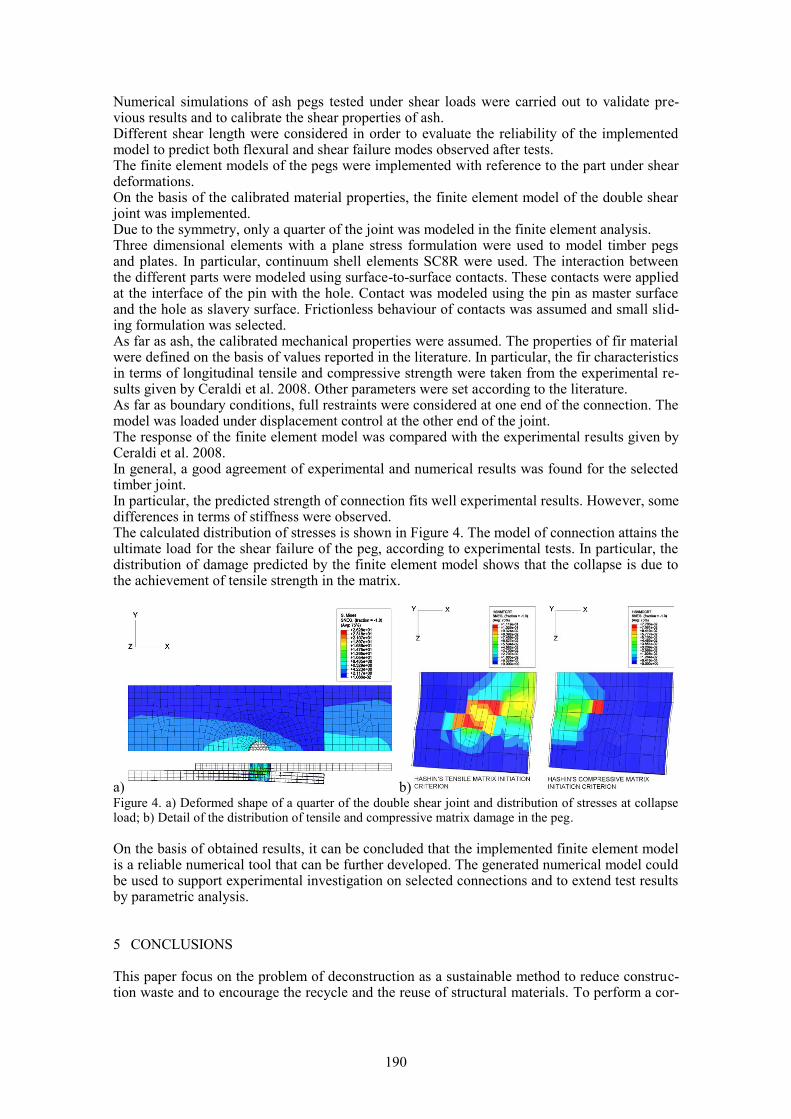
Numerical simulations of ash pegs tested under shear loads were carried out to validate pre-vious results and to calibrate the shear properties of ash. Different shear length were considered in order to evaluate the reliability of the implemented model to predict both flexural and shear failure modes observed after tests. The finite element models of the pegs were implemented with reference to the part under shear deformations. On the basis of the calibrated material properties, the finite element model of the double shear joint was implemented. Due to the symmetry, only a quarter of the joint was modeled in the finite element analysis. Three dimensional elements with a plane stress formulation were used to model timber pegs and plates. In particular, continuum shell elements SC8R were used. The interaction between the different parts were modeled using surface-to-surface contacts. These contacts were applied at the interface of the pin with the hole. Contact was modeled using the pin as master surface and the hole as slavery surface. Frictionless behaviour of contacts was assumed and small slid-ing formulation was selected. As far as ash, the calibrated mechanical properties were assumed. The properties of fir material were defined on the basis of values reported in the literature. In particular, the fir characteristics in terms of longitudinal tensile and compressive strength were taken from the experimental re-sults given by Ceraldi et al. 2008. Other parameters were set according to the literature. As far as boundary conditions, full restraints were considered at one end of the connection. The model was loaded under displacement control at the other end of the joint. The response of the finite element model was compared with the experimental results given by Ceraldi et al. 2008. In general, a good agreement of experimental and numerical results was found for the selected timber joint. In particular, the predicted strength of connection fits well experimental results. However, some differences in terms of stiffness were observed. The calculated distribution of stresses is shown in Figure 4. The model of connection attains the ultimate load for the shear failure of the peg, according to experimental tests. In particular, the distribution of damage predicted by the finite element model shows that the collapse is due to the achievement of tensile strength in the matrix.
a) b) Figure 4. a) Deformed shape of a quarter of the double shear joint and distribution of stresses at collapse load; b) Detail of the distribution of tensile and compressive matrix damage in the peg.
On the basis of obtained results, it can be concluded that the implemented finite element model is a reliable numerical tool that can be further developed. The generated numerical model could be used to support experimental investigation on selected connections and to extend test results by parametric analysis.
5 CONCLUSIONS
This paper focus on the problem of deconstruction as a sustainable method to reduce construc-tion waste and to encourage the recycle and the reuse of structural materials. To perform a cor-
190
rect deconstruction, the structure has to be designed in a proper manner, avoiding the use of glue and chemical treatments. The use of tenon and mortise joints with timber pegs represent a important choice for guarantee the dismantling of buildings and the reuse of construction mate-rials. This choice is strictly dependant by the possibility to guarantee the reliability of pegged joints, and by the necessity to understand their mechanical behaviour. To this end, the results of a finite element analysis on a three dimensional model of double shear joint are presented. Hashin criterion was used to control the plastic yielding and the fail-ure mode of timber elements. The comparison of experimental and numerical results shows a good agreement in terms of strength and failure modes, both for wood elements and timber joint. On the basis of obtained results, it can be concluded that the implemented finite element model is a reliable numerical tool that can be further developed. The generated numerical model could be used to support experimental investigation on selected connections and to extend test results by parametric analysis.
6 REFERENCES
Landolfo R., Ungureanu V., 2008. “Life-time structural engineering”. In Proc. Of COST C25 Seminary on “Sustainability of construction – Integrated approach to life-time Structural Engineering, Dresden 6,7 October 2008.
Miller, J. F. 2004. Capacity of pegged mortise and tenon joints. PhD Thesis. Department of Civil and Ar-chitectural Engineering of the University of Wyoming.
Ceraldi C., Mormone V., Russo Ermolli E. 2008. Restoring of timber structures: connections with timber pegs. In Proc. of Structural Analysis of Historic Constructions
Guy, B., Shell, S. 2002. “Design for Deconstruction” in Proc. of CIB Task Group - 39 Deconstruction. Karlsruhe, Germany.
Falk B., 2002. “Wood-Framed Building Deconstruction A Source of Lumber for Construction?”. In For-est Products Journal, Vol. 52, No. 3
Shanks J., 2005. “Experimental performance of mortice and tenon connections in green oak”. In The Structural Engineer Journal, 6 September 2005.
Geller L., 1998. “High value markets for deconstruction wood”. In Research Recycling Journal, Agoust 1998.
Portioli F., Ungureanu V., 2008. “Demolition and deconstruction of building structures”. In Proc. Of COST C25 Seminary on “Sustainability of construction – Integrated approach to life-time Structural Engineering, Dresden 6,7 October 2008.
Heiduschke A., Cabrero J.M., Manthey Ch., Haller P., Günther E., 2008. “Mechanical behaviour and life cycle assessment of fibre-reinforced timber profiles”. In Proc. Of COST C25 Seminary on “Sustain-ability of construction – Integrated approach to life-time Structural Engineering, Dresden 6,7 October 2008.
Putzger R., Haller P., 2008. “Bond strength and durability of textile reinforced wood”. In Proc. Of COST C25 Seminary on “Sustainability of construction – Integrated approach to life-time Structural Engi-neering, Dresden 6,7 October 2008.
Portioli F., Marmo R., Ceraldi C., Landolfo R., 2010. “Numerical modeling of connections with timber pegs”. In Proc. of World Conference on Timber Engineering WCTE 2010, Riva del Garda 20-24 June, paper n. 493.
191

192
1 SCENE SETTING
1.1 Conservation & Sustainability
Conservation and sustainability are strongly interrelated and interdependent. They share a his-tory of growing concern for the environment but recently sustainable design is most widely publicised for its application in new construction. Emerging sustainability concerns have caused a ‘rethink’ in the construction industry, but as a society we have already been carrying out the most sustainable practice possible: recycling our existing building stock through restora-tion and re-use. We need to be aware that, quite apart from the historic gains, we are not living in some ever demanding present but as part of a longer thread of continuity (Jones et al., 2007).
Traditional buildings are inherently sustainable having been built largely from renewable materials obtained locally. Therefore our existing building stock represents huge investments in embodied environmental capital and energy but all too often when a use cannot be found for
Sustainable Conservation of Heritage at Risk: Strategies for proactive preservation and maintenance
L. Robinson Queen’s University Belfast, Northern Ireland [email protected]
ABSTRACT: In this paper the researcher will outline and discuss a PhD concept and early study which questions the sustainable nature of re-use in conservation and the alternatives in the absence of it. This research provides an opportunity to refocus the emphasis the built envi-ronment has on sustainability at present, reverting back to the concepts of conservation, sus-tainable re-use and preventative maintenance.
There are various references and studies that exist on ‘adaptive re-use’ of historic buildings, but legislations, education and management strategies have yet to correctly address and advise how to manage unoccupied buildings and monuments at risk in a sustainable manner. With the topic of sustainability and climate change fast becoming an important item on every agenda to-day and increasing pressure on that of the built environment, how will our heritage survive and cope with such demands. For countries with vast numbers of vacant historic buildings, sustain-able conservation through continuous maintenance is vital. The intention of this research is to undertake a study on current conservation legislations, planning and management strategies in order to develop a sustainable approach to re-use and maintenance of non-domestic, unoccupied heritage at risk. Malta will be used as a main case study as its high concentration of defence heritage presents a unique and challenging typology and a significant problem at present. Other examples of ‘difficult’ typologies across Europe and the UK will also be studied to help draw adequate conclusion to a way forward. An alternative to re-use now has to be considered in the context of what is sustainable conservation. The outcome of the intended research will contri-bute both regionally and internationally and will verify the applicability of a new philosophy in conservation practice and approach to sustainable re-use and maintenance of vacant heritage at risk.
193
a building this gives a prime excuse for demolition. Historic buildings provide unique architec-tural features and development opportunities that could not be afforded with new build. We have become accustomed to the pressures and arguments that the past should be ignored in fa-vour of a more hermetically sealed, artificially warmed and vented ‘sustainably designed’ new environment (Maxwell, 2007). Reusing a historic building actively contributes to the recycling process, reducing the production of new materials and reducing waste. For example, to demo-lish a Victorian terraced house is to throw away enough embodied energy to fill a car with 15,000 litres of petrol and drive it around the world five times (English Heritage, 2004).
Conservation in itself is innately green and is recognized as such in United Nations policy framework to protect the global environment; Conservation, rehabilitation and culturally sensi-tive adaptive re-use of urban, rural and architectural heritage are also in accordance with the sustainable use of natural and human-made resources (UN, 1996). Just as we need a new ap-proach to the construction of new buildings in order to safeguard the environment, so we need a fresher greener approach to conservation (Woolley, 2003). Protective works, retention and re-use of historic buildings can massively contribute to targets for sustainable development of the built environment. Existing structures have to be tackled first and foremost for conservation to play an active role in sustainability. We cannot build our way out of the global warming crisis. We have to conserve our way out (Moe, 2007).
1.2 Re-use of heritage in the context of sustainability
The recycling of buildings has long been an important and effective preservation tool. Re-use came into mainstream architecture during the 1960’s and 1970’s due to growing concerns for the environment. Re-use is a process by which older, historic buildings are developed for their cultural value while finding a viable new use of a sustainable nature. It is a superior alternative to new construction due to minimal consumption of energy, re-use of existing materials, reduc-ing waste, preserving architectural history, reviving urban areas and, in the last fifty years, creating economic advantage. Along with these concerns also came social reasoning for pre-servation of heritage. They are seen as valuable social, cultural, economic and green assets waiting to be tapped into and renewed. It has been recognized that there is a need for promot-ing the role and importance of the built heritage and particularly in the light of the need for cul-tural identity and continuity in a rapidly changing world, since they represent an important ele-ment of stable and humane life (UN, 1996).
Historic building preservation is already trying to push the boundaries to ensure a building can contribute as much as possible to the green agenda. There are numerous studies currently addressing sustainable strategies for historic buildings, and retrofit is the latest trend in the field of conservation. Various sustainable methods have been devised to make ‘occupied’ existing buildings more sustainable (E.g. Thermal drylining, secondary glazing etc) but how do unoccu-pied, vacant buildings become sustainable. Restoration is caring for the fabric but maintenance and re-use completes the whole cycle (Jones, 2007). Before these sustainable strategies can be applied a re-use has to be considered. It is simply better in sustainability terms to use and re-cycle old buildings than to demolish them and build new ones (ODPM, 2004).
Re-use involves consideration of previous occupancy/ function, the duration it has been va-cant, size, scale, character, quality, condition, perceptions, legibility, adaptability, structural stability, and economic environment. A recent study commissioned by Dublin City Council compared costs of reusing a variety of existing buildings with the cost of demolishing and building anew (Carrig Conservation et al., 2004). The study found that depending on the re-pairs needed, overall development costs could be halved by reusing an existing building. The study findings support the acknowledged international view that the re-use of buildings mini-mizes the depletion of non-renewable resources and is therefore essential to sustainable devel-opment (O’Dulaing et al., 2004). If re-use of buildings is therefore the way forward, then how can heritage at risk and vacant buildings be dealt with successfully.
194
1.3 Heritage at risk & vacant historic buildings
The issue of re-use cannot be addressed without considering heritage that may not lend itself to a straightforward re-use; non-domestic buildings, large scale buildings, groups of buildings and unoccupied buildings all fall into this category. Many of these desolate heritage items have been identified and added to ‘Buildings at Risk’ registers and ‘Monuments of Danger’ lists but what are the next steps that can be taken to ensure they have a future. An alternative solution has to be considered when a re-use is not viable. The first step to solving any problem is to first recognize there is a problem, and publications and records of heritage at risk display an array of the problems faced in black and white. The primary aim of buildings at risk registers is to high-light the vulnerability of our built heritage, heighten public awareness and to act as a catalyst for conservation and re-use. Buildings and monuments are selected because of their historic or architectural value and are at risk for a number of reasons, from functional redundancy, vandal-ism, fire damage and in general neglect and disrepair. Risk is assessed primarily on the basis of condition and occupancy.
Many local authorities and councils produce their own BaR Registers; Society for the Pro-tection of Ancient Buildings (SPAB), Ulster Architectural Heritage Society (UAHS), Scottish Civic Trust to name a few in the UK and at an international level UNESCO and ICOMOS. ICOMOS’ latest Heritage at Risk World Report on Monuments and Sites in Danger was pub-lished in 2006- 2007 and UNESCO keep a constant record; The World Heritage List. All herit-age at risk requires attention and incentives to move forward. Building Preservation Trusts often act on a small scale as a vehicle to secure buildings at risk which are not commercially attractive. Powers do exist to protect buildings at risk such as Building Preservation Notices, Urgent Works Orders and Compulsory Purchase Orders. Being put on a risk register does not ensure the building’s survival but if a building has gone beyond the state of acceptable disre-pair, the authorities can step in and take relevant action. They must lead by example as failure is so often pursued by needless decay, vandalism and unnecessary accumulative expense (McClelland et al., 2008).
It is the larger, difficult typologies that now require direct attention and planning. Effective planning and targeted public policies that encourage re-use are vital and will aid in the fight to discourage vacancy. For this to happen, the future of our collective efforts must focus more clearly on preventative maintenance and, by extension, on measures such as better educating owners and ‘up-skilling’ both craftspeople and professionals (McClelland, 2008). To sustain heritage at risk proactive maintenance or a re-use needs to been assigned. An often-used excuse for demolition is that there is no longer a use for a building (Wilson, 2007). A lot of effort goes into the final solution or use of the building but if preventative maintenance is not carried out, deterioration may result in the search for a new use being completely pointless. If a permanent solution to identified problems is not immediately possible, temporary works should be under-taken to prevent the problems from escalating; this is where proactive preservation plays a vital role in the re-use of heritage (Lewis, 2009).
1.4 Preventative Maintenance
In normal circumstances a use generates an income for the building which in turn sustains the building’s maintenance therefore a rethink is required on maintenance without a re-use. Man-agement and maintenance can be the most problematic part of conserving a historic building and also the most important part. The conservation of significant places is founded on appro-priate and planned routine management and maintenance. The values of landscape and build-ing tend to be quickly obscured or lost if long-standing management and maintenance regimes are discontinued. Such regimes are closely linked to historic design, function and stewardship (Lewis, 2009). In ‘Buildings at Risk - A New Strategy (1998)’, English Heritage stressed the importance of local planning authorities monitoring the condition of their listed building stock and taking preventative action as soon as a place shows significant signs of neglect, not waiting until it is in extremis. It is vital to use persuasion, backed up by Urgent Works and Notices, to stem neglect at an early stage, and prevent further deterioration while a long-term solution is found. Managing Local Authority Heritage Assets (English Heritage 2003) stresses the need for local authorities to set a good example to others.
195
Lack of past investment in the maintenance of heritage has now created a maintenance back-log. In 2007 English Heritage reported that their register contains 1,235 buildings, which need a total of £400m to be brought into a state of repair. It gives a "conservation deficit" for each site, which occurs when a building will cost more to repair than it is worth when repaired, and is therefore money which cannot be recouped from the final value after restoration. We call on the government to work with us to convince public funding bodies of the value of the nation's heritage and that buildings like the ones we have identified today deserve a second chance (Thurley, 2007). There is a need to prioritise allocating of state resources for capital maintenance of state-owned facilities.
The best means of long-term preservation of any building is routine care and maintenance. Without this, buildings soon fall into disrepair and in a short space of time decay, neglect and vandalism rapidly leads to serious physical and structural failure. Buildings seen as beyond saving quickly face the ultimate ignominy of demolition (Hanna et al., 2007). There are short term measures which can be taken to secure a building until a re-use is found but techniques such as ‘mothballing’ are never seen as a means to an end. Temporary solutions should be ef-fective, timely and reversible (Lewis, 2009).
1.5 The role of ‘Mothballing’ in heritage maintenance
When all means of finding a productive use for a building have been exhausted or when funds are not currently available, the only necessary approach to prevent a building’s further deteri-oration is to close it up temporarily. Mothballing is a comprehensive series of proactive steps that can prepare a building for a sustained period of vacancy. The process is designed to dis-courage decay and deterioration. Understanding, observation and repair of the structure during this stage will allow for easy return to use in the future, protecting the historic fabric in the inte-rim, whilst having significant cost savings in the long run. Mothballing is a necessary and ef-fective procedure in protecting a building’s future, but it is intended to be a temporary measure (Tyzack, 2006). In a lot of cases ‘mothballing’ ends up being a long term measure and can lead to buildings being put on a risk register or pushing them deeper into heritage at risk lists and not out of them. This ‘lock and leave’ approach can often have negative consequences for historic structures as it often sets up the desired environment to accelerate deterioration and further neg-lect. Holding repairs are usually conducted between acquisition and commencing the develop-ment. However, they are only valid for the period reasonably necessary to work up and submit an application. Cumulative costs for a period of inactive ownership should be avoided (English heritage, 2008). This is where the logic of mothballing fails.
There is no substitute for a building being in use and accessed regularly. Based on William Morris’s philosophy of repair with the minimum intervention, the most appropriate way to care for a building without a beneficial use is to instigate a temporary programme of mothballing and this is one approach that needs to be investigated further in relation to vacant heritage at risk and unique heritage typologies.
2 RESEARCH PROJECT
2.1 Research Concept
The author has previously conducted research on ‘Restoration and Re-use of Military Heritage’ using a case study to answer ‘Is it advisable to restore without a re-use’. This previous study has given rise to the opportunity to conduct further research on the issues associated with re-use of heritage at risk and the problems and alternatives faced in the absence of it. The paper dis-cusses the initial elements required for conducting this research.
The initial review of existing literature has given rise to a number of exploratory questions; In the absence of a ‘suitable re-use’, what are the social, economic and environmental costs
of leaving a building in a state of neglect or temporary preserved state? Is it justifiable to sus-tain the building through other procedures, until a re-use is identified? Mothballing is not a
196
new procedure but is it an effective alternative in the absence of an immediate re-use? How much money can be invested in them through preventative processes such as ‘mothballing’ when an eventual re-use may never be found or secured? What are the financial and social implications of ‘mothballing’? In countries where heritage at risk can be found on a vast scale and high concentration, is preventative maintenance the way forward? How long do you give a building before accepting that it has no use and when do restored buildings without a re-use become mere monuments? What affect does this have on areas with UNESCO World Heritage Status?
There are few studies that specifically review preventative maintenance measures and
‘mothballing’ in relation to ‘unoccupied’ heritage at risk and larger scale, immovable buildings at risk such a defence heritage and forts. A review now needs to be conducted on the successes and limitations mothballing has on heritage and especially that at risk and unable to find an immediate re-use. The problem is not reusing old buildings, it is a question of how you moth-ball the very difficult ones and how you eventually direct money and developers to re-use them (Patton, Historic Buildings Council N.I, 2010). The research will also include a review of ex-isting buildings at risk registers and ways forward for those buildings most in danger. These registers are seen as mere records at present and action has to be taken to now advance the use of such registers for the preservation and maintenance of heritage. A range of what are consi-dered ‘difficult’ and ‘hopeless’ building typologies will be reviewed in a case study context and conclusions will then be drawn to a way forward. The most difficult typologies to re-use are the ones that end up most in danger of being lost and most in need of alternative measures for survival. Forts, fortifications, underground complexes and follies; are all unique heritage items that are seen as functionally obsolete and too difficult to save. These unusual and challenging buildings present a unique opportunity and current perceptions need to be refocused so they are viewed as this and no longer a problem. Sometimes these massive structures will survive for centuries without much repair as they are built to last, but the problem occurs when the times comes and they have to be dealt with in one way or another. Government needs to lead the way and take responsibility and deal with its stewardship duties.
Malta is one such country which needs to change its perceptions and take a firm grasp of its high concentration of defence heritage and turn it into a unique and opportune showcase. Old buildings always have unusual and positive features that you couldn’t possibly afford to build new, so that unique selling proposition needs to be clearly seen (Patton, 2010). This typology is difficult to preserve, let alone re-use, due to its sheer scale and its hindering original function of defence. These structures are also permanent and this intensifies the challenge even further. The fortified structures are carved from the limestone strata and built into it; therefore even if they go beyond the point of disrepair they cannot simply be demolished and replaced.
2.2 Relevance
The research project aims to overcome the difficulty of maintaining heritage at risk and diffi-cult typologies, and provide a new path for proactive maintenance techniques and an eventual re-use if possible. The boundaries now need to be pushed beyond the relevance of re-use and to explore alternatives and a way forward for heritage in extreme danger.
An analysis of preventative maintenance measures will be provided, the role and value of Heritage at Risk registers will be questioned and new approaches and perceptions towards maintaining heritage at risk will be encouraged. The project will achieve an understanding of the current role of mothballing and preventative measures for buildings at risk and analyse the economic and social implications of this. From conclusions drawn a new approach and philos-ophy will be developed in the hope of redirecting attention toward unusual and challenging ty-pologies at risk.
The social, financial and environmental cost of vacant buildings is too great to ignore and re-use cannot be the only defining factor of their fate. The study aims to provide maintenance strategies on measures that can be taken to get buildings at risk off current registers. The entire research will also reaffirm conservations role in sustainable development.
197
2.3 Methodology
The research will be conducted through literature review, case studies (locally and internation-ally), qualitative research, desk-based studies, questionnaires and liaising with government au-thorities, heritage groups and conservation specialists. A literature review will be conducted on the philosophy and principles of conservation and re-use, followed by a review of more recent publications on maintenance and management of heritage and heritage at risk in particular. Ex-amples of unique building typologies across Europe which are at extreme risk will be identified and a number of case studies will be used to focus the study. Fort Manoel and Fort St Elmo in the Maltese context will provide relevant case study material to initiate the process. Fort Ma-noel has recently been restored but yet to find a re-use and therefore provides an excellent op-portunity for monitoring, and Fort St Elmo, a building on the list of World Heritage in Danger, lies vacant and is not even in the early stages of a maintenance programme let alone a subject for re-use. They will by no means be the only examples used but do provide fitting examples of the extremity of the problem being addressed.
3 CONCLUSION AND WAY FORWARD Preventive maintenance makes such profound sense that it is remarkable that we have to re-learn so painfully what was obvious to Ruskin and Morris. The challenge is immense, but there are signs that new thinking from local authorities and Building Preservation Trusts may turn the tide towards a more sustainable future for our historic buildings. By controlling the long-term deterioration of a historic building while it is unoccupied, heritage can be sustained and pre-served for future intent of use. Mothballing is more sustainable than allowing an empty build-ing to physically deteriorate, but at what cost. The principle of modern times.....is to neglect buildings first and to restore them afterwards. Take proper care of your monuments and you will not need to restore them (Ruskin, 1849). Anticipation early on is obviously the most effec-tive approach in reducing costs but this is not always possible.
An emphasis now needs to be put on prevention rather than cure for disrepair. There can be no sustainable development without a central role of heritage preservation. The historic envi-ronment is a fragile resource and we have an obligation to manage change in a sensitive and sustainable way to ensure that what is significant is passed on to future generations. The histor-ic environment is an asset, not a barrier to change (Lewis, 2009).
REFERENCES
Carrig Conservation (2004). Built to Last: The Sustainable Re-use of Buildings. An Action of the Dublin City Heritage Plan. Dublin: The Heritage Council.
English Heritage, (2008). Enabling Development and the Conservation of Significant Places.
http://www.helm.org.uk/upload/pdf/EnablingwebV2.pdf. London 2008. English Heritage (2004). Heritage Counts 2004: The State of England’s Historic Environment. London:
English Heritage. House of Commons (2004). . ODPM: Housing, Planning, Local Government and the Regional
Committee The Role of Historic Buildings in Urban Regeneration. London: Stationary Office.
Lewis, M. (2009). Conservation principles, policies and guidance, for sustainable management of
historic environment in Wales. Consultation draft.
http://www.cadw.wales.gov.uk/upload/resourcepool/Conservation_Principles_Doc_ENG2893.pdf. Welsh Assem-
bly Government McClelland, A., Hanna, S. (2008). Built Heritage at Risk Northern Ireland (BHARNI). Ulster Architec-
tural Heritage Society. Vol. 8. Moe, R. Sustainable Stewardship: Preservation’s essential role in fighting climate change. Speech,
National Building Museum, Washington, DC. 13 December 2007. Ruskin, J. (1849). The Seven Lamps of Architecture. Toronto: General Publishing Company Ltd. Chap-
ter VI, pp181.
Thurley, S. 2007. At Risk-Buildings “Need Millions”. http://news.bbc.co.uk/go/pr/fr/-
/2/hi/uk_news/england/6913354.stm
198

Tyzack, A. (2006). Crumbling Heritage Needs Investment. http://www.countrylife.co.uk/news/culture/article/108398/Crumbling_Heritage_Needs_Investment.html.
United Nations. (1996). Istanbul Declaration on Human Settlements and the Habitat Agenda. Section 8: Conservation and rehabilitation of the historical and cultural heritage. http://www.unhabitat.org/downloads/docs/407-ISTANBUL_DECLARATION_ON_HUMAN_SETTLEMENTS-
Istanbul_Declaration.pdf
Wilson, L., Jones, G. R., Maxwell, I. 2007. Lose or Re-use: Managing Heritage Sustainably. Belfast: Ulster Architectural Heritage Society.
Woolley, T. (2003). Conservation and Sustainability: Making the Connection. http://constructireland.ie/articles/0207conservation.php.
199

200

Top Related
Copyright © 2022 FDOKUMEN

