


Bahasa
Halaman
Hukum


Student Debt: Rhetoric and Reality
Sandy Baum Senior Fellow, The Urban Institute
Contact information:
161 E. Chicago Avenue, Apt. 45C Chicago, IL 60611 Tel: 518-369-374
Sandy Baum ([email protected]) is a higher education economist and Senior Fellow at the Urban Institute. She was Professor of Economics at Skidmore College for many years and has co-authored the College Board’s annual reports Trends in Student Aid and Trends in College Pricing since 2002. She is the author of Student Debt: Rhetoric and Realities of Higher Education Financing, published in 2016 by Palgrave Macmillan. Abstract: The general perception of a student debt “crisis” misses the reality that most education borrowing improves people’s lives by increasing educational opportunities. Higher-income people carry more student debt than lower-income people. However, specific groups of people and specific types of debt cause serious difficulties. Default rates are disturbingly high, but the biggest problems are among students who do not complete their programs and among those who attended for-profit institutions. Finding solutions to the very real problems requires pinpointing the problems, targeting the solutions, and recognizing the responsibilities of both borrowers and taxpayers. The most important strategy for ameliorating student debt problems is preventing people from borrowing for programs they are unlikely to complete and institutions that won’t serve them well. Major steps for dealing with existing debt include an improved income-driven payment system that appropriately supports borrowers while expecting most to repay their debts in full and improving the structures surrounding the repayment and collection processes. Other potential policy modifications could ameliorate the difficulties facing borrowers even without total overhaul of the system.
Student Debt: Good, Bad, and Misunderstood
Sandy Baum
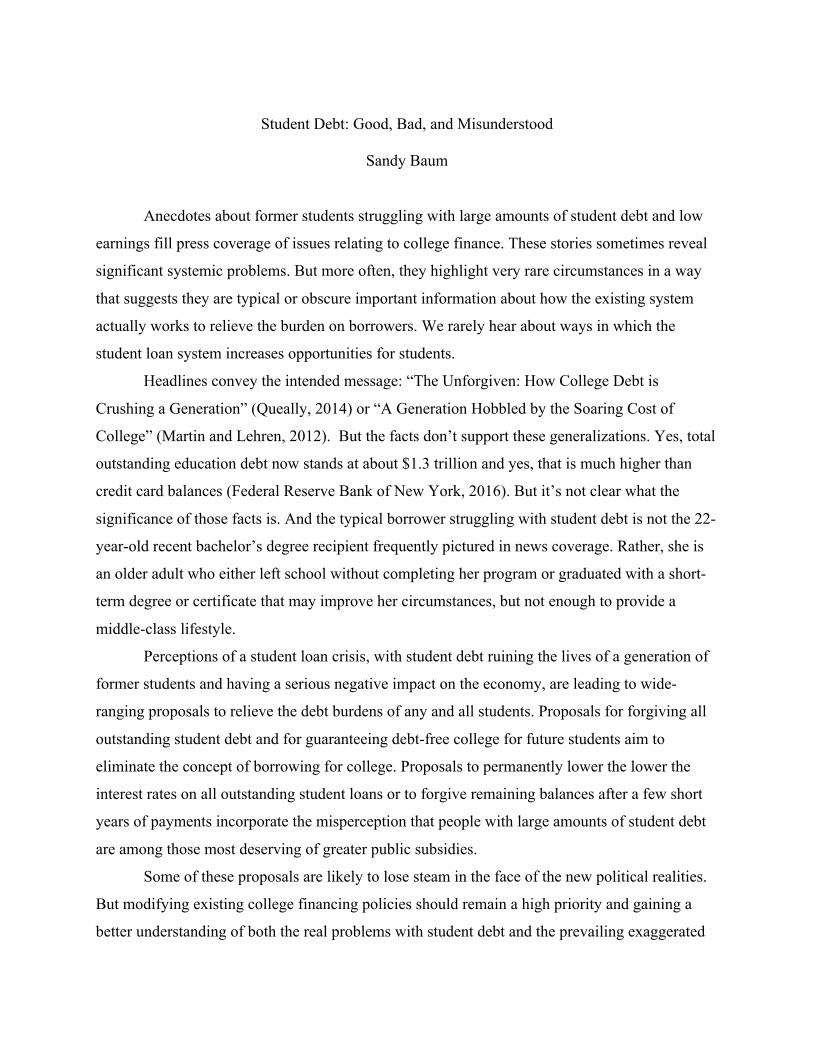
Anecdotes about former students struggling with large amounts of student debt and low
earnings fill press coverage of issues relating to college finance. These stories sometimes reveal
significant systemic problems. But more often, they highlight very rare circumstances in a way
that suggests they are typical or obscure important information about how the existing system
actually works to relieve the burden on borrowers. We rarely hear about ways in which the
student loan system increases opportunities for students.
Headlines convey the intended message: “The Unforgiven: How College Debt is
Crushing a Generation” (Queally, 2014) or “A Generation Hobbled by the Soaring Cost of
College” (Martin and Lehren, 2012). But the facts don’t support these generalizations. Yes, total
outstanding education debt now stands at about $1.3 trillion and yes, that is much higher than
credit card balances (Federal Reserve Bank of New York, 2016). But it’s not clear what the
significance of those facts is. And the typical borrower struggling with student debt is not the 22-
year-old recent bachelor’s degree recipient frequently pictured in news coverage. Rather, she is
an older adult who either left school without completing her program or graduated with a short-
term degree or certificate that may improve her circumstances, but not enough to provide a
middle-class lifestyle.
Perceptions of a student loan crisis, with student debt ruining the lives of a generation of
former students and having a serious negative impact on the economy, are leading to wide-
ranging proposals to relieve the debt burdens of any and all students. Proposals for forgiving all
outstanding student debt and for guaranteeing debt-free college for future students aim to
eliminate the concept of borrowing for college. Proposals to permanently lower the lower the
interest rates on all outstanding student loans or to forgive remaining balances after a few short
years of payments incorporate the misperception that people with large amounts of student debt
are among those most deserving of greater public subsidies.
Some of these proposals are likely to lose steam in the face of the new political realities.
But modifying existing college financing policies should remain a high priority and gaining a
better understanding of both the real problems with student debt and the prevailing exaggerated
perceptions remains critical. Ironically, too many proposals billed as progressive would increase
subsidies to some of the better-off members of society, leaving those most in need behind.
Basic facts about student debt
How much do individual students borrow?
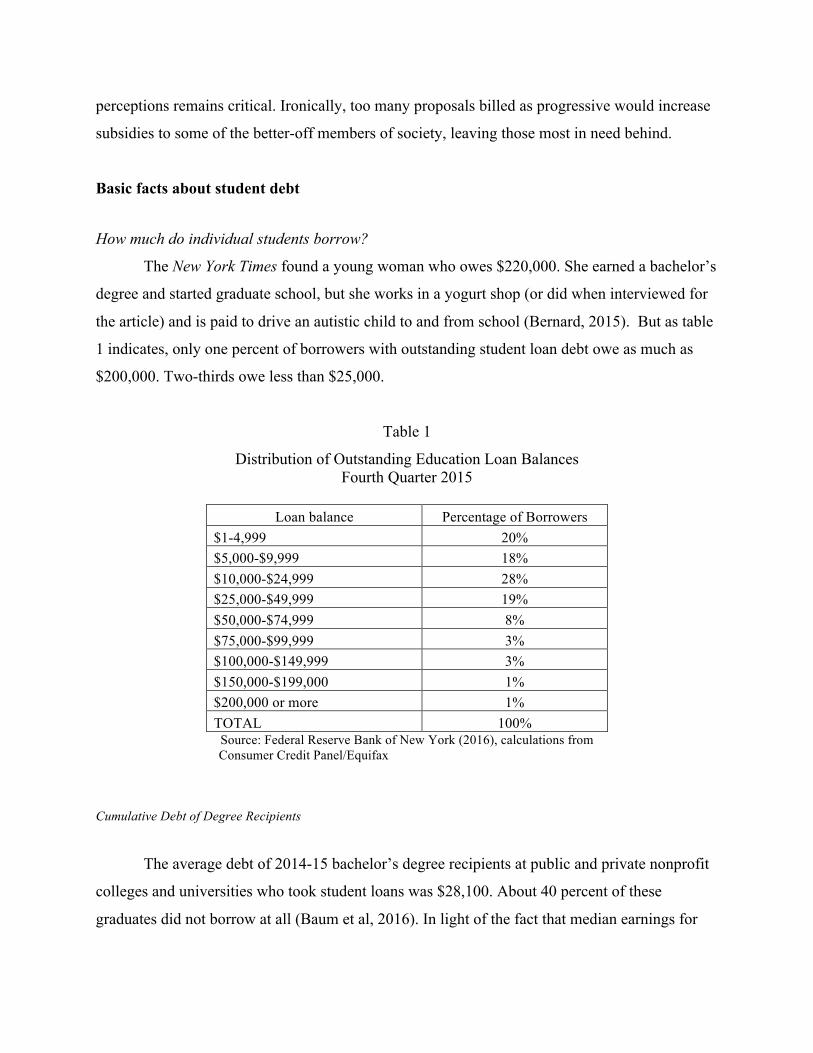
The New York Times found a young woman who owes $220,000. She earned a bachelor’s
degree and started graduate school, but she works in a yogurt shop (or did when interviewed for
the article) and is paid to drive an autistic child to and from school (Bernard, 2015). But as table
1 indicates, only one percent of borrowers with outstanding student loan debt owe as much as
$200,000. Two-thirds owe less than $25,000.
Table 1
Distribution of Outstanding Education Loan Balances Fourth Quarter 2015
Loan balance Percentage of Borrowers
$1-4,999 20% $5,000-$9,999 18% $10,000-$24,999 28% $25,000-$49,999 19% $50,000-$74,999 8% $75,000-$99,999 3% $100,000-$149,999 3% $150,000-$199,000 1% $200,000 or more 1% TOTAL 100%
Source: Federal Reserve Bank of New York (2016), calculations from Consumer Credit Panel/Equifax
Cumulative Debt of Degree Recipients
The average debt of 2014-15 bachelor’s degree recipients at public and private nonprofit
colleges and universities who took student loans was $28,100. About 40 percent of these
graduates did not borrow at all (Baum et al, 2016). In light of the fact that median earnings for

25-to-34-year olds with bachelor’s degrees were $18,900 higher than the median for those with
only a high school diploma in 2015 (U.S. Census Bureau, 2015), this is not a daunting amount.
But debt levels have increased significantly in recent years and averages hide a lot.
Between 2003-04 and 2011-12, the percentage of bachelor’s degree recipients who had borrowed
$40,000 (in 2012 dollars) rose from two percent to 18 percent. The share of students with this
level of debt increased in all sectors. But as figure 1 illustrates, the increase in public colleges
and universities, which award almost two-thirds of all bachelor’s degrees, was from one
Figure 1 Cumulative Debt of Bachelor’s Degree Recipients in 2012 Dollars by Sector,
2003-04, 2007-08, and 2011-12
Source: Baum et al (2104), Trends in Student Aid, trends.collegeboard.org, Figure 2014_14A. Based on data from National Postsecondary Student Aid Study.
30%
33%
35%
34%
36%
38%
25%
26%
28%
12%
11%
15%
10%
15%
24%
12%
17%
26%
8%
11%
19%
4%
6%
15%
13%
21%
26%
14%
21%
23%
12%
22%
32%
7%
15%
32%
18%
16%
10%
18%
14%
9%
20%
17%
12%
14%
27%
21%
12%
8%
4%
10%
6%
3%
14%
11%
5%
16%
23%
13%
18%
8%
2%
12%
5%
20%
13%
4%
48%
18%
4%
0% 10% 20% 30% 40% 50% 60% 70% 80% 90% 100%
2011-12
2007-08
2003-04
2011-12
2007-08
2003-04
2011-12
2007-08
2003-04
2011-12
2007-08
2003-04
Total
PublicFo
ur-Year
PrivateNo
nprofit
Four-Year
For-Profit
NoDebt Lessthan$10,000 $10,000to$19,999$20,000to$29,999 $30,000to$39,999 $40,000orMore

percent to 12 percent, while in the for-profit sector—which awarded eight percent of bachelor’s
degrees in 2011-12 and is not included in the $28,100 average debt figure cited above—it was
from four percent to 48 percent (Baum et al, 2014).
Associate degree recipients borrow less than students earning four-year degrees. They are
typically in school for a shorter period of time and many of them attend low-tuition community
colleges. But even among these students, debt levels have risen considerably. Eight percent of
2011-12 degree recipients graduated with $30,000 or more in debt—including 28 percent of
those whose degrees were from for-profit institutions (Baum et al, 2014). Associate degrees do
not generally lead to earnings as high as bachelor’s degrees, so it makes sense to be concerned
about lower levels of debt for these individuals than for those with bachelor’s degrees.
Recent Trends
Borrowing per student has declined in recent years. As table 2 reports, average federal
loans rose from $4,300 (in 2015 dollars) per full-time equivalent undergraduate student in 2005-
06 to $5,700 in 2010-11, but declined to $4,700 in 2015-16. Federal loans per graduate student
rose from $13,000 in 2005-06 to $18,700 in 2010-11, before declining to $17,500 in 2015-16
(Baum et al, 2016). This reality is not yet reflected in the debt levels of degree recipients and it
may not be, if the change results primarily from reduced enrollment of students unlikely to
complete degrees—particularly bachelor’s degrees. But overall student loan problems can be
mitigated even without reducing these cumulative debt levels, since this is not where the biggest
problems lie.
Table 2:
Federal Loans per Full-Time Equivalent Student, 1995-96 to 2015-16, Selected Years
Undergraduate
Students Graduate Students 1995-96 $3,200 $9,100 2000-01 $3,400 $10,200 2005-06 $4,300 $13,000 2010-11 $5,700 $18,700 2015-16 $4,700 $17,500
Source: Baum et al (2016), Trends in Student Aid 2016, Figure 1

How do students’ borrowing patterns differ?
One of the difficulties with talking about a “student debt crisis” is that it fails to
differentiate among students with different characteristics in different circumstances. Table 3
displays the distribution of cumulative debt for 2011-12 bachelor’s degree recipients with
different characteristics.
Table 3 Cumulative Debt of 2011-12 Bachelor’s Degree Recipients
No Debt Less than
$10,000
$10,000 to
$19,999
$20,000 to
$29,999
$30,000 to
$39,999
$40,000 or More
All Bachelor’s Degree Recipient Total 30% 10% 13% 18% 12% Total
Age at Completion 23 or Younger (60%) 34% 12% 14% 19% 11% 11% 24 to 29 (20%) 21% 12% 12% 15% 14% 25% 30 to 39 (11%) 21% 6% 11% 15% 14% 33% 40 or Older (9%) 30% 5% 10% 13% 13% 29%
Dependency Status Dependent (56%) 34% 12% 14% 19% 10% 11% Independent, No Dependents (25%) 25% 9% 12% 15% 13% 25% Independent with Dependents (19%) 23% 8% 10% 15% 15% 29%
Time Elapsed Between First Enrollment and Degree Completion Within 4 Years (39%) 36% 11% 15% 19% 9% 10% 5 Years (21%) 29% 11% 12% 19% 13% 15% 6 Years (10%) 25% 11% 12% 19% 16% 17% 7 to 9 Years (12%) 23% 11% 12% 13% 13% 28% 10 Years or Longer (19%) 24% 6% 10% 15% 14% 31%
Sector Public Four-Year (56%) 34% 12% 14% 17% 10% 12% Private Nonprofit Four-Year (26%) 25% 8% 12% 20% 14% 20% For-Profit (9%) 12% 4% 7% 14% 16% 48% Other (8%) 28% 11% 14% 16% 11% 20%
Race/Ethnicity Asian (6%) 43% 12% 14% 17% 7% 7% Black (12%) 14% 11% 12% 16% 15% 32% Hispanic (12%) 27% 11% 14% 17% 14% 17% White (66%) 32% 10% 13% 18% 12% 16%
Source: Baum et al., Trends in Student Aid 2016, trends.collegeboard.org, Figures 2015_16A,16B,17A, 17B, and 18.

Most stories about student debt focus on people in their early twenties struggling to
establish themselves as adults. But older students tend to borrow more than traditional-age
college students. Only 11 percent of students who completed bachelor’s degrees in 2011-12
when they were age 23 or younger had borrowed as much as $40,000, but about 30 percent of
those who completed their degrees at age 30 or older had accumulated this much debt (Baum et
al, 2015). They should be a focus of any investigation into problems in our higher education
financing system.
Another critical issue is the amount of time students spend in school. The longer the time
period from first enrollment to degree completion, the more likely students are to accumulate
high levels of debt. And of even greater concern, black bachelor’s degree recipients are much
less likely to graduate without debt and much more likely than members of other racial / ethnic
groups to borrow $40,000 or more.
Graduate students borrow much more than undergraduates
In 2011-12, when about 20 percent of the degrees completed were graduate degrees, two-
thirds of the students graduating with $50,000 or more in debt—and 94 percent of those with
$100,000 or more in debt—had completed master’s or doctoral degrees (NCES, 2012). Fourteen
percent of graduate students who completed their programs in 2011-12 (and 21 percent of those
who borrowed) had accumulated $100,000 or more in debt. Among those receiving professional
practice degrees such as law and medicine, 62 percent overall and 72 percent of those who
borrowed had this much debt (Baum et al, 2014).
The policy considerations relating to graduate students are quite different from those
relating to undergraduates. The individuals incurring this debt already have bachelor’s degrees
and are among those in the labor force with the highest earnings potential. They are also older
and more educated than most people making decisions about undergraduate debt. In most
cases—although certainly not all—earnings can support this debt and graduate borrowers have
relatively low default rates.

Who is in debt?
The misperception that bachelor’s degree recipients with very high levels of debt are
typical co-exists with the misperception that individuals who have borrowed for college are
among the groups in society struggling most. In fact, because of the association between higher
levels of education and higher incomes, education debt holders tend to be relatively well off.
As figure 2 shows, in 2013, the 25 percent of households with the highest incomes held 47
percent of all outstanding student debt. The 25 percent of households with the lowest incomes
held 11 percent of the debt (Baum et al, 2015). Student debt is correlated with education and
with earnings. The people who are having the most trouble making ends meet are those who
have not gone to college and may not even have graduated from high school.
Figure 2
Distribution of Outstanding Education Debt by Household Income Quartile, 2013
Note: Income quartiles are based on 2012 household income. The upper limits for the first three quartiles are $25,000, $48,000, and $90,000. Source: Baum et al., Trends in Student Aid 2015, The College Board, Figure 19A. Based on data from the Survey of Consumer Finances.
LowestIncome11%
Lower-MiddleIncome…
Upper-MiddleIncome25%
HighestIncome47%

Who Goes to College?
There is no doubt that rising college prices and stagnant income levels have contributed
to increasing reliance on borrowing to pay for college. But it is also true that the population of
college students has changed over time. There are certainly people who could have gone to
college 10 or 20 years ago without borrowing, but now find no other way to finance their
education, but many more people now go to college than was the case a generation or even a
decade ago.
In the late 1970s, less than one-third of high school graduates from the lowest family
income quintile went straight to college. In the twenty-first century, more than half of this group
starts college right after high school. (Immediate college-going went from about two-thirds to
over 80 percent for those at the top of the income distribution over this time period) (NCES,
2015) (NCES, 2014, Table 302.20).
Total postsecondary enrollment increased by 15 percent between 2007 and 2010. Of the
2.8 million new students, 30 percent were enrolled in for-profit institutions, which accounted for
about seven percent of students in 2007 and ten percent in 2010 (NCES, 2014, Table 302.30). As
noted above, students in this sector borrow significantly more than those with similar levels of
education in the public and private nonprofit sectors. These students tend to be from lower-
income backgrounds, to be older when they enroll, are disproportionately black and Hispanic,
and have relatively low completion rates and weak labor market outcomes.
In other words, a big part of the story is about new subgroups of the population going to
college and about a new set of institutions enrolling many of these students. A large number of
these people come from middle- or lower-income families. Many are adults who are supporting
themselves and sometimes their families. A generation ago there were jobs available to high
school graduates that provided living wages and job security. As that opportunity has faded,
people who would have gotten on-the-job training now go to college. They are part of all of the
college financial aid programs—including student loans.
The student debt picture would look quite different if the only people at issue were the
relatively privileged, mostly young people drawn from traditional college-going populations who
went to college 20 or 30 years ago.
When borrowers don’t repay their debts
Default on student loans is a serious problem for taxpayers, but the consequences for
individuals are most serious. Borrowers may incur high collection charges and have their wages
garnished or tax refunds confiscated. Defaulters are likely to have difficulty accessing credit,
renting an apartment or even getting a job.
The official federal student loan three-year default rate for borrowers who should have
begun making loan payments in 2012-13 was 11 percent, a decline from 15 percent three years
earlier (U.S. Department of Education 2015, 2016).
Insufficient resources surely explain a considerable fraction of default. However, the
federal income-driven student loan repayment options in which a quarter of all borrowers now
participate limit monthly payments to an affordable share of incomes. Moreover, in addition to
objective financial constraints, attitudes and priorities affect how borrowers approach loan
repayment. Some borrowers may view student loan payments as an add-on to all consumption
and to other obligations, including car loans and other forms of credit. It is the student loan
payments that people view as putting them over the edge. It is easy to forget that the education
financed by student loans generates the income for other expenses.
Predictors of default rates
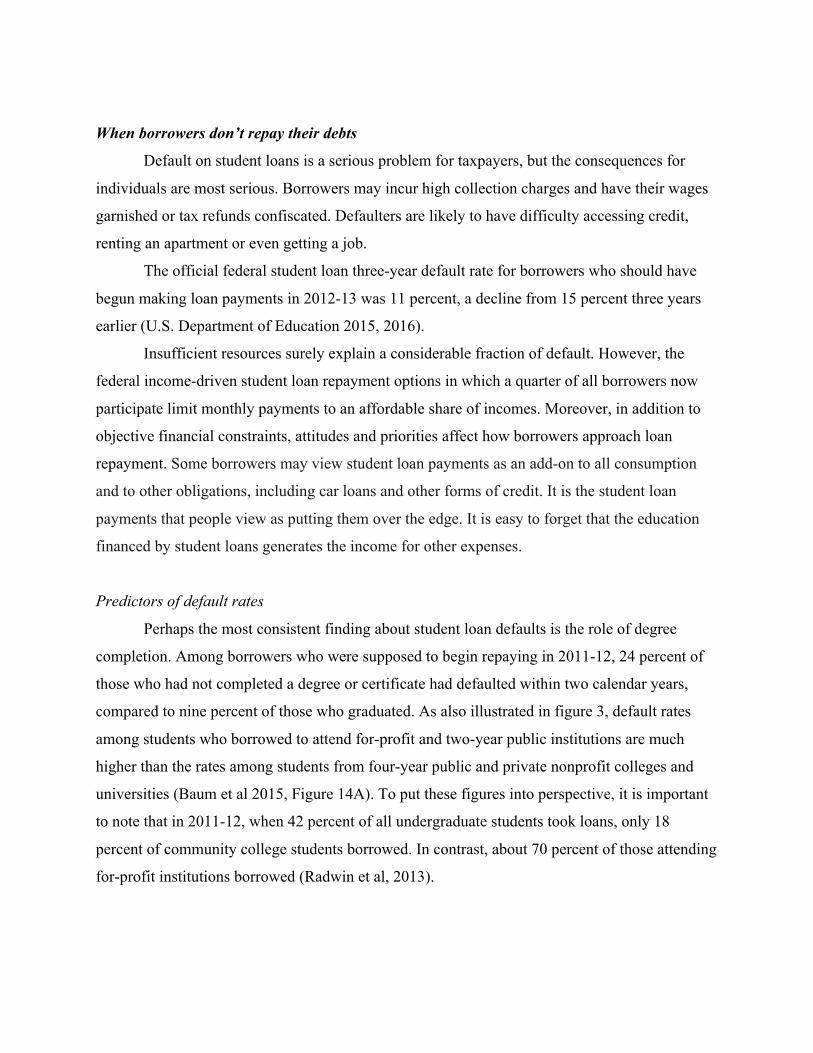
Perhaps the most consistent finding about student loan defaults is the role of degree
completion. Among borrowers who were supposed to begin repaying in 2011-12, 24 percent of
those who had not completed a degree or certificate had defaulted within two calendar years,
compared to nine percent of those who graduated. As also illustrated in figure 3, default rates
among students who borrowed to attend for-profit and two-year public institutions are much
higher than the rates among students from four-year public and private nonprofit colleges and
universities (Baum et al 2015, Figure 14A). To put these figures into perspective, it is important
to note that in 2011-12, when 42 percent of all undergraduate students took loans, only 18
percent of community college students borrowed. In contrast, about 70 percent of those attending
for-profit institutions borrowed (Radwin et al, 2013).

Figure 3
Two-Year Federal Student Loan Default Rate Among Borrowers Entering Repayment in 2011-12, by Sector and Degree Completion Status
Source: Baum et al (2015), Figure 14A. Based on data from Adam Looney and Constantine Yannelis (2015).
Again, it is not the traditional college students frequently making the front page of the
newspaper, but the non-traditional students—likely older, independent, seeking occupational
preparation—who are most likely to encounter repayment problems.
Smaller debts, bigger problems
Notably, it is not borrowers with high levels of debt who are most likely to default. Most
of the four percent of borrowers carrying debts of $100,000 or higher will repay those debts—
they have graduate degrees and relatively high earnings. Rather, as table 4 shows, default rates
are highest for those with the lowest levels of debt and two-thirds of defaulters enter repayment
owing $10,000 or less (Council of Economic Advisers, 2016, Figure 27).
9%
5% 6%
14% 17%
24%
15% 18%
28% 29%
0
0.05
0.1
0.15
0.2
0.25
0.3
0.35
All PrivateNonprofitFour-Year
PublicFour-Year For-Profit PublicTwo-Year
BorrowersWhoCompleted BorrowersWhoDidNotComplete

Table 4
Share of Defaulters and Three-Year Federal Student Loan Default Rate Among Borrowers Entering Repayment in 2010-11, by Loan Balance
Loan Balance Percent Share of Defaulters Less than $5,000 35%
$5,001 to $10,000 31% $10,001 to $20,000 18% $20,001 to $40,000 11% More than $40,000 4%
Default Rate Less than $5,000 24% $5,001 to $10,000 19% $10,001 to $20,000 12% $20,001 to $40,000 8%
More than $40,000 7% Note: Loan balance is as of the time the borrower entered repayment. Source: Council of Economic Advisers (2016), Investing in Higher Education: Benefits, Challenges, and the State of Student Debt, Figure 27.
Many borrowers who owe just a few thousand dollars were in school for just a short
period of time. They may be struggling with their debt because they did not complete the
investment in education necessary to get a real payoff in the labor market—a better job and
higher earnings.
The default rate on student loans is cause for real concern. A system that puts many
people into this situation needs repair. It is also important to remember that when borrowers fail
to repay their federal student loans, if the government never recovers the money, taxpayers are
left holding the bag. It is one thing for society to decide to collect more tax revenues in order to
better fund higher education institutions and their students and quite another to provide
unplanned and arbitrary subsidies to students selected on the basis of failing to meet their
repayment obligations.
Why the misperceptions?
The public faces of the student debt crisis do not coincide with the actual individuals
struggling most with paying for college. Some young people from middle-class families did
accumulate startling amounts of debt in the process of earning their bachelor’s degrees and if

they graduated into the depths of the recession, many struggled to find well-paying jobs. These
former students are very appealing subjects for the media and they know how to make their
voices heard. The older adults who went back to school seeking associate degrees or certificates
and never completed a credential are much less compelling subjects for the press.
That these images have created widespread concern is not surprising. Examples of
uncommon events can be frightening and garner disproportionate attention. In a 2014 Gallup
Poll, Ebola was the third most commonly-cited health issue for Americans, with 17 percent of
respondents seeing it as the nation’s most urgent health problem. Yet there were only four
reported cases in the country (Saad, 2014). Simple ideas are easier to latch onto than more
nuanced realities. Media reports can lead to strong public reactions, leading politicians to
propose policy solutions addressing the emotion, rather than considering the most effective
strategies for dealing with the problems emerging from solid evidence and analysis. Anyone who
claims that the danger is overstated is suspected of association with a cover-up (Kahneman,
2011). This phenomenon rings true to researchers who have tried to counter some of the
misperceptions about student debt.
Is student debt causing serious economic problems?
To really understand how student debt affects individuals and how the amount borrowed
to pay for education affects society and the economy as a whole, we need a counterfactual—an
alternative scenario to use as a comparison. It is obvious that individuals with student debt will
be unable to save and consume as much as similar individuals with the same incomes and no
debt, but the alternative is definitely not everyone having the same level of education without
anyone paying for it. If students don’t borrow, either they will have to pay in another way or
someone else will have to pay.
Parental resources make it possible for some students to graduate without debt while their
classmates are forced to borrow. But the children of affluent parents enjoy much more than just
college without debt. Their parents may support them after graduation so they can take an unpaid
internship that will open professional doors, pay the security deposit when they rent an
apartment, and provide at least part of the down payment for a house. In other words, the absence

of student debt and the accumulation of assets—including buying a house— may both be the
result of parental support.
This reality casts doubt on many of the studies that purport to analyze the impact of
student debt on areas such as home ownership. If the absence of debt meant lower levels of
educational attainment, this group of students would have lower incomes and diminished
wherewithal to finance home purchases. If their parents had paid higher taxes to better fund the
state governments that have cut back on their financing of public higher education, they might
not have been able to help as much with down payments for their children’s houses.
Despite widespread assertions about the relationship between student debt and home
ownership, entrepreneurial activity, and asset accumulation, there is no good causal evidence.
Clearly if people had the same incomes and no debt payments, they would have more options.
But in reality, the alternatives are that someone else will pay—probably through higher taxes—
or fewer people will go to college.
The real problems and promising solutions
The alarmist narrative distracts from the serious problems with student debt that could be
addressed without totally transforming the system of higher education finance or arbitrarily and
disproportionately shifting burdens from the people who benefit most from higher education to
taxpayers in general.
There are problems, but they are different from the problems that many policy proposals
are designed to address:
Students are borrowing to enroll in colleges and programs from which they are unlikely
to graduate and/or which, even if they do graduate, are not likely to lead to positive labor market
outcomes.
Many recent college graduates (and non-graduates) have entered the labor force while the
economy is weak, unemployment is high, and opportunities are scarce.
State disinvestment in higher education has led to rapidly rising tuition levels in public
colleges. The combination of higher tuition and diminished family support has contributed to
rapid increases in borrowing.

In the absence of a strong workforce development system, reasonable support for job
training that does not involve borrowing, and a strong safety net for individuals and families with
inadequate labor market earnings, too many adults who find that their only hope for getting a
good job is to go back to school borrow to enroll in expensive for-profit colleges.
The federal student loan system does not place reasonable limits on the amount graduate
students and parents of dependent students can borrow.
These problems do not imply that the majority of people who have gone to college are
suffering “crushing” student debt or that individuals with student debt are, overall, among the
most financially strained groups in the nation. They do not imply that borrowing to finance an
investment in higher education is a self-destructive decision or that public policy should be
focused either on forgiving the debt of most of those who have borrowed for education or on
preventing students from having to borrow in the future.
Policy solutions
The student loan system could be designed to pay a part of the cost of education for all
borrowers through, for example, interest-free loans. Under this system, anyone who borrows,
regardless of their financial circumstances before or after college, would benefit from taxpayer
subsidies. Because students who do not borrow would miss out on this funding, this type of
system creates the incentive to borrow as much as possible and to postpone repayment for as
long as possible.
At the other end of the spectrum, the system could be self-financing, with borrowers
essentially paying for insurance that causes those with the best outcomes to subsidize those with
the worst outcomes. Students who repay their loans in full in a timely manner would subsidize
those who face difficulties, rather than having taxpayers take on this responsibility.
A reasonable compromise is to limit the across-the-board subsidies—which are best
delivered through general funding for all students, not just those who borrow—but to use the
loan program to support those whose educations do not end up paying for themselves. Borrowers
who reap the typical financial benefits from higher education would repay their loans; the cost of
loan defaults or other payment problems would be borne by taxpayers in general, not just by the
more successful borrowers.

The student loan issue is not monolithic. Graduate students face issues that are quite
different from those faced by typical undergraduates. The circumstances of most older students,
enrolling in college after having been in the labor force for a number of years and frequently
having dependents of their own, are quite different from those of recent high school graduates.
Students borrowing to attend for-profit institutions are particularly vulnerable. And perhaps most
important, too many students borrow for college when they have little chance of completing their
programs.
The prevalence of non-completion would be a serious problem even absent student loans.
It is too often a sign of wasted time, effort, and money, in addition to shattered dreams. We
urgently need stronger pre-college academic preparation, better guidance about choosing schools
and programs, better policing of postsecondary quality, and better student support systems. We
should minimize the number of students who enroll in programs they are not likely to complete,
not just ensure that they don’t borrow excessively to fund these dead-end paths.
We are much more likely to be able to fund these efforts amply if we carefully target
public subsidies to those who need them. Because most students experience significant financial
benefits from their college education, most of them can repay loans. We should not direct our
limited dollars away from the more urgent needs to repaying loans for people with high levels of
education and high earnings potential.
Policies that could reduce the prevalence of borrowing that is unlikely to support
productive investments include:
1) Stricter rules for institutional eligibility for federal student aid programs;
2) Stronger incentives for institutions to improve performance and reduce student debt
levels, possibly through a system forcing institutions to bear part of the financial risk of
unpaid student loans;
3) Better guidance—not just general information— for students making decisions about
what, where, when, and with what intensity to pursue postsecondary studies, with
systems tailored for the differing needs of recent high school graduates and older adults;
4) Better tracking of student success across institutions so they do not borrow for an
unsuccessful course of study at one school and then move on to a different school,
accumulating more debt without any progress toward a credential.
5) Lower loan limits for part-time students;

6) Modifying the policy allowing graduate students and parents of undergraduates to
borrow up to the full cost of attendance (including tuition, fees, room, board, and other
expenses) less grant aid—no matter how high those costs;
In addition to working to prevent problematic borrowing, it is imperative that we improve
the student loan repayment system to make it easier for borrowers to navigate and to
appropriately divide the risks between students and taxpayers. There is growing bipartisan
consensus for a single income-driven repayment plan into which borrowers would be placed
automatically. Having payments withheld from paychecks would ease the repayment process for
borrowers, allow payments to change automatically when earnings change, and ensure that
repaying student loans is not last on the list of personal budget priorities.
The details of such a plan are of course critical. Forgiving unpaid balances after a set
period of time is reasonable, but terms should be set so most borrowers repay their entire
balances. In contrast to current provisions, total payments should bear some relationship to the
amount borrowed and there should be limits on the amount of debt that can be forgiven.
Forgiven balances should no longer be taxable.
There are other fixes short of this comprehensive plan that could ease some of the
problems currently facing too many struggling borrowers. For example, eliminating the
privileged category of private student loans and treating these loans like any other credit in
bankruptcy proceedings, ending the practice of garnishing Social Security payments for student
debts owed, and improving collection practices could all make a difference.
Conclusion
Student debt is seriously harming too many former students. But federal extension of
credit to undergraduate students makes it possible for many individuals, particularly those with
limited financial means, to go to college, to go to an appropriate college, and to succeed in
college. Because of the positive impact of postsecondary education on employment and earnings,
relatively affluent households carry a disproportionate amount of the outstanding student debt.
This reality means that some policies to alleviate debt burdens that sound progressive can
actually skew subsidies away from those who need them most.

It is not borrowers with high levels of debt—most of whom have graduate degrees and
very few of whom have less than a bachelor’s degree—who are struggling most with student
debt. Rather, it is those who borrowed relatively small amounts but did not emerge with
educational credentials of value in the labor market. In other words, forgiving debt across the
board or even lowering interest rates on that debt will provide the largest benefit to people who
don’t really need the help. It will leave many who lack both the financial resources and the
necessary guidance to succeed in the education system and the labor market without the support
they need.
No one should borrow money to go to a postsecondary institution with an abysmal
graduation rate or poor job outcomes for those who do graduate. No one should put time and
effort into such an institution even if it doesn’t require borrowing. But that doesn’t mean that all
borrowing for college is bad. It just has to be cautious and well informed.
Too many students are making decisions about pursuing and financing postsecondary
education without the guidance they need, leading to bad outcomes they could have avoided; too
many students who have difficulty making payments face bureaucratic barriers to accessing the
protections they need; too many borrowers are exploited by abusive collection procedures. We
should improve the choices students make and the public policies that shape those choices. We
should also carefully consider how responsibility for repaying education debt can and should be
shared by individuals and society as a whole.
Addressing the very real problems facing many former students who have borrowed
requires targeting reforms to the causes of these problems. Media sensationalism aside, most—
but not all—borrowers with high levels of debt have earned graduate degrees and repay their
debts out of relatively high earnings. The more intractable problems are among those who
borrowed small amounts of money but did not graduate. The composition of student loan
borrowers has changed over time, including an increasing number of non-completers, older
adults, and former for-profit sector students. In the past, these people would have been on the no-
debt side of the line—and would have no postsecondary education. Addressing their problems is
not the same as treating all student debt as a crisis.
Producing high quality education opportunities requires significant resources. Someone
has to pay. Students are and should be responsible for a portion of that funding. Acknowledging
that reality and working to develop a system that both prepares and protects people seeking to

invest in themselves through postsecondary education should be high on the national policy
agenda.
Resources
Baum, S. (2016). Student Debt: Rhetoric and Realities of Higher Education Financing. New
York: Palgrave Macmaillan.
Baum, S., Elliott, D., & Ma, J. (2014). Trends in Student Aid 2014. New York: The College Board. Baum, S., Ma, J., Pender, M., & Bell, D. (2015). Trends in Student Aid 2015. New York: The College Board. Baum, S., Ma, J., Pender, M., & Welch, M. (2016). Trends in Student Aid 2016. New York: The College Board. Bernard, T. (2015, September 4). “The Many Pitfalls of Private Student Loans,” The New York Times. Council of Economic Advisers (2016). Investing in Higher Education: Benefits, Challenges, and the State of Student Debt. Retrieved from https://www.whitehouse.gov/sites/default/files/page/files/20160718_cea_student_debt.pdf. Federal Reserve Bank of New York, (2016, August). Quarterly Report on Household Debt and Credit, retrieved from https://www.newyorkfed.org/medialibrary/interactives/householdcredit/data/pdf/HHDC_2016Q2.pdf. Kahneman, D. (2011). Thinking, Fast and Slow. New York: Farrar, Straus and Giroux. Looney, A. & Yannelis, C. (2015, September). “A crisis in student loans? How changes in the characteristics of borrowers and in the institutions they attended contributed to rising loan defaults.” Brookings Papers on Economic Activity. Martin, A. &Lehren, A. (2012, May 12). “A Generation Hobbled by the Soaring Cost of College,” New York Times.. NCES (2012). National Postsecondary Student Aid Study 2012, Power Stats, http://nces.ed.gov/datalab/. NCES (2014). Digest of Education Statistics 2014. U.S. Department of Education. Retrieved from https://nces.ed.gov/programs/digest/2014menu_tables.asp.

NCES (2015). Digest of Education Statistics 2014. U.S. Department of Education. Retrieved from https://nces.ed.gov/programs/digest/2015menu_tables.asp. Queally, J. (2014, November 13). “The Unforgiven: How College Debt is Crushing a Generation,” Common Dreams. Retrieved from http://www.commondreams.org/news/2014/11/13/unforgiven-how-college-debt-crushing-generation. Radwin D., Wine, J., Siegel, P& Bryan, M. (2013). 2011-12 National Postsecondary Student Aid Study (NPSAS:12): Student Financial Aid Estimates for 2011-12, 2013-165. Washington, DC: National Center for Education Statistics. Saad, L. (2014, November 17). “Ebola Ranks Among Americans’ Top Three Health Concerns,” Gallup. Retrieved from http://www.gallup.com/poll/179429/ebola-ranks-among-americans-top-three-healthcare-concerns.aspx. U.S. Census Bureau (2015), Current Population Survey Tables for Personal Income 2015, PINC-03. Retrieved from http://www.census.gov/data/tables/time-series/demo/income-poverty/cps-pinc.html. U.S. Department of Education (2015). “National Student Loan Default Rates,” Federal Student Aid,. Retrieved from http://www.ifap.ed.gov/eannouncements/attachments/093015AttachOfficialFY20123YRCDRBriefing.pdf; U.S. Department of Education (2016). “Official Cohort Default Rates for Schools,” Federal Student Aid 2016. Retrieved from http://www2.ed.gov/offices/OSFAP/defaultmanagement/schooltyperates.pdf
Top Related
Copyright © 2022 FDOKUMEN

