


Bahasa
Halaman
Hukum

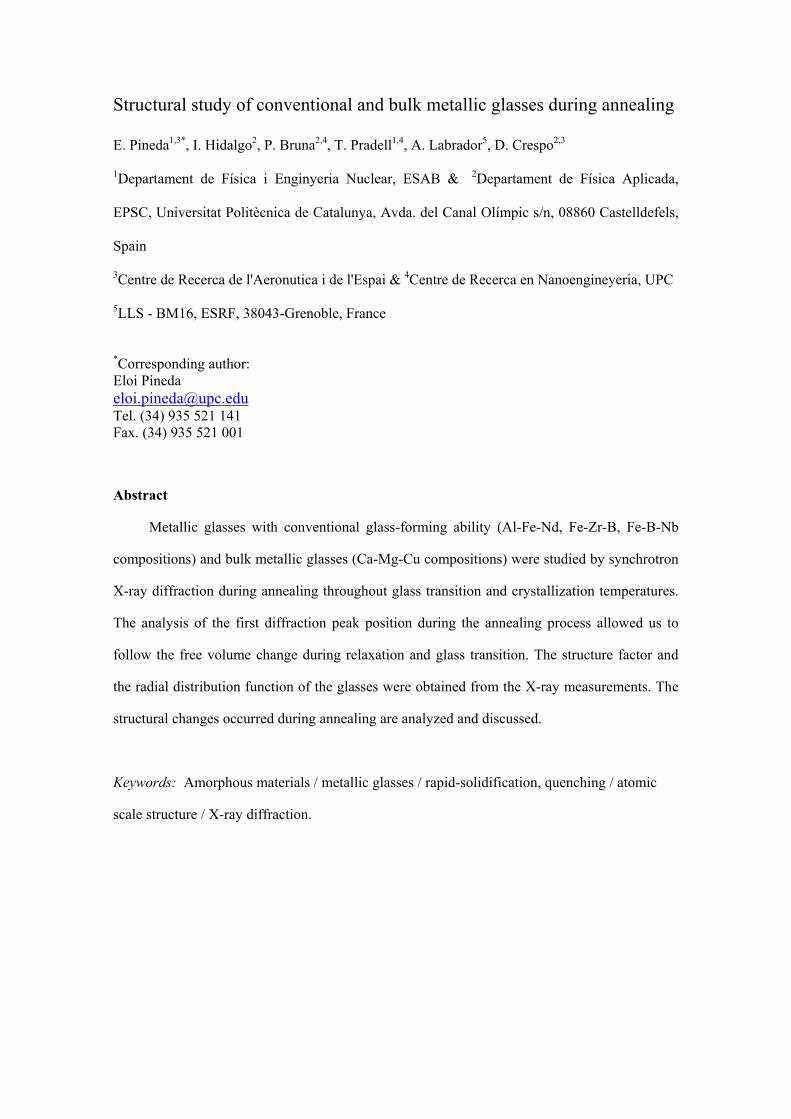
Structural study of conventional and bulk metallic glasses during annealing
E. Pineda1,3*, I. Hidalgo2, P. Bruna2,4, T. Pradell1,4, A. Labrador5, D. Crespo2,3
1Departament de Física i Enginyeria Nuclear, ESAB & 2Departament de Física Aplicada,
EPSC, Universitat Politècnica de Catalunya, Avda. del Canal Olímpic s/n, 08860 Castelldefels,
Spain
3Centre de Recerca de l'Aeronutica i de l'Espai & 4Centre de Recerca en Nanoengineyeria, UPC
5LLS - BM16, ESRF, 38043-Grenoble, France
*Corresponding author: Eloi Pineda [email protected] Tel. (34) 935 521 141 Fax. (34) 935 521 001
Abstract
Metallic glasses with conventional glass-forming ability (Al-Fe-Nd, Fe-Zr-B, Fe-B-Nb
compositions) and bulk metallic glasses (Ca-Mg-Cu compositions) were studied by synchrotron
X-ray diffraction during annealing throughout glass transition and crystallization temperatures.
The analysis of the first diffraction peak position during the annealing process allowed us to
follow the free volume change during relaxation and glass transition. The structure factor and
the radial distribution function of the glasses were obtained from the X-ray measurements. The
structural changes occurred during annealing are analyzed and discussed.
Keywords: Amorphous materials / metallic glasses / rapid-solidification, quenching / atomic
scale structure / X-ray diffraction.

Introduction
The study of the mechanical properties of amorphous or glassy alloys has become an
active field of research, as the improvement of these properties promises future applications of
metallic glasses (MG) as structural materials. The ductility of these materials is one of the key
properties determining their applicability [1]. Recently, molecular dynamics simulations showed
that the plastic deformation process is closely related to the presence of certain configurations in
the atomic structure [2]; open atomic configurations facilitate plastic flow and the initiation of
shear bands, hence improving ductility. Other theoretical studies relate changes of the elastic
constants to small variations of the mean position and width σ of the first-neighbour peak of the
atomic radial distribution function (RDF) [3]. A reduction of σ, as expected after structural
relaxation, implies an increase of the shear to bulk modulus ratio thus stiffening the material and
reducing ductility. Experimentally, some MG alloys show a transition from ductile to brittle
behaviour after structural relaxation [4], as the densification occurred during relaxation involves
the reduction of open atomic configurations thus blocking plastic flow. In the super-cooled
liquid state, the temperature-viscosity behaviour can be interpreted in terms of free volume
change in the liquid. In the amorphous solid state, the free volume quenched-in during the glass
transition characterizes the glassy state, and can be reduced because of structural relaxation
during annealing treatments. The presence of free-volume, that from a microscopic point of
view implies more open atomic arrangements, has also been shown to facilitate homogeneous
plastic deformation [5].
The study of the atomic structure of MG alloys and its evolution during annealing
processes is then important for understanding the mechanical properties of these materials and
for finding strategies to improve them. In this paper we present in-situ synchrotron X-ray
diffraction measurements that allow us to study the thermal dilatation, the free volume change
and the crystallization occurred during annealing of MGs. Results for the radial distribution
function and volume change during the heating treatments are analyzed and discussed.
Experimental details
Metallic glass samples were obtained as ribbons by melt-spinning; their glass transition
and crystallization were previously analysed by DSC measurements. The compositions studied
in the present work are listed in table 1. The Al and Fe-based alloys are conventional metallic
glasses with low glass forming ability while the Ca-Mg-Cu alloys are bulk metallic glasses with
large glass stability. The thickness of the ribbons ranges from 30 to 140 µm depending on the
alloy. The X-ray measurements were performed at the BM16 line of the European Synchrotron
Radiation Facility (ESRF). The ribbons were cut in 0.3×1 cm pieces and introduced into a
Linkam hot stage, fixed in a metallic washer. The diffracted intensity was collected by a 2-
dimensional ADSC Q210r CCD detector perpendicular to the incident beam in transmission
geometry. The time-resolution of the X-ray detector allowed us to follow the structural changes
of the samples throughout the annealing process. Various annealing protocols with heating and
cooling rates of 10-20 K/min were applied, and spectra were acquired every 5 s. The annealing
was performed under nitrogen flow in order to minimize the oxidation of the samples.
The radiation energy used was of 15 keV with a corresponding wave length of 0.826 Å.
The spectra used to determine the RDF of the alloys at different points during the annealing
protocols were treated separately. The total intensity elastically scattered by the samples I(Q)
was obtained subtracting background and applying absorption, multiple scattering, and inelastic
Compton scattering corrections. The absorption correction in flat transmission geometry was
performed following ref. [6]. The Compton scattering contribution was calculated using the
fitting parameters provided in ref. [7] for the different elements. The normalization factor was
obtained by the Krogh-Moe-Norman method. From I(Q) the total structure factor S(Q) was
obtained by
( )( )
12
2
+−
=f
fQIQS (1)
and the average atomic factors of the alloys f were calculated using the tabulated values in
refs. [8,9] compiled in the DABAX data base [10]. The reduced radial distribution function was
then obtained by Fourier transformation
( ) ( )[ ] ( )[ ] ( )∫ −=−=max
00 sin1214
Q
dQQrQSQrgrrGπ
ρπ (2)
where g(r) is the pair distribution function, and the radial distribution function is then calculated
as ( ) ( )rgrrRDF 024 ρπ= . The experimental setup allows the measurement of the diffracted
intensity up to Qmax=8 Å-1. This low value of Qmax impedes a proper normalization of I(Q) and it
is expected to broaden artificially the peaks of the calculated RDFs [6,11].
Results and discussion
The intensity diffracted by the samples was recorded at temperature intervals of 0.833 K
and 1.67 K for heating or cooling rates of respectively 10 K/min and 20 K/min; this allows us to
follow accurately the structural changes all along the annealing protocols. The onset of
crystallization can be well determined due to the high resolution of the synchrotron
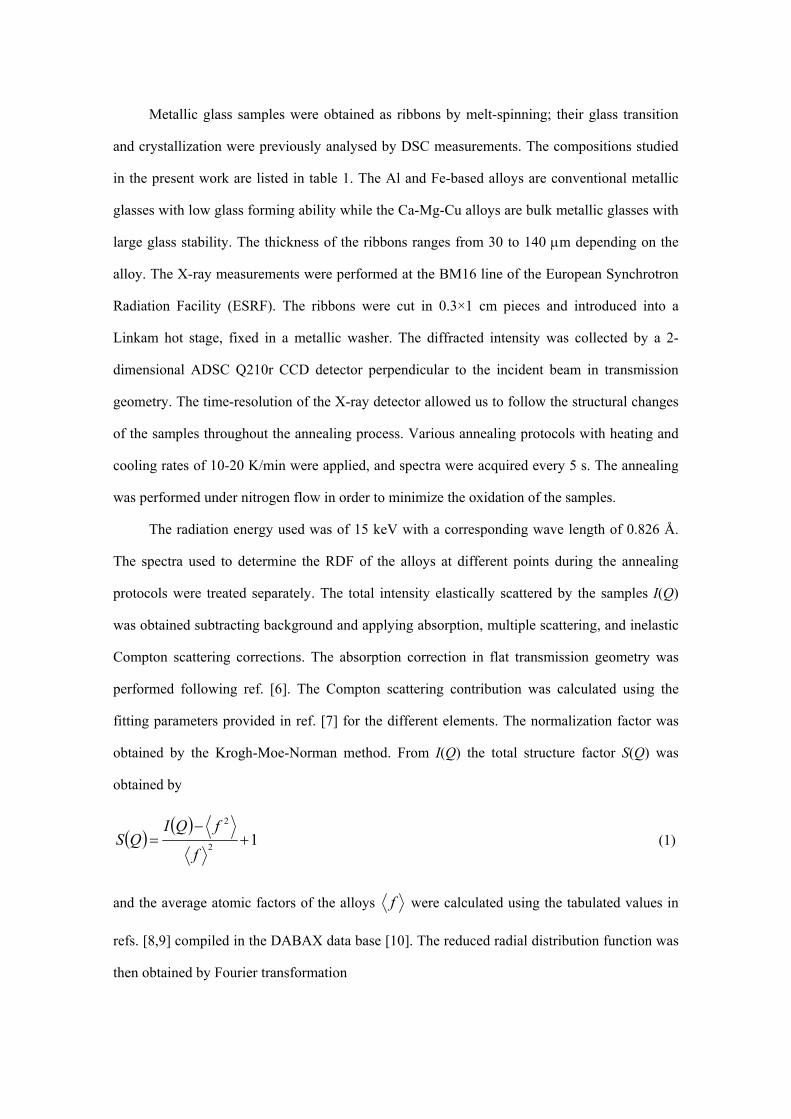
measurements. Figure 1 shows the appearance of peaks for the Al90Fe5Nd5 alloy due to the
primary crystallization of crystalline Al. These crystalline peaks are noticed since T=188.1 ºC,
corresponding to the diffraction spectrum depicted with dashed line in figure 1. Previous DSC
measurements of the same alloy (figure 1 inset) gave a primary crystallization temperature of
Tx1=185 ºC for the same heating rate.
Although crystallization is observed from the initial stages, the structural changes in the
glassy state are hardly perceived in the diffracted intensities or the corresponding structure
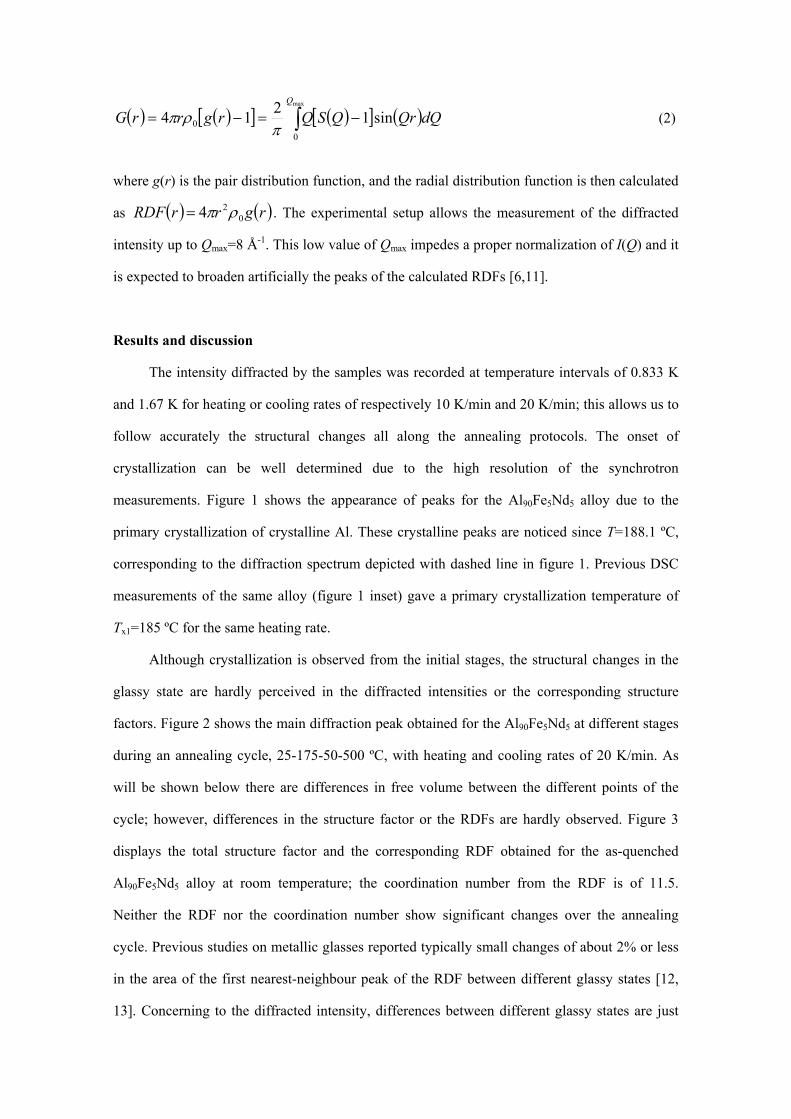
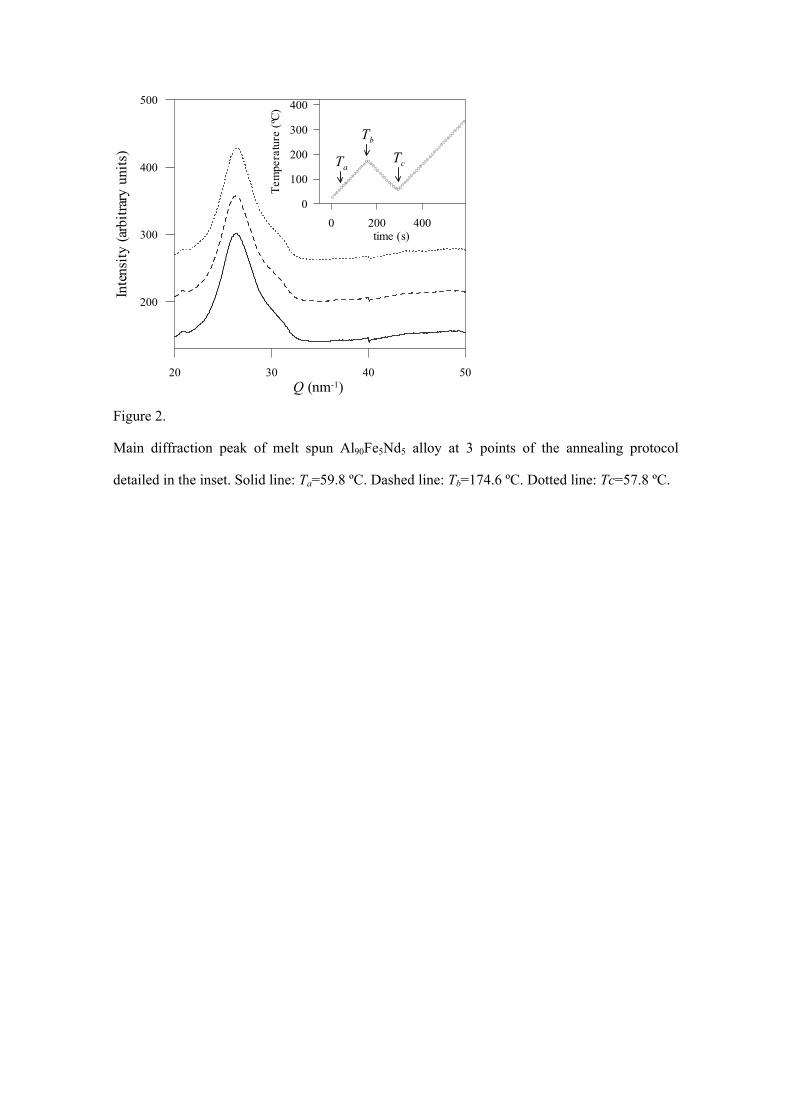
factors. Figure 2 shows the main diffraction peak obtained for the Al90Fe5Nd5 at different stages
during an annealing cycle, 25-175-50-500 ºC, with heating and cooling rates of 20 K/min. As
will be shown below there are differences in free volume between the different points of the
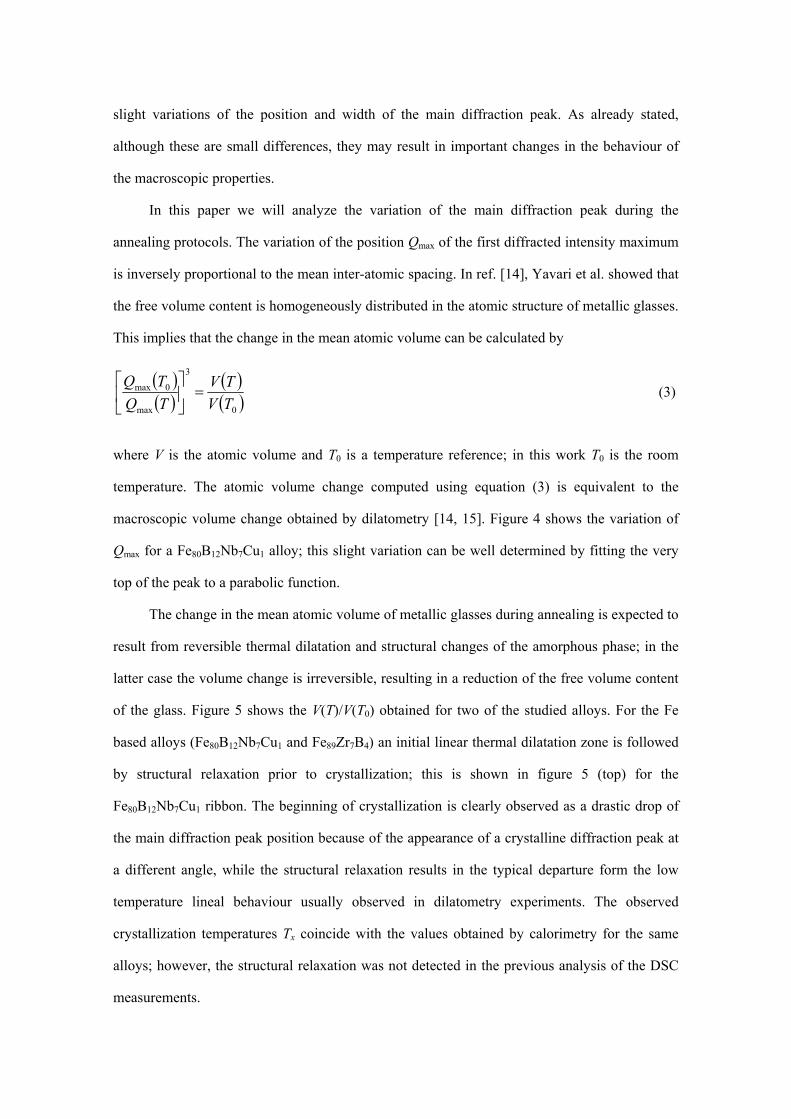
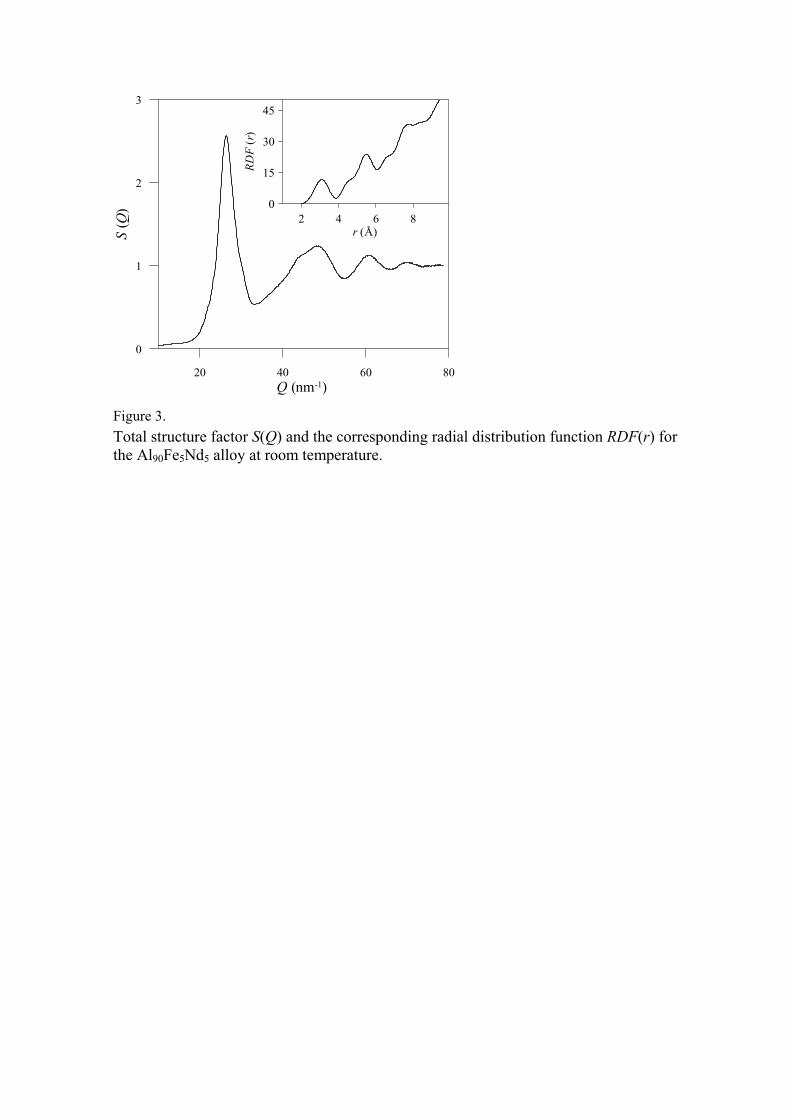
cycle; however, differences in the structure factor or the RDFs are hardly observed. Figure 3
displays the total structure factor and the corresponding RDF obtained for the as-quenched
Al90Fe5Nd5 alloy at room temperature; the coordination number from the RDF is of 11.5.
Neither the RDF nor the coordination number show significant changes over the annealing
cycle. Previous studies on metallic glasses reported typically small changes of about 2% or less
in the area of the first nearest-neighbour peak of the RDF between different glassy states [12,
13]. Concerning to the diffracted intensity, differences between different glassy states are just
slight variations of the position and width of the main diffraction peak. As already stated,
although these are small differences, they may result in important changes in the behaviour of
the macroscopic properties.
In this paper we will analyze the variation of the main diffraction peak during the
annealing protocols. The variation of the position Qmax of the first diffracted intensity maximum
is inversely proportional to the mean inter-atomic spacing. In ref. [14], Yavari et al. showed that
the free volume content is homogeneously distributed in the atomic structure of metallic glasses.
This implies that the change in the mean atomic volume can be calculated by
( )( )
( )( )0
3
max
0max
TVTV
TQTQ
=
(3)
where V is the atomic volume and T0 is a temperature reference; in this work T0 is the room
temperature. The atomic volume change computed using equation (3) is equivalent to the
macroscopic volume change obtained by dilatometry [14, 15]. Figure 4 shows the variation of
Qmax for a Fe80B12Nb7Cu1 alloy; this slight variation can be well determined by fitting the very
top of the peak to a parabolic function.
The change in the mean atomic volume of metallic glasses during annealing is expected to
result from reversible thermal dilatation and structural changes of the amorphous phase; in the
latter case the volume change is irreversible, resulting in a reduction of the free volume content
of the glass. Figure 5 shows the V(T)/V(T0) obtained for two of the studied alloys. For the Fe
based alloys (Fe80B12Nb7Cu1 and Fe89Zr7B4) an initial linear thermal dilatation zone is followed
by structural relaxation prior to crystallization; this is shown in figure 5 (top) for the
Fe80B12Nb7Cu1 ribbon. The beginning of crystallization is clearly observed as a drastic drop of
the main diffraction peak position because of the appearance of a crystalline diffraction peak at
a different angle, while the structural relaxation results in the typical departure form the low
temperature lineal behaviour usually observed in dilatometry experiments. The observed
crystallization temperatures Tx coincide with the values obtained by calorimetry for the same
alloys; however, the structural relaxation was not detected in the previous analysis of the DSC
measurements.
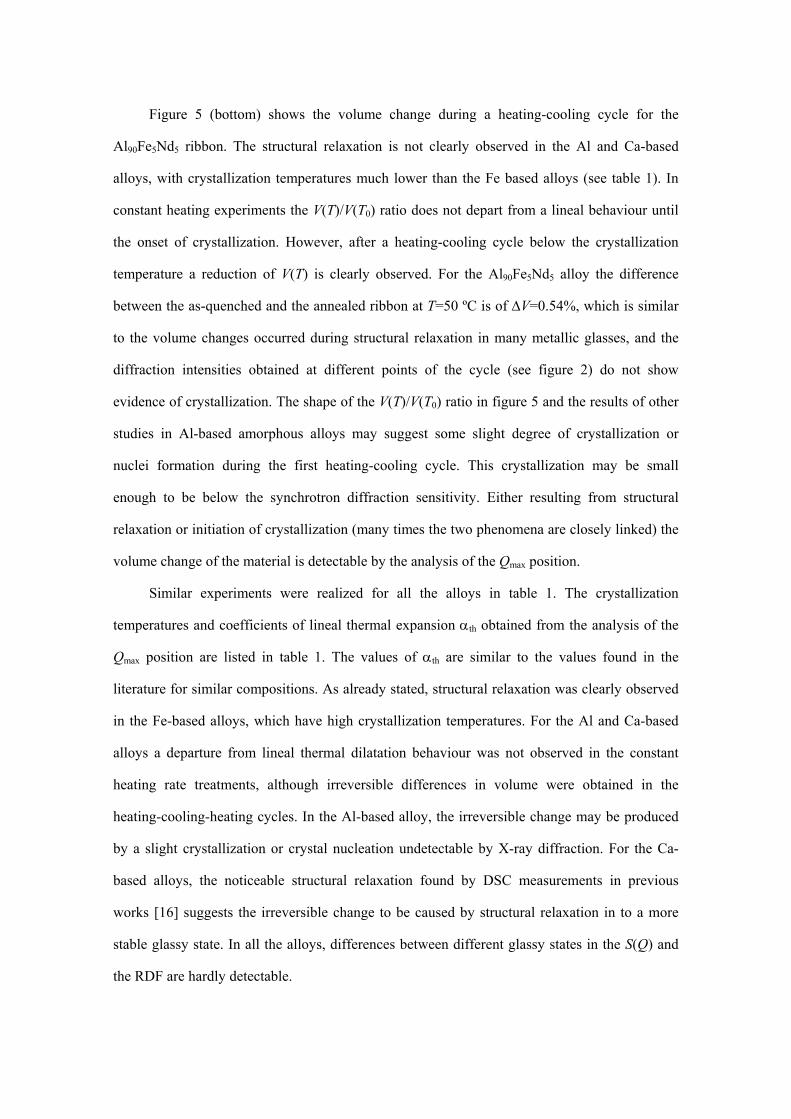
Figure 5 (bottom) shows the volume change during a heating-cooling cycle for the
Al90Fe5Nd5 ribbon. The structural relaxation is not clearly observed in the Al and Ca-based
alloys, with crystallization temperatures much lower than the Fe based alloys (see table 1). In
constant heating experiments the V(T)/V(T0) ratio does not depart from a lineal behaviour until
the onset of crystallization. However, after a heating-cooling cycle below the crystallization
temperature a reduction of V(T) is clearly observed. For the Al90Fe5Nd5 alloy the difference
between the as-quenched and the annealed ribbon at T=50 ºC is of ∆V=0.54%, which is similar
to the volume changes occurred during structural relaxation in many metallic glasses, and the
diffraction intensities obtained at different points of the cycle (see figure 2) do not show
evidence of crystallization. The shape of the V(T)/V(T0) ratio in figure 5 and the results of other
studies in Al-based amorphous alloys may suggest some slight degree of crystallization or
nuclei formation during the first heating-cooling cycle. This crystallization may be small
enough to be below the synchrotron diffraction sensitivity. Either resulting from structural
relaxation or initiation of crystallization (many times the two phenomena are closely linked) the
volume change of the material is detectable by the analysis of the Qmax position.
Similar experiments were realized for all the alloys in table 1. The crystallization
temperatures and coefficients of lineal thermal expansion αth obtained from the analysis of the
Qmax position are listed in table 1. The values of αth are similar to the values found in the
literature for similar compositions. As already stated, structural relaxation was clearly observed
in the Fe-based alloys, which have high crystallization temperatures. For the Al and Ca-based
alloys a departure from lineal thermal dilatation behaviour was not observed in the constant
heating rate treatments, although irreversible differences in volume were obtained in the
heating-cooling-heating cycles. In the Al-based alloy, the irreversible change may be produced
by a slight crystallization or crystal nucleation undetectable by X-ray diffraction. For the Ca-
based alloys, the noticeable structural relaxation found by DSC measurements in previous
works [16] suggests the irreversible change to be caused by structural relaxation in to a more
stable glassy state. In all the alloys, differences between different glassy states in the S(Q) and
the RDF are hardly detectable.
Conclusions
The structure of metallic glass ribbons during annealing has been studied by synchrotron
X-ray diffraction. For the investigated alloys, structural changes between glassy states are
hardly detectable from the total structure factors. The analysis of the main peak position allows
to detect structural relaxation, differences in free volume content and the onset of
crystallization. Further analysis of the total and partial radial distribution functions at different
points of the annealing protocols may unveil the changes in the atomic structure occurred during
the process and responsible for the differences in mean atomic volume.
Acknowledgements
The authors thank Dr. J. Molera from the Universitat de Girona for her help in DSC and
dilatometer measurements. Work funded by CICYT, grant MAT2004-01214 and Generalitat de
Catalunya, grants 2005SGR00535 and 2005SGR201.
References
[1] M.F. Ashby, A.L. Greer, Scripta Mater. 54 (2006) 321-326.
[2] M. Wakeda, Y. Shibutani, S. Ogata, J. Park, Intermetallics 15 (2007) 139-144.
[3] E. Pineda, Phys. Rev. B 73 (2006) 104109.
[4] J.J. Lewandowski, W.H. Wang, A.L. Greer, Philos. Mag. Lett. 85 (2005) 77–87.
[5] F. Spaepen, Scripta Mater. 54 (2006) 363-367.
[6] Y. Waseda, The Structure of Non-Crystalline Materials, McGraw-Hill, 1980.
[7] H.H.M. Balyuzi, Acta Cryst. A31 (1975) 600.
[8] D. Waasmaier, A. Kirfel, Acta Cryst. A51 (1995), 416-413.
[9] L. Kissel, B. Zhou, S. C. Roy, S. K.S. Gupta , R. H. Pratt, Acta Cryst. A51 (1995) 271-
288.
[10] DABAX A Dynamic Database for X-ray Applications. B. Roux and M.S. del Rio,
European Synchrotron Radiation Facility.
[11] Th. Proffen, S.J.L. Billinge, T. Egami, D. Louca, Z. Kristallogr. 218 (2003) 132-143.
[12] Y. Waseda, T. Egami, J. Mater. Sci. 14 (1979) 1249.
[13] H.S. Chen, K.T. Aust, Y. Waseda, J. Mater. Sic. Lett. 2 (1983) 153.
[14] A.R. Yavari, A. Le Moulec, A. Inoue, N. Nishiyama, N. Lupu, E. Matsubara, W.J. Botta,
G. Vaughan, M. Di Michiel, A. Kvick, Acta mater. 53 (2005) 1611-1619.
[15] D.V. Louzguine, A.R. Yavari, K. Ota, G. Vaughan, A. Inoue, J. Non-Cryst. Solids 351
(2005) 1639-1645.
[16] E. Pineda, Y. Zhang, A.L. Greer, J. Alloys and Compounds 434-435 (2007) 145-148.
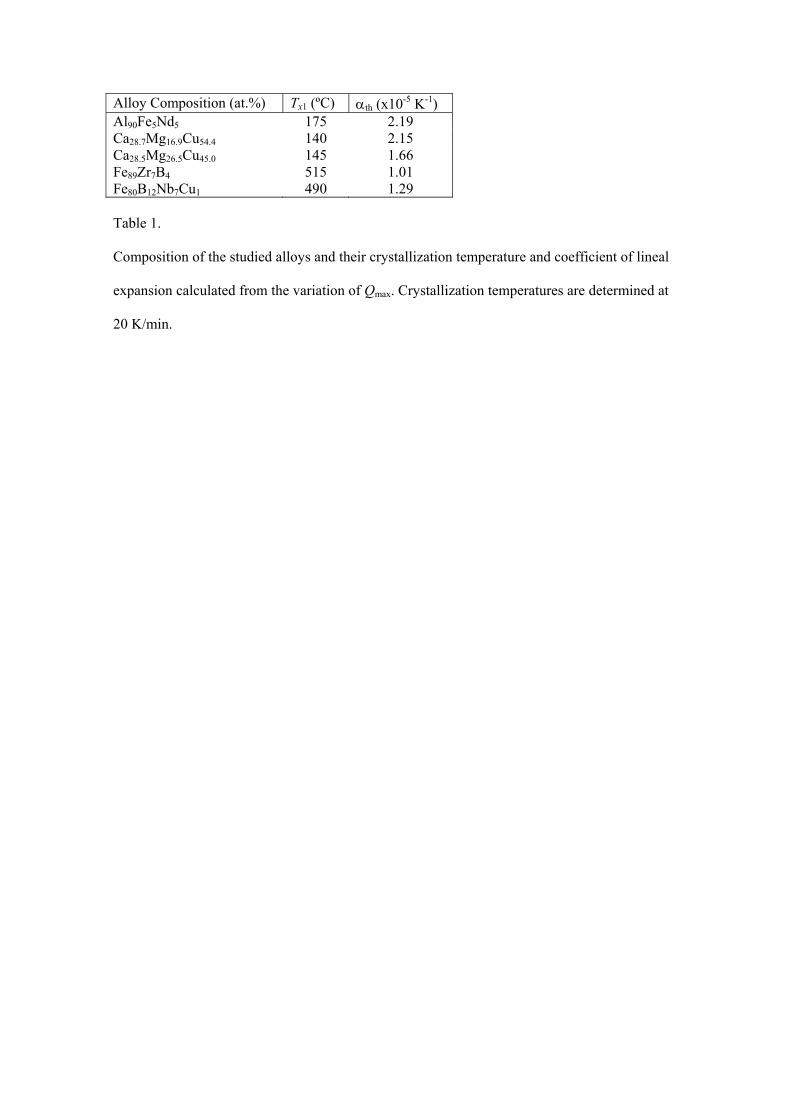
Alloy Composition (at.%) Tx1 (ºC) αth (x10-5 K-1) Al90Fe5Nd5 175 2.19 Ca28.7Mg16.9Cu54.4 140 2.15 Ca28.5Mg26.5Cu45.0 145 1.66 Fe89Zr7B4 515 1.01 Fe80B12Nb7Cu1 490 1.29 Table 1.
Composition of the studied alloys and their crystallization temperature and coefficient of lineal
expansion calculated from the variation of Qmax. Crystallization temperatures are determined at
20 K/min.

Tx1
Tm
20 24 28 32 36 40Q (nm-1)
1000
1500
2000
2500In
tens
ity (a
rbitr
ary
units
)
200 400 600Temperature (ºC)
Hea
t flo
w
Tx2
Figure 1.
Main diffraction peak of melt spun Al90Fe5Nd5 alloy at 3 different temperatures during
annealing with a heating rate of 20 K/min. The emergence of two peaks of crystalline Al is
observed. Solid line: T=164.5 ºC. Dashed line: T=188.1 ºC. Dotted line: T=212.3 ºC. Inset: DSC
curve for Al90Fe5Nd5 alloy.
TaTc
20 30 40 50Q (nm-1)
200
300
400
500
Inte
nsity
(arb
itrar
y un
its)
0 200 400time (s)
0
100
200
300
400
Tem
pera
ture
(ºC)
Tb
Figure 2.
Main diffraction peak of melt spun Al90Fe5Nd5 alloy at 3 points of the annealing protocol
detailed in the inset. Solid line: Ta=59.8 ºC. Dashed line: Tb=174.6 ºC. Dotted line: Tc=57.8 ºC.
20 40 60 80Q (nm-1)
0
1
2
3
S (Q
)
2 4 6 8r (Å)
0
15
30
45
RDF
(r)
Figure 3. Total structure factor S(Q) and the corresponding radial distribution function RDF(r) for the Al90Fe5Nd5 alloy at room temperature.

28 30 32 34Q (nm-1)
0
4000
8000In
tens
ity (a
rbitr
ary
units
)
T=26.1 ºC
Qmax variationIncreasing T
T=403.9 ºC
25 50 75Q (nm-1)
Inte
nsity
Figure 4.
Variation of the position of the main diffraction peak during annealing for a melt-spun
Fe80B12Nb7Cu1 alloy. Inset: Complete diffracted spectra at the same temperatures.

Al90Fe5Nd5 alloy
Fe80B12Nb7Cu1 alloy
0 200 400 600
1
1.005
1.01
1.015
1.02
Tg ?
Onset of structuralrelaxation
Onset of primarycrystallization
Coefficient of linealthermal expansion:αth=1.29x10⁻⁵ (K-1)
0 50 100 150 200
T (ºC)
0.99
0.995
1
1.005
1.01
Q3 m
ax(T
0)/Q
3 max
(T)=
V(T)
/V(T
0)
20 K/min
-20 K/min
20 K/min∆V
αth=2.30x10⁻⁵ (K-1)
Onset of primarycrystallization
Figure 5.
Mean atomic volume change of amorphous metallic ribbons during annealing protocols. Top:
Fe80B12Nb7Cu1 alloy during a heating protocol at 20 K/min. Bottom: Al90Fe5Nd5 alloy during a
heating-cooling-heating cycle at 20 K/min.
Top Related
Copyright © 2022 FDOKUMEN

