


Bahasa
Halaman
Hukum

HYDRO NEPAL ISSUE NO. 14 JANUARY, 2014 53
Introduction
With the growth of interconnected power systems and the emergence of rapidly increasing
distributed generation, complexities about efficiencies also increase. Thermal power plants are the main source of power supply in many countries including India. Hence, generation scheduling of thermal power plants has been studied mainly in relation to the uncertainties of fuel costs and various operational constraints. Increasing environmental awareness has drawn more researchers to the issues of environmentally-friendly water, and optimum utilization of water in hydro power plants. Soares and Salmazo (1997) presented a pre-dispatch model for hydroelectric power system that minimizes generation and transmission losses on hourly basis. This model has been applied to a hydroelectric power system in Brazil and significant savings were realized. Pérez-Díaz et al. (2010) proposed a non-linear programming based model to solve short-term operation scheduling problems for a single hydropower plant with an objective to maximize its revenues. The study focuses on water discharge and reservoir volume and the schedules of start-ups/shut-downs to obtain unit commitment and dispatch of the committed units.
The concept presented in this paper focuses on a large capacity, multi-unit hydroelectric power plant equipped with Francis turbines whose efficiency varies considerably with the variation in head and output/ discharge. At a given head, as discharge increases, turbine efficiency also increases until it reaches its maximum value, after which point efficiency begins to fall with further increase in discharge. In short term scheduling for a day, the variation in water elevation of a large capacity reservoir is very small (Pérez-Díazet
al. 2010; Soares et al. 2003) but variation in tail water elevation may be significant depending on number of units in operation.
The operational strategies proposed are based on the operation of turbines at maximum efficiencies. The methodology considers all the hydraulic losses, including loss of water in start-ups/shut-downs and electrical losses upto the switchyard. The units are operated within constraints and bounds like reservoir levels, head, output, and other factors in order to ensure satisfactory performance. The units are operated at constant loads in different time periods as advised by the Load Dispatch Centre. Operation with the proposed methodology minimizes discharge and, in turn, total requirement of water. In addition, the operating reserve is created which is readily available to feed the grid in the event of fall in frequency. In interstate rivers, release of obligatory quantity of water is regulated and monitored by the river control authority. By adopting the proposed concept, enhanced generation is achieved with the same quantity of water. An associated benefit is the increase in reactive power of generator with the fall in reservoir level which can be utilized to regulate the grid voltage.
Operational Considerations and Constraints Various considerations and constraints in the operation of a power plant are discussed in this section.
Generator Output Generator power in a power plant is transferred through bus ducts, a transformer, and link lines to the switchyard. Efficiency of power transfer (Etrans) from generator terminals to the switchyard may be above 99% for large generating units and is calculated as:
Strategic Planning for Operation of Large Hydropower Plants Shambhu Ratan Awasthi, Vishnu Prasad and Saroj Rangnekar
Abstract: Electricity is an integral part of modern life. The main sources of power generation continue to be the fossil fuels which are largely responsible for global warming. In view of environmental concerns, there is increasing aware-ness on judicious use of natural resources, including water. Large hydroelectric power plants are generally multi-pur-pose projects and require huge quantities of water for their operation. Usually the generating units in a hydroelectric power plant are put in operation to meet the electrical load demand without considering the efficiency of the units, which can lead to excessive water use. It is now need of the hour to pay more attention to optimizing the utilization of water in hydroelectric power plants.
This paper presents strategic planning for optimal operation of large hydroelectric power plants. Large variation in efficiency of a Francis turbine forms the basis of proposed methodology in which turbines are operated at maximum efficiency. In one approach, discharge is minimized for constant load operation thus conserving water. In another approach, generation is maximized with the same quantity of water. The fringe benefits include creation of operating reserve and availability of additional reactive power in the generator.
Key words: Strategic planning, short term generation scheduling, hydro turbine efficiency, operating reserve, fre-quency control
Shambhu Ratna Awasti Vishnu Prasad Saroj Rangnekar
HYDRO NEPAL ISSUE NO. 14 JANUARY, 2014 54
(1)
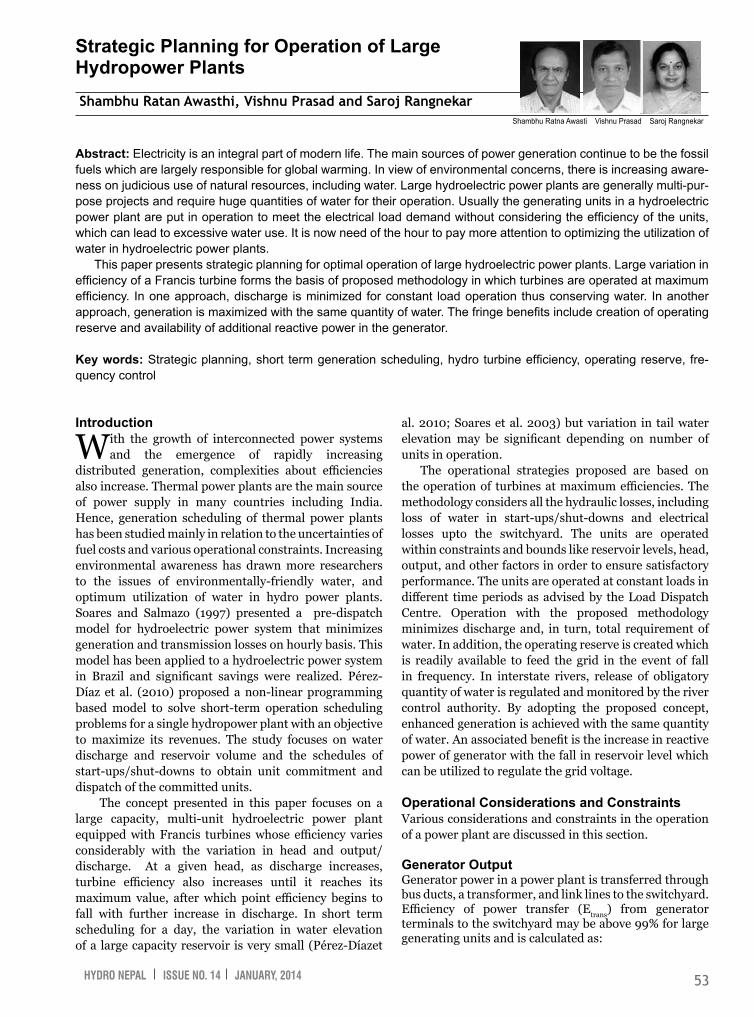
Generator Input The generator input (i.e. turbine output) is obtained from a generator efficiency curve. A typical curve is shown in Figure 1.Turbine Output Power output of a hydro turbine in MW is given by:
Head Loss in Water Conductor System
The loss in a water conductor system is proportional to the square of discharge.
The proportionality constant (klos) represents characteristics of a water conductor system. Equivalent head loss is subtracted from gross head to get net head.
Loss of Water in Start-ups and Shut-downs In the starting process, the speed of a hydro turbine is raised to synchronous speed and voltage is built-up followed by synchronization and loading of the unit. Nilsson and Sjelvgren (1997) have proposed an algorithm for computing loss of water in start-ups and shut-downs. However, the following empirical formulae are used based on author’s own experience and interaction with power plant operators:
T1, T2 and T3 are taken as 30s, 60s, and 30s
respectively. Similarly, loss of water in each shut-down = Stopping time (T4) is taken as 60s during which
discharge reduces to zero.
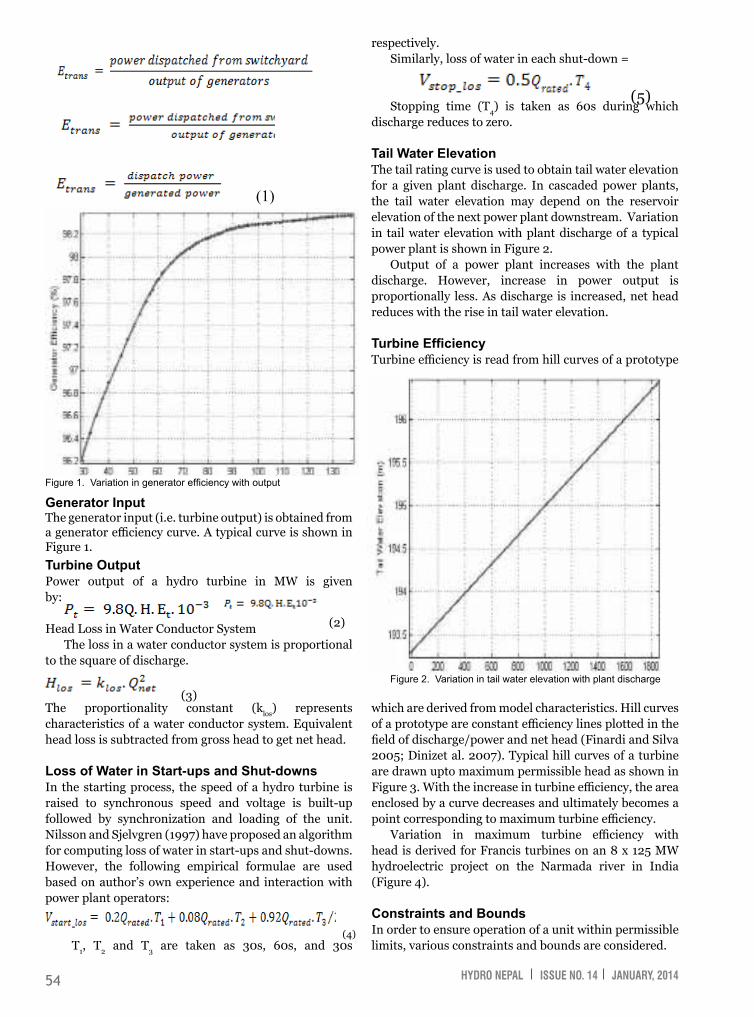
Tail Water ElevationThe tail rating curve is used to obtain tail water elevation for a given plant discharge. In cascaded power plants, the tail water elevation may depend on the reservoir elevation of the next power plant downstream. Variation in tail water elevation with plant discharge of a typical power plant is shown in Figure 2.
Output of a power plant increases with the plant discharge. However, increase in power output is proportionally less. As discharge is increased, net head reduces with the rise in tail water elevation.
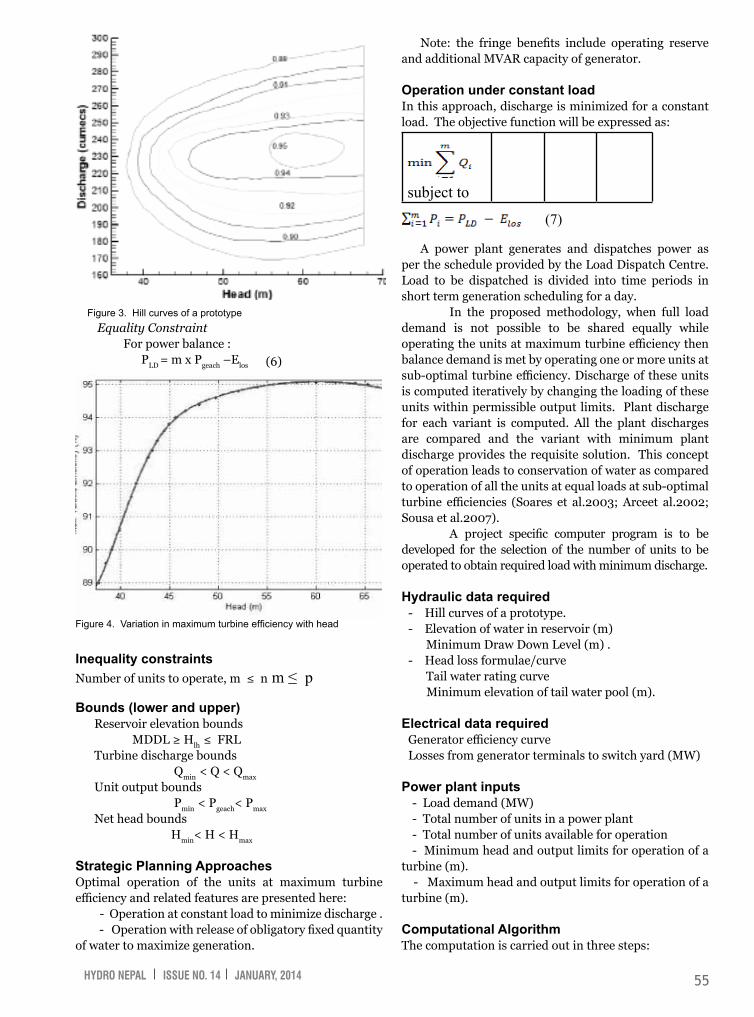
Turbine Efficiency Turbine efficiency is read from hill curves of a prototype
Figure 1. Variation in generator efficiency with output
Figure 2. Variation in tail water elevation with plant discharge
which are derived from model characteristics. Hill curves of a prototype are constant efficiency lines plotted in the field of discharge/power and net head (Finardi and Silva 2005; Dinizet al. 2007). Typical hill curves of a turbine are drawn upto maximum permissible head as shown in Figure 3. With the increase in turbine efficiency, the area enclosed by a curve decreases and ultimately becomes a point corresponding to maximum turbine efficiency.
Variation in maximum turbine efficiency with head is derived for Francis turbines on an 8 x 125 MW hydroelectric project on the Narmada river in India (Figure 4).
Constraints and Bounds In order to ensure operation of a unit within permissible limits, various constraints and bounds are considered.
(2)
(3)
(4)
(5)
HYDRO NEPAL ISSUE NO. 14 JANUARY, 2014 55
Equality Constraint For power balance : PLD = m x Pgeach –Elos
Inequality constraints Number of units to operate, m ≤ n m ≤ p
Bounds (lower and upper) Reservoir elevation bounds MDDL ≥ Hlh ≤ FRL Turbine discharge bounds Qmin < Q < Qmax
Unit output bounds Pmin < Pgeach< Pmax
Net head bounds Hmin< H < Hmax
Strategic Planning Approaches Optimal operation of the units at maximum turbine efficiency and related features are presented here:
- Operation at constant load to minimize discharge . - Operation with release of obligatory fixed quantity
of water to maximize generation.
Note: the fringe benefits include operating reserve and additional MVAR capacity of generator.
Operation under constant load In this approach, discharge is minimized for a constant load. The objective function will be expressed as:
subject to
(7)
A power plant generates and dispatches power as per the schedule provided by the Load Dispatch Centre. Load to be dispatched is divided into time periods in short term generation scheduling for a day.
In the proposed methodology, when full load demand is not possible to be shared equally while operating the units at maximum turbine efficiency then balance demand is met by operating one or more units at sub-optimal turbine efficiency. Discharge of these units is computed iteratively by changing the loading of these units within permissible output limits. Plant discharge for each variant is computed. All the plant discharges are compared and the variant with minimum plant discharge provides the requisite solution. This concept of operation leads to conservation of water as compared to operation of all the units at equal loads at sub-optimal turbine efficiencies (Soares et al.2003; Arceet al.2002; Sousa et al.2007).
A project specific computer program is to be developed for the selection of the number of units to be operated to obtain required load with minimum discharge.
Hydraulic data required - Hill curves of a prototype. - Elevation of water in reservoir (m) Minimum Draw Down Level (m) .- Head loss formulae/curve Tail water rating curve
Minimum elevation of tail water pool (m).
Electrical data required Generator efficiency curve Losses from generator terminals to switch yard (MW)
Power plant inputs - Load demand (MW)- Total number of units in a power plant - Total number of units available for operation - Minimum head and output limits for operation of a
turbine (m).- Maximum head and output limits for operation of a
turbine (m).
Computational Algorithm The computation is carried out in three steps:
Figure 4. Variation in maximum turbine efficiency with head
Figure 3. Hill curves of a prototype
(6)
HYDRO NEPAL ISSUE NO. 14 JANUARY, 2014 56
Step-I: computation of initial net head For a given load demand, compute gross head, plant
discharge, maximum turbine efficiency. Net head is obtained by subtracting head loss from gross head.
Step-II: Computation to finalize net head Compute plant discharge, tail water level, head loss
and net head iteratively to obtain final value of net head. Compute number of units to operate.
Step-III: In the optimization process, one of the following two cases may occur
Case–I: Full load demand is met by operating the units at maximum turbine efficiency. In this case all the units are equally and optimally loaded. It is an ideal case and results in minimum plant discharge. In this case k = m.
Case-II: Full load demand is not possible to be shared equally to meet the load demand while operating the units at maximum turbine efficiency. In such a case, ‘k’ units will be operated equally at maximum turbine efficiency whereas balance load will be shared by operating one unit at sub-optimal turbine efficiency. Plant discharge is computed (L1). In this case k + 1 = m.
Optimization for Case-II: Plant discharge is obtained as given below to find out whether any plant discharge lower than L1 is feasible. Under following conditions, Case-II will not be feasible and one of the following two conditions will apply.
Condition-I: total output of 2 units operating at suboptimal turbine efficiencies .
> 2 x minimum output limit . Instead of one unit, two units are operated at sub-
optimal turbine efficiencies. Combined minimum discharge of these two units is obtained by iterating them within the permissible output limits. On the basis of combined minimum discharge from these two units, plant discharge is computed (L2). In this case k + 2 = m.
Condition-II : total output of 2 units operating at suboptimal turbine efficiencies
< 2 x minimum output limit Instead of two units, three units are operated at
sub-optimal turbine efficiencies. Combined minimum discharge of these three units is obtained by iterating them within the permissible output limits. On the basis of combined minimum discharge of these three units, plant discharge is computed (L3). In this case k + 3 = m.
Equal load operation: Plant discharge is computed for equal load operation of the units (L4).
Optimality check: Plant discharges L1 and/or L2 or L3 are compared and minimum amongst these is compared with L$. Overall minimum plant discharge amongst L1, L2, L2 and L4 provides the requisite solution.
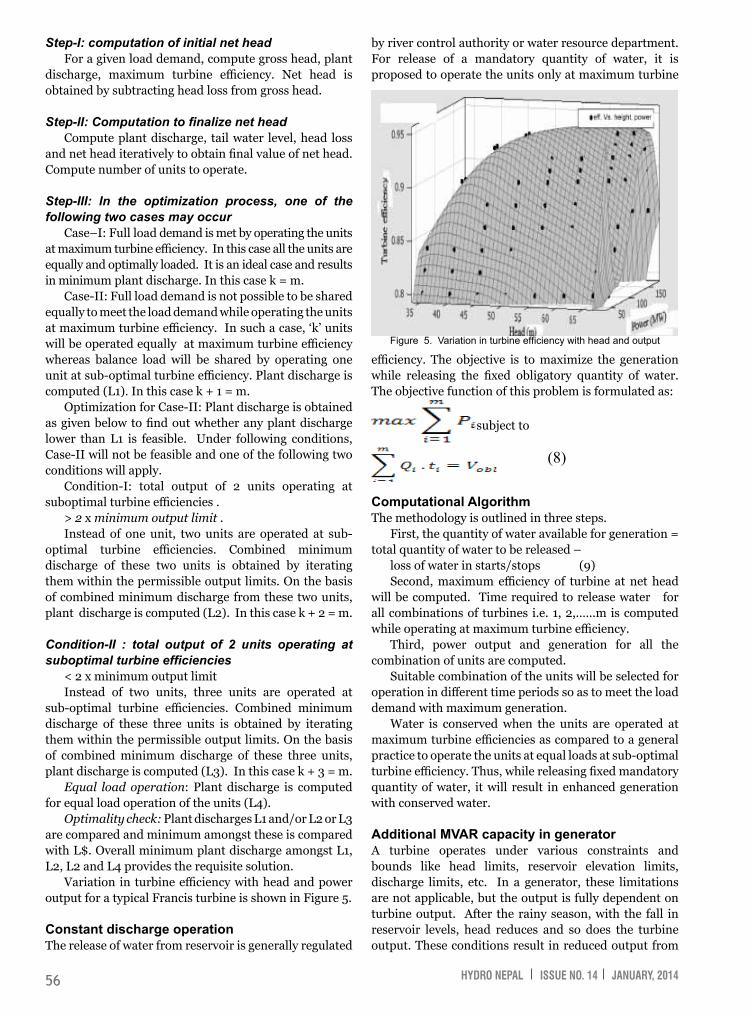
Variation in turbine efficiency with head and power output for a typical Francis turbine is shown in Figure 5.
Constant discharge operation The release of water from reservoir is generally regulated
by river control authority or water resource department. For release of a mandatory quantity of water, it is proposed to operate the units only at maximum turbine
efficiency. The objective is to maximize the generation while releasing the fixed obligatory quantity of water. The objective function of this problem is formulated as:
subject to
Computational Algorithm The methodology is outlined in three steps.
First, the quantity of water available for generation = total quantity of water to be released –
loss of water in starts/stops (9)Second, maximum efficiency of turbine at net head
will be computed. Time required to release water for all combinations of turbines i.e. 1, 2,.…..m is computed while operating at maximum turbine efficiency.
Third, power output and generation for all the combination of units are computed.
Suitable combination of the units will be selected for operation in different time periods so as to meet the load demand with maximum generation.
Water is conserved when the units are operated at maximum turbine efficiencies as compared to a general practice to operate the units at equal loads at sub-optimal turbine efficiency. Thus, while releasing fixed mandatory quantity of water, it will result in enhanced generation with conserved water.
Additional MVAR capacity in generator A turbine operates under various constraints and bounds like head limits, reservoir elevation limits, discharge limits, etc. In a generator, these limitations are not applicable, but the output is fully dependent on turbine output. After the rainy season, with the fall in reservoir levels, head reduces and so does the turbine output. These conditions result in reduced output from
Figure 5. Variation in turbine efficiency with head and output
(8)
HYDRO NEPAL ISSUE NO. 14 JANUARY, 2014 57
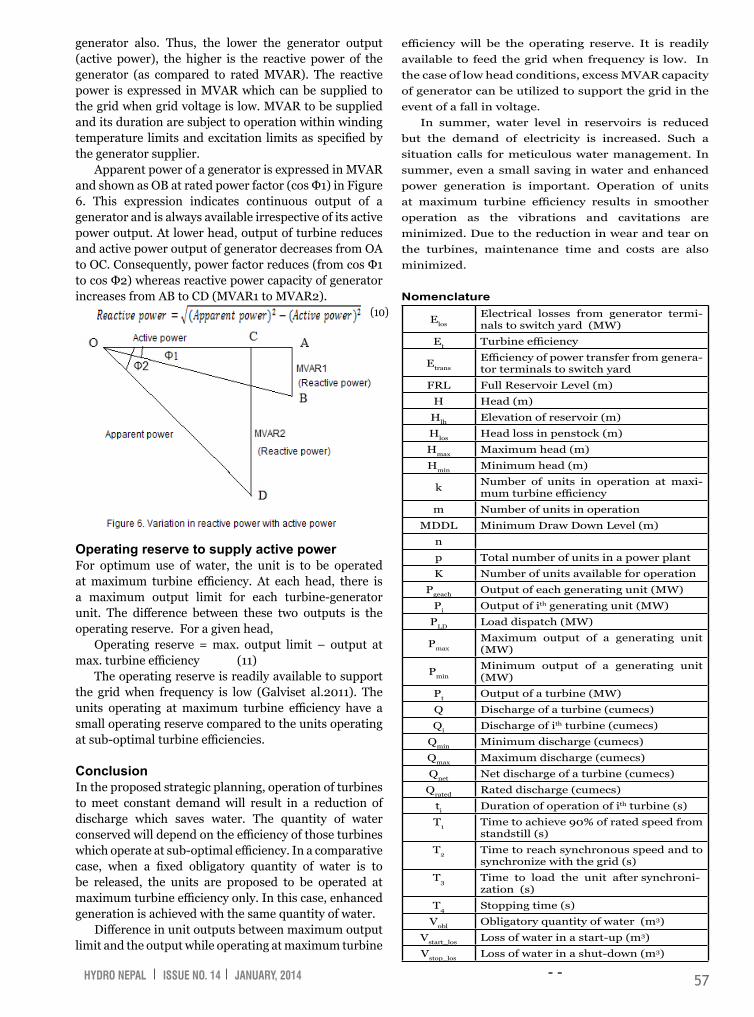
generator also. Thus, the lower the generator output (active power), the higher is the reactive power of the generator (as compared to rated MVAR). The reactive power is expressed in MVAR which can be supplied to the grid when grid voltage is low. MVAR to be supplied and its duration are subject to operation within winding temperature limits and excitation limits as specified by the generator supplier.
Apparent power of a generator is expressed in MVAR and shown as OB at rated power factor (cos Φ1) in Figure 6. This expression indicates continuous output of a generator and is always available irrespective of its active power output. At lower head, output of turbine reduces and active power output of generator decreases from OA to OC. Consequently, power factor reduces (from cos Φ1 to cos Φ2) whereas reactive power capacity of generator increases from AB to CD (MVAR1 to MVAR2).
Operating reserve to supply active power For optimum use of water, the unit is to be operated at maximum turbine efficiency. At each head, there is a maximum output limit for each turbine-generator unit. The difference between these two outputs is the operating reserve. For a given head,
Operating reserve = max. output limit – output at max. turbine efficiency (11)
The operating reserve is readily available to support the grid when frequency is low (Galviset al.2011). The units operating at maximum turbine efficiency have a small operating reserve compared to the units operating at sub-optimal turbine efficiencies.
Conclusion In the proposed strategic planning, operation of turbines to meet constant demand will result in a reduction of discharge which saves water. The quantity of water conserved will depend on the efficiency of those turbines which operate at sub-optimal efficiency. In a comparative case, when a fixed obligatory quantity of water is to be released, the units are proposed to be operated at maximum turbine efficiency only. In this case, enhanced generation is achieved with the same quantity of water.
Difference in unit outputs between maximum output limit and the output while operating at maximum turbine
efficiency will be the operating reserve. It is readily available to feed the grid when frequency is low. In the case of low head conditions, excess MVAR capacity of generator can be utilized to support the grid in the event of a fall in voltage.
In summer, water level in reservoirs is reduced but the demand of electricity is increased. Such a situation calls for meticulous water management. In summer, even a small saving in water and enhanced power generation is important. Operation of units at maximum turbine efficiency results in smoother operation as the vibrations and cavitations are minimized. Due to the reduction in wear and tear on the turbines, maintenance time and costs are also minimized.
Nomenclature
Elos
Electrical losses from generator termi-nals to switch yard (MW)
Et Turbine efficiency
Etrans
Efficiency of power transfer from genera-tor terminals to switch yard
FRL Full Reservoir Level (m)
H Head (m)
Hlh Elevation of reservoir (m)
Hlos Head loss in penstock (m)
Hmax Maximum head (m)
Hmin Minimum head (m)
k Number of units in operation at maxi-mum turbine efficiency
m Number of units in operation
MDDL Minimum Draw Down Level (m)
n
p Total number of units in a power plant
K Number of units available for operation
Pgeach Output of each generating unit (MW)
Pi Output of ith generating unit (MW)
PLD Load dispatch (MW)
Pmax
Maximum output of a generating unit (MW)
Pmin
Minimum output of a generating unit (MW)
Pt Output of a turbine (MW)
Q Discharge of a turbine (cumecs)
Qi Discharge of ith turbine (cumecs)
Qmin Minimum discharge (cumecs)
Qmax Maximum discharge (cumecs)
Qnet Net discharge of a turbine (cumecs)
Qrated Rated discharge (cumecs)
ti Duration of operation of ith turbine (s)
T1 Time to achieve 90% of rated speed from standstill (s)
T2 Time to reach synchronous speed and to synchronize with the grid (s)
T3 Time to load the unit after synchroni-zation (s)
T4 Stopping time (s)
Vobl Obligatory quantity of water (m3)
Vstart_los Loss of water in a start-up (m3)
Vstop_los Loss of water in a shut-down (m3)
- -
(10)
HYDRO NEPAL ISSUE NO. 14 JANUARY, 2014 58
AcknowledgementThe authors gratefully acknowledge the support of Dr. Appu Kuttan K.K., Director Maulana Azad (National Institute of Technology, Bhopal, India) to carry out this research work.
Shambhu Ratan Awasthi, graduated in electrical Engineering in 1971 and obtained his Master’s degree in Design of Heavy Electrical Equipment. He joined as Design Engineer at Bharat Heavy Electricals Limited, Bhopal, India where he was finally elevated to the post of General Manager prior to his superannuation in 2010. He has 36 years of rich experience in the design of Hydro-generators, Project Management of power projects and field experience of hydropower plants in India and abroad. He has two books and more than 20 published papers at his credit in the field of his specialization. Corresponding address: [email protected]
Dr. Vishnu Prasad, has 24 years teaching and research experience and presently working as Professor and Head, Department of Civil Engineering, MANIT, Bhopal (India). He has specialization in hydro power and water resources engineering. He has published about 75 papers in International, national journals and conferences. He has supervised M.Tech. and Ph.D. candidates in hydropower engineering and organized conferences. He has expertise in model testing and numerical simulation of hydraulic machines and contributed a lot in consultancy in this area. He has visited UK for six months training in the area of hydro power under Indo-UK RECs Project.
Dr. Saroj Rangnekar, is Professor in Department of Energy, Maulana Azad National Institute of Technology (MANIT), Bhopal, India. She has 34 years of teaching and research experience and received three National awards. Her field of interest includes real time control of
Energy Systems, Integrated Energy Systems Modeling, Simulation, Optimization etc.
ReferencesArce, A., T. Ohishi and S. Soares, 2002, ‘Optimal dispatch
of generating units of the Itaipú hydroelectric plant’, IEEE Trans. Power Systems 17(1).
Diniz, A. L., P. P. I. Esteves and C. Sagastizábal, 2007, ‘A Mathematical Model for the Efficiency Curves of Hydroelectric units’, IEEE PES General Meeting, Tampa, FL, pp. 1-7.
Finardi, E. C. and E. L. Silva, 2005, ‘Unit commitment of single hydroelectric plant’, Electric Power Systems Research 75(2-3):116-123.
Galvis, J. C., A. Padilha-Feltrin and J. M. Y. Loyo, 2011, ‘Cost assessment of efficiency losses in hydroelectric plants’, Electric Power Syst. Research 81(10):1866-1873.
Nilsson, O. and D. Sjelvgren, 1997, ‘Variable splitting applied to modeling of start-up costs in short term hydro generation scheduling’, IEEE Transactions on Power Systems 12(2):770-775.
Pérez-Díaz, J. I, J. R. Wilhelmi and J. A. Sánchez-Fernández, 2010, ‘Short-term operation scheduling of a hydropower plant in the day-ahead electricity market’, Electrical Power Systems Research 80(12):1535-1542.
Soares, S. and C. T. Salmazo, 1997, ‘Minimum loss pre-dispatch model for hydroelectric power system’, IEEE Transactions on Power Systems12 (3):1220-1228.
Soares, S., T. Ohishi, M. Cicogna and A. Arce, 2003, ‘Dynamic dispatch of hydro generating units’, IEEE Bologna PowerTech Conference, 1-6.
Sousa, T., J. A. Jardini and R. A. Lima, 2007, ‘Hydroelectric Power Plant Unit Efficiencies Evaluation and Unit Commitment’, IEEE Bologna PowerTech Conference, 1368-1373.
contract administration. He is presently involved with the dispute resolution process with the Contractors in different hydropower projects undertaken by NEA.Corresponding address: [email protected]
ReferencesBrian W. Totterdill – A practical guide to the 1999 Red
and Yellow Books.E.C Corbett – FIDIC 4th A Practical Legal Guide.Guide to the Use of FIDIC, Conditions of Contract for
Civil Engineering Construction – Fourth EditionNael G. Bunni – The FIDIC Form of Contract –Fourth
Edition of Red Book.Proceedings of 6th International Conference on
Development of Hydropower- A Major Source of Renewable Energy organized by International Association on Electricity Generation, Transmission and Distribution, June 7-9, 2005, Kathmandu, Nepal.
Status of Claim Situation of Hydropower Projects being undertaken by Nepal Electricity Authority.
Continued from page 51
Top Related
Copyright © 2022 FDOKUMEN

