


Bahasa
Halaman
Hukum


IPPG Programme Office, IDPM, School of Environment & DevelopmentUniversity of ManchesterHarold Hankin Building, Precinct CentreOxford Road, Manchester M13 9PLTelephone 0161 306 6438Fax 0161 273 8829www.ippg.org.uk
State-Business Relations, Investment Climate Reform and Firm Productivity
in Sub-Saharan AfricaA
Mahvash Qureshib and
dirk WilleM te veldeb
discussion PaPer series nuMber six
June 2007
a the authors are grateful to ParticiPants at the iPPg WorkshoP in Manchester, May 2007, and the abcde, slovenia, May 2007 for helPful coMMents and suggestions
b overseas develoPMent institute, uk
Paper prepared for the DFID-funded Research Programme, Institutions and Pro-Poor Growth (IPPG). The authors are grateful to DFID for the funding that made this research possible. The views expressed in this paper are entirely those of the author and in no
way represent either the official policy of DFID or the policy of any other part of the UK Government. Material published by the IPPG may be reproduced free of charge in any format or medium provided it is reproduced faithfully,
not used in a misleading context and properly attributed to the author(s). Copyright exists in all other original material published by members of the Programme and may belong to the author or to the University of Manchester depending on the circumstances
of publication. Enquiries should be sent to the editor at the above address.

3
iPPg
3
iPPg
abstract
This paper examines whether an effective state-business relationship (SBR) facilitated by an organized private sector improves firm performance in seven sub-Saharan African (SSA) countries: Benin, Ethiopia, Madagascar, Malawi, Mauritius, South Africa and Zambia. We argue that a well-organized and sustained state-business relationship which fulfils the criteria of transparency, reciprocity, credibility and trust can influence firm productivity in at least three important ways: efficient policies and institutions, improved quality and relevance of government expenditure, and finally reduced policy uncertainty.
In order to test this, this paper exploits the private enterprise survey data of the World Bank Group for seven SSA countries and focuses on the effects of state-business relations in different countries. The results based on the panel of firms show that being a member of a business association improves firm performance in the form of total factor productivity improvements in the range of 25 to 35 percent. This finding is robust to including other variables that are commonly used to describe the investment climate, and robust to using estimates of productivity that account for endogeneity problems. Further detailed findings show that the effectiveness of business association works primarily through solving of information related market and co-ordination failures and lobbying government. Membership also increases labour productivity so that positive productivity effects are in part captured by labour; most of these benefits are going to the skilled workers providing positive dynamic incentives throughout the economy.
There are significant differences in the effects of membership across countries, ranging from highly significant and positive in Mauritius and Ethiopia to insignificant in Benin and Madagascar, with effects positive and significant in Malawi and Zambia. The size of the effect is correlated with a country specific index capturing factors associated with effective state-business relations, which shows that business associations are most effective when the overall climate for state-business relations is more effective. Membership of business associations also decreases the size of make informal payments and improves other investment climate indicators. This provides further evidence for how investment climate reform happens.
Key Words: state-business relations, firm performance, labour productivity, skills, sub-Saharan Africa
JEL Classification: D24, O17
contents
Page
1. Introduction 42. SBRs and economic performance 4 2.1 Theoretical background 4 2.1.1 Macroeconomic impacts 4 2.1.2 Microeconomic impacts 5 2.1.3 Labour productivity and returns to labour 6 2.2 Empirical background 63. Empirical strategy 7 3.1 SBRs and total factor productivity 7 3.2 SBR and investment climate 8 3.3 SBR, labour productivity and return to labour 84. Data description 9 4.1 Data sources 9 4.2 Measuring SBRs 9 4.3 Firm characteristics and investment climate indicators 135. Empirical results 13 5.1 SBR and firm performance 14 5.2 Small vs. large and foreign vs. domestically owned firms 17 5.3 SBRs and investment climate 18 5.4 Labour productivity and returns to labour 196. Conclusions 20 Bibliography 21Appendix A 24
4
iPPg
5
iPPg
1. introduction
This paper examines whether an effective state-business relationship (SBR) facilitated by an organized private sector promotes the economic performance of firms. Effective SBRs lead to a more optimal allocation of resources in the economy, including an increased effectiveness of government involvement in supporting private sector activities and removing obstacles to investment (Te Velde, 2006). Governments that engage in SBRs are thought to have a higher likelihood of adopting appropriate policies and reforms, while enterprizes participating in state-business discussions are more likely to support these initiatives (Bannock, 2005; Herzberg and Wright, 2005). However, this has never been tested empirically.
Despite the importance of the issue, in-depth discussions of state-business relations especially for sub-Saharan African (SSA) countries have been patchy or absent; a detailed analysis of its effects on microeconomic performance largely lacking. Qureshi and Te Velde (2007) are a recent exception and focus on the effects of state-business relations in Zambia. This paper attempts to fill this gap in literature and provides empirical evidence on the effect of SBRs on firm performance and labour productivity in seven SSA countries which permits an analysis of whether and why the effects of SBRs may differ across countries. In addition to Qureshi and Te Velde (2006), we also examine whether SBR affects the pattern of economic growth through its effect on the skill intensity of firms. We use private enterprise surveys of the World Bank Group for firms in seven SSA countries with data on performance, including data that facilitates the calculation of productivity levels, and on the institutional context facing or perceived by firms.
The findings reveal that SBRs, measured by an organized private sector such as membership of a business association, enhance firm performance in the form of total factor productivity improvement in the range of 25 to 35 percent. This finding is robust to including other variables that are commonly used to describe characteristics internal and external to the firm, for example, the firm’s age, size and ownership structure and different measures of institutions and corruption, and robust to using estimates of productivity that account for endogeneity problems. The gain in productivity as a result of SBRs is experienced by small, medium and large firms.
The results also show that of the various services provided by a business association to its members, providing information on government regulations and lobbying government are the most useful for firms in SSA countries. Membership also increases average returns to workers and labour productivity so that positive productivity effects are in part captured by labour; most of these labour benefits are going to the skilled workers providing positive dynamic incentives throughout the economy.
The remainder of the paper is organized as follows. Section 2 outlines the theoretical and empirical background of the research and identifies the channels through which effective SBRs have microeconomic impacts.2 Section 3 discusses the theoretical framework and estimation strategy adopted in the paper. Section 4 describes the data and discusses relevant issues. Section 5 presents the results from econometric analysis. Section 6 summarizes the main findings and concludes outlining the important policy implications of this research.
2. sbrs and econoMic PerforMance
2.1 Theoretical background 2.1.1 Macroeconomic impacts
Effective state-business relations or public-private sector dialogue has been identified as an important determinant of economic growth at the macro-level (OECD, 2006; Te Velde, 2006). This is because failures exist at both the state and market levels and joint action may raise collective efficiency. Market and co-ordination failures prevent the optimal allocation of resources and justify state intervention. However, government and institutional failures may exist alongside market failures: this could be because governments often do not have the capacity to intervene and transform an economy or because they lack perfect information and foresight which is needed to identify and overcome market failures. Government intervention also carries the risk of misallocation and rent-seeking behaviour, especially in countries with high levels of corruption.
In general, effective SBRs provide a solution to both types of failures discussed above. Harriss (2006) suggests that good SBRs are based on a benign collaboration between business and the state with positive mechanisms that enable transparency, ensure the likelihood of reciprocity; increase credibility of the state among the capitalists, and establish high levels of trust between public and private agents. They provide a transparent way of sharing information, lead to a more appropriate allocation of resources, remove unnecessary obstacles to doing business, and provide checks and balances on government intervention.
Hisahiro (2005) argues that various forms of information and resources, which are dispersed among entities in the public and private sector, need to be integrated in a more sophisticated way to jointly co-
1. This section is based on discussions in Qureshi and Te Velde (2007).
4
iPPg
5
iPPg
ordinate policies and provide better public services. It is this combination of insulation and connectedness that minimizes the risks and enhances the effectiveness of economic policies. Hence, appropriate government capacity and policy, which is necessary to support private sector development and promote economic growth, can be enabled by good SBRs and productive public-private sector dialogues.
2.1.2 Microeconomic impacts
A well-organized and sustained state-business relationship which fulfils the criteria of transparency, reciprocity, credibility and trust can influence firm productivity in at least three important ways:
i) Efficientpoliciesandinstitutions
The nature and scope of public policies have a direct impact on a firm’s strategies, choices and output, mainly through their effect on costs, risks and barriers to competition. Kerr (2000) argues that a quagmire of regulation imposes high costs on businesses and deters productive investment. These costs arise not only from compliance but also from resource misallocation and a lack of competition especially if the designed regulation is bad. The design of effective government policies and regulations depends, among other things, on input from and consultation with the private sector; regular sharing of information between the state and businesses ensures that private sector objectives are met with public action and that local level issues are fed into higher level policy processes (OECD, 2006).
The private sector can identify constraints, opportunities, and possible policy options for creating incentives, lowering investment risks, and reducing the cost of doing business. They may, for example, raise concerns related to the tax regime, licensing requirements or difficulty in hiring skilled workers. These concerns could contribute significantly to improving the national/local tax and licensing practices and to initiatives that encourage investing in human capital. Thus, more efficient institutions and rules and regulations can be achieved through policy advocacy which could reduce the costs and risks faced by firms and significantly enhance their productivity.
ii)Improvedqualityandrelevanceofgovernmentexpenditure
The competitive advantage of a firm and the competitive pressure that encourages a firm to take risks, innovate and improve its performance depend on the availability of public services as much as they depend on the private incentives facing the firm. These services include infrastructure, availability of physical and human capital, information and communication technology, the availability and cost of finance, and, legal and judicial services. Public services can affect firm productivity directly, for example, through skills development or through uninterrupted and reliable provision of basic facilities like water, electricity and gas, which is important for the smooth running of production facilities. They can also affect firm performance indirectly through, for example, stimulating the quality of basic demand, and facilitating business creation and development. The efficient delivery of public services requires the private sector to play a pro-active role, inform the state of its needs, and lobby for improving the quality of government spending and creating a better climate for investment.
iii)Reducedpolicyuncertainty
Firms operate in an uncertain environment and frequently face risk and resource shortages. They undertake decisions concerning technology, inputs, and production facilities based on anticipated market conditions and profitability. Uncertainty can affect investment through a variety of channels. For example, it may increase the risk premium demanded for investing in certain projects, pushing the required rate of return upwards and dampening investment. The effect of uncertainty may be more pronounced when managers influence investment decisions and cannot fully diversify their exposure to idiosyncratic risk (Bond and Cummins, 2004).2 Dixit and Pindyck (1994) argue that uncertainty has significant negative effects on investment, when investment involves large sunk and irreversible costs and there is the option to delay the decision to make the investment until further information becomes available.
Greater liaison with the state and free flow of information on prospective policies and trends may help to solve co-ordination failures, reduce uncertainty surrounding the business environment and increase business confidence. The services provided by business associations in the form of provision of information on government regulations, domestic and international markets may be particularly useful in this regard. This will enable more accurate forecasting and quick decision making and enhance firm productivity even if other factors are held constant.
2. Hartman (1972), however, argues that if expected profits are a convex function of future output prices, then higher uncertainty will have a positive effect on investment.
6
iPPg
7
iPPg
2.1.3 Labour productivity and returns to labour
The impact of investment climate on overall productivity of the firm may work through the effects on the productivity of workers. There may be further effects on employment growth and returns to labour (see, for example, Dollar et al. [2003]; Pernia and Salas [2006]). These factors are important in achieving sustained high economic growth rates and substantial poverty reduction. Earlier research indicates that economic growth is necessary but not sufficient to achieve poverty reduction. The pattern and sources of growth and the distribution of gains, which are determined by labour productivity, are crucial elements to reduce poverty (Islam, 2003). Increasing productivity of workers in their existing occupations by providing them physical capital and new technology or shifting them to skill intensive occupations increases their incomes, reduces poverty, and creates a virtuous cycles of economic growth, investment and higher productivity (Islam, 2003).
Improved SBRs could affect the productivity of workers – defined as output per worker – and the average returns to workers, or wages, by the channels discussed above, that is improved institutions and governance, better quality of government expenditure, reduced policy uncertainty, and provision of information on domestic and international markets.
2.2 Empirical background
Effective state-business relations are linked to the literature on good governance and institutions. The importance of these factors in promoting growth at the macro level has been well-established by a number of studies (for example, Kormendi and McGuire [1985]; Knack and Keefer [1995]; Rodrik and Subramanian [2003]). Hall and Jones (1999) observe that social infrastructure, defined as institutions and government policies that frame the economic environment within which individuals and firms operate to produce output, determines almost all of the differences observed in output per worker across countries.
Following this strand of research, a growing body of literature attempts to investigate the impact of investment climate, measured as financial, legal, infrastructural and administrative constraints to businesses, at the micro level (McArthur and Teal [2002]; Dollar et al. [2003]; Beck et al. [2005]; Subramanian et al. [2005]). These studies find that investment climate constraints dampen firm productivity and restrict its growth. None of these studies however explicitly takes into account the effect of public-private sector relationships. Effective SBRs, while being part of good governance and institutions, may also lead to and prioritize governance reforms and institutional settings. It is therefore important to isolate the effect of SBRs on firm performance and examine the extent to which they can explain the variation in performance across firms. This paper fills the gap in literature and uses firm level survey data to empirically examine the impact of state-business interaction on firm and labour productivity as well as the skill intensity of firms.
Another key contribution of the paper is its innovative approach to measuring SBRs. Following Te Velde (2006), we use different indicators that capture key factors associated with effective SBRs to assess the effects of different types of SBRs. These key factors are based on economic theory as explained in the previous section and include an organized private sector, an organized public sector, and an institutionalized mechanism of SBR. In addition, we analyse data on provision of different services by an organized private sector and determine the services of most value to the firms.
Further, much of the literature on state-business relations has been limited to Asian countries such as Korea, Japan, Malaysia, Bangladesh and Thailand.3 The importance of SBRs in the context of SSA has largely been ignored, despite its potential importance for firm performance, economic growth and poverty reduction. Two recent studies have begun to study the effects of effective state-business relations. Sen and Te Velde (2007) use the index developed in Te Velde (2006) and estimate standard growth regressions in dynamic panel form of 20 SSA countries over 1970–2004, controlling for more conventionally used measures of institutional quality in the empirical literature. The results show that effective state-business relationships contribute significantly to economic growth in Sub-Saharan Africa – countries which have shown improvements in state-business relationships have witnessed higher economic growth, controlling for other determinants of economic growth.
Qureshi and Te Velde (2007) use the enterprise survey data of the World Bank Group for Zambia for around 200 firms with data on performance, including data that facilitate the calculation of productivity levels, and on the institutional context facing or perceived by firms. The paper finds that membership of a business association enhances Zambian firm performance in the form of productivity improvements in the range of 37 to 41 percent. This finding is robust to including other variables. They also find that joining a business association is particularly useful for small and medium sized firms. Further, the results support the view that foreign owned firms lobby the government more effectively than their Zambian counterparts.
In this paper we take seven SSA countries – Benin, Ethiopia, Madagascar, Malawi, Mauritius, South Africa
3. See, for example, Hisahiro, K. (2005).
6
iPPg
7
iPPg
and Zambia – and use firm level data provided by World Bank’s private enterprise surveys in our empirical analysis.4 Each of these countries has undertaken steps to strengthen its state-business relations.5 The enterprise survey provides information relating to firm characteristics, investment climate constraints and SBRs for around hundred firms, of varying sizes and ownership structures, in each country.
3. eMPirical strategy3.1 SBRs and total factor productivity
The theoretical framework used in this paper is a synthesis of earlier research on industrial organization, corporate governance, corporate finance, and economic growth theory. To assess the link between SBRs and firm performance, we begin with a simple Cobb-Douglas production function which links output with inputs and the firm’s productivity, as follows:
уi = α0+ αL Li+ αK Ki+ εi , (1)
where yi is log of output measured in value added terms of firm i, and L and K are logs of labour and capital inputs, respectively. уi is the unobserved error term that represents the log of productivity shock or total factor productivity (TFP) of firm i and captures any effects in total output not caused by inputs or productivity.
To investigate the effect of a firm’s relationship with the government on its economic performance we estimate TFP from (1) and estimate the effect of SBRs (SBR) and several other factors identified in earlier literature to explain a significant proportion of the variability in TFP. We categorize the factors into two groups: characteristics of the firm (F) and characteristics of the investment climate (X), and estimate:
log(TFPi) = β0 + βs SBRi + ΣβF Fik + ΣβX Xjk + vi , (2)
where vi is a white noise error term, F includes firm characteristics such as the age, location, size and sector of the firm, and X comprises a number of investment climate indicators such as days to get a phone line, need to pay bribes, and power losses.
Most of the earlier research treats the productivity shock in (1) as orthogonal to the factor inputs. This assumption has been challenged since long and it is argued that the input variables L and K are in general correlated with the unobserved productivity shock ε.6 For example, a positive productivity shock may lead a firm to use more inputs than otherwise. If this assertion is true, then the parameter estimates for the production function obtained from the Ordinary Least Squares (OLS) method will be biased and will yield biased estimates of TFP.
A number of studies have put forward ways to address this endogeneity problem, including introducing fixed effects, the instrumental variables technique (IV) and the first differenced Generalized Method of Moments (GMM) estimator, proposed by Arellano and Bond (1991). Each of these methods has some limitations, for example, the fixed effect method makes a strong assumption that the part of TFP which influences firm’s decisions is a time invariant firm-specific attribute. However, this assumption may not always be reasonable, which makes the estimation procedure invalid (Arnold, 2005). The IV technique requires using instruments that are correlated with the endogenous variables but not with the error term. In general, it is difficult to find strongly correlated instruments and using weakly correlated instruments is not advised since the estimates are biased in the same direction as OLS. Similarly, Mairesse and Hall (1996) report that first differenced GMM approach yields unsatisfactory results in the estimation of production functions from panel datasets covering a small number of time periods and a large number of firms. This is because the variables entering the production function, that is, capital, labour and output, are highly persistent in nature, which induces weak correlation between the endogenous variables and the instruments leading to poor precision in the estimators (Blundell and Bond, 1999).
Olley and Pakes (1996) propose to overcome the simultaneity problem by using the firm’s investment decision to proxy unobserved productivity shocks. Their technique, later modified by Levinsohn and Petrin (2003), is commonly used to obtain consistent estimates of the production function.7 They divide ε in into two components, η which is a part of the productivity shock that influences a firm’s decisions relating to factor inputs, and ξ which is an independent and identically distributed random component. L and K are treated as free and state variables, respectively, and investment is defined as a function of K and η. This gives us:
уi = α0+ αL Li+ αK Ki+ η( Ii , Ki ) + ξi , (3)
j
4. Enterprise surveys were conducted in different years in these countries. The available data is for 2004 for Benin, 2002 for Ethiopia, 2005 for Madagascar, 2005 for Malawi, 2005 for Mauritius, 2003 for South Africa and 2002 for Zambia.5. See Te Velde (2006) for a detailed discussion on SBRs in SSA countries. 6. See, for example, Marschak and Andrews (1944).7. Levinsohn and Petrin (2003) use intermediate inputs, such as material inputs, as a proxy instead of investment. This is because most datasets contain significantly less zero-observations in materials than in firm-level investment.
k k j
8
iPPg
9
iPPg
Now defining φ(Ii , Ki ) = αo + αKKi + η (Ii , Ki ), we obtain:
уi = αL Li + φ(Ii , Ki ) + ξi , (4)
A first stage estimator that is linear in L and non-parametric in φ is used to obtain a consistent estimate of αL.
8 To identify αK, two assumptions are made. First, η follows a first-order Markov process and, second, K does not respond immediately to ψ, defined as the innovations in productivity over last period’s expectation, that is, ψit = ηit - E [ηit | ηit-1 ]. Putting ψ in (3) and defining у* as output net of labour’s contribution, we obtain:
у*i = уi - αL Li+ αK Ki+ E [ηit | ηi-1 ] + ξi, (5)
where ξ*i. Since ψi and ξi are both uncorrelated with K, regressing у* on K and E [ηt | ηt-1 ] produces a consistent estimate of αK. Having obtained consistent estimates for both parameters of interest, αL and αK, we can construct the individual error term εi from (1) which will give us unbiased estimates of TFP. Since this technique imposes less stringent data requirements and is not affected by the small time dimension of the dataset, we prefer to use it for estimation purposes.
3.2 SBR and investment climate
Section 2 of this paper argued that one channel through which SBRs affect firm performance is improved investment climate. Hence, while being part of the good governance literature, effective SBRs may also lead to and prioritize governance reforms. Governments that engage in SBRs have a higher likelihood of adopting appropriate policies and reforms, while enterprises participating in state-business discussions are more likely to support these initiatives (Bannock, 2005; Herzberg and Wright, 2005). To test this claim, we estimate an equation linking SBRs to firm-level investment climate indicators. Specifically, we estimate:
InvClimatei = β0 + βS SBRi + ΣβF Fik + ΣβX Xjk + ςi , (6)
where InvClimate refers to investment climate indicators such as the percentage of revenues paid as informal payments to government officials, percentage of total sales value lost due to power losses and insufficient water supply, availability of information and communications technology (ICT), and the average days required for custom clearance of export and imports. β represents the parameters to be estimated, ς is a white noise error term, and the remaining variables are the same as in (2). If SBRs improve the investment climate for firms, then βS is expected to be positive and vice versa.
3.3 SBR, labour productivity and return to labour
To examine the link of SBR with labour productivity and average returns to labour, we follow earlier literature (for example, Dollar et al. [2003]; Pernia and Salas [2006]) and estimate the following equations:
log (Labourprodi ) = δ0 + δS SBRi + Σ δF Fik + Σ δX Xjk + κi , (7)
log (Avgreturni ) = γ0 + γS SBRi + Σ γF Fik + Σ γX Xjk + ui , (8)
where Labourprodi is labour productivity (defined as output per worker) and Avgreturni is the average wage received by the workers of firm i. δ and γ represent the parameters to be estimated, κ and u are white noise error terms, and the definition of the remaining variables is the same as in (2). If SBRs enhance labour productivity and/or the average returns to workers, then the estimated δS and γS will be positive, respectively, and vice versa.
jk k j
jk k j
jk k j
8. Olley and Pakes (1996) employ a fourth-order polynomial in I and K to approximate φ(.), estimating (2) using OLS, with output refressed on labour and the polynomial terms.
8
iPPg
9
iPPg
4. data descriPtion4.1 Data sources
This paper explores the link between SBRs and firm performance in the context of SSA. The sample comprises seven SSA countries – Benin, Ethiopia, Madagascar, Malawi, Mauritius, South Africa and Zambia – for which relevant data are available from the World Bank’s Productivity and Investment Climate Private Enterprise Surveys. In its efforts to measure and compare investment climate conditions across countries, the World Bank has conducted enterprise surveys across a number of regions to highlight the microeconomic and institutional conditions for investment and to identify priority problems (in policy, regulatory, and institutional areas) to productive investment. A typical survey covers over a hundred firms of various sizes belonging to different sectors and located in different regions across the country.
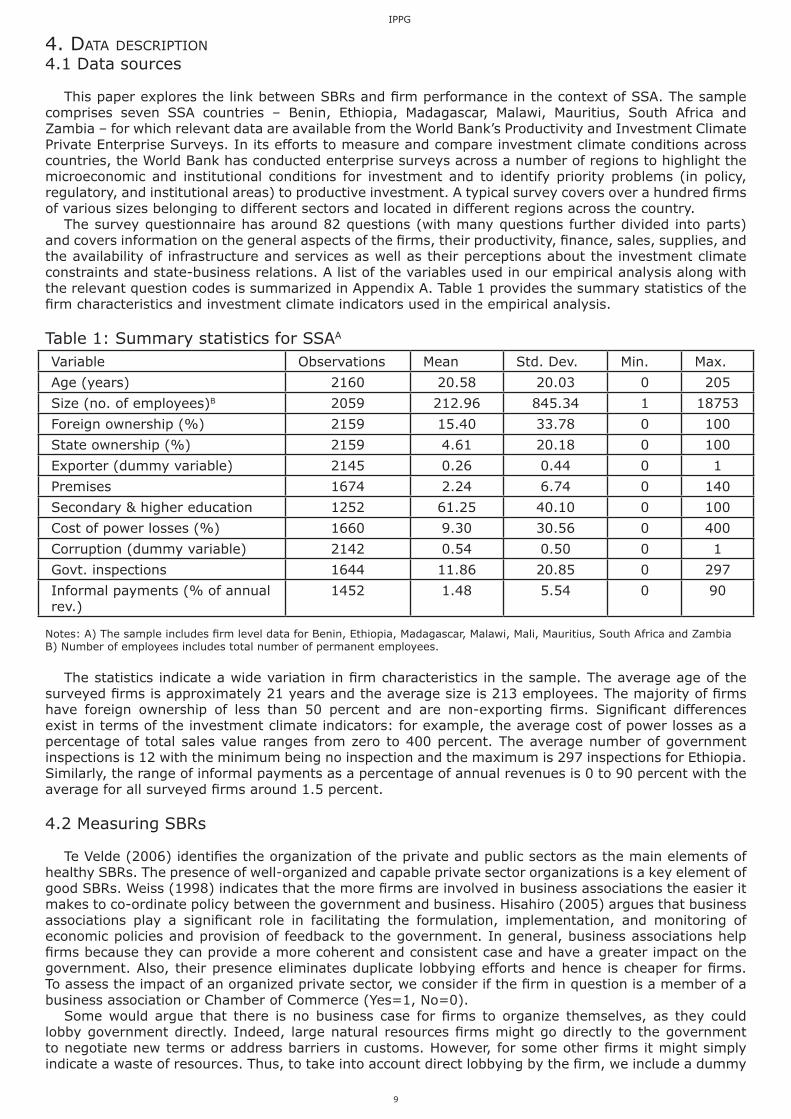
The survey questionnaire has around 82 questions (with many questions further divided into parts) and covers information on the general aspects of the firms, their productivity, finance, sales, supplies, and the availability of infrastructure and services as well as their perceptions about the investment climate constraints and state-business relations. A list of the variables used in our empirical analysis along with the relevant question codes is summarized in Appendix A. Table 1 provides the summary statistics of the firm characteristics and investment climate indicators used in the empirical analysis.
Table 1: Summary statistics for SSAA
Notes: A) The sample includes firm level data for Benin, Ethiopia, Madagascar, Malawi, Mali, Mauritius, South Africa and Zambia B) Number of employees includes total number of permanent employees.
The statistics indicate a wide variation in firm characteristics in the sample. The average age of the surveyed firms is approximately 21 years and the average size is 213 employees. The majority of firms have foreign ownership of less than 50 percent and are non-exporting firms. Significant differences exist in terms of the investment climate indicators: for example, the average cost of power losses as a percentage of total sales value ranges from zero to 400 percent. The average number of government inspections is 12 with the minimum being no inspection and the maximum is 297 inspections for Ethiopia. Similarly, the range of informal payments as a percentage of annual revenues is 0 to 90 percent with the average for all surveyed firms around 1.5 percent.
4.2 Measuring SBRs
Te Velde (2006) identifies the organization of the private and public sectors as the main elements of healthy SBRs. The presence of well-organized and capable private sector organizations is a key element of good SBRs. Weiss (1998) indicates that the more firms are involved in business associations the easier it makes to co-ordinate policy between the government and business. Hisahiro (2005) argues that business associations play a significant role in facilitating the formulation, implementation, and monitoring of economic policies and provision of feedback to the government. In general, business associations help firms because they can provide a more coherent and consistent case and have a greater impact on the government. Also, their presence eliminates duplicate lobbying efforts and hence is cheaper for firms. To assess the impact of an organized private sector, we consider if the firm in question is a member of a business association or Chamber of Commerce (Yes=1, No=0).
Some would argue that there is no business case for firms to organize themselves, as they could lobby government directly. Indeed, large natural resources firms might go directly to the government to negotiate new terms or address barriers in customs. However, for some other firms it might simply indicate a waste of resources. Thus, to take into account direct lobbying by the firm, we include a dummy
Variable Observations Mean Std. Dev. Min. Max.
Age (years) 2160 20.58 20.03 0 205
Size (no. of employees)B 2059 212.96 845.34 1 18753
Foreign ownership (%) 2159 15.40 33.78 0 100
State ownership (%) 2159 4.61 20.18 0 100
Exporter (dummy variable) 2145 0.26 0.44 0 1
Premises 1674 2.24 6.74 0 140
Secondary & higher education 1252 61.25 40.10 0 100
Cost of power losses (%) 1660 9.30 30.56 0 400
Corruption (dummy variable) 2142 0.54 0.50 0 1
Govt. inspections 1644 11.86 20.85 0 297
Informal payments (% of annual rev.)
1452 1.48 5.54 0 90
10
iPPg
11
iPPg
variable that captures if the firm lobbied government (Yes=1, No=0).9 How efficiently government is organized is as crucial as the organization of the private sector for
SBRs. Weiss (1995) argues that the government is the ‘senior partner’ in the state-business relationship which directs the policy patterns. The government may face numerous decisions on how it may organize itself to interact with business. An important measure is the presence and effectiveness of an investment promotion agency which could be seen as indicative for advocacy of private sector interests as a whole. Another would be the presence of a governing unit specifically for the private sector. To measure the role of the government in state-business relations, we consider firm’s perceptions about the efficiency of government in delivering services (for example, public utilities, public transportation, security, education and health etc.) on a scale of 1 (= very inefficient) to 6 (= very efficient).
Theoretically speaking, effective SBRs lead to a reduction in uncertainty surrounding the firm, positively affecting its performance. Hence, another measure for SBR which we include is a firm’s opinion about economic and regulatory policy uncertainty hampering the operation and growth of its business. The greater the problem of uncertainty, the lower would be the effectiveness of SBRs. In addition, we include the percentage of senior management’s time in a typical week spent in dealing with requirements imposed by government regulations such as taxes, customs, licensing etc., as other proxies for SBRs. Good SBRs are expected to lower the administrative constraints faced by the firms.
The empirical analysis treats SBRs as exogenous to firm performance. This assumption is subject to debate as a firm’s performance may determine its relationship with the state. For example, well performing businesses are in a stronger position to establish informal connections with the state elites and extract favours. However, the questionnaire which is discussed in more detail below suggest that firms perceive there to be value from being part of a business association suggesting that the causation runs from joining to performance.
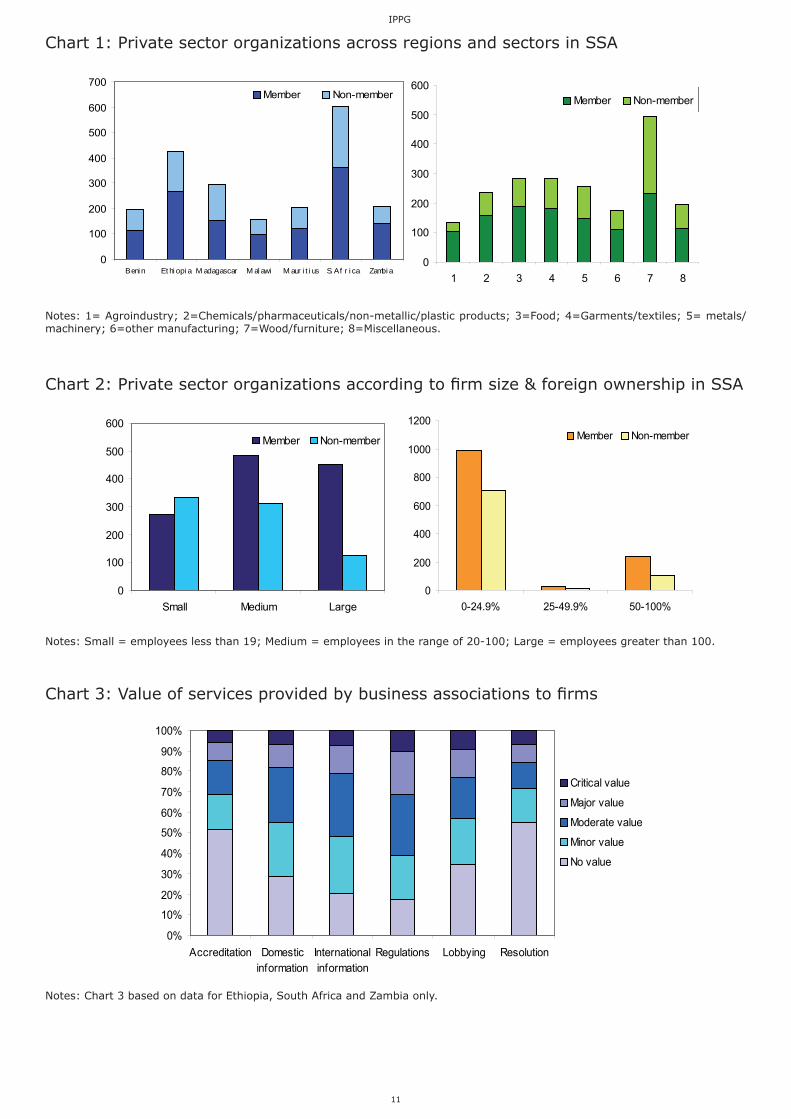
Chart 1 presents the distributions of firms that are members of business associations across countries and sectors included in the sample. In each country, the percentage of member firms is higher than non-member firms. Zambia has the highest percentage of firms which are members of business associations with around 70 percent of the firms covered in the survey as members whereas Madagascar has the lowest percentage of member firms with 53 percent firms as members. Similarly, a majority of firms across the various sectors are members of business associations with the highest percentage for agroindustry followed by the categories sectors of chemicals/pharmaceutics/non-metallic/plastic products and food.
Chart 2 shows that a majority of small firms in the sample are non-members whereas a majority of large firms are members of business associations. This observation contradicts the argument that there is no business case for large firms to join business associations as they could lobby government directly. The effect of foreign ownership on membership is less clear since in each ownership category, the percentage of member firms is greater than non-member firms. However, firms with foreign stakes of over 50 percent have the highest percentage of member firms (70 percent).
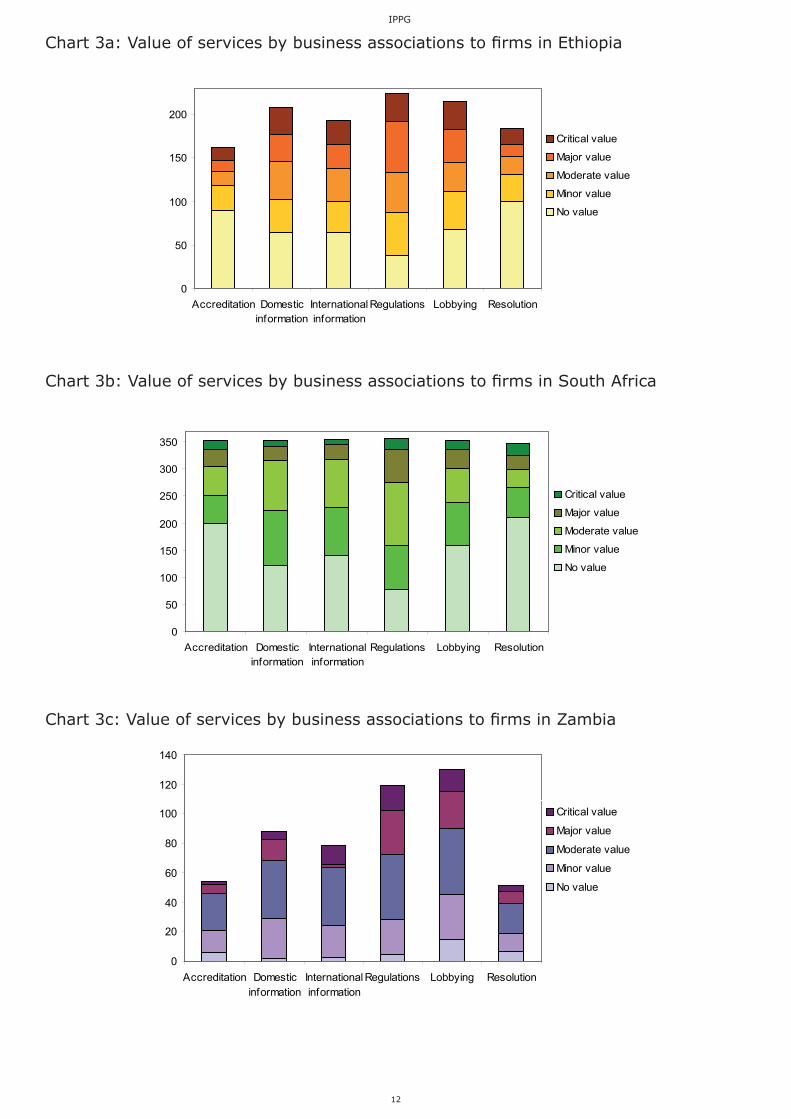
In terms of the various services provided by business associations, lobbying government and information on government regulations are on average the two most important services provided by business associations to the firms covered in the sample (Chart 3).10 The least important services are resolution of disputes (with officials, workers, or other firms) and accrediting standards or quality of products. Charts 3a, 3b and 3c present the country wise picture and depict the value of services to member firms in Ethiopia, South Africa and Zambia, respectively. In each case, a majority of the firms report that the business association provided information on government regulations and lobbied government. Of all the services, these services were reported as having major/critical value by the largest number of firms. The services which the largest number of firms find of little or no value appear to be accreditation of standards and resolution of conflicts for each country.
9. Data for this variable is available only for Benin, Mauritius, South Africa and Zambia. Hence, we do not include this variable in all estimated equations.10. Information on the value of different services provided by business associations to firms is available for only three countries, Ethiopia, South Africa and Zambia.
10
iPPg
11
iPPg
Chart 1: Private sector organizations across regions and sectors in SSA
Notes: 1= Agroindustry; 2=Chemicals/pharmaceuticals/non-metallic/plastic products; 3=Food; 4=Garments/textiles; 5= metals/machinery; 6=other manufacturing; 7=Wood/furniture; 8=Miscellaneous.
Chart 2: Private sector organizations according to firm size & foreign ownership in SSA
Notes: Small = employees less than 19; Medium = employees in the range of 20-100; Large = employees greater than 100.
Chart 3: Value of services provided by business associations to firms
Notes: Chart 3 based on data for Ethiopia, South Africa and Zambia only.
0
100
200
300
400
500
600
1 2 3 4 5 6 7 8
Member Non-member
0
100
200
300
400
500
600
700
Beni n Et hi opi a M adagascar M al awi M aur i t i us S. Af r i ca Zambi a
Member Non-member
0
100
200
300
400
500
600
Small Medium Large
Member Non-member
0
200
400
600
800
1000
1200
0-24.9% 25-49.9% 50-100%
Member Non-member
0%
10%
20%
30%
40%
50%
60%
70%
80%
90%
100%
Accreditation Domesticinformation
Internationalinformation
Regulations Lobbying Resolution
Critical value
Major value
Moderate value
Minor value
No value
12
iPPg
13
iPPg
Chart 3a: Value of services by business associations to firms in Ethiopia
Chart 3b: Value of services by business associations to firms in South Africa
Chart 3c: Value of services by business associations to firms in Zambia
0
50
100
150
200
250
300
350
Accreditation Domesticinformation
Internationalinformation
Regulations Lobbying Resolution
Critical value
Major value
Moderate value
Minor value
No value
0
20
40
60
80
100
120
140
Accreditation Domesticinformation
Internationalinformation
Regulations Lobbying Resolution
Critical value
Major value
Moderate value
Minor value
No value
0
50
100
150
200
Accreditation Domesticinformation
Internationalinformation
Regulations Lobbying Resolution
Critical value
Major value
Moderate value
Minor value
No value
12
iPPg
13
iPPg
4.3 Firm characteristics and investment climate indicators
While assessing the effect of SBRs on firm performance, we need to control for several other factors that may explain heterogeneity of firm performance. These include firm characteristics as well as the characteristics of the external environment in which the firm operates that can affect firm performance. The firm characteristics that we control for in our firm are standard variables in empirical literature on investment climate and industrial organization and include the age, size, location and sector of the firm. Labour quality is another possible factor to affect firm performance. Knowledge and skills of workers at businesses may directly increase firm performance, or/and they may indirectly act as a complement to improved technologies, business models or organizational practices (Abowd et al., 2002). We use the percentage of work force in a firm with at least secondary education as a measure of labour quality. In addition, research on firm performance has identified three features, namely the extent of firm’s export orientation, competition and ownership, as key determinants of firm productivity. In general, firms that export, face higher competition and have foreign ownership are found to perform better (Svejnar, 2006). Hence, we control for these factors while estimating (2).
The spatial organization of firms can also play a role in determining its productivity. Firms commonly operate multiple plants for the same product and separate administrative functions from the production site: for example, a firm may find it beneficial to locate production facilities in smaller and more specialized cities and set up its headquarters and administrative functions in a large city with better access to financial and business services (Duranton and Puga 2002); or, firms with geographically dispersed plants may establish their administrative units at a central location from where they can reach all plants easily and quickly. Such separation can enhance a firm’s performance or it could impose significant communication costs (Aarland et al. 2004). Similarly, firms with more than one plant may experience multi-plant economies, defined as cost advantages from operating several plants.11 Multi-plant firms may also gain productivity from the closure of relatively unproductive plants and the opening of productive ones (Seabright, 2000). However, diseconomies from operating plants in multiple locations can arise due to co-ordination and control problems. To estimate the effect of firm spatial organization, we include a proxy which measures the number of premises (for example, production facilities, offices, etc.) as part of firm characteristics.
The investment climate in which the firm operates comprises a variety of factors including public utilities, transport and information and communication technology infrastructure, and regulation and bureaucracy. Provision of public utilities such as electricity, water, gas, and waste disposal services determines firm productivity directly. Interrupted supplies of public services may result in the wastage of other inputs and therefore reduce TFP. Transaction costs associated with regulations, bureaucracy and poor institutions reflect resources diverted from production and hence may have significant implications for a firm’s performance (World Bank, 2004; de Groot et al. 2004). Following earlier literature, for example, Dollar et al. (2003) and Subramanian et al. (2005), we capture these external factors influencing a firm’s productivity by including the average number of days required for export clearance, total number of government inspections during the year, and various measures for corruption.12
The number of days required for custom clearance and measures of corruption are expected to have a negative effect on total factor and labour productivity. However, the effect of number of inspections remains theoretically unpredictable. On the one hand, government inspections are important mechanisms for enforcing regulations but on the other, firms often complain about government inspectors harassing them, favouring cronies or demanding bribes. This is especially true for developing countries where inspections often impose unnecessary costs and risks on businesses while failing to ensure compliance.
5. eMPirical results
Section 3 has argued that effective state-business relations will affect firm performance in several ways. Joining a business association will help firms to communicate and lobby with governments for more efficient policies, institutions and government expenditure, but also reduce policy uncertainty by providing information about government policies and product/factor markets. Thus SBRs, measured at the firm level by an organized private sector, contribute to a rise in firm productivity through these various channels. We also hypothesized that the effects of SBRs and lobbying will depend on the size and ownership structure of firms. The discussion below presents the results of estimation and hypotheses testing.
11. See Scherer et al. (1975) for a detailed discussion on multi-plant economies.12. We measure corruption by: 1) the percentage of total annual revenues that the firm spent in making informal payments, and 2) by constructing a dummy variable on the basis of the survey question if the firm viewed corruption as a problem for its production and growth (respondents answered on a scale from no problem=0 to highly problematic=4). Following McArthur and Teal (2002), we interpret this question as asking whether the firm typically faced corruption in its operations and construct a binary variable from the answers. The responses of 0 and 1 are interpreted as indicating that the firm never or seldom faced corruption and given a value of zero whereas 2, 3, and 4 are treated as firm faced corruption and assigned a value of one.
14
iPPg
15
iPPg
5.1 SBR and firm performance
To isolate and test for the importance of SBRs on firm performance, we estimate the production function as expressed in (1) to retrieve estimates of total factor productivity (TFP). y represents total value added and is calculated by subtracting the cost of material inputs and energy from the total market value of production, L is the number of employees and K is the gross value of assets. We estimate (1) for each country in the sample using the Levinsohn-Petrin approach outlined in Section 3 to obtained unbiased estimates of TFP.13
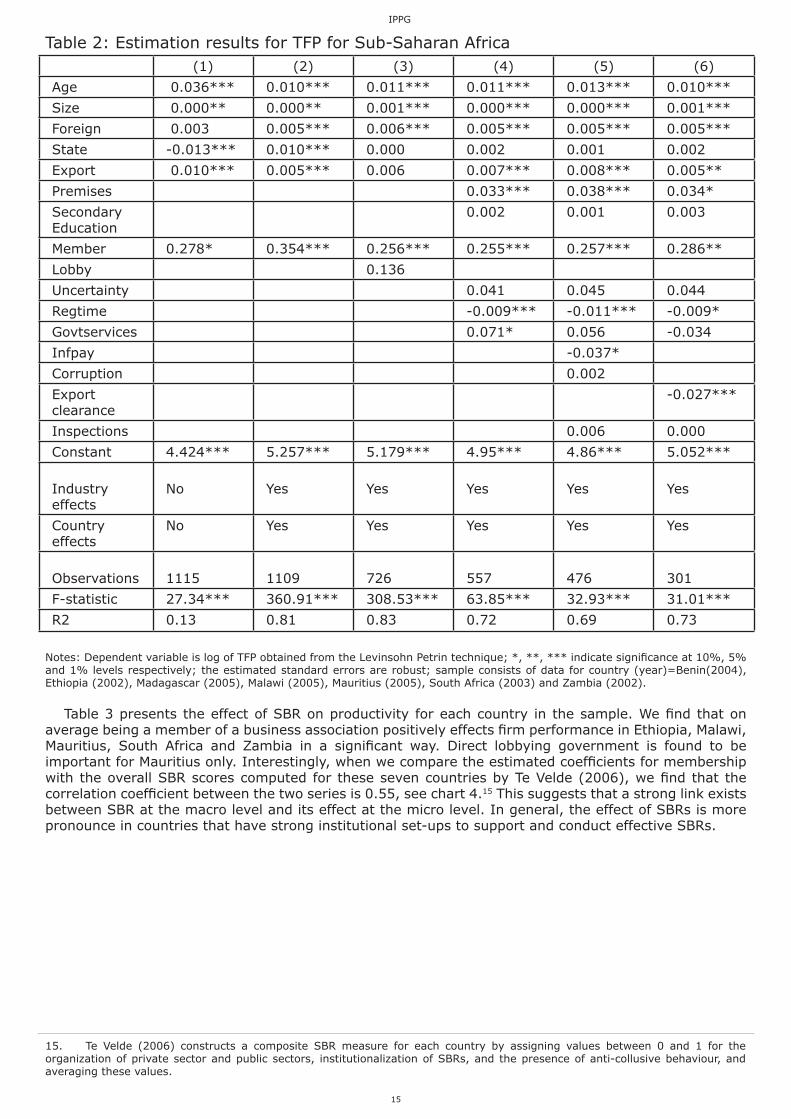
The (log of) TFP is then related to the internal and external characteristics of the firm, and the SBR measures using a pooled dataset (while controlling for country-specific effects) and also for individual SSA countries. Columns 1 to 7 of Table 2 show the estimated effects of various SBR measures on firm performance while controlling for various other factors. In the first specification presented in column (1), we include membership of a business association as a SBR measure, with a number of firm characteristics such as age, size and ownership structure of the firm but do not control for sector- and country-specific effects. We find that although all variables except for foreign ownership (foreign) are significant, the overall fit of the equation is poor and the variables explain only 13 percent of the variation in the dependent variable.
In the next specification we control for sector and country specific effects to address the omitted variable bias that may have affected our results in column (1). The R-squared jumps to 0.81 and all variables including foreign are highly significant. The estimated coefficient of membership is positive and significant, so that being part of an organized private sector helps firm performance. In column 3 of Table 2 we add a second SBR measure that captures if a firm lobbied government directly or not. Since information for this variable is available for only four countries, Benin, Mauritius, South Africa and Zambia, the total number of observations in the sample drops noticeably. The effect of membership remains strongly positive however we do not find any important effect of lobbying directly on productivity.
In column (4) we include two other important features of a firm that may affect its productivity. These include measures for the quality of labour – proxied by the percentage of labour force with at least secondary education – and the economies of scale/scope experienced through a number of premises. As explained above, the quality of labour is expected to positively influence a firm’s TFP however the theoretical expectation for the effect of multiple plants/premises is unclear. In addition, we include three other measures of SBR effectiveness, economic and regulatory policy uncertainty, management’s time spent in dealing with regulations, and firms’ perceptions of government services. The estimated coefficients of uncertainty and time spent in dealing with regulations are expected to be negative whereas that of government services is expected to be positive. Contrary to expectations, we obtain a positive sign for uncertainty. However, its estimated coefficient is highly insignificant implying no effect of uncertainty on firm productivity.14 Management’s time spent in dealing with regulations has a significantly negative effect on productivity whereas (perceptions of) government services have a positive effect at the 10 percent significance level.
Finally, in columns (5) and (6) we augment the basic specification by including different variables reflecting investment climate constraints that have been identified as important determinants of firm performance in earlier empirical literature. The results show that informal payments and the average number of days required for custom clearance have a strong negative effect on firm productivity – note that the estimated effect of membership is robust to the inclusion of these variables, which supports our assertion that SBRs may have an effect on firm performance directly through various channels.
Overall, our findings indicate that regardless of the specification used, membership of the association is an important determinant of firm’s productivity in SSA and increases firm’s productivity in the range of 25 to 35 percent. In addition to membership, managements’ time spent in dealing with regulations is another SBR measure which significantly affects firm performance and reduces productivity by about 1 percent.
13. Estimated results for the production function are presented in the Appendix.14. This maybe because the proxy for uncertainty is a subjective variable based on firms’ perceptions.
14
iPPg
15
iPPg
Table 2: Estimation results for TFP for Sub-Saharan Africa
Notes: Dependent variable is log of TFP obtained from the Levinsohn Petrin technique; *, **, *** indicate significance at 10%, 5% and 1% levels respectively; the estimated standard errors are robust; sample consists of data for country (year)=Benin(2004), Ethiopia (2002), Madagascar (2005), Malawi (2005), Mauritius (2005), South Africa (2003) and Zambia (2002).
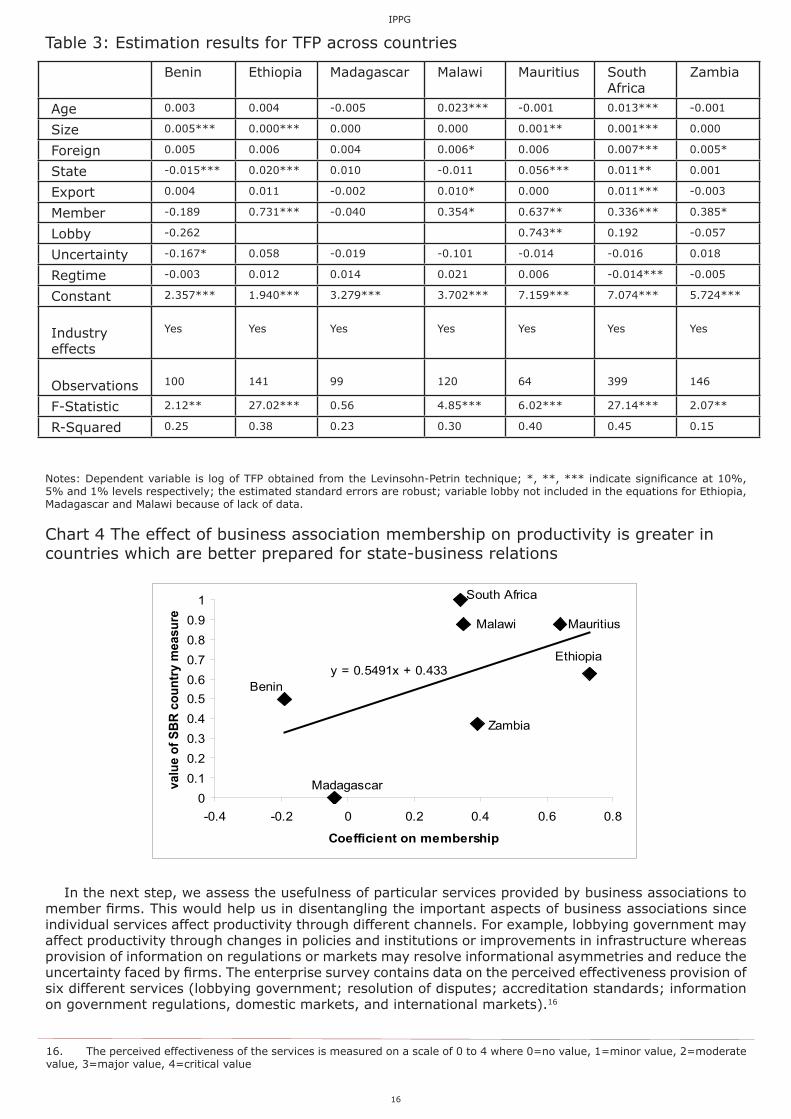
Table 3 presents the effect of SBR on productivity for each country in the sample. We find that on average being a member of a business association positively effects firm performance in Ethiopia, Malawi, Mauritius, South Africa and Zambia in a significant way. Direct lobbying government is found to be important for Mauritius only. Interestingly, when we compare the estimated coefficients for membership with the overall SBR scores computed for these seven countries by Te Velde (2006), we find that the correlation coefficient between the two series is 0.55, see chart 4.15 This suggests that a strong link exists between SBR at the macro level and its effect at the micro level. In general, the effect of SBRs is more pronounce in countries that have strong institutional set-ups to support and conduct effective SBRs.
(1) (2) (3) (4) (5) (6)
Age 0.036*** 0.010*** 0.011*** 0.011*** 0.013*** 0.010***
Size 0.000** 0.000** 0.001*** 0.000*** 0.000*** 0.001***
Foreign 0.003 0.005*** 0.006*** 0.005*** 0.005*** 0.005***
State -0.013*** 0.010*** 0.000 0.002 0.001 0.002
Export 0.010*** 0.005*** 0.006 0.007*** 0.008*** 0.005**
Premises 0.033*** 0.038*** 0.034*
Secondary Education
0.002 0.001 0.003
Member 0.278* 0.354*** 0.256*** 0.255*** 0.257*** 0.286**
Lobby 0.136
Uncertainty 0.041 0.045 0.044
Regtime -0.009*** -0.011*** -0.009*
Govtservices 0.071* 0.056 -0.034
Infpay -0.037*
Corruption 0.002
Export clearance
-0.027***
Inspections 0.006 0.000
Constant 4.424*** 5.257*** 5.179*** 4.95*** 4.86*** 5.052***
Industry effects
No Yes Yes Yes Yes Yes
Country effects
No Yes Yes Yes Yes Yes
Observations 1115 1109 726 557 476 301
F-statistic 27.34*** 360.91*** 308.53*** 63.85*** 32.93*** 31.01***
R2 0.13 0.81 0.83 0.72 0.69 0.73
15. Te Velde (2006) constructs a composite SBR measure for each country by assigning values between 0 and 1 for the organization of private sector and public sectors, institutionalization of SBRs, and the presence of anti-collusive behaviour, and averaging these values.
16
iPPg
17
iPPg
Table 3: Estimation results for TFP across countries
Notes: Dependent variable is log of TFP obtained from the Levinsohn-Petrin technique; *, **, *** indicate significance at 10%, 5% and 1% levels respectively; the estimated standard errors are robust; variable lobby not included in the equations for Ethiopia, Madagascar and Malawi because of lack of data.
Chart 4 The effect of business association membership on productivity is greater in countries which are better prepared for state-business relations
In the next step, we assess the usefulness of particular services provided by business associations to member firms. This would help us in disentangling the important aspects of business associations since individual services affect productivity through different channels. For example, lobbying government may affect productivity through changes in policies and institutions or improvements in infrastructure whereas provision of information on regulations or markets may resolve informational asymmetries and reduce the uncertainty faced by firms. The enterprise survey contains data on the perceived effectiveness provision of six different services (lobbying government; resolution of disputes; accreditation standards; information on government regulations, domestic markets, and international markets).16
Benin Ethiopia Madagascar Malawi Mauritius South Africa
Zambia
Age 0.003 0.004 -0.005 0.023*** -0.001 0.013*** -0.001
Size 0.005*** 0.000*** 0.000 0.000 0.001** 0.001*** 0.000
Foreign 0.005 0.006 0.004 0.006* 0.006 0.007*** 0.005*
State -0.015*** 0.020*** 0.010 -0.011 0.056*** 0.011** 0.001
Export 0.004 0.011 -0.002 0.010* 0.000 0.011*** -0.003
Member -0.189 0.731*** -0.040 0.354* 0.637** 0.336*** 0.385*
Lobby -0.262 0.743** 0.192 -0.057
Uncertainty -0.167* 0.058 -0.019 -0.101 -0.014 -0.016 0.018
Regtime -0.003 0.012 0.014 0.021 0.006 -0.014*** -0.005
Constant 2.357*** 1.940*** 3.279*** 3.702*** 7.159*** 7.074*** 5.724***
Industryeffects
Yes Yes Yes Yes Yes Yes Yes
Observations 100 141 99 120 64 399 146
F-Statistic 2.12** 27.02*** 0.56 4.85*** 6.02*** 27.14*** 2.07**
R-Squared 0.25 0.38 0.23 0.30 0.40 0.45 0.15
y = 0.5491x + 0.433
00.10.20.30.40.50.60.70.80.9
1
-0.4 -0.2 0 0.2 0.4 0.6 0.8
Coefficient on membership
valu
e of
SBR
cou
ntry
mea
sure
Mauritius
Ethiopia
South Africa
Malawi
Madagascar
Benin
Zambia
16. The perceived effectiveness of the services is measured on a scale of 0 to 4 where 0=no value, 1=minor value, 2=moderate value, 3=major value, 4=critical value
16
iPPg
17
iPPg
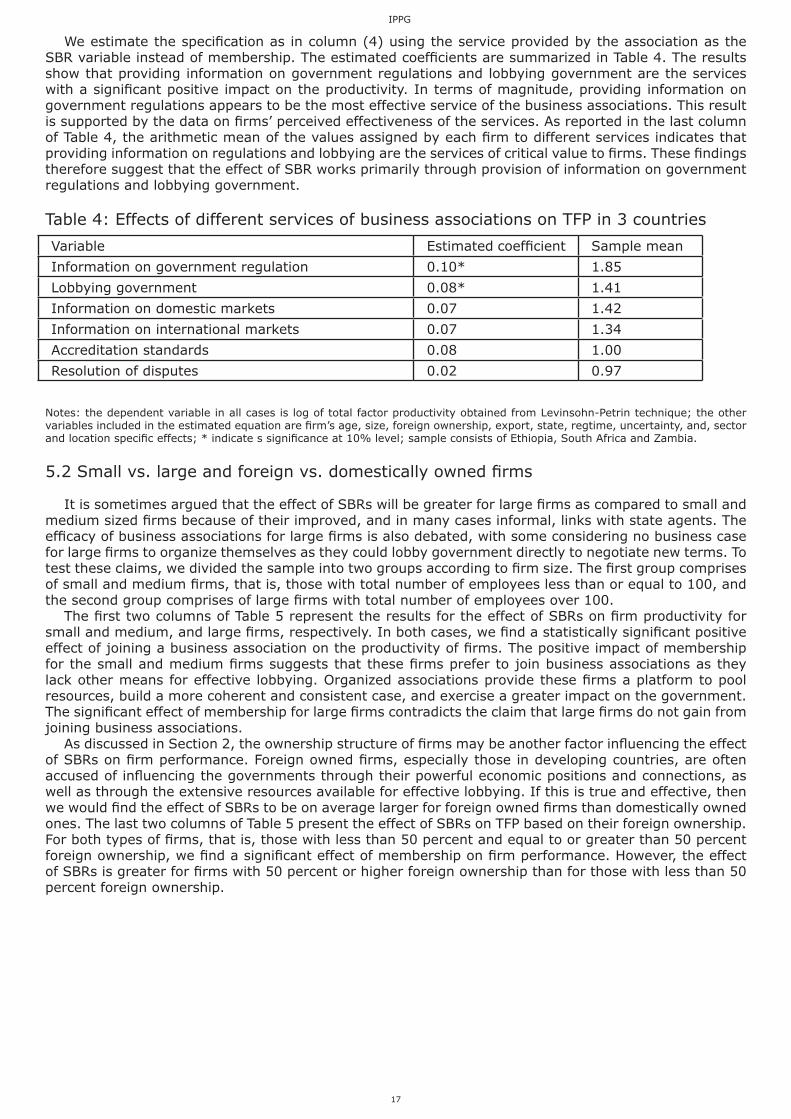
We estimate the specification as in column (4) using the service provided by the association as the SBR variable instead of membership. The estimated coefficients are summarized in Table 4. The results show that providing information on government regulations and lobbying government are the services with a significant positive impact on the productivity. In terms of magnitude, providing information on government regulations appears to be the most effective service of the business associations. This result is supported by the data on firms’ perceived effectiveness of the services. As reported in the last column of Table 4, the arithmetic mean of the values assigned by each firm to different services indicates that providing information on regulations and lobbying are the services of critical value to firms. These findings therefore suggest that the effect of SBR works primarily through provision of information on government regulations and lobbying government.
Table 4: Effects of different services of business associations on TFP in 3 countries
Notes: the dependent variable in all cases is log of total factor productivity obtained from Levinsohn-Petrin technique; the other variables included in the estimated equation are firm’s age, size, foreign ownership, export, state, regtime, uncertainty, and, sector and location specific effects; * indicate s significance at 10% level; sample consists of Ethiopia, South Africa and Zambia.
5.2 Small vs. large and foreign vs. domestically owned firms
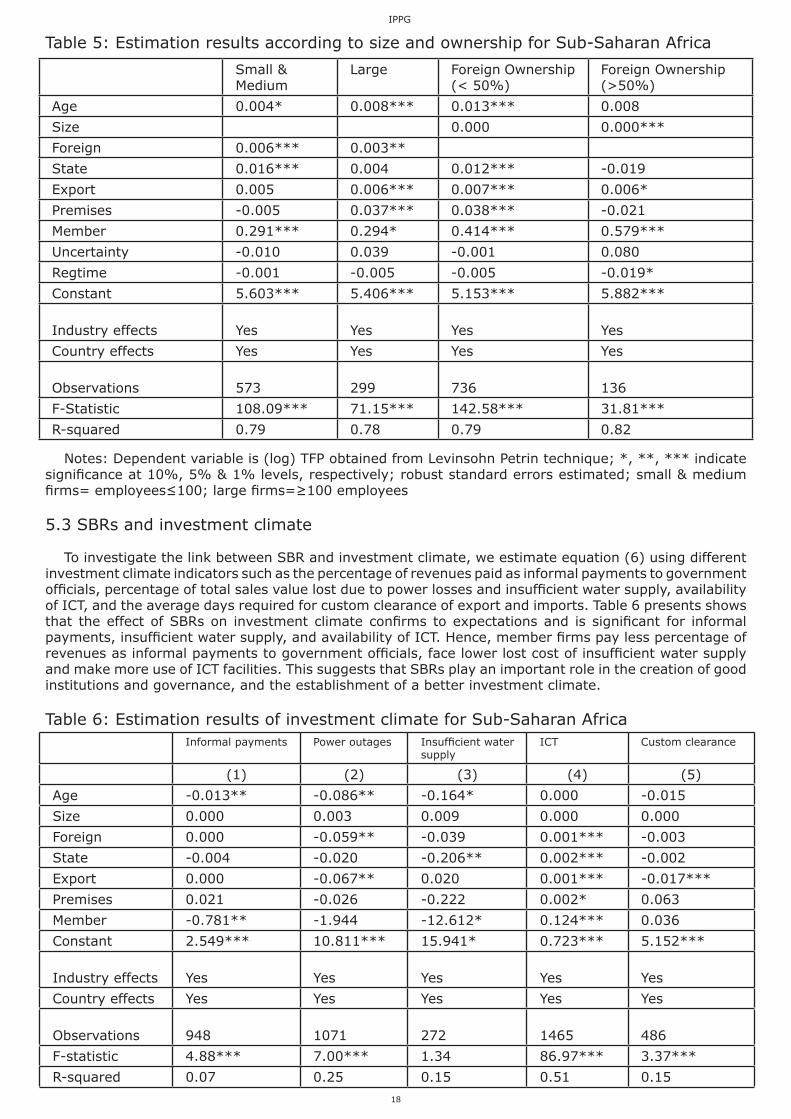
It is sometimes argued that the effect of SBRs will be greater for large firms as compared to small and medium sized firms because of their improved, and in many cases informal, links with state agents. The efficacy of business associations for large firms is also debated, with some considering no business case for large firms to organize themselves as they could lobby government directly to negotiate new terms. To test these claims, we divided the sample into two groups according to firm size. The first group comprises of small and medium firms, that is, those with total number of employees less than or equal to 100, and the second group comprises of large firms with total number of employees over 100.
The first two columns of Table 5 represent the results for the effect of SBRs on firm productivity for small and medium, and large firms, respectively. In both cases, we find a statistically significant positive effect of joining a business association on the productivity of firms. The positive impact of membership for the small and medium firms suggests that these firms prefer to join business associations as they lack other means for effective lobbying. Organized associations provide these firms a platform to pool resources, build a more coherent and consistent case, and exercise a greater impact on the government. The significant effect of membership for large firms contradicts the claim that large firms do not gain from joining business associations.
As discussed in Section 2, the ownership structure of firms may be another factor influencing the effect of SBRs on firm performance. Foreign owned firms, especially those in developing countries, are often accused of influencing the governments through their powerful economic positions and connections, as well as through the extensive resources available for effective lobbying. If this is true and effective, then we would find the effect of SBRs to be on average larger for foreign owned firms than domestically owned ones. The last two columns of Table 5 present the effect of SBRs on TFP based on their foreign ownership. For both types of firms, that is, those with less than 50 percent and equal to or greater than 50 percent foreign ownership, we find a significant effect of membership on firm performance. However, the effect of SBRs is greater for firms with 50 percent or higher foreign ownership than for those with less than 50 percent foreign ownership.
Variable Estimated coefficient Sample mean
Information on government regulation 0.10* 1.85
Lobbying government 0.08* 1.41
Information on domestic markets 0.07 1.42
Information on international markets 0.07 1.34
Accreditation standards 0.08 1.00
Resolution of disputes 0.02 0.97
18
iPPg
19
iPPg
Table 5: Estimation results according to size and ownership for Sub-Saharan Africa
Notes: Dependent variable is (log) TFP obtained from Levinsohn Petrin technique; *, **, *** indicate significance at 10%, 5% & 1% levels, respectively; robust standard errors estimated; small & medium firms= employees≤100; large firms=≥100 employees
5.3 SBRs and investment climate
To investigate the link between SBR and investment climate, we estimate equation (6) using different investment climate indicators such as the percentage of revenues paid as informal payments to government officials, percentage of total sales value lost due to power losses and insufficient water supply, availability of ICT, and the average days required for custom clearance of export and imports. Table 6 presents shows that the effect of SBRs on investment climate confirms to expectations and is significant for informal payments, insufficient water supply, and availability of ICT. Hence, member firms pay less percentage of revenues as informal payments to government officials, face lower lost cost of insufficient water supply and make more use of ICT facilities. This suggests that SBRs play an important role in the creation of good institutions and governance, and the establishment of a better investment climate.
Table 6: Estimation results of investment climate for Sub-Saharan Africa
Small & Medium
Large Foreign Ownership (< 50%)
Foreign Ownership (>50%)
Age 0.004* 0.008*** 0.013*** 0.008
Size 0.000 0.000***
Foreign 0.006*** 0.003**
State 0.016*** 0.004 0.012*** -0.019
Export 0.005 0.006*** 0.007*** 0.006*
Premises -0.005 0.037*** 0.038*** -0.021
Member 0.291*** 0.294* 0.414*** 0.579***
Uncertainty -0.010 0.039 -0.001 0.080
Regtime -0.001 -0.005 -0.005 -0.019*
Constant 5.603*** 5.406*** 5.153*** 5.882***
Industry effects Yes Yes Yes Yes
Country effects Yes Yes Yes Yes
Observations 573 299 736 136
F-Statistic 108.09*** 71.15*** 142.58*** 31.81***
R-squared 0.79 0.78 0.79 0.82
Informal payments Power outages Insufficient water supply
ICT Custom clearance
(1) (2) (3) (4) (5)
Age -0.013** -0.086** -0.164* 0.000 -0.015
Size 0.000 0.003 0.009 0.000 0.000
Foreign 0.000 -0.059** -0.039 0.001*** -0.003
State -0.004 -0.020 -0.206** 0.002*** -0.002
Export 0.000 -0.067** 0.020 0.001*** -0.017***
Premises 0.021 -0.026 -0.222 0.002* 0.063
Member -0.781** -1.944 -12.612* 0.124*** 0.036
Constant 2.549*** 10.811*** 15.941* 0.723*** 5.152***
Industry effects Yes Yes Yes Yes Yes
Country effects Yes Yes Yes Yes Yes
Observations 948 1071 272 1465 486
F-statistic 4.88*** 7.00*** 1.34 86.97*** 3.37***
R-squared 0.07 0.25 0.15 0.51 0.15
18
iPPg
19
iPPg
Notes: Custom clearance is the average number of days for export and import custom clearance; ICT measures if the firm uses e-mail facilities regularly; *, **, *** indicate significance at 10%, 5% and 1% levels respectively; robust standard errors estimated.
5.4 Labour productivity and returns to labour
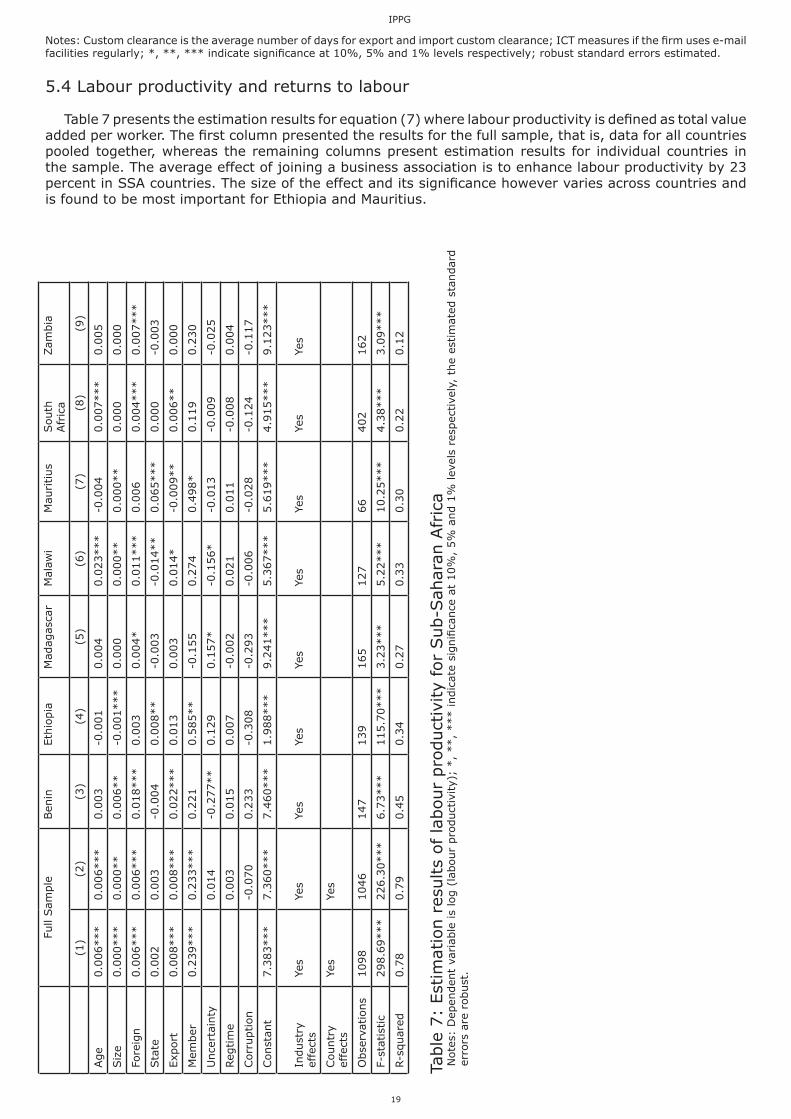
Table 7 presents the estimation results for equation (7) where labour productivity is defined as total value added per worker. The first column presented the results for the full sample, that is, data for all countries pooled together, whereas the remaining columns present estimation results for individual countries in the sample. The average effect of joining a business association is to enhance labour productivity by 23 percent in SSA countries. The size of the effect and its significance however varies across countries and is found to be most important for Ethiopia and Mauritius.
Full
Sam
ple
Ben
inEth
iopia
Mad
agas
car
Mal
awi
Mau
ritius
South
Afr
ica
Zam
bia
(1)
(2)
(3)
(4)
(5)
(6)
(7)
(8)
(9)
Age
0.0
06***
0.0
06***
0.0
03
-0.0
01
0.0
04
0.0
23***
-0.0
04
0.0
07***
0.0
05
Siz
e0.0
00***
0.0
00**
0.0
06**
-0.0
01***
0.0
00
0.0
00**
0.0
00**
0.0
00
0.0
00
Fore
ign
0.0
06***
0.0
06***
0.0
18***
0.0
03
0.0
04*
0.0
11***
0.0
06
0.0
04***
0.0
07***
Sta
te0.0
02
0.0
03
-0.0
04
0.0
08**
-0.0
03
-0.0
14**
0.0
65***
0.0
00
-0.0
03
Exp
ort
0.0
08***
0.0
08***
0.0
22***
0.0
13
0.0
03
0.0
14*
-0.0
09**
0.0
06**
0.0
00
Mem
ber
0.2
39***
0.2
33***
0.2
21
0.5
85**
-0.1
55
0.2
74
0.4
98*
0.1
19
0.2
30
Unce
rtai
nty
0.0
14
-0.2
77**
0.1
29
0.1
57*
-0.1
56*
-0.0
13
-0.0
09
-0.0
25
Reg
tim
e0.0
03
0.0
15
0.0
07
-0.0
02
0.0
21
0.0
11
-0.0
08
0.0
04
Corr
uption
-0.0
70
0.2
33
-0.3
08
-0.2
93
-0.0
06
-0.0
28
-0.1
24
-0.1
17
Const
ant
7.3
83***
7.3
60***
7.4
60***
1.9
88***
9.2
41***
5.3
67***
5.6
19***
4.9
15***
9.1
23***
Indust
ry
effe
cts
Yes
Yes
Yes
Yes
Yes
Yes
Yes
Yes
Yes
Countr
y ef
fect
sYe
sYe
s
Obse
rvat
ions
1098
1046
147
139
165
127
66
402
162
F-st
atis
tic
298.6
9***
226.3
0***
6.7
3***
115.7
0***
3.2
3***
5.2
2***
10.2
5***
4.3
8***
3.0
9***
R-s
quar
ed0.7
80.7
90.4
50.3
40.2
70.3
30.3
00.2
20.1
2
Table
7:
Est
imat
ion r
esults
of la
bour
pro
duct
ivity
for
Sub-S
ahar
an A
fric
aN
ote
s: D
epen
den
t va
riab
le is
log (
labour
pro
duct
ivity)
; *,
**,
*** indic
ate
signifi
cance
at
10%
, 5%
and 1
% lev
els
resp
ective
ly,
the
estim
ated
sta
ndar
d
erro
rs a
re r
obust
.
20
iPPg
21
iPPg
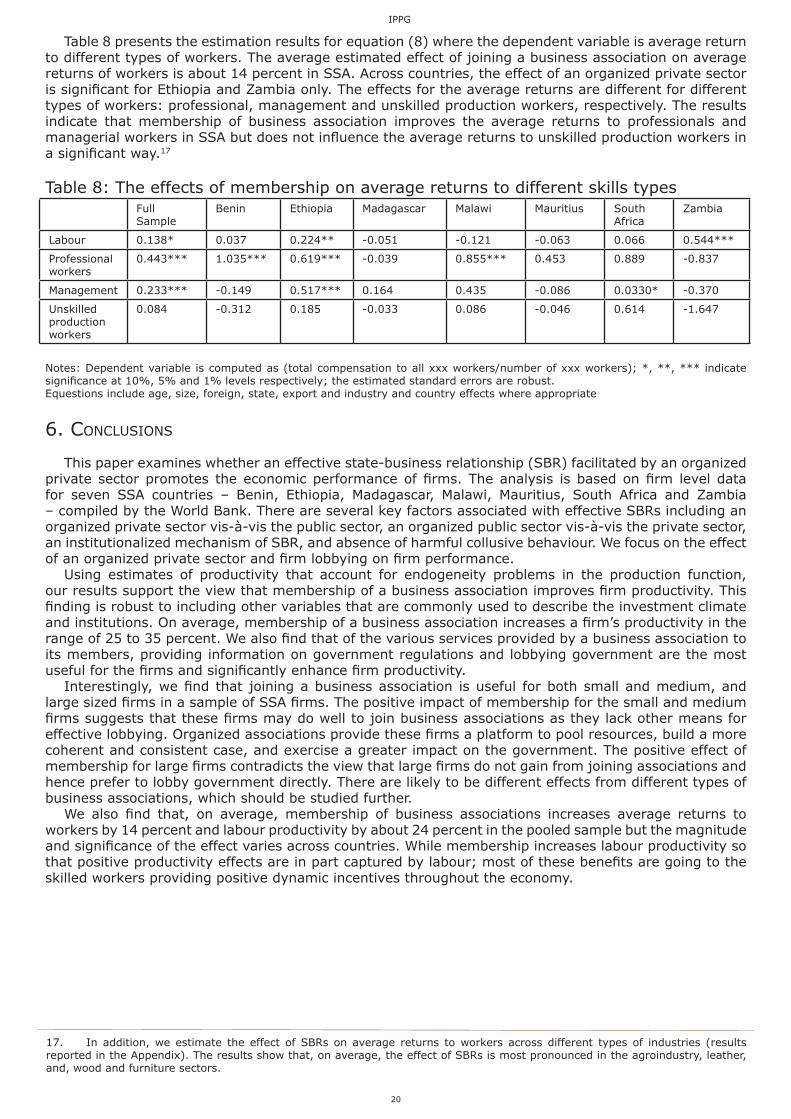
Table 8 presents the estimation results for equation (8) where the dependent variable is average return to different types of workers. The average estimated effect of joining a business association on average returns of workers is about 14 percent in SSA. Across countries, the effect of an organized private sector is significant for Ethiopia and Zambia only. The effects for the average returns are different for different types of workers: professional, management and unskilled production workers, respectively. The results indicate that membership of business association improves the average returns to professionals and managerial workers in SSA but does not influence the average returns to unskilled production workers in a significant way.17
Table 8: The effects of membership on average returns to different skills types
Notes: Dependent variable is computed as (total compensation to all xxx workers/number of xxx workers); *, **, *** indicate significance at 10%, 5% and 1% levels respectively; the estimated standard errors are robust.Equestions include age, size, foreign, state, export and industry and country effects where appropriate
6. conclusions
This paper examines whether an effective state-business relationship (SBR) facilitated by an organized private sector promotes the economic performance of firms. The analysis is based on firm level data for seven SSA countries – Benin, Ethiopia, Madagascar, Malawi, Mauritius, South Africa and Zambia – compiled by the World Bank. There are several key factors associated with effective SBRs including an organized private sector vis-à-vis the public sector, an organized public sector vis-à-vis the private sector, an institutionalized mechanism of SBR, and absence of harmful collusive behaviour. We focus on the effect of an organized private sector and firm lobbying on firm performance.
Using estimates of productivity that account for endogeneity problems in the production function, our results support the view that membership of a business association improves firm productivity. This finding is robust to including other variables that are commonly used to describe the investment climate and institutions. On average, membership of a business association increases a firm’s productivity in the range of 25 to 35 percent. We also find that of the various services provided by a business association to its members, providing information on government regulations and lobbying government are the most useful for the firms and significantly enhance firm productivity.
Interestingly, we find that joining a business association is useful for both small and medium, and large sized firms in a sample of SSA firms. The positive impact of membership for the small and medium firms suggests that these firms may do well to join business associations as they lack other means for effective lobbying. Organized associations provide these firms a platform to pool resources, build a more coherent and consistent case, and exercise a greater impact on the government. The positive effect of membership for large firms contradicts the view that large firms do not gain from joining associations and hence prefer to lobby government directly. There are likely to be different effects from different types of business associations, which should be studied further.
We also find that, on average, membership of business associations increases average returns to workers by 14 percent and labour productivity by about 24 percent in the pooled sample but the magnitude and significance of the effect varies across countries. While membership increases labour productivity so that positive productivity effects are in part captured by labour; most of these benefits are going to the skilled workers providing positive dynamic incentives throughout the economy.
17. In addition, we estimate the effect of SBRs on average returns to workers across different types of industries (results reported in the Appendix). The results show that, on average, the effect of SBRs is most pronounced in the agroindustry, leather, and, wood and furniture sectors.
Full Sample
Benin Ethiopia Madagascar Malawi Mauritius South Africa
Zambia
Labour 0.138* 0.037 0.224** -0.051 -0.121 -0.063 0.066 0.544***
Professional workers
0.443*** 1.035*** 0.619*** -0.039 0.855*** 0.453 0.889 -0.837
Management 0.233*** -0.149 0.517*** 0.164 0.435 -0.086 0.0330* -0.370
Unskilled production workers
0.084 -0.312 0.185 -0.033 0.086 -0.046 0.614 -1.647
20
iPPg
21
iPPg
bibliograPhy
Aarland, K.; C. James; J. Davis; V. Henderson; and Yukako Ono (2004) ‘Spatial Organization of Firms: The Decision to Split Production and Administration’. Discussion Paper No. 04–03, Centre for Economic Studies, Washington DC.
Abowd, John; John Haltiwanger; Ron Jarmin; Julia Lane; Paul Lengermann; Kristin McCue; Kevin McKinney; and Kristin Sandusky (2002) ‘The Relationship between Human Capital, Productivity and Market Value: Building Up from Micro Evidence’. Paper prepared for the NBER/CRIW conference, Washington, D.C., April 2002.
Arellano, M. and S. Bond (1991) ‘Some Tests of Specification for Panel Data: Monte Carlo Evidence and an Application to Employment Equations’. Review of Economic Studies, vol. 58, pp. 277–297.
Arellano, M. and O. Bover (1995) ‘Another look at the Instrumental Variable Estimation of Error-Component Models’. Journal of Econometrics, vol. 68, pp. 29–52.
Arnold, J. M. (2005) ‘Productivity Estimation at the Plant Level: A Practical Guide’. Paper available at http://www.jensarnold.de/prodest.pdf
Beck, T., Asli Demirgüç-Kunt, and Vojislav Maksimovic (2005) ‘Financial and Legal Constraints to Growth: Does Firm Size Matter?’ The Journal of Finance, vol. 60(1), pp. 137–177.
Bloom, Nick, Stephen Bond, and John Van Reenen (2006) ‘Uncertainty and Investment Dynamics’. Working Paper No. 12383, National Bureau of Economic Research, Cambridge MA.
Boddewyn, J. J. (1988) ‘Political Aspects of MNE Theory’. Journal of International Business Studies, vol. 19(3), pp. 341–363.
Bond, Stephen and J. G. Cummins (2004) ‘Uncertainty and Investment: An Empirical Investigation Using Data on Analysts’ Profits Forecasts’. Discussion Paper No. 2004–20, US Federal Reserve System.
Brautigam, D., L. Rakner and S.Taylor (2002) ‘Business associations and growth coalitions in Sub-Saharan Africa’. Journal of Modern African Studies, vol. 40, 4, pp. 519–547.
Blundell, R. and S. Bond (1999) ‘GMM Estimation with Persistent Panel Data: An Application to Production Functions’. Working Paper No. 99/4, The Institute for Fiscal Studies, London.
de Soto, H. (2002) The Mystery of Capital: Why Capitalism Triumphs in the West and Fails Everywhere
else. New York, Basic Books Press.
Desbordes, R. and J. Vauday (2006) ‘The Political Influence of Foreign Firms in Developing Countries’. Available online at www.adres.polytechnique.fr/DOCTEURS/ARTICLE_pdf/desbordes-article.pdf
Dixit, A.K. and R. Pindyck (1994) Investment Under Uncertainty. Princeton University Press.
Dollar, David, Mary Hallward-Driemeier, and Tay Mengistae (2003) ‘Investment Climate and Firm Performance in Developing Economies’. Unpublished manuscript, World Bank.
Du, Julan (2002) ‘Government-Business Relationship and International Corporate Finance’. Paper presented at the Royal Economic Society Annual Conference 2002, 25–27 March, Warwick, UK.
Duranton, G. and Diego Puga (2002) ‘From Sectoral to Functional Urban Specialization’. Working Paper No. W9112, National Bureau of Economic Research, Cambridge MA.
Falk, Martin and Katja Seim (2000) ‘The Impact of Information Technology on High-Skilled Labor in Services: Evidence from Firm-Level Panel Data’. ZEW Discussion Paper No. 5899.
Farinha, Jorge (2003) ‘Corporate Governance: A Survey of the Literature’. Universidade do Porto
Economia Discussion Paper No. 2003–06.
Gawande, K., P. Krishna, and M. J. Robbins (2004) ‘Foreign Lobbies and US Trade Policy’. Working Paper No. W10205, National Bureau of Economic Research, Cambridge MA.
22
iPPg
23
iPPg
Ghosal, Vivek (2003) ‘Impact of Uncertainty and Sunk Costs on Firm Survival and Industry Dynamics’. Working Paper No. SP II 2003–12, Competitiveness and Industrial Change Research Unit, Wissenschaftszentrum Berlin.
Grether, J.-M., J. de Melo, and M. Olarreaga (2001) ‘Who Determines Mexican Trade Policy?’ Journal of Development Economics, vol. 64 (2), pp. 343–370.
Hall, Robert E. and Charles I. Jones (1999) ‘Why do Some Countries Produce So Much More Output per Worker than Others?’ The Quarterly Journal of Economics, vol. 114(1), pp. 83–116.
Harriss, J. (2006) ‘Institutions and State-Business Relations’. IPPG Briefing Note 2, available online at http://www.ippg.org.uk/publications.html#br2.
Hartman, R. (1972) ‘The Effects of Price and Cost Uncertainty on Investment’. Journal of Economic Theory, vol. 5, pp. 258–66.
Hausmann, R. and D. Rodrik (2002) ‘Economic Development as Self-Discovery’. NBER Discussion Paper 8952.
Hillman, A. L. and H. W. Ursprung (1993) ‘Multinational Firms, Political Competition, and International Trade Policy’. International Economic Review, vol. 34(2), pp. 347–63.
Hillman, A. J. and M. A. Hitt (1999) ‘Corporate Political Strategy Formulation: A Model of Approach, Participation, and Strategy Decision’. The Academy of Management Review, vol. 24(4), pp. 825–842.
Hisahiro, K. (2005) ‘Comparative Analysis of Governance: Relationship Between Bureaucracy and Policy Co-ordination Capacity with Particular Reference to Bangladesh’. Institute for International Co-operation.
Islam, Rizwanul (2000) ‘Pro-poor Growth: Linkages and Policies’. Geneva: ILO.
Kerr, Roger (2000) ‘The Quagmire of Regulation’. Speech delivered at the Otaki Rotary Club, New Zealand, October 2000.
Kohli, A (2006) ‘Politics of Economic Growth in India, 1980–2005 Part 1: The 1980s’ and ‘Part II: The 1990s and Beyond’. Economic and Political Weekly, April 1 pp. 1251–1259 and April 8 pp. 1361–1370.
Levinsohn, James and Amil Petrin (2000) ‘Estimating Production Functions Using Inputs to Control for Unobservables’. Review of Economic Studies, vol. 70(2), pp. 317–341.
Mandova, Petya (2002) ‘Effectiveness of Public-Private Dialogue in Bulgaria’. Institute for Market Economics.
Marschak, Jacob and William H. Jr. Andrews (1944) ‘Random Simultaneous Equations and the Theory of Production’. Econometrica, vol 12, pp. 143–206.
McArthur, John and Francis Teal (2002) ‘Corruption and Firm Performance in Africa’. Working Paper No. 2002–10, Centre for the Study of African Economies, Department of Economics, University of Oxford.
OECD (2006) Promoting Pro-poor Growth: Policy Guidance for Donors. Paris: Organization for Economic Co-operation and Development.
Olarreaga, M. (1999) ‘Endogenous Tariffs in the Presence of Foreign Capital’. Journal ofEconomic Integration, vol. 14(4), pp. 606–624.
Olley, Steven and Ariel Pakes (1996) ‘The Dynamics of Productivity in the Telecommunications Equipment Industry’. Econometrica, vol. 64(6), pp. 1263–1297.
Pernia, E. M. and J. M. Ian S. Salas (2006) ‘Investment Climate, Productivity, and Regional Development in a Developing Country’. Asian Development Review, vol. 23(2), pp. 70–89.
Qureshi, M. and D.W. te Velde (2007) ‘State-Business Relations and Firm Performance in Zambia’. IPPG Discussion Paper 5 available online, http://www.ippg.org.uk/publications.html.
Rajan, Raghuram and Luigi Zingales (1999) ‘The Politics of Financial Development’. Mimeo, University of Chicago.
22
iPPg
23
iPPg
Roe, Mark J. (2000) ‘Political Preconditions to Separating Ownership from Corporate Control’. Stanford Law Review, vol. 53(3), pp. 539–606.
Scarpetta, Stefano, Philip Hemmings, Thierry Tressel, and Jaejoon Woo (2002) ‘The Role of Policy and Institutions for Productivity and Firm Dynamics: Evidence from Micro and Industry Data’. Working Paper No. 329, OECD Economics Department, OECD Publishing.
Scherer, F. M., A. Beckenstein, E. Kaufer and R. D. Murphy (1975) The Economics of Multiplant Operations: An International Comparison Study. Cambridge, MA., Harvard University Press.
Schumpeter, Joseph A. (1942) Capitalism, Socialism and Democracy. New York, Harper and Brothers.Seabright, Paul (2000) ‘Ten Years of European Merger Control’. Lecture delivered in the Beesley
Lectures: Lectures on Regulation Series, at the Institute of Economic Affairs, London.
Sen, K. and D.W. te Velde (2007) ‘State business relationships and economic growth in sub Saharan Africa’. Draft IPPG paper.
Subramanian, Uma, Willimam P. Anderson, and Kihoon Lee (2005) ‘Measuring the Impact of the Investment Climate on Total Factor Productivity: The Cases of China and Brazil’. Policy Research Working Paper No. 3792, World Bank.
Warner, Grey F. (2006) ‘Innovation and Economic Growth’. Paper presented for the OECD Forum on Balancing Globalization, 22-23 May, 2006, Paris.
Weiss, L. (1998) The Myth of the Powerless State. Ithaca, NY: Cornell University Press.
World Bank (2006) World Development Indicators 2006. Washington DC: World Bank.
Velde, D.W. te, and O. Morrissey (2005) ‘Supporting industrial development: overcoming market failures and providing public goods’. Report to UNIDO.
Velde, D.W. te (2006) ‘Measuring state-business relations in sub-Saharan Africa’. IPPG Discussion Paper 4 available online, http://www.ippg.org.uk/publications.html
24
iPPg
25
iPPg
aPPendix a
Table A1: Description of variables
Notes: 1) Total value added=total market value of production-total material costs-total energy costs; 2) Number of workers includes permanent workers; 3) Capital is the gross value of plant, property and equipment; 4) LCU=local currency units.
Variables Abbreviation Units Question Code
Total value added1 Value added In 000 LCU4 C274a1y-c274d1y-c274e1y
Number of workers2 Labour Number C262a1y
Capital3 Capital In ‘000 C281a1Y
Energy Energy In 000 LCU C74e1y
Material Material In 000 LCU C274d1y
Sector Ind Dummy variable Industry
Location Loc Dummy variable Country
Age of firm Age Years Surveyyear-c201
Foreign Ownership Foreign Percentage C203b
State Ownership State Percentage C203c
Ownership Ownership Dummy variable Ownership
Sales exported directly Export Percentage C211a2
Number of premises Premises Number C206a
Number of competitors Competitors Number C216a+c216a2+c216a3
Export custom clearance Exportclearance Days C236b1
Import clearance Importclearance Days C236b1
Capacity utilization Capacityutiliz Percentage C250a
Workers with at least a secondary Education
Edusecondary Percentage C270b+c270c+c270dti
Losses due to power outages
Powerlosses Percentage C219a3
Telephone unavailable Teleunavailable Days C219c1
Internet access Internet Yes = 1, No = 0 C224a
CorruptionPercentage of informal payments
CorruptionInfpay
Dummy variablePercentage
C218oC239
Economic and regulatory policy uncertainty
Uncertainty Scale 0 to 4 C218m
Member of a business association or CoC
Member Yes = 1, No = 0 C225a
Firm lobbying Lobby Yes = 1, No = 0 C244a
Time required in dealing with regulations
Regtime Percentage C238
Services of Govt. institutions
Govtservices Scale 0 to 6 C234
Days spent in Govt. inspections
Inspections Days C242a7
24
iPPg
25
iPPg
Table A2: Estimation results for the production function
Notes: Dependent variable in all specifications is log of total valueadded; *, **, *** indicate significance at 10%, 5% and 1% levels respectively, labour is defined as number of permanent employees and capital is the gross value of plant, property and equipment; estimation is conducted using the Levinsohn-Petrin technique.
Table A3: Estimation results for SBR and average returns to different sectors in SSA
Notes: : Dependent variable is computed as (total compensation to all permanent workers/number of permanent workers); other variables included in the estimated equations are age, size, foreign, state, export, uncertainty, regtime, and country dummies; ** indicates significance at 5% level.
Benin Ethiopia Madagascar Malawi Mauritius South Africa
Zambia
Log(Labour) 0.44*** 0.30** 0.44*** 0.17** 0.06 0.29*** 0.25***
Log(Capital) 0.67*** 0.23 0.59*** 0.47** 0.15 0.05 0.47***
Observations 213 392 235 254 127 1110 357
Wald chi-2 0.28 4.29** 3.63* 3.02* 2.62 100.52*** 12.63***
Member Observations
Agroindustry 0.627** 116
Beverages -0.489 20
Chemicals and pharmaceuticals 0.165 114
Food 0.096 218
Garments 0.144 80
Leather 1.739** 37
Metals and machinery 0.163 207
Mining and quarrying 0.393 20
Non-metallic and plastic materials
-0.575 80
Other manufacturing -0.028 137
Paper -0.306 44
Textiles 0.026 116
Wood and furniture 0.274** 388
Top Related
Copyright © 2022 FDOKUMEN

