


Bahasa
Halaman
Hukum


On: 18 September 2007Access Details: Free AccessPublisher: Informa HealthcareInforma Ltd Registered in England and Wales Registered Number: 1072954Registered office: Mortimer House, 37-41 Mortimer Street, London W1T 3JH, UK
Annals of Human BiologyPublication details, including instructions for authors and subscription information:http://www.informaworld.com/smpp/title~content=t713723502
Spirometric reference values for children andadolescents from KazakhstanFiorenzo Facchini a; Giovanni Fiori b; Giorgio Bedogni bc; Livia Galletti a; OrazakIsmagulov d; Ainagul Ismagulova d; Turegeldy Sharmanov e; Igor Tsoy e; MariaGiovanna Belcastro a; Sara Rizzoli b; Matteo Goldoni bfa Department of Experimental Evolutionary Biology, Bologna University, Italyb MediData Studi e Ricerche, Modena, Italyc Liver Research Center, Basovizza (Trieste), Italyd Anthropology Laboratory, National Academy of Sciences, and State NationalMuseum, Almaty, Kazakhstane National Institute of Nutrition, National Academy of Sciences, Almaty, Kazakhstanf Department of Clinical Medicine, Nephrology and Health Sciences, University ofParma, Parma, Italy
Online Publication Date: 01 September 2007To cite this Article: Facchini, Fiorenzo, Fiori, Giovanni, Bedogni, Giorgio, Galletti, Livia, Ismagulov, Orazak,Ismagulova, Ainagul, Sharmanov, Turegeldy, Tsoy, Igor, Belcastro, Maria Giovanna, Rizzoli, Sara and Goldoni, Matteo(2007) 'Spirometric reference values for children and adolescents from Kazakhstan', Annals of Human Biology, 34:5, 519 -534To link to this article: DOI: 10.1080/03014460701556346URL: http://dx.doi.org/10.1080/03014460701556346
PLEASE SCROLL DOWN FOR ARTICLE
Full terms and conditions of use: http://www.informaworld.com/terms-and-conditions-of-access.pdf
This article maybe used for research, teaching and private study purposes. Any substantial or systematic reproduction,re-distribution, re-selling, loan or sub-licensing, systematic supply or distribution in any form to anyone is expresslyforbidden.
The publisher does not give any warranty express or implied or make any representation that the contents will becomplete or accurate or up to date. The accuracy of any instructions, formulae and drug doses should beindependently verified with primary sources. The publisher shall not be liable for any loss, actions, claims, proceedings,demand or costs or damages whatsoever or howsoever caused arising directly or indirectly in connection with orarising out of the use of this material.

Dow
nloa
ded
At:
09:4
6 18
Sep
tem
ber 2
007
Annals of Human Biology, September–October 2007; 34(5): 519–534
Spirometric reference values for children and adolescentsfrom Kazakhstan
FIORENZO FACCHINI1, GIOVANNI FIORI2, GIORGIO BEDOGNI2,3,
LIVIA GALLETTI1, ORAZAK ISMAGULOV4, AINAGUL ISMAGULOVA4,
TUREGELDY SHARMANOV5, IGOR TSOY5,
MARIA GIOVANNA BELCASTRO1, SARA RIZZOLI2, &
MATTEO GOLDONI2,6
1Department of Experimental Evolutionary Biology, Bologna University, Italy, 2MediData Studi
e Ricerche, Modena, Italy, 3Liver Research Center, Basovizza (Trieste), Italy, 4Anthropology
Laboratory, National Academy of Sciences, and State National Museum, Almaty, Kazakhstan,5National Institute of Nutrition, National Academy of Sciences, Almaty, Kazakhstan, and6Department of Clinical Medicine, Nephrology and Health Sciences, University of Parma,
Parma, Italy
(Received 5 June 2007; revised 5 June 2007; accepted 5 July 2007)
AbstractBackground: Spirometric parameters are influenced by several factors and many reference data areavailable in the literature. However, no spirometric data are available for children and adolescents fromCentral Asia.Aim: The study aimed to calculate spirometric reference curves on the basis of anthropometry,ethnicity (Kazakh vs. Russian) and living environment (urban vs. rural).Subjects and methods: Spirometry (FEV1, FVC and FEF25–75%) was performed and anthropometricmeasurements taken for 1926 male and 1967 female Kazakh children aged 7–18 years.Results: Height explained almost all the variance of forced vital capacity (FVC) and forced expiratoryvolume in 1 s (FEV1) for both sexes, while age and inspiratory circumference contributed slightly tothe prediction. Moreover, FVC and FEV1 were greater in Russians than in Kazakhs and ethnicity didenter the prediction model for these parameters. The living environment had a marginal effect onspirometry. In fact, forced expiratory flow 25–75% (FEF25–75%) was slightly higher in urban than inrural females, FVC was slightly higher in rural than in urban males, while FEV1 was not affected.Finally, among several spirometric equations available in the literature, those performing better in ourchildren were obtained in developed countries.Conclusion: Anthropometry was the most important predictor of spirometry. Age and ethnicity werealso predictors, while the contribution of the living environment was more limited.
Keywords: Children, spirometry, Kazakhstan, ethnicity, living environment
Correspondence: Fiorenzo Facchini, Anthropology Unit, Department of Experimental Evolutionary Biology, Bologna University,
Via Selmi 3, 40126 Bologna, Italy. E-mail: [email protected]
ISSN 0301–4460 print/ISSN 1464–5033 online � 2007 Informa UK Ltd.
DOI: 10.1080/03014460701556346

Dow
nloa
ded
At:
09:4
6 18
Sep
tem
ber 2
007
Introduction
Spirometry, i.e. the measurement of airflow during maximal forced expiration, is a non-
invasive technique for assessing lung function. The spirometric parameters most commonly
employed are forced vital capacity (FVC) and forced expiratory volume in 1 s (FEV1).
The prediction of FVC and FEV1 from equations based on gender, age and height is
commonly employed to obtain reference values for evaluating lung function (Parma et al.
1996; Coultas et al. 1998; Mohamed et al. 2002). Other anthropometric parameters such as
body mass index (BMI) may slightly improve the accuracy of the prediction (Marcus et al.
1988). Moreover, spirometric values are influenced by genetic factors, ethnic characteristics
(American Thoracic Society 1991; Hankinson et al. 1999) environmental pollution, physical
activity, altitude (Forastiere et al. 1994; MacAuley et al. 1999; Fiori et al. 2000; Havryk et al.
2002) and to a minor extent by nutritional and socio-economical factors (Harik-Khan et al.
2004; Raju et al. 2005), which are normally not included in spirometric reference curves.
The transition between childhood and adolescence makes the relation between anthro-
pometry and lung function more complicated than in adults (Knudson et al. 1983; Quanjer
et al. 1995) and renders necessary the use of population-specific equations (Hellmann and
Goren 1999).
No spirometric data are presently available for children and adolescents from Central
Asia. As part of the Kazakhstan Health and Nutrition Examination Survey (KHAN-ES)
(Facchini et al., in press), we performed spirometry in a large sample of children and
adolescents with the aim of calculating reference curves on the basis of anthropometry,
ethnicity (Russian vs. Kazakh) and living environment (urban vs. rural). This calculation
and the comparison of our prediction model with those available in the literature may be
useful for clinical purposes in a multiethnic country undergoing a rapid modernization
process and could add information about lung function in developing countries.
Methods
Study design
Kazakhstan is a multiethnic country, where Kazakhs and Russians represent today about
80% of the population with consistent minorities of other ethnic groups (the main ones are
Ukrainians, Germans and Uzbeks) (Bhavna 2004). Kazakhs have been rapidly increasing
after independence (122% from 1989 to 1999) and a complete description of the
demographic trend of the last century was published recently (Masanov 2002). Moreover,
the ethnic characteristics of Kazakhs are well described in the literature (Facchini and Fiori
2000).
The measurement of lung function was one of the aims of KHAN-ES, a cross-sectional
study of children and adolescents living in urban and rural areas of Kazakhstan. Male and
female children of the two major ethnic groups of Kazakhstan, i.e. Kazakhs and Russians,
were studied between 2002 and 2004. They were aged 7–18 years and resided either in
Almaty or in Chilik. Almaty (1 200 000 inhabitants) is the biggest city in Kazakhstan, and is
at an altitude of about 600–950 m. Chilik is a village of about 20 000 inhabitants located
150 km north-east from Almaty at an altitude of 600 m and is very distant from other urban
centres. Because Chilik did not meet the demographic criteria of ‘urban area’ defined by the
United States Department of Agriculture (US Department of Agriculture 2005) we
classified its environment as ‘rural’. Almaty is made up of six urban districts and at the time
520 F. Facchini et al.

Dow
nloa
ded
At:
09:4
6 18
Sep
tem
ber 2
007
of the study had nearly 180 000 students aged 7–18 years, attending about 230 schools.
Only 20 schools of three different districts agreed to participate in KHAN-ES, so our Almaty
sample must be considered a convenience sample. In Chilik, about 5000 students aged 7–18
years attended 15 different schools, 11 of which agreed to participate in KHAN-ES. We
recruited about 50 children (from 40 to 65) for every combination of gender (male vs.
female), environment (Almaty vs. Chilik), ethnic group (Kazakh vs. Russian) and age group
(7–18 years), for a total of 4808 children. The number of subjects was lower only at the
extremes (7 and 18 years). We selected a random sample of school classes for each year of
age from 7 to 18 years and an almost equal number of Russian and Kazakh children of both
sexes for each class. The overall participation rate was about 1.5% in Almaty and 50% in
Chilik. Age was calculated as the difference between the day of the visit and birthday, and
was therefore decimal.
General exclusion criteria from KHAN-ES were mental impairment, having a sibling
already enrolled into the study, unknown ethnic origin, and different ethnic origin of
parents. Specific exclusion criteria for the present analysis were: (1) present smoking (�4
cigarettes/week); (2) previous smoking (�4 cigarettes/week within 12 months of spirometry);
(3) presence of respiratory symptoms at the time of spirometry; (4) use of respiratory drugs;
(5) chronic respiratory disease (e.g. asthma), cardiovascular disease or past history of other
respiratory pathologies (violation of these criteria led to the exclusion of 608 children);
(6) lack of data needed for analysis (n¼ 299); and (7) transcription errors (n¼ 10).
The above data were self-reported in a questionnaire compiled by the children (e.g. for
smoking habits) or their parents. On the basis of the data of Gold et al. (1996), slight or
occasional smokers (from 1 to 3 cigarettes/week, n¼ 9), sometimes considered as non-
smokers (e.g. National Cancer Institute 2001) were included in the analysis. However, their
exclusion from statistical analysis did not modify the results (data not shown). Because of the
high number of subjects it was not possible to employ more accurate indicators of cigarette
smoking such as cotinine in saliva or urine (Simoni et al. 2006). Therefore, the influence of
environmental passive smoking was not considered in this study.
A total of 3893 children (1926 males and 1967 females) were thus available for the present
analysis. The study was conducted in conformity with the declaration of Helsinki and the
protocol was approved by the Scientific Committee of the Kazakh Academy of Sciences. As
requested in the case of no greater than minimal risk, every boy/girl gave his/her written
assent and at least one parent gave a written and signed informed permission to participate
in the study if the child’s age was lower than 18.00 years (Burns 2003). Otherwise (age
between 18.00 and 18.49 years), the boy/girl himself/herself gave his/her signed informed
consent.
Spirometry
FVC and FEV1 were assessed using a Vitalograph spirometer calibrated at least twice daily
with a 3-L syringe (Vitalograph, Maids Moreton, Buckingham, UK) in medical rooms at
school with a temperature between 20 and 25�C, without differences between Almaty and
Chilik. The children performed at least three blows from the sitting position and the highest
values of FVC and FEV1 were recorded (American Thoracic Society 1995; Arets et al.
2001). Forced Midexpiratory Flow FEF25–75% was calculated from the blow with the
largest sum of FEV1 and FVC. Reproducibility of measurements was within the limits
established by the American Thoracic Society and ATS/ERS (American Thoracic Society
1995; Miller et al. 2005).
Lung function in Kazakh children 521

Dow
nloa
ded
At:
09:4
6 18
Sep
tem
ber 2
007
Anthropometry
Weight, height, sitting height, chest circumference (maximal inspiratory or ICC, maximal
expiratory or ECC, and resting or RCC), chest breadth, and chest depth were measured
following the Anthropometric Standardization Reference Manual (Lohman et al. 1991). BMI
was calculated as weight (kg)/height (m)2. The per cent increase in chest circumference was
calculated as �CC¼ [(ICC–ECC)/ECC]� 100.
Statistical analysis
Medians, 10th and 90th percentiles were calculated for every measurement, stratifying
children for living environment and ethnicity. Spirometry prediction equations were
developed using forward stepwise multiple regression. Anthropometric variables (see
above), age (years, continuous), living environment (0¼urban; 1¼ rural) and ethnic group
(0¼Kazakh; 1¼Russian) were input in the model separately for males and females. A base-
10 logarithm (log10) transformation of the outcome variables with the predictors modelled as
linear was chosen because there was no increase in the explained variance when using log10-
transformed predictors or polynomial transformations and after taking interactions into
account. Multicollinearity was checked using variance inflation factors (VIF). Values of VIF
410 were taken as evidence of multicollinearity (Myers 1990). Standardized residual plots
are also reported. The final prediction model was compared with several models available in
the literature (Knudson et al. 1983; Lebecque et al. 1991; Rosenthal et al. 1993; Quanjer
et al. 1995; Sirotkovic and Cvoriscec 1995; Parma et al. 1996; Hankinson et al. 1999;
Ip et al. 2000; Kivastik and Kingisepp 2001; Golshan et al. 2003; Al-Riyami et al. 2004;
Chinn et al. 2006) using median values of the difference between measured and predicted
values and the difference between 5th and 95th percentiles (Tables I and II). Residual
standard deviation (RSD) as goodness-of-fit test is also reported for all experimental models.
It was calculated as SD of differences between observed and predicted values in a log-scale.
Moreover, linear RSD (LRSD) was calculated as the SD of differences between observed
and predicted spirometric values for all considered models in a linear scale. Finally, the
statistic of Bland and Altman (1986) was applied to log-transformed variables to further
investigate deviations from measured values. Statistical analysis was performed using SPSS
13.0 (SPSS, Chicago, USA).
Results
Prediction of FVC in males
Figure 1 give the distribution of age and gender and Table III gives the 10th, 50th and 90th
percentiles of all measurements.
At stepwise regression, the best model for the prediction of log10-FVC in males was based
on height (R2¼ 0.792), ICC (additional R2
¼ 0.019), ethnic group (additional R2¼ 0.009)
and age (additional R2¼ 0.005) (p50.001 for all predictors). Other anthropometric
variables were correlated with FVC, but they were not included because of multicollinearity
(data not shown). The final best fit model is reported in Table IV with total R2 and RSD
together with a simplified model taking into account only height and ethnicity. Residual
graph (Figure 2A) did not show significant deviations from normality, heteroskedasticity or
non-linearity.
522 F. Facchini et al.

Dow
nloa
ded
At:
09:4
6 18
Sep
tem
ber 2
007
The mean (95% CI) FVC difference between Russians and Kazakhs was 0.314
(0.208�0.419).
The living environment did not contribute to the prediction and was therefore not
inserted in the model. However, rural males had significantly but slightly higher values of
FVC than urban ones [mean difference (95% CI) 0.128 (0.022�0.233), p¼ 0.002].
Prediction of FVC in females
At stepwise regression, the best model for the prediction of log10-FVC in females was based
on height (R2¼ 0.735), ICC (additional R2
¼ 0.019), ethnic group (additional R2¼ 0.007)
and age (additional R2¼ 0.005) (p50.001 for all predictors). Other anthropometric
variables were associated with FVC, but they were not included because of multicollinearity
(data not shown). The final best fit model is reported in Table IV with total R2 and RSD
together with a simplified model taking into account only height and ethnicity. Residual
graph (Figure 2B) did not show significant deviations from normality, heteroskedasticity or
non-linearity.
Table I. The literature models used for comparisons for FVC. ln, natural logarithm; log, log10; M, male; F, female.
In the Chinn and Quanjer models, height is expressed in metres and in the Parma model, defined only for males.
Units for FVC are millilitres.
Author Model (FVC) M/F
Al-Riyami et al. (2004) M: ln(FVC)¼�15.699þ3.339ln(height)
Oman, 6–19 years F: ln(FVC)¼�14.955þ 3.170ln(height)
Chinn et al. (2006) M: ln(FVC)¼�1.422þ (1.495þ 0.0141Age)height
UK, 7–20 years F: ln(FVC)¼�1.466þ (1.471þ 0.0145Age)height
Golshan et al. (2003) M: FVC¼�4.322þ 0.04202Heightþ 0.09678Age
Iran,521 years F: FVC¼�3.223þ0.03510Heightþ0.06651Age
Hankinson et al. (1999), USA M: FVC¼�0.2584�0.20415Ageþ 0.010133Age2þ
0.00018642Height2
Caucasian (520 years M,518 years F) F: FVC¼ 1.2082þ 0.05916Ageþ 0.00014815Height2
Ip et al. (2000) M: ln(FVC)¼�13.851þ2.964ln(Height)
Hong Kong, 7–19 years F: ln(FVC)¼�13.270þ 2.835ln(Height)
Kivastik and Kingisepp (2001) M: ln(FVC)¼�10.583þ2.106ln(Height)þ 0.435ln(Age)
Estonia, 6–18 years F: ln(FVC)¼�10.136þ 1.969ln(Height)þ0.484ln(Age)
Quanjer et al. (1995) M: ln(FVC)¼�1.2782þ [1.3731þ 0.0164Age]Height
Europe, 6–21 years F: ln(FVC)¼�1.4507þ [1.4800þ0.0127Age]Height
Rosenthal et al. (1993) M5162.6 cm: FVC¼ 0.043 �Height� 3.619
UK, 4–19 years M� 162.6 cm: FVC¼ 0.068 �Height�7.038
F5152.6 cm: FVC¼ 0.039 �Height� 3.311
F� 152.6 cm: FVC¼ 0.045 �Height� 3.881
Sirotkovic and Cvoriscec (1995) M: FVC¼�5.00129þ0.04634Heightþ 0.07952Age
Croatia, 6–18 years F: FVC¼�3.37147þ 0.03296Heightþ 0.09170Age
Knudson et al. (1983) M 6–12 years: FVC¼�3.3756þ 0.0409Height
USA, variable age range M 12–25 years: FVC¼�6.8865þ 0.0590Heightþ 0.0739Age
F 6–11 years: FVC¼�3.7486þ 0.0430Height
F 12–20 years: FVC¼�4.4470þ 0.0416Heightþ 0.0699Age
Lebecque et al. (1991) M: log(FVC)¼�0.8703þ0.00881Height
Canada, 5–18 years F: log(FVC)¼�0.9742þ 0.00938Height
Parma et al. (1996) M: ln(FVC)¼ 0.1796�0.049ageþ 0.003age2þ
0.791ln(weight) – 0.043BMIþ
Italy, 7–18 years 12.060ln(ICC) �11.106� ln(ECC)� 9.678delta%
Lung function in Kazakh children 523
Dow
nloa
ded
At:
09:4
6 18
Sep
tem
ber 2
007
The mean (95% CI) FVC difference between Russians and Kazakhs was 0.203
(0.128�0.280).
The living environment did not contribute to the prediction and had no effect when added
to the final equation (p¼NS).
Prediction of FEV1 in males
At stepwise regression, the best model for the prediction of log10-FEV1 in males was based
on height (R2¼ 0.788), ICC (additional R2
¼ 0.018), ethnic group (additional R2¼ 0.004)
and age (additional R2¼ 0.005) (p50.001 for all predictors). Other anthropometric
variables were not included because of multicollinearity (data not shown). The final best fit
model is reported in Table IV with total R2 and RSD together with a simplified model taking
into account only height and ethnicity. Residual plots (Figure 2C) did not show significant
deviations from normality, heteroskedasticity or non-linearity.
The mean FEV1 (95% CI) difference between Russians and Kazakhs was 0.227
(0.133�0.320).
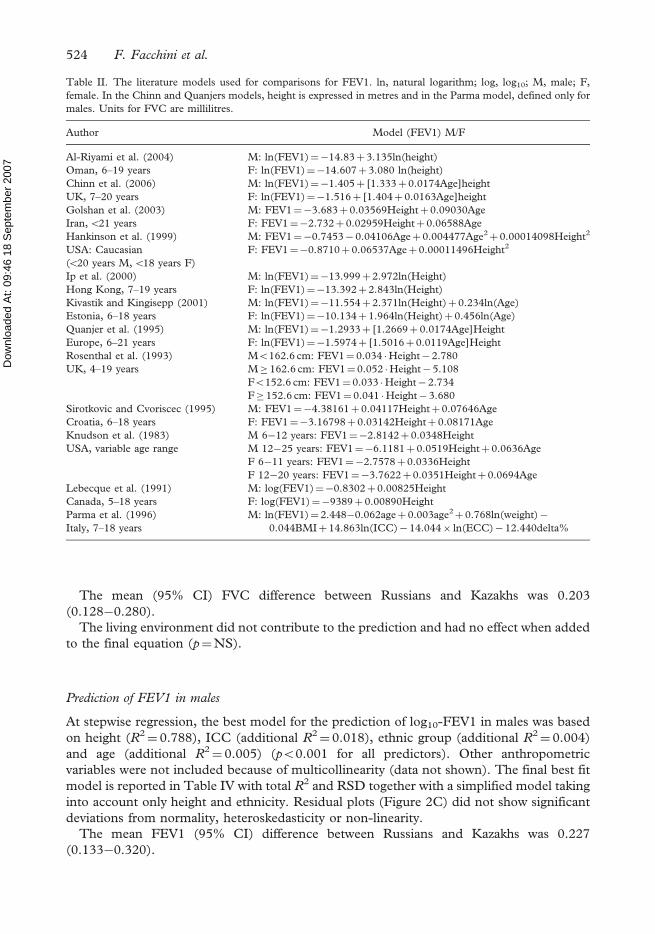
Table II. The literature models used for comparisons for FEV1. ln, natural logarithm; log, log10; M, male; F,
female. In the Chinn and Quanjers models, height is expressed in metres and in the Parma model, defined only for
males. Units for FVC are millilitres.
Author Model (FEV1) M/F
Al-Riyami et al. (2004) M: ln(FEV1)¼�14.83þ3.135ln(height)
Oman, 6–19 years F: ln(FEV1)¼�14.607þ 3.080 ln(height)
Chinn et al. (2006) M: ln(FEV1)¼�1.405þ [1.333þ 0.0174Age]height
UK, 7–20 years F: ln(FEV1)¼�1.516þ [1.404þ 0.0163Age]height
Golshan et al. (2003) M: FEV1¼�3.683þ0.03569Heightþ0.09030Age
Iran,521 years F: FEV1¼�2.732þ 0.02959Heightþ 0.06588Age
Hankinson et al. (1999) M: FEV1¼�0.7453� 0.04106Ageþ 0.004477Age2þ 0.00014098Height2
USA: Caucasian F: FEV1¼�0.8710þ 0.06537Ageþ 0.00011496Height2
(520 years M,518 years F)
Ip et al. (2000) M: ln(FEV1)¼�13.999þ 2.972ln(Height)
Hong Kong, 7–19 years F: ln(FEV1)¼�13.392þ 2.843ln(Height)
Kivastik and Kingisepp (2001) M: ln(FEV1)¼�11.554þ 2.371ln(Height)þ0.234ln(Age)
Estonia, 6–18 years F: ln(FEV1)¼�10.134þ 1.964ln(Height)þ 0.456ln(Age)
Quanjer et al. (1995) M: ln(FEV1)¼�1.2933þ [1.2669þ 0.0174Age]Height
Europe, 6–21 years F: ln(FEV1)¼�1.5974þ [1.5016þ0.0119Age]Height
Rosenthal et al. (1993) M5162.6 cm: FEV1¼ 0.034 �Height� 2.780
UK, 4–19 years M� 162.6 cm: FEV1¼ 0.052 �Height� 5.108
F5152.6 cm: FEV1¼0.033 �Height� 2.734
F� 152.6 cm: FEV1¼ 0.041 �Height� 3.680
Sirotkovic and Cvoriscec (1995) M: FEV1¼�4.38161þ 0.04117Heightþ 0.07646Age
Croatia, 6–18 years F: FEV1¼�3.16798þ 0.03142Heightþ 0.08171Age
Knudson et al. (1983) M 6�12 years: FEV1¼�2.8142þ 0.0348Height
USA, variable age range M 12�25 years: FEV1¼�6.1181þ 0.0519Heightþ 0.0636Age
F 6�11 years: FEV1¼�2.7578þ0.0336Height
F 12�20 years: FEV1¼�3.7622þ0.0351Heightþ0.0694Age
Lebecque et al. (1991) M: log(FEV1)¼�0.8302þ0.00825Height
Canada, 5–18 years F: log(FEV1)¼�9389þ 0.00890Height
Parma et al. (1996) M: ln(FEV1)¼ 2.448�0.062ageþ 0.003age2þ 0.768ln(weight)�
Italy, 7–18 years 0.044BMIþ 14.863ln(ICC)� 14.044� ln(ECC)� 12.440delta%
524 F. Facchini et al.

Dow
nloa
ded
At:
09:4
6 18
Sep
tem
ber 2
007
The living environment did not contribute to the prediction and had no effect when added
to the final equation (p¼NS).
Prediction of FEV1 in females
At stepwise regression, the best model for the prediction of log10-FEV1 in females was based
on height (R2¼ 0.688), ICC (additional R2
¼ 0.017), ethnic group (additional R2¼ 0.003)
and age (additional R2¼ 0.004) (p50.001 for all predictors). Other anthropometric
variables were not included because of multicollinearity (data not shown). The final best fit
model is reported in Table IV with total R2 and RSD together with a simplified model taking
into account only height and ethnicity. Residual plots (Figure 2D) did not show significant
deviations from normality, heteroskedasticity or non-linearity.
The mean (95% CI) FEV1 difference between Russian and Kazakhs was 0.148
(0.080�0.218).
The living environment did not contribute to the prediction and had no effect when added
to the final equation (p¼NS).
Figure 1. Distribution of children and adolescents with age for (A) males and (B) females.
Lung function in Kazakh children 525
Dow
nloa
ded
At:
09:4
6 18
Sep
tem
ber 2
007
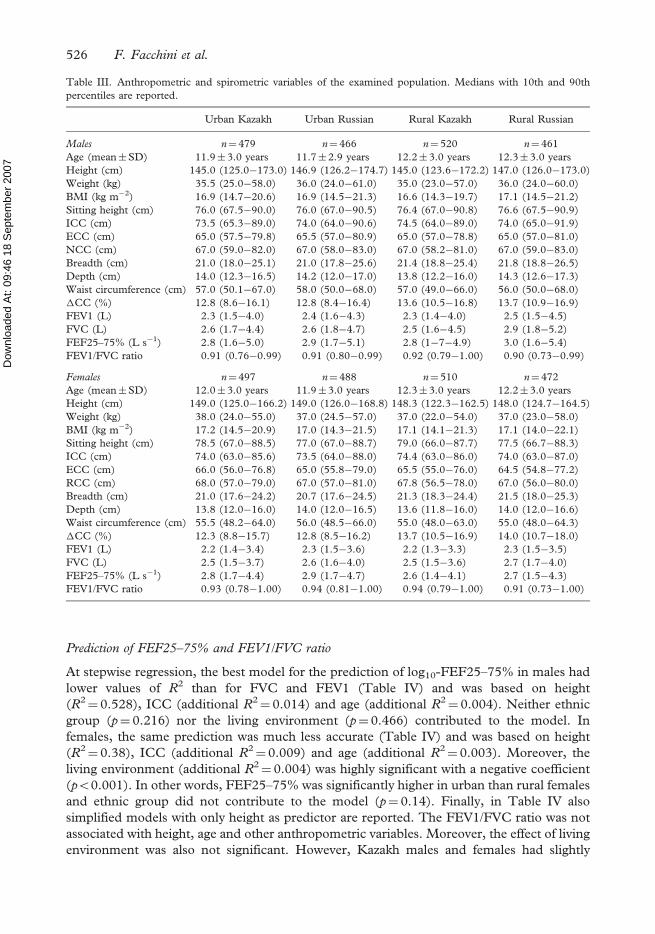
Prediction of FEF25–75% and FEV1/FVC ratio
At stepwise regression, the best model for the prediction of log10-FEF25–75% in males had
lower values of R2 than for FVC and FEV1 (Table IV) and was based on height
(R2¼ 0.528), ICC (additional R2
¼ 0.014) and age (additional R2¼ 0.004). Neither ethnic
group (p¼ 0.216) nor the living environment (p¼ 0.466) contributed to the model. In
females, the same prediction was much less accurate (Table IV) and was based on height
(R2¼ 0.38), ICC (additional R2
¼ 0.009) and age (additional R2¼ 0.003). Moreover, the
living environment (additional R2¼ 0.004) was highly significant with a negative coefficient
(p50.001). In other words, FEF25–75% was significantly higher in urban than rural females
and ethnic group did not contribute to the model (p¼ 0.14). Finally, in Table IV also
simplified models with only height as predictor are reported. The FEV1/FVC ratio was not
associated with height, age and other anthropometric variables. Moreover, the effect of living
environment was also not significant. However, Kazakh males and females had slightly
Table III. Anthropometric and spirometric variables of the examined population. Medians with 10th and 90th
percentiles are reported.
Urban Kazakh Urban Russian Rural Kazakh Rural Russian
Males n¼ 479 n¼ 466 n¼ 520 n¼ 461
Age (mean�SD) 11.9� 3.0 years 11.7�2.9 years 12.2� 3.0 years 12.3� 3.0 years
Height (cm) 145.0 (125.0�173.0) 146.9 (126.2�174.7) 145.0 (123.6�172.2) 147.0 (126.0�173.0)
Weight (kg) 35.5 (25.0�58.0) 36.0 (24.0�61.0) 35.0 (23.0�57.0) 36.0 (24.0�60.0)
BMI (kg m�2) 16.9 (14.7�20.6) 16.9 (14.5�21.3) 16.6 (14.3�19.7) 17.1 (14.5�21.2)
Sitting height (cm) 76.0 (67.5�90.0) 76.0 (67.0�90.5) 76.4 (67.0�90.8) 76.6 (67.5�90.9)
ICC (cm) 73.5 (65.3�89.0) 74.0 (64.0�90.6) 74.5 (64.0�89.0) 74.0 (65.0�91.9)
ECC (cm) 65.0 (57.5�79.8) 65.5 (57.0�80.9) 65.0 (57.0�78.8) 65.0 (57.0�81.0)
NCC (cm) 67.0 (59.0�82.0) 67.0 (58.0�83.0) 67.0 (58.2�81.0) 67.0 (59.0�83.0)
Breadth (cm) 21.0 (18.0�25.1) 21.0 (17.8�25.6) 21.4 (18.8�25.4) 21.8 (18.8�26.5)
Depth (cm) 14.0 (12.3�16.5) 14.2 (12.0�17.0) 13.8 (12.2�16.0) 14.3 (12.6�17.3)
Waist circumference (cm) 57.0 (50.1�67.0) 58.0 (50.0�68.0) 57.0 (49.0�66.0) 56.0 (50.0�68.0)
�CC (%) 12.8 (8.6�16.1) 12.8 (8.4�16.4) 13.6 (10.5�16.8) 13.7 (10.9�16.9)
FEV1 (L) 2.3 (1.5�4.0) 2.4 (1.6�4.3) 2.3 (1.4�4.0) 2.5 (1.5�4.5)
FVC (L) 2.6 (1.7�4.4) 2.6 (1.8�4.7) 2.5 (1.6�4.5) 2.9 (1.8�5.2)
FEF25–75% (L s�1) 2.8 (1.6�5.0) 2.9 (1.7�5.1) 2.8 (1�7�4.9) 3.0 (1.6�5.4)
FEV1/FVC ratio 0.91 (0.76�0.99) 0.91 (0.80�0.99) 0.92 (0.79�1.00) 0.90 (0.73�0.99)
Females n¼ 497 n¼ 488 n¼ 510 n¼ 472
Age (mean�SD) 12.0� 3.0 years 11.9�3.0 years 12.3� 3.0 years 12.2� 3.0 years
Height (cm) 149.0 (125.0�166.2) 149.0 (126.0�168.8) 148.3 (122.3�162.5) 148.0 (124.7�164.5)
Weight (kg) 38.0 (24.0�55.0) 37.0 (24.5�57.0) 37.0 (22.0�54.0) 37.0 (23.0�58.0)
BMI (kg m�2) 17.2 (14.5�20.9) 17.0 (14.3�21.5) 17.1 (14.1�21.3) 17.1 (14.0�22.1)
Sitting height (cm) 78.5 (67.0�88.5) 77.0 (67.0�88.7) 79.0 (66.0�87.7) 77.5 (66.7�88.3)
ICC (cm) 74.0 (63.0�85.6) 73.5 (64.0�88.0) 74.4 (63.0�86.0) 74.0 (63.0�87.0)
ECC (cm) 66.0 (56.0�76.8) 65.0 (55.8�79.0) 65.5 (55.0�76.0) 64.5 (54.8�77.2)
RCC (cm) 68.0 (57.0�79.0) 67.0 (57.0�81.0) 67.8 (56.5�78.0) 67.0 (56.0�80.0)
Breadth (cm) 21.0 (17.6�24.2) 20.7 (17.6�24.5) 21.3 (18.3�24.4) 21.5 (18.0�25.3)
Depth (cm) 13.8 (12.0�16.0) 14.0 (12.0�16.5) 13.6 (11.8�16.0) 14.0 (12.0�16.6)
Waist circumference (cm) 55.5 (48.2�64.0) 56.0 (48.5�66.0) 55.0 (48.0�63.0) 55.0 (48.0�64.3)
�CC (%) 12.3 (8.8�15.7) 12.8 (8.5�16.2) 13.7 (10.5�16.9) 14.0 (10.7�18.0)
FEV1 (L) 2.2 (1.4�3.4) 2.3 (1.5�3.6) 2.2 (1.3�3.3) 2.3 (1.5�3.5)
FVC (L) 2.5 (1.5�3.7) 2.6 (1.6�4.0) 2.5 (1.5�3.6) 2.7 (1.7�4.0)
FEF25–75% (L s�1) 2.8 (1.7�4.4) 2.9 (1.7�4.7) 2.6 (1.4�4.1) 2.7 (1.5�4.3)
FEV1/FVC ratio 0.93 (0.78�1.00) 0.94 (0.81�1.00) 0.94 (0.79�1.00) 0.91 (0.73�1.00)
526 F. Facchini et al.

Dow
nloa
ded
At:
09:4
6 18
Sep
tem
ber 2
007
higher values of FEV1/FVC ratio than Russians males (p¼ 0.001) and females (p¼ 0.004)
(Mann–Whitney test).
Comparison with available equations
Table V gives the values of FVC and FEV1 predicted by the equations of Tables I and II.
The data are given as 5th, 10th, 25th, 50th, 75th, 90th and 95th percentiles of the difference
and as the difference between 95th and 5th percentiles (per cent variability or �). We also
calculated the difference between the median measured and the best possible result if the
experimental and theoretical model coincided: 100% (this statistic was called Dev50).
Finally, the LRSD of the model was also reported. The model of Parma et al. (1996) was
Table IV. Best fit and simplified models with relative R2 and RSD.
FVC – Males
Best fit model: log10-FVC¼�0.729þ 0.00429 � height (cm)þ 0.00526 � ICC (cm)þ 0.0339 � ethnic group
(1¼Russian; 0¼Kazakh)þ0.00991 � age (years)
R2¼ 0.824, RSD¼ 0.070
Simplified model: log10-FVC¼�0.811þ0.00830 �height (cm)þ 0.0317 � ethnic group (1¼Russian;
0¼Kazakh)
R2¼ 0.801, RSD¼ 0.074
FVC – Females
Best fit model: log10-FVC¼�0.710þ 0.00477 � height (cm)þ 0.00407 � ICC (cm)þ 0.0257 � ethnic group
(1¼Russian; 0¼Kazakh)þ0.00744 � age (years)
R2¼ 0.766, RSD¼ 0.072
Simplified model: log10-FVC¼�0.815þ0.0082 �height (cm)þ 0.0169 � ethnic group (1¼Russian;
0¼Kazakh)
R2¼ 0.738, RSD¼ 0.075
FEV1 – Males
Best fit model: log10-FEV1¼�0.782þ0.00445 �height (cm)þ 0.00506 � ICC (cm)þ0.0253 � ethnic group
(1¼Russian; 0¼Kazakh)þ0.00892 � age (years)
R2¼ 0.815, RSD¼ 0.072
Simplified model: log10-FEV1¼�0.864þ 0.00844 � height (cm)þ 0.023 � ethnic group (1¼Russian;
0¼Kazakh)
R2¼ 0.793, RSD¼ 0.076
FEV1 – Females
Best fit model: log10-FEV1¼�0.747þ0.00496 �height (cm)þ 0.00383 � ICC (cm)þ0.0190 � ethnic group
(1¼Russian; 0¼Kazakh)þ0.00622 � age (years)
R2¼ 0.712, RSD¼ 0.081
Simplified model: log10-FEV1¼�0.832þ 0.008 �height (cm)þ 0.0091 � ethnic group (1¼Russian;
0¼Kazakh)
R2¼ 0.689, RSD¼ 0.083
FEF25–75% – Males
Best fit model: log10-FEF25–75%¼�0.616þ 0.00376 � height (cm)þ0.00515 � ICC (cm)þ 0.0104 � age
(years)
R2¼ 0.545, RSD¼ 0.128
Simplified model: log10-FEF25–75%¼�0.703þ 0.00783 �height (cm)
R2¼ 0.527, RSD¼ 0.131
FEF25–75% – Females
Best fit model: log10-FEF25–75%¼�0.515þ 0.00408 � height (cm)þ0.00364 � ICC (cm)þ 0.00702 � age
(years)-0.0273 � origin (0¼urban, 1¼ rural)
R2¼ 0.396, RSD¼ 0.140
Simplified model: log10-FEF25–75%¼�0.703þ 0.00783 �height (cm)
R2¼ 0.381, RSD¼ 0.142
Lung function in Kazakh children 527

Dow
nloa
ded
At:
09:4
6 18
Sep
tem
ber 2
007
used only for FEV1, because of a probable error in the intercept of FVC (0.176, while one
would expect a value between 1.5 and 2.5). As for FVC in males, some models had a value
of � similar to our model (Chinn, Quanjer), but underestimated the median value. The
Quanjer model also presented the lowest difference in LRSD value as compared to the
experimental model. The Knudson model gave a good estimation of median values but had
a higher variability (þ3.1%) than the experimental model. As for FVC in females, several
models had a variability similar to our model (Chinn, Golshan, Hankinson, Quanjer), while
the Knudson and Lebeque models estimated the median better. Looking at LRSD, the
Knudson model presented the lowest value as compared to the experimental model. As for
FEV1 in males, the models of Parma and Quanjer provided a good estimate of both the
median and variability with lowest LRSD (together with the Chinn model), very close to
those of our model. Lastly, as for FEV1 in females, the Quanjer model had predictive power
similar to our model and most models presented similar LRSD.
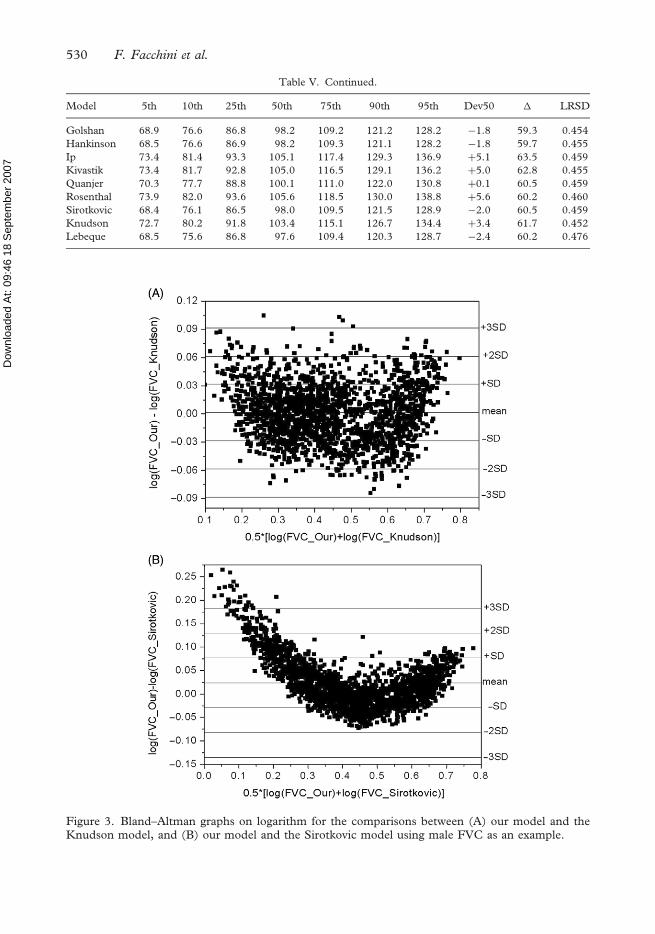
As an example, Figure 3 gives the Bland–Altman plots for the comparison of our model
(FVC for males) with Knudson and Sirotkovic models. A non-linearity of the residual trend
was slightly evident for Knudson model and dramatically evident for the Sirotkovic model.
The Sirotkovic model tended in fact to underestimate FVC at lowest and highest values.
Moreover, the residual mean and SD in the first comparison (0.0016� 0.03) were much
lower than in the second comparison (0.024� 0.05).
Figure 2. Standardized residuals as a function of standardized predicted values of best fit modelsfor (A) male FVC, (B) female FVC, (C) male FEV1, and (D) female FEV1.
528 F. Facchini et al.

Dow
nloa
ded
At:
09:4
6 18
Sep
tem
ber 2
007
Table V. (A) Male FVC as% predicted; (B) female FVC as% predicted; (C) male FEV1 as% predicted; (D) female
FEV1 as% predicted using all the models presented in Tables I and II. NA, not applicable. LRSD (linear residual
standard deviation) is expressed in litres. Best fit and simplified models are taken from Table IV.
Model 5th 10th 25th 50th 75th 90th 95th Dev50 � LRSD
(A) Male FVC as% predicted
Best fit 76.6 82.7 90.6 99.8 110.4 122.2 131.6 �0.2 55.0 0.499
Simplified 77.2 82.5 91.3 101.8 113.2 126.3 136.6 þ1.8 59.4 0.548
Al-Riyami 78.6 83.6 93.3 104.8 118.6 133.3 143.2 þ4.8 64.6 0.567
Chinn 73.3 77.8 86.7 96.6 107.6 119.8 129.1 �3.4 55.8 0.552
Golshan 71.3 76.0 84.6 95.2 107.5 120.5 131.4 �4.8 60.1 0.581
Hankinson 75.1 79.6 88.3 98.8 111.0 124.4 134.0 �1.2 58.9 0.558
Ip 81.8 86.2 96.0 107.2 120.1 134.3 144.6 þ7.2 62.8 0.569
Kivastik 76.7 81.7 91.1 101.7 113.7 126.7 137.3 þ1.7 60.6 0.557
Quanjer 72.8 77.5 86.4 96.2 106.9 119.0 127.8 �3.8 55.0 0.549
Rosenthal 74.7 79.7 88.7 99.1 110.9 123.8 133.4 �0.9 58.7 0.568
Sirotkovic 77.8 83.3 92.6 105.0 119.3 135.3 148.8 þ5.0 71.0 0.580
Knudson 76.3 81.1 90.2 100.3 112.3 125.1 134.4 þ0.3 58.1 0.553
Lebeque 77.1 81.5 91.2 101.4 113.2 127.2 136.6 þ1.4 59.5 0.562
Parma NA NA NA NA NA NA NA NA NA NA
(B) Female FVC as% predicted
Best fit 76.1 82.1 90.9 100.3 110.5 122.2 130.0 þ0.3 53.9 0.442
Simplified 74.8 81.1 90.0 100.2 111.6 124.3 132.6 þ0.2 57.8 0.473
Al-Riyami 80.1 86.3 96.0 107.6 120.7 133.9 144.4 þ7.6 64.3 0.478
Chinn 72.5 77.9 86.0 95.9 106.7 118.9 127.6 �4.1 55.1 0.477
Golshan 71.3 76.5 85.1 94.9 105.4 117.4 125.7 �5.1 54.4 0.467
Hankinson 72.4 77.2 85.7 95.9 107.3 118.9 127.2 �4.1 54.8 0.474
Ip 79.6 85.9 94.6 106.4 118.0 131.1 141.3 þ6.4 61.7 0.475
Kivastik 79.1 84.5 93.8 104.7 116.8 130.0 138.6 þ4.7 59.5 0.466
Quanjer 72.6 78.1 86.4 96.5 107.1 119.7 127.8 �3.5 55.2 0.472
Rosenthal 76.0 81.4 90.7 101.9 113.2 125.9 136.2 þ1.9 60.2 0.481
Sirotkovic 76.5 81.6 90.9 101.4 114.0 126.3 135.4 þ1.4 58.9 0.469
Knudson 75.3 80.7 89.2 99.8 111.3 123.1 132.7 �0.2 57.4 0.465
Lebeque 73.6 79.6 88.5 99.1 110.6 122.7 132.5 �0.9 58.9 0.497
(C) Male FEV1 as% predicted
Best fit 74.6 81.4 90.8 100.6 110.9 121.2 129.4 þ0.6 54.8 0.455
Simplified 73.6 80.3 90.0 100.6 111.7 123.5 132.4 þ0.6 58.8 0.490
Al-Riyami 80.0 87.2 97.4 108.9 122.0 135.6 147.3 þ8.9 67.3 0.499
Chinn 75.1 81.2 91.5 101.7 113.4 124.4 133.5 þ1.7 58.4 0.486
Golshan 71.1 77.6 86.9 97.0 109.4 121.6 130.4 �3.0 59.3 0.514
Hankinson 75.0 81.6 91.6 102.2 114.2 126.6 136.2 þ2.2 61.2 0.493
Ip 78.7 86.0 95.8 107.1 119.8 132.1 143.1 þ7.1 64.4 0.503
Kivastik 77.7 84.5 94.4 104.8 117.1 128.7 138.7 þ4.8 61.0 0.502
Quanjer 73.9 80.1 90.3 100.2 112.1 122.5 132.5 þ0.2 58.6 0.487
Rosenthal 79.0 85.4 96.2 107.4 119.7 132.5 142.6 þ7.4 63.6 0.502
Sirotkovic 72.9 79.0 89.2 99.7 112.5 127.9 137.9 �0.3 65.0 0.512
Knudson 76.5 82.8 92.9 103.3 115.2 126.6 135.5 þ3.3 59.0 0.492
Lebeque 73.8 79.5 89.8 99.9 111.8 123.7 132.4 �0.1 58.6 0.498
Parma 73.1 80.3 90.1 100.2 111.3 122.5 130.6 þ0.2 57.5 0.479
(D) Female FEV1 as% predicted
Best fit 71.6 79.1 90.6 101.6 111.9 123.0 132.0 þ1.6 60.4 0.440
Simplified 71.4 80.0 91.2 102.4 114.4 126.3 133.8 þ2.4 62.4 0.460
Al-Riyami 76.0 83.7 95.9 108.3 122.0 134.8 142.8 þ8.3 66.8 0.462
Chinn 69.1 76.5 87.6 98.0 108.9 120.4 129.1 �2.0 60.0 0.467
(continued )
Lung function in Kazakh children 529
Dow
nloa
ded
At:
09:4
6 18
Sep
tem
ber 2
007
Table V. Continued.
Model 5th 10th 25th 50th 75th 90th 95th Dev50 � LRSD
Golshan 68.9 76.6 86.8 98.2 109.2 121.2 128.2 �1.8 59.3 0.454
Hankinson 68.5 76.6 86.9 98.2 109.3 121.1 128.2 �1.8 59.7 0.455
Ip 73.4 81.4 93.3 105.1 117.4 129.3 136.9 þ5.1 63.5 0.459
Kivastik 73.4 81.7 92.8 105.0 116.5 129.1 136.2 þ5.0 62.8 0.455
Quanjer 70.3 77.7 88.8 100.1 111.0 122.0 130.8 þ0.1 60.5 0.459
Rosenthal 73.9 82.0 93.6 105.6 118.5 130.0 138.8 þ5.6 60.2 0.460
Sirotkovic 68.4 76.1 86.5 98.0 109.5 121.5 128.9 �2.0 60.5 0.459
Knudson 72.7 80.2 91.8 103.4 115.1 126.7 134.4 þ3.4 61.7 0.452
Lebeque 68.5 75.6 86.8 97.6 109.4 120.3 128.7 �2.4 60.2 0.476
Figure 3. Bland–Altman graphs on logarithm for the comparisons between (A) our model and theKnudson model, and (B) our model and the Sirotkovic model using male FVC as an example.
530 F. Facchini et al.
Dow
nloa
ded
At:
09:4
6 18
Sep
tem
ber 2
007
Discussion
KHAN-ES was aimed at evaluating the contribution of the living environment to nutrition
and health in children and adolescents living in Kazakhstan. KHAN-ES children also
underwent spirometry, offering us the possibility to calculate spirometric reference curves
for Kazakh children and adolescents also taking in account the living environment. While
little data on adults are available in the literature (Fiori et al. 2000), this is the first study of
spirometry in children from Central Asia. However, a limitation of KHAN-ES is that only
children and adolescents attending school were studied, so that our results do not
necessarily apply to all Kazakh children.
In our equations, height was the most important predictor of FVC and FEV1 and
some anthropometric parameters such as ICC marginally improved the accuracy of the
estimate. However, most anthropometric variables (weight, BMI, sitting height, waist
circumference, expiratory and resting chest circumference, chest breadth, chest depth
and also BMI) did not significantly contribute to the prediction or were excluded
because of multicollinearity.
The contribution of age to the predictions was statistically significant inside the best fit
models in the presence of standing height even if it marginally improved the model. More
importantly, Russians had higher values of FVC and FEV1 – but not of FEF25–75% – than
Kazakhs, and this is the first study to report this difference in Mongolian vs. Caucasian
children. Another study (Crapo et al. 1999) performed in a sample with a limitated number
of subjects with a greater variability in age did not find such an effect. A small but significant
ethnic difference was evident also for the FEV1/FVC ratio. R2 values found in our reference
models for FEV1 and FVC (0.712�0.824) are perfectly in line with the literature, indicating
that the most part of variance of these parameters was explained by predictor variables
considered in this study. Finally, RSD of the models are also consistent with the literature,
when logarithmic models for FVC and FEV1 have been considered (Quanjer et al. 1995;
Ip et al. 2000; Kivastik and Kingisepp 2001; Al-Riyami et al. 2004).
This does not imply that other variables could be taken into consideration as predictor
factors, like puberty onset, socio-economical status, nutritional status, genetic factors,
environmental pollution and so on. However, it would be difficult to include them in
reference curves available for current clinical practice. Further analyses of the KHAN data
are in progress to evaluate the association between puberty, living environment,
anthropometric variables, socio-economical factors and clinical variables.
Finally, simplified models taking into account only height and ethnicity were added, to
simplify their use for clinical practice without measuring specific anthropometric values,
such as ICC.
Prediction equations for FEF25–75% were less accurate because their R2 were much
lower than those for FVC and FEV1. A similar trend had been already observed by Parma
et al. (1996), indicating that FEF25–75% needs further investigation and that other variables
not considered in this study may be needed to improve prediction.
The effect of the living environment on spirometry requires a brief discussion. In fact, the
influence of the living environment (urban vs. rural) on lung function has been poorly studied
in the literature. KHAN-ES shows that the living environment in Kazakhstan has only a
marginal influence on spirometric parameters. FEF25–75% was higher in urban than in rural
females and FVC was higher in rural than urban male children. The living environment was
not associated with FEV1 so that, at this stage of analysis, it is impossible to speculate about
the environmental factors that could influence our results. However, they are in good
agreement with those reported for Italy (Centanni et al. 2001), while the results from other
Lung function in Kazakh children 531
Dow
nloa
ded
At:
09:4
6 18
Sep
tem
ber 2
007
developing countries are contrasting. In Nigeria, spirometric parameters of children were not
associated with the living environment (Glew et al. 2004), while in Iran, urban children had a
worse pulmonary function as compared with rural children (Asgari et al. 1998).
After defining a predictive model for FVC and FEV1, we compared it with the most recent
models available in the literature (Tables I and II). As measures of accuracy, we used the
median predicted for FVC and FEV1 (expected value¼ 100%), the difference between 95th
and 5th percentiles and RSD. The best models were Knudson for FVC in both genders,
Quanjer and Parma for male FEV1 and Quanjer for female FEV1, even if other models
(Golshan, Hatkinson) gave acceptable results. In general, the best models were those
developed in white Caucasians of developed countries (USA, Europe), while models
developed in more selected populations were more prone to error.
To definitively and accurately compare experimental and literature models, we used
Bland–Altman plots on a logarithmic scale. The difference between measured values of FVC
and those predicted by the Knudson algorithm was uniformly distributed, with evidence of
low bias (average difference near 0) and only a few points were above 3 SD (the Bland–
Altman statistics employ a 2 SDs cut-off also because it calculates 95% limits of agreement
from the standard error). With a less well performing model such as Sirotkovic, the
differences between measured and predicted values had a non-linear trend and the average
difference was clearly different from zero. As a general rule, the comparison of several
models confirmed that the log transformation of spirometric values appears to be the most
appropriate way of analysing such data.
In conclusion, while the living environment only slightly affected male FVC and female
FEF 25.75%, spirometric prediction equations depended primarily on height (for FVC and
FEV1 in both genders) with a modest but significant contribution from ICC and age.
Moreover, Russians had higher values of FVC and FEV1 than Kazakhs and ethnic group
was maintained in prediction equations. Lastly, a statistical approach based on the
calculation of% predicted values and Bland–Altman graph is proposed to compare
experimental spirometric reference curves with literature models. In our case, models that
better predicted FVC/FEV1 were those defined on white Caucasians of developed countries.
Competing interests
All the authors declare that they have no conflicts of interest.
Acknowledgements
KHAN-ES was supported by research grants from Fondazione Cassa di Risparmio di
Bologna and MIUR as part of a FIRB project.
References
Al-Riyami BM, Al-Rawas OA, Hassan MO. 2004. Normal spirometric reference values for Omani children and
adolescents. Respirology 9:387–391.
American Thoracic Society. 1991. Lung function testing: Selection of reference values and interpretative strategies.
Official Statement of the American Thoracic Society. Am Rev Respir Dis 144:1202–1218.
532 F. Facchini et al.

Dow
nloa
ded
At:
09:4
6 18
Sep
tem
ber 2
007
American Thoracic Society. 1995. Medical section of the American lung association. Standardization of
spirometry. 1994 update. Am J Respir Crit Care Med 152:1107–1136.
Arets HGM, Brackel HJL, Van der Ent CK. 2001. Forced expiratory manoeuvres in children: Do they meet ATS
and ERS criteria for spirometry? Eur Respir J 18:655–660.
Asgari MM, DuBois A, Asgari M, Gent J, Beckett WS. 1998. Association of ambient air quality with children’s lung
function in urban and rural Iran. Arch Environ Health 53:222–230.
Bhavna D. (2004). Minorities and participation in public life: Kazakhstan. Minority rights: Cultural diversity and
development in central Asia. Office of the United Nations High Commissioner for Human Rights, Geneva,
Switzerland.
Bland JM, Altman DG. 1986. Statistical methods for assessing agreement between two methods of clinical
measurement. Lancet 1:307–310.
Burns JP. 2003. Research in children. Crit Care Med 31:(Suppl. 3)S131–S135.
Centanni S, Di Marco F, Castagna F, Santus P, Guarnieri R, Allegra L. 2001. Atopy prevalence and spirometric
performance in asymptomatic schoolchildren exposed to air pollution. Monaldi Arch Chest Dis 56:304–308.
Chinn DJ, Cotes JE, Martin AJ. 2006. Modelling the lung function of Caucasians during adolescence as a basis for
reference values. Ann Hum Biol 33:64–77.
Coultas BD, Howard AC, Skipper JB, Samet MJ. 1998. Spirometric prediction equations for Hispanic children and
adults in New Mexico. Am Rev Respir Dis 138:1386–1392.
Crapo RO, Jensen RL, Oyunchimeg M, Tsh T, DuWayne Schmidt C. 1999. Differences in spirometry reference
values: A statistical comparison of a Mongolian and a Caucasian study. Eur Respir J 13:606–609.
Facchini F, Fiori F. 2000. The modernizing Kazakhstan: A review of biomedical data. J Phys Anthropol 20:95–103.
Facchini F, Fiori G, Bedogni G, Galletti L, Belcastro MG, Ismagulov O, Ismagulova A, Sharmanov T, Tsoy I,
Rizzoli S, Goldoni M. In press. Prevalence of overweight and cardiovascular risk factors in rural and urban
children from central Asia: The Kazakhstan Health And Nutrition Examination Survey. Am J Hum Biol.
Fiori G, Facchini F, Ismagulov O, Ismagulova A, Tarazona-Santos E, Pettener D. 2000. Chest size, lung volumes
and haematological parameters in central Asian high and low altitude populations. Am J Phys Anthropol
113:47–59.
Forastiere F, Corbo GM, Pistelli P, Michelozzi P, Agabiti N, Brancato G, Ciappi G, Perucci CA. 1994.
Bronchial responsiveness in children living in areas with different air pollution levels. Arch Environ Health
49:111–118.
Glew RH, Kassam H, Vander Voort J, Agaba PA, Harkins M, VanderJagt DJ. 2004. Comparison of pulmonary
function between children living in rural and urban areas in northern Nigeria. J Trop Pediatr 50:209–216.
Gold DR, Wang X, Wypij D, Speizer FE, Ware JH, Dockery DW. 1996. Effects of cigarette smoking on lung
function in adolescent boys and girls. New Eng J Med 335:931–937.
Golshan M, Nematbakhsh M, Amra B, Crapo RO. 2003. Spirometric reference values in a large middle eastern
population. Eur Respir J 22:529–534.
Hankinson JL, Odencrantz JR, Fedan KB. 1999. Spirometric reference values from a sample of the general U.S.
population. Am J Respir Crit Care Med 159:179–187.
Harik-Khan RI, Muller DC, Wise RA. 2004. Racial difference in lung function in African–American and White
children: Effect of anthropometric, socioeconomic, nutritional and environmental factors. Am J Epidemiol
160:893–900.
Havryk AP, Gilbert M, Burgess KR. 2002. Spirometry values in Himalayan high altitude residents (Sherpas).
Resp Physiol Neurobiol 132:223–232.
Hellmann S, Goren AI. 1999. The necessity of building population specific prediction equations for clinical
assessment of pulmonary function tests. Eur J Pediatr 158:519–522.
Ip MSM, Karlberg EM, Karlberg JPE, Luk KDK, Leong JCY. 2000. Lung function reference values in Chinese
children and adolescents in Hong Kong. I. Spirometric values and comparison with other populations. Am J
Respir Crit Care Med 162:424–429.
Kivastik J, Kingisepp PH. 2001. Spirometric reference values in Estonian schoolchildren. Clin Physiol 4:490–497.
Knudson RJ, Lebowitz MD, Holberg CJ, Burrows B. 1983. Changes in the normal maximal expiratory flow-
volume curve with growth and ageing. Am Rev Respir Dis 127:725–734.
Lebecque P, Desmond K, Swartebroeckx Y, Dubois P, Lulling J, Coates A. 1991. Measurement of respiratory
system resistance by forced oscillation in normal children: A comparison with spirometric values. Pediatr
Pulmonol 10:117–122.
Lohman TG, Roche AF, Martorell R. 1991. Anthropometric standardization reference manual: Abridged
edition. Champaign, IL, USA: Human Kinetics Books.
Marcus BE, MacLean JC, Curb DJ, Johnson RL, Vollmer MW, Buist AS. 1988. Reference values for FEV1 in
Japanese–American men from 45 to 68 years of age. Am Rev Respir Dis 138:1393–1397.
Lung function in Kazakh children 533

Dow
nloa
ded
At:
09:4
6 18
Sep
tem
ber 2
007
MacAuley D, McCrum E, Evans A, Stott G, Boreham C, Trinick T. 1999. Physical activity, physical fitness and
respiratory function–exercise and respiratory function. Ir J Med Sci 168:119–123.
Masanov N. 2002. The nationalities question in post-Soviet Kazakhstan. Middle East Studies Series. Institute of
Developing Economies, Japan External Trade Organization (IDE-JETRO), Tokyo, Japan.
Miller MR, Hankinson J, Brusasco V, Burgos F, Casaburi R, Coates A, Crapo R, Enright P, van der Grinten CP,
Gustafsson P, et al. 2005. ATS/ERS Task Force: Standardization of spirometry. Eur Respir J 26:319–338.
Mohamed EI, Maiolo C, Iacopino L, Pepe M, Di Daniele N, De Lorenzo A. 2002. The impact of body-weight
components on forced spirometry in healthy Italians. Lung 180:149–159.
Myers R. 1990. Classical and modern regression with applications, 2nd ed. Boston, MA: Duxbury.
National Cancer Institute. 2001. Randomized study of three plant phenolic compounds versus sulindac (part A) or
curcumin (part B) in prevention of colon cancer. www.cancer.gov/clinicaltrials/RUH-SSH-190-0600,
accessed 27 February 2007.
Parma A, Magliocchetti N, Spagnolo A, Di Monaco A, Migliorino MR, Menotti A. 1996. Spirometric prediction
equations for male Italians 7–18 years of age. Eur J Epidemiol 12:263–277.
Quanjer PH, Borsboom GJJM, Brunekreef B, Zach M, Forche G, Cotes JE, Sanchis J, Paoletti P. 1995.
Spirometric reference values for white European children and adolescents: Polgar revisited. Pediatr Pulmonol
19:135–142.
Raju PS, Prasad KV, Ramana YV, Balakrishna N, Murthy KJ. 2005. Influence of socioeconomic status on lung
function and prediction equations in Indian children. Pediatr Pulmonol 39:528–536.
Rosenthal M, Bain SH, Cramer D, Helms P, Denison D, Bush A, Warner JO. 1993. Lung function in white
children aged 4 to 19 years: I. Spirometry. Thorax 48:794–802.
Simoni M, Baldacci S, Puntoni R, Pistelli F, Farchi S, Lo Presti E, Pistelli R, Corbo G, Agabiti N, Basso S, et al.
2006. Plasma, salivary and urinary cotinine in non-smoker Italian women exposed and unexposed to
environmental tobacco smoking (SEASD study). Clin Chem Lab Med 44:632–638.
Sirotkovic M, Cvoriscec B. 1995. Spirometric reference values in school children from Dalmatia. Monaldi Arch
Chest Dis 50:258–263.
US Department of Agriculture. 2005. What is rural? www.nal.usda.gov/ric/ricpubs/what_is_rural.htm, accessed 27
February 2007.
534 F. Facchini et al.
Top Related
Copyright © 2022 FDOKUMEN

