


Bahasa
Halaman
Hukum

Sourcebook of Living Arrangements andSocial Networks of Older Adultsin the Netherlands
Questionnaire and Data Documentationof the NESTOR-program,Main Study 1992 andNetwork Study 1992-1995
Theo van TilburgPearl DykstraAart C. LiefbroerMarjolein Broese van Groenou
Sourcebook of living arrangements and socialnetworks of older adults in the Netherlands
Questionnaire and data documentation of the NESTOR-program, Main Study 1992 and Network Study 1992-1995
Theo van TilburgPearl Dykstra
Aart C. LiefbroerMarjolein Broese van Groenou
Departments ofSociology & Social GerontologyandSocial Research Methodology,Vrije Universiteit Amsterdam
NetherlandsInterdisciplinary
DemographicInstitute,
The Hague
2 Living arrangements and social networks
AcknowledgementsThe data were collected in the context of the research program "Living arrangements and socialnetworks of older adults". This research program is conducted at the departments of Sociology &Social Gerontology and Social Research Methodology of the Vrije Universiteit in Amsterdam,and the Netherlands Interdisciplinary Demographic Institute in The Hague. The research issupported by a program grant from the Netherlands Program for Research on Ageing(NESTOR), funded by the Ministry of Education, Culture and Sciences and the Ministry ofHealth, Welfare, and Sports. The Network Study was made possible by a fellowship from theRoyal Netherlands Academy of Arts and Sciences (K.N.A.W.), awarded to the first author.
CopyrightsAll rights reserved. No part of this publication may be reproduced, stored in a retrieval system,or transmitted, in any form or by any means, electronic, mechanical, photocopying, recording, orotherwise, without the prior written permission of the management of the NESTOR-LSN-program.
Addressdr. T.G. van TilburgVrije Universiteit AmsterdamSocial Gerontology, Faculty of Social SciencesDe Boelelaan 1081c1081 HV AmsterdamThe Netherlandse-mail [email protected] +31 - 20 444 6870
+31 - 20 444 6804 (general number of the Department)+31 - 20 444 7777 (general number of the Vrije Universiteit)
fax +31 - 20 444 6810 (Department)
Living arrangements and social networks 3
Table of contentsPreface 5
Summary of the research program 7
Part A: Main Study (1992)
Sample and data collection 15
Overview of the questionnaire of the face-to-face interview 30
Introduction to the structure of the data files 34
Overview of data files 43
Questionnaire and variables 49
Appendices
Example of a programmed questionnaire 246
List of variables 255
List of SPSS data files 270
Part G, H, I: Network Study (1992-1995)
Introduction 273
Sample and data collection 277
Overview of data files 284
Questionnaire and variables 290
Appendices
Example of a programmed questionnaire 337
List of variables 348
List of SPSS data files 353
References 354

4 Living arrangements and social networks
Living arrangements and social networks 5
PrefaceThis sourcebook contains the documentation of the data of the Main Study and of the NetworkStudy of the NESTOR-program Living arrangements and social networks of older adults, as itstands March 12, 2003. Errata will be listed in the forthcoming documentations of the data ofthe Longitudinal Aging Study Amsterdam.
A large number of people have made great efforts during the process of collecting the data ofthe Main Study. Kees Knipscheer, Jenny Gierveld, Theo van Tilburg, Pearl Dykstra, Aat Lief-broer, Marjolein Broese van Groenou and Edith de Leeuw were responsible for the content of(sections of) the questionnaire. Theo van Tilburg and Aat Liefbroer programmed thequestionnaire. Marius de Pijper was very helpful with the programming of the questionnaire andof the management program on the computers. During the interviewing, Edith de Leeuw(Amsterdam), Fleur Thomése (Wormerland and Waterland), Aat Liefbroer (Zwolle andsurroundings), and Pearl Dykstra (Oss and surroundings) supervised the interviewers, coordinatedby Marjolein Broese van Groenou. Mik van der Klundert and Inke Wisse, assisted by YolandeBrands, Jan Poppelaars, Cornelie Peeck, Pien van der Kooi and Jutte Koekebakker, managed thecontacts with respondents and interviewers. The interviewers were M. Abeling, M.F. Baar, A.H.Barf-Smid, J.M.P. Bijnen-Willems, M.N.A. Blanc, S.C.G. Blijendaal, H.E.T. Bloemenkamp, J.D.de Boer, A. de Boer, G. Brakel-Schotkamp, E. Breebaart, T.C. Buddingh, H.G.A. Bulk, A.W.Craje, A. Dalvoorde, C. Danje ter Horst, W. Deenik, A.J. van Dijk-Zwart, M.E. Feddema, S. deGans, R. de Gruyter, H.M. de Haan-Remkes, M.J.H. Hagedoorn-Viskaal, J.C. Haveman, I.J.W.van Heeswijk, J. Hofland, F.K. Hoogendorp-van Aalderen, J.H.C.V. Jilesen, M.G. de Jonge-denHartog, J.B.M. de Jonge-Winkelman, Y.W. van Klingeren, D. Knoop, L.M. Koldewee, H.A. deKoning, B.P.L.M. van der Kroft, F.F. Lamkamp, J. Langendijk-Oliemeulen, J. de Leeuwe, C.Leeuwin, B. Maes, J.M.G. Majoor-van den Bergh, G. Makkinga, N.A. Manhave, E.M. Manuel,M.R. Mastenbroek-Guichelaar, A.P. van der Meiden-Mooij, E. Meulenbroek, A.H. Michielse,W.F.M van Mourik, R. van der Mueren, W.H. Muns-Winkelaar, I. Nyklicek, H.K. Paassen, F.Pearson, E. Pijfers, P.J.A. Pijpers, M.S. Pinas, M.G.G. Rebel-de Gier, P. Rensen, E.C. van Riel,E.G. van Roest, A.W.A.M. de Ruijter-van Zuijlen, H.A. Schaap, A. Schaapman-Harsevoord, J.M.van Schadewijk-Eykemans, M.J. Smit-Molenaar, D. Snijders-Schreurs, A.F. Staarman, P.E.A.M.Steeman, A.A.M. van der Steen, A.M. Sterk-Schat, J.L. Swagerman-Beekman, G.H.Timmerman-van Elburg, G. Uffels-de Olde, J.M. Velthoven, A.R.J. Visser-Albers, M. Vonk, K.de Vos, J.H.M. Walboomers, J.A. van Wees, P.H.R.M. Westebring, J.M.V. Wierdsma, J.C.Wijnen-Naaktgeboren, M.A. Wijnschenk, J.A.C. Zijlstra, and E.M. Zonjee. The data were storedby Theo van Tilburg and Aat Liefbroer.
Theo van Tilburg and Jan Poppelaars managed the data collection for the Network Study. Theywere assisted by Conny Veltman.
The editors Amsterdam / The Hague, March 12, 2003

6 Living arrangements and social networks
Living arrangements and social networks 7
Summary of the research programThe research program "Living arrangements and social networks of older adults" (Leefvormen ensociale netwerken van ouderen) (Knipscheer et al., 1990) has been developed on request of theNetherlands Program for Research on Aging (Nederlands Stimuleringsprogramma Ouderen-onderzoek; NESTOR) steering committee. The aim of this committee, which was installed by theMinistry of Welfare, Health and Cultural Affairs and by the Ministry of Education and Science,is to develop a national plan for research on aging, and to supervise and guide the execution ofthis plan. The aim of NESTOR is to strengthen the position of aging research in the Netherlandsby stressing the improvement of the scientific infrastructure and the stimulation of internationalcollaboration. "Living arrangements and social networks of older adults" is one of the topicsselected by the NESTOR steering committee as part of their national plan for research on aging.Previous research carried out at three scientific institutes, namely, the Department of Sociologyand Social Gerontology at the Vrije Universiteit in Amsterdam, the Department of SocialResearch Methodology at the Vrije Universiteit in Amsterdam, and the NetherlandsInterdisciplinary Demographic Institute (NIDI) in The Hague, provided the expertise required forthe topic.
ObjectiveThe objectives of the program are the following. First, it aims to provide insight into thedeterminants of living arrangements of older adults, their kin and non-kin networks. Second, itaims to provide insight into the outcomes of living arrangements of older adults, and their kinand non-kin networks in terms of the availability of the social support essential for dailyfunctioning, for coping with problems associated with life events, and for maintaining well-being. The third objective is to use these insights to separate the assumptions essential to theconstructing of models predicting future trends in living arrangements and networks from theassumptions which are not.
The perspective adopted in the research program is one which emphasizes the autonomy ofolder adults, i.e. their ability to manage on their own. However, contrary to many of the studiesinto the conditions underlying their ability to manage alone, which tend to emphasize individualcharacteristics, such as the level of cognitive performance or health status, this program centerson characteristics of the social matrix in which older adults are embedded. In other words, thefocus is on the importance of the personal relationships for daily functioning, for coping withlife events and for maintaining well-being. More specifically the focus is on living arrangementsof older adults and their social networks.
The desire to move beyond an exclusive focus on individual characteristics is not the onlyreason for focusing on relationships of older persons. Another consideration is that it isparticularly in personal relationships that the impact of broader changes in society is reflected.The economic, demographic and cultural changes of recent decades have led to changes inrelationships available to people and/or in the conditions providing opportunities for socialinteraction. It is unclear what the implications are for the individual older adult. How do olderpersons deal with the changing conditions of personal relationships and how will they deal withthese changes in the future? It should be pointed out that relationships of older adults are alsosubject to changes associated with the aging process itself. For this reason, the (possible)implications of changes in personal relationships which are associated with changes in societymust be considered in relation with life course changes in personal relationships.
8 Living arrangements and social networks Summary
Research questionsThe first question is: what are the determinants of living arrangements of older adults, their kinand non-kin networks? Living arrangements refer to housing, household composition andresidential environment. Housing relates to the situation of an older adult living in a privatehousehold or in an institution of some kind. Household composition concerns the matter of theolder adult living alone, or sharing the household. If the latter is the case, data are gatheredabout the household members, whether they are a marital partner, a non-marital partner of thesame or of the opposite sex, family members (e.g. adult children, elderly parents, siblings etc.)and/or non-family related individuals. The question of residential environment refers to thelocation such as close to adult children and/or other family members, or whether the person livesin a area with a relatively high or relatively low sub-population of older adults, and whether theperson is a relative newcomer or a long term resident. It is likely that housing, householdcomposition and residential environment lay down the restrictions and opportunities which anolder person has for establishing and maintaining the relationships which decide their socialnetworks. The proposed research program aims to provide insight into the manner in which thisoccurs.
The second question is: what are the outcomes of having a specific living arrangement, kinand non-kin network in terms of the support received, and consequently in terms of dailyfunctioning, coping with life events and maintaining well-being? People who are surrounded byother people, who have others available to assist them now and then with practical services, togive positive feedback or to show their affective concern, generally experience a higher level ofwell-being than those who lack such ties with others. It is put forward that the support providedby social network members helps to protect older persons from experiencing negative outcomes,helps them in their efforts to improve their situation, and helps them respond to adverse events.The support is considered adequate if it meets older persons’s needs for well-being and makes itpossible for them to arrange their own lives. Several theoretical models can be used to examinethe adequacy of support. One is the model of ecological congruence which emphasizes a lock-and-key fit between the demands for particular types of support and the supply of support.Another acknowledge that analyses of the adequacy of support should not only take into accountthe actual provision of support but also whether or not the support matches the expectation ofthe individual. Cognitive process approach stressing personal perceptions and evaluations,provide a fruitful framework for such analyses.
The third question is: how can insights into the determinants and outcomes of livingarrangements of older adults, their kin and non-kin networks be applied in the construction ofmore realistic models of future trends in living arrangements and networks? The usefulness offuture prognoses depends upon the validity of the assumptions upon which they are founded.Knowledge obtained through the proposed research program can be used in the construction ofmore realistic models, more realistic in the sense of a broader awareness of the validity of theassumptions upon which they are based. It is proposed that there are two ways in which this aimcan be achieved. The first is through the analysis of trends in living arrangements, kin and non-kin networks. Knowledge about trends in living arrangements and networks can provide anindication of the extent to which predictions about future cohorts of older adults can be basedupon characteristics of past and present cohorts. The second is through the analysis of inter-individual variability. More particularly, research into the conditions determining the relationsbetween well-being on the one hand and living arrangements or network characteristics on theother is proposed. Such knowledge can provide insight into the question as to whetherdifferences in living arrangements or in networks among older adults can be glossed over orshould be taken into account.
Summary Living arrangements and social networks 9
Data collectionThe aim of collecting data for the Main Study was twofold. First of all, the aim was to providedescriptive information about the living arrangements1 and social networks of older adults (theMain Study). A large-scale survey based on a representative sample was expected to providesuch information. Secondly, the Main Study provided the information necessary to carry out thetwo subsidiary studies. Respondents who experienced the transition to widowhood will befollowed longitudinally. The widowhood study is still ongoing and therefore not documented inthis sourcebook. A second study is the Network Study, which is described in detail in the partGHI of this sourcebook. Identification of the respondents to be followed in the Network Studytook place on the basis of data collected during the Main Study. Furthermore, during the MainStudy, additional information has been collected on selected groups of respondents. Researchquestions to be addressed in specific projects motivate the selection of these groups.
The Main Study consisted of face-to-face interviews conducted among 4494 older adults in1992. The response rate was 61.7%. A stratified sample of older adults has been taken from thepopulation registers of eleven municipalities, in three regions of the Netherlands. The samplewas stratified according to sex and year of birth. By not introducing additional stratificationcriteria, it remains possible to generalize the findings in a relatively simple way to thepopulation of the selected regions and municipalities.
The selected years of birth were 1903 through 1937, so that the respondents vary in agefrom 54 to 89. The mean age of the respondents is 72.8 (SD= 10.0). By including these cohortsin the sample, data are available about people who grew up and reached maturity before andduring the Depression and during or after the Second World War. These differences are likely tobe reflected in the history of the composition of their households (e.g. membership of three-generation households, co-residence with parents as newly-weds due to housing shortage) or inthe timing and the likelihood of marriage and the birth of children. In addition, data are availableon older adults who, at the time of the interview, find themselves in different age-relatedcircumstances. A large proportion of the youngest respondents face the transition fromemployment to retirement, and from having a family with children to having an "empty nest". Aconsiderable number of the oldest respondents may be facing the transition from health andindependent functioning to physical ailments and restricted independent functioning. They maybe facing possible admission into a home for older persons. Furthermore, there is, withincreasing age, an increasing chance of widowhood (with its associated changes in thecomposition of the household, and changes in the social network) and the increasing chance ofdeath of social network members.
Collaboration in data collection with other research programsIn the framework of the Longitudinal Aging Study Amsterdam (LASA), the respondents of theNESTOR-LSN-survey born after 1908 are being followed up until the year 2000 to observechanges in their physical, emotional, cognitive and social functioning. At the Dipartimento diStatistica e Matematica Applicata all’Economia, Universitá degli Studi di Pisa, Italia, data werecollected on living arrangements and social networks of older adults living in North-WesternTuscany, Italy, in collaboration with the NESTOR-LSN-program. Therefore, this documentationwill pay attention to the links between the data of the NESTOR-LSN Main Study on the onehand, and the LASA-data and the data of Tuscans on the other hand.
1 Since 1971, there was no census in the Netherlands.
10 Living arrangements and social networks Summary
Management of the programA program management team is responsible for laying down and monitoring the policy as far asscientific, personnel, financial and managerial aspects are concerned. The members of the projectmanagement team are: Prof. Dr C.P.M. Knipscheer (chair / program director), Prof. Dr J.Gierveld, Dr T.G. van Tilburg, and Dr P.A. Dykstra. With NESTOR-funds, project researchersare appointed. The main objective of the project researchers is to answer the research questions.Tasks from the senior researchers are also delegated to the project researchers. Project juniorsare involved in data collection and data analysis. Assistants ("assistent in opleiding" or"onderzoeker in opleiding") are employed for a four-year period, at the end of which they musthave completed their dissertations. They are involved in specific projects.
Societal relevance and policy implicationsThe program will contribute in many ways to a better understanding of an aging society and willpromote reflections on the consequences of the changing structure and culture of the Dutchsociety, especially as far as it concerns living arrangements and social networks of older people.These reflections will direct policy development in the next decades. The relevance of thisprogram can be located in three areas: description and insight into life course relateddeterminants, challenging the negative image of older persons, and insight for the prediction offuture changes.
PublicationsA key publication is published (Knipscheer et al., 1995), with an overview of most of the topicsof the research program. A list of other publications is available on request.
Summary Living arrangements and social networks 11
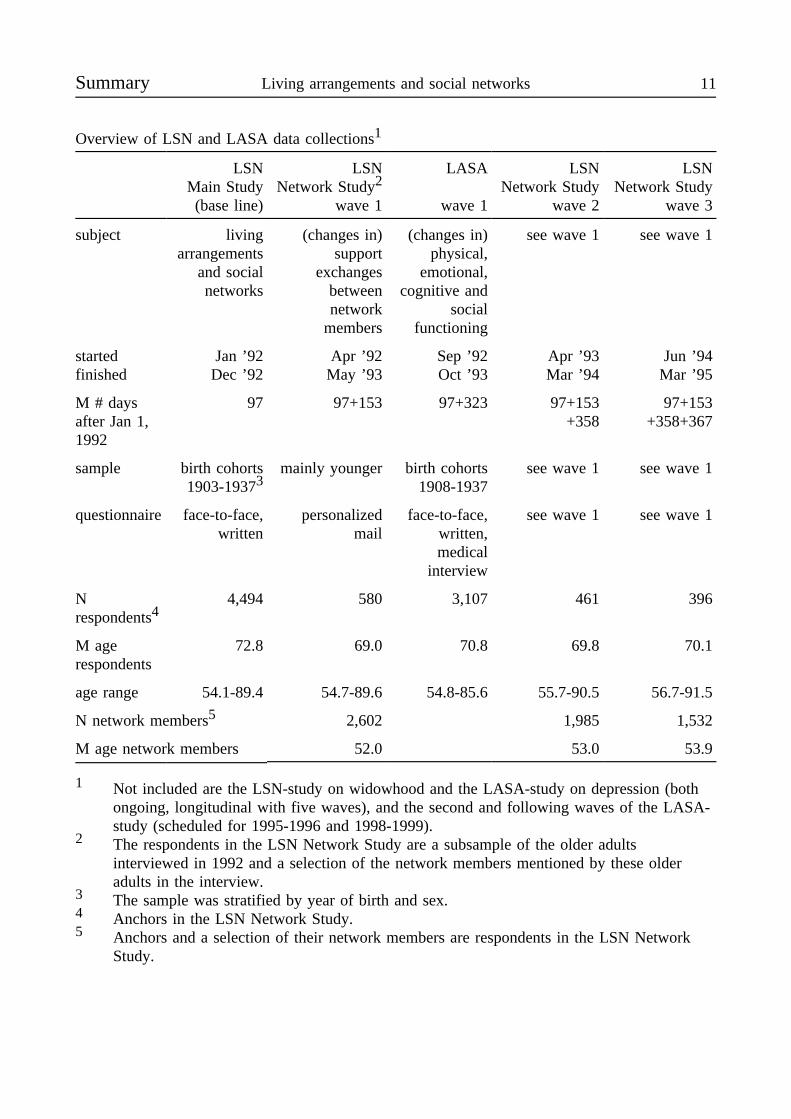
Overview of LSN and LASA data collections1
LSNMain Study(base line)
LSNNetwork Study2
wave 1
LASA
wave 1
LSNNetwork Study
wave 2
LSNNetwork Study
wave 3
subject livingarrangements
and socialnetworks
(changes in)support
exchangesbetweennetwork
members
(changes in)physical,
emotional,cognitive and
socialfunctioning
see wave 1 see wave 1
startedfinished
Jan ’92Dec ’92
Apr ’92May ’93
Sep ’92Oct ’93
Apr ’93Mar ’94
Jun ’94Mar ’95
M # daysafter Jan 1,1992
97 97+153 97+323 97+153+358
97+153+358+367
sample birth cohorts1903-19373
mainly younger birth cohorts1908-1937
see wave 1 see wave 1
questionnaire face-to-face,written
personalizedmail
face-to-face,written,medical
interview
see wave 1 see wave 1
Nrespondents4
4,494 580 3,107 461 396
M agerespondents
72.8 69.0 70.8 69.8 70.1
age range 54.1-89.4 54.7-89.6 54.8-85.6 55.7-90.5 56.7-91.5
N network members5 2,602 1,985 1,532
M age network members 52.0 53.0 53.9
1 Not included are the LSN-study on widowhood and the LASA-study on depression (bothongoing, longitudinal with five waves), and the second and following waves of the LASA-study (scheduled for 1995-1996 and 1998-1999).
2 The respondents in the LSN Network Study are a subsample of the older adultsinterviewed in 1992 and a selection of the network members mentioned by these olderadults in the interview.
3 The sample was stratified by year of birth and sex.4 Anchors in the LSN Network Study.5 Anchors and a selection of their network members are respondents in the LSN Network
Study.

12 NESTOR living arrangements and social networks
Part A
Main Study 1992

14 NESTOR living arrangements and social networks

Main Study 1992 15
Sample and Data CollectionThis chapter gives some general information on the steps taken to collect data for the NESTORprogram "Living arrangements and social networks of older adults" (LSN). The first step was todetermine the projected sample. The next section focuses on the sampling criteria, the selectionof municipalities and how the names and addresses of the sample members were obtained. Thenext step involved the recruitment, selection and training of the interviewers and is described inthe section on interviewers. The planning and actual implementation of the data collection is thesubject of the following section. The outcome of these steps is the actual sample, and some ofits background characteristics are presented in the section on the realized sample. In the twofinal sections of this chapter, information is given about the non-response of the sample and therepresentativeness of the realized sample in comparison with the relevant categories of the Dutchpopulation.
Determination of the sample
Sample criteriaThe primary intention was to obtain a representative sample of older Dutch males and females invarious age categories. To get this representative sample, use was made of population registersin municipalities all across the Netherlands. For reasons of efficiency and cost control, theselection was restricted to the following three regions: the northeast, the southeast and the westof the Netherlands. These regions can be viewed as representing differences in culture, religion,urbanization and aging. No strict criteria were used to specify these regions. The northeastregion includes all of the province Overijssel and the northeastern part of Gelderland andFlevoland. In addition to Zwolle as a city, this region contains various smaller cities and manyrural villages. The west includes the Randstad, which is the urban agglomeration of theNetherlands. The Randstad contains the four major cities Amsterdam, The Hague, Rotterdam andUtrecht. What we call the southeast region covers the eastern part of the province North Brabant.The major city is ’s-Hertogenbosch. The people live in cities and villages with a relatively lowlevel of urbanization.
The choice of these three regions was guided by the following factors. The regions differtotally with respect to religion: the majority of the population in the northeast is Protestant, inthe southeast Roman Catholic. The population in the west is mixed with respect to religion. Thenortheastern and southeastern regions are low in population density. Many older adults live insmall rural villages and are limited in their mobility by the poor availability of publictransportation. The west is densely populated. The western region differs from the northeasternas well as the southeastern one with respect to the high degree of urbanization, the availabilityof public transportation and the mixture of religions. In addition to the choice of regions, a widerange of differences in urbanization was also accomplished by selecting at least twomunicipalities in each region, a large or medium-sized city (high population density) and onelarger rural town or several smaller ones (low population density).
The sample was stratified according to sex and year of birth. Stratification according to sexwas called for because men and women generally differ as regards structural opportunities forinteracting with others. More specifically, older men and women differ with respect to theirliving arrangements and whether or not they have a partner. In order to stratify the sampleaccording to age, we selected years of birth ranging from 1903 to 1937, so that on January 1,1992 the respondents varied in age from 54 to 89. The lower age limit was chosen becausepeople above 54 are increasingly included in the category of senior citizens. The youngest agecohorts are on the verge of experiencing changes in their work situation and living arrangements
16 NESTOR living arrangements and social networks Data Collection
(empty nest). The upper age limit of 89 was chosen because people older than 89 areincreasingly less able to participate in the lengthy interview as planned.
The total number of respondents to be interviewed was set at 4,000. This figure waschosen because it made it possible for the total of 70 different categories of sex and years ofbirth to be filled with numbers high enough for complex data analyses.
Selection of the municipalitiesEvery effort was made to select a sample that was representative of the Dutch population aged55-89 years with respect to region and degree of urbanization. The selection of the sample tookplace in the autumn of 1991, and the available population statistics dated back to January 1,1990. One guideline with respect to regional variation was the entire population aged 50 andolder in 1990 in the Netherlands. Of this population, 45% lived in the western provinces, 31% inthe northeastern provinces and 24% in the southern provinces of the Netherlands (NCBS,1990a). Three degrees of urbanization were distinguished: rural area, small or medium-sizedcities, and large cities. Of the national population aged 55-89, 46% lived in rural area, 27% insmall or medium-sized cities and 27% in large cities (NCBS, 1990b).
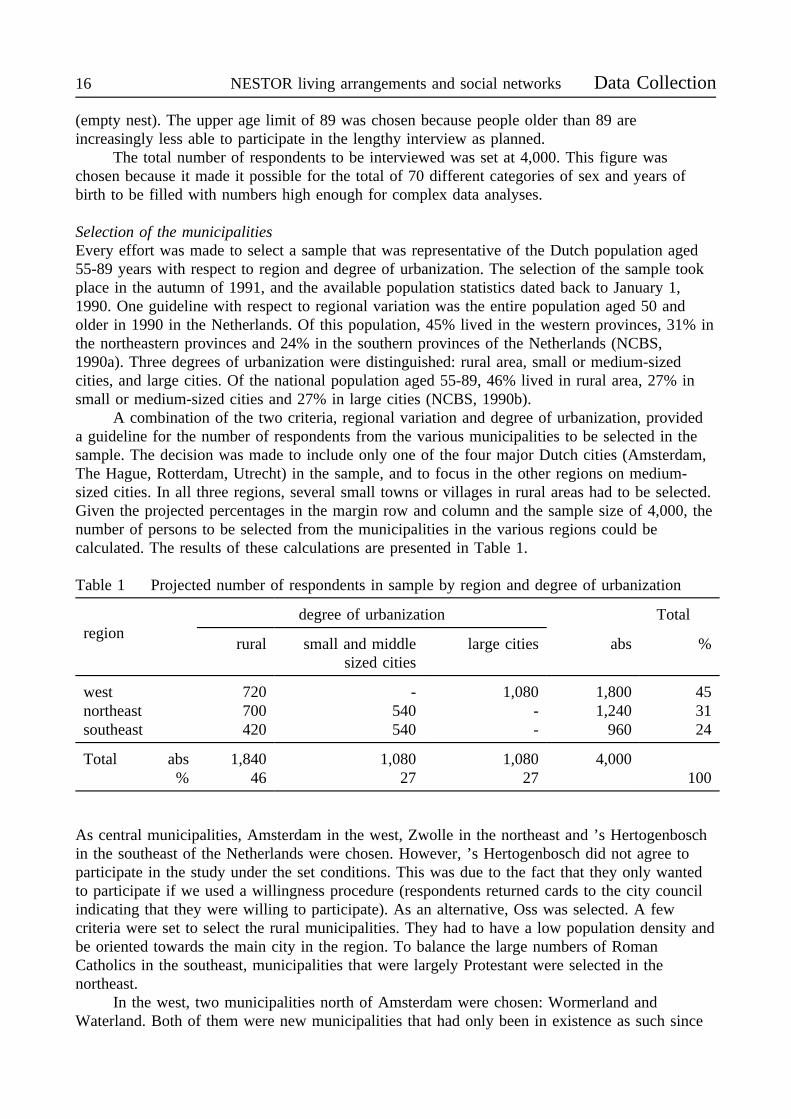
A combination of the two criteria, regional variation and degree of urbanization, provideda guideline for the number of respondents from the various municipalities to be selected in thesample. The decision was made to include only one of the four major Dutch cities (Amsterdam,The Hague, Rotterdam, Utrecht) in the sample, and to focus in the other regions on medium-sized cities. In all three regions, several small towns or villages in rural areas had to be selected.Given the projected percentages in the margin row and column and the sample size of 4,000, thenumber of persons to be selected from the municipalities in the various regions could becalculated. The results of these calculations are presented in Table 1.
Table 1 Projected number of respondents in sample by region and degree of urbanization
regiondegree of urbanization Total
rural small and middlesized cities
large cities abs %
west 720 - 1,080 1,800 45northeast 700 540 - 1,240 31southeast 420 540 - 960 24
Total abs 1,840 1,080 1,080 4,000% 46 27 27 100
As central municipalities, Amsterdam in the west, Zwolle in the northeast and ’s Hertogenboschin the southeast of the Netherlands were chosen. However, ’s Hertogenbosch did not agree toparticipate in the study under the set conditions. This was due to the fact that they only wantedto participate if we used a willingness procedure (respondents returned cards to the city councilindicating that they were willing to participate). As an alternative, Oss was selected. A fewcriteria were set to select the rural municipalities. They had to have a low population density andbe oriented towards the main city in the region. To balance the large numbers of RomanCatholics in the southeast, municipalities that were largely Protestant were selected in thenortheast.
In the west, two municipalities north of Amsterdam were chosen: Wormerland andWaterland. Both of them were new municipalities that had only been in existence as such since

Data Collection Main Study 1992 17
January 1991, and were composed of several large and small villages in a relatively large ruralarea. According to Table 1, in each of these two municipalities about 360 respondents were tobe interviewed.
In the northeast, Zwartsluis and Nieuwleusen were chosen as the largely Protestantmunicipalities. Nieuwleusen did not agree to participate in the study on the set conditions (theyonly wanted to participate if we used a willingness procedure) and was replaced by twomunicipalities, Genemuiden and Hasselt. Since Zwartsluis, Genemuiden and Hasselt were smalland densely populated communities, Ommen was chosen as a fourth municipality with a morerural character and lower population density. The four municipalities were together to provide atotal of 700 respondents. Considering the differences in size, the decision was made to interview300 persons in Ommen, 100 in Genemuiden, 100 in Hasselt and 200 in Zwartsluis.
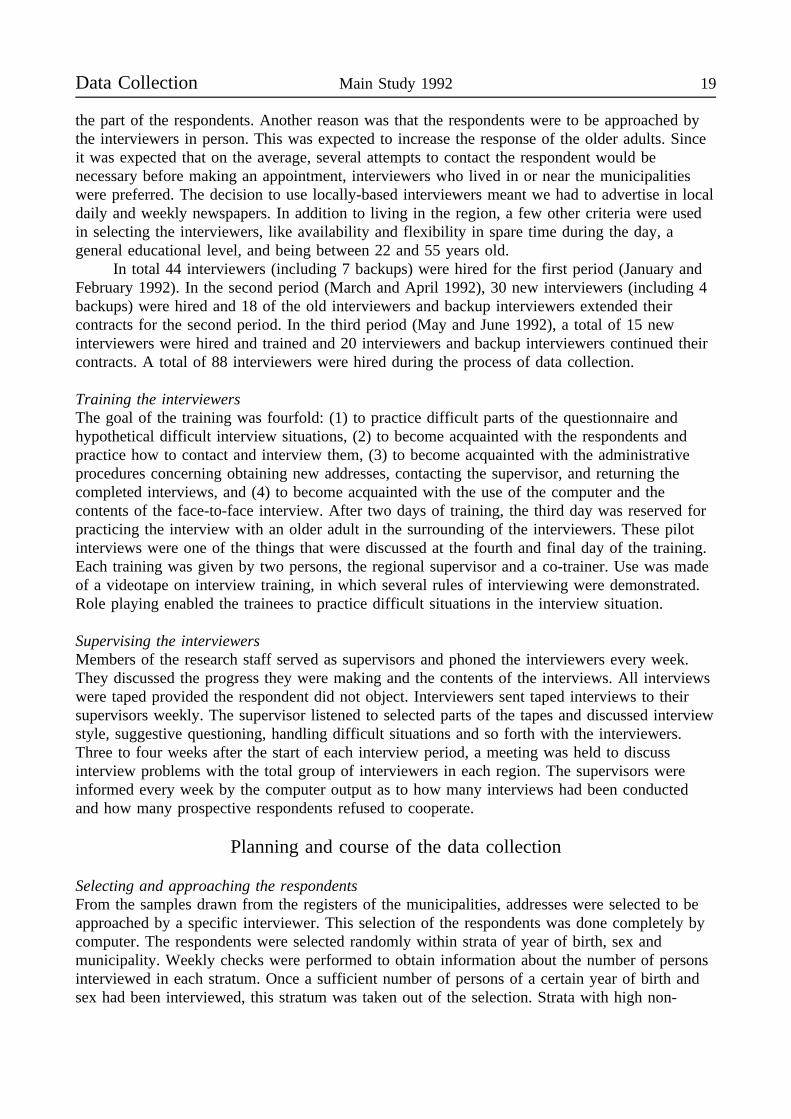
In the southeast, we chose Uden as an
Figure 1. Location of the elevenmunicipalities in the Netherlands
urbanized rural municipality. Boekel was chosenbecause it is a small farming village. Weplanned to interview 420 respondents in thesetwo municipalities, 240 in Uden and 180 inBoekel. Figure 1 shows the location of theselected municipalities in the Netherlands.
Most of the municipalities provided thesample addresses without any problems. InAmsterdam and Boekel, however, themunicipality only agreed to cooperate if arefusal procedure was used, with themunicipality directly addressing the selectedgroup. The sample members had to make clearby returning a card that they were not willing tobe approached by the researchers from the VrijeUniversiteit. If they did not return the cardswithin three weeks, their addresses were given tothe researchers. Despite the fact that thisprocedure involves a selection bias of thesample, we agreed to the procedure because wedid not want to lose Amsterdam for the study. In the case of Boekel, we agreed because thealternative rural municipalities used the same refusal procedure.
Stratification by sex and year of birthAs has been noted above, the decision was made to stratify the sample by sex and year of birth.This means the same number of males and females was to be selected for each year of birth. Inaddition, the sample was selected in such a way that after five years, the number of males andfemales in the oldest age categories would still be large enough to be studied. The reason forthis was that the LSN program is linked with the Longitudinal Aging Study Amsterdam (LASA),which is to provide a ten-year follow-up on the LSN sample. Based on NCBS survival rates ofthe population in the 55 to 84 age group (NCBS, 1990c), weights were calculated to determinethe number of males and females in each age category. The decision was made not to includepersons aged 85 to 89 (year of birth 1903-1907) in the weight measurement, since this wouldlead to a very large oversampling of this age category. The number of persons aged 84 wascalculated for these age categories. This would have resulted in an oversampling of the oldestage categories in the sample, but the samples of most of the smaller municipalities did notcontain enough persons (especially males) in the oldest age category. The projected number ofrespondents in the oldest age category was thus relatively low (columns projected in Table 2).
18 NESTOR living arrangements and social networks Data Collection
The section after the next section discusses the extent to which efforts were made to havethe resulting sample meet the original criteria.
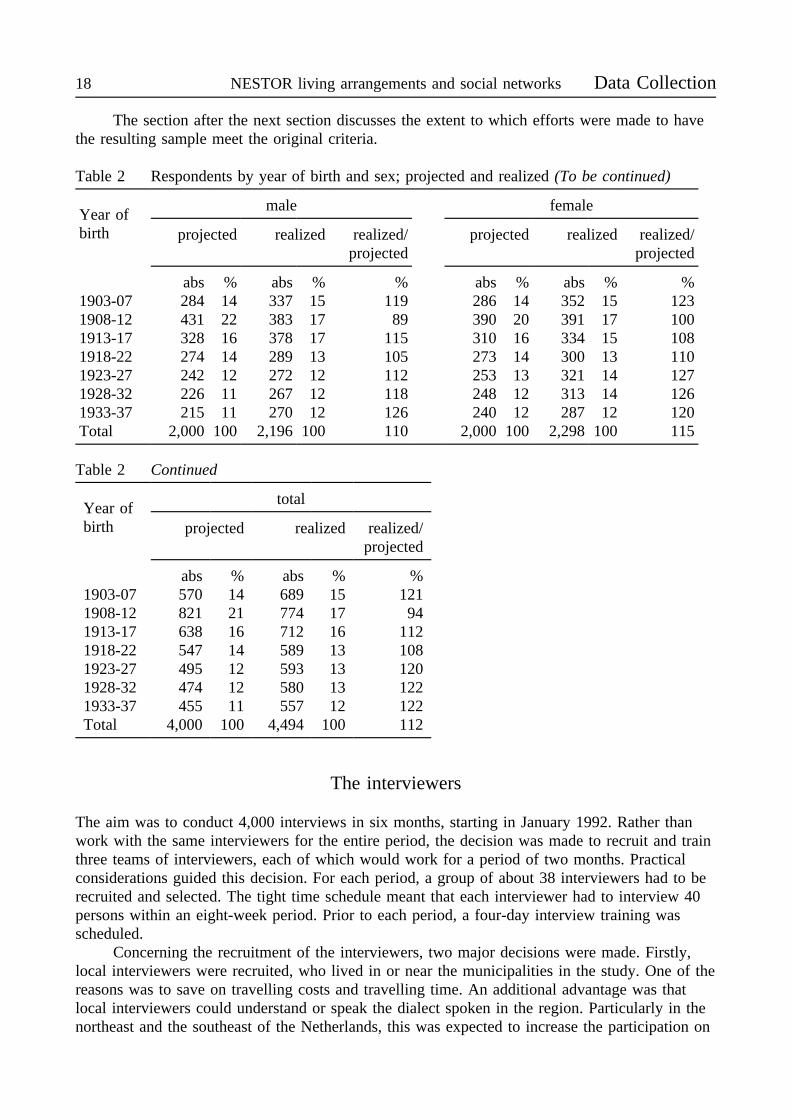
Table 2 Respondents by year of birth and sex; projected and realized (To be continued)
Year ofbirth
male female
projected realized realized/projected
projected realized realized/projected
abs % abs % % abs % abs % %1903-07 284 14 337 15 119 286 14 352 15 1231908-12 431 22 383 17 89 390 20 391 17 1001913-17 328 16 378 17 115 310 16 334 15 1081918-22 274 14 289 13 105 273 14 300 13 1101923-27 242 12 272 12 112 253 13 321 14 1271928-32 226 11 267 12 118 248 12 313 14 1261933-37 215 11 270 12 126 240 12 287 12 120Total 2,000 100 2,196 100 110 2,000 100 2,298 100 115
Table 2 Continued
Year ofbirth
total
projected realized realized/projected
abs % abs % %1903-07 570 14 689 15 1211908-12 821 21 774 17 941913-17 638 16 712 16 1121918-22 547 14 589 13 1081923-27 495 12 593 13 1201928-32 474 12 580 13 1221933-37 455 11 557 12 122Total 4,000 100 4,494 100 112
The interviewers
The aim was to conduct 4,000 interviews in six months, starting in January 1992. Rather thanwork with the same interviewers for the entire period, the decision was made to recruit and trainthree teams of interviewers, each of which would work for a period of two months. Practicalconsiderations guided this decision. For each period, a group of about 38 interviewers had to berecruited and selected. The tight time schedule meant that each interviewer had to interview 40persons within an eight-week period. Prior to each period, a four-day interview training wasscheduled.
Concerning the recruitment of the interviewers, two major decisions were made. Firstly,local interviewers were recruited, who lived in or near the municipalities in the study. One of thereasons was to save on travelling costs and travelling time. An additional advantage was thatlocal interviewers could understand or speak the dialect spoken in the region. Particularly in thenortheast and the southeast of the Netherlands, this was expected to increase the participation on
Data Collection Main Study 1992 19
the part of the respondents. Another reason was that the respondents were to be approached bythe interviewers in person. This was expected to increase the response of the older adults. Sinceit was expected that on the average, several attempts to contact the respondent would benecessary before making an appointment, interviewers who lived in or near the municipalitieswere preferred. The decision to use locally-based interviewers meant we had to advertise in localdaily and weekly newspapers. In addition to living in the region, a few other criteria were usedin selecting the interviewers, like availability and flexibility in spare time during the day, ageneral educational level, and being between 22 and 55 years old.
In total 44 interviewers (including 7 backups) were hired for the first period (January andFebruary 1992). In the second period (March and April 1992), 30 new interviewers (including 4backups) were hired and 18 of the old interviewers and backup interviewers extended theircontracts for the second period. In the third period (May and June 1992), a total of 15 newinterviewers were hired and trained and 20 interviewers and backup interviewers continued theircontracts. A total of 88 interviewers were hired during the process of data collection.
Training the interviewersThe goal of the training was fourfold: (1) to practice difficult parts of the questionnaire andhypothetical difficult interview situations, (2) to become acquainted with the respondents andpractice how to contact and interview them, (3) to become acquainted with the administrativeprocedures concerning obtaining new addresses, contacting the supervisor, and returning thecompleted interviews, and (4) to become acquainted with the use of the computer and thecontents of the face-to-face interview. After two days of training, the third day was reserved forpracticing the interview with an older adult in the surrounding of the interviewers. These pilotinterviews were one of the things that were discussed at the fourth and final day of the training.Each training was given by two persons, the regional supervisor and a co-trainer. Use was madeof a videotape on interview training, in which several rules of interviewing were demonstrated.Role playing enabled the trainees to practice difficult situations in the interview situation.
Supervising the interviewersMembers of the research staff served as supervisors and phoned the interviewers every week.They discussed the progress they were making and the contents of the interviews. All interviewswere taped provided the respondent did not object. Interviewers sent taped interviews to theirsupervisors weekly. The supervisor listened to selected parts of the tapes and discussed interviewstyle, suggestive questioning, handling difficult situations and so forth with the interviewers.Three to four weeks after the start of each interview period, a meeting was held to discussinterview problems with the total group of interviewers in each region. The supervisors wereinformed every week by the computer output as to how many interviews had been conductedand how many prospective respondents refused to cooperate.
Planning and course of the data collection
Selecting and approaching the respondentsFrom the samples drawn from the registers of the municipalities, addresses were selected to beapproached by a specific interviewer. This selection of the respondents was done completely bycomputer. The respondents were selected randomly within strata of year of birth, sex andmunicipality. Weekly checks were performed to obtain information about the number of personsinterviewed in each stratum. Once a sufficient number of persons of a certain year of birth andsex had been interviewed, this stratum was taken out of the selection. Strata with high non-
20 NESTOR living arrangements and social networks Data Collection
response obtained larger weights, so that more of the respondents in these strata would beselected for approach.
The selected respondents received a letter introducing the study and asking them toparticipate in it. It announced the arrival of an interviewer within the next few days to make anappointment for an interview. A flyer was also enclosed with more information about theobjectives of the study and the background of the researchers.
At the same time as the letters were sent to the prospective respondents, information aboutthe address, age and sex of the respondents was sent to the interviewer. The interviewerapproached the prospective respondents (preferably on the doorstep and not by phone) and askedthem to participate in the study. If they agreed to participate, an appointment was made for theinterview. At the time of appointment, the interviewer went to the home of the respondent with alaptop computer and conducted the interview. After returning home the interviewer filled out anumber of questions related to the course of the interview and the respondent’s behavior.
If the respondent was not at home, the interviewer was instructed to approach therespondent again and again, for as long as the interviewer participated in the project. If theinterviewer’s contract expired and the respondent still had not been reached, another interviewerin the same region continued to try. The approach attempts were carried out until the closingdate of the period of data collection (December 1992). If a prospective respondent refused tocooperate, the interviewer was asked to state the reason as well as whether the respondentrefused right away or after some discussion. At a later stage (October 1992), a selection of thepersons who refused were approached again with a request to participate in the study.
If physical or mental deficiencies prevented the respondent from being able to participatein a lengthy, one-hour-and-a-half interview, the interviewer had the option to choose the shortversion of the interview. In the event of possible mental deficiencies, the interviewer performeda shortened mental-state test to aid the decision whether to continue the full interview. If arespondent obtained a low test score, the interviewer chose the short version of thequestionnaire.
If, as a result of physical and mental deficiencies, the interviewer was not even able toconduct a short version, he or she tried to obtain the name and address of a proxy. This was tobe a person close to the respondent, who could answer a few questions about the living andhealth situation of the respondent. At a later stage in the data collection, these proxies werecontacted by phone to answer a few questions about the respondent.
Completing the data collectionThe period when prospective respondents were approached was from January 3 to July 12, 1992.After this date, no new prospective respondents were approached to participate in the study,although efforts were made to increase the response. The first step was to re-approach peoplewho had been classified as not-reached. They had been in the hospital at the time, or had movedto another part of the region or were abroad or on vacation, and were approached again fromJuly 12 to December 1, 1992. They received a revised letter of introduction. An interviewerwould then contact them to try and set an interview date.
The second step was to re-approach people who had initially refused to participate in thestudy. Starting in October, they received a letter with another request to participate in the study.A few days later they were called on the telephone and asked to respond to the letter. If theyagreed to participate, their names and addresses were sent to an interviewer in the region andthey were approached to set a date for the interview. Not all respondents who had refused wereapproached a second time. Only the respondents who had used "soft" reasons for notparticipating the first time were selected. For example, they had been ill or lacked the time orinterest to take part in an interview. Since the interviewer recorded the reason for the refusal at
Data Collection Main Study 1992 21
the first approach, it was possible to select only those respondents who had given some leewayfor arguments.
Realized sample
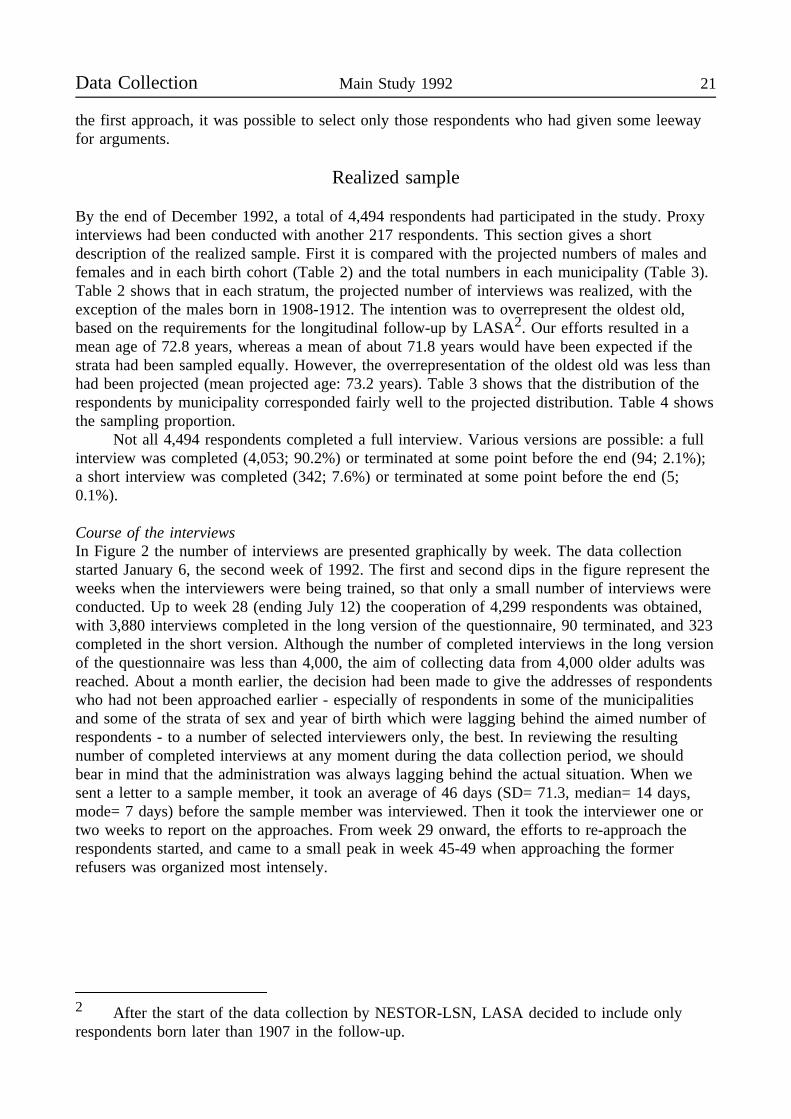
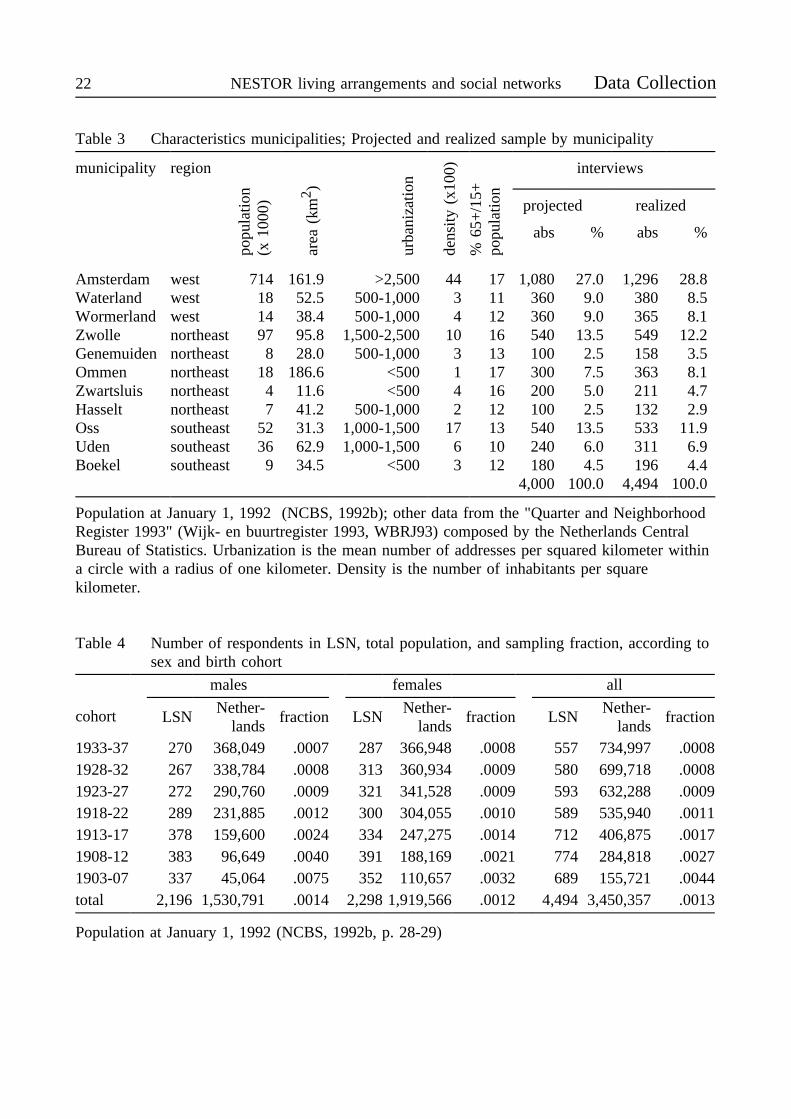
By the end of December 1992, a total of 4,494 respondents had participated in the study. Proxyinterviews had been conducted with another 217 respondents. This section gives a shortdescription of the realized sample. First it is compared with the projected numbers of males andfemales and in each birth cohort (Table 2) and the total numbers in each municipality (Table 3).Table 2 shows that in each stratum, the projected number of interviews was realized, with theexception of the males born in 1908-1912. The intention was to overrepresent the oldest old,based on the requirements for the longitudinal follow-up by LASA2. Our efforts resulted in amean age of 72.8 years, whereas a mean of about 71.8 years would have been expected if thestrata had been sampled equally. However, the overrepresentation of the oldest old was less thanhad been projected (mean projected age: 73.2 years). Table 3 shows that the distribution of therespondents by municipality corresponded fairly well to the projected distribution. Table 4 showsthe sampling proportion.
Not all 4,494 respondents completed a full interview. Various versions are possible: a fullinterview was completed (4,053; 90.2%) or terminated at some point before the end (94; 2.1%);a short interview was completed (342; 7.6%) or terminated at some point before the end (5;0.1%).
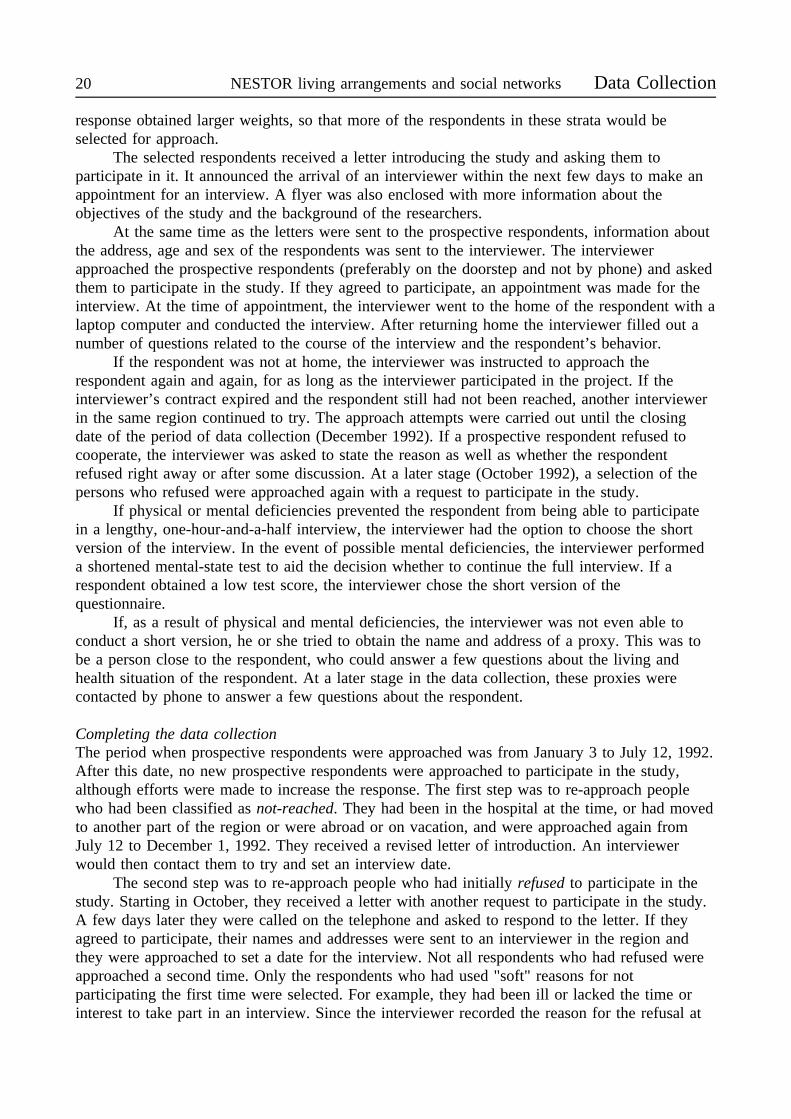
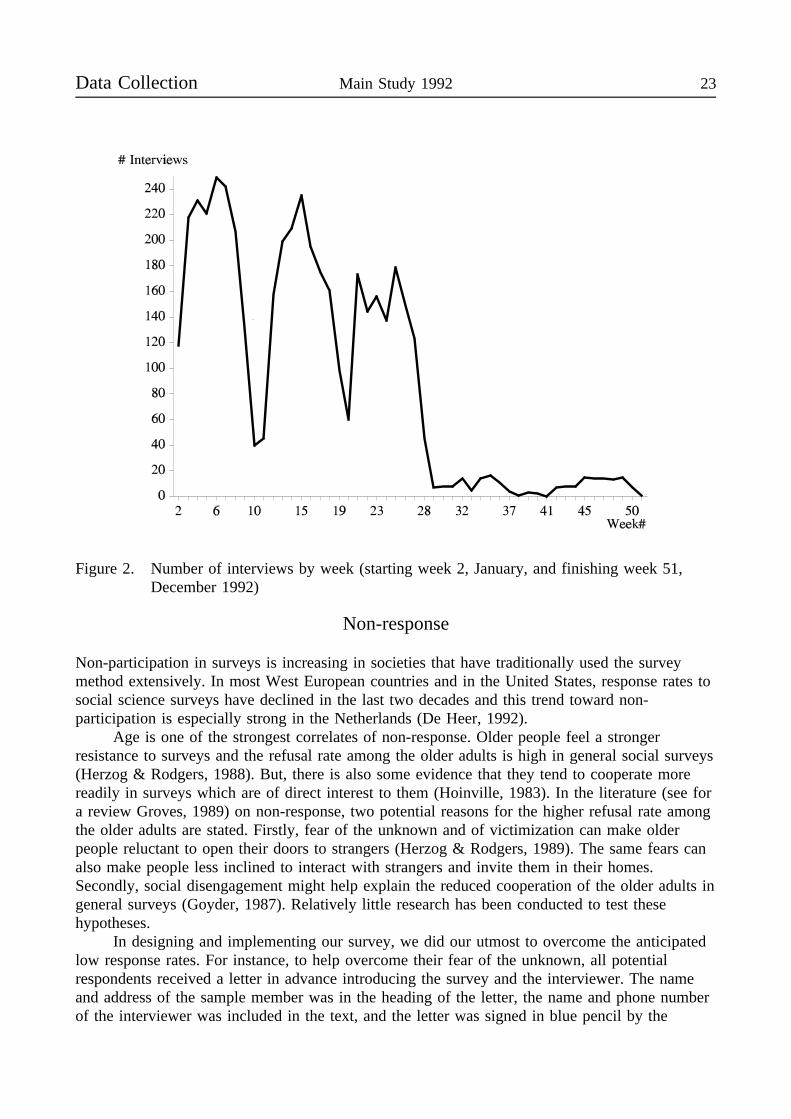
Course of the interviewsIn Figure 2 the number of interviews are presented graphically by week. The data collectionstarted January 6, the second week of 1992. The first and second dips in the figure represent theweeks when the interviewers were being trained, so that only a small number of interviews wereconducted. Up to week 28 (ending July 12) the cooperation of 4,299 respondents was obtained,with 3,880 interviews completed in the long version of the questionnaire, 90 terminated, and 323completed in the short version. Although the number of completed interviews in the long versionof the questionnaire was less than 4,000, the aim of collecting data from 4,000 older adults wasreached. About a month earlier, the decision had been made to give the addresses of respondentswho had not been approached earlier - especially of respondents in some of the municipalitiesand some of the strata of sex and year of birth which were lagging behind the aimed number ofrespondents - to a number of selected interviewers only, the best. In reviewing the resultingnumber of completed interviews at any moment during the data collection period, we shouldbear in mind that the administration was always lagging behind the actual situation. When wesent a letter to a sample member, it took an average of 46 days (SD= 71.3, median= 14 days,mode= 7 days) before the sample member was interviewed. Then it took the interviewer one ortwo weeks to report on the approaches. From week 29 onward, the efforts to re-approach therespondents started, and came to a small peak in week 45-49 when approaching the formerrefusers was organized most intensely.
2 After the start of the data collection by NESTOR-LSN, LASA decided to include onlyrespondents born later than 1907 in the follow-up.
22 NESTOR living arrangements and social networks Data Collection
Table 3 Characteristics municipalities; Projected and realized sample by municipality
municipality region
popu
latio
n(x
1000
)
area
(km
2 )
urba
niza
tion
dens
ity(x
100)
%65
+/1
5+po
pula
tion
interviews
projected realized
abs % abs %
Amsterdam west 714 161.9 >2,500 44 17 1,080 27.0 1,296 28.8Waterland west 18 52.5 500-1,000 3 11 360 9.0 380 8.5Wormerland west 14 38.4 500-1,000 4 12 360 9.0 365 8.1Zwolle northeast 97 95.8 1,500-2,500 10 16 540 13.5 549 12.2Genemuiden northeast 8 28.0 500-1,000 3 13 100 2.5 158 3.5Ommen northeast 18 186.6 <500 1 17 300 7.5 363 8.1Zwartsluis northeast 4 11.6 <500 4 16 200 5.0 211 4.7Hasselt northeast 7 41.2 500-1,000 2 12 100 2.5 132 2.9Oss southeast 52 31.3 1,000-1,500 17 13 540 13.5 533 11.9Uden southeast 36 62.9 1,000-1,500 6 10 240 6.0 311 6.9Boekel southeast 9 34.5 <500 3 12 180 4.5 196 4.4
4,000 100.0 4,494 100.0
Population at January 1, 1992 (NCBS, 1992b); other data from the "Quarter and NeighborhoodRegister 1993" (Wijk- en buurtregister 1993, WBRJ93) composed by the Netherlands CentralBureau of Statistics. Urbanization is the mean number of addresses per squared kilometer withina circle with a radius of one kilometer. Density is the number of inhabitants per squarekilometer.
Table 4 Number of respondents in LSN, total population, and sampling fraction, according tosex and birth cohort
males females all
cohort LSNNether-
landsfraction LSN
Nether-lands
fraction LSNNether-
landsfraction
1933-37 270 368,049 .0007 287 366,948 .0008 557 734,997 .00081928-32 267 338,784 .0008 313 360,934 .0009 580 699,718 .00081923-27 272 290,760 .0009 321 341,528 .0009 593 632,288 .00091918-22 289 231,885 .0012 300 304,055 .0010 589 535,940 .00111913-17 378 159,600 .0024 334 247,275 .0014 712 406,875 .00171908-12 383 96,649 .0040 391 188,169 .0021 774 284,818 .00271903-07 337 45,064 .0075 352 110,657 .0032 689 155,721 .0044total 2,196 1,530,791 .0014 2,298 1,919,566 .0012 4,494 3,450,357 .0013
Population at January 1, 1992 (NCBS, 1992b, p. 28-29)
Data Collection Main Study 1992 23
Non-response
Figure 2. Number of interviews by week (starting week 2, January, and finishing week 51,December 1992)
Non-participation in surveys is increasing in societies that have traditionally used the surveymethod extensively. In most West European countries and in the United States, response rates tosocial science surveys have declined in the last two decades and this trend toward non-participation is especially strong in the Netherlands (De Heer, 1992).
Age is one of the strongest correlates of non-response. Older people feel a strongerresistance to surveys and the refusal rate among the older adults is high in general social surveys(Herzog & Rodgers, 1988). But, there is also some evidence that they tend to cooperate morereadily in surveys which are of direct interest to them (Hoinville, 1983). In the literature (see fora review Groves, 1989) on non-response, two potential reasons for the higher refusal rate amongthe older adults are stated. Firstly, fear of the unknown and of victimization can make olderpeople reluctant to open their doors to strangers (Herzog & Rodgers, 1989). The same fears canalso make people less inclined to interact with strangers and invite them in their homes.Secondly, social disengagement might help explain the reduced cooperation of the older adults ingeneral surveys (Goyder, 1987). Relatively little research has been conducted to test thesehypotheses.
In designing and implementing our survey, we did our utmost to overcome the anticipatedlow response rates. For instance, to help overcome their fear of the unknown, all potentialrespondents received a letter in advance introducing the survey and the interviewer. The nameand address of the sample member was in the heading of the letter, the name and phone numberof the interviewer was included in the text, and the letter was signed in blue pencil by the

24 NESTOR living arrangements and social networks Data Collection
program director. Also, all interviewers were issued an identity card with their photograph on it,and were instructed to keep this card ready and show it even before the respondents asked for it.During the interviewer training, special attention was devoted to how to convince and reassurehesitant respondents. Furthermore, to overcome their disinterest, an attractive brochure was sentto all potential respondents explaining the study and emphasizing its importance and its directsignificance for the respondent. An extended field period was planned to accommodaterespondents who were temporarily indisposed, and a small gift was offered to all respondents asa token of appreciation for their help. Beside these activities directed to the individual samplemember, information was sent to local institutions (e.g. homes for the elderly), generalpractitioners, and local papers, which resulted in some publicity.
Overall non-responseThe response rate is defined as the number of interviews that actually were completed dividedby the number of all sampled cases in which an interview could have been completed (Groves,1989, p. 141). This rate most clearly estimates the number of all eligible persons measured bythe survey procedure. This results in an overall response rate of 61.7%3, which is comparableto response rates for the general population of the Netherlands (De Heer, 1992). Considering thenon-response problems when interviewing an population of older adults, the results aresatisfactory. A detailed non-response breakdown is given in Tables 5 and 6.
Table 5 Review of response and non-response (To be continued)
refusalvia
munici-pality
notused
language
ill (noproxydata)
ill(proxy
data)
died ormoved
notcon-
tacted
un-known
refusal inter-viewed
Amsterdam 1,222 297 14 81 45 95 23 2 445 1,296Waterland 297 17 11 174 1 213 380Wormerland 410 1 19 13 13 159 365Zwolle 798 52 34 33 3 1 297 549Genemuiden 214 18 19 4 1 96 158Ommen 734 23 19 21 203 363Zwartsluis 592 13 3 15 169 211Hasselt 23 6 10 5 1 101 132Oss 771 1 42 33 29 246 533Uden 185 31 12 18 121 311Boekel 121 200 1 9 18 4 42 196Total 1,343 4,521 17 311 217 411 28 4 2,092 4,494
When reading Table 5, two things should be noted. First, the ’refusal via municipality’ columngives the results of the special sampling procedure used by the municipalities of Amsterdam andBoekel. In the first step of approaching the respondents, which was conducted by themunicipality, sampled persons could inform the municipality that they would prefer not to beapproached by the Vrije Universiteit. In that case, their addresses were not disclosed to theresearch group. These first-step refusals are roughly divided into eligible refusals (e.g., I’m notinterested, privacy problems) and ineligible refusals (e.g., sampled person died, is too ill to beinterviewed). We need those estimates of the size of those two categories when we compute the
3 The comparable figure for the birth cohorts 1908-1937 (the LASA sample) is 62.3%.
Data Collection Main Study 1992 25
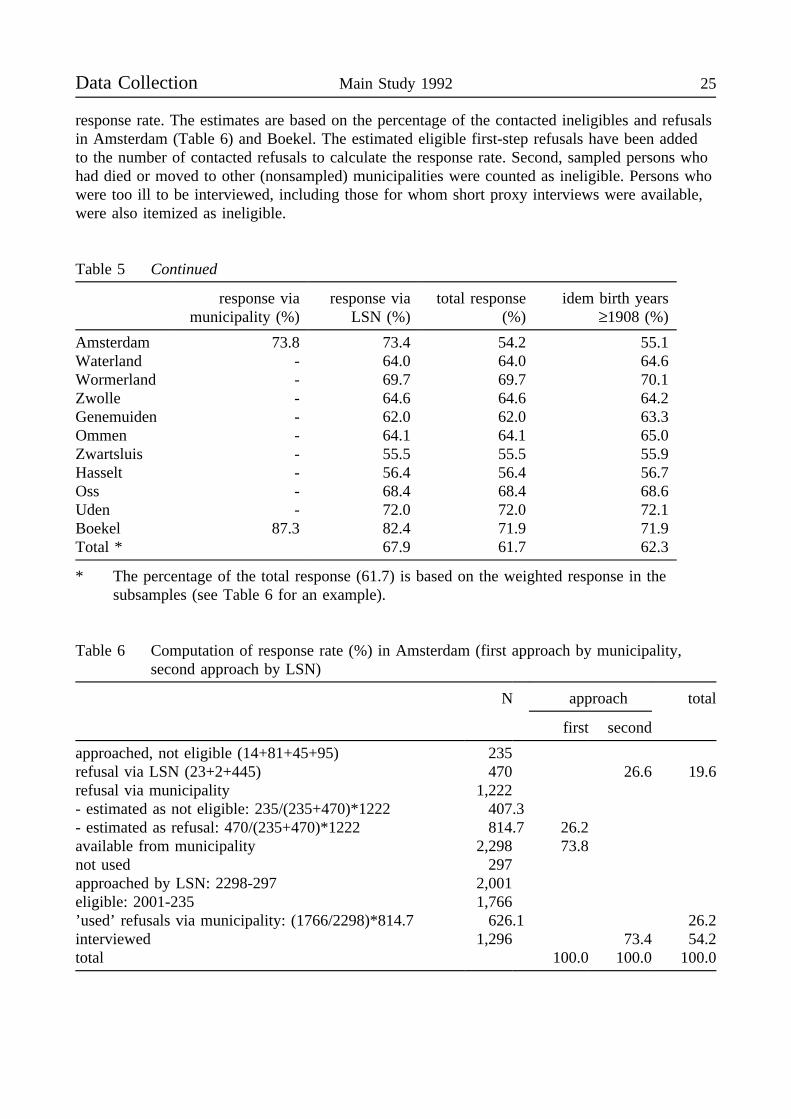
response rate. The estimates are based on the percentage of the contacted ineligibles and refusalsin Amsterdam (Table 6) and Boekel. The estimated eligible first-step refusals have been addedto the number of contacted refusals to calculate the response rate. Second, sampled persons whohad died or moved to other (nonsampled) municipalities were counted as ineligible. Persons whowere too ill to be interviewed, including those for whom short proxy interviews were available,were also itemized as ineligible.
Table 5 Continued
response viamunicipality (%)
response viaLSN (%)
total response(%)
idem birth years≥1908 (%)
Amsterdam 73.8 73.4 54.2 55.1Waterland - 64.0 64.0 64.6Wormerland - 69.7 69.7 70.1Zwolle - 64.6 64.6 64.2Genemuiden - 62.0 62.0 63.3Ommen - 64.1 64.1 65.0Zwartsluis - 55.5 55.5 55.9Hasselt - 56.4 56.4 56.7Oss - 68.4 68.4 68.6Uden - 72.0 72.0 72.1Boekel 87.3 82.4 71.9 71.9Total * 67.9 61.7 62.3
* The percentage of the total response (61.7) is based on the weighted response in thesubsamples (see Table 6 for an example).
Table 6 Computation of response rate (%) in Amsterdam (first approach by municipality,second approach by LSN)
N approach total
first second
approached, not eligible (14+81+45+95) 235refusal via LSN (23+2+445) 470 26.6 19.6refusal via municipality 1,222- estimated as not eligible: 235/(235+470)*1222 407.3- estimated as refusal: 470/(235+470)*1222 814.7 26.2available from municipality 2,298 73.8not used 297approached by LSN: 2298-297 2,001eligible: 2001-235 1,766’used’ refusals via municipality: (1766/2298)*814.7 626.1 26.2interviewed 1,296 73.4 54.2total 100.0 100.0 100.0
26 NESTOR living arrangements and social networks Data Collection
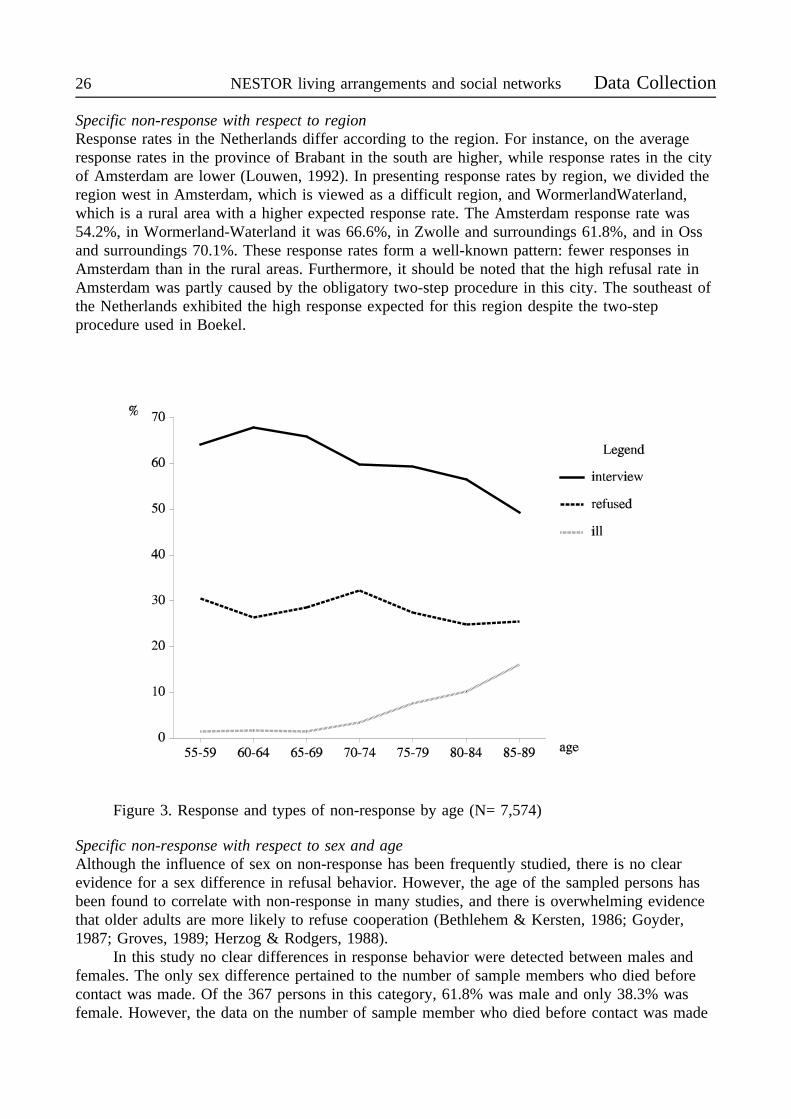
Specific non-response with respect to regionResponse rates in the Netherlands differ according to the region. For instance, on the averageresponse rates in the province of Brabant in the south are higher, while response rates in the cityof Amsterdam are lower (Louwen, 1992). In presenting response rates by region, we divided theregion west in Amsterdam, which is viewed as a difficult region, and WormerlandWaterland,which is a rural area with a higher expected response rate. The Amsterdam response rate was54.2%, in Wormerland-Waterland it was 66.6%, in Zwolle and surroundings 61.8%, and in Ossand surroundings 70.1%. These response rates form a well-known pattern: fewer responses inAmsterdam than in the rural areas. Furthermore, it should be noted that the high refusal rate inAmsterdam was partly caused by the obligatory two-step procedure in this city. The southeast ofthe Netherlands exhibited the high response expected for this region despite the two-stepprocedure used in Boekel.
Specific non-response with respect to sex and age
Figure 3. Response and types of non-response by age (N= 7,574)
Although the influence of sex on non-response has been frequently studied, there is no clearevidence for a sex difference in refusal behavior. However, the age of the sampled persons hasbeen found to correlate with non-response in many studies, and there is overwhelming evidencethat older adults are more likely to refuse cooperation (Bethlehem & Kersten, 1986; Goyder,1987; Groves, 1989; Herzog & Rodgers, 1988).
In this study no clear differences in response behavior were detected between males andfemales. The only sex difference pertained to the number of sample members who died beforecontact was made. Of the 367 persons in this category, 61.8% was male and only 38.3% wasfemale. However, the data on the number of sample member who died before contact was made

Data Collection Main Study 1992 27
are not reliable: it is possible that many of them (especially in Waterland) died before thesample was drawn.
There is a clear correlation between age and response, as is shown in Figure 3.Significantly more interviews were agreed to by the younger older adults (55-69), and among thevery oldest (80-89) significantly fewer interviews were completed. This same very old groupwas also overrepresented in the non-response due to illness. If we look at the age differencesamong those who refused, it is clear that the very young older adults (55-60) and people in theirearly seventies were overrepresented among the refusers. So in the category of the youngestsample members, we found a relatively high rate of participation and of refusal, and a relativelylow rate of illness. There was thus no linear age-related refusal rate.
ConclusionsThe older adults are a difficult population to survey, and are less willing to cooperate in surveys.In this study, a special effort was made to optimize the response among the older adults. Almostall potential respondents were contacted, and the non-response was mainly due to refusals. Theoverall response rate was 61.7%, which is comparable to response rates for surveys of thegeneral population of the Netherlands. That a survey of older adults can reach response rates ashigh as those for the general population is encouraging.
Around a third of the data were collected in municipalities where the city councils insistedon a two-step procedure to guard the privacy of their records. The two-step procedure gavepotential respondents an easy extra opportunity to refuse by returning a prestamped postcard. Itis possible that this had a negative effect on the cooperation.
Analysis of the non-response indicated that there were no clear effects of sex on non-response, but age effects did exist. There was a decline in response with increasing age with theoldest exhibiting more non-response due to illness.
The representativeness of the realized sample
In this section we will briefly assess to what extent the realized sample was representative. Inparticular, with regard to three key aspects, (1) regional distribution, (2) distribution according tolevel of urbanization, and (3) distribution according to marital status. Sex and age are notreviewed because the sample stratification already includes these characteristics.
Table 7 shows the distribution of the realized sample4 and of the total Dutch populationof 55 and older (NCBS, 1992a) according to region and level of urbanization.
Table 7 Distribution of the realized sample and the population according to region andurbanization (%)
Region sample pop. Level of urbanisation sample pop.west 44.3 47.2 rural 40.3 41.2northeast 32.1 31.1 small / middle size cities 19.4 20.1southeast 23.6 21.7 large cities 40.3 38.7
4 Sample distributions referred to in this section are based on respondents who participatedin a complete version of the interview (N= 4,147). Excluded are the respondents whoparticipated in the short version of the interview and the respondents for whom only a proxyinterview was conducted.
28 NESTOR living arrangements and social networks Data Collection
With regard to the regional distribution of the realized sample, older adults were somewhatunderrepresented in the western provinces and overrepresented in the northeast of the countryand in particular in the southeast. To assess how representative the realized sample wasregarding level of urbanization, we used a recent measure developed by the Netherlands CentralBureau of Statistics (Den Dulk, Van de Stadt & Vliegen, 1992), based on the address density ofan area. To date, this is the best measure of urbanization level available in the Netherlands. Asis clear from Table 7, the distribution of the realized sample regarding level of urbanizationcorresponds very closely to that of the total population above the age of 55 years.
Finally, we assessed the representativeness of the realized sample by comparing thedistribution of respondents regarding marital status cross-classified by age and sex with themarital status distribution of the underlying population. These distributions are shown for malesand females in Table 85.
Among males there is generally a very good fit between the realized sample distributionand the distribution of the population regarding marital status. Divorced older adults are slightlyunderrepresented, especially among the youngest and oldest age categories, whereas widowersare slightly overrepresented, especially among the respondents between the ages of 80 and 84years. The realized sample and population distributions of married and never married malesexhibited quite a close correspondence.
Among females, the differences between the realized sample and the population werelarger than among males. Overall, never married and divorced females were underrepresentedand widowed females overrepresented in the realized sample. The underrepresentation of nevermarried females was apparent in all age categories except the youngest. Divorced females werealso underrepresented in most age categories, with the exception of 65-69 and 85-89 years.Widowed females were overrepresented in most of the age categories. Married females exhibiteda high correspondence between the realized sample and the population.
Table 8 Distribution of the realized sample and the population according to marital status andage for males and females (%)* (To be continued)
Age Never married MarriedMale Female Male Female
55-59 8.1 7.2 6.0 5.4 83.8 83.2 78.3 77.360-64 8.4 6.9 6.0 6.3 82.4 83.3 69.5 71.665-69 3.1 6.0 6.0 7.3 84.3 83.1 59.5 61.870-74 6.9 5.4 5.0 7.8 80.7 80.8 52.9 49.975-79 5.4 5.5 6.8 9.1 74.8 75.1 37.7 35.080-84 4.7 6.4 9.4 10.7 65.2 68.5 21.1 21.585-89 7.5 6.4 8.8 11.9 49.3 50.4 7.7 10.9Total 6.5 6.4 6.4 7.7 80.0 80.1 54.4 54.4
* Sample percentages are shown first, population percentages (NCBS, 1992b)second (in italic).
5 The distribution of the total male and female sample according to marital status wascorrected for the overrepresentation of the older age categories in the LSN study.
Data Collection Main Study 1992 29
Table 8 (Continued)
Age Divorced WidowedMale Female Male Female
55-59 5.0 7.5 6.4 8.4 3.1 2.1 9.3 8.960-64 5.7 6.1 6.0 6.6 3.4 3.7 18.5 15.665-69 4.2 4.8 6.0 5.5 8.4 6.2 28.5 25.370-74 4.0 3.9 3.9 4.7 8.4 9.9 38.2 37.675-79 3.4 3.2 2.9 4.1 16.3 16.2 52.6 51.780-84 2.0 2.7 2.9 3.4 28.1 22.3 66.6 64.485-89 0.4 2.0 4.6 2.9 42.9 41.1 78.9 74.4Total 4.4 5.2 5.0 5.6 9.1 8.3 34.2 32.4
Based on these figures, we can conclude that the realized sample was fairly representative of theunderlying population. This was especially true of the distribution regarding urbanization. As totheir regional distribution, respondents in the western provinces were somewhat under-represented, whereas those in the southeastern part of the Netherlands were somewhat over-represented. The distribution of the realized sample regarding marital status was particularlygood among males, and exhibited a slight underrepresentation of never married and divorcedfemales.
To enhance the national representativeness of the realized sample, we decided to weightthe sample according to region. Secondly, within each age and sex category, the sample could beweighted according to marital status. Furthermore, since the older age categories and the oldermales were both oversampled, special sample weights were calculated to compare cohort scores,corrected for the oversampling of males, and to assess overall scores for all respondents aged 55and over, correcting for the oversampling of older cohorts.
30 NESTOR living arrangements and social networks Questionnaire
Overview of the questionnaireof the face-to-face interview
The face-to-face questionnaire consisted of 36 sections6 ("i1" to "en"). It was necessary to splitthe interview into sections to allow for the interim storage of data and to facilitate proper routingthrough the interview. In this way it was possible to interrupt the interview and to skip certainsections of the interview (marked with * in the next table) on the basis of the data gatheredwithin previous sections or of the choices made by the management. Most questions asked in thequestionnaire can be subsumed under one of the following topics:
Basic demographics. Four sections of the questionnaire ("i1", "bd", "hc", "rc") gatheredbasic demographic data of the respondent and of his/her partner/spouse, if present. Among thesewere education, employment status, religious affiliation, marital and partner status, characteristicsof the current household and housing characteristics.
Family background. In the section "bp" questions were asked about the parents and theparental home.
Family composition. In three sections ("sb", "cc", "gc"), questions were asked about thenumber of siblings, children and grandchildren. The first name of these family members wasasked and used to determine characteristics of these family members (e.g. age) and of therelationship with them (e.g. frequency of contact).
Health. Subjective health, handicaps and capacities to perform activities of daily livingwere investigated in section "hr" for the respondent and in section "hp" for the partner/spouse.
Social participation and social network. Participation in educational courses, membershipsof and activities in organizations, volunteer work and other aspects of social participation werethe topics of section "sp". In sections "n1" through "n9" the respondent was asked to nominatehis or her network members; they were to be nominated by first name and first letter of the lastname only. In the following sections "nf", "nc", and "ns", characteristics of the network members(e.g. age and employment status) and characteristics of the relationships (e.g. frequency ofcontact and supportive exchanges) were collected.
Life history. Questions were asked about previous cohabitations of the older adults withtheir children and the marriages and consensual unions of the children (section "ch"). Previousrelationships with a partner/spouse were investigated in section "ph". Data on the history ofhousehold composition, of employment and of moves were collected in section "hh", "eh", and"rh", respectively.
Well-being, skills and attitudes. Items on loneliness, well-being, exchange orientation,social skills, self-evaluation, need for affiliation and attitudes toward help by family were in thesections "lo", "wb", "ec", "sk", "sr", "an", and "af".
Evaluation of the interview. The interview was closed by asking how the respondent hadexperienced the interview (section "en"). After the interview, when the interviewer was at hishome, the interviewer reported about the manner in which the interview had progressed andabout the performance of the respondent (section "$e").
The 36 sections of the interview are listed in the next table. The first column indicates thesequence in the face-to-face interview, the second column shows the abbreviation for theparticular section, the third column gives a description, and the fourth column shows the files inwhich the data were stored. The questionnaires $b, $c, $n, $r, $e and $p were answered by the
6 No questions were asked in the section with number 22.
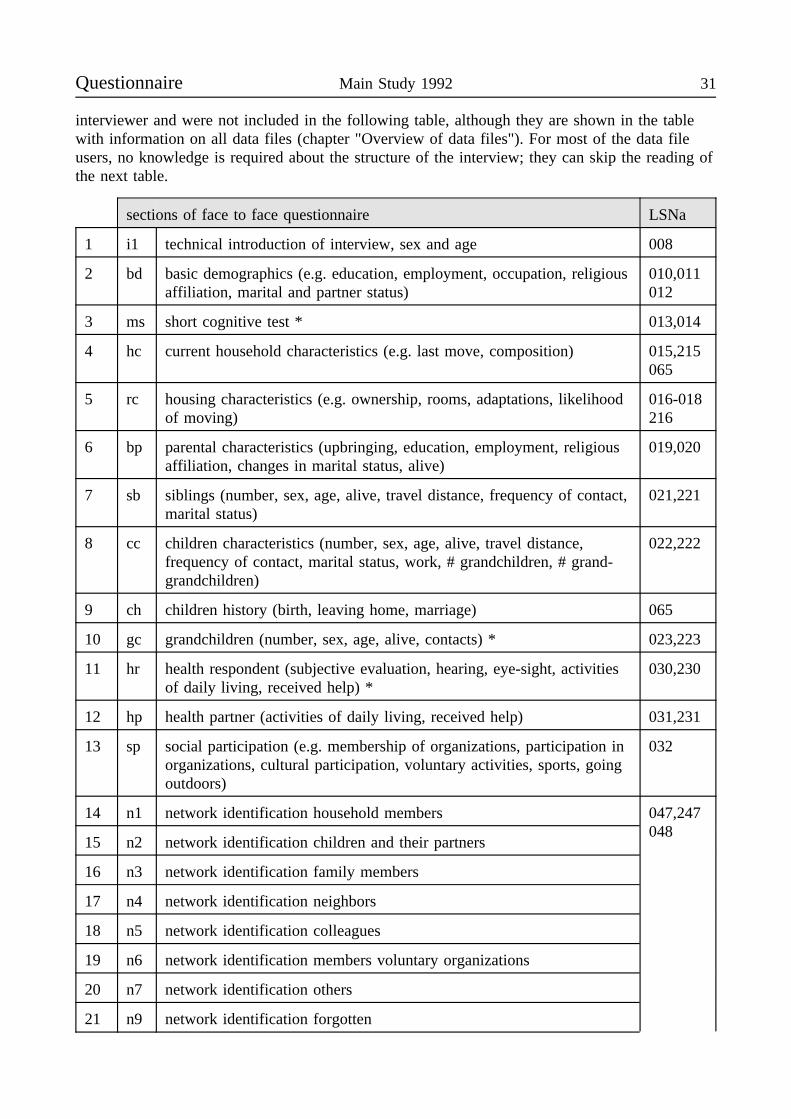
Questionnaire Main Study 1992 31
interviewer and were not included in the following table, although they are shown in the tablewith information on all data files (chapter "Overview of data files"). For most of the data fileusers, no knowledge is required about the structure of the interview; they can skip the reading ofthe next table.
sections of face to face questionnaire LSNa
1 i1 technical introduction of interview, sex and age 008
2 bd basic demographics (e.g. education, employment, occupation, religiousaffiliation, marital and partner status)
010,011012
3 ms short cognitive test * 013,014
4 hc current household characteristics (e.g. last move, composition) 015,215065
5 rc housing characteristics (e.g. ownership, rooms, adaptations, likelihoodof moving)
016-018216
6 bp parental characteristics (upbringing, education, employment, religiousaffiliation, changes in marital status, alive)
019,020
7 sb siblings (number, sex, age, alive, travel distance, frequency of contact,marital status)
021,221
8 cc children characteristics (number, sex, age, alive, travel distance,frequency of contact, marital status, work, # grandchildren, # grand-grandchildren)
022,222
9 ch children history (birth, leaving home, marriage) 065
10 gc grandchildren (number, sex, age, alive, contacts) * 023,223
11 hr health respondent (subjective evaluation, hearing, eye-sight, activitiesof daily living, received help) *
030,230
12 hp health partner (activities of daily living, received help) 031,231
13 sp social participation (e.g. membership of organizations, participation inorganizations, cultural participation, voluntary activities, sports, goingoutdoors)
032
14 n1 network identification household members 047,247048
15 n2 network identification children and their partners
16 n3 network identification family members
17 n4 network identification neighbors
18 n5 network identification colleagues
19 n6 network identification members voluntary organizations
20 n7 network identification others
21 n9 network identification forgotten
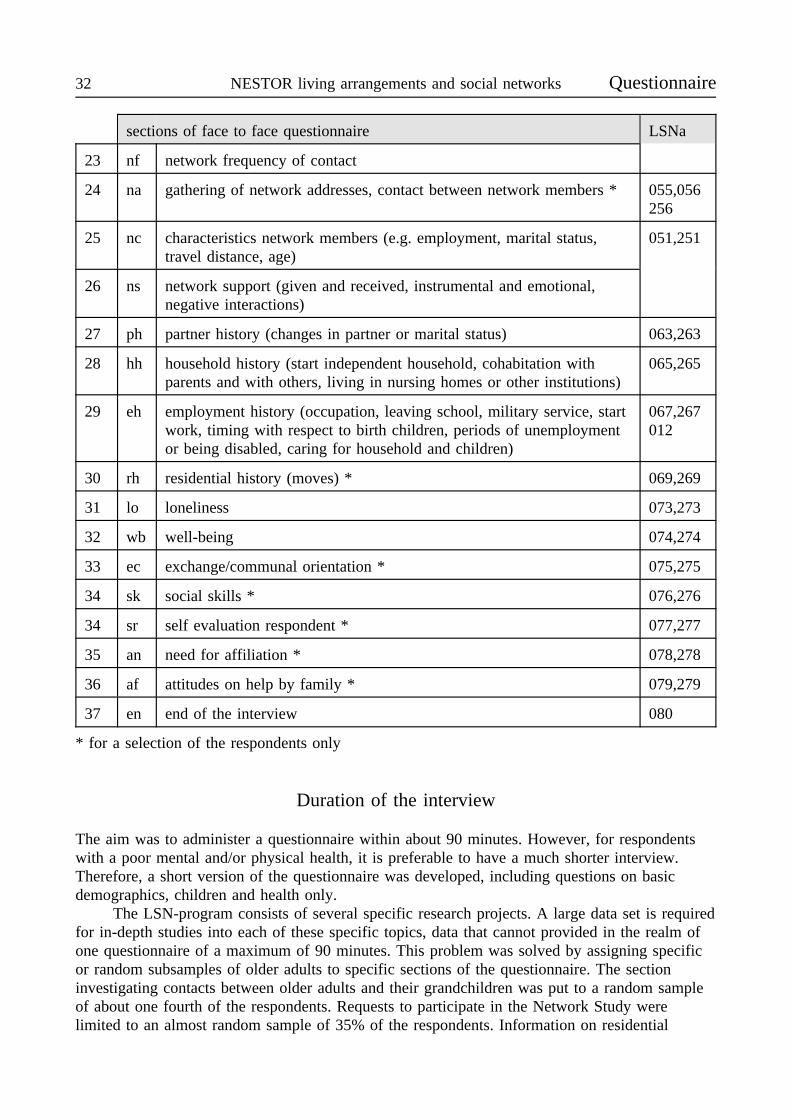
32 NESTOR living arrangements and social networks Questionnaire
sections of face to face questionnaire LSNa
23 nf network frequency of contact
24 na gathering of network addresses, contact between network members * 055,056256
25 nc characteristics network members (e.g. employment, marital status,travel distance, age)
051,251
26 ns network support (given and received, instrumental and emotional,negative interactions)
27 ph partner history (changes in partner or marital status) 063,263
28 hh household history (start independent household, cohabitation withparents and with others, living in nursing homes or other institutions)
065,265
29 eh employment history (occupation, leaving school, military service, startwork, timing with respect to birth children, periods of unemploymentor being disabled, caring for household and children)
067,267012
30 rh residential history (moves) * 069,269
31 lo loneliness 073,273
32 wb well-being 074,274
33 ec exchange/communal orientation * 075,275
34 sk social skills * 076,276
34 sr self evaluation respondent * 077,277
35 an need for affiliation * 078,278
36 af attitudes on help by family * 079,279
37 en end of the interview 080
* for a selection of the respondents only
Duration of the interview
The aim was to administer a questionnaire within about 90 minutes. However, for respondentswith a poor mental and/or physical health, it is preferable to have a much shorter interview.Therefore, a short version of the questionnaire was developed, including questions on basicdemographics, children and health only.
The LSN-program consists of several specific research projects. A large data set is requiredfor in-depth studies into each of these specific topics, data that cannot provided in the realm ofone questionnaire of a maximum of 90 minutes. This problem was solved by assigning specificor random subsamples of older adults to specific sections of the questionnaire. The sectioninvestigating contacts between older adults and their grandchildren was put to a random sampleof about one fourth of the respondents. Requests to participate in the Network Study werelimited to an almost random sample of 35% of the respondents. Information on residential
Questionnaire Main Study 1992 33
history was also restricted to a random subsample of respondents: about one fifth of therespondents were asked these questions. When 90 minutes were passed, the computer programallowed the interviewer to skip sections of the interview, starting with item 4 of the section onwell-being and continuing to the section on attitudes on help by family.
Technical equipment
The only way to collect the kind of information that was desired, was to use a computerizedquestionnaire. The questionnaire (a specification of a special programming language) needed tobe capable of interactive data collection and editing, with the possibility of immediate correctionof inconsistent answer combinations. A properly functioning computerized questionnaire takes onthe interviewer’s tasks by routing the interview conversation; the program describes theconditions under which and the order in which questions should be asked. The wording ofquestions depends on information gathered earlier in the interview. The system can handlecomplex data structures, while concealing the complexity from the user (the interviewer). Theinterviewers used computers with a 286-processor, a 20 MB harddisk and a monochrome screen.
In handling the administrative tasks and in conducting the interview, the interviewer wasassisted by a program. After starting the laptop computer a menu appeared. Choices were,among others: reporting contacts with the respondents, starting or restarting the interview, andexchanging information with the fieldwork management. In the latter exchanges, collected datawere written on a diskette and names and addresses of respondents to be interviewed were readfrom the diskette. The program was such that information exchanges could take place only afterthe interviewers had made backups of the data.
Interviews were recorded on magnetic audio tape, if permission was obtained from therespondent.
34 NESTOR living arrangements and social networks
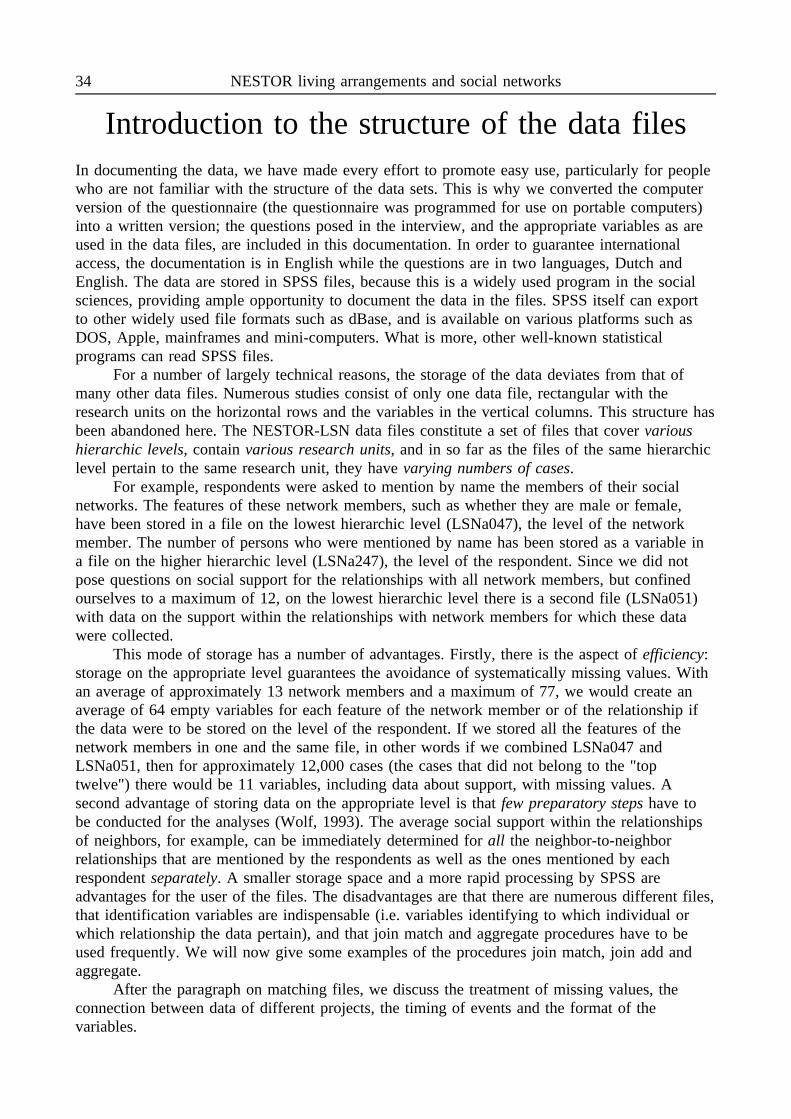
Introduction to the structure of the data filesIn documenting the data, we have made every effort to promote easy use, particularly for peoplewho are not familiar with the structure of the data sets. This is why we converted the computerversion of the questionnaire (the questionnaire was programmed for use on portable computers)into a written version; the questions posed in the interview, and the appropriate variables as areused in the data files, are included in this documentation. In order to guarantee internationalaccess, the documentation is in English while the questions are in two languages, Dutch andEnglish. The data are stored in SPSS files, because this is a widely used program in the socialsciences, providing ample opportunity to document the data in the files. SPSS itself can exportto other widely used file formats such as dBase, and is available on various platforms such asDOS, Apple, mainframes and mini-computers. What is more, other well-known statisticalprograms can read SPSS files.
For a number of largely technical reasons, the storage of the data deviates from that ofmany other data files. Numerous studies consist of only one data file, rectangular with theresearch units on the horizontal rows and the variables in the vertical columns. This structure hasbeen abandoned here. The NESTOR-LSN data files constitute a set of files that cover varioushierarchic levels, contain various research units, and in so far as the files of the same hierarchiclevel pertain to the same research unit, they have varying numbers of cases.
For example, respondents were asked to mention by name the members of their socialnetworks. The features of these network members, such as whether they are male or female,have been stored in a file on the lowest hierarchic level (LSNa047), the level of the networkmember. The number of persons who were mentioned by name has been stored as a variable ina file on the higher hierarchic level (LSNa247), the level of the respondent. Since we did notpose questions on social support for the relationships with all network members, but confinedourselves to a maximum of 12, on the lowest hierarchic level there is a second file (LSNa051)with data on the support within the relationships with network members for which these datawere collected.
This mode of storage has a number of advantages. Firstly, there is the aspect of efficiency:storage on the appropriate level guarantees the avoidance of systematically missing values. Withan average of approximately 13 network members and a maximum of 77, we would create anaverage of 64 empty variables for each feature of the network member or of the relationship ifthe data were to be stored on the level of the respondent. If we stored all the features of thenetwork members in one and the same file, in other words if we combined LSNa047 andLSNa051, then for approximately 12,000 cases (the cases that did not belong to the "toptwelve") there would be 11 variables, including data about support, with missing values. Asecond advantage of storing data on the appropriate level is that few preparatory steps have tobe conducted for the analyses (Wolf, 1993). The average social support within the relationshipsof neighbors, for example, can be immediately determined for all the neighbor-to-neighborrelationships that are mentioned by the respondents as well as the ones mentioned by eachrespondent separately. A smaller storage space and a more rapid processing by SPSS areadvantages for the user of the files. The disadvantages are that there are numerous different files,that identification variables are indispensable (i.e. variables identifying to which individual orwhich relationship the data pertain), and that join match and aggregate procedures have to beused frequently. We will now give some examples of the procedures join match, join add andaggregate.
After the paragraph on matching files, we discuss the treatment of missing values, theconnection between data of different projects, the timing of events and the format of thevariables.
Introduction Main Study 1992 35
Matching files
Using variables stored in two different files (example):*7 wants to know the average network size for each birth cohort.join match /file ’LSNa247.sys’ /keep respnr anwsize /file’LSNa010.sys’ /keep respnr bycohort /by respnr.* important: do not forget the /by respnr part of the command, otherwise the matching
will give invalid results.* all files are sorted on the identification variable (eg respnr).recode all (lo thru -1=-1).missing values all (-1).oneway /variables anwsize by bycohort (1,7) /ranges lsd (.01) /options2 6 /statistics 1.
When you want to delete cases not available in LSNa247, replace the first command line by:join match /file ’LSNa247.sys’ /keep respnr anwsize /table’LSNa010.sys’ /keep respnr bycohort /by respnr.
Hypothetical example of matching files with cases on the same hierarchical level:Suppose you want to analyse the association between age and adl (capacity to perform activitiesin daily life). In this example, we create some hypothetical data files with variables comparablewith the LSN-file with the same number.
* file ’hypo008.sys’ contains four cases with the variables aage and identifier respnr.data list fixed / respnr 1-5 aage 7-8.begin data10001 7010002 6610003 8610004 54end data.save file ’hypo008.sys’.* file ’hypo230.sys’ contains three cases with the variables aadl and identifier respnr; the
adl-score of one case (respondent) is missing; the case is deleted from the file (see below).data list fixed / respnr 1-5 aadl 7-8.begin data10001 810003 1210004 11end data.save file ’hypo230.sys’.
Let us review the results of different matching procedures.
* the matching procedure /file creates a new file with four cases; the point indicates asystem-missing.
join match /file ’hypo230.sys’ /file ’hypo008.sys’ /by respnr.list variables= all.
RESPNR AADL AAGE10001 8 7010002 . 6610003 12 8610004 11 54
* the matching procedure without the part /by respnr gives the wrong match.
7 Comments in SPSS-PC input are preceeded by an asterisk and ended by a point. In thischapter, the names of (auxiliary) variables are in bold.

36 NESTOR living arrangements and social networks Introduction
join match /file ’hypo230.sys’ /file ’hypo008.sys’.list variables= all.
RESPNR AADL AAGE10001 8 7010003 12 6610004 11 8610004 . 54
* the matching procedure /table gives a new file with three cases.join match /file ’hypo230.sys’ /table ’hypo008.sys’ /by respnr.list variables= all.
RESPNR AADL AAGE10001 8 7010003 12 8610004 11 54
Hypothetical example of matching files with cases on different hierarchical levels:Suppose you want to analyse the association between the frequency of contact within therelationships with the network members on the one hand and (the difference between) the age ofthe network members and the age of the respondent on the other hand.
* file ’hypo047.sys’ contains six cases (network members) with the variables anwfreq(frequency of contact) and identifier anwmem; these six cases belong to three respondents(10001, 10002 and 10003), or in other words, are nested within three cases on a higherhierarchical level.
data list fixed / anwmem 1-7 anwfreq 9.begin data1000101 81000102 41000103 71000201 71000202 51000301 6end data.save file ’hypo047.sys’.
* file ’hypo051.sys’ contains six cases (network members) with the variable anwage (age ofthe network member) and identifier anwmem.
data list fixed / anwmem 1-7 anwage 9-10.begin data1000101 651000102 781000103 421000201 301000202 671000301 56end data.save file ’hypo051.sys’.join match /file ’hypo047.sys’ /file ’hypo051.sys’ /by anwmem.* create a variable with identifier respnr.compute respnr= trunc(anwmem/100).format respnr (f5).save file ’temp.sys’.
Introduction Main Study 1992 37
* file ’hypo008.sys’ contains four cases with the variables aage and identifier respnr.data list fixed / respnr 1-5 aage 7-8.begin data10001 7010002 6610003 8610004 54end data.save file ’hypo008.sys’.
Let us review the results of different matching procedures.* the matching procedure /file gives a new file with seven cases; the point indicates a
system missing (see below).join match /file ’temp.sys’ /file ’hypo008.sys’ /by respnr.* a warning is displayed by SPSS: for at least one respondent (may be more respondents) the
created file contains more cases.WARNING 1037Duplicate key encountered.Key values:
10001* note that this matching will not give satisfying results8; the match of data from the lower
hierarchical level (relationships) with data from the higher hierarchical level (respondents)is made only between the data on the respondent level and the first network member ofthat respondent in the file ’temp.sys’.
list variables= all.
ANWMEM ANWFREQ ANWAGE RESPNR AAGE1000101 8 65 10001 701000102 4 78 10001 .1000103 7 42 10001 .1000201 7 30 10002 661000202 5 67 10002 .1000301 6 56 10003 86
. . . 10004 54
* the matching procedure /table creates a new file with six cases.join match /file ’temp.sys’ /table ’hypo008.sys’ /by respnr.
WARNING 1037
8 However, there are analyses where you need only one case from the file ’hypo047.sys’ foreach respondent. In that case you may use this procedure. For example, when you want to knowthe intensity of the support exchanges within the relationship with the highest frequency ofcontact, you give the next commands:
get file ’LSNa047.sys’.select if (anwfreq>-1).compute respnr= trunc (anwmem/100).formats respnr (f5).compute random= uniform(100).modify variables /keep anwmem respnr anwfreq random.sort by respnr (a), anwfreq (d), random.* note: for ties, one relationship is chosen randomly.save file ’temp.sys’.join match /file ’temp.sys’ /keep anwmem respnr anwfreq /file
’LSNa247.sys’ /by respnr.select if (not missing (anwfreq) and not missing (anwsize)).save file ’temp.sys’.join match /file ’temp.sys’ /keep anwmem anwfreq /table ’LSNa051.sys’
/by anwmem.
38 NESTOR living arrangements and social networks Introduction
Duplicate key encountered.Key values:
10001
list variables= all.
ANWMEM ANWFREQ ANWAGE RESPNR AAGE1000101 8 65 10001 701000102 4 78 10001 701000103 7 42 10001 701000201 7 30 10002 661000202 5 67 10002 661000301 6 56 10003 86
* note that by this way of matching (’disaggregate’) statistical dependence is introducedbecause different cases on the relationship level contain data from one source (therespondent).
Aggregating from files with variables on relationship level (example):get file ’LSNa047.sys’.recode all (lo thru -1=-1).missing values all (-1).* creating identification variable on respondent level.compute respnr= trunc(anwmem/100).* wants to create a variable on the respondent level with the number of relationships with
more than weekly contact.recode anwfreq (1 thru 6=0) (7,8=1).modify variables /keep respnr anwfreq.sort by respnr.aggregate /outfile= ’temp.sys’ /presorted /break respnr/freqctcs ’# weekly contacts’ = sum (anwfreq).
* the procedure aggregate produces only cases on the respondent level for those who havenetwork members; respondents with a network size of 0 are not in the aggregatedtemporary file.
join match /file ’LSNa247.sys’ /file ’temp.sys’ /by respnr.* if network size equals 0, then the number of relationships with more than weekly contact
equals 0.if (anwsize=0)freqctcs=0.format freqctcs (f2).
There are two reasons why different files of same research units have different numbers ofcases. One was mentioned above, namely that particular questions were posed for a selection ofthe research units only. The second reason pertains to the distinction between the original dataand the processed versions. Scale scores on the item lists are included as variables in variousseparate files (for example the loneliness items in LSNa073 and the loneliness score inLSNa273). In computing the scale scores, respondents with too many missing values on the itemscores were removed from the relevant file.
Missing values
Some attention should be devoted to the treatment of missing values. SPSS has two types ofmissing values, system missings and missings defined by the user. System missings can emergein a wide range of cases, for example if cases are joined to each other via the join matchprocedure and a case is missing in one of the files. The variables from the other file are thengiven a system missing for the missing cases in that file. No specific attention has to be given tothis (the file LSNa001 documents why cases on the respondent level are missing).
Introduction Main Study 1992 39
Attention should however be given to the missing values defined by the user. SPSSPConly allows for one missing value for each variable, although some other SPSS-versions allowfor more missing values for each variable. Storing the data required more missing values. Attimes there are numerous reasons for the absence of a valid value. The missings of variableshave consequently not been declared as such. However, they can always be recognized by thelabel and they always have a negative value (for example -1 for no response or -2 for a questionthat was not posed); none of the valid values are negative (however, in some cases one candoubt which values are valid; see below). If you are not interested in the distinctions betweenthe various reasons why the valid values are missing, add the following command to assign userdefined missing values when you retrieve a file:Treatment of missing values:
recode all (lo thru -1=-1).missing values all (-1).
If you then create new variables on the basis of original variables, a system missing will beassigned to all the cases for which one or more of the original variables have a user missing or asystem missing. For the rest, you should bear in mind that a negative value always indicates amissing value for the particular variable, but nonetheless often contains interesting information.For example, the variable on the number of grandchildren (angcnum, stored in LSNa223) isattributed with a missing value -2 if there are no children. If respondents have no children, noquestions were asked about how many grandchildren they have. In order to properly calculatethe number of grandchildren, you should first decide what to do with the -2 values before youadopt the recoding procedure that was proposed earlier.
Multiple response questions
The questionnaire includes various multiple response questions or series of questions whosepurpose it is to gather in a responsible manner some single item of information. For a number ofthese questions or series of questions, various responses have been combined into one variable.One example is the composition of the household. The original data can be reconstructed asfollows:Computing several variables from one multiple response variable (example):get file ’LSNa216.sys’.* answers on several questions about household composition were combined into one variable
(alivarr), the following commands will recreate the original variables.compute alivarr1 = trunc(alivarr/1000).compute alivarr2 = trunc(alivarr/100) -trunc(alivarr/1000)*10.compute alivarr3 = trunc(alivarr/10) -trunc(alivarr/100)*10.compute alivarr4 = trunc(alivarr) -trunc(alivarr/10)*10.format alivarr1 to alivarr4 (f1).variable labelsalivarr1 ’private or institutional household’alivarr2 ’partner in household’alivarr3 ’# children in household’alivarr4 ’# others in household’.
value labelsalivarr1 1’private household’2’nursing home’
3’old peoples home’4’hospital’5’psychiatric hospital’7’home for homeless’8’monastery’/
alivarr2 0’no partner in hh’1’partner in household’/alivarr3 0’no childr in hh’1’1 child in hh’6’6 childr in hh’/alivarr4 0’no others in hh’1’1 other in hh’6’6 others in hh’.
40 NESTOR living arrangements and social networks Introduction
Connecting data of different projects
All the data, including the data from administrative procedures and sub-studies, are recognizableas either NESTOR-LSN Main Study data, NESTOR-LSN substudy data or as data from theLongitudinal Aging Study Amsterdam (LASA). An effort has been made to store the data insuch a way that it is simple to join the LASA data and the NESTOR-LSN data. All thevariables, except unchangeable items such as sex, date of birth or respondent number, arepreceded by a letter. For example, the network size (abbreviated as nwsize) at T1 is the variableanwsize, and the variable bnwsize is the network size at T2. The prefix "a" stands for the firstobservation (NESTOR-LSN) and corresponds with the file names (the "a" in LSNa247). Thevariable bnwsize is stored in LASAb247. The prefix "b" in the variable stands for the secondobservation (LASA) and corresponds with the file names (the "b" in LASAb247). If we want tosee whether the average network size in the NESTOR-LSN survey differs from the one in thesecond observation (the first LASA survey), we carry out the following commands:Comparing data measured on different points in time (example):
* network size at baseline (LSN) and at LASA follow up.join match /file ’LSNa247.sys’ /file ’LASAb247.sys’ /by respnr.recode all (lo thru -1=-1).missing values all (-1).t-test /pairs anwsize bnwsize.
Or comparing data on the capacity to perform activities in daily life at the baseline (LSN) andat T1 of the LSN Network Study:
get file ’LSNg230.sys’.select if (anwmem - trunc(anwmem/100)*100 = 0).compute respnr= trunc(anwmem/100).format respnr (f5).save file ’temp.sys’ /keep respnr gadl.join match /file ’temp.sys’ /table ’LSNa230.sys’ /by respnr.recode all (lo thru -1=-1).missing values all (-1).t-test /pairs aadl gadl.
The LSN data files and the Tuscany data files can also be simply joined. Common variables areconstructed in the same manner. Respondent numbers in the LSN data are between 11003 and34474 (format f5); respondent numbers in the Tuscany data are between 110002 and 279289(format f6). One should bear in mind that the composition of the two samples is not exactly thesame (caused by different stratification and different non-response), so that weighting of thecases is required.Comparing the Dutch and the Tuscany data (example):
join match /file ’LSNa247.sys’ /file ’LSNa009.sys’ /keep respnralsnpisa /by respnr.compute country=1.save file ’temp1.sys’.join match /file ’Pisa247.sys’ /file ’Pisa009.sys’ /keep respnralsnpisa /by respnr.compute country=2.save file ’temp2.sys’.join add /file ’temp1.sys’ /file ’temp2.sys’.format country (f1).variable label country ’Netherlands-Tuscany’.value label country 1 ’Netherlands’ 2 ’Tuscany’.weight by alsnpisa.recode all (lo thru -1=-1).missing values all (-1).t-test /groups= country (1,2) /variables= anwsize.
Introduction Main Study 1992 41
Another way to compare the LSN and Pisa data is to include variables in the analysis whichwere used to construct the samples.
join add /file ’LSNa247.sys’ /file ’Pisa247.sys’.save file ’temp.sys’.join match /file ’temp.sys’ /file ’LSNa008.sys’ /keep respnr sexbycohort /file ’Pisa008.sys’ /keep respnr sex bycohort /file’LSNa216.sys’ /keep respnr alivarr /file ’Pisa216.sys’ /keep respnralivarr /by respnr.select if (not missing (anwsize)).* independent living only.select if (alivarr<2000).compute country= trunc(respnr/100000).recode country (0=1)(1,2=2).format country (f1).value label country 1’Netherlands’ 2’Tuscany’.variable label country ’1 Netherlands, 2 Tuscany’.anova /variable anwsize by sex (1,2) bycohort (1,7) country (1,2)/option 4 /statistics 1 2.
Timing of events
For methodological reasons, questions in the interview always enquired into the year, andsometimes the month, of experienced events rather than the age of the respondent at the time ofthe event. Since most analyses focus on the timing of the event related to the respondent’s age,the years have been converted into the ages of the respondents in the data files. If the question isonly about the year, the date of the event is fixed at July 1 of that year, and if only the monthand year are asked, the date is fixed at the 15th of that month. Next, the difference is calculatedbetween the date of the event and the date of birth of the respondent. As an example, we giveour treatment of the original data about the timing of the end of the employment of therespondent. We computed the age at which the employment of R ended by executing thefollowing commands for each case in dBase:
if aempleny<0mage=aempleny && in case of a missing value for end employment
elsemage=aempleny-birthyear+(ctod("1/7/92")-;ctod(str(birthday,2)+"/"+str(birthmonth,2)+"/92"))/365.25do case
case mage>mageR && age of end employment > age of Rmage=ageRcase mage<12 && out of rangemage=-1
endcaseendifreplace aemplen with mage
Or in SPSSPC:compute byear= trunc(bdate/10000).compute bmonth= trunc(bdate/100)-trunc(bdate/10000)*100.compute bday= bdate-trunc(bdate/100)*100.compute xyear= trunc(aempleny/10000).compute xmonth= trunc(aempleny/100)-trunc(aempleny/10000)*100.compute xday= aempleny-trunc(aempleny/100)*100.if (aempleny>0)aemplen= (yrmoda(xyear,xmonth,xday) -yrmoda(byear,bmonth,bday))/(365.25).if (aemplen>=0 & aemplen<12)aemplen=-1.format aemplen (f5.2).
42 NESTOR living arrangements and social networks Introduction
Converting historical data to years (example):If you are interested in the actual date of a specific event, you can calculate it on the basis ofthe respondent’s date of birth. When you have a version of SPSS with the appropriate datefunctions, you have to execute the following commands:
compute byear=trunc(bdate/10000)+1900.compute bmonth=trunc(bdate/100)-(trunc(bdate/10000)*100).compute bday=bdate-(trunc(bdate/100)*100).compute birth=date.dmy(bday,bmonth,byear).compute jobdays=trunc(86400+365.25*aemplen).if (aemplen>0)aempleny=xdate.year(birth+jobdays).if (aemplen>0)aemplenm=xdate.month(birth+jobdays).if (aemplen>0)aemplend=xdate.mday(birth+jobdays).
Or without date functions:if (aemplen>0) aempleny= aemplen + 1900 + trunc(bdate/10000) +(trunc(bdate/100)-trunc(bdate/10000)*100)/12 +(bdate-trunc(bdate/100)*100)/(365.25).format aempleny (f7.2).
Converting historical data to number of years passed since event (example):When you want to know how many years ago the respondent left the labor force, execute thefollowing commands:
join match /file ’LSNa010.sys’ /keep respnr aemplen /file’LSNa008.sys’ /keep respnr aage /by respnr.compute leftlabf = aage - aemplen.if (aemplen<0) leftlabf = aemplen.variable label leftlabf ’# years passed since R left labor force’.value label
leftlabf -4’now employed’-3’never had job’-1’no answer’.format leftlabf (f5.2).
Format of variables
The data are stored in a format that is not only informative, but also practical for extracting listsof data or transcribing to a dBase format or to an unprocessed data file. Integer variables have aformat (fx.0) whereby x fits the range of the variable (due to the missing values, x is often >1).Age (with some exceptions) and so forth have the format (f5.2) with precision to two decimals.
Main Study 1992 43
Overview of data filesThe NESTOR-LSNa files in the 001 to 099 series are original data, 201 to 299 are processeddata such as typologies or scales, and 401 to 499 are technical data on the interview, such as theduration of parts of the various sections of the interview (e.g. one item or a number ofquestions). The data in this last series are not comprehensible without thorough knowledge ofthe programming of the interview, and are thus not dealt with here. There are different versionsof (approximately) the same data files: LSNa???.exp are SPSSPC-export (portable) files,LSNa???.sys are SPSSPC-system files, and LSNa???.dbf are dBase III+ files. The dBase-filescontain alphanumeric data like answers in the category "other (please specify)", answers on openquestions and personal names; some of these files may not used by others. To save disk space,all PC-files are stored as self-extracting compressed files using PKZIP version 2.04g, e.g.LSNa???s.exe are the compressed SPSSPC-system files. For extracting these files, type the nameof the file after the command-prompt, e.g. from diskette to harddisk, directory sysfiles:
c:\> cd\sysfilesc:\sysfiles> a:lsna010s
To extract a number of files, execute the next commands:c:\> cd\sysfilesc:\sysfiles> copy a:lsna???s.exec:\sysfiles> dir lsna???s.exe /b >unzip.batc:\sysfiles> unzipc:\sysfiles> del lsna???s.exec:\sysfiles> del unzip.bat
The following table presents a survey of the data files, with the sequence number of theinterview section in the first column, the source of the data in the second column, a shortdescription of the contents in the third column, the identification variable in the fourth column,the number of cases in the fifth column, and the questionnaire that the data are from in the sixthcolumn.
The data are from the following sources: the respondent in the face-to-face interview (R),the proxy of the person in the sample (P), the interviewer (I), the municipality (M) and thesystem (S), such as the computer system, administrative data or computations on original data.
The most important identifier of the cases in the files is the variable RESPNR, whichconsists of five figures, the first two of which are referring to the number of the municipalityfrom the variable aplace in the files LSNa002 and LSNa008 (it was necessary to use more thanone place identifier for the cases in several municipalities; e.g. respondent numbers starting with11 through 14 are citizens of Amsterdam, with a value of 10 on variable aplace). The last threefigures of the variable RESPNR are sequence numbers without any meaning (respondents wererandomly selected from the stock). Other identifiers are ADEMID for all the persons who arereferred to by the respondent in the demographic section of the interview (the first five figuresare the respondent number, followed by a unique random serial number), ANWMEM for thenetwork members (the first five figures are the respondent number, followed by a unique numberin the sequence in which the network members were referred to), ANWPAIR for pairs ofnetwork members (the first five figures are the respondent number, followed by a unique numbergiven twice in the sequence in which the network members were referred to) and AITERNR forthe number of the interviewer.
The following four questionnaires were used: a computer-programmed questionnaire for theface-to-face interview, answered by the respondent or by the interviewer (F, followed by anabbreviation of that part of the questionnaire), a written questionnaire (W), answered by the
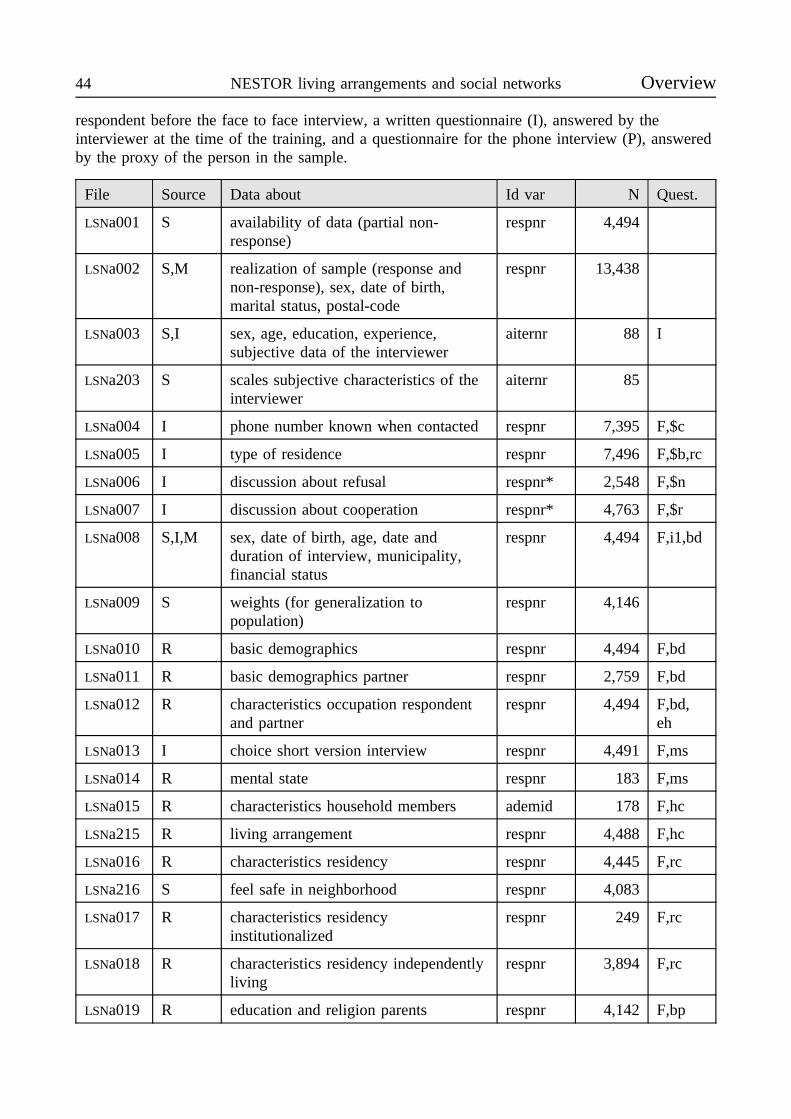
44 NESTOR living arrangements and social networks Overview
respondent before the face to face interview, a written questionnaire (I), answered by theinterviewer at the time of the training, and a questionnaire for the phone interview (P), answeredby the proxy of the person in the sample.
File Source Data about Id var N Quest.
LSNa001 S availability of data (partial non-response)
respnr 4,494
LSNa002 S,M realization of sample (response andnon-response), sex, date of birth,marital status, postal-code
respnr 13,438
LSNa003 S,I sex, age, education, experience,subjective data of the interviewer
aiternr 88 I
LSNa203 S scales subjective characteristics of theinterviewer
aiternr 85
LSNa004 I phone number known when contacted respnr 7,395 F,$c
LSNa005 I type of residence respnr 7,496 F,$b,rc
LSNa006 I discussion about refusal respnr* 2,548 F,$n
LSNa007 I discussion about cooperation respnr* 4,763 F,$r
LSNa008 S,I,M sex, date of birth, age, date andduration of interview, municipality,financial status
respnr 4,494 F,i1,bd
LSNa009 S weights (for generalization topopulation)
respnr 4,146
LSNa010 R basic demographics respnr 4,494 F,bd
LSNa011 R basic demographics partner respnr 2,759 F,bd
LSNa012 R characteristics occupation respondentand partner
respnr 4,494 F,bd,eh
LSNa013 I choice short version interview respnr 4,491 F,ms
LSNa014 R mental state respnr 183 F,ms
LSNa015 R characteristics household members ademid 178 F,hc
LSNa215 R living arrangement respnr 4,488 F,hc
LSNa016 R characteristics residency respnr 4,445 F,rc
LSNa216 S feel safe in neighborhood respnr 4,083
LSNa017 R characteristics residencyinstitutionalized
respnr 249 F,rc
LSNa018 R characteristics residency independentlyliving
respnr 3,894 F,rc
LSNa019 R education and religion parents respnr 4,142 F,bp

Overview Main Study 1992 45
File Source Data about Id var N Quest.
LSNa020 R parental background respnr 4,142 F,bp
LSNa021 R characteristics siblings ademid 11,486 F,sb
LSNa221 R,S # siblings respnr 4,139 F,sb
LSNa022 R characteristics children ademid 12,501 F,cc
LSNa222 R,S # children respnr 4,482 F,cc
LSNa023 R characteristics grandchildren ademid 6,237 F,gc
LSNa223 R # (great) grandchildren respnr 4,137
LSNa030 R subjective health, visus, hearing, ADL,IADL
respnr 4,477 F,hr
LSNa230 S scales visus, ADL, IADL respnr 4,477
LSNa031 R ADL of partner respnr 2,495 F,hp
LSNa231 S scale ADL of partner respnr 2,492
LSNa032 R social participation respnr 4,125 F,sp
LSNa232 S scale scores social participation respnr 4,125
LSNa047 R sex network member, type relationshipand frequency contact
anwmem 54,501 F,ni,nf
LSNa247 R network size respnr 4,059
LSNa048 S match network members and familymembers
anwmemademid
54,501 F,ni
LSNa051 R relationship characteristics and support anwmem 37,248 F,nc,ns
LSNa251 S sum of support within relationshipsother than with partner/spouse
respnr 4,041
LSNa055 R cooperation network-study respnr 1,547 F,na
LSNa056 R contact between network members anwpair 32,238 F,na
LSNa256 S density contact respnr 699
LSNa063 R partner history respnr* 4,343 F,ph
LSNa263 S # marriages/cohabitations, partnerhistory
respnr 4,084
LSNa065 R household history respnr*ademid
27,499 F,hhchhc,ph
LSNa265 R quality household history data respnr 4,092
LSNa067 R employment history respnr* 2,877 F,eh
LSNa267 R,S employment history, income respnr 4,082
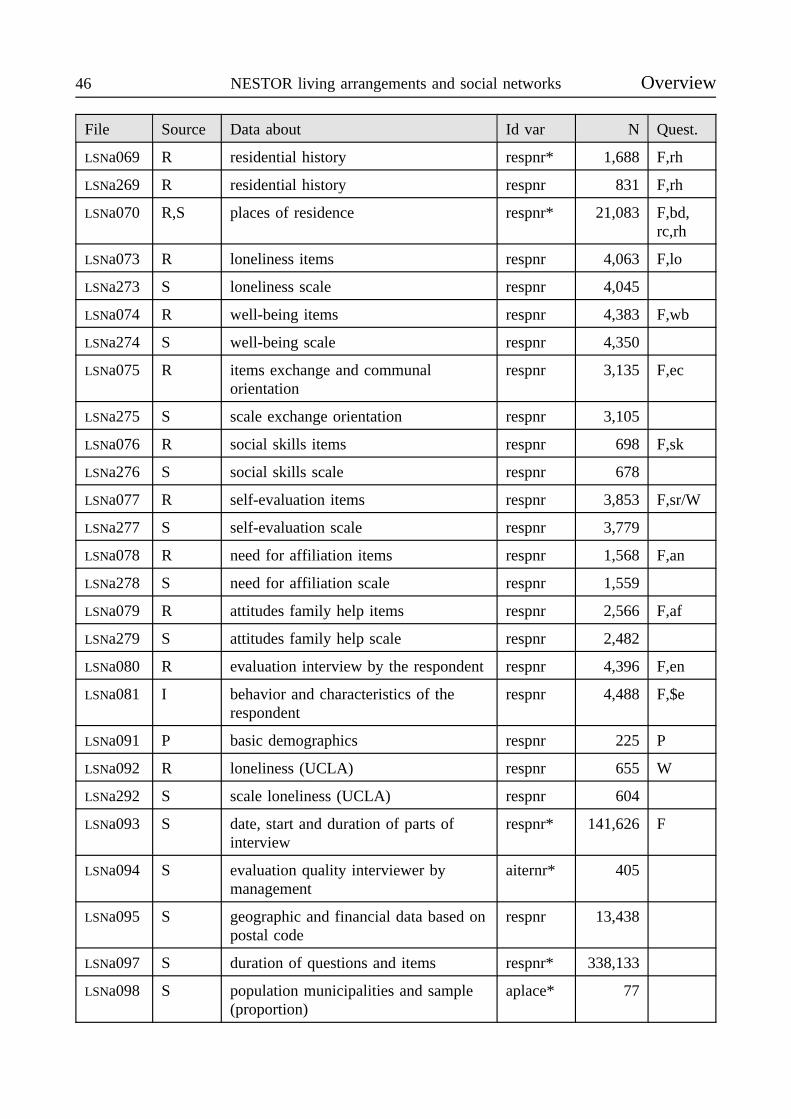
46 NESTOR living arrangements and social networks Overview
File Source Data about Id var N Quest.
LSNa069 R residential history respnr* 1,688 F,rh
LSNa269 R residential history respnr 831 F,rh
LSNa070 R,S places of residence respnr* 21,083 F,bd,rc,rh
LSNa073 R loneliness items respnr 4,063 F,lo
LSNa273 S loneliness scale respnr 4,045
LSNa074 R well-being items respnr 4,383 F,wb
LSNa274 S well-being scale respnr 4,350
LSNa075 R items exchange and communalorientation
respnr 3,135 F,ec
LSNa275 S scale exchange orientation respnr 3,105
LSNa076 R social skills items respnr 698 F,sk
LSNa276 S social skills scale respnr 678
LSNa077 R self-evaluation items respnr 3,853 F,sr/W
LSNa277 S self-evaluation scale respnr 3,779
LSNa078 R need for affiliation items respnr 1,568 F,an
LSNa278 S need for affiliation scale respnr 1,559
LSNa079 R attitudes family help items respnr 2,566 F,af
LSNa279 S attitudes family help scale respnr 2,482
LSNa080 R evaluation interview by the respondent respnr 4,396 F,en
LSNa081 I behavior and characteristics of therespondent
respnr 4,488 F,$e
LSNa091 P basic demographics respnr 225 P
LSNa092 R loneliness (UCLA) respnr 655 W
LSNa292 S scale loneliness (UCLA) respnr 604
LSNa093 S date, start and duration of parts ofinterview
respnr* 141,626 F
LSNa094 S evaluation quality interviewer bymanagement
aiternr* 405
LSNa095 S geographic and financial data based onpostal code
respnr 13,438
LSNa097 S duration of questions and items respnr* 338,133
LSNa098 S population municipalities and sample(proportion)
aplace* 77

Overview Main Study 1992 47
* Multiple records for one respondent/interviewer/municipality may exist.
In the following part of the documentation (LSNa001 through LSNa098), it is indicated for eachof these files which variables are available (with a number of descriptive characteristics), whichquestions were posed to gather the data, and how the original data was processed. In addition tothis documentation, you may list the information about the variables in the SPSS-files. Anexample (to execute in SPSSPC):
sysfile info ’LSNa010.sys’.Or:
get file ’LSNa010.sys’.display all.
The dBase files are listed in the next table (files containing personal names are excluded). Thealphanumeric information is stored in the database field ’text’. The values of the field ’var’ linkto the variables in the SPSS-files. If there are more records with information on a variable, thefield ’line’ contains a sequence number. If necessary, the field ’mod’ gives the original sectionof the interview (’i1’ to ’en’, and $b, $t, $e, etcetera). The respondent or case identification isstored in the field ’respnr’ (available in all files) and in other fields like ’ademid’. For mostdatabases, the information is coded and combined with the numeric information in the SPSSfiles.
File N records Fields other than respnr (n) Variables (values of field ’var’)
LSNa001 478 mod (a), var (a), line (n),text (a)
alast
LSNa005 730 var (a), text (a) ahouse
LSNa008 268 mod (a), var (a), line (n),text (a)
aidate
LSNa010 62 var (a), text (a) aethnic, anation, asepar
LSNa012 14,948 mod (a), var (a), text (a) a65, afa, ap6, apc, apl, ar1, arc, arl
LSNa013 618 var (a), line (n), text (a) ashort_r
LSNa018 464 var (a), text (a) amo_typh, amo_typi, ares_typ
LSNa020 3,227 var (a), line (n), text (a) aevent_i, aevent_t
LSNa032 50 var (a), text (a) anoact
LSNa065 4,146 var (a), line (n), text (a) (various)
LSNa069 533 amovenr (n), var (a), text (a) amo_loc, amo_rea
LSNa073 2,480 var (a), line (n), text (a) alodelay, aloexpl
LSNa080 11,760 var (a), line (n), text (a) acontact, ageneval, asuggest
LSNa081 12,715 mod (a), var (a), line (n),text (a)
acoopnex, ahandic, aproblem,atoolong
LSNa215 29 var (a), text (a) alivarr
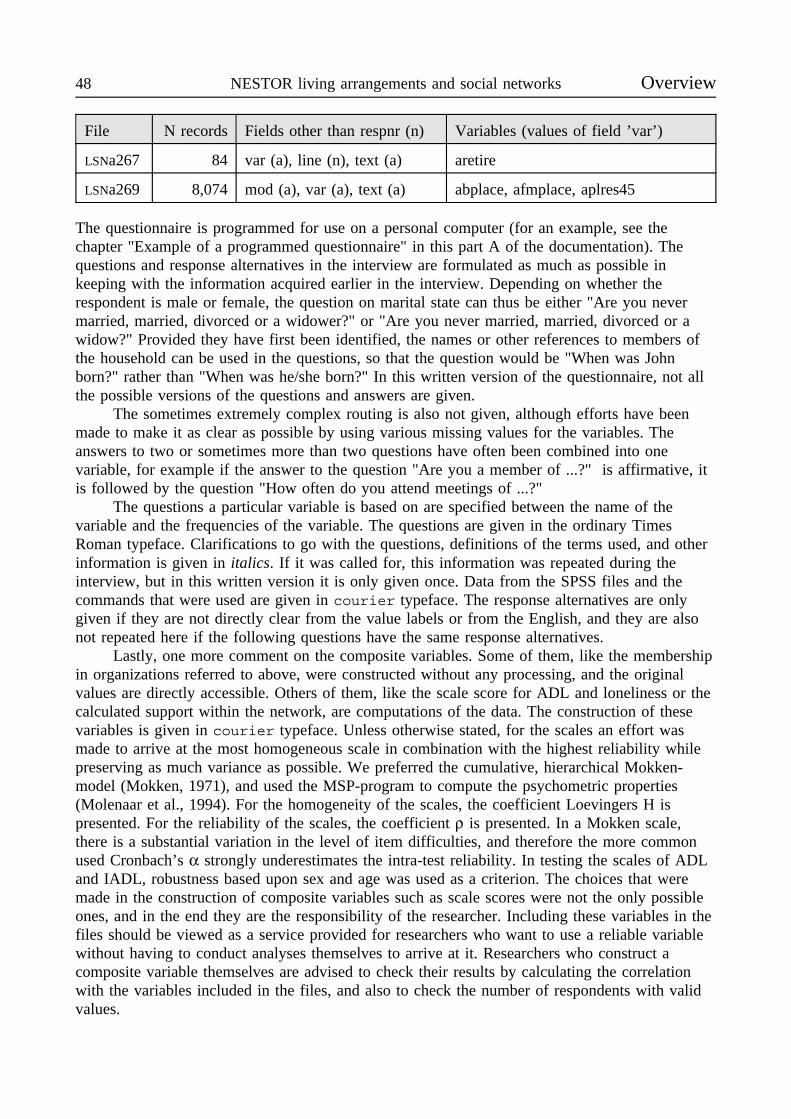
48 NESTOR living arrangements and social networks Overview
File N records Fields other than respnr (n) Variables (values of field ’var’)
LSNa267 84 var (a), line (n), text (a) aretire
LSNa269 8,074 mod (a), var (a), text (a) abplace, afmplace, aplres45
The questionnaire is programmed for use on a personal computer (for an example, see thechapter "Example of a programmed questionnaire" in this part A of the documentation). Thequestions and response alternatives in the interview are formulated as much as possible inkeeping with the information acquired earlier in the interview. Depending on whether therespondent is male or female, the question on marital state can thus be either "Are you nevermarried, married, divorced or a widower?" or "Are you never married, married, divorced or awidow?" Provided they have first been identified, the names or other references to members ofthe household can be used in the questions, so that the question would be "When was Johnborn?" rather than "When was he/she born?" In this written version of the questionnaire, not allthe possible versions of the questions and answers are given.
The sometimes extremely complex routing is also not given, although efforts have beenmade to make it as clear as possible by using various missing values for the variables. Theanswers to two or sometimes more than two questions have often been combined into onevariable, for example if the answer to the question "Are you a member of ...?" is affirmative, itis followed by the question "How often do you attend meetings of ...?"
The questions a particular variable is based on are specified between the name of thevariable and the frequencies of the variable. The questions are given in the ordinary TimesRoman typeface. Clarifications to go with the questions, definitions of the terms used, and otherinformation is given in italics. If it was called for, this information was repeated during theinterview, but in this written version it is only given once. Data from the SPSS files and thecommands that were used are given in courier typeface. The response alternatives are onlygiven if they are not directly clear from the value labels or from the English, and they are alsonot repeated here if the following questions have the same response alternatives.
Lastly, one more comment on the composite variables. Some of them, like the membershipin organizations referred to above, were constructed without any processing, and the originalvalues are directly accessible. Others of them, like the scale score for ADL and loneliness or thecalculated support within the network, are computations of the data. The construction of thesevariables is given in courier typeface. Unless otherwise stated, for the scales an effort wasmade to arrive at the most homogeneous scale in combination with the highest reliability whilepreserving as much variance as possible. We preferred the cumulative, hierarchical Mokken-model (Mokken, 1971), and used the MSP-program to compute the psychometric properties(Molenaar et al., 1994). For the homogeneity of the scales, the coefficient Loevingers H ispresented. For the reliability of the scales, the coefficient ρ is presented. In a Mokken scale,there is a substantial variation in the level of item difficulties, and therefore the more commonused Cronbach’s α strongly underestimates the intra-test reliability. In testing the scales of ADLand IADL, robustness based upon sex and age was used as a criterion. The choices that weremade in the construction of composite variables such as scale scores were not the only possibleones, and in the end they are the responsibility of the researcher. Including these variables in thefiles should be viewed as a service provided for researchers who want to use a reliable variablewithout having to conduct analyses themselves to arrive at it. Researchers who construct acomposite variable themselves are advised to check their results by calculating the correlationwith the variables included in the files, and also to check the number of respondents with validvalues.
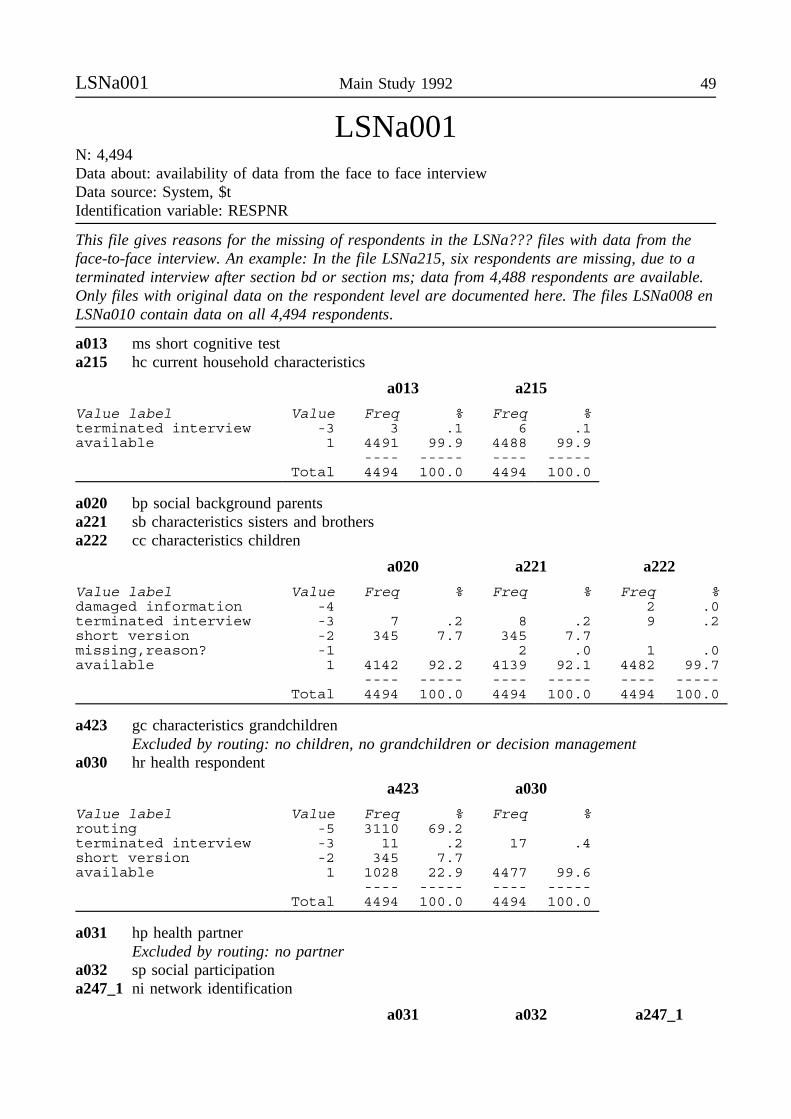
LSNa001 Main Study 1992 49
LSNa001N: 4,494Data about: availability of data from the face to face interviewData source: System, $tIdentification variable: RESPNR
This file gives reasons for the missing of respondents in the LSNa??? files with data from theface-to-face interview. An example: In the file LSNa215, six respondents are missing, due to aterminated interview after section bd or section ms; data from 4,488 respondents are available.Only files with original data on the respondent level are documented here. The files LSNa008 enLSNa010 contain data on all 4,494 respondents.
a013 ms short cognitive testa215 hc current household characteristics
a013 a215
Value label Value Freq % Freq %terminated interview -3 3 .1 6 .1available 1 4491 99.9 4488 99.9
---- ----- ---- -----Total 4494 100.0 4494 100.0
a020 bp social background parentsa221 sb characteristics sisters and brothersa222 cc characteristics children
a020 a221 a222
Value label Value Freq % Freq % Freq %damaged information -4 2 .0terminated interview -3 7 .2 8 .2 9 .2short version -2 345 7.7 345 7.7missing,reason? -1 2 .0 1 .0available 1 4142 92.2 4139 92.1 4482 99.7
---- ----- ---- ----- ---- -----Total 4494 100.0 4494 100.0 4494 100.0
a423 gc characteristics grandchildrenExcluded by routing: no children, no grandchildren or decision management
a030 hr health respondent
a423 a030
Value label Value Freq % Freq %routing -5 3110 69.2terminated interview -3 11 .2 17 .4short version -2 345 7.7available 1 1028 22.9 4477 99.6
---- ----- ---- -----Total 4494 100.0 4494 100.0
a031 hp health partnerExcluded by routing: no partner
a032 sp social participationa247_1 ni network identification
a031 a032 a247_1

50 NESTOR living arrangements and social networks LSNa001
Value label Value Freq % Freq % Freq %refusal/skip by I -8 33 .7routing -5 1634 36.4damaged information -4 20 .4terminated interview -3 17 .4 24 .5 37 .8short version -2 345 7.7 345 7.7 345 7.7missing,reason? -1 2 .0available 1 2496 55.5 4125 91.8 4059
---- ----- ---- ----- ---- -----Total 4494 100.0 4494 100.0 4494 100.0
a247_2 nf frequency contact network membersExcluded by routing: no network members mentioned
a055 na gathering addresses network membersExcluded by routing: no network members mentioned or decision management
a251_1 nc characteristics network membersExcluded by routing: no network members mentioned
a247_2 a055 a251_1
Value label Value Freq % Freq % Freq %routing -5 68 1.5 2560 57.0 68 1.5terminated interview -3 37 .8 37 .8 40 .9short version -2 345 7.7 345 7.7 345 7.7missing,reason? -1 2 .0available 1 4044 90.0 1550 34.5 4041 89.9
---- ----- ---- ----- ---- -----Total 4494 100.0 4494 100.0 4494 100.0
a251_2 ns support network membersExcluded by routing: no network members mentioned
a263 ph partner historyExcluded by routing: no (previous) partner relationship (all never married)
a265 hh household history
a251_2 a263 a265
Value label Value Freq % Freq % Freq %no valid data9 -6 5 .1routing -5 53 1.2 222 4.9terminated interview -3 42 .9 49 1.1 57 1.2short version -2 345 7.7 345 7.7 345 7.7available 1 4054 90.2 3873 86.2 4092 91.1
---- ----- ---- ----- ---- -----Total 4494 100.0 4494 100.0 4494 100.0
9 For partner history: on the basis of consistency of events. For item lists (files LSNa073to LSNa079): No valid information on any of the items.

LSNa001 Main Study 1992 51
a267 eh employment historya269 rh residential history
Excluded by routing: decision managementa073 lo loneliness
a267 a269 a073
Value label Value Freq % Freq % Freq %no valid data -6 13 .3routing -5 3250 72.3terminated interview -3 67 1.5 68 1.5 73 1.6short version -2 345 7.7 345 7.7 345 7.7available 1 4082 90.8 831 18.5 4063 90.4
---- ----- ---- ----- ---- -----Total 4494 100.0 4494 100.0 4494 100.0
a074 wb well-beinga075 ec exchange/communal orientation
Excluded by routing: decision managementa076 sk social skills
Excluded by routing: decision management
a074 a075 a076
Value label Value Freq % Freq % Freq %no valid data -6 31 .7 19 .4 4 .1routing -5 916 20.4 3355 74.7terminated interview -3 78 1.7 80 1.8 94 2.1short version -2 343 7.6 343 7.6missing,reason? -1 1 .0available 1 4383 97.6 3135 69.8 698 15.5
---- ----- ---- ----- ---- -----Total 4494 100.0 4494 100.0 4494 100.0
a077 sr self evaluation respondentExcluded by routing: decision management
a078 an need for affiliationExcluded by routing: decision management
a079 af attitudes family helpExcluded by routing: decision management
a077 a078 a079
Value label Value Freq % Freq % Freq %no valid data -6 37 .8 26 .6 29 .6routing -5 201 4.5 2463 54.8 1462 32.5terminated interview -3 81 1.8 93 2.1 93 2.1short version -2 323 7.2 343 7.6 343 7.6missing,reason? -1 1 .0 1 .0available 1 3852 85.7 1568 34.9 2566 57.1
---- ----- ---- ----- ---- -----Total 4494 100.0 4494 100.0 4494 100.0
52 NESTOR living arrangements and social networks LSNa001
a080 en end of interviewa081 $e after interview
This section of the questionnaire is answered by the interviewer after the completion ofthe interview (see LSNa081).
a080 a081
Value label Value Freq % Freq %no valid data -6 2 .0terminated interview -3 98 2.2missing,reason? -1 4 .1available 1 4396 97.8 4488 99.9
---- ----- ---- -----Total 4494 100.0 4494 100.0
apartial pattern of choices in interview
Due to the aim to limit the duration of the interviews, several routings through the questionnairewere developed. The questionnaire sections "gc", "na" and "rh" excluded each other, inprincipal. Different combinations of the item lists "mtmm" (multi trait, multi method: items 4through 9 of section "wb"), "ec", "an" and "af" were possible, in combination with the sections"gc", "na" or "rh". The choice for one specific routing was made aselect by the interviewprogram, with the restriction that asking questions of a certain section have to be meaningful(e.g. questions about grandchildren were asked only if there were grandchildren).
Value Label Value Frequency % Cum%none 0 184 4.1 4.1af 1 2 .0 4.1an 10 1 .0 4.2an+af 11 11 .2 4.4ec 100 62 1.4 5.8ec+af 101 6 .1 5.9ec+an 110 1 .0 5.9ec+an+af 111 42 .9 6.9<interrupted>gc+rh+an+af 1100011 1 .0 100.0
------- -------Total 4494 100.0
aversion full/short,completed/terminated,proxy
The procedure applied for choosing between a full or a short version is explained in chapterLSNa013. The procedure applied for conducting proxy interviews is explained in chapterLSNa091. The interview with three respondents was terminated early in the interview; the proxyof these respondents was interviewed too.
Value Label Value Frequency % Cum%full,compl,no proxy 1 4052 90.2 90.2full,term,no proxy 2 94 2.1 92.3short,compl,no proxy 3 342 7.6 99.9short,term,no proxy 4 3 .1 99.9full,term,proxy 6 1 .0 100.0short,term,proxy 8 2 .0 100.0
------- -------Total 4494 100.0
LSNa001 Main Study 1992 53
alast last section terminated interview
The values refer to the sequence number in the table in the chapter "Overview of thequestionnaire of the face-to-face interview".
Value Label Value Frequency % Cum%not terminated -2 4395 97.8 97.8bd basic demographic 2 3 .1 97.9<interrupted>sk/sr skills/self ev 34 5 .1 99.9af attitudes family 36 6 .1 100.0
------- -------Total 4494 100.0
Question to be anwered by the interviewer.Volgens de administratie heeft u vragenlijst-onderdeel .. als laatste gedaan. Waarom zijn niet alleonderdelen gedaan?Information stored in database LSNa001.dbf.
LSNa002N: 13,438Data about: sample, responseData source: SystemOther files about same topic: LSNa008Selection of respondents: interviewed, refusals, ill R’s, etceteraIdentification variable: RESPNR
sex sex
Value Label Value Frequency % Cum%male 1 6470 48.1 48.1female 2 6968 51.9 100.0
------- -------Total 13438 100.0
amarstm marital status (data municipality)
Value Label Value Frequency % Cum%refusal Amsterdam -2 1220 9.1 9.1not Amsterdam -1 9918 73.8 82.9never married 1 197 1.5 84.4married 2 1166 8.7 93.0divorced 3 233 1.7 94.8widowed 4 704 5.2 100.0
------- -------Total 13438 100.0
byear year of birth
Value Label Value Frequency % Cum%1903 376 2.8 2.8
<interrupted>1937 326 2.4 100.0
------- -------Total 13438 100.0
54 NESTOR living arrangements and social networks LSNa002
apostcod postal code (4 digits)
Value Label Value Frequency % Cum%unknown -1 1 .0 .0Amsterdam 1011 24 .2 .2<interrupted>Mastenbroek 8294 10 .1 100.0
------- -------Total 13438 100.0
aplace municipality
Note: Several municipalities consist of a number of (small) villages. These villages are to berecognized by the postal code (see previous variable). See LSNa095 for more geographic data.
Value Label Value Frequency % Cum%Amsterdam 10 3520 26.2 26.2Waterland 15 1093 8.1 34.3Wormerland 16 980 7.3 41.6Zwolle 20 1767 13.1 54.8Genemuiden 23 510 3.8 58.6Ommen 24 1363 10.1 68.7Zwartsluis 25 1003 7.5 76.2Hasselt 28 278 2.1 78.2Oss 30 1655 12.3 90.6Uden 33 678 5.0 95.6Boekel 34 591 4.4 100.0
------- -------Total 13438 100.0
ainstit in institution (probable)
This variable is based on a match of the postal code of the respondent and postal codes ofinstitutions for the elderly.Suggested recoding:recode ainstit (3 thru 9=8).
Value Label Value Frequency % Cum%postal code missing -1 13 .1 .1no match postal code 1 11842 88.1 88.2match,street differs 2 10 .1 88.3match,no addr available 3 232 1.7 90.0match,same street 4 184 1.4 91.4match,same address 5 3 .0 91.4id,nursing home 6 91 .7 92.1id,home elderly 7 843 6.3 98.4id,nursing/elderly home 8 76 .6 98.9id,service flat 9 75 .6 99.5id,psych hospital 10 47 .3 99.8id,home homeless 11 7 .1 99.9id,monastery 12 15 .1 100.0
------- -------Total 13438 100.0
LSNa002 Main Study 1992 55
aresult result of enlisting attempt
Note: It is not possible to compute the refusal rate directly from this variable, because themunicipalities Amsterdam and Boekel required the researchers to use deviating procedures.
Value Label Value Frequency % Cum%refusal via municipality -3 1343 10.0 10.0not used -2 4521 33.6 43.6unknown 1 4 .0 43.7not contacted 2 28 .2 43.9refusal other reason 3 2092 15.6 59.4refusal (language) 4 17 .1 59.6refusal (ill,proxy possible) 5 37 .3 59.8refusal (ill, no prox poss) 6 274 2.0 61.9died/moved before approach 8 411 3.1 64.9proxy interview 9 217 1.6 66.6face-to-face interview 10 4494 33.4 100.0
------- -------Total 13438 100.0
aexpl explanation of aresult=2 <values 1..11> and of aresult=3 <values 31..40>
Value Label Value Frequency % Cum%result<>2<>3 -2 11340 84.4 84.4unknown -1 15 .1 84.5not at home 1 23 .2 84.7moved to institution 2 2 .0 84.7moved to other address 3 1 .0 84.7temp stay elsewhere 5 4 .0 84.7not known at address 6 9 .1 84.8phone not answered 10 20 .1 84.9other 11 5 .0 85.0no reason mentioned 31 244 1.8 86.8no time 32 172 1.3 88.1appointment forgotten 33 4 .0 88.1not interested/motivated 36 839 6.2 94.3surveys useless 37 206 1.5 95.9violation privacy 38 138 1.0 96.9iv creates worries 39 46 .3 97.2other 40 370 2.8 100.0
------- -------Total 13438 100.0
aiternr identification interviewer
Value Label Value Frequency % Cum%no interviewer -1 5957 44.3 44.3
101 18 .1 44.5<interrupted>
418 15 .1 100.0------- -------
Total 13438 100.0
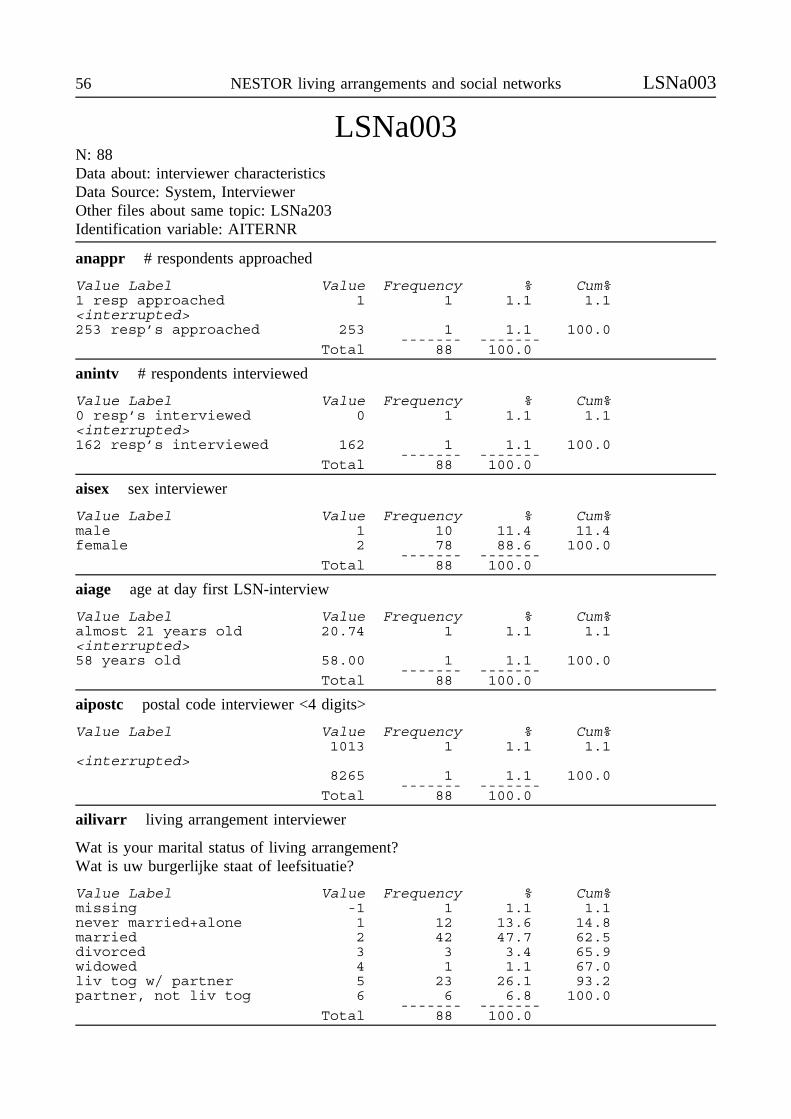
56 NESTOR living arrangements and social networks LSNa003
LSNa003N: 88Data about: interviewer characteristicsData Source: System, InterviewerOther files about same topic: LSNa203Identification variable: AITERNR
anappr # respondents approached
Value Label Value Frequency % Cum%1 resp approached 1 1 1.1 1.1<interrupted>253 resp’s approached 253 1 1.1 100.0
------- -------Total 88 100.0
anintv # respondents interviewed
Value Label Value Frequency % Cum%0 resp’s interviewed 0 1 1.1 1.1<interrupted>162 resp’s interviewed 162 1 1.1 100.0
------- -------Total 88 100.0
aisex sex interviewer
Value Label Value Frequency % Cum%male 1 10 11.4 11.4female 2 78 88.6 100.0
------- -------Total 88 100.0
aiage age at day first LSN-interview
Value Label Value Frequency % Cum%almost 21 years old 20.74 1 1.1 1.1<interrupted>58 years old 58.00 1 1.1 100.0
------- -------Total 88 100.0
aipostc postal code interviewer <4 digits>
Value Label Value Frequency % Cum%1013 1 1.1 1.1
<interrupted>8265 1 1.1 100.0
------- -------Total 88 100.0
ailivarr living arrangement interviewer
Wat is your marital status of living arrangement?Wat is uw burgerlijke staat of leefsituatie?
Value Label Value Frequency % Cum%missing -1 1 1.1 1.1never married+alone 1 12 13.6 14.8married 2 42 47.7 62.5divorced 3 3 3.4 65.9widowed 4 1 1.1 67.0liv tog w/ partner 5 23 26.1 93.2partner, not liv tog 6 6 6.8 100.0
------- -------Total 88 100.0
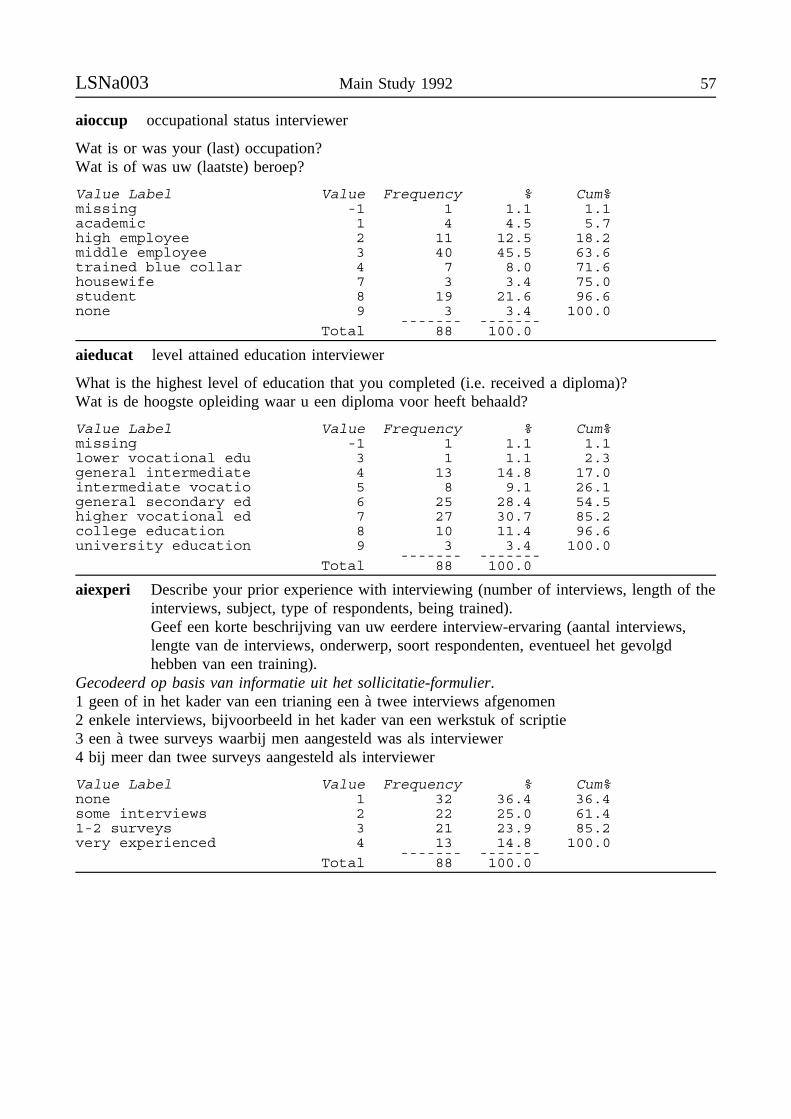
LSNa003 Main Study 1992 57
aioccup occupational status interviewer
Wat is or was your (last) occupation?Wat is of was uw (laatste) beroep?
Value Label Value Frequency % Cum%missing -1 1 1.1 1.1academic 1 4 4.5 5.7high employee 2 11 12.5 18.2middle employee 3 40 45.5 63.6trained blue collar 4 7 8.0 71.6housewife 7 3 3.4 75.0student 8 19 21.6 96.6none 9 3 3.4 100.0
------- -------Total 88 100.0
aieducat level attained education interviewer
What is the highest level of education that you completed (i.e. received a diploma)?Wat is de hoogste opleiding waar u een diploma voor heeft behaald?
Value Label Value Frequency % Cum%missing -1 1 1.1 1.1lower vocational edu 3 1 1.1 2.3general intermediate 4 13 14.8 17.0intermediate vocatio 5 8 9.1 26.1general secondary ed 6 25 28.4 54.5higher vocational ed 7 27 30.7 85.2college education 8 10 11.4 96.6university education 9 3 3.4 100.0
------- -------Total 88 100.0
aiexperi Describe your prior experience with interviewing (number of interviews, length of theinterviews, subject, type of respondents, being trained).Geef een korte beschrijving van uw eerdere interview-ervaring (aantal interviews,lengte van de interviews, onderwerp, soort respondenten, eventueel het gevolgdhebben van een training).
Gecodeerd op basis van informatie uit het sollicitatie-formulier.1 geen of in het kader van een trianing een à twee interviews afgenomen2 enkele interviews, bijvoorbeeld in het kader van een werkstuk of scriptie3 een à twee surveys waarbij men aangesteld was als interviewer4 bij meer dan twee surveys aangesteld als interviewer
Value Label Value Frequency % Cum%none 1 32 36.4 36.4some interviews 2 22 25.0 61.41-2 surveys 3 21 23.9 85.2very experienced 4 13 14.8 100.0
------- -------Total 88 100.0
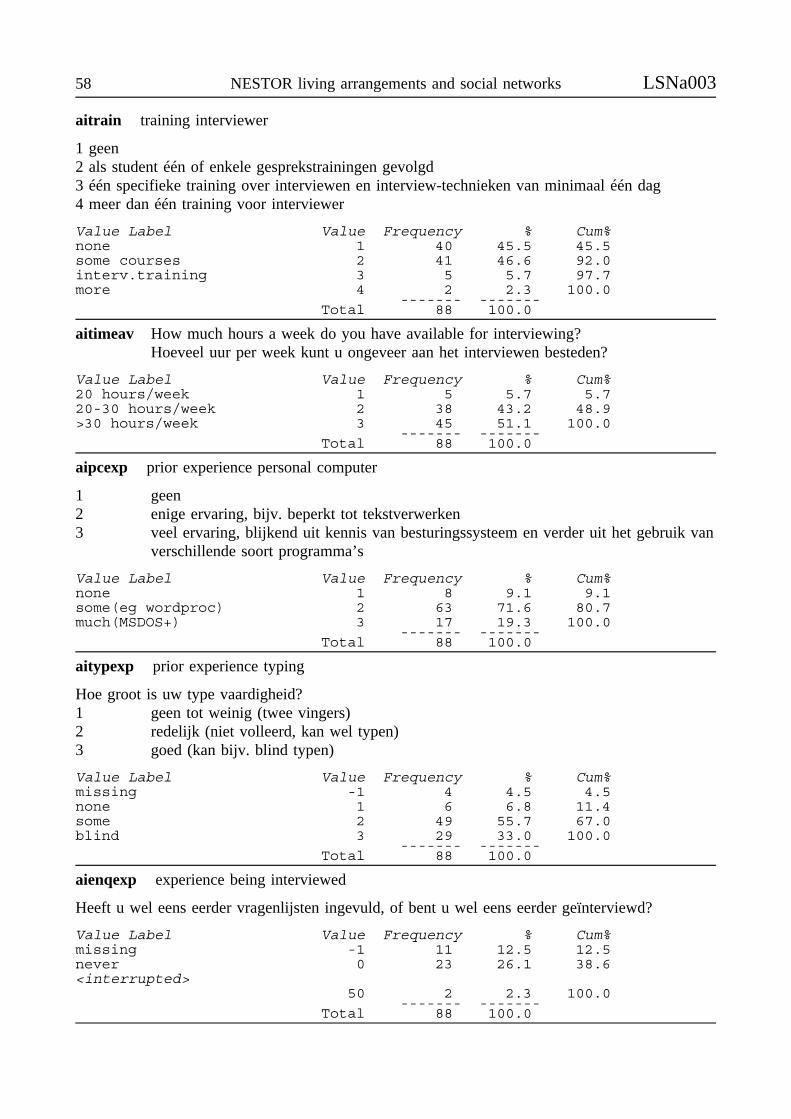
58 NESTOR living arrangements and social networks LSNa003
aitrain training interviewer
1 geen2 als student één of enkele gesprekstrainingen gevolgd3 één specifieke training over interviewen en interview-technieken van minimaal één dag4 meer dan één training voor interviewer
Value Label Value Frequency % Cum%none 1 40 45.5 45.5some courses 2 41 46.6 92.0interv.training 3 5 5.7 97.7more 4 2 2.3 100.0
------- -------Total 88 100.0
aitimeav How much hours a week do you have available for interviewing?Hoeveel uur per week kunt u ongeveer aan het interviewen besteden?
Value Label Value Frequency % Cum%20 hours/week 1 5 5.7 5.720-30 hours/week 2 38 43.2 48.9>30 hours/week 3 45 51.1 100.0
------- -------Total 88 100.0
aipcexp prior experience personal computer
1 geen2 enige ervaring, bijv. beperkt tot tekstverwerken3 veel ervaring, blijkend uit kennis van besturingssysteem en verder uit het gebruik van
verschillende soort programma’s
Value Label Value Frequency % Cum%none 1 8 9.1 9.1some(eg wordproc) 2 63 71.6 80.7much(MSDOS+) 3 17 19.3 100.0
------- -------Total 88 100.0
aitypexp prior experience typing
Hoe groot is uw type vaardigheid?1 geen tot weinig (twee vingers)2 redelijk (niet volleerd, kan wel typen)3 goed (kan bijv. blind typen)
Value Label Value Frequency % Cum%missing -1 4 4.5 4.5none 1 6 6.8 11.4some 2 49 55.7 67.0blind 3 29 33.0 100.0
------- -------Total 88 100.0
aienqexp experience being interviewed
Heeft u wel eens eerder vragenlijsten ingevuld, of bent u wel eens eerder geïnterviewd?
Value Label Value Frequency % Cum%missing -1 11 12.5 12.5never 0 23 26.1 38.6<interrupted>
50 2 2.3 100.0------- -------
Total 88 100.0
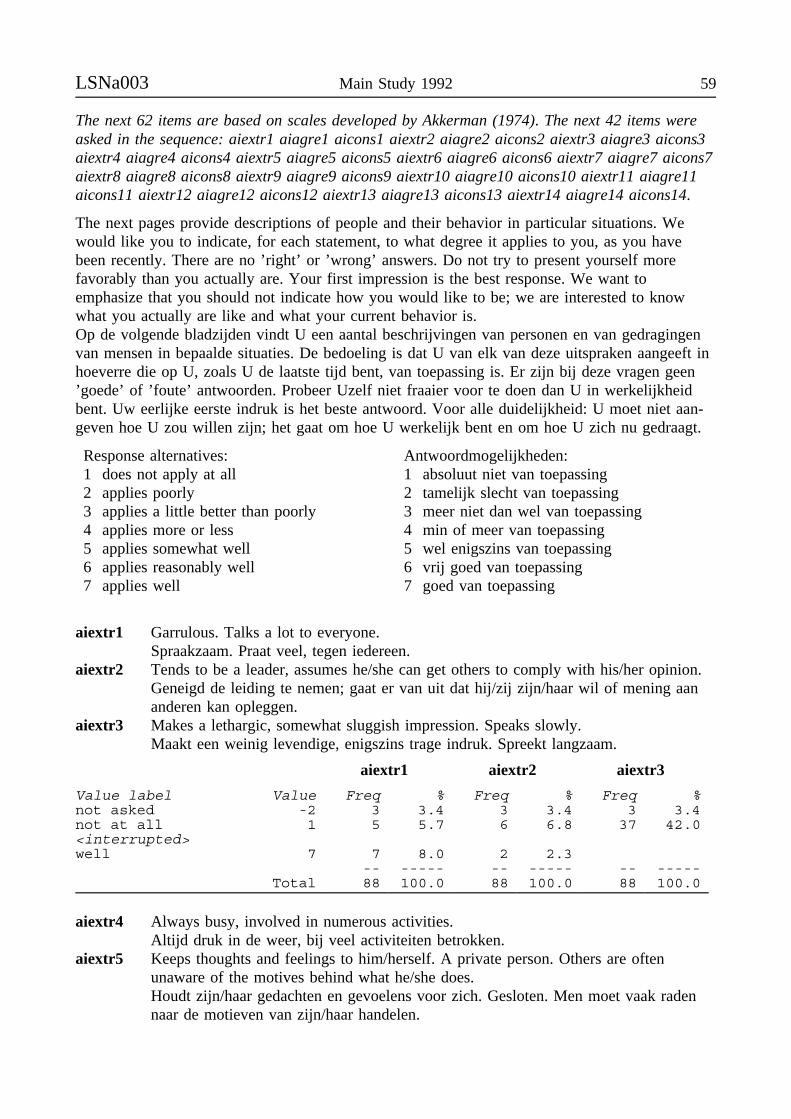
LSNa003 Main Study 1992 59
The next 62 items are based on scales developed by Akkerman (1974). The next 42 items wereasked in the sequence: aiextr1 aiagre1 aicons1 aiextr2 aiagre2 aicons2 aiextr3 aiagre3 aicons3aiextr4 aiagre4 aicons4 aiextr5 aiagre5 aicons5 aiextr6 aiagre6 aicons6 aiextr7 aiagre7 aicons7aiextr8 aiagre8 aicons8 aiextr9 aiagre9 aicons9 aiextr10 aiagre10 aicons10 aiextr11 aiagre11aicons11 aiextr12 aiagre12 aicons12 aiextr13 aiagre13 aicons13 aiextr14 aiagre14 aicons14.
The next pages provide descriptions of people and their behavior in particular situations. Wewould like you to indicate, for each statement, to what degree it applies to you, as you havebeen recently. There are no ’right’ or ’wrong’ answers. Do not try to present yourself morefavorably than you actually are. Your first impression is the best response. We want toemphasize that you should not indicate how you would like to be; we are interested to knowwhat you actually are like and what your current behavior is.Op de volgende bladzijden vindt U een aantal beschrijvingen van personen en van gedragingenvan mensen in bepaalde situaties. De bedoeling is dat U van elk van deze uitspraken aangeeft inhoeverre die op U, zoals U de laatste tijd bent, van toepassing is. Er zijn bij deze vragen geen’goede’ of ’foute’ antwoorden. Probeer Uzelf niet fraaier voor te doen dan U in werkelijkheidbent. Uw eerlijke eerste indruk is het beste antwoord. Voor alle duidelijkheid: U moet niet aan-geven hoe U zou willen zijn; het gaat om hoe U werkelijk bent en om hoe U zich nu gedraagt.
Response alternatives:1 does not apply at all2 applies poorly3 applies a little better than poorly4 applies more or less5 applies somewhat well6 applies reasonably well7 applies well
Antwoordmogelijkheden:1 absoluut niet van toepassing2 tamelijk slecht van toepassing3 meer niet dan wel van toepassing4 min of meer van toepassing5 wel enigszins van toepassing6 vrij goed van toepassing7 goed van toepassing
aiextr1 Garrulous. Talks a lot to everyone.Spraakzaam. Praat veel, tegen iedereen.
aiextr2 Tends to be a leader, assumes he/she can get others to comply with his/her opinion.Geneigd de leiding te nemen; gaat er van uit dat hij/zij zijn/haar wil of mening aananderen kan opleggen.
aiextr3 Makes a lethargic, somewhat sluggish impression. Speaks slowly.Maakt een weinig levendige, enigszins trage indruk. Spreekt langzaam.
aiextr1 aiextr2 aiextr3
Value label Value Freq % Freq % Freq %not asked -2 3 3.4 3 3.4 3 3.4not at all 1 5 5.7 6 6.8 37 42.0<interrupted>well 7 7 8.0 2 2.3
-- ----- -- ----- -- -----Total 88 100.0 88 100.0 88 100.0
aiextr4 Always busy, involved in numerous activities.Altijd druk in de weer, bij veel activiteiten betrokken.
aiextr5 Keeps thoughts and feelings to him/herself. A private person. Others are oftenunaware of the motives behind what he/she does.Houdt zijn/haar gedachten en gevoelens voor zich. Gesloten. Men moet vaak radennaar de motieven van zijn/haar handelen.
60 NESTOR living arrangements and social networks LSNa003
aiextr6 Energetic, lively, fast, alert, always where the action is.Energiek, levendig, snel, alert, altijd "er boven op".
aiextr4 aiextr5 aiextr6
Value label Value Freq % Freq % Freq %not asked -2 3 3.4 3 3.4 3 3.4no answer -1 1 1.1not at all 1 11 12.5 1 1.1<interrupted>well 7 13 14.8 1 1.1 7 8.0
-- ----- -- ----- -- -----Total 88 100.0 88 100.0 88 100.0
aiextr7 Likes to have a lot of people around. Loves parties.Houdt van veel mensen om zich heen. Houdt van feesten.
aiextr8 Straightforward, candid. Expresses opinions without reservations. Everyone knowshow he/she feels.Openhartig, ongereserveerd. Geeft zonder terughouding zijn/haar mening. Naarzijn/haar gevoelens hoeft men nooit te raden.
aiextr9 Adventurous, dauntless.Avontuurlijk, een durfal.
aiextr7 aiextr8 aiextr9
Value label Value Freq % Freq % Freq %not asked -2 3 3.4 3 3.4 3 3.4no answer -1 1 1.1 1 1.1not at all 1 5 5.7 1 1.1<interrupted>well 7 11 12.5 3 3.4 3 3.4
-- ----- -- ----- -- -----Total 88 100.0 88 100.0 88 100.0
aiextr10 Reticent, quiet. Even with others around, he/she is often lost in thought.Zwijgzaam, stil. Is in gezelschap vaak met eigen gedachten bezig.
aiextr11 Has no trouble getting to know strangers.Maakt gemakkelijk kennis met onbekenden.
aiextr12 Is good at spending time alone, does not seek the company of others.Kan uitstekend alleen zijn, is niet geneigd gezelschap te zoeken.
aiextr10 aiextr11 aiextr12
Value label Value Freq % Freq % Freq %not asked -2 3 3.4 3 3.4 3 3.4no answer -1 1 1.1not at all 1 16 18.2<interrupted>well 7 1 1.1 11 12.5 8 9.1
-- ----- -- ----- -- -----Total 88 100.0 88 100.0 88 100.0
aiextr13 Likes being in the limelight.Vindt het prettig om in de schijnwerpers te staan.
aiextr14 Behaves inconspicuously, modestly.Gedraagt zich onopvallend, bescheiden.
LSNa003 Main Study 1992 61
aiextr13 aiextr14
Value label Value Freq % Freq %not asked -2 3 3.4 3 3.4no answer -1 1 1.1not at all 1 13 14.8<interrupted>well 7 2 2.3 2 2.3
-- ----- -- -----
Total 88 100.0 88 100.0
aiagre1 Has very little trust in other people. Cynical.Heeft weinig vertrouwen in zijn/haar medemens. Cynisch.
aiagre2 Has a sharp temper. Not easy to get along with.Scherp, kan venijnig uitvallen. Niet makkelijk mee om te gaan.
aiagre3 Is rather self-centred, egotistical.Is nogal zelfzuchtig, egoïstisch.
aiagre1 aiagre2 aiagre3
Value label Value Freq % Freq % Freq %not asked -2 3 3.4 3 3.4 3 3.4no answer -1 1 1.1not at all 1 23 26.1 20 22.7 21 23.9<interrupted>
6 1 1.1 2 2.3-- ----- -- ----- -- -----
Total 88 100.0 88 100.0 88 100.0
aiagre4 Good-natured, easy to get along with. Doesn’t mind others using his/her things ortaking up his/her time and energy.Goedmoedig, makkelijk om mee om te gaan. Vindt het niet erg wanneer anderenzijn/haar spullen gebruiken of beslag leggen op zijn/haar tijd en energie.
aiagre5 Cooperative, generally says yes if he/she is invited to work with someone else.Willing to meet others at least half way.Coöperatief; in het algemeen geneigd ja te zeggen, wanneer hij/zij uitgenodigd wordtsamen te werken. Klaar om anderen tenminste halverwege tegemoet te komen.
aiagre6 Considerate, amicable.Attent, vriendelijk.
aiagre4 aiagre5 aiagre6
Value label Value Freq % Freq % Freq %not asked -2 3 3.4 3 3.4 3 3.4not at all 1 1 1.1<interrupted>well 7 8 9.1 10 11.4 20 22.7
-- ----- -- ----- -- -----Total 88 100.0 88 100.0 88 100.0
aiagre7 Gives others their due, is not jealous or envious.Gunt iedereen het zijne, vrij van jaloezie of afgunst.
aiagre8 Obstinate. Tends to object to anyone else’s plans. Has negative attitude to doingthings together. Can’t be flexible in a group.
62 NESTOR living arrangements and social networks LSNa003
Tegen de draad. Geneigd bezwaren te maken wanneer iemand anders met een plankomt. Een negatieve houding tegenover dingen samen doen. Kan in een groep nietsoepel ’meedraaien’.
aiagre9 Compassionate with others. Shows interest in their difficulties and takes theirinterests into consideration.Meelevend met anderen. Stelt belang in hun moeilijkheden en houdt rekening methun belangen.
aiagre7 aiagre8 aiagre9
Value label Value Freq % Freq % Freq %not asked -2 3 3.4 3 3.4not at all 1 21 23.9<interrupted>well 7 15 17.0
-- ----- -- ----- -- -----Total 88 100.0 88 100.0 88 100.0
aiagre10 Does not think too highly of many people.Heeft een niet al te hoge dunk van veel mensen.
aiagre11 Enjoys working on a team.Werkt voor de gezelligheid graag in teamverband.
aiagre12 Aloof, detached. Thinks other people usually are not worth knowing. Keeps them at adistance.Koel, uit de hoogte. Vindt andere mensen vaak niet de moeite waard. Houdt ze opeen afstand.
aiagre10 aiagre11 aiagre12
Value label Value Freq % Freq % Freq %not asked -2 3 3.4 3 3.4 3 3.4no answer -1 1 1.1not at all 1 22 25.0 38 43.2<interrupted>
7 11 12.5-- ----- -- ----- -- -----
Total 88 100.0 88 100.0 88 100.0
aiagre13 Trusting. Expects most people to want what is good. Gives them the benefit of thedoubt.Is goed van vertrouwen. Gaat er van uit dat de meeste mensen het goede willen.Geeft ze "the benefit of the doubt".
aiagre14 Congenial, cordial.Hartelijk.
aiagre13 aiagre14
Value label Value Freq % Freq %not asked -2 3 3.4 3 3.4
2 2 2.3<interrupted>well 7 13 14.8 10 11.4
-- ----- -- -----Total 88 100.0 88 100.0
aicons1 Accurate, precise. Does not like it if details are overlooked. Tends to be punctilious.

LSNa003 Main Study 1992 63
Nauwgezet, precies. Vindt het onaangenaam wanneer details verwaarloosd worden.Neiging tot pietluttigheid.
aicons2 Nonchalant, does things when he/she feels like it. Sometimes forgets appointments.Nonchalant, doet de dingen wanneer het hem/haar zo uitkomt. Vergeet nogal eenseen afspraak.
aicons3 Not persistent. Does not always finish what he/she starts. Tends to feel somethingelse is more worthwhile.Niet vasthoudend. Maakt nogal eens niet af waar hij/zij aan begonnen is. Vindt algauw iets anders meer de moeite waard.
aicons1 aicons2 aicons3
Value label Value Freq % Freq % Freq %not asked -2 3 3.4 3 3.4 3 3.4no answer -1 1 1.1not at all 1 2 2.3 35 39.8 24 27.3<interrupted>well 7 5 5.7
-- ----- -- ----- -- -----Total 88 100.0 88 100.0 88 100.0
aicons4 Conscientious, scrupulous. Always keeps his/her word.Gewetensvol, principieel. Een man een man, een woord een woord.
aicons5 Thinks it is important that people adhere to the norms.Vindt het belangrijk dat men zich aan de geldende normen houdt.
aicons6 Responsible. Puts the common interest above his/her own and demands the sameloyalty from others (business before pleasure).Verantwoordelijk. Stelt algemeen belang boven het persoonlijk belang en eist vananderen dezelfde loyaliteit (zaken gaan voor het meisje).
aicons4 aicons5 aicons6
Value label Value Freq % Freq % Freq %not asked -2 3 3.4 3 3.4 3 3.4not at all 1 1 1.1 2 2.3<interrupted>well 7 18 20.5 10 11.4 6 6.8
-- ----- -- ----- -- -----Total 88 100.0 88 100.0 88 100.0
aicons7 Thinks it is important to dress appropriately for whatever the occasion might be.Vindt het belangrijk gekleed te gaan zoals de gelegenheid dat vereist.
aicons8 Neat, never leaves anything lying around. Everything has a fixed spot.Netjes, laat nooit iets rond slingeren. Alles heeft een vaste plaats.
aicons9 Thinks it is all right to ignore rules and regulations you don’t agree with.Vindt dat je wetten en voorschriften waar je het niet mee eens bent, kunt negeren.
aicons7 aicons8 aicons9
Value label Value Freq % Freq % Freq %not asked -2 3 3.4 3 3.4 3 3.4no answer -1 1 1.1 1 1.1not at all 1 2 2.3 4 4.5 14 15.9<interrupted>well 7 16 18.2 9 10.2 2 2.3
-- ----- -- ----- -- -----Total 88 100.0 88 100.0 88 100.0
64 NESTOR living arrangements and social networks LSNa003
aicons10 Likes order and regularity, does everything at the proper time. Insists that everythingis done the way it ought to be.Houdt van orde en regelmaat; doet alles op zijn tijd. Staat erop dat alles gebeurtzoals het hoort.
aicons11 Tenacious, tends to persevere. Once he/she has decided to do something, he/she doesit, no matter how much time or energy it takes. A strong will.Volhardend, doorzettend. Wanneer hij/zij zich heeft voorgenomen iets te doen, doethij/zij het ook, hoeveel tijd en moeite dat mag kosten. Een sterke wil.
aicons12 Rather sloppy, not interested in being neat. Leaves his/her things lying around.Nogal slordig, niet geïnteresseerd in de puntjes op de i. Laat zijn/haar spullenslingeren.
aicons10 aicons11 aicons12
Value label Value Freq % Freq % Freq %not asked -2 3 3.4 3 3.4 3 3.4no answer -1 1 1.1not at all 1 3 3.4 19 21.6<interrupted>well 7 4 4.5 10 11.4
-- ----- -- ----- -- -----Total 88 100.0 88 100.0 88 100.0
aicons13 Feels most comfortable and at ease if he/she knows what is expected of him/her.Voelt zich het prettigst wanneer hij/zij weet wat er van hem/haar verwacht wordt.
aicons14 Does not let anything sidetrack him/her. Once a job is started, he/she can keep ateven the most unpleasant one for a long time.Laat zich niet van zijn/haar werk halen. Is in staat eenmaal begonnen, ook vervelendwerk lang vol te houden.
aicons13 aicons14
Value label Value Freq % Freq %not asked -2 3 3.4 3 3.4
2 1 1.1 2 2.3<interrupted>well 7 10 11.4 6 6.8
-- ----- -- -----Total 88 100.0 88 100.0
The next 20 items were asked in the sequence: aiterm1 aiterm2 aisecu1 aiterm3 aisecu2 aiterm4aiterm5 aisecu3 aisecu4 aisecu5 aisecu6 aisecu7 aiterm6 aisecu8 aiterm7 aisecu9 aiterm8aiterm9 aisecu10 aiterm10.
aiterm1 I don’t worry much about what people think of me.Ik maak me weinig zorgen over wat mensen wel van me denken.
aiterm2 I don’t mind getting into a heated argument if the situation calls for it.Ik zie er niet tegenop om een forse ruzie te maken als de situatie dat vereist.
aiterm3 If someone I like a lot disapproves of my behavior, I am afraid he/she will terminatethe relationship with me.Als iemand op wie ik erg gesteld ben mijn gedrag afkeurt, ben ik bang dat hij/zij deomgang zal verbreken.
LSNa003 Main Study 1992 65
aiterm1 aiterm2 aiterm3
Value label Value Freq % Freq % Freq %not asked -2 3 3.4 3 3.4 3 3.4no answer -1 1 1.1not at all 1 1 1.1 2 2.3 9 10.2<interrupted>well 7 3 3.4 4 4.5
-- ----- -- ----- -- -----Total 88 100.0 88 100.0 88 100.0
aiterm4 It bothers me if I know someone can’t stand me.Ik vind het vervelend als ik weet dat iemand een hekel aan mij heeft.
aiterm5 I hate to be told at a party that I am very quiet.Ik vind het vreselijk als ik op een feestje te horen krijg dat ik erg stil ben.
aiterm6 I detest being laughed at with other people around.Ik vind het heel erg als ik uitgelachen word waar andere mensen bij zijn.
aiterm4 aiterm5 aiterm6
Value label Value Freq % Freq % Freq %not asked -2 3 3.4 3 3.4 3 3.4no answer -1 1 1.1 1 1.1not at all 1 1 1.1 10 11.4 2 2.3<interrupted>well 7 7 8.0 9 10.2
-- ----- -- ----- -- -----Total 88 100.0 88 100.0 88 100.0
aiterm7 If I get into little conflicts with people I like, I am not afraid it will end therelationship.Als ik kleine conflicten heb met mensen die ik graag mag, ben ik niet bang dat diteen einde aan de relatie maakt.
aiterm8 If I get the impression someone doesn’t like me, I couldn’t care less one way or theother.Als ik de indruk heb dat iemand mij niet aardig vindt, word ik daar niet heet of koudvan.
aiterm9 I hate doing something wrong with other people around.Ik vind het vreselijk om iets fout te doen waar anderen bij zijn.
aiterm10 Other people’s positive or negative reactions don’t have that much influence on whatI do.Positieve of negatieve reacties van anderen hebben niet zoveel invloed op wat ik doe.
aiterm7 aiterm8 aiterm9 aiterm10
Value label Value Freq % Freq % Freq % Freq %not asked -2 3 3.4 3 3.4 3 3.4 3 3.4no answer -1 1 1.1not at all 1 3 3.4 3 3.4 1 1.1 1 1.1<interrupted>well 7 15 17.0 1 1.1 1 1.1 1 1.1
-- ----- -- ----- -- ----- -- -----Total 88 100.0 88 100.0 88 100.0 88 100.0
aisecu1 If someone keeps kicking the back of my seat at the movies, I don’t say anythingabout it.
66 NESTOR living arrangements and social networks LSNa003
Als ik in de bioscoop zit en iemand zit voortdurend tegen de achterkant van mijnstoel te schoppen, dan zeg ik daar niets van.
aisecu2 If I order food and it turns out to be poorly cooked, I send it back.Als ik ergens iets te eten heb besteld en het blijkt niet goed klaargemaakt te zijn, danstuur ik het terug.
aisecu3 If I am hard at work and friends come over unannounced, I ask them to come backsome other time.Als ik hard aan het werk ben en er komen onverwacht vrienden binnenvallen, danvraag ik hen een andere keer terug te komen.
aisecu1 aisecu2 aisecu3
Value label Value Freq % Freq % Freq %not asked -2 3 3.4 3 3.4 3 3.4not at all 1 23 26.1 1 1.1 20 22.7<interrupted>well 7 5 5.7 5 5.7
-- ----- -- ----- -- -----Total 88 100.0 88 100.0 88 100.0
aisecu4 If I am having a talk with someone and have had enough of it, it is very hard for meto leave.Als ik met iemand een gesprek heb waar ik genoeg van heb, dan kost het me ergveel moeite om weg te gaan.
aisecu5 If someone interrupts me while I am talking to someone else, I ask them to wait untilI have finished saying what I have to say.Als iemand mij onderbreekt als ik iets tegen een ander zeg, dan vraag ik hem/haar tewachten tot ik uitgesproken ben.
aisecu6 If someone has borrowed money from me and does not pay it back on time, I amafraid to ask if I can have it back as soon as possible.Als iemand geld van mij heeft geleend en het niet op tijd terugbetaalt, durf ik niet tevragen of ik het zo snel mogelijk terug kan krijgen.
aisecu4 aisecu5 aisecu6
Value label Value Freq % Freq % Freq %not asked -2 3 3.4 3 3.4 3 3.4no answer -1 1 1.1not at all 1 2 2.3 1 1.1 9 10.2<interrupted>well 7 5 5.7 3 3.4
-- ----- -- ----- -- -----Total 88 100.0 88 100.0 88 100.0
aisecu7 If someone who is with me does something that really irritates me, I don’t askhim/her to stop.Als iemand in mijn gezelschap iets doet waar ik me erg aan stoor, dan vraag ikhem/haar niet daarmee op te houden.
aisecu8 If I am with friends and something irritates me, I do something about it.Als ik bij vrienden ben en ik erger me ergens aan, dan doe ik daar iets aan.
aisecu9 If I buy something and get home to find something wrong with it, I go back to thestore as soon as possible and say I want to exchange it.Als ik iets heb gekocht en thuis blijkt dat er een mankement aan zit, ga ik zo snelmogelijk terug naar de winkel en zeg dat ik een ander exemplaar wil.
LSNa003 Main Study 1992 67
aisecu10 If someone who lives next door to me regularly makes a lot of noise and it bothersme, I still don’t say anything about it.Als iemand die naast me woont regelmatig veel herrie maakt en ik daar last van heb,zeg ik er toch niets van.
aisecu7 aisecu8 aisecu9 aisecu10
Value label Value Freq % Freq % Freq %not asked -2 3 3.4 3 3.4 3 3.4 3 3.4no answer -1 1 1.1not at all 1 5 5.7 2 2.3 2 2.3 12 13.6<interrupted>well 7 2 2.3 1 1.1 31 35.2 1 1.1
-- ----- -- ----- -- ----- -- -----Total 88 100.0 88 100.0 88 100.0 88 100.0
Please check the appropriate space in the lines below to indicate how you generally feel aboutolder adults.Wilt U op onderstaande lijnen met een kruisje in het betreffende vakje aangeven hoe U in hetalgemeen staat tegenover ouderen?
Based on a semantic differential developed by Osgood, Succi & Tannenbaum (1957).
aielev1 fast-slowvlug |---|---|---|---|---|---|---|---|---| langzaam
aielev2 heavy-light / zwaar-lichtaielev3 small-large / klein-groot
aielev1 aielev2 aielev3
Value label Value Freq % Freq % Freq %not asked -2 3 3.4 3 3.4 3 3.4no answer -1 3 3.4 3 3.4 4 4.5
1 2 2.3<interrupted>
9 1 1.1-- ----- -- ----- -- -----
Total 88 100.0 88 100.0 88 100.0
aielev4 valuable-worthless / waardevol-waardeloosaielev5 boring-interesting / saai-boeiendaielev6 clean-dirty / schoon-vies
aielev4 aielev5 aielev6
Value label Value Freq % Freq % Freq %not asked -2 3 3.4 3 3.4 3 3.4no answer -1 1 1.1 1 1.1 1 1.1
1 25 28.4 7 8.0<interrupted>
9 12 13.6-- ----- -- ----- -- -----
Total 88 100.0 88 100.0 88 100.0
aielev7 unimportant-important / onbelangrijk-belangrijkaielev8 strong-weak / sterk-zwakaielev9 pleasant-unpleasant / prettig-naar
aielev7 aielev8 aielev9
68 NESTOR living arrangements and social networks LSNa003
Value label Value Freq % Freq % Freq %not asked -2 3 3.4 3 3.4 3 3.4no answer -1 1 1.1 2 2.3 1 1.1
1 4 4.5 11 12.5<interrupted>
9 21 23.9-- ----- -- ----- -- -----
Total 88 100.0 88 100.0 88 100.0
aielev10 attractive-repulsive / aantrekkelijk-afstotendaielev11 good-bad / goed-slechtaielev12 unkind-nice / onaardig-aardig
aielev10 aielev11 aielev12
Value label Value Freq % Freq % Freq %not asked -2 3 3.4 3 3.4 3 3.4no answer -1 2 2.3 2 2.3 1 1.1
1 1 1.1 11 12.5<interrupted>
9 9 10.2-- ----- -- ----- -- -----
Total 88 100.0 88 100.0 88 100.0
aielev13 happy-unhappy / gelukkig-ongelukkigaielev14 hard-soft / hard-zachtaielev15 active-passive / actief-passiefaielev16 calm-excited / kalm-opgewonden
aielev13 aielev14 aielev15 aielev16
Value label Value Freq % Freq % Freq % Freq %not asked -2 3 3.4 3 3.4 3 3.4 3 3.4no answer -1 3 3.4 1 1.1 2 2.3 2 2.3
1 6 6.8 5 5.7 3 3.4<interrupted>
9 2 2.3 1 1.1-- ----- -- ----- -- ----- -- -----
Total 88 100.0 88 100.0 88 100.0 88 100.0
LSNa203N: 85Data about: scales characteristics interviewersData Source: SystemOther files about same topic: LSNa003Selection of respondents: with valid dataIdentification variable: AITERNR
aiextr extraversion (interviewer)
Computation of this variable from original variables:recode aiextr3 aiextr5 aiextr10 aiextr12 aiextr14(7=1)(6=2)(5=3)(3=5)(2=6)(1=7).count mis= aiextr1 to aiextr8 aiextr10 aiextr11 aiextr14 (-1).recode aiextr1 to aiextr14 (-1=4).if (mis<3) aiextr= aiextr1+aiextr2+aiextr3+aiextr4+aiextr5+aiextr6+

LSNa203 NESTOR living arrangements and social networks 1992 69
aiextr7+aiextr8+aiextr10+aiextr11+aiextr14.Psychometric properties: H= .38, Reliability ρ= .85.
Value Label Value Frequency % Cum%no answer -1 1 1.2 1.2
21 1 1.2 2.4<interrupted>
71 1 1.2 100.0------- -------
Total 85 100.0
aiagree agreeableness (interviewer)
Computation of this variable from original variables:recode aiagre1 to aiagre3 aiagre8 aiagre10 aiagre12(7=1)(6=2)(5=3)(3=5)(2=6)(1=7).count mis= aiagre1 to aiagre10 aiagre12 to aiagre14 (-1).recode aiagre1 to aiagre14 (-1=4).if (mis<3) aiagree=aiagre1+aiagre2+aiagre3+aiagre4+aiagre5+aiagre6+aiagre7+aiagre8+aiagre9+aiagre10+aiagre12+aiagre13+aiagre14.
Psychometric properties: H= .41, Reliability ρ= .89.
Value Label Value Frequency % Cum%40 1 1.2 1.2
<interrupted>88 1 1.2 100.0
------- -------Total 85 100.0
aicons conscientiousness (interviewer)
Computation of this variable from original variables:recode aicons2 aicons3 aicons9 aicons12(7=1)(6=2)(5=3)(3=5)(2=6)(1=7).count mis= aicons1 aicons2 aicons4 to aicons8aicons10 aicons12 to aicons14 (-1).recode aicons1 to aicons14 (-1=4).if (mis<3) aicons= aicons1+aicons2+aicons4+aicons5+aicons6+aicons7+aicons8+aicons10+aicons12+aicons13+aicons14.
Psychometric properties: H= . 35, Reliability ρ= .84.
Value Label Value Frequency % Cum%36 2 2.4 2.4
<interrupted>76 1 1.2 100.0
------- -------Total 85 100.0
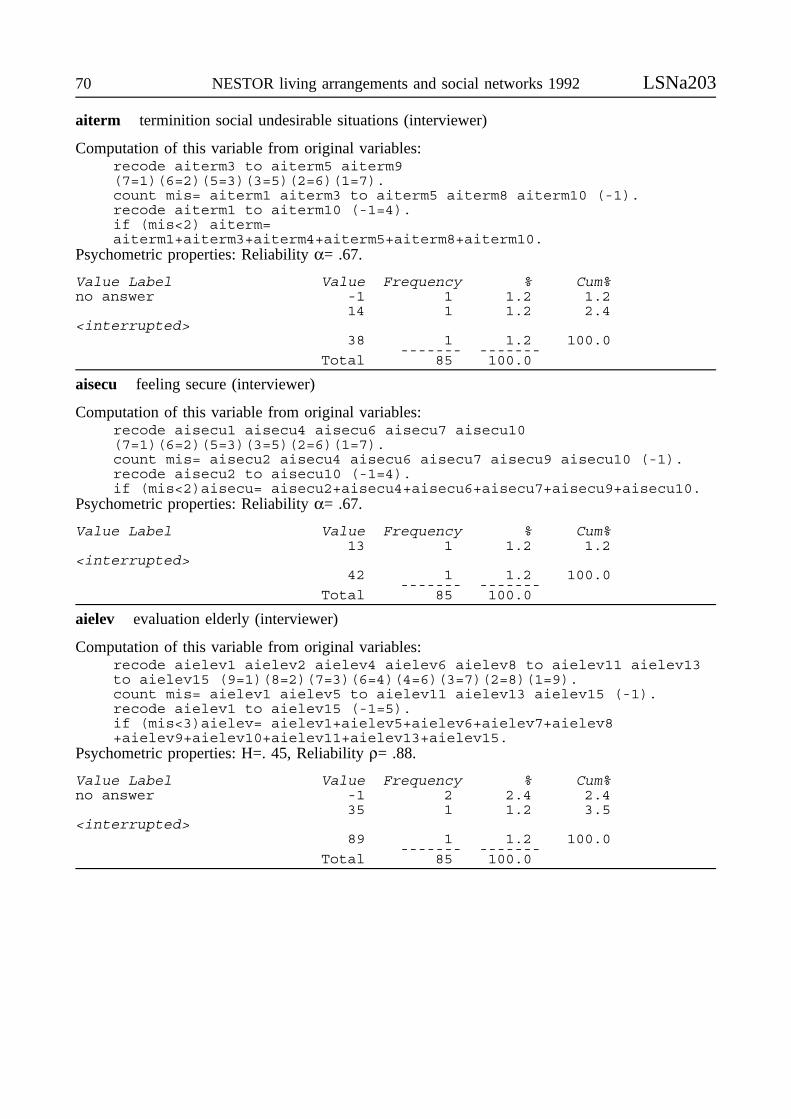
70 NESTOR living arrangements and social networks 1992 LSNa203
aiterm terminition social undesirable situations (interviewer)
Computation of this variable from original variables:recode aiterm3 to aiterm5 aiterm9(7=1)(6=2)(5=3)(3=5)(2=6)(1=7).count mis= aiterm1 aiterm3 to aiterm5 aiterm8 aiterm10 (-1).recode aiterm1 to aiterm10 (-1=4).if (mis<2) aiterm=aiterm1+aiterm3+aiterm4+aiterm5+aiterm8+aiterm10.
Psychometric properties: Reliability α= .67.
Value Label Value Frequency % Cum%no answer -1 1 1.2 1.2
14 1 1.2 2.4<interrupted>
38 1 1.2 100.0------- -------
Total 85 100.0
aisecu feeling secure (interviewer)
Computation of this variable from original variables:recode aisecu1 aisecu4 aisecu6 aisecu7 aisecu10(7=1)(6=2)(5=3)(3=5)(2=6)(1=7).count mis= aisecu2 aisecu4 aisecu6 aisecu7 aisecu9 aisecu10 (-1).recode aisecu2 to aisecu10 (-1=4).if (mis<2)aisecu= aisecu2+aisecu4+aisecu6+aisecu7+aisecu9+aisecu10.
Psychometric properties: Reliability α= .67.
Value Label Value Frequency % Cum%13 1 1.2 1.2
<interrupted>42 1 1.2 100.0
------- -------Total 85 100.0
aielev evaluation elderly (interviewer)
Computation of this variable from original variables:recode aielev1 aielev2 aielev4 aielev6 aielev8 to aielev11 aielev13to aielev15 (9=1)(8=2)(7=3)(6=4)(4=6)(3=7)(2=8)(1=9).count mis= aielev1 aielev5 to aielev11 aielev13 aielev15 (-1).recode aielev1 to aielev15 (-1=5).if (mis<3)aielev= aielev1+aielev5+aielev6+aielev7+aielev8+aielev9+aielev10+aielev11+aielev13+aielev15.
Psychometric properties: H=. 45, Reliability ρ= .88.
Value Label Value Frequency % Cum%no answer -1 2 2.4 2.4
35 1 1.2 3.5<interrupted>
89 1 1.2 100.0------- -------
Total 85 100.0
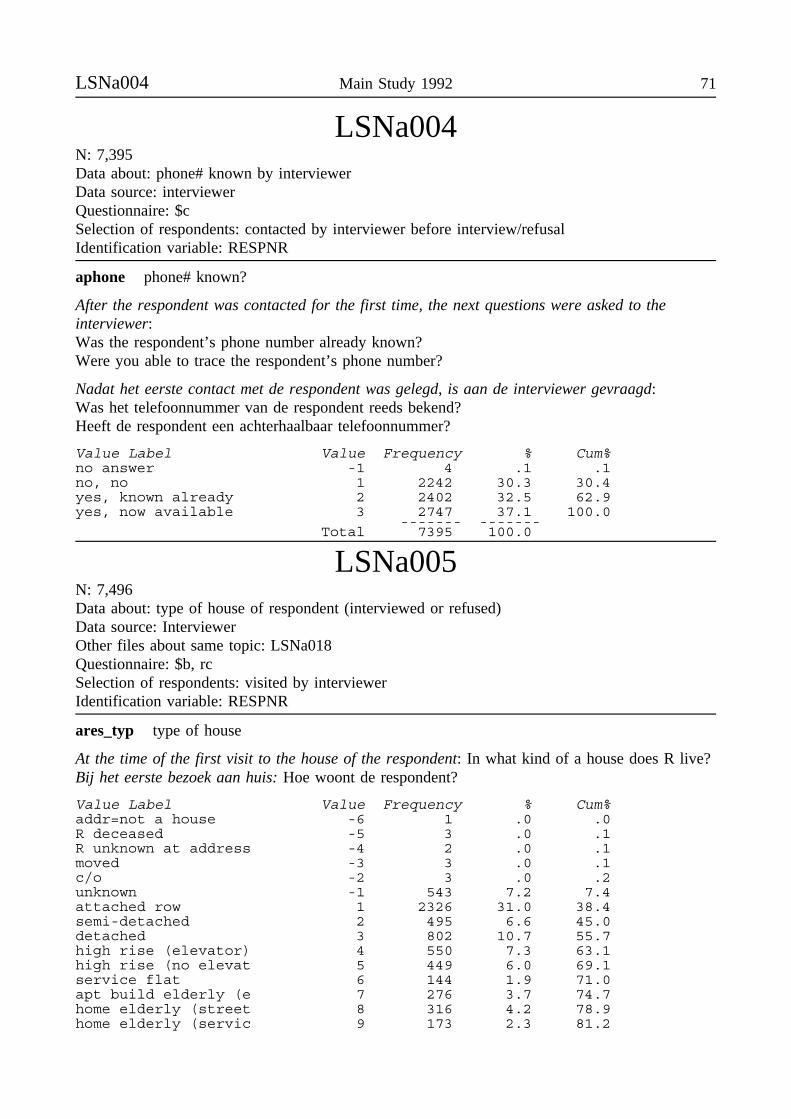
LSNa004 Main Study 1992 71
LSNa004N: 7,395Data about: phone# known by interviewerData source: interviewerQuestionnaire: $cSelection of respondents: contacted by interviewer before interview/refusalIdentification variable: RESPNR
aphone phone# known?
After the respondent was contacted for the first time, the next questions were asked to theinterviewer:Was the respondent’s phone number already known?Were you able to trace the respondent’s phone number?
Nadat het eerste contact met de respondent was gelegd, is aan de interviewer gevraagd:Was het telefoonnummer van de respondent reeds bekend?Heeft de respondent een achterhaalbaar telefoonnummer?
Value Label Value Frequency % Cum%no answer -1 4 .1 .1no, no 1 2242 30.3 30.4yes, known already 2 2402 32.5 62.9yes, now available 3 2747 37.1 100.0
------- -------Total 7395 100.0
LSNa005N: 7,496Data about: type of house of respondent (interviewed or refused)Data source: InterviewerOther files about same topic: LSNa018Questionnaire: $b, rcSelection of respondents: visited by interviewerIdentification variable: RESPNR
ares_typ type of house
At the time of the first visit to the house of the respondent: In what kind of a house does R live?Bij het eerste bezoek aan huis: Hoe woont de respondent?
Value Label Value Frequency % Cum%addr=not a house -6 1 .0 .0R deceased -5 3 .0 .1R unknown at address -4 2 .0 .1moved -3 3 .0 .1c/o -2 3 .0 .2unknown -1 543 7.2 7.4attached row 1 2326 31.0 38.4semi-detached 2 495 6.6 45.0detached 3 802 10.7 55.7high rise (elevator) 4 550 7.3 63.1high rise (no elevat 5 449 6.0 69.1service flat 6 144 1.9 71.0apt build elderly (e 7 276 3.7 74.7home elderly (street 8 316 4.2 78.9home elderly (servic 9 173 2.3 81.2

72 NESTOR living arrangements and social networks LSNa005
semi-independent 10 235 3.1 84.3farm 11 393 5.2 89.6commune 12 22 .3 89.9low-level apt buildi 13 407 5.4 95.3houseboat 14 26 .3 95.6institution 15 316 4.2 99.9other 16 8 .1 100.0canalside house 17 3 .0 100.0
------- -------Total 7496 100.0
See also variable ares_typ in LSNa016.
LSNa006N: 2,548Data about: refusalData source: InterviewerQuestionnaire: $nSelection of respondents: refusal respondent reported by interviewerIdentification variable: RESPNR
arefusal refusal immediately-after doubts
For definite nonresponse/refusal: How did the refusal arise?1 R refused immediately, no discussion possible2 R refused after some discussion3 For a moment it seemed as if R would participate, but in the end s/he refused anyway4 R refused after initially having agreed to participate on account of the written questionnaire5 R refused after initially having agreed to participate for a different reason
Bij definitieve non-response/weigering: Hoe kwam de weigering tot stand?1 Respondent weigerde onmiddellijk, geen discussie mogelijk2 Respondent weigerde na enige discussie3 Even zag het ernaar uit dat de respondent toch mee zou doen, maar uiteindelijk weigerde deze
toch4 Respondent weigerde na eerst toestemming gegeven te hebben en een afspraak gemaakt te
hebben i.v.m. de schriftelijke vragenlijst5 Respondent weigerde na eerst toestemming gegeven te hebben en een afspraak gemaakt te
hebben, om een andere reden
Value Label Value Frequency % Cum%no answer -1 48 1.9 1.9immediately 1 1473 57.8 59.7after discussion 2 458 18.0 77.7after doubts 3 278 10.9 88.6after agreement, que 4 41 1.6 90.2after agreement, oth 5 250 9.8 100.0
------- -------Total 2548 100.0
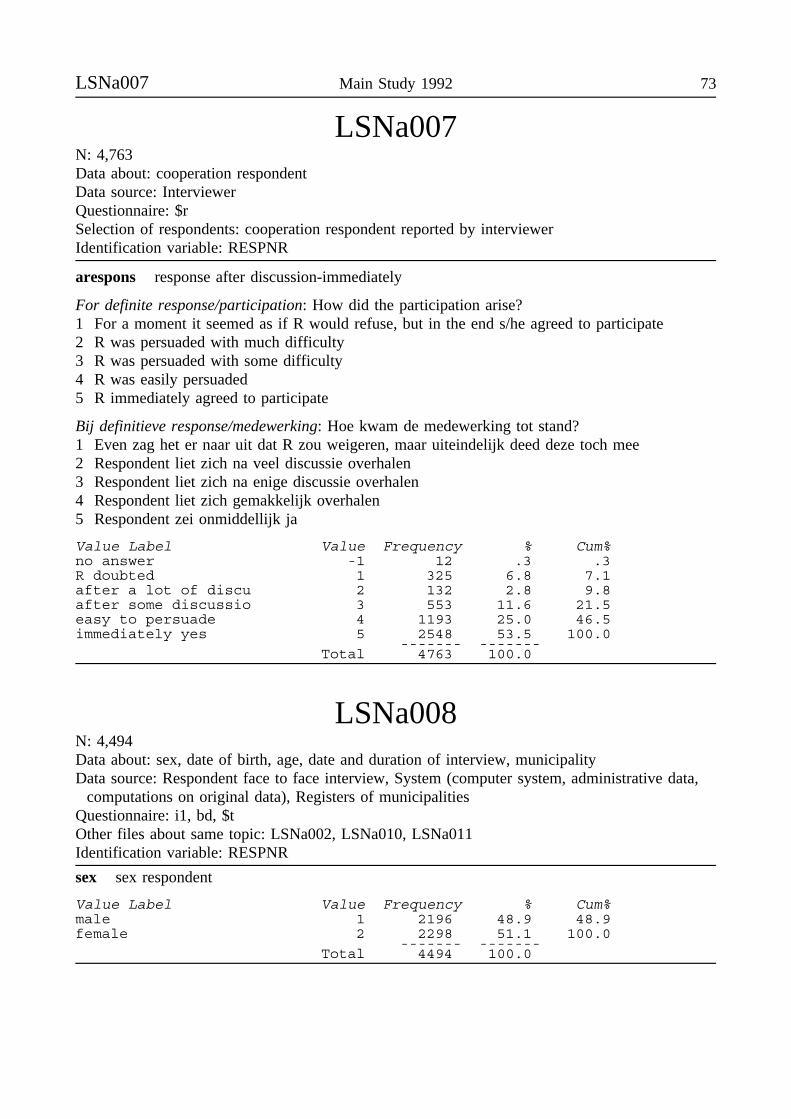
LSNa007 Main Study 1992 73
LSNa007N: 4,763Data about: cooperation respondentData source: InterviewerQuestionnaire: $rSelection of respondents: cooperation respondent reported by interviewerIdentification variable: RESPNR
arespons response after discussion-immediately
For definite response/participation: How did the participation arise?1 For a moment it seemed as if R would refuse, but in the end s/he agreed to participate2 R was persuaded with much difficulty3 R was persuaded with some difficulty4 R was easily persuaded5 R immediately agreed to participate
Bij definitieve response/medewerking: Hoe kwam de medewerking tot stand?1 Even zag het er naar uit dat R zou weigeren, maar uiteindelijk deed deze toch mee2 Respondent liet zich na veel discussie overhalen3 Respondent liet zich na enige discussie overhalen4 Respondent liet zich gemakkelijk overhalen5 Respondent zei onmiddellijk ja
Value Label Value Frequency % Cum%no answer -1 12 .3 .3R doubted 1 325 6.8 7.1after a lot of discu 2 132 2.8 9.8after some discussio 3 553 11.6 21.5easy to persuade 4 1193 25.0 46.5immediately yes 5 2548 53.5 100.0
------- -------Total 4763 100.0
LSNa008N: 4,494Data about: sex, date of birth, age, date and duration of interview, municipalityData source: Respondent face to face interview, System (computer system, administrative data,
computations on original data), Registers of municipalitiesQuestionnaire: i1, bd, $tOther files about same topic: LSNa002, LSNa010, LSNa011Identification variable: RESPNR
sex sex respondent
Value Label Value Frequency % Cum%male 1 2196 48.9 48.9female 2 2298 51.1 100.0
------- -------Total 4494 100.0
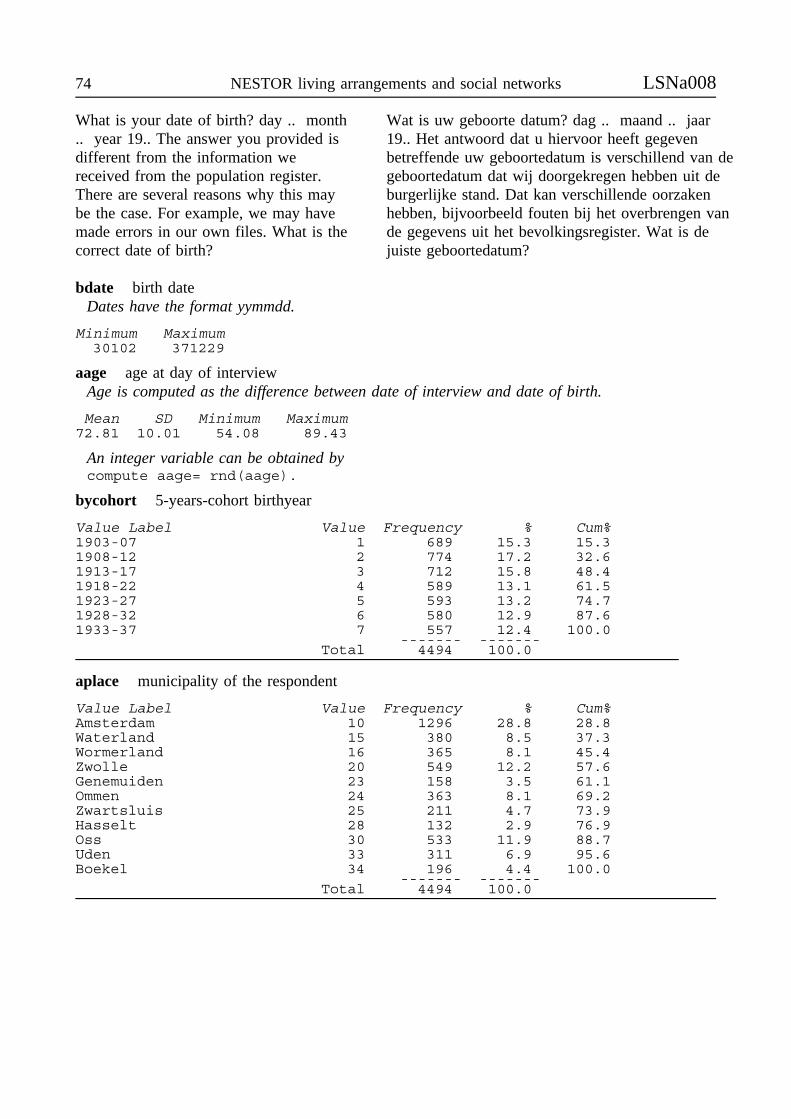
74 NESTOR living arrangements and social networks LSNa008
What is your date of birth? day .. month.. year 19.. The answer you provided isdifferent from the information wereceived from the population register.There are several reasons why this maybe the case. For example, we may havemade errors in our own files. What is thecorrect date of birth?
Wat is uw geboorte datum? dag .. maand .. jaar19.. Het antwoord dat u hiervoor heeft gegevenbetreffende uw geboortedatum is verschillend van degeboortedatum dat wij doorgekregen hebben uit deburgerlijke stand. Dat kan verschillende oorzakenhebben, bijvoorbeeld fouten bij het overbrengen vande gegevens uit het bevolkingsregister. Wat is dejuiste geboortedatum?
bdate birth dateDates have the format yymmdd.
Minimum Maximum30102 371229
aage age at day of interviewAge is computed as the difference between date of interview and date of birth.
Mean SD Minimum Maximum72.81 10.01 54.08 89.43
An integer variable can be obtained bycompute aage= rnd(aage).
bycohort 5-years-cohort birthyear
Value Label Value Frequency % Cum%1903-07 1 689 15.3 15.31908-12 2 774 17.2 32.61913-17 3 712 15.8 48.41918-22 4 589 13.1 61.51923-27 5 593 13.2 74.71928-32 6 580 12.9 87.61933-37 7 557 12.4 100.0
------- -------Total 4494 100.0
aplace municipality of the respondent
Value Label Value Frequency % Cum%Amsterdam 10 1296 28.8 28.8Waterland 15 380 8.5 37.3Wormerland 16 365 8.1 45.4Zwolle 20 549 12.2 57.6Genemuiden 23 158 3.5 61.1Ommen 24 363 8.1 69.2Zwartsluis 25 211 4.7 73.9Hasselt 28 132 2.9 76.9Oss 30 533 11.9 88.7Uden 33 311 6.9 95.6Boekel 34 196 4.4 100.0
------- -------Total 4494 100.0
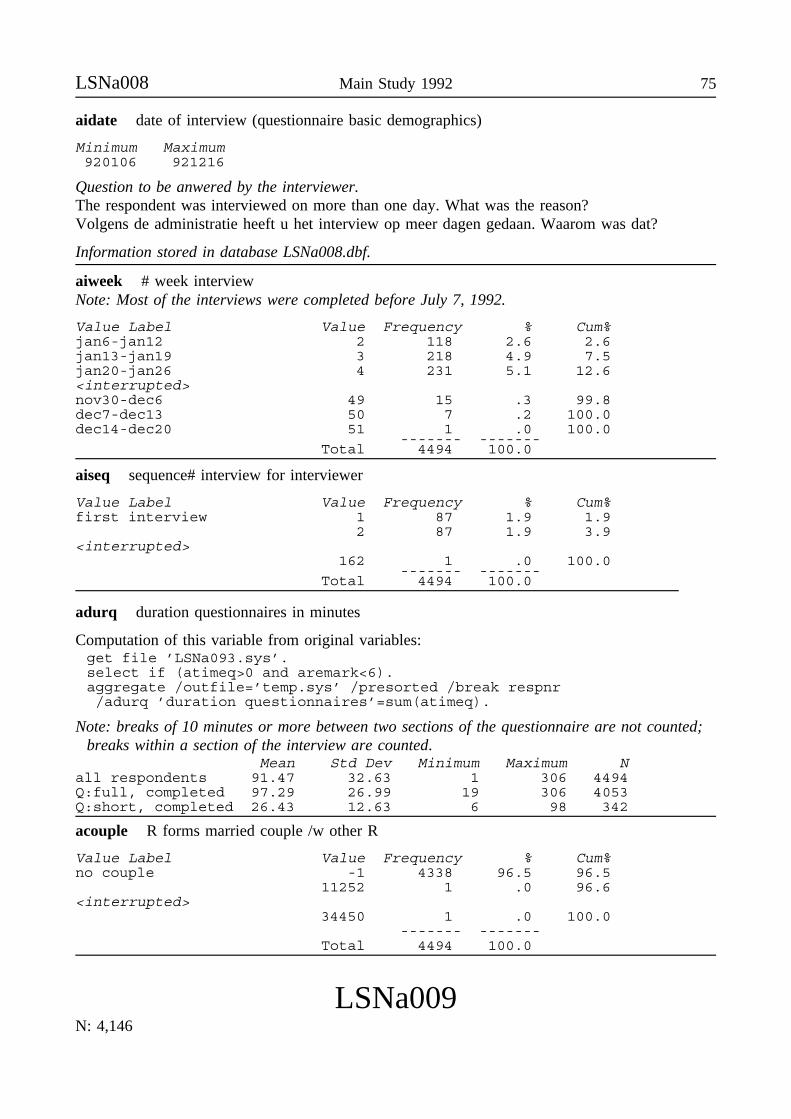
LSNa008 Main Study 1992 75
aidate date of interview (questionnaire basic demographics)
Minimum Maximum920106 921216
Question to be anwered by the interviewer.The respondent was interviewed on more than one day. What was the reason?Volgens de administratie heeft u het interview op meer dagen gedaan. Waarom was dat?
Information stored in database LSNa008.dbf.
aiweek # week interviewNote: Most of the interviews were completed before July 7, 1992.
Value Label Value Frequency % Cum%jan6-jan12 2 118 2.6 2.6jan13-jan19 3 218 4.9 7.5jan20-jan26 4 231 5.1 12.6<interrupted>nov30-dec6 49 15 .3 99.8dec7-dec13 50 7 .2 100.0dec14-dec20 51 1 .0 100.0
------- -------Total 4494 100.0
aiseq sequence# interview for interviewer
Value Label Value Frequency % Cum%first interview 1 87 1.9 1.9
2 87 1.9 3.9<interrupted>
162 1 .0 100.0------- -------
Total 4494 100.0
adurq duration questionnaires in minutes
Computation of this variable from original variables:get file ’LSNa093.sys’.select if (atimeq>0 and aremark<6).aggregate /outfile=’temp.sys’ /presorted /break respnr/adurq ’duration questionnaires’=sum(atimeq).
Note: breaks of 10 minutes or more between two sections of the questionnaire are not counted;breaks within a section of the interview are counted.
Mean Std Dev Minimum Maximum Nall respondents 91.47 32.63 1 306 4494Q:full, completed 97.29 26.99 19 306 4053Q:short, completed 26.43 12.63 6 98 342
acouple R forms married couple /w other R
Value Label Value Frequency % Cum%no couple -1 4338 96.5 96.5
11252 1 .0 96.6<interrupted>
34450 1 .0 100.0------- -------
Total 4494 100.0
LSNa009N: 4,146

76 NESTOR living arrangements and social networks LSNa009
Data about: weight factors (herweegfactoren)Data source: SystemSelection of respondents: long version questionnaire, no proxy dataIdentification variable: RESPNR
Three variables have been created using factors to weight the data, to control for stratificationand non-response biases.10 The weights are based on data from respondents who participatedin the normal interview (long version, no proxy data); respondents who participated in the shortversion of the interview have been excluded. The reason is that only few data are available forthe latter group, and most analyses will focus on respondents who participated in the longversion of the questionnaire. The procedure used does not affect the total sample size, and worksbasically as follows: if the number of R’s with characteristics A equals ni, and if the totalnumber of R’s equals ntot, and if the number of people in the population with characteristic Aequals Ni, and if the total number of people in the population equals Ntot, then the weightassigned is wi=(Ni*ntot)/(Ntot*ni). Note that using weighted data may have limitations, forexample in regression analyses (Winshop & Radbill, 1994).Er zijn drie variabelen gemaakt met factoren om de data te herwegen, ter correctie opstratificatie- en non-respons-bias. De herweging is gebaseerd op gegevens van respondenten diehet gewone interview hebben gehad (dat wil zeggen: geen korte versie en geen proxy-gegevens);respondenten die alleen een verkort interview hebben gedaan zijn bij de berekening van deherweegfactoren buiten beschouwing gelaten. Van deze laatste groep zijn namelijk slechts weiniggegevens beschikbaar, en de meeste analyses zullen betrekking hebben op respondenten die hetgewone interview gedaan hebben.
awcohsex weight sex & cohort
This weight factor should be used in analyses of differences according to both sex and birthcohort. Each category (i.e. males born between 1903 and 1907, females etcetera) is weighted insuch a way that it meets national distributions according to region and marital status.Deze herweegfactor is bedoeld voor analyses waarin verschillen tussen mannen en vrouwen entussen cohorten bestudeerd worden. Binnen iedere categorie (mannen geboren tussen 1903 en1907, vrouwen geboren tussen 1903 en 1907, mannen geboren tussen 1908 en 1912, enz.) isherwogen naar regio en naar burgerlijke staat.
Mean Std Dev Minimum Maximum1.00 .16 .609317 5.750607
awcoh weight cohorts
This weight factor should be used for analyses of inter-cohort differences. In comparison toAWCOHSEX, the sample is additionally corrected for the over-representation of males in mostof the cohorts in the sample.Deze herweegfactor is bedoeld voor analyses waarin verschillen tussen cohorten bestudeerdworden. In vergelijking met AWCOHSEX heeft er als extra stap een correctie plaatsgevondenvoor de oververtegenwoordiging van mannen in de meeste cohorten binnen onze steekproef.
Mean Std Dev Minimum Maximum1.00 .28 .486604 3.358046
10 A memo, written by A.C. Liefbroer, about the construction of the weight variables isavailable on request.
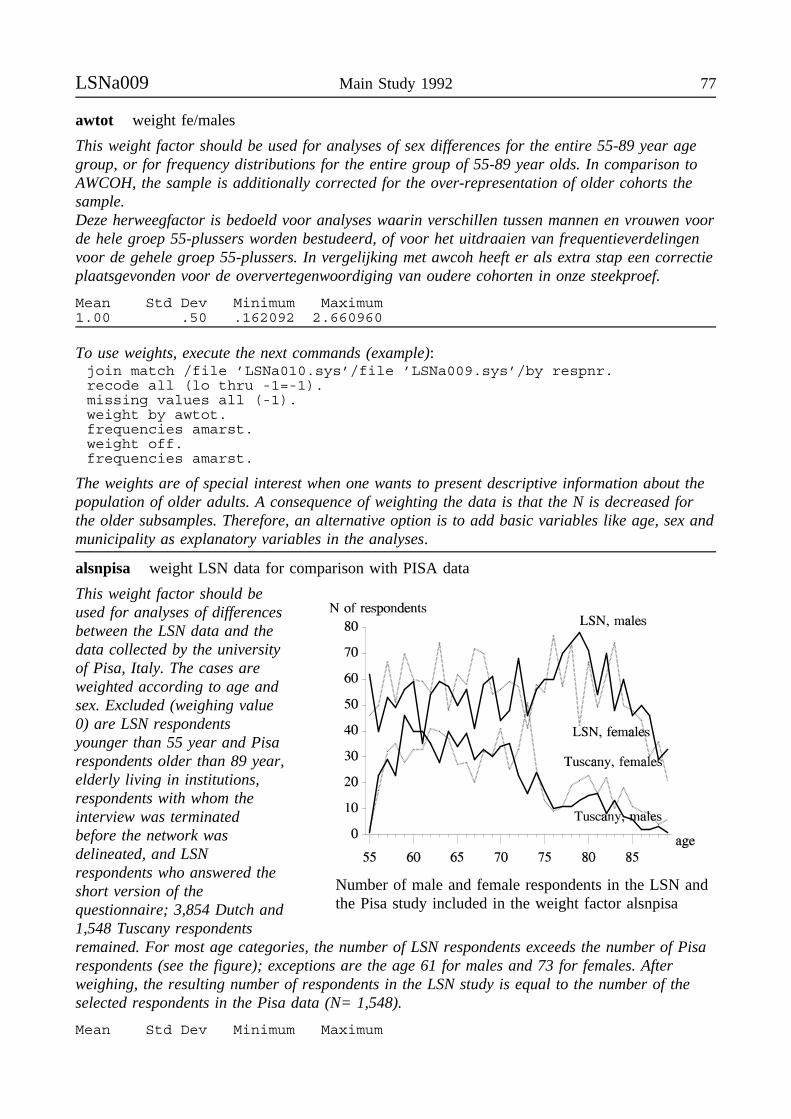
LSNa009 Main Study 1992 77
awtot weight fe/males
This weight factor should be used for analyses of sex differences for the entire 55-89 year agegroup, or for frequency distributions for the entire group of 55-89 year olds. In comparison toAWCOH, the sample is additionally corrected for the over-representation of older cohorts thesample.Deze herweegfactor is bedoeld voor analyses waarin verschillen tussen mannen en vrouwen voorde hele groep 55-plussers worden bestudeerd, of voor het uitdraaien van frequentieverdelingenvoor de gehele groep 55-plussers. In vergelijking met awcoh heeft er als extra stap een correctieplaatsgevonden voor de oververtegenwoordiging van oudere cohorten in onze steekproef.
Mean Std Dev Minimum Maximum1.00 .50 .162092 2.660960
To use weights, execute the next commands (example):join match /file ’LSNa010.sys’/file ’LSNa009.sys’/by respnr.recode all (lo thru -1=-1).missing values all (-1).weight by awtot.frequencies amarst.weight off.frequencies amarst.
The weights are of special interest when one wants to present descriptive information about thepopulation of older adults. A consequence of weighting the data is that the N is decreased forthe older subsamples. Therefore, an alternative option is to add basic variables like age, sex andmunicipality as explanatory variables in the analyses.
alsnpisa weight LSN data for comparison with PISA data
This weight factor should be
Number of male and female respondents in the LSN andthe Pisa study included in the weight factor alsnpisa
used for analyses of differencesbetween the LSN data and thedata collected by the universityof Pisa, Italy. The cases areweighted according to age andsex. Excluded (weighing value0) are LSN respondentsyounger than 55 year and Pisarespondents older than 89 year,elderly living in institutions,respondents with whom theinterview was terminatedbefore the network wasdelineated, and LSNrespondents who answered theshort version of thequestionnaire; 3,854 Dutch and1,548 Tuscany respondentsremained. For most age categories, the number of LSN respondents exceeds the number of Pisarespondents (see the figure); exceptions are the age 61 for males and 73 for females. Afterweighing, the resulting number of respondents in the LSN study is equal to the number of theselected respondents in the Pisa data (N= 1,548).
Mean Std Dev Minimum Maximum
78 NESTOR living arrangements and social networks LSNa009
.37 .26 .00 1.24
Example:join match /file ’LSNa273.sys’ /table ’LSNa009.sys’ /keep respnralsnpisa /by respnr.compute study=1.format study (f1).variable label study ’Netherlands - Tuscany’.value labels study 1’Netherlands’ 2’Tuscany’.save file ’temp1.sys’.join match /file ’PISA273.sys’ /table ’PISA009.sys’ /by respnr.compute study=2.save file ’temp2.sys’.join add /file ’temp1.sys’ /file ’temp2.sys’.weight by alsnpisa.t-test /groups study (1,2) /variables alo.
80 NESTOR living arrangements and social networks LSNa010
LSNa010N: 4,494Data about: basic demographics respondentData source: Respondent face to face interviewQuestionnaire: bd, ehOther files about same topic: LSNa008, LSNa011, LSNa012, LSNa091Identification variable: RESPNR
amarst official marital status
What is your official marital status?Wat is uw officiële burgerlijke staat?
Value Label Value Frequency % Cum%never married 1 301 6.7 6.7married 2 2607 58.0 64.7divorced 3 201 4.5 69.2widowed 4 1385 30.8 100.0
------- -------Total 4494 100.0
Note: Married includes officially separated ("gescheiden van tafel en bed").
apartst partner status (partner living in the household, sex of the partner, married)
Are you currently living withsomeone (= person of the oppositesex), whom you consider to be apartner?Are you currently living withsomeone (= person of the same sex),whom you consider to be a partner?Is there someone with whom you donot share living quarters, but doconsider to be a partner? And: Is thisa man or a woman?Are you currently living togetherwith your husband/wife? Answer"yes" if the separation is temporary,e.g. in connection with employment,schooling or admission in hospital.Answer "no" if the separation willprobably have a duration of over sixmonths.
Woont u nu met een vriend/vriendin (= iemand vanhet andere geslacht) samen die u als een partnerbeschouwt?Woont u nu met een vriend/vriendin (= iemand vanhet gelijke geslacht) samen die u als een partnerbeschouwt?Hebt u iemand waarmee u niet samenwoont, maardie u wel als uw partner beschouwt? En: Is dit eenman of een vrouw?Woont u momenteel met uw man/vrouw samen? Alsde man/vrouw van R tijdelijk afwezig is, bijv.vanwege studie, werk of ziekenhuisverblijf, dan "ja"antwoorden. Bij afwezigheid die waarschijnlijklanger dan zes maanden zal duren, ook al is dievanwege studie, ziekenhuisverblijf, en dergelijke, dan"nee" antwoorden.Ik zet de situatie met betrekking tot uw partner nogeven op een rijtje. U heeft/leeft .... Is dezeinformatie juist?
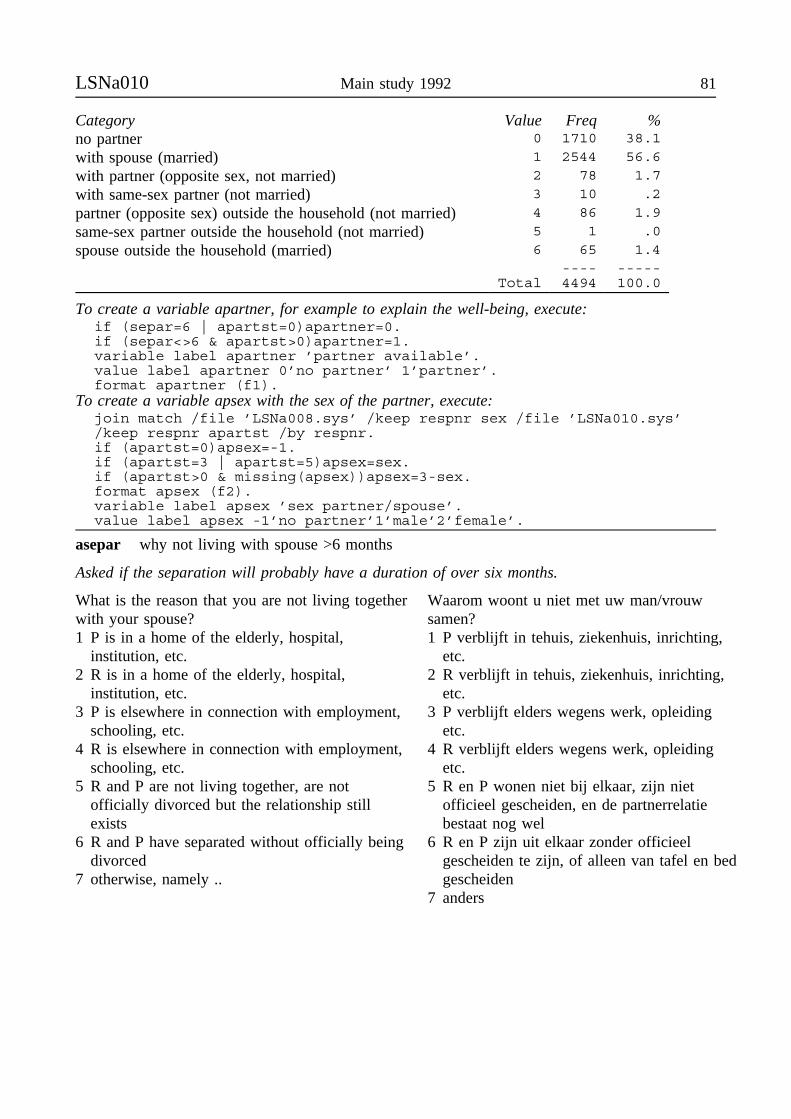
LSNa010 Main study 1992 81
Category Value Freq %no partner 0 1710 38.1
with spouse (married) 1 2544 56.6
with partner (opposite sex, not married) 2 78 1.7
with same-sex partner (not married) 3 10 .2
partner (opposite sex) outside the household (not married) 4 86 1.9
same-sex partner outside the household (not married) 5 1 .0
spouse outside the household (married) 6 65 1.4---- -----
Total 4494 100.0
To create a variable apartner, for example to explain the well-being, execute:if (separ=6 | apartst=0)apartner=0.if (separ<>6 & apartst>0)apartner=1.variable label apartner ’partner available’.value label apartner 0’no partner’ 1’partner’.format apartner (f1).
To create a variable apsex with the sex of the partner, execute:join match /file ’LSNa008.sys’ /keep respnr sex /file ’LSNa010.sys’/keep respnr apartst /by respnr.if (apartst=0)apsex=-1.if (apartst=3 | apartst=5)apsex=sex.if (apartst>0 & missing(apsex))apsex=3-sex.format apsex (f2).variable label apsex ’sex partner/spouse’.value label apsex -1’no partner’1’male’2’female’.
asepar why not living with spouse >6 months
Asked if the separation will probably have a duration of over six months.
What is the reason that you are not living togetherwith your spouse?1 P is in a home of the elderly, hospital,
institution, etc.2 R is in a home of the elderly, hospital,
institution, etc.3 P is elsewhere in connection with employment,
schooling, etc.4 R is elsewhere in connection with employment,
schooling, etc.5 R and P are not living together, are not
officially divorced but the relationship stillexists
6 R and P have separated without officially beingdivorced
7 otherwise, namely ..
Waarom woont u niet met uw man/vrouwsamen?1 P verblijft in tehuis, ziekenhuis, inrichting,
etc.2 R verblijft in tehuis, ziekenhuis, inrichting,
etc.3 P verblijft elders wegens werk, opleiding
etc.4 R verblijft elders wegens werk, opleiding
etc.5 R en P wonen niet bij elkaar, zijn niet
officieel gescheiden, en de partnerrelatiebestaat nog wel
6 R en P zijn uit elkaar zonder officieelgescheiden te zijn, of alleen van tafel en bedgescheiden
7 anders
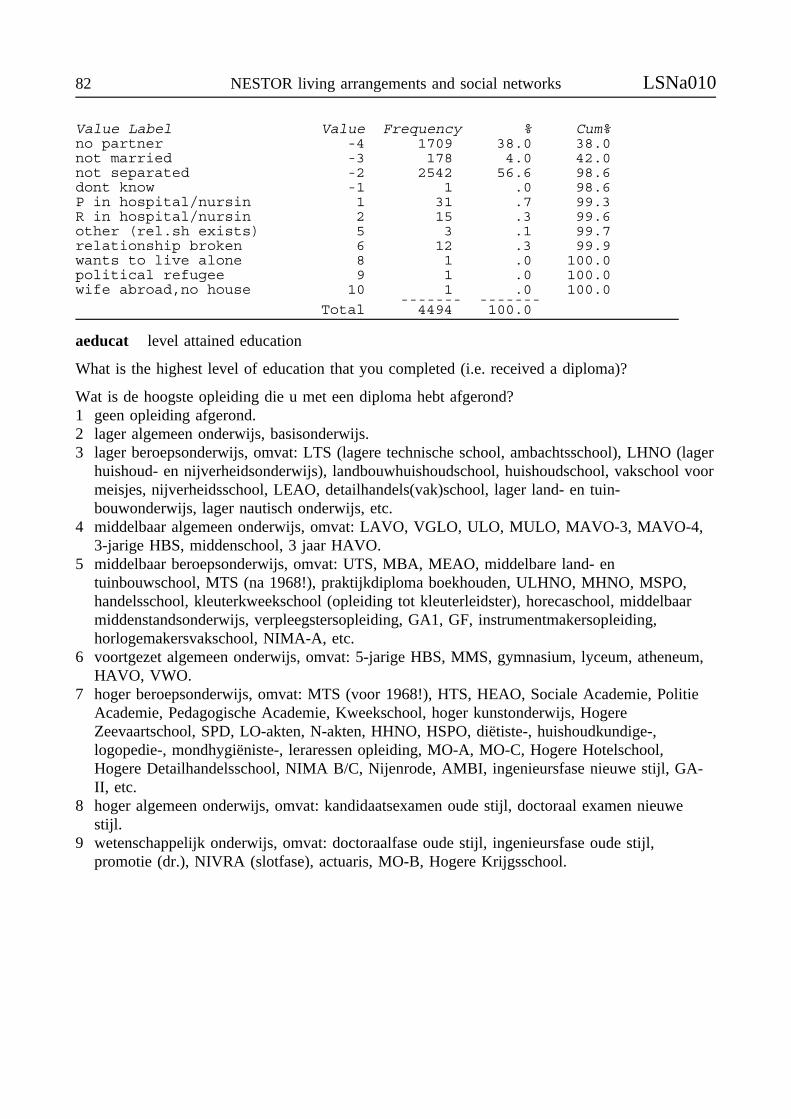
82 NESTOR living arrangements and social networks LSNa010
Value Label Value Frequency % Cum%no partner -4 1709 38.0 38.0not married -3 178 4.0 42.0not separated -2 2542 56.6 98.6dont know -1 1 .0 98.6P in hospital/nursin 1 31 .7 99.3R in hospital/nursin 2 15 .3 99.6other (rel.sh exists) 5 3 .1 99.7relationship broken 6 12 .3 99.9wants to live alone 8 1 .0 100.0political refugee 9 1 .0 100.0wife abroad,no house 10 1 .0 100.0
------- -------Total 4494 100.0
aeducat level attained education
What is the highest level of education that you completed (i.e. received a diploma)?
Wat is de hoogste opleiding die u met een diploma hebt afgerond?1 geen opleiding afgerond.2 lager algemeen onderwijs, basisonderwijs.3 lager beroepsonderwijs, omvat: LTS (lagere technische school, ambachtsschool), LHNO (lager
huishoud- en nijverheidsonderwijs), landbouwhuishoudschool, huishoudschool, vakschool voormeisjes, nijverheidsschool, LEAO, detailhandels(vak)school, lager land- en tuin-bouwonderwijs, lager nautisch onderwijs, etc.
4 middelbaar algemeen onderwijs, omvat: LAVO, VGLO, ULO, MULO, MAVO-3, MAVO-4,3-jarige HBS, middenschool, 3 jaar HAVO.
5 middelbaar beroepsonderwijs, omvat: UTS, MBA, MEAO, middelbare land- entuinbouwschool, MTS (na 1968!), praktijkdiploma boekhouden, ULHNO, MHNO, MSPO,handelsschool, kleuterkweekschool (opleiding tot kleuterleidster), horecaschool, middelbaarmiddenstandsonderwijs, verpleegstersopleiding, GA1, GF, instrumentmakersopleiding,horlogemakersvakschool, NIMA-A, etc.
6 voortgezet algemeen onderwijs, omvat: 5-jarige HBS, MMS, gymnasium, lyceum, atheneum,HAVO, VWO.
7 hoger beroepsonderwijs, omvat: MTS (voor 1968!), HTS, HEAO, Sociale Academie, PolitieAcademie, Pedagogische Academie, Kweekschool, hoger kunstonderwijs, HogereZeevaartschool, SPD, LO-akten, N-akten, HHNO, HSPO, diëtiste-, huishoudkundige-,logopedie-, mondhygiëniste-, leraressen opleiding, MO-A, MO-C, Hogere Hotelschool,Hogere Detailhandelsschool, NIMA B/C, Nijenrode, AMBI, ingenieursfase nieuwe stijl, GA-II, etc.
8 hoger algemeen onderwijs, omvat: kandidaatsexamen oude stijl, doctoraal examen nieuwestijl.
9 wetenschappelijk onderwijs, omvat: doctoraalfase oude stijl, ingenieursfase oude stijl,promotie (dr.), NIVRA (slotfase), actuaris, MO-B, Hogere Krijgsschool.

LSNa010 Main study 1992 83
Value Label Value Frequency % Cum%no answer -1 10 .2 .2elementary not compl 1 548 12.2 12.4elementary education 2 1662 37.0 49.4lower vocational edu 3 799 17.8 67.2general intermediate 4 418 9.3 76.5intermediate vocatio 5 499 11.1 87.6general secondary ed 6 101 2.2 89.8higher vocational ed 7 287 6.4 96.2college education 8 48 1.1 97.3university education 9 122 2.7 100.0
------- -------Total 4494 100.0
To convert the level of the attained education into the number of years of education:compute aedu = aeducat.recode aedu (1=5)(2=6)(3=9)(4=10)(5=11)(6=12)(7=15)(8=16)(9=18).format aedu (f2).variable labels aedu ’education level attained (years)’.value labels aedu -1’no answer’5’5 years’ 18’18 years’.
aedu education level attained (years)
Value Label Value Frequency % Cum%no answer -1 10 .2 .25 years 5 548 12.2 12.4
6 1662 37.0 49.49 799 17.8 67.2
10 418 9.3 76.511 499 11.1 87.612 101 2.2 89.815 287 6.4 96.216 48 1.1 97.3
18 years 18 122 2.7 100.0------- -------
Total 4494 100.0
aemplst employment status
Are you currently employed? To be employedmeans: to be a professional, to have one’s owncompany or practice, to work in a family businessor practice, to work on a free-lance basis, to workthrough a temporary agency, to have a paidapprenticeship, to be on temporary sick-leave (i.e.paid via health, not disability insurances), to beemployed in a sheltered workshop.Are you unemployed or looking for a job? R isconsidered to be unemployed if s/he is registeredas looking for work at the job center.
Verricht u nu betaald werk? "Werk" omvat:vrij beroep, eigen bedrijf of praktijk, mee-werkend in gezins- of familiebedrijf of prak-tijk, free-lance, uitzendwerk, stage met loonof salaris, ziektewetuitkering, sociale werk-plaats.Bent u werkloos of werkzoekend? R wordtals werkloos of werkzoekend beschouwd alshij/zij bij het arbeidsbureau als werkzoe-kend staat ingeschreven.
Does one of the early retirement schemes apply toyou?
Bent u vervroegd gepensioneerd? Hierwordt gedoeld op regelingen zoals de VUT,als ook gedoeld op reguliere pensioneringvoor de leeftijd van 65.
Are you occupationally disabled?Are you partially unemployed or looking for a job?
Bent u arbeidsongeschikt?Bent u gedeeltelijk werkloos ofwerkzoekend?
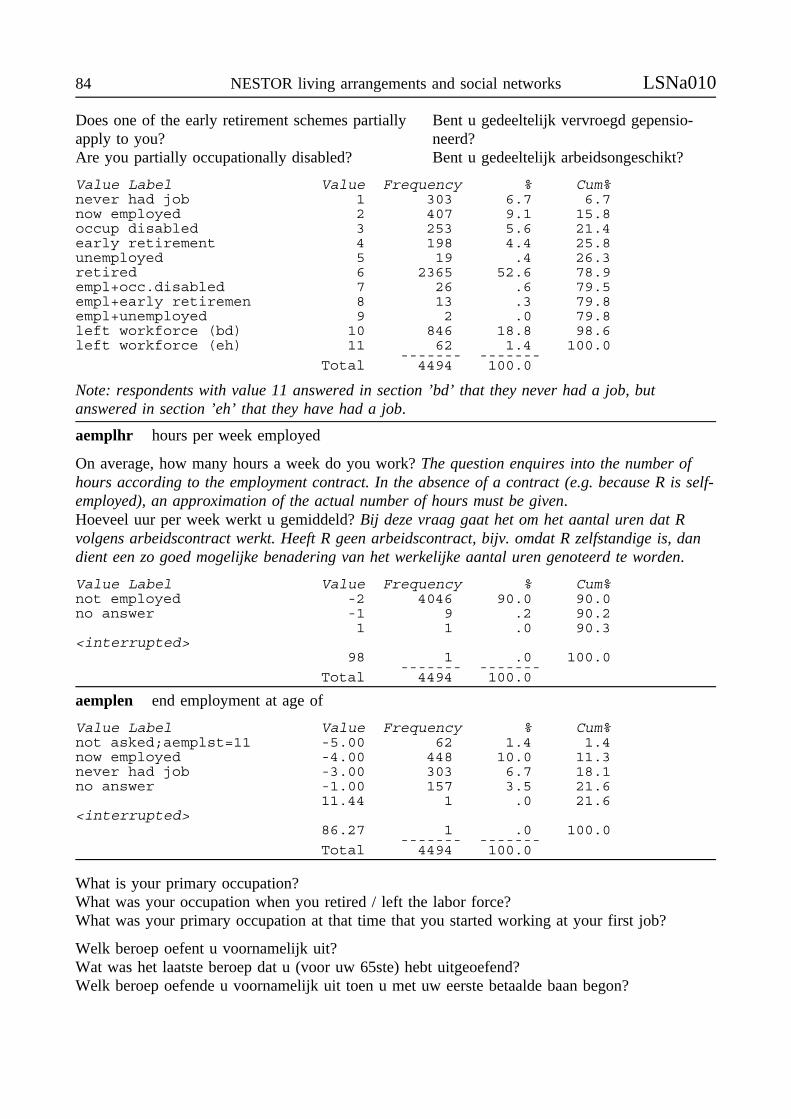
84 NESTOR living arrangements and social networks LSNa010
Does one of the early retirement schemes partiallyapply to you?Are you partially occupationally disabled?
Bent u gedeeltelijk vervroegd gepensio-neerd?Bent u gedeeltelijk arbeidsongeschikt?
Value Label Value Frequency % Cum%never had job 1 303 6.7 6.7now employed 2 407 9.1 15.8occup disabled 3 253 5.6 21.4early retirement 4 198 4.4 25.8unemployed 5 19 .4 26.3retired 6 2365 52.6 78.9empl+occ.disabled 7 26 .6 79.5empl+early retiremen 8 13 .3 79.8empl+unemployed 9 2 .0 79.8left workforce (bd) 10 846 18.8 98.6left workforce (eh) 11 62 1.4 100.0
------- -------Total 4494 100.0
Note: respondents with value 11 answered in section ’bd’ that they never had a job, butanswered in section ’eh’ that they have had a job.
aemplhr hours per week employed
On average, how many hours a week do you work? The question enquires into the number ofhours according to the employment contract. In the absence of a contract (e.g. because R is self-employed), an approximation of the actual number of hours must be given.Hoeveel uur per week werkt u gemiddeld? Bij deze vraag gaat het om het aantal uren dat Rvolgens arbeidscontract werkt. Heeft R geen arbeidscontract, bijv. omdat R zelfstandige is, dandient een zo goed mogelijke benadering van het werkelijke aantal uren genoteerd te worden.
Value Label Value Frequency % Cum%not employed -2 4046 90.0 90.0no answer -1 9 .2 90.2
1 1 .0 90.3<interrupted>
98 1 .0 100.0------- -------
Total 4494 100.0
aemplen end employment at age of
Value Label Value Frequency % Cum%not asked;aemplst=11 -5.00 62 1.4 1.4now employed -4.00 448 10.0 11.3never had job -3.00 303 6.7 18.1no answer -1.00 157 3.5 21.6
11.44 1 .0 21.6<interrupted>
86.27 1 .0 100.0------- -------
Total 4494 100.0
What is your primary occupation?What was your occupation when you retired / left the labor force?What was your primary occupation at that time that you started working at your first job?
Welk beroep oefent u voornamelijk uit?Wat was het laatste beroep dat u (voor uw 65ste) hebt uitgeoefend?Welk beroep oefende u voornamelijk uit toen u met uw eerste betaalde baan begon?
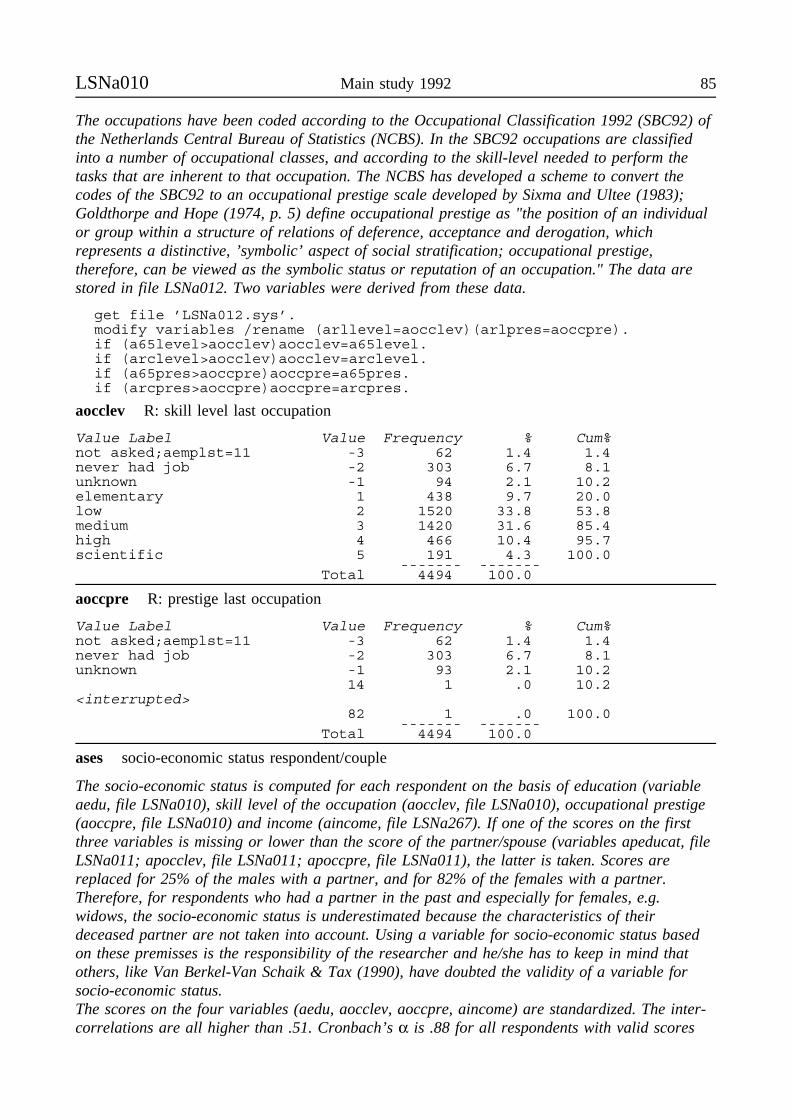
LSNa010 Main study 1992 85
The occupations have been coded according to the Occupational Classification 1992 (SBC92) ofthe Netherlands Central Bureau of Statistics (NCBS). In the SBC92 occupations are classifiedinto a number of occupational classes, and according to the skill-level needed to perform thetasks that are inherent to that occupation. The NCBS has developed a scheme to convert thecodes of the SBC92 to an occupational prestige scale developed by Sixma and Ultee (1983);Goldthorpe and Hope (1974, p. 5) define occupational prestige as "the position of an individualor group within a structure of relations of deference, acceptance and derogation, whichrepresents a distinctive, ’symbolic’ aspect of social stratification; occupational prestige,therefore, can be viewed as the symbolic status or reputation of an occupation." The data arestored in file LSNa012. Two variables were derived from these data.
get file ’LSNa012.sys’.modify variables /rename (arllevel=aocclev)(arlpres=aoccpre).if (a65level>aocclev)aocclev=a65level.if (arclevel>aocclev)aocclev=arclevel.if (a65pres>aoccpre)aoccpre=a65pres.if (arcpres>aoccpre)aoccpre=arcpres.
aocclev R: skill level last occupation
Value Label Value Frequency % Cum%not asked;aemplst=11 -3 62 1.4 1.4never had job -2 303 6.7 8.1unknown -1 94 2.1 10.2elementary 1 438 9.7 20.0low 2 1520 33.8 53.8medium 3 1420 31.6 85.4high 4 466 10.4 95.7scientific 5 191 4.3 100.0
------- -------Total 4494 100.0
aoccpre R: prestige last occupation
Value Label Value Frequency % Cum%not asked;aemplst=11 -3 62 1.4 1.4never had job -2 303 6.7 8.1unknown -1 93 2.1 10.2
14 1 .0 10.2<interrupted>
82 1 .0 100.0------- -------
Total 4494 100.0
ases socio-economic status respondent/couple
The socio-economic status is computed for each respondent on the basis of education (variableaedu, file LSNa010), skill level of the occupation (aocclev, file LSNa010), occupational prestige(aoccpre, file LSNa010) and income (aincome, file LSNa267). If one of the scores on the firstthree variables is missing or lower than the score of the partner/spouse (variables apeducat, fileLSNa011; apocclev, file LSNa011; apoccpre, file LSNa011), the latter is taken. Scores arereplaced for 25% of the males with a partner, and for 82% of the females with a partner.Therefore, for respondents who had a partner in the past and especially for females, e.g.widows, the socio-economic status is underestimated because the characteristics of theirdeceased partner are not taken into account. Using a variable for socio-economic status basedon these premisses is the responsibility of the researcher and he/she has to keep in mind thatothers, like Van Berkel-Van Schaik & Tax (1990), have doubted the validity of a variable forsocio-economic status.The scores on the four variables (aedu, aocclev, aoccpre, aincome) are standardized. The inter-correlations are all higher than .51. Cronbach’s α is .88 for all respondents with valid scores
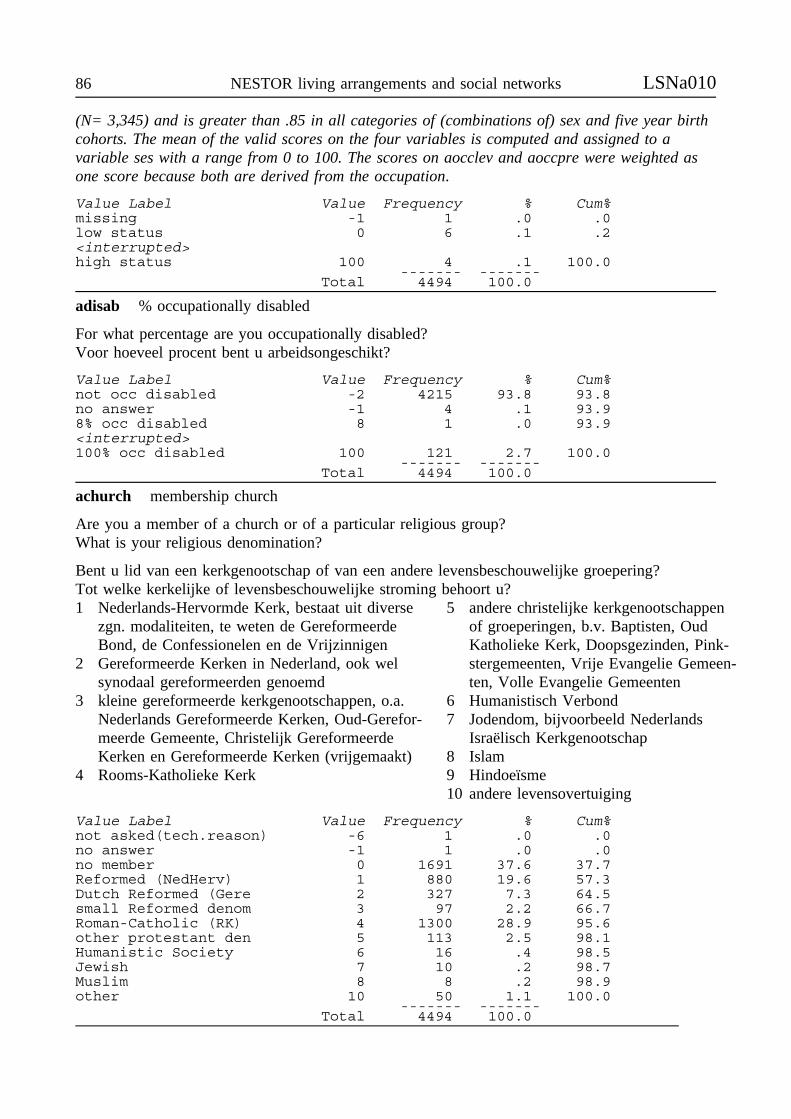
86 NESTOR living arrangements and social networks LSNa010
(N= 3,345) and is greater than .85 in all categories of (combinations of) sex and five year birthcohorts. The mean of the valid scores on the four variables is computed and assigned to avariable ses with a range from 0 to 100. The scores on aocclev and aoccpre were weighted asone score because both are derived from the occupation.
Value Label Value Frequency % Cum%missing -1 1 .0 .0low status 0 6 .1 .2<interrupted>high status 100 4 .1 100.0
------- -------Total 4494 100.0
adisab % occupationally disabled
For what percentage are you occupationally disabled?Voor hoeveel procent bent u arbeidsongeschikt?
Value Label Value Frequency % Cum%not occ disabled -2 4215 93.8 93.8no answer -1 4 .1 93.98% occ disabled 8 1 .0 93.9<interrupted>100% occ disabled 100 121 2.7 100.0
------- -------Total 4494 100.0
achurch membership church
Are you a member of a church or of a particular religious group?What is your religious denomination?
Bent u lid van een kerkgenootschap of van een andere levensbeschouwelijke groepering?Tot welke kerkelijke of levensbeschouwelijke stroming behoort u?1 Nederlands-Hervormde Kerk, bestaat uit diverse
zgn. modaliteiten, te weten de GereformeerdeBond, de Confessionelen en de Vrijzinnigen
2 Gereformeerde Kerken in Nederland, ook welsynodaal gereformeerden genoemd
3 kleine gereformeerde kerkgenootschappen, o.a.Nederlands Gereformeerde Kerken, Oud-Gerefor-meerde Gemeente, Christelijk GereformeerdeKerken en Gereformeerde Kerken (vrijgemaakt)
4 Rooms-Katholieke Kerk
5 andere christelijke kerkgenootschappenof groeperingen, b.v. Baptisten, OudKatholieke Kerk, Doopsgezinden, Pink-stergemeenten, Vrije Evangelie Gemeen-ten, Volle Evangelie Gemeenten
6 Humanistisch Verbond7 Jodendom, bijvoorbeeld Nederlands
Israëlisch Kerkgenootschap8 Islam9 Hindoeïsme10 andere levensovertuiging
Value Label Value Frequency % Cum%not asked(tech.reason) -6 1 .0 .0no answer -1 1 .0 .0no member 0 1691 37.6 37.7Reformed (NedHerv) 1 880 19.6 57.3Dutch Reformed (Gere 2 327 7.3 64.5small Reformed denom 3 97 2.2 66.7Roman-Catholic (RK) 4 1300 28.9 95.6other protestant den 5 113 2.5 98.1Humanistic Society 6 16 .4 98.5Jewish 7 10 .2 98.7Muslim 8 8 .2 98.9other 10 50 1.1 100.0
------- -------Total 4494 100.0
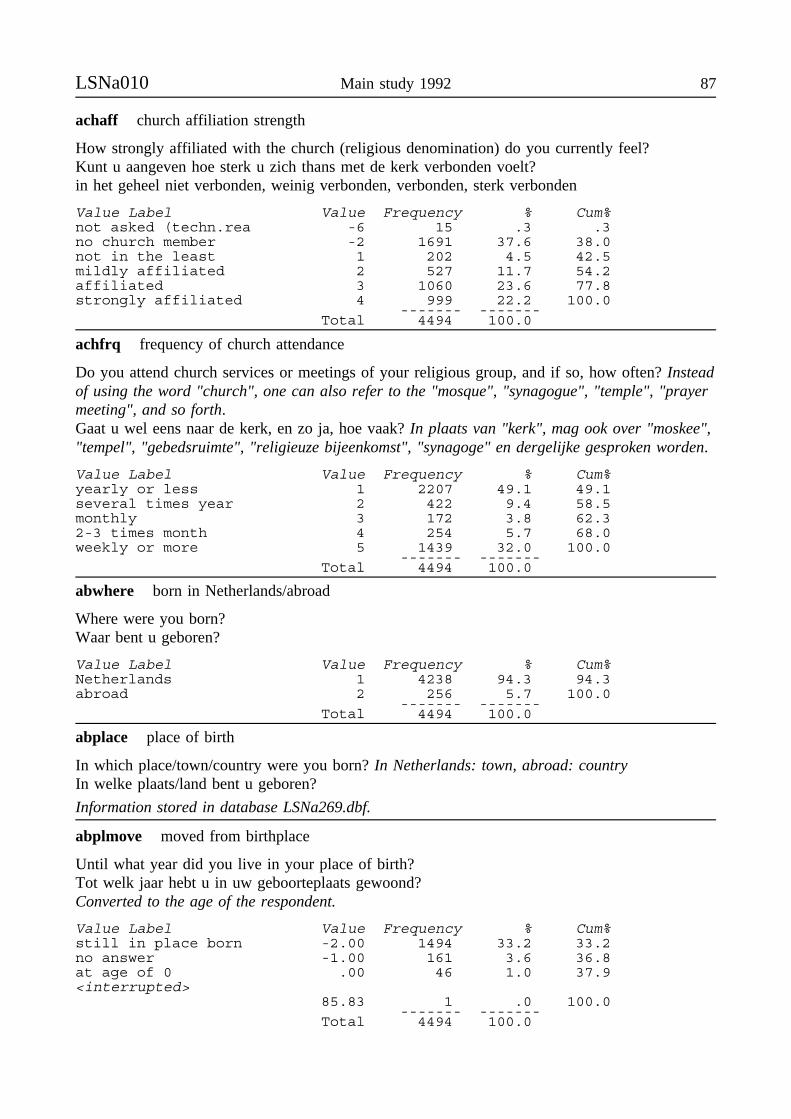
LSNa010 Main study 1992 87
achaff church affiliation strength
How strongly affiliated with the church (religious denomination) do you currently feel?Kunt u aangeven hoe sterk u zich thans met de kerk verbonden voelt?in het geheel niet verbonden, weinig verbonden, verbonden, sterk verbonden
Value Label Value Frequency % Cum%not asked (techn.rea -6 15 .3 .3no church member -2 1691 37.6 38.0not in the least 1 202 4.5 42.5mildly affiliated 2 527 11.7 54.2affiliated 3 1060 23.6 77.8strongly affiliated 4 999 22.2 100.0
------- -------Total 4494 100.0
achfrq frequency of church attendance
Do you attend church services or meetings of your religious group, and if so, how often? Insteadof using the word "church", one can also refer to the "mosque", "synagogue", "temple", "prayermeeting", and so forth.Gaat u wel eens naar de kerk, en zo ja, hoe vaak? In plaats van "kerk", mag ook over "moskee","tempel", "gebedsruimte", "religieuze bijeenkomst", "synagoge" en dergelijke gesproken worden.
Value Label Value Frequency % Cum%yearly or less 1 2207 49.1 49.1several times year 2 422 9.4 58.5monthly 3 172 3.8 62.32-3 times month 4 254 5.7 68.0weekly or more 5 1439 32.0 100.0
------- -------Total 4494 100.0
abwhere born in Netherlands/abroad
Where were you born?Waar bent u geboren?
Value Label Value Frequency % Cum%Netherlands 1 4238 94.3 94.3abroad 2 256 5.7 100.0
------- -------Total 4494 100.0
abplace place of birth
In which place/town/country were you born? In Netherlands: town, abroad: countryIn welke plaats/land bent u geboren?
Information stored in database LSNa269.dbf.
abplmove moved from birthplace
Until what year did you live in your place of birth?Tot welk jaar hebt u in uw geboorteplaats gewoond?Converted to the age of the respondent.
Value Label Value Frequency % Cum%still in place born -2.00 1494 33.2 33.2no answer -1.00 161 3.6 36.8at age of 0 .00 46 1.0 37.9<interrupted>
85.83 1 .0 100.0------- -------
Total 4494 100.0
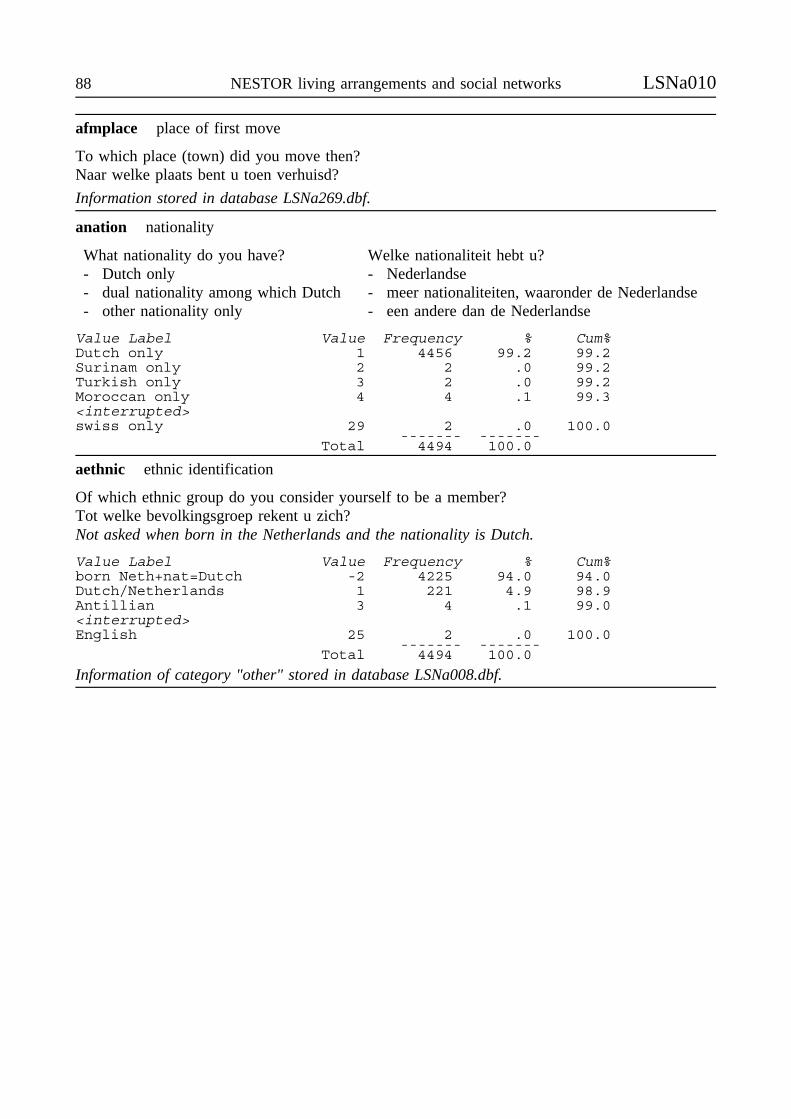
88 NESTOR living arrangements and social networks LSNa010
afmplace place of first move
To which place (town) did you move then?Naar welke plaats bent u toen verhuisd?
Information stored in database LSNa269.dbf.
anation nationality
What nationality do you have?- Dutch only- dual nationality among which Dutch- other nationality only
Welke nationaliteit hebt u?- Nederlandse- meer nationaliteiten, waaronder de Nederlandse- een andere dan de Nederlandse
Value Label Value Frequency % Cum%Dutch only 1 4456 99.2 99.2Surinam only 2 2 .0 99.2Turkish only 3 2 .0 99.2Moroccan only 4 4 .1 99.3<interrupted>swiss only 29 2 .0 100.0
------- -------Total 4494 100.0
aethnic ethnic identification
Of which ethnic group do you consider yourself to be a member?Tot welke bevolkingsgroep rekent u zich?Not asked when born in the Netherlands and the nationality is Dutch.
Value Label Value Frequency % Cum%born Neth+nat=Dutch -2 4225 94.0 94.0Dutch/Netherlands 1 221 4.9 98.9Antillian 3 4 .1 99.0<interrupted>English 25 2 .0 100.0
------- -------Total 4494 100.0
Information of category "other" stored in database LSNa008.dbf.

LSNa011 Main Study 1992 89
LSNa011N: 2,759Data about: basic demographics partner/spouseData source: Respondent face to face interviewQuestionnaire: bdSelection of respondents: with partner only, if valid dataIdentification variable: RESPNR
A "partner" is either a spouse, a person of the opposite sex sharing living quarters consideredby the respondent to be a partner, a person of the same sex sharing living quarters consideredby the respondent to be a partner, or someone who is considered to be a partner, but with whomR does not share living quarters (also referred to as Living-Apart-Together; LAT-partner).Een "partner" is òf een huwelijkspartner, òf iemand van het andere geslacht met wie wordtsamengewoond en die als partner wordt beschouwd, òf iemand van hetzelfde geslacht met wordtsamengewoond en die als partner wordt beschouwd, òf iemand met wie R een lat-relatieonderhoudt.
apage age partner
When was your partner born? month .. year 19..Wanneer is uw partner geboren? maand .. jaar 19..The birth date is converted to the age at the day of the interview, with the birth day fixed at 15.When the partner participates in the network study, the birth day is known from that datacollection. In case of a missing value for the month, the month is set to 7 and the day to 1.
Value Label Value Frequency % Cum%not asked(techn.reas -6.00 7 .3 .3no answer -1.00 5 .2 .430.03 years old 30.03 1 .0 .5<interrupted>93.05 years old 93.05 1 .0 100.0
------- -------Total 2759 100.0
alatstrt start of lat-relationship <age R>
Since when have you and s/he been involved in a lat-relationship? month .. year 19..Sinds wanneer heeft u met deze man/vrouw een partnerrelatie? maand .. jaar 19..Converted to the age of the respondent.
Value Label Value Frequency % Cum%P in household/married -2.00 2677 97.0 97.0no answer -1.00 3 .1 97.122 years old 22.00 1 .0 97.2<interrupted>83.31 years old 83.31 1 .0 100.0
------- -------Total 2759 100.0
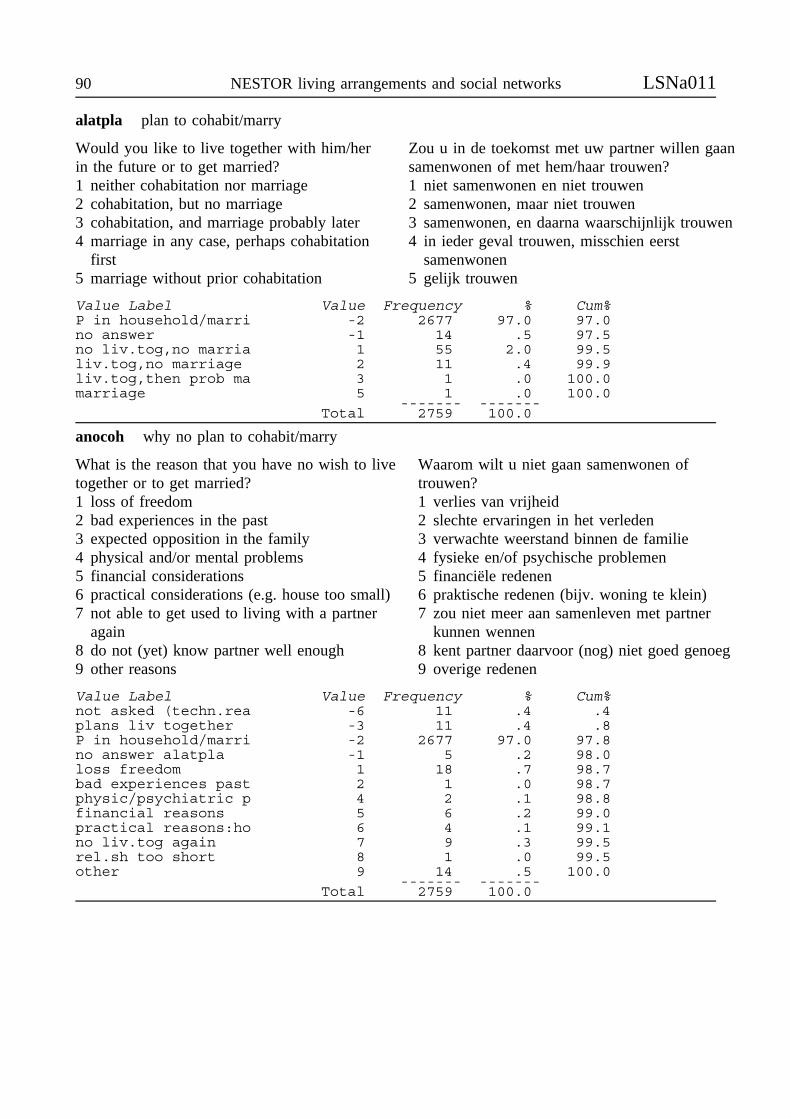
90 NESTOR living arrangements and social networks LSNa011
alatpla plan to cohabit/marry
Would you like to live together with him/herin the future or to get married?1 neither cohabitation nor marriage2 cohabitation, but no marriage3 cohabitation, and marriage probably later4 marriage in any case, perhaps cohabitation
first5 marriage without prior cohabitation
Zou u in de toekomst met uw partner willen gaansamenwonen of met hem/haar trouwen?1 niet samenwonen en niet trouwen2 samenwonen, maar niet trouwen3 samenwonen, en daarna waarschijnlijk trouwen4 in ieder geval trouwen, misschien eerst
samenwonen5 gelijk trouwen
Value Label Value Frequency % Cum%P in household/marri -2 2677 97.0 97.0no answer -1 14 .5 97.5no liv.tog,no marria 1 55 2.0 99.5liv.tog,no marriage 2 11 .4 99.9liv.tog,then prob ma 3 1 .0 100.0marriage 5 1 .0 100.0
------- -------Total 2759 100.0
anocoh why no plan to cohabit/marry
What is the reason that you have no wish to livetogether or to get married?1 loss of freedom2 bad experiences in the past3 expected opposition in the family4 physical and/or mental problems5 financial considerations6 practical considerations (e.g. house too small)7 not able to get used to living with a partner
again8 do not (yet) know partner well enough9 other reasons
Waarom wilt u niet gaan samenwonen oftrouwen?1 verlies van vrijheid2 slechte ervaringen in het verleden3 verwachte weerstand binnen de familie4 fysieke en/of psychische problemen5 financiële redenen6 praktische redenen (bijv. woning te klein)7 zou niet meer aan samenleven met partner
kunnen wennen8 kent partner daarvoor (nog) niet goed genoeg9 overige redenen
Value Label Value Frequency % Cum%not asked (techn.rea -6 11 .4 .4plans liv together -3 11 .4 .8P in household/marri -2 2677 97.0 97.8no answer alatpla -1 5 .2 98.0loss freedom 1 18 .7 98.7bad experiences past 2 1 .0 98.7physic/psychiatric p 4 2 .1 98.8financial reasons 5 6 .2 99.0practical reasons:ho 6 4 .1 99.1no liv.tog again 7 9 .3 99.5rel.sh too short 8 1 .0 99.5other 9 14 .5 100.0
------- -------Total 2759 100.0

LSNa011 Main Study 1992 91
awhencoh when plan to cohabit
Within what period of time would you prefer to start living together or to get married?Op welke termijn zou u het liefst met uw partner willen gaan samenleven?
Value Label Value Frequency % Cum%no plan liv together -3 55 2.0 2.0P in household/marri -2 2677 97.0 99.0no answer alatpla -1 14 .5 99.5within year 1 8 .3 99.8within 2 years 2 4 .1 100.0after 2 or more year 3 1 .0 100.0
------- -------Total 2759 100.0
apeducat level attained education partner
What is the highest level of education that your partner completed (i.e. received a diploma)?Wat is de hoogste opleiding die uw partner met een diploma heeft afgerond?
Value Label Value Frequency % Cum%not asked (techn.rea -6 8 .3 .3no answer -1 21 .8 1.1elementary not compl 1 208 7.5 8.6elementary education 2 1002 36.3 44.9lower vocational edu 3 575 20.8 65.7general intermediate 4 319 11.6 77.3intermediate vocatio 5 308 11.2 88.5general secondary ed 6 51 1.8 90.3higher vocational ed 7 186 6.7 97.1college education 8 29 1.1 98.1university education 9 52 1.9 100.0
------- -------Total 2759 100.0
apemplst employment status partner
Is your partner currently employed?Is your partner unemployed or looking for a job?Does one of the early retirement schemes apply to your partner?Is your partner occupationally disabled?Is your partner partially unemployed or looking for a job?Does one of the early retirement schemes partially apply to your partner?Is your partner partially occupationally disabled?
Verricht uw partner betaald werk?Is uw partner werkloos of werkzoekend?Is uw partner vervroegd gepensioneerd?Is uw partner arbeidsongeschikt?Is uw partner gedeeltelijk werkloos of werkzoekend?Is uw partner gedeeltelijk vervroegd gepensioneerd?Is uw partner gedeeltelijk arbeidsongeschikt?
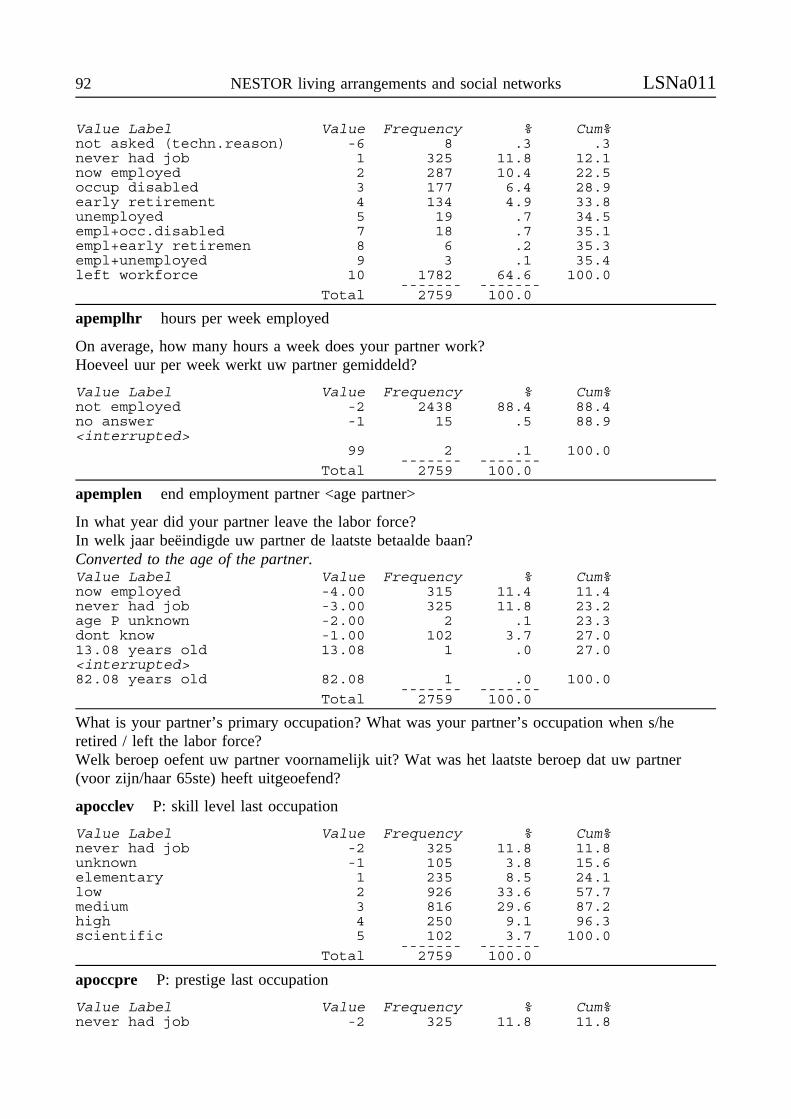
92 NESTOR living arrangements and social networks LSNa011
Value Label Value Frequency % Cum%not asked (techn.reason) -6 8 .3 .3never had job 1 325 11.8 12.1now employed 2 287 10.4 22.5occup disabled 3 177 6.4 28.9early retirement 4 134 4.9 33.8unemployed 5 19 .7 34.5empl+occ.disabled 7 18 .7 35.1empl+early retiremen 8 6 .2 35.3empl+unemployed 9 3 .1 35.4left workforce 10 1782 64.6 100.0
------- -------Total 2759 100.0
apemplhr hours per week employed
On average, how many hours a week does your partner work?Hoeveel uur per week werkt uw partner gemiddeld?
Value Label Value Frequency % Cum%not employed -2 2438 88.4 88.4no answer -1 15 .5 88.9<interrupted>
99 2 .1 100.0------- -------
Total 2759 100.0
apemplen end employment partner <age partner>
In what year did your partner leave the labor force?In welk jaar beëindigde uw partner de laatste betaalde baan?Converted to the age of the partner.Value Label Value Frequency % Cum%now employed -4.00 315 11.4 11.4never had job -3.00 325 11.8 23.2age P unknown -2.00 2 .1 23.3dont know -1.00 102 3.7 27.013.08 years old 13.08 1 .0 27.0<interrupted>82.08 years old 82.08 1 .0 100.0
------- -------Total 2759 100.0
What is your partner’s primary occupation? What was your partner’s occupation when s/heretired / left the labor force?Welk beroep oefent uw partner voornamelijk uit? Wat was het laatste beroep dat uw partner(voor zijn/haar 65ste) heeft uitgeoefend?
apocclev P: skill level last occupation
Value Label Value Frequency % Cum%never had job -2 325 11.8 11.8unknown -1 105 3.8 15.6elementary 1 235 8.5 24.1low 2 926 33.6 57.7medium 3 816 29.6 87.2high 4 250 9.1 96.3scientific 5 102 3.7 100.0
------- -------Total 2759 100.0
apoccpre P: prestige last occupation
Value Label Value Frequency % Cum%never had job -2 325 11.8 11.8
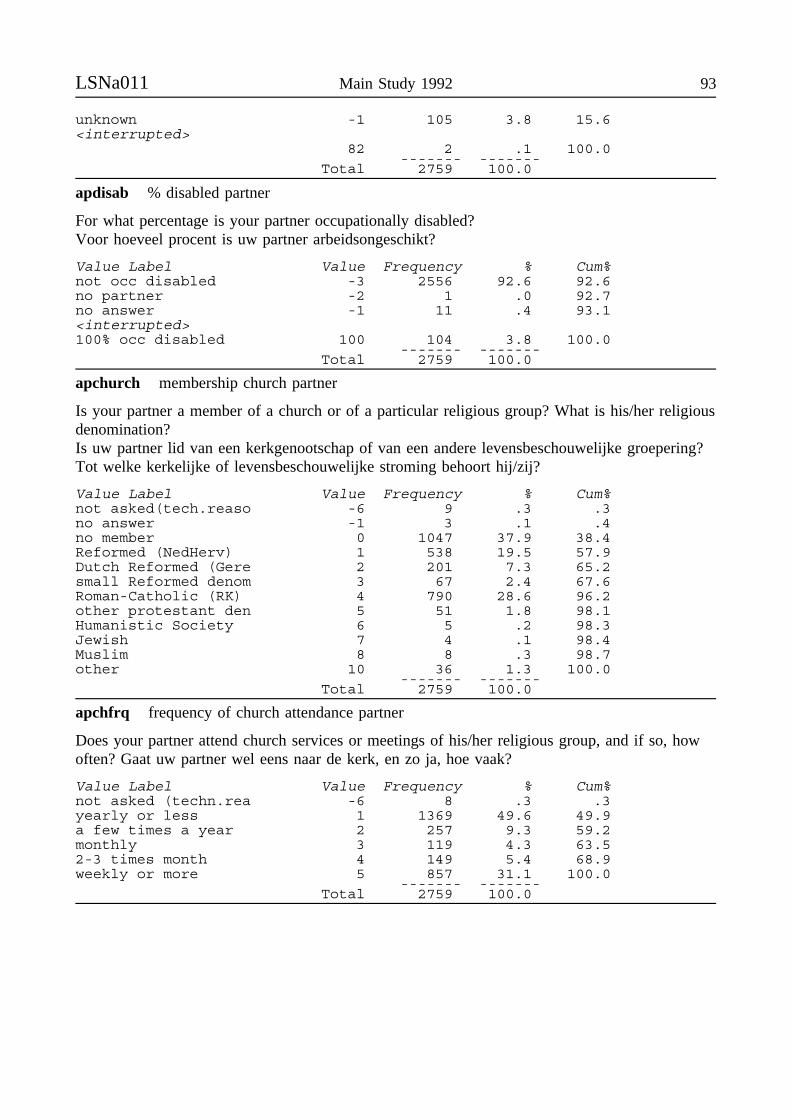
LSNa011 Main Study 1992 93
unknown -1 105 3.8 15.6<interrupted>
82 2 .1 100.0------- -------
Total 2759 100.0
apdisab % disabled partner
For what percentage is your partner occupationally disabled?Voor hoeveel procent is uw partner arbeidsongeschikt?
Value Label Value Frequency % Cum%not occ disabled -3 2556 92.6 92.6no partner -2 1 .0 92.7no answer -1 11 .4 93.1<interrupted>100% occ disabled 100 104 3.8 100.0
------- -------Total 2759 100.0
apchurch membership church partner
Is your partner a member of a church or of a particular religious group? What is his/her religiousdenomination?Is uw partner lid van een kerkgenootschap of van een andere levensbeschouwelijke groepering?Tot welke kerkelijke of levensbeschouwelijke stroming behoort hij/zij?
Value Label Value Frequency % Cum%not asked(tech.reaso -6 9 .3 .3no answer -1 3 .1 .4no member 0 1047 37.9 38.4Reformed (NedHerv) 1 538 19.5 57.9Dutch Reformed (Gere 2 201 7.3 65.2small Reformed denom 3 67 2.4 67.6Roman-Catholic (RK) 4 790 28.6 96.2other protestant den 5 51 1.8 98.1Humanistic Society 6 5 .2 98.3Jewish 7 4 .1 98.4Muslim 8 8 .3 98.7other 10 36 1.3 100.0
------- -------Total 2759 100.0
apchfrq frequency of church attendance partner
Does your partner attend church services or meetings of his/her religious group, and if so, howoften? Gaat uw partner wel eens naar de kerk, en zo ja, hoe vaak?
Value Label Value Frequency % Cum%not asked (techn.rea -6 8 .3 .3yearly or less 1 1369 49.6 49.9a few times a year 2 257 9.3 59.2monthly 3 119 4.3 63.52-3 times month 4 149 5.4 68.9weekly or more 5 857 31.1 100.0
------- -------Total 2759 100.0
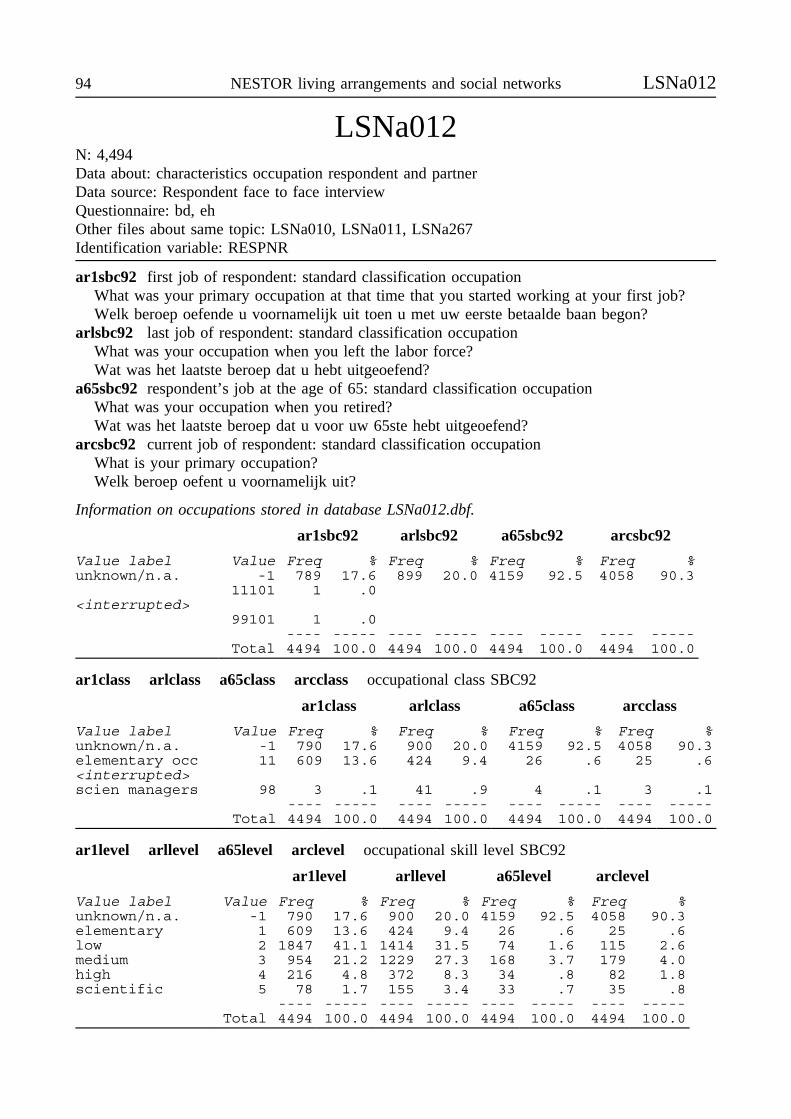
94 NESTOR living arrangements and social networks LSNa012
LSNa012N: 4,494Data about: characteristics occupation respondent and partnerData source: Respondent face to face interviewQuestionnaire: bd, ehOther files about same topic: LSNa010, LSNa011, LSNa267Identification variable: RESPNR
ar1sbc92 first job of respondent: standard classification occupationWhat was your primary occupation at that time that you started working at your first job?Welk beroep oefende u voornamelijk uit toen u met uw eerste betaalde baan begon?
arlsbc92 last job of respondent: standard classification occupationWhat was your occupation when you left the labor force?Wat was het laatste beroep dat u hebt uitgeoefend?
a65sbc92 respondent’s job at the age of 65: standard classification occupationWhat was your occupation when you retired?Wat was het laatste beroep dat u voor uw 65ste hebt uitgeoefend?
arcsbc92 current job of respondent: standard classification occupationWhat is your primary occupation?Welk beroep oefent u voornamelijk uit?
Information on occupations stored in database LSNa012.dbf.
ar1sbc92 arlsbc92 a65sbc92 arcsbc92
Value label Value Freq % Freq % Freq % Freq %unknown/n.a. -1 789 17.6 899 20.0 4159 92.5 4058 90.3
11101 1 .0<interrupted>
99101 1 .0---- ----- ---- ----- ---- ----- ---- -----
Total 4494 100.0 4494 100.0 4494 100.0 4494 100.0
ar1class arlclass a65class arcclass occupational class SBC92
ar1class arlclass a65class arcclass
Value label Value Freq % Freq % Freq % Freq %unknown/n.a. -1 790 17.6 900 20.0 4159 92.5 4058 90.3elementary occ 11 609 13.6 424 9.4 26 .6 25 .6<interrupted>scien managers 98 3 .1 41 .9 4 .1 3 .1
---- ----- ---- ----- ---- ----- ---- -----Total 4494 100.0 4494 100.0 4494 100.0 4494 100.0
ar1level arllevel a65level arclevel occupational skill level SBC92
ar1level arllevel a65level arclevel
Value label Value Freq % Freq % Freq % Freq %unknown/n.a. -1 790 17.6 900 20.0 4159 92.5 4058 90.3elementary 1 609 13.6 424 9.4 26 .6 25 .6low 2 1847 41.1 1414 31.5 74 1.6 115 2.6medium 3 954 21.2 1229 27.3 168 3.7 179 4.0high 4 216 4.8 372 8.3 34 .8 82 1.8scientific 5 78 1.7 155 3.4 33 .7 35 .8
---- ----- ---- ----- ---- ----- ---- -----Total 4494 100.0 4494 100.0 4494 100.0 4494 100.0
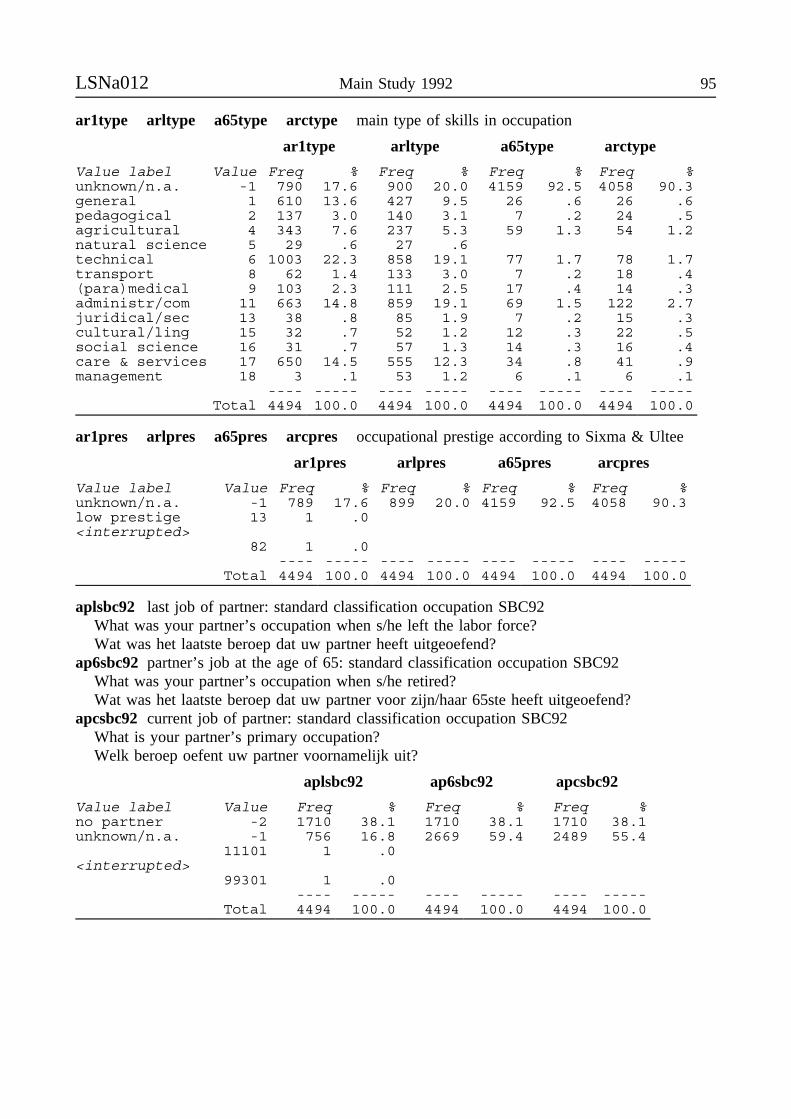
LSNa012 Main Study 1992 95
ar1type arltype a65type arctype main type of skills in occupation
ar1type arltype a65type arctype
Value label Value Freq % Freq % Freq % Freq %unknown/n.a. -1 790 17.6 900 20.0 4159 92.5 4058 90.3general 1 610 13.6 427 9.5 26 .6 26 .6pedagogical 2 137 3.0 140 3.1 7 .2 24 .5agricultural 4 343 7.6 237 5.3 59 1.3 54 1.2natural science 5 29 .6 27 .6technical 6 1003 22.3 858 19.1 77 1.7 78 1.7transport 8 62 1.4 133 3.0 7 .2 18 .4(para)medical 9 103 2.3 111 2.5 17 .4 14 .3administr/com 11 663 14.8 859 19.1 69 1.5 122 2.7juridical/sec 13 38 .8 85 1.9 7 .2 15 .3cultural/ling 15 32 .7 52 1.2 12 .3 22 .5social science 16 31 .7 57 1.3 14 .3 16 .4care & services 17 650 14.5 555 12.3 34 .8 41 .9management 18 3 .1 53 1.2 6 .1 6 .1
---- ----- ---- ----- ---- ----- ---- -----Total 4494 100.0 4494 100.0 4494 100.0 4494 100.0
ar1pres arlpres a65pres arcpres occupational prestige according to Sixma & Ultee
ar1pres arlpres a65pres arcpres
Value label Value Freq % Freq % Freq % Freq %unknown/n.a. -1 789 17.6 899 20.0 4159 92.5 4058 90.3low prestige 13 1 .0<interrupted>
82 1 .0---- ----- ---- ----- ---- ----- ---- -----
Total 4494 100.0 4494 100.0 4494 100.0 4494 100.0
aplsbc92 last job of partner: standard classification occupation SBC92What was your partner’s occupation when s/he left the labor force?Wat was het laatste beroep dat uw partner heeft uitgeoefend?
ap6sbc92 partner’s job at the age of 65: standard classification occupation SBC92What was your partner’s occupation when s/he retired?Wat was het laatste beroep dat uw partner voor zijn/haar 65ste heeft uitgeoefend?
apcsbc92 current job of partner: standard classification occupation SBC92What is your partner’s primary occupation?Welk beroep oefent uw partner voornamelijk uit?
aplsbc92 ap6sbc92 apcsbc92
Value label Value Freq % Freq % Freq %no partner -2 1710 38.1 1710 38.1 1710 38.1unknown/n.a. -1 756 16.8 2669 59.4 2489 55.4
11101 1 .0<interrupted>
99301 1 .0---- ----- ---- ----- ---- -----
Total 4494 100.0 4494 100.0 4494 100.0
96 NESTOR living arrangements and social networks LSNa012
aplclass ap6class apcclass occupational class SBC92
aplclass ap6class apcclassValue label Value Freq % Freq % Freq %no partner -2 1710 38.1 1710 38.1 1710 38.1unknown/n.a. -1 756 16.8 2669 59.4 2490 55.4elementary occupatio 11 215 4.8 10 .2 21 .5<interrupted>scien managers 98 23 .5 2 .0 2 .0
---- ----- ---- ----- ---- -----Total 4494 100.0 4494 100.0 4494 100.0
apllevel ap6level apclevel occupational skill level SBC92
apllevel ap6level apclevelValue label Value Freq % Freq % Freq %no partner -2 1710 38.1 1710 38.1 1710 38.1unknown/n.a. -1 756 16.8 2669 59.4 2490 55.4elementary 1 215 4.8 10 .2 21 .5low 2 856 19.0 21 .5 69 1.5medium 3 695 15.5 57 1.3 119 2.6high 4 177 3.9 18 .4 69 1.5scientific 5 85 1.9 9 .2 16 .4
---- ----- ---- ----- ---- -----Total 4494 100.0 4494 100.0 4494 100.0
apltype ap6type apctype main type of skills in occupation
apltype ap6type apctypeValue label Value Freq % Freq % Freq %no partner -2 1710 38.1 1710 38.1 1710 38.1unknown/n.a. -1 756 16.8 2669 59.4 2490 55.4general 1 216 4.8 11 .2 23 .5pedagogical 2 72 1.6 5 .1 18 .4agricultural 4 127 2.8 21 .5 34 .8natural science 5 13 .3 0 .0 2 .0technical 6 495 11.0 22 .5 52 1.2transport 8 74 1.6 3 .1 5 .1(para)medical 9 65 1.4 3 .1 13 .3administr/commercial 11 495 11.0 34 .8 94 2.1juridical/security 13 43 1.0 3 .1 5 .1cultural/linguistic 15 19 .4 2 .0 9 .2social science 16 25 .6 6 .1 12 .3care & services 17 358 8.0 3 .1 21 .5management 18 26 .6 2 .1 6 .1
---- ----- ---- ----- ---- -----Total 4494 100.0 4494 100.0 4494 100.0
aplpres ap6pres apcpres occupational prestige (Sixma & Ultee)
aplpres ap6pres apcpresValue label Value Freq % Freq % Freq %no partner -2 1710 38.1 1710 38.1 1710 38.1unknown/n.a. -1 756 16.8 2669 59.4 2490 55.4
17 31 .7<interrupted>
82 2 .0---- ----- ---- ----- ---- -----
Total 4494 100.0 4494 100.0 4494 100.0
LSNa013 Main Study 1992 97
LSNa013N: 4,491Data about: choice short version questionnaireData source: InterviewerOther files about same topic: LSNa014Questionnaire: msIdentification variable: RESPNR
The short form of the Minimal Mental State Examination (a cognitive screening test) isadministered if in the view of the interviewer, the respondent needs a considerable amount oftime to answer general background questions, and/or provides a date of birth which differs fromthat based on information from the population registers. On the basis of the results of thecognitive test, the interviewer decides either to continue with the rest of the regular interviewschedule, or to administer the short version.
asuspect administer cognitive test?
Interviewer, relatively much time has passed since the interview started (.. minutes)/ the date ofbirth provided by R is incorrect. Is it possible that R is unable to complete the full interview?What is your opinion?
Interviewer, de tot dusverre verlopen tijd is lang (.. minuten)/ R heeft een onjuistegeboortedatum gegeven. Kan het zijn dat R niet goed in staat is het volledige interview tevoltooien? Wat is uw mening?- het is zinvol om de cognitieve test te doen- er waren bijzondere omstandigheden, de capaciteiten van R zijn voldoende, de cognitieve test
is niet zinvol
Value Label Value Frequency % Cum%no test 1 4308 95.9 95.9yes, examine test 2 183 4.1 100.0
------- -------Total 4491 100.0
ashort short version questionnaire?
Asked after the questiona of LSNa014: Interviewer, R has obtained a score of .. That is very low/ not very poor, but not very good either / high; there is probably no need to administer the shortversion (the maximum score is 18, obtained if no errors are made). You should be aware that theinterview can always be terminated if no progress is being made. Have you decided toadminister the short version? Please tell us why you made this decision. Interviewer, are yousure that the short version should be administered?
Interviewer, R heeft .. punten gescoord (het maximum is 18, bij geen fouten). Dat is erg weinig /dat is niet erg slecht, maar ook niet erg goed / dat is veel; er is waarschijnlijk geen reden vooreen kort interview. U weet dat u hierna altijd het interview kan onderbreken wanneer het echtniet meer gaat. Kiest u voor de zeer korte versie van de vragenlijst? Geef een toelichting.Interviewer, weet u zeker dat u kiest voor de verkorte versie?
Value Label Value Frequency % Cum%no,long version 1 4136 92.1 92.1yes,short but not confirmed 2 9 .2 92.3yes,short and confirmed 3 346 7.7 100.0
------- -------Total 4491 100.0
ashort_r reason for short version
98 NESTOR living arrangements and social networks LSNa013
Value Label Value Frequency % Cum%no short version -2 4145 92.3 92.3no answer by I -1 15 .3 92.6other reason 1 7 .2 92.8language 10 13 .3 93.1no time, not interested 100 68 1.5 94.6emotional 1000 7 .2 94.7
1100 1 .0 94.8psychiatric 10000 7 .2 94.9cognitive 100000 78 1.7 96.7
100010 2 .0 96.7101000 2 .0 96.7
physical 1000000 94 2.1 98.81000001 1 .0 98.91000010 1 .0 98.91000100 1 .0 98.91001000 3 .1 99.01100000 45 1.0 100.01100010 1 .0 100.0
------- -------Total 4491 100.0
Information stored in database LSNa013.dbf.
LSNa014N: 183Data about: short cognitive testData source: Respondent face to face interviewOther files about same topic: LSNa013Questionnaire: msSelection of respondents: see variable asuspect (LSNa013)Identification variable: RESPNR
The next questions concern memory and concentration. To obtain an indication of these, the nextquestions are put to all the respondents. The other respondents will answer these questions in thesecond part of this data collection (1992, September - 1993, June).De volgende vragen gaan over geheugen en concentratie. Om daarvan een indruk te krijgenworden deze vragen in dit onderzoek aan iedereen gesteld. De overige respondenten zullen dezevragen beantwoorden in het tweede deel van het onderzoek (september 1992 - juni 1993).
Asked in the sequence: amemory1 ammse04 ammse06 ammse08 ammse11 ammse12 ammse17ammse14.
amemory1 ever had problems with memory?
Have you ever had any problems with your memory?Heeft u ooit problemen gehad met uw geheugen?
Value Label Value Frequency % Cum%no answer -1 1 .5 .5no 1 113 61.7 62.3yes 2 69 37.7 100.0
------- -------Total 183 100.0
The next questions are from Folstein, Folstein & McHugh (1975).
LSNa014 Main Study 1992 99
ammse04 What day of the week is it today? (Monday, Tuesday, etc.)Welke dag van de week is het nu? (Maandag, Dinsdag, etc.)
ammse06 Can you tell me which province we are in? (Noord Holland, Noord Brabant,Overijssel)Kunt u me zeggen in welke provincie we nu zijn?
ammse08 Can you give me the names of two main streets that are close to here? Any answer iscorrect. However, if R fails to provide two names or says "I don’t know", the answeris incorrect.Kunt u twee hoofdstraten hier vlakbij noemen? Elk antwoord is goed. Als R er geentwee noemt of zegt "ik weet het niet", is de score onjuist.
ammse17 Please repeat after me "No if, and or but". Speak slowly and clearly.Wilt u de volgende zin herhalen: "Geen als en of maar". Duidelijk en langzaamvoorlezen.
ammse04 ammse06 ammse08 ammse17
Value label Value Freq % Freq % Freq % Freq %no answer -1 3 1.6 4 2.2 5 2.7 5 2.7incorrect 1 52 28.4 46 25.1 90 49.2 118 64.5correct 2 128 69.9 133 72.7 88 48.1 60 32.8
---- ----- ---- ----- ---- ----- --- -----Total 183 100.0 183 100.0 183 100.0 183 100.0
ammse11 repeat names of 3 objects
I am going to give you the names of three objects. After I have done so, I would like you torepeat their names. Please try to remember the names of the three objects. Speak slowly, aboutone second for each word.
Apple Table NickelCan you repeat the names of the objects? Code the results of the first attempt. Count the numberof correct responses; the order in which the objects is given is not important. After the firstattempt, name the three words again. Ask the respondent to repeat them. Continue -with amaximum of five attempts- until the respondent is able to repeat the names of the three objects.Ik ga nu namen van drie voorwerpen opnoemen. Nadat ik die genoemd heb, moet u de namenvan deze voorwerpen herhalen. Probeert u deze drie voorwerpen te onthouden. Spreek langzaam,ongeveer één seconde per woord.
Appel Tafel StuiverKunt u de voorwerpen herhalen? Scoor de eerste poging. Tel het aantal goede woorden. Devolgorde van opsomming is niet van belang. Herhaal na de eerste poging de drie woorden, laatde respondent ze opnieuw herhalen, net zo lang tot de respondent ze goed herhaalt. Maximaalvijf pogingen.
ammse12 100-7-7-7-7-7=65Please subtract the number 7 from the number 100, and then subtract 7 from the resultingnumber and so on until I tell you to stop. The correct answers are: 93, 86, 79, 72, 65. At 65:stop! Wait 10 seconds at most between successive numbers. Count every difference of 7 as acorrect response. R is permitted to make corrections along the way.Kunt u van het getal 100 het getal 7 aftrekken en van wat u overhoudt weer 7 en zo verder totik stop zeg? De goede antwoorden zijn: 93, 86, 79, 72, 65. Bij 65: stop! Wacht maximaal 10seconden tussen opeenvolgende getallen. Ieder verschil van 7 goed rekenen. Tussentijdseverbeteringen zijn toegestaan.
ammse14 name 3 objects again
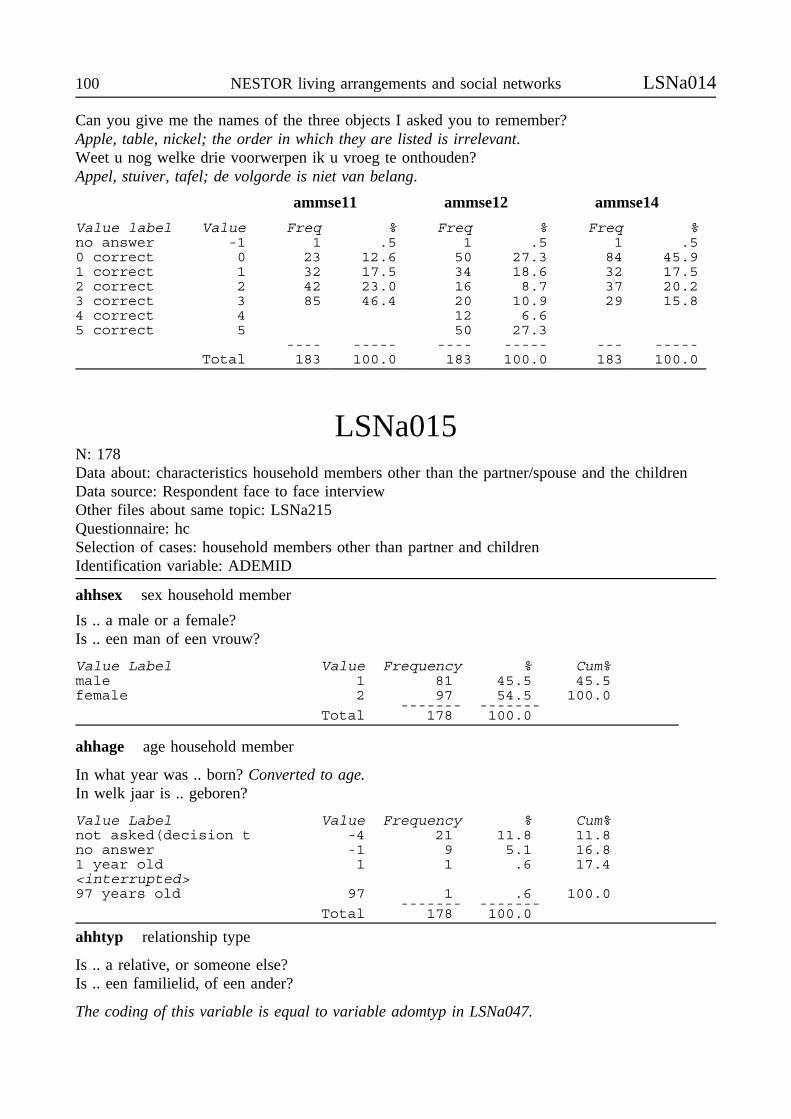
100 NESTOR living arrangements and social networks LSNa014
Can you give me the names of the three objects I asked you to remember?Apple, table, nickel; the order in which they are listed is irrelevant.Weet u nog welke drie voorwerpen ik u vroeg te onthouden?Appel, stuiver, tafel; de volgorde is niet van belang.
ammse11 ammse12 ammse14
Value label Value Freq % Freq % Freq %no answer -1 1 .5 1 .5 1 .50 correct 0 23 12.6 50 27.3 84 45.91 correct 1 32 17.5 34 18.6 32 17.52 correct 2 42 23.0 16 8.7 37 20.23 correct 3 85 46.4 20 10.9 29 15.84 correct 4 12 6.65 correct 5 50 27.3
---- ----- ---- ----- --- -----Total 183 100.0 183 100.0 183 100.0
LSNa015N: 178Data about: characteristics household members other than the partner/spouse and the childrenData source: Respondent face to face interviewOther files about same topic: LSNa215Questionnaire: hcSelection of cases: household members other than partner and childrenIdentification variable: ADEMID
ahhsex sex household member
Is .. a male or a female?Is .. een man of een vrouw?
Value Label Value Frequency % Cum%male 1 81 45.5 45.5female 2 97 54.5 100.0
------- -------Total 178 100.0
ahhage age household member
In what year was .. born? Converted to age.In welk jaar is .. geboren?
Value Label Value Frequency % Cum%not asked(decision t -4 21 11.8 11.8no answer -1 9 5.1 16.81 year old 1 1 .6 17.4<interrupted>97 years old 97 1 .6 100.0
------- -------Total 178 100.0
ahhtyp relationship type
Is .. a relative, or someone else?Is .. een familielid, of een ander?
The coding of this variable is equal to variable adomtyp in LSNa047.
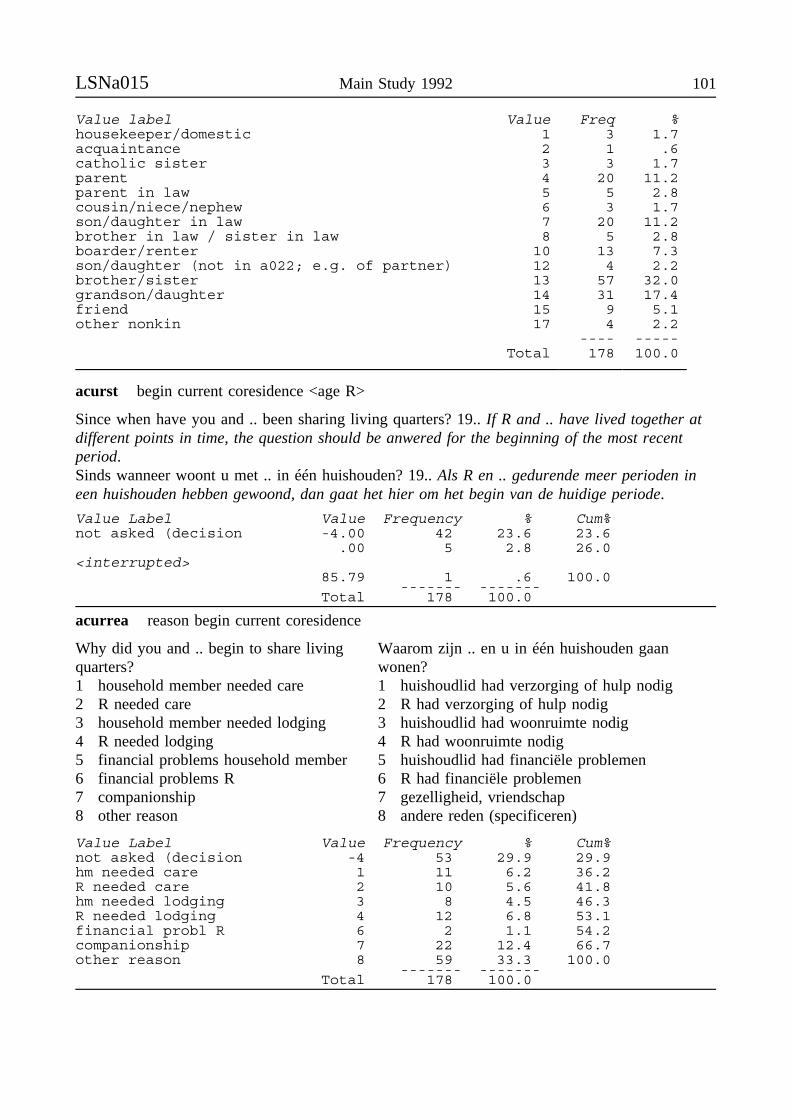
LSNa015 Main Study 1992 101
Value label Value Freq %housekeeper/domestic 1 3 1.7acquaintance 2 1 .6catholic sister 3 3 1.7parent 4 20 11.2parent in law 5 5 2.8cousin/niece/nephew 6 3 1.7son/daughter in law 7 20 11.2brother in law / sister in law 8 5 2.8boarder/renter 10 13 7.3son/daughter (not in a022; e.g. of partner) 12 4 2.2brother/sister 13 57 32.0grandson/daughter 14 31 17.4friend 15 9 5.1other nonkin 17 4 2.2
---- -----Total 178 100.0
acurst begin current coresidence <age R>
Since when have you and .. been sharing living quarters? 19.. If R and .. have lived together atdifferent points in time, the question should be anwered for the beginning of the most recentperiod.Sinds wanneer woont u met .. in één huishouden? 19.. Als R en .. gedurende meer perioden ineen huishouden hebben gewoond, dan gaat het hier om het begin van de huidige periode.
Value Label Value Frequency % Cum%not asked (decision -4.00 42 23.6 23.6
.00 5 2.8 26.0<interrupted>
85.79 1 .6 100.0------- -------
Total 178 100.0
acurrea reason begin current coresidence
Why did you and .. begin to share livingquarters?1 household member needed care2 R needed care3 household member needed lodging4 R needed lodging5 financial problems household member6 financial problems R7 companionship8 other reason
Waarom zijn .. en u in één huishouden gaanwonen?1 huishoudlid had verzorging of hulp nodig2 R had verzorging of hulp nodig3 huishoudlid had woonruimte nodig4 R had woonruimte nodig5 huishoudlid had financiële problemen6 R had financiële problemen7 gezelligheid, vriendschap8 andere reden (specificeren)
Value Label Value Frequency % Cum%not asked (decision -4 53 29.9 29.9hm needed care 1 11 6.2 36.2R needed care 2 10 5.6 41.8hm needed lodging 3 8 4.5 46.3R needed lodging 4 12 6.8 53.1financial probl R 6 2 1.1 54.2companionship 7 22 12.4 66.7other reason 8 59 33.3 100.0
------- -------Total 178 100.0
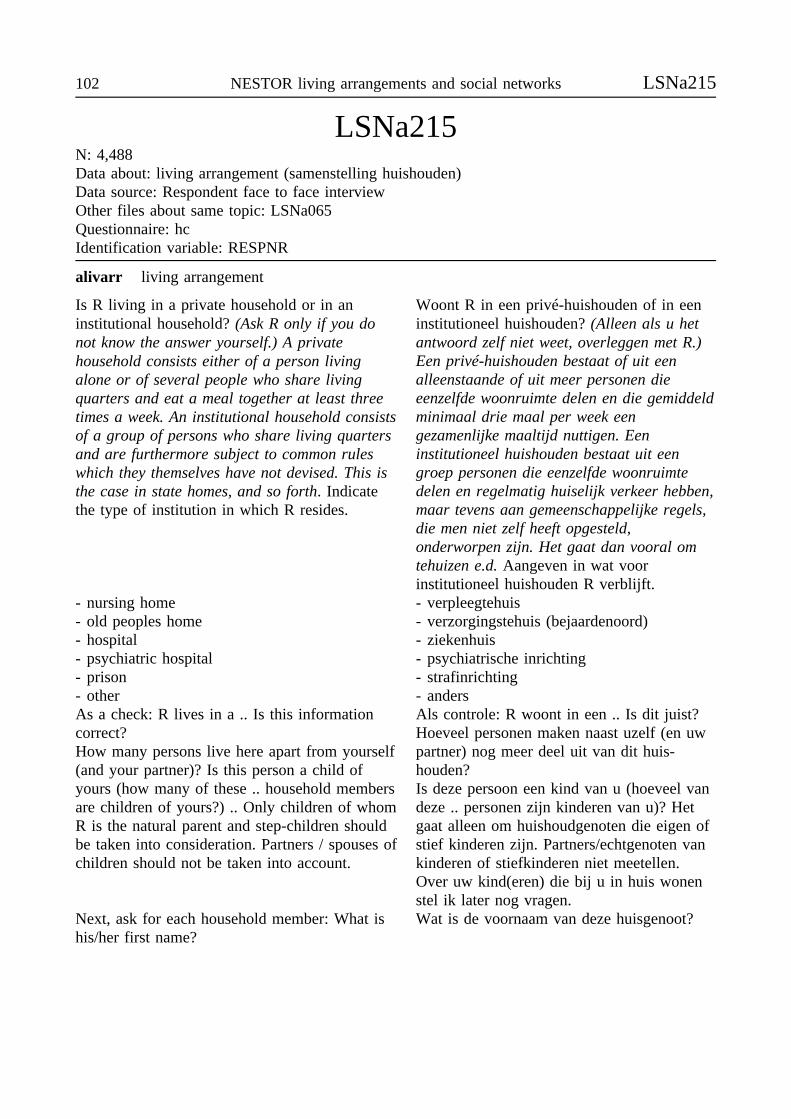
102 NESTOR living arrangements and social networks LSNa215
LSNa215N: 4,488Data about: living arrangement (samenstelling huishouden)Data source: Respondent face to face interviewOther files about same topic: LSNa065Questionnaire: hcIdentification variable: RESPNR
alivarr living arrangement
Is R living in a private household or in aninstitutional household? (Ask R only if you donot know the answer yourself.) A privatehousehold consists either of a person livingalone or of several people who share livingquarters and eat a meal together at least threetimes a week. An institutional household consistsof a group of persons who share living quartersand are furthermore subject to common ruleswhich they themselves have not devised. This isthe case in state homes, and so forth. Indicatethe type of institution in which R resides.
Woont R in een privé-huishouden of in eeninstitutioneel huishouden? (Alleen als u hetantwoord zelf niet weet, overleggen met R.)Een privé-huishouden bestaat of uit eenalleenstaande of uit meer personen dieeenzelfde woonruimte delen en die gemiddeldminimaal drie maal per week eengezamenlijke maaltijd nuttigen. Eeninstitutioneel huishouden bestaat uit eengroep personen die eenzelfde woonruimtedelen en regelmatig huiselijk verkeer hebben,maar tevens aan gemeenschappelijke regels,die men niet zelf heeft opgesteld,onderworpen zijn. Het gaat dan vooral omtehuizen e.d. Aangeven in wat voorinstitutioneel huishouden R verblijft.
- nursing home- old peoples home- hospital- psychiatric hospital- prison- other
- verpleegtehuis- verzorgingstehuis (bejaardenoord)- ziekenhuis- psychiatrische inrichting- strafinrichting- anders
As a check: R lives in a .. Is this informationcorrect?How many persons live here apart from yourself(and your partner)? Is this person a child ofyours (how many of these .. household membersare children of yours?) .. Only children of whomR is the natural parent and step-children shouldbe taken into consideration. Partners / spouses ofchildren should not be taken into account.
Als controle: R woont in een .. Is dit juist?Hoeveel personen maken naast uzelf (en uwpartner) nog meer deel uit van dit huis-houden?Is deze persoon een kind van u (hoeveel vandeze .. personen zijn kinderen van u)? Hetgaat alleen om huishoudgenoten die eigen ofstief kinderen zijn. Partners/echtgenoten vankinderen of stiefkinderen niet meetellen.Over uw kind(eren) die bij u in huis wonenstel ik later nog vragen.
Next, ask for each household member: What ishis/her first name?
Wat is de voornaam van deze huisgenoot?
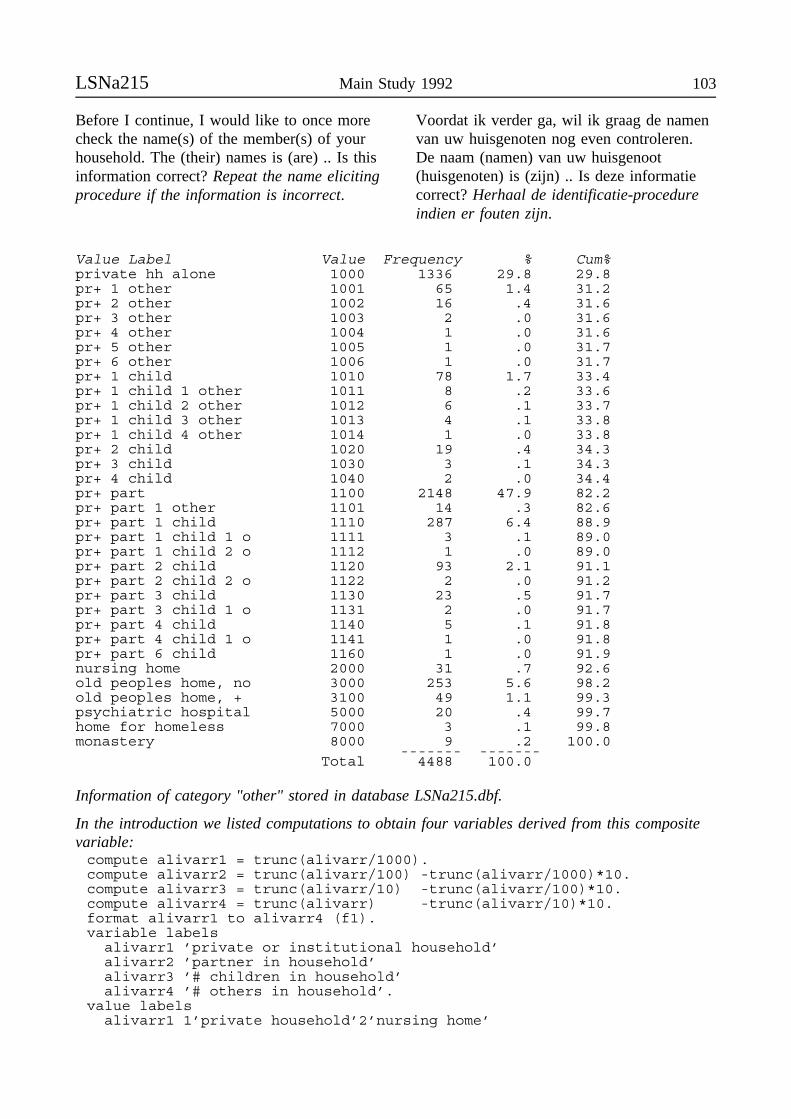
LSNa215 Main Study 1992 103
Before I continue, I would like to once morecheck the name(s) of the member(s) of yourhousehold. The (their) names is (are) .. Is thisinformation correct? Repeat the name elicitingprocedure if the information is incorrect.
Voordat ik verder ga, wil ik graag de namenvan uw huisgenoten nog even controleren.De naam (namen) van uw huisgenoot(huisgenoten) is (zijn) .. Is deze informatiecorrect? Herhaal de identificatie-procedureindien er fouten zijn.
Value Label Value Frequency % Cum%private hh alone 1000 1336 29.8 29.8pr+ 1 other 1001 65 1.4 31.2pr+ 2 other 1002 16 .4 31.6pr+ 3 other 1003 2 .0 31.6pr+ 4 other 1004 1 .0 31.6pr+ 5 other 1005 1 .0 31.7pr+ 6 other 1006 1 .0 31.7pr+ 1 child 1010 78 1.7 33.4pr+ 1 child 1 other 1011 8 .2 33.6pr+ 1 child 2 other 1012 6 .1 33.7pr+ 1 child 3 other 1013 4 .1 33.8pr+ 1 child 4 other 1014 1 .0 33.8pr+ 2 child 1020 19 .4 34.3pr+ 3 child 1030 3 .1 34.3pr+ 4 child 1040 2 .0 34.4pr+ part 1100 2148 47.9 82.2pr+ part 1 other 1101 14 .3 82.6pr+ part 1 child 1110 287 6.4 88.9pr+ part 1 child 1 o 1111 3 .1 89.0pr+ part 1 child 2 o 1112 1 .0 89.0pr+ part 2 child 1120 93 2.1 91.1pr+ part 2 child 2 o 1122 2 .0 91.2pr+ part 3 child 1130 23 .5 91.7pr+ part 3 child 1 o 1131 2 .0 91.7pr+ part 4 child 1140 5 .1 91.8pr+ part 4 child 1 o 1141 1 .0 91.8pr+ part 6 child 1160 1 .0 91.9nursing home 2000 31 .7 92.6old peoples home, no 3000 253 5.6 98.2old peoples home, + 3100 49 1.1 99.3psychiatric hospital 5000 20 .4 99.7home for homeless 7000 3 .1 99.8monastery 8000 9 .2 100.0
------- -------Total 4488 100.0
Information of category "other" stored in database LSNa215.dbf.
In the introduction we listed computations to obtain four variables derived from this compositevariable:compute alivarr1 = trunc(alivarr/1000).compute alivarr2 = trunc(alivarr/100) -trunc(alivarr/1000)*10.compute alivarr3 = trunc(alivarr/10) -trunc(alivarr/100)*10.compute alivarr4 = trunc(alivarr) -trunc(alivarr/10)*10.format alivarr1 to alivarr4 (f1).variable labelsalivarr1 ’private or institutional household’alivarr2 ’partner in household’alivarr3 ’# children in household’alivarr4 ’# others in household’.
value labelsalivarr1 1’private household’2’nursing home’
104 NESTOR living arrangements and social networks LSNa215
3’old peoples home’4’hospital’5’psychiatric hospital’7’home for homeless’8’monastery’/
alivarr2 0’no partner in hh’1’partner in household’/alivarr3 0’no childr in hh’1’1 child in hh’6’6 children in hh’/alivarr4 0’no others in hh’1’1 other in hh’6’6 others in hh’.
An alternative is to construct one variable about household composition / partner status.join match /file ’LSNa215.sys’ /keep respnr alivarr /table
’LSNa010.sys’ /keep respnr amarst /by respnr.if (alivarr>=1100 & alivarr<=1199)hhcomp=1.if (alivarr=1000 & amarst=1)hhcomp=2.if (alivarr=1000 & amarst=3)hhcomp=3.if (alivarr=1000 & amarst=4)hhcomp=4.if (alivarr>1000 & alivarr<=1099)hhcomp=5.if (alivarr=1000 & amarst=2)hhcomp=6.if (alivarr>=2000 & alivarr<=5000)hhcomp=7.if (alivarr>=7000)hhcomp=8.format hhcomp (f2).variable labels hhcomp ’household composition / partner status’.value labels hhcomp 1’with partner in household’ 2’alone,unmarried’
3’alone,divorced’ 4’alone,widowed’5’multi-person hh, no partner’6’spouse not in hh’ 7’institution’8’other’.
An other alternative:if ((alivarr>=1100 & alivarr<=1199) &
trunc(alivarr/10)-trunc(alivarr/100)*10 =0) hhcomp=1.if ((alivarr>=1100 & alivarr<=1199) &
trunc(alivarr/10)-trunc(alivarr/100)*10 >0) hhcomp=2.if (alivarr=1000)hhcomp=3.if ((alivarr>1000 & alivarr<=1099) &
trunc(alivarr/10)-trunc(alivarr/100)*10 >0) hhcomp=4.if ((alivarr>1000 & alivarr<=1099) &
trunc(alivarr/10)-trunc(alivarr/100)*10 =0) hhcomp=5.if (alivarr>=2000 & alivarr<=5000) hhcomp=6.if (alivarr>=7000)hhcomp=7.format hhcomp (f1).value labels hhcomp 1’with partner, no children (+ others)’
2’with partner & children (+ others)’3’alone’ 4’no partner, with children (+ others)’5’no partner, no children: only others’ 6’institution’7’other’.
variable labels hhcomp ’household composition’.
LSNa016N: 4,445Data about: characteristics residency / neighborhoodData source: Respondent face to face interviewOther files about same topic: LSNa005, LSNa216Questionnaire: $b, hr, rcSelection of cases: no missing values on type of residenceIdentification variable: RESPNR
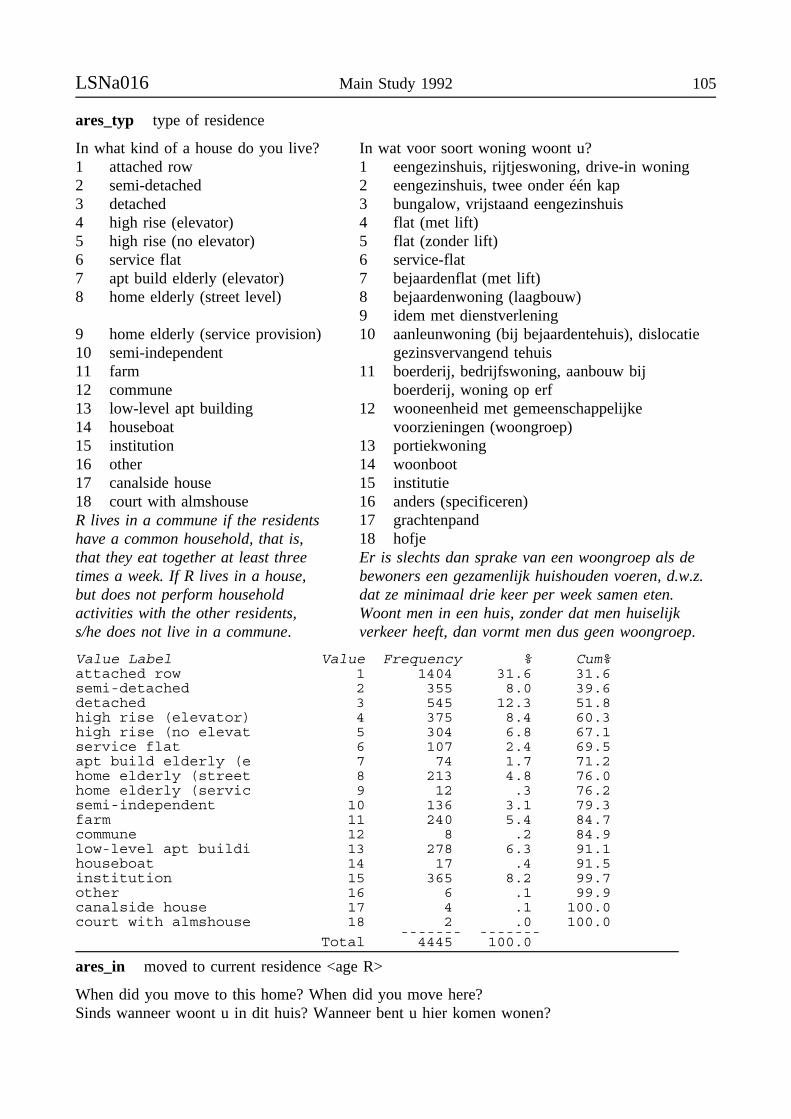
LSNa016 Main Study 1992 105
ares_typ type of residence
In what kind of a house do you live?1 attached row2 semi-detached3 detached4 high rise (elevator)5 high rise (no elevator)6 service flat7 apt build elderly (elevator)8 home elderly (street level)
In wat voor soort woning woont u?1 eengezinshuis, rijtjeswoning, drive-in woning2 eengezinshuis, twee onder één kap3 bungalow, vrijstaand eengezinshuis4 flat (met lift)5 flat (zonder lift)6 service-flat7 bejaardenflat (met lift)8 bejaardenwoning (laagbouw)9 idem met dienstverlening
9 home elderly (service provision)10 semi-independent11 farm12 commune13 low-level apt building14 houseboat15 institution16 other17 canalside house18 court with almshouseR lives in a commune if the residentshave a common household, that is,that they eat together at least threetimes a week. If R lives in a house,but does not perform householdactivities with the other residents,s/he does not live in a commune.
10 aanleunwoning (bij bejaardentehuis), dislocatiegezinsvervangend tehuis
11 boerderij, bedrijfswoning, aanbouw bijboerderij, woning op erf
12 wooneenheid met gemeenschappelijkevoorzieningen (woongroep)
13 portiekwoning14 woonboot15 institutie16 anders (specificeren)17 grachtenpand18 hofjeEr is slechts dan sprake van een woongroep als debewoners een gezamenlijk huishouden voeren, d.w.z.dat ze minimaal drie keer per week samen eten.Woont men in een huis, zonder dat men huiselijkverkeer heeft, dan vormt men dus geen woongroep.
Value Label Value Frequency % Cum%attached row 1 1404 31.6 31.6semi-detached 2 355 8.0 39.6detached 3 545 12.3 51.8high rise (elevator) 4 375 8.4 60.3high rise (no elevat 5 304 6.8 67.1service flat 6 107 2.4 69.5apt build elderly (e 7 74 1.7 71.2home elderly (street 8 213 4.8 76.0home elderly (servic 9 12 .3 76.2semi-independent 10 136 3.1 79.3farm 11 240 5.4 84.7commune 12 8 .2 84.9low-level apt buildi 13 278 6.3 91.1houseboat 14 17 .4 91.5institution 15 365 8.2 99.7other 16 6 .1 99.9canalside house 17 4 .1 100.0court with almshouse 18 2 .0 100.0
------- -------Total 4445 100.0
ares_in moved to current residence <age R>
When did you move to this home? When did you move here?Sinds wanneer woont u in dit huis? Wanneer bent u hier komen wonen?
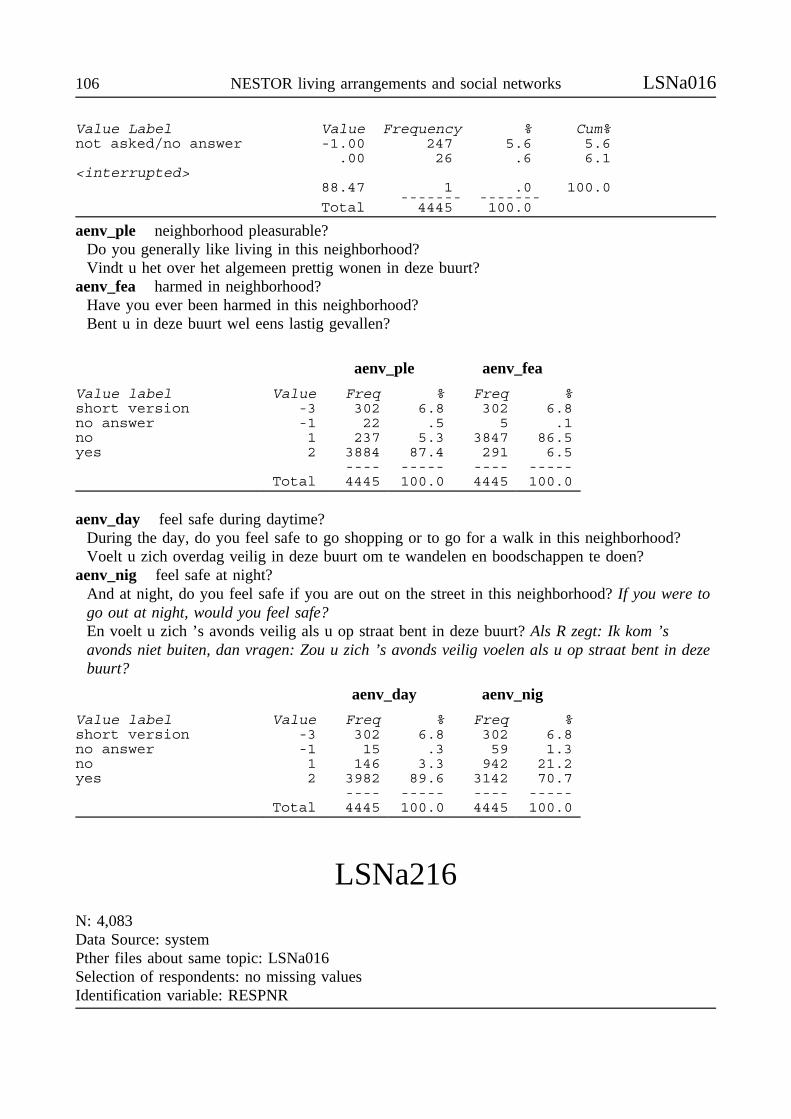
106 NESTOR living arrangements and social networks LSNa016
Value Label Value Frequency % Cum%not asked/no answer -1.00 247 5.6 5.6
.00 26 .6 6.1<interrupted>
88.47 1 .0 100.0------- -------
Total 4445 100.0
aenv_ple neighborhood pleasurable?Do you generally like living in this neighborhood?Vindt u het over het algemeen prettig wonen in deze buurt?
aenv_fea harmed in neighborhood?Have you ever been harmed in this neighborhood?Bent u in deze buurt wel eens lastig gevallen?
aenv_ple aenv_fea
Value label Value Freq % Freq %short version -3 302 6.8 302 6.8no answer -1 22 .5 5 .1no 1 237 5.3 3847 86.5yes 2 3884 87.4 291 6.5
---- ----- ---- -----Total 4445 100.0 4445 100.0
aenv_day feel safe during daytime?During the day, do you feel safe to go shopping or to go for a walk in this neighborhood?Voelt u zich overdag veilig in deze buurt om te wandelen en boodschappen te doen?
aenv_nig feel safe at night?And at night, do you feel safe if you are out on the street in this neighborhood? If you were togo out at night, would you feel safe?En voelt u zich ’s avonds veilig als u op straat bent in deze buurt? Als R zegt: Ik kom ’savonds niet buiten, dan vragen: Zou u zich ’s avonds veilig voelen als u op straat bent in dezebuurt?
aenv_day aenv_nig
Value label Value Freq % Freq %short version -3 302 6.8 302 6.8no answer -1 15 .3 59 1.3no 1 146 3.3 942 21.2yes 2 3982 89.6 3142 70.7
---- ----- ---- -----Total 4445 100.0 4445 100.0
LSNa216N: 4,083Data Source: systemPther files about same topic: LSNa016Selection of respondents: no missing valuesIdentification variable: RESPNR
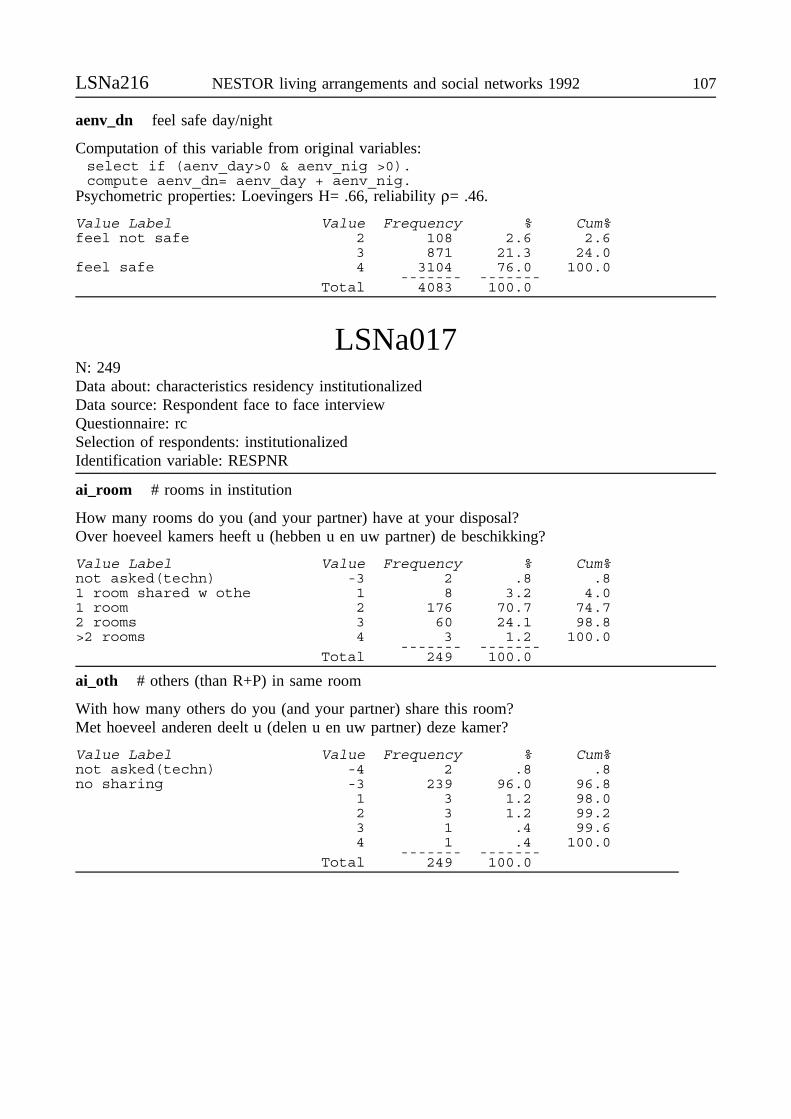
LSNa216 NESTOR living arrangements and social networks 1992 107
aenv_dn feel safe day/night
Computation of this variable from original variables:select if (aenv_day>0 & aenv_nig >0).compute aenv_dn= aenv_day + aenv_nig.
Psychometric properties: Loevingers H= .66, reliability ρ= .46.
Value Label Value Frequency % Cum%feel not safe 2 108 2.6 2.6
3 871 21.3 24.0feel safe 4 3104 76.0 100.0
------- -------Total 4083 100.0
LSNa017N: 249Data about: characteristics residency institutionalizedData source: Respondent face to face interviewQuestionnaire: rcSelection of respondents: institutionalizedIdentification variable: RESPNR
ai_room # rooms in institution
How many rooms do you (and your partner) have at your disposal?Over hoeveel kamers heeft u (hebben u en uw partner) de beschikking?
Value Label Value Frequency % Cum%not asked(techn) -3 2 .8 .81 room shared w othe 1 8 3.2 4.01 room 2 176 70.7 74.72 rooms 3 60 24.1 98.8>2 rooms 4 3 1.2 100.0
------- -------Total 249 100.0
ai_oth # others (than R+P) in same room
With how many others do you (and your partner) share this room?Met hoeveel anderen deelt u (delen u en uw partner) deze kamer?
Value Label Value Frequency % Cum%not asked(techn) -4 2 .8 .8no sharing -3 239 96.0 96.8
1 3 1.2 98.02 3 1.2 99.23 1 .4 99.64 1 .4 100.0
------- -------Total 249 100.0
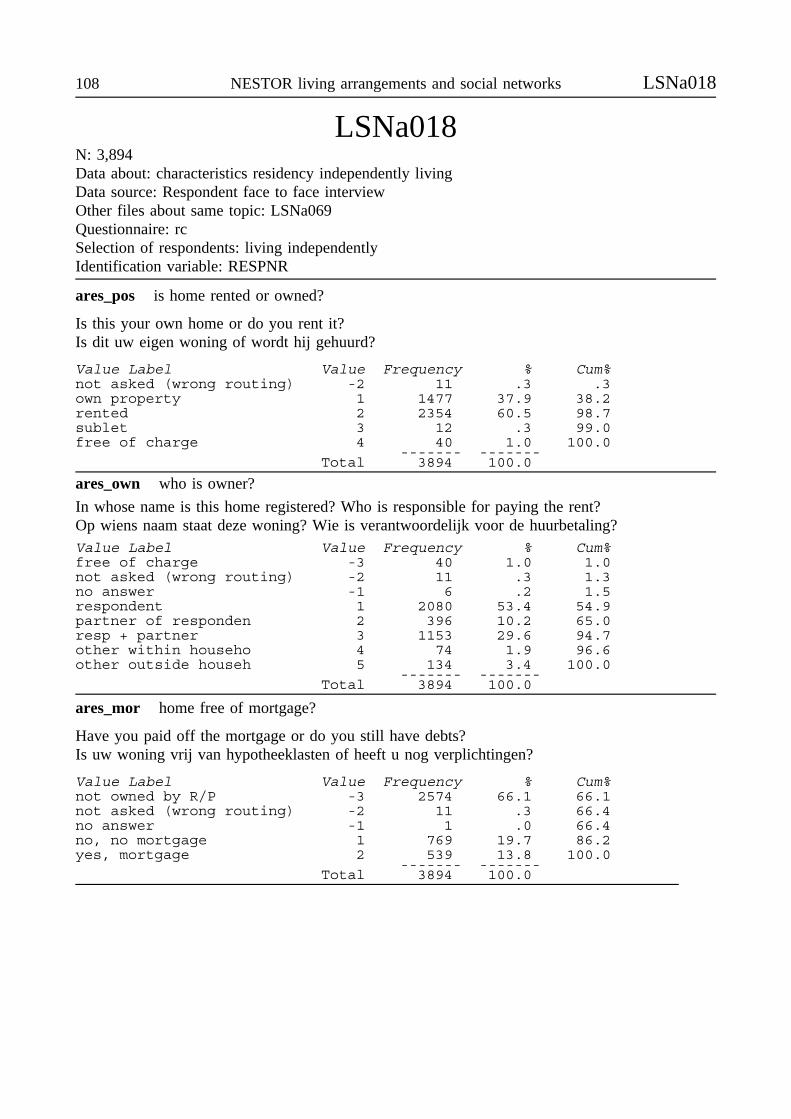
108 NESTOR living arrangements and social networks LSNa018
LSNa018N: 3,894Data about: characteristics residency independently livingData source: Respondent face to face interviewOther files about same topic: LSNa069Questionnaire: rcSelection of respondents: living independentlyIdentification variable: RESPNR
ares_pos is home rented or owned?
Is this your own home or do you rent it?Is dit uw eigen woning of wordt hij gehuurd?
Value Label Value Frequency % Cum%not asked (wrong routing) -2 11 .3 .3own property 1 1477 37.9 38.2rented 2 2354 60.5 98.7sublet 3 12 .3 99.0free of charge 4 40 1.0 100.0
------- -------Total 3894 100.0
ares_own who is owner?
In whose name is this home registered? Who is responsible for paying the rent?Op wiens naam staat deze woning? Wie is verantwoordelijk voor de huurbetaling?Value Label Value Frequency % Cum%free of charge -3 40 1.0 1.0not asked (wrong routing) -2 11 .3 1.3no answer -1 6 .2 1.5respondent 1 2080 53.4 54.9partner of responden 2 396 10.2 65.0resp + partner 3 1153 29.6 94.7other within househo 4 74 1.9 96.6other outside househ 5 134 3.4 100.0
------- -------Total 3894 100.0
ares_mor home free of mortgage?
Have you paid off the mortgage or do you still have debts?Is uw woning vrij van hypotheeklasten of heeft u nog verplichtingen?
Value Label Value Frequency % Cum%not owned by R/P -3 2574 66.1 66.1not asked (wrong routing) -2 11 .3 66.4no answer -1 1 .0 66.4no, no mortgage 1 769 19.7 86.2yes, mortgage 2 539 13.8 100.0
------- -------Total 3894 100.0
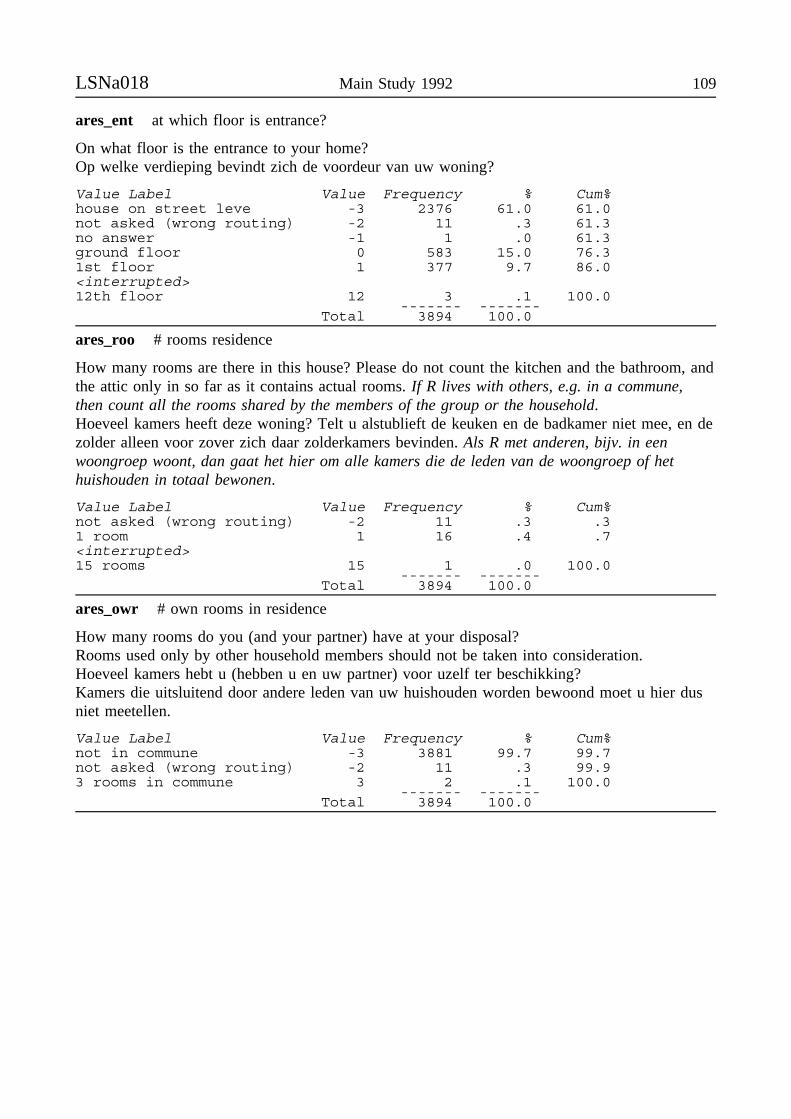
LSNa018 Main Study 1992 109
ares_ent at which floor is entrance?
On what floor is the entrance to your home?Op welke verdieping bevindt zich de voordeur van uw woning?
Value Label Value Frequency % Cum%house on street leve -3 2376 61.0 61.0not asked (wrong routing) -2 11 .3 61.3no answer -1 1 .0 61.3ground floor 0 583 15.0 76.31st floor 1 377 9.7 86.0<interrupted>12th floor 12 3 .1 100.0
------- -------Total 3894 100.0
ares_roo # rooms residence
How many rooms are there in this house? Please do not count the kitchen and the bathroom, andthe attic only in so far as it contains actual rooms. If R lives with others, e.g. in a commune,then count all the rooms shared by the members of the group or the household.Hoeveel kamers heeft deze woning? Telt u alstublieft de keuken en de badkamer niet mee, en dezolder alleen voor zover zich daar zolderkamers bevinden. Als R met anderen, bijv. in eenwoongroep woont, dan gaat het hier om alle kamers die de leden van de woongroep of hethuishouden in totaal bewonen.
Value Label Value Frequency % Cum%not asked (wrong routing) -2 11 .3 .31 room 1 16 .4 .7<interrupted>15 rooms 15 1 .0 100.0
------- -------Total 3894 100.0
ares_owr # own rooms in residence
How many rooms do you (and your partner) have at your disposal?Rooms used only by other household members should not be taken into consideration.Hoeveel kamers hebt u (hebben u en uw partner) voor uzelf ter beschikking?Kamers die uitsluitend door andere leden van uw huishouden worden bewoond moet u hier dusniet meetellen.
Value Label Value Frequency % Cum%not in commune -3 3881 99.7 99.7not asked (wrong routing) -2 11 .3 99.93 rooms in commune 3 2 .1 100.0
------- -------Total 3894 100.0
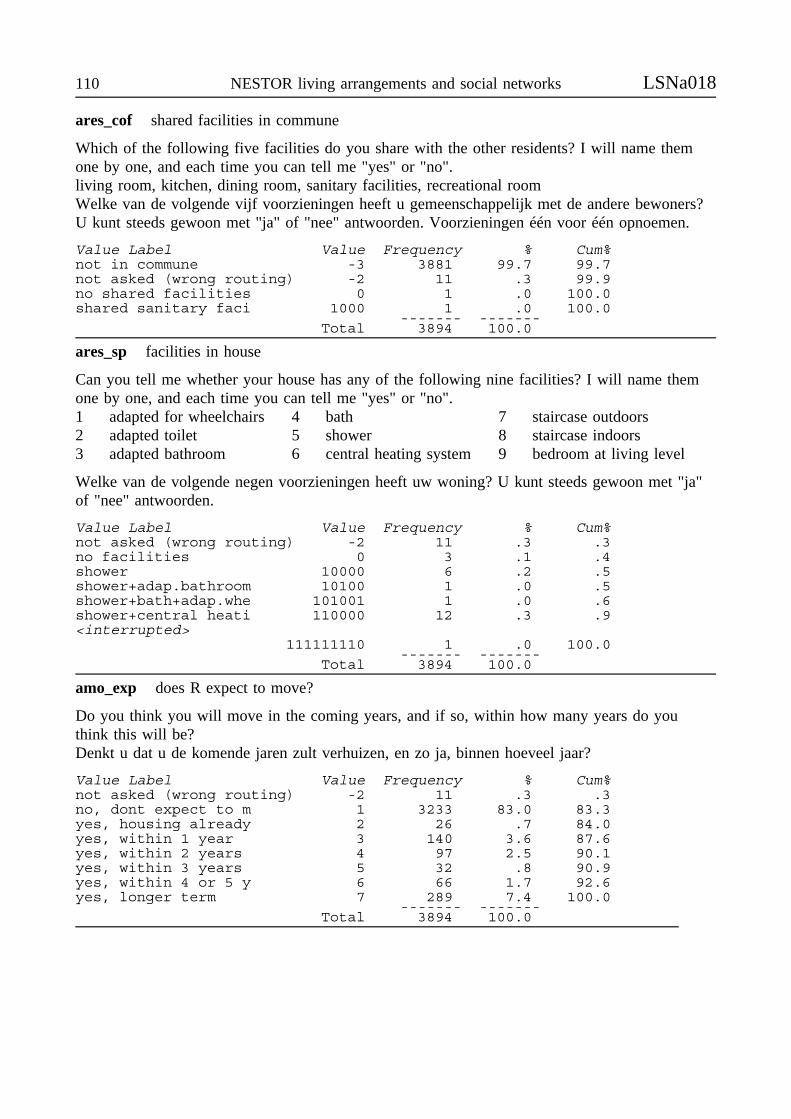
110 NESTOR living arrangements and social networks LSNa018
ares_cof shared facilities in commune
Which of the following five facilities do you share with the other residents? I will name themone by one, and each time you can tell me "yes" or "no".living room, kitchen, dining room, sanitary facilities, recreational roomWelke van de volgende vijf voorzieningen heeft u gemeenschappelijk met de andere bewoners?U kunt steeds gewoon met "ja" of "nee" antwoorden. Voorzieningen één voor één opnoemen.
Value Label Value Frequency % Cum%not in commune -3 3881 99.7 99.7not asked (wrong routing) -2 11 .3 99.9no shared facilities 0 1 .0 100.0shared sanitary faci 1000 1 .0 100.0
------- -------Total 3894 100.0
ares_sp facilities in house
Can you tell me whether your house has any of the following nine facilities? I will name themone by one, and each time you can tell me "yes" or "no".1 adapted for wheelchairs2 adapted toilet3 adapted bathroom
4 bath5 shower6 central heating system
7 staircase outdoors8 staircase indoors9 bedroom at living level
Welke van de volgende negen voorzieningen heeft uw woning? U kunt steeds gewoon met "ja"of "nee" antwoorden.
Value Label Value Frequency % Cum%not asked (wrong routing) -2 11 .3 .3no facilities 0 3 .1 .4shower 10000 6 .2 .5shower+adap.bathroom 10100 1 .0 .5shower+bath+adap.whe 101001 1 .0 .6shower+central heati 110000 12 .3 .9<interrupted>
111111110 1 .0 100.0------- -------
Total 3894 100.0
amo_exp does R expect to move?
Do you think you will move in the coming years, and if so, within how many years do youthink this will be?Denkt u dat u de komende jaren zult verhuizen, en zo ja, binnen hoeveel jaar?
Value Label Value Frequency % Cum%not asked (wrong routing) -2 11 .3 .3no, dont expect to m 1 3233 83.0 83.3yes, housing already 2 26 .7 84.0yes, within 1 year 3 140 3.6 87.6yes, within 2 years 4 97 2.5 90.1yes, within 3 years 5 32 .8 90.9yes, within 4 or 5 y 6 66 1.7 92.6yes, longer term 7 289 7.4 100.0
------- -------Total 3894 100.0
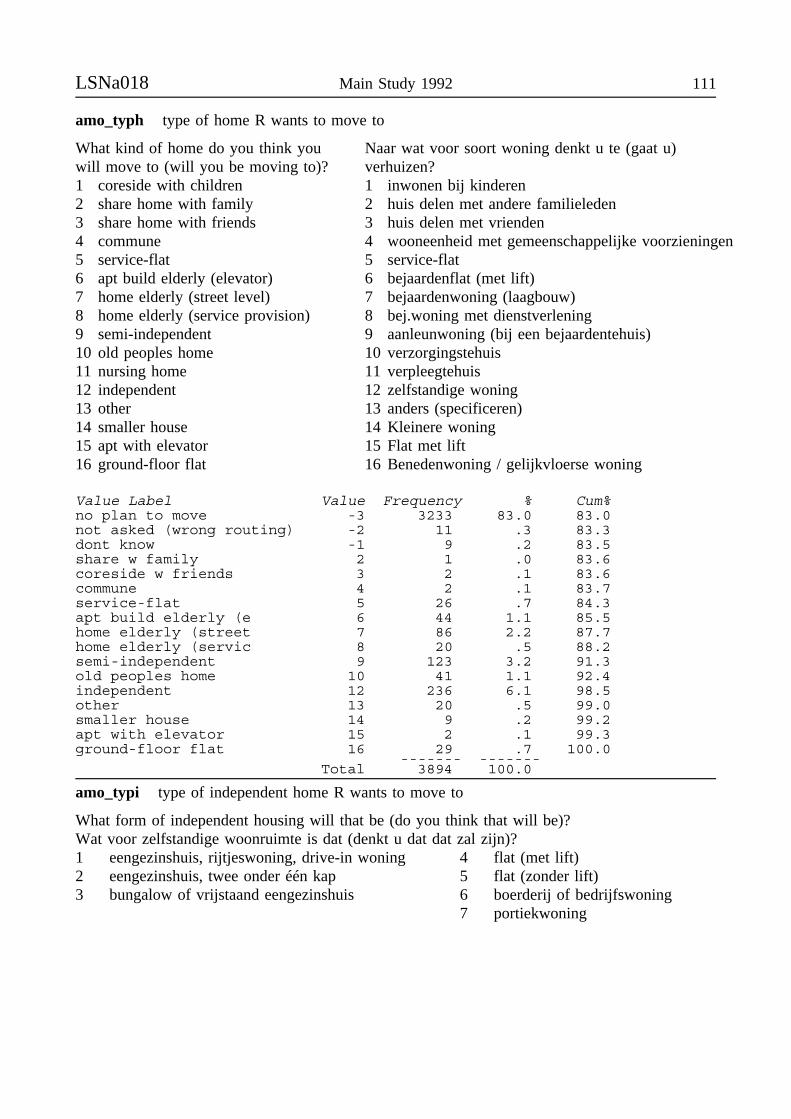
LSNa018 Main Study 1992 111
amo_typh type of home R wants to move to
What kind of home do you think youwill move to (will you be moving to)?1 coreside with children2 share home with family3 share home with friends4 commune5 service-flat6 apt build elderly (elevator)7 home elderly (street level)8 home elderly (service provision)9 semi-independent10 old peoples home11 nursing home12 independent13 other14 smaller house15 apt with elevator16 ground-floor flat
Naar wat voor soort woning denkt u te (gaat u)verhuizen?1 inwonen bij kinderen2 huis delen met andere familieleden3 huis delen met vrienden4 wooneenheid met gemeenschappelijke voorzieningen5 service-flat6 bejaardenflat (met lift)7 bejaardenwoning (laagbouw)8 bej.woning met dienstverlening9 aanleunwoning (bij een bejaardentehuis)10 verzorgingstehuis11 verpleegtehuis12 zelfstandige woning13 anders (specificeren)14 Kleinere woning15 Flat met lift16 Benedenwoning / gelijkvloerse woning
Value Label Value Frequency % Cum%no plan to move -3 3233 83.0 83.0not asked (wrong routing) -2 11 .3 83.3dont know -1 9 .2 83.5share w family 2 1 .0 83.6coreside w friends 3 2 .1 83.6commune 4 2 .1 83.7service-flat 5 26 .7 84.3apt build elderly (e 6 44 1.1 85.5home elderly (street 7 86 2.2 87.7home elderly (servic 8 20 .5 88.2semi-independent 9 123 3.2 91.3old peoples home 10 41 1.1 92.4independent 12 236 6.1 98.5other 13 20 .5 99.0smaller house 14 9 .2 99.2apt with elevator 15 2 .1 99.3ground-floor flat 16 29 .7 100.0
------- -------Total 3894 100.0
amo_typi type of independent home R wants to move to
What form of independent housing will that be (do you think that will be)?Wat voor zelfstandige woonruimte is dat (denkt u dat dat zal zijn)?1 eengezinshuis, rijtjeswoning, drive-in woning2 eengezinshuis, twee onder één kap3 bungalow of vrijstaand eengezinshuis
4 flat (met lift)5 flat (zonder lift)6 boerderij of bedrijfswoning7 portiekwoning
112 NESTOR living arrangements and social networks LSNa018
Value Label Value Frequency % Cum%dependent -4 422 10.8 10.8no plan to move -3 3233 83.0 93.9not asked (wrong routing) -2 11 .3 94.1no answer -1 7 .2 94.3attached row 1 87 2.2 96.6semi-detached 2 9 .2 96.8detached 3 60 1.5 98.3high rise (elevator) 4 48 1.2 99.6high rise (no elevat 5 6 .2 99.7farm 6 3 .1 99.8low-level apt buildi 7 8 .2 100.0
------- -------Total 3894 100.0
amo_com wants affiliation with commune
Have you joined (do you plan to join) an existing commune or formed (do you plan to form) anew commune with others?Heeft u zich aangesloten (denkt u zich aan te sluiten) bij een reeds bestaande woongroep ofheeft (denkt) u met anderen een woongroep gevormd (te vormen)?
1 aansluiten bij bestaande woongroep2 vormen van nieuwe woongroep
Value Label Value Frequency % Cum%not to commune -4 648 16.6 16.6no plan to move -3 3233 83.0 99.7not asked (wrong routing) -2 11 .3 99.9existing commune 1 2 .1 100.0
------- -------Total 3894 100.0
amo_ncom # members in commune
How many members does (should) this commune have, including yourself?Uit hoeveel personen bestaat (zou) deze woongroep (moeten bestaan), uzelf meegerekend?
Value Label Value Frequency % Cum%not to commune -4 648 16.6 16.6no plan to move -3 3233 83.0 99.7not asked (wrong routing) -2 11 .3 99.9no answer -1 1 .0 100.050 members 50 1 .0 100.0
------- -------Total 3894 100.0
amo_cof shared facilities in commune (future)
Which of the following five facilities will be shared (do you plan to share) with the othermembers of the commune? I will name them one by one, and each time you can tell me "yes" or"no".Welke van de volgende voorzieningen zult (zou) u gemeenschappelijk met de andere leden vande woongroep (willen) hebben? U kunt steeds gewoon met "ja" of "nee" antwoorden.
Value Label Value Frequency % Cum%not to commune -4 648 16.6 16.6no plan to move -3 3233 83.0 99.7not asked (wrong routing) -2 11 .3 99.9shared recreational 10000 1 .0 100.0shared rec din kit l 10111 1 .0 100.0
------- -------Total 3894 100.0
LSNa018 Main Study 1992 113
amo_rea most import reason for moving
What is the most importantreason why you want to move?1 poor health R2 poor health partner3 cohabit/marriage4 divorce5 more privacy6 more companionship7 no burden to others8 closer to (non)kin9 job10 house now too big11 house now too small12 house now too expensive
Wat is voor u de belangrijkste reden om te gaan verhuizen?
1 mijn gezondheid laat te wensen over2 de gezondheid van mijn partner laat te wensen over3 ik ga trouwen / ongehuwd samenwonen4 vanwege scheiding5 ik wil meer privacy6 ik wil meer gezelligheid7 ik wil anderen niet tot last zijn8 ik wil dichter bij mijn familie of vrienden gaan wonen9 vanwege het werk10 de huidige woning is te groot11 de huidige woning is te klein12 de huidige woning is te duur
13 house now inadequate(for other reasons)
14 dislike neighborhood15 closer to facilities16 demolition house17 other18 potential health decline
13 de huidige woning voldoet om andere redenen niet
14 de buurt bevalt me niet15 ik wil dichter bij allerlei voorzieningen gaan wonen16 de huidige woning wordt gesloopt of gerenoveerd17 andere reden (specificeren)18 mogelijke verslechtering gezondheid in de toekomst
Value Label Value Frequency % Cum%no plan to move -3 3233 83.0 83.0not asked (wrong routing) -2 11 .3 83.3no answer -1 2 .1 83.4poor health R 1 163 4.2 87.5poor health partner 2 44 1.1 88.7divorce 4 1 .0 88.7more privacy 5 10 .3 89.0more companionship 6 16 .4 89.4no burden to others 7 4 .1 89.5closer to (non)kin 8 25 .6 90.1job 9 3 .1 90.2house now too big 10 129 3.3 93.5house now too small 11 10 .3 93.8house now too expens 12 14 .4 94.1house now inadequate 13 64 1.6 95.8dislike neighborhood 14 57 1.5 97.2closer to facilities 15 40 1.0 98.3demolition house 16 10 .3 98.5other 17 36 .9 99.4potential health dec 18 22 .6 100.0
------- -------Total 3894 100.0
114 NESTOR living arrangements and social networks LSNa018
amo_act activities for moving
What activities have you undertakenin order to move? More than oneanswer can be provided.0 none1 signed up at municipality2 signed up housing corporation3 signed up at housing bureau for
elderly4 signed up for institutionalization5 contact with landlord6 contact with estate agent7 read advertisements8 placed advertisements9 used friends/acquaintances
Welke activiteiten heeft u ondernomen om aan eenandere woning te komen? Meer dan één antwoord ismogelijk.0 geen1 ingeschreven bij het gemeentelijke
huisvestingsbureau2 ingeschreven bij een woningbouwvereniging3 ingeschreven bij een huisvestingsbureau speciaal
voor ouderen4 ingeschreven voor opname in een verzorgingstehuis5 contact met eigenaar / verhuurder6 regelmatig contact met makelaar7 intensief advertenties gelezen8 advertenties geplaatst9 familie of kennissen ingeschakeld
Value Label Value Frequency % Cum%no plan to move -3 3233 83.0 83.0not asked (wrong routing) -2 11 .3 83.3no activities for mo 0 231 5.9 89.2signed up at municip 1 69 1.8 91.0<interrupted>
111010011 1 .0 100.0------- -------
Total 3894 100.0
amo_ind positive indication nursing home, date
Have you received a positive indication for an old people’s home? A positive indication meansthat R has been put on a waiting list that entitles him/her to admission in an old people’s home.If so, when did you receive a positive indication? month .. 19..Bent u positief geïndiceerd voor opname in een verzorgingshuis? Een positieve indicatie betekentdat men toegelaten is tot de wachtlijst die recht geeft op opname in een verzorgingstehuis. Zo ja,sinds wanneer staat u op de wachtlijst? maand.. 19..
Value Label Value Frequency % Cum%no positive indicati -5.00 13 .3 .3not signed for insti -4.00 602 15.5 15.8no plan to move -3.00 3233 83.0 98.8not asked (wrong routing) -2.00 11 .3 99.1no answer -1.00 3 .1 99.2
66.04 1 .0 99.2<interrupted>
89.30 1 .0 100.0------- -------
Total 3894 100.0
LSNa019N: 4,142Data about: education and church affiliation parents, occupation fatherData source: Respondent face to face interviewQuestionnaire: bpIdentification variable: RESPNR
LSNa019 Main Study 1992 115
amo_edu afa_edu level attained education mother/father
What was the highest level of education that your mother/father (or primary caretaker)completed?Wat is de hoogste opleiding die uw moeder/vader (primaire verzorg(st)er) met een diploma heeftafgerond?
amo_edu afa_eduValue label Value Freq % Freq %upb too short -2 27 .7 4 .1no answer -1 179 4.3 195 4.7primary edu not comp 1 1083 26.1 833 20.1primary education 2 2464 59.5 2046 49.4lower vocational 3 144 3.5 437 10.6secondary general le 4 95 2.3 118 2.8medium vocational 5 72 1.7 251 6.1high school 6 22 .5 48 1.2higher vocational 7 42 1.0 115 2.8university (1st phas 8 7 .2 20 .5university (2nd phas 9 7 .2 75 1.8
---- ----- ---- -----Total 4142 100.0 4142 100.0
amo_ch afa_ch mother/father church member during youth R?
Was your mother/father (primary caretaker) a member of a church or of a particular religiousgroup during most of your youth? What was her/his religious denomination?Was uw moeder/vader (primaire verzorg(st)er) tijdens het grootste deel van uw jeugd lid van eenkerkgenootschap of van een andere levensbeschouwelijke groepering? Tot welke kerkelijke oflevensbeschouwelijke stroming behoorde zij/hij?
amo_ch afa_ch
Value label Value Freq % Freq %no answ Q membership -4 18 .4 31 .7upb too short -2 27 .7 4 .1member, no answ spec -1 2 .0 0 0no church member 0 902 21.8 1142 27.6Reformed (NedHerv) 1 1125 27.2 950 22.9Dutch Reformed (Gere 2 381 9.2 384 9.3small Ref denom (Ger 3 80 1.9 67 1.6Roman-Catholic (RK) 4 1383 33.4 1379 33.3other protestant den 5 141 3.4 114 2.8Humanistic Society 6 2 .0 3 .1Jewish 7 16 .4 17 .4Muslim 8 6 .1 5 .1Hindu 9 2 .0 3 .1other 10 57 1.4 43 1.0
---- ----- ---- -----Total 4142 100.0 4142 100.0
What was the last job that your father (or primary caretaker) had?Wat is het laatste beroep dat uw vader (primaire verzorger) heeft uitgeoefend?
Documented in LSNa010. Information on occupations stored in database LSNa012.dbf.
afasbc92 standard classification occupation father
Value Label Value Frequency % Cum%unknown -1 117 2.8 2.8
11103 6 .1 3.0<interrupted>
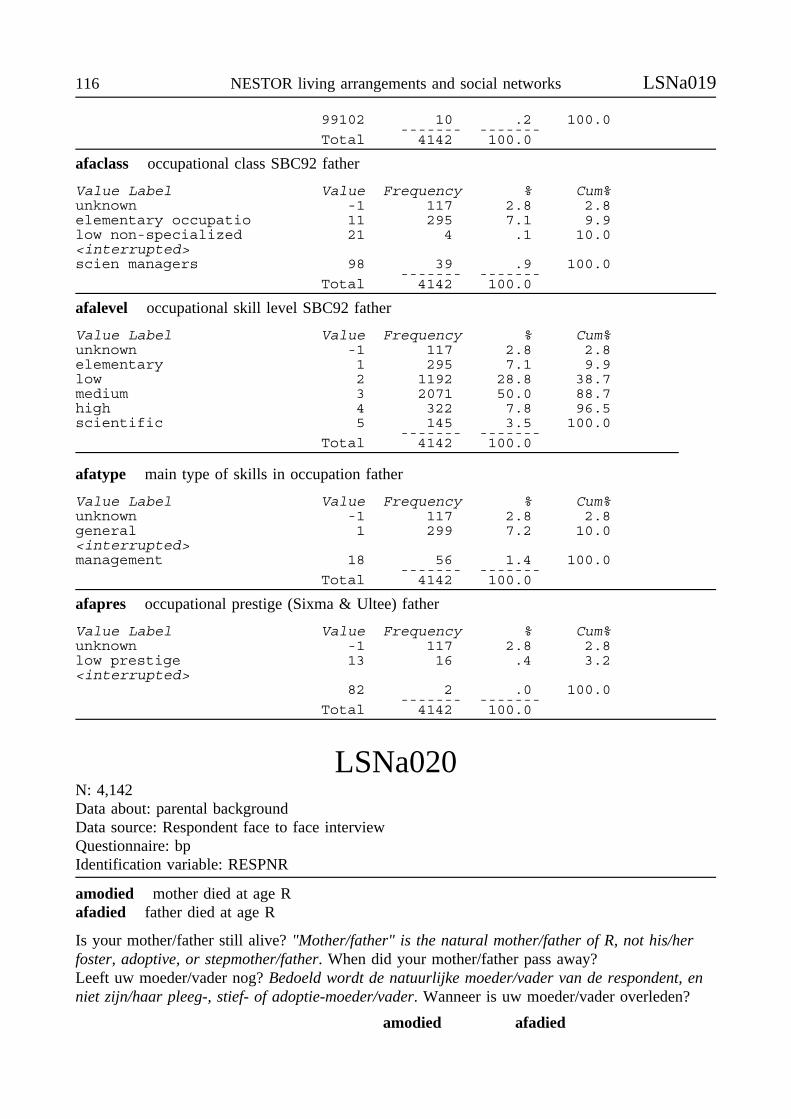
116 NESTOR living arrangements and social networks LSNa019
99102 10 .2 100.0------- -------
Total 4142 100.0
afaclass occupational class SBC92 father
Value Label Value Frequency % Cum%unknown -1 117 2.8 2.8elementary occupatio 11 295 7.1 9.9low non-specialized 21 4 .1 10.0<interrupted>scien managers 98 39 .9 100.0
------- -------Total 4142 100.0
afalevel occupational skill level SBC92 father
Value Label Value Frequency % Cum%unknown -1 117 2.8 2.8elementary 1 295 7.1 9.9low 2 1192 28.8 38.7medium 3 2071 50.0 88.7high 4 322 7.8 96.5scientific 5 145 3.5 100.0
------- -------Total 4142 100.0
afatype main type of skills in occupation father
Value Label Value Frequency % Cum%unknown -1 117 2.8 2.8general 1 299 7.2 10.0<interrupted>management 18 56 1.4 100.0
------- -------Total 4142 100.0
afapres occupational prestige (Sixma & Ultee) father
Value Label Value Frequency % Cum%unknown -1 117 2.8 2.8low prestige 13 16 .4 3.2<interrupted>
82 2 .0 100.0------- -------
Total 4142 100.0
LSNa020N: 4,142Data about: parental backgroundData source: Respondent face to face interviewQuestionnaire: bpIdentification variable: RESPNR
amodied mother died at age Rafadied father died at age R
Is your mother/father still alive? "Mother/father" is the natural mother/father of R, not his/herfoster, adoptive, or stepmother/father. When did your mother/father pass away?Leeft uw moeder/vader nog? Bedoeld wordt de natuurlijke moeder/vader van de respondent, enniet zijn/haar pleeg-, stief- of adoptie-moeder/vader. Wanneer is uw moeder/vader overleden?
amodied afadied
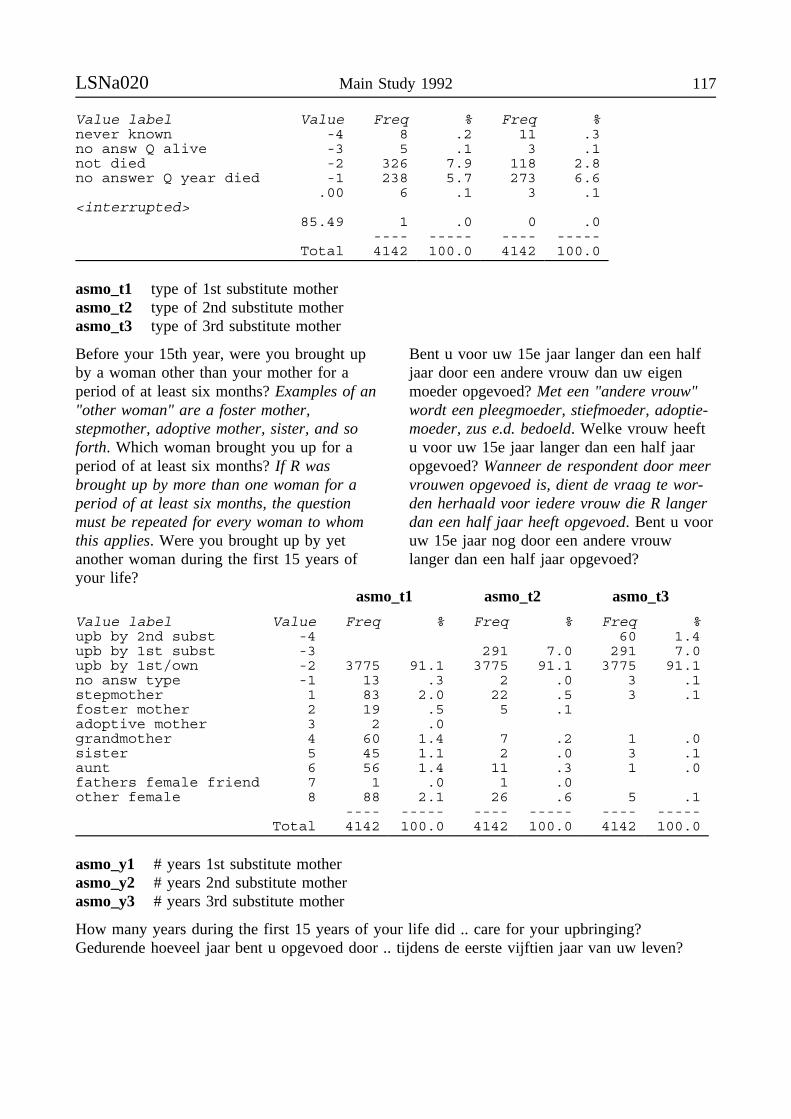
LSNa020 Main Study 1992 117
Value label Value Freq % Freq %never known -4 8 .2 11 .3no answ Q alive -3 5 .1 3 .1not died -2 326 7.9 118 2.8no answer Q year died -1 238 5.7 273 6.6
.00 6 .1 3 .1<interrupted>
85.49 1 .0 0 .0---- ----- ---- -----
Total 4142 100.0 4142 100.0
asmo_t1 type of 1st substitute motherasmo_t2 type of 2nd substitute motherasmo_t3 type of 3rd substitute mother
Before your 15th year, were you brought upby a woman other than your mother for aperiod of at least six months? Examples of an"other woman" are a foster mother,stepmother, adoptive mother, sister, and soforth. Which woman brought you up for aperiod of at least six months? If R wasbrought up by more than one woman for aperiod of at least six months, the questionmust be repeated for every woman to whomthis applies. Were you brought up by yetanother woman during the first 15 years ofyour life?
Bent u voor uw 15e jaar langer dan een halfjaar door een andere vrouw dan uw eigenmoeder opgevoed? Met een "andere vrouw"wordt een pleegmoeder, stiefmoeder, adoptie-moeder, zus e.d. bedoeld. Welke vrouw heeftu voor uw 15e jaar langer dan een half jaaropgevoed? Wanneer de respondent door meervrouwen opgevoed is, dient de vraag te wor-den herhaald voor iedere vrouw die R langerdan een half jaar heeft opgevoed. Bent u vooruw 15e jaar nog door een andere vrouwlanger dan een half jaar opgevoed?
asmo_t1 asmo_t2 asmo_t3
Value label Value Freq % Freq % Freq %upb by 2nd subst -4 60 1.4upb by 1st subst -3 291 7.0 291 7.0upb by 1st/own -2 3775 91.1 3775 91.1 3775 91.1no answ type -1 13 .3 2 .0 3 .1stepmother 1 83 2.0 22 .5 3 .1foster mother 2 19 .5 5 .1adoptive mother 3 2 .0grandmother 4 60 1.4 7 .2 1 .0sister 5 45 1.1 2 .0 3 .1aunt 6 56 1.4 11 .3 1 .0fathers female friend 7 1 .0 1 .0other female 8 88 2.1 26 .6 5 .1
---- ----- ---- ----- ---- -----Total 4142 100.0 4142 100.0 4142 100.0
asmo_y1 # years 1st substitute motherasmo_y2 # years 2nd substitute motherasmo_y3 # years 3rd substitute mother
How many years during the first 15 years of your life did .. care for your upbringing?Gedurende hoeveel jaar bent u opgevoed door .. tijdens de eerste vijftien jaar van uw leven?
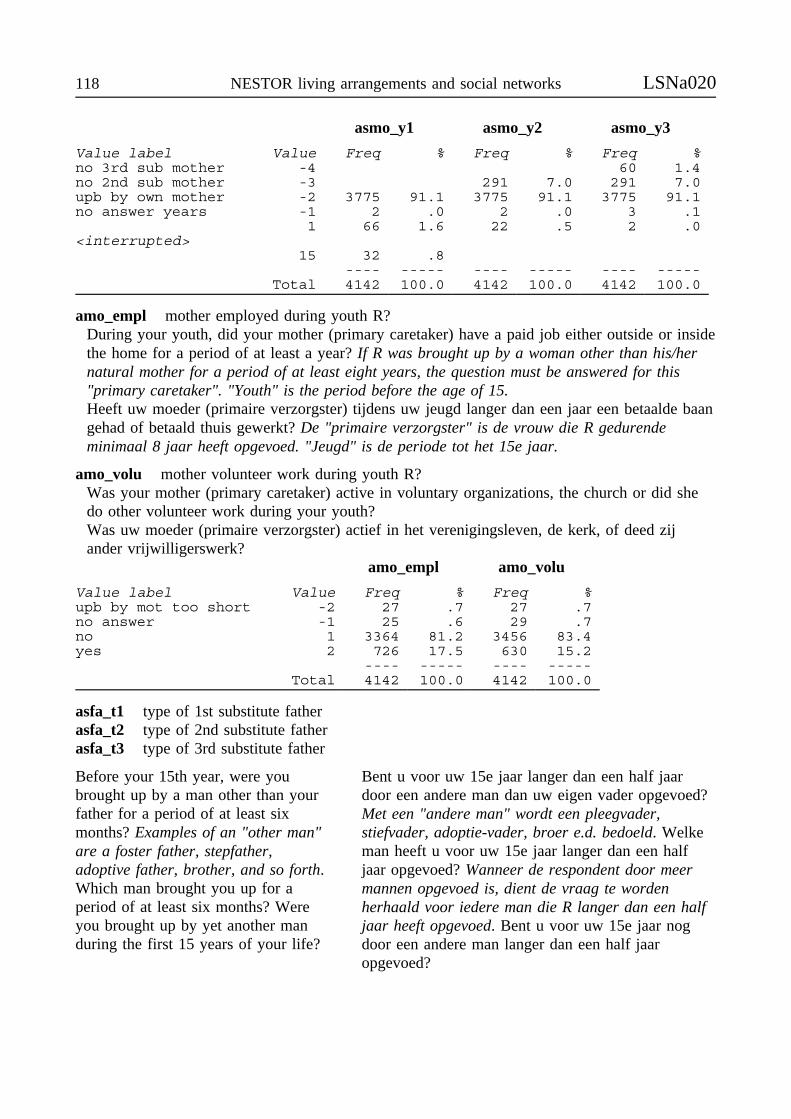
118 NESTOR living arrangements and social networks LSNa020
asmo_y1 asmo_y2 asmo_y3
Value label Value Freq % Freq % Freq %no 3rd sub mother -4 60 1.4no 2nd sub mother -3 291 7.0 291 7.0upb by own mother -2 3775 91.1 3775 91.1 3775 91.1no answer years -1 2 .0 2 .0 3 .1
1 66 1.6 22 .5 2 .0<interrupted>
15 32 .8---- ----- ---- ----- ---- -----
Total 4142 100.0 4142 100.0 4142 100.0
amo_empl mother employed during youth R?During your youth, did your mother (primary caretaker) have a paid job either outside or insidethe home for a period of at least a year? If R was brought up by a woman other than his/hernatural mother for a period of at least eight years, the question must be answered for this"primary caretaker". "Youth" is the period before the age of 15.Heeft uw moeder (primaire verzorgster) tijdens uw jeugd langer dan een jaar een betaalde baangehad of betaald thuis gewerkt? De "primaire verzorgster" is de vrouw die R gedurendeminimaal 8 jaar heeft opgevoed. "Jeugd" is de periode tot het 15e jaar.
amo_volu mother volunteer work during youth R?Was your mother (primary caretaker) active in voluntary organizations, the church or did shedo other volunteer work during your youth?Was uw moeder (primaire verzorgster) actief in het verenigingsleven, de kerk, of deed zijander vrijwilligerswerk?
amo_empl amo_volu
Value label Value Freq % Freq %upb by mot too short -2 27 .7 27 .7no answer -1 25 .6 29 .7no 1 3364 81.2 3456 83.4yes 2 726 17.5 630 15.2
---- ----- ---- -----Total 4142 100.0 4142 100.0
asfa_t1 type of 1st substitute fatherasfa_t2 type of 2nd substitute fatherasfa_t3 type of 3rd substitute father
Before your 15th year, were youbrought up by a man other than yourfather for a period of at least sixmonths? Examples of an "other man"are a foster father, stepfather,adoptive father, brother, and so forth.Which man brought you up for aperiod of at least six months? Wereyou brought up by yet another manduring the first 15 years of your life?
Bent u voor uw 15e jaar langer dan een half jaardoor een andere man dan uw eigen vader opgevoed?Met een "andere man" wordt een pleegvader,stiefvader, adoptie-vader, broer e.d. bedoeld. Welkeman heeft u voor uw 15e jaar langer dan een halfjaar opgevoed? Wanneer de respondent door meermannen opgevoed is, dient de vraag te wordenherhaald voor iedere man die R langer dan een halfjaar heeft opgevoed. Bent u voor uw 15e jaar nogdoor een andere man langer dan een half jaaropgevoed?
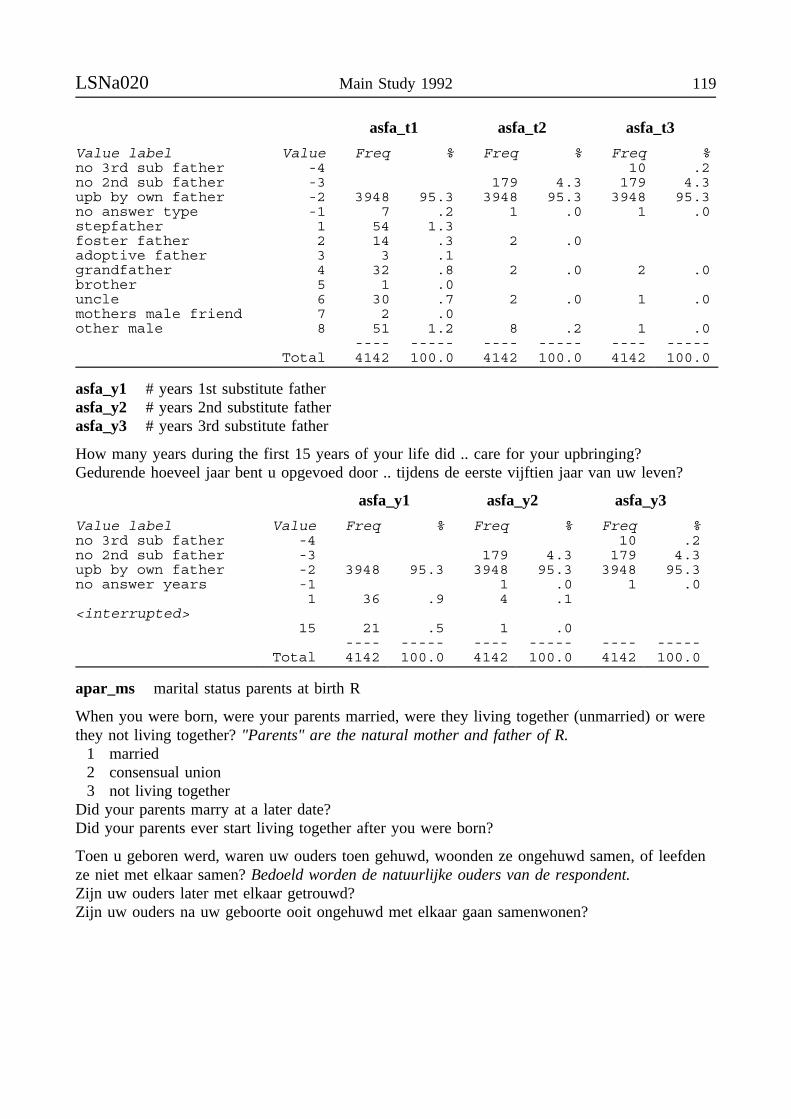
LSNa020 Main Study 1992 119
asfa_t1 asfa_t2 asfa_t3
Value label Value Freq % Freq % Freq %no 3rd sub father -4 10 .2no 2nd sub father -3 179 4.3 179 4.3upb by own father -2 3948 95.3 3948 95.3 3948 95.3no answer type -1 7 .2 1 .0 1 .0stepfather 1 54 1.3foster father 2 14 .3 2 .0adoptive father 3 3 .1grandfather 4 32 .8 2 .0 2 .0brother 5 1 .0uncle 6 30 .7 2 .0 1 .0mothers male friend 7 2 .0other male 8 51 1.2 8 .2 1 .0
---- ----- ---- ----- ---- -----Total 4142 100.0 4142 100.0 4142 100.0
asfa_y1 # years 1st substitute fatherasfa_y2 # years 2nd substitute fatherasfa_y3 # years 3rd substitute father
How many years during the first 15 years of your life did .. care for your upbringing?Gedurende hoeveel jaar bent u opgevoed door .. tijdens de eerste vijftien jaar van uw leven?
asfa_y1 asfa_y2 asfa_y3
Value label Value Freq % Freq % Freq %no 3rd sub father -4 10 .2no 2nd sub father -3 179 4.3 179 4.3upb by own father -2 3948 95.3 3948 95.3 3948 95.3no answer years -1 1 .0 1 .0
1 36 .9 4 .1<interrupted>
15 21 .5 1 .0---- ----- ---- ----- ---- -----
Total 4142 100.0 4142 100.0 4142 100.0
apar_ms marital status parents at birth R
When you were born, were your parents married, were they living together (unmarried) or werethey not living together? "Parents" are the natural mother and father of R.
1 married2 consensual union3 not living together
Did your parents marry at a later date?Did your parents ever start living together after you were born?
Toen u geboren werd, waren uw ouders toen gehuwd, woonden ze ongehuwd samen, of leefdenze niet met elkaar samen? Bedoeld worden de natuurlijke ouders van de respondent.Zijn uw ouders later met elkaar getrouwd?Zijn uw ouders na uw geboorte ooit ongehuwd met elkaar gaan samenwonen?
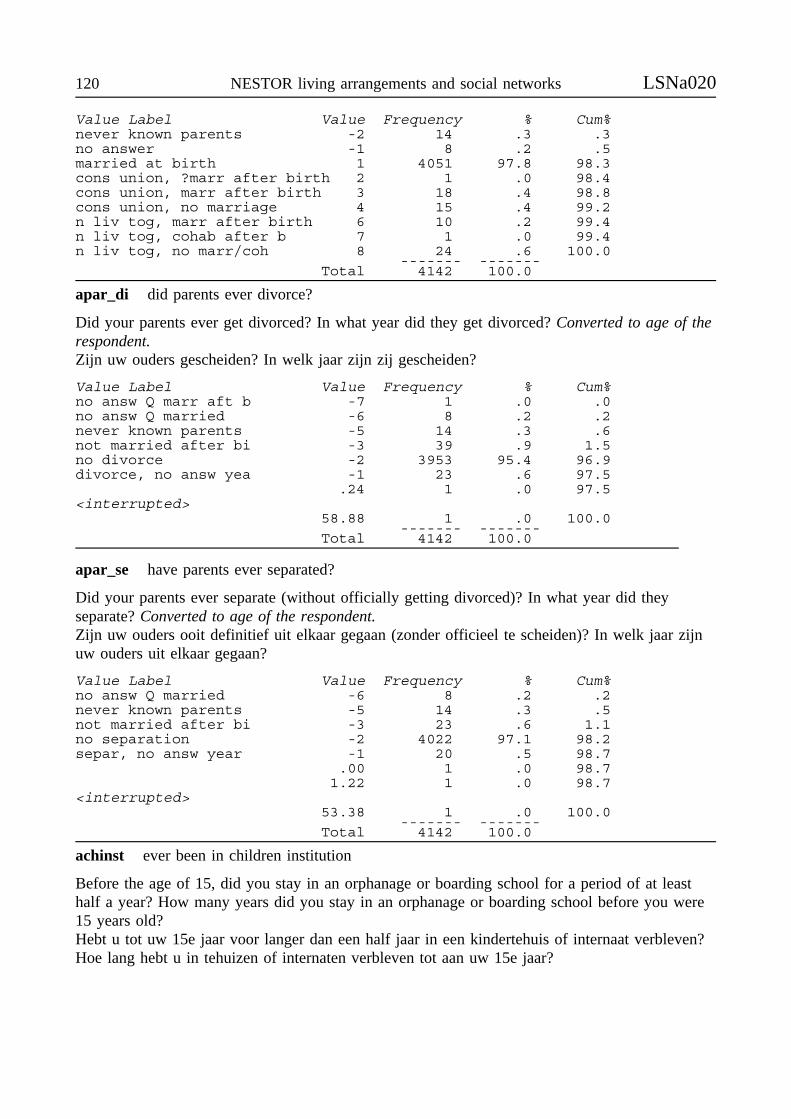
120 NESTOR living arrangements and social networks LSNa020
Value Label Value Frequency % Cum%never known parents -2 14 .3 .3no answer -1 8 .2 .5married at birth 1 4051 97.8 98.3cons union, ?marr after birth 2 1 .0 98.4cons union, marr after birth 3 18 .4 98.8cons union, no marriage 4 15 .4 99.2n liv tog, marr after birth 6 10 .2 99.4n liv tog, cohab after b 7 1 .0 99.4n liv tog, no marr/coh 8 24 .6 100.0
------- -------Total 4142 100.0
apar_di did parents ever divorce?
Did your parents ever get divorced? In what year did they get divorced? Converted to age of therespondent.Zijn uw ouders gescheiden? In welk jaar zijn zij gescheiden?
Value Label Value Frequency % Cum%no answ Q marr aft b -7 1 .0 .0no answ Q married -6 8 .2 .2never known parents -5 14 .3 .6not married after bi -3 39 .9 1.5no divorce -2 3953 95.4 96.9divorce, no answ yea -1 23 .6 97.5
.24 1 .0 97.5<interrupted>
58.88 1 .0 100.0------- -------
Total 4142 100.0
apar_se have parents ever separated?
Did your parents ever separate (without officially getting divorced)? In what year did theyseparate? Converted to age of the respondent.Zijn uw ouders ooit definitief uit elkaar gegaan (zonder officieel te scheiden)? In welk jaar zijnuw ouders uit elkaar gegaan?
Value Label Value Frequency % Cum%no answ Q married -6 8 .2 .2never known parents -5 14 .3 .5not married after bi -3 23 .6 1.1no separation -2 4022 97.1 98.2separ, no answ year -1 20 .5 98.7
.00 1 .0 98.71.22 1 .0 98.7
<interrupted>53.38 1 .0 100.0
------- -------Total 4142 100.0
achinst ever been in children institution
Before the age of 15, did you stay in an orphanage or boarding school for a period of at leasthalf a year? How many years did you stay in an orphanage or boarding school before you were15 years old?Hebt u tot uw 15e jaar voor langer dan een half jaar in een kindertehuis of internaat verbleven?Hoe lang hebt u in tehuizen of internaten verbleven tot aan uw 15e jaar?
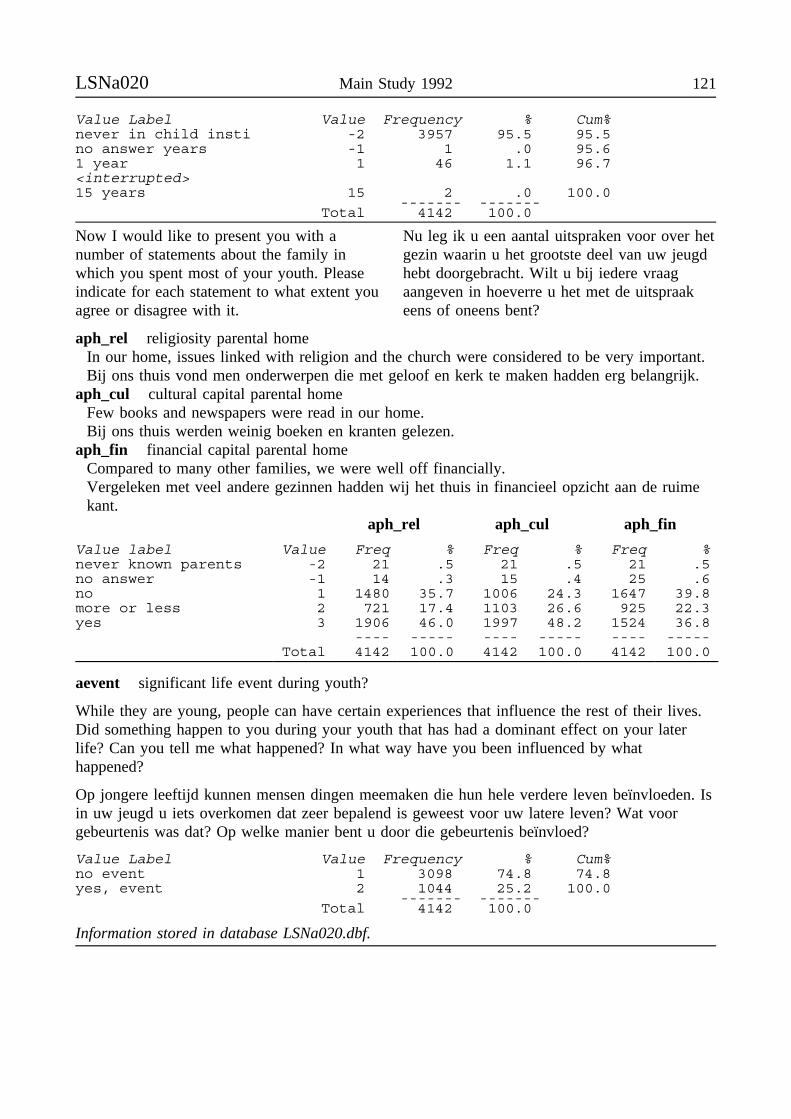
LSNa020 Main Study 1992 121
Value Label Value Frequency % Cum%never in child insti -2 3957 95.5 95.5no answer years -1 1 .0 95.61 year 1 46 1.1 96.7<interrupted>15 years 15 2 .0 100.0
------- -------Total 4142 100.0
Now I would like to present you with anumber of statements about the family inwhich you spent most of your youth. Pleaseindicate for each statement to what extent youagree or disagree with it.
Nu leg ik u een aantal uitspraken voor over hetgezin waarin u het grootste deel van uw jeugdhebt doorgebracht. Wilt u bij iedere vraagaangeven in hoeverre u het met de uitspraakeens of oneens bent?
aph_rel religiosity parental homeIn our home, issues linked with religion and the church were considered to be very important.Bij ons thuis vond men onderwerpen die met geloof en kerk te maken hadden erg belangrijk.
aph_cul cultural capital parental homeFew books and newspapers were read in our home.Bij ons thuis werden weinig boeken en kranten gelezen.
aph_fin financial capital parental homeCompared to many other families, we were well off financially.Vergeleken met veel andere gezinnen hadden wij het thuis in financieel opzicht aan de ruimekant.
aph_rel aph_cul aph_fin
Value label Value Freq % Freq % Freq %never known parents -2 21 .5 21 .5 21 .5no answer -1 14 .3 15 .4 25 .6no 1 1480 35.7 1006 24.3 1647 39.8more or less 2 721 17.4 1103 26.6 925 22.3yes 3 1906 46.0 1997 48.2 1524 36.8
---- ----- ---- ----- ---- -----Total 4142 100.0 4142 100.0 4142 100.0
aevent significant life event during youth?
While they are young, people can have certain experiences that influence the rest of their lives.Did something happen to you during your youth that has had a dominant effect on your laterlife? Can you tell me what happened? In what way have you been influenced by whathappened?
Op jongere leeftijd kunnen mensen dingen meemaken die hun hele verdere leven beïnvloeden. Isin uw jeugd u iets overkomen dat zeer bepalend is geweest voor uw latere leven? Wat voorgebeurtenis was dat? Op welke manier bent u door die gebeurtenis beïnvloed?
Value Label Value Frequency % Cum%no event 1 3098 74.8 74.8yes, event 2 1044 25.2 100.0
------- -------Total 4142 100.0
Information stored in database LSNa020.dbf.
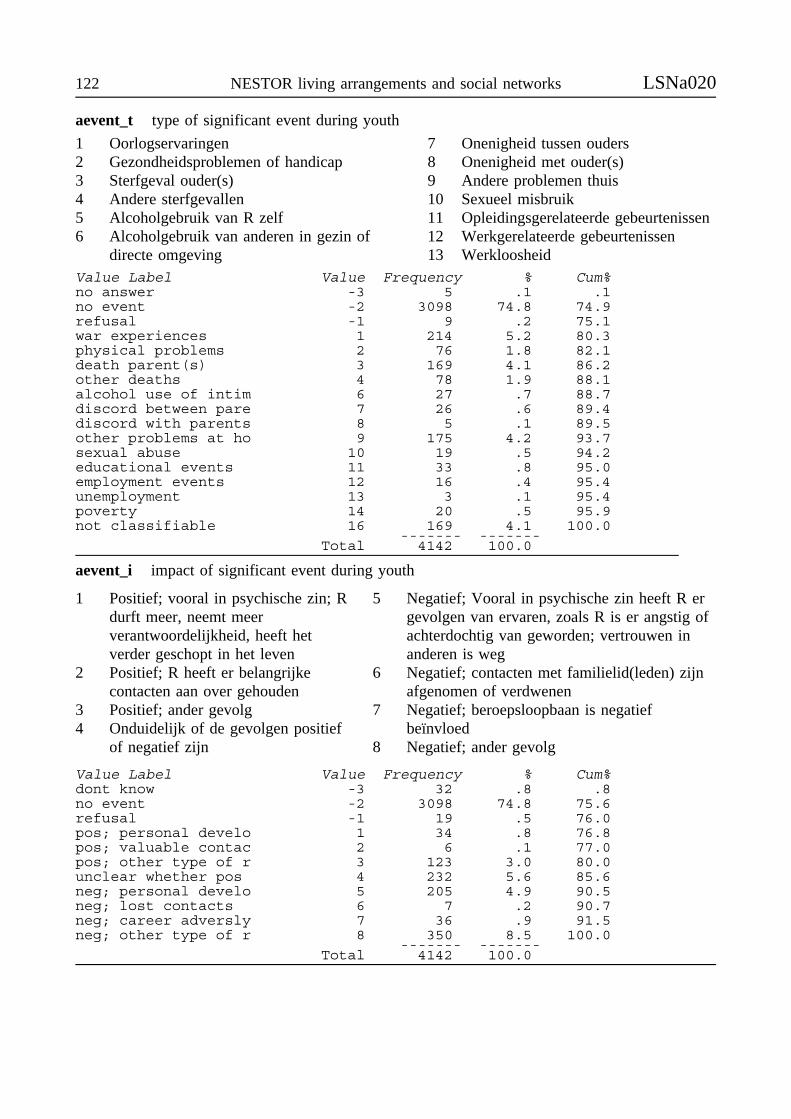
122 NESTOR living arrangements and social networks LSNa020
aevent_t type of significant event during youth
1 Oorlogservaringen2 Gezondheidsproblemen of handicap3 Sterfgeval ouder(s)4 Andere sterfgevallen5 Alcoholgebruik van R zelf6 Alcoholgebruik van anderen in gezin of
directe omgeving
7 Onenigheid tussen ouders8 Onenigheid met ouder(s)9 Andere problemen thuis10 Sexueel misbruik11 Opleidingsgerelateerde gebeurtenissen12 Werkgerelateerde gebeurtenissen13 Werkloosheid
Value Label Value Frequency % Cum%no answer -3 5 .1 .1no event -2 3098 74.8 74.9refusal -1 9 .2 75.1war experiences 1 214 5.2 80.3physical problems 2 76 1.8 82.1death parent(s) 3 169 4.1 86.2other deaths 4 78 1.9 88.1alcohol use of intim 6 27 .7 88.7discord between pare 7 26 .6 89.4discord with parents 8 5 .1 89.5other problems at ho 9 175 4.2 93.7sexual abuse 10 19 .5 94.2educational events 11 33 .8 95.0employment events 12 16 .4 95.4unemployment 13 3 .1 95.4poverty 14 20 .5 95.9not classifiable 16 169 4.1 100.0
------- -------Total 4142 100.0
aevent_i impact of significant event during youth
1 Positief; vooral in psychische zin; Rdurft meer, neemt meerverantwoordelijkheid, heeft hetverder geschopt in het leven
2 Positief; R heeft er belangrijkecontacten aan over gehouden
3 Positief; ander gevolg4 Onduidelijk of de gevolgen positief
of negatief zijn
5 Negatief; Vooral in psychische zin heeft R ergevolgen van ervaren, zoals R is er angstig ofachterdochtig van geworden; vertrouwen inanderen is weg
6 Negatief; contacten met familielid(leden) zijnafgenomen of verdwenen
7 Negatief; beroepsloopbaan is negatiefbeïnvloed
8 Negatief; ander gevolg
Value Label Value Frequency % Cum%dont know -3 32 .8 .8no event -2 3098 74.8 75.6refusal -1 19 .5 76.0pos; personal develo 1 34 .8 76.8pos; valuable contac 2 6 .1 77.0pos; other type of r 3 123 3.0 80.0unclear whether pos 4 232 5.6 85.6neg; personal develo 5 205 4.9 90.5neg; lost contacts 6 7 .2 90.7neg; career adversly 7 36 .9 91.5neg; other type of r 8 350 8.5 100.0
------- -------Total 4142 100.0
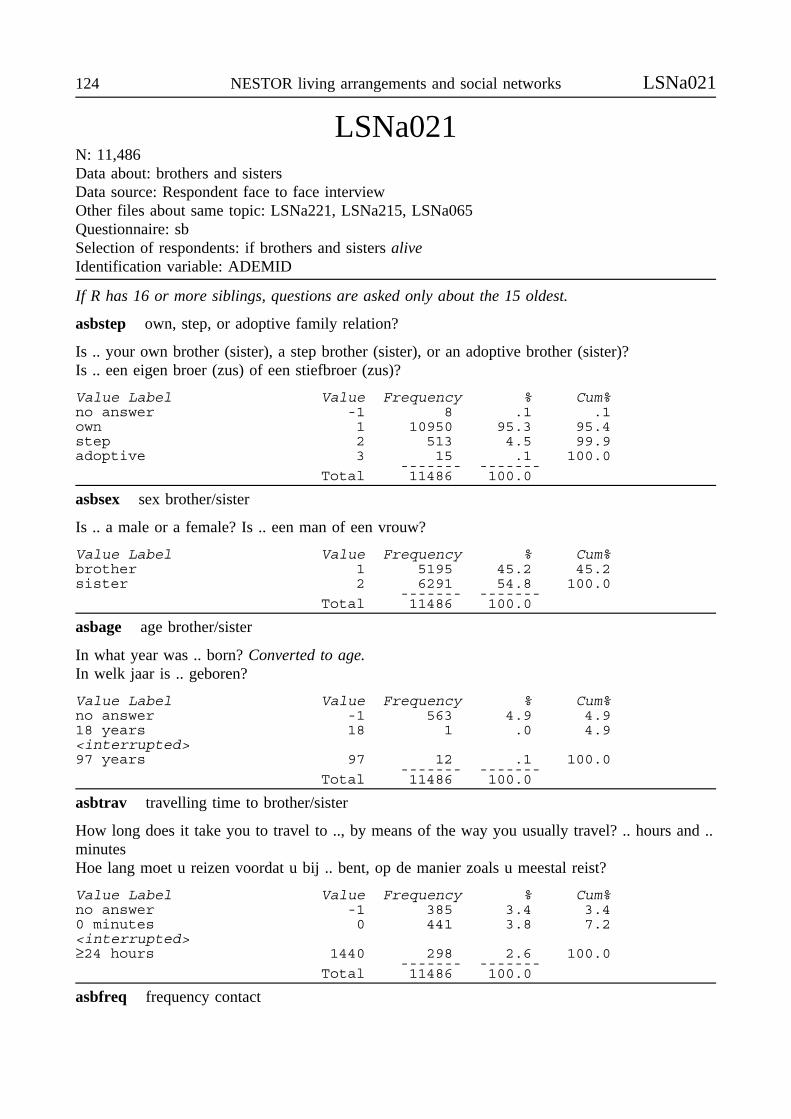
124 NESTOR living arrangements and social networks LSNa021
LSNa021N: 11,486Data about: brothers and sistersData source: Respondent face to face interviewOther files about same topic: LSNa221, LSNa215, LSNa065Questionnaire: sbSelection of respondents: if brothers and sisters aliveIdentification variable: ADEMID
If R has 16 or more siblings, questions are asked only about the 15 oldest.
asbstep own, step, or adoptive family relation?
Is .. your own brother (sister), a step brother (sister), or an adoptive brother (sister)?Is .. een eigen broer (zus) of een stiefbroer (zus)?
Value Label Value Frequency % Cum%no answer -1 8 .1 .1own 1 10950 95.3 95.4step 2 513 4.5 99.9adoptive 3 15 .1 100.0
------- -------Total 11486 100.0
asbsex sex brother/sister
Is .. a male or a female? Is .. een man of een vrouw?
Value Label Value Frequency % Cum%brother 1 5195 45.2 45.2sister 2 6291 54.8 100.0
------- -------Total 11486 100.0
asbage age brother/sister
In what year was .. born? Converted to age.In welk jaar is .. geboren?
Value Label Value Frequency % Cum%no answer -1 563 4.9 4.918 years 18 1 .0 4.9<interrupted>97 years 97 12 .1 100.0
------- -------Total 11486 100.0
asbtrav travelling time to brother/sister
How long does it take you to travel to .., by means of the way you usually travel? .. hours and ..minutesHoe lang moet u reizen voordat u bij .. bent, op de manier zoals u meestal reist?
Value Label Value Frequency % Cum%no answer -1 385 3.4 3.40 minutes 0 441 3.8 7.2<interrupted>≥24 hours 1440 298 2.6 100.0
------- -------Total 11486 100.0
asbfreq frequency contact

LSNa021 Main Study 1992 125
How often are you in touch with ..? "In touch" means face-to-face contact, as well as contact byphone or in writing.How vaak heeft u contact met ..? Het gaat zowel om contact wanneer u elkaar ziet, als wanneeru met elkaar belt of schrijft.
Suggested recoding:recode asbfreq (1=0)(2=1)(3=6)(4=12)(5=26)(6=52)(7=156)(8=365).value labels asbfreq -1’no answer’0’never’1’once a year or less’6’few times a year’12’once a month’26’once a fortnight’52’once a week’156’few times a week’365’each day’.
Value Label Value Frequency % Cum%no answer -1 188 1.6 1.6never 1 1080 9.4 11.0once a year or less 2 796 6.9 18.0few times a year 3 3703 32.2 50.2once a month 4 2238 19.5 69.7once a forthnight 5 1148 10.0 79.7once a week 6 1325 11.5 91.2few times a week 7 658 5.7 97.0each day 8 350 3.0 100.0
------- -------Total 11486 100.0
asbpart partner status brother/sister
Is .. living with a partner, and what is his/her official marital status?Woont .. met een partner, en wat is zijn/haar burgerlijke staat?
Value Label Value Frequency % Cum%no answer -1 146 1.3 1.3mar,partner 1 7671 66.8 68.1wid,partner 2 273 2.4 70.4div,partner 3 83 .7 71.2unm,partner 4 194 1.7 72.8mar,no partner 5 34 .3 73.1wid,no partner 6 2005 17.5 90.6div,no partner 7 325 2.8 93.4unm,no partner 8 755 6.6 100.0
------- -------Total 11486 100.0
asbhoush living in household R
Does .. live with you in the same household?Woont .. bij u in huis?
Value Label Value Frequency % Cum%not in household R 0 11437 99.6 99.6liv in household R 1 49 .4 100.0
------- -------Total 11486 100.0
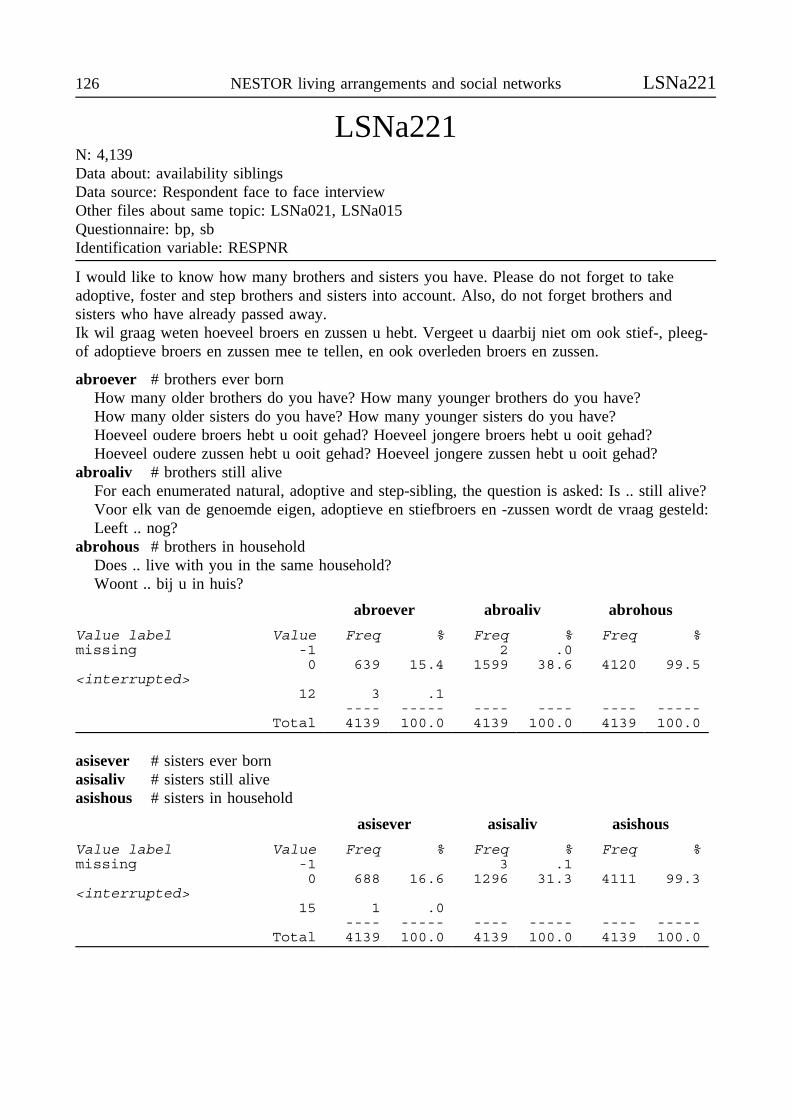
126 NESTOR living arrangements and social networks LSNa221
LSNa221N: 4,139Data about: availability siblingsData source: Respondent face to face interviewOther files about same topic: LSNa021, LSNa015Questionnaire: bp, sbIdentification variable: RESPNR
I would like to know how many brothers and sisters you have. Please do not forget to takeadoptive, foster and step brothers and sisters into account. Also, do not forget brothers andsisters who have already passed away.Ik wil graag weten hoeveel broers en zussen u hebt. Vergeet u daarbij niet om ook stief-, pleeg-of adoptieve broers en zussen mee te tellen, en ook overleden broers en zussen.
abroever # brothers ever bornHow many older brothers do you have? How many younger brothers do you have?How many older sisters do you have? How many younger sisters do you have?Hoeveel oudere broers hebt u ooit gehad? Hoeveel jongere broers hebt u ooit gehad?Hoeveel oudere zussen hebt u ooit gehad? Hoeveel jongere zussen hebt u ooit gehad?
abroaliv # brothers still aliveFor each enumerated natural, adoptive and step-sibling, the question is asked: Is .. still alive?Voor elk van de genoemde eigen, adoptieve en stiefbroers en -zussen wordt de vraag gesteld:Leeft .. nog?
abrohous # brothers in householdDoes .. live with you in the same household?Woont .. bij u in huis?
abroever abroaliv abrohous
Value label Value Freq % Freq % Freq %missing -1 2 .0
0 639 15.4 1599 38.6 4120 99.5<interrupted>
12 3 .1---- ----- ---- ---- ---- -----
Total 4139 100.0 4139 100.0 4139 100.0
asisever # sisters ever bornasisaliv # sisters still aliveasishous # sisters in household
asisever asisaliv asishous
Value label Value Freq % Freq % Freq %missing -1 3 .1
0 688 16.6 1296 31.3 4111 99.3<interrupted>
15 1 .0---- ----- ---- ----- ---- -----
Total 4139 100.0 4139 100.0 4139 100.0
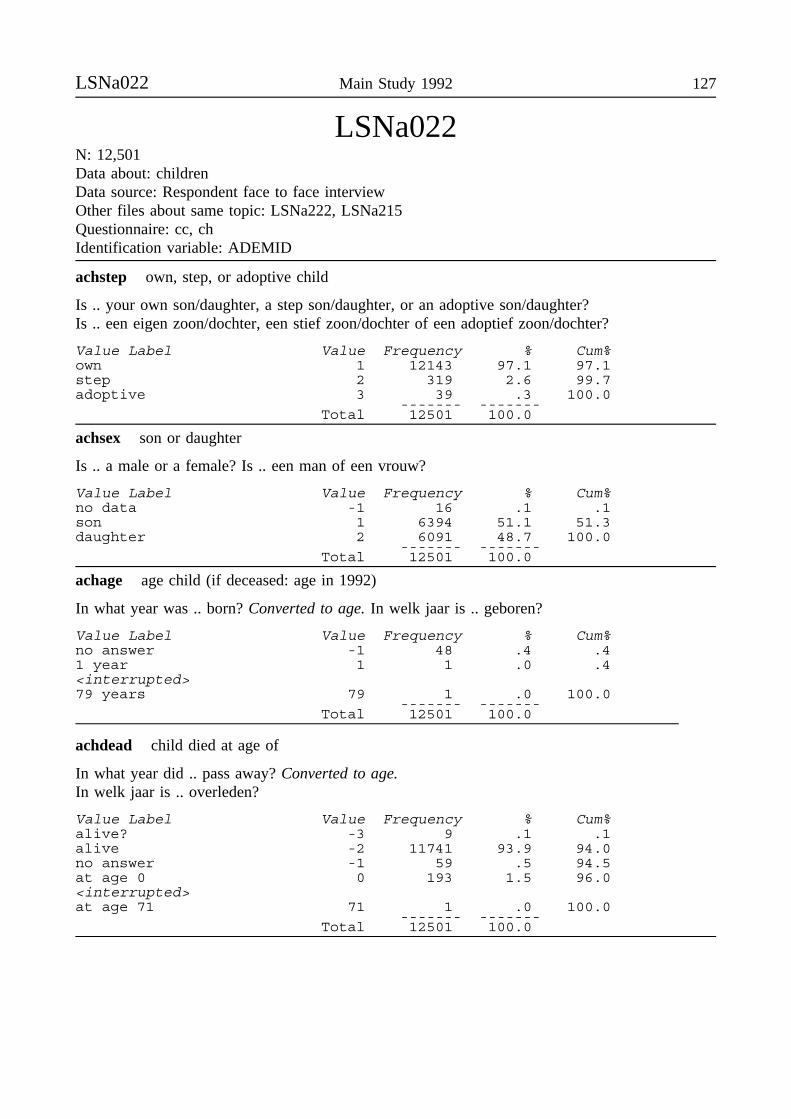
LSNa022 Main Study 1992 127
LSNa022N: 12,501Data about: childrenData source: Respondent face to face interviewOther files about same topic: LSNa222, LSNa215Questionnaire: cc, chIdentification variable: ADEMID
achstep own, step, or adoptive child
Is .. your own son/daughter, a step son/daughter, or an adoptive son/daughter?Is .. een eigen zoon/dochter, een stief zoon/dochter of een adoptief zoon/dochter?
Value Label Value Frequency % Cum%own 1 12143 97.1 97.1step 2 319 2.6 99.7adoptive 3 39 .3 100.0
------- -------Total 12501 100.0
achsex son or daughter
Is .. a male or a female? Is .. een man of een vrouw?
Value Label Value Frequency % Cum%no data -1 16 .1 .1son 1 6394 51.1 51.3daughter 2 6091 48.7 100.0
------- -------Total 12501 100.0
achage age child (if deceased: age in 1992)
In what year was .. born? Converted to age. In welk jaar is .. geboren?
Value Label Value Frequency % Cum%no answer -1 48 .4 .41 year 1 1 .0 .4<interrupted>79 years 79 1 .0 100.0
------- -------Total 12501 100.0
achdead child died at age of
In what year did .. pass away? Converted to age.In welk jaar is .. overleden?
Value Label Value Frequency % Cum%alive? -3 9 .1 .1alive -2 11741 93.9 94.0no answer -1 59 .5 94.5at age 0 0 193 1.5 96.0<interrupted>at age 71 71 1 .0 100.0
------- -------Total 12501 100.0
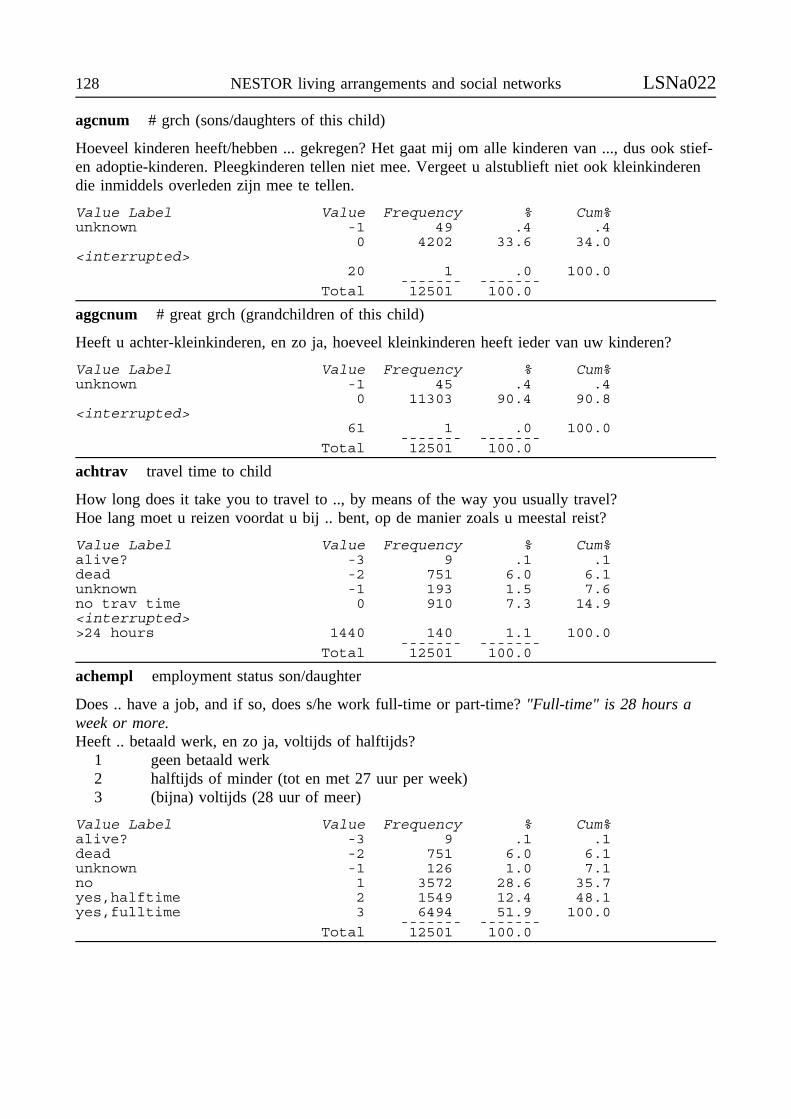
128 NESTOR living arrangements and social networks LSNa022
agcnum # grch (sons/daughters of this child)
Hoeveel kinderen heeft/hebben ... gekregen? Het gaat mij om alle kinderen van ..., dus ook stief-en adoptie-kinderen. Pleegkinderen tellen niet mee. Vergeet u alstublieft niet ook kleinkinderendie inmiddels overleden zijn mee te tellen.
Value Label Value Frequency % Cum%unknown -1 49 .4 .4
0 4202 33.6 34.0<interrupted>
20 1 .0 100.0------- -------
Total 12501 100.0
aggcnum # great grch (grandchildren of this child)
Heeft u achter-kleinkinderen, en zo ja, hoeveel kleinkinderen heeft ieder van uw kinderen?
Value Label Value Frequency % Cum%unknown -1 45 .4 .4
0 11303 90.4 90.8<interrupted>
61 1 .0 100.0------- -------
Total 12501 100.0
achtrav travel time to child
How long does it take you to travel to .., by means of the way you usually travel?Hoe lang moet u reizen voordat u bij .. bent, op de manier zoals u meestal reist?
Value Label Value Frequency % Cum%alive? -3 9 .1 .1dead -2 751 6.0 6.1unknown -1 193 1.5 7.6no trav time 0 910 7.3 14.9<interrupted>>24 hours 1440 140 1.1 100.0
------- -------Total 12501 100.0
achempl employment status son/daughter
Does .. have a job, and if so, does s/he work full-time or part-time? "Full-time" is 28 hours aweek or more.Heeft .. betaald werk, en zo ja, voltijds of halftijds?
1 geen betaald werk2 halftijds of minder (tot en met 27 uur per week)3 (bijna) voltijds (28 uur of meer)
Value Label Value Frequency % Cum%alive? -3 9 .1 .1dead -2 751 6.0 6.1unknown -1 126 1.0 7.1no 1 3572 28.6 35.7yes,halftime 2 1549 12.4 48.1yes,fulltime 3 6494 51.9 100.0
------- -------Total 12501 100.0

LSNa022 Main Study 1992 129
achfreq frequency contact
How often are you in touch with ..? How vaak heeft u contact met ..?
Suggested recoding:recode achfreq (1=0)(2=1)(3=6)(4=12)(5=26)(6=52)(7=156)(8=365).value labels achfreq -3’alive’-2’dead’-1’no answer’0’never’ 1’once ayear or less’6’few times a year’12’once a month’26’once a fortnight’52’once a week’156’few times a week’365’each day’.
Value Label Value Frequency % Cum%alive? -3 9 .1 .1dead -2 751 6.0 6.1unknown -1 38 .3 6.4never 1 255 2.0 8.4once a year or less 2 91 .7 9.2few times a year 3 582 4.7 13.8once a month 4 1008 8.1 21.9once a forthnight 5 1333 10.7 32.5once a week 6 3044 24.4 56.9few times a week 7 3209 25.7 82.6each day 8 2181 17.4 100.0
------- -------Total 12501 100.0
achpart partner status child
Is .. living with a partner, and what is his/her official marital status?Woont .. met een partner, en wat is zijn/haar burgerlijke staat?
Value Label Value Frequency % Cum%alive? -3 9 .1 .1dead -2 751 6.0 6.1unknown -1 90 .7 6.8married,partner 1 8233 65.9 72.7widowed,partner 2 37 .3 73.0divorced,partner 3 165 1.3 74.3unmarried,partner 4 1066 8.5 82.8married,no partner 5 18 .1 82.9widowed,no partner 6 105 .8 83.8divorced,no partner 7 371 3.0 86.8unmarried,no partner 8 1656 13.2 100.0
------- -------Total 12501 100.0
achhoush child in household R
Does .. live with you in the same household?Woont .. bij u in huis?
Value Label Value Frequency % Cum%dead -2 760 6.1 6.1not in household R 0 11043 88.3 94.4in household R 1 698 5.6 100.0
------- -------Total 12501 100.0
anformm # former marriages of child
How often has .. been married (before)?Hoe vaak is .. (eerder) gehuwd geweest?
Value Label Value Frequency % Cum%miss info R -8 9 .1 .1<16y old/never marri -2 3234 25.9 25.9
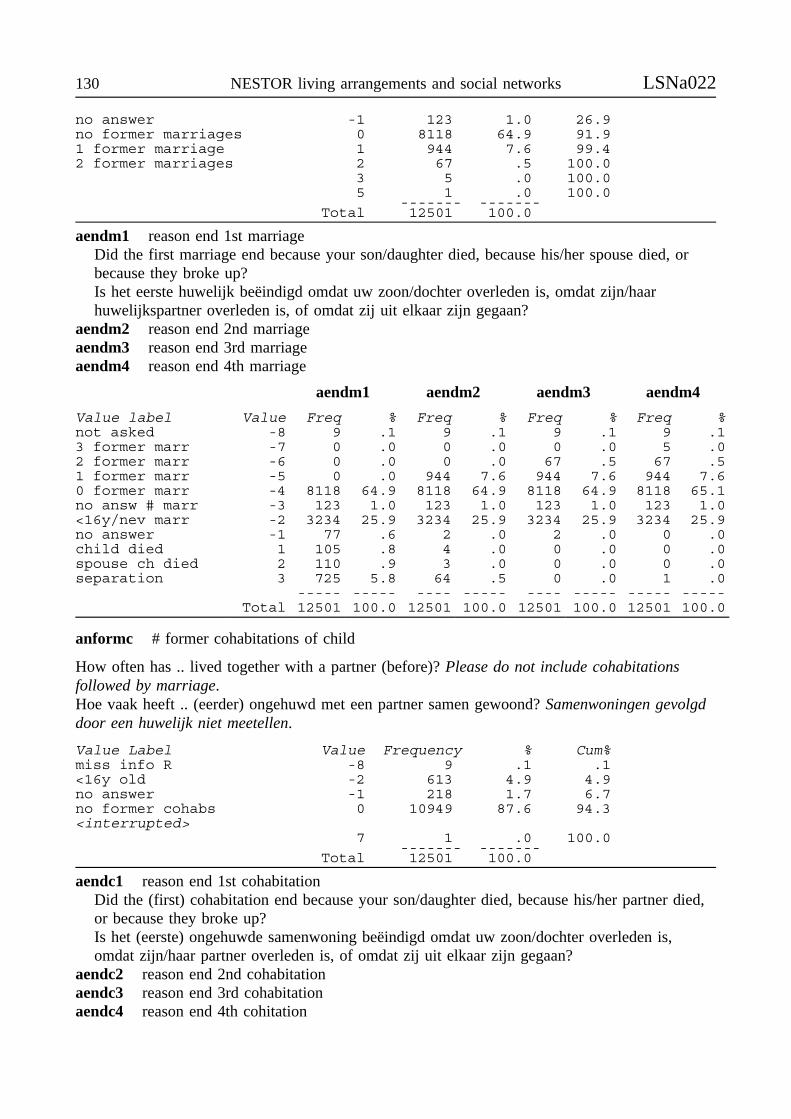
130 NESTOR living arrangements and social networks LSNa022
no answer -1 123 1.0 26.9no former marriages 0 8118 64.9 91.91 former marriage 1 944 7.6 99.42 former marriages 2 67 .5 100.0
3 5 .0 100.05 1 .0 100.0
------- -------Total 12501 100.0
aendm1 reason end 1st marriageDid the first marriage end because your son/daughter died, because his/her spouse died, orbecause they broke up?Is het eerste huwelijk beëindigd omdat uw zoon/dochter overleden is, omdat zijn/haarhuwelijkspartner overleden is, of omdat zij uit elkaar zijn gegaan?
aendm2 reason end 2nd marriageaendm3 reason end 3rd marriageaendm4 reason end 4th marriage
aendm1 aendm2 aendm3 aendm4
Value label Value Freq % Freq % Freq % Freq %not asked -8 9 .1 9 .1 9 .1 9 .13 former marr -7 0 .0 0 .0 0 .0 5 .02 former marr -6 0 .0 0 .0 67 .5 67 .51 former marr -5 0 .0 944 7.6 944 7.6 944 7.60 former marr -4 8118 64.9 8118 64.9 8118 64.9 8118 65.1no answ # marr -3 123 1.0 123 1.0 123 1.0 123 1.0<16y/nev marr -2 3234 25.9 3234 25.9 3234 25.9 3234 25.9no answer -1 77 .6 2 .0 2 .0 0 .0child died 1 105 .8 4 .0 0 .0 0 .0spouse ch died 2 110 .9 3 .0 0 .0 0 .0separation 3 725 5.8 64 .5 0 .0 1 .0
----- ----- ---- ----- ---- ----- ----- -----Total 12501 100.0 12501 100.0 12501 100.0 12501 100.0
anformc # former cohabitations of child
How often has .. lived together with a partner (before)? Please do not include cohabitationsfollowed by marriage.Hoe vaak heeft .. (eerder) ongehuwd met een partner samen gewoond? Samenwoningen gevolgddoor een huwelijk niet meetellen.
Value Label Value Frequency % Cum%miss info R -8 9 .1 .1<16y old -2 613 4.9 4.9no answer -1 218 1.7 6.7no former cohabs 0 10949 87.6 94.3<interrupted>
7 1 .0 100.0------- -------
Total 12501 100.0
aendc1 reason end 1st cohabitationDid the (first) cohabitation end because your son/daughter died, because his/her partner died,or because they broke up?Is het (eerste) ongehuwde samenwoning beëindigd omdat uw zoon/dochter overleden is,omdat zijn/haar partner overleden is, of omdat zij uit elkaar zijn gegaan?
aendc2 reason end 2nd cohabitationaendc3 reason end 3rd cohabitationaendc4 reason end 4th cohitation
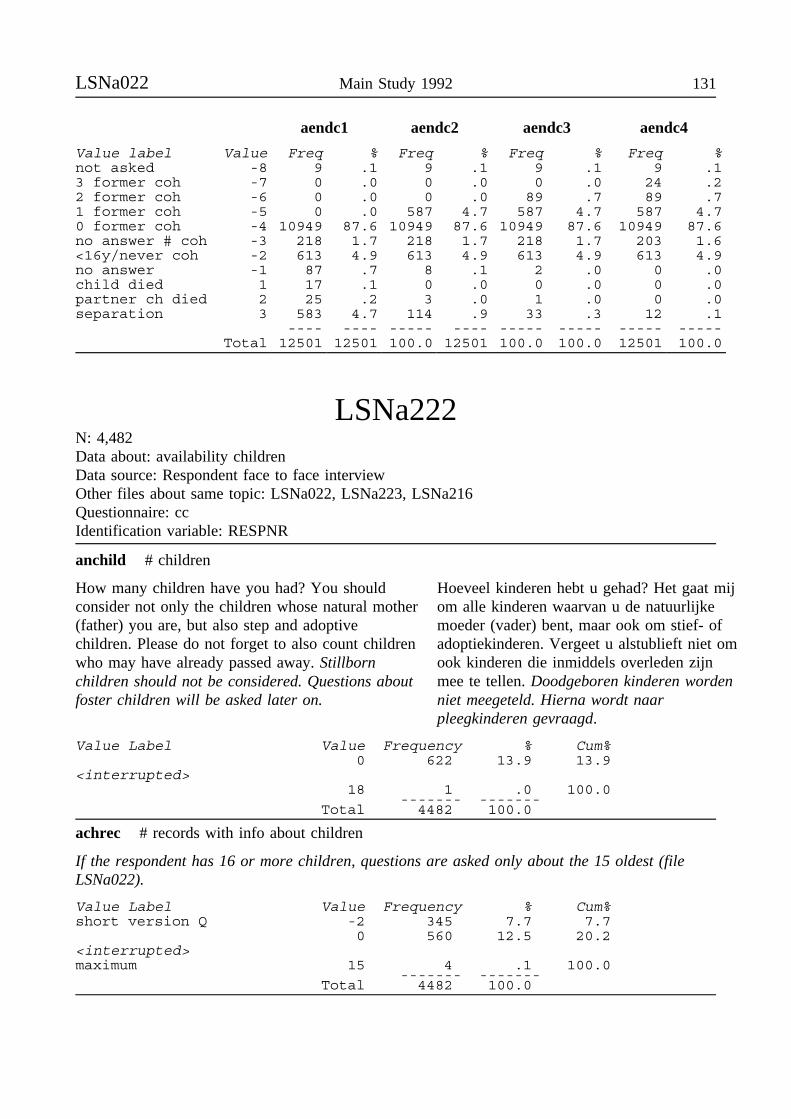
LSNa022 Main Study 1992 131
aendc1 aendc2 aendc3 aendc4
Value label Value Freq % Freq % Freq % Freq %not asked -8 9 .1 9 .1 9 .1 9 .13 former coh -7 0 .0 0 .0 0 .0 24 .22 former coh -6 0 .0 0 .0 89 .7 89 .71 former coh -5 0 .0 587 4.7 587 4.7 587 4.70 former coh -4 10949 87.6 10949 87.6 10949 87.6 10949 87.6no answer # coh -3 218 1.7 218 1.7 218 1.7 203 1.6<16y/never coh -2 613 4.9 613 4.9 613 4.9 613 4.9no answer -1 87 .7 8 .1 2 .0 0 .0child died 1 17 .1 0 .0 0 .0 0 .0partner ch died 2 25 .2 3 .0 1 .0 0 .0separation 3 583 4.7 114 .9 33 .3 12 .1
---- ---- ----- ---- ----- ----- ----- -----Total 12501 12501 100.0 12501 100.0 100.0 12501 100.0
LSNa222N: 4,482Data about: availability childrenData source: Respondent face to face interviewOther files about same topic: LSNa022, LSNa223, LSNa216Questionnaire: ccIdentification variable: RESPNR
anchild # children
How many children have you had? You shouldconsider not only the children whose natural mother(father) you are, but also step and adoptivechildren. Please do not forget to also count childrenwho may have already passed away. Stillbornchildren should not be considered. Questions aboutfoster children will be asked later on.
Hoeveel kinderen hebt u gehad? Het gaat mijom alle kinderen waarvan u de natuurlijkemoeder (vader) bent, maar ook om stief- ofadoptiekinderen. Vergeet u alstublieft niet omook kinderen die inmiddels overleden zijnmee te tellen. Doodgeboren kinderen wordenniet meegeteld. Hierna wordt naarpleegkinderen gevraagd.
Value Label Value Frequency % Cum%0 622 13.9 13.9
<interrupted>18 1 .0 100.0
------- -------Total 4482 100.0
achrec # records with info about children
If the respondent has 16 or more children, questions are asked only about the 15 oldest (fileLSNa022).
Value Label Value Frequency % Cum%short version Q -2 345 7.7 7.7
0 560 12.5 20.2<interrupted>maximum 15 4 .1 100.0
------- -------Total 4482 100.0
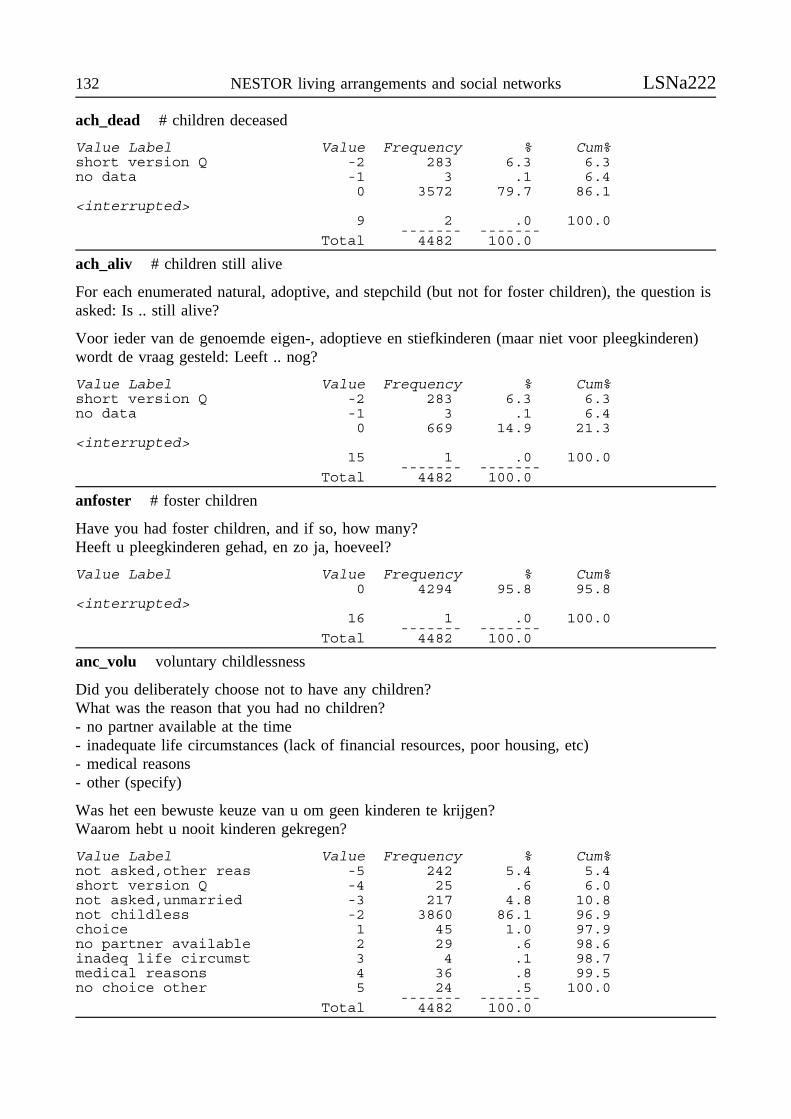
132 NESTOR living arrangements and social networks LSNa222
ach_dead # children deceased
Value Label Value Frequency % Cum%short version Q -2 283 6.3 6.3no data -1 3 .1 6.4
0 3572 79.7 86.1<interrupted>
9 2 .0 100.0------- -------
Total 4482 100.0
ach_aliv # children still alive
For each enumerated natural, adoptive, and stepchild (but not for foster children), the question isasked: Is .. still alive?
Voor ieder van de genoemde eigen-, adoptieve en stiefkinderen (maar niet voor pleegkinderen)wordt de vraag gesteld: Leeft .. nog?
Value Label Value Frequency % Cum%short version Q -2 283 6.3 6.3no data -1 3 .1 6.4
0 669 14.9 21.3<interrupted>
15 1 .0 100.0------- -------
Total 4482 100.0
anfoster # foster children
Have you had foster children, and if so, how many?Heeft u pleegkinderen gehad, en zo ja, hoeveel?
Value Label Value Frequency % Cum%0 4294 95.8 95.8
<interrupted>16 1 .0 100.0
------- -------Total 4482 100.0
anc_volu voluntary childlessness
Did you deliberately choose not to have any children?What was the reason that you had no children?- no partner available at the time- inadequate life circumstances (lack of financial resources, poor housing, etc)- medical reasons- other (specify)
Was het een bewuste keuze van u om geen kinderen te krijgen?Waarom hebt u nooit kinderen gekregen?
Value Label Value Frequency % Cum%not asked,other reas -5 242 5.4 5.4short version Q -4 25 .6 6.0not asked,unmarried -3 217 4.8 10.8not childless -2 3860 86.1 96.9choice 1 45 1.0 97.9no partner available 2 29 .6 98.6inadeq life circumst 3 4 .1 98.7medical reasons 4 36 .8 99.5no choice other 5 24 .5 100.0
------- -------Total 4482 100.0
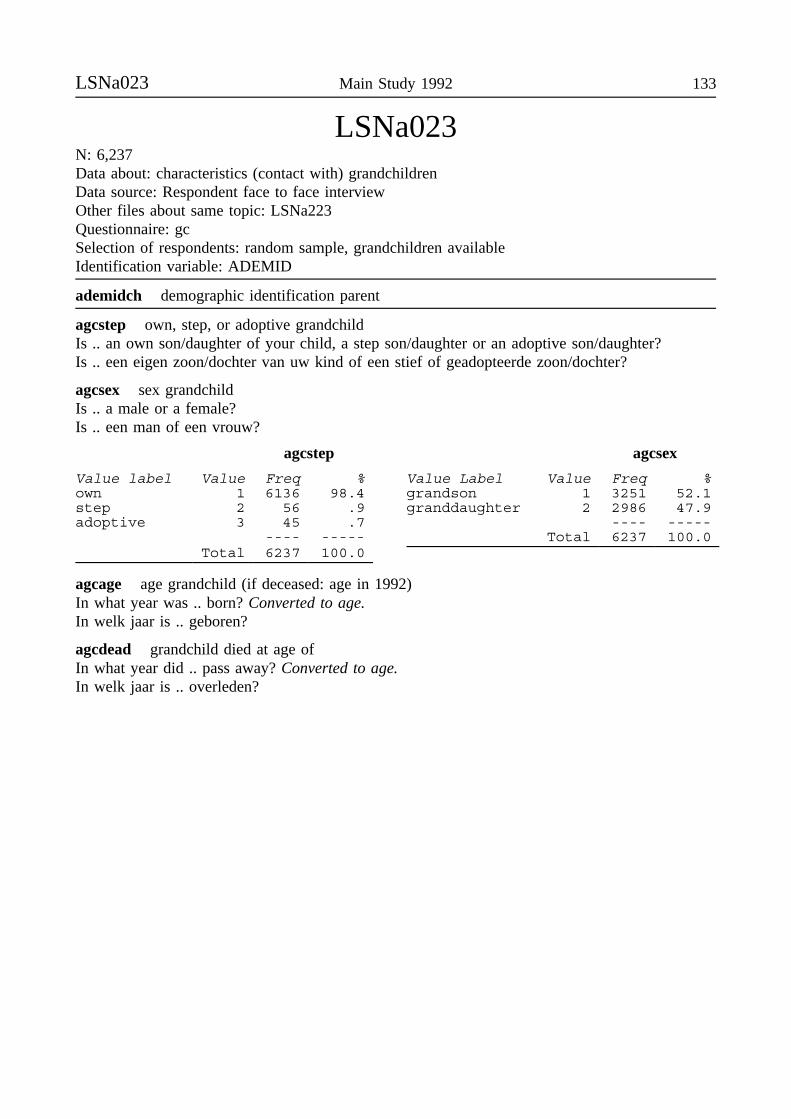
LSNa023 Main Study 1992 133
LSNa023N: 6,237Data about: characteristics (contact with) grandchildrenData source: Respondent face to face interviewOther files about same topic: LSNa223Questionnaire: gcSelection of respondents: random sample, grandchildren availableIdentification variable: ADEMID
ademidch demographic identification parent
agcstep own, step, or adoptive grandchildIs .. an own son/daughter of your child, a step son/daughter or an adoptive son/daughter?Is .. een eigen zoon/dochter van uw kind of een stief of geadopteerde zoon/dochter?
agcsex sex grandchildIs .. a male or a female?Is .. een man of een vrouw?
agcstep agcsex
Value label Value Freq % Value Label Value Freq %own 1 6136 98.4 grandson 1 3251 52.1step 2 56 .9 granddaughter 2 2986 47.9adoptive 3 45 .7 ---- -----
---- ----- Total 6237 100.0Total 6237 100.0
agcage age grandchild (if deceased: age in 1992)In what year was .. born? Converted to age.In welk jaar is .. geboren?
agcdead grandchild died at age ofIn what year did .. pass away? Converted to age.In welk jaar is .. overleden?
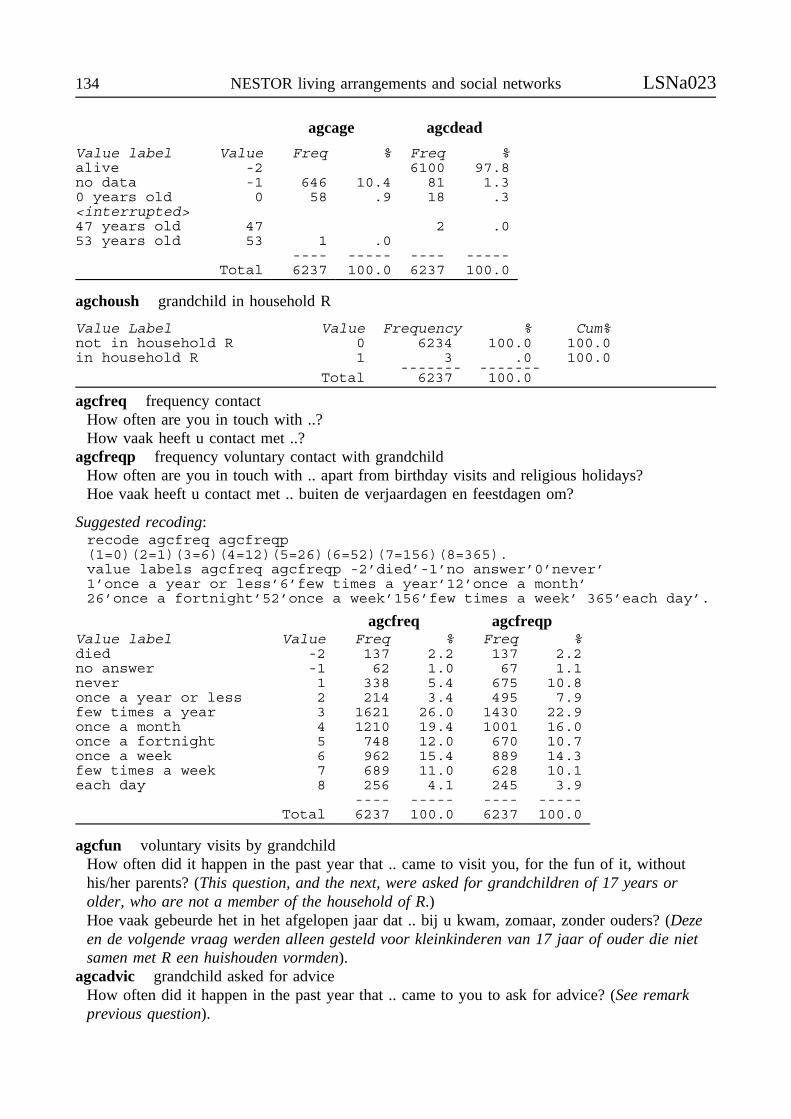
134 NESTOR living arrangements and social networks LSNa023
agcage agcdead
Value label Value Freq % Freq %alive -2 6100 97.8no data -1 646 10.4 81 1.30 years old 0 58 .9 18 .3<interrupted>47 years old 47 2 .053 years old 53 1 .0
---- ----- ---- -----Total 6237 100.0 6237 100.0
agchoush grandchild in household R
Value Label Value Frequency % Cum%not in household R 0 6234 100.0 100.0in household R 1 3 .0 100.0
------- -------Total 6237 100.0
agcfreq frequency contactHow often are you in touch with ..?How vaak heeft u contact met ..?
agcfreqp frequency voluntary contact with grandchildHow often are you in touch with .. apart from birthday visits and religious holidays?Hoe vaak heeft u contact met .. buiten de verjaardagen en feestdagen om?
Suggested recoding:recode agcfreq agcfreqp(1=0)(2=1)(3=6)(4=12)(5=26)(6=52)(7=156)(8=365).value labels agcfreq agcfreqp -2’died’-1’no answer’0’never’1’once a year or less’6’few times a year’12’once a month’26’once a fortnight’52’once a week’156’few times a week’ 365’each day’.
agcfreq agcfreqpValue label Value Freq % Freq %died -2 137 2.2 137 2.2no answer -1 62 1.0 67 1.1never 1 338 5.4 675 10.8once a year or less 2 214 3.4 495 7.9few times a year 3 1621 26.0 1430 22.9once a month 4 1210 19.4 1001 16.0once a fortnight 5 748 12.0 670 10.7once a week 6 962 15.4 889 14.3few times a week 7 689 11.0 628 10.1each day 8 256 4.1 245 3.9
---- ----- ---- -----Total 6237 100.0 6237 100.0
agcfun voluntary visits by grandchildHow often did it happen in the past year that .. came to visit you, for the fun of it, withouthis/her parents? (This question, and the next, were asked for grandchildren of 17 years orolder, who are not a member of the household of R.)Hoe vaak gebeurde het in het afgelopen jaar dat .. bij u kwam, zomaar, zonder ouders? (Dezeen de volgende vraag werden alleen gesteld voor kleinkinderen van 17 jaar of ouder die nietsamen met R een huishouden vormden).
agcadvic grandchild asked for adviceHow often did it happen in the past year that .. came to you to ask for advice? (See remarkprevious question).
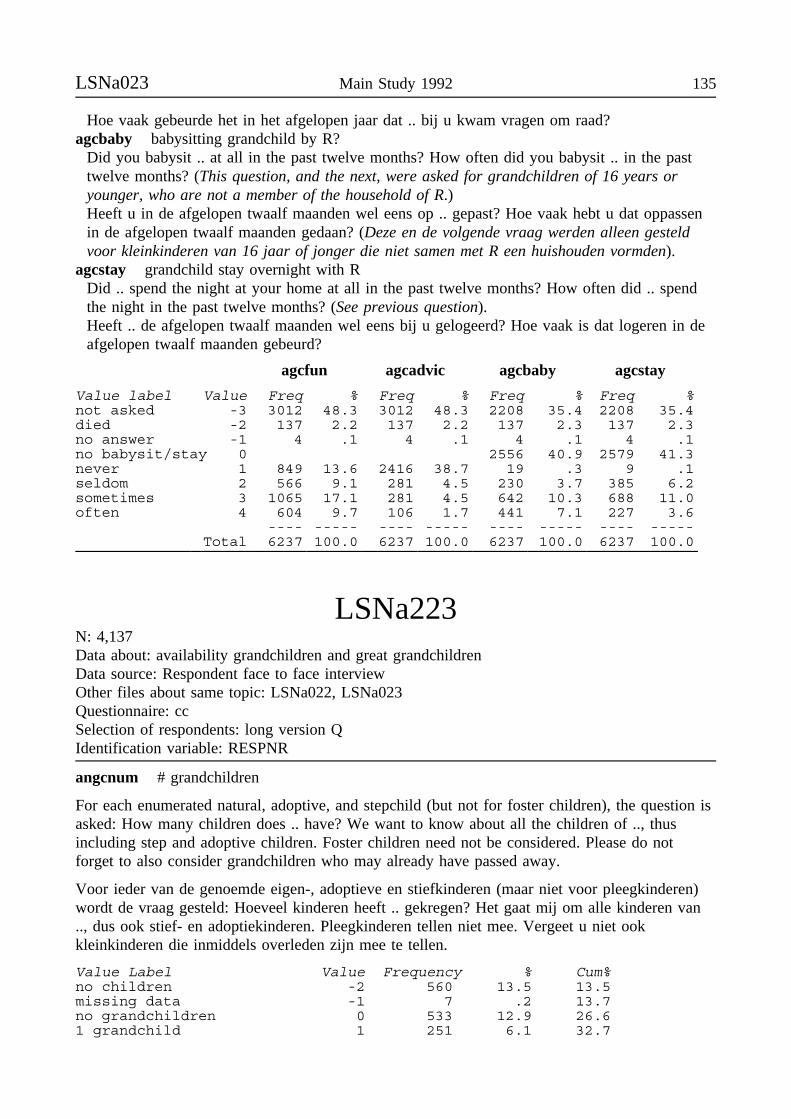
LSNa023 Main Study 1992 135
Hoe vaak gebeurde het in het afgelopen jaar dat .. bij u kwam vragen om raad?agcbaby babysitting grandchild by R?
Did you babysit .. at all in the past twelve months? How often did you babysit .. in the pasttwelve months? (This question, and the next, were asked for grandchildren of 16 years oryounger, who are not a member of the household of R.)Heeft u in de afgelopen twaalf maanden wel eens op .. gepast? Hoe vaak hebt u dat oppassenin de afgelopen twaalf maanden gedaan? (Deze en de volgende vraag werden alleen gesteldvoor kleinkinderen van 16 jaar of jonger die niet samen met R een huishouden vormden).
agcstay grandchild stay overnight with RDid .. spend the night at your home at all in the past twelve months? How often did .. spendthe night in the past twelve months? (See previous question).Heeft .. de afgelopen twaalf maanden wel eens bij u gelogeerd? Hoe vaak is dat logeren in deafgelopen twaalf maanden gebeurd?
agcfun agcadvic agcbaby agcstay
Value label Value Freq % Freq % Freq % Freq %not asked -3 3012 48.3 3012 48.3 2208 35.4 2208 35.4died -2 137 2.2 137 2.2 137 2.3 137 2.3no answer -1 4 .1 4 .1 4 .1 4 .1no babysit/stay 0 2556 40.9 2579 41.3never 1 849 13.6 2416 38.7 19 .3 9 .1seldom 2 566 9.1 281 4.5 230 3.7 385 6.2sometimes 3 1065 17.1 281 4.5 642 10.3 688 11.0often 4 604 9.7 106 1.7 441 7.1 227 3.6
---- ----- ---- ----- ---- ----- ---- -----Total 6237 100.0 6237 100.0 6237 100.0 6237 100.0
LSNa223N: 4,137Data about: availability grandchildren and great grandchildrenData source: Respondent face to face interviewOther files about same topic: LSNa022, LSNa023Questionnaire: ccSelection of respondents: long version QIdentification variable: RESPNR
angcnum # grandchildren
For each enumerated natural, adoptive, and stepchild (but not for foster children), the question isasked: How many children does .. have? We want to know about all the children of .., thusincluding step and adoptive children. Foster children need not be considered. Please do notforget to also consider grandchildren who may already have passed away.
Voor ieder van de genoemde eigen-, adoptieve en stiefkinderen (maar niet voor pleegkinderen)wordt de vraag gesteld: Hoeveel kinderen heeft .. gekregen? Het gaat mij om alle kinderen van.., dus ook stief- en adoptiekinderen. Pleegkinderen tellen niet mee. Vergeet u niet ookkleinkinderen die inmiddels overleden zijn mee te tellen.
Value Label Value Frequency % Cum%no children -2 560 13.5 13.5missing data -1 7 .2 13.7no grandchildren 0 533 12.9 26.61 grandchild 1 251 6.1 32.7

136 NESTOR living arrangements and social networks LSNa223
<interrupted>46 1 .0 100.0
------- -------Total 4137 100.0
anggcnum # great grandchildren
Do you have great grandchildren, and if so, how many grandchildren does your child (do yourchildren) have? The existence of grandchildren is assessed for each enumerated natural,adoptive, and stepchild.
Heeft u achterkleinkinderen, en zo ja, hoeveel kleinkinderen heeft uw kind (hebben uwkinderen)? De aanwezigheid van kleinkinderen wordt voor ieder van de eigen, stief en adoptievekinderen van R nagegaan.
Value Label Value Frequency % Cum%no grandchildren -3 533 12.9 12.9no children -2 560 13.5 26.4missing data -1 7 .2 26.6no great grandchildr 0 2315 56.0 82.51 great grandchild 1 183 4.4 87.0<interrupted>
80 1 .0 100.0------- -------
Total 4137 100.0
LSNa030N: 4,477Data about: health respondentData source: Respondent face to face interviewOther files about same topic: LSNa230, LSNa081, LSNg030Questionnaire: hrIdentification variable: RESPNR
ahegener health in general
How is your health in general?Hoe is over het algemeen uw gezondheid?1 slecht, 2 niet zo best, 3 gaat wel, 4 goed, 5 zeer goed
Value Label Value Frequency % Cum%no answer -1 5 .1 .1poor 1 106 2.4 2.5not so good 2 413 9.2 11.7fair 3 1211 27.0 38.8good 4 2143 47.9 86.6very good 5 599 13.4 100.0
------- -------Total 4477 100.0

LSNa030 Main Study 1992 137
ahecoage How is your health in comparison to that of other people your age?Hoe is uw gezondheid in vergelijking met andere mensen van uw leeftijd?
aheco10y How is your health now in comparison to what it was like 10 years ago?Hoe is uw gezondheid nu in vergelijking met hoe het 10 jaar geleden was?
1 veel slechter, 2 iets slechter, 3 even goed, 4 iets beter, 5 veel beter
ahecoage aheco10y
Value label Value Freq % Freq %short version -3 265 5.9 265 5.9no answer -1 138 3.1 5 .1much poorer 1 113 2.5 227 5.1somewhat poorer 2 337 7.5 99 2.2the same 3 1815 40.5 150 3.4somewhat better 4 1090 24.3 388 8.7much better 5 719 16.1 3343 74.7
---- ----- ---- -----Total 4477 100.0 4477 100.0
aheill health illnesses handicaps
Are you restricted in your daily activities due to chronic illnesses, health disorders or handicaps?Do you suffer no limitations, light limitations or severe limitations?
Wordt u door langdurige ziekten, aandoeningen of handicaps belemmerd in uw dagelijksebezigheden? Wordt u hierdoor sterk belemmerd, licht belemmerd, of niet belemmerd?
Value Label Value Frequency % Cum%short version -2 265 5.9 5.9no answer -1 7 .2 6.1no limitations/handi 1 2715 60.6 66.7light limitations 2 886 19.8 86.5severe limitations 3 604 13.5 100.0
------- -------Total 4477 100.0
avisread I would like to ask you whether you can still see properly, to begin with, as regardsreading. When reading, can you see well, moderately or poorly (taking into accountthe possible use of glasses)?Ik wil u vragen of u nog goed kunt zien, in de eerste plaats bij het lezen. Kunt u bijhet lezen goed, matig of slecht zien (eventueel met gebruik van een bril)?
avisstrt And in the street, in other words, seeing at a distance? Can you then see well,moderately or poorly (taking into account the possible use of glasses)?En op straat, dus het zien in de verte? Kunt u dan slecht, matig of goed zien(eventueel met gebruik van een bril)?
ahear As regards your hearing ability, in a personal conversation can you hear the otherperson well (taking into account the possible use of a hearing aid)?Wat betreft het horen, kunt u in een persoonlijk gesprek de ander goed horen(eventueel met gebruik van een gehoorapparaat)?
1 in het geheel niet, 2 slecht, 3 matig, 4 goed
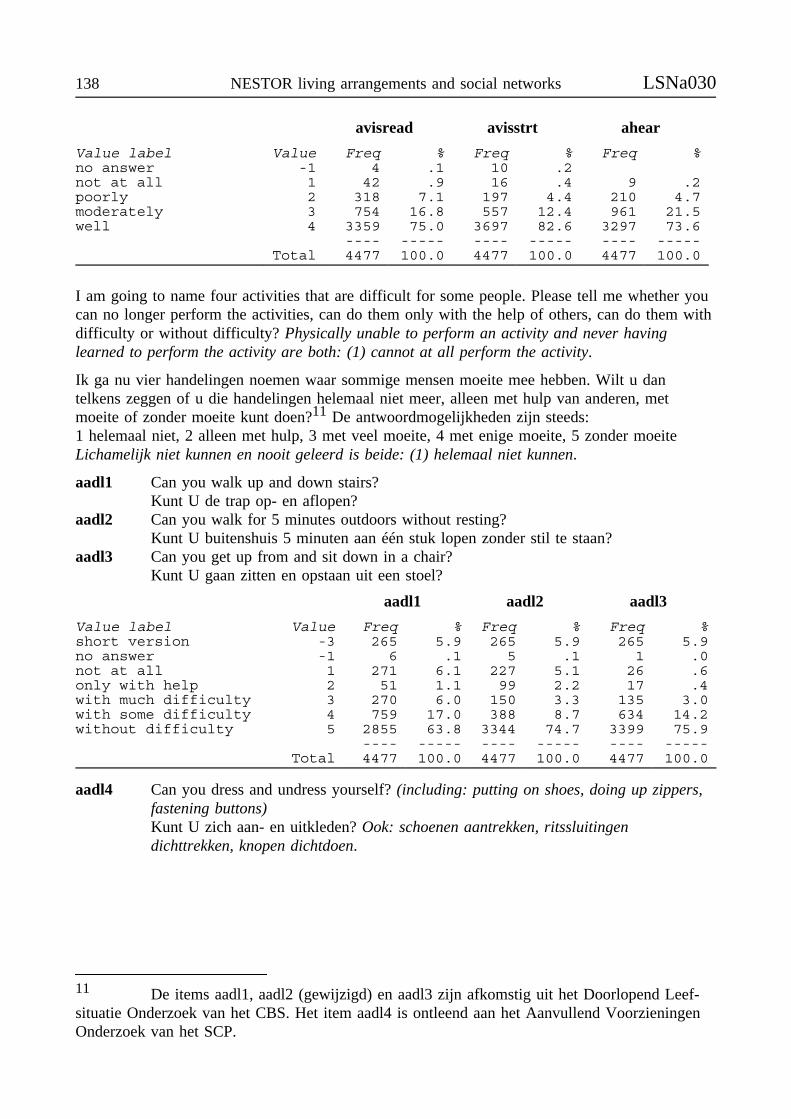
138 NESTOR living arrangements and social networks LSNa030
avisread avisstrt ahear
Value label Value Freq % Freq % Freq %no answer -1 4 .1 10 .2not at all 1 42 .9 16 .4 9 .2poorly 2 318 7.1 197 4.4 210 4.7moderately 3 754 16.8 557 12.4 961 21.5well 4 3359 75.0 3697 82.6 3297 73.6
---- ----- ---- ----- ---- -----Total 4477 100.0 4477 100.0 4477 100.0
I am going to name four activities that are difficult for some people. Please tell me whether youcan no longer perform the activities, can do them only with the help of others, can do them withdifficulty or without difficulty? Physically unable to perform an activity and never havinglearned to perform the activity are both: (1) cannot at all perform the activity.
Ik ga nu vier handelingen noemen waar sommige mensen moeite mee hebben. Wilt u dantelkens zeggen of u die handelingen helemaal niet meer, alleen met hulp van anderen, metmoeite of zonder moeite kunt doen?11 De antwoordmogelijkheden zijn steeds:1 helemaal niet, 2 alleen met hulp, 3 met veel moeite, 4 met enige moeite, 5 zonder moeiteLichamelijk niet kunnen en nooit geleerd is beide: (1) helemaal niet kunnen.
aadl1 Can you walk up and down stairs?Kunt U de trap op- en aflopen?
aadl2 Can you walk for 5 minutes outdoors without resting?Kunt U buitenshuis 5 minuten aan één stuk lopen zonder stil te staan?
aadl3 Can you get up from and sit down in a chair?Kunt U gaan zitten en opstaan uit een stoel?
aadl1 aadl2 aadl3
Value label Value Freq % Freq % Freq %short version -3 265 5.9 265 5.9 265 5.9no answer -1 6 .1 5 .1 1 .0not at all 1 271 6.1 227 5.1 26 .6only with help 2 51 1.1 99 2.2 17 .4with much difficulty 3 270 6.0 150 3.3 135 3.0with some difficulty 4 759 17.0 388 8.7 634 14.2without difficulty 5 2855 63.8 3344 74.7 3399 75.9
---- ----- ---- ----- ---- -----Total 4477 100.0 4477 100.0 4477 100.0
aadl4 Can you dress and undress yourself? (including: putting on shoes, doing up zippers,fastening buttons)Kunt U zich aan- en uitkleden? Ook: schoenen aantrekken, ritssluitingendichttrekken, knopen dichtdoen.
11 De items aadl1, aadl2 (gewijzigd) en aadl3 zijn afkomstig uit het Doorlopend Leef-situatie Onderzoek van het CBS. Het item aadl4 is ontleend aan het Aanvullend VoorzieningenOnderzoek van het SCP.
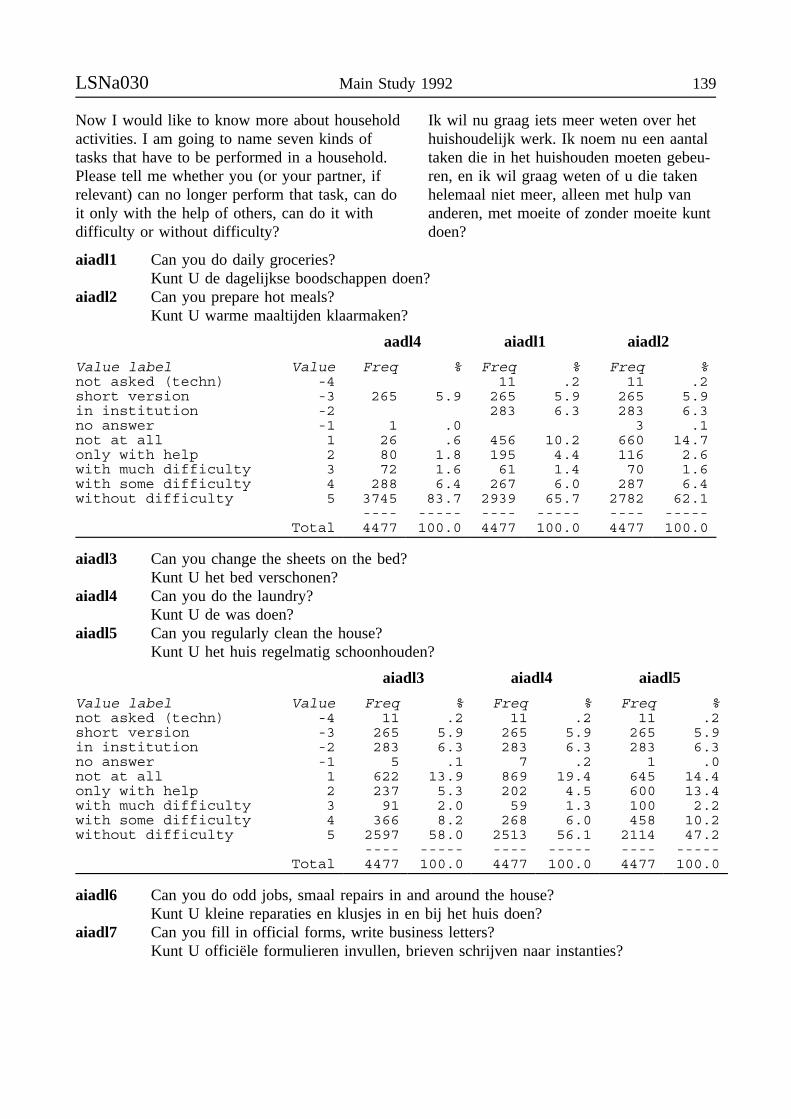
LSNa030 Main Study 1992 139
Now I would like to know more about householdactivities. I am going to name seven kinds oftasks that have to be performed in a household.Please tell me whether you (or your partner, ifrelevant) can no longer perform that task, can doit only with the help of others, can do it withdifficulty or without difficulty?
Ik wil nu graag iets meer weten over hethuishoudelijk werk. Ik noem nu een aantaltaken die in het huishouden moeten gebeu-ren, en ik wil graag weten of u die takenhelemaal niet meer, alleen met hulp vananderen, met moeite of zonder moeite kuntdoen?
aiadl1 Can you do daily groceries?Kunt U de dagelijkse boodschappen doen?
aiadl2 Can you prepare hot meals?Kunt U warme maaltijden klaarmaken?
aadl4 aiadl1 aiadl2
Value label Value Freq % Freq % Freq %not asked (techn) -4 11 .2 11 .2short version -3 265 5.9 265 5.9 265 5.9in institution -2 283 6.3 283 6.3no answer -1 1 .0 3 .1not at all 1 26 .6 456 10.2 660 14.7only with help 2 80 1.8 195 4.4 116 2.6with much difficulty 3 72 1.6 61 1.4 70 1.6with some difficulty 4 288 6.4 267 6.0 287 6.4without difficulty 5 3745 83.7 2939 65.7 2782 62.1
---- ----- ---- ----- ---- -----Total 4477 100.0 4477 100.0 4477 100.0
aiadl3 Can you change the sheets on the bed?Kunt U het bed verschonen?
aiadl4 Can you do the laundry?Kunt U de was doen?
aiadl5 Can you regularly clean the house?Kunt U het huis regelmatig schoonhouden?
aiadl3 aiadl4 aiadl5
Value label Value Freq % Freq % Freq %not asked (techn) -4 11 .2 11 .2 11 .2short version -3 265 5.9 265 5.9 265 5.9in institution -2 283 6.3 283 6.3 283 6.3no answer -1 5 .1 7 .2 1 .0not at all 1 622 13.9 869 19.4 645 14.4only with help 2 237 5.3 202 4.5 600 13.4with much difficulty 3 91 2.0 59 1.3 100 2.2with some difficulty 4 366 8.2 268 6.0 458 10.2without difficulty 5 2597 58.0 2513 56.1 2114 47.2
---- ----- ---- ----- ---- -----Total 4477 100.0 4477 100.0 4477 100.0
aiadl6 Can you do odd jobs, smaal repairs in and around the house?Kunt U kleine reparaties en klusjes in en bij het huis doen?
aiadl7 Can you fill in official forms, write business letters?Kunt U officiële formulieren invullen, brieven schrijven naar instanties?
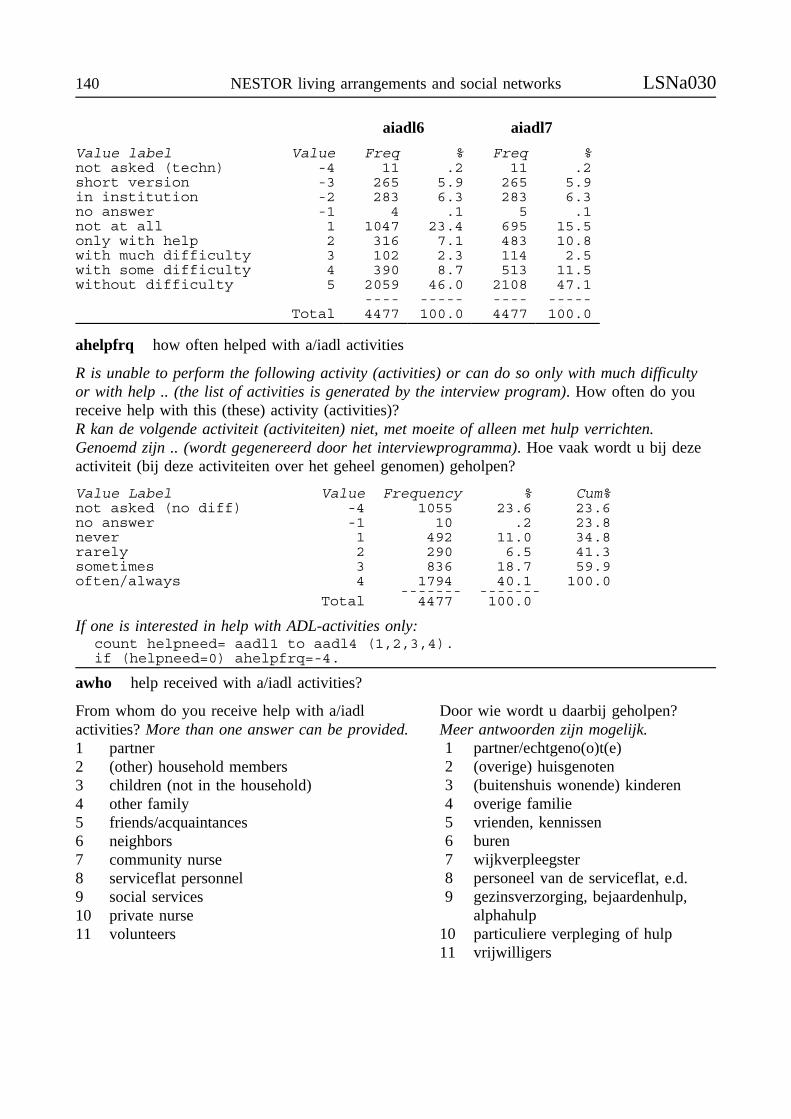
140 NESTOR living arrangements and social networks LSNa030
aiadl6 aiadl7
Value label Value Freq % Freq %not asked (techn) -4 11 .2 11 .2short version -3 265 5.9 265 5.9in institution -2 283 6.3 283 6.3no answer -1 4 .1 5 .1not at all 1 1047 23.4 695 15.5only with help 2 316 7.1 483 10.8with much difficulty 3 102 2.3 114 2.5with some difficulty 4 390 8.7 513 11.5without difficulty 5 2059 46.0 2108 47.1
---- ----- ---- -----Total 4477 100.0 4477 100.0
ahelpfrq how often helped with a/iadl activities
R is unable to perform the following activity (activities) or can do so only with much difficultyor with help .. (the list of activities is generated by the interview program). How often do youreceive help with this (these) activity (activities)?R kan de volgende activiteit (activiteiten) niet, met moeite of alleen met hulp verrichten.Genoemd zijn .. (wordt gegenereerd door het interviewprogramma). Hoe vaak wordt u bij dezeactiviteit (bij deze activiteiten over het geheel genomen) geholpen?
Value Label Value Frequency % Cum%not asked (no diff) -4 1055 23.6 23.6no answer -1 10 .2 23.8never 1 492 11.0 34.8rarely 2 290 6.5 41.3sometimes 3 836 18.7 59.9often/always 4 1794 40.1 100.0
------- -------Total 4477 100.0
If one is interested in help with ADL-activities only:count helpneed= aadl1 to aadl4 (1,2,3,4).if (helpneed=0) ahelpfrq=-4.
awho help received with a/iadl activities?
From whom do you receive help with a/iadlactivities? More than one answer can be provided.1 partner2 (other) household members3 children (not in the household)4 other family5 friends/acquaintances6 neighbors7 community nurse8 serviceflat personnel9 social services10 private nurse11 volunteers
Door wie wordt u daarbij geholpen?Meer antwoorden zijn mogelijk.1 partner/echtgeno(o)t(e)2 (overige) huisgenoten3 (buitenshuis wonende) kinderen4 overige familie5 vrienden, kennissen6 buren7 wijkverpleegster8 personeel van de serviceflat, e.d.9 gezinsverzorging, bejaardenhulp,
alphahulp10 particuliere verpleging of hulp11 vrijwilligers
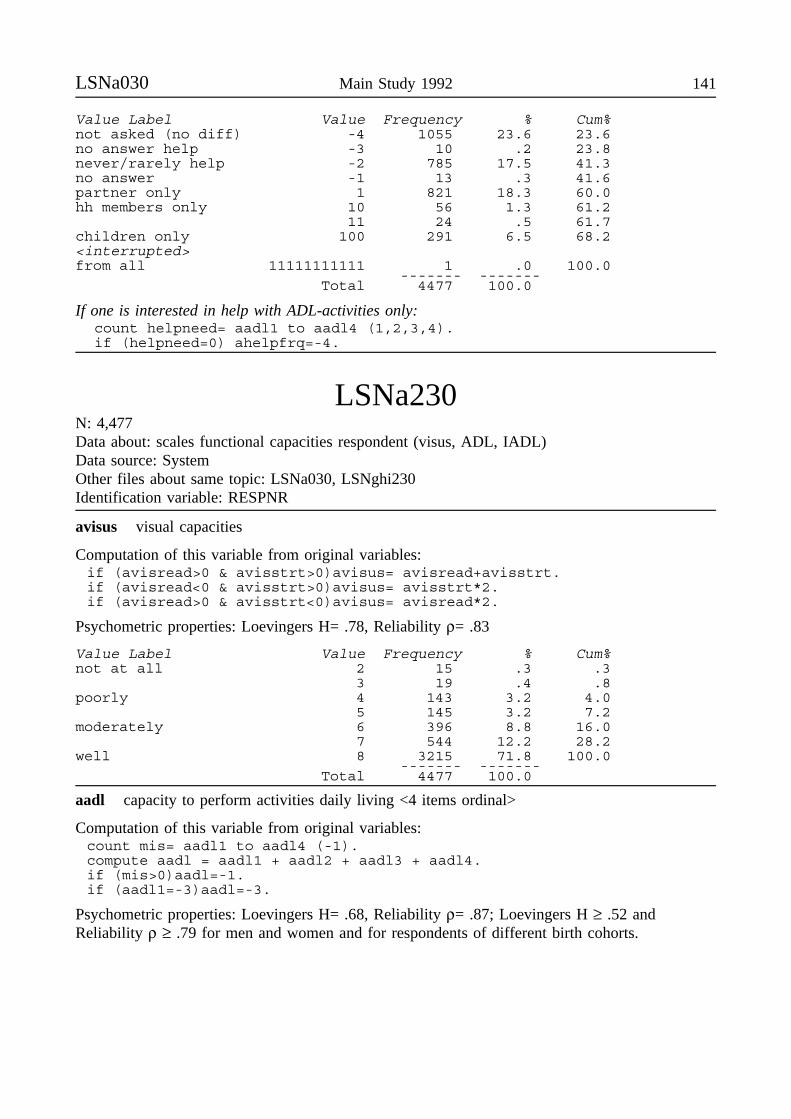
LSNa030 Main Study 1992 141
Value Label Value Frequency % Cum%not asked (no diff) -4 1055 23.6 23.6no answer help -3 10 .2 23.8never/rarely help -2 785 17.5 41.3no answer -1 13 .3 41.6partner only 1 821 18.3 60.0hh members only 10 56 1.3 61.2
11 24 .5 61.7children only 100 291 6.5 68.2<interrupted>from all 11111111111 1 .0 100.0
------- -------Total 4477 100.0
If one is interested in help with ADL-activities only:count helpneed= aadl1 to aadl4 (1,2,3,4).if (helpneed=0) ahelpfrq=-4.
LSNa230N: 4,477Data about: scales functional capacities respondent (visus, ADL, IADL)Data source: SystemOther files about same topic: LSNa030, LSNghi230Identification variable: RESPNR
avisus visual capacities
Computation of this variable from original variables:if (avisread>0 & avisstrt>0)avisus= avisread+avisstrt.if (avisread<0 & avisstrt>0)avisus= avisstrt*2.if (avisread>0 & avisstrt<0)avisus= avisread*2.
Psychometric properties: Loevingers H= .78, Reliability ρ= .83
Value Label Value Frequency % Cum%not at all 2 15 .3 .3
3 19 .4 .8poorly 4 143 3.2 4.0
5 145 3.2 7.2moderately 6 396 8.8 16.0
7 544 12.2 28.2well 8 3215 71.8 100.0
------- -------Total 4477 100.0
aadl capacity to perform activities daily living <4 items ordinal>
Computation of this variable from original variables:count mis= aadl1 to aadl4 (-1).compute aadl = aadl1 + aadl2 + aadl3 + aadl4.if (mis>0)aadl=-1.if (aadl1=-3)aadl=-3.
Psychometric properties: Loevingers H= .68, Reliability ρ= .87; Loevingers H ≥ .52 andReliability ρ ≥ .79 for men and women and for respondents of different birth cohorts.
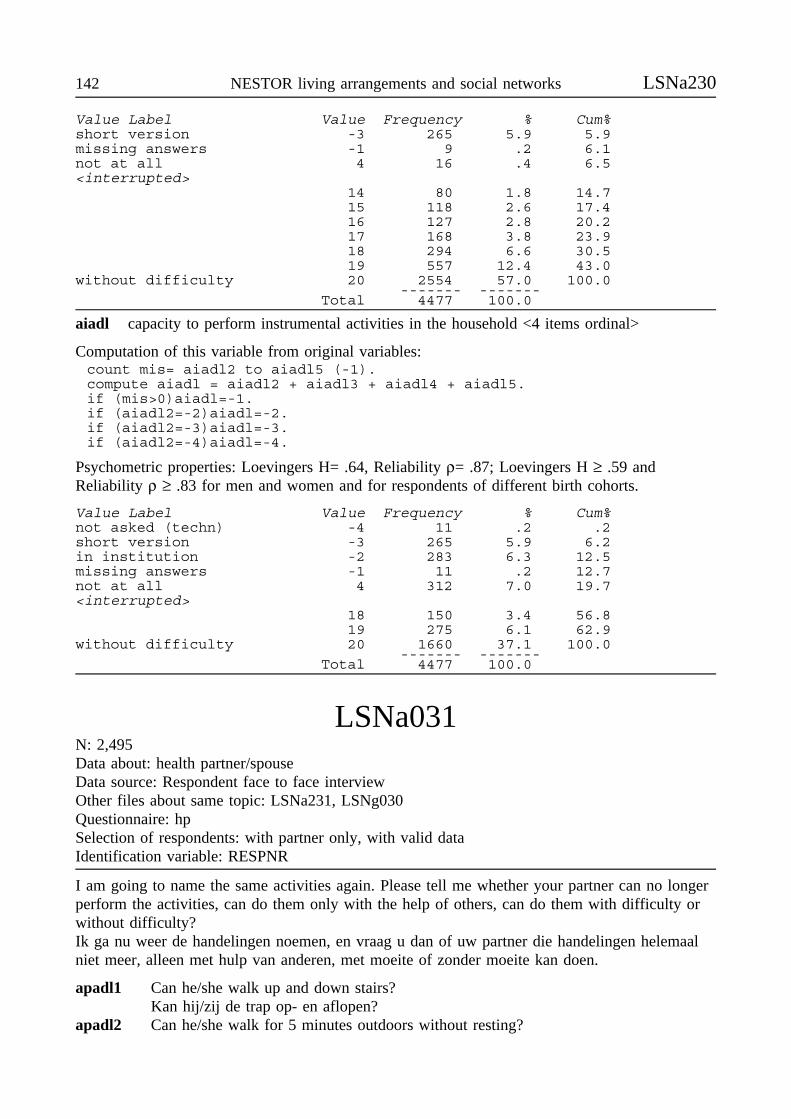
142 NESTOR living arrangements and social networks LSNa230
Value Label Value Frequency % Cum%short version -3 265 5.9 5.9missing answers -1 9 .2 6.1not at all 4 16 .4 6.5<interrupted>
14 80 1.8 14.715 118 2.6 17.416 127 2.8 20.217 168 3.8 23.918 294 6.6 30.519 557 12.4 43.0
without difficulty 20 2554 57.0 100.0------- -------
Total 4477 100.0
aiadl capacity to perform instrumental activities in the household <4 items ordinal>
Computation of this variable from original variables:count mis= aiadl2 to aiadl5 (-1).compute aiadl = aiadl2 + aiadl3 + aiadl4 + aiadl5.if (mis>0)aiadl=-1.if (aiadl2=-2)aiadl=-2.if (aiadl2=-3)aiadl=-3.if (aiadl2=-4)aiadl=-4.
Psychometric properties: Loevingers H= .64, Reliability ρ= .87; Loevingers H ≥ .59 andReliability ρ ≥ .83 for men and women and for respondents of different birth cohorts.
Value Label Value Frequency % Cum%not asked (techn) -4 11 .2 .2short version -3 265 5.9 6.2in institution -2 283 6.3 12.5missing answers -1 11 .2 12.7not at all 4 312 7.0 19.7<interrupted>
18 150 3.4 56.819 275 6.1 62.9
without difficulty 20 1660 37.1 100.0------- -------
Total 4477 100.0
LSNa031N: 2,495Data about: health partner/spouseData source: Respondent face to face interviewOther files about same topic: LSNa231, LSNg030Questionnaire: hpSelection of respondents: with partner only, with valid dataIdentification variable: RESPNR
I am going to name the same activities again. Please tell me whether your partner can no longerperform the activities, can do them only with the help of others, can do them with difficulty orwithout difficulty?Ik ga nu weer de handelingen noemen, en vraag u dan of uw partner die handelingen helemaalniet meer, alleen met hulp van anderen, met moeite of zonder moeite kan doen.
apadl1 Can he/she walk up and down stairs?Kan hij/zij de trap op- en aflopen?
apadl2 Can he/she walk for 5 minutes outdoors without resting?
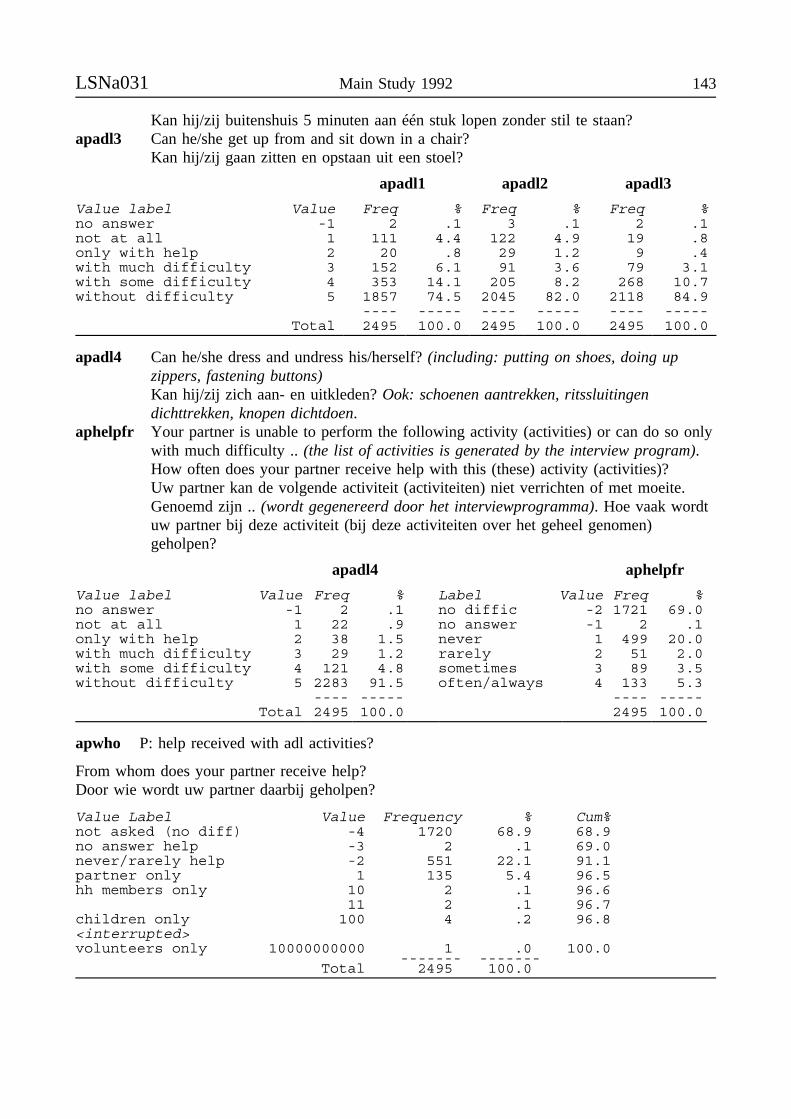
LSNa031 Main Study 1992 143
Kan hij/zij buitenshuis 5 minuten aan één stuk lopen zonder stil te staan?apadl3 Can he/she get up from and sit down in a chair?
Kan hij/zij gaan zitten en opstaan uit een stoel?
apadl1 apadl2 apadl3
Value label Value Freq % Freq % Freq %no answer -1 2 .1 3 .1 2 .1not at all 1 111 4.4 122 4.9 19 .8only with help 2 20 .8 29 1.2 9 .4with much difficulty 3 152 6.1 91 3.6 79 3.1with some difficulty 4 353 14.1 205 8.2 268 10.7without difficulty 5 1857 74.5 2045 82.0 2118 84.9
---- ----- ---- ----- ---- -----Total 2495 100.0 2495 100.0 2495 100.0
apadl4 Can he/she dress and undress his/herself? (including: putting on shoes, doing upzippers, fastening buttons)Kan hij/zij zich aan- en uitkleden? Ook: schoenen aantrekken, ritssluitingendichttrekken, knopen dichtdoen.
aphelpfr Your partner is unable to perform the following activity (activities) or can do so onlywith much difficulty .. (the list of activities is generated by the interview program).How often does your partner receive help with this (these) activity (activities)?Uw partner kan de volgende activiteit (activiteiten) niet verrichten of met moeite.Genoemd zijn .. (wordt gegenereerd door het interviewprogramma). Hoe vaak wordtuw partner bij deze activiteit (bij deze activiteiten over het geheel genomen)geholpen?
apadl4 aphelpfr
Value label Value Freq % Label Value Freq %no answer -1 2 .1 no diffic -2 1721 69.0not at all 1 22 .9 no answer -1 2 .1only with help 2 38 1.5 never 1 499 20.0with much difficulty 3 29 1.2 rarely 2 51 2.0with some difficulty 4 121 4.8 sometimes 3 89 3.5without difficulty 5 2283 91.5 often/always 4 133 5.3
---- ----- ---- -----Total 2495 100.0 2495 100.0
apwho P: help received with adl activities?
From whom does your partner receive help?Door wie wordt uw partner daarbij geholpen?
Value Label Value Frequency % Cum%not asked (no diff) -4 1720 68.9 68.9no answer help -3 2 .1 69.0never/rarely help -2 551 22.1 91.1partner only 1 135 5.4 96.5hh members only 10 2 .1 96.6
11 2 .1 96.7children only 100 4 .2 96.8<interrupted>volunteers only 10000000000 1 .0 100.0
------- -------Total 2495 100.0
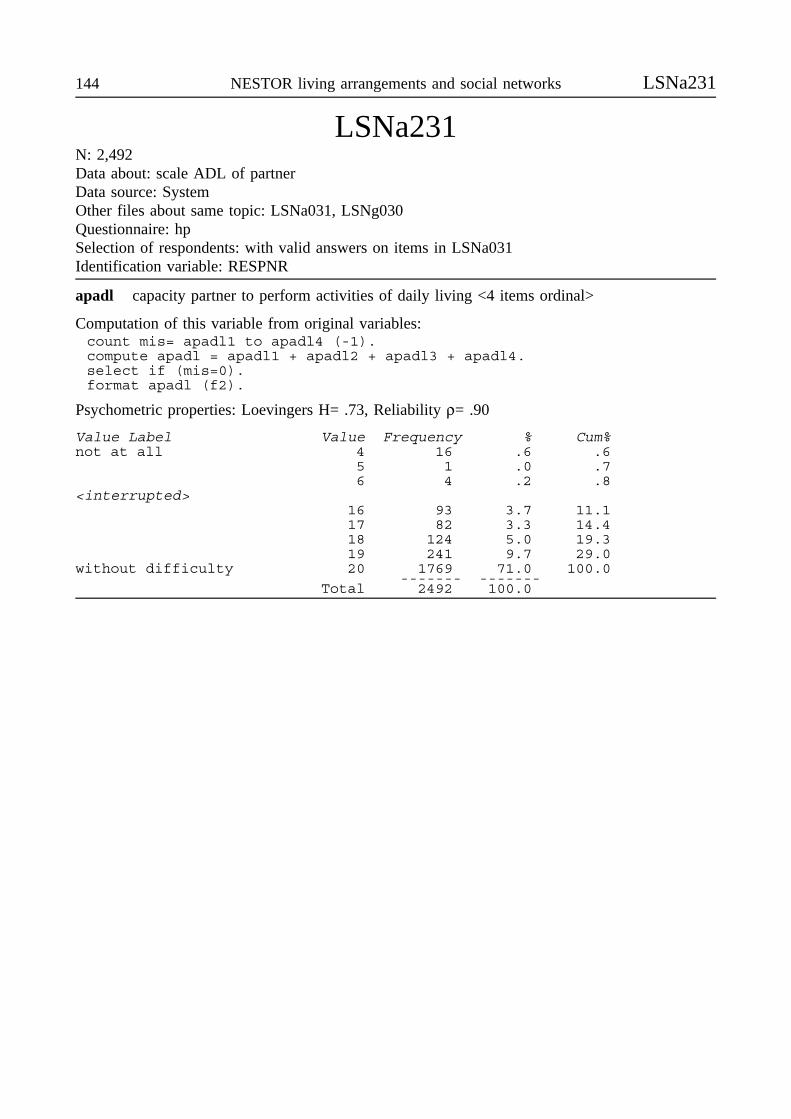
144 NESTOR living arrangements and social networks LSNa231
LSNa231N: 2,492Data about: scale ADL of partnerData source: SystemOther files about same topic: LSNa031, LSNg030Questionnaire: hpSelection of respondents: with valid answers on items in LSNa031Identification variable: RESPNR
apadl capacity partner to perform activities of daily living <4 items ordinal>
Computation of this variable from original variables:count mis= apadl1 to apadl4 (-1).compute apadl = apadl1 + apadl2 + apadl3 + apadl4.select if (mis=0).format apadl (f2).
Psychometric properties: Loevingers H= .73, Reliability ρ= .90
Value Label Value Frequency % Cum%not at all 4 16 .6 .6
5 1 .0 .76 4 .2 .8
<interrupted>16 93 3.7 11.117 82 3.3 14.418 124 5.0 19.319 241 9.7 29.0
without difficulty 20 1769 71.0 100.0------- -------
Total 2492 100.0
LSNa032 Main Study 1992 145
LSNa032N: 4,125Data about: social participationData source: Respondent face to face interviewQuestionnaire: spIdentification variable: RESPNR
atypedu type of schooling or course
I would like to ask you a number ofquestions about all kinds of activities.Did you attend school or take anycourses during the past half year? Whatkind of schooling did you attend orwhat kind of course did you take? If Ris involved in more than one form ofschool, the one with the greatest timeinvestment must be considered.1 general secondary level2 university or college level3 adult education classes4 courses at community center5 classes focusing on the position of
women6 university courses for seniors7 correspondence courses8 TELEAC-courses (=via Dutch tv)9 other
Ik wil u nu een aantal vragen stellen over uwbezigheden. Hebt u in het afgelopen half jaar eenopleiding of een cursus gevolgd? Wat voor cursusof opleiding was dat? Als R meerdere opleidingenof cursussen heeft gevolgd, dient de opleiding diede meeste tijd vergt genoteerd te worden.1 opleiding op middelbaar niveau (bijv.
MAVO, HAVO, VWO)2 opleiding op hoger of universitair niveau
(bijv. Open universiteit)3 cursus bij volksuniversiteit4 cursus bij buurthuis, e.d.5 cursus gericht op positie en/of emancipatie
van vrouwen (bijv. VOS)6 cursus in het kader van Hoger Onderwijs
voor Ouderen (HOVO)7 schriftelijke cursus8 TELEAC-cursus9 andere cursus
Value Label Value Frequency % Cum%no schooling now -2 3780 91.6 91.6no answer -1 1 .0 91.7general secondary le 1 21 .5 92.2university/college l 2 15 .4 92.5adult education clas 3 29 .7 93.2courses at community 4 55 1.3 94.6classes position of 5 6 .1 94.7uni course for senio 6 3 .1 94.8correspondence cours 7 11 .3 95.1TELEAC-courses (=via 8 8 .2 95.2other 9 196 4.8 100.0
------- -------Total 4125 100.0
146 NESTOR living arrangements and social networks LSNa032
atimedu time involved in schooling
How many hours a week are you involved in course work?We are interested to know the total amount of hours involved in attending school and preparingfor classes, exams and so forth. If R is involved in more than one form of schooling, the totalnumber of hours of all courses must be taken into account.
Hoeveel uur besteedt u per week aan deze opleiding of cursus? Het gaat dan om het totaal vande les- en de studie-uren; als R meerdere opleidingen of cursussen volgt, dient het aantal urenvan alle opleidingen of cursussen samen genoteerd te worden.
Value Label Value Frequency % Cum%not asked(no educati -2 3780 91.6 91.6no answer -1 5 .1 91.8<1 hour/week 0 11 .3 92.01 hour/week 1 31 .8 92.8
2 56 1.4 94.1<interrupted>
30 1 .0 100.040 hours/week 40 1 .0 100.0100 hours/week 100 1 .0 100.0
------- -------Total 4125 100.0
acar car household/valid drivers license
Do you have a valid drivers license? Do you (does your partner or does any of the othermembers of the household) have a car at your disposal?
Bezit u een geldig rijbewijs? Beschikt u (of uw partner of een van de andere leden van uwhuishouden) over een auto?
Value Label Value Frequency % Cum%no car & no valid dr 0 1789 43.4 43.4car in hh 1 501 12.1 55.5valid drivers lic (no car) 2 130 3.2 58.7car hh+ valid driver 3 1705 41.3 100.0
------- -------Total 4125 100.0
apas65 use made of cultural seniors card
Do you have a cultural seniors card that is made available through your municipality? Pleasenote that we do not mean the reduced-fare pass of Dutch rail (60+/65+). In the past 12 months,did you use your cultural seniors card for reduced tickets to the theatre, museum, movies,concert, and so forth?
Bezit u een pas 65+ die door uw gemeentebestuur verstrekt wordt? Ik bedoel hiermee niet de65+ (60+) kaart van de Nederlandse Spoorwegen. Hebt u de afgelopen 12 maanden uw pas 65+gebruikt om korting te krijgen bij bezoek aan een schouwburg, museum, bioscoop, concert,enzovoorts?
Value Label Value Frequency % Cum%not asked(age) -2 741 18.0 18.0no pas65 0 1003 24.3 42.3pas65,not used 1 1583 38.4 80.7pas65,used 2 798 19.3 100.0
------- -------Total 4125 100.0
amember memberships (being active)

LSNa032 Main Study 1992 147
Are you a member of... a union or of an employers organization? Do youever attend meetings of this union or employersorganization?... of a political party? Do you ever attend meetingsof this political party?... a women’s (men’s) club, a women’s (men’s)union or a women’s (men’s) association? Do youever attend meetings of this women’s (men’s) club,this women’s (men’s) union or this women’s(men’s) association?... a senior citizens’ organization? Do you everattend meetings of this senior citizens’organization?... a choir, music association or drama association?... a sports association?... a hobby association?... an association with a societal objective (e.g.Widows and widowers association, AmnestyInternational)?
Bent u lid van een... vakbond of van een werkgevers-organisatie? Gaat u wel eens naar eenvergadering van deze vakbond ofwerkgeversorganisatie?... politieke partij? Gaat u wel eens naareen vergadering van deze politieke partij?... vrouwen/mannen-vereniging ofvrouwen/mannen-bond? Gaat u wel eensnaar een vergadering van deze vrou-wen/mannen-vereniging of vrouwen/mannen-bond?... ouderenbond? Gaat u wel eens naar eenvergadering van deze ouderenbond?... zang-, muziek- of toneelvereniging?... sportvereniging?... hobbyvereniging?... vereniging met een maatschappelijkdoel (bijv. weduwnaarsbond, AmnestyInternational)?
Value Label Value Frequency % Cum%no memberships 0 1485 36.0 36.0mem:union/employer o 1 145 3.5 39.5act:union/employer o 2 57 1.4 40.9mem:political party 10 87 2.1 43.0mem:polit + mem:unio 11 19 .5 43.5mem:polit + act:unio 12 9 .2 43.7act:political party 20 19 .5 44.1
21 5 .1 44.322 11 .3 44.5
mem:same-sex organiz 100 9 .2 44.8110 2 .0 44.8
act:same-sex organiz 200 82 2.0 46.8<interrupted>
11110200 1 .0 100.0------- -------
Total 4125 100.0
To create a variable for being active in organizations:if (not mssing(amember)ama=0.if (trunc(amember/10000000)=2)ama=1.if (trunc(amember/1000000) -trunc(amember/10000000)*10=2)ama=1.if (trunc(amember/100000 ) -trunc(amember/1000000 )*10=2)ama=1.if (trunc(amember/10000 ) -trunc(amember/100000 )*10=2)ama=1.if (trunc(amember/1000 ) -trunc(amember/10000 )*10=2)ama=1.if (trunc(amember/100 ) -trunc(amember/1000 )*10=2)ama=1.if (trunc(amember/10 ) -trunc(amember/100 )*10=2)ama=1.if (trunc(amember ) -trunc(amember/10 )*10=2)ama=1.variable label ama ’not/yes active in organizations’.value label ama 0’not active’1’active’.
148 NESTOR living arrangements and social networks LSNa032
alibrary read books from library
Do you read books from the library? This includes books on tape for the visually handicapped.How often do you take books on loan from the library?Leest u boeken uit de bibliotheek? Voor slecht zienden ook boeken op cassette. Hoe vaak leent uboeken uit de bibliotheek?
Value Label Value Frequency % Cum%never 1 3104 75.2 75.2yearly or less often 2 25 .6 75.9a few times a year 3 154 3.7 79.6monthly 4 287 7.0 86.5once per 14 days 5 296 7.2 93.7weekly 6 216 5.2 99.0several times a week 7 37 .9 99.9daily 8 6 .1 100.0
------- -------Total 4125 100.0
avolunt volunteer work
Do you ever do unpaid volunteer work, as for example in church, for a sports association,community center, parent-teacher associations, and so forth? The card that I will present to you,lists different types of organizations for which one can do volunteer work. Please indicate theorganizations for which you do volunteer work.Verricht u wel eens onbetaald vrijwilligerswerk? U moet dan denken aan dingen als kerkelijkwerk, werk binnen sport- en buurtverenigingen, oudercommissies, e.d. Op de kaart die ik u nuoverhandig vindt u een lijst met organisaties. Voor welke van de volgende organisaties doet uvrijwilligerswerk?
Value Label Value Frequency % Cum%no volunteering 0 3051 74.0 74.0political party 1 3 .1 74.0pro organization 10 17 .4 74.4church 100 150 3.6 78.1<interrupted>womens association 1000 11 .3 78.5
1100 9 .2 78.7<interrupted>school board etc 10000000 4 .1 83.4<interrupted>kindergarten daycare 100000000 7 .2 83.6<interrupted>youth community cent 1000000000 8 .2 84.0<interrupted>societal objective 1.000000E+12 80 1.9 94.9<interrupted>other forms of care 1.000000E+13 48 1.2 98.4<interrupted>
1.110000E+13 1 .0 100.0------- -------
Total 4125 100.0
To create a variable for the number of voluntary activities:compute avolunt=trunc(avolunt/10000000000000)+trunc(avolunt/1000000000000) -trunc(avolunt/10000000000000)*10+trunc(avolunt/100000000000 ) -trunc(avolunt/1000000000000 )*10+trunc(avolunt/10000000000 ) -trunc(avolunt/100000000000 )*10+trunc(avolunt/1000000000 ) -trunc(avolunt/10000000000 )*10+trunc(avolunt/100000000 ) -trunc(avolunt/1000000000 )*10+trunc(avolunt/10000000 ) -trunc(avolunt/100000000 )*10+trunc(avolunt/1000000 ) -trunc(avolunt/10000000 )*10
LSNa032 Main Study 1992 149
+trunc(avolunt/100000 ) -trunc(avolunt/1000000 )*10+trunc(avolunt/10000 ) -trunc(avolunt/100000 )*10+trunc(avolunt/1000 ) -trunc(avolunt/10000 )*10+trunc(avolunt/100 ) -trunc(avolunt/1000 )*10+trunc(avolunt/10 ) -trunc(avolunt/100 )*10+trunc(avolunt ) -trunc(avolunt/10 )*10.
aactleis leisure time activities
I am going to provide you with a list of four leisure time activities. Please indicate whether youhave performed any of them during the last month.Ik noem u nu vier activiteiten in de vrije tijd. Wilt u steeds aangeven of u de afgelopen maanddaarmee bezig bent geweest?
Value Label Value Frequency % Cum%no leisure time acti 0 481 11.7 11.7sports/physical exer 1 189 4.6 16.2creative activities 10 280 6.8 23.0
11 201 4.9 27.9do-it-yourself/garde 100 213 5.2 33.1<interrupted>other 1000 339 8.2 60.8<interrupted>sports+crea+diy+othe 1111 393 9.5 100.0
------- -------Total 4125 100.0
anoact reason no leisure time activities
Why do you not participate in any of the leisure time activities that I mentioned?Waarom neemt u niet deel aan de door mij genoemde vrije tijd activiteiten?1 lichamelijke beperkingen, 2 nooit gedaan, 3 geen tijd, 4 geen behoefte, 5 overige reden
Value Label Value Frequency % Cum%not asked (activities) -2 3638 88.2 88.2no answer -1 3 .1 88.3health restriction 1 221 5.4 93.6never done them 2 19 .5 94.1no time for them 3 37 .9 95.0no need for them 4 175 4.2 99.2too old 6 8 .2 99.4not able to, tired 7 6 .1 99.6never thougth about 8 2 .0 99.6anxious to go out 9 1 .0 99.6no company available 10 5 .1 99.8social reason 11 2 .0 99.8personal reason 12 2 .0 99.9financial reason 13 3 .1 99.9illness spouse 14 3 .1 100.0
------- -------Total 4125 100.0
Information of category "other" stored in database LSNa032.dbf.
atv watch news on tvHow often do you watch the news on television or other programs about current events?Hoe vaak kijkt u op de tv naar het journaal of naar een actualiteitenrubriek?
apaper read newspaperHow often do you read the newspaper?Hoe vaak leest u de krant?
atv apaper
Value label Value Freq % Freq %
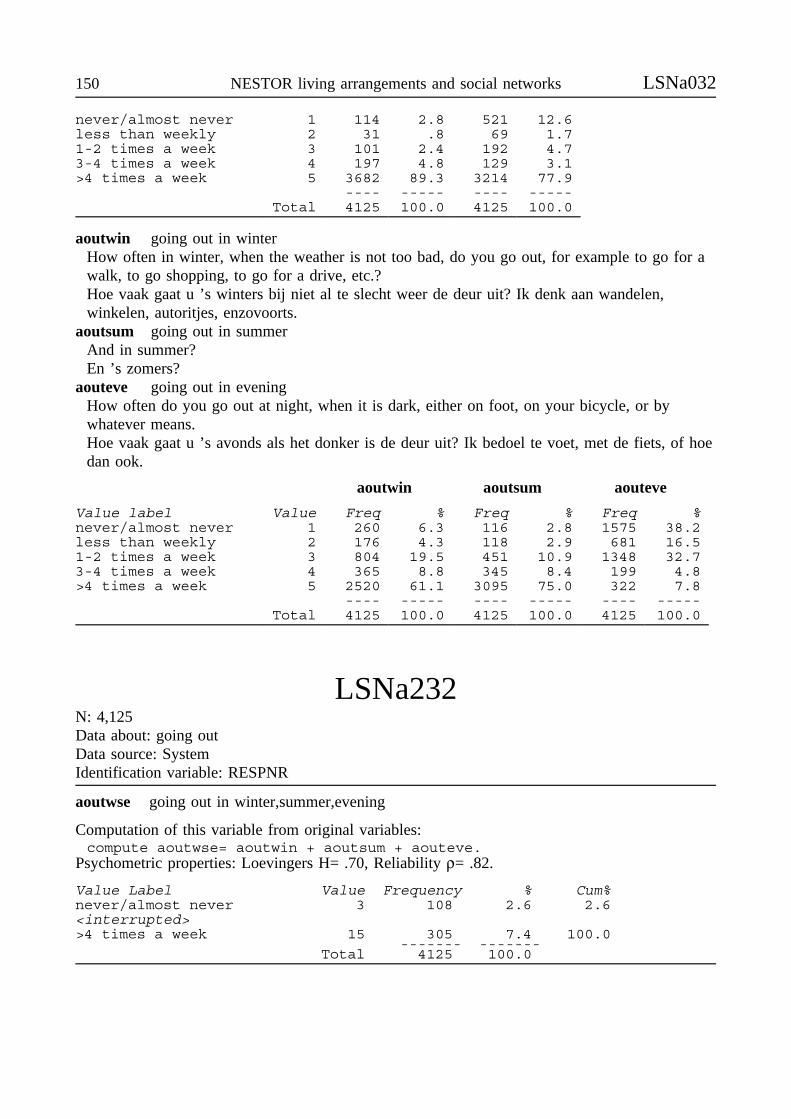
150 NESTOR living arrangements and social networks LSNa032
never/almost never 1 114 2.8 521 12.6less than weekly 2 31 .8 69 1.71-2 times a week 3 101 2.4 192 4.73-4 times a week 4 197 4.8 129 3.1>4 times a week 5 3682 89.3 3214 77.9
---- ----- ---- -----Total 4125 100.0 4125 100.0
aoutwin going out in winterHow often in winter, when the weather is not too bad, do you go out, for example to go for awalk, to go shopping, to go for a drive, etc.?Hoe vaak gaat u ’s winters bij niet al te slecht weer de deur uit? Ik denk aan wandelen,winkelen, autoritjes, enzovoorts.
aoutsum going out in summerAnd in summer?En ’s zomers?
aouteve going out in eveningHow often do you go out at night, when it is dark, either on foot, on your bicycle, or bywhatever means.Hoe vaak gaat u ’s avonds als het donker is de deur uit? Ik bedoel te voet, met de fiets, of hoedan ook.
aoutwin aoutsum aouteve
Value label Value Freq % Freq % Freq %never/almost never 1 260 6.3 116 2.8 1575 38.2less than weekly 2 176 4.3 118 2.9 681 16.51-2 times a week 3 804 19.5 451 10.9 1348 32.73-4 times a week 4 365 8.8 345 8.4 199 4.8>4 times a week 5 2520 61.1 3095 75.0 322 7.8
---- ----- ---- ----- ---- -----Total 4125 100.0 4125 100.0 4125 100.0
LSNa232N: 4,125Data about: going outData source: SystemIdentification variable: RESPNR
aoutwse going out in winter,summer,evening
Computation of this variable from original variables:compute aoutwse= aoutwin + aoutsum + aouteve.
Psychometric properties: Loevingers H= .70, Reliability ρ= .82.
Value Label Value Frequency % Cum%never/almost never 3 108 2.6 2.6<interrupted>>4 times a week 15 305 7.4 100.0
------- -------Total 4125 100.0
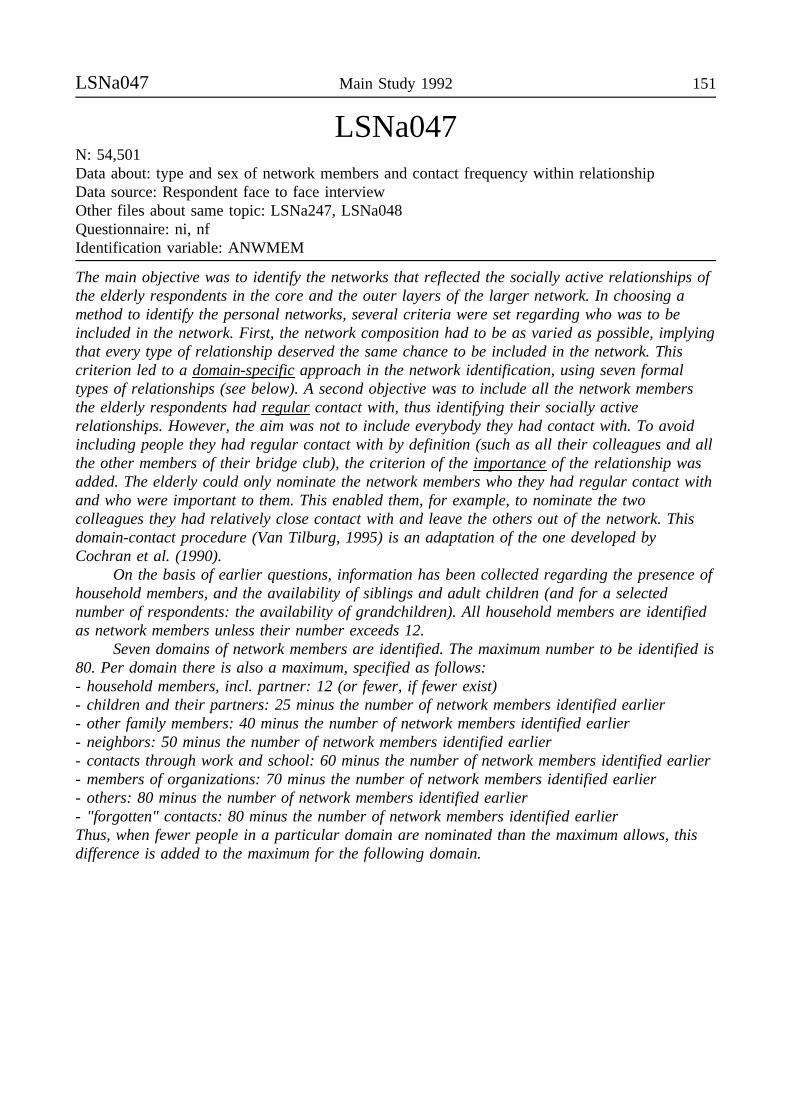
LSNa047 Main Study 1992 151
LSNa047N: 54,501Data about: type and sex of network members and contact frequency within relationshipData source: Respondent face to face interviewOther files about same topic: LSNa247, LSNa048Questionnaire: ni, nfIdentification variable: ANWMEM
The main objective was to identify the networks that reflected the socially active relationships ofthe elderly respondents in the core and the outer layers of the larger network. In choosing amethod to identify the personal networks, several criteria were set regarding who was to beincluded in the network. First, the network composition had to be as varied as possible, implyingthat every type of relationship deserved the same chance to be included in the network. Thiscriterion led to a domain-specific approach in the network identification, using seven formaltypes of relationships (see below). A second objective was to include all the network membersthe elderly respondents had regular contact with, thus identifying their socially activerelationships. However, the aim was not to include everybody they had contact with. To avoidincluding people they had regular contact with by definition (such as all their colleagues and allthe other members of their bridge club), the criterion of the importance of the relationship wasadded. The elderly could only nominate the network members who they had regular contact withand who were important to them. This enabled them, for example, to nominate the twocolleagues they had relatively close contact with and leave the others out of the network. Thisdomain-contact procedure (Van Tilburg, 1995) is an adaptation of the one developed byCochran et al. (1990).
On the basis of earlier questions, information has been collected regarding the presence ofhousehold members, and the availability of siblings and adult children (and for a selectednumber of respondents: the availability of grandchildren). All household members are identifiedas network members unless their number exceeds 12.
Seven domains of network members are identified. The maximum number to be identified is80. Per domain there is also a maximum, specified as follows:- household members, incl. partner: 12 (or fewer, if fewer exist)- children and their partners: 25 minus the number of network members identified earlier- other family members: 40 minus the number of network members identified earlier- neighbors: 50 minus the number of network members identified earlier- contacts through work and school: 60 minus the number of network members identified earlier- members of organizations: 70 minus the number of network members identified earlier- others: 80 minus the number of network members identified earlier- "forgotten" contacts: 80 minus the number of network members identified earlierThus, when fewer people in a particular domain are nominated than the maximum allows, thisdifference is added to the maximum for the following domain.
152 NESTOR living arrangements and social networks LSNa047
General introductionDuring the next part of the interview I wouldlike to obtain information about the peoplewith whom you are in touch regularly andwho are important to you. In succession, Iwill be asking about (the othermember/members of your household,) (yourchildren and the partners they may have,)(other) family members, neighbors, contactsfrom work or school, contacts from voluntaryassociations and other organizations, andfriends and acquaintances. Not all of thesepeople need to be nominated. We areinterested in those with whom you are intouch regularly and who are important to you.Furthermore, they have to be at least 18 yearsold. First I will fill in the names of thosewith whom you are in touch regularly andwho are important to you. Next, I will ask anumber of questions about each.
Algemene introductieIn het volgende gedeelte wil ik graag wetenmet wie u een regelmatig en belangrijk con-tact heeft. Ik vraag achtereenvolgens naar (deandere persoon/personen in huis,) (uwkinderen en hun eventuele partners,) (andere)familieleden, buurtgenoten, contacten vanwerk, studie of cursus, contacten van vereni-gingen en organisaties, en vrienden en kennis-sen. Het gaat er nu niet om dat u allepersonen noemt. Wij zijn geïnteresseerd in demensen met wie u een regelmatig en belang-rijk contact heeft. De personen moeten 18 jaarof ouder zijn. Eerst noteer ik de namen vande personen met wie u een regelmatig enbelangrijk contact heeft, en vervolgens stel ikenkele vragen over ieder van hen.
You as the interviewer, must emphasize thecriteria according to which network membersare identified: people with whom R is intouch regularly and who are important tohim/her. If necessary, repeat these criteria,and formulate them clearly. Also, please payattention to the age criterion: networkmembers must be at least 18 years old. It isnecessary that network members areidentified as unique individuals and by name.There are no objections against using initialsfor privacy reasons.
U, interviewer, moet het criterium van deafbakening, dus regelmatig contact en belang-rijk contact, duidelijk formuleren en zonodigherhalen en benadrukken. Let ook op hetcriterium van 18 jaar en ouder. Verder is hetbelangrijk dat personen uniek en bij naamgenoemd worden. In verband met privacy zijninitialen ook akkoord. Over de verschillendepersonen worden daarna namelijk nog vragengesteld, en u en R moeten dan weten over wiehet gaat. Als R één zoon heeft, is hetantwoord "mijn zoon" voldoende. U weetimmers de naam.
Later on, questions will be asked about theindividual network members. For that reason,it necessary that both you and R know whothe person involved is. Members of a couplemust be identified individually, thus as "Mr.X" and "Mrs. X". The answer "I know somany people" is not acceptable. In that case,ask R "Please will you provide the names ofthose with whom you are in touch regularlyand who are important to you".
Typ in dat geval de naam van de zoon. Als Rdrie kinderen heeft, is het antwoord ’al mijnkinderen’ onvoldoende. Vraag danbevestiging: Dus u heeft met uw drie kinderen<naam 1>, <naam 2>, <naam 3>, eenregelmatig contact en dat contact is ookbelangrijk voor u? Echtparen moetenafzonderlijk genoemd worden, dus "Dhr. X","Mevr. X". Het antwoord "Ik ken zoveelmensen...." is beslist niet akkoord. Vraag dan:Wilt u de mensen met wie u een regelmatigen belangrijk contact heeft bij naam noemen?

LSNa047 Main Study 1992 153
Identification of household membersYou share living quarters with .. I would liketo ask a number of questions about those inyour household who are at least 18 years old.For that reason, will you please give me thename(s) of (each of) the person(s) aged 18and over with whom you live?
Identificatie van huisgenotenU woont met .. in huis. Ik wil graag eenaantal vragen stellen over de persoon (per-sonen) van 18 jaar en ouder die bij u in huiswonen. Mag ik daarom de voornaam en deeerste letter van de achternaam van die anderepersoon (de personen) van 18 jaar en ouder inuw huishouden weten? Wilt u ze één vooréén opnoemen? Dan begin ik met de eerste.
Identification of children and their partnersEarlier on during the interview, you providedthe name(s) of your child(ren) who was(were) still alive. You also told us whether ornot she/he (they) was (were) living with apartner. Now we would like to know whetheryou are in touch regularly with (each of) yourchild(ren) (and his/her partner) (and theirpartners) and whether she/he (they) is (eachare) important to you. If this is the case, willyou please give me his/her (their) firstname(s) and the first letter of his/her (their)last name(s)? The children/partners must beidentified individually. Do not simply includeall of them in the network.
Identificatie van kinderen en hun partnersEerder in het interview heeft u al de naamvan uw nog levende kind(eren) genoemd. Ookheeft u verteld of hij/zij een echtgenoot, eenechtgenote of een partner heeft (hebben). Nuwil ik graag weten of u met uw kind (enzijn/haar partner) (met welke van uw kinderenu) (en hun partners) een regelmatig contact enbelangrijk contact heeft. Indien dit zo is, wiltu dan de voornaam en de eerste letter van deachternaam van uw kind (en zijn/haar partner)noemen? Wilt u ze één voor één opnoemen?Noemt u maar de voornaam en de eersteletter van de achternaam. Namen latennoemen, dus niet zomaar alle kinderen /partners in netwerk opnemen.
Identification of other family membersNext, will you please provide me with thenames of those family members with whomyou are in touch regularly and who areimportant to you? "Family members" areparents and parents-in-law (if they are stillalive), siblings, cousins, nieces and nephews,in-laws (both on your side of the family andon the side of your partner), aunts and uncles(and grandchildren). They must be at least 18years old. I would like to have the first nameand the first letter of the last name of each.The family members must be identifiedindividually. Do not simply include all ofthem in the network.
Identificatie van andere familieledenKunt u van uw familieleden, dat zijn ondermeer uw ouders of schoonouders -indien zijnog leven-, uw broers en zussen (ook al heeftu die al eerder genoemd in het familie-gedeelte), uw neven en nichten, uw schoon-familie (van uw kant en van de kant van uwpartner), uw ooms en tantes, (en uw klein-kinderen,) degenen noemen met wie u regel-matig contact heeft en die belangrijk voor uzijn? Het moeten personen zijn van 18 jaar enouder. Wilt u de voornaam en de eerste lettervan de achternaam geven? Namen latennoemen, dus niet zomaar alle familieleden innetwerk opnemen. Zonodig criteria herhalen.
Identification of neighborsNow, will you please provide me with thenames of those neighbors and others livingnearby with whom you are in touch regularlyand who are important to you? I would liketo have the first name and the first letter ofthe last name of each.
Identificatie van buurtgenotenKunt u van al uw buren en buurtgenoten de-genen noemen met wie u regelmatig contactheeft en die belangrijk voor u zijn? Wilt u devoornaam en de eerste letter van de ach-ternaam geven?
154 NESTOR living arrangements and social networks LSNa047
Identification of contacts through work andschoolPlease provide me with the names of those(ex-) colleagues, and others you knowthrough volunteer work or school with whomyou are in touch regularly and who areimportant to you. I would like to have thefirst name and the first letter of the last nameof each.
Identificatie van werkcontacten enstudiegenotenKunt u de namen noemen van personen vanuw (voormalig) werk, vrijwilligerswerk ofopleiding, met wie u regelmatig contact heeften die belangrijk voor u zijn? Wilt u de voor-naam en de eerste letter van de achternaamgeven?
Identification of members of organizationsPlease provide me with the names of thoseyou meet through church, a sportsassociation, political organizations, and othervoluntary associations with whom you are intouch regularly and who are important to you.I would like to have the first name and thefirst letter of the last name of each.
Identificatie van leden van organisatiesKunt u de namen noemen van personen die uontmoet via de kerk, sportvereniging, poli-tieke organisaties, belangenvereniging endergelijke, met wie u regelmatig contact heeften die belangrijk voor u zijn? Wilt u devoornaam en de eerste letter van de ach-ternaam geven?
Identification of othersPerhaps there still are people (friends andacquaintances for example) with whom youare in touch, and who you have not been ableto mention in response to earlier questions.Please provide the names of others withwhom you are in touch regularly and who areimportant to you. I would like to have thefirst name and the first letter of the last nameof each.
Identificatie van anderenEr zijn wellicht nog mensen (bijvoorbeeldvrienden of kennissen) waarmee u omgaat,maar die u nog niet bij de eerdere vragenheeft kunnen noemen. Kunt u de namen noe-men van hen met wie u regelmatig contactheeft en die belangrijk voor u zijn? Wilt u devoornaam en de eerste letter van deachternaam geven?
Identification of "forgotten" contactsThere may be certain family members,neighbors or others with whom you are intouch frequently and who are important toyou, but may have forgotten to mentionearlier. This is the opportunity to name themas yet. I would like to have the first nameand the first letter of the last name of each.
Identificatie van "vergeten" personenEr zijn wellicht nog familieleden of buurt-genoten of andere mensen met wie u regel-matig contact heeft en die belangrijk voor uzijn, die u vergeten bent hiervoor te noemen.Die kunnen nu als nog genoemd worden. Wiltu de voornaam en de eerste letter van deachternaam geven?
Is ..- a household member- a child or a partner of a child- a neighbor or someone who lives nearby- a contact through work, volunteer work or
school- a member of a voluntary organization- another type of contact (e.g. friend or
acquaintance)
Is .. een- huisgenoot, huisgenote- kind of echtgeno(o)t(e)/partner van een kind- familielid- buur of buurtgenoot- iemand van het werk, vrijwilligerswerk, of
opleiding- iemand van een organisatie- ander contact (bijv. vriend, vriendin of
kennis)
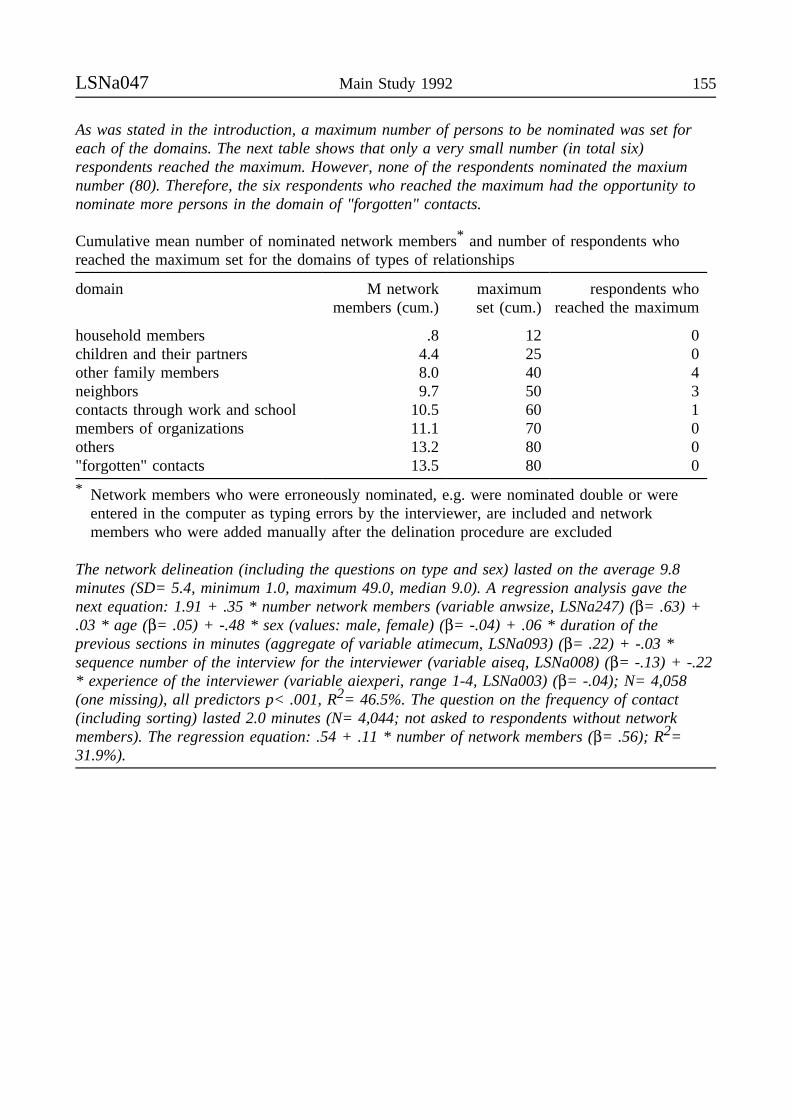
LSNa047 Main Study 1992 155
As was stated in the introduction, a maximum number of persons to be nominated was set foreach of the domains. The next table shows that only a very small number (in total six)respondents reached the maximum. However, none of the respondents nominated the maxiumnumber (80). Therefore, the six respondents who reached the maximum had the opportunity tonominate more persons in the domain of "forgotten" contacts.
Cumulative mean number of nominated network members* and number of respondents whoreached the maximum set for the domains of types of relationships
domain M networkmembers (cum.)
maximumset (cum.)
respondents whoreached the maximum
household members .8 12 0children and their partners 4.4 25 0other family members 8.0 40 4neighbors 9.7 50 3contacts through work and school 10.5 60 1members of organizations 11.1 70 0others 13.2 80 0"forgotten" contacts 13.5 80 0
* Network members who were erroneously nominated, e.g. were nominated double or wereentered in the computer as typing errors by the interviewer, are included and networkmembers who were added manually after the delination procedure are excluded
The network delineation (including the questions on type and sex) lasted on the average 9.8minutes (SD= 5.4, minimum 1.0, maximum 49.0, median 9.0). A regression analysis gave thenext equation: 1.91 + .35 * number network members (variable anwsize, LSNa247) (β= .63) +.03 * age (β= .05) + -.48 * sex (values: male, female) (β= -.04) + .06 * duration of theprevious sections in minutes (aggregate of variable atimecum, LSNa093) (β= .22) + -.03 *sequence number of the interview for the interviewer (variable aiseq, LSNa008) (β= -.13) + -.22* experience of the interviewer (variable aiexperi, range 1-4, LSNa003) (β= -.04); N= 4,058(one missing), all predictors p< .001, R2= 46.5%. The question on the frequency of contact(including sorting) lasted 2.0 minutes (N= 4,044; not asked to respondents without networkmembers). The regression equation: .54 + .11 * number of network members (β= .56); R2=31.9%).
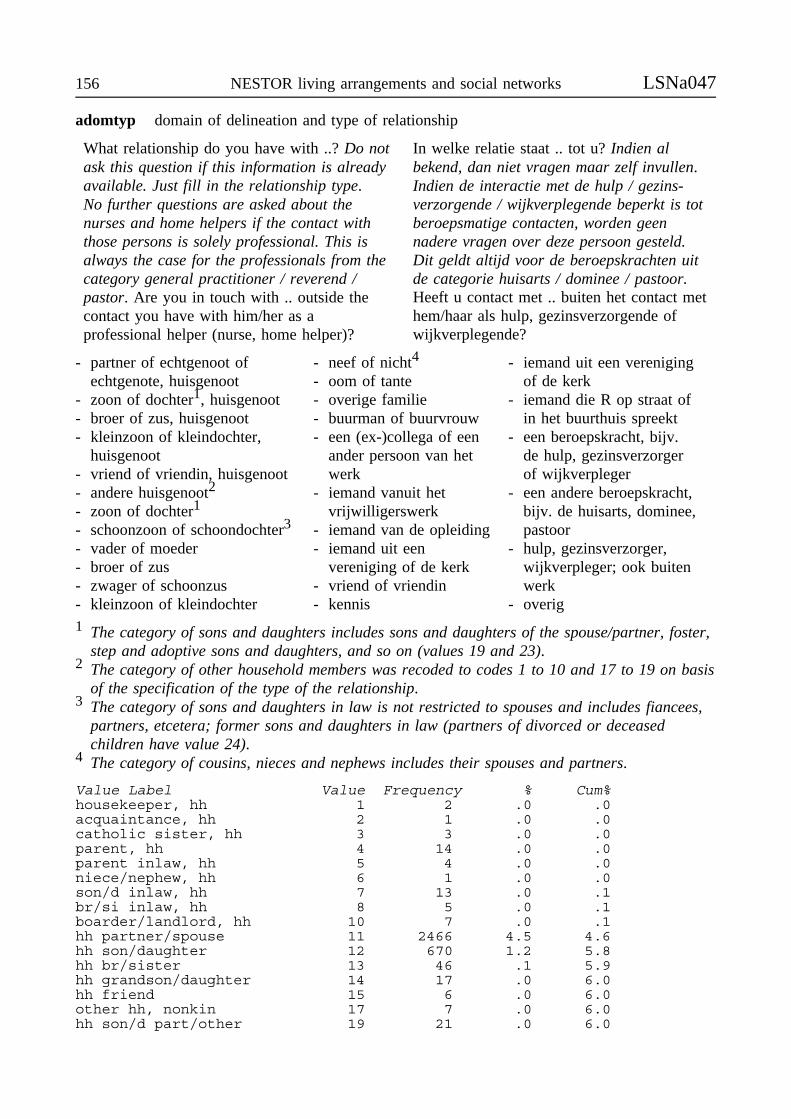
156 NESTOR living arrangements and social networks LSNa047
adomtyp domain of delineation and type of relationship
What relationship do you have with ..? Do notask this question if this information is alreadyavailable. Just fill in the relationship type.No further questions are asked about thenurses and home helpers if the contact withthose persons is solely professional. This isalways the case for the professionals from thecategory general practitioner / reverend /pastor. Are you in touch with .. outside thecontact you have with him/her as aprofessional helper (nurse, home helper)?
In welke relatie staat .. tot u? Indien albekend, dan niet vragen maar zelf invullen.Indien de interactie met de hulp / gezins-verzorgende / wijkverplegende beperkt is totberoepsmatige contacten, worden geennadere vragen over deze persoon gesteld.Dit geldt altijd voor de beroepskrachten uitde categorie huisarts / dominee / pastoor.Heeft u contact met .. buiten het contact methem/haar als hulp, gezinsverzorgende ofwijkverplegende?
- partner of echtgenoot ofechtgenote, huisgenoot
- zoon of dochter1, huisgenoot- broer of zus, huisgenoot- kleinzoon of kleindochter,
huisgenoot- vriend of vriendin, huisgenoot- andere huisgenoot2
- zoon of dochter1
- schoonzoon of schoondochter3
- vader of moeder- broer of zus- zwager of schoonzus- kleinzoon of kleindochter
- neef of nicht4
- oom of tante- overige familie- buurman of buurvrouw- een (ex-)collega of een
ander persoon van hetwerk
- iemand vanuit hetvrijwilligerswerk
- iemand van de opleiding- iemand uit een
vereniging of de kerk- vriend of vriendin- kennis
- iemand uit een verenigingof de kerk
- iemand die R op straat ofin het buurthuis spreekt
- een beroepskracht, bijv.de hulp, gezinsverzorgerof wijkverpleger
- een andere beroepskracht,bijv. de huisarts, dominee,pastoor
- hulp, gezinsverzorger,wijkverpleger; ook buitenwerk
- overig1 The category of sons and daughters includes sons and daughters of the spouse/partner, foster,
step and adoptive sons and daughters, and so on (values 19 and 23).2 The category of other household members was recoded to codes 1 to 10 and 17 to 19 on basis
of the specification of the type of the relationship.3 The category of sons and daughters in law is not restricted to spouses and includes fiancees,
partners, etcetera; former sons and daughters in law (partners of divorced or deceasedchildren have value 24).
4 The category of cousins, nieces and nephews includes their spouses and partners.
Value Label Value Frequency % Cum%housekeeper, hh 1 2 .0 .0acquaintance, hh 2 1 .0 .0catholic sister, hh 3 3 .0 .0parent, hh 4 14 .0 .0parent inlaw, hh 5 4 .0 .0niece/nephew, hh 6 1 .0 .0son/d inlaw, hh 7 13 .0 .1br/si inlaw, hh 8 5 .0 .1boarder/landlord, hh 10 7 .0 .1hh partner/spouse 11 2466 4.5 4.6hh son/daughter 12 670 1.2 5.8hh br/sister 13 46 .1 5.9hh grandson/daughter 14 17 .0 6.0hh friend 15 6 .0 6.0other hh, nonkin 17 7 .0 6.0hh son/d part/other 19 21 .0 6.0
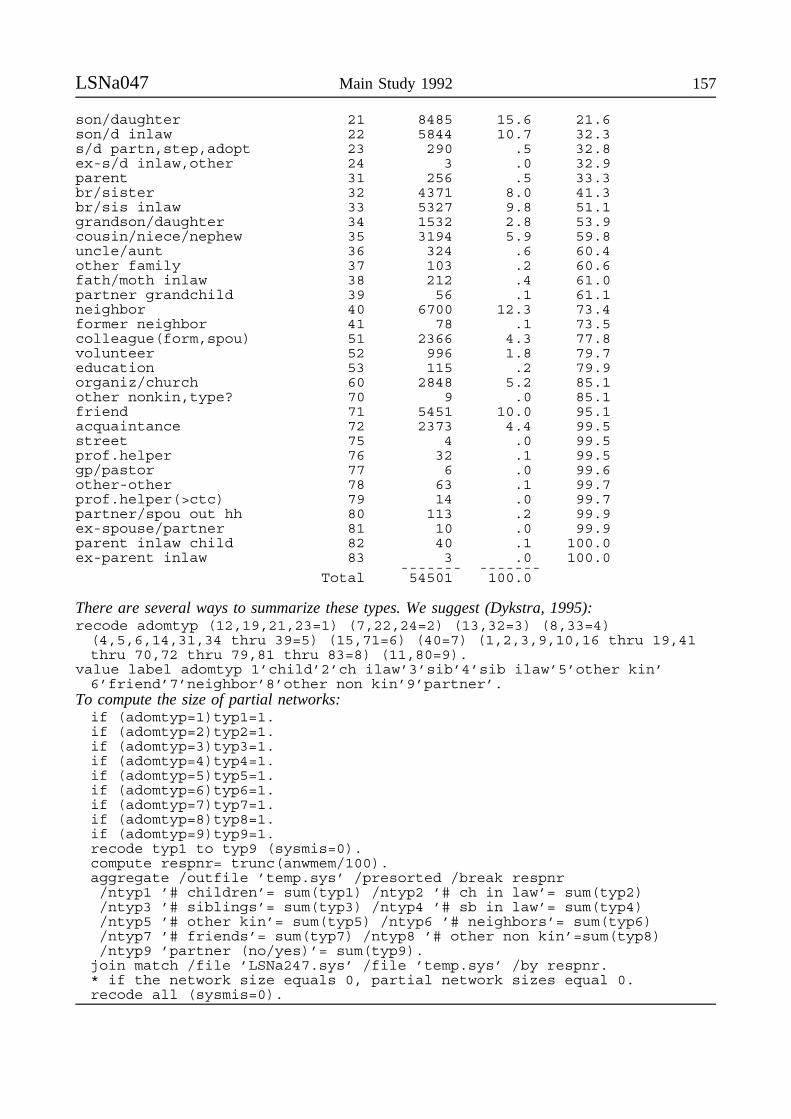
LSNa047 Main Study 1992 157
son/daughter 21 8485 15.6 21.6son/d inlaw 22 5844 10.7 32.3s/d partn,step,adopt 23 290 .5 32.8ex-s/d inlaw,other 24 3 .0 32.9parent 31 256 .5 33.3br/sister 32 4371 8.0 41.3br/sis inlaw 33 5327 9.8 51.1grandson/daughter 34 1532 2.8 53.9cousin/niece/nephew 35 3194 5.9 59.8uncle/aunt 36 324 .6 60.4other family 37 103 .2 60.6fath/moth inlaw 38 212 .4 61.0partner grandchild 39 56 .1 61.1neighbor 40 6700 12.3 73.4former neighbor 41 78 .1 73.5colleague(form,spou) 51 2366 4.3 77.8volunteer 52 996 1.8 79.7education 53 115 .2 79.9organiz/church 60 2848 5.2 85.1other nonkin,type? 70 9 .0 85.1friend 71 5451 10.0 95.1acquaintance 72 2373 4.4 99.5street 75 4 .0 99.5prof.helper 76 32 .1 99.5gp/pastor 77 6 .0 99.6other-other 78 63 .1 99.7prof.helper(>ctc) 79 14 .0 99.7partner/spou out hh 80 113 .2 99.9ex-spouse/partner 81 10 .0 99.9parent inlaw child 82 40 .1 100.0ex-parent inlaw 83 3 .0 100.0
------- -------Total 54501 100.0
There are several ways to summarize these types. We suggest (Dykstra, 1995):recode adomtyp (12,19,21,23=1) (7,22,24=2) (13,32=3) (8,33=4)(4,5,6,14,31,34 thru 39=5) (15,71=6) (40=7) (1,2,3,9,10,16 thru 19,41thru 70,72 thru 79,81 thru 83=8) (11,80=9).
value label adomtyp 1’child’2’ch ilaw’3’sib’4’sib ilaw’5’other kin’6’friend’7’neighbor’8’other non kin’9’partner’.
To compute the size of partial networks:if (adomtyp=1)typ1=1.if (adomtyp=2)typ2=1.if (adomtyp=3)typ3=1.if (adomtyp=4)typ4=1.if (adomtyp=5)typ5=1.if (adomtyp=6)typ6=1.if (adomtyp=7)typ7=1.if (adomtyp=8)typ8=1.if (adomtyp=9)typ9=1.recode typ1 to typ9 (sysmis=0).compute respnr= trunc(anwmem/100).aggregate /outfile ’temp.sys’ /presorted /break respnr/ntyp1 ’# children’= sum(typ1) /ntyp2 ’# ch in law’= sum(typ2)/ntyp3 ’# siblings’= sum(typ3) /ntyp4 ’# sb in law’= sum(typ4)/ntyp5 ’# other kin’= sum(typ5) /ntyp6 ’# neighbors’= sum(typ6)/ntyp7 ’# friends’= sum(typ7) /ntyp8 ’# other non kin’=sum(typ8)/ntyp9 ’partner (no/yes)’= sum(typ9).
join match /file ’LSNa247.sys’ /file ’temp.sys’ /by respnr.* if the network size equals 0, partial network sizes equal 0.recode all (sysmis=0).

158 NESTOR living arrangements and social networks LSNa047
anwsex sex network member
Is .. a male or a female? Is .. een man of een vrouw?
Value Label Value Frequency % Cum%unknown -1 6 .0 .0male 1 24718 45.4 45.4female 2 29777 54.6 100.0
------- -------Total 54501 100.0
anwfreq frequency of contact
How often are you in touch with ..? Ik wil graag weten hoe vaak u contact heeft met ..
Suggested recoding to get the frequency in days per year:recode anwfreq (1=0)(2=1)(3=6)(4=12)(5=26)(6=52)(7=156)(8=365).value labels anwfreq -1’missing’0’never’1’once a year or less’6’few times a year’12’once a month’26’once a fortnight’52’once a week’156’few times a week’365’each day’.missing values anwfreq (-1).
Value Label Value Frequency % Cum%missing -1 322 .6 .6never 1 104 .2 .8yearly or less often 2 535 1.0 1.8few times year 3 8490 15.6 17.4monthly 4 9504 17.4 34.8once every 2 weeks 5 6708 12.3 47.1weekly 6 11982 22.0 69.1few times week 7 8864 16.3 85.3daily/hh member 8 7992 14.7 100.0
------- -------Total 54501 100.0
Missing values were coded in two cases. First, if network members were deleted during theinterview from the list generated by the interviewer. Second, if after the interview networkmembers were added manually, while more detailed information was missing.
Aggregating information on the relationship level to the level of the respondents (example):get file ’LSNa047.sys’.compute temp=adomtyp.recode temp (12,19,21,23=1) (7,22,24=2) (13,32=3) (8,33=4)(4,5,6,14,31,34 thru 39=5) (15,71=6) (40=7) (1,2,3,9,10,16 thru19,41 thru 70,72 thru 79,81 thru 83=8) (11,80=9).value label temp 1’child’2’ch ilaw’3’sib’4’sib ilaw’5’other kin’6’friend’7’neighbor’8’other non kin’9’partner’.if (temp>=1 & temp <=5)kin=1.if (adomtyp=-1 | adomtyp=11 | adomtyp=80)kin=-1.recode kin (sysmis=0).missing values kin anwfreq (-1).compute weekly=0.if (anwfreq>=6)weekly=1.compute respnr=trunc(anwmem/100).aggregate /outfile ’temp.sys’ /break respnr/pctkin ’percentage of kin’ = pgt(kin,0)/nweekly ’number contacted at least weekly’ = sum (weekly)/sdfreq ’standard deviation frequency contact’ = sd (anwfreq).
join match /file ’LSNa247.sys’ /file ’temp.sys’ /by respnr.* if network size equals zero, the number of network members contactedat least weekly equals zero.if (anwsize=0)nweekly=0.descriptives /variables = pctkin nweekly sdfreq.
One has to pay attention to the missing values for the aggregate variables. The next tableprovides an overview of the missing values for the three aggregate variables.

LSNa047 Main Study 1992 159
variable N of respondents with missing values
pctkin 55: no network members (15), partner is the only relationship (40)
nweekly none
sdfreq 105: no network members (15), only one relationship (87), none or only onerelationships with valid values on anwfreq (3)
Combining data of all persons (current household members in LSNa015, siblings in LSNa021,children in LSNa022 and network members in LSNa047; grandchildren in LSNa023 excludedbecause this section of the questionnaire was not asked to all respondents) mentioned by therespondent; respondents of whom the network have not been delineated are excluded.join match /file ’LSNa047.sys’ /rename (adomtyp=ptyp) (anwsex= psex)(anwfreq=pfreq) /file ’LSNa048.sys’ /keep anwmem ademid /file’LSNa051.sys’ /drop anwdurat asequenc /rename (anwpart= ppart)(anwage=page) (anwtrav=ptrav) (anwempl=pempl) /by anwmem.compute source="nw".if (ptyp<20)ptrav=0.variable label source ’source of data’.add value labels ppart 9’partner’.save file ’temp.sys’.select if ((ademid<0 | ptyp=14 | ptyp=34) & ptyp<>11 & ptyp<>80).save file ’temp0471.sys’.get file ’temp.sys’.select if (ademid>0 & ptyp<>14 & ptyp<>34 & ptyp<>11 & ptyp<>80).sort by ademid.save file ’temp0472.sys’.get file ’temp.sys’.select if (ptyp=11 | ptyp=80).save file ’temp0473.sys’.get file ’LSNa015.sys’.compute source="hc".compute pfreq=8.compute ptrav=0.save file ’temp015.sys’ /keep ademid pfreq ptrav ahhsex ahhage ahhtypsource /rename (ahhsex=psex) (ahhage=page) (ahhtyp=ptyp).get file ’LSNa021.sys’.compute source="sb".compute ptyp=32.if (asbhoush=1)ptyp=13.modify variables /drop asbstep asbhoush /rename (asbsex=psex)(asbage=page) (asbtrav=ptrav) (asbfreq=pfreq) (asbpart=ppart).save file ’temp021.sys’.get file ’LSNa022.sys’.compute source="cc".select if (achdead=-2).if (achhoush=1 & achstep=1)ptyp=12.if (achhoush=1 & achstep<>1)ptyp=19.if (achhoush=0 & achstep=1)ptyp=21.if (achhoush=0 & achstep<>1)ptyp=24.modify variables /drop achdead achstep agcnum aggcnum achhoush anformmto aendc4 /rename (achsex=psex) (achage=page) (achtrav=ptrav)(achfreq=pfreq) (achpart=ppart) (achempl=pempl).save file ’temp022.sys’.join match /file ’temp0472.sys’ /file ’temp015.sys’ /file ’temp021.sys’/file ’temp022.sys’ /by ademid.compute respnr=trunc(ademid/100).save file ’temp2.sys’.join match /file ’temp2.sys’ /table ’LSNa247.sys’ /by respnr.select if (not missing(anwsize)).save file ’temp4.sys’ /drop anwsize respnr.

160 NESTOR living arrangements and social networks LSNa047
join match /file ’temp0473.sys’ /file ’LSNa011.sys’ /keep respnr apageapemplhr /table ’LSNa010.sys’ /keep respnr amarst /by respnr.select if (not missing(anwmem)).if (missing(page) or page<1)page=apage.if (apemplhr=-2)pempl=1.if (apemplhr>0 & apemplhr<=27)pempl=2.if (apemplhr>=28)pempl=3.if (amarst=2)ppart=1.recode ppart (sysmis=9).save file ’temp3.sys’ /drop apage apemplhr respnr amarst.join add /file ’temp0471.sys’ /file ’temp4.sys’ /file ’temp3.sys’.
This procedure leads to a file with approximately 63,000 cases.
LSNa247N: 4,059Data about: network sizeData source: SystemOther files about same topic: LSNa047Selection of respondents: no technical problems with questionnaireIdentification variable: RESPNR
anwsize size network
This is the total number of network members generated in response to the questions about theseven domains (LSNa047).
Computation:get file ’LSNa047.sys’.compute respnr=trunc(anwmem/100).aggregate /outfile ’LSNa247.sys’ /break respnr/anwsize ’network size’ = N.join match /file ’LSNa001.sys’ /keep respnr a247_1 /file’LSNa247.sys’ /by respnr.select if (a247_1=1).recode anwsize (sysmis=0).
Value Label Value Frequency % Cum%0 15 .4 .41 86 2.1 2.52 133 3.3 5.83 136 3.4 9.14 164 4.0 13.25 212 5.2 18.46 221 5.4 23.87 223 5.5 29.38 241 5.9 35.39 218 5.4 40.6
10 217 5.3 46.011 209 5.1 51.112 170 4.2 55.313 186 4.6 59.914 162 4.0 63.915 163 4.0 67.916 128 3.2 71.117 115 2.8 73.918 101 2.5 76.419 104 2.6 78.920 82 2.0 81.021 99 2.4 83.4
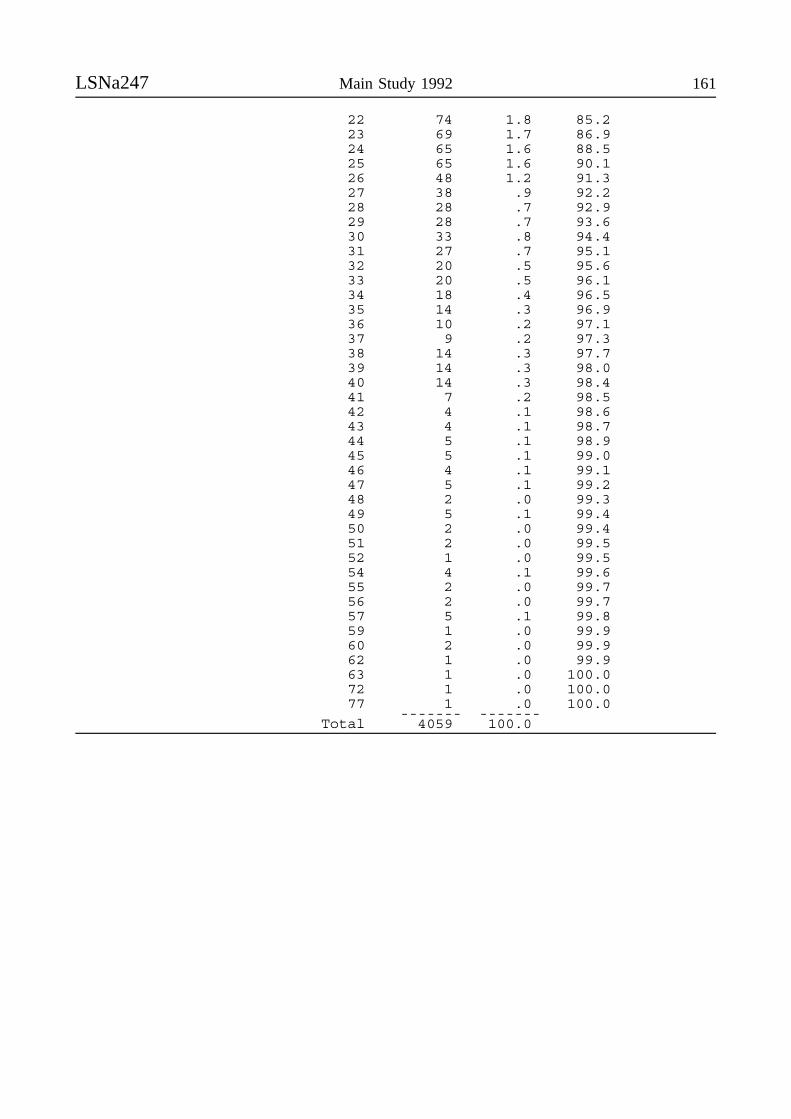
LSNa247 Main Study 1992 161
22 74 1.8 85.223 69 1.7 86.924 65 1.6 88.525 65 1.6 90.126 48 1.2 91.327 38 .9 92.228 28 .7 92.929 28 .7 93.630 33 .8 94.431 27 .7 95.132 20 .5 95.633 20 .5 96.134 18 .4 96.535 14 .3 96.936 10 .2 97.137 9 .2 97.338 14 .3 97.739 14 .3 98.040 14 .3 98.441 7 .2 98.542 4 .1 98.643 4 .1 98.744 5 .1 98.945 5 .1 99.046 4 .1 99.147 5 .1 99.248 2 .0 99.349 5 .1 99.450 2 .0 99.451 2 .0 99.552 1 .0 99.554 4 .1 99.655 2 .0 99.756 2 .0 99.757 5 .1 99.859 1 .0 99.960 2 .0 99.962 1 .0 99.963 1 .0 100.072 1 .0 100.077 1 .0 100.0
------- -------Total 4059 100.0
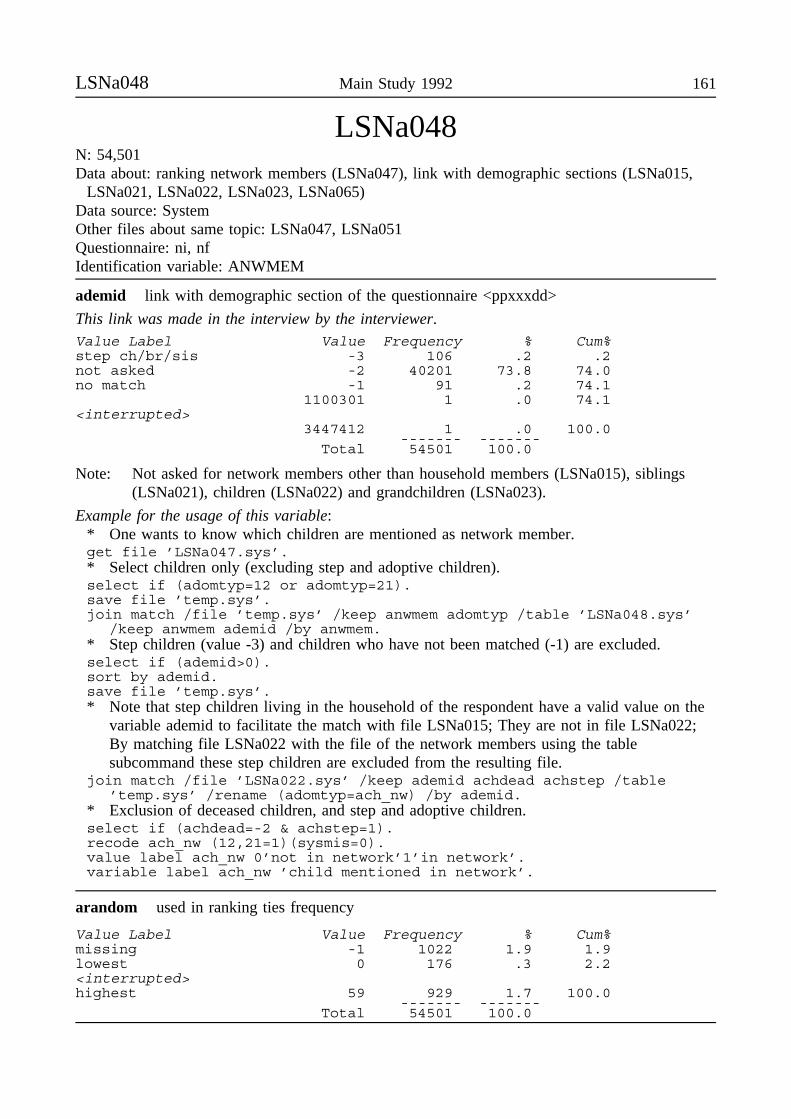
LSNa048 Main Study 1992 161
LSNa048N: 54,501Data about: ranking network members (LSNa047), link with demographic sections (LSNa015,
LSNa021, LSNa022, LSNa023, LSNa065)Data source: SystemOther files about same topic: LSNa047, LSNa051Questionnaire: ni, nfIdentification variable: ANWMEM
ademid link with demographic section of the questionnaire <ppxxxdd>
This link was made in the interview by the interviewer.Value Label Value Frequency % Cum%step ch/br/sis -3 106 .2 .2not asked -2 40201 73.8 74.0no match -1 91 .2 74.1
1100301 1 .0 74.1<interrupted>
3447412 1 .0 100.0------- -------
Total 54501 100.0
Note: Not asked for network members other than household members (LSNa015), siblings(LSNa021), children (LSNa022) and grandchildren (LSNa023).
Example for the usage of this variable:* One wants to know which children are mentioned as network member.get file ’LSNa047.sys’.* Select children only (excluding step and adoptive children).select if (adomtyp=12 or adomtyp=21).save file ’temp.sys’.join match /file ’temp.sys’ /keep anwmem adomtyp /table ’LSNa048.sys’
/keep anwmem ademid /by anwmem.* Step children (value -3) and children who have not been matched (-1) are excluded.select if (ademid>0).sort by ademid.save file ’temp.sys’.* Note that step children living in the household of the respondent have a valid value on the
variable ademid to facilitate the match with file LSNa015; They are not in file LSNa022;By matching file LSNa022 with the file of the network members using the tablesubcommand these step children are excluded from the resulting file.
join match /file ’LSNa022.sys’ /keep ademid achdead achstep /table’temp.sys’ /rename (adomtyp=ach_nw) /by ademid.
* Exclusion of deceased children, and step and adoptive children.select if (achdead=-2 & achstep=1).recode ach_nw (12,21=1)(sysmis=0).value label ach_nw 0’not in network’1’in network’.variable label ach_nw ’child mentioned in network’.
arandom used in ranking ties frequency
Value Label Value Frequency % Cum%missing -1 1022 1.9 1.9lowest 0 176 .3 2.2<interrupted>highest 59 929 1.7 100.0
------- -------Total 54501 100.0
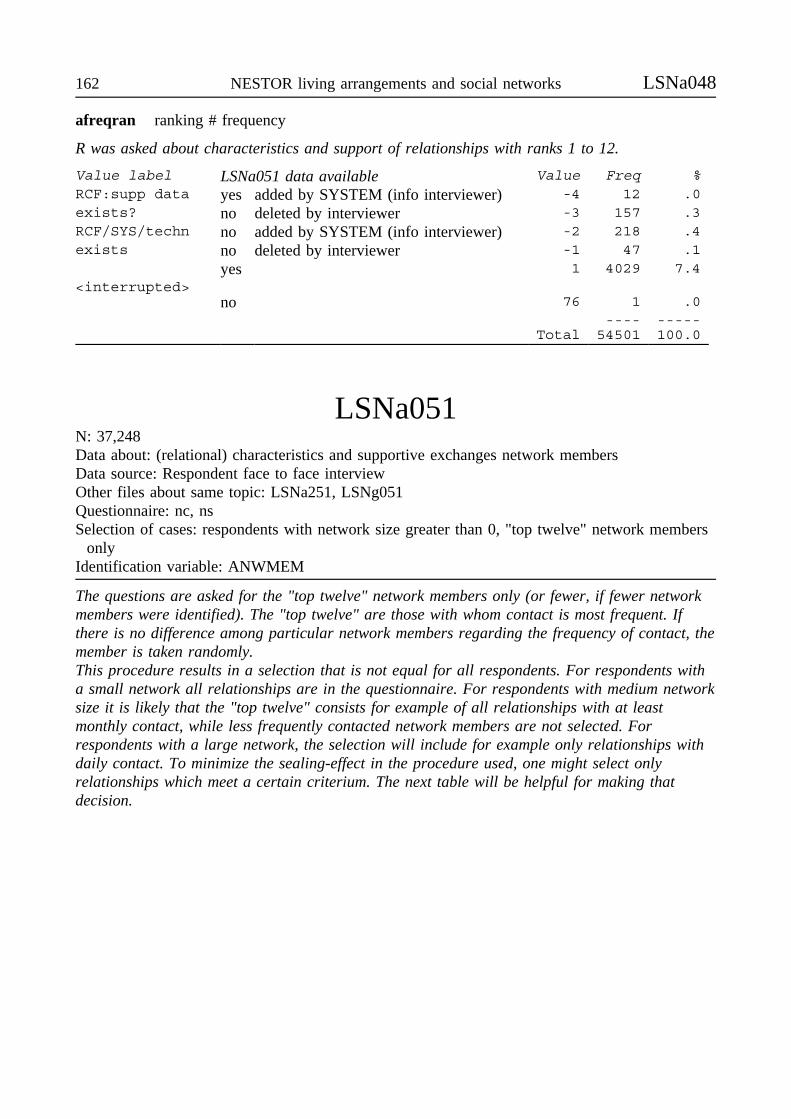
162 NESTOR living arrangements and social networks LSNa048
afreqran ranking # frequency
R was asked about characteristics and support of relationships with ranks 1 to 12.
Value label LSNa051 data available Value Freq %RCF:supp data yes added by SYSTEM (info interviewer) -4 12 .0exists? no deleted by interviewer -3 157 .3RCF/SYS/techn no added by SYSTEM (info interviewer) -2 218 .4exists no deleted by interviewer -1 47 .1
yes 1 4029 7.4<interrupted>
no 76 1 .0---- -----
Total 54501 100.0
LSNa051N: 37,248Data about: (relational) characteristics and supportive exchanges network membersData source: Respondent face to face interviewOther files about same topic: LSNa251, LSNg051Questionnaire: nc, nsSelection of cases: respondents with network size greater than 0, "top twelve" network members
onlyIdentification variable: ANWMEM
The questions are asked for the "top twelve" network members only (or fewer, if fewer networkmembers were identified). The "top twelve" are those with whom contact is most frequent. Ifthere is no difference among particular network members regarding the frequency of contact, themember is taken randomly.This procedure results in a selection that is not equal for all respondents. For respondents witha small network all relationships are in the questionnaire. For respondents with medium networksize it is likely that the "top twelve" consists for example of all relationships with at leastmonthly contact, while less frequently contacted network members are not selected. Forrespondents with a large network, the selection will include for example only relationships withdaily contact. To minimize the sealing-effect in the procedure used, one might select onlyrelationships which meet a certain criterium. The next table will be helpful for making thatdecision.
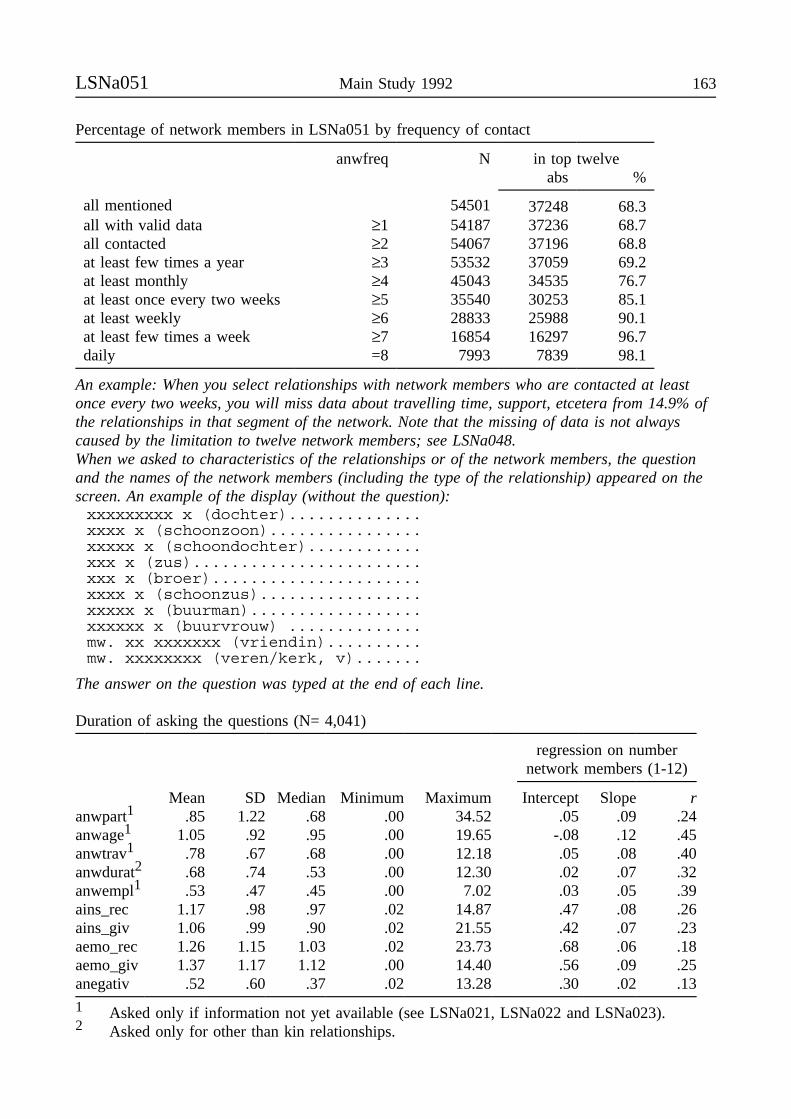
LSNa051 Main Study 1992 163
Percentage of network members in LSNa051 by frequency of contact
anwfreq N in top twelveabs %
all mentioned 54501 37248 68.3all with valid data ≥1 54187 37236 68.7all contacted ≥2 54067 37196 68.8at least few times a year ≥3 53532 37059 69.2at least monthly ≥4 45043 34535 76.7at least once every two weeks ≥5 35540 30253 85.1at least weekly ≥6 28833 25988 90.1at least few times a week ≥7 16854 16297 96.7daily =8 7993 7839 98.1
An example: When you select relationships with network members who are contacted at leastonce every two weeks, you will miss data about travelling time, support, etcetera from 14.9% ofthe relationships in that segment of the network. Note that the missing of data is not alwayscaused by the limitation to twelve network members; see LSNa048.When we asked to characteristics of the relationships or of the network members, the questionand the names of the network members (including the type of the relationship) appeared on thescreen. An example of the display (without the question):xxxxxxxxx x (dochter)..............xxxx x (schoonzoon)................xxxxx x (schoondochter)............xxx x (zus)........................xxx x (broer)......................xxxx x (schoonzus).................xxxxx x (buurman)..................xxxxxx x (buurvrouw) ..............mw. xx xxxxxxx (vriendin)..........mw. xxxxxxxx (veren/kerk, v).......
The answer on the question was typed at the end of each line.
Duration of asking the questions (N= 4,041)
regression on numbernetwork members (1-12)
Mean SD Median Minimum Maximum Intercept Slope ranwpart1 .85 1.22 .68 .00 34.52 .05 .09 .24anwage1 1.05 .92 .95 .00 19.65 -.08 .12 .45anwtrav1 .78 .67 .68 .00 12.18 .05 .08 .40anwdurat2 .68 .74 .53 .00 12.30 .02 .07 .32anwempl1 .53 .47 .45 .00 7.02 .03 .05 .39ains_rec 1.17 .98 .97 .02 14.87 .47 .08 .26ains_giv 1.06 .99 .90 .02 21.55 .42 .07 .23aemo_rec 1.26 1.15 1.03 .02 23.73 .68 .06 .18aemo_giv 1.37 1.17 1.12 .00 14.40 .56 .09 .25anegativ .52 .60 .37 .02 13.28 .30 .02 .13
1 Asked only if information not yet available (see LSNa021, LSNa022 and LSNa023).2 Asked only for other than kin relationships.
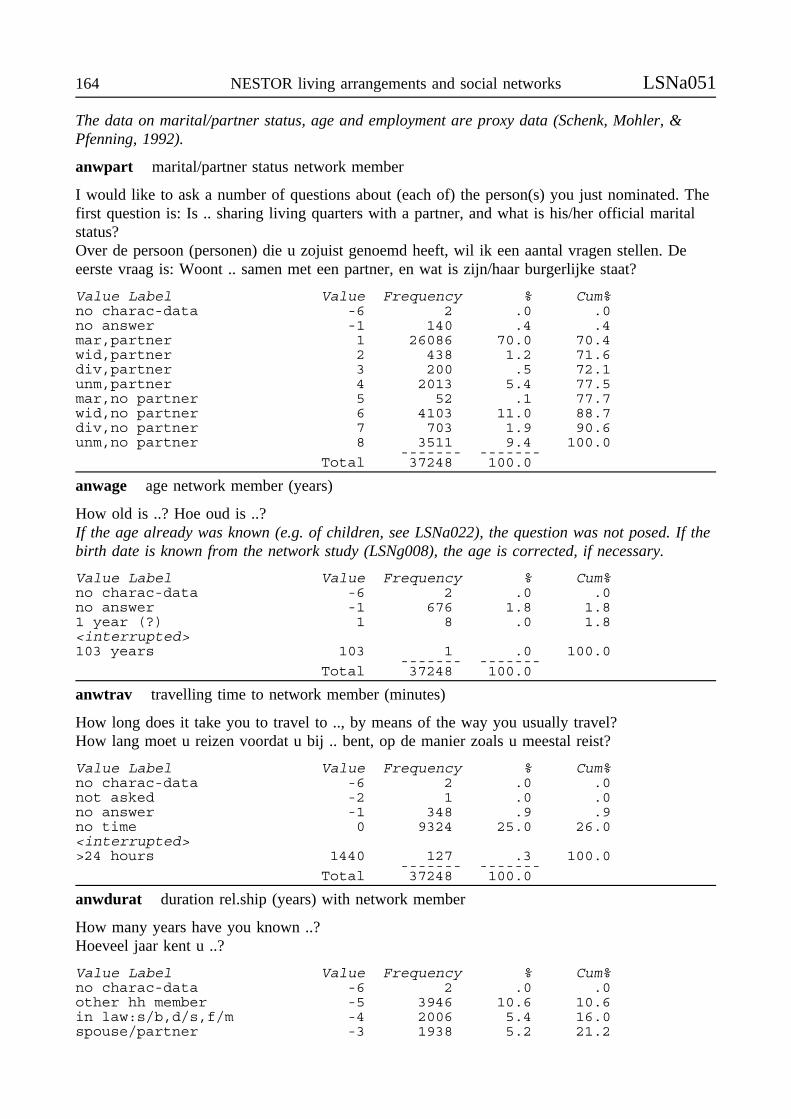
164 NESTOR living arrangements and social networks LSNa051
The data on marital/partner status, age and employment are proxy data (Schenk, Mohler, &Pfenning, 1992).
anwpart marital/partner status network member
I would like to ask a number of questions about (each of) the person(s) you just nominated. Thefirst question is: Is .. sharing living quarters with a partner, and what is his/her official maritalstatus?Over de persoon (personen) die u zojuist genoemd heeft, wil ik een aantal vragen stellen. Deeerste vraag is: Woont .. samen met een partner, en wat is zijn/haar burgerlijke staat?
Value Label Value Frequency % Cum%no charac-data -6 2 .0 .0no answer -1 140 .4 .4mar,partner 1 26086 70.0 70.4wid,partner 2 438 1.2 71.6div,partner 3 200 .5 72.1unm,partner 4 2013 5.4 77.5mar,no partner 5 52 .1 77.7wid,no partner 6 4103 11.0 88.7div,no partner 7 703 1.9 90.6unm,no partner 8 3511 9.4 100.0
------- -------Total 37248 100.0
anwage age network member (years)
How old is ..? Hoe oud is ..?If the age already was known (e.g. of children, see LSNa022), the question was not posed. If thebirth date is known from the network study (LSNg008), the age is corrected, if necessary.
Value Label Value Frequency % Cum%no charac-data -6 2 .0 .0no answer -1 676 1.8 1.81 year (?) 1 8 .0 1.8<interrupted>103 years 103 1 .0 100.0
------- -------Total 37248 100.0
anwtrav travelling time to network member (minutes)
How long does it take you to travel to .., by means of the way you usually travel?How lang moet u reizen voordat u bij .. bent, op de manier zoals u meestal reist?
Value Label Value Frequency % Cum%no charac-data -6 2 .0 .0not asked -2 1 .0 .0no answer -1 348 .9 .9no time 0 9324 25.0 26.0<interrupted>>24 hours 1440 127 .3 100.0
------- -------Total 37248 100.0
anwdurat duration rel.ship (years) with network member
How many years have you known ..?Hoeveel jaar kent u ..?
Value Label Value Frequency % Cum%no charac-data -6 2 .0 .0other hh member -5 3946 10.6 10.6in law:s/b,d/s,f/m -4 2006 5.4 16.0spouse/partner -3 1938 5.2 21.2
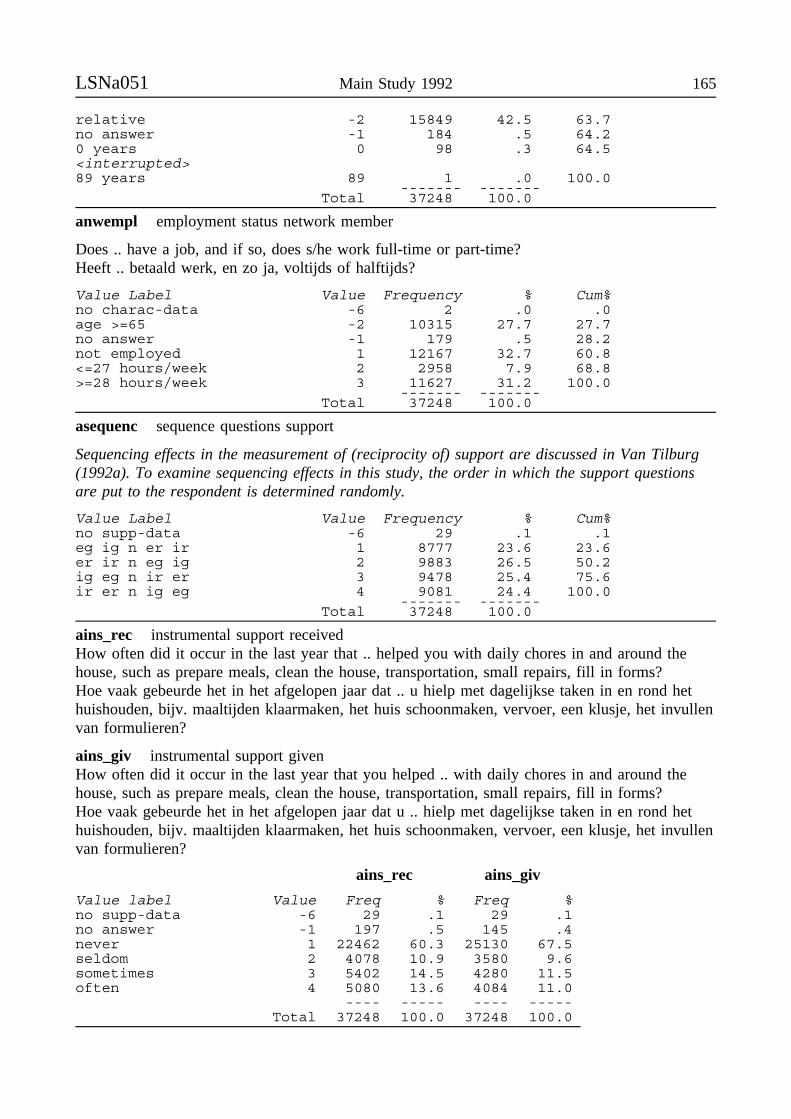
LSNa051 Main Study 1992 165
relative -2 15849 42.5 63.7no answer -1 184 .5 64.20 years 0 98 .3 64.5<interrupted>89 years 89 1 .0 100.0
------- -------Total 37248 100.0
anwempl employment status network member
Does .. have a job, and if so, does s/he work full-time or part-time?Heeft .. betaald werk, en zo ja, voltijds of halftijds?
Value Label Value Frequency % Cum%no charac-data -6 2 .0 .0age >=65 -2 10315 27.7 27.7no answer -1 179 .5 28.2not employed 1 12167 32.7 60.8<=27 hours/week 2 2958 7.9 68.8>=28 hours/week 3 11627 31.2 100.0
------- -------Total 37248 100.0
asequenc sequence questions support
Sequencing effects in the measurement of (reciprocity of) support are discussed in Van Tilburg(1992a). To examine sequencing effects in this study, the order in which the support questionsare put to the respondent is determined randomly.
Value Label Value Frequency % Cum%no supp-data -6 29 .1 .1eg ig n er ir 1 8777 23.6 23.6er ir n eg ig 2 9883 26.5 50.2ig eg n ir er 3 9478 25.4 75.6ir er n ig eg 4 9081 24.4 100.0
------- -------Total 37248 100.0
ains_rec instrumental support receivedHow often did it occur in the last year that .. helped you with daily chores in and around thehouse, such as prepare meals, clean the house, transportation, small repairs, fill in forms?Hoe vaak gebeurde het in het afgelopen jaar dat .. u hielp met dagelijkse taken in en rond hethuishouden, bijv. maaltijden klaarmaken, het huis schoonmaken, vervoer, een klusje, het invullenvan formulieren?
ains_giv instrumental support givenHow often did it occur in the last year that you helped .. with daily chores in and around thehouse, such as prepare meals, clean the house, transportation, small repairs, fill in forms?Hoe vaak gebeurde het in het afgelopen jaar dat u .. hielp met dagelijkse taken in en rond hethuishouden, bijv. maaltijden klaarmaken, het huis schoonmaken, vervoer, een klusje, het invullenvan formulieren?
ains_rec ains_giv
Value label Value Freq % Freq %no supp-data -6 29 .1 29 .1no answer -1 197 .5 145 .4never 1 22462 60.3 25130 67.5seldom 2 4078 10.9 3580 9.6sometimes 3 5402 14.5 4280 11.5often 4 5080 13.6 4084 11.0
---- ----- ---- -----Total 37248 100.0 37248 100.0
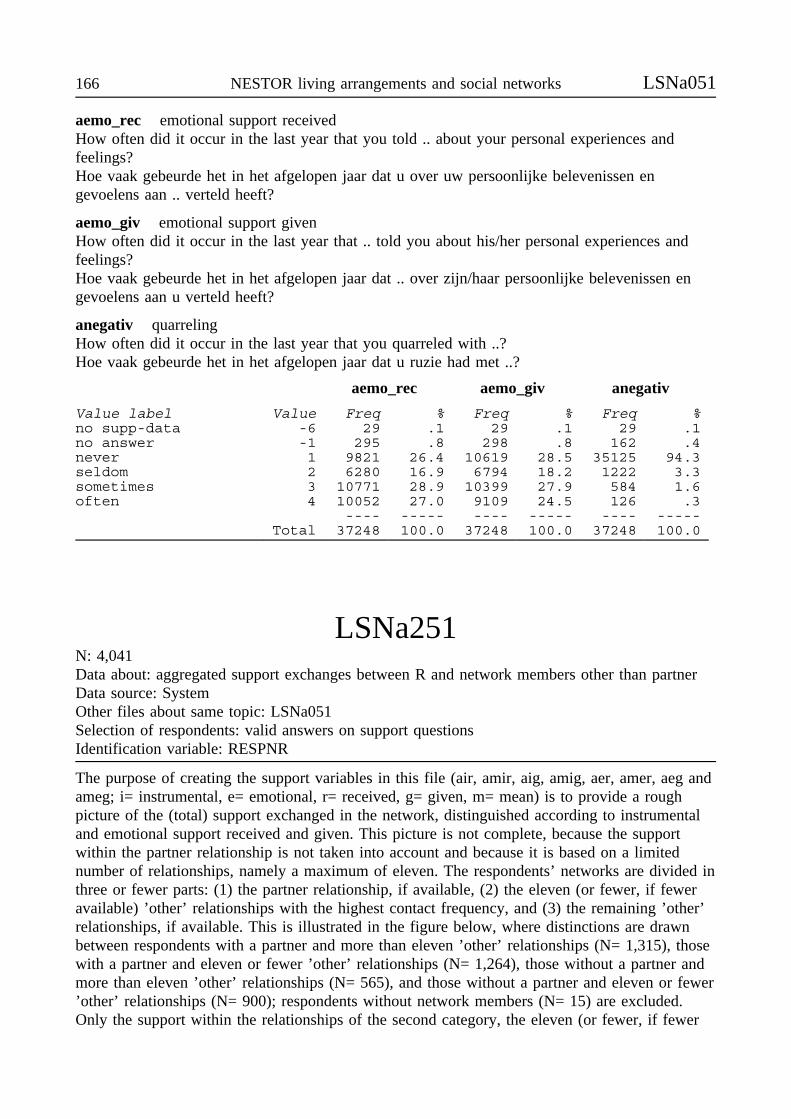
166 NESTOR living arrangements and social networks LSNa051
aemo_rec emotional support receivedHow often did it occur in the last year that you told .. about your personal experiences andfeelings?Hoe vaak gebeurde het in het afgelopen jaar dat u over uw persoonlijke belevenissen engevoelens aan .. verteld heeft?
aemo_giv emotional support givenHow often did it occur in the last year that .. told you about his/her personal experiences andfeelings?Hoe vaak gebeurde het in het afgelopen jaar dat .. over zijn/haar persoonlijke belevenissen engevoelens aan u verteld heeft?
anegativ quarrelingHow often did it occur in the last year that you quarreled with ..?Hoe vaak gebeurde het in het afgelopen jaar dat u ruzie had met ..?
aemo_rec aemo_giv anegativ
Value label Value Freq % Freq % Freq %no supp-data -6 29 .1 29 .1 29 .1no answer -1 295 .8 298 .8 162 .4never 1 9821 26.4 10619 28.5 35125 94.3seldom 2 6280 16.9 6794 18.2 1222 3.3sometimes 3 10771 28.9 10399 27.9 584 1.6often 4 10052 27.0 9109 24.5 126 .3
---- ----- ---- ----- ---- -----Total 37248 100.0 37248 100.0 37248 100.0
LSNa251N: 4,041Data about: aggregated support exchanges between R and network members other than partnerData source: SystemOther files about same topic: LSNa051Selection of respondents: valid answers on support questionsIdentification variable: RESPNR
The purpose of creating the support variables in this file (air, amir, aig, amig, aer, amer, aeg andameg; i= instrumental, e= emotional, r= received, g= given, m= mean) is to provide a roughpicture of the (total) support exchanged in the network, distinguished according to instrumentaland emotional support received and given. This picture is not complete, because the supportwithin the partner relationship is not taken into account and because it is based on a limitednumber of relationships, namely a maximum of eleven. The respondents’ networks are divided inthree or fewer parts: (1) the partner relationship, if available, (2) the eleven (or fewer, if feweravailable) ’other’ relationships with the highest contact frequency, and (3) the remaining ’other’relationships, if available. This is illustrated in the figure below, where distinctions are drawnbetween respondents with a partner and more than eleven ’other’ relationships (N= 1,315), thosewith a partner and eleven or fewer ’other’ relationships (N= 1,264), those without a partner andmore than eleven ’other’ relationships (N= 565), and those without a partner and eleven or fewer’other’ relationships (N= 900); respondents without network members (N= 15) are excluded.Only the support within the relationships of the second category, the eleven (or fewer, if fewer

LSNa251 Main Study 1992 167
available) ’other’ relationships with the highest contact frequency, is taken into account in theaggregated support measures in the LSNa251 file.
Division of the network into three parts, for respondents with and without a partnerrelationship and for respondents with a small and a large network
Exclusion of support within the partner relationshipThere are 2,579 partner relationship among the 54,501 network members. The reason for nottaking the support within the partner relationship into account is that the support questionspertain to a broad range of types of relationship and therefore do not discriminate very wellbetween support exchanged within the partner relationship and within other relationships. Ingeneral, large differences between the partner and other relationships are found, and for mostpeople the partner relationship is, among the relationships in the personal network, therelationship with the most intensive exchanges of support (Van Tilburg, 1988). Studies reportingthese findings have used instruments with greater discriminatory power than the ones used in theLSN Main Study. Usually, several questions about each of the support aspects (instrumental andemotional, received and given) are asked (see for an example the LSN network study,documented in section LSNg051 of this book). In the LSN Main Study, only one question isasked for each aspect. One of the consequences is that the support exchanged within the partnerrelationship is underestimated in the sense that the wide range of supportive exchanges is notmeasured.
Nevertheless we find that even with our simple measure (one question for each aspect) thesupport exchanges within the partner relationship are more intensive than within the otherrelationships. When we sum the scores on the four support questions for each relationship, witha theoretical range from 4 to 16, a clear difference emerges: an average of 14.0 (SD= 2.5, N=2,376) for the partner relationships, which is close to the theoretical maximum, and an averageof 8.2 (SD= 2.9, N= 34,447) for the other relationships. However, the difference between thepartner relationship and the most supportive of the other relationships is less pronounced. Thefigures in the table on the next page illustrates this. For about 55% of the networks, the partnerrelationship is ranked highest in exchanging instrumental support, and for about 29% of the
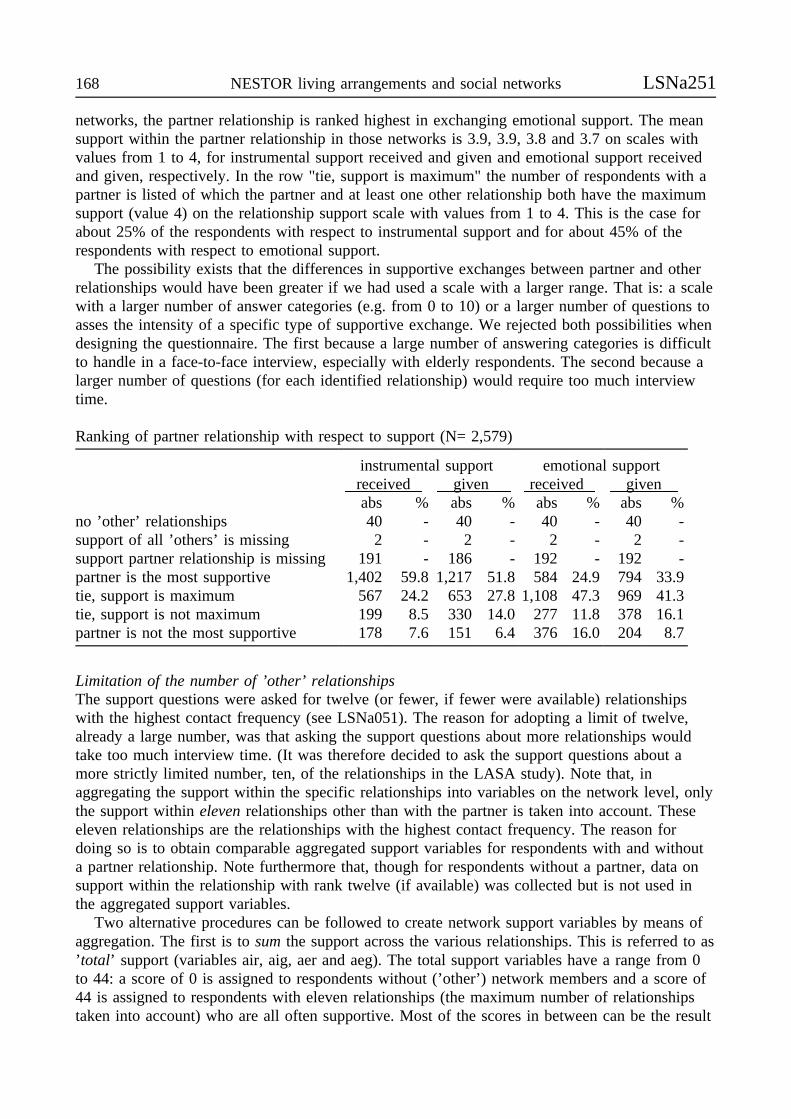
168 NESTOR living arrangements and social networks LSNa251
networks, the partner relationship is ranked highest in exchanging emotional support. The meansupport within the partner relationship in those networks is 3.9, 3.9, 3.8 and 3.7 on scales withvalues from 1 to 4, for instrumental support received and given and emotional support receivedand given, respectively. In the row "tie, support is maximum" the number of respondents with apartner is listed of which the partner and at least one other relationship both have the maximumsupport (value 4) on the relationship support scale with values from 1 to 4. This is the case forabout 25% of the respondents with respect to instrumental support and for about 45% of therespondents with respect to emotional support.
The possibility exists that the differences in supportive exchanges between partner and otherrelationships would have been greater if we had used a scale with a larger range. That is: a scalewith a larger number of answer categories (e.g. from 0 to 10) or a larger number of questions toasses the intensity of a specific type of supportive exchange. We rejected both possibilities whendesigning the questionnaire. The first because a large number of answering categories is difficultto handle in a face-to-face interview, especially with elderly respondents. The second because alarger number of questions (for each identified relationship) would require too much interviewtime.
Ranking of partner relationship with respect to support (N= 2,579)
instrumental support emotional supportreceived given received givenabs % abs % abs % abs %
no ’other’ relationships 40 - 40 - 40 - 40 -support of all ’others’ is missing 2 - 2 - 2 - 2 -support partner relationship is missing 191 - 186 - 192 - 192 -partner is the most supportive 1,402 59.8 1,217 51.8 584 24.9 794 33.9tie, support is maximum 567 24.2 653 27.8 1,108 47.3 969 41.3tie, support is not maximum 199 8.5 330 14.0 277 11.8 378 16.1partner is not the most supportive 178 7.6 151 6.4 376 16.0 204 8.7
Limitation of the number of ’other’ relationshipsThe support questions were asked for twelve (or fewer, if fewer were available) relationshipswith the highest contact frequency (see LSNa051). The reason for adopting a limit of twelve,already a large number, was that asking the support questions about more relationships wouldtake too much interview time. (It was therefore decided to ask the support questions about amore strictly limited number, ten, of the relationships in the LASA study). Note that, inaggregating the support within the specific relationships into variables on the network level, onlythe support within eleven relationships other than with the partner is taken into account. Theseeleven relationships are the relationships with the highest contact frequency. The reason fordoing so is to obtain comparable aggregated support variables for respondents with and withouta partner relationship. Note furthermore that, though for respondents without a partner, data onsupport within the relationship with rank twelve (if available) was collected but is not used inthe aggregated support variables.
Two alternative procedures can be followed to create network support variables by means ofaggregation. The first is to sum the support across the various relationships. This is referred to as’total’ support (variables air, aig, aer and aeg). The total support variables have a range from 0to 44: a score of 0 is assigned to respondents without (’other’) network members and a score of44 is assigned to respondents with eleven relationships (the maximum number of relationshipstaken into account) who are all often supportive. Most of the scores in between can be the result
LSNa251 Main Study 1992 169
of different patterns, for example a score of 11 is assigned to respondents with elevenrelationships who are all never supportive, and to respondents with five relationships with scores4, 2, 3, 1 and 1. The second possibility is to compute the mean of the support within the variousrelationships (variables amir, amig, amer and ameg). This is referred to as ’mean’ support. Themean support variables have a range from 0 (all relationships are never supportive) to 3 (allrelationships are often supportive), and a score of 0 is assigned to respondents without (’other’)network members.
Given the limit in the number of ’other’ relationships for which questions about support wereasked, the aggregated total support underestimates the support in the network for respondentswith more than eleven ’other’ relationships, assuming that at least one of the remaining ’other’relationships is supportive. Whether this will influence the results of substantive analyses isunclear. A study by Van Tilburg (1990) showed that the importance for the explanation ofloneliness of relationships with a high ranking number (in that particular study: six or higher) islimited. There is no knowledge about such effects for other topics of research. Given the limit inthe number of ’other’ relationships for which questions about support were asked, the aggregatedmean support overestimates the mean support in the network for respondents with more thaneleven ’other’ relationships, assuming that the remaining ’other’ relationships are less supportivethan the eleven relationships with the highest contact frequency. Following these considerations,it is necessary to look at the associations between the frequency of the contact and the intensityof the instrumental and emotional support received and given. The figure below shows a higherintensity of support for a higher contact frequency. However, Spearman correlations are low tomoderate (between .16 and .27; 34,522 ≤ N ≤ 34,679). Given the relatively low correlations it ismost likely that the difference in support between the eleven and the remaining relationships issmall. Our conclusion is that the underestimation of total support is probably larger than theoverestimation of mean support.
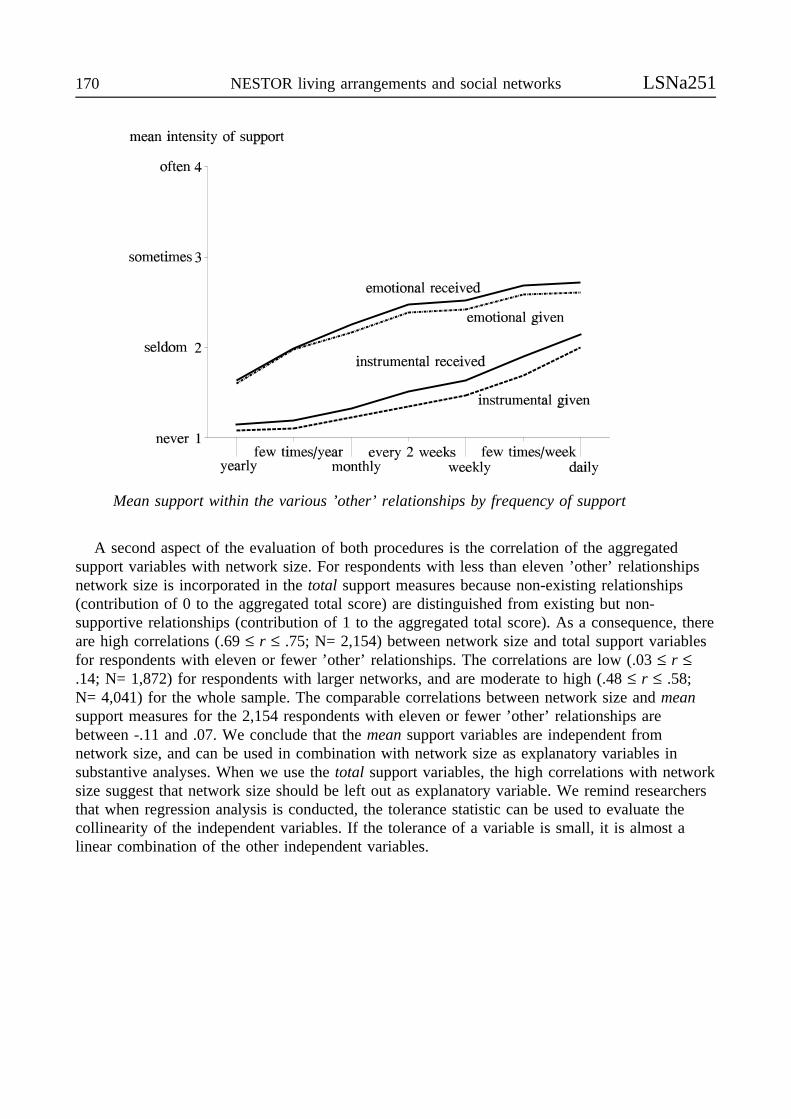
170 NESTOR living arrangements and social networks LSNa251
A second aspect of the evaluation of both procedures is the correlation of the aggregated
Mean support within the various ’other’ relationships by frequency of support
support variables with network size. For respondents with less than eleven ’other’ relationshipsnetwork size is incorporated in the total support measures because non-existing relationships(contribution of 0 to the aggregated total score) are distinguished from existing but non-supportive relationships (contribution of 1 to the aggregated total score). As a consequence, thereare high correlations (.69 ≤ r ≤ .75; N= 2,154) between network size and total support variablesfor respondents with eleven or fewer ’other’ relationships. The correlations are low (.03 ≤ r ≤.14; N= 1,872) for respondents with larger networks, and are moderate to high (.48 ≤ r ≤ .58;N= 4,041) for the whole sample. The comparable correlations between network size and meansupport measures for the 2,154 respondents with eleven or fewer ’other’ relationships arebetween -.11 and .07. We conclude that the mean support variables are independent fromnetwork size, and can be used in combination with network size as explanatory variables insubstantive analyses. When we use the total support variables, the high correlations with networksize suggest that network size should be left out as explanatory variable. We remind researchersthat when regression analysis is conducted, the tolerance statistic can be used to evaluate thecollinearity of the independent variables. If the tolerance of a variable is small, it is almost alinear combination of the other independent variables.
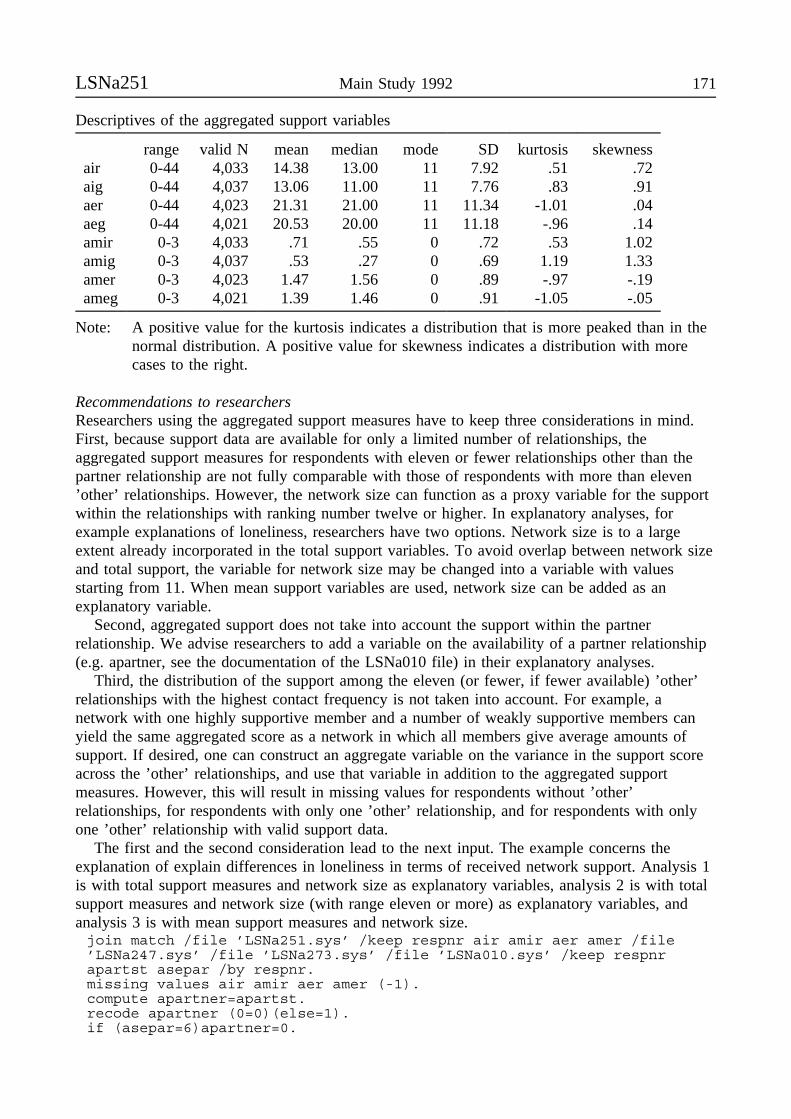
LSNa251 Main Study 1992 171
Descriptives of the aggregated support variables
range valid N mean median mode SD kurtosis skewnessair 0-44 4,033 14.38 13.00 11 7.92 .51 .72aig 0-44 4,037 13.06 11.00 11 7.76 .83 .91aer 0-44 4,023 21.31 21.00 11 11.34 -1.01 .04aeg 0-44 4,021 20.53 20.00 11 11.18 -.96 .14amir 0-3 4,033 .71 .55 0 .72 .53 1.02amig 0-3 4,037 .53 .27 0 .69 1.19 1.33amer 0-3 4,023 1.47 1.56 0 .89 -.97 -.19ameg 0-3 4,021 1.39 1.46 0 .91 -1.05 -.05
Note: A positive value for the kurtosis indicates a distribution that is more peaked than in thenormal distribution. A positive value for skewness indicates a distribution with morecases to the right.
Recommendations to researchersResearchers using the aggregated support measures have to keep three considerations in mind.First, because support data are available for only a limited number of relationships, theaggregated support measures for respondents with eleven or fewer relationships other than thepartner relationship are not fully comparable with those of respondents with more than eleven’other’ relationships. However, the network size can function as a proxy variable for the supportwithin the relationships with ranking number twelve or higher. In explanatory analyses, forexample explanations of loneliness, researchers have two options. Network size is to a largeextent already incorporated in the total support variables. To avoid overlap between network sizeand total support, the variable for network size may be changed into a variable with valuesstarting from 11. When mean support variables are used, network size can be added as anexplanatory variable.
Second, aggregated support does not take into account the support within the partnerrelationship. We advise researchers to add a variable on the availability of a partner relationship(e.g. apartner, see the documentation of the LSNa010 file) in their explanatory analyses.
Third, the distribution of the support among the eleven (or fewer, if fewer available) ’other’relationships with the highest contact frequency is not taken into account. For example, anetwork with one highly supportive member and a number of weakly supportive members canyield the same aggregated score as a network in which all members give average amounts ofsupport. If desired, one can construct an aggregate variable on the variance in the support scoreacross the ’other’ relationships, and use that variable in addition to the aggregated supportmeasures. However, this will result in missing values for respondents without ’other’relationships, for respondents with only one ’other’ relationship, and for respondents with onlyone ’other’ relationship with valid support data.
The first and the second consideration lead to the next input. The example concerns theexplanation of explain differences in loneliness in terms of received network support. Analysis 1is with total support measures and network size as explanatory variables, analysis 2 is with totalsupport measures and network size (with range eleven or more) as explanatory variables, andanalysis 3 is with mean support measures and network size.join match /file ’LSNa251.sys’ /keep respnr air amir aer amer /file’LSNa247.sys’ /file ’LSNa273.sys’ /file ’LSNa010.sys’ /keep respnrapartst asepar /by respnr.missing values air amir aer amer (-1).compute apartner=apartst.recode apartner (0=0)(else=1).if (asepar=6)apartner=0.
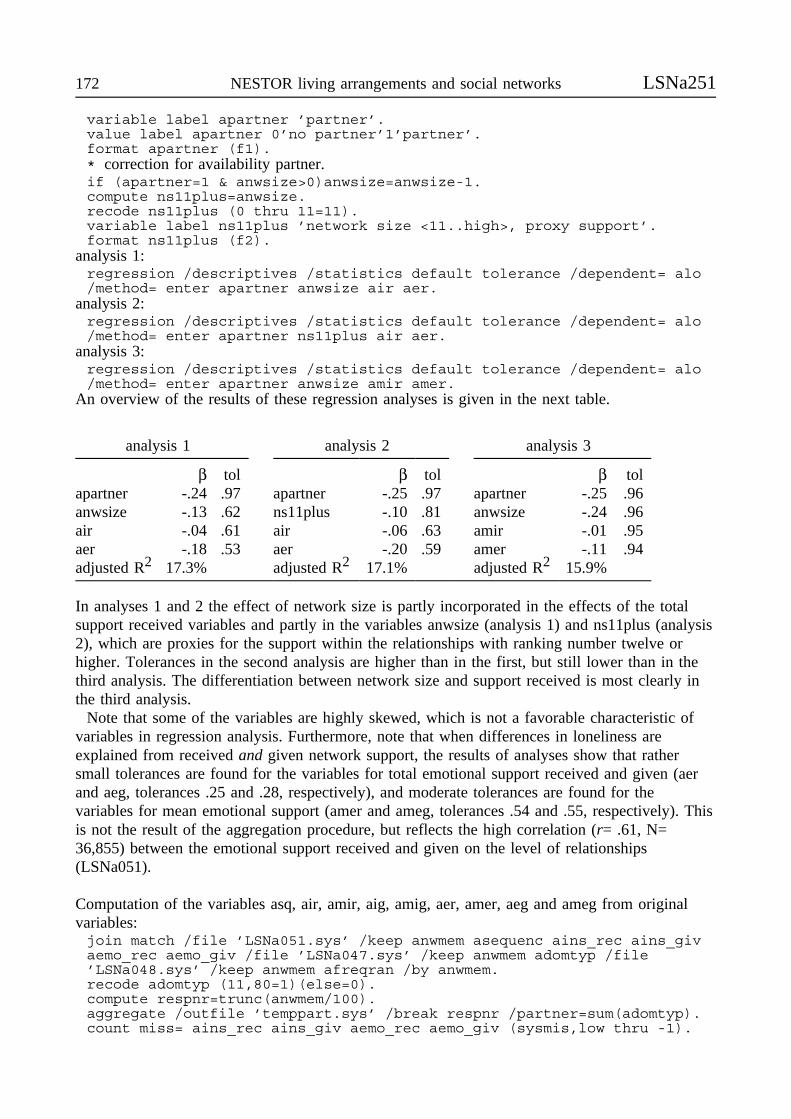
172 NESTOR living arrangements and social networks LSNa251
variable label apartner ’partner’.value label apartner 0’no partner’1’partner’.format apartner (f1).* correction for availability partner.if (apartner=1 & anwsize>0)anwsize=anwsize-1.compute ns11plus=anwsize.recode ns11plus (0 thru 11=11).variable label ns11plus ’network size <11..high>, proxy support’.format ns11plus (f2).
analysis 1:regression /descriptives /statistics default tolerance /dependent= alo/method= enter apartner anwsize air aer.
analysis 2:regression /descriptives /statistics default tolerance /dependent= alo/method= enter apartner ns11plus air aer.
analysis 3:regression /descriptives /statistics default tolerance /dependent= alo/method= enter apartner anwsize amir amer.
An overview of the results of these regression analyses is given in the next table.
analysis 1 analysis 2 analysis 3
β tol β tol β tolapartner -.24 .97 apartner -.25 .97 apartner -.25 .96anwsize -.13 .62 ns11plus -.10 .81 anwsize -.24 .96air -.04 .61 air -.06 .63 amir -.01 .95aer -.18 .53 aer -.20 .59 amer -.11 .94adjusted R2 17.3% adjusted R2 17.1% adjusted R2 15.9%
In analyses 1 and 2 the effect of network size is partly incorporated in the effects of the totalsupport received variables and partly in the variables anwsize (analysis 1) and ns11plus (analysis2), which are proxies for the support within the relationships with ranking number twelve orhigher. Tolerances in the second analysis are higher than in the first, but still lower than in thethird analysis. The differentiation between network size and support received is most clearly inthe third analysis.
Note that some of the variables are highly skewed, which is not a favorable characteristic ofvariables in regression analysis. Furthermore, note that when differences in loneliness areexplained from received and given network support, the results of analyses show that rathersmall tolerances are found for the variables for total emotional support received and given (aerand aeg, tolerances .25 and .28, respectively), and moderate tolerances are found for thevariables for mean emotional support (amer and ameg, tolerances .54 and .55, respectively). Thisis not the result of the aggregation procedure, but reflects the high correlation (r= .61, N=36,855) between the emotional support received and given on the level of relationships(LSNa051).
Computation of the variables asq, air, amir, aig, amig, aer, amer, aeg and ameg from originalvariables:join match /file ’LSNa051.sys’ /keep anwmem asequenc ains_rec ains_givaemo_rec aemo_giv /file ’LSNa047.sys’ /keep anwmem adomtyp /file’LSNa048.sys’ /keep anwmem afreqran /by anwmem.recode adomtyp (11,80=1)(else=0).compute respnr=trunc(anwmem/100).aggregate /outfile ’temppart.sys’ /break respnr /partner=sum(adomtyp).count miss= ains_rec ains_giv aemo_rec aemo_giv (sysmis,low thru -1).
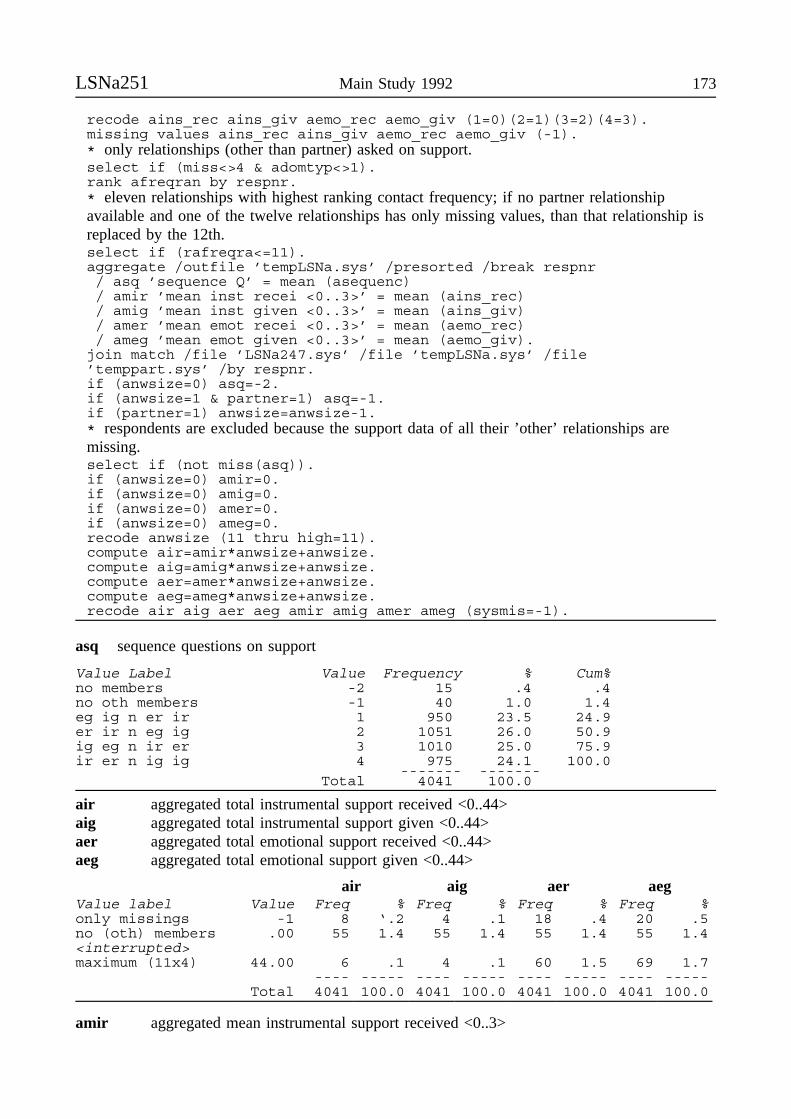
LSNa251 Main Study 1992 173
recode ains_rec ains_giv aemo_rec aemo_giv (1=0)(2=1)(3=2)(4=3).missing values ains_rec ains_giv aemo_rec aemo_giv (-1).* only relationships (other than partner) asked on support.select if (miss<>4 & adomtyp<>1).rank afreqran by respnr.* eleven relationships with highest ranking contact frequency; if no partner relationshipavailable and one of the twelve relationships has only missing values, than that relationship isreplaced by the 12th.select if (rafreqra<=11).aggregate /outfile ’tempLSNa.sys’ /presorted /break respnr/ asq ’sequence Q’ = mean (asequenc)/ amir ’mean inst recei <0..3>’ = mean (ains_rec)/ amig ’mean inst given <0..3>’ = mean (ains_giv)/ amer ’mean emot recei <0..3>’ = mean (aemo_rec)/ ameg ’mean emot given <0..3>’ = mean (aemo_giv).
join match /file ’LSNa247.sys’ /file ’tempLSNa.sys’ /file’temppart.sys’ /by respnr.if (anwsize=0) asq=-2.if (anwsize=1 & partner=1) asq=-1.if (partner=1) anwsize=anwsize-1.* respondents are excluded because the support data of all their ’other’ relationships aremissing.select if (not miss(asq)).if (anwsize=0) amir=0.if (anwsize=0) amig=0.if (anwsize=0) amer=0.if (anwsize=0) ameg=0.recode anwsize (11 thru high=11).compute air=amir*anwsize+anwsize.compute aig=amig*anwsize+anwsize.compute aer=amer*anwsize+anwsize.compute aeg=ameg*anwsize+anwsize.recode air aig aer aeg amir amig amer ameg (sysmis=-1).
asq sequence questions on support
Value Label Value Frequency % Cum%no members -2 15 .4 .4no oth members -1 40 1.0 1.4eg ig n er ir 1 950 23.5 24.9er ir n eg ig 2 1051 26.0 50.9ig eg n ir er 3 1010 25.0 75.9ir er n ig ig 4 975 24.1 100.0
------- -------Total 4041 100.0
air aggregated total instrumental support received <0..44>aig aggregated total instrumental support given <0..44>aer aggregated total emotional support received <0..44>aeg aggregated total emotional support given <0..44>
air aig aer aegValue label Value Freq % Freq % Freq % Freq %only missings -1 8 ‘.2 4 .1 18 .4 20 .5no (oth) members .00 55 1.4 55 1.4 55 1.4 55 1.4<interrupted>maximum (11x4) 44.00 6 .1 4 .1 60 1.5 69 1.7
---- ----- ---- ----- ---- ----- ---- -----Total 4041 100.0 4041 100.0 4041 100.0 4041 100.0
amir aggregated mean instrumental support received <0..3>

174 NESTOR living arrangements and social networks LSNa251
amig aggregated mean instrumental support given <0..3>amer aggregated mean emotional support received <0..3>ameg aggregated mean emotional support given <0..3>
amir amig amer amegValue label Value Freq % Freq % Freq % Freq %only missings -1 8 .2 4 .1 18 .4 20 .5no members/never .00 1091 27.0 1751 43.3 493 12.1 570 14.6<interrupted>often 3.00 57 1.4 25 .6 190 4.7 208 5.1
---- ----- ---- ----- ---- ----- ---- -----Total 4041 100.0 4041 100.0 4041 100.0 4041 100.0
In the LASA survey a maximum of ten relationships were studied in the support section of thequestionnaire. The next variables are computed following the same procedure as used for theprevious variables and are comparable with the variables in the LASA study.
air_9 aggregated total instrumental support received <0..36, LASA>aig_9 aggregated total instrumental support given <0..36, LASA>aer_9 aggregated total emotional support received <0..36, LASA>aeg_9 aggregated total emotional support given <0..36, LASA>
air_9 aig_9 aer_9 aeg_9Value label Value Freq % Freq % Freq % Freq %only missings -1 9 .2 4 .1 18 .4 20 .5no (oth) members .00 55 1.4 55 1.4 55 1.4 55 1.4<interrupted>maximum (9x4) 36.00 10 .2 5 .1 98 2.4 100 2.5
---- ----- ---- ----- ---- ----- ---- -----Total 4041 100.0 4041 100.0 4041 100.0 4041 100.0
amir_9 aggregated mean instrumental support received <0..3, LASA>amig_9 aggregated mean instrumental support given <0..3, LASA>amer_9 aggregated mean emotional support received <0..3, LASA>ameg_9 aggregated mean emotional support given <0..3, LASA>
amir_9 amig_9 amer_9 ameg_9Value label Value Freq % Freq % Freq % Freq %only missings -1 9 .2 4 .1 18 .4 20 .5no members/never .00 1110 27.4 1768 43.7 500 12.3 576 14.2<interrupted>often 3.00 59 1.5 26 .6 205 5.1 222 5.5
---- ----- ---- ----- ---- ----- ---- -----Total 4041 100.0 4041 100.0 4041 100.0 4041 100.0
LSNa055N: 1,548Data about: asking addresses network membersData source: Respondent face to face interviewOther files about same topic: LSNg055Questionnaire: naSelection of respondents: network size greater than 0, random sampleIdentification variable: RESPNR

LSNa055 Main Study 1992 175
A selected number of respondents were asked whether they are willing to provide the names andaddresses of a maximum of eight of their "top twelve" network members.
anwcoop result asking cooperation network study
As you know, this study focuses on the livingsituation and the social ties of older adults. Wehave already asked you a number of questionsabout your situation, and more questions willfollow. However, in order to obtain a morecomplete picture of your living situation andsocial ties, we would like to also put a numberof questions to (some of) the people you justnominated. More particularly, it would concernthe following individuals: .. We would, forexample, like to ask them about thecomposition of their families, and about theirdaily activities. We would also like to ask anumber of questions about their social ties.
In dit onderzoek zijn we geïnteresseerd in deleefsituatie en de sociale contacten vanouderen. We hebben reeds een aantal vragenover uw situatie gesteld, en er zullen nogmeer vragen volgen. Om goed geïnformeerdte zijn over uw leefsituatie en uw socialecontacten vinden wij het belangrijk ook eenaantal vragen te stellen aan (een aantal van)de personen die u zojuist genoemd heeft. Hetgaat om de volgende personen: .. Van henwillen we bijvoorbeeld weten hoe hun gezinis samengesteld, en wat voor activiteiten zijdoen. Ook willen we vragen stellen over hunsociale contacten.
Our intention is to send them a questionnairewhich they can fill in at home. It takes under30 minutes to complete this task. Naturally, asis the case with the answers you have given,the information they provide will be treatedconfidentially, and will not be passed on tothird parties. You will receive a questionnairewith roughly similar questions at the same timethat they will be approached. That questionnairecontains a number of questions that aredifferent from the ones I am asking you today,and provides you with the opportunity to befully informed about what follows in this study.
Het is de bedoeling hen een vragenlijst testuren welke zij thuis kunnen invullen. Hetinvullen van deze lijst duurt een klein halfuur. Evenals dat met de door u gegeven ant-woorden het geval is, zullen de gegevens diezij verstrekken vertrouwelijk blijven, en dusniet aan u of aan anderen doorgegeven wor-den. Wel zullen we, wanneer we hen schrif-telijk benaderen, ook u een vragenlijsttoezenden die ongeveer dezelfde vragen be-vat als de lijst die we aan hen toezenden. Westellen u dan een aantal vragen die ikvandaag niet gesteld heb, en u bent dan ookvolledig op de hoogte van het verdere ver-loop van dit onderzoek.
In the letter accompanying the questionnaire,we will mention that you have made it possiblefor us to contact them. Of course, it is up tothem to decide for themselves whether or notthey wish to respond. At this point I would liketo ask you: (under what conditions) are youwilling to participate in this part of the study?
In de brief die zij zullen krijgen, zalmeegedeeld worden dat hun deelname aanhet onderzoek mogelijk is doordat u deadressen aan ons gegeven heeft. Hun deel-name aan het onderzoek is uiteraard vrij-willig. (Onder welke voorwaarden) bent ubereid aan dit deel van het onderzoek mee tewerken?
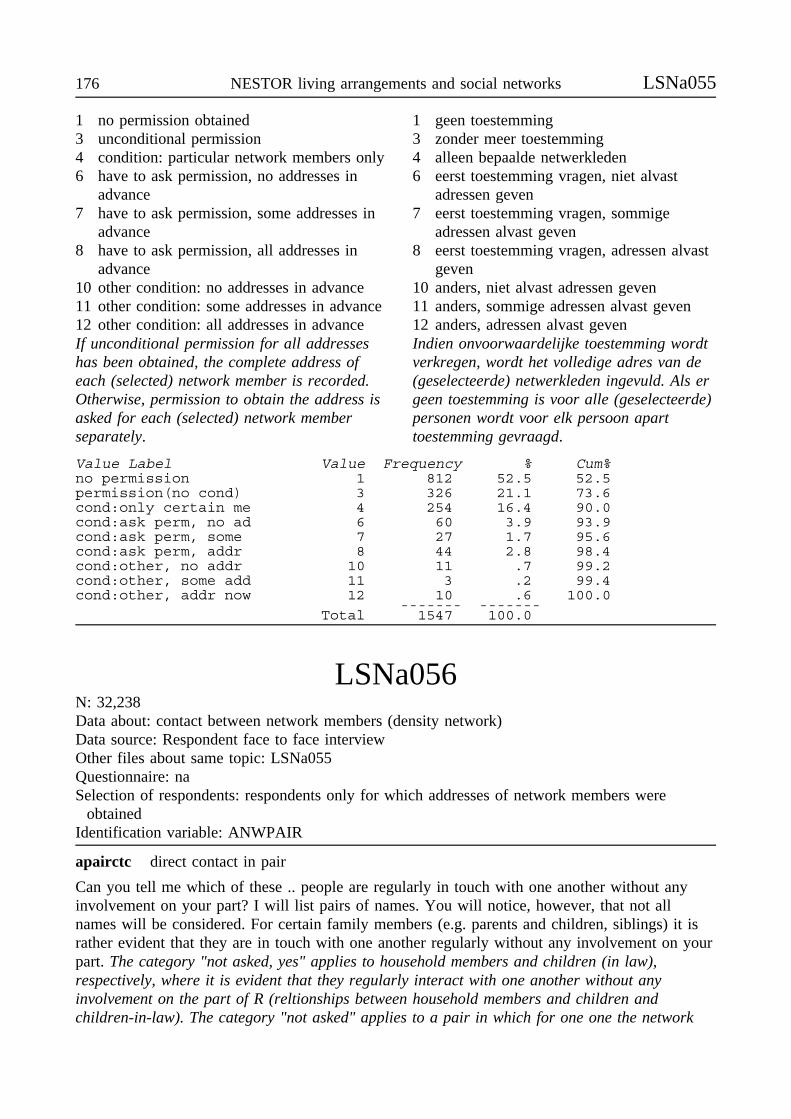
176 NESTOR living arrangements and social networks LSNa055
1 no permission obtained3 unconditional permission4 condition: particular network members only6 have to ask permission, no addresses in
advance7 have to ask permission, some addresses in
advance8 have to ask permission, all addresses in
advance10 other condition: no addresses in advance11 other condition: some addresses in advance12 other condition: all addresses in advance
1 geen toestemming3 zonder meer toestemming4 alleen bepaalde netwerkleden6 eerst toestemming vragen, niet alvast
adressen geven7 eerst toestemming vragen, sommige
adressen alvast geven8 eerst toestemming vragen, adressen alvast
geven10 anders, niet alvast adressen geven11 anders, sommige adressen alvast geven12 anders, adressen alvast geven
If unconditional permission for all addresseshas been obtained, the complete address ofeach (selected) network member is recorded.Otherwise, permission to obtain the address isasked for each (selected) network memberseparately.
Indien onvoorwaardelijke toestemming wordtverkregen, wordt het volledige adres van de(geselecteerde) netwerkleden ingevuld. Als ergeen toestemming is voor alle (geselecteerde)personen wordt voor elk persoon aparttoestemming gevraagd.
Value Label Value Frequency % Cum%no permission 1 812 52.5 52.5permission(no cond) 3 326 21.1 73.6cond:only certain me 4 254 16.4 90.0cond:ask perm, no ad 6 60 3.9 93.9cond:ask perm, some 7 27 1.7 95.6cond:ask perm, addr 8 44 2.8 98.4cond:other, no addr 10 11 .7 99.2cond:other, some add 11 3 .2 99.4cond:other, addr now 12 10 .6 100.0
------- -------Total 1547 100.0
LSNa056N: 32,238Data about: contact between network members (density network)Data source: Respondent face to face interviewOther files about same topic: LSNa055Questionnaire: naSelection of respondents: respondents only for which addresses of network members were
obtainedIdentification variable: ANWPAIR
apairctc direct contact in pair
Can you tell me which of these .. people are regularly in touch with one another without anyinvolvement on your part? I will list pairs of names. You will notice, however, that not allnames will be considered. For certain family members (e.g. parents and children, siblings) it israther evident that they are in touch with one another regularly without any involvement on yourpart. The category "not asked, yes" applies to household members and children (in law),respectively, where it is evident that they regularly interact with one another without anyinvolvement on the part of R (reltionships between household members and children andchildren-in-law). The category "not asked" applies to a pair in which for one one the network
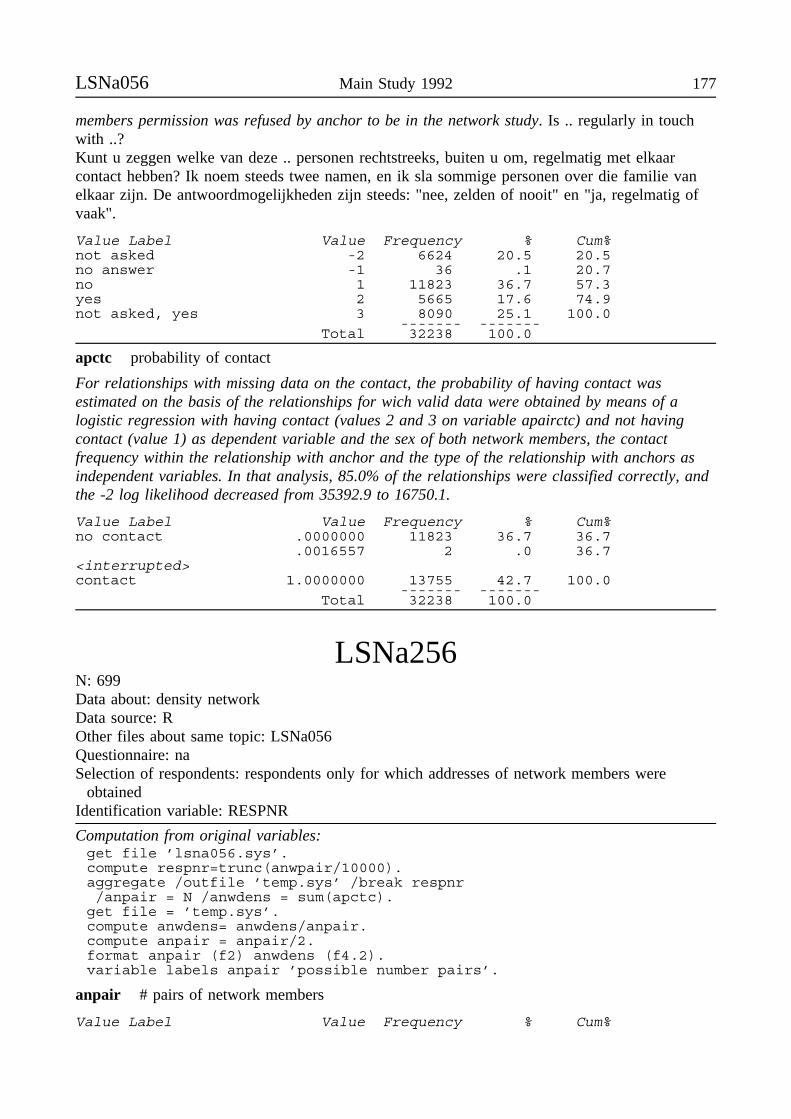
LSNa056 Main Study 1992 177
members permission was refused by anchor to be in the network study. Is .. regularly in touchwith ..?Kunt u zeggen welke van deze .. personen rechtstreeks, buiten u om, regelmatig met elkaarcontact hebben? Ik noem steeds twee namen, en ik sla sommige personen over die familie vanelkaar zijn. De antwoordmogelijkheden zijn steeds: "nee, zelden of nooit" en "ja, regelmatig ofvaak".
Value Label Value Frequency % Cum%not asked -2 6624 20.5 20.5no answer -1 36 .1 20.7no 1 11823 36.7 57.3yes 2 5665 17.6 74.9not asked, yes 3 8090 25.1 100.0
------- -------Total 32238 100.0
apctc probability of contact
For relationships with missing data on the contact, the probability of having contact wasestimated on the basis of the relationships for wich valid data were obtained by means of alogistic regression with having contact (values 2 and 3 on variable apairctc) and not havingcontact (value 1) as dependent variable and the sex of both network members, the contactfrequency within the relationship with anchor and the type of the relationship with anchors asindependent variables. In that analysis, 85.0% of the relationships were classified correctly, andthe -2 log likelihood decreased from 35392.9 to 16750.1.
Value Label Value Frequency % Cum%no contact .0000000 11823 36.7 36.7
.0016557 2 .0 36.7<interrupted>contact 1.0000000 13755 42.7 100.0
------- -------Total 32238 100.0
LSNa256N: 699Data about: density networkData source: ROther files about same topic: LSNa056Questionnaire: naSelection of respondents: respondents only for which addresses of network members were
obtainedIdentification variable: RESPNR
Computation from original variables:get file ’lsna056.sys’.compute respnr=trunc(anwpair/10000).aggregate /outfile ’temp.sys’ /break respnr/anpair = N /anwdens = sum(apctc).get file = ’temp.sys’.compute anwdens= anwdens/anpair.compute anpair = anpair/2.format anpair (f2) anwdens (f4.2).variable labels anpair ’possible number pairs’.
anpair # pairs of network members
Value Label Value Frequency % Cum%
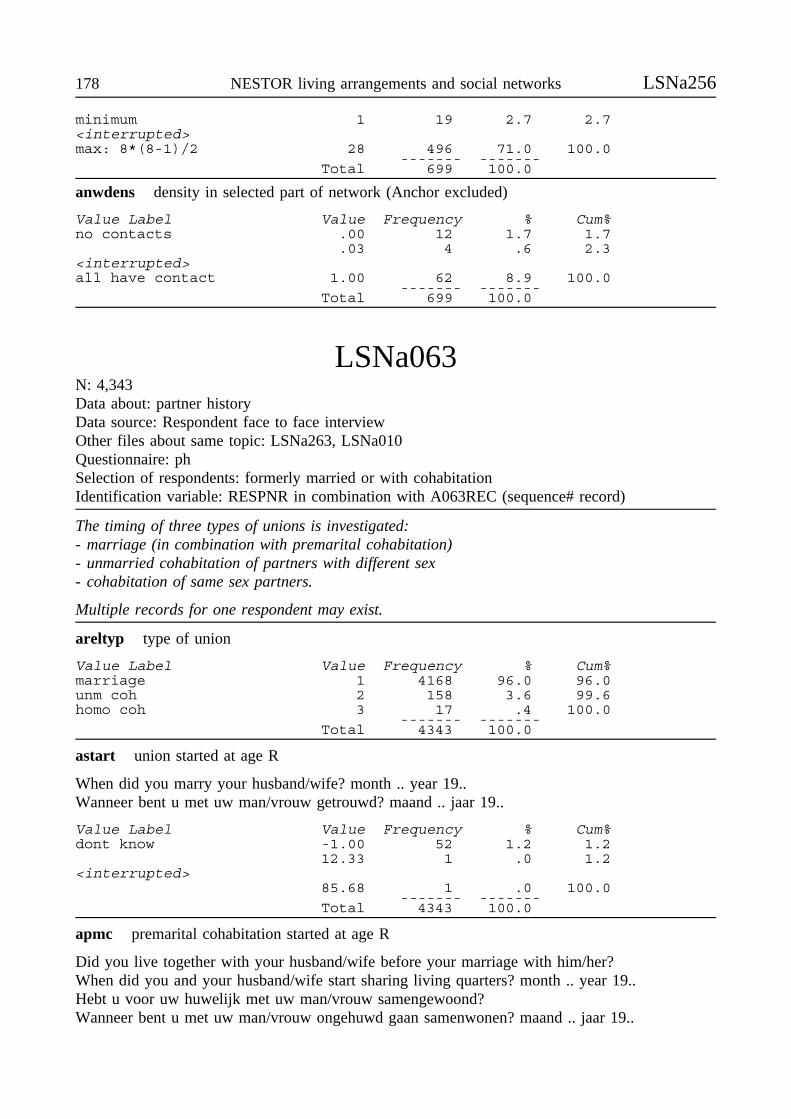
178 NESTOR living arrangements and social networks LSNa256
minimum 1 19 2.7 2.7<interrupted>max: 8*(8-1)/2 28 496 71.0 100.0
------- -------Total 699 100.0
anwdens density in selected part of network (Anchor excluded)
Value Label Value Frequency % Cum%no contacts .00 12 1.7 1.7
.03 4 .6 2.3<interrupted>all have contact 1.00 62 8.9 100.0
------- -------Total 699 100.0
LSNa063N: 4,343Data about: partner historyData source: Respondent face to face interviewOther files about same topic: LSNa263, LSNa010Questionnaire: phSelection of respondents: formerly married or with cohabitationIdentification variable: RESPNR in combination with A063REC (sequence# record)
The timing of three types of unions is investigated:- marriage (in combination with premarital cohabitation)- unmarried cohabitation of partners with different sex- cohabitation of same sex partners.
Multiple records for one respondent may exist.
areltyp type of union
Value Label Value Frequency % Cum%marriage 1 4168 96.0 96.0unm coh 2 158 3.6 99.6homo coh 3 17 .4 100.0
------- -------Total 4343 100.0
astart union started at age R
When did you marry your husband/wife? month .. year 19..Wanneer bent u met uw man/vrouw getrouwd? maand .. jaar 19..
Value Label Value Frequency % Cum%dont know -1.00 52 1.2 1.2
12.33 1 .0 1.2<interrupted>
85.68 1 .0 100.0------- -------
Total 4343 100.0
apmc premarital cohabitation started at age R
Did you live together with your husband/wife before your marriage with him/her?When did you and your husband/wife start sharing living quarters? month .. year 19..Hebt u voor uw huwelijk met uw man/vrouw samengewoond?Wanneer bent u met uw man/vrouw ongehuwd gaan samenwonen? maand .. jaar 19..
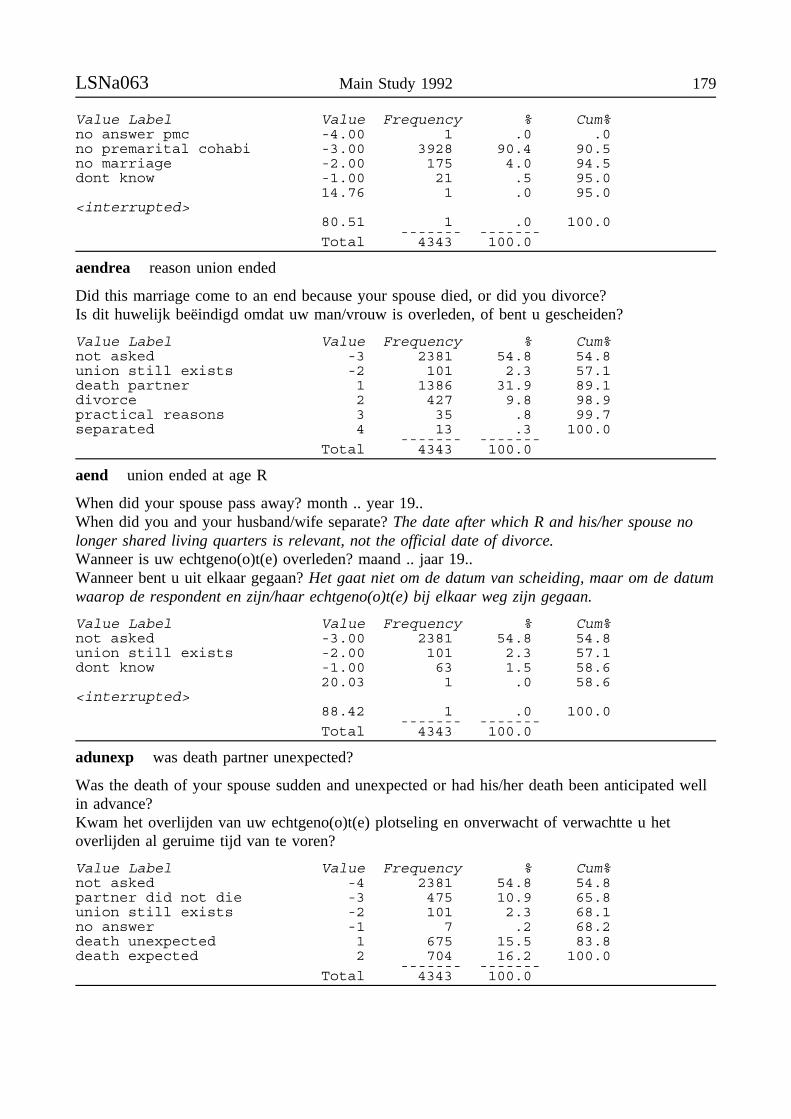
LSNa063 Main Study 1992 179
Value Label Value Frequency % Cum%no answer pmc -4.00 1 .0 .0no premarital cohabi -3.00 3928 90.4 90.5no marriage -2.00 175 4.0 94.5dont know -1.00 21 .5 95.0
14.76 1 .0 95.0<interrupted>
80.51 1 .0 100.0------- -------
Total 4343 100.0
aendrea reason union ended
Did this marriage come to an end because your spouse died, or did you divorce?Is dit huwelijk beëindigd omdat uw man/vrouw is overleden, of bent u gescheiden?
Value Label Value Frequency % Cum%not asked -3 2381 54.8 54.8union still exists -2 101 2.3 57.1death partner 1 1386 31.9 89.1divorce 2 427 9.8 98.9practical reasons 3 35 .8 99.7separated 4 13 .3 100.0
------- -------Total 4343 100.0
aend union ended at age R
When did your spouse pass away? month .. year 19..When did you and your husband/wife separate? The date after which R and his/her spouse nolonger shared living quarters is relevant, not the official date of divorce.Wanneer is uw echtgeno(o)t(e) overleden? maand .. jaar 19..Wanneer bent u uit elkaar gegaan? Het gaat niet om de datum van scheiding, maar om de datumwaarop de respondent en zijn/haar echtgeno(o)t(e) bij elkaar weg zijn gegaan.
Value Label Value Frequency % Cum%not asked -3.00 2381 54.8 54.8union still exists -2.00 101 2.3 57.1dont know -1.00 63 1.5 58.6
20.03 1 .0 58.6<interrupted>
88.42 1 .0 100.0------- -------
Total 4343 100.0
adunexp was death partner unexpected?
Was the death of your spouse sudden and unexpected or had his/her death been anticipated wellin advance?Kwam het overlijden van uw echtgeno(o)t(e) plotseling en onverwacht of verwachtte u hetoverlijden al geruime tijd van te voren?
Value Label Value Frequency % Cum%not asked -4 2381 54.8 54.8partner did not die -3 475 10.9 65.8union still exists -2 101 2.3 68.1no answer -1 7 .2 68.2death unexpected 1 675 15.5 83.8death expected 2 704 16.2 100.0
------- -------Total 4343 100.0
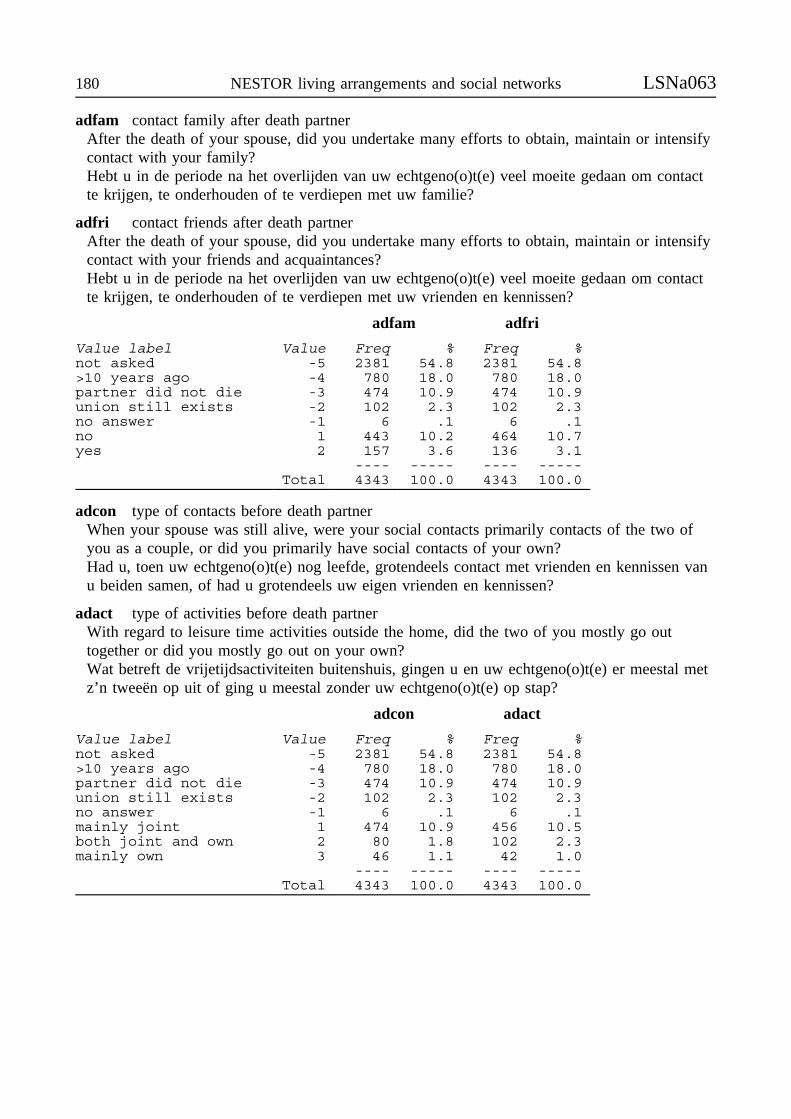
180 NESTOR living arrangements and social networks LSNa063
adfam contact family after death partnerAfter the death of your spouse, did you undertake many efforts to obtain, maintain or intensifycontact with your family?Hebt u in de periode na het overlijden van uw echtgeno(o)t(e) veel moeite gedaan om contactte krijgen, te onderhouden of te verdiepen met uw familie?
adfri contact friends after death partnerAfter the death of your spouse, did you undertake many efforts to obtain, maintain or intensifycontact with your friends and acquaintances?Hebt u in de periode na het overlijden van uw echtgeno(o)t(e) veel moeite gedaan om contactte krijgen, te onderhouden of te verdiepen met uw vrienden en kennissen?
adfam adfri
Value label Value Freq % Freq %not asked -5 2381 54.8 2381 54.8>10 years ago -4 780 18.0 780 18.0partner did not die -3 474 10.9 474 10.9union still exists -2 102 2.3 102 2.3no answer -1 6 .1 6 .1no 1 443 10.2 464 10.7yes 2 157 3.6 136 3.1
---- ----- ---- -----Total 4343 100.0 4343 100.0
adcon type of contacts before death partnerWhen your spouse was still alive, were your social contacts primarily contacts of the two ofyou as a couple, or did you primarily have social contacts of your own?Had u, toen uw echtgeno(o)t(e) nog leefde, grotendeels contact met vrienden en kennissen vanu beiden samen, of had u grotendeels uw eigen vrienden en kennissen?
adact type of activities before death partnerWith regard to leisure time activities outside the home, did the two of you mostly go outtogether or did you mostly go out on your own?Wat betreft de vrijetijdsactiviteiten buitenshuis, gingen u en uw echtgeno(o)t(e) er meestal metz’n tweeën op uit of ging u meestal zonder uw echtgeno(o)t(e) op stap?
adcon adact
Value label Value Freq % Freq %not asked -5 2381 54.8 2381 54.8>10 years ago -4 780 18.0 780 18.0partner did not die -3 474 10.9 474 10.9union still exists -2 102 2.3 102 2.3no answer -1 6 .1 6 .1mainly joint 1 474 10.9 456 10.5both joint and own 2 80 1.8 102 2.3mainly own 3 46 1.1 42 1.0
---- ----- ---- -----Total 4343 100.0 4343 100.0
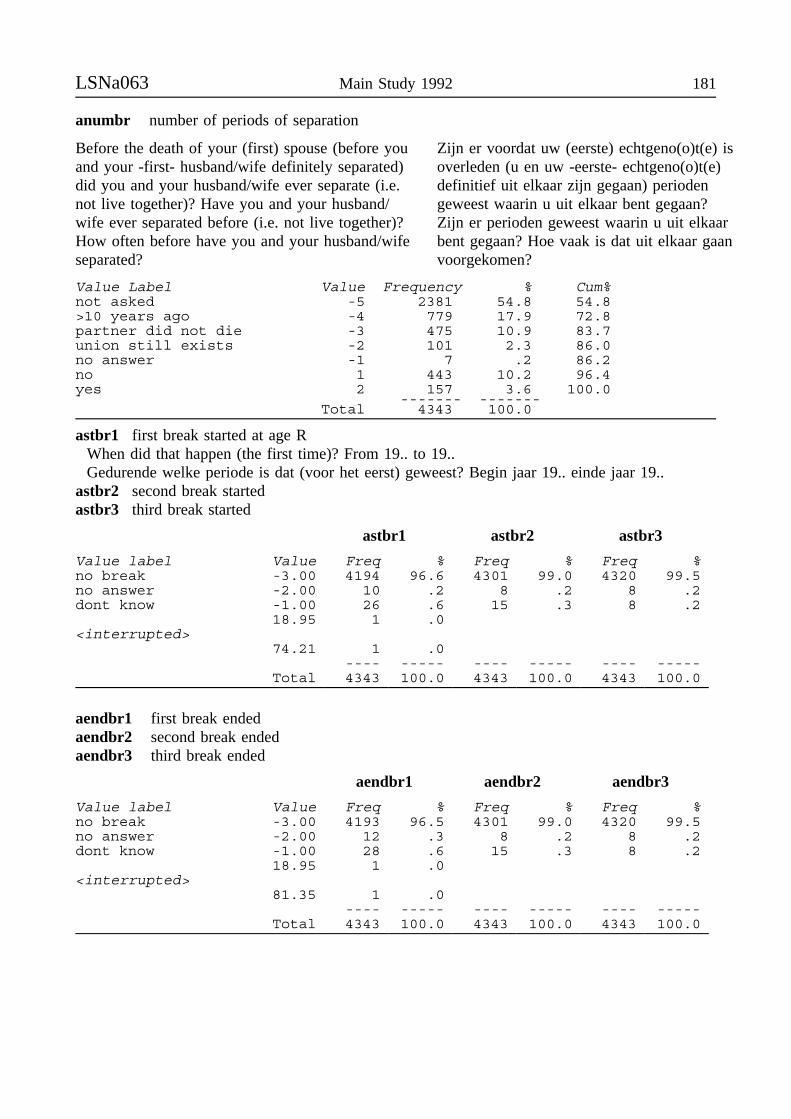
LSNa063 Main Study 1992 181
anumbr number of periods of separation
Before the death of your (first) spouse (before youand your -first- husband/wife definitely separated)did you and your husband/wife ever separate (i.e.not live together)? Have you and your husband/wife ever separated before (i.e. not live together)?How often before have you and your husband/wifeseparated?
Zijn er voordat uw (eerste) echtgeno(o)t(e) isoverleden (u en uw -eerste- echtgeno(o)t(e)definitief uit elkaar zijn gegaan) periodengeweest waarin u uit elkaar bent gegaan?Zijn er perioden geweest waarin u uit elkaarbent gegaan? Hoe vaak is dat uit elkaar gaanvoorgekomen?
Value Label Value Frequency % Cum%not asked -5 2381 54.8 54.8>10 years ago -4 779 17.9 72.8partner did not die -3 475 10.9 83.7union still exists -2 101 2.3 86.0no answer -1 7 .2 86.2no 1 443 10.2 96.4yes 2 157 3.6 100.0
------- -------Total 4343 100.0
astbr1 first break started at age RWhen did that happen (the first time)? From 19.. to 19..Gedurende welke periode is dat (voor het eerst) geweest? Begin jaar 19.. einde jaar 19..
astbr2 second break startedastbr3 third break started
astbr1 astbr2 astbr3
Value label Value Freq % Freq % Freq %no break -3.00 4194 96.6 4301 99.0 4320 99.5no answer -2.00 10 .2 8 .2 8 .2dont know -1.00 26 .6 15 .3 8 .2
18.95 1 .0<interrupted>
74.21 1 .0---- ----- ---- ----- ---- -----
Total 4343 100.0 4343 100.0 4343 100.0
aendbr1 first break endedaendbr2 second break endedaendbr3 third break ended
aendbr1 aendbr2 aendbr3
Value label Value Freq % Freq % Freq %no break -3.00 4193 96.5 4301 99.0 4320 99.5no answer -2.00 12 .3 8 .2 8 .2dont know -1.00 28 .6 15 .3 8 .2
18.95 1 .0<interrupted>
81.35 1 .0---- ----- ---- ----- ---- -----
Total 4343 100.0 4343 100.0 4343 100.0
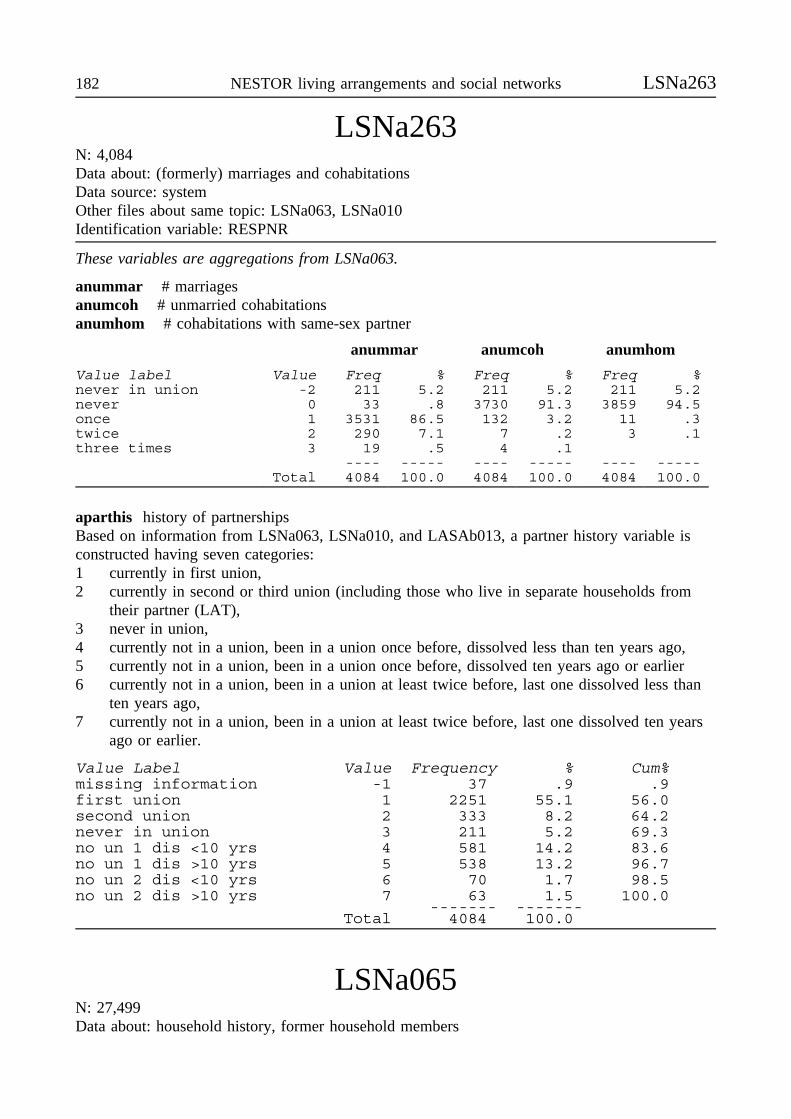
182 NESTOR living arrangements and social networks LSNa263
LSNa263N: 4,084Data about: (formerly) marriages and cohabitationsData source: systemOther files about same topic: LSNa063, LSNa010Identification variable: RESPNR
These variables are aggregations from LSNa063.
anummar # marriagesanumcoh # unmarried cohabitationsanumhom # cohabitations with same-sex partner
anummar anumcoh anumhom
Value label Value Freq % Freq % Freq %never in union -2 211 5.2 211 5.2 211 5.2never 0 33 .8 3730 91.3 3859 94.5once 1 3531 86.5 132 3.2 11 .3twice 2 290 7.1 7 .2 3 .1three times 3 19 .5 4 .1
---- ----- ---- ----- ---- -----Total 4084 100.0 4084 100.0 4084 100.0
aparthis history of partnershipsBased on information from LSNa063, LSNa010, and LASAb013, a partner history variable isconstructed having seven categories:1 currently in first union,2 currently in second or third union (including those who live in separate households from
their partner (LAT),3 never in union,4 currently not in a union, been in a union once before, dissolved less than ten years ago,5 currently not in a union, been in a union once before, dissolved ten years ago or earlier6 currently not in a union, been in a union at least twice before, last one dissolved less than
ten years ago,7 currently not in a union, been in a union at least twice before, last one dissolved ten years
ago or earlier.
Value Label Value Frequency % Cum%missing information -1 37 .9 .9first union 1 2251 55.1 56.0second union 2 333 8.2 64.2never in union 3 211 5.2 69.3no un 1 dis <10 yrs 4 581 14.2 83.6no un 1 dis >10 yrs 5 538 13.2 96.7no un 2 dis <10 yrs 6 70 1.7 98.5no un 2 dis >10 yrs 7 63 1.5 100.0
------- -------Total 4084 100.0
LSNa065N: 27,499Data about: household history, former household members

LSNa065 Main Study 1992 183
Data source: Respondent face to face interviewOther files about same topic: LSNa265, LSNa063Questionnaire: hhIdentification variables: RESPNR in combination with A065REC; ADEMID
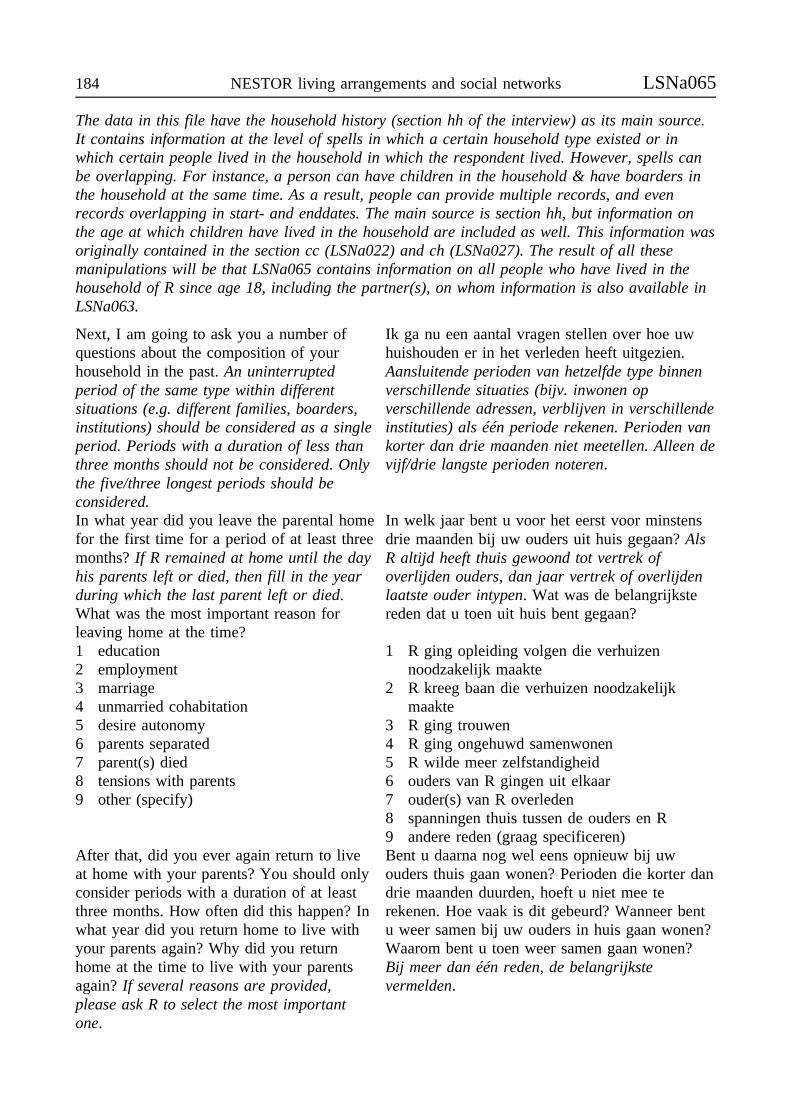
184 NESTOR living arrangements and social networks LSNa065
The data in this file have the household history (section hh of the interview) as its main source.It contains information at the level of spells in which a certain household type existed or inwhich certain people lived in the household in which the respondent lived. However, spells canbe overlapping. For instance, a person can have children in the household & have boarders inthe household at the same time. As a result, people can provide multiple records, and evenrecords overlapping in start- and enddates. The main source is section hh, but information onthe age at which children have lived in the household are included as well. This information wasoriginally contained in the section cc (LSNa022) and ch (LSNa027). The result of all thesemanipulations will be that LSNa065 contains information on all people who have lived in thehousehold of R since age 18, including the partner(s), on whom information is also available inLSNa063.
Next, I am going to ask you a number ofquestions about the composition of yourhousehold in the past. An uninterruptedperiod of the same type within differentsituations (e.g. different families, boarders,institutions) should be considered as a singleperiod. Periods with a duration of less thanthree months should not be considered. Onlythe five/three longest periods should beconsidered.
Ik ga nu een aantal vragen stellen over hoe uwhuishouden er in het verleden heeft uitgezien.Aansluitende perioden van hetzelfde type binnenverschillende situaties (bijv. inwonen opverschillende adressen, verblijven in verschillendeinstituties) als één periode rekenen. Perioden vankorter dan drie maanden niet meetellen. Alleen devijf/drie langste perioden noteren.
In what year did you leave the parental homefor the first time for a period of at least threemonths? If R remained at home until the dayhis parents left or died, then fill in the yearduring which the last parent left or died.What was the most important reason forleaving home at the time?
In welk jaar bent u voor het eerst voor minstensdrie maanden bij uw ouders uit huis gegaan? AlsR altijd heeft thuis gewoond tot vertrek ofoverlijden ouders, dan jaar vertrek of overlijdenlaatste ouder intypen. Wat was de belangrijkstereden dat u toen uit huis bent gegaan?
1 education2 employment3 marriage4 unmarried cohabitation5 desire autonomy6 parents separated7 parent(s) died8 tensions with parents9 other (specify)
1 R ging opleiding volgen die verhuizennoodzakelijk maakte
2 R kreeg baan die verhuizen noodzakelijkmaakte
3 R ging trouwen4 R ging ongehuwd samenwonen5 R wilde meer zelfstandigheid6 ouders van R gingen uit elkaar7 ouder(s) van R overleden8 spanningen thuis tussen de ouders en R9 andere reden (graag specificeren)
After that, did you ever again return to liveat home with your parents? You should onlyconsider periods with a duration of at leastthree months. How often did this happen? Inwhat year did you return home to live withyour parents again? Why did you returnhome at the time to live with your parentsagain? If several reasons are provided,please ask R to select the most importantone.
Bent u daarna nog wel eens opnieuw bij uwouders thuis gaan wonen? Perioden die korter dandrie maanden duurden, hoeft u niet mee terekenen. Hoe vaak is dit gebeurd? Wanneer bentu weer samen bij uw ouders in huis gaan wonen?Waarom bent u toen weer samen gaan wonen?Bij meer dan één reden, de belangrijkstevermelden.
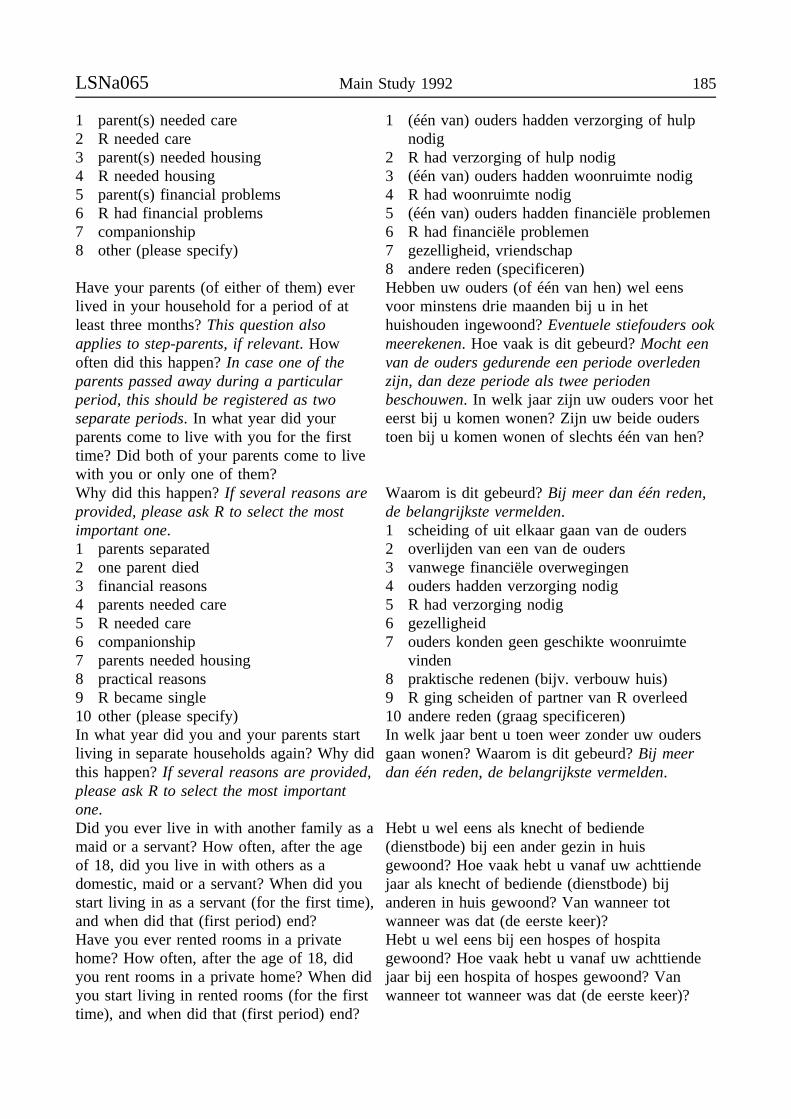
LSNa065 Main Study 1992 185
1 parent(s) needed care2 R needed care3 parent(s) needed housing4 R needed housing5 parent(s) financial problems6 R had financial problems7 companionship8 other (please specify)
1 (één van) ouders hadden verzorging of hulpnodig
2 R had verzorging of hulp nodig3 (één van) ouders hadden woonruimte nodig4 R had woonruimte nodig5 (één van) ouders hadden financiële problemen6 R had financiële problemen7 gezelligheid, vriendschap8 andere reden (specificeren)
Have your parents (of either of them) everlived in your household for a period of atleast three months? This question alsoapplies to step-parents, if relevant. Howoften did this happen? In case one of theparents passed away during a particularperiod, this should be registered as twoseparate periods. In what year did yourparents come to live with you for the firsttime? Did both of your parents come to livewith you or only one of them?
Hebben uw ouders (of één van hen) wel eensvoor minstens drie maanden bij u in hethuishouden ingewoond? Eventuele stiefouders ookmeerekenen. Hoe vaak is dit gebeurd? Mocht eenvan de ouders gedurende een periode overledenzijn, dan deze periode als twee periodenbeschouwen. In welk jaar zijn uw ouders voor heteerst bij u komen wonen? Zijn uw beide ouderstoen bij u komen wonen of slechts één van hen?
Why did this happen? If several reasons areprovided, please ask R to select the mostimportant one.1 parents separated2 one parent died3 financial reasons4 parents needed care5 R needed care6 companionship7 parents needed housing8 practical reasons9 R became single10 other (please specify)In what year did you and your parents startliving in separate households again? Why didthis happen? If several reasons are provided,please ask R to select the most importantone.
Waarom is dit gebeurd? Bij meer dan één reden,de belangrijkste vermelden.1 scheiding of uit elkaar gaan van de ouders2 overlijden van een van de ouders3 vanwege financiële overwegingen4 ouders hadden verzorging nodig5 R had verzorging nodig6 gezelligheid7 ouders konden geen geschikte woonruimte
vinden8 praktische redenen (bijv. verbouw huis)9 R ging scheiden of partner van R overleed10 andere reden (graag specificeren)In welk jaar bent u toen weer zonder uw oudersgaan wonen? Waarom is dit gebeurd? Bij meerdan één reden, de belangrijkste vermelden.
Did you ever live in with another family as amaid or a servant? How often, after the ageof 18, did you live in with others as adomestic, maid or a servant? When did youstart living in as a servant (for the first time),and when did that (first period) end?
Hebt u wel eens als knecht of bediende(dienstbode) bij een ander gezin in huisgewoond? Hoe vaak hebt u vanaf uw achttiendejaar als knecht of bediende (dienstbode) bijanderen in huis gewoond? Van wanneer totwanneer was dat (de eerste keer)?
Have you ever rented rooms in a privatehome? How often, after the age of 18, didyou rent rooms in a private home? When didyou start living in rented rooms (for the firsttime), and when did that (first period) end?
Hebt u wel eens bij een hospes of hospitagewoond? Hoe vaak hebt u vanaf uw achttiendejaar bij een hospita of hospes gewoond? Vanwanneer tot wanneer was dat (de eerste keer)?

186 NESTOR living arrangements and social networks LSNa065
Have you ever lived in residence (e.g. whileat college)? How often have you lived inresidence? When did you start living inresidence (for the first time), and when didthat (first period) end?
Hebt u wel eens in een studentenhuis gewoond?Hoe vaak hebt u in een studentenhuis gewoond?Van wanneer tot wanneer was dat (de eerstekeer)?
Have you ever had boarders? A "boarder" issomeone who is not a family member, butwho has lived in your home and paid forhis/her room and possibly for meals. Thisincludes lodgers. How often have you hadboarders? When did you start to haveboarders (for the first time), and when didthat (first period) end?
Hebt u wel eens kostgangers in huis gehad? Meteen "kostganger" bedoelen wij iemand die geenfamilie van u is, maar die bij u in huis heeftgewoond en voor de inwoning en eventueel dekost heeft betaald. Ook kamerverhuur valthieronder. Hoe vaak hebt u kostgangers gehad?Van wanneer tot wanneer was dat (de eerstekeer)?
In what follows, I will ask you a number ofquestions about each of these people withwhom you previously lived.
Ik ga nu een aantal vragen stellen voor dezepersonen waarmee u vroeger voor ten minste driemaanden hebt samengeleefd.
When did you and .. start sharing livingquarters (for the first time)? If R was livingwith .. before his/her 18th birthday, the yearduring which they started sharing livingquarters should be filled in. Did you everagain share living quarters with .. for aperiod of at least three months? When didyou and .. start sharing living quarters again?How often did this happen? Please onlyconsider periods with a duration of at leastthree months.
Wanneer bent u (voor het eerst) met .. in éénhuishouden gaan wonen? Als R al voor zijn/ haarachttiende verjaardag met .. hetzelfde huishoudenwoonde, dan het jaar van aanvang van diesamenleving noteren. Hebt u daarna nog vakerdrie maanden of langer met .. in hetzelfdehuishouden gewoond? Wanneer bent u opnieuwmet .. in één huishouden gaan wonen? Hoe vaakis dat nog gebeurd? Graag alleen perioden langerdan drie maanden meetellen.
In what year did .. leave home? If .. left theparental home more than once, this questionconcerns the first time that .. left. Militaryservice = living at home. If the child is nolonger alive (and died after the age of 15) thequestion is asked: Did .. leave home befores/he passed away? If so, in what year? Whendid .. leave home for the second time?
Wanneer is .. het huis uitgegaan? Als .. vaker danéén keer het ouderlijk huis heeft verlaten, dangaat het om de eerste keer dat .. uit huis ging.Militaire dienst = thuiswonend. Als het kind nietlanger in leven is (en gestorven is na het 15ejaar) dan wordt de vraag gesteld: Is .. nog hethuis uitgegaan, voordat hij/zij overleden is? Zo ja,in welk jaar? Wanneer is .. voor de tweede keerbij u uit het huishouden gegaan?
Why did you and .. begin to share livingquarters [again]?1 hm needed care2 R needed care3 hm needed lodging4 R needed lodging5 financial probl hm6 financial probl R7 companionship8 other reason (please specify)
Waarom bent u toen weer samen gaan wonen ?1 huishoudlid had verzorging of hulp nodig2 R had verzorging of hulp nodig3 huishoudlid had woonruimte nodig4 R had woonruimte nodig5 huishoudlid had financiële problemen6 R had financiële problemen7 gezelligheid, vriendschap8 andere reden (specificeren)
Why did you [R and child] start living againin the same household? Please indicate themost important reason.
Waarom zijn .. en u [toen weer] in éénhuishouden gaan wonen? Bij meer dan één reden,de belangrijkste vermelden.

LSNa065 Main Study 1992 187
When did you and .. stop sharing livingquarters? Why did .. leave home at the firsttime? Please indicate the most importantreason. Why did this happen then?
Wanneer zijn .. en u weer apart gaan wonen?Waarom ging .. toen het huis uit? Bij meer danéén reden, de belangrijkste vermelden. Waarom isdit toen gebeurd?
1 job/education hm or R2 cohab/marr hm or R3 quarrels between hm and R4 no longer need care hm or R5 no longer fin probl hm or R6 hm or R got own house7 hm or R needed special housing8 hm had financial probl9 R had financial probl10 hm had insufficient space11 R had insufficient space12 hm died13 other (specify)
1 baan of opleiding van hhlid of R2 huwelijk of samenwoning van hhlid of R3 spanningen tussen hhlid en R4 hhlid of R hadden geen speciale verzorging
meer nodig5 hhlid of R hadden geen financiële problemen
meer6 hhlid of R kreeg eigen woonruimte7 hhlid of R had speciale woonruimte nodig8 hhlid had financiële problemen9 R had financiële problemen10 hhlid had onvoldoende woonruimte11 R had onvoldoende woonruimte12 hhlid stierf13 andere reden (specificeren)
Next, I will name five kinds of institutionsinto which people can be admitted for longerperiods of time. After the age of 18, did youstay in any of these institutions for a periodof at least three months? If so, in whichinstitution? The current period of residenceshould not be taken into consideration.
Ik noem zo dadelijk vijf instellingen waar mensenlangere tijd kunnen verblijven. Heeft u in één ofmeer van deze instellingen na uw achttiende jaarten minste drie maanden aaneengeslotenverbleven, en zo ja, welke? Huidige situatie nietmeerekenen.
How often, after the age of 18, have youstayed in a nursing home? When did youenter a nursing home (the first time), andwhen did you leave (the first time)?
Hoe vaak hebt u na uw achttiende jaar in eenverpleegtehuis verbleven? Van wanneer totwanneer was dat (de eerste keer)?
How often, after the age of 18, have youstayed in an old people’s home? When didyou start living in an old people’s home (forthe first time), and when did that (firstperiod) end?
Hoe vaak hebt u na uw achttiende jaar in eenverzorgingstehuis verbleven? Van wanneer totwanneer was dat (de eerste keer)?
How often, after the age of 18, have youstayed in a mental hospital? When did youenter a mental hospital (the first time), andwhen did you leave (the first time)?
Hoe vaak hebt u na uw achttiende jaar in eenpsychiatrische inrichting verbleven? Van wanneertot wanneer was dat (de eerste keer)?
How often, after the age of 18, have youstayed in a hospital or other healthinstitution? When did you enter hospital oranother health institution (the first time), andwhen did leave (the first time)?
Hoe vaak hebt u na uw achttiende jaar in eenziekenhuis of ander tehuis verbleven? Vanwanneer tot wanneer was dat (de eerste keer)?
How often, after the age of 18, have youspent time in prison? When did you go toprison (the first time), and when did youleave that institution (the first time)?
Hoe vaak hebt u na uw achttiende jaar in eenstrafinrichting verbleven? Van wanneer totwanneer was dat (de eerste keer)?
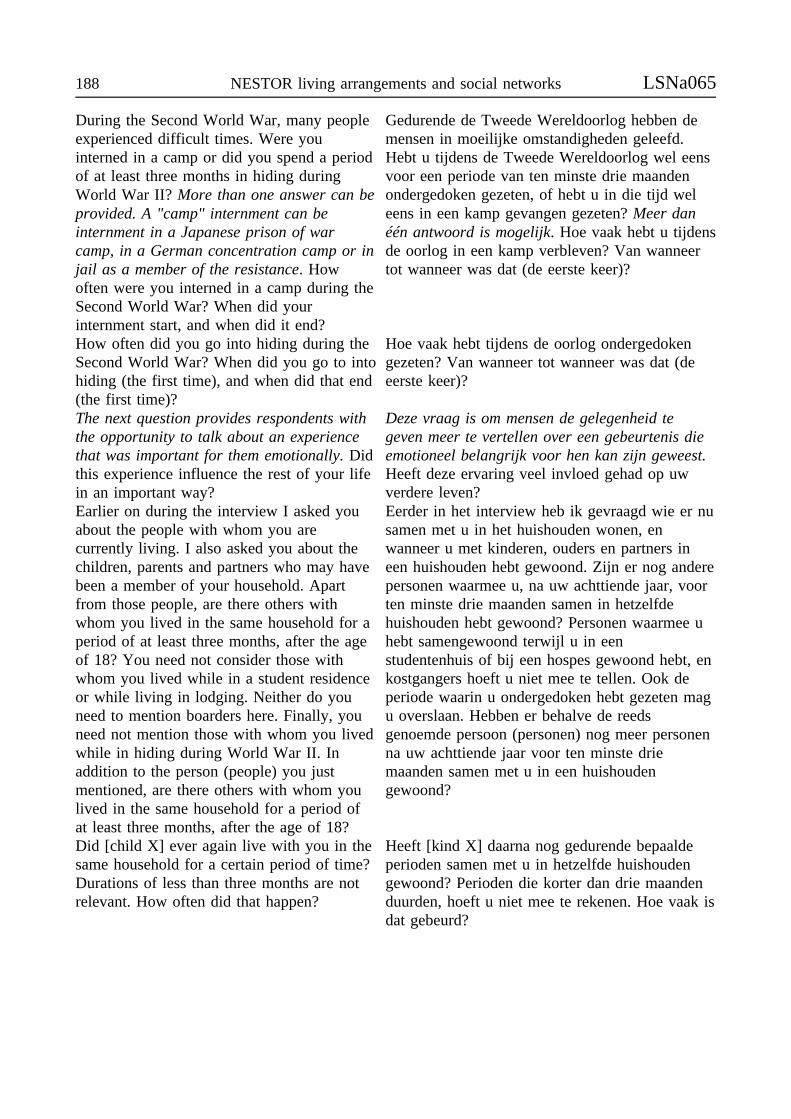
188 NESTOR living arrangements and social networks LSNa065
During the Second World War, many peopleexperienced difficult times. Were youinterned in a camp or did you spend a periodof at least three months in hiding duringWorld War II? More than one answer can beprovided. A "camp" internment can beinternment in a Japanese prison of warcamp, in a German concentration camp or injail as a member of the resistance. Howoften were you interned in a camp during theSecond World War? When did yourinternment start, and when did it end?
Gedurende de Tweede Wereldoorlog hebben demensen in moeilijke omstandigheden geleefd.Hebt u tijdens de Tweede Wereldoorlog wel eensvoor een periode van ten minste drie maandenondergedoken gezeten, of hebt u in die tijd weleens in een kamp gevangen gezeten? Meer danéén antwoord is mogelijk. Hoe vaak hebt u tijdensde oorlog in een kamp verbleven? Van wanneertot wanneer was dat (de eerste keer)?
How often did you go into hiding during theSecond World War? When did you go to intohiding (the first time), and when did that end(the first time)?
Hoe vaak hebt tijdens de oorlog ondergedokengezeten? Van wanneer tot wanneer was dat (deeerste keer)?
The next question provides respondents withthe opportunity to talk about an experiencethat was important for them emotionally. Didthis experience influence the rest of your lifein an important way?
Deze vraag is om mensen de gelegenheid tegeven meer te vertellen over een gebeurtenis dieemotioneel belangrijk voor hen kan zijn geweest.Heeft deze ervaring veel invloed gehad op uwverdere leven?
Earlier on during the interview I asked youabout the people with whom you arecurrently living. I also asked you about thechildren, parents and partners who may havebeen a member of your household. Apartfrom those people, are there others withwhom you lived in the same household for aperiod of at least three months, after the ageof 18? You need not consider those withwhom you lived while in a student residenceor while living in lodging. Neither do youneed to mention boarders here. Finally, youneed not mention those with whom you livedwhile in hiding during World War II. Inaddition to the person (people) you justmentioned, are there others with whom youlived in the same household for a period ofat least three months, after the age of 18?
Eerder in het interview heb ik gevraagd wie er nusamen met u in het huishouden wonen, enwanneer u met kinderen, ouders en partners ineen huishouden hebt gewoond. Zijn er nog anderepersonen waarmee u, na uw achttiende jaar, voorten minste drie maanden samen in hetzelfdehuishouden hebt gewoond? Personen waarmee uhebt samengewoond terwijl u in eenstudentenhuis of bij een hospes gewoond hebt, enkostgangers hoeft u niet mee te tellen. Ook deperiode waarin u ondergedoken hebt gezeten magu overslaan. Hebben er behalve de reedsgenoemde persoon (personen) nog meer personenna uw achttiende jaar voor ten minste driemaanden samen met u in een huishoudengewoond?
Did [child X] ever again live with you in thesame household for a certain period of time?Durations of less than three months are notrelevant. How often did that happen?
Heeft [kind X] daarna nog gedurende bepaaldeperioden samen met u in hetzelfde huishoudengewoond? Perioden die korter dan drie maandenduurden, hoeft u niet mee te rekenen. Hoe vaak isdat gebeurd?

LSNa065 Main Study 1992 189
For current household members, other than thespouse or children: Is .. a male or a female? Inwhat year was .. born? Is .. a relative, orsomeone else? Since when have you and .. beensharing living quarters? 19.. If R and .. havelived together at different points in time, thequestion should be answered for the beginningof the most recent period. Why did you and ..begin to share living quarters?
Voor huidige huisgenoten, anders dan de partnerof kinderen: Is .. een man of een vrouw? In welkjaar is .. geboren? Is .. een familielid, of eenander? Sinds wanneer woont u met .. in éénhuishouden? 19.. Als R en .. gedurende meerperioden in een huishouden hebben gewoond,dan gaat het hier om het begin van de huidigeperiode. Waarom zijn .. en u in één huishoudengaan wonen?
Have you shared living quarters with .. before?Periods of coresidence with a duration of lessthan three months should not be considered.How often did this happen? When did you and.. begin to share living quarters for the firsttime? Why did you do that then? When did ..leave the home you were both living in? Whydid this happen then?
Heeft .. daarvoor al een vaker gedurende bepaal-de perioden bij u in het huishouden gewoond?Perioden die korter dan drie maanden duurden,hoeft u niet mee te rekenen. Hoe vaak is datgebeurd? Wanneer zijn .. en u voor het eerstsamen in één huishouden gaan wonen? Waarombent u dat toen gaan doen? Wanneer is .. toen biju uit het huishouden gegaan? Waarom is dit toengebeurd?
a065sour source of data
Records from source ph (partner history) are also available in LSNa063.
Value Label Value Frequency % Cum%ch 13176 47.9 47.9hc 518 1.9 49.8hh 9462 34.4 84.2ph 4343 15.8 100.0
------- -------Total 27499 100.0
a065type type of household recordValue Label Value Frequency % Cum%in parental home 1 5121 18.6 18.6partner 2 4349 15.8 34.4father 3 112 .4 34.8mother 4 183 .7 35.5both parents 5 84 .3 35.8son 6 6717 24.4 60.2daughter 7 6449 23.5 83.7father in law 8 123 .4 84.1mother in law 9 147 .5 84.7brother 10 109 .4 85.1sister 11 146 .5 85.6brother in law 12 45 .2 85.8sister in law 13 45 .2 85.9son in law 14 26 .1 86.0daughter in law 15 12 .0 86.1grandson 16 28 .1 86.2granddaughter 17 15 .1 86.2uncle 20 19 .1 86.3aunt 21 25 .1 86.4male kin 22 8 .0 86.4female kin 23 14 .1 86.5male friend 24 23 .1 86.5female friend 25 39 .1 86.7male servant 26 38 .1 86.8female servant 27 36 .1 87.0male nonkin 28 33 .1 87.1female nonkin 29 41 .1 87.2
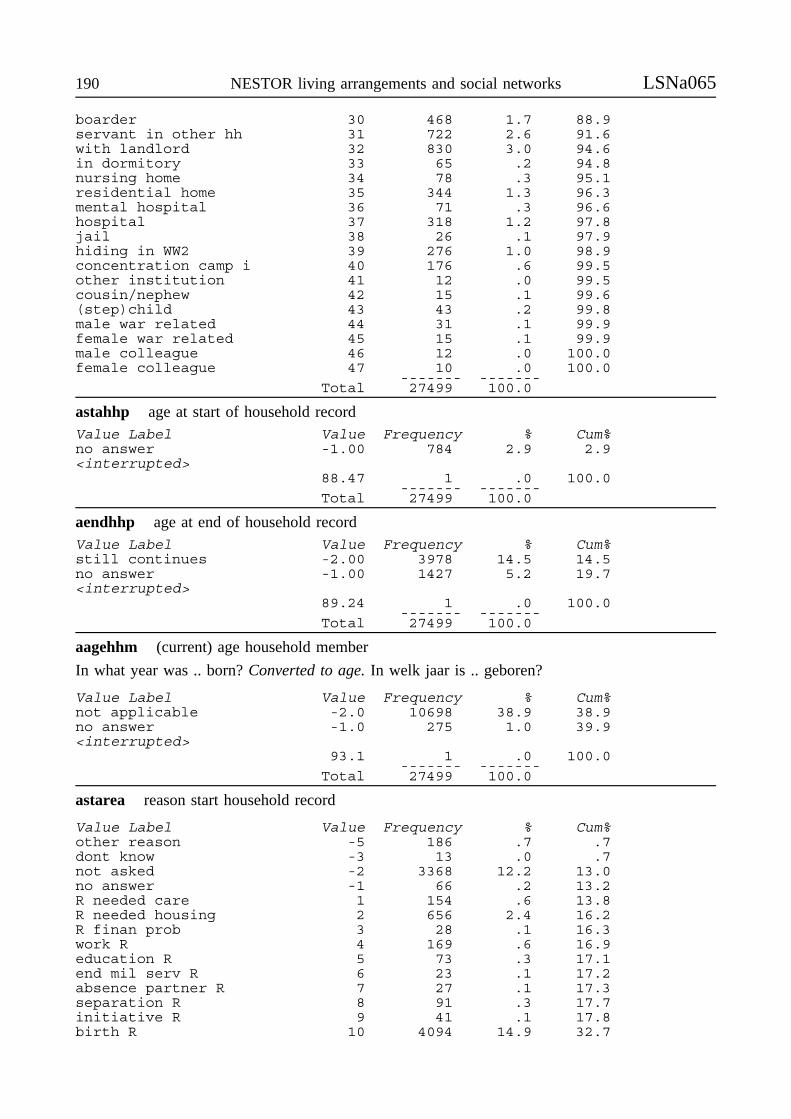
190 NESTOR living arrangements and social networks LSNa065
boarder 30 468 1.7 88.9servant in other hh 31 722 2.6 91.6with landlord 32 830 3.0 94.6in dormitory 33 65 .2 94.8nursing home 34 78 .3 95.1residential home 35 344 1.3 96.3mental hospital 36 71 .3 96.6hospital 37 318 1.2 97.8jail 38 26 .1 97.9hiding in WW2 39 276 1.0 98.9concentration camp i 40 176 .6 99.5other institution 41 12 .0 99.5cousin/nephew 42 15 .1 99.6(step)child 43 43 .2 99.8male war related 44 31 .1 99.9female war related 45 15 .1 99.9male colleague 46 12 .0 100.0female colleague 47 10 .0 100.0
------- -------Total 27499 100.0
astahhp age at start of household recordValue Label Value Frequency % Cum%no answer -1.00 784 2.9 2.9<interrupted>
88.47 1 .0 100.0------- -------
Total 27499 100.0
aendhhp age at end of household recordValue Label Value Frequency % Cum%still continues -2.00 3978 14.5 14.5no answer -1.00 1427 5.2 19.7<interrupted>
89.24 1 .0 100.0------- -------
Total 27499 100.0
aagehhm (current) age household member
In what year was .. born? Converted to age. In welk jaar is .. geboren?
Value Label Value Frequency % Cum%not applicable -2.0 10698 38.9 38.9no answer -1.0 275 1.0 39.9<interrupted>
93.1 1 .0 100.0------- -------
Total 27499 100.0
astarea reason start household record
Value Label Value Frequency % Cum%other reason -5 186 .7 .7dont know -3 13 .0 .7not asked -2 3368 12.2 13.0no answer -1 66 .2 13.2R needed care 1 154 .6 13.8R needed housing 2 656 2.4 16.2R finan prob 3 28 .1 16.3work R 4 169 .6 16.9education R 5 73 .3 17.1end mil serv R 6 23 .1 17.2absence partner R 7 27 .1 17.3separation R 8 91 .3 17.7initiative R 9 41 .1 17.8birth R 10 4094 14.9 32.7
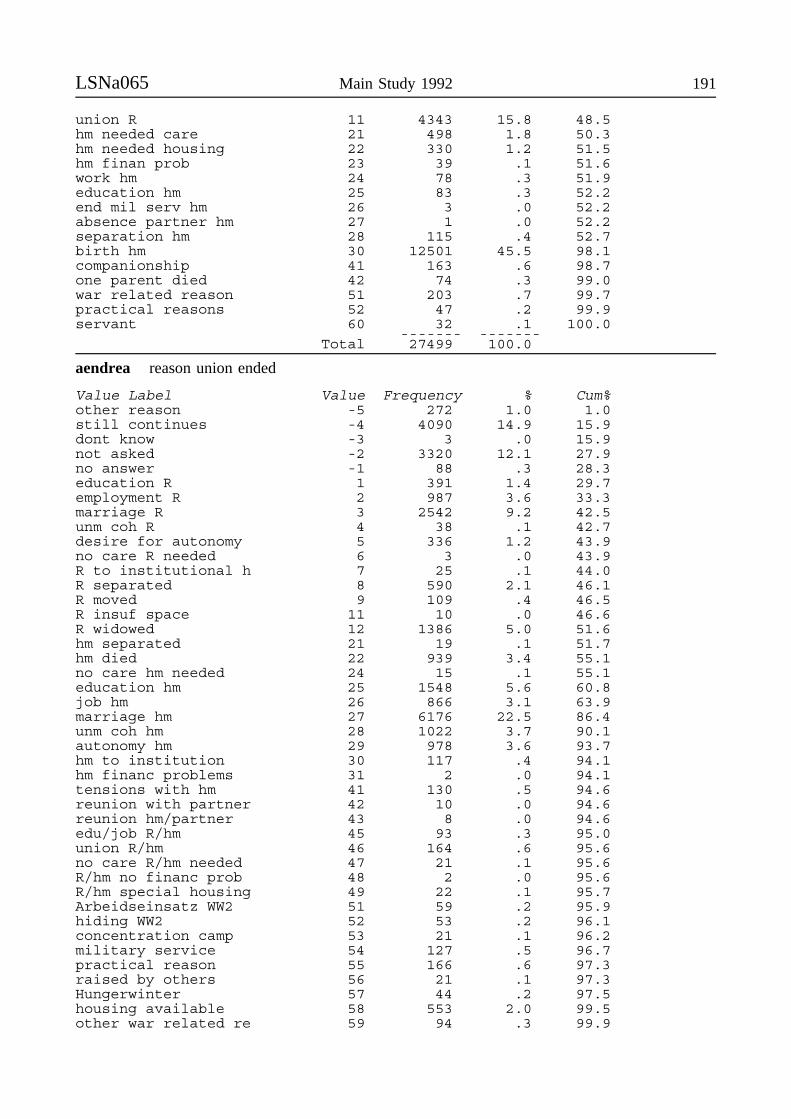
LSNa065 Main Study 1992 191
union R 11 4343 15.8 48.5hm needed care 21 498 1.8 50.3hm needed housing 22 330 1.2 51.5hm finan prob 23 39 .1 51.6work hm 24 78 .3 51.9education hm 25 83 .3 52.2end mil serv hm 26 3 .0 52.2absence partner hm 27 1 .0 52.2separation hm 28 115 .4 52.7birth hm 30 12501 45.5 98.1companionship 41 163 .6 98.7one parent died 42 74 .3 99.0war related reason 51 203 .7 99.7practical reasons 52 47 .2 99.9servant 60 32 .1 100.0
------- -------Total 27499 100.0
aendrea reason union ended
Value Label Value Frequency % Cum%other reason -5 272 1.0 1.0still continues -4 4090 14.9 15.9dont know -3 3 .0 15.9not asked -2 3320 12.1 27.9no answer -1 88 .3 28.3education R 1 391 1.4 29.7employment R 2 987 3.6 33.3marriage R 3 2542 9.2 42.5unm coh R 4 38 .1 42.7desire for autonomy 5 336 1.2 43.9no care R needed 6 3 .0 43.9R to institutional h 7 25 .1 44.0R separated 8 590 2.1 46.1R moved 9 109 .4 46.5R insuf space 11 10 .0 46.6R widowed 12 1386 5.0 51.6hm separated 21 19 .1 51.7hm died 22 939 3.4 55.1no care hm needed 24 15 .1 55.1education hm 25 1548 5.6 60.8job hm 26 866 3.1 63.9marriage hm 27 6176 22.5 86.4unm coh hm 28 1022 3.7 90.1autonomy hm 29 978 3.6 93.7hm to institution 30 117 .4 94.1hm financ problems 31 2 .0 94.1tensions with hm 41 130 .5 94.6reunion with partner 42 10 .0 94.6reunion hm/partner 43 8 .0 94.6edu/job R/hm 45 93 .3 95.0union R/hm 46 164 .6 95.6no care R/hm needed 47 21 .1 95.6R/hm no financ prob 48 2 .0 95.6R/hm special housing 49 22 .1 95.7Arbeidseinsatz WW2 51 59 .2 95.9hiding WW2 52 53 .2 96.1concentration camp 53 21 .1 96.2military service 54 127 .5 96.7practical reason 55 166 .6 97.3raised by others 56 21 .1 97.3Hungerwinter 57 44 .2 97.5housing available 58 553 2.0 99.5other war related re 59 94 .3 99.9
192 NESTOR living arrangements and social networks LSNa065
servant 60 39 .1 100.0------- -------
Total 27499 100.0
LSNa265N: 4,092Data about: quality of household history dataData Source: SystemOther files about same topic: LSNa265, LSNa063Selection of respondents: available in LSNa065Identification variable: RESPNR
a065qual quality household history data
Computation of this variable from original variables:get file ’LSNa065.sys’.compute a065qual=2.if (astahhp=-1 | aendhhp=-1)a065qual=1.if (a065qual=1 & (a065type=1 | a065type=2 | a065type=6 | a065type=7))a065qual=0.aggregate /outfile ’LSNa265.sys’ /break respnr/a065qual=min(a065qual).join match /file ’LSNa265.sys’ /file ’LSNa001.sys’ /by respnr.select if (a265=1).
Value Label Value Frequency % Cum%miss key info 0 512 12.5 12.5miss info 1 244 6.0 18.5complete info 2 3336 81.5 100.0
------- -------Total 4092 100.0

192 NESTOR living arrangements and social networks LSNa067
LSNa067N: 2,877Data about: employment historyData Source: respondent face-to-face interviewOther files about same topic: LSNa267Questionnaire: ehIdentification variable: RESPNR in combination with A067REC (sequence# record)
The timing of four types of employment related period is investigated. Multiple records for onerespondent may exist.
aemptyp type of employment related period
I would now like to discuss employment withyou and the other activities which you carriedout during your life. We will be talking bothabout periods during which you were andperiods during which you were not gainfullyemployed. Did you fulfill military service?Mobilization during World War II is notrelevant here. Were you ever unemployed fora period of at least three months? How oftendid this happen? Were you everoccupationally disabled for a period of atleast three months? "Occupationally disabled"applies to situations where R receivedbenefits under the law of the occupationallydisabled. Was that one particular period, orwere you occupationally disabled at differentpoints in time? Was there ever a period of atleast three months during which you did nothave a paid job because you attended tohomemaking activities (or because you wererearing and caring for your child/children)?How often were you a full-time homemaker?
Ik wil het nu met u gaan hebben over hetwerk en de andere dingen die u in uw levenhebt gedaan. Ik ben daarbij zowel geïnte-resseerd in perioden waarin u betaald werkhebt verricht als in perioden waarin u dat niethebt gedaan. Hebt u militaire dienstplichtvervuld? Het gaat hier niet om mobilisatietijdens de Tweede Wereldoorlog. Bent u weleens voor ten minste drie maanden werkloosgeweest? Hoe vaak bent u dit geweest? Bentu wel eens in de WAO terecht gekomen? Al-leen perioden van langer dan drie maandenmeetellen. Is dat een aaneengesloten periodegeweest, of bent u vaker dan één keer in deWAO terecht gekomen? Hebt u wel eens voorten minste drie maanden geen betaalde baangehad omdat u voor het huishouden hebt ge-zorgd (of omdat u het opvoeden van uwkind/kinderen op u hebt genomen)? Is dit eenaaneengesloten periode geweest, of hebt uvaker dan één keer geen betaalde baan gehadvanwege het verrichten van huishoudelijkwerk?
Value Label Value Frequency % Cum%military service 1 790 27.5 27.5unemployment 2 525 18.2 45.7disability 3 590 20.5 66.2homemaking 4 972 33.8 100.0
------- -------Total 2877 100.0
LSNa067 Main Study 1992 193
astaper age at start of period
When did you start and when did you end military service? In 19.. and 19..When were you unemployed (for the first time)? From 19.. to 19..When were you occupationally disabled (for the first time)? From 19.. to 19..When were you a full-time homemaker (for the first time)? When were you a full-timehomemaker for the second time? From 19.. to 19..
Van wanneer tot wanneer hebt u uw militaire dienstplicht vervuld? Van 19.. tot 19..Voor de perioden van werkloosheid, WAO, en verzorging van huishouden / opvoeden vankinderen: Gedurende welke periode is dat (voor het eerst) geweest? Gedurende welke periode isdat voor de tweede keer geweest? begin 19.. einde 19..
Value Label Value Frequency % Cum%betw age 0 and 12 -3.00 14 .5 .5dont know -1.00 180 6.3 6.7
12.04 1 .0 6.8<interrupted>
85.42 1 .0 100.0------- -------
Total 2877 100.0
aendper age at end of period
Value Label Value Frequency % Cum%betw age 0 and 12 -3.00 5 .2 .2continues -2.00 840 29.2 29.4dont know -1.00 192 6.7 36.0
12.59 1 .0 36.1<interrupted>
85.79 1 .0 100.0------- -------
Total 2877 100.0
astmar start period & marriage in same year?
You were married in the same year that you started military service. Did you enter militaryservice before or after your marriage?You were married in the same year that you start working at your first job. Did you startworking before your marriage, or afterwards?You became a homemaker and were married in the same year. Did you become a homemakerbefore your marriage, or afterwards?
1 start military service / start 1st job / homemaker first2 marriage first3 simultaneously
U bent in hetzelfde jaar in militaire dienst gegaan en getrouwd. Bent u in dienst gegaan voordatu trouwde, of erna?U bent in hetzelfde jaar met uw eerste baan begonnen en getrouwd. Bent u met uw eerste baanbegonnen voordat u trouwde, of erna?U bent in hetzelfde jaar voor het huishouden gaan zorgen en getrouwd. Bent u werkloosgeworden voordat u trouwde, of erna?
1 in dienst / met eerste baan begonnen / huishouden voor trouwen2 in dienst / met eerste baan begonnen / huishouden na trouwen3 gelijktijdig
194 NESTOR living arrangements and social networks LSNa067
Value Label Value Frequency % Cum%not asked -2 2292 79.7 79.7no answer -1 1 .0 79.7start period first 1 35 1.2 80.9marriage first 2 165 5.7 86.7simultaneous 3 384 13.3 100.0
------- -------Total 2877 100.0
astch start period & first child in same year?
You had a child in the same year that you went into military service. Did you enter militaryservice before or after your child was born?You had a child in the same year that you started your first job. Was your child born beforeyour marriage, or afterwards?You had a child in the same year as when you were dismissed from employment. Did you enterunemployment before your child was born, or afterwards?You had a child in the same year as when you became a full-time homemaker. Did you becomea full-time homemaker before your child was born, or afterwards?
1 start military service / start 1st job / unemployment / homemaker first2 child first3 simultaneously
In hetzelfde jaar dat u in militaire dienst bent gegaan, hebt u ook een kind gekregen. Bent u inmilitaire dienst gegaan voordat u dit kind hebt gekregen, of erna?
In hetzelfde jaar dat u met uw eerste baan bent begonnen, hebt u ook een kind gekregen. Bent umet uw eerste baan begonnen voordat u dit kind hebt gekregen, of erna?In hetzelfde jaar dat u werkloos bent geworden, hebt u ook een kind gekregen. Bent u werkloosgeworden voordat u dit kind hebt gekregen, of erna?In hetzelfde jaar dat u voor het huishouden bent gaan zorgen, hebt u ook een kind gekregen.Bent u voor het huishouden gaan zorgen voordat u dit kind hebt gekregen, of erna?
1 in dienst voor / met eerste baan begonnen / werkloos / huishouden voor geboorte kind2 in dienst voor / met eerste baan begonnen / werkloos / huishouden na geboorte kind3 gelijktijdig
Value Label Value Frequency % Cum%not asked -2 2682 93.2 93.2no answer -1 3 .1 93.3start period first 1 134 4.7 98.0childbirth first 2 25 .9 98.9simultaneous 3 33 1.1 100.0
------- -------Total 2877 100.0
LSNa067 Main Study 1992 195
aendmar end period & marriage in same year?
You were married and dismissed from employmentin the same year. Did you enter unemploymentbefore your marriage, or afterwards? You weremarried in the same year that you ended militaryservice. Did you end military service before or afteryour marriage?1 unemployment first / end military service first2 marriage first3 simultaneously
U bent in hetzelfde jaar werkloos gewordenen getrouwd. Bent u werkloos gewordenvoordat u trouwde, of erna?U bent u in hetzelfde jaar uit militairedienst gegaan en getrouwd. Bent u uitdienst gegaan voordat u trouwde, of erna?1 werkloos / uit dienst voor trouwen2 werkloos / uit dienst na trouwen3 gelijktijdig
Value Label Value Frequency % Cum%not asked -2 2847 99.0 99.0end period first 1 19 .7 99.6marriage first 2 10 .3 100.0simultaneous 3 1 .0 100.0
------- -------Total 2877 100.0
aendch end period & first child in same year?
You had a child in the same year as when youleft school. Did you leave school before yourchild was born, or afterwards? You had a childin the same year that you left military service.Did you leave military service before or afteryour child was born?1 left school first / end military service first2 child first3 simultaneously
In hetzelfde jaar dat u van school bent gegaan,hebt u ook een kind gekregen. Bent u vanschool gegaan voordat u dit kind hebt gekregen,of erna? In hetzelfde jaar dat u uit militairedienst bent gegaan, hebt u ook een kind gekre-gen. Bent u uit militaire dienst gegaan voordat udit kind hebt gekregen, of erna?1 van school / uit dienst voor geboorte kind2 van school / uit dienst na geboorte kind3 gelijktijdig
Value Label Value Frequency % Cum%not asked -2 2868 99.7 99.7end period first 1 4 .1 99.8childbirth first 2 4 .1 100.0simultaneous 3 1 .0 100.0
------- -------Total 2877 100.0
LSNa267N: 4,082Data about: employment history, income, early retirementData source: Respondent face to face interviewOther files about same topic: LSNa067Questionnaire: ehIdentification variable: RESPNR
196 NESTOR living arrangements and social networks LSNa267
aendedu age at end full-time education
When did you leave school? The question refers tothe completion of full-time schooling. Temporaryleaves in connection with illness and so forth arenot relevant. If R quit full-time schooling andreturned to school full-time at a later date, the firsttime s/he left school is relevant here.
Wanneer bent u van school gegaan?Bedoeld wordt de beëindiging van eenvoltijd opleiding. Als R met tussenpozeneen voltijd opleiding gevolgd heeft, dangaat het om de eerste onderbreking. jaar19..
Value Label Value Frequency % Cum%no answer -1.00 67 1.6 1.6
5.35 1 .0 1.7<interrupted>
11.01 1 .0 5.4<interrupted>
49.65 1 .0 100.0------- -------
Total 4082 100.0
aedu_er reason end full-time education
Why did you then leave school? Pleaseindicate the most important reason.1 had finished education2 parents could not afford further education3 R disliked school / had difficulty learning4 due to marriage5 otherwise6 R had to start working / have to earn
money
Waarom bent u toen van school afgegaan? Debelangrijkste reden noteren.1 had opleiding afgerond2 ouders/verzorgers hadden geen geld om
verder te laten studeren3 had hekel aan school / kon niet goed leren4 vanwege huwelijk5 anders6 omdat R moest werken / geld moest
verdienen
Value Label Value Frequency % Cum%completed education 1 2762 67.7 67.7no money for educati 2 377 9.2 76.9disliked school 3 132 3.2 80.1marriage 4 6 .1 80.3other reason 5 526 12.9 93.2had to start working 6 279 6.8 100.0
------- -------Total 4082 100.0
alsmar left school and marriage in same year
You left school and you were married in thesame year. Did you leave school before yourmarriage, or afterwards?
1 left school first2 marriage first3 simultaneously
U bent in hetzelfde jaar van school gegaan engetrouwd. Bent u van school gegaan voordat utrouwde, of erna?
1 van school voor trouwen2 van school na trouwen3 gelijktijdig
Value Label Value Frequency % Cum%not asked -2 4064 99.6 99.6left school first 1 13 .3 99.9married first 2 5 .1 100.0
------- -------Total 4082 100.0
alsch left school and first child in same year
Value Label Value Frequency % Cum%not asked -2 4071 99.7 99.7
LSNa267 Main Study 1992 197
no answer -1 6 .1 99.9left school first 1 4 .1 100.0child first 2 1 .0 100.0
------- -------Total 4082 100.0
astjob age at start first job
In what year did you get start working at your first job? The "first job" is one which involvedmore than eight hours each week.In welk jaar bent u met uw eerste betaalde baan begonnen? Het gaat hier om een betaalde baanwaar men meer dan acht uur per week aan besteedde.
Value Label Value Frequency % Cum%no answer -1.00 419 10.3 10.3
5.35 1 .0 10.3<interrupted>
11.03 1 .0 10.5<interrupted>
59.15 1 .0 100.0------- -------
Total 4082 100.0
afjmar first job and marriage in same year
Value Label Value Frequency % Cum%not asked -2 3984 97.6 97.6no answer -1 1 .0 97.6left school first 1 39 1.0 98.6married first 2 14 .3 98.9simultaneously 3 44 1.1 100.0
------- -------Total 4082 100.0
afjch first job and first child in same year
Value Label Value Frequency % Cum%not asked -2 4054 99.3 99.3no answer -1 5 .1 99.4left school first 1 21 .5 100.0child first 2 2 .0 100.0
------- -------Total 4082 100.0
ainc income: single or double
Among other things, we want to obtain general background information in this study. For thatreason I would now like to ask you: do you have an income of your own? "Own income" isincome from gainful employment, or income from benefits such as private pension, old age statepension, or dividend that comes in on your name. We would like to point out to you that allinformation that we obtain from you is strictly confidential, and will not be passed on to others,such as for example the tax department.Does your partner have an income of his/her own?
In dit onderzoek willen we graag een paar algemene gegevens verzamelen. Daarom vraag ik nu:Hebt u een eigen inkomen? Hiermee bedoelen wij inkomen waarvoor u zelf werkt, maar ookuitkeringen, zoals pensioen, AOW, of dividend dat op uw eigen naam binnenkomt. Voor allegegevens die wij verzamelen, geldt dat ze vertrouwelijk zijn, en niet doorgegeven worden aanbijvoorbeeld de belastingdienst.Heeft uw partner een eigen inkomen?
Respondent Partner Value label Value Freq %corrected income -2 1 .0
198 NESTOR living arrangements and social networks LSNa267
refuses to answer -1 1 .0no income no partner no inc: R-, no P 1 69 1.7
no income no income no inc: R-, P- 2 24 .6
no income income single: R-, P+ 3 327 8.0
income partner, income? R+, P not asked 4 9 .2
income no partner single: R+, no P 5 1530 37.5
income no income single: R+, P- 6 432 10.6
income income double income 7 1689 41.4---- -----
Total 4082 100.0
ainccat household income categorical
I will now hand you a card with answer categories. Using that card, will you please tell me whatcategory applies to your net income (the net income of you and your partner)?Wilt u aan de hand van de kaart, die ik u nu geef, zeggen in welke categorie uw maand-inkomen(het netto maand-inkomen van u en uw partner), exclusief vakantiegeld, valt? Noemt u maar hetcijfer dat van toepassing is.Corrections:
* if R has no income and has no partner, recoded to income level 1.if (ainc=1 & ainccat=-3)ainccat=1.* if R has no income and partner has no income, recoded to income level 3.if (ainc=2 & ainccat=-3)ainccat=3.* if level 1 or 2 and partner in household, recoded to income level 3.if ((ainccat=1 | ainccat=2) & apartst>0 & apartst<4)ainccat=3.
Value Label Value Frequency % Cum%not asked -3 1 .0 .0refuses to answer -2 213 5.2 5.2do not know -1 300 7.3 12.61,000-1,250 gld 1 481 11.8 24.4<interrupted>5,001 gld or more 12 214 5.2 100.0
------- -------Total 4082 100.0
aincome income DFL/month corrected for partner
Computation of this variable from original variable.compute aincome=ainccat.* recode to class mean.recode aincome (1=1125)(2=1375)(3=1625)(4=1875)(5=2125)(6=2375)(7=2725)(8=3250)(9=3750)(10=4250)(11=4750)(12=5750).* correction for availability partner in the household; creating equivalence score.if (not(apartst>3) & aincome>0)aincome=trunc(aincome * .7).
Value Label Value Frequency % Cum%not asked (techn) -3 1 .0 .0refused to answer -2 213 5.2 5.2no answer -1 300 7.3 12.6lowest if no partner 1125 481 11.8 24.4lowest if partner 1137 388 9.5 33.9<interrupted>highest if no partner 5750 25 .6 100.0
------- -------Total 4082 100.0
aretire early retirement (company, eligible, use, plan)
LSNa267 Main Study 1992 199
Are you currently working in a company or institution that hasan early retirement policy?If no: (1)If yes: Are you already eligible for the early retirement schemein your company or institution?
If no: Will you in all likelihood be eligible for the earlyretirement scheme in your company or institution in thefuture?
If no: (3)If yes:Within what period of time will you be able to make useof the early retirement scheme in your company orinstitution?- within a year (5)- within two years (6)- within three years (7)- within four years (8)- in four years or more (9)
If yes: Are you planning to make use of the early retirementscheme in your company or institution?
If no: (11) Why won’t you make use of the earlyretirement scheme in your company or institution?(Information stored in database LSNa267.dbf)If yes: Within what period of time do you plan to makeuse of the early retirement scheme in your company orinstitution?- within a year (12)- within two years (13)- within three years (14)- within four years (15)- in four years or more (16)
Bent u momenteel werkzaamin een bedrijf of instellingwaar een VUT-regeling vantoepassing is?Indien ja:
Komt u nu reeds in aan-merking voor de VUT-rege-ling die uw bedrijf ofinstelling hanteert?Indien niet:
Komt u in de toekomstwaarschijnlijk in aan-merking voor de VUT-regeling die uw bedrijf ofinstelling hanteert?Indien ja:Op welke termijn kunt ugebruik maken van deVUT-regeling die uw be-drijf of instellinghanteert?
Indien ja:Bent u van plan gebruikte maken van de VUT-regeling van uw bedrijfof instelling?Indien niet:Waarom niet? Wilt us.v.p. een toelichtinggeven?Indien ja:Op welke termijn?
Note: values between parentheses.
Value Label Value Frequency % Cum%not empl / >65yr -2 3840 94.1 94.1no answ possib cy -1 1 .0 94.1no possib in cy 1 101 2.5 96.6not eli now;future? 2 1 .0 96.6not eli now+future 3 8 .2 96.8eli fut,no answ yr 4 1 .0 96.8eli fut 1yr 5 10 .2 97.1eli fut 2yr 6 21 .5 97.6eli fut 3yr 7 18 .4 98.0eli fut 4yr 8 10 .2 98.3eli fut 4+yr 9 29 .7 99.0eli,no answ plan 10 1 .0 99.0eli,no plan 11 11 .3 99.3eli,plan 1yr 12 16 .4 99.7eli,plan 2yr 13 4 .1 99.8eli,plan 3yr 14 3 .1 99.8eli,plan 4yr 15 2 .0 99.9eli,plan 4+yr 16 5 .1 100.0
------- -------
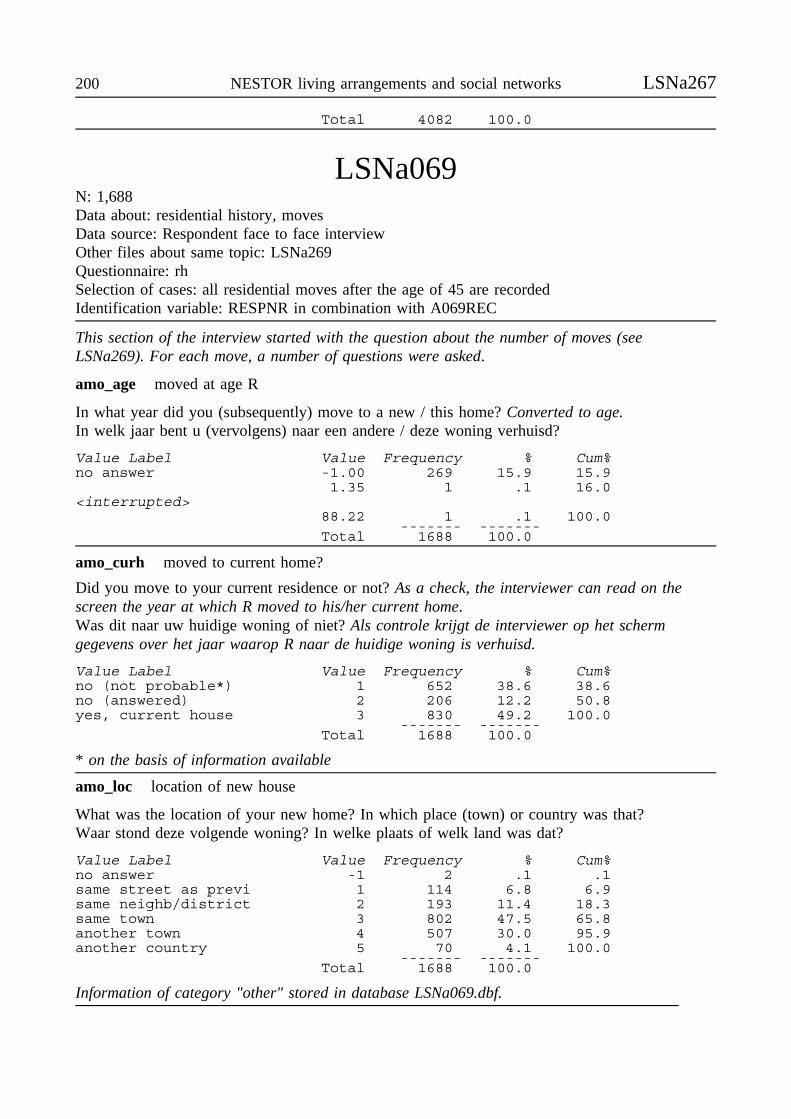
200 NESTOR living arrangements and social networks LSNa267
Total 4082 100.0
LSNa069N: 1,688Data about: residential history, movesData source: Respondent face to face interviewOther files about same topic: LSNa269Questionnaire: rhSelection of cases: all residential moves after the age of 45 are recordedIdentification variable: RESPNR in combination with A069REC
This section of the interview started with the question about the number of moves (seeLSNa269). For each move, a number of questions were asked.
amo_age moved at age R
In what year did you (subsequently) move to a new / this home? Converted to age.In welk jaar bent u (vervolgens) naar een andere / deze woning verhuisd?
Value Label Value Frequency % Cum%no answer -1.00 269 15.9 15.9
1.35 1 .1 16.0<interrupted>
88.22 1 .1 100.0------- -------
Total 1688 100.0
amo_curh moved to current home?
Did you move to your current residence or not? As a check, the interviewer can read on thescreen the year at which R moved to his/her current home.Was dit naar uw huidige woning of niet? Als controle krijgt de interviewer op het schermgegevens over het jaar waarop R naar de huidige woning is verhuisd.
Value Label Value Frequency % Cum%no (not probable*) 1 652 38.6 38.6no (answered) 2 206 12.2 50.8yes, current house 3 830 49.2 100.0
------- -------Total 1688 100.0
* on the basis of information available
amo_loc location of new house
What was the location of your new home? In which place (town) or country was that?Waar stond deze volgende woning? In welke plaats of welk land was dat?
Value Label Value Frequency % Cum%no answer -1 2 .1 .1same street as previ 1 114 6.8 6.9same neighb/district 2 193 11.4 18.3same town 3 802 47.5 65.8another town 4 507 30.0 95.9another country 5 70 4.1 100.0
------- -------Total 1688 100.0
Information of category "other" stored in database LSNa069.dbf.

LSNa069 Main Study 1992 201
amo_type rented or owner occupied?
Was this your own home or did you rent it?Was dit een huur- of een koopwoning ?
Value Label Value Frequency % Cum%no answer -1 1502 89.0 89.0rented 1 141 8.4 97.3rented, bought later 2 3 .2 97.5owner occupied 3 28 1.7 99.2rented rooms (lodgin 5 9 .5 99.7institutional living 6 5 .3 100.0
------- -------Total 1688 100.0
amo_rea most important reason for moving
What was the most important reasonwhy you moved at the time?1 marriage/cohabitation2 divorce/widowhood3 family reunion4 addition to family5 children leaving home6 to be closer to children
Wat was de belangrijkste reden waarom u naar diewoning bent verhuisd?1 huwelijk of ongehuwd samenwonen2 scheiding van partner, overlijden partner3 gezinshereniging4 gezinsuitbreiding5 uit huis gaan van de kinderen6 nieuwe woning dichter bij de kinderen
7 employment R8 employment partner9 desire greater privacy10 health R11 health partner12 old home too expensive13 old home too small
7 (ander) werk van mijzelf8 (ander) werk van mijn partner9 wens om meer privacy10 gezondheidstoestand van mijzelf11 gezondheidstoestand partner12 oude woning was te duur13 oude woning was te klein
14 old home too big15 renovation/demolition old home16 nicer neighborhood new home17 termination of lease18 other reason (please specify)
14 oude woning was te groot15 oude woning werd gesloopt of gerenoveerd16 woonomgeving nieuwe woning aantrekkelijker17 huurcontract werd opgezegd18 andere reden (graag specificeren)
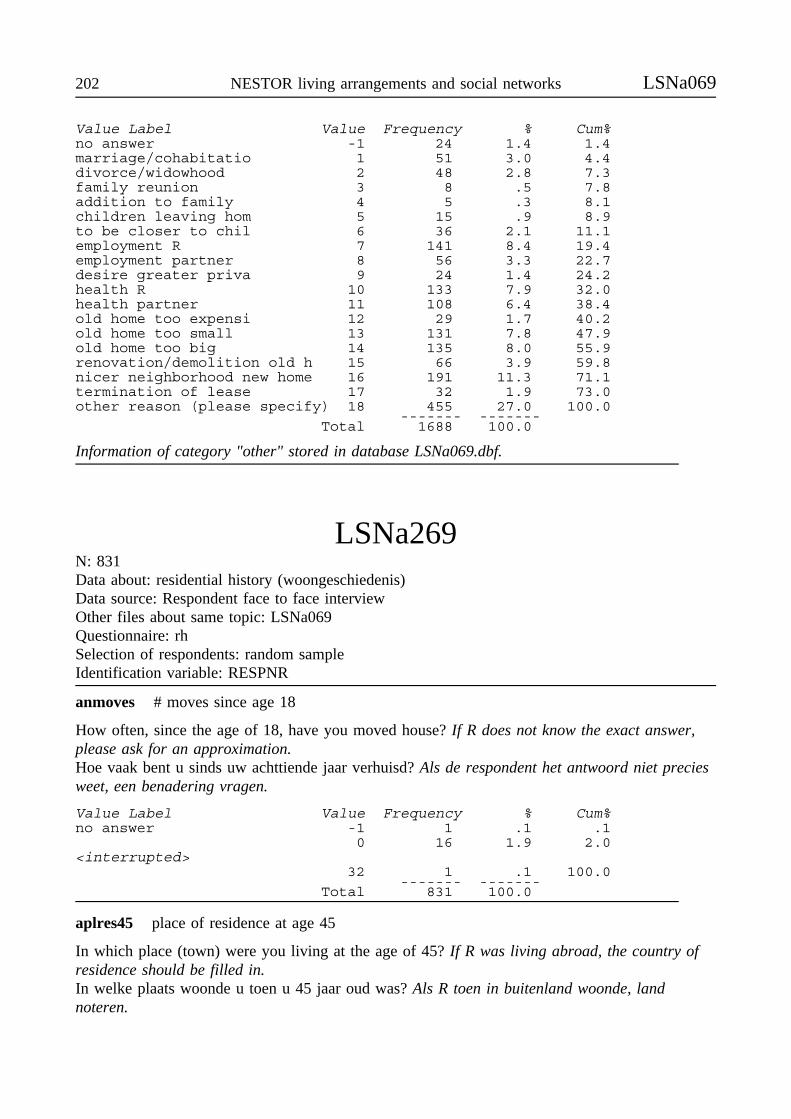
202 NESTOR living arrangements and social networks LSNa069
Value Label Value Frequency % Cum%no answer -1 24 1.4 1.4marriage/cohabitatio 1 51 3.0 4.4divorce/widowhood 2 48 2.8 7.3family reunion 3 8 .5 7.8addition to family 4 5 .3 8.1children leaving hom 5 15 .9 8.9to be closer to chil 6 36 2.1 11.1employment R 7 141 8.4 19.4employment partner 8 56 3.3 22.7desire greater priva 9 24 1.4 24.2health R 10 133 7.9 32.0health partner 11 108 6.4 38.4old home too expensi 12 29 1.7 40.2old home too small 13 131 7.8 47.9old home too big 14 135 8.0 55.9renovation/demolition old h 15 66 3.9 59.8nicer neighborhood new home 16 191 11.3 71.1termination of lease 17 32 1.9 73.0other reason (please specify) 18 455 27.0 100.0
------- -------Total 1688 100.0
Information of category "other" stored in database LSNa069.dbf.
LSNa269N: 831Data about: residential history (woongeschiedenis)Data source: Respondent face to face interviewOther files about same topic: LSNa069Questionnaire: rhSelection of respondents: random sampleIdentification variable: RESPNR
anmoves # moves since age 18
How often, since the age of 18, have you moved house? If R does not know the exact answer,please ask for an approximation.Hoe vaak bent u sinds uw achttiende jaar verhuisd? Als de respondent het antwoord niet preciesweet, een benadering vragen.
Value Label Value Frequency % Cum%no answer -1 1 .1 .1
0 16 1.9 2.0<interrupted>
32 1 .1 100.0------- -------
Total 831 100.0
aplres45 place of residence at age 45
In which place (town) were you living at the age of 45? If R was living abroad, the country ofresidence should be filled in.In welke plaats woonde u toen u 45 jaar oud was? Als R toen in buitenland woonde, landnoteren.
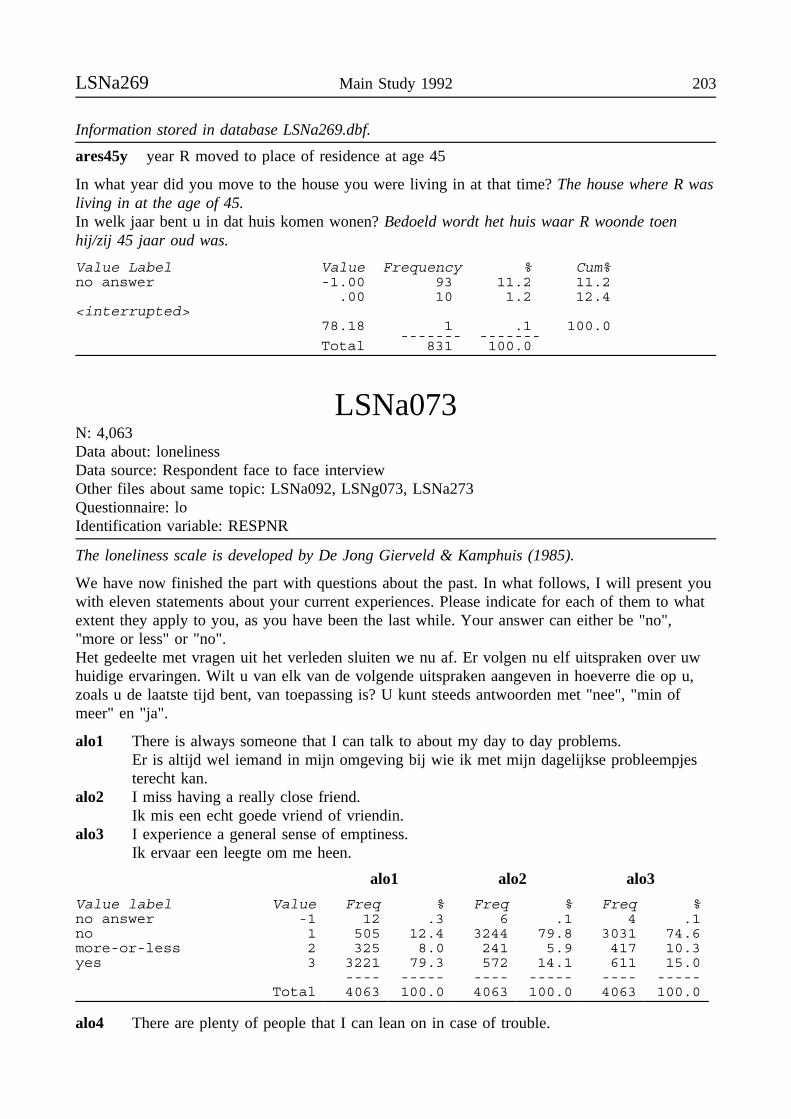
LSNa269 Main Study 1992 203
Information stored in database LSNa269.dbf.
ares45y year R moved to place of residence at age 45
In what year did you move to the house you were living in at that time? The house where R wasliving in at the age of 45.In welk jaar bent u in dat huis komen wonen? Bedoeld wordt het huis waar R woonde toenhij/zij 45 jaar oud was.
Value Label Value Frequency % Cum%no answer -1.00 93 11.2 11.2
.00 10 1.2 12.4<interrupted>
78.18 1 .1 100.0------- -------
Total 831 100.0
LSNa073N: 4,063Data about: lonelinessData source: Respondent face to face interviewOther files about same topic: LSNa092, LSNg073, LSNa273Questionnaire: loIdentification variable: RESPNR
The loneliness scale is developed by De Jong Gierveld & Kamphuis (1985).
We have now finished the part with questions about the past. In what follows, I will present youwith eleven statements about your current experiences. Please indicate for each of them to whatextent they apply to you, as you have been the last while. Your answer can either be "no","more or less" or "no".Het gedeelte met vragen uit het verleden sluiten we nu af. Er volgen nu elf uitspraken over uwhuidige ervaringen. Wilt u van elk van de volgende uitspraken aangeven in hoeverre die op u,zoals u de laatste tijd bent, van toepassing is? U kunt steeds antwoorden met "nee", "min ofmeer" en "ja".
alo1 There is always someone that I can talk to about my day to day problems.Er is altijd wel iemand in mijn omgeving bij wie ik met mijn dagelijkse probleempjesterecht kan.
alo2 I miss having a really close friend.Ik mis een echt goede vriend of vriendin.
alo3 I experience a general sense of emptiness.Ik ervaar een leegte om me heen.
alo1 alo2 alo3
Value label Value Freq % Freq % Freq %no answer -1 12 .3 6 .1 4 .1no 1 505 12.4 3244 79.8 3031 74.6more-or-less 2 325 8.0 241 5.9 417 10.3yes 3 3221 79.3 572 14.1 611 15.0
---- ----- ---- ----- ---- -----Total 4063 100.0 4063 100.0 4063 100.0
alo4 There are plenty of people that I can lean on in case of trouble.
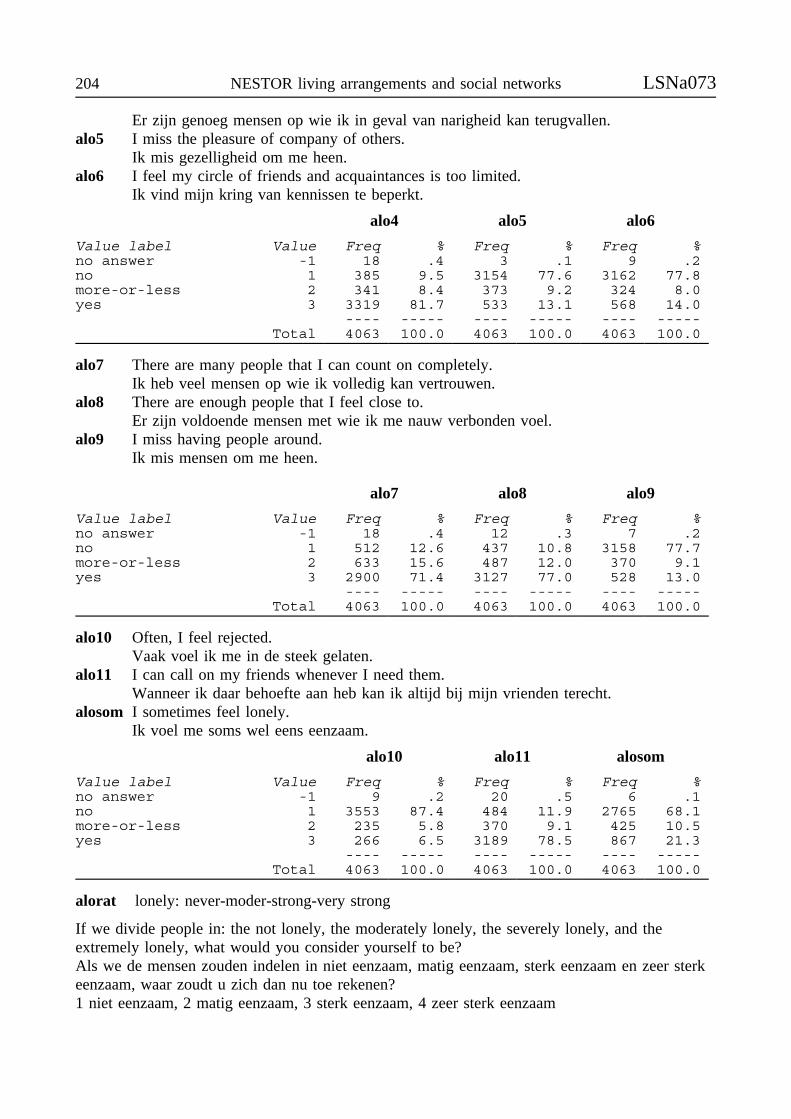
204 NESTOR living arrangements and social networks LSNa073
Er zijn genoeg mensen op wie ik in geval van narigheid kan terugvallen.alo5 I miss the pleasure of company of others.
Ik mis gezelligheid om me heen.alo6 I feel my circle of friends and acquaintances is too limited.
Ik vind mijn kring van kennissen te beperkt.
alo4 alo5 alo6
Value label Value Freq % Freq % Freq %no answer -1 18 .4 3 .1 9 .2no 1 385 9.5 3154 77.6 3162 77.8more-or-less 2 341 8.4 373 9.2 324 8.0yes 3 3319 81.7 533 13.1 568 14.0
---- ----- ---- ----- ---- -----Total 4063 100.0 4063 100.0 4063 100.0
alo7 There are many people that I can count on completely.Ik heb veel mensen op wie ik volledig kan vertrouwen.
alo8 There are enough people that I feel close to.Er zijn voldoende mensen met wie ik me nauw verbonden voel.
alo9 I miss having people around.Ik mis mensen om me heen.
alo7 alo8 alo9
Value label Value Freq % Freq % Freq %no answer -1 18 .4 12 .3 7 .2no 1 512 12.6 437 10.8 3158 77.7more-or-less 2 633 15.6 487 12.0 370 9.1yes 3 2900 71.4 3127 77.0 528 13.0
---- ----- ---- ----- ---- -----Total 4063 100.0 4063 100.0 4063 100.0
alo10 Often, I feel rejected.Vaak voel ik me in de steek gelaten.
alo11 I can call on my friends whenever I need them.Wanneer ik daar behoefte aan heb kan ik altijd bij mijn vrienden terecht.
alosom I sometimes feel lonely.Ik voel me soms wel eens eenzaam.
alo10 alo11 alosom
Value label Value Freq % Freq % Freq %no answer -1 9 .2 20 .5 6 .1no 1 3553 87.4 484 11.9 2765 68.1more-or-less 2 235 5.8 370 9.1 425 10.5yes 3 266 6.5 3189 78.5 867 21.3
---- ----- ---- ----- ---- -----Total 4063 100.0 4063 100.0 4063 100.0
alorat lonely: never-moder-strong-very strong
If we divide people in: the not lonely, the moderately lonely, the severely lonely, and theextremely lonely, what would you consider yourself to be?Als we de mensen zouden indelen in niet eenzaam, matig eenzaam, sterk eenzaam en zeer sterkeenzaam, waar zoudt u zich dan nu toe rekenen?1 niet eenzaam, 2 matig eenzaam, 3 sterk eenzaam, 4 zeer sterk eenzaam
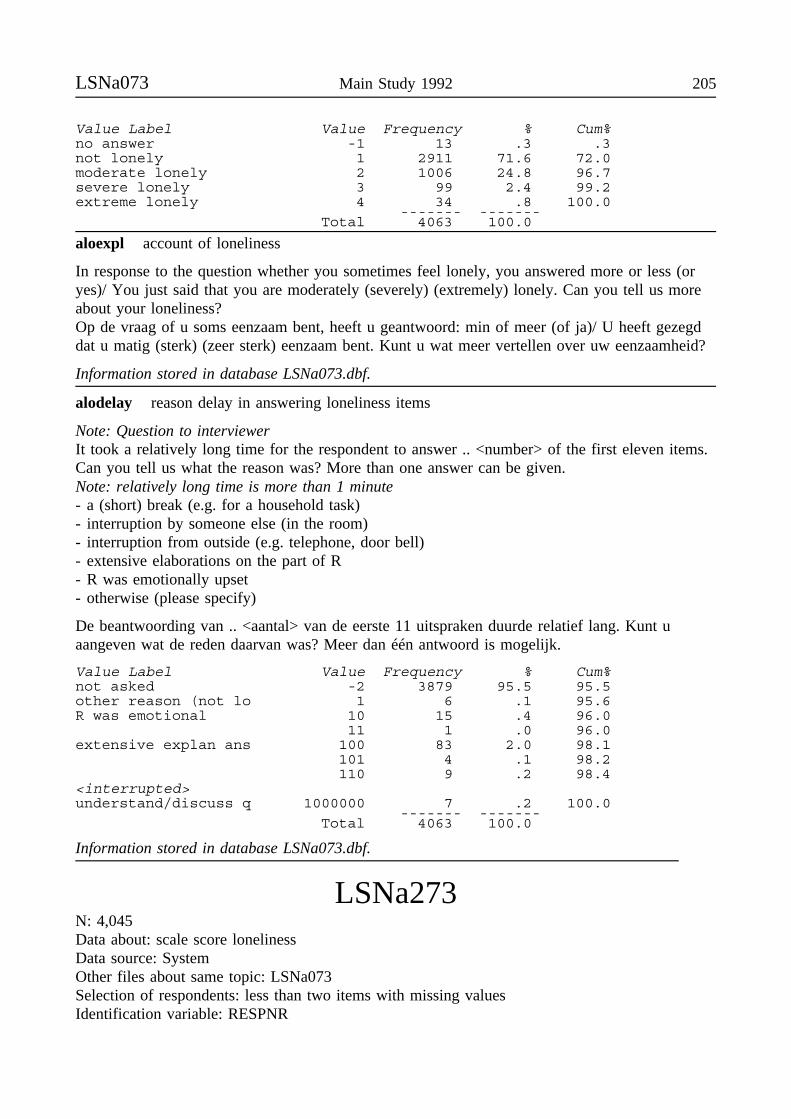
LSNa073 Main Study 1992 205
Value Label Value Frequency % Cum%no answer -1 13 .3 .3not lonely 1 2911 71.6 72.0moderate lonely 2 1006 24.8 96.7severe lonely 3 99 2.4 99.2extreme lonely 4 34 .8 100.0
------- -------Total 4063 100.0
aloexpl account of loneliness
In response to the question whether you sometimes feel lonely, you answered more or less (oryes)/ You just said that you are moderately (severely) (extremely) lonely. Can you tell us moreabout your loneliness?Op de vraag of u soms eenzaam bent, heeft u geantwoord: min of meer (of ja)/ U heeft gezegddat u matig (sterk) (zeer sterk) eenzaam bent. Kunt u wat meer vertellen over uw eenzaamheid?
Information stored in database LSNa073.dbf.
alodelay reason delay in answering loneliness items
Note: Question to interviewerIt took a relatively long time for the respondent to answer .. <number> of the first eleven items.Can you tell us what the reason was? More than one answer can be given.Note: relatively long time is more than 1 minute- a (short) break (e.g. for a household task)- interruption by someone else (in the room)- interruption from outside (e.g. telephone, door bell)- extensive elaborations on the part of R- R was emotionally upset- otherwise (please specify)
De beantwoording van .. <aantal> van de eerste 11 uitspraken duurde relatief lang. Kunt uaangeven wat de reden daarvan was? Meer dan één antwoord is mogelijk.
Value Label Value Frequency % Cum%not asked -2 3879 95.5 95.5other reason (not lo 1 6 .1 95.6R was emotional 10 15 .4 96.0
11 1 .0 96.0extensive explan ans 100 83 2.0 98.1
101 4 .1 98.2110 9 .2 98.4
<interrupted>understand/discuss q 1000000 7 .2 100.0
------- -------Total 4063 100.0
Information stored in database LSNa073.dbf.
LSNa273N: 4,045Data about: scale score lonelinessData source: SystemOther files about same topic: LSNa073Selection of respondents: less than two items with missing valuesIdentification variable: RESPNR
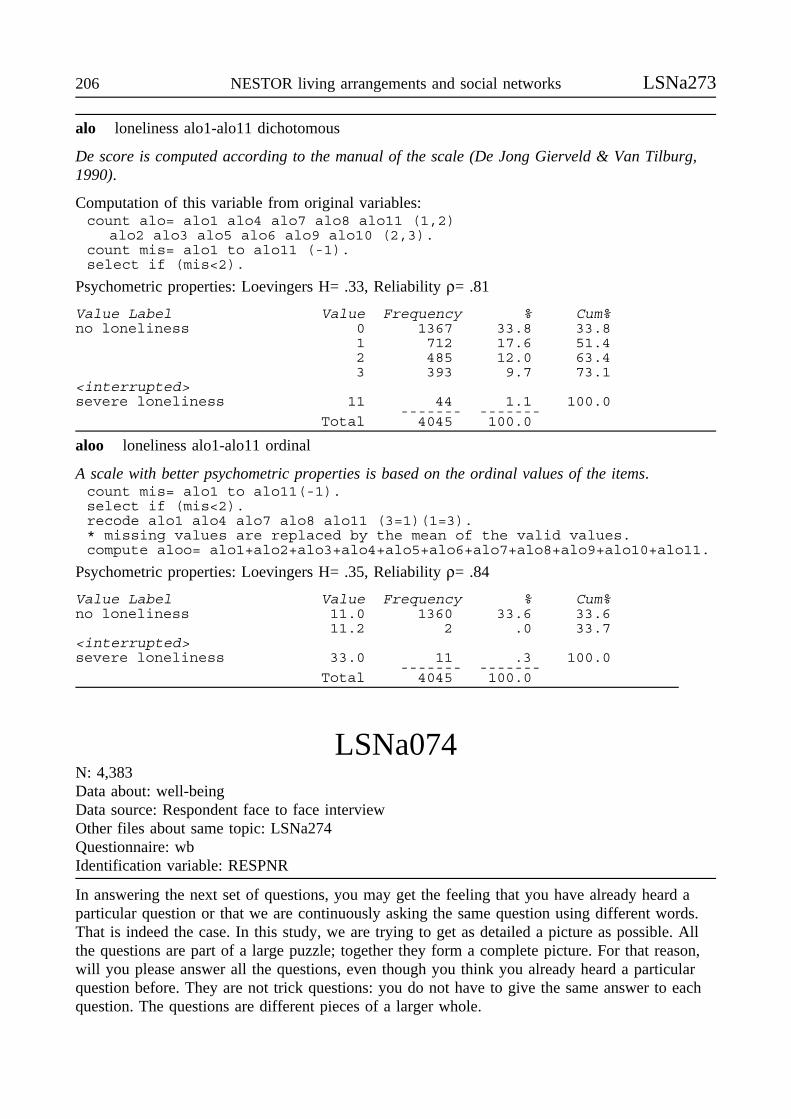
206 NESTOR living arrangements and social networks LSNa273
alo loneliness alo1-alo11 dichotomous
De score is computed according to the manual of the scale (De Jong Gierveld & Van Tilburg,1990).
Computation of this variable from original variables:count alo= alo1 alo4 alo7 alo8 alo11 (1,2)
alo2 alo3 alo5 alo6 alo9 alo10 (2,3).count mis= alo1 to alo11 (-1).select if (mis<2).
Psychometric properties: Loevingers H= .33, Reliability ρ= .81
Value Label Value Frequency % Cum%no loneliness 0 1367 33.8 33.8
1 712 17.6 51.42 485 12.0 63.43 393 9.7 73.1
<interrupted>severe loneliness 11 44 1.1 100.0
------- -------Total 4045 100.0
aloo loneliness alo1-alo11 ordinal
A scale with better psychometric properties is based on the ordinal values of the items.count mis= alo1 to alo11(-1).select if (mis<2).recode alo1 alo4 alo7 alo8 alo11 (3=1)(1=3).* missing values are replaced by the mean of the valid values.compute aloo= alo1+alo2+alo3+alo4+alo5+alo6+alo7+alo8+alo9+alo10+alo11.
Psychometric properties: Loevingers H= .35, Reliability ρ= .84
Value Label Value Frequency % Cum%no loneliness 11.0 1360 33.6 33.6
11.2 2 .0 33.7<interrupted>severe loneliness 33.0 11 .3 100.0
------- -------Total 4045 100.0
LSNa074N: 4,383Data about: well-beingData source: Respondent face to face interviewOther files about same topic: LSNa274Questionnaire: wbIdentification variable: RESPNR
In answering the next set of questions, you may get the feeling that you have already heard aparticular question or that we are continuously asking the same question using different words.That is indeed the case. In this study, we are trying to get as detailed a picture as possible. Allthe questions are part of a large puzzle; together they form a complete picture. For that reason,will you please answer all the questions, even though you think you already heard a particularquestion before. They are not trick questions: you do not have to give the same answer to eachquestion. The questions are different pieces of a larger whole.
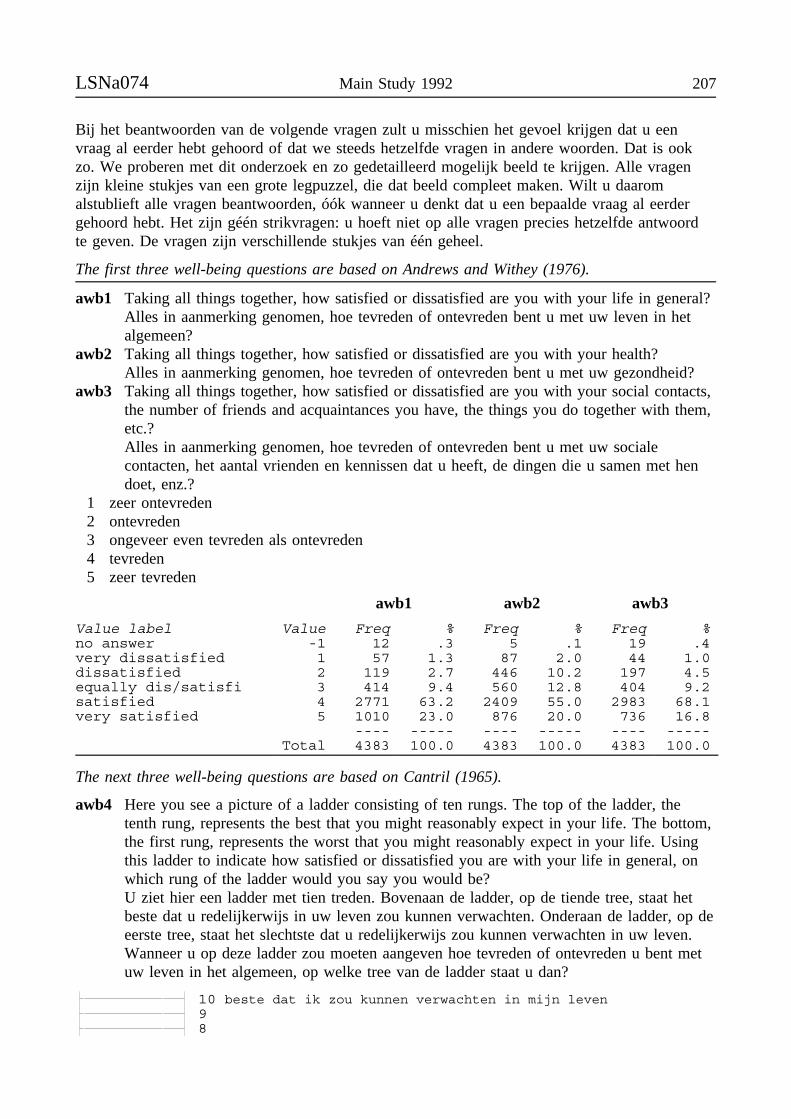
LSNa074 Main Study 1992 207
Bij het beantwoorden van de volgende vragen zult u misschien het gevoel krijgen dat u eenvraag al eerder hebt gehoord of dat we steeds hetzelfde vragen in andere woorden. Dat is ookzo. We proberen met dit onderzoek en zo gedetailleerd mogelijk beeld te krijgen. Alle vragenzijn kleine stukjes van een grote legpuzzel, die dat beeld compleet maken. Wilt u daaromalstublieft alle vragen beantwoorden, óók wanneer u denkt dat u een bepaalde vraag al eerdergehoord hebt. Het zijn géén strikvragen: u hoeft niet op alle vragen precies hetzelfde antwoordte geven. De vragen zijn verschillende stukjes van één geheel.
The first three well-being questions are based on Andrews and Withey (1976).
awb1 Taking all things together, how satisfied or dissatisfied are you with your life in general?Alles in aanmerking genomen, hoe tevreden of ontevreden bent u met uw leven in hetalgemeen?
awb2 Taking all things together, how satisfied or dissatisfied are you with your health?Alles in aanmerking genomen, hoe tevreden of ontevreden bent u met uw gezondheid?
awb3 Taking all things together, how satisfied or dissatisfied are you with your social contacts,the number of friends and acquaintances you have, the things you do together with them,etc.?Alles in aanmerking genomen, hoe tevreden of ontevreden bent u met uw socialecontacten, het aantal vrienden en kennissen dat u heeft, de dingen die u samen met hendoet, enz.?
1 zeer ontevreden2 ontevreden3 ongeveer even tevreden als ontevreden4 tevreden5 zeer tevreden
awb1 awb2 awb3
Value label Value Freq % Freq % Freq %no answer -1 12 .3 5 .1 19 .4very dissatisfied 1 57 1.3 87 2.0 44 1.0dissatisfied 2 119 2.7 446 10.2 197 4.5equally dis/satisfi 3 414 9.4 560 12.8 404 9.2satisfied 4 2771 63.2 2409 55.0 2983 68.1very satisfied 5 1010 23.0 876 20.0 736 16.8
---- ----- ---- ----- ---- -----Total 4383 100.0 4383 100.0 4383 100.0
The next three well-being questions are based on Cantril (1965).
awb4 Here you see a picture of a ladder consisting of ten rungs. The top of the ladder, thetenth rung, represents the best that you might reasonably expect in your life. The bottom,the first rung, represents the worst that you might reasonably expect in your life. Usingthis ladder to indicate how satisfied or dissatisfied you are with your life in general, onwhich rung of the ladder would you say you would be?U ziet hier een ladder met tien treden. Bovenaan de ladder, op de tiende tree, staat hetbeste dat u redelijkerwijs in uw leven zou kunnen verwachten. Onderaan de ladder, op deeerste tree, staat het slechtste dat u redelijkerwijs zou kunnen verwachten in uw leven.Wanneer u op deze ladder zou moeten aangeven hoe tevreden of ontevreden u bent metuw leven in het algemeen, op welke tree van de ladder staat u dan?
10 beste dat ik zou kunnen verwachten in mijn leven98
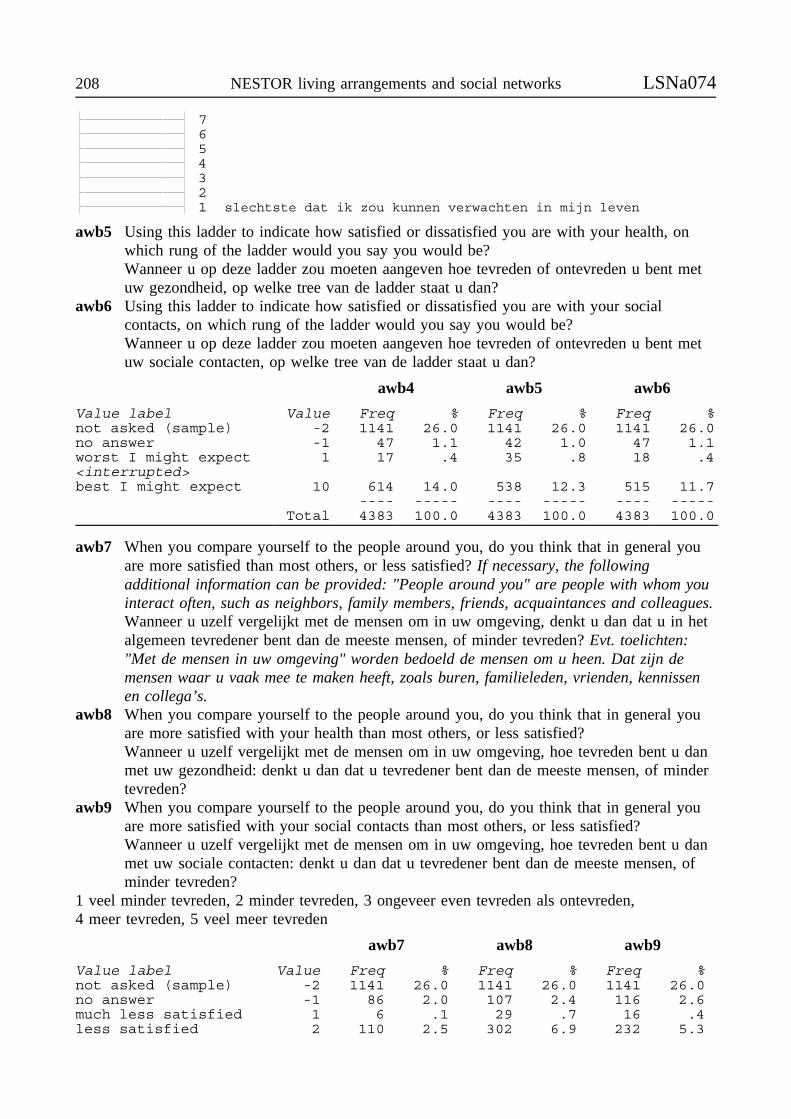
208 NESTOR living arrangements and social networks LSNa074
7654321 slechtste dat ik zou kunnen verwachten in mijn leven
awb5 Using this ladder to indicate how satisfied or dissatisfied you are with your health, onwhich rung of the ladder would you say you would be?Wanneer u op deze ladder zou moeten aangeven hoe tevreden of ontevreden u bent metuw gezondheid, op welke tree van de ladder staat u dan?
awb6 Using this ladder to indicate how satisfied or dissatisfied you are with your socialcontacts, on which rung of the ladder would you say you would be?Wanneer u op deze ladder zou moeten aangeven hoe tevreden of ontevreden u bent metuw sociale contacten, op welke tree van de ladder staat u dan?
awb4 awb5 awb6
Value label Value Freq % Freq % Freq %not asked (sample) -2 1141 26.0 1141 26.0 1141 26.0no answer -1 47 1.1 42 1.0 47 1.1worst I might expect 1 17 .4 35 .8 18 .4<interrupted>best I might expect 10 614 14.0 538 12.3 515 11.7
---- ----- ---- ----- ---- -----Total 4383 100.0 4383 100.0 4383 100.0
awb7 When you compare yourself to the people around you, do you think that in general youare more satisfied than most others, or less satisfied? If necessary, the followingadditional information can be provided: "People around you" are people with whom youinteract often, such as neighbors, family members, friends, acquaintances and colleagues.Wanneer u uzelf vergelijkt met de mensen om in uw omgeving, denkt u dan dat u in hetalgemeen tevredener bent dan de meeste mensen, of minder tevreden? Evt. toelichten:"Met de mensen in uw omgeving" worden bedoeld de mensen om u heen. Dat zijn demensen waar u vaak mee te maken heeft, zoals buren, familieleden, vrienden, kennissenen collega’s.
awb8 When you compare yourself to the people around you, do you think that in general youare more satisfied with your health than most others, or less satisfied?Wanneer u uzelf vergelijkt met de mensen om in uw omgeving, hoe tevreden bent u danmet uw gezondheid: denkt u dan dat u tevredener bent dan de meeste mensen, of mindertevreden?
awb9 When you compare yourself to the people around you, do you think that in general youare more satisfied with your social contacts than most others, or less satisfied?Wanneer u uzelf vergelijkt met de mensen om in uw omgeving, hoe tevreden bent u danmet uw sociale contacten: denkt u dan dat u tevredener bent dan de meeste mensen, ofminder tevreden?
1 veel minder tevreden, 2 minder tevreden, 3 ongeveer even tevreden als ontevreden,4 meer tevreden, 5 veel meer tevreden
awb7 awb8 awb9
Value label Value Freq % Freq % Freq %not asked (sample) -2 1141 26.0 1141 26.0 1141 26.0no answer -1 86 2.0 107 2.4 116 2.6much less satisfied 1 6 .1 29 .7 16 .4less satisfied 2 110 2.5 302 6.9 232 5.3
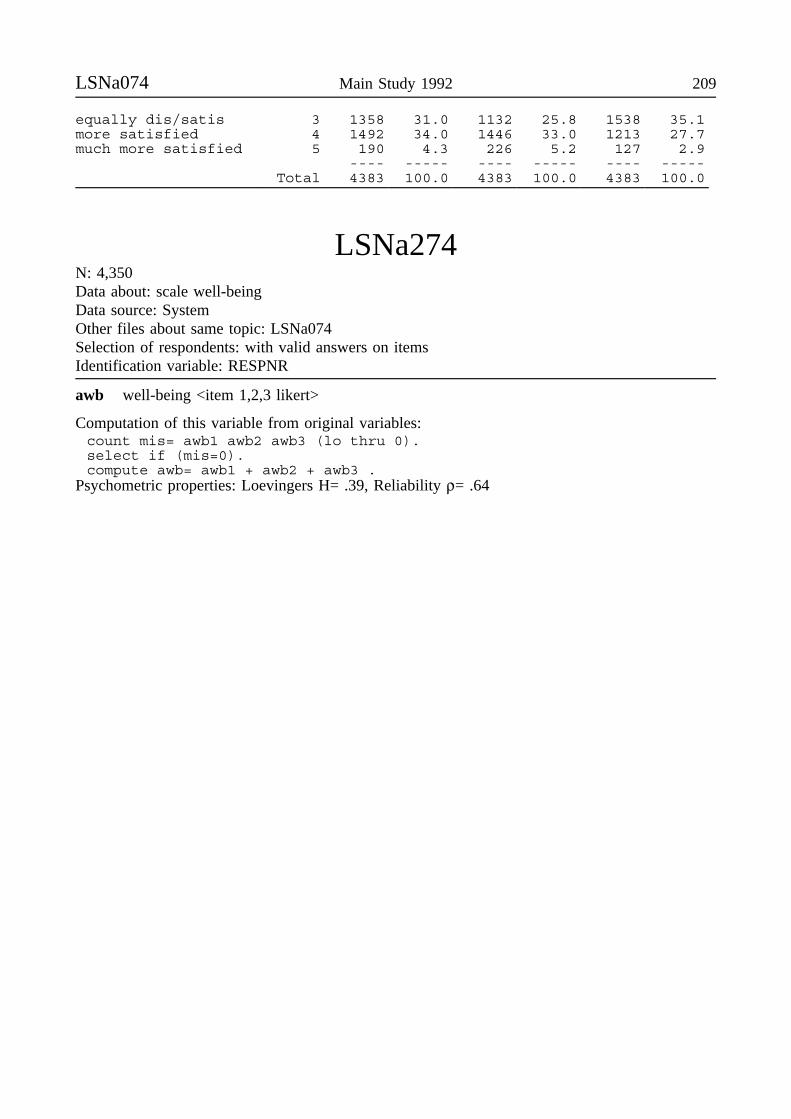
LSNa074 Main Study 1992 209
equally dis/satis 3 1358 31.0 1132 25.8 1538 35.1more satisfied 4 1492 34.0 1446 33.0 1213 27.7much more satisfied 5 190 4.3 226 5.2 127 2.9
---- ----- ---- ----- ---- -----Total 4383 100.0 4383 100.0 4383 100.0
LSNa274N: 4,350Data about: scale well-beingData source: SystemOther files about same topic: LSNa074Selection of respondents: with valid answers on itemsIdentification variable: RESPNR
awb well-being <item 1,2,3 likert>
Computation of this variable from original variables:count mis= awb1 awb2 awb3 (lo thru 0).select if (mis=0).compute awb= awb1 + awb2 + awb3 .
Psychometric properties: Loevingers H= .39, Reliability ρ= .64
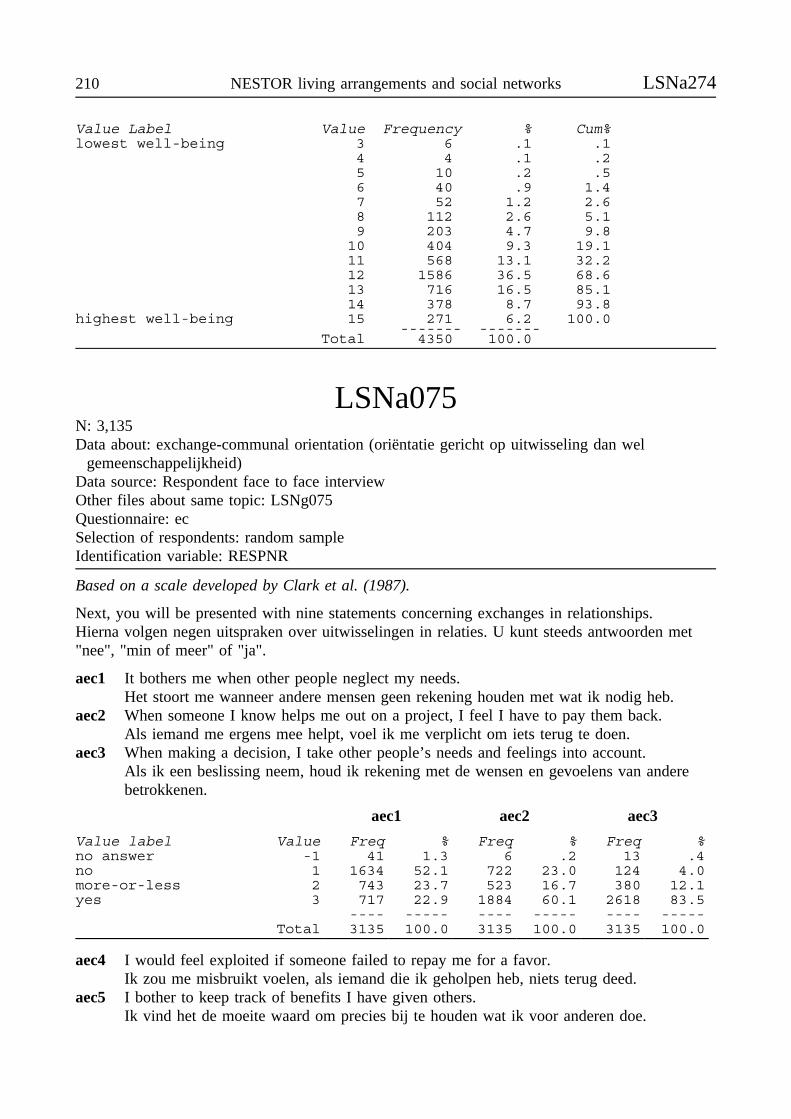
210 NESTOR living arrangements and social networks LSNa274
Value Label Value Frequency % Cum%lowest well-being 3 6 .1 .1
4 4 .1 .25 10 .2 .56 40 .9 1.47 52 1.2 2.68 112 2.6 5.19 203 4.7 9.8
10 404 9.3 19.111 568 13.1 32.212 1586 36.5 68.613 716 16.5 85.114 378 8.7 93.8
highest well-being 15 271 6.2 100.0------- -------
Total 4350 100.0
LSNa075N: 3,135Data about: exchange-communal orientation (oriëntatie gericht op uitwisseling dan wel
gemeenschappelijkheid)Data source: Respondent face to face interviewOther files about same topic: LSNg075Questionnaire: ecSelection of respondents: random sampleIdentification variable: RESPNR
Based on a scale developed by Clark et al. (1987).
Next, you will be presented with nine statements concerning exchanges in relationships.Hierna volgen negen uitspraken over uitwisselingen in relaties. U kunt steeds antwoorden met"nee", "min of meer" of "ja".
aec1 It bothers me when other people neglect my needs.Het stoort me wanneer andere mensen geen rekening houden met wat ik nodig heb.
aec2 When someone I know helps me out on a project, I feel I have to pay them back.Als iemand me ergens mee helpt, voel ik me verplicht om iets terug te doen.
aec3 When making a decision, I take other people’s needs and feelings into account.Als ik een beslissing neem, houd ik rekening met de wensen en gevoelens van anderebetrokkenen.
aec1 aec2 aec3
Value label Value Freq % Freq % Freq %no answer -1 41 1.3 6 .2 13 .4no 1 1634 52.1 722 23.0 124 4.0more-or-less 2 743 23.7 523 16.7 380 12.1yes 3 717 22.9 1884 60.1 2618 83.5
---- ----- ---- ----- ---- -----Total 3135 100.0 3135 100.0 3135 100.0
aec4 I would feel exploited if someone failed to repay me for a favor.Ik zou me misbruikt voelen, als iemand die ik geholpen heb, niets terug deed.
aec5 I bother to keep track of benefits I have given others.Ik vind het de moeite waard om precies bij te houden wat ik voor anderen doe.

LSNa075 Main Study 1992 211
aec6 I expect people I know to be responsive to my needs and feelings.Ik verwacht van mensen die ik ken, dat ze open staan voor mijn behoeften en gevoelens.
aec4 aec5 aec6
Value label Value Freq % Freq % Freq %no answer -1 13 .4 14 .4 20 .6no 1 2258 72.0 2812 89.7 1283 40.9more-or-less 2 360 11.5 118 3.8 793 25.3yes 3 504 16.1 191 6.1 1039 33.1
---- ----- ---- ----- ---- -----Total 3135 100.0 3135 100.0 3135 100.0
aec7 It’s best to make sure things are always kept ’even’ between two people in a relationship.Ik let er op dat mijn relatie met een ander in evenwicht blijft.
aec8 When I have a need that others ignore, I’m hurt.Het kwetst me wanneer mensen een bepaalde wens van mij negeren.
aec9 I think people should feel obligated to repay others for favors.Mensen die ik heb geholpen, moeten zich verplicht voelen om iets voor mij terug tedoen.
aec7 aec8 aec9
Value label Value Freq % Freq % Freq %no answer -1 17 .5 39 1.2 8 .3no 1 264 8.4 1327 42.3 2937 93.7more-or-less 2 339 10.8 776 24.8 89 2.8yes 3 2515 80.2 993 31.7 101 3.2
---- ----- ---- ----- ---- -----Total 3135 100.0 3135 100.0 3135 100.0
LSNa275N: 3,105Data about: scale exchange orientationData source: SystemOther files about same topic: LSNa075, LSNg275Selection of respondents: with valid answers on itemsIdentification variable: RESPNR
aexch exchange orientation <2,4,5,9><ord>
Computation of this variable from original variables:count mis= aec2 aec4 aec5 aec9 (-1).select if (mis=0).compute aexch= aec2+aec4+aec5+aec9.
Psychometric properties: Loevingers H= .46, Reliability ρ= .57
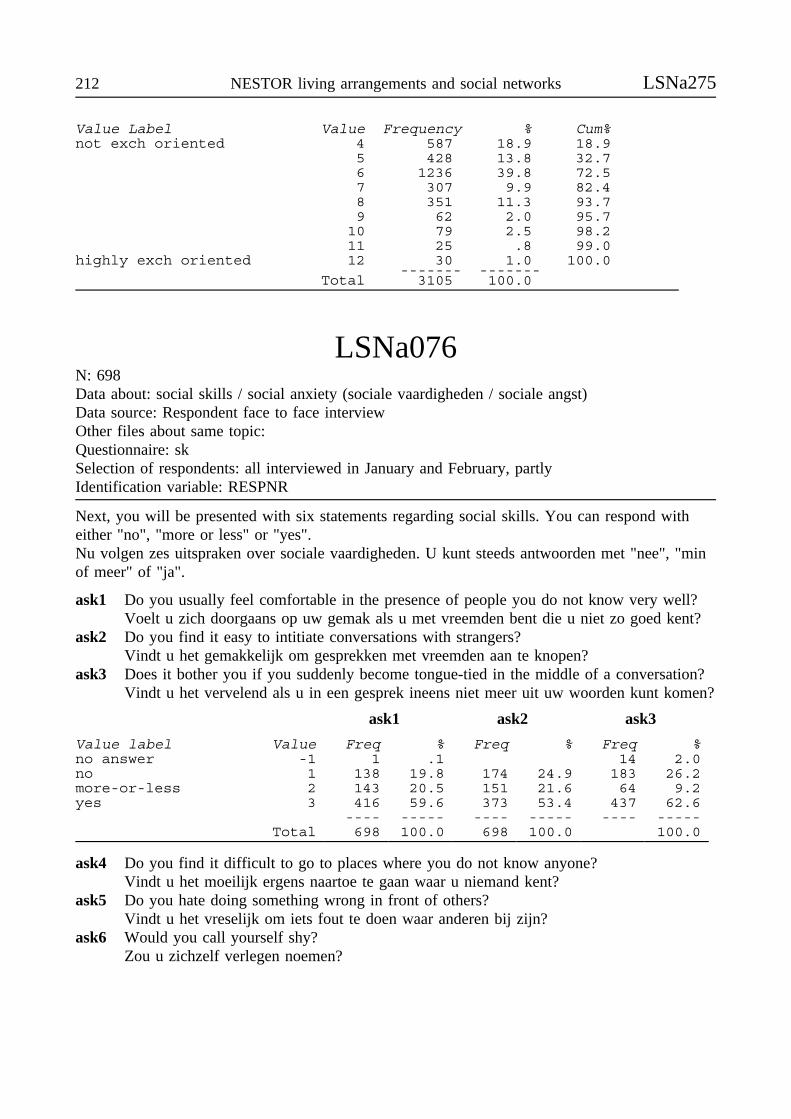
212 NESTOR living arrangements and social networks LSNa275
Value Label Value Frequency % Cum%not exch oriented 4 587 18.9 18.9
5 428 13.8 32.76 1236 39.8 72.57 307 9.9 82.48 351 11.3 93.79 62 2.0 95.7
10 79 2.5 98.211 25 .8 99.0
highly exch oriented 12 30 1.0 100.0------- -------
Total 3105 100.0
LSNa076N: 698Data about: social skills / social anxiety (sociale vaardigheden / sociale angst)Data source: Respondent face to face interviewOther files about same topic:Questionnaire: skSelection of respondents: all interviewed in January and February, partlyIdentification variable: RESPNR
Next, you will be presented with six statements regarding social skills. You can respond witheither "no", "more or less" or "yes".Nu volgen zes uitspraken over sociale vaardigheden. U kunt steeds antwoorden met "nee", "minof meer" of "ja".
ask1 Do you usually feel comfortable in the presence of people you do not know very well?Voelt u zich doorgaans op uw gemak als u met vreemden bent die u niet zo goed kent?
ask2 Do you find it easy to intitiate conversations with strangers?Vindt u het gemakkelijk om gesprekken met vreemden aan te knopen?
ask3 Does it bother you if you suddenly become tongue-tied in the middle of a conversation?Vindt u het vervelend als u in een gesprek ineens niet meer uit uw woorden kunt komen?
ask1 ask2 ask3
Value label Value Freq % Freq % Freq %no answer -1 1 .1 14 2.0no 1 138 19.8 174 24.9 183 26.2more-or-less 2 143 20.5 151 21.6 64 9.2yes 3 416 59.6 373 53.4 437 62.6
---- ----- ---- ----- ---- -----Total 698 100.0 698 100.0 100.0
ask4 Do you find it difficult to go to places where you do not know anyone?Vindt u het moeilijk ergens naartoe te gaan waar u niemand kent?
ask5 Do you hate doing something wrong in front of others?Vindt u het vreselijk om iets fout te doen waar anderen bij zijn?
ask6 Would you call yourself shy?Zou u zichzelf verlegen noemen?
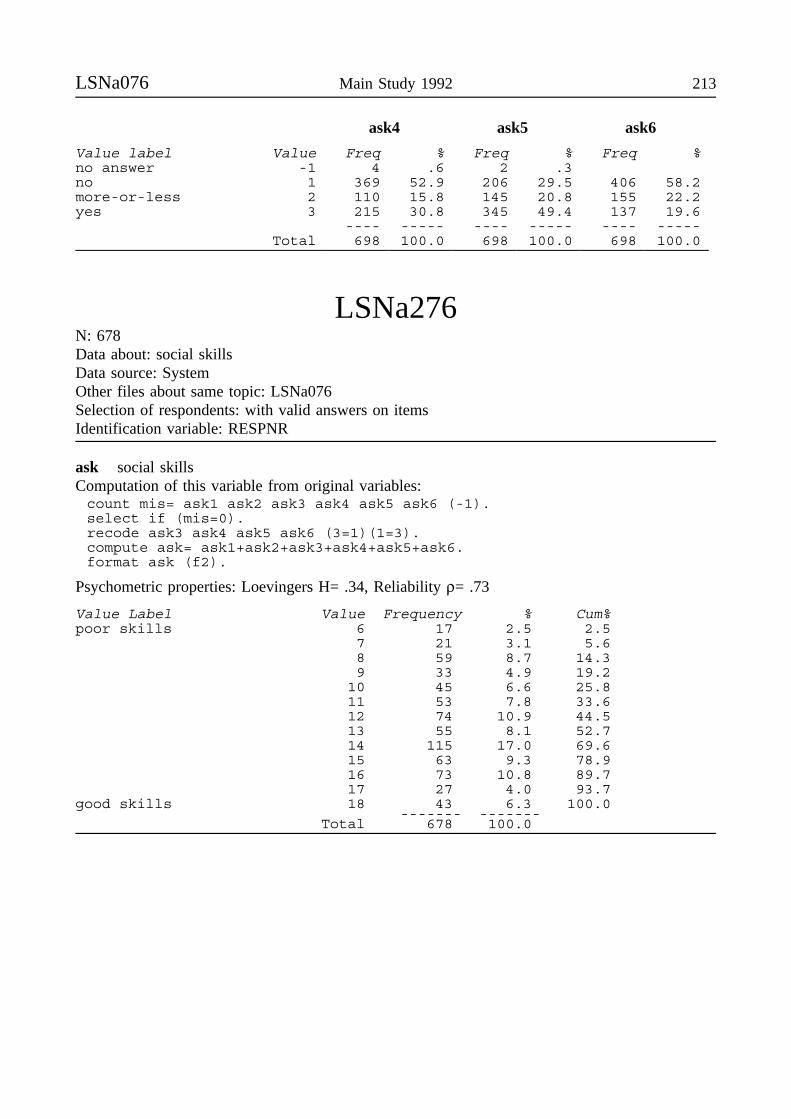
LSNa076 Main Study 1992 213
ask4 ask5 ask6
Value label Value Freq % Freq % Freq %no answer -1 4 .6 2 .3no 1 369 52.9 206 29.5 406 58.2more-or-less 2 110 15.8 145 20.8 155 22.2yes 3 215 30.8 345 49.4 137 19.6
---- ----- ---- ----- ---- -----Total 698 100.0 698 100.0 698 100.0
LSNa276N: 678Data about: social skillsData source: SystemOther files about same topic: LSNa076Selection of respondents: with valid answers on itemsIdentification variable: RESPNR
ask social skillsComputation of this variable from original variables:count mis= ask1 ask2 ask3 ask4 ask5 ask6 (-1).select if (mis=0).recode ask3 ask4 ask5 ask6 (3=1)(1=3).compute ask= ask1+ask2+ask3+ask4+ask5+ask6.format ask (f2).
Psychometric properties: Loevingers H= .34, Reliability ρ= .73
Value Label Value Frequency % Cum%poor skills 6 17 2.5 2.5
7 21 3.1 5.68 59 8.7 14.39 33 4.9 19.2
10 45 6.6 25.811 53 7.8 33.612 74 10.9 44.513 55 8.1 52.714 115 17.0 69.615 63 9.3 78.916 73 10.8 89.717 27 4.0 93.7
good skills 18 43 6.3 100.0------- -------
Total 678 100.0
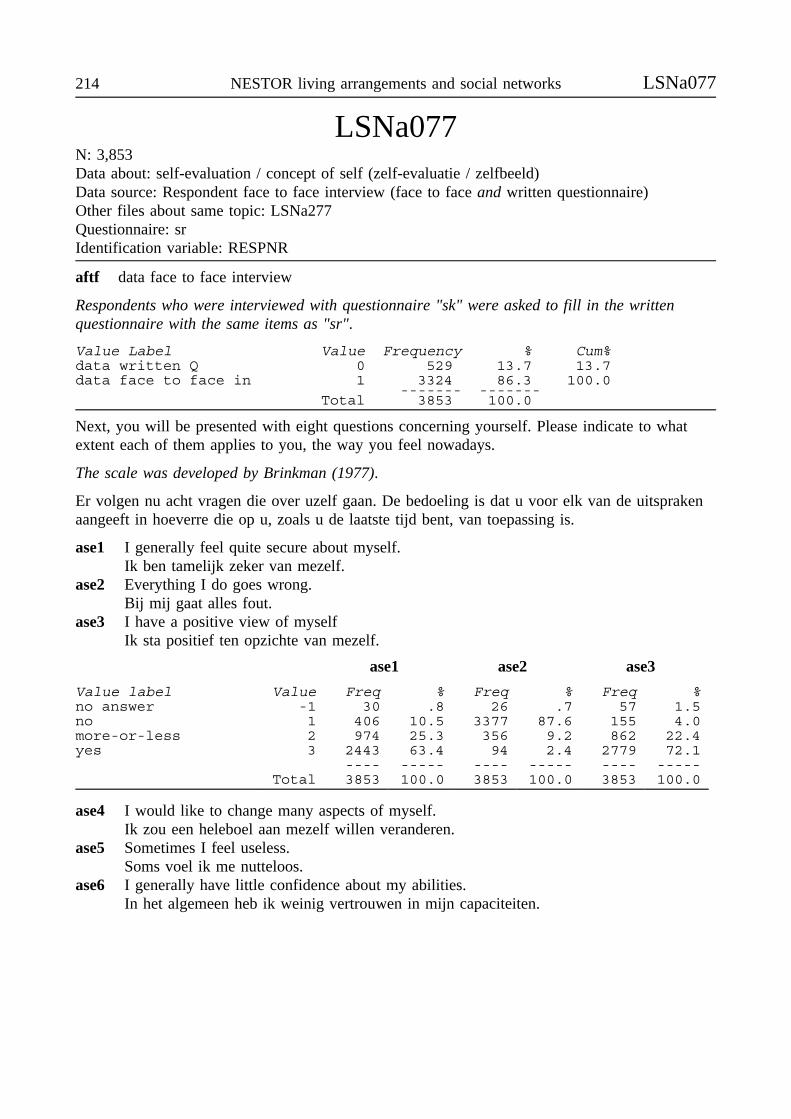
214 NESTOR living arrangements and social networks LSNa077
LSNa077N: 3,853Data about: self-evaluation / concept of self (zelf-evaluatie / zelfbeeld)Data source: Respondent face to face interview (face to face and written questionnaire)Other files about same topic: LSNa277Questionnaire: srIdentification variable: RESPNR
aftf data face to face interview
Respondents who were interviewed with questionnaire "sk" were asked to fill in the writtenquestionnaire with the same items as "sr".
Value Label Value Frequency % Cum%data written Q 0 529 13.7 13.7data face to face in 1 3324 86.3 100.0
------- -------Total 3853 100.0
Next, you will be presented with eight questions concerning yourself. Please indicate to whatextent each of them applies to you, the way you feel nowadays.
The scale was developed by Brinkman (1977).
Er volgen nu acht vragen die over uzelf gaan. De bedoeling is dat u voor elk van de uitsprakenaangeeft in hoeverre die op u, zoals u de laatste tijd bent, van toepassing is.
ase1 I generally feel quite secure about myself.Ik ben tamelijk zeker van mezelf.
ase2 Everything I do goes wrong.Bij mij gaat alles fout.
ase3 I have a positive view of myselfIk sta positief ten opzichte van mezelf.
ase1 ase2 ase3
Value label Value Freq % Freq % Freq %no answer -1 30 .8 26 .7 57 1.5no 1 406 10.5 3377 87.6 155 4.0more-or-less 2 974 25.3 356 9.2 862 22.4yes 3 2443 63.4 94 2.4 2779 72.1
---- ----- ---- ----- ---- -----Total 3853 100.0 3853 100.0 3853 100.0
ase4 I would like to change many aspects of myself.Ik zou een heleboel aan mezelf willen veranderen.
ase5 Sometimes I feel useless.Soms voel ik me nutteloos.
ase6 I generally have little confidence about my abilities.In het algemeen heb ik weinig vertrouwen in mijn capaciteiten.
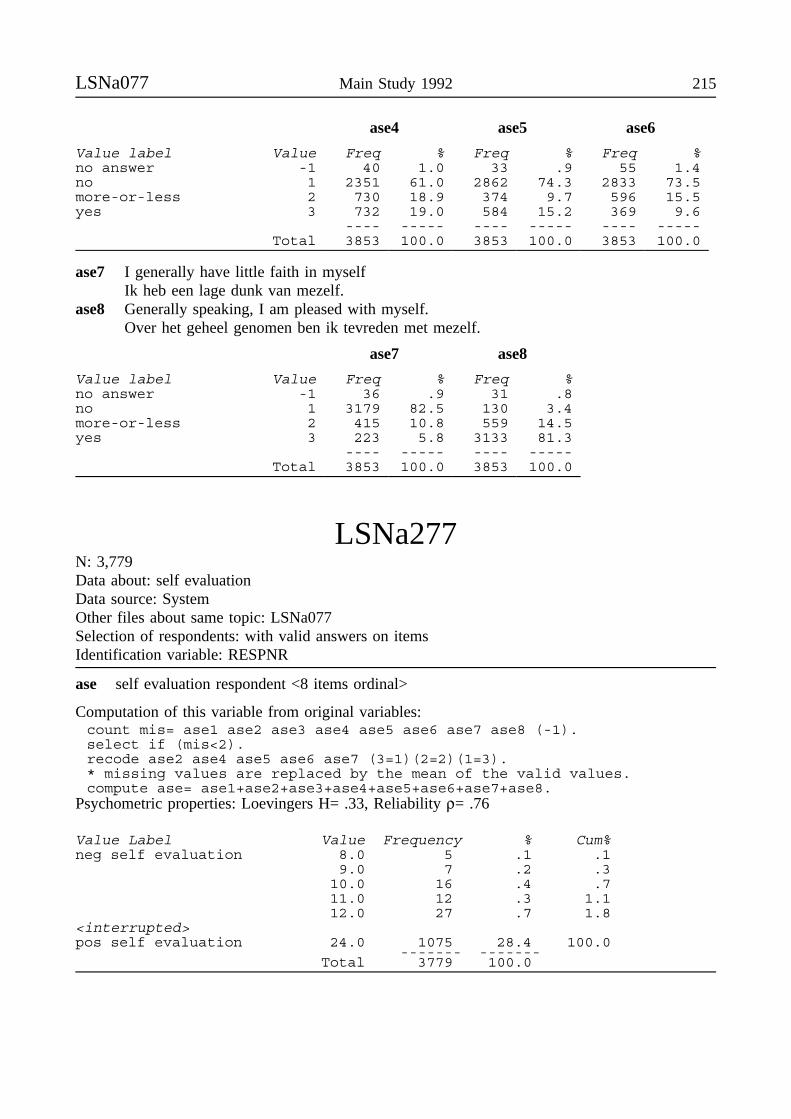
LSNa077 Main Study 1992 215
ase4 ase5 ase6
Value label Value Freq % Freq % Freq %no answer -1 40 1.0 33 .9 55 1.4no 1 2351 61.0 2862 74.3 2833 73.5more-or-less 2 730 18.9 374 9.7 596 15.5yes 3 732 19.0 584 15.2 369 9.6
---- ----- ---- ----- ---- -----Total 3853 100.0 3853 100.0 3853 100.0
ase7 I generally have little faith in myselfIk heb een lage dunk van mezelf.
ase8 Generally speaking, I am pleased with myself.Over het geheel genomen ben ik tevreden met mezelf.
ase7 ase8
Value label Value Freq % Freq %no answer -1 36 .9 31 .8no 1 3179 82.5 130 3.4more-or-less 2 415 10.8 559 14.5yes 3 223 5.8 3133 81.3
---- ----- ---- -----Total 3853 100.0 3853 100.0
LSNa277N: 3,779Data about: self evaluationData source: SystemOther files about same topic: LSNa077Selection of respondents: with valid answers on itemsIdentification variable: RESPNR
ase self evaluation respondent <8 items ordinal>
Computation of this variable from original variables:count mis= ase1 ase2 ase3 ase4 ase5 ase6 ase7 ase8 (-1).select if (mis<2).recode ase2 ase4 ase5 ase6 ase7 (3=1)(2=2)(1=3).* missing values are replaced by the mean of the valid values.compute ase= ase1+ase2+ase3+ase4+ase5+ase6+ase7+ase8.
Psychometric properties: Loevingers H= .33, Reliability ρ= .76
Value Label Value Frequency % Cum%neg self evaluation 8.0 5 .1 .1
9.0 7 .2 .310.0 16 .4 .711.0 12 .3 1.112.0 27 .7 1.8
<interrupted>pos self evaluation 24.0 1075 28.4 100.0
------- -------Total 3779 100.0

216 NESTOR living arrangements and social networks LSNa078
LSNa078N: 1,568Data about: need for affiliation (behoefte aan verbondenheid)Data source: Respondent face to face interviewOther files about same topic: LSNa278Questionnaire: anIdentification variable: RESPNR
Scale developed by Van Tilburg (1988).
Next, I will read 10 statements to you. They deal with what you consider to be important inyour ties with others. You can respond with either "no", "more or less" or "yes".Ik leg nu 10 uitspraken aan u voor, die betrekking hebben op wat u belangrijk vindt in uwcontacten. U kunt steeds antwoorden met "nee", "min of meer" of "ja".
aan1 I want to talk to others about what I feel, about my inner experiences.Ik wil met anderen praten over wat ik voel, wat ik innerlijk meemaak.
aan2 I dislike having to ask for advice.Ik vind het vervelend om raad te moeten vragen.
aan3 I think it is better to restrain myself emotionally.Ik vind het beter om me emotioneel in te houden.
aan1 aan2 aan3
Value label Value Freq % Freq % Freq %no answer -1 4 .3 3 .2 6 .4no 1 707 45.1 778 49.6 373 23.8more-or-less 2 324 20.7 173 11.0 254 16.2yes 3 533 34.0 614 39.2 935 59.6
---- ----- ---- ----- ---- -----Total 1568 100.0 1568 100.0 1568 100.0
aan4 When I am in trouble, I need help and support from others.Als ik in moeilijkheden zit, heb ik behoefte aan hulp en steun van anderen.
aan5 I prefer to keep emotional problems to myself.Emotionele problemen houd ik liever voor me.
aan6 I try to cope with sorrows on my own.Verdriet probeer ik zelf te verwerken.
aan4 aan5 aan6
Value label Value Freq % Freq % Freq %no answer -1 10 .6 4 .3 3 .2no 1 383 24.4 262 16.7 146 9.3more-or-less 2 306 19.5 230 14.7 185 11.8yes 3 869 55.4 1072 68.4 1234 78.7
---- ----- ---- ----- ---- -----Total 1568 100.0 1568 100.0 1568 100.0
aan7 I want to share my inner life.Ik wil m’n gevoelsleven delen.
aan8 When something bothers me, I like to go to others for advice.Als ik met iets zit, stap ik graag naar iemand toe.
aan9 My feelings are my own business.Gevoelens zijn m’n eigen zaak.
aan10 Particularly when I am experiencing difficulties, I like to lean on someone.
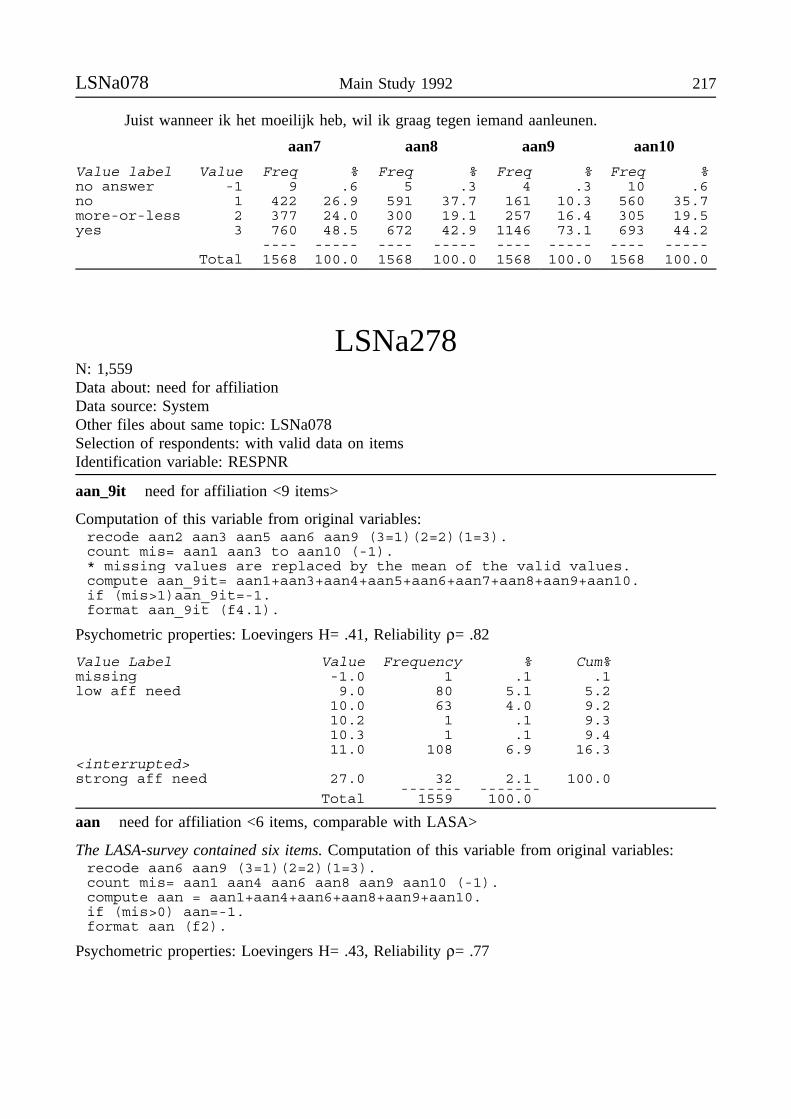
LSNa078 Main Study 1992 217
Juist wanneer ik het moeilijk heb, wil ik graag tegen iemand aanleunen.
aan7 aan8 aan9 aan10
Value label Value Freq % Freq % Freq % Freq %no answer -1 9 .6 5 .3 4 .3 10 .6no 1 422 26.9 591 37.7 161 10.3 560 35.7more-or-less 2 377 24.0 300 19.1 257 16.4 305 19.5yes 3 760 48.5 672 42.9 1146 73.1 693 44.2
---- ----- ---- ----- ---- ----- ---- -----Total 1568 100.0 1568 100.0 1568 100.0 1568 100.0
LSNa278N: 1,559Data about: need for affiliationData source: SystemOther files about same topic: LSNa078Selection of respondents: with valid data on itemsIdentification variable: RESPNR
aan_9it need for affiliation <9 items>
Computation of this variable from original variables:recode aan2 aan3 aan5 aan6 aan9 (3=1)(2=2)(1=3).count mis= aan1 aan3 to aan10 (-1).* missing values are replaced by the mean of the valid values.compute aan_9it= aan1+aan3+aan4+aan5+aan6+aan7+aan8+aan9+aan10.if (mis>1)aan_9it=-1.format aan_9it (f4.1).
Psychometric properties: Loevingers H= .41, Reliability ρ= .82
Value Label Value Frequency % Cum%missing -1.0 1 .1 .1low aff need 9.0 80 5.1 5.2
10.0 63 4.0 9.210.2 1 .1 9.310.3 1 .1 9.411.0 108 6.9 16.3
<interrupted>strong aff need 27.0 32 2.1 100.0
------- -------Total 1559 100.0
aan need for affiliation <6 items, comparable with LASA>
The LASA-survey contained six items. Computation of this variable from original variables:recode aan6 aan9 (3=1)(2=2)(1=3).count mis= aan1 aan4 aan6 aan8 aan9 aan10 (-1).compute aan = aan1+aan4+aan6+aan8+aan9+aan10.if (mis>0) aan=-1.format aan (f2).
Psychometric properties: Loevingers H= .43, Reliability ρ= .77
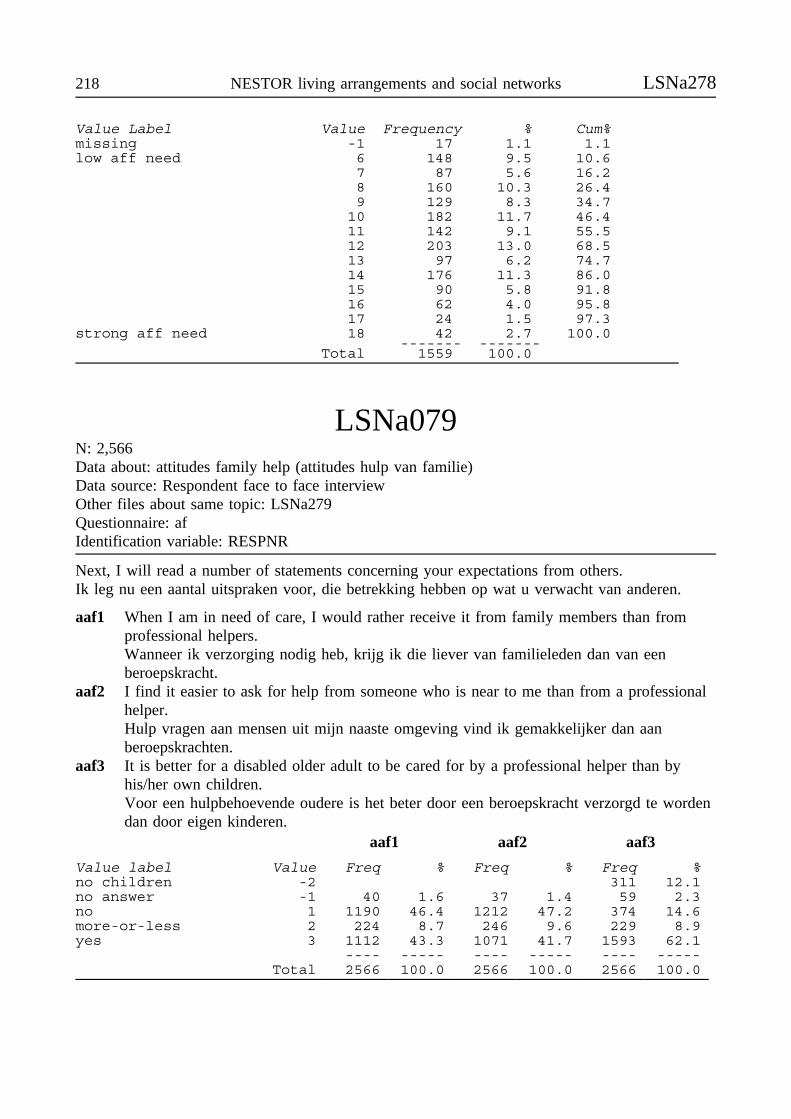
218 NESTOR living arrangements and social networks LSNa278
Value Label Value Frequency % Cum%missing -1 17 1.1 1.1low aff need 6 148 9.5 10.6
7 87 5.6 16.28 160 10.3 26.49 129 8.3 34.7
10 182 11.7 46.411 142 9.1 55.512 203 13.0 68.513 97 6.2 74.714 176 11.3 86.015 90 5.8 91.816 62 4.0 95.817 24 1.5 97.3
strong aff need 18 42 2.7 100.0------- -------
Total 1559 100.0
LSNa079N: 2,566Data about: attitudes family help (attitudes hulp van familie)Data source: Respondent face to face interviewOther files about same topic: LSNa279Questionnaire: afIdentification variable: RESPNR
Next, I will read a number of statements concerning your expectations from others.Ik leg nu een aantal uitspraken voor, die betrekking hebben op wat u verwacht van anderen.
aaf1 When I am in need of care, I would rather receive it from family members than fromprofessional helpers.Wanneer ik verzorging nodig heb, krijg ik die liever van familieleden dan van eenberoepskracht.
aaf2 I find it easier to ask for help from someone who is near to me than from a professionalhelper.Hulp vragen aan mensen uit mijn naaste omgeving vind ik gemakkelijker dan aanberoepskrachten.
aaf3 It is better for a disabled older adult to be cared for by a professional helper than byhis/her own children.Voor een hulpbehoevende oudere is het beter door een beroepskracht verzorgd te wordendan door eigen kinderen.
aaf1 aaf2 aaf3
Value label Value Freq % Freq % Freq %no children -2 311 12.1no answer -1 40 1.6 37 1.4 59 2.3no 1 1190 46.4 1212 47.2 374 14.6more-or-less 2 224 8.7 246 9.6 229 8.9yes 3 1112 43.3 1071 41.7 1593 62.1
---- ----- ---- ----- ---- -----Total 2566 100.0 2566 100.0 2566 100.0
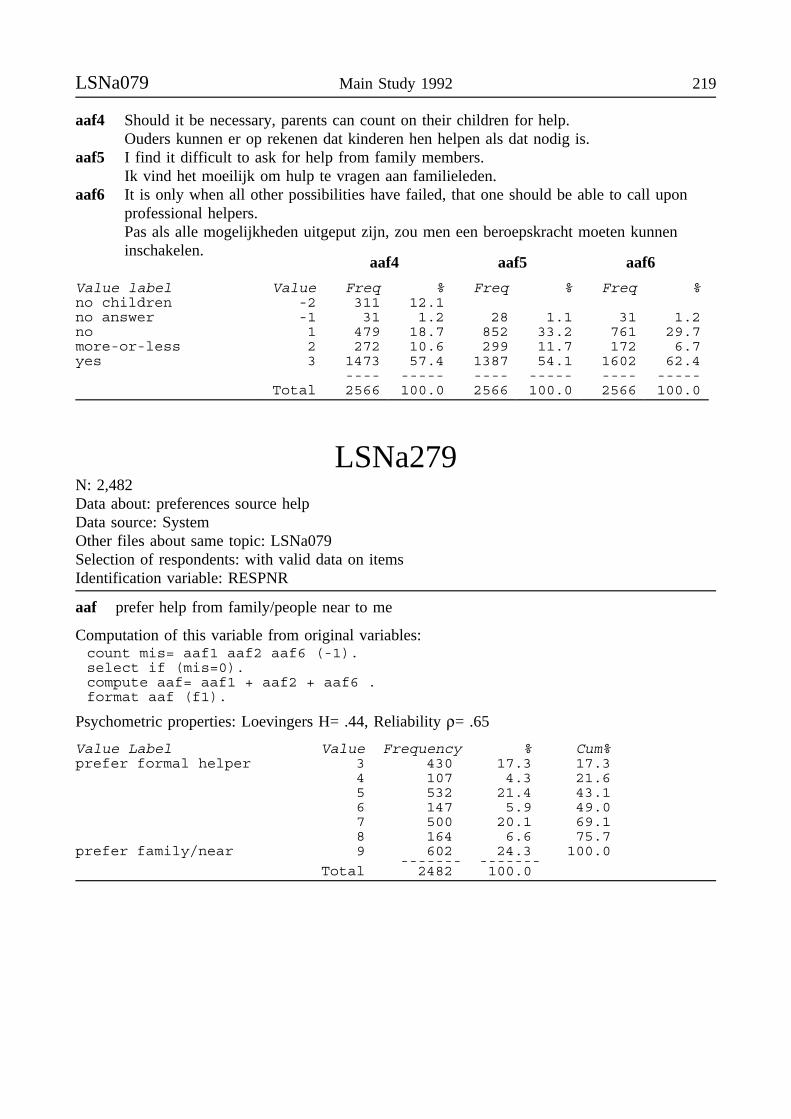
LSNa079 Main Study 1992 219
aaf4 Should it be necessary, parents can count on their children for help.Ouders kunnen er op rekenen dat kinderen hen helpen als dat nodig is.
aaf5 I find it difficult to ask for help from family members.Ik vind het moeilijk om hulp te vragen aan familieleden.
aaf6 It is only when all other possibilities have failed, that one should be able to call uponprofessional helpers.Pas als alle mogelijkheden uitgeput zijn, zou men een beroepskracht moeten kunneninschakelen.
aaf4 aaf5 aaf6
Value label Value Freq % Freq % Freq %no children -2 311 12.1no answer -1 31 1.2 28 1.1 31 1.2no 1 479 18.7 852 33.2 761 29.7more-or-less 2 272 10.6 299 11.7 172 6.7yes 3 1473 57.4 1387 54.1 1602 62.4
---- ----- ---- ----- ---- -----Total 2566 100.0 2566 100.0 2566 100.0
LSNa279N: 2,482Data about: preferences source helpData source: SystemOther files about same topic: LSNa079Selection of respondents: with valid data on itemsIdentification variable: RESPNR
aaf prefer help from family/people near to me
Computation of this variable from original variables:count mis= aaf1 aaf2 aaf6 (-1).select if (mis=0).compute aaf= aaf1 + aaf2 + aaf6 .format aaf (f1).
Psychometric properties: Loevingers H= .44, Reliability ρ= .65
Value Label Value Frequency % Cum%prefer formal helper 3 430 17.3 17.3
4 107 4.3 21.65 532 21.4 43.16 147 5.9 49.07 500 20.1 69.18 164 6.6 75.7
prefer family/near 9 602 24.3 100.0------- -------
Total 2482 100.0
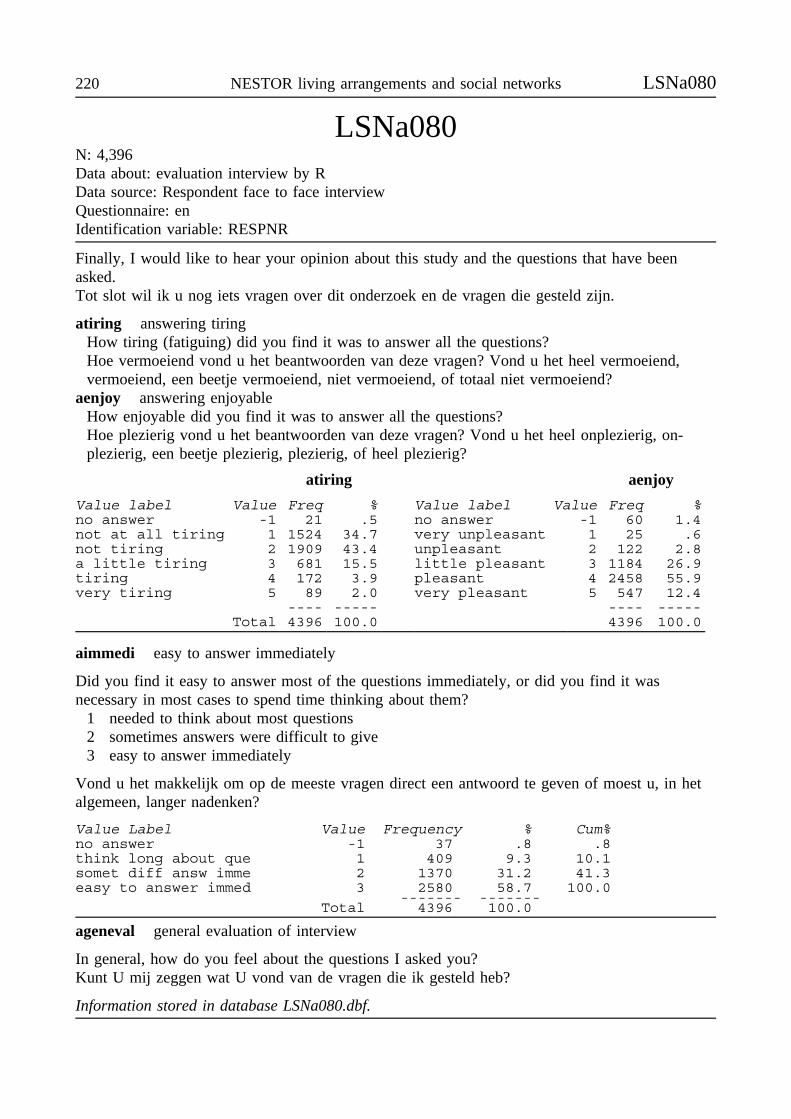
220 NESTOR living arrangements and social networks LSNa080
LSNa080N: 4,396Data about: evaluation interview by RData source: Respondent face to face interviewQuestionnaire: enIdentification variable: RESPNR
Finally, I would like to hear your opinion about this study and the questions that have beenasked.Tot slot wil ik u nog iets vragen over dit onderzoek en de vragen die gesteld zijn.
atiring answering tiringHow tiring (fatiguing) did you find it was to answer all the questions?Hoe vermoeiend vond u het beantwoorden van deze vragen? Vond u het heel vermoeiend,vermoeiend, een beetje vermoeiend, niet vermoeiend, of totaal niet vermoeiend?
aenjoy answering enjoyableHow enjoyable did you find it was to answer all the questions?Hoe plezierig vond u het beantwoorden van deze vragen? Vond u het heel onplezierig, on-plezierig, een beetje plezierig, plezierig, of heel plezierig?
atiring aenjoy
Value label Value Freq % Value label Value Freq %no answer -1 21 .5 no answer -1 60 1.4not at all tiring 1 1524 34.7 very unpleasant 1 25 .6not tiring 2 1909 43.4 unpleasant 2 122 2.8a little tiring 3 681 15.5 little pleasant 3 1184 26.9tiring 4 172 3.9 pleasant 4 2458 55.9very tiring 5 89 2.0 very pleasant 5 547 12.4
---- ----- ---- -----Total 4396 100.0 4396 100.0
aimmedi easy to answer immediately
Did you find it easy to answer most of the questions immediately, or did you find it wasnecessary in most cases to spend time thinking about them?
1 needed to think about most questions2 sometimes answers were difficult to give3 easy to answer immediately
Vond u het makkelijk om op de meeste vragen direct een antwoord te geven of moest u, in hetalgemeen, langer nadenken?
Value Label Value Frequency % Cum%no answer -1 37 .8 .8think long about que 1 409 9.3 10.1somet diff answ imme 2 1370 31.2 41.3easy to answer immed 3 2580 58.7 100.0
------- -------Total 4396 100.0
ageneval general evaluation of interview
In general, how do you feel about the questions I asked you?Kunt U mij zeggen wat U vond van de vragen die ik gesteld heb?
Information stored in database LSNa080.dbf.
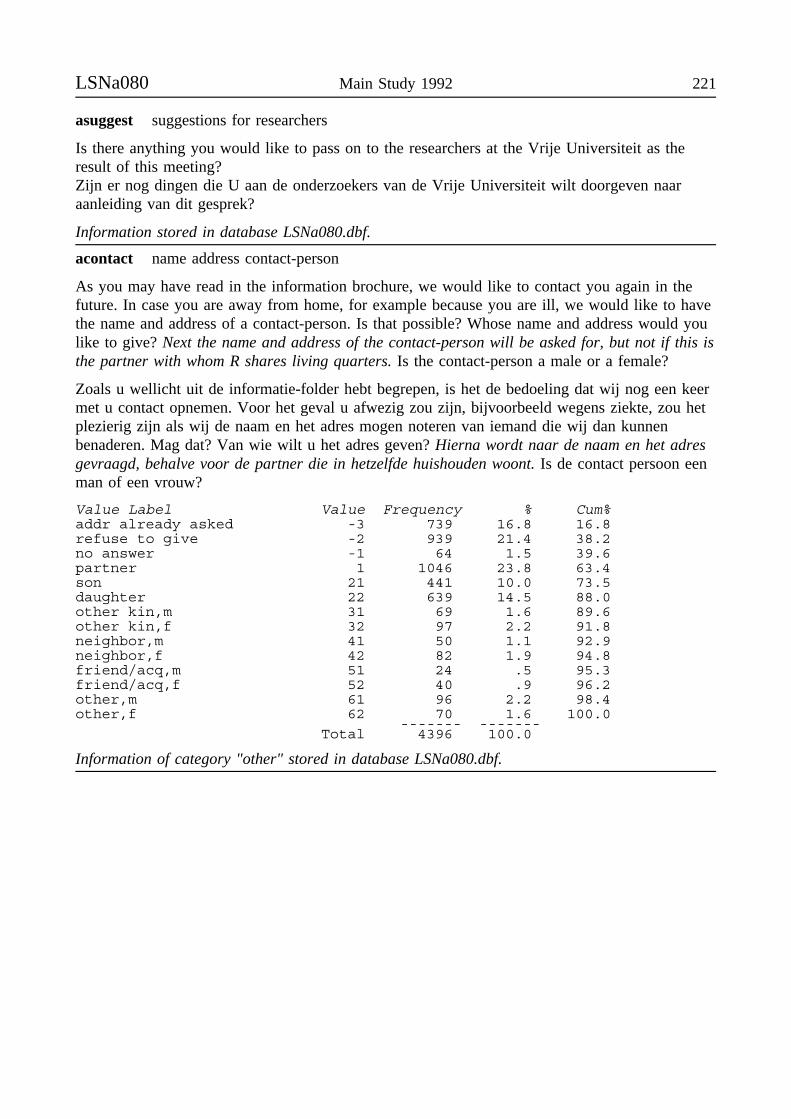
LSNa080 Main Study 1992 221
asuggest suggestions for researchers
Is there anything you would like to pass on to the researchers at the Vrije Universiteit as theresult of this meeting?Zijn er nog dingen die U aan de onderzoekers van de Vrije Universiteit wilt doorgeven naaraanleiding van dit gesprek?
Information stored in database LSNa080.dbf.
acontact name address contact-person
As you may have read in the information brochure, we would like to contact you again in thefuture. In case you are away from home, for example because you are ill, we would like to havethe name and address of a contact-person. Is that possible? Whose name and address would youlike to give? Next the name and address of the contact-person will be asked for, but not if this isthe partner with whom R shares living quarters. Is the contact-person a male or a female?
Zoals u wellicht uit de informatie-folder hebt begrepen, is het de bedoeling dat wij nog een keermet u contact opnemen. Voor het geval u afwezig zou zijn, bijvoorbeeld wegens ziekte, zou hetplezierig zijn als wij de naam en het adres mogen noteren van iemand die wij dan kunnenbenaderen. Mag dat? Van wie wilt u het adres geven? Hierna wordt naar de naam en het adresgevraagd, behalve voor de partner die in hetzelfde huishouden woont. Is de contact persoon eenman of een vrouw?
Value Label Value Frequency % Cum%addr already asked -3 739 16.8 16.8refuse to give -2 939 21.4 38.2no answer -1 64 1.5 39.6partner 1 1046 23.8 63.4son 21 441 10.0 73.5daughter 22 639 14.5 88.0other kin,m 31 69 1.6 89.6other kin,f 32 97 2.2 91.8neighbor,m 41 50 1.1 92.9neighbor,f 42 82 1.9 94.8friend/acq,m 51 24 .5 95.3friend/acq,f 52 40 .9 96.2other,m 61 96 2.2 98.4other,f 62 70 1.6 100.0
------- -------Total 4396 100.0
Information of category "other" stored in database LSNa080.dbf.
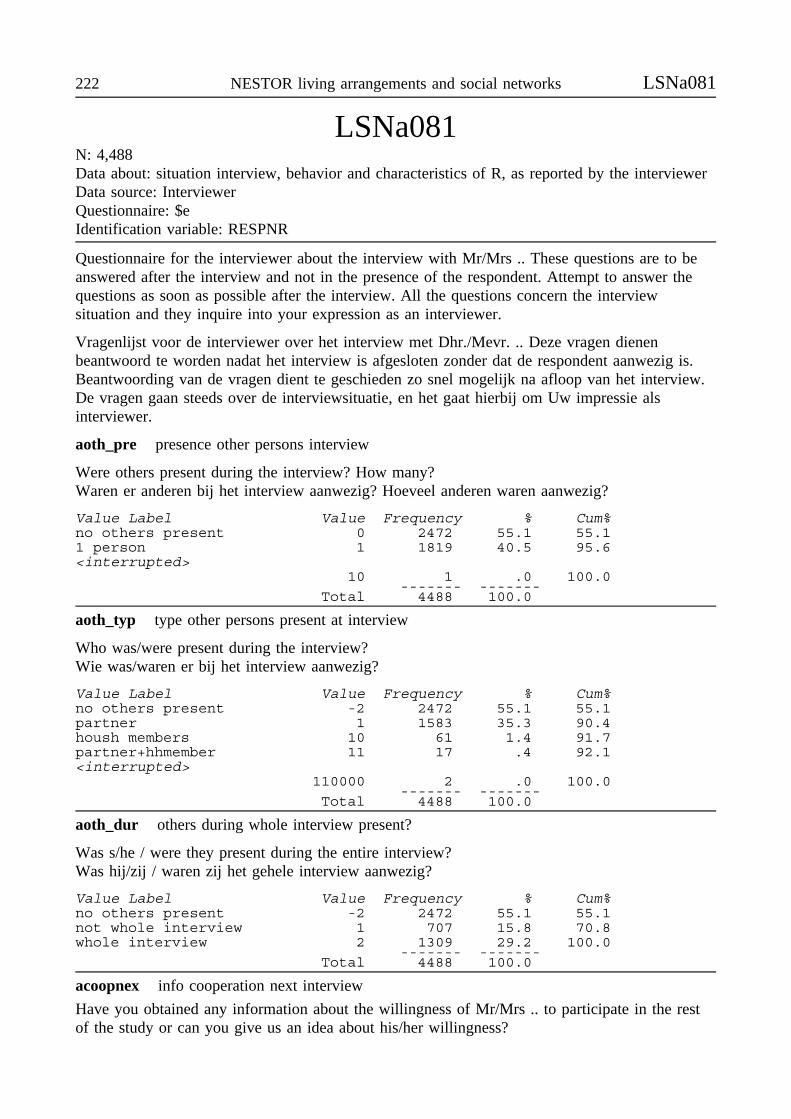
222 NESTOR living arrangements and social networks LSNa081
LSNa081N: 4,488Data about: situation interview, behavior and characteristics of R, as reported by the interviewerData source: InterviewerQuestionnaire: $eIdentification variable: RESPNR
Questionnaire for the interviewer about the interview with Mr/Mrs .. These questions are to beanswered after the interview and not in the presence of the respondent. Attempt to answer thequestions as soon as possible after the interview. All the questions concern the interviewsituation and they inquire into your expression as an interviewer.
Vragenlijst voor de interviewer over het interview met Dhr./Mevr. .. Deze vragen dienenbeantwoord te worden nadat het interview is afgesloten zonder dat de respondent aanwezig is.Beantwoording van de vragen dient te geschieden zo snel mogelijk na afloop van het interview.De vragen gaan steeds over de interviewsituatie, en het gaat hierbij om Uw impressie alsinterviewer.
aoth_pre presence other persons interview
Were others present during the interview? How many?Waren er anderen bij het interview aanwezig? Hoeveel anderen waren aanwezig?
Value Label Value Frequency % Cum%no others present 0 2472 55.1 55.11 person 1 1819 40.5 95.6<interrupted>
10 1 .0 100.0------- -------
Total 4488 100.0
aoth_typ type other persons present at interview
Who was/were present during the interview?Wie was/waren er bij het interview aanwezig?
Value Label Value Frequency % Cum%no others present -2 2472 55.1 55.1partner 1 1583 35.3 90.4housh members 10 61 1.4 91.7partner+hhmember 11 17 .4 92.1<interrupted>
110000 2 .0 100.0------- -------
Total 4488 100.0
aoth_dur others during whole interview present?
Was s/he / were they present during the entire interview?Was hij/zij / waren zij het gehele interview aanwezig?
Value Label Value Frequency % Cum%no others present -2 2472 55.1 55.1not whole interview 1 707 15.8 70.8whole interview 2 1309 29.2 100.0
------- -------Total 4488 100.0
acoopnex info cooperation next interview
Have you obtained any information about the willingness of Mr/Mrs .. to participate in the restof the study or can you give us an idea about his/her willingness?
LSNa081 Main Study 1992 223
1 no info, no idea2 yes, information or idea, + other information3 no, but would like to pass on other information
Heeft u enige informatie gekregen over de bereidheid van Dhr./Mevr. .. om niet of wel mee tewerken aan de rest van het onderzoek, of kunt u een inschatting maken?
1 nee, geen informatie en geen inschatting2 ja, informatie of inschatting + overige meldingen3 nee, maar ik wil nog wel wat anders doorgeven
Value Label Value Frequency % Cum%no info or idea 1 729 16.2 16.2yes (info or idea) 2 3692 82.3 98.5no, but other info 3 67 1.5 100.0
------- -------Total 4488 100.0
Information stored in database LSNa081.dbf.
apleasan interview pleasant?
How do you feel the interview with Mr/Mrs .. went on the whole?Hoe verliep naar uw idee het interview met Dhr./Mevr. .. als geheel?
Value Label Value Frequency % Cum%no answer -1 5 .1 .1very unpleasant 1 67 1.5 1.6somewhat unpleasant 2 158 3.5 5.1not pleas not unplea 3 550 12.3 17.4somewhat pleasant 4 775 17.3 34.6pleasant 5 2253 50.2 84.8very pleasant 6 680 15.2 100.0
------- -------Total 4488 100.0
aproblem problems in general (eg language)
In general, were there problems (e.g. language problems or problems in comprehension) whichmade it difficult to interview Mr/Mrs ..?Waren er in het algemeen problemen (bijvoorbeeld taalproblemen of begripsproblemen)waardoor het moeilijk was Dhr./Mevr. .. te interviewen?
Value Label Value Frequency % Cum%no answer -1 10 .2 .2no 1 3586 79.9 80.1yes,minor problems 2 656 14.6 94.7yes,serious problems 3 236 5.3 100.0
------- -------Total 4488 100.0
Information stored in database LSNa081.dbf.
224 NESTOR living arrangements and social networks LSNa081
ahelpnee help needed with Q (eg repeat)
How much help (e.g. repeating questions, extra explanations, and so forth) did Mr/Mrs .. need toanswer the questions?Hoeveel hulp (herhalen van vragen, extra uitleg, en dergelijke) had Dhr./Mevr. .. nodig bij hetbeantwoorden van de vragen?
Value Label Value Frequency % Cum%no answer -1 11 .2 .2none or hardly any 1 1876 41.8 42.0less than average 2 683 15.2 57.3average 3 1128 25.1 82.4more than average 4 606 13.5 95.9very much 5 184 4.1 100.0
------- -------Total 4488 100.0
aunderst comprehension of questions by R
How good in general was Mr/Mrs .. comprehension of the questions?Hoe goed begreep Dhr./Mevr. .. de vragen in het algemeen?
Value Label Value Frequency % Cum%no answer -1 11 .2 .2very poor 1 83 1.8 2.1poor 2 338 7.5 9.6normal 3 1688 37.6 47.2good 4 1558 34.7 82.0excellent 5 810 18.0 100.0
------- -------Total 4488 100.0
amemo_1 calling mind
Did Mr/Mrs .. have difficulty calling experiences from the past into mind?Had Dhr./Mevr. .. moeite met het zich voor de geest halen van dingen uit het verleden?
Value Label Value Frequency % Cum%no answer -1 13 .3 .3much difficulties 1 131 2.9 3.2some difficulties 2 500 11.1 14.3normal 3 1522 33.9 48.3good performance 4 1608 35.8 84.1excellent performance 5 714 15.9 100.0
------- -------Total 4488 100.0
astray How often did Mr/Mrs .. attention stray during the interview?Hoe vaak dwaalde Dhr./Mevr. .. af tijdens het interview?
adivert Was Mr/Mrs .. attention often diverted during the interview?Was Dhr./Mevr. .. vaak afgeleid tijdens het interview?
aworries Did Mr/Mrs .. worry about whether s/he was performing well?Maakte Dhr./Mevr. .. zich zorgen of hij/zij het wel goed deed?
astray adivert aworries
Value label Value Freq % Freq % Freq %no answer -1 14 .3 8 .2 15 .3never 1 2324 51.8 3066 68.3 3896 86.8sometimes 2 1378 30.7 1062 23.7 508 11.3often 3 772 17.2 352 7.8 69 1.5
---- ----- ---- ----- ---- -----Total 4488 100.0 4488 100.0 4488 100.0
LSNa081 Main Study 1992 225
aforgot R forgot the point?
Did Mr/Mrs .. forget what the encounter was about?Vergat Dhr./Mevr. .. waar het eigenlijk over ging?
Value Label Value Frequency % Cum%no answer -1 21 .5 .5never 1 3668 81.7 82.2sometimes 2 578 12.9 95.1often 3 221 4.9 100.0
------- -------Total 4488 100.0
aexpress expressing answers
How good or bad was Mr/Mrs .. at expressing his/her answers? His/her means of expressionswas:1 very poor (very limited vocabulary, great difficulty finding words)2 poor, 3 normal, 4 good5 excellent (extensive vocabulary, no difficulty finding words)Hoe goed of slecht kon Dhr./Mevr. .. zijn/haar antwoorden verwoorden? Het uitdrukkingsvermo-gen was:1 erg slecht (zeer kleine woordenschat, grote moeite zich uit te drukken)2 slecht, 3 normaal, 4 goed5 uitstekend (ruime woordenschat, kon zich prima uitdrukken)
Value Label Value Frequency % Cum%no answer -1 12 .3 .3very poor 1 84 1.9 2.1poor 2 244 5.4 7.6normal 3 1807 40.3 47.8good 4 1602 35.7 83.5excellent 5 739 16.5 100.0
------- -------Total 4488 100.0
aanswcat Did Mr/Mrs .. experience difficulties with the answer categories?Had Dhr./Mevr. .. moeite met de gebruikte antwoordcategorieën?
aelabora Did Mr/mrs .. tend to extensively elaborate his/her answers?Bevatten de antwoorden van Dhr./Mevr. .. in het algemeen veel uitweidingen?
aanswcat aelabora
Value label Value Freq % Freq %no answer -1 36 .8 14 .3never 1 2320 51.7 1983 44.2sometimes 2 1492 33.2 1615 36.0often 3 640 14.3 876 19.5
---- ----- ---- -----Total 4488 100.0 4488 100.0
ainteres interest of R in interview
How much was Mr/Mrs interested in the interview?Hoe groot was de belangstelling van Dhr./Mevr. .. voor het interview in het algemeen?
1 zeer klein, Dhr./Mevr. .. was totaal niet geïnteresseerd2 minder dan normale belangstelling3 normale belangstelling4 meer dan normale belangstelling5 zeer groot, Dhr./Mevr. .. was erg geïnteresseerd
226 NESTOR living arrangements and social networks LSNa081
Value Label Value Frequency % Cum%no answer -1 21 .5 .5limited 1 153 3.4 3.9less than normal 2 492 11.0 14.8normal 3 2702 60.2 75.0more than normal 4 907 20.2 95.3exceptional 5 213 4.7 100.0
------- -------Total 4488 100.0
atire_r How tiring (fatiguing) do you think the interview was for Mr/Mrs ..?Hoe vermoeiend was volgens u het interview voor Dhr./Mevr. ..?
atire_i How tiring (fatiguing) was the interview with Mr/Mrs .. for you?Hoe vermoeiend was het interview met Dhr./Mevr. .. voor Uzelf?
1 totaal niet vermoeiend, 2 niet vermoeiend, 3 een beetje vermoeiend,4 vermoeiend, 5 heel vermoeiend
atire_r atire_i
Value label Value Freq % Freq %no answer -1 12 .3 8 .2not at all 1 1187 26.4 961 21.4not 2 2029 45.2 2129 47.4a little 3 897 20.0 939 20.9tiring 4 276 6.1 331 7.4very tiring 5 87 1.9 120 2.7
---- ----- ---- -----Total 4488 100.0 4488 100.0
asuspic R suspicious?
Was Mr/Mrs .. somewhat suspicious about the interview before it took place?Was Dhr./Mevr. .. enigszins achterdochtig over het onderzoek voordat het interview plaats vond?
Value Label Value Frequency % Cum%no answer -1 12 .3 .3no 1 3749 83.5 83.8yes,somewhat 2 606 13.5 97.3yes,very 3 121 2.7 100.0
------- -------Total 4488 100.0
ahonest R honest?
Do you feel Mr/Mrs .. answers arehonest?1 no2 yes most, but some were flattered3 yes, all answers were honest
Heeft naar uw indruk Dhr./Mevr. .. eerlijk geantwoord?1 Nee2 Ja, voor het grootste deel, maar soms werd het
mooier voorgesteld3 Ja, altijd
Value Label Value Frequency % Cum%no answer -1 26 .6 .6no 1 109 2.4 3.0yes,most 2 642 14.3 17.3yes,all 3 3711 82.7 100.0
------- -------Total 4488 100.0
adurat length of interview
How was the duration of the interview for Mr/Mrs ..?
Hoe was de duur van het interview met Dhr./Mevr. ..?1 Het was duidelijk veel te lang
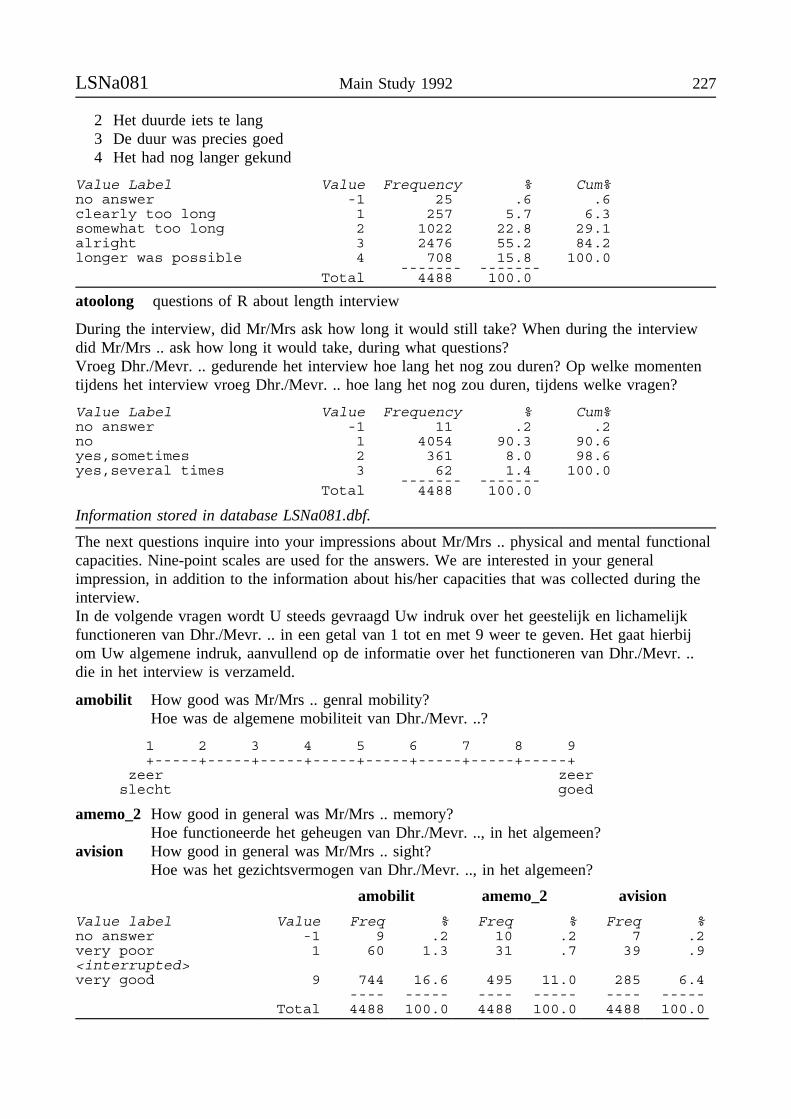
LSNa081 Main Study 1992 227
2 Het duurde iets te lang3 De duur was precies goed4 Het had nog langer gekund
Value Label Value Frequency % Cum%no answer -1 25 .6 .6clearly too long 1 257 5.7 6.3somewhat too long 2 1022 22.8 29.1alright 3 2476 55.2 84.2longer was possible 4 708 15.8 100.0
------- -------Total 4488 100.0
atoolong questions of R about length interview
During the interview, did Mr/Mrs ask how long it would still take? When during the interviewdid Mr/Mrs .. ask how long it would take, during what questions?Vroeg Dhr./Mevr. .. gedurende het interview hoe lang het nog zou duren? Op welke momententijdens het interview vroeg Dhr./Mevr. .. hoe lang het nog zou duren, tijdens welke vragen?
Value Label Value Frequency % Cum%no answer -1 11 .2 .2no 1 4054 90.3 90.6yes,sometimes 2 361 8.0 98.6yes,several times 3 62 1.4 100.0
------- -------Total 4488 100.0
Information stored in database LSNa081.dbf.
The next questions inquire into your impressions about Mr/Mrs .. physical and mental functionalcapacities. Nine-point scales are used for the answers. We are interested in your generalimpression, in addition to the information about his/her capacities that was collected during theinterview.In de volgende vragen wordt U steeds gevraagd Uw indruk over het geestelijk en lichamelijkfunctioneren van Dhr./Mevr. .. in een getal van 1 tot en met 9 weer te geven. Het gaat hierbijom Uw algemene indruk, aanvullend op de informatie over het functioneren van Dhr./Mevr. ..die in het interview is verzameld.
amobilit How good was Mr/Mrs .. genral mobility?Hoe was de algemene mobiliteit van Dhr./Mevr. ..?
1 2 3 4 5 6 7 8 9+-----+-----+-----+-----+-----+-----+-----+-----+
zeer zeerslecht goed
amemo_2 How good in general was Mr/Mrs .. memory?Hoe functioneerde het geheugen van Dhr./Mevr. .., in het algemeen?
avision How good in general was Mr/Mrs .. sight?Hoe was het gezichtsvermogen van Dhr./Mevr. .., in het algemeen?
amobilit amemo_2 avision
Value label Value Freq % Freq % Freq %no answer -1 9 .2 10 .2 7 .2very poor 1 60 1.3 31 .7 39 .9<interrupted>very good 9 744 16.6 495 11.0 285 6.4
---- ----- ---- ----- ---- -----Total 4488 100.0 4488 100.0 4488 100.0
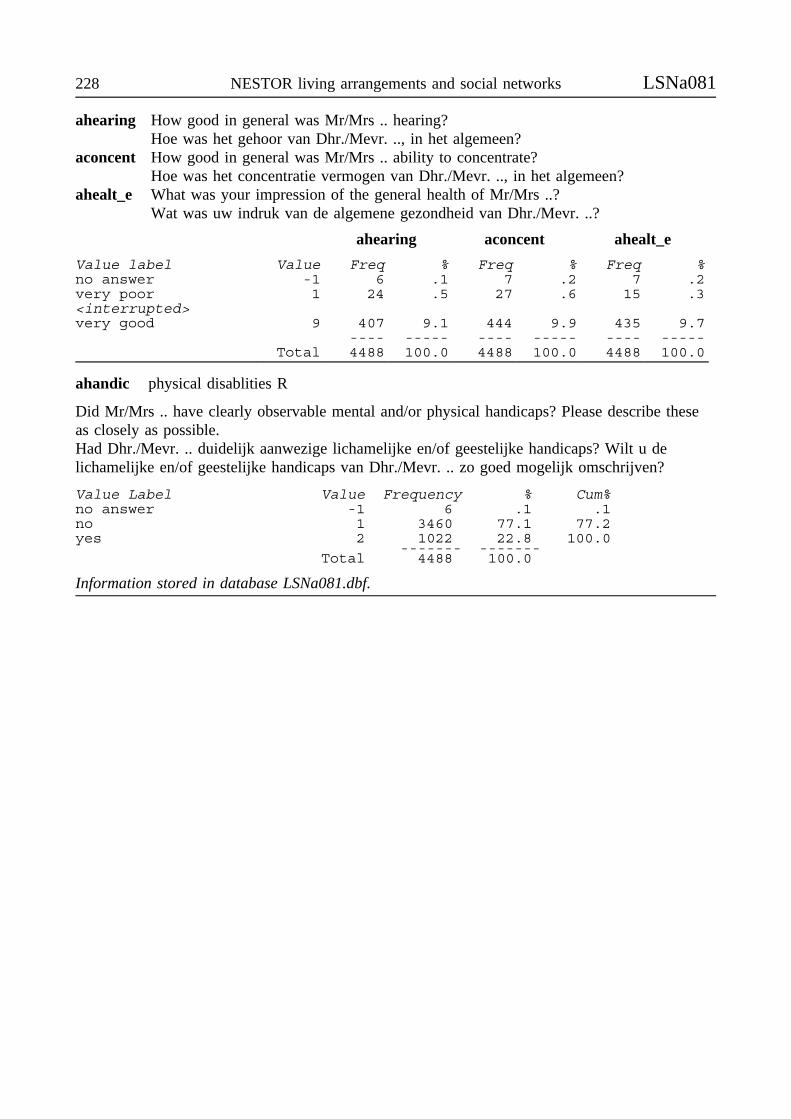
228 NESTOR living arrangements and social networks LSNa081
ahearing How good in general was Mr/Mrs .. hearing?Hoe was het gehoor van Dhr./Mevr. .., in het algemeen?
aconcent How good in general was Mr/Mrs .. ability to concentrate?Hoe was het concentratie vermogen van Dhr./Mevr. .., in het algemeen?
ahealt_e What was your impression of the general health of Mr/Mrs ..?Wat was uw indruk van de algemene gezondheid van Dhr./Mevr. ..?
ahearing aconcent ahealt_e
Value label Value Freq % Freq % Freq %no answer -1 6 .1 7 .2 7 .2very poor 1 24 .5 27 .6 15 .3<interrupted>very good 9 407 9.1 444 9.9 435 9.7
---- ----- ---- ----- ---- -----Total 4488 100.0 4488 100.0 4488 100.0
ahandic physical disablities R
Did Mr/Mrs .. have clearly observable mental and/or physical handicaps? Please describe theseas closely as possible.Had Dhr./Mevr. .. duidelijk aanwezige lichamelijke en/of geestelijke handicaps? Wilt u delichamelijke en/of geestelijke handicaps van Dhr./Mevr. .. zo goed mogelijk omschrijven?
Value Label Value Frequency % Cum%no answer -1 6 .1 .1no 1 3460 77.1 77.2yes 2 1022 22.8 100.0
------- -------Total 4488 100.0
Information stored in database LSNa081.dbf.
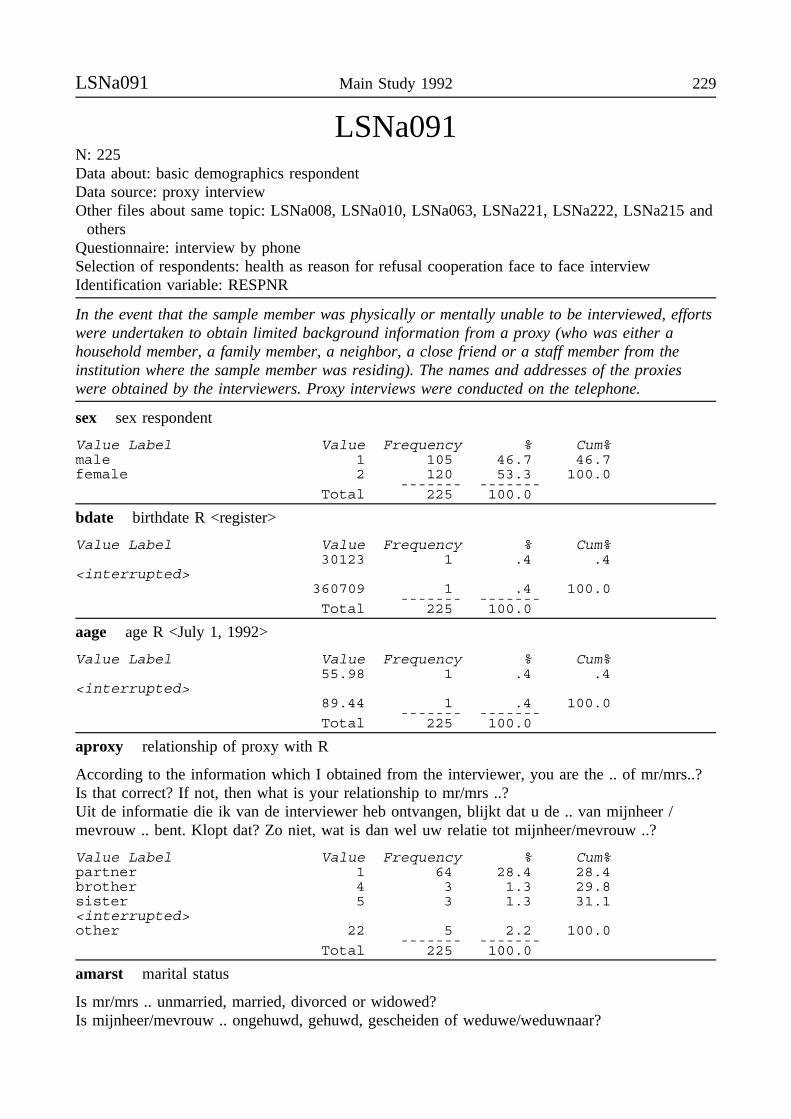
LSNa091 Main Study 1992 229
LSNa091N: 225Data about: basic demographics respondentData source: proxy interviewOther files about same topic: LSNa008, LSNa010, LSNa063, LSNa221, LSNa222, LSNa215 and
othersQuestionnaire: interview by phoneSelection of respondents: health as reason for refusal cooperation face to face interviewIdentification variable: RESPNR
In the event that the sample member was physically or mentally unable to be interviewed, effortswere undertaken to obtain limited background information from a proxy (who was either ahousehold member, a family member, a neighbor, a close friend or a staff member from theinstitution where the sample member was residing). The names and addresses of the proxieswere obtained by the interviewers. Proxy interviews were conducted on the telephone.
sex sex respondent
Value Label Value Frequency % Cum%male 1 105 46.7 46.7female 2 120 53.3 100.0
------- -------Total 225 100.0
bdate birthdate R <register>
Value Label Value Frequency % Cum%30123 1 .4 .4
<interrupted>360709 1 .4 100.0
------- -------Total 225 100.0
aage age R <July 1, 1992>
Value Label Value Frequency % Cum%55.98 1 .4 .4
<interrupted>89.44 1 .4 100.0
------- -------Total 225 100.0
aproxy relationship of proxy with R
According to the information which I obtained from the interviewer, you are the .. of mr/mrs..?Is that correct? If not, then what is your relationship to mr/mrs ..?Uit de informatie die ik van de interviewer heb ontvangen, blijkt dat u de .. van mijnheer /mevrouw .. bent. Klopt dat? Zo niet, wat is dan wel uw relatie tot mijnheer/mevrouw ..?
Value Label Value Frequency % Cum%partner 1 64 28.4 28.4brother 4 3 1.3 29.8sister 5 3 1.3 31.1<interrupted>other 22 5 2.2 100.0
------- -------Total 225 100.0
amarst marital status
Is mr/mrs .. unmarried, married, divorced or widowed?Is mijnheer/mevrouw .. ongehuwd, gehuwd, gescheiden of weduwe/weduwnaar?
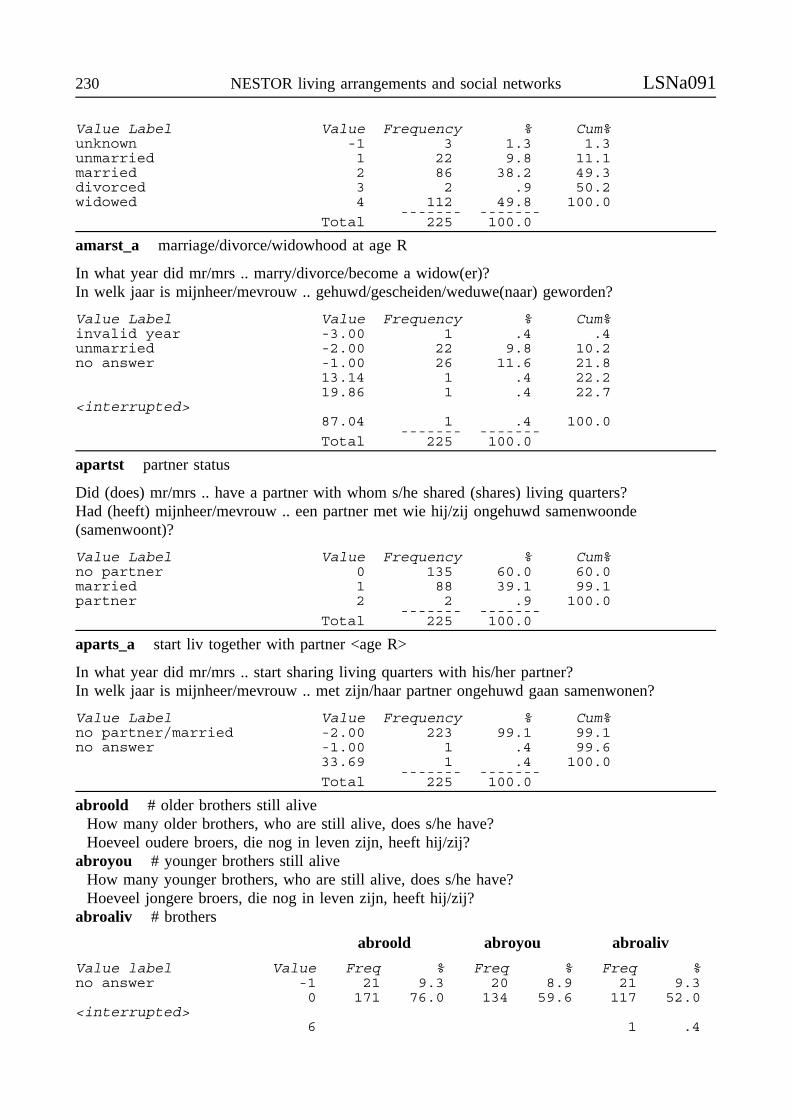
230 NESTOR living arrangements and social networks LSNa091
Value Label Value Frequency % Cum%unknown -1 3 1.3 1.3unmarried 1 22 9.8 11.1married 2 86 38.2 49.3divorced 3 2 .9 50.2widowed 4 112 49.8 100.0
------- -------Total 225 100.0
amarst_a marriage/divorce/widowhood at age R
In what year did mr/mrs .. marry/divorce/become a widow(er)?In welk jaar is mijnheer/mevrouw .. gehuwd/gescheiden/weduwe(naar) geworden?
Value Label Value Frequency % Cum%invalid year -3.00 1 .4 .4unmarried -2.00 22 9.8 10.2no answer -1.00 26 11.6 21.8
13.14 1 .4 22.219.86 1 .4 22.7
<interrupted>87.04 1 .4 100.0
------- -------Total 225 100.0
apartst partner status
Did (does) mr/mrs .. have a partner with whom s/he shared (shares) living quarters?Had (heeft) mijnheer/mevrouw .. een partner met wie hij/zij ongehuwd samenwoonde(samenwoont)?
Value Label Value Frequency % Cum%no partner 0 135 60.0 60.0married 1 88 39.1 99.1partner 2 2 .9 100.0
------- -------Total 225 100.0
aparts_a start liv together with partner <age R>
In what year did mr/mrs .. start sharing living quarters with his/her partner?In welk jaar is mijnheer/mevrouw .. met zijn/haar partner ongehuwd gaan samenwonen?
Value Label Value Frequency % Cum%no partner/married -2.00 223 99.1 99.1no answer -1.00 1 .4 99.6
33.69 1 .4 100.0------- -------
Total 225 100.0
abroold # older brothers still aliveHow many older brothers, who are still alive, does s/he have?Hoeveel oudere broers, die nog in leven zijn, heeft hij/zij?
abroyou # younger brothers still aliveHow many younger brothers, who are still alive, does s/he have?Hoeveel jongere broers, die nog in leven zijn, heeft hij/zij?
abroaliv # brothers
abroold abroyou abroaliv
Value label Value Freq % Freq % Freq %no answer -1 21 9.3 20 8.9 21 9.3
0 171 76.0 134 59.6 117 52.0<interrupted>
6 1 .4
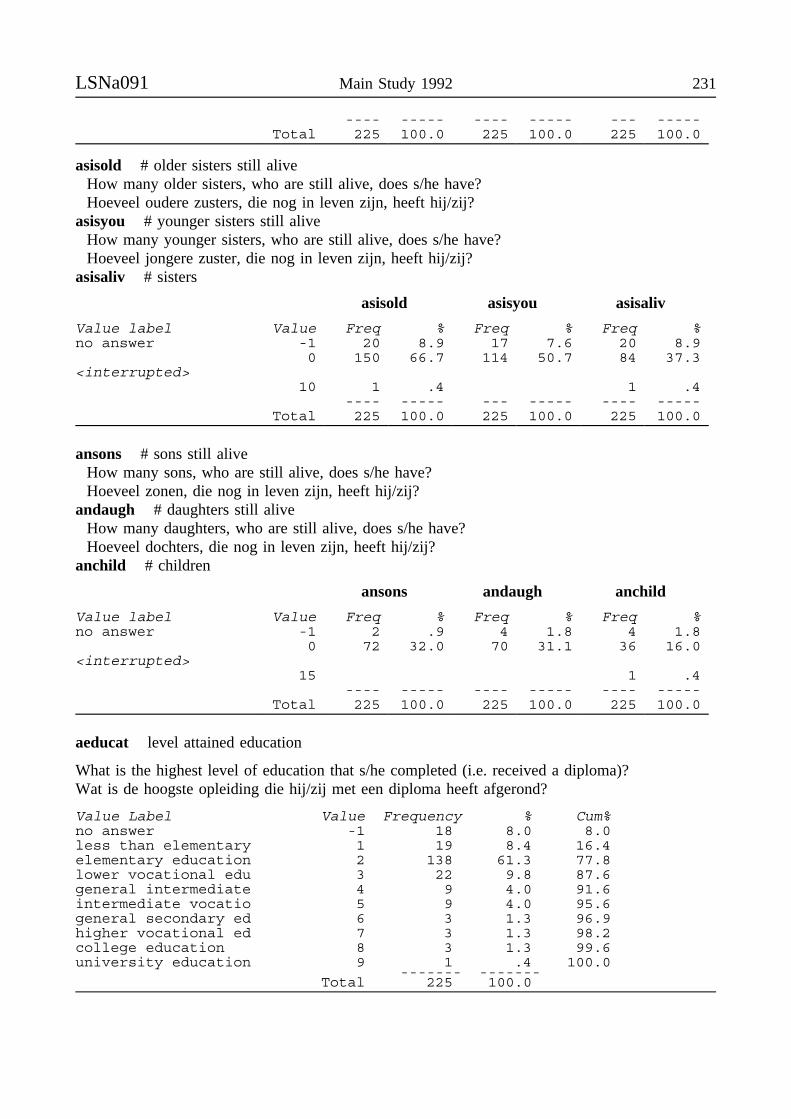
LSNa091 Main Study 1992 231
---- ----- ---- ----- --- -----Total 225 100.0 225 100.0 225 100.0
asisold # older sisters still aliveHow many older sisters, who are still alive, does s/he have?Hoeveel oudere zusters, die nog in leven zijn, heeft hij/zij?
asisyou # younger sisters still aliveHow many younger sisters, who are still alive, does s/he have?Hoeveel jongere zuster, die nog in leven zijn, heeft hij/zij?
asisaliv # sisters
asisold asisyou asisaliv
Value label Value Freq % Freq % Freq %no answer -1 20 8.9 17 7.6 20 8.9
0 150 66.7 114 50.7 84 37.3<interrupted>
10 1 .4 1 .4---- ----- --- ----- ---- -----
Total 225 100.0 225 100.0 225 100.0
ansons # sons still aliveHow many sons, who are still alive, does s/he have?Hoeveel zonen, die nog in leven zijn, heeft hij/zij?
andaugh # daughters still aliveHow many daughters, who are still alive, does s/he have?Hoeveel dochters, die nog in leven zijn, heeft hij/zij?
anchild # children
ansons andaugh anchild
Value label Value Freq % Freq % Freq %no answer -1 2 .9 4 1.8 4 1.8
0 72 32.0 70 31.1 36 16.0<interrupted>
15 1 .4---- ----- ---- ----- ---- -----
Total 225 100.0 225 100.0 225 100.0
aeducat level attained education
What is the highest level of education that s/he completed (i.e. received a diploma)?Wat is de hoogste opleiding die hij/zij met een diploma heeft afgerond?
Value Label Value Frequency % Cum%no answer -1 18 8.0 8.0less than elementary 1 19 8.4 16.4elementary education 2 138 61.3 77.8lower vocational edu 3 22 9.8 87.6general intermediate 4 9 4.0 91.6intermediate vocatio 5 9 4.0 95.6general secondary ed 6 3 1.3 96.9higher vocational ed 7 3 1.3 98.2college education 8 3 1.3 99.6university education 9 1 .4 100.0
------- -------Total 225 100.0
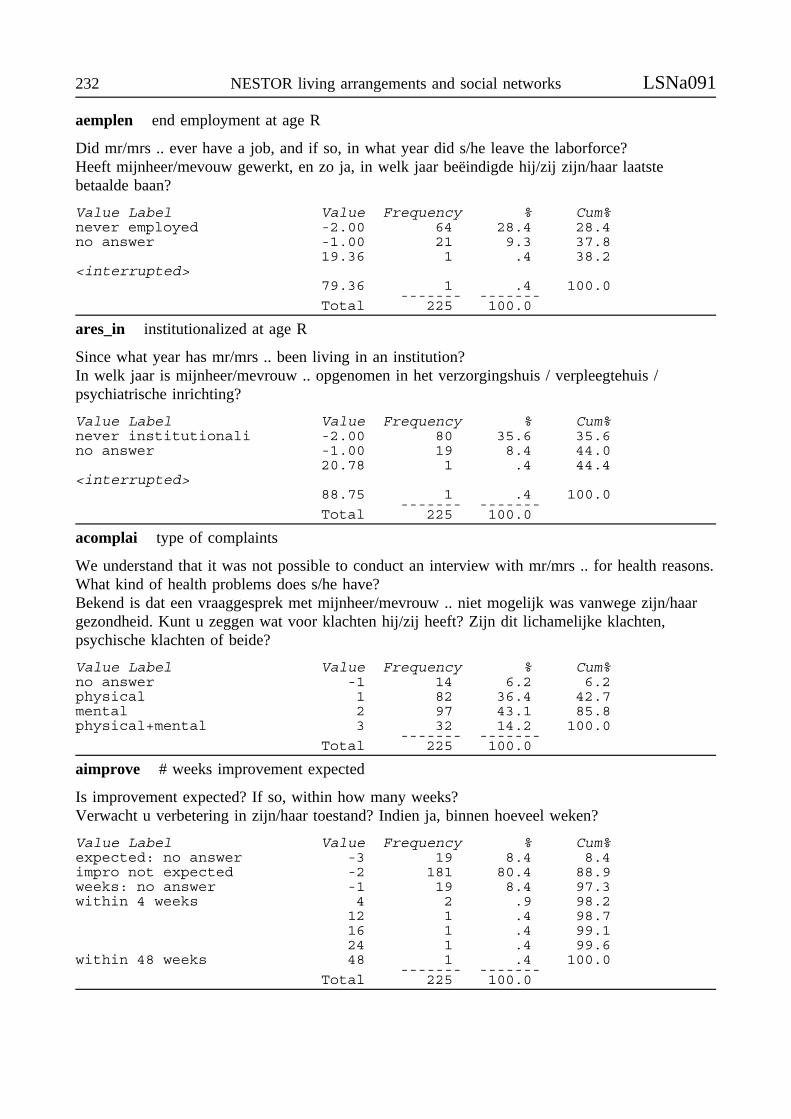
232 NESTOR living arrangements and social networks LSNa091
aemplen end employment at age R
Did mr/mrs .. ever have a job, and if so, in what year did s/he leave the laborforce?Heeft mijnheer/mevouw gewerkt, en zo ja, in welk jaar beëindigde hij/zij zijn/haar laatstebetaalde baan?
Value Label Value Frequency % Cum%never employed -2.00 64 28.4 28.4no answer -1.00 21 9.3 37.8
19.36 1 .4 38.2<interrupted>
79.36 1 .4 100.0------- -------
Total 225 100.0
ares_in institutionalized at age R
Since what year has mr/mrs .. been living in an institution?In welk jaar is mijnheer/mevrouw .. opgenomen in het verzorgingshuis / verpleegtehuis /psychiatrische inrichting?
Value Label Value Frequency % Cum%never institutionali -2.00 80 35.6 35.6no answer -1.00 19 8.4 44.0
20.78 1 .4 44.4<interrupted>
88.75 1 .4 100.0------- -------
Total 225 100.0
acomplai type of complaints
We understand that it was not possible to conduct an interview with mr/mrs .. for health reasons.What kind of health problems does s/he have?Bekend is dat een vraaggesprek met mijnheer/mevrouw .. niet mogelijk was vanwege zijn/haargezondheid. Kunt u zeggen wat voor klachten hij/zij heeft? Zijn dit lichamelijke klachten,psychische klachten of beide?
Value Label Value Frequency % Cum%no answer -1 14 6.2 6.2physical 1 82 36.4 42.7mental 2 97 43.1 85.8physical+mental 3 32 14.2 100.0
------- -------Total 225 100.0
aimprove # weeks improvement expected
Is improvement expected? If so, within how many weeks?Verwacht u verbetering in zijn/haar toestand? Indien ja, binnen hoeveel weken?
Value Label Value Frequency % Cum%expected: no answer -3 19 8.4 8.4impro not expected -2 181 80.4 88.9weeks: no answer -1 19 8.4 97.3within 4 weeks 4 2 .9 98.2
12 1 .4 98.716 1 .4 99.124 1 .4 99.6
within 48 weeks 48 1 .4 100.0------- -------
Total 225 100.0
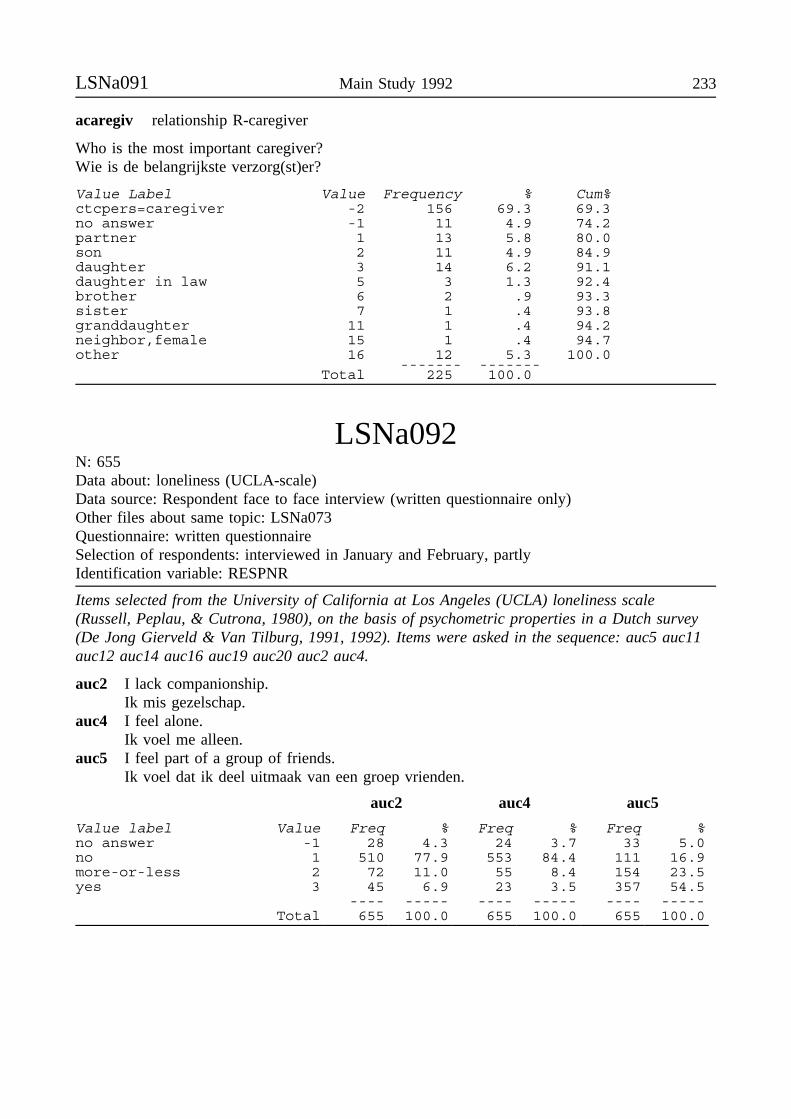
LSNa091 Main Study 1992 233
acaregiv relationship R-caregiver
Who is the most important caregiver?Wie is de belangrijkste verzorg(st)er?
Value Label Value Frequency % Cum%ctcpers=caregiver -2 156 69.3 69.3no answer -1 11 4.9 74.2partner 1 13 5.8 80.0son 2 11 4.9 84.9daughter 3 14 6.2 91.1daughter in law 5 3 1.3 92.4brother 6 2 .9 93.3sister 7 1 .4 93.8granddaughter 11 1 .4 94.2neighbor,female 15 1 .4 94.7other 16 12 5.3 100.0
------- -------Total 225 100.0
LSNa092N: 655Data about: loneliness (UCLA-scale)Data source: Respondent face to face interview (written questionnaire only)Other files about same topic: LSNa073Questionnaire: written questionnaireSelection of respondents: interviewed in January and February, partlyIdentification variable: RESPNR
Items selected from the University of California at Los Angeles (UCLA) loneliness scale(Russell, Peplau, & Cutrona, 1980), on the basis of psychometric properties in a Dutch survey(De Jong Gierveld & Van Tilburg, 1991, 1992). Items were asked in the sequence: auc5 auc11auc12 auc14 auc16 auc19 auc20 auc2 auc4.
auc2 I lack companionship.Ik mis gezelschap.
auc4 I feel alone.Ik voel me alleen.
auc5 I feel part of a group of friends.Ik voel dat ik deel uitmaak van een groep vrienden.
auc2 auc4 auc5
Value label Value Freq % Freq % Freq %no answer -1 28 4.3 24 3.7 33 5.0no 1 510 77.9 553 84.4 111 16.9more-or-less 2 72 11.0 55 8.4 154 23.5yes 3 45 6.9 23 3.5 357 54.5
---- ----- ---- ----- ---- -----Total 655 100.0 655 100.0 655 100.0
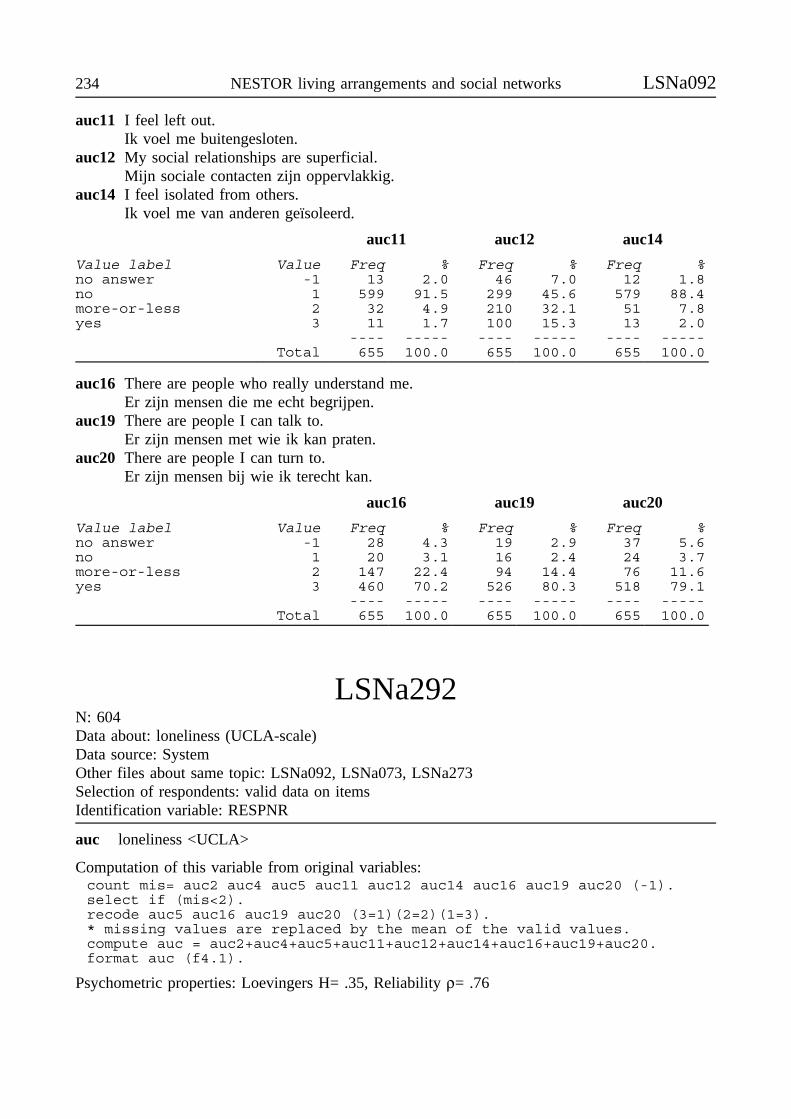
234 NESTOR living arrangements and social networks LSNa092
auc11 I feel left out.Ik voel me buitengesloten.
auc12 My social relationships are superficial.Mijn sociale contacten zijn oppervlakkig.
auc14 I feel isolated from others.Ik voel me van anderen geïsoleerd.
auc11 auc12 auc14
Value label Value Freq % Freq % Freq %no answer -1 13 2.0 46 7.0 12 1.8no 1 599 91.5 299 45.6 579 88.4more-or-less 2 32 4.9 210 32.1 51 7.8yes 3 11 1.7 100 15.3 13 2.0
---- ----- ---- ----- ---- -----Total 655 100.0 655 100.0 655 100.0
auc16 There are people who really understand me.Er zijn mensen die me echt begrijpen.
auc19 There are people I can talk to.Er zijn mensen met wie ik kan praten.
auc20 There are people I can turn to.Er zijn mensen bij wie ik terecht kan.
auc16 auc19 auc20
Value label Value Freq % Freq % Freq %no answer -1 28 4.3 19 2.9 37 5.6no 1 20 3.1 16 2.4 24 3.7more-or-less 2 147 22.4 94 14.4 76 11.6yes 3 460 70.2 526 80.3 518 79.1
---- ----- ---- ----- ---- -----Total 655 100.0 655 100.0 655 100.0
LSNa292N: 604Data about: loneliness (UCLA-scale)Data source: SystemOther files about same topic: LSNa092, LSNa073, LSNa273Selection of respondents: valid data on itemsIdentification variable: RESPNR
auc loneliness <UCLA>
Computation of this variable from original variables:count mis= auc2 auc4 auc5 auc11 auc12 auc14 auc16 auc19 auc20 (-1).select if (mis<2).recode auc5 auc16 auc19 auc20 (3=1)(2=2)(1=3).* missing values are replaced by the mean of the valid values.compute auc = auc2+auc4+auc5+auc11+auc12+auc14+auc16+auc19+auc20.format auc (f4.1).
Psychometric properties: Loevingers H= .35, Reliability ρ= .76
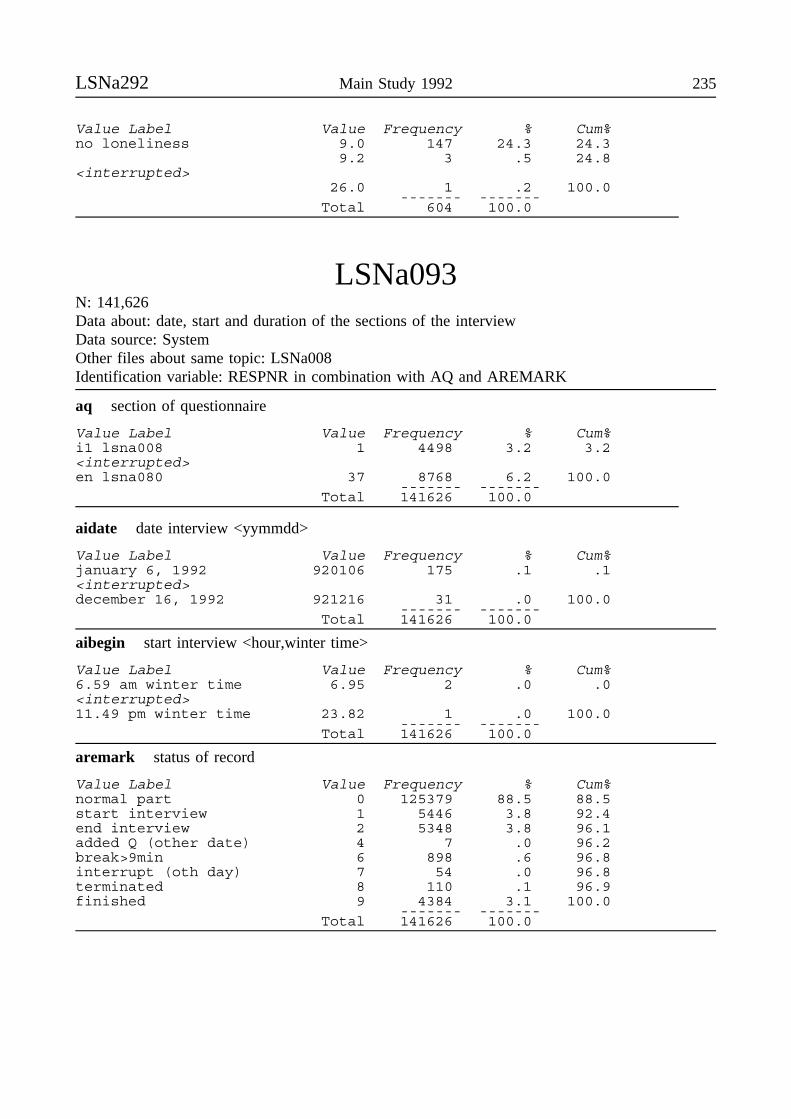
LSNa292 Main Study 1992 235
Value Label Value Frequency % Cum%no loneliness 9.0 147 24.3 24.3
9.2 3 .5 24.8<interrupted>
26.0 1 .2 100.0------- -------
Total 604 100.0
LSNa093N: 141,626Data about: date, start and duration of the sections of the interviewData source: SystemOther files about same topic: LSNa008Identification variable: RESPNR in combination with AQ and AREMARK
aq section of questionnaire
Value Label Value Frequency % Cum%i1 lsna008 1 4498 3.2 3.2<interrupted>en lsna080 37 8768 6.2 100.0
------- -------Total 141626 100.0
aidate date interview <yymmdd>
Value Label Value Frequency % Cum%january 6, 1992 920106 175 .1 .1<interrupted>december 16, 1992 921216 31 .0 100.0
------- -------Total 141626 100.0
aibegin start interview <hour,winter time>
Value Label Value Frequency % Cum%6.59 am winter time 6.95 2 .0 .0<interrupted>11.49 pm winter time 23.82 1 .0 100.0
------- -------Total 141626 100.0
aremark status of record
Value Label Value Frequency % Cum%normal part 0 125379 88.5 88.5start interview 1 5446 3.8 92.4end interview 2 5348 3.8 96.1added Q (other date) 4 7 .0 96.2break>9min 6 898 .6 96.8interrupt (oth day) 7 54 .0 96.8terminated 8 110 .1 96.9finished 9 4384 3.1 100.0
------- -------Total 141626 100.0
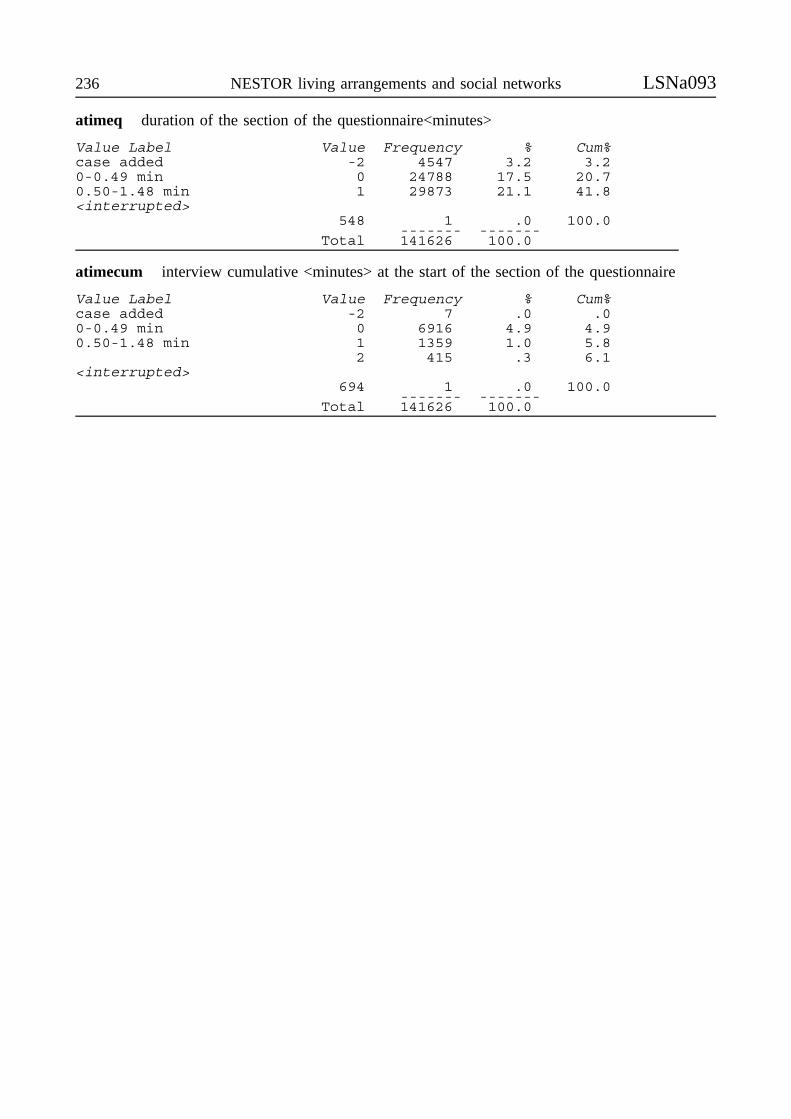
236 NESTOR living arrangements and social networks LSNa093
atimeq duration of the section of the questionnaire<minutes>
Value Label Value Frequency % Cum%case added -2 4547 3.2 3.20-0.49 min 0 24788 17.5 20.70.50-1.48 min 1 29873 21.1 41.8<interrupted>
548 1 .0 100.0------- -------
Total 141626 100.0
atimecum interview cumulative <minutes> at the start of the section of the questionnaire
Value Label Value Frequency % Cum%case added -2 7 .0 .00-0.49 min 0 6916 4.9 4.90.50-1.48 min 1 1359 1.0 5.8
2 415 .3 6.1<interrupted>
694 1 .0 100.0------- -------
Total 141626 100.0
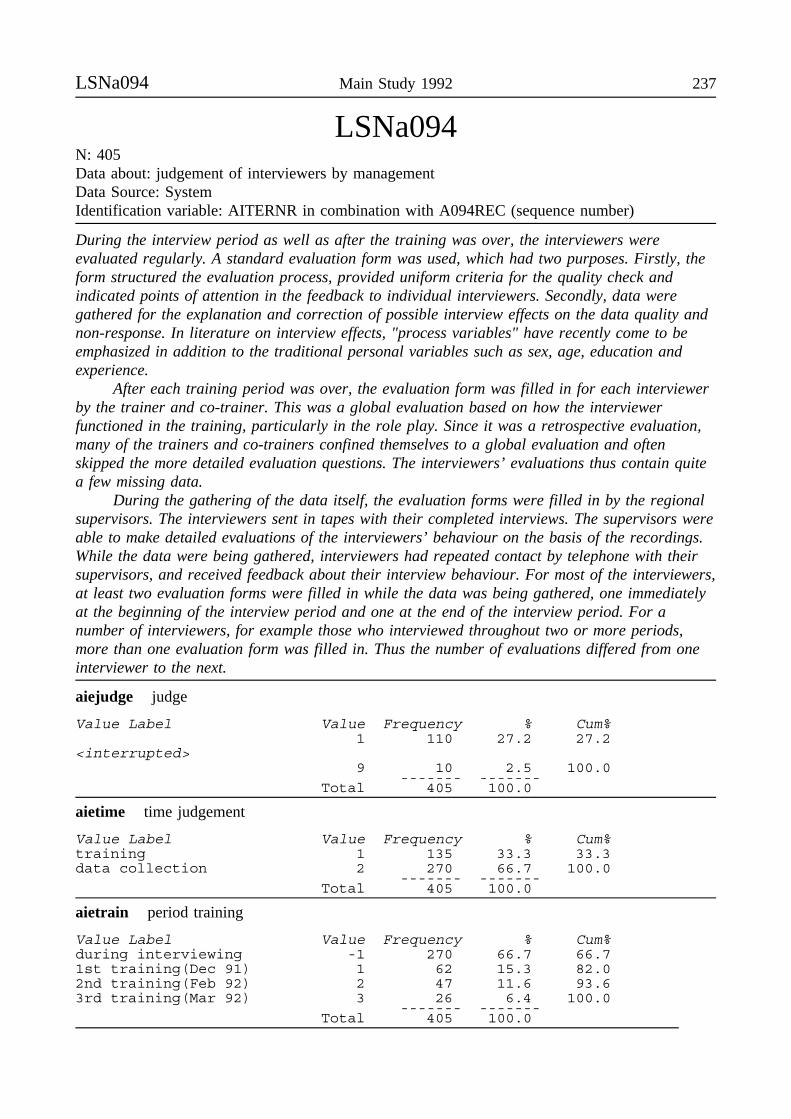
LSNa094 Main Study 1992 237
LSNa094N: 405Data about: judgement of interviewers by managementData Source: SystemIdentification variable: AITERNR in combination with A094REC (sequence number)
During the interview period as well as after the training was over, the interviewers wereevaluated regularly. A standard evaluation form was used, which had two purposes. Firstly, theform structured the evaluation process, provided uniform criteria for the quality check andindicated points of attention in the feedback to individual interviewers. Secondly, data weregathered for the explanation and correction of possible interview effects on the data quality andnon-response. In literature on interview effects, "process variables" have recently come to beemphasized in addition to the traditional personal variables such as sex, age, education andexperience.
After each training period was over, the evaluation form was filled in for each interviewerby the trainer and co-trainer. This was a global evaluation based on how the interviewerfunctioned in the training, particularly in the role play. Since it was a retrospective evaluation,many of the trainers and co-trainers confined themselves to a global evaluation and oftenskipped the more detailed evaluation questions. The interviewers’ evaluations thus contain quitea few missing data.
During the gathering of the data itself, the evaluation forms were filled in by the regionalsupervisors. The interviewers sent in tapes with their completed interviews. The supervisors wereable to make detailed evaluations of the interviewers’ behaviour on the basis of the recordings.While the data were being gathered, interviewers had repeated contact by telephone with theirsupervisors, and received feedback about their interview behaviour. For most of the interviewers,at least two evaluation forms were filled in while the data was being gathered, one immediatelyat the beginning of the interview period and one at the end of the interview period. For anumber of interviewers, for example those who interviewed throughout two or more periods,more than one evaluation form was filled in. Thus the number of evaluations differed from oneinterviewer to the next.
aiejudge judge
Value Label Value Frequency % Cum%1 110 27.2 27.2
<interrupted>9 10 2.5 100.0
------- -------Total 405 100.0
aietime time judgement
Value Label Value Frequency % Cum%training 1 135 33.3 33.3data collection 2 270 66.7 100.0
------- -------Total 405 100.0
aietrain period training
Value Label Value Frequency % Cum%during interviewing -1 270 66.7 66.71st training(Dec 91) 1 62 15.3 82.02nd training(Feb 92) 2 47 11.6 93.63rd training(Mar 92) 3 26 6.4 100.0
------- -------Total 405 100.0
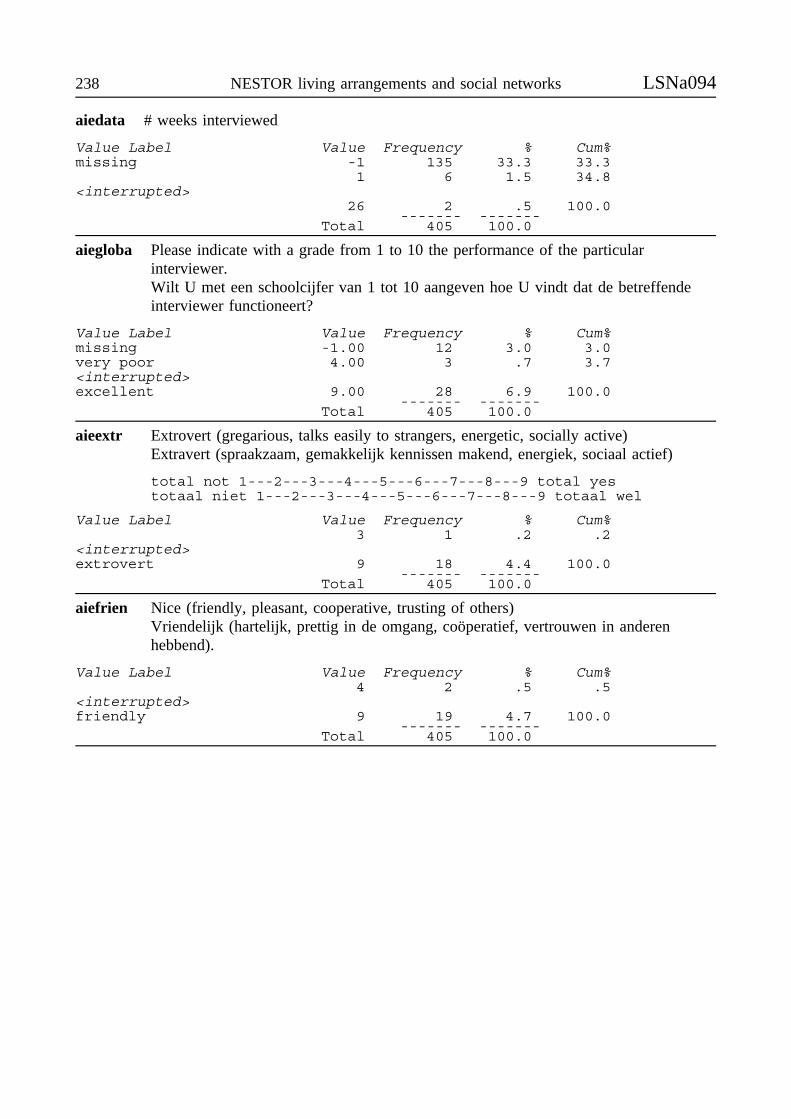
238 NESTOR living arrangements and social networks LSNa094
aiedata # weeks interviewed
Value Label Value Frequency % Cum%missing -1 135 33.3 33.3
1 6 1.5 34.8<interrupted>
26 2 .5 100.0------- -------
Total 405 100.0
aiegloba Please indicate with a grade from 1 to 10 the performance of the particularinterviewer.Wilt U met een schoolcijfer van 1 tot 10 aangeven hoe U vindt dat de betreffendeinterviewer functioneert?
Value Label Value Frequency % Cum%missing -1.00 12 3.0 3.0very poor 4.00 3 .7 3.7<interrupted>excellent 9.00 28 6.9 100.0
------- -------Total 405 100.0
aieextr Extrovert (gregarious, talks easily to strangers, energetic, socially active)Extravert (spraakzaam, gemakkelijk kennissen makend, energiek, sociaal actief)
total not 1---2---3---4---5---6---7---8---9 total yestotaal niet 1---2---3---4---5---6---7---8---9 totaal wel
Value Label Value Frequency % Cum%3 1 .2 .2
<interrupted>extrovert 9 18 4.4 100.0
------- -------Total 405 100.0
aiefrien Nice (friendly, pleasant, cooperative, trusting of others)Vriendelijk (hartelijk, prettig in de omgang, coöperatief, vertrouwen in anderenhebbend).
Value Label Value Frequency % Cum%4 2 .5 .5
<interrupted>friendly 9 19 4.7 100.0
------- -------Total 405 100.0
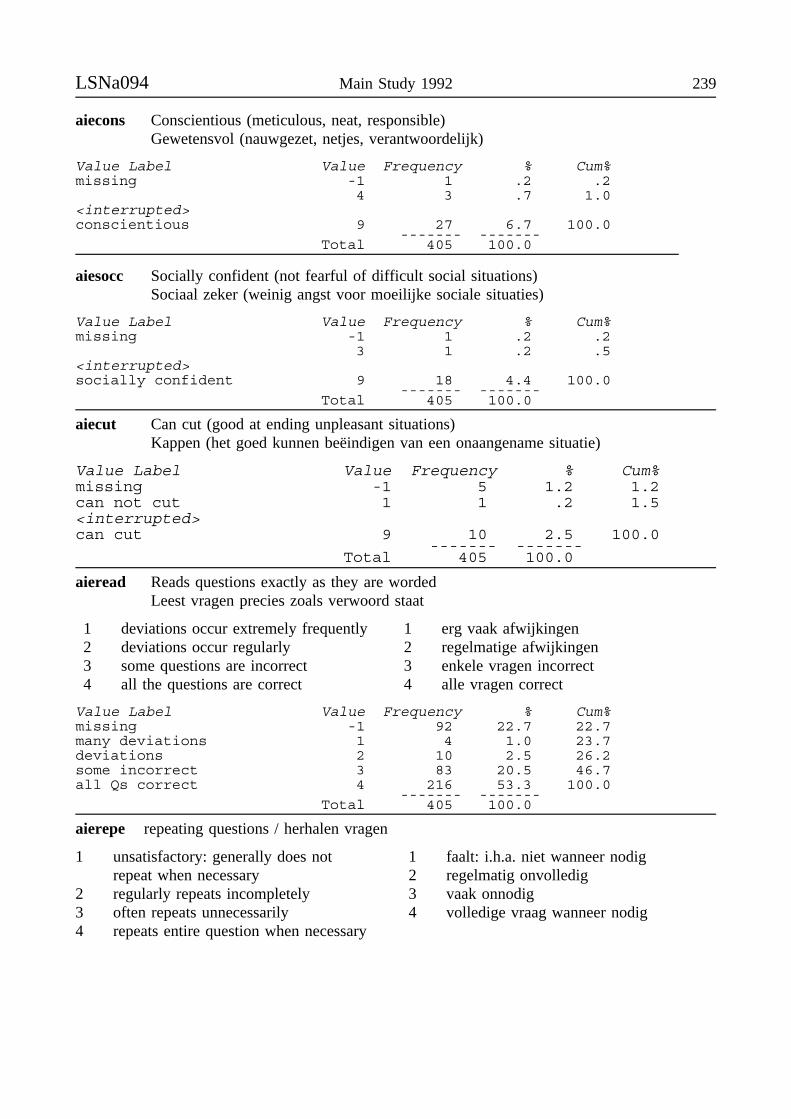
LSNa094 Main Study 1992 239
aiecons Conscientious (meticulous, neat, responsible)Gewetensvol (nauwgezet, netjes, verantwoordelijk)
Value Label Value Frequency % Cum%missing -1 1 .2 .2
4 3 .7 1.0<interrupted>conscientious 9 27 6.7 100.0
------- -------Total 405 100.0
aiesocc Socially confident (not fearful of difficult social situations)Sociaal zeker (weinig angst voor moeilijke sociale situaties)
Value Label Value Frequency % Cum%missing -1 1 .2 .2
3 1 .2 .5<interrupted>socially confident 9 18 4.4 100.0
------- -------Total 405 100.0
aiecut Can cut (good at ending unpleasant situations)Kappen (het goed kunnen beëindigen van een onaangename situatie)
Value Label Value Frequency % Cum%missing -1 5 1.2 1.2can not cut 1 1 .2 1.5<interrupted>can cut 9 10 2.5 100.0
------- -------Total 405 100.0
aieread Reads questions exactly as they are wordedLeest vragen precies zoals verwoord staat
1 deviations occur extremely frequently2 deviations occur regularly3 some questions are incorrect4 all the questions are correct
1 erg vaak afwijkingen2 regelmatige afwijkingen3 enkele vragen incorrect4 alle vragen correct
Value Label Value Frequency % Cum%missing -1 92 22.7 22.7many deviations 1 4 1.0 23.7deviations 2 10 2.5 26.2some incorrect 3 83 20.5 46.7all Qs correct 4 216 53.3 100.0
------- -------Total 405 100.0
aierepe repeating questions / herhalen vragen
1 unsatisfactory: generally does notrepeat when necessary
2 regularly repeats incompletely3 often repeats unnecessarily4 repeats entire question when necessary
1 faalt: i.h.a. niet wanneer nodig2 regelmatig onvolledig3 vaak onnodig4 volledige vraag wanneer nodig
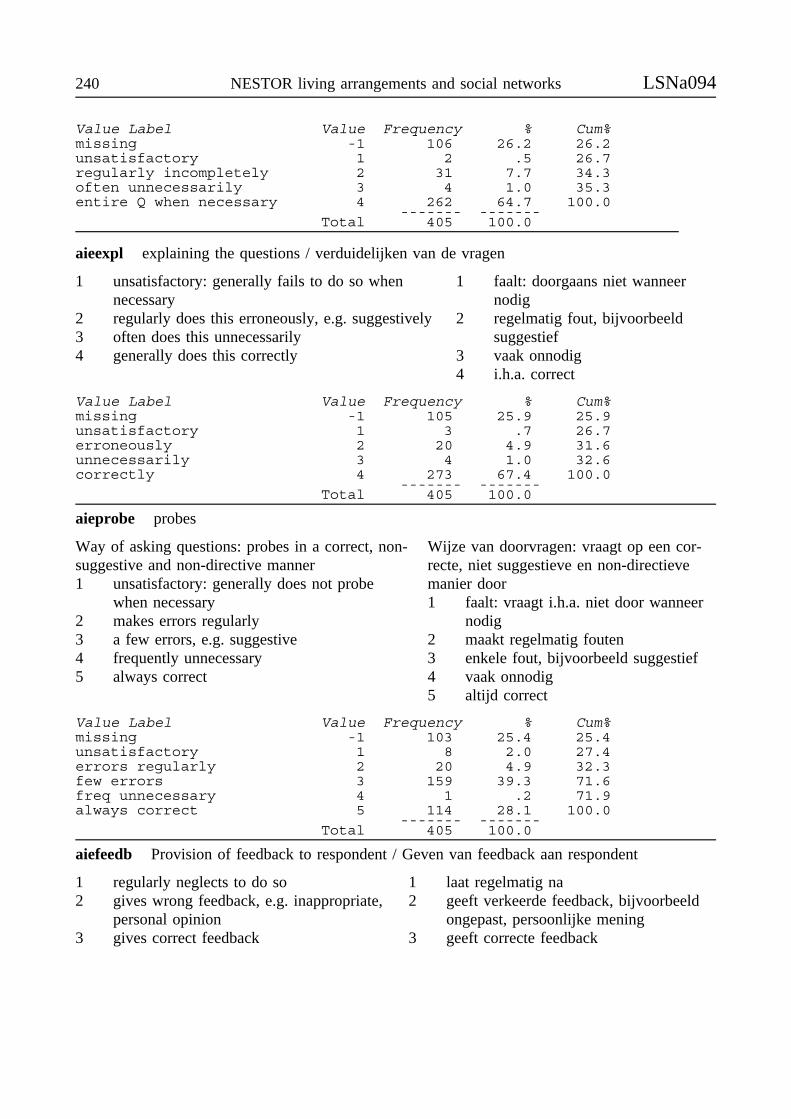
240 NESTOR living arrangements and social networks LSNa094
Value Label Value Frequency % Cum%missing -1 106 26.2 26.2unsatisfactory 1 2 .5 26.7regularly incompletely 2 31 7.7 34.3often unnecessarily 3 4 1.0 35.3entire Q when necessary 4 262 64.7 100.0
------- -------Total 405 100.0
aieexpl explaining the questions / verduidelijken van de vragen
1 unsatisfactory: generally fails to do so whennecessary
2 regularly does this erroneously, e.g. suggestively3 often does this unnecessarily4 generally does this correctly
1 faalt: doorgaans niet wanneernodig
2 regelmatig fout, bijvoorbeeldsuggestief
3 vaak onnodig4 i.h.a. correct
Value Label Value Frequency % Cum%missing -1 105 25.9 25.9unsatisfactory 1 3 .7 26.7erroneously 2 20 4.9 31.6unnecessarily 3 4 1.0 32.6correctly 4 273 67.4 100.0
------- -------Total 405 100.0
aieprobe probes
Way of asking questions: probes in a correct, non-suggestive and non-directive manner1 unsatisfactory: generally does not probe
when necessary2 makes errors regularly3 a few errors, e.g. suggestive4 frequently unnecessary5 always correct
Wijze van doorvragen: vraagt op een cor-recte, niet suggestieve en non-directievemanier door1 faalt: vraagt i.h.a. niet door wanneer
nodig2 maakt regelmatig fouten3 enkele fout, bijvoorbeeld suggestief4 vaak onnodig5 altijd correct
Value Label Value Frequency % Cum%missing -1 103 25.4 25.4unsatisfactory 1 8 2.0 27.4errors regularly 2 20 4.9 32.3few errors 3 159 39.3 71.6freq unnecessary 4 1 .2 71.9always correct 5 114 28.1 100.0
------- -------Total 405 100.0
aiefeedb Provision of feedback to respondent / Geven van feedback aan respondent
1 regularly neglects to do so2 gives wrong feedback, e.g. inappropriate,
personal opinion3 gives correct feedback
1 laat regelmatig na2 geeft verkeerde feedback, bijvoorbeeld
ongepast, persoonlijke mening3 geeft correcte feedback
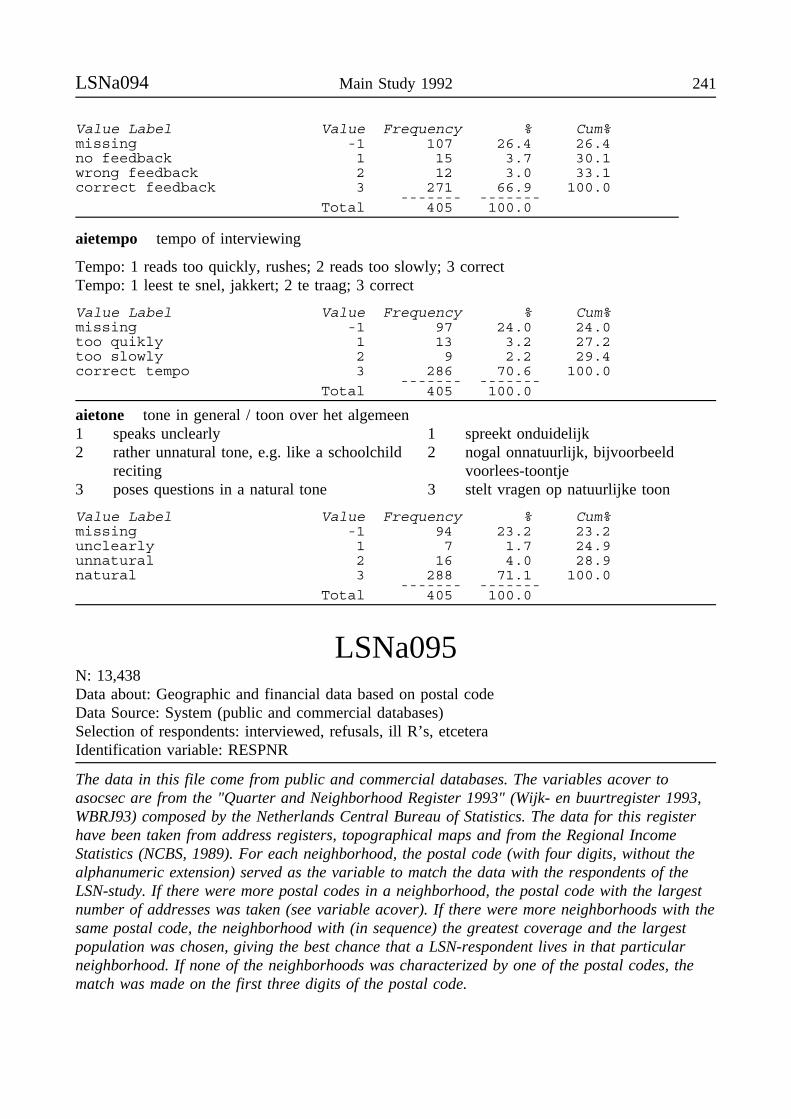
LSNa094 Main Study 1992 241
Value Label Value Frequency % Cum%missing -1 107 26.4 26.4no feedback 1 15 3.7 30.1wrong feedback 2 12 3.0 33.1correct feedback 3 271 66.9 100.0
------- -------Total 405 100.0
aietempo tempo of interviewing
Tempo: 1 reads too quickly, rushes; 2 reads too slowly; 3 correctTempo: 1 leest te snel, jakkert; 2 te traag; 3 correct
Value Label Value Frequency % Cum%missing -1 97 24.0 24.0too quikly 1 13 3.2 27.2too slowly 2 9 2.2 29.4correct tempo 3 286 70.6 100.0
------- -------Total 405 100.0
aietone tone in general / toon over het algemeen1 speaks unclearly2 rather unnatural tone, e.g. like a schoolchild
reciting3 poses questions in a natural tone
1 spreekt onduidelijk2 nogal onnatuurlijk, bijvoorbeeld
voorlees-toontje3 stelt vragen op natuurlijke toon
Value Label Value Frequency % Cum%missing -1 94 23.2 23.2unclearly 1 7 1.7 24.9unnatural 2 16 4.0 28.9natural 3 288 71.1 100.0
------- -------Total 405 100.0
LSNa095N: 13,438Data about: Geographic and financial data based on postal codeData Source: System (public and commercial databases)Selection of respondents: interviewed, refusals, ill R’s, etceteraIdentification variable: RESPNR
The data in this file come from public and commercial databases. The variables acover toasocsec are from the "Quarter and Neighborhood Register 1993" (Wijk- en buurtregister 1993,WBRJ93) composed by the Netherlands Central Bureau of Statistics. The data for this registerhave been taken from address registers, topographical maps and from the Regional IncomeStatistics (NCBS, 1989). For each neighborhood, the postal code (with four digits, without thealphanumeric extension) served as the variable to match the data with the respondents of theLSN-study. If there were more postal codes in a neighborhood, the postal code with the largestnumber of addresses was taken (see variable acover). If there were more neighborhoods with thesame postal code, the neighborhood with (in sequence) the greatest coverage and the largestpopulation was chosen, giving the best chance that a LSN-respondent lives in that particularneighborhood. If none of the neighborhoods was characterized by one of the postal codes, thematch was made on the first three digits of the postal code.
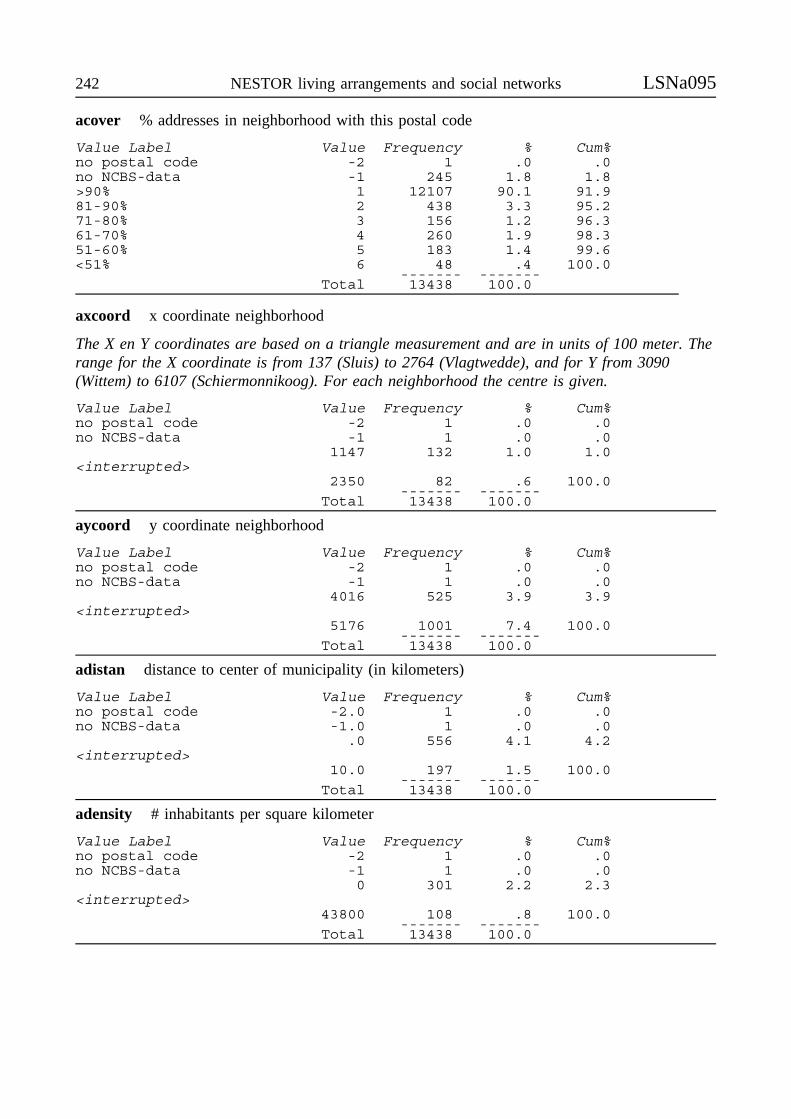
242 NESTOR living arrangements and social networks LSNa095
acover % addresses in neighborhood with this postal code
Value Label Value Frequency % Cum%no postal code -2 1 .0 .0no NCBS-data -1 245 1.8 1.8>90% 1 12107 90.1 91.981-90% 2 438 3.3 95.271-80% 3 156 1.2 96.361-70% 4 260 1.9 98.351-60% 5 183 1.4 99.6<51% 6 48 .4 100.0
------- -------Total 13438 100.0
axcoord x coordinate neighborhood
The X en Y coordinates are based on a triangle measurement and are in units of 100 meter. Therange for the X coordinate is from 137 (Sluis) to 2764 (Vlagtwedde), and for Y from 3090(Wittem) to 6107 (Schiermonnikoog). For each neighborhood the centre is given.
Value Label Value Frequency % Cum%no postal code -2 1 .0 .0no NCBS-data -1 1 .0 .0
1147 132 1.0 1.0<interrupted>
2350 82 .6 100.0------- -------
Total 13438 100.0
aycoord y coordinate neighborhood
Value Label Value Frequency % Cum%no postal code -2 1 .0 .0no NCBS-data -1 1 .0 .0
4016 525 3.9 3.9<interrupted>
5176 1001 7.4 100.0------- -------
Total 13438 100.0
adistan distance to center of municipality (in kilometers)
Value Label Value Frequency % Cum%no postal code -2.0 1 .0 .0no NCBS-data -1.0 1 .0 .0
.0 556 4.1 4.2<interrupted>
10.0 197 1.5 100.0------- -------
Total 13438 100.0
adensity # inhabitants per square kilometer
Value Label Value Frequency % Cum%no postal code -2 1 .0 .0no NCBS-data -1 1 .0 .0
0 301 2.2 2.3<interrupted>
43800 108 .8 100.0------- -------
Total 13438 100.0
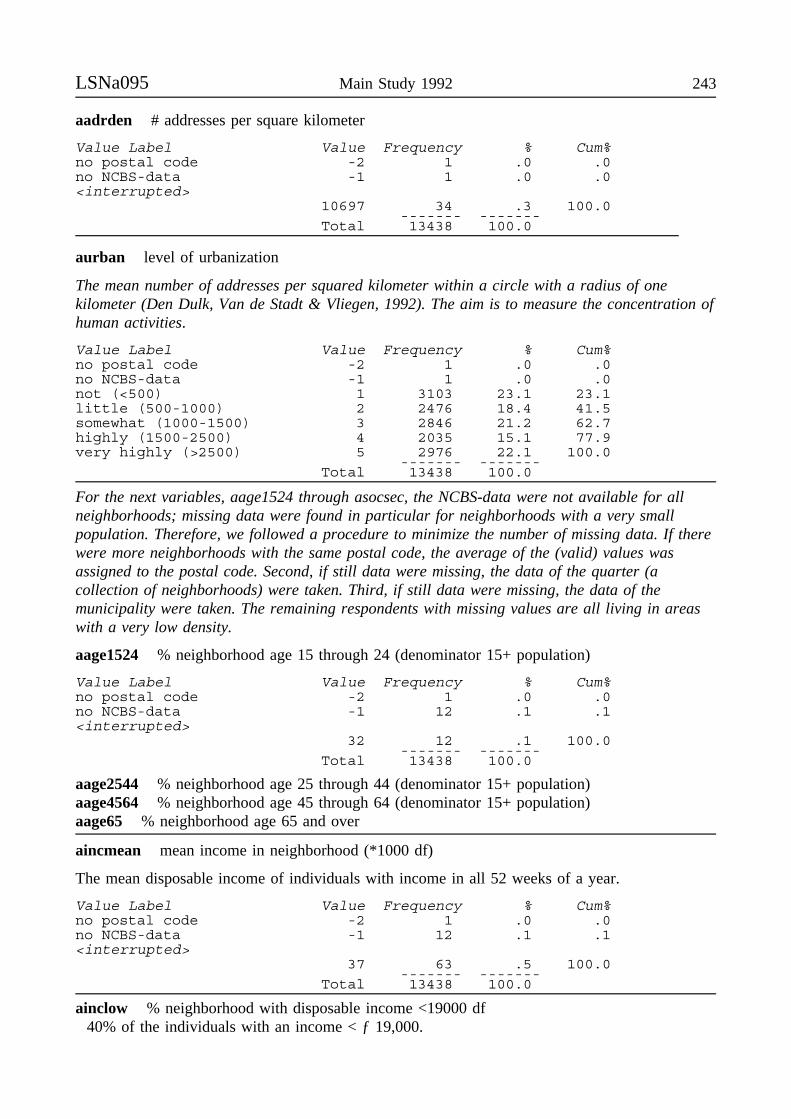
LSNa095 Main Study 1992 243
aadrden # addresses per square kilometer
Value Label Value Frequency % Cum%no postal code -2 1 .0 .0no NCBS-data -1 1 .0 .0<interrupted>
10697 34 .3 100.0------- -------
Total 13438 100.0
aurban level of urbanization
The mean number of addresses per squared kilometer within a circle with a radius of onekilometer (Den Dulk, Van de Stadt & Vliegen, 1992). The aim is to measure the concentration ofhuman activities.
Value Label Value Frequency % Cum%no postal code -2 1 .0 .0no NCBS-data -1 1 .0 .0not (<500) 1 3103 23.1 23.1little (500-1000) 2 2476 18.4 41.5somewhat (1000-1500) 3 2846 21.2 62.7highly (1500-2500) 4 2035 15.1 77.9very highly (>2500) 5 2976 22.1 100.0
------- -------Total 13438 100.0
For the next variables, aage1524 through asocsec, the NCBS-data were not available for allneighborhoods; missing data were found in particular for neighborhoods with a very smallpopulation. Therefore, we followed a procedure to minimize the number of missing data. If therewere more neighborhoods with the same postal code, the average of the (valid) values wasassigned to the postal code. Second, if still data were missing, the data of the quarter (acollection of neighborhoods) were taken. Third, if still data were missing, the data of themunicipality were taken. The remaining respondents with missing values are all living in areaswith a very low density.
aage1524 % neighborhood age 15 through 24 (denominator 15+ population)
Value Label Value Frequency % Cum%no postal code -2 1 .0 .0no NCBS-data -1 12 .1 .1<interrupted>
32 12 .1 100.0------- -------
Total 13438 100.0
aage2544 % neighborhood age 25 through 44 (denominator 15+ population)aage4564 % neighborhood age 45 through 64 (denominator 15+ population)aage65 % neighborhood age 65 and over
aincmean mean income in neighborhood (*1000 df)
The mean disposable income of individuals with income in all 52 weeks of a year.
Value Label Value Frequency % Cum%no postal code -2 1 .0 .0no NCBS-data -1 12 .1 .1<interrupted>
37 63 .5 100.0------- -------
Total 13438 100.0
ainclow % neighborhood with disposable income <19000 df40% of the individuals with an income < ƒ 19,000.
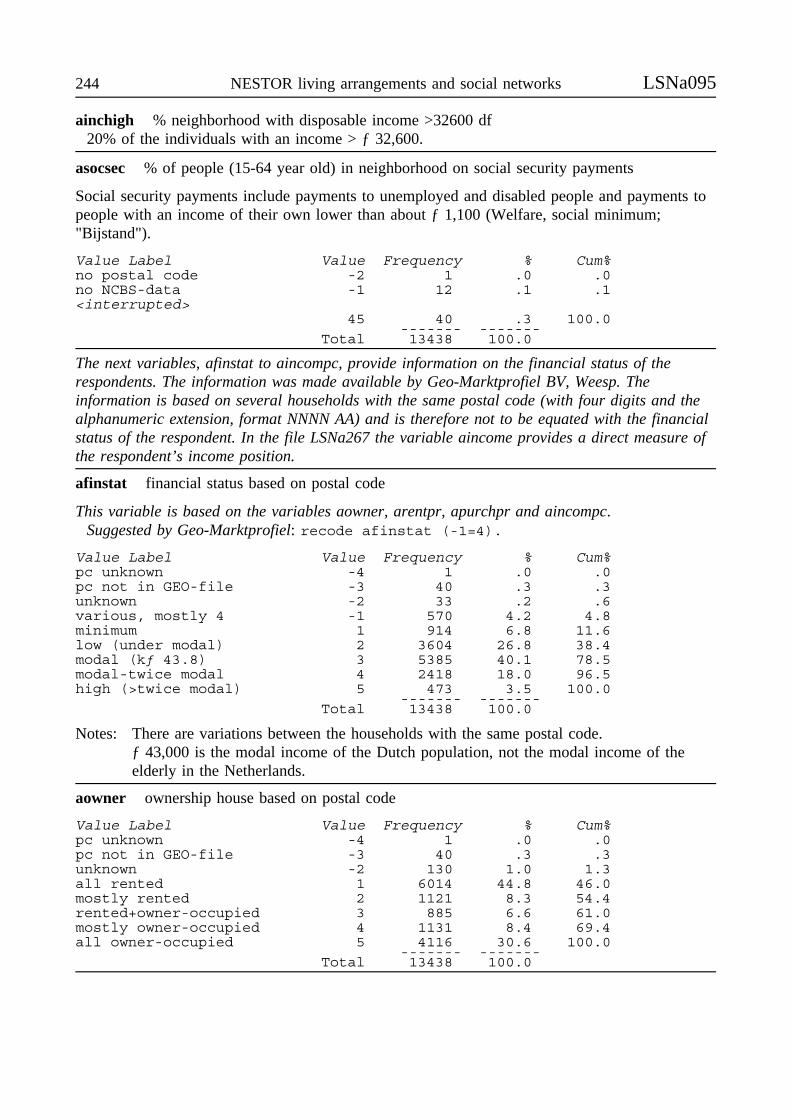
244 NESTOR living arrangements and social networks LSNa095
ainchigh % neighborhood with disposable income >32600 df20% of the individuals with an income > ƒ 32,600.
asocsec % of people (15-64 year old) in neighborhood on social security payments
Social security payments include payments to unemployed and disabled people and payments topeople with an income of their own lower than about ƒ 1,100 (Welfare, social minimum;"Bijstand").
Value Label Value Frequency % Cum%no postal code -2 1 .0 .0no NCBS-data -1 12 .1 .1<interrupted>
45 40 .3 100.0------- -------
Total 13438 100.0
The next variables, afinstat to aincompc, provide information on the financial status of therespondents. The information was made available by Geo-Marktprofiel BV, Weesp. Theinformation is based on several households with the same postal code (with four digits and thealphanumeric extension, format NNNN AA) and is therefore not to be equated with the financialstatus of the respondent. In the file LSNa267 the variable aincome provides a direct measure ofthe respondent’s income position.
afinstat financial status based on postal code
This variable is based on the variables aowner, arentpr, apurchpr and aincompc.Suggested by Geo-Marktprofiel: recode afinstat (-1=4).
Value Label Value Frequency % Cum%pc unknown -4 1 .0 .0pc not in GEO-file -3 40 .3 .3unknown -2 33 .2 .6various, mostly 4 -1 570 4.2 4.8minimum 1 914 6.8 11.6low (under modal) 2 3604 26.8 38.4modal (kƒ 43.8) 3 5385 40.1 78.5modal-twice modal 4 2418 18.0 96.5high (>twice modal) 5 473 3.5 100.0
------- -------Total 13438 100.0
Notes: There are variations between the households with the same postal code.ƒ 43,000 is the modal income of the Dutch population, not the modal income of theelderly in the Netherlands.
aowner ownership house based on postal code
Value Label Value Frequency % Cum%pc unknown -4 1 .0 .0pc not in GEO-file -3 40 .3 .3unknown -2 130 1.0 1.3all rented 1 6014 44.8 46.0mostly rented 2 1121 8.3 54.4rented+owner-occupied 3 885 6.6 61.0mostly owner-occupied 4 1131 8.4 69.4all owner-occupied 5 4116 30.6 100.0
------- -------Total 13438 100.0
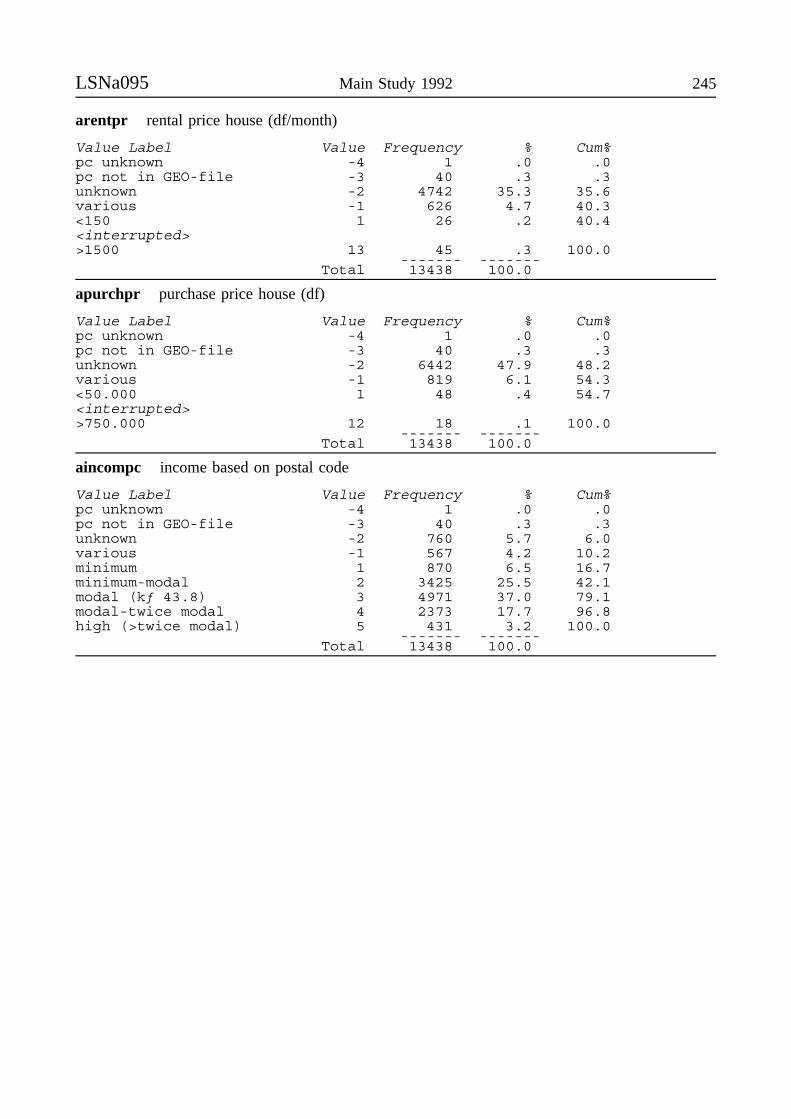
LSNa095 Main Study 1992 245
arentpr rental price house (df/month)
Value Label Value Frequency % Cum%pc unknown -4 1 .0 .0pc not in GEO-file -3 40 .3 .3unknown -2 4742 35.3 35.6various -1 626 4.7 40.3<150 1 26 .2 40.4<interrupted>>1500 13 45 .3 100.0
------- -------Total 13438 100.0
apurchpr purchase price house (df)
Value Label Value Frequency % Cum%pc unknown -4 1 .0 .0pc not in GEO-file -3 40 .3 .3unknown -2 6442 47.9 48.2various -1 819 6.1 54.3<50.000 1 48 .4 54.7<interrupted>>750.000 12 18 .1 100.0
------- -------Total 13438 100.0
aincompc income based on postal code
Value Label Value Frequency % Cum%pc unknown -4 1 .0 .0pc not in GEO-file -3 40 .3 .3unknown -2 760 5.7 6.0various -1 567 4.2 10.2minimum 1 870 6.5 16.7minimum-modal 2 3425 25.5 42.1modal (kƒ 43.8) 3 4971 37.0 79.1modal-twice modal 4 2373 17.7 96.8high (>twice modal) 5 431 3.2 100.0
------- -------Total 13438 100.0
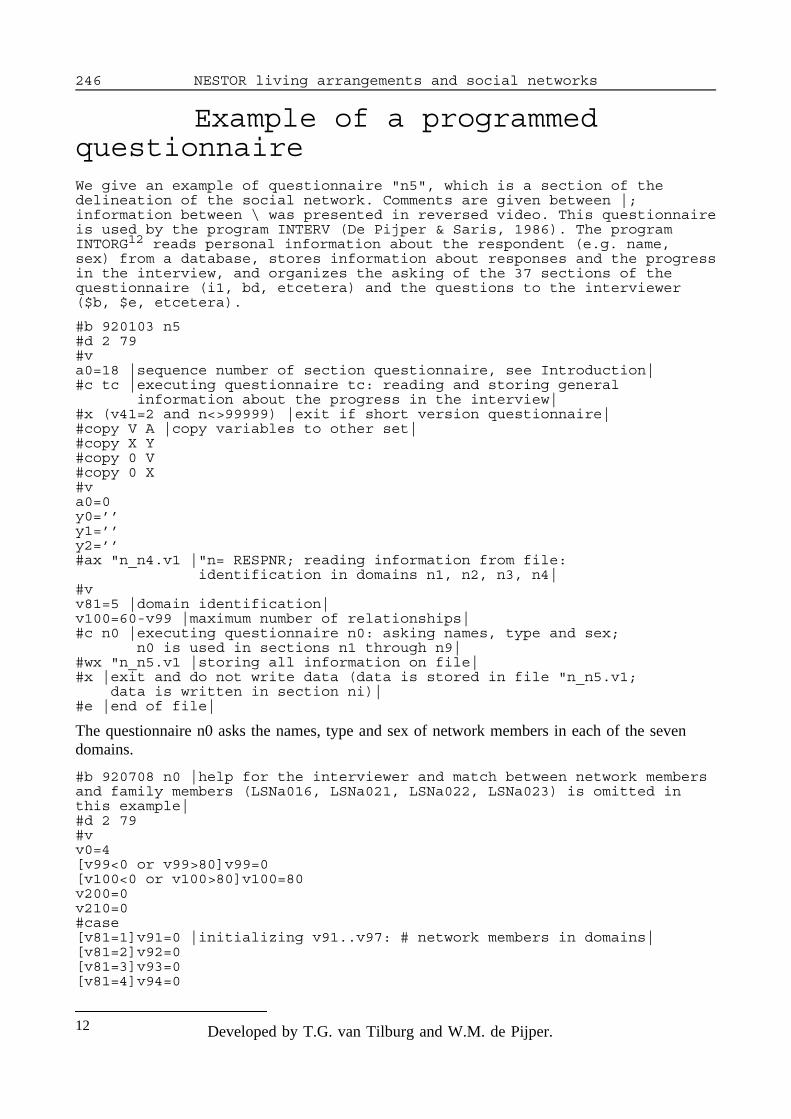
246 NESTOR living arrangements and social networks
Example of a programmedquestionnaireWe give an example of questionnaire "n5", which is a section of thedelineation of the social network. Comments are given between |;information between \ was presented in reversed video. This questionnaireis used by the program INTERV (De Pijper & Saris, 1986). The programINTORG12 reads personal information about the respondent (e.g. name,sex) from a database, stores information about responses and the progressin the interview, and organizes the asking of the 37 sections of thequestionnaire (i1, bd, etcetera) and the questions to the interviewer($b, $e, etcetera).
#b 920103 n5#d 2 79#va0=18 |sequence number of section questionnaire, see Introduction|#c tc |executing questionnaire tc: reading and storing general
information about the progress in the interview|#x (v41=2 and n<>99999) |exit if short version questionnaire|#copy V A |copy variables to other set|#copy X Y#copy 0 V#copy 0 X#va0=0y0=’’y1=’’y2=’’#ax "n_n4.v1 |"n= RESPNR; reading information from file:
identification in domains n1, n2, n3, n4|#vv81=5 |domain identification|v100=60-v99 |maximum number of relationships|#c n0 |executing questionnaire n0: asking names, type and sex;
n0 is used in sections n1 through n9|#wx "n_n5.v1 |storing all information on file|#x |exit and do not write data (data is stored in file "n_n5.v1;
data is written in section ni)|#e |end of file|
The questionnaire n0 asks the names, type and sex of network members in each of the sevendomains.
#b 920708 n0 |help for the interviewer and match between network membersand family members (LSNa016, LSNa021, LSNa022, LSNa023) is omitted inthis example|#d 2 79#vv0=4[v99<0 or v99>80]v99=0[v100<0 or v100>80]v100=80v200=0v210=0#case[v81=1]v91=0 |initializing v91..v97: # network members in domains|[v81=2]v92=0[v81=3]v93=0[v81=4]v94=0
12 Developed by T.G. van Tilburg and W.M. de Pijper.
Example Q Main Study 1992 247
[v81=5]v95=0[v81=6]v96=0[v81=7]v97=0#repeat 16#vv0=v0+1#vy[v0]=’’ |initializing|#until#vv0=0 |counter for this domain, number questions/loops|v90=0 |counter number persons in this domain|v85=0 |for presentation on screen|#ts v200 \t_start \d_start |storing time: hhmmss|#if (v100>0) |if maximum number for this domain is not reached|#repeat 80 |start loop for (v100) persons for this domain|#vy1=’’ |initializing|y2=’’y3=’’a81=0v82=0v83=0v84=0v0=v0+1 |counter for this domain, number questions/loops|#q1 |next a block of one question|#11 d y1 \name |asking of alfanumeric information, store only in variabley1|
{(v81=1) |conditional display of information on screen|\Identificatie huisgenoten\}{(v81=2)\Identificatie kinderen en hun partners\}{(v81=3)\Identificatie familieleden\}{(v81=4)\Identificatie buren en buurtgenoten\}{(v81=5)\Identificatie personen werk / vrijwilligerswerk / opleiding\}{(v81=6)\Identificatie personen organisaties\}{(v81=7)\Identificatie overige contacten\}{(v81=9)\Identificatie, toevoegen contacten\}
\Kaart 8\{(v81=1 and v0=1) |if domain=1 and counter=1|{(a15=1 and a17=1) |no partner in household, one other in household|Mag ik de voornaam en de eerste letter van de achternaam van die anderepersoon (van 18 jaar of ouder) in uw huishouden weten, met wie u eenregelmatig en belangrijk contact heeft_?}{(a15=1 and a17>1) |no partner in household, others in household|Mag ik de voornaam en de eerste letter van de achternaam van de personenin uw huishouden weten, met wie u een regelmatig en belangrijk contactheeft_?Wilt u ze één voor één opnoemen_? Dan begin ik nu met de eerste.}{(a15=2 and a17=0) |partner/spouse in the household, no others|Mag ik de voornaam en de eerste letter van de achternaam van uw "y23weten_?}{(a15=2 and a17=1) |partner/spouse in the household, one other|Ik wil graag eerst de voornaam en de eerste letter van de achternaam vanuw "y23 weten. }{(a15=2 and a17>1) |partner/spouse in the household, others|

248 NESTOR living arrangements and social networks Example Q
Ik wil graag eerst de voornaam en de eerste letter van de achternaam vanuw "y23 weten.}{(b93<1)\Algemene instructie: F4\}{(b93>0)\Algemene instructie: F4, gevolgd door namen huisgenoten\}}{(v81=2 and v0=1) |domain=2 and counter=1|{(b95=1){(b96<1)Eerder in het interview heeft u al de naam van uw kind genoemd.}{(b96>0)Eerder in het interview heeft u al de naam van uw nog levende kindgenoemd.}Ook heeft u verteld of hij/zij een echtgenoot, een echtgenote of eenpartner heeft. Nu wil ik graag weten of u met uw \kind\ een \regelmatigcontact\ en \belangrijk\ contact heeft. Indien dit zo is, wilt u dan devoornaam en de eerste letter van de achternaam van uw kind noemen_?}{(b95>1){(b96<1)Eerder in het interview heeft u al de namen van uw kinderen genoemd.}{(b96>0)Eerder in het interview heeft u al de namen van uw nog levende kinderengenoemd.}Ook heeft u verteld of zij een echtgenoot, een echtgenote of een partnerhebben. Nu wil ik graag weten met welke \kinderen\ (en hun partners) ueen \regelmatig contact\ en \belangrijk\ contact heeft. Wilt u ze éénvoor één opnoemen_? Noemt u maar de voornaam en de eerste letter van deachternaam.
\Namen laten noemen, dus niet zomaar alle kinderen/partners in netwerkopnemen. Zonodig citeria herhalen.\}}{(v81=3 and v0=1) |domain=3 and counter=1|Kunt u van uw \familieleden\, dat zijn onder meer{(a28=1)
uw schoonouders -indien zij nog leven-,}{(a28<>1)
uw ouders of schoonouders -indien zij nog leven-,}uw broers en zussen,
ook al heeft U die al eerder genoemd \in familiegedeelte\,uw neven en nichten,
{(a15=1)uw schoonfamilie,}
{(a15<>1)uw schoonfamilie van uw kant en van de kant van uw "y23,}
{(a29=1)en uw ooms en tantes}
{(a29<>1)uw ooms en tantes, enuw kleinkinderen,}
degenen noemen met wie u \regelmatig contact\ heeft en die \belangrijk\voor u zijn_? Het moeten personen zijn van 18 jaar en ouder. Wilt u devoornaam en de eerste letter van de achternaam geven_?
\Namen latennoemen, dus niet zomaar alle familieleden in netwerk opnemen. Zonodigciteria herhalen.\}{(v81=4 and v0=1) |domain=4 and counter=1|Kunt u van al uw \buren en buurtgenoten\ degenen noemen met wie u\regelmatig contact\ heeft en die \belangrijk\ voor u zijn_?Wilt u de voornaam en de eerste letter van de achternaam geven_?}{(v81=5 and v0=1) |domain=5 and counter=1|Kunt u de namen noemen van personen van uw (voormalig) \werk\,\vrijwilligerswerk of opleiding\, met wie u \regelmatig contact\ heeft endie \belangrijk\ voor u zijn_?Wilt u de voornaam en de eerste letter van de achternaam geven_?}
Example Q Main Study 1992 249
{(v81=6 and v0=1) |domain=6 and counter=1|Kunt u de namen noemen van personen die u ontmoet via de \kerk,sportvereniging, politieke organisaties, belangenvereniging\ endergelijke, met wie u \regelmatig contact\ heeft en die \belangrijk\ vooru zijn_?Wilt u de voornaam en de eerste letter van de achternaam geven_?}{(v81=7 and v0=1 and v85=0) |domain=7 and counter=1, no professional|{(v254=4)
\Er is een partner buiten het huishouden\}Er zijn wellicht nog mensen (bijvoorbeeld \vrienden of kennissen\)waarmee u omgaat, maar die u nog niet bij de eerdere vragen heeftkunnen noemen. Kunt u de namen noemen van hen met wie u \regelmatigcontact\ heeft en die \belangrijk\ voor u zijn_?Wilt u de voornaam en de eerste letter van de achternaam geven_?}{(v81=9 and v0=1) |domain=9 and counter=1|{(v254=4)
\Er is een partner buiten het huishouden\}Er zijn wellicht nog familieleden of buurtgenoten of andere mensenmet wie u \regelmatig contact\ heeft en die \belangrijk\ voor u zijn, dieu \vergeten\ bent hiervoor te noemen. Die kunnen nu als nog genoemdworden.Wilt u de voornaam en de eerste letter van de achternaam geven_?}
{((v0>1 and v85=0) or v85=1)
{(v81=1)Wat is de voornaam en de eerste letter van de achternaam van uw"v0(1,0)e huisgenoot, met wie u een regelmatig en belangrijk contactheeft_?}{(v81=2)Is er nog een kind of een schoonzoon, schoondochter, partner van een kindmet wie u een regelmatig en belangrijk contact heeft_?}{(v81=3)Is er nog een familielidmet wie u een regelmatig en belangrijk contact heeft_?}{(v81=4)Is er nog een buurman, buurvrouw of buurtgenootmet wie u een regelmatig en belangrijk contact heeft_?}{(v81=5)Is er nog iemand van uw werk, vrijwilligerswerk of opleidingmet wie u een regelmatig en belangrijk contact heeft_?}{(v81=6)Is er nog iemand van een organisatiemet wie u een regelmatig en belangrijk contact heeft_?}{(v81=7)Is er nog een volgende vriend, vriendin of kennismet wie u een regelmatig en belangrijk contact heeft_?}{(v81=9)Is er nog een volgende persoonmet wie u een regelmatig en belangrijk contact heeft_?}}
{(v81>1)\0 typen indien geen persoon.\}
Naam persoon: "# |end question asking alfanumeric information|#v |variable manipulation|[y1<>"0"]v90=v90+1 |if name<>0, # persons in this domain increased|[y1<>"0"]v99=v99+1 |if name<>0, total # persons increased|#if (v90=v0) |if # loop = # persons in this domain, ask type|#q1 |one question|#5 d a81 [1 7] \domain |asking numeric information, allowed range 1-7,store answer only in variable a81|
250 NESTOR living arrangements and social networks Example Q
#c (v81=9) |asked only for section n9|
\Identificatie, toevoegen contacten\
Is "y1 een
1 huisgenoot, huisgenote2 kind of een echtgeno(o)t(e)/partner van een kind3 familielid4 buur of buurtgenoot5 iemand van het werk, vrijwilligerswerk, of opleiding6 iemand van een organisatie7 een ander contact (bijv. vriend, vriendin of kennis)
\Indien geen twijfel, zelf invullen.\
#v[v81<8]a81=v81 |domain|#case[a81=1]a82=6 |maximum number answer categories for question about type|[a81=2]a82=2[a81=3]a82=8[a81=4]a82=0[a81=5]a82=3[a81=6]a82=0[a81=7]a82=8#v[a82<0 or a82>10]a82=10#case |variable manipulation|[v81=1 and a15=2 and v0=1]
v83=a16 |sex spouse/partner is already known|v82=1 |type=partner|
#q3 |block of 3 questions|#5 d v83 [1 2] \sex |asking numeric information (integer), allowed range1-2, information stored in variable v83|#c (v81<>1 or a15<>2 or v0<>1)
{(a81=1)\Identificatie huisgenoten\}{(a81=2)\Identificatie kinderen en hun partners\}{(a81=3)\Identificatie familieleden\}{(a81=4)\Identificatie buren en buurtgenoten\}{(a81=5)\Identificatie personen werk / vrijwilligerswerk / opleiding\}{(a81=6)\Identificatie personen organisaties\}{(a81=7)\Identificatie overige contacten\}{(v81=9 and v0>1) |domain=9 and counter>1|\toevoegen contacten\}
Is "y1 een man of een vrouw_?
\Indien geen twijfel, zelf invullen.\
1 man2 vrouw
#5 d v82 [1 [a82]] \type#c ((a81=1 or a81=2 or a81=3 or a81=5 or a81=7)and|| (v81<>1 or a15<>2 or v0<>1))
{(a81=1)\Identificatie huisgenoten\}
Example Q Main Study 1992 251
{(a81=2)\Identificatie kinderen en hun partners\}{(a81=3)\Identificatie familieleden\}{(a81=5)\Identificatie personen werk / vrijwilligerswerk / opleiding\}{(a81=7)\Identificatie overige contacten\}{(v81=9 and v0>1) |domain=9 and counter>1|\toevoegen contacten\}
In welke relatie staat "y1 tot u_?
{(a81=1 and v83=1){(a15=2)1 "y23 van R}2 zoon van R3 broer van R4 kleinzoon van R5 vriend van R}{(a81=1 and v83=2){(a15=2)1 "y23 van R}2 dochter van R3 zus van R4 kleindochter van R5 vriendin van R}{(a81=1)6 een andere persoon}{(a81=2 and v83=1)1 zoon van R2 schoonzoon (ook indien niet gehuwd) van R}{(a81=2 and v83=2)1 dochter van R2 schoondochter (ook indien niet gehuwd) van R}{(a81=3 and v83=1)1 vader van R2 broer van R3 zwager van R4 kleinzoon van R5 neef van R6 oom van R}{(a81=3 and v83=2)1 moeder van R2 zus van R3 schoonzus van R4 kleindochter van R5 nicht van R6 tante van R}{(a81=3)7 een ander familielid}{(a81=3 and v83=1)8 schoonvader van R}{(a81=3 and v83=2)8 schoonmoeder van R}{(a81=5)1 een (ex-)collega, chef of een ander persoon van het werk van R2 iemand vanuit het vrijwilligerswerk van R3 iemand van de opleiding die R volgt}{(a81=7 and v83=1)1 een vriend van R}{(a81=7 and v83=2)1 een vriendin van R}{(a81=7)

252 NESTOR living arrangements and social networks Example Q
2 een kennis van R3 een (ex-)collega, chef of een ander persoon van het werk van R4 iemand uit een vereniging of van de kerk van R5 iemand die R op straat of in het buurthuis spreekt}
{(a81=7 and v83=1)6 een beroepskracht, bijv. de hulp, gezinsverzorger of wijkverpleger vanR}{(a81=7 and v83=2)6 beroepskracht, bijv. de hulp, gezinsverzorgster of wijkverpleegstervan R}{(a81=7)7 andere beroepskracht, bijv. de huisarts, dominee, pastoor van R8 een ander contact van R}
\Indien geen twijfel, zelf invullen.\
#11 d y2 \type_om#c ((a81=1 and v82=6)or(a81=3 and v82=7)or(a81=7 and v82=8))
Wilt u de aard van de relatie met \"y1\ nauwkeuriger omschrijven_?
\Indien al bekend, dan niet vragen maar zelf invullen.\
\Voor deze omschrijving is ruimte tot het eind van de regel.\\Er is niet meer ruimte, omdat meer informatie in het vervolg van hetinterview niet op scherm past\ "##q1#5 [1 2] v88 d \personal#c (a81=7 and v82=6) |if professionals are mentioned|
Heeft u contact met \"y1\, buiten het contact met{(v83=1)hem als hulp, gezinsverzorger of wijkverpleger_?}{(v83=2)haar als hulp, gezinsverzorgster of wijkverpleegster_?}
1 nee2 ja
#case |adding a description of the relationship|[a81=1 and v82=1]y2=y23+’, huisgenoot’[a81=1 and v82=2 and v83=1]y2=’zoon, huisgenoot’[a81=1 and v82=2 and v83=2]y2=’dochter, huisgenoot’[a81=1 and v82=3 and v83=1]y2=’broer, huisgenoot’[a81=1 and v82=3 and v83=2]y2=’zus, huisgenoot’<interrupted>[a81=7 and v82=7 and v83=2]y2=’beroepskracht, v’[a81=7 and v82=8 and v83=1]y2=y2+’, m’[a81=7 and v82=8 and v83=2]y2=y2+’, v’#case[a81=7 and v82=6 and v88=2]v82=9 |helper, personal contact|#if (a81=7 and v82=7) |if professional and no personal contact|#vv90=v90-1 |decrease number persons in domain|v99=v99-1 |decrease total number persons|v0=v0-1 |decrease counter|v84=0v85=1 |screen|#i |information is displayed on screen|
\De genoemde persoon, "y1, is een beroepskracht.\\Het noemen van een beroepskracht is toegestaan, en genoteerd.\\Later zullen er echter geen vragen over "y1 gesteld worden. \
#endif#if (a81<>7 or v82<>7) |if not professional|
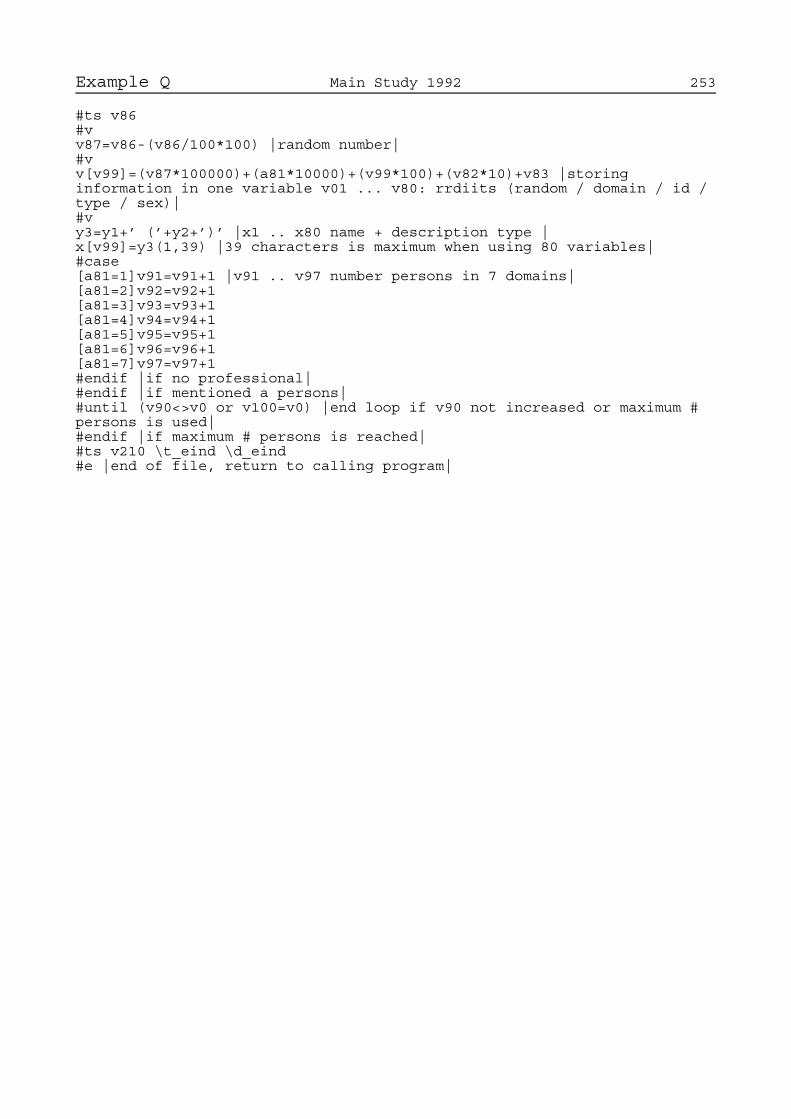
Example Q Main Study 1992 253
#ts v86#vv87=v86-(v86/100*100) |random number|#vv[v99]=(v87*100000)+(a81*10000)+(v99*100)+(v82*10)+v83 |storinginformation in one variable v01 ... v80: rrdiits (random / domain / id /type / sex)|#vy3=y1+’ (’+y2+’)’ |x1 .. x80 name + description type |x[v99]=y3(1,39) |39 characters is maximum when using 80 variables|#case[a81=1]v91=v91+1 |v91 .. v97 number persons in 7 domains|[a81=2]v92=v92+1[a81=3]v93=v93+1[a81=4]v94=v94+1[a81=5]v95=v95+1[a81=6]v96=v96+1[a81=7]v97=v97+1#endif |if no professional|#endif |if mentioned a persons|#until (v90<>v0 or v100=v0) |end loop if v90 not increased or maximum #persons is used|#endif |if maximum # persons is reached|#ts v210 \t_eind \d_eind#e |end of file, return to calling program|

254 NESTOR living arrangements and social networks
List of variablesVariables with the same name contain the same information (sometimes the same informationabout different respondents). Numbers at the end of a line preceded by "a" refer to data files.
sexachsex son or daughter a022agcsex grandson or granddaughter a023aisex sex interviewer a003anwsex sex network member a047asbsex brother or sister a021awcohsex weight sex & cohort a009awtot weight fe/males a009sex sex person in sample / respondent a002/a008/a091
birth, birthdate, ageaage age of respondent a008/a091abwhere born in Netherlands or abroad a010achage age child a022aethnic ethnic identification a010agcage age grandchild a023anation nationality a010anwage age network member a051apage age partner a011asbage age sister or brother a021awcoh weight cohorts a009awcohsex weight sex & cohort a009bdate birth date a008/a091bycohort 5-years-cohort birth year a008/a098byear year of birth person in sample a002
marital status, cohabitation, living arrangement, household (history)a065qual quality household history data a265a065source source of data in LSNa065 a065a065type type of household record a065aagehhm (current) age household member a065abrohous # brothers in household a221achhoush child in household respondent a022achpart marital status and partner status child a022acouple respondent forms married couple with an other respondent a008acurst begin current coresidence household member <age R> a015acurrea reason begin current coresidence household member a015adunexp was death partner unexpected? a063aend union ended at age respondent a063aendbr1 first break ended at age respondent a063aendbr2 second break ended at age respondent a063aendbr3 third break ended at age respondent a063aendc1 reason end 1st cohabitation a022aendc2 reason end 2nd cohabitation a022
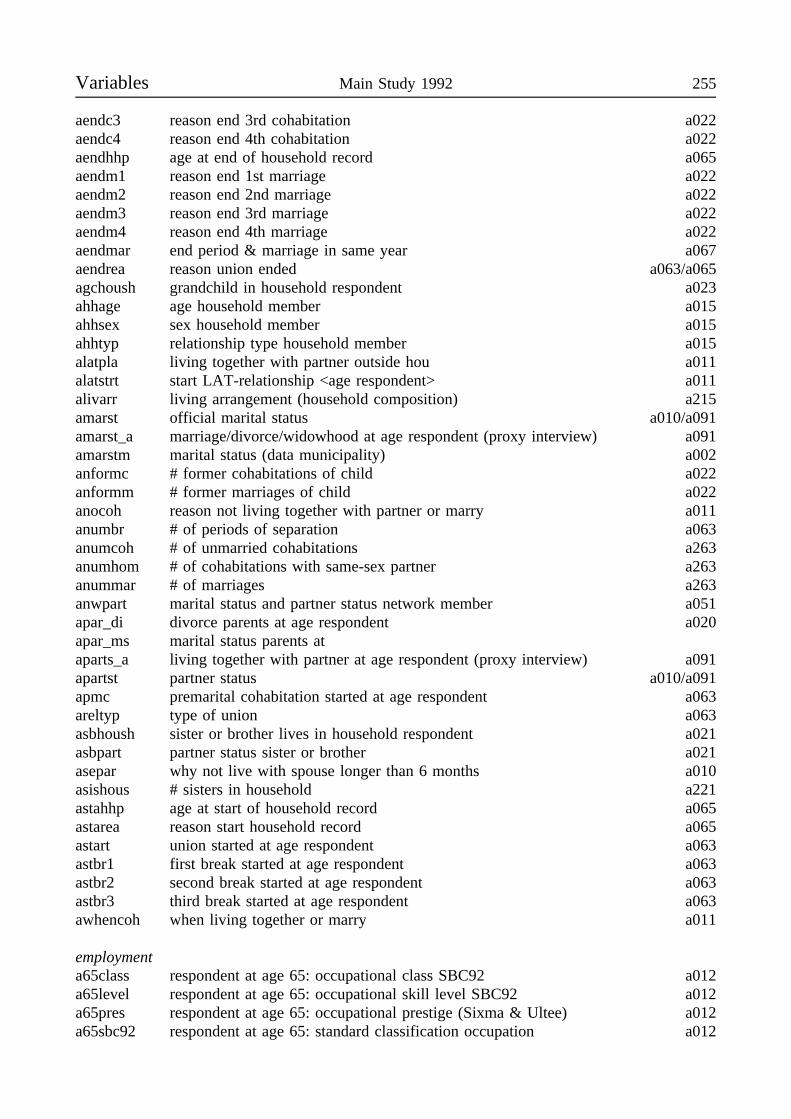
Variables Main Study 1992 255
aendc3 reason end 3rd cohabitation a022aendc4 reason end 4th cohabitation a022aendhhp age at end of household record a065aendm1 reason end 1st marriage a022aendm2 reason end 2nd marriage a022aendm3 reason end 3rd marriage a022aendm4 reason end 4th marriage a022aendmar end period & marriage in same year a067aendrea reason union ended a063/a065agchoush grandchild in household respondent a023ahhage age household member a015ahhsex sex household member a015ahhtyp relationship type household member a015alatpla living together with partner outside hou a011alatstrt start LAT-relationship <age respondent> a011alivarr living arrangement (household composition) a215amarst official marital status a010/a091amarst_a marriage/divorce/widowhood at age respondent (proxy interview) a091amarstm marital status (data municipality) a002anformc # former cohabitations of child a022anformm # former marriages of child a022anocoh reason not living together with partner or marry a011anumbr # of periods of separation a063anumcoh # of unmarried cohabitations a263anumhom # of cohabitations with same-sex partner a263anummar # of marriages a263anwpart marital status and partner status network member a051apar_di divorce parents at age respondent a020apar_ms marital status parents ataparts_a living together with partner at age respondent (proxy interview) a091apartst partner status a010/a091apmc premarital cohabitation started at age respondent a063areltyp type of union a063asbhoush sister or brother lives in household respondent a021asbpart partner status sister or brother a021asepar why not live with spouse longer than 6 months a010asishous # sisters in household a221astahhp age at start of household record a065astarea reason start household record a065astart union started at age respondent a063astbr1 first break started at age respondent a063astbr2 second break started at age respondent a063astbr3 third break started at age respondent a063awhencoh when living together or marry a011
employmenta65class respondent at age 65: occupational class SBC92 a012a65level respondent at age 65: occupational skill level SBC92 a012a65pres respondent at age 65: occupational prestige (Sixma & Ultee) a012a65sbc92 respondent at age 65: standard classification occupation a012

256 NESTOR living arrangements and social networks Variables
a65type respondent at age 65: main type of skills in occupation a012achempl employment child a022aemplen end employment at age respondent a010/a091aemplhr hours per week employment a010aemplst employment status a010aemptyp type of employment related period a067aendper age at end of period a067afaclass father: occupational class SBC92 a019afalevel father: occupational skill level SBC92 a019afasbc92 father: standard classification occupation a019afapres father: occupational prestige a019afatype father: main type of skills in occupation a019afjch 1st job and 1st child in same year a267afjmar 1st job and mar in same year a267amo_empl employment mother during youth respondent a020amo_volu volunteer work mother during youth respondent a020anwempl no/part/fulltime work network member a051aocclev respondent: skill level last occupation a010aoccpre respondent: prestige last occupation a010ap6class partner at age 65: occupational class SBC92 a012ap6level partner at age 65: occupational skill level SBC92 a012ap6pres partner at age 65: occupational prestige (Sixma & Ultee) a012ap6sbc92 partner at age 65: standard classification occupation a012ap6type partner at age 65: main type of skills in occupation a012apcclass partner, current: occupational class SBC92 a012apclevel partner, current: occupational skill level SBC92 a012apcpres partner, current: occupational prestige (Sixma & Ultee) a012apcsbc92 partner, current: standard classification occupation a012apctype partner, current: main type of skills in occupation a012apemplen end employment partner a011apemplhr hours per week employment partner a011apemplst employment status partner a011aplclass partner, last: occupational class SBC92 a012apllevel partner, last: occupational skill level SBC92 a012aplpres partner, last: occupational prestige (Sixma & Ultee) a012aplsbc92 partner, last: standard classification occupation a012apltype partner, last: main type of skills in occupation a012apocclev partner: skill level last occupation a011apoccpre partner: prestige last occupation a011ar1class respondent, first: occupational class SBC92 a012ar1level respondent, first: occupational skill level SBC92 a012ar1pres respondent, first: occupational prestige (Sixma & Ultee) a012ar1sbc92 respondent, first: standard classification occupation a012ar1type respondent, first: main type of skills in occupation a012arcclass respondent, current: occupational class SBC92 a012arclevel respondent, current: occupational skill level SBC92 a012arcpres respondent, current: occupational prestige (Sixma & Ultee) a012arcsbc92 respondent, current: standard classification occupation a012arctype respondent, current: main type of skills in occupation a012aretire early retirement (company, eligible, use, plan) a267
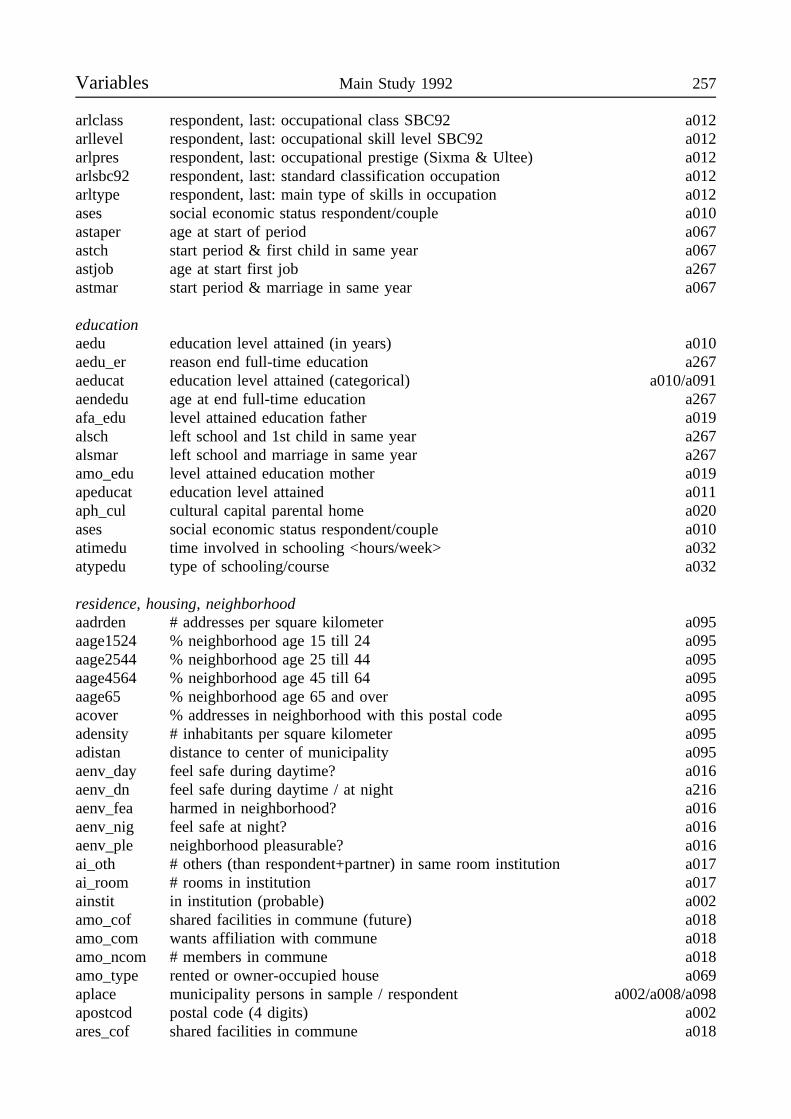
Variables Main Study 1992 257
arlclass respondent, last: occupational class SBC92 a012arllevel respondent, last: occupational skill level SBC92 a012arlpres respondent, last: occupational prestige (Sixma & Ultee) a012arlsbc92 respondent, last: standard classification occupation a012arltype respondent, last: main type of skills in occupation a012ases social economic status respondent/couple a010astaper age at start of period a067astch start period & first child in same year a067astjob age at start first job a267astmar start period & marriage in same year a067
educationaedu education level attained (in years) a010aedu_er reason end full-time education a267aeducat education level attained (categorical) a010/a091aendedu age at end full-time education a267afa_edu level attained education father a019alsch left school and 1st child in same year a267alsmar left school and marriage in same year a267amo_edu level attained education mother a019apeducat education level attained a011aph_cul cultural capital parental home a020ases social economic status respondent/couple a010atimedu time involved in schooling <hours/week> a032atypedu type of schooling/course a032
residence, housing, neighborhoodaadrden # addresses per square kilometer a095aage1524 % neighborhood age 15 till 24 a095aage2544 % neighborhood age 25 till 44 a095aage4564 % neighborhood age 45 till 64 a095aage65 % neighborhood age 65 and over a095acover % addresses in neighborhood with this postal code a095adensity # inhabitants per square kilometer a095adistan distance to center of municipality a095aenv_day feel safe during daytime? a016aenv_dn feel safe during daytime / at night a216aenv_fea harmed in neighborhood? a016aenv_nig feel safe at night? a016aenv_ple neighborhood pleasurable? a016ai_oth # others (than respondent+partner) in same room institution a017ai_room # rooms in institution a017ainstit in institution (probable) a002amo_cof shared facilities in commune (future) a018amo_com wants affiliation with commune a018amo_ncom # members in commune a018amo_type rented or owner-occupied house a069aplace municipality persons in sample / respondent a002/a008/a098apostcod postal code (4 digits) a002ares_cof shared facilities in commune a018
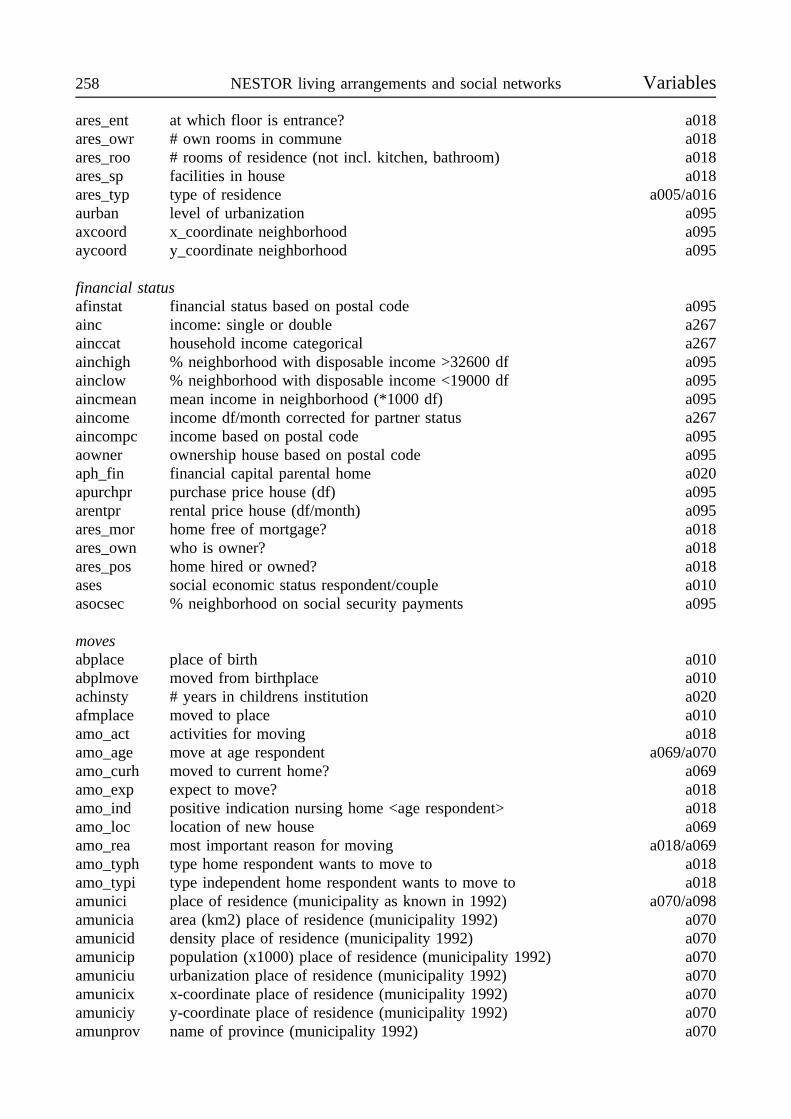
258 NESTOR living arrangements and social networks Variables
ares_ent at which floor is entrance? a018ares_owr # own rooms in commune a018ares_roo # rooms of residence (not incl. kitchen, bathroom) a018ares_sp facilities in house a018ares_typ type of residence a005/a016aurban level of urbanization a095axcoord x_coordinate neighborhood a095aycoord y_coordinate neighborhood a095
financial statusafinstat financial status based on postal code a095ainc income: single or double a267ainccat household income categorical a267ainchigh % neighborhood with disposable income >32600 df a095ainclow % neighborhood with disposable income <19000 df a095aincmean mean income in neighborhood (*1000 df) a095aincome income df/month corrected for partner status a267aincompc income based on postal code a095aowner ownership house based on postal code a095aph_fin financial capital parental home a020apurchpr purchase price house (df) a095arentpr rental price house (df/month) a095ares_mor home free of mortgage? a018ares_own who is owner? a018ares_pos home hired or owned? a018ases social economic status respondent/couple a010asocsec % neighborhood on social security payments a095
movesabplace place of birth a010abplmove moved from birthplace a010achinsty # years in childrens institution a020afmplace moved to place a010amo_act activities for moving a018amo_age move at age respondent a069/a070amo_curh moved to current home? a069amo_exp expect to move? a018amo_ind positive indication nursing home <age respondent> a018amo_loc location of new house a069amo_rea most important reason for moving a018/a069amo_typh type home respondent wants to move to a018amo_typi type independent home respondent wants to move to a018amunici place of residence (municipality as known in 1992) a070/a098amunicia area (km2) place of residence (municipality 1992) a070amunicid density place of residence (municipality 1992) a070amunicip population (x1000) place of residence (municipality 1992) a070amuniciu urbanization place of residence (municipality 1992) a070amunicix x-coordinate place of residence (municipality 1992) a070amuniciy y-coordinate place of residence (municipality 1992) a070amunprov name of province (municipality 1992) a070
Variables Main Study 1992 259
anmoves # of moves since age 18 a269aplres45 place of residence at age 45 a269ares_in moved to current home / institutionalized <age respondent> a016/a091ares45y age respondent moved to place of residence at age of 45 a269
religionachaff church affiliation strength a010achfrq frequency church attendance a010achurch membership church a010afa_ch fathers religious denomination a019amo_ch mothers religious denomination a019apchfrq frequency church attendance partner a011apchurch membership church partner a011aph_rel religiosity parental home a020avolunt volunteering a032
health, physical and cognitive capacities, careaadl activities daily living <4 items ordinal> a230aadl1 respondent: up/down stairs a030aadl2 respondent: walk 5 minutes outdoors a030aadl3 respondent: stand up/sit down chair a030aadl4 respondent: dress/undress a030acaregiv relationship respondent-caregiver (proxy interview) a091acomplai type complaints (proxy interview) a091adisab % disabled occupationally a010ahandic physical disablities respondent (evaluation interviewer) a081ahealt_e estimate of health of respondent (evaluation interviewer) a081ahear hearing personal conversation a030ahearing hearing capacities of respondent (evaluation interviewer) a081aheco10y health compared to 10 years ago a030ahecoage health compared to peers a030ahegener health in general a030aheill limitations health illnesses handicaps a030ahelpfrq respondent: how often helped with a/iadl-activities a030aiadl instrumental activities household <4 items ordinal> a230aiadl1 respondent: daily groceries a030aiadl2 respondent: prepare hot meals a030aiadl3 respondent: change bed sheets a030aiadl4 respondent: do laundry a030aiadl5 respondent: clean house a030aiadl6 respondent: odd jobs/small repairs a030aiadl7 respondent: official forms/letters a030aimprove # weeks improvement expected (proxy interview) a091amemo_1 calling mind (evaluation interviewer) a081amemo_2 memory of respondent (evaluation interviewer) a081amemory1 ever had problems with memory? a014ammse04 which day is it now? a014ammse06 which province are we now? a014ammse08 mention two mainstreets a014ammse11 repeat 3 objects a014
260 NESTOR living arrangements and social networks Variables
ammse12 100-7-7-7-7-7=65 a014ammse14 repeat 3 objects, again a014ammse17 repeat sentence a014amobilit mobility of respondent (evaluation interviewer) a081anoact reason no leisure time activities a032apadl activities partner daily living <4 items ordinal> a231apadl1 partner: stairs up and down a031apadl2 partner: walking outdoor 5 minutes a031apadl3 partner: sitting/standing chair a031apadl4 partner: dressing/changing clothes a031apdisab % disabled occupationally partner a011aphelpfr partner: how often helped with adl-activities a031apwho partner: helped with adl-activities by .... a031avision vision capacities of respondent (evaluation interviewer) a081avisread vision reading a030avisstrt vision street a030avisus visual capacities a230awb2 likert: satisfaction health a074awb5 ladder: satisfaction health a074awb8 comparison: satisfaction health a074awho respondent: helped with adl-activities by .... a030
social supportaeg aggregated total emotional support given <0..44> a251aeg_9 agg. total emotional support given <0..36, comparable with LASA> a251aemo_giv emotional support given (for each relationship) a051aemo_rec emotional support received (for each relationship) a051aer aggregated total emotional support received <0..44> a251aer_9 agg. total emotional support received <0..36, comp. with LASA> a251agcadvic grandchild asked for advice a023agcbaby babysitted during last year a023aig aggregated total instrumental support given <0..44> a251aig_9 agg. total instrumental support given <0..36, comp. with LASA> a251ains_giv instrumental support given (for each relationship) a051ains_rec instrumental support received (for each relationship) a051air aggregated total instrumental support received <0..44> a251air_9 agg. total instrumental support received <0..36, comp. with LASA> a251ameg aggregated mean emotional support given <0..44> a251ameg_9 agg. mean emotional support given <0..36, comparable with LASA> a251amer aggregated mean emotional support received <0..44> a251amer_9 agg. mean emotional support received <0..36, comp. with LASA> a251amig aggregated mean instrumental support given <0..44> a251amig_9 agg. mean instrumental support given <0..36, comp. with LASA> a251amir aggregated mean instrumental support received <0..44> a251amir_9 agg. mean instrumental support received <0..36, comp. with LASA> a251asequenc sequence questions support (for each relationship) a051asq sequence questions support a251
frequency of contact, contact characteristics (other than support and travelling time)achfreq frequency contact with child a022
Variables Main Study 1992 261
adact type of activities before death partner a063adcon type of contacts before death partner a063adfam contact family after death partner a063adfri contact friends after death partner a063afreqran ranking # frequency (network members) a048agcfreq frequency contact with grandchild a023agcfreqp frequency contact with grandchild voluntary/pleasure a023agcfun voluntary visits by grandchild a023agcstay grandchild stayed with respondent a023anwdens density in selected part of network a256anwfreq frequency of contact with network member a047apairctc direct contact between network members in pair a056apctc probability of contact a056arandom used in ranking frequency ties (network members) a048asbfreq frequency contact with sister or brother a021
travelling timeachtrav travelling time to child (minutes) a022anwtrav travelling time to network member (minutes) a051asbtrav travelling time to sister or brother (minutes) a021
network (incl. family, other than support, frequency of contact, etcetera)adomtyp domain and type of relationship with network member a047anegativ quarreling within relationship with network member a051anwdurat duration relationship (years) with network member a051anwsize network size (# of network members) a247
family composition, deathsabroaliv # brothers alive a221/a091abroever # brothers ever born a221abroold # older brothers (proxy interview) a091abroyou # younger brothers (proxy interview) a091ach_aliv # children still alive a222ach_dead # children deceased a222achdead child died at age a022achrec # records with info about children a222achstep own, step, adoptive child a022aendch end period & first child in same year a067afadied father died at age respondent a020agcdead grandchild died at age a023
262 NESTOR living arrangements and social networks Variables
agcnum # grandchildren (sons/daughters of this child) a022agcstep own, step, adoptive grandchild a023aggcnum # great grandchildren (grandchildren of this child) a022amodied mother died at age respondent a020anc_volu voluntary childlessness a222anchild # children a222/a091andaugh # daughters (proxy interview) a091anfoster # foster children a222angcnum # grandchildren a223anggcnum # greatgrandchildren a223anpair # pairs between selected network members a256ansons # sons (proxy interview) a091asbstep own, step, adoptive sister of brother a021asfa_t1 type 1st substitute father a020asfa_t2 type 2nd substitute father a020asfa_t3 type 3rd substitute father a020asfa_y1 # years 1st substitute father a020asfa_y2 # years 2nd substitute father a020asfa_y3 # years 3rd substitute father a020asisaliv # sisters alive a221/a091asisever # sisters ever born a221asisold # older sisters (proxy interview) a091asisyou # younger sisters (proxy interview) a091asmo_t1 type 1st substitute mother a020asmo_t2 type 2nd substitute mother a020asmo_t3 type 3rd substitute mother a020asmo_y1 # years 1st substitute mother a020asmo_y2 # years 2nd substitute mother a020asmo_y3 # years 3rd substitute mother a020
social participationaactleis leisure time activities a032acar car in household, valid driver license a032alibrary reading books public library a032amember memberships (+activities: uni par ssex sen) a032anoact reason no leisure time activities a032aouteve going out in evening a032aoutsum going out in summer a032aoutwin going out in winter a032aoutwse going out in winter,summer,evening a232apaper read newspaper a032apas65 use made of cultural seniors card a032atv watch news on tv a032avolunt volunteering a032
lonelinessalo loneliness (11 items dichotomous) a273aloo loneliness (11 items ordinal) a273alo1 can talk about day to day problems a073alo2 miss really close friend a073
Variables Main Study 1992 263
alo3 experience emptiness a073alo4 people to lean on if in trouble a073alo5 miss the pleasure of company a073alo6 circle of friends too limited a073alo7 many people I can count on a073alo8 enough people I feel close to a073alo9 miss having people around a073alo10 often, I feel rejected a073alo11 can call on friends whenever necessary a073alorat lonely: not-moderately-severe-extreme a073alosom I sometimes feel lonely a073auc loneliness <UCLA> a292auc2 lack companionship a092auc4 feel alone a092auc5 feel part of group of friends a092auc11 feel left out a092auc12 relationships are superficial a092auc14 feel isolated from others a092auc16 ...people who really understand me a092auc19 ...people I can talk to a092auc20 ...people I can turn to a092
need for affiliationaan need for affiliation <6 items, comparable with LASA> a278aan_9it need for affiliation <9 items> a278aan1 want to talk about feelings a078aan2 dislike having to ask for advice a078aan3 better to restrain myself emotionally a078aan4 when in trouble, I need support a078aan5 prefer keep emotional problems to self a078aan6 cope with sorrows on my own a078aan7 I want to share my inner life a078aan8 go to others when something bothers me a078aan9 my feelings are my own business a078aan10 when difficulties, like to lean on someone a078
attitudes family helpaaf prefer help from family/people near to m a279aaf1 prefer family to formal helper a079aaf2 easier to ask someone near a079aaf3 better care by professional a079aaf4 count on children if necessary a079aaf5 difficult to ask help family members a079aaf6 professional help as last resort a079
exchange / communal orientation, relationship normsaec1 bothers me when others neglect my needs a075aec2 someone helps me, have to pay back a075aec3 making decis, take others needs into acc a075aec4 feel exploited if someone failed repay m a075
264 NESTOR living arrangements and social networks Variables
aec5 bother to keep track of benefits I have a075aec6 expect people to be responsive to my nee a075aec7 make sure things kept even in a relation a075aec8 have need that others ignore, I am hurt a075aec9 think people feel obligated to repay for a075aexch exchange orientation <items 2,4,5,9 ordinal> a275
self evaluation respondentase self evaluation respondent <8 items ordinal> a277ase1 generally quite secure about self a077ase2 everything I do goes wrong a077ase3 positive view of self a077ase4 wish to change much of self a077ase5 sometimes feel useless a077ase6 little confidence about abilities a077ase7 little faith in self a077ase8 generally pleased with self a077
social skillsask social skills a276ask1 comfortable in presence people dont know a076ask2 easy to initiate conversations with strangers a076ask3 bother if suddenly tongue-tied in conversation a076ask4 difficult to go to places dont know anyone a076ask5 hate doing something wrong in front of others a076ask6 call yourself shy a076
well-beingawb well-being <item 1,2,3 likert> a274awb1 likert: satisfaction life general a074awb2 likert: satisfaction health a074awb3 likert: satisfaction social contacts a074awb4 ladder: satisfaction life general a074awb5 ladder: satisfaction health a074awb6 ladder: satisfaction social contacts a074awb7 comparison: satisfaction life general a074awb8 comparison: satisfaction health a074awb9 comparison: satisfaction social contacts a074
life eventsaevent significant life events during youth a020aevent_i impact of significant event during youth a020aevent_t type of significant event during youth a020
responsea013 ms short cognitive test a001a020 bp social background parents a001a030 hr health respondent a001a031 hp health partner a001a032 sp social participation a001
Variables Main Study 1992 265
a055 na gathering addresses network members a001a073 lo loneliness a001a074 wb well-being a001a075 ec exchange/communal orientation a001a076 sk social skills a001a077 sr self evaluation respondent a001a078 an need for affiliation a001a079 af attitudes family help a001a080 en end of interview a001a081 $e after interview a001a215 hc current household characteristics a001a221 sb characteristics sisters and brothers a001a222 cc characteristics children a001a247_1 ni network identification a001a247_2 nf frequency contact network members a001a251_1 nc characteristics network members a001a251_2 ns support network members a001a263 ph partner history a001a265 hh household history a001a267 eh employment history a001a269 rh residential history a001a423 gc characteristics grandchildren a001acoopnex information cooperation next interview (information interviewer) a081aexpl explanation of aresult=2 or aresult=3 a002alast last part terminated interview a001anwcoop result asking cooperation Network Study a055apartial pattern of choices in interview a001aphone phone# known a004arefusal refusal immediately-after doubts a006arespons response after discussion-immediately a007aresult result of enlisting attempt a002ashort short or long version questionnaire a013ashort_r reason for short version a013aversion full or short, completed or terminated, proxy interview a001popum municipality population: unmarried men a098popuw municipality population: unmarried women a098popmm municipality population: married men a098popmw municipality population: married women a098popdm municipality population: divorced men a098popdw municipality population: divorced women a098popwm municipality population: widowed men a098popww municipality population: widowed women a098poptm municipality population: total men a098poptw municipality population: total women a098samum municipality sample: unmarried men a098samuw municipality sample: unmarried women a098sammm municipality sample: married men a098sammw municipality sample: married women a098samdm municipality sample: divorced men a098samdw municipality sample: divorced women a098
266 NESTOR living arrangements and social networks Variables
samwm municipality sample: widowed men a098samww municipality sample: widowed women a098samtm municipality sample: total men a098samtw municipality sample: total women a098pctum municipality sample proportion: unmarried men a098pctuw municipality sample proportion: unmarried women a098pctmm municipality sample proportion: married men a098pctmw municipality sample proportion: married women a098pctdm municipality sample proportion: divorced men a098pctdw municipality sample proportion: divorced women a098pctwm municipality sample proportion: widowed men a098pctww municipality sample proportion: widowed women a098pcttm municipality sample proportion: total men a098pcttw municipality sample proportion: total women a098
course of interviewacontact giving name and address contact-person a080adurat length of interview a081adurq duration questionnaires a008aftf self evaluation data from face-to-face interview or from written Q a077aibegin time start section of questionnaire a093aidate date interview a008/a093aiweek # of week interview a008alodelay reason delay answering loneliness-items a073aloexpl account of loneliness a073aoth_dur presence others during whole interview a081aoth_pre presence other persons interview a081aoth_typ type other persons present at interview a081aproxy relationship between proxy and respondent a091aq section of questionnaire a093aremark status of record a093asuspect examination of cognitive test a013atimecum duration of interview cumulative a093atimeq duration of sextion of questionnaire a093
evaluation interview, behavior respondentaanswcat difficulties with answer categories a081aconcent concentration of respondent a081adivert respondent diverted? a081aelabora elaborating answers? a081aenjoy answering enjoyable a080aexpress expressing answers a081aforgot respondent forgot the point? a081ageneval general evaluation of interview a080ahelpnee help needed with Q (eg repeat) a081ahonest respondent honest? a081aimmedia easy to answer immediately a080ainteres interest of respondent in interview a081amemo_1 calling mind (evaluation interviewer) a081amemo_2 memory of respondent (evaluation interviewer) a081
Variables Main Study 1992 267
apleasan interview pleasant? a081aproblem problems in general (e.g. language) a081astray respondent strayed? a081asuggest suggestions for researchers a080asuspic respondent suspicious? a081atire_r tiredness interview for respondent a081atiring answering tiring a080atoolong questions of respondent about length interview a081aunderst understandness questions by respondent a081aworries respondent worried? a081
interviewer, demographic characteristicsaiage age at day first lsn-interview a003aieducat level attained education interviewer a003aioccup employment status interviewer a003ailivarr living arrangement interviewer a003aipostc postal code interviewer <4 digits> a003aisex sex interviewer a003
interviewer, personality characteristicsaiagree agreeableness (interviewer) a203aiagre1 cynical a003aiagre2 sharp temper a003aiagre3 egotistical a003aiagre4 good-natured a003aiagre5 cooperative a003aiagre6 considerate a003aiagre7 not jealous a003aiagre8 obstinate a003aiagre9 compassionate with others a003aiagre10 does not think too highly of people a003aiagre11 enjoys working on a team a003aiagre12 aloof a003aiagre13 trusting a003aiagre14 cordial a003aicons conscientiousness (interviewer) a203aicons1 accurate a003aicons2 nonchalant a003aicons3 not persistent a003aicons4 conscientious a003aicons5 important that people adhere to the norms a003aicons6 responsible a003aicons7 important to dress appropriately a003aicons8 neat a003aicons9 ignore rules you don’t agree with a003aicons10 likes order & regularity a003aicons11 perseverely a003aicons12 sloppy a003aicons13 comfortable if he/she knows what is expected of him/her a003aicons14 does not let anything sidetrack him/her a003
268 NESTOR living arrangements and social networks Variables
aielev evaluation elderly (interviewer) a203aielev1 fast-slow a003aielev2 heavy-light a003aielev3 small-large a003aielev4 valuable-worthless a003aielev5 boring-interesting a003aielev6 clean-dirty a003aielev7 unimportant-important a003aielev8 strong-weak a003aielev9 pleasant-unpleasant a003aielev10 attractive-repulsive a003aielev11 good-bad a003aielev12 unkind-nice a003aielev13 happy-unhappy a003aielev14 hard-soft a003aielev15 active-passive a003aielev16 calm-excited a003aiextr extroversion (interviewer) a203aiextr1 garrulous a003aiextr2 leadership a003aiextr3 lethargic a003aiextr4 busy, involved in activities a003aiextr5 keeps thoughts & feelings to him/herself a003aiextr6 energetic a003aiextr7 loves parties a003aiextr8 straightforward a003aiextr9 adventurous a003aiextr10 reticent a003aiextr11 no trouble getting to know strangers a003aiextr12 good at spending time alone a003aiextr13 likes being in the limelight a003aiextr14 modestly a003aisecu feeling secure (interviewer) a203aisecu1 kicking back seat, don’t say anything a003aisecu2 send back food a003aisecu3 unannounced friends a003aisecu4 enough of talk, difficult to leave a003aisecu5 interrupt, ask wait finished a003aisecu6 afraid to ask money back a003aisecu7 someone irritates me, I don’t ask to stop a003aisecu8 if friends irritates me, I do something a003aisecu9 defects, back to store a003aisecu10 noisy neighbors, don’t say anything a003aiterm terminition soc undesirable situations a203aiterm1 don’t worry much about what people think of me a003aiterm2 don’t mind getting into a heated argument a003aiterm3 disapproves my behavior, afraid relationship terminated a003aiterm4 bothers me if someone can’t stand me a003aiterm5 hate to be told that I am quiet a003aiterm6 detest being laughed a003
Variables Main Study 1992 269
aiterm7 conflicts, not afraid relationship will end a003aiterm8 impression, couldn’t care less a003aiterm9 hate doing something wrong a003aiterm10 positive or negative reactions others don’t have influence a003
interviewer, evaluation qualityaiecons conscientious a094aiecut can cut a094aiedata # weeks interviewed a094aieexpl explaining questions a094aieextr extrovert a094aiefeedb feedback a094aiefrien friendly a094aiegloba global judgement a094aiejudge judge a094aieprobe probes a094aieread reads questions exactly a094aierepe repeating questions a094aiesocc socially confident a094aietempo tempo of interviewing a094aietime time judgement a094aietone tone in general a094aietrain period training a094
interviewer, otheraienqexp prior experience being interviewed a003aiexperi prior experience interviewing a003aipcexp prior experience with personal computer a003aiseq sequence# interview for interviewer a008aitimeav time available a003aitrain training interviewer a003aitypexp experience typing a003anappr # respondents approached a003anintv # respondents interviewed a003atire_i tiredness interview for interviewer a081
otheralsnpisa weight LSN data for comparison with Pisa data a009
270 NESTOR living arrangements and social networks
List of filesFile Size Date Time File Size Date TimeLSNa001.SYS 304368 951207 15:25LSNa002.SYS 759088 951208 09:43LSNa003.SYS 39464 951208 09:43LSNa004.SYS 216000 940111 11:08LSNa005.SYS 218776 951120 11:26LSNa006.SYS 74600 951208 09:44LSNa007.SYS 138080 951208 09:44LSNa008.SYS 283312 950913 14:51LSNa009.SYS 262984 950503 10:33LSNa010.SYS 267392 960327 10:34LSNa011.SYS 157616 951208 09:45LSNa012.SYS 399088 950918 13:16LSNa013.SYS 142416 951208 09:45LSNa014.SYS 10224 951208 09:45LSNa015.SYS 13104 951212 08:46LSNa016.SYS 188456 951120 12:23LSNa017.SYS 15024 951120 11:41LSNa018.SYS 218072 951120 13:10LSNa019.SYS 188976 951208 09:47LSNa020.SYS 293808 951212 11:39LSNa021.SYS 411880 950807 14:41LSNa022.SYS 625904 961202 13:02LSNa023.SYS 302032 950613 15:56LSNa030.SYS 232920 951120 13:53LSNa031.SYS 88024 950913 14:41LSNa032.SYS 221392 951208 09:45LSNa047.SYS 1691096 961202 13:02LSNa048.SYS 1858720 961129 09:10LSNa051.SYS 1463928 961202 12:54LSNa055.SYS 46104 961129 13:54LSNa056.SYS 1020800 951012 12:49LSNa063.SYS 253272 960327 11:48LSNa065.SYS 1753152 951211 16:20LSNa067.SYS 141008 961129 13:54LSNa069.SYS 69512 961129 13:54LSNa070.SYS 1591528 960122 13:09LSNa073.SYS 172600 950613 15:36LSNa074.SYS 164336 960213 09:12LSNa075.SYS 118608 951208 09:46LSNa076.SYS 25952 951208 09:46LSNa077.SYS 143000 951208 09:46LSNa078.SYS 60992 951208 09:46LSNa079.SYS 89856 951208 09:46LSNa080.SYS 142968 930811 09:22LSNa081.SYS 267280 941212 13:00LSNa091.SYS 22128 951208 09:46
LSNa092.SYS 26376 950510 11:58LSNa093.SYS 7074920 950614 17:44LSNa094.SYS 30640 960726 14:53LSNa095.SYS 1519760 961129 13:54LSNa097.SYS 15346376 960213 11:23LSNa098.SYS 13240 960312 13:25LSNa203.SYS 26848 941222 12:10LSNa215.SYS 167720 951120 13:26LSNa216.SYS 122824 951120 12:46LSNa221.SYS 142240 941207 16:58LSNa222.SYS 153424 950503 14:39LSNa223.SYS 126232 940511 11:28LSNa230.SYS 146920 951214 09:59LSNa231.SYS 73624 951214 09:59LSNa232.SYS 124880 950905 11:15LSNa247.SYS 117376 961129 09:12LSNa251.SYS 343944 961129 09:21LSNa256.SYS 27712 961129 13:54LSNa263.SYS 132760 961128 17:23LSNa265.SYS 119736 951211 16:29LSNa267.SYS 252952 951218 12:00LSNa269.SYS 31488 950613 14:39LSNa273.SYS 122920 950613 15:36LSNa274.SYS 127712 950613 15:34LSNa275.SYS 90600 950510 10:18LSNa276.SYS 19832 950510 12:54LSNa277.SYS 110104 950509 14:38LSNa278.SYS 47328 950510 13:14LSNa279.SYS 72624 951218 12:00LSNa292.SYS 20168 950510 12:07

Main Study 1992 271

272 NESTOR living arrangements and social networks
Part G, H, I
Network Study 1992-1995
G: 1992-1993H: 1993-1994I: 1994-1995

274 Living arrangements and social networks
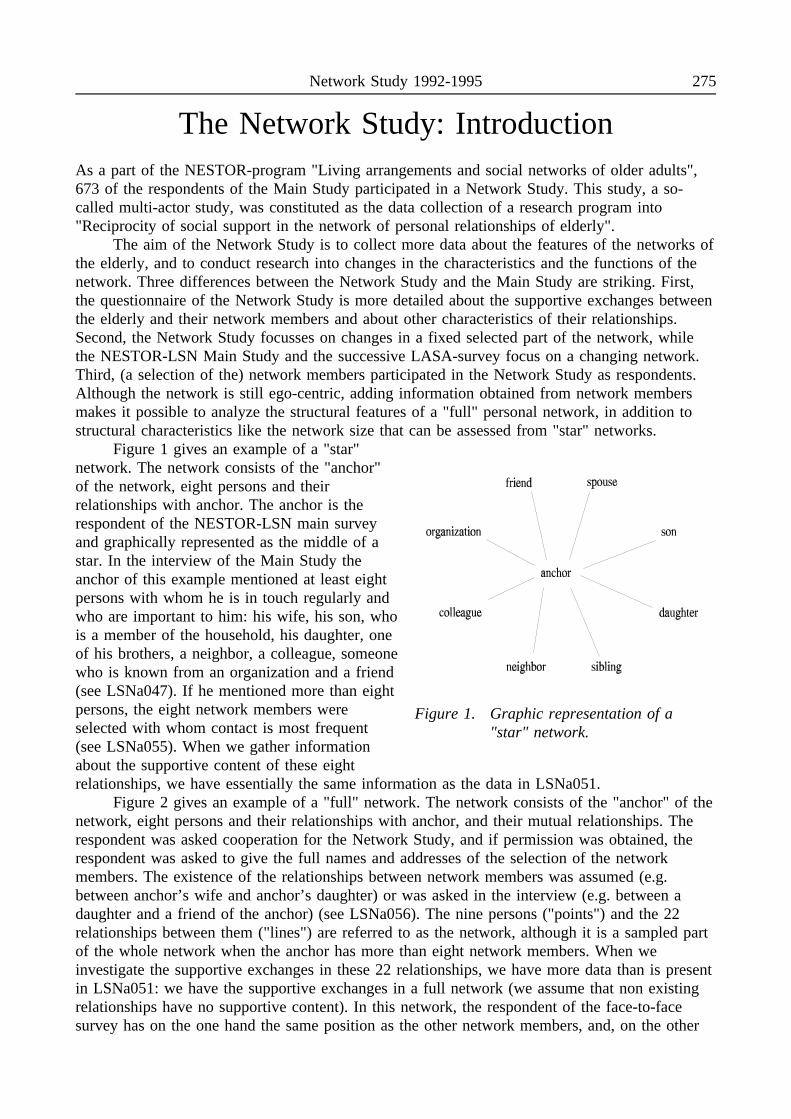
Network Study 1992-1995 275
The Network Study: IntroductionAs a part of the NESTOR-program "Living arrangements and social networks of older adults",673 of the respondents of the Main Study participated in a Network Study. This study, a so-called multi-actor study, was constituted as the data collection of a research program into"Reciprocity of social support in the network of personal relationships of elderly".
The aim of the Network Study is to collect more data about the features of the networks ofthe elderly, and to conduct research into changes in the characteristics and the functions of thenetwork. Three differences between the Network Study and the Main Study are striking. First,the questionnaire of the Network Study is more detailed about the supportive exchanges betweenthe elderly and their network members and about other characteristics of their relationships.Second, the Network Study focusses on changes in a fixed selected part of the network, whilethe NESTOR-LSN Main Study and the successive LASA-survey focus on a changing network.Third, (a selection of the) network members participated in the Network Study as respondents.Although the network is still ego-centric, adding information obtained from network membersmakes it possible to analyze the structural features of a "full" personal network, in addition tostructural characteristics like the network size that can be assessed from "star" networks.
Figure 1 gives an example of a "star"
Figure 1. Graphic representation of a"star" network.
network. The network consists of the "anchor"of the network, eight persons and theirrelationships with anchor. The anchor is therespondent of the NESTOR-LSN main surveyand graphically represented as the middle of astar. In the interview of the Main Study theanchor of this example mentioned at least eightpersons with whom he is in touch regularly andwho are important to him: his wife, his son, whois a member of the household, his daughter, oneof his brothers, a neighbor, a colleague, someonewho is known from an organization and a friend(see LSNa047). If he mentioned more than eightpersons, the eight network members wereselected with whom contact is most frequent(see LSNa055). When we gather informationabout the supportive content of these eightrelationships, we have essentially the same information as the data in LSNa051.
Figure 2 gives an example of a "full" network. The network consists of the "anchor" of thenetwork, eight persons and their relationships with anchor, and their mutual relationships. Therespondent was asked cooperation for the Network Study, and if permission was obtained, therespondent was asked to give the full names and addresses of the selection of the networkmembers. The existence of the relationships between network members was assumed (e.g.between anchor’s wife and anchor’s daughter) or was asked in the interview (e.g. between adaughter and a friend of the anchor) (see LSNa056). The nine persons ("points") and the 22relationships between them ("lines") are referred to as the network, although it is a sampled partof the whole network when the anchor has more than eight network members. When weinvestigate the supportive exchanges in these 22 relationships, we have more data than is presentin LSNa051: we have the supportive exchanges in a full network (we assume that non existingrelationships have no supportive content). In this network, the respondent of the face-to-facesurvey has on the one hand the same position as the other network members, and, on the other
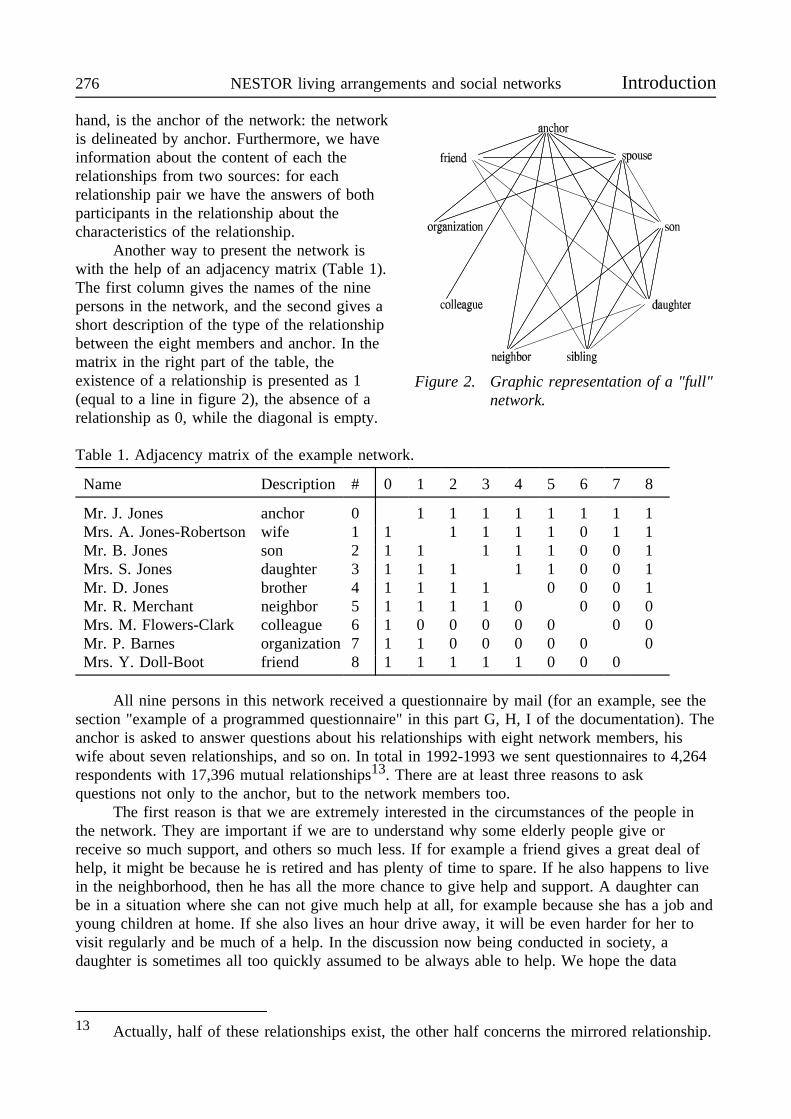
276 NESTOR living arrangements and social networks Introduction
hand, is the anchor of the network: the network
Figure 2. Graphic representation of a "full"network.
is delineated by anchor. Furthermore, we haveinformation about the content of each therelationships from two sources: for eachrelationship pair we have the answers of bothparticipants in the relationship about thecharacteristics of the relationship.
Another way to present the network iswith the help of an adjacency matrix (Table 1).The first column gives the names of the ninepersons in the network, and the second gives ashort description of the type of the relationshipbetween the eight members and anchor. In thematrix in the right part of the table, theexistence of a relationship is presented as 1(equal to a line in figure 2), the absence of arelationship as 0, while the diagonal is empty.
Table 1. Adjacency matrix of the example network.
Name Description # 0 1 2 3 4 5 6 7 8
Mr. J. Jones anchor 0 1 1 1 1 1 1 1 1Mrs. A. Jones-Robertson wife 1 1 1 1 1 1 0 1 1Mr. B. Jones son 2 1 1 1 1 1 0 0 1Mrs. S. Jones daughter 3 1 1 1 1 1 0 0 1Mr. D. Jones brother 4 1 1 1 1 0 0 0 1Mr. R. Merchant neighbor 5 1 1 1 1 0 0 0 0Mrs. M. Flowers-Clark colleague 6 1 0 0 0 0 0 0 0Mr. P. Barnes organization 7 1 1 0 0 0 0 0 0Mrs. Y. Doll-Boot friend 8 1 1 1 1 1 0 0 0
All nine persons in this network received a questionnaire by mail (for an example, see thesection "example of a programmed questionnaire" in this part G, H, I of the documentation). Theanchor is asked to answer questions about his relationships with eight network members, hiswife about seven relationships, and so on. In total in 1992-1993 we sent questionnaires to 4,264respondents with 17,396 mutual relationships13. There are at least three reasons to askquestions not only to the anchor, but to the network members too.
The first reason is that we are extremely interested in the circumstances of the people inthe network. They are important if we are to understand why some elderly people give orreceive so much support, and others so much less. If for example a friend gives a great deal ofhelp, it might be because he is retired and has plenty of time to spare. If he also happens to livein the neighborhood, then he has all the more chance to give help and support. A daughter canbe in a situation where she can not give much help at all, for example because she has a job andyoung children at home. If she also lives an hour drive away, it will be even harder for her tovisit regularly and be much of a help. In the discussion now being conducted in society, adaughter is sometimes all too quickly assumed to be always able to help. We hope the data
13 Actually, half of these relationships exist, the other half concerns the mirrored relationship.
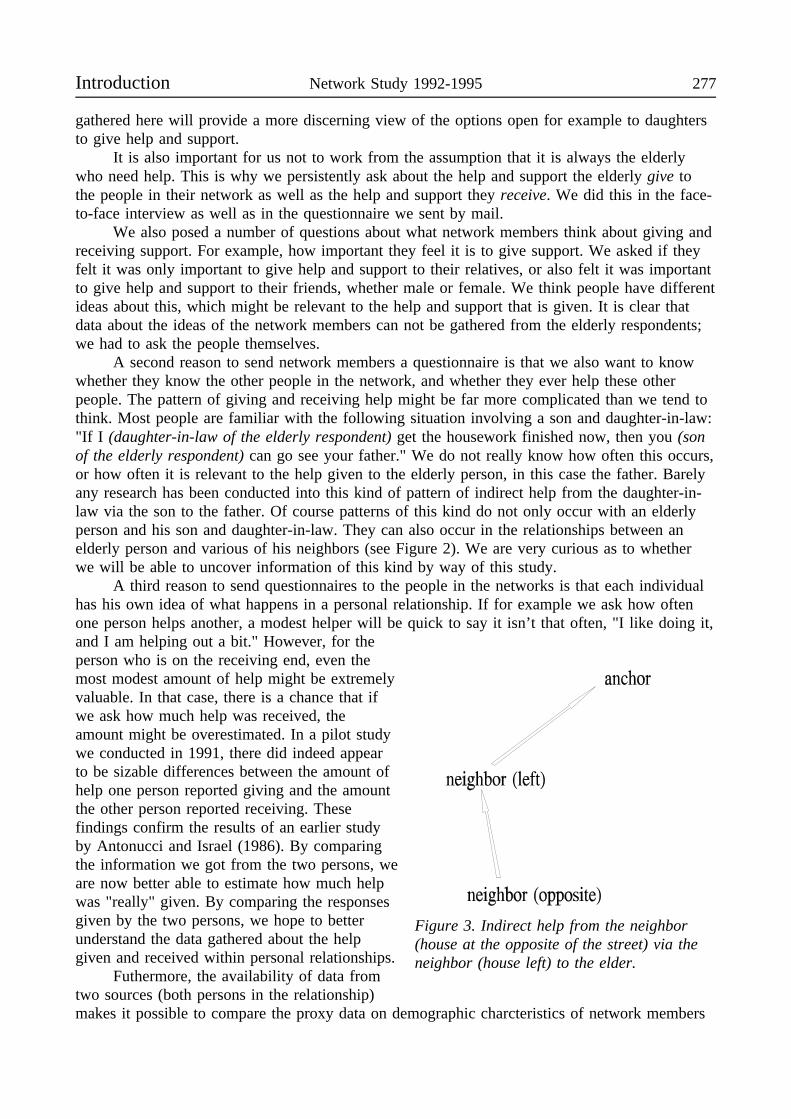
Introduction Network Study 1992-1995 277
gathered here will provide a more discerning view of the options open for example to daughtersto give help and support.
It is also important for us not to work from the assumption that it is always the elderlywho need help. This is why we persistently ask about the help and support the elderly give tothe people in their network as well as the help and support they receive. We did this in the face-to-face interview as well as in the questionnaire we sent by mail.
We also posed a number of questions about what network members think about giving andreceiving support. For example, how important they feel it is to give support. We asked if theyfelt it was only important to give help and support to their relatives, or also felt it was importantto give help and support to their friends, whether male or female. We think people have differentideas about this, which might be relevant to the help and support that is given. It is clear thatdata about the ideas of the network members can not be gathered from the elderly respondents;we had to ask the people themselves.
A second reason to send network members a questionnaire is that we also want to know
Figure 3. Indirect help from the neighbor(house at the opposite of the street) via theneighbor (house left) to the elder.
whether they know the other people in the network, and whether they ever help these otherpeople. The pattern of giving and receiving help might be far more complicated than we tend tothink. Most people are familiar with the following situation involving a son and daughter-in-law:"If I (daughter-in-law of the elderly respondent) get the housework finished now, then you (sonof the elderly respondent) can go see your father." We do not really know how often this occurs,or how often it is relevant to the help given to the elderly person, in this case the father. Barelyany research has been conducted into this kind of pattern of indirect help from the daughter-in-law via the son to the father. Of course patterns of this kind do not only occur with an elderlyperson and his son and daughter-in-law. They can also occur in the relationships between anelderly person and various of his neighbors (see Figure 2). We are very curious as to whetherwe will be able to uncover information of this kind by way of this study.
A third reason to send questionnaires to the people in the networks is that each individualhas his own idea of what happens in a personal relationship. If for example we ask how oftenone person helps another, a modest helper will be quick to say it isn’t that often, "I like doing it,and I am helping out a bit." However, for theperson who is on the receiving end, even themost modest amount of help might be extremelyvaluable. In that case, there is a chance that ifwe ask how much help was received, theamount might be overestimated. In a pilot studywe conducted in 1991, there did indeed appearto be sizable differences between the amount ofhelp one person reported giving and the amountthe other person reported receiving. Thesefindings confirm the results of an earlier studyby Antonucci and Israel (1986). By comparingthe information we got from the two persons, weare now better able to estimate how much helpwas "really" given. By comparing the responsesgiven by the two persons, we hope to betterunderstand the data gathered about the helpgiven and received within personal relationships.
Futhermore, the availability of data fromtwo sources (both persons in the relationship)makes it possible to compare the proxy data on demographic charcteristics of network members

278 NESTOR living arrangements and social networks Introduction
as given by the anchor of the network and these data from the network members. This offersopportunities for methodological research into the reliability of survey data (see for examplesPfenning, Pfennig & Mohler, 1991; Schenk, Mohler & Pfennig, 1992).
Network Study 1992-1995 279
Sample and Data CollectionThis chapter gives some general information on the steps taken to collect data for the NetworkStudy, part of the NESTOR program "Living arrangements and social networks of older adults"(LSN). The data collection was prepared during the face-to-face interviews we held with theelderly respondents in 1992. We asked them at the time whether they were willing to take partin this study. If that was the case, we asked them to provide the full names and addresses of anumber of people in their network. These data were entered by the interviewer in the computer.When the data was presented to the people in charge of the study, all the information waschecked. Typing errors were corrected, and the postal codes often had to be looked up. Then thequestionnaires were drawn up. Each questionnaire is different, since each one contains the namesof the various other people in the network. Checking the names and addresses was very time-consuming, as was producing the questionnaires (ever since April 1992, a printer has beenproducing them virtually day and night), and there was usually a period of a few monthsbetween the face-to-face interview and the moment when the questionnaires were sent out. InFebruary 1993 we were finished sending out the questionnaires for the first observation. In May1993 the second observation began, and the third observation started in June 1994 and finishedin April 1995.
Determination of the sample
Respondents of the Main SurveyIn 1992, face-to-face interviews were conducted with 4,494 respondents. They constituted astratified random sample of men and women born in 1903 to 1937. The random sample wastaken from the registers of eleven municipalities: the city of Amsterdam and two ruralcommunities in the west, one city and two rural communities in the south, and one city and fourrural communities in the east of the Netherlands. The response was 61.7%. The data werecollected by 88 interviewers. The interview was programmed on a laptop computer.
The average age of the respondents was 72.8. Most of them did not live in homes for theaged or nursing homes: 1,327 (29.6%) lived alone, 2,579 (57.5%) lived with a partner, and 205(4.6%) lived in another kind of multi-person household; 351 (7.8%) lived in homes for the agedor nursing homes.
In the Network Study, we confined ourselves to the 4,059 respondents who providedinformation about their relational network.
QuestionnaireThe networks of persons with whom the respondents maintained an important and frequentrelationship were stipulated in the Main Study (Van Tilburg, 1995) by using a procedure basedupon Cochran et al. (1990) (see LSNa047). The following seven categories were distinguished:people who live in the same household, children and children-in-law, other relatives, neighbors,people one is working or studying with, contacts in organizations, and other contacts (friendsand acquaintances). In each of these categories, the respondents were asked to name peopleabove the age of eighteen with whom they had important and regular contact. The size of thenetwork was determined by the number of people who were named in the seven variouscategories.
A selected number of respondents (N= 1,547) were asked whether they were willing toprovide the names and addresses of a maximum of eight of their network members (seeLSNa055). The sample was to a certain extent stratified and consisted of more younger thanolder respondents, more unmarried, divorced and widowed respondents than respondents with a
280 NESTOR living arrangements and social networks Data Collection
partner and respondents living in institutions, and more respondents with a low than a highADL-capacity. We asked:
As you know, this study focuses on the living situation and social ties of older adults. Wehave already asked you a number of questions about your situation, and more questionswill follow. However, in order to obtain a more complete picture of your living situationand social ties, we would like to also put a number of questions to some of the people youjust mentioned. More specifically, the following individuals: .. We would like to ask themabout the composition of their families and about their daily activities. We would also liketo ask a number of questions about their social ties. Our intention is to send them aquestionnaire they can fill in at home. It takes less than 30 minutes to do so. Naturally, asis the case with the answers you have given, the information they provide will be treatedconfidentially, and will not be passed on to third parties. You will receive a questionnairewith roughly the same questions at the same time as they are approached. Thatquestionnaire contains a number of questions that are different from the ones I am askingyou today, and gives you an opportunity to be fully informed about what the next stepswill be in this study. In the letter accompanying the questionnaire, we will mention thatyou have made it possible for us to contact them. Of course, it is up to them to decide forthemselves whether or not they wish to respond. At this point I would like to ask you: Areyou willing to participate in this part of the study? (Choice of answers: no; yes, underconditions; yes, no conditions).
The network members that were approached in the Network Study were the eight with thehighest frequency of contact. If unconditional permission for all the addresses was obtained, thecomplete names and address of each selected network member were recorded. Otherwise,permission to obtain the name and address was requested for each selected network memberseparately. As a result of this procedure, 812 respondents refused to give permission to approachtheir network members, 326 respondents gave unconditional permission, and the others gavepermission under the condition that only particular network members would be approached orsaid they would have to ask the network members’ permission individually. Furthermore, to beprepared for the Network Study, we wanted to know about which relationships between networkmembers questions could be posed in the network questionnaire, and asked questions on thedensity of the network (see LSNa056):
Can you tell me which of these .. people are regularly in touch with one another withoutany involvement on your part? I will list pairs of names. You will notice, however, thatnot all the names will be listed. People who are related to each other are apt to keep intouch regularly without any involvement on your part. Is .. regularly in touch with ..?
After this part of the questionnaire, the respondents were asked (see LSNa051) about thestructural properties of the relationships or the network members (e.g. age, travel time, maritalstatus, employment status) and about instrumental and emotional support received and given.Questions were posed only for the twelve or less relationships with the highest frequency ofcontact.
As regards the aspect of health of the respondent, two instruments were used (seeLSNa030 and LSNa230). The first instrument contained four questions about experiencingproblems with four activities of daily life (ADL). The ADL items formed a hierarchicallyhomogeneous scale (Loevinger’s coefficient of homogeneity H= .68) which was reliablymeasured (ρ= .87). The scale ranged from four (numerous problems) to twenty (no problems).The second instrument pertained to a question about the respondents’ perception of their ownhealth: "How is your health in general?". Subjective health correlated with ADL (r= .43).
Data Collection Network Study 1992-1995 281
Respondents of the Network StudyAfter the data in the Main Study were received from the interviewers, the names and addressesof the network members mentioned were read from the diskettes, cleaned and stored in adatabase. If necessary, the respondents in the Main Study (anchors) were approached to askwhether they had received permission from their network members. Via this procedure, or byanother report on the part of the anchors, 64 anchors refused to cooperate and 2 anchors whohad refused at the time of the face-to-face interview said they were now willing to cooperate inthe Network Study. This meant there were 673 anchors available for the Network Study. Besidesthese anchors, a selection of their network members served as respondents. The questionnaireswere mailed between 15 and 349 days after the face-to-face interview (median 115 days),starting in April 1992. There were several reasons for the delay between the face-to-faceinterview and the mailing of the questionnaires, the most important of which was that thecleaning of the addresses, the second approach of the anchors by telephone or letter if moreinformation was necessary, and the printing of the questionnaires were very time-consuming.
QuestionnaireThe mailed questionnaire (see for an example the section "example of a programmedquestionnaire" in this part G,H,I of the documentation) included questions about demographiccharacteristics, living and working conditions, ADL capacity, problematic situations, loneliness,exchange orientation, and family features. As regards the relationships with their networkmembers, questions were posed about contact frequency, activity intensity to maintain thecontact, changes in contact frequency, the quality of a relationship as compared with other ones,travelling time and social support. The questionnaire was completely personalized. The names ofnetwork members were included in the list, and questions that were not relevant for certainmembers, such as travelling time where neighbors were concerned, were not posed.
Twelve questions were about the instrumental and emotional aspects of each relationship:six about support received and six about support given (see LSNghi051). Three of the sixquestions were about instrumental support and three about emotional support. The questionsposed for receiving instrumental support were: "How often did it occur in the last year that thefollowing persons helped you with daily household tasks (e.g. preparing meals, cleaning thehouse, transport, a chore)?", "... gave you advice (e.g. on an important decision or on filling outforms)?", and "... gave you help when you needed it, e.g. when you were ill?", and for emotionalsupport: "... gave you a present?", "... showed you they cared for you?", and "... that you told thefollowing persons about your personal feelings?" (choice of answers: never, rarely, sometimes,often). The questions could be ranked on unidimensional scales of instrumental and emotionalsupport received (at T1 H= .59 and .55, ρ= .80 and .76, respectively) and given (at T1 H= .59and .56, ρ= .79 and .77, respectively) (see LSNghi251 for further information).
Four ADL items, the same as in the main survey, were used (see LSNghi030). Theyformed a hierarchically homogeneous scale (at T1 H= .77) which was reliably measured (at T1ρ= .92) (see LSNghi230 for further information).
Response and Non-response
Response on the network levelTable 1 gives an overview of the willingness of the anchors to participate in the Network Study.Of the 1,547 respondents in the main survey, 812 refused (a cooperation of 47.6%; Schenk et al.,1992 reported for a comparable study 46% cooperation). By using logistic regression, weanalyzed whether the anchors in the Network Study form a representative sample of therespondents in the principal sample (the Main Study). The analysis showed that the 812
282 NESTOR living arrangements and social networks Data Collection
respondents who refused to take part in the Network Study did not differ from the 735respondents who - at the time of the face-to-face interview - were willing to cooperate withrespect to sex (p= .37), partner status (no partner, living with a partner, partner outside thehousehold) (p= .66), subjective health (p= .70), ADL capacity (p= .74) and network size (p=.11), but differed with respect to age (more younger people than older people were willing tocooperate, p= .004, odds ratio (eB)= .98).
Table 1. Overview of response of the Network Study at the level of the networks
T1 T2 T3
abs. % abs. % abs. %
In face-to-face interview asked about network 4,059Not eligible (network size=0) 15Not asked for Network Study (sample) 2,497
Eligible for Network Study (assessed at Tx-1) 1,547 100.0 671 100.0 594 100.0Refusal1 810 52.4Refusal before questionnaires were mailed 64 4.1 39 5.8 27 4.6Anchor deceased 2 0.1 21 3.1 21 3.5Too little response Tx-1 - - 15 2.2 39 6.6Not eligible Tx
2 - - 2 0.3 7 1.2
Questionnaires mailed 671 594 500
1 At the time of the face-to-face interview, excluding two respondents who reported after theface-to-face interview that they were willing to cooperate, despite their refusal at the timeof the face-to-face interview.
2 A variety of reasons, e.g. all network members have been deceased, severe illness ofanchor, networks of two anchors (a couple) overlapped completely and were combined atT3.
Questionnaires were mailed to 671 anchors; two anchors deceased and 64 respondents who werewilling to cooperate at the time of the face-to-face interview refused before the questionnaireswere mailed. Another nineteen anchors and all of their network members did not return thequestionnaires. We thus have at least partial information on 652 networks in the Network Study.A second logistic regression analysis showed that the 3,390 respondents who did not participatein the Network Study did not differ significantly from the 652 respondents who participated withrespect to sex (fewer, but not significantly, females in the Network Study, p= .15, eB= .88),subjective health (p= .17, eB= .93), ADL capacity (p= .64, eB= .99), and network size (p= .55,eB= 1.00), but did differ in age (p= .000, eB= .96) and household composition / marital status(p= .000), with about the same proportion living with a partner, (p= .81, eB= .98), more peopleunmarried and living alone (p= .001, eB= 1.81), about the same proportion divorced and livingalone (p= .64, eB= 1.10), about the same proportion widowed and living alone (p= .05, eB=1.25), and institutionalized (p= .37, eB= .81).
We conclude that our realized sample is biased when we compare it with the Main Study,with the most important deviation for age. However, since the Main Study consists of a stratifiedsample according to sex and birth year, the realized sample of networks in the Network Studycan be viewed as a probability sample.
Response on the level of network members
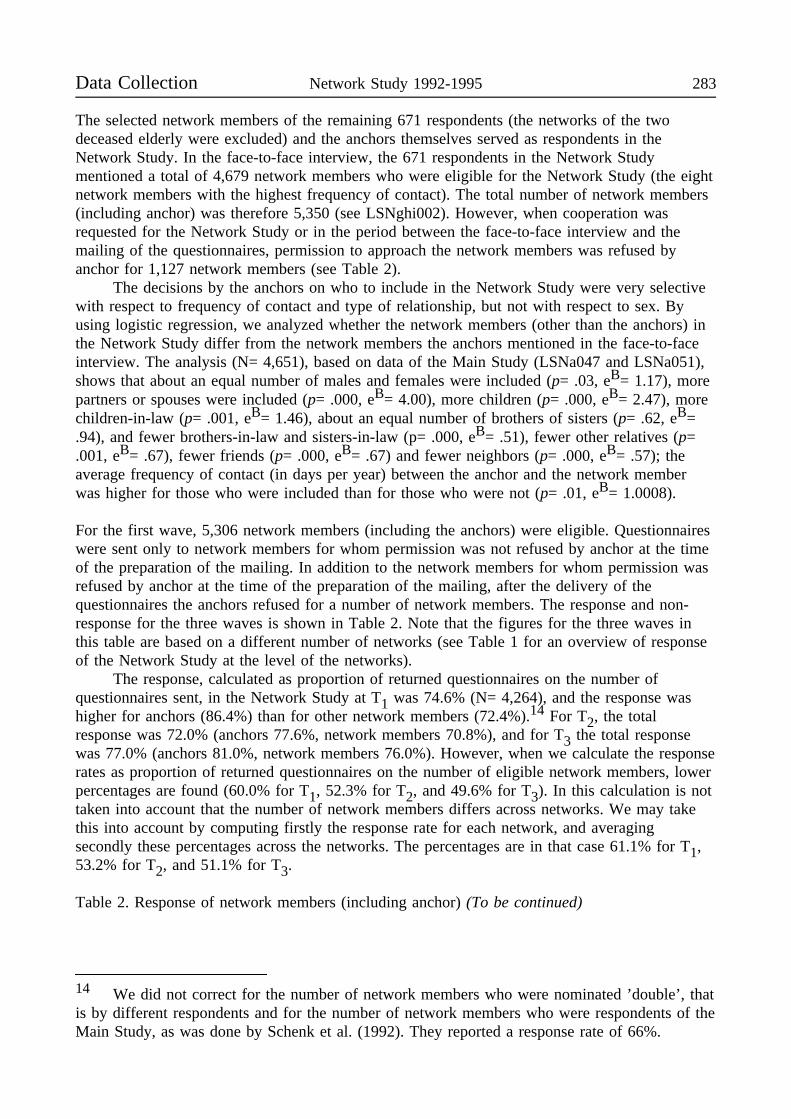
Data Collection Network Study 1992-1995 283
The selected network members of the remaining 671 respondents (the networks of the twodeceased elderly were excluded) and the anchors themselves served as respondents in theNetwork Study. In the face-to-face interview, the 671 respondents in the Network Studymentioned a total of 4,679 network members who were eligible for the Network Study (the eightnetwork members with the highest frequency of contact). The total number of network members(including anchor) was therefore 5,350 (see LSNghi002). However, when cooperation wasrequested for the Network Study or in the period between the face-to-face interview and themailing of the questionnaires, permission to approach the network members was refused byanchor for 1,127 network members (see Table 2).
The decisions by the anchors on who to include in the Network Study were very selectivewith respect to frequency of contact and type of relationship, but not with respect to sex. Byusing logistic regression, we analyzed whether the network members (other than the anchors) inthe Network Study differ from the network members the anchors mentioned in the face-to-faceinterview. The analysis (N= 4,651), based on data of the Main Study (LSNa047 and LSNa051),shows that about an equal number of males and females were included (p= .03, eB= 1.17), morepartners or spouses were included (p= .000, eB= 4.00), more children (p= .000, eB= 2.47), morechildren-in-law (p= .001, eB= 1.46), about an equal number of brothers of sisters (p= .62, eB=.94), and fewer brothers-in-law and sisters-in-law (p= .000, eB= .51), fewer other relatives (p=.001, eB= .67), fewer friends (p= .000, eB= .67) and fewer neighbors (p= .000, eB= .57); theaverage frequency of contact (in days per year) between the anchor and the network memberwas higher for those who were included than for those who were not (p= .01, eB= 1.0008).
For the first wave, 5,306 network members (including the anchors) were eligible. Questionnaireswere sent only to network members for whom permission was not refused by anchor at the timeof the preparation of the mailing. In addition to the network members for whom permission wasrefused by anchor at the time of the preparation of the mailing, after the delivery of thequestionnaires the anchors refused for a number of network members. The response and non-response for the three waves is shown in Table 2. Note that the figures for the three waves inthis table are based on a different number of networks (see Table 1 for an overview of responseof the Network Study at the level of the networks).
The response, calculated as proportion of returned questionnaires on the number ofquestionnaires sent, in the Network Study at T1 was 74.6% (N= 4,264), and the response washigher for anchors (86.4%) than for other network members (72.4%).14 For T2, the totalresponse was 72.0% (anchors 77.6%, network members 70.8%), and for T3 the total responsewas 77.0% (anchors 81.0%, network members 76.0%). However, when we calculate the responserates as proportion of returned questionnaires on the number of eligible network members, lowerpercentages are found (60.0% for T1, 52.3% for T2, and 49.6% for T3). In this calculation is nottaken into account that the number of network members differs across networks. We may takethis into account by computing firstly the response rate for each network, and averagingsecondly these percentages across the networks. The percentages are in that case 61.1% for T1,53.2% for T2, and 51.1% for T3.
Table 2. Response of network members (including anchor) (To be continued)
14 We did not correct for the number of network members who were nominated ’double’, thatis by different respondents and for the number of network members who were respondents of theMain Study, as was done by Schenk et al. (1992). They reported a response rate of 66%.
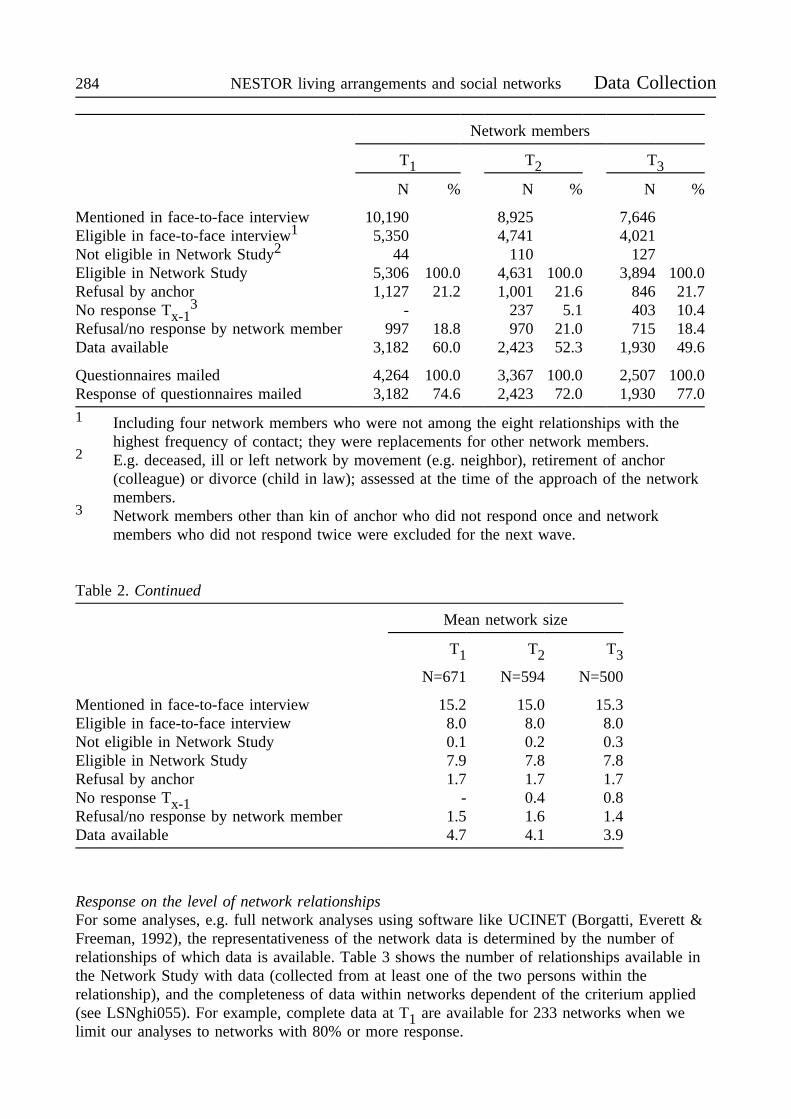
284 NESTOR living arrangements and social networks Data Collection
Network members
T1 T2 T3
N % N % N %
Mentioned in face-to-face interview 10,190 8,925 7,646Eligible in face-to-face interview1 5,350 4,741 4,021Not eligible in Network Study2 44 110 127Eligible in Network Study 5,306 100.0 4,631 100.0 3,894 100.0Refusal by anchor 1,127 21.2 1,001 21.6 846 21.7No response Tx-1
3 - 237 5.1 403 10.4Refusal/no response by network member 997 18.8 970 21.0 715 18.4Data available 3,182 60.0 2,423 52.3 1,930 49.6
Questionnaires mailed 4,264 100.0 3,367 100.0 2,507 100.0Response of questionnaires mailed 3,182 74.6 2,423 72.0 1,930 77.0
1 Including four network members who were not among the eight relationships with thehighest frequency of contact; they were replacements for other network members.
2 E.g. deceased, ill or left network by movement (e.g. neighbor), retirement of anchor(colleague) or divorce (child in law); assessed at the time of the approach of the networkmembers.
3 Network members other than kin of anchor who did not respond once and networkmembers who did not respond twice were excluded for the next wave.
Table 2. Continued
Mean network size
T1 T2 T3
N=671 N=594 N=500
Mentioned in face-to-face interview 15.2 15.0 15.3Eligible in face-to-face interview 8.0 8.0 8.0Not eligible in Network Study 0.1 0.2 0.3Eligible in Network Study 7.9 7.8 7.8Refusal by anchor 1.7 1.7 1.7No response Tx-1 - 0.4 0.8Refusal/no response by network member 1.5 1.6 1.4Data available 4.7 4.1 3.9
Response on the level of network relationshipsFor some analyses, e.g. full network analyses using software like UCINET (Borgatti, Everett &Freeman, 1992), the representativeness of the network data is determined by the number ofrelationships of which data is available. Table 3 shows the number of relationships available inthe Network Study with data (collected from at least one of the two persons within therelationship), and the completeness of data within networks dependent of the criterium applied(see LSNghi055). For example, complete data at T1 are available for 233 networks when welimit our analyses to networks with 80% or more response.
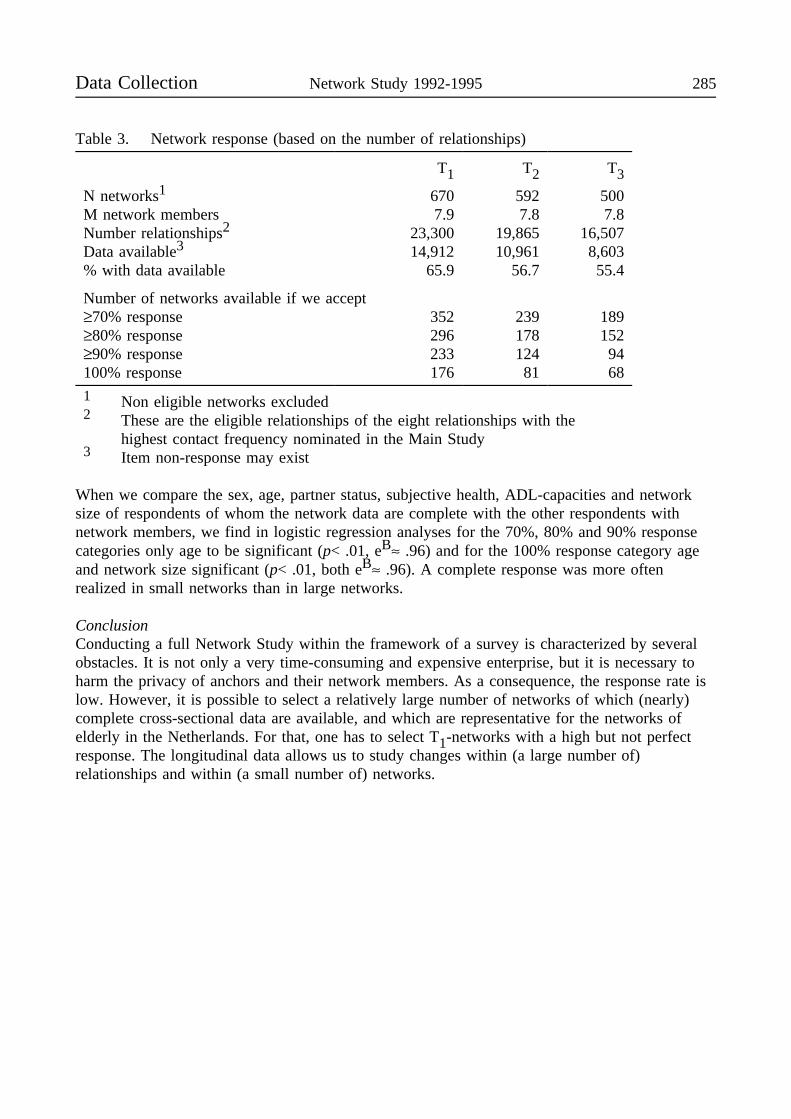
Data Collection Network Study 1992-1995 285
Table 3. Network response (based on the number of relationships)
T1 T2 T3
N networks1 670 592 500M network members 7.9 7.8 7.8Number relationships2 23,300 19,865 16,507Data available3 14,912 10,961 8,603% with data available 65.9 56.7 55.4
Number of networks available if we accept≥70% response 352 239 189≥80% response 296 178 152≥90% response 233 124 94100% response 176 81 68
1 Non eligible networks excluded2 These are the eligible relationships of the eight relationships with the
highest contact frequency nominated in the Main Study3 Item non-response may exist
When we compare the sex, age, partner status, subjective health, ADL-capacities and networksize of respondents of whom the network data are complete with the other respondents withnetwork members, we find in logistic regression analyses for the 70%, 80% and 90% responsecategories only age to be significant (p< .01, eB≈ .96) and for the 100% response category ageand network size significant (p< .01, both eB≈ .96). A complete response was more oftenrealized in small networks than in large networks.
ConclusionConducting a full Network Study within the framework of a survey is characterized by severalobstacles. It is not only a very time-consuming and expensive enterprise, but it is necessary toharm the privacy of anchors and their network members. As a consequence, the response rate islow. However, it is possible to select a relatively large number of networks of which (nearly)complete cross-sectional data are available, and which are representative for the networks ofelderly in the Netherlands. For that, one has to select T1-networks with a high but not perfectresponse. The longitudinal data allows us to study changes within (a large number of)relationships and within (a small number of) networks.
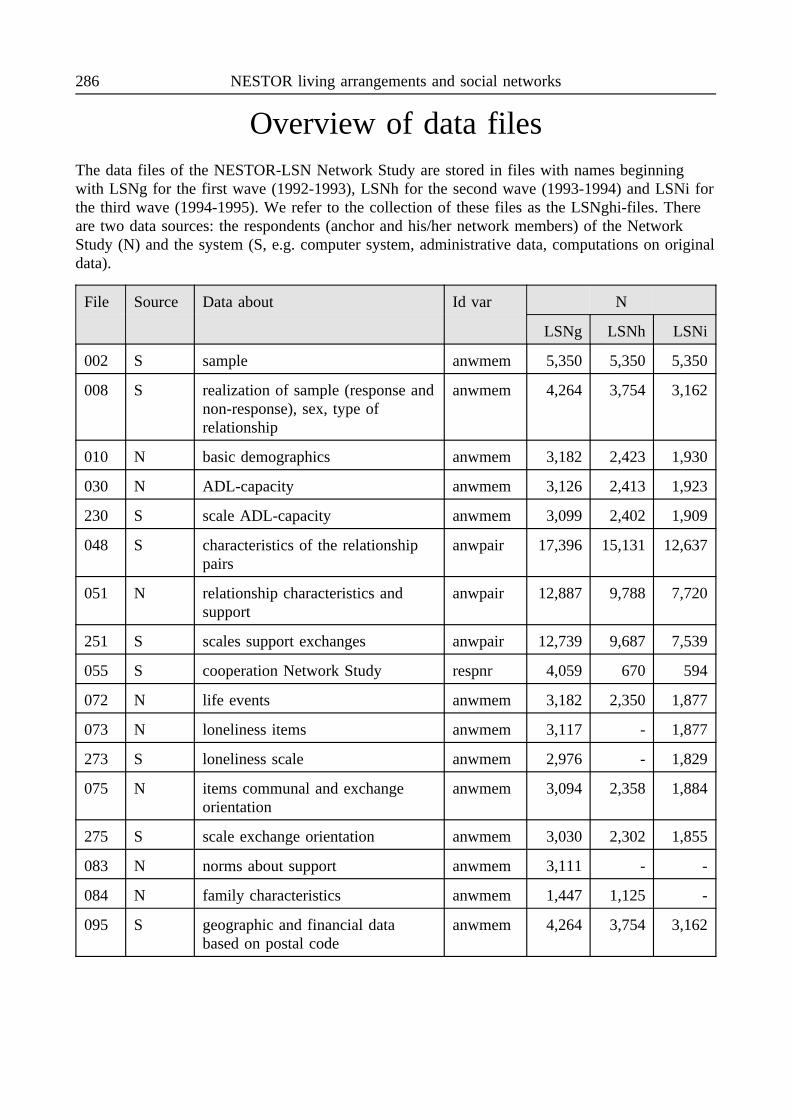
286 NESTOR living arrangements and social networks
Overview of data filesThe data files of the NESTOR-LSN Network Study are stored in files with names beginningwith LSNg for the first wave (1992-1993), LSNh for the second wave (1993-1994) and LSNi forthe third wave (1994-1995). We refer to the collection of these files as the LSNghi-files. Thereare two data sources: the respondents (anchor and his/her network members) of the NetworkStudy (N) and the system (S, e.g. computer system, administrative data, computations on originaldata).
File Source Data about Id var N
LSNg LSNh LSNi
002 S sample anwmem 5,350 5,350 5,350
008 S realization of sample (response andnon-response), sex, type ofrelationship
anwmem 4,264 3,754 3,162
010 N basic demographics anwmem 3,182 2,423 1,930
030 N ADL-capacity anwmem 3,126 2,413 1,923
230 S scale ADL-capacity anwmem 3,099 2,402 1,909
048 S characteristics of the relationshippairs
anwpair 17,396 15,131 12,637
051 N relationship characteristics andsupport
anwpair 12,887 9,788 7,720
251 S scales support exchanges anwpair 12,739 9,687 7,539
055 S cooperation Network Study respnr 4,059 670 594
072 N life events anwmem 3,182 2,350 1,877
073 N loneliness items anwmem 3,117 - 1,877
273 S loneliness scale anwmem 2,976 - 1,829
075 N items communal and exchangeorientation
anwmem 3,094 2,358 1,884
275 S scale exchange orientation anwmem 3,030 2,302 1,855
083 N norms about support anwmem 3,111 - -
084 N family characteristics anwmem 1,447 1,125 -
095 S geographic and financial databased on postal code
anwmem 4,264 3,754 3,162

Overview Network Study 1992-1995 287
The identifiers of the cases in the LSNghi-files are RESPNR (the number of the respondent, i.e.the anchor of the network), ANWMEM (the first five figures are the respondent number,followed by a unique number in the sequence in which the network members were referred to;the last two figures are 00 for anchors) and ANWPAIR (the first five figures are the respondentnumber, followed by a unique number given twice in the sequence in which the networkmembers were referred to). The identifiers are similar to the identifiers in the LSNa-files. Someexamples:
ANWMEM = 1234567 respondent in the Network Study, network member number 67 ofrespondent 12345
ANWMEM = 1234500 respondent in the Network Study, anchor of the network 12345,same respondent as the respondent in the LSNa-data withRESPNR = 12345
ANWPAIR = 123456789 data on the relationship between network members 1234567 and1234589, provided by network member ANWMEM = 1234567
ANWPAIR = 123458967 data on the relationship between network members 1234567 and1234589, provided by network member ANWMEM = 1234589
Data transformations to get the variable RESPNR from ANWMEM:compute respnr= trunc(anwmem/100).compute anchor= anwmem-trunc(anwmem/100)*100.recode anchor (0=1) (else=0).format respnr (f5) anchor (f1).
Data transformations to get the variable ANWMEM from ANWPAIR:compute anwmem= trunc(anwpair/100).compute mem1= anwmem-trunc(anwmem/100)*100.if (mem1=0) anchor=1.recode anchor (sysmis=0).compute mem2= anwpair-trunc(anwpair/100)*100.format anwmem (f7) mem1 mem2 (f2) anchor (f1).
Comparing answers of both participants in one relationshipRelationship characteristics (dyad data) are collected twice (from two perspectives): they areasked to both participants of one relationship. For example, the question about the frequency ofcontact within the relationship is answered by YY and ZZ. In principal, these answers must beequal. Questions about the supportive exchanges are asked also to both participants. It isexpected that the data on support received by YY from ZZ, as answered by YY, are stronglyassociated with the data on support given by ZZ to YY, as answered by ZZ. However, deviationsmay exist due to the more or less subjective nature of the questions.Data transformations (example):
Make a text-file (ASCII) ’temp.prg’:set echo offset talk offuse templast=0do while .not. eof()
* select one of the pairs XXXXXYYZZ and XXXXXZZYY at randomif tempvar=last
if random=0delete
elseskip -1deleteskip
endifendif
288 NESTOR living arrangements and social networks Overview
last=tempvarskip
enddopackquitExecute the following SPSS-PC commands:get file ’LSNg051.sys’/keep anwpair gnwfreq.* in this file, in each record the information is available from one source: the pair
XXXXXYYZZ has information about the frequency of the contact as reported by YY, and thepair XXXXXZZYY has information about the frequency of the contact as reported by ZZ.
compute opposite = trunc(anwpair/10000)*10000 +(anwpair-trunc(anwpair/100)*100)*100 +trunc(anwpair/100)-trunc(anwpair/10000)*100.
format opposite (f9).modify variables /drop anwpair.sort by opposite.modify variables /rename (opposite=anwpair)(gnwfreq=freq_opp).save file ’temp.sys’.join match /file ’LSNg051.sys’/keep anwpair gnwfreq
/file ’temp.sys’ /by anwpair.* reject if not both participants in the relationship have responded.select if (not missing(gnwfreq) & not missing(freq_opp)).* the information is now double available (from two sources): the pairs XXXXXYYZZ and
XXXXXZZYY have both information about the frequency of the contact as reported by YY
and reported by ZZ; one may select one of the two cases at random which has thedisadvantage of different results across repeated analyses; one may select all cases whichhas the disadvantage of an overestimation of the p-value.
* begin of computations to select one of the two cases at random.compute mem1= trunc(anwpair/100)-trunc(anwpair/10000)*100.compute mem2= anwpair-trunc(anwpair/100)*100.if (mem1>mem2) memnew1=mem1.if (mem1>mem2) memnew2=mem2.if (mem1<mem2) memnew1=mem2.if (mem1<mem2) memnew2=mem1.compute random= trunc(uniform (2)).compute tempvar=trunc(anwpair/10000)*10000+memnew1*100+memnew2.format tempvar (f9) random (f1).modify variables /keep anwpair gnwfreq freq_opp tempvar random.sort by tempvar.translate to ’temp.dbf’ /type=db3 /replace.* the dBase program temp.prg selects one of the two cases at random.dos ’dbase temp.prg’.translate from ’temp.dbf’/drop tempvar random.modify variables /drop d_r.* end of computations to select one of the two cases at random.recode gnwfreq freq_opp (lo thru -1=-1).missing values gnwfreq freq_opp (-1).* labels are lost caused by translation to and from dBase-file.value labels gnwfreq freq_opp -1’missing’ 8’daily/household’ 6’weekly’
5’2x month’ 4’1x month’ 3’<1x month’.variable labels gnwfreq ’frequency in XY as reported by X’
freq_opp ’frequency in XY as reported by Y’.crosstabs /tables= gnwfreq by freq_opp /statistics kappa.
An example for a substantive analysis, using data from several levels:The research question is: Do sex, age, adl, frequency of contact, network size and percentage kinin networks influence changes in instrumental support received by anchors from neighbors? Thedata are combined in several steps (a through h).
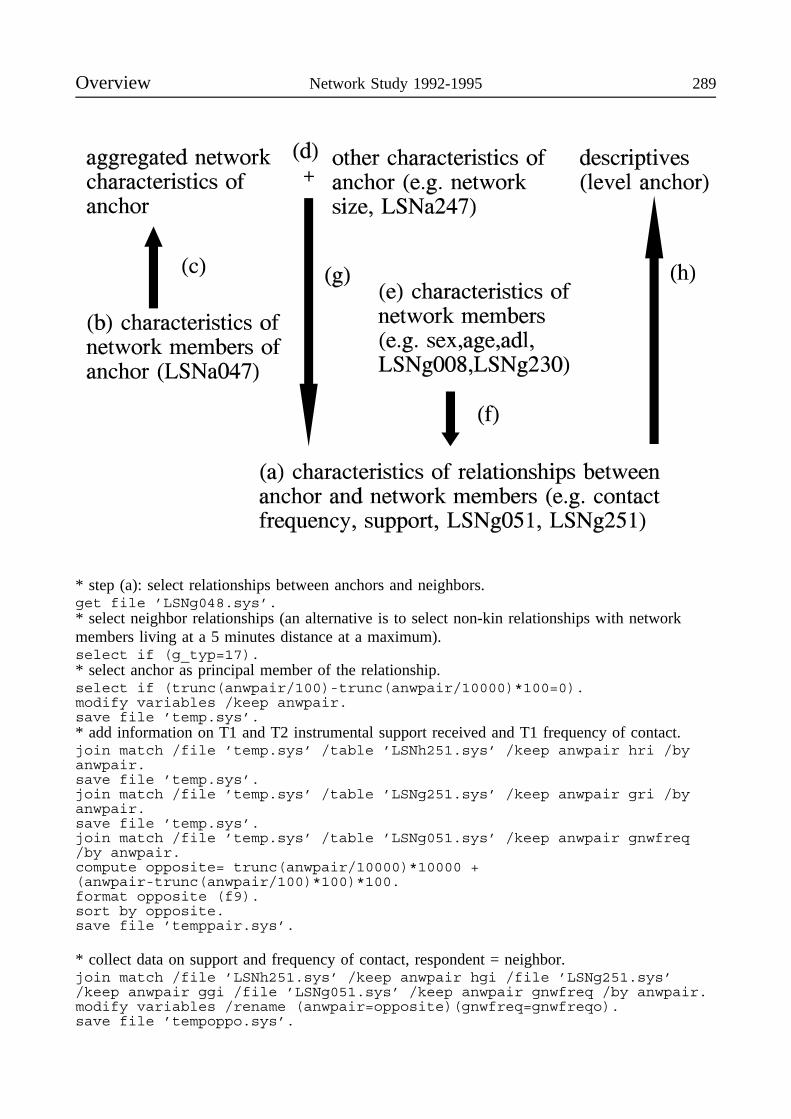
Overview Network Study 1992-1995 289
* step (a): select relationships between anchors and neighbors.get file ’LSNg048.sys’.* select neighbor relationships (an alternative is to select non-kin relationships with networkmembers living at a 5 minutes distance at a maximum).select if (g_typ=17).* select anchor as principal member of the relationship.select if (trunc(anwpair/100)-trunc(anwpair/10000)*100=0).modify variables /keep anwpair.save file ’temp.sys’.* add information on T1 and T2 instrumental support received and T1 frequency of contact.join match /file ’temp.sys’ /table ’LSNh251.sys’ /keep anwpair hri /byanwpair.save file ’temp.sys’.join match /file ’temp.sys’ /table ’LSNg251.sys’ /keep anwpair gri /byanwpair.save file ’temp.sys’.join match /file ’temp.sys’ /table ’LSNg051.sys’ /keep anwpair gnwfreq/by anwpair.compute opposite= trunc(anwpair/10000)*10000 +(anwpair-trunc(anwpair/100)*100)*100.format opposite (f9).sort by opposite.save file ’temppair.sys’.
* collect data on support and frequency of contact, respondent = neighbor.join match /file ’LSNh251.sys’ /keep anwpair hgi /file ’LSNg251.sys’/keep anwpair ggi /file ’LSNg051.sys’ /keep anwpair gnwfreq /by anwpair.modify variables /rename (anwpair=opposite)(gnwfreq=gnwfreqo).save file ’tempoppo.sys’.
290 NESTOR living arrangements and social networks Overview
* replace missing values in temppair.sys by data from the neighbor.join match /file ’temppair.sys’ /table ’tempoppo.sys’ /by opposite.if ((gnwfreq<1 | miss(gnwfreq)) & gnwfreqo>0)gnwfreq=gnwfreqo.if ((hri<1 | miss(hri)) & hgi>0)hri=hgi.if ((gri<1 | miss(gri)) & ggi>0)gri=ggi.select if (not miss (hri) & (not miss (gri)).compute respnr= trunc(anwpair/10000).compute anwmem= trunc(anwpair/100).modify variables /drop hgi ggi gnwfreqo opposite.sort by anwpair.save file ’temppair.sys’.
* step (b): make file with data on network characteristics.get file ’LSNa047.sys’.recode adomtyp (12,19,21,23,24=1) (7,22=2) (13,32=3) (8,33=4)(4,5,6,14,31,34 thru 39=5) (15,71=6) (40=7) (1,2,3,9,10,16,17,18,19,41thru 70,72 thru 79=8) (11,80=9).value label adomtyp 1’child’2’ch ilaw’3’sib’4’sib ilaw’5’other kin’6’friend’7’neighbor’8’other non kin’9’partner’.if (adomtyp>=1 & adomtyp<=5)kin=1.if (adomtyp>=6 & adomtyp<=8)kin=0.if (adomtyp=-1 | adomtyp=9)kin=-1.missing values kin (-1).compute respnr=trunc(anwmem/100).* step (c): aggregate to level anchors.aggregate /outfile ’temp.sys’ /break respnr /pctkin=pgt(kin,0).* step (d): collect data on level anchors.join match /file ’LSNa247.sys’ /keep respnr anwsize /file ’temp.sys’ /byrespnr.format pctkin (f5.1).save file ’tempresp.sys’.
* step (e): make file with data (SEX, AGE and ADL) on the level of the network members.join match /file ’LSNg008.sys’ /keep anwmem anwsex gage /file’LSNg230.sys’ /file ’LSNh230.sys’ /file ’LSNi230.sys’ /by anwmem.if (miss(gadl) & not miss(hadl))gadl=hadl.if (miss(gadl) & not miss(iadl))gadl=iadl.compute respnr= trunc(anwmem/100).compute mem= anwmem - respnr*100.save file ’temp.sys’.join match /file ’temp.sys’ /drop hadl iadl /table ’LSNa230.sys’ /keeprespnr aadl /by respnr.* if adl of anchor is missing in the Network Study, the adl as assessed in the main survey istaken as replacement.if (miss(gadl) & mem=0 & aadl>0)gadl=aadl.modify variables /drop aadl respnr mem.save file ’tempmem.sys’.
* step (f), phase 1 (anchors): join data on the relationship level with data on the networkmember level.join match /file ’temppair.sys’ /table ’tempmem.sys’ /rename(anwsex=sexanch) (gage=ageanch) (gadl=adlanch) /by anwmem.compute anwmem= respnr*100+ anwpair-trunc(anwpair/100)*100.sort by anwmem.save file ’temppair.sys’.* step (f), phase 2 (neighbors): join data on the relationship level with data on the networkmember level.join match /file ’temppair.sys’ /table ’tempmem.sys’ /rename(anwsex=sexneig) (gage=ageneig) (gadl=adlneig) /by anwmem.
Overview Network Study 1992-1995 291
save file ’temppair.sys’.* step (g): join data on the relationship level with data on level anchor.join match /file ’temppair.sys’ /drop anwmem /table ’tempresp.sys’ /byrespnr.format respnr (f5).variable label respnr ’identification anchor’.compute mem= anwpair- respnr*10000.format mem (f2).variable label mem ’identification neighbor’.missing values hri gri gnwfreq (-1) ageneig (-2).modify variables /reorder (anwpair respnr mem hri gri gnwfreq sexanchageanch adlanch sexneig ageneig adlneig anwsize pctkin).save file ’pairdata.sys’.* descriptives of the relationships.descriptives /variables=all.
* step (h): descriptives of variables of anchor.get file ’pairdata.sys’.* for characteristics of anchor, the first valid value is taken, for characteristics of neighbors, themean of valid values is taken.aggregate /outfile ’tempagg.sys’ /break respnr/nrecord ’selected # neighb rel.ships’ =N /sex=first(sexanch)/age=first(ageanch) /adl=first(adlanch) /anwsize=first(anwsize)/pctkin=first(pctkin)/meanfreq ’mean contact frequency /w neighbors’=mean(gnwfreq)/femaneig ’pct female neighbors’=pgt(sexneig,1)/mageneig ’mean age neighbors’=mean(ageneig)/madlneig ’mean adl neighbors’=mean(adlneig).get file ’tempagg.sys’.format nrecord (f2) meanfreq (f3.1) femaneig (f5.1) mageneig (f6.2)madlneig (f4.1).* note that a valid value for the adl of neighbors is only available when at least one of theneighbors responded; the mean can be based on less than the number of neighbors in therelationship file.desciptives /variables= all.
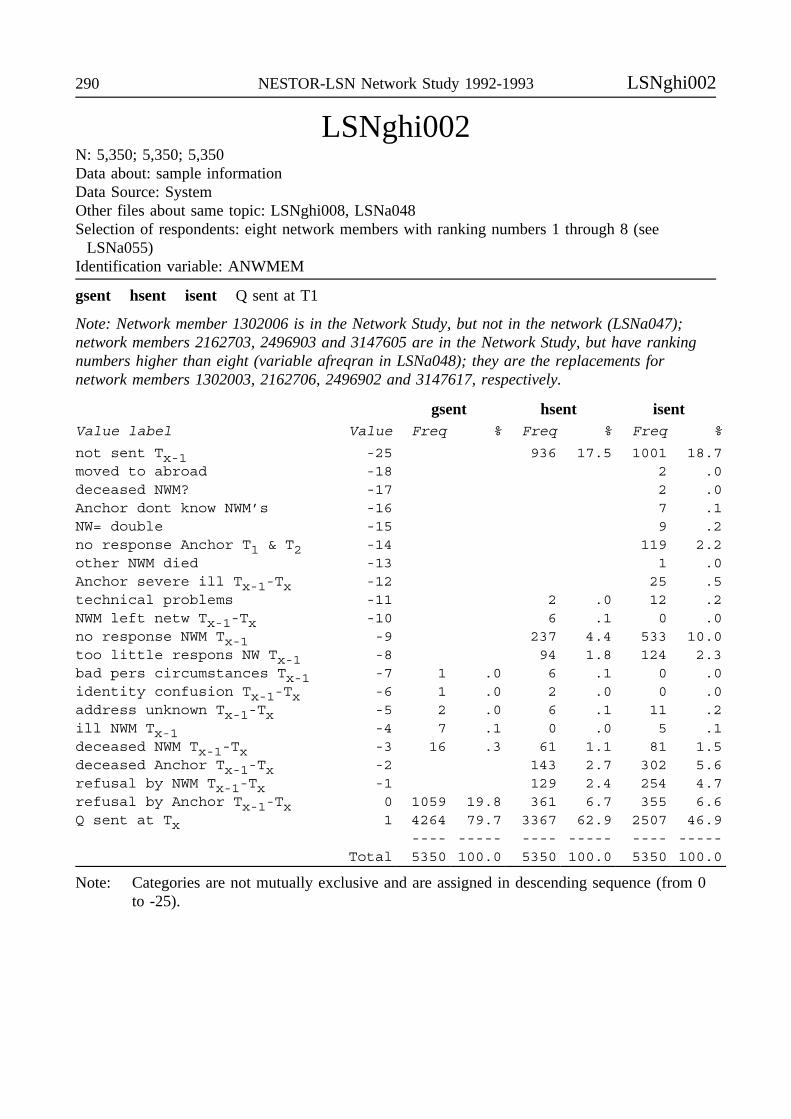
290 NESTOR-LSN Network Study 1992-1993 LSNghi002
LSNghi002N: 5,350; 5,350; 5,350Data about: sample informationData Source: SystemOther files about same topic: LSNghi008, LSNa048Selection of respondents: eight network members with ranking numbers 1 through 8 (see
LSNa055)Identification variable: ANWMEM
gsent hsent isent Q sent at T1
Note: Network member 1302006 is in the Network Study, but not in the network (LSNa047);network members 2162703, 2496903 and 3147605 are in the Network Study, but have rankingnumbers higher than eight (variable afreqran in LSNa048); they are the replacements fornetwork members 1302003, 2162706, 2496902 and 3147617, respectively.
gsent hsent isentValue label Value Freq % Freq % Freq %
not sent Tx-1 -25 936 17.5 1001 18.7moved to abroad -18 2 .0deceased NWM? -17 2 .0Anchor dont know NWM’s -16 7 .1NW= double -15 9 .2no response Anchor T1 & T2 -14 119 2.2other NWM died -13 1 .0Anchor severe ill Tx-1-Tx -12 25 .5technical problems -11 2 .0 12 .2NWM left netw Tx-1-Tx -10 6 .1 0 .0no response NWM Tx-1 -9 237 4.4 533 10.0too little respons NW Tx-1 -8 94 1.8 124 2.3bad pers circumstances Tx-1 -7 1 .0 6 .1 0 .0identity confusion Tx-1-Tx -6 1 .0 2 .0 0 .0address unknown Tx-1-Tx -5 2 .0 6 .1 11 .2ill NWM Tx-1 -4 7 .1 0 .0 5 .1deceased NWM Tx-1-Tx -3 16 .3 61 1.1 81 1.5deceased Anchor Tx-1-Tx -2 143 2.7 302 5.6refusal by NWM Tx-1-Tx -1 129 2.4 254 4.7refusal by Anchor Tx-1-Tx 0 1059 19.8 361 6.7 355 6.6Q sent at Tx 1 4264 79.7 3367 62.9 2507 46.9
---- ----- ---- ----- ---- -----Total 5350 100.0 5350 100.0 5350 100.0
Note: Categories are not mutually exclusive and are assigned in descending sequence (from 0to -25).

LSNghi008 Network Study 1992-1995 291
LSNghi008N: 4,264; 3,754; 3,162Data about: sample informationData source: SystemOther files about same topic: LSNg002, LSNa047Selection of respondents: valid names/addresses of selected members (see LSNa055)Identification variable: ANWMEM
anwsex sex R Network StudyThis variable is equal to the variable anwsex in LSNa047; the values for anchors are equal tothe variable sex in LSNa008.
bdate birth date <yymmdd>What is your date of birth?Wat is Uw geboortedatum? dag (1..31) ..... maand (1..12) ..... jaar 19 .....
anwsex bdate
Label Value Freq % Value label Value Freq %male 1 1889 44.3 no data -1 959 22.5female 2 2375 55.7 Feb 1, 1900 201 1 .0
---- ----- <interrupted>Total 4264 100.0 July 26, 1975 750726 1 .0
!Jan 23, 1896 960123 1 .0!Feb 25, 1897 970225 1 .0
---- -----Total 4264 100.0
gage hage iage age at day of returning QIf a questionnaire is not returned, the day of sending the questionnaire is taken. If the birth dateis missing, the age of the network member is taken from LSNa051.
gage hage iage
Value label Value Freq % Freq % Freq %bdate missing -2 16 1.5 13 .3 12 .4youngest T1 16.04 1 .0youngest T2 17.02 1 .0youngest T3 18.03 1 .0<interrupted>oldest T1 96.54 1 .0oldest T2 97.59 1 .0oldest T3 98.70 1 .0
---- ----- ---- ----- ---- -----Total 4264 100.0 3754 100.0 3162 100.0
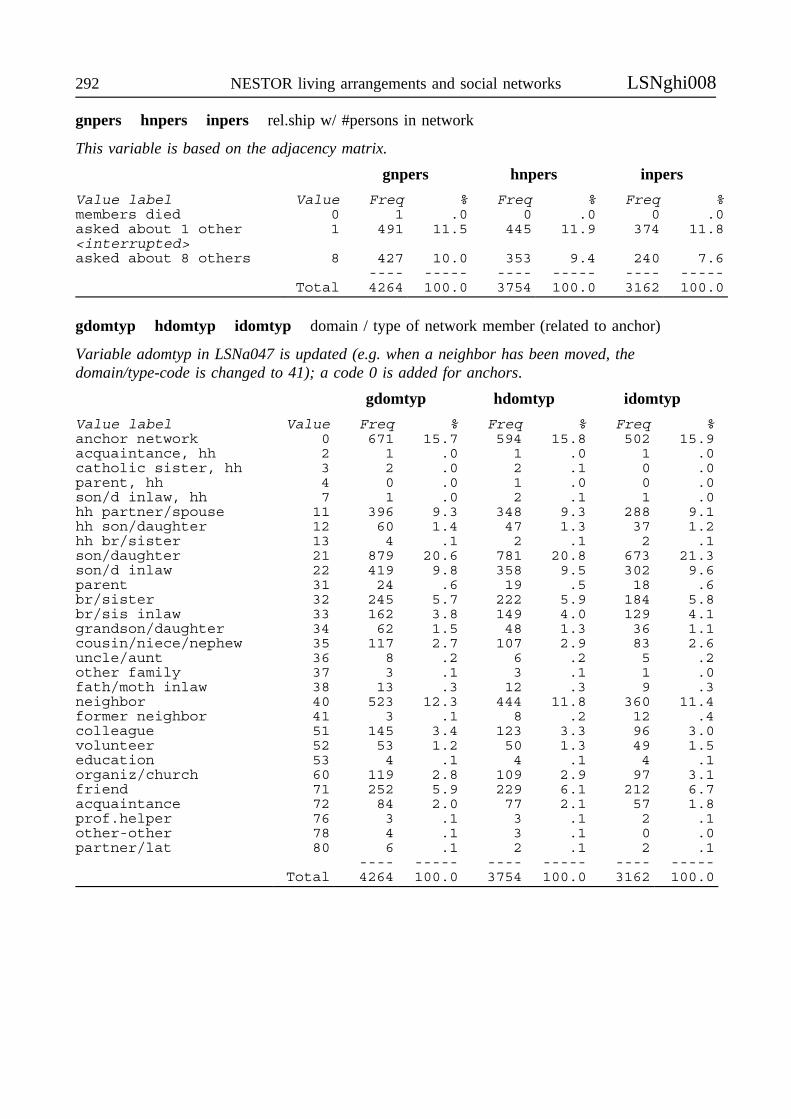
292 NESTOR living arrangements and social networks LSNghi008
gnpers hnpers inpers rel.ship w/ #persons in network
This variable is based on the adjacency matrix.
gnpers hnpers inpers
Value label Value Freq % Freq % Freq %members died 0 1 .0 0 .0 0 .0asked about 1 other 1 491 11.5 445 11.9 374 11.8<interrupted>asked about 8 others 8 427 10.0 353 9.4 240 7.6
---- ----- ---- ----- ---- -----Total 4264 100.0 3754 100.0 3162 100.0
gdomtyp hdomtyp idomtyp domain / type of network member (related to anchor)
Variable adomtyp in LSNa047 is updated (e.g. when a neighbor has been moved, thedomain/type-code is changed to 41); a code 0 is added for anchors.
gdomtyp hdomtyp idomtyp
Value label Value Freq % Freq % Freq %anchor network 0 671 15.7 594 15.8 502 15.9acquaintance, hh 2 1 .0 1 .0 1 .0catholic sister, hh 3 2 .0 2 .1 0 .0parent, hh 4 0 .0 1 .0 0 .0son/d inlaw, hh 7 1 .0 2 .1 1 .0hh partner/spouse 11 396 9.3 348 9.3 288 9.1hh son/daughter 12 60 1.4 47 1.3 37 1.2hh br/sister 13 4 .1 2 .1 2 .1son/daughter 21 879 20.6 781 20.8 673 21.3son/d inlaw 22 419 9.8 358 9.5 302 9.6parent 31 24 .6 19 .5 18 .6br/sister 32 245 5.7 222 5.9 184 5.8br/sis inlaw 33 162 3.8 149 4.0 129 4.1grandson/daughter 34 62 1.5 48 1.3 36 1.1cousin/niece/nephew 35 117 2.7 107 2.9 83 2.6uncle/aunt 36 8 .2 6 .2 5 .2other family 37 3 .1 3 .1 1 .0fath/moth inlaw 38 13 .3 12 .3 9 .3neighbor 40 523 12.3 444 11.8 360 11.4former neighbor 41 3 .1 8 .2 12 .4colleague 51 145 3.4 123 3.3 96 3.0volunteer 52 53 1.2 50 1.3 49 1.5education 53 4 .1 4 .1 4 .1organiz/church 60 119 2.8 109 2.9 97 3.1friend 71 252 5.9 229 6.1 212 6.7acquaintance 72 84 2.0 77 2.1 57 1.8prof.helper 76 3 .1 3 .1 2 .1other-other 78 4 .1 3 .1 0 .0partner/lat 80 6 .1 2 .1 2 .1
---- ----- ---- ----- ---- -----Total 4264 100.0 3754 100.0 3162 100.0

LSNghi008 Network Study 1992-1995 293
gs1dat hs1dat is1dat Q sent <yymmdd>
gs1dat hs1dat is1dat
Value label Value Freq % Freq % Freq %not sent -1 388 10.3 656 20.7
920422 48 1.1<interrupted>
950126 2 .1---- ----- ---- ----- ---- -----
Total 4264 100.0 3754 100.0 3162 100.0
gs2dat hs2dat is2dat first reminder sent <yymmdd>gs3dat hs3dat is3dat second reminder sent <yymmdd>
grespons hrespons irespons response mailed Q
grespons hrespons irespons
Value label Value Freq % Freq % Freq %no approach T2 -7 300 9.5refusal for Tx-1 -6 150 4.0 139 4.4address unknown -5 7 .2no response T1 -4 237 6.3 209 6.6no response 0 830 19.5 695 18.5 452 14.3valid Q 1 3182 74.6 2423 64.5 1930 61.0mail returned 2 9 .2 19 .5 2 .1empty Q returned 3 60 1.4 26 .7 30 .9refusal phone 4 61 1.4 24 .6 7 .2refusal letter 5 39 .9 99 2.6 43 1.4refusal by anchor 6 68 1.6 60 1.6 28 .9severe ill, dying 10 7 .2 5 .2A severe ill, dying 11 6 .1 7 .2 0 .0left network 12 4 .1 5 .2temporary abroad 13 2 .0 2 .1 2 .1other member died 14 7 .2 1 .0 0 .0address unknown 15 3 .1
---- ----- ---- ----- ---- -----Total 4264 100.0 3754 100.0 3162 100.0
grpdat hrpdat irpdat date of response
grpdat hrpdat irpdat
Value label Value Freq % Freq % Freq %no approach T2 -7 300 9.5refusal for Tx -6 150 4.0 139 4.4address unknown -5 7 .2no response Tx-1 -4 237 6.3 209 6.6no response -1 830 19.5 695 18.5 453 14.3April 29, 1992 920429 14 .3<interrupted>April 26, 1995 950426 1 .0
---- ----- ---- ----- ---- -----Total 4264 100.0 3754 100.0 3162 100.0
gequalg equal to R in Network Study (LSNg)40 netwerk members are also network members in another network. The networks 15623 and15910 are the same, and the networks 15925 and 15794 are almost the same.
gequala equal to R in main survey (LSNa)90 network members, other than anchor in that network, are also respondents in the main study(LSNa008).
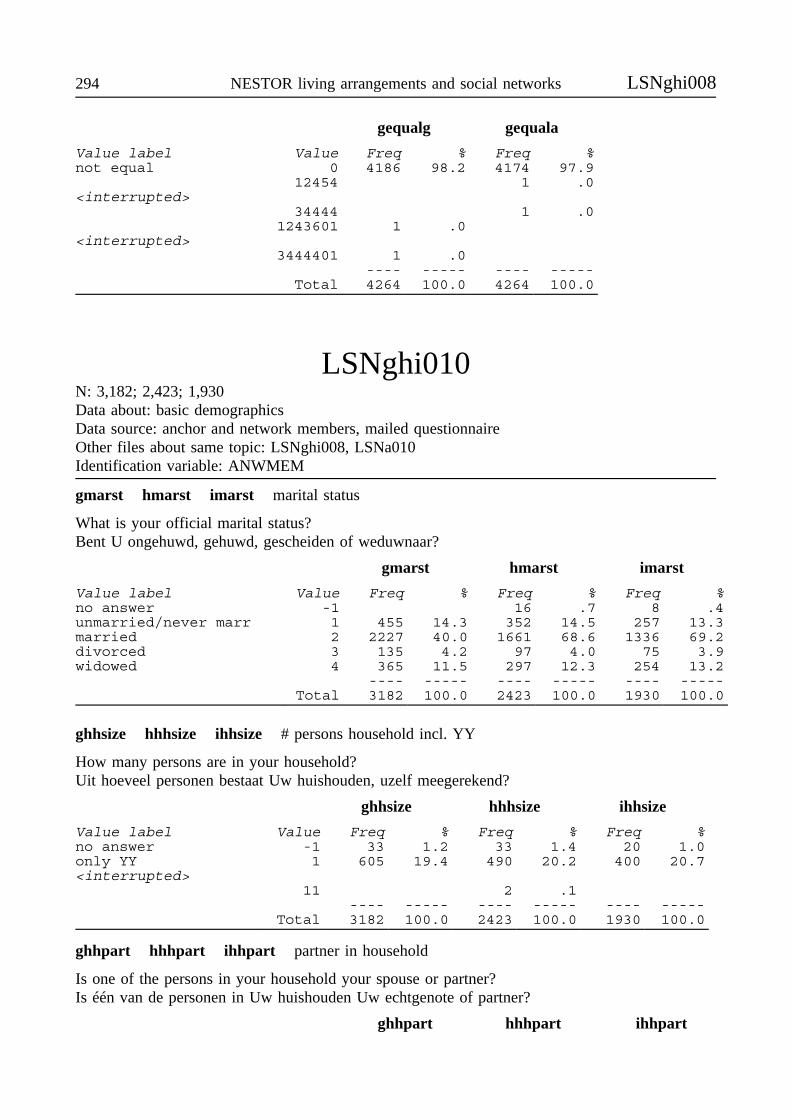
294 NESTOR living arrangements and social networks LSNghi008
gequalg gequala
Value label Value Freq % Freq %not equal 0 4186 98.2 4174 97.9
12454 1 .0<interrupted>
34444 1 .01243601 1 .0
<interrupted>3444401 1 .0
---- ----- ---- -----Total 4264 100.0 4264 100.0
LSNghi010N: 3,182; 2,423; 1,930Data about: basic demographicsData source: anchor and network members, mailed questionnaireOther files about same topic: LSNghi008, LSNa010Identification variable: ANWMEM
gmarst hmarst imarst marital status
What is your official marital status?Bent U ongehuwd, gehuwd, gescheiden of weduwnaar?
gmarst hmarst imarst
Value label Value Freq % Freq % Freq %no answer -1 16 .7 8 .4unmarried/never marr 1 455 14.3 352 14.5 257 13.3married 2 2227 40.0 1661 68.6 1336 69.2divorced 3 135 4.2 97 4.0 75 3.9widowed 4 365 11.5 297 12.3 254 13.2
---- ----- ---- ----- ---- -----Total 3182 100.0 2423 100.0 1930 100.0
ghhsize hhhsize ihhsize # persons household incl. YY
How many persons are in your household?Uit hoeveel personen bestaat Uw huishouden, uzelf meegerekend?
ghhsize hhhsize ihhsize
Value label Value Freq % Freq % Freq %no answer -1 33 1.2 33 1.4 20 1.0only YY 1 605 19.4 490 20.2 400 20.7<interrupted>
11 2 .1---- ----- ---- ----- ---- -----
Total 3182 100.0 2423 100.0 1930 100.0
ghhpart hhhpart ihhpart partner in household
Is one of the persons in your household your spouse or partner?Is één van de personen in Uw huishouden Uw echtgenote of partner?
ghhpart hhhpart ihhpart
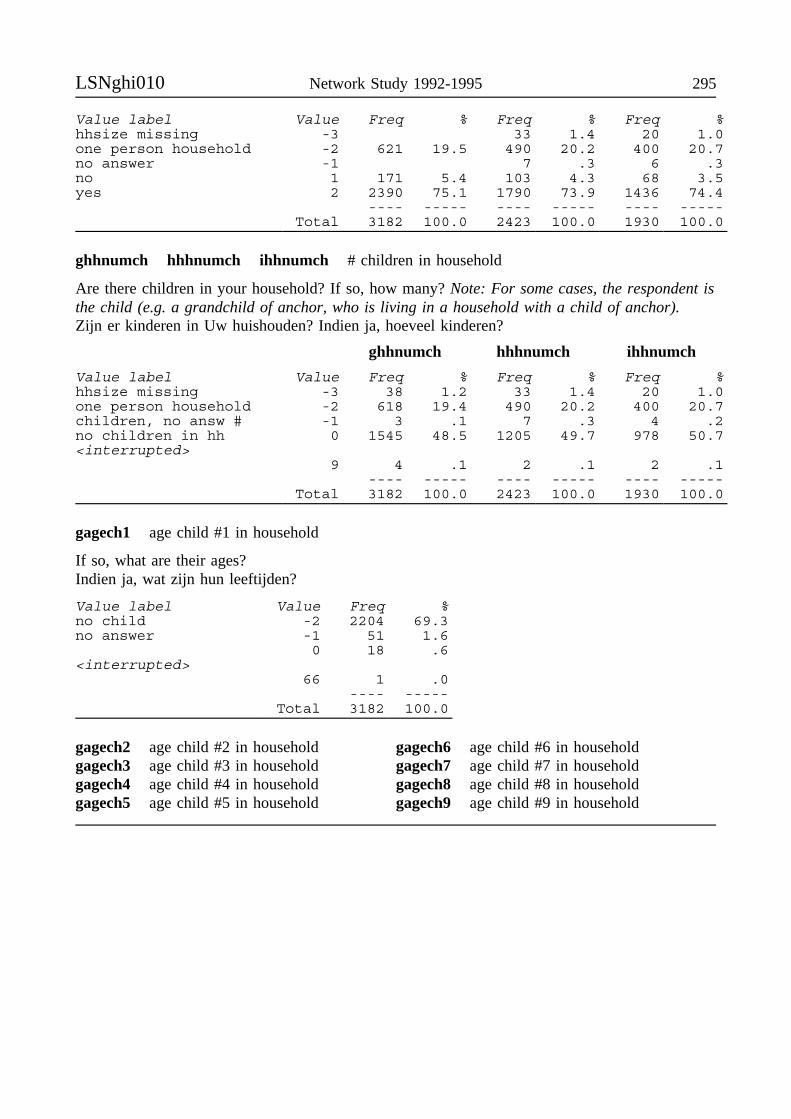
LSNghi010 Network Study 1992-1995 295
Value label Value Freq % Freq % Freq %hhsize missing -3 33 1.4 20 1.0one person household -2 621 19.5 490 20.2 400 20.7no answer -1 7 .3 6 .3no 1 171 5.4 103 4.3 68 3.5yes 2 2390 75.1 1790 73.9 1436 74.4
---- ----- ---- ----- ---- -----Total 3182 100.0 2423 100.0 1930 100.0
ghhnumch hhhnumch ihhnumch # children in household
Are there children in your household? If so, how many? Note: For some cases, the respondent isthe child (e.g. a grandchild of anchor, who is living in a household with a child of anchor).Zijn er kinderen in Uw huishouden? Indien ja, hoeveel kinderen?
ghhnumch hhhnumch ihhnumch
Value label Value Freq % Freq % Freq %hhsize missing -3 38 1.2 33 1.4 20 1.0one person household -2 618 19.4 490 20.2 400 20.7children, no answ # -1 3 .1 7 .3 4 .2no children in hh 0 1545 48.5 1205 49.7 978 50.7<interrupted>
9 4 .1 2 .1 2 .1---- ----- ---- ----- ---- -----
Total 3182 100.0 2423 100.0 1930 100.0
gagech1 age child #1 in household
If so, what are their ages?Indien ja, wat zijn hun leeftijden?
Value label Value Freq %no child -2 2204 69.3no answer -1 51 1.6
0 18 .6<interrupted>
66 1 .0---- -----
Total 3182 100.0
gagech2 age child #2 in householdgagech3 age child #3 in householdgagech4 age child #4 in householdgagech5 age child #5 in household
gagech6 age child #6 in householdgagech7 age child #7 in householdgagech8 age child #8 in householdgagech9 age child #9 in household
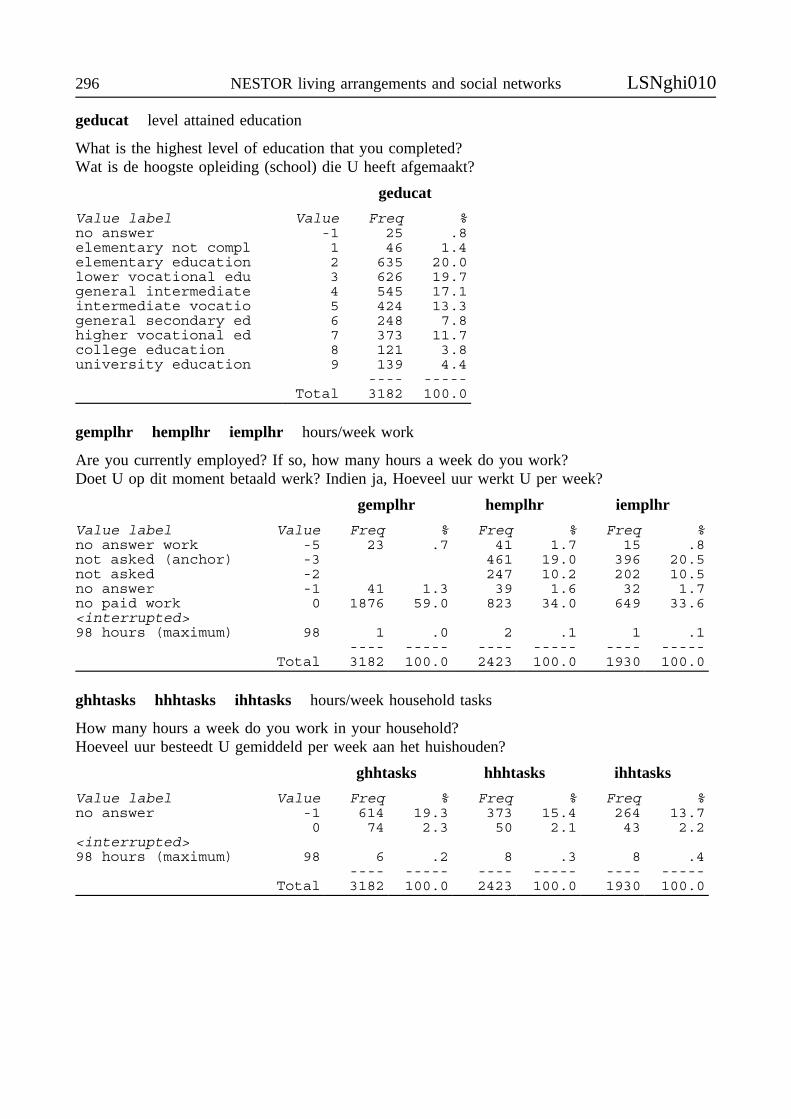
296 NESTOR living arrangements and social networks LSNghi010
geducat level attained education
What is the highest level of education that you completed?Wat is de hoogste opleiding (school) die U heeft afgemaakt?
geducat
Value label Value Freq %no answer -1 25 .8elementary not compl 1 46 1.4elementary education 2 635 20.0lower vocational edu 3 626 19.7general intermediate 4 545 17.1intermediate vocatio 5 424 13.3general secondary ed 6 248 7.8higher vocational ed 7 373 11.7college education 8 121 3.8university education 9 139 4.4
---- -----Total 3182 100.0
gemplhr hemplhr iemplhr hours/week work
Are you currently employed? If so, how many hours a week do you work?Doet U op dit moment betaald werk? Indien ja, Hoeveel uur werkt U per week?
gemplhr hemplhr iemplhr
Value label Value Freq % Freq % Freq %no answer work -5 23 .7 41 1.7 15 .8not asked (anchor) -3 461 19.0 396 20.5not asked -2 247 10.2 202 10.5no answer -1 41 1.3 39 1.6 32 1.7no paid work 0 1876 59.0 823 34.0 649 33.6<interrupted>98 hours (maximum) 98 1 .0 2 .1 1 .1
---- ----- ---- ----- ---- -----Total 3182 100.0 2423 100.0 1930 100.0
ghhtasks hhhtasks ihhtasks hours/week household tasks
How many hours a week do you work in your household?Hoeveel uur besteedt U gemiddeld per week aan het huishouden?
ghhtasks hhhtasks ihhtasks
Value label Value Freq % Freq % Freq %no answer -1 614 19.3 373 15.4 264 13.7
0 74 2.3 50 2.1 43 2.2<interrupted>98 hours (maximum) 98 6 .2 8 .3 8 .4
---- ----- ---- ----- ---- -----Total 3182 100.0 2423 100.0 1930 100.0
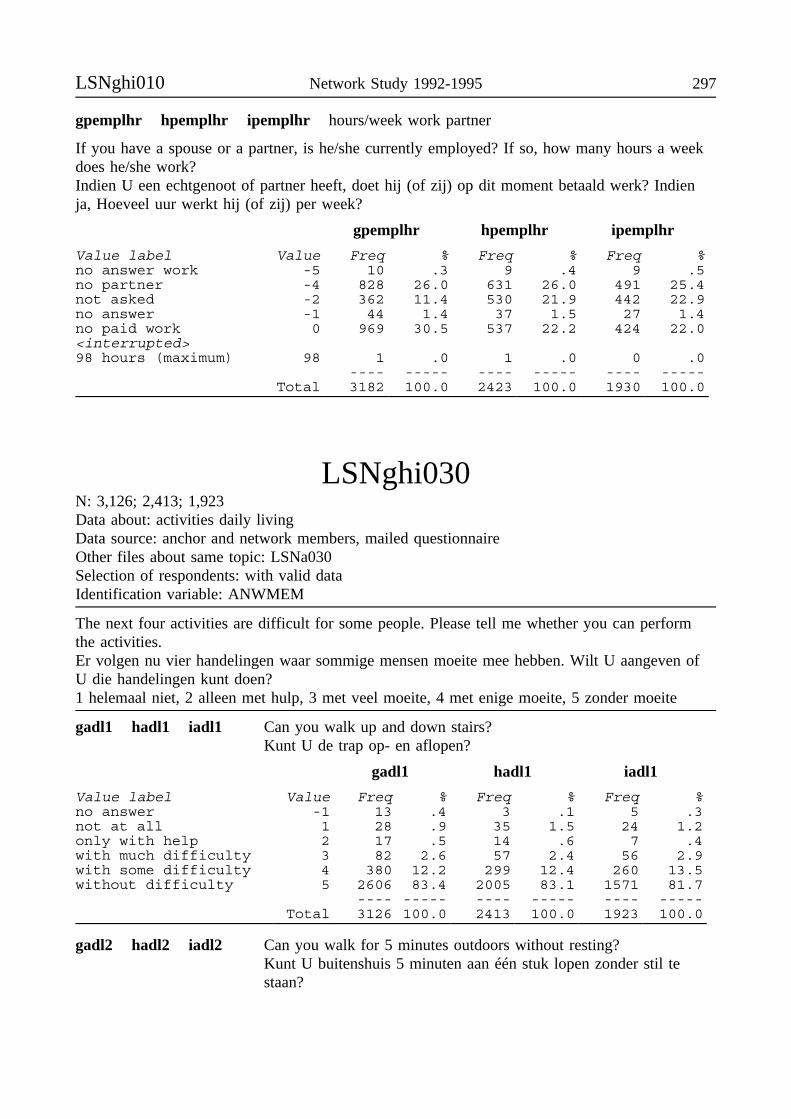
LSNghi010 Network Study 1992-1995 297
gpemplhr hpemplhr ipemplhr hours/week work partner
If you have a spouse or a partner, is he/she currently employed? If so, how many hours a weekdoes he/she work?Indien U een echtgenoot of partner heeft, doet hij (of zij) op dit moment betaald werk? Indienja, Hoeveel uur werkt hij (of zij) per week?
gpemplhr hpemplhr ipemplhr
Value label Value Freq % Freq % Freq %no answer work -5 10 .3 9 .4 9 .5no partner -4 828 26.0 631 26.0 491 25.4not asked -2 362 11.4 530 21.9 442 22.9no answer -1 44 1.4 37 1.5 27 1.4no paid work 0 969 30.5 537 22.2 424 22.0<interrupted>98 hours (maximum) 98 1 .0 1 .0 0 .0
---- ----- ---- ----- ---- -----Total 3182 100.0 2423 100.0 1930 100.0
LSNghi030N: 3,126; 2,413; 1,923Data about: activities daily livingData source: anchor and network members, mailed questionnaireOther files about same topic: LSNa030Selection of respondents: with valid dataIdentification variable: ANWMEM
The next four activities are difficult for some people. Please tell me whether you can performthe activities.Er volgen nu vier handelingen waar sommige mensen moeite mee hebben. Wilt U aangeven ofU die handelingen kunt doen?1 helemaal niet, 2 alleen met hulp, 3 met veel moeite, 4 met enige moeite, 5 zonder moeite
gadl1 hadl1 iadl1 Can you walk up and down stairs?Kunt U de trap op- en aflopen?
gadl1 hadl1 iadl1
Value label Value Freq % Freq % Freq %no answer -1 13 .4 3 .1 5 .3not at all 1 28 .9 35 1.5 24 1.2only with help 2 17 .5 14 .6 7 .4with much difficulty 3 82 2.6 57 2.4 56 2.9with some difficulty 4 380 12.2 299 12.4 260 13.5without difficulty 5 2606 83.4 2005 83.1 1571 81.7
---- ----- ---- ----- ---- -----Total 3126 100.0 2413 100.0 1923 100.0
gadl2 hadl2 iadl2 Can you walk for 5 minutes outdoors without resting?Kunt U buitenshuis 5 minuten aan één stuk lopen zonder stil testaan?
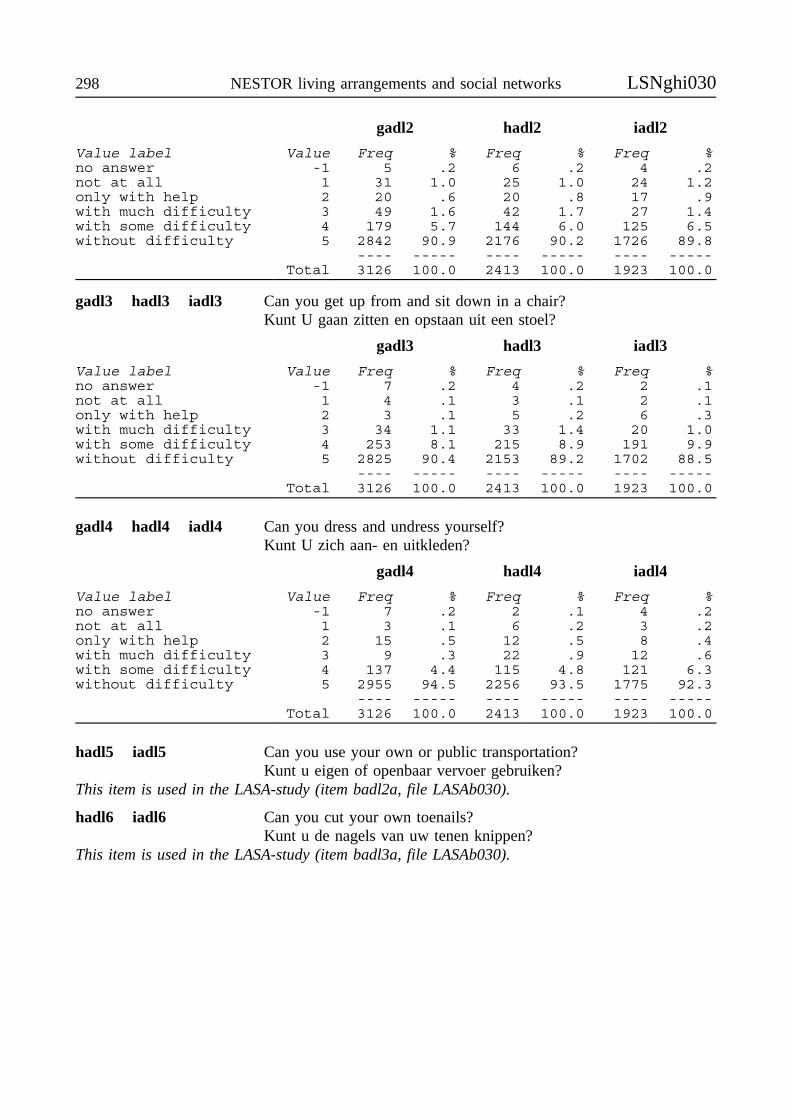
298 NESTOR living arrangements and social networks LSNghi030
gadl2 hadl2 iadl2
Value label Value Freq % Freq % Freq %no answer -1 5 .2 6 .2 4 .2not at all 1 31 1.0 25 1.0 24 1.2only with help 2 20 .6 20 .8 17 .9with much difficulty 3 49 1.6 42 1.7 27 1.4with some difficulty 4 179 5.7 144 6.0 125 6.5without difficulty 5 2842 90.9 2176 90.2 1726 89.8
---- ----- ---- ----- ---- -----Total 3126 100.0 2413 100.0 1923 100.0
gadl3 hadl3 iadl3 Can you get up from and sit down in a chair?Kunt U gaan zitten en opstaan uit een stoel?
gadl3 hadl3 iadl3
Value label Value Freq % Freq % Freq %no answer -1 7 .2 4 .2 2 .1not at all 1 4 .1 3 .1 2 .1only with help 2 3 .1 5 .2 6 .3with much difficulty 3 34 1.1 33 1.4 20 1.0with some difficulty 4 253 8.1 215 8.9 191 9.9without difficulty 5 2825 90.4 2153 89.2 1702 88.5
---- ----- ---- ----- ---- -----Total 3126 100.0 2413 100.0 1923 100.0
gadl4 hadl4 iadl4 Can you dress and undress yourself?Kunt U zich aan- en uitkleden?
gadl4 hadl4 iadl4
Value label Value Freq % Freq % Freq %no answer -1 7 .2 2 .1 4 .2not at all 1 3 .1 6 .2 3 .2only with help 2 15 .5 12 .5 8 .4with much difficulty 3 9 .3 22 .9 12 .6with some difficulty 4 137 4.4 115 4.8 121 6.3without difficulty 5 2955 94.5 2256 93.5 1775 92.3
---- ----- ---- ----- ---- -----Total 3126 100.0 2413 100.0 1923 100.0
hadl5 iadl5 Can you use your own or public transportation?Kunt u eigen of openbaar vervoer gebruiken?
This item is used in the LASA-study (item badl2a, file LASAb030).
hadl6 iadl6 Can you cut your own toenails?Kunt u de nagels van uw tenen knippen?
This item is used in the LASA-study (item badl3a, file LASAb030).
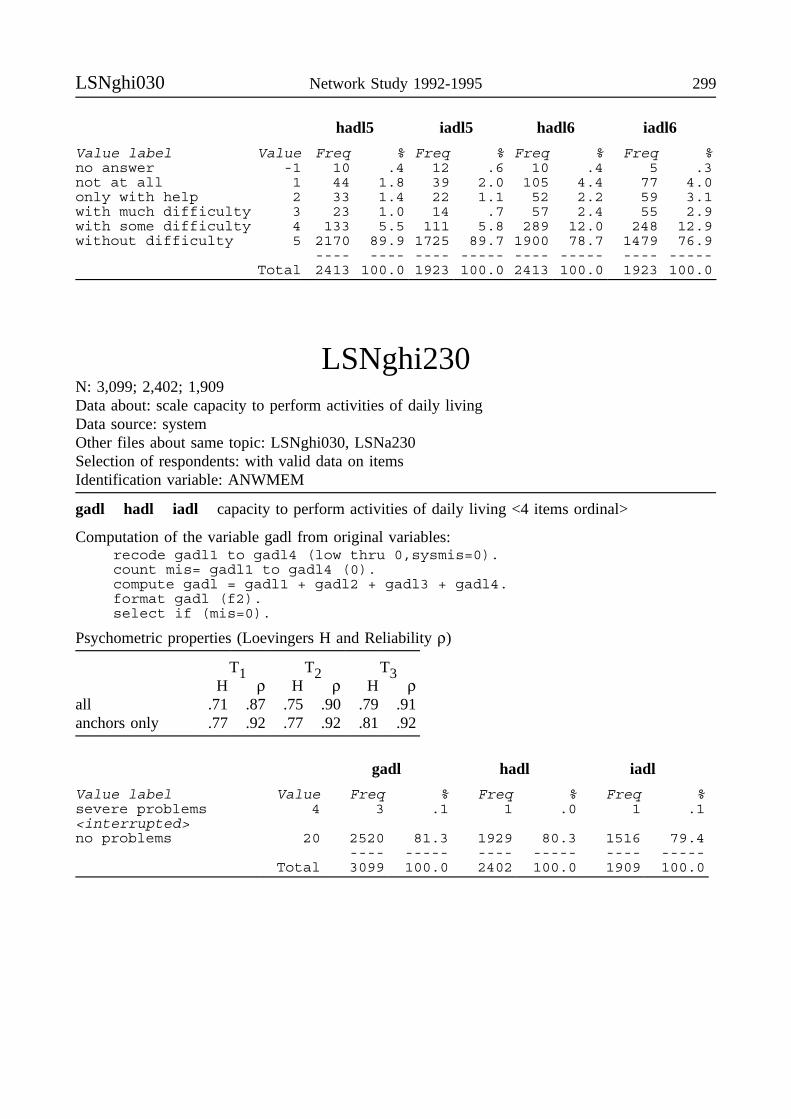
LSNghi030 Network Study 1992-1995 299
hadl5 iadl5 hadl6 iadl6
Value label Value Freq % Freq % Freq % Freq %no answer -1 10 .4 12 .6 10 .4 5 .3not at all 1 44 1.8 39 2.0 105 4.4 77 4.0only with help 2 33 1.4 22 1.1 52 2.2 59 3.1with much difficulty 3 23 1.0 14 .7 57 2.4 55 2.9with some difficulty 4 133 5.5 111 5.8 289 12.0 248 12.9without difficulty 5 2170 89.9 1725 89.7 1900 78.7 1479 76.9
---- ---- ---- ----- ---- ----- ---- -----Total 2413 100.0 1923 100.0 2413 100.0 1923 100.0
LSNghi230N: 3,099; 2,402; 1,909Data about: scale capacity to perform activities of daily livingData source: systemOther files about same topic: LSNghi030, LSNa230Selection of respondents: with valid data on itemsIdentification variable: ANWMEM
gadl hadl iadl capacity to perform activities of daily living <4 items ordinal>
Computation of the variable gadl from original variables:recode gadl1 to gadl4 (low thru 0,sysmis=0).count mis= gadl1 to gadl4 (0).compute gadl = gadl1 + gadl2 + gadl3 + gadl4.format gadl (f2).select if (mis=0).
Psychometric properties (Loevingers H and Reliability ρ)
T1 T2 T3H ρ H ρ H ρ
all .71 .87 .75 .90 .79 .91anchors only .77 .92 .77 .92 .81 .92
gadl hadl iadl
Value label Value Freq % Freq % Freq %severe problems 4 3 .1 1 .0 1 .1<interrupted>no problems 20 2520 81.3 1929 80.3 1516 79.4
---- ----- ---- ----- ---- -----Total 3099 100.0 2402 100.0 1909 100.0

300 NESTOR living arrangements and social networks LSNghi048
LSNghi048N: 17,396; 15,131; 12,637Data about: characteristics of the relationship pairsData source: system (addresses of network members, commercial geographic database),
LSNa056, LSNghi095Other files about same topic: LSNghi051, LSNa056, LSNa047, LSNa048Identification variable: ANWPAIR
The basis of the questionnaire was an adjacency matrix, like the one of the example network inthe introduction on the Network Study. The information to construct these matrices for eachrespondent was obtained in the face-to-face survey in 1992 (LSNa056). In the files LSNghi048,information about the individual network members, available in the database, is matched to getinformation about the pairs (relationship characteristics). In LSNghi051, information is storedabout the relationship characteristics, obtained from the individual network members using themailed questionnaire. The network members in the pairs can have a different administrativestatus: Q sent and returned, Q sent and not returned, Q not sent, or the network member saysthat s/he does not know the other network member, while the other says s/he knows the firstmember.
g_sex sex of pair members
g_sex
Value label Value Freq %both male 1 3484 20.0R=male,opp=female 2 4487 25.8R=female,opp=male 3 4488 25.8both female 4 4937 28.4
----- -----Total 17396 100.0
g_post h_post i_post postal code equal for network members in the relationship
g_post h_post i_post
Value label Value Freq % Freq % Freq %1 or both missing -1 598 3.4 466 3.1 348 2.81 abroad 0 164 .9 158 1.0 142 1.1unequal 1 2878 16.5 2576 17.0 2232 17.71 digit equal 2 2528 14.5 2290 15.1 1914 15.12 digits equal 3 2275 13.1 2049 13.5 1659 13.13 digits equal 4 1506 8.7 1238 8.2 1058 8.4all digits equal 5 3379 19.4 2908 19.2 2478 19.6compl equal 6 1768 10.2 1492 9.9 1238 9.8address equal 7 2300 13.2 1954 12.9 1568 12.4
----- ----- ---- ----- ---- -----Total 17396 100.0 15131 100.0 12637 100.0
Note: Missing for questionnaires mailed as c/o anchor (per adres anker verstuurd).
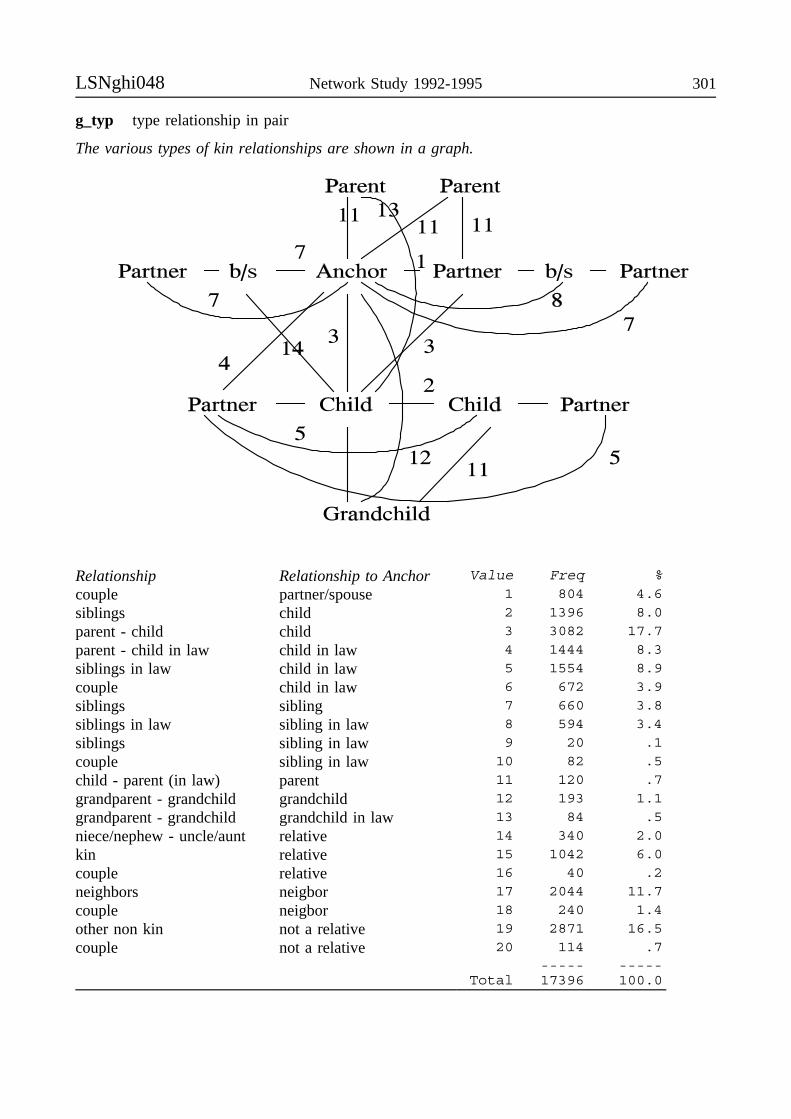
LSNghi048 Network Study 1992-1995 301
g_typ type relationship in pair
The various types of kin relationships are shown in a graph.
Relationship Relationship to Anchor Value Freq %
couple partner/spouse 1 804 4.6
siblings child 2 1396 8.0
parent - child child 3 3082 17.7
parent - child in law child in law 4 1444 8.3
siblings in law child in law 5 1554 8.9
couple child in law 6 672 3.9
siblings sibling 7 660 3.8
siblings in law sibling in law 8 594 3.4
siblings sibling in law 9 20 .1
couple sibling in law 10 82 .5
child - parent (in law) parent 11 120 .7
grandparent - grandchild grandchild 12 193 1.1
grandparent - grandchild grandchild in law 13 84 .5
niece/nephew - uncle/aunt relative 14 340 2.0
kin relative 15 1042 6.0
couple relative 16 40 .2
neighbors neigbor 17 2044 11.7
couple neigbor 18 240 1.4
other non kin not a relative 19 2871 16.5
couple not a relative 20 114 .7----- -----
Total 17396 100.0
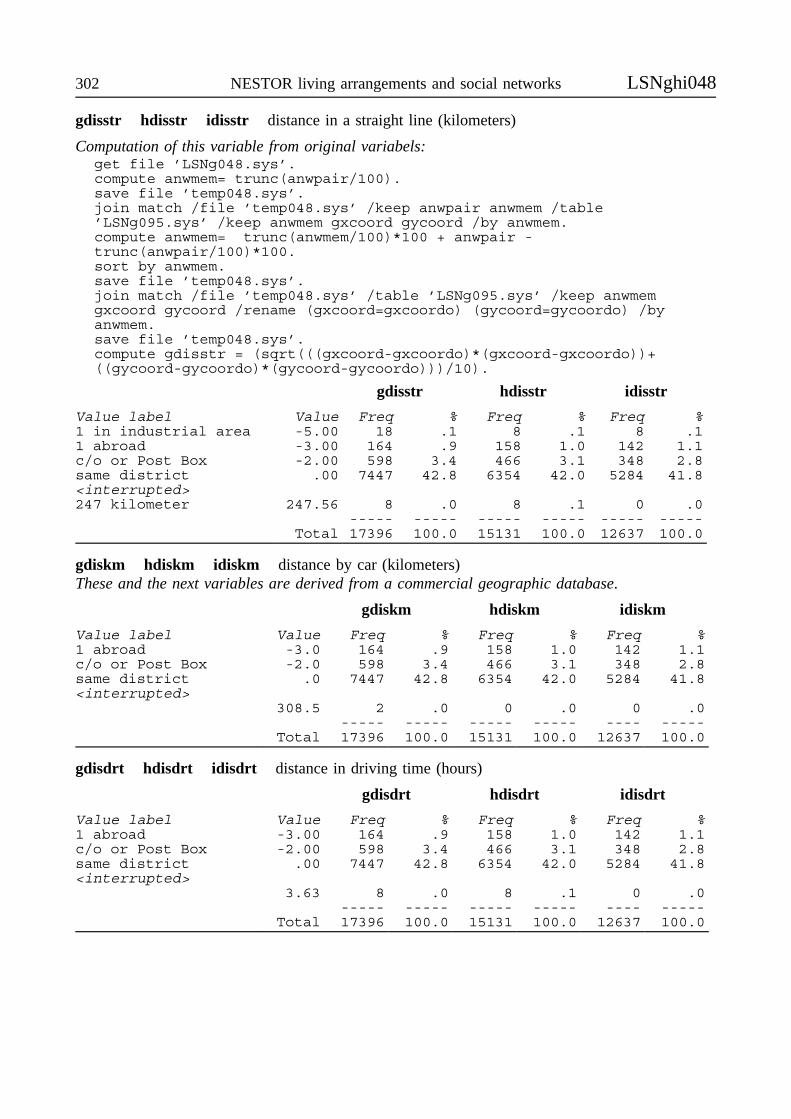
302 NESTOR living arrangements and social networks LSNghi048
gdisstr hdisstr idisstr distance in a straight line (kilometers)
Computation of this variable from original variabels:get file ’LSNg048.sys’.compute anwmem= trunc(anwpair/100).save file ’temp048.sys’.join match /file ’temp048.sys’ /keep anwpair anwmem /table’LSNg095.sys’ /keep anwmem gxcoord gycoord /by anwmem.compute anwmem= trunc(anwmem/100)*100 + anwpair -trunc(anwpair/100)*100.sort by anwmem.save file ’temp048.sys’.join match /file ’temp048.sys’ /table ’LSNg095.sys’ /keep anwmemgxcoord gycoord /rename (gxcoord=gxcoordo) (gycoord=gycoordo) /byanwmem.save file ’temp048.sys’.compute gdisstr = (sqrt(((gxcoord-gxcoordo)*(gxcoord-gxcoordo))+((gycoord-gycoordo)*(gycoord-gycoordo)))/10).
gdisstr hdisstr idisstr
Value label Value Freq % Freq % Freq %1 in industrial area -5.00 18 .1 8 .1 8 .11 abroad -3.00 164 .9 158 1.0 142 1.1c/o or Post Box -2.00 598 3.4 466 3.1 348 2.8same district .00 7447 42.8 6354 42.0 5284 41.8<interrupted>247 kilometer 247.56 8 .0 8 .1 0 .0
----- ----- ----- ----- ----- -----Total 17396 100.0 15131 100.0 12637 100.0
gdiskm hdiskm idiskm distance by car (kilometers)These and the next variables are derived from a commercial geographic database.
gdiskm hdiskm idiskm
Value label Value Freq % Freq % Freq %1 abroad -3.0 164 .9 158 1.0 142 1.1c/o or Post Box -2.0 598 3.4 466 3.1 348 2.8same district .0 7447 42.8 6354 42.0 5284 41.8<interrupted>
308.5 2 .0 0 .0 0 .0----- ----- ----- ----- ---- -----
Total 17396 100.0 15131 100.0 12637 100.0
gdisdrt hdisdrt idisdrt distance in driving time (hours)
gdisdrt hdisdrt idisdrt
Value label Value Freq % Freq % Freq %1 abroad -3.00 164 .9 158 1.0 142 1.1c/o or Post Box -2.00 598 3.4 466 3.1 348 2.8same district .00 7447 42.8 6354 42.0 5284 41.8<interrupted>
3.63 8 .0 8 .1 0 .0----- ----- ----- ----- ---- -----
Total 17396 100.0 15131 100.0 12637 100.0
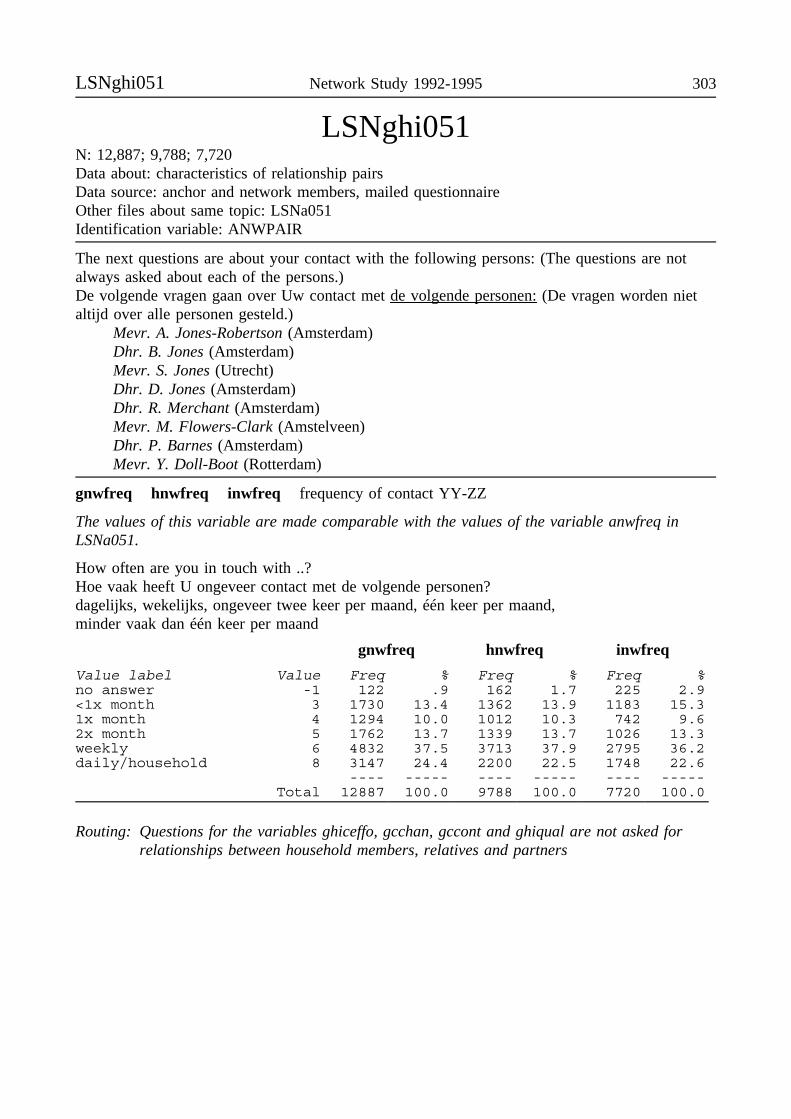
LSNghi051 Network Study 1992-1995 303
LSNghi051N: 12,887; 9,788; 7,720Data about: characteristics of relationship pairsData source: anchor and network members, mailed questionnaireOther files about same topic: LSNa051Identification variable: ANWPAIR
The next questions are about your contact with the following persons: (The questions are notalways asked about each of the persons.)De volgende vragen gaan over Uw contact met de volgende personen: (De vragen worden nietaltijd over alle personen gesteld.)
Mevr. A. Jones-Robertson (Amsterdam)Dhr. B. Jones (Amsterdam)Mevr. S. Jones (Utrecht)Dhr. D. Jones (Amsterdam)Dhr. R. Merchant (Amsterdam)Mevr. M. Flowers-Clark (Amstelveen)Dhr. P. Barnes (Amsterdam)Mevr. Y. Doll-Boot (Rotterdam)
gnwfreq hnwfreq inwfreq frequency of contact YY-ZZ
The values of this variable are made comparable with the values of the variable anwfreq inLSNa051.
How often are you in touch with ..?Hoe vaak heeft U ongeveer contact met de volgende personen?dagelijks, wekelijks, ongeveer twee keer per maand, één keer per maand,minder vaak dan één keer per maand
gnwfreq hnwfreq inwfreq
Value label Value Freq % Freq % Freq %no answer -1 122 .9 162 1.7 225 2.9<1x month 3 1730 13.4 1362 13.9 1183 15.31x month 4 1294 10.0 1012 10.3 742 9.62x month 5 1762 13.7 1339 13.7 1026 13.3weekly 6 4832 37.5 3713 37.9 2795 36.2daily/household 8 3147 24.4 2200 22.5 1748 22.6
---- ----- ---- ----- ---- -----Total 12887 100.0 9788 100.0 7720 100.0
Routing: Questions for the variables ghiceffo, gcchan, gccont and ghiqual are not asked forrelationships between household members, relatives and partners
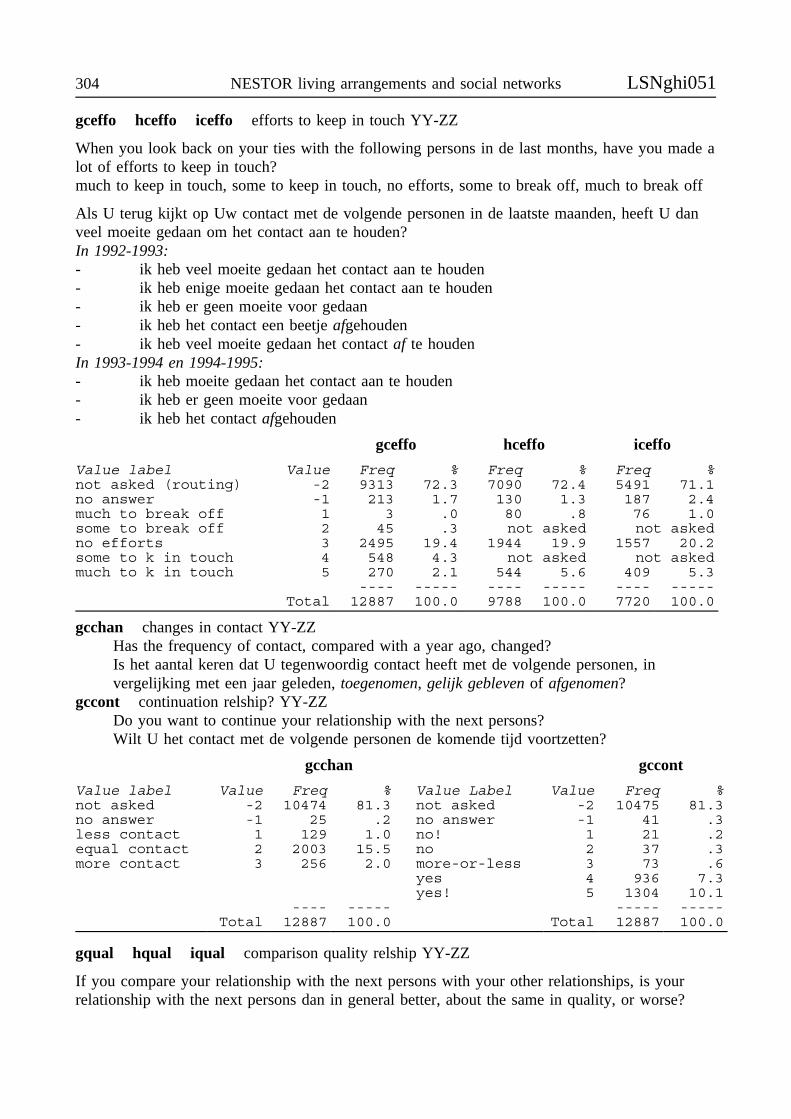
304 NESTOR living arrangements and social networks LSNghi051
gceffo hceffo iceffo efforts to keep in touch YY-ZZ
When you look back on your ties with the following persons in de last months, have you made alot of efforts to keep in touch?much to keep in touch, some to keep in touch, no efforts, some to break off, much to break off
Als U terug kijkt op Uw contact met de volgende personen in de laatste maanden, heeft U danveel moeite gedaan om het contact aan te houden?In 1992-1993:- ik heb veel moeite gedaan het contact aan te houden- ik heb enige moeite gedaan het contact aan te houden- ik heb er geen moeite voor gedaan- ik heb het contact een beetje afgehouden- ik heb veel moeite gedaan het contact af te houdenIn 1993-1994 en 1994-1995:- ik heb moeite gedaan het contact aan te houden- ik heb er geen moeite voor gedaan- ik heb het contact afgehouden
gceffo hceffo iceffo
Value label Value Freq % Freq % Freq %not asked (routing) -2 9313 72.3 7090 72.4 5491 71.1no answer -1 213 1.7 130 1.3 187 2.4much to break off 1 3 .0 80 .8 76 1.0some to break off 2 45 .3 not asked not askedno efforts 3 2495 19.4 1944 19.9 1557 20.2some to k in touch 4 548 4.3 not asked not askedmuch to k in touch 5 270 2.1 544 5.6 409 5.3
---- ----- ---- ----- ---- -----Total 12887 100.0 9788 100.0 7720 100.0
gcchan changes in contact YY-ZZHas the frequency of contact, compared with a year ago, changed?Is het aantal keren dat U tegenwoordig contact heeft met de volgende personen, invergelijking met een jaar geleden, toegenomen, gelijk gebleven of afgenomen?
gccont continuation relship? YY-ZZDo you want to continue your relationship with the next persons?Wilt U het contact met de volgende personen de komende tijd voortzetten?
gcchan gccont
Value label Value Freq % Value Label Value Freq %not asked -2 10474 81.3 not asked -2 10475 81.3no answer -1 25 .2 no answer -1 41 .3less contact 1 129 1.0 no! 1 21 .2equal contact 2 2003 15.5 no 2 37 .3more contact 3 256 2.0 more-or-less 3 73 .6
yes 4 936 7.3yes! 5 1304 10.1
---- ----- ----- -----Total 12887 100.0 Total 12887 100.0
gqual hqual iqual comparison quality relship YY-ZZ
If you compare your relationship with the next persons with your other relationships, is yourrelationship with the next persons dan in general better, about the same in quality, or worse?
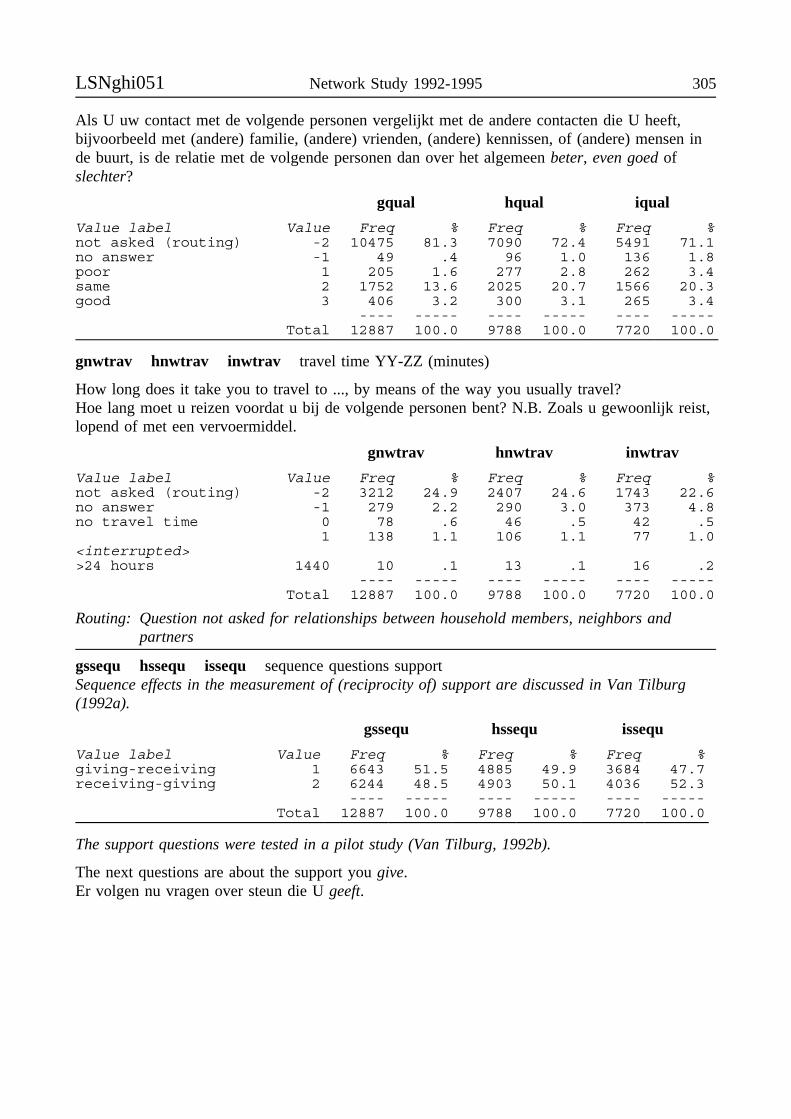
LSNghi051 Network Study 1992-1995 305
Als U uw contact met de volgende personen vergelijkt met de andere contacten die U heeft,bijvoorbeeld met (andere) familie, (andere) vrienden, (andere) kennissen, of (andere) mensen inde buurt, is de relatie met de volgende personen dan over het algemeen beter, even goed ofslechter?
gqual hqual iqual
Value label Value Freq % Freq % Freq %not asked (routing) -2 10475 81.3 7090 72.4 5491 71.1no answer -1 49 .4 96 1.0 136 1.8poor 1 205 1.6 277 2.8 262 3.4same 2 1752 13.6 2025 20.7 1566 20.3good 3 406 3.2 300 3.1 265 3.4
---- ----- ---- ----- ---- -----Total 12887 100.0 9788 100.0 7720 100.0
gnwtrav hnwtrav inwtrav travel time YY-ZZ (minutes)
How long does it take you to travel to ..., by means of the way you usually travel?Hoe lang moet u reizen voordat u bij de volgende personen bent? N.B. Zoals u gewoonlijk reist,lopend of met een vervoermiddel.
gnwtrav hnwtrav inwtrav
Value label Value Freq % Freq % Freq %not asked (routing) -2 3212 24.9 2407 24.6 1743 22.6no answer -1 279 2.2 290 3.0 373 4.8no travel time 0 78 .6 46 .5 42 .5
1 138 1.1 106 1.1 77 1.0<interrupted>>24 hours 1440 10 .1 13 .1 16 .2
---- ----- ---- ----- ---- -----Total 12887 100.0 9788 100.0 7720 100.0
Routing: Question not asked for relationships between household members, neighbors andpartners
gssequ hssequ issequ sequence questions supportSequence effects in the measurement of (reciprocity of) support are discussed in Van Tilburg(1992a).
gssequ hssequ issequ
Value label Value Freq % Freq % Freq %giving-receiving 1 6643 51.5 4885 49.9 3684 47.7receiving-giving 2 6244 48.5 4903 50.1 4036 52.3
---- ----- ---- ----- ---- -----Total 12887 100.0 9788 100.0 7720 100.0
The support questions were tested in a pilot study (Van Tilburg, 1992b).
The next questions are about the support you give.Er volgen nu vragen over steun die U geeft.
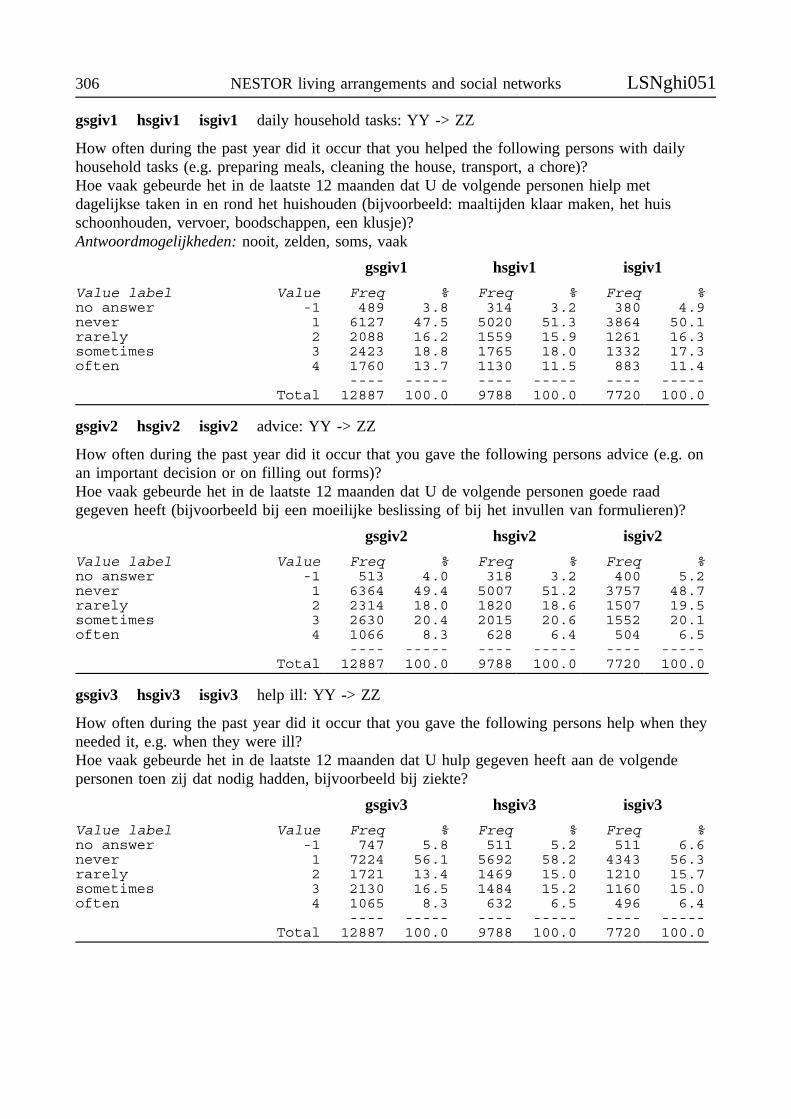
306 NESTOR living arrangements and social networks LSNghi051
gsgiv1 hsgiv1 isgiv1 daily household tasks: YY -> ZZ
How often during the past year did it occur that you helped the following persons with dailyhousehold tasks (e.g. preparing meals, cleaning the house, transport, a chore)?Hoe vaak gebeurde het in de laatste 12 maanden dat U de volgende personen hielp metdagelijkse taken in en rond het huishouden (bijvoorbeeld: maaltijden klaar maken, het huisschoonhouden, vervoer, boodschappen, een klusje)?Antwoordmogelijkheden: nooit, zelden, soms, vaak
gsgiv1 hsgiv1 isgiv1
Value label Value Freq % Freq % Freq %no answer -1 489 3.8 314 3.2 380 4.9never 1 6127 47.5 5020 51.3 3864 50.1rarely 2 2088 16.2 1559 15.9 1261 16.3sometimes 3 2423 18.8 1765 18.0 1332 17.3often 4 1760 13.7 1130 11.5 883 11.4
---- ----- ---- ----- ---- -----Total 12887 100.0 9788 100.0 7720 100.0
gsgiv2 hsgiv2 isgiv2 advice: YY -> ZZ
How often during the past year did it occur that you gave the following persons advice (e.g. onan important decision or on filling out forms)?Hoe vaak gebeurde het in de laatste 12 maanden dat U de volgende personen goede raadgegeven heeft (bijvoorbeeld bij een moeilijke beslissing of bij het invullen van formulieren)?
gsgiv2 hsgiv2 isgiv2
Value label Value Freq % Freq % Freq %no answer -1 513 4.0 318 3.2 400 5.2never 1 6364 49.4 5007 51.2 3757 48.7rarely 2 2314 18.0 1820 18.6 1507 19.5sometimes 3 2630 20.4 2015 20.6 1552 20.1often 4 1066 8.3 628 6.4 504 6.5
---- ----- ---- ----- ---- -----Total 12887 100.0 9788 100.0 7720 100.0
gsgiv3 hsgiv3 isgiv3 help ill: YY -> ZZ
How often during the past year did it occur that you gave the following persons help when theyneeded it, e.g. when they were ill?Hoe vaak gebeurde het in de laatste 12 maanden dat U hulp gegeven heeft aan de volgendepersonen toen zij dat nodig hadden, bijvoorbeeld bij ziekte?
gsgiv3 hsgiv3 isgiv3
Value label Value Freq % Freq % Freq %no answer -1 747 5.8 511 5.2 511 6.6never 1 7224 56.1 5692 58.2 4343 56.3rarely 2 1721 13.4 1469 15.0 1210 15.7sometimes 3 2130 16.5 1484 15.2 1160 15.0often 4 1065 8.3 632 6.5 496 6.4
---- ----- ---- ----- ---- -----Total 12887 100.0 9788 100.0 7720 100.0
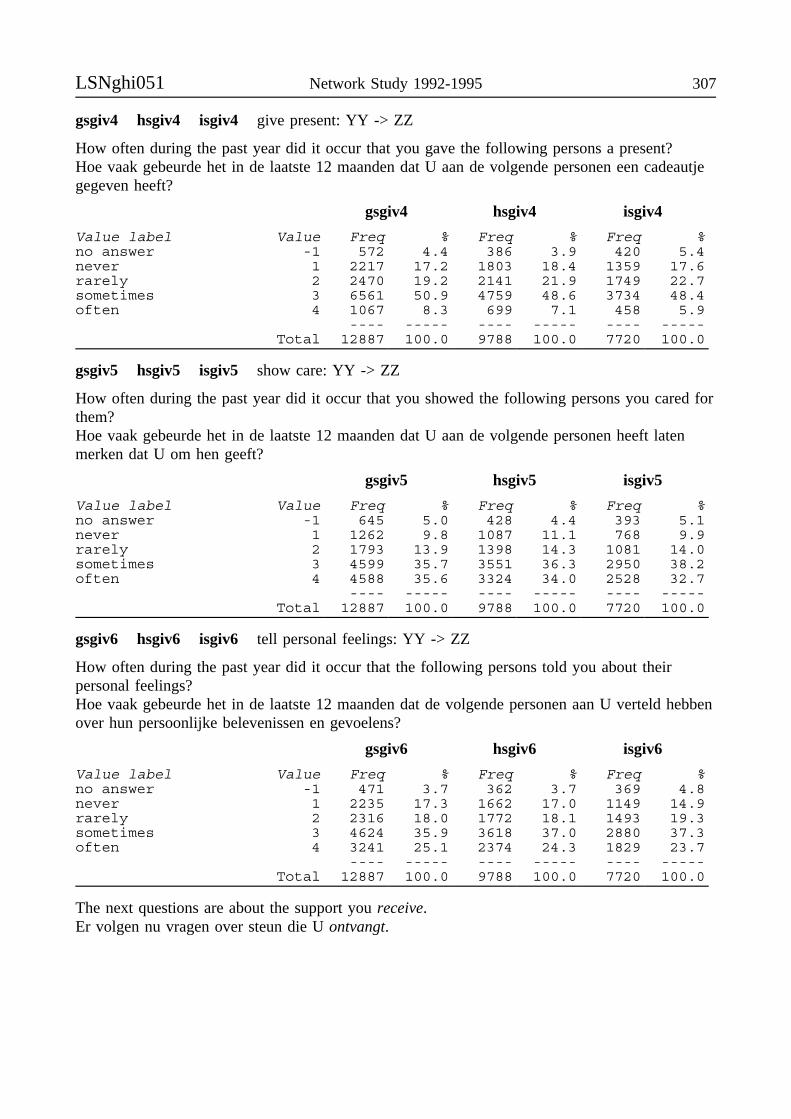
LSNghi051 Network Study 1992-1995 307
gsgiv4 hsgiv4 isgiv4 give present: YY -> ZZ
How often during the past year did it occur that you gave the following persons a present?Hoe vaak gebeurde het in de laatste 12 maanden dat U aan de volgende personen een cadeautjegegeven heeft?
gsgiv4 hsgiv4 isgiv4
Value label Value Freq % Freq % Freq %no answer -1 572 4.4 386 3.9 420 5.4never 1 2217 17.2 1803 18.4 1359 17.6rarely 2 2470 19.2 2141 21.9 1749 22.7sometimes 3 6561 50.9 4759 48.6 3734 48.4often 4 1067 8.3 699 7.1 458 5.9
---- ----- ---- ----- ---- -----Total 12887 100.0 9788 100.0 7720 100.0
gsgiv5 hsgiv5 isgiv5 show care: YY -> ZZ
How often during the past year did it occur that you showed the following persons you cared forthem?Hoe vaak gebeurde het in de laatste 12 maanden dat U aan de volgende personen heeft latenmerken dat U om hen geeft?
gsgiv5 hsgiv5 isgiv5
Value label Value Freq % Freq % Freq %no answer -1 645 5.0 428 4.4 393 5.1never 1 1262 9.8 1087 11.1 768 9.9rarely 2 1793 13.9 1398 14.3 1081 14.0sometimes 3 4599 35.7 3551 36.3 2950 38.2often 4 4588 35.6 3324 34.0 2528 32.7
---- ----- ---- ----- ---- -----Total 12887 100.0 9788 100.0 7720 100.0
gsgiv6 hsgiv6 isgiv6 tell personal feelings: YY -> ZZ
How often during the past year did it occur that the following persons told you about theirpersonal feelings?Hoe vaak gebeurde het in de laatste 12 maanden dat de volgende personen aan U verteld hebbenover hun persoonlijke belevenissen en gevoelens?
gsgiv6 hsgiv6 isgiv6
Value label Value Freq % Freq % Freq %no answer -1 471 3.7 362 3.7 369 4.8never 1 2235 17.3 1662 17.0 1149 14.9rarely 2 2316 18.0 1772 18.1 1493 19.3sometimes 3 4624 35.9 3618 37.0 2880 37.3often 4 3241 25.1 2374 24.3 1829 23.7
---- ----- ---- ----- ---- -----Total 12887 100.0 9788 100.0 7720 100.0
The next questions are about the support you receive.Er volgen nu vragen over steun die U ontvangt.

308 NESTOR living arrangements and social networks LSNghi051
gsrec1 hsrec1 isrec1 daily household tasks: YY <- ZZ
How often during the past year did it occur that the following persons helped you with dailyhousehold tasks (e.g. preparing meals, cleaning the house, transport, a chore)?Hoe vaak gebeurde het in de laatste 12 maanden dat de volgende personen U hielpen metdagelijkse taken in en rond het huishouden (bijvoorbeeld: maaltijden klaar maken, het huisschoonhouden, vervoer, boodschappen, een klusje)?
gsrec1 hsrec1 isrec1
Value label Value Freq % Freq % Freq %no answer -1 415 3.2 368 3.8 393 5.1never 1 6604 51.2 5486 56.0 4182 54.2rarely 2 1650 12.8 1253 12.8 1062 13.8sometimes 3 2389 18.5 1500 15.3 1175 15.2often 4 1829 14.2 1181 12.1 908 11.8
---- ----- ---- ----- ---- -----Total 12887 100.0 9788 100.0 7720 100.0
gsrec2 hsrec2 isrec2 advice: YY <- ZZ
How often during the past year did it occur that the following persons gave you advice (e.g. onan important decision or on filling out forms)?Hoe vaak gebeurde het in de laatste 12 maanden dat de volgende personen goede raad gegevenhebben aan U (bijvoorbeeld bij een moeilijke beslissing of bij het invullen van formulieren)?
gsrec2 hsrec2 isrec2
Value label Value Freq % Freq % Freq %no answer -1 450 3.5 334 3.4 406 5.3never 1 6759 52.4 5356 54.7 3957 51.3rarely 2 2005 15.6 1628 16.6 1390 18.0sometimes 3 2504 19.4 1780 18.2 1448 18.8often 4 1169 9.1 690 7.0 519 6.7
---- ----- ---- ----- ---- -----Total 12887 100.0 9788 100.0 7720 100.0
gsrec3 hsrec3 isrec3 help ill: YY <- ZZ
How often during the past year did it occur that the following persons gave you help when youneeded it, e.g. when you were ill?Hoe vaak gebeurde het in de laatste 12 maanden dat de volgende personen hulp gegeven hebbenaan U toen U dat nodig had, bijvoorbeeld bij ziekte?
gsrec3 hsrec3 isrec3
Value label Value Freq % Freq % Freq %no answer -1 859 6.7 576 5.9 584 7.6never 1 7092 55.0 5758 58.8 4402 57.0rarely 2 1476 11.5 1216 12.4 1004 13.0sometimes 3 2086 16.2 1432 14.6 1102 14.3often 4 1374 10.7 806 8.2 628 8.1
---- ----- ---- ----- ---- -----Total 12887 100.0 9788 100.0 7720 100.0
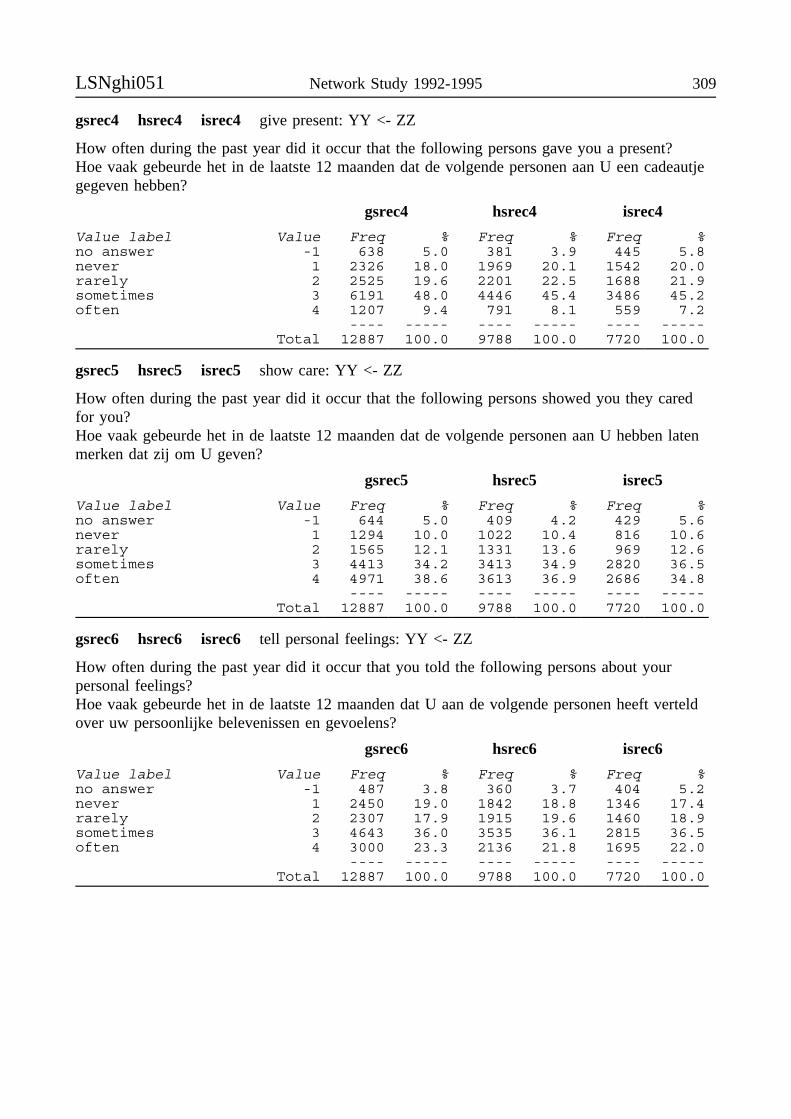
LSNghi051 Network Study 1992-1995 309
gsrec4 hsrec4 isrec4 give present: YY <- ZZ
How often during the past year did it occur that the following persons gave you a present?Hoe vaak gebeurde het in de laatste 12 maanden dat de volgende personen aan U een cadeautjegegeven hebben?
gsrec4 hsrec4 isrec4
Value label Value Freq % Freq % Freq %no answer -1 638 5.0 381 3.9 445 5.8never 1 2326 18.0 1969 20.1 1542 20.0rarely 2 2525 19.6 2201 22.5 1688 21.9sometimes 3 6191 48.0 4446 45.4 3486 45.2often 4 1207 9.4 791 8.1 559 7.2
---- ----- ---- ----- ---- -----Total 12887 100.0 9788 100.0 7720 100.0
gsrec5 hsrec5 isrec5 show care: YY <- ZZ
How often during the past year did it occur that the following persons showed you they caredfor you?Hoe vaak gebeurde het in de laatste 12 maanden dat de volgende personen aan U hebben latenmerken dat zij om U geven?
gsrec5 hsrec5 isrec5
Value label Value Freq % Freq % Freq %no answer -1 644 5.0 409 4.2 429 5.6never 1 1294 10.0 1022 10.4 816 10.6rarely 2 1565 12.1 1331 13.6 969 12.6sometimes 3 4413 34.2 3413 34.9 2820 36.5often 4 4971 38.6 3613 36.9 2686 34.8
---- ----- ---- ----- ---- -----Total 12887 100.0 9788 100.0 7720 100.0
gsrec6 hsrec6 isrec6 tell personal feelings: YY <- ZZ
How often during the past year did it occur that you told the following persons about yourpersonal feelings?Hoe vaak gebeurde het in de laatste 12 maanden dat U aan de volgende personen heeft verteldover uw persoonlijke belevenissen en gevoelens?
gsrec6 hsrec6 isrec6
Value label Value Freq % Freq % Freq %no answer -1 487 3.8 360 3.7 404 5.2never 1 2450 19.0 1842 18.8 1346 17.4rarely 2 2307 17.9 1915 19.6 1460 18.9sometimes 3 4643 36.0 3535 36.1 2815 36.5often 4 3000 23.3 2136 21.8 1695 22.0
---- ----- ---- ----- ---- -----Total 12887 100.0 9788 100.0 7720 100.0

310 NESTOR living arrangements and social networks LSNghi051
gsneed hsneed isneed ZZ needs support
Do you think that the following persons need social support?Vindt U dat de volgende personen steun kunnen gebruiken van mensen uit hun omgeving?ja, zeer veel; ja, een beetje; nauwelijks
gsneed hsneed isneed
Value label Value Freq % Freq % Freq %no answer -1 905 7.0 634 6.5 559 7.2scarcely 1 5779 44.8 4875 49.8 3854 49.9yes,some 2 4547 35.3 3190 32.6 2398 31.1yes,very much 3 1656 12.9 1089 11.1 909 11.8
---- ----- ---- ----- ---- -----Total 12887 100.0 9788 100.0 7720 100.0
gsinia hsinia isinia request ZZ or initiative YY
If you gave support in the last twelvemonths, did they ask for it, or was ityour initiative?- I did not gave support- predominantly on request of
her- predominantly on my initiative- sometimes on request,
sometimes on my initiative
Indien U aan de volgende personen in de laatste12 maanden steun heeft gegeven, heeft U dezesteun dan gegeven omdat de personen er om vroe-gen of heeft U de steun op eigen initiatief gegevenomdat U merkte dat zij steun nodig hadden?- ik heb geen steun gegeven- overwegend op verzoek van hem/haar- overwegend op mijn eigen initiatief- soms op verzoek, soms op mijn initiatief
gsinia hsinia isinia
Value label Value Freq % Freq % Freq %no answer -1 1039 8.1 861 8.8 706 9.1no support given 1 4727 36.7 3789 38.7 2900 37.6request ZZ, pred 2 920 7.1 701 7.2 612 7.9initiative YY, pred 3 2477 19.2 1588 16.2 1358 17.6request ZZ/ini YY 4 3724 28.9 2849 29.1 2144 27.8
---- ----- ---- ----- ---- -----Total 12887 100.0 9788 100.0 7720 100.0
LSNghi251N: 12,739; 9,687; 7,539Data about: supportive exchangesData source: systemOther files about same topic: LSNa051Selection of cases: with valid dataIdentification variable: ANWPAIR
LSNghi251 Network Study 1992-1995 311
gri hri iri instrumental support received
Computation of variable gri from original variables:if (gsrec1=-1 & gsrec2>0 & gsrec3>0 & gsrec2-gsrec3>=-1 &
gsrec2-gsrec3<=1) gsrec1=(gsrec2+gsrec3)/2.if (gsrec2=-1 & gsrec1>0 & gsrec3>0 & gsrec1-gsrec3>=-1 &
gsrec1-gsrec3<=1) gsrec2=(gsrec1+gsrec3)/2.if (gsrec3=-1 & gsrec2>0 & gsrec1>0 & gsrec2-gsrec1>=-1 &
gsrec2-gsrec1<=1) gsrec3=(gsrec2+gsrec1)/2.compute gri= gsrec1 + gsrec2 + gsrec3 .if (gsrec1=-1 | gsrec2=-1 | gsrec3=-1) gri=-1.
Psychometric properties (Loevingers H and Reliability ρ)
T1 T2 T3H ρ H ρ H ρ
all .63 .83 .66 .85 .68 .86anchors only .59 .80 .61 .82 .64 .83
gri hri iri
Value label Value Freq % Freq % Freq %missings -1.0 358 2.8 276 2.8 262 3.53x never 3.0 4632 36.4 3983 41.1 3031 40.2<interrupted>3x often 12.0 666 5.2 388 4.0 269 3.6
---- ----- ---- ----- ---- -----Total 12739 100.0 9687 100.0 7539 100.0
ggi hgi igi instrumental support given
Psychometric properties (Loevingers H and Reliability ρ)
T1 T2 T3H ρ H ρ H ρ
all .63 .82 .66 .84 .68 .85anchors only .59 .79 .61 .81 .63 .81
ggi hgi igi
Value label Value Freq % Freq % Freq %missings -1.0 417 3.3 273 2.8 251 3.33x never 3.0 4213 33.1 3577 36.9 2742 36.4<interrupted>3x often 12.0 524 4.1 303 3.1 239 3.2
---- ----- ---- ----- ---- -----Total 12739 100.0 9687 100.0 7539 100.0

312 NESTOR living arrangements and social networks LSNghi251
gre hre ire emotional support received
Psychometric properties (Loevingers H and Reliability ρ)
T1 T2 T3H ρ H ρ H ρ
all .62 .80 .64 .81 .66 .82anchors only .55 .76 .60 .79 .63 .80
gre hre ire
Value label Value Freq % Freq % Freq %missings -1.0 418 3.3 284 2.9 211 2.83x never 3.0 753 5.9 613 6.3 509 6.8<interrupted>3x often 12.0 834 6.5 535 5.5 395 5.2
---- ----- ---- ----- ---- -----Total 12739 100.0 9687 100.0 7539 100.0
gge hge ige emotional support given
Psychometric properties (Loevingers H and Reliability ρ)
T1 T2 T3H ρ H ρ H ρ
all .61 .80 .61 .79 .65 .81anchors only .56 .77 .55 .75 .60 .78
gge hge ige
Value label Value Freq % Freq % Freq %missings -1.0 419 3.3 311 3.2 209 2.83x never 3.0 672 5.3 568 5.9 453 6.0<interrupted>3x often 12.0 766 6.0 458 4.7 332 4.4
---- ----- ---- ----- ---- -----Total 12739 100.0 9687 100.0 7539 100.0
LSNghi055N: 4,059; 670; 594Data about: cooperation, response of Network StudyData source: systemOther files about same topic: LSNa055Selection of respondents: see LSNa001Identification variable: RESPNR
LSNghi055 Network Study 1992-1995 313
gnwcoop hnwcoop inwcoop cooperation
Cooperation means that at least one member returned the questionnaire.
gnwcoop hnwcoop inwcoop
Value label Value Freq % Freq % Freq %not eligible -2 15 .4not asked ftf interv -1 2497 61.5no coop nw92 + ftf 1 810 20.0no coop 92, coop ftf 2 64 1.6sent (coop ftf), no valid
Q’s returned3 19 .5 25 3.7 20 3.5
coop (coop ftf) 5 649 16.0 568 84.8 479 80.6coop (no coop ftf) 6 2 .0 1 .1 1 .2Tx-1: network refusal by A 11 23 3.4 26 4.4Tx-1: too little response 12 15 2.2 25 4.2refusal via LASA 13 16 2.4 1anchor died 14 2 .0 21 3.1 21 3.5partner died, problems 15 1 .1empty network 16 1 .0A severe ill 17 5 .8no response A at T1 and T2 18 14 2.4double network 19 1 .2A does not know network
members20 1 .2
---- ----- ---- ----- ---- -----Total 4059 100.0 670 100.0 594 100.0
gsizeq hsizeq isizeq # Q sent
gsizeq hsizeq isizeq
Value label Value Freq % Freq % Freq %not eligible -5 15 .4 0 .0 0 .0not asked ftf -4 2497 61.5 0 .0 0 .0no cooperation -3 874 21.5 55 8.2 73 12.3anchor died -2 2 .0 21 3.1 21 3.5sent to 1 member 1 1 .0 0 .0 20 3.4<interrupted>sent to 9 memb (max) 9 200 4.9 163 24.3 31 5.2
---- ----- ---- ----- ---- -----Total 4059 100.0 670 100.0 594 100.0
gsizer hsizer isizer # Q returnedgsizer hsizer isizer
Value label Value Freq % Freq % Freq %not eligible -5 15 .4 0 .0 0 .0not asked ftf -4 2497 61.5 0 .0 0 .0no cooperation -3 874 21.5 55 8.2 73 12.3anchor died -2 2 .0 21 3.1 21 3.5no returns 0 19 .5 25 3.7 20 3.4returned from 1 memb 1 34 .8 52 7.8 58 9.8<interrupted>returned from 9 memb 9 47 1.2 21 3.1 10 1.7
---- ----- ---- ----- ---- -----Total 4059 100.0 670 100.0 594 100.0
ganchor hanchor ianchor anchor returnedganchor hanchor ianchor
Value label Value Freq % Freq % Freq %not eligible -5 15 .4 0 .0 0 .0
314 NESTOR living arrangements and social networks LSNghi055
not asked ftf -4 2497 61.5 0 .0 0 .0no cooperation -3 874 21.5 55 8.2 73 12.3anchor died -2 2 .0 21 3.1 21 3.5no return by anchor 0 91 2.2 133 19.9 104 17.5anchor returned 1 580 14.3 461 68.8 396 66.7
---- ----- ---- ----- ---- -----Total 4059 100.0 670 100.0 594 100.0
gpctdat hpctdat ipctdat response rate within networks (% data / #relationships)gpctdat hpctdat ipctdat
Value label Value Freq % Freq % Freq %not eligible -5.00 15 .4 0 .0 0 .0not asked ftf -4.00 2497 61.5 0 .0 0 .0not sent Tx -3.00 874 21.5 55 8.2 73 12.3anchor died -2.00 2 .0 21 3.1 21 3.5no relationships -1.00 1 .0 2 .3 0 .0no data at all .00 20 .5 26 3.9 21 3.5<interrupted>complete data 100.00 176 4.3 81 12.1 68 11.4
---- ----- ---- ----- ---- -----Total 4059 100.0 670 100.0 594 100.0
LSNghi072N: 3,182; 2,350; 1,877Data about: life eventsData source: anchor and network members, mailed questionnaireIdentification variable: ANWMEM
gev experienced life event
Did you experience a life event inthe last twelve months?1 movement2 birth (grand)child3 retirement4 new job5 severe illness /hospitalization
of you6 severe illness/hospital of
partner7 severe illness/hospital of kin8 death9 a marriage (eg of children)10 a divorce11 otherIf an event happened, please describeshortly what happened, whoexperienced the event, and in whichmonth the event happened.
Heeft U in de laatste 12 maanden een ingrijpendegebeurtenis meegemaakt?1 verhuizing2 de geboorte van een kind of kleinkind3 pensionering4 een nieuwe baan5 ernstige ziekte van U, opname in het ziekenhuis6 ernstig ziek worden van de echtgenote/partner7 ernstig ziek worden van een nabij familielid,
namelijk ... (bijv.: vader, moeder, zoon, dochter,zus, broer)
8 overlijden van iemand in uw naaste omgeving,namelijk ...
9 een huwelijk, bijvoorbeeld van uw zoon ofdochter
10 een echtscheiding11 anders, namelijk ...Indien een gebeurtenis heeft plaats gevonden, kunt Ukort omschrijven wat er is gebeurd, wie het betrof, enin welke maand deze gebeurtenis plaatsvond?
LSNghi072 Network Study 1992-1995 315
Value label Value Freq %none 0 1362 42.8movement 1 86 2.7birth (grand)child 10 146 4.6
11 5 .2retirement 100 34 1.1<interrupted>
11100000001 1 .0---- -----
Total 3182 100.0
gev7t type person event 7gev8t type person event 8
gev7t gev8tValue label Value Freq % Freq %no event -2 2757 86.6 2570 80.8no answer -1 46 1.4 30 .9spouse/partner 1 2 .1 25 .8<interrupted>other 13 3 .1 30 .9
---- ----- ---- -----Total 3182 100.0 3182 100.0
gev7s sex person event 7gev8s sex person event 8
gev7s gev8sValue label Value Freq % Freq %no event -2 2757 86.6 2570 80.8no answer -1 48 1.5 68 2.1male 1 203 6.4 330 10.4female 2 174 5.5 214 6.7
---- ----- ---- -----Total 3182 100.0 3182 100.0
Life events in the last twelve months.Belangrijke gebeurtenissen kunnen een grote invloed hebben op het welbevinden, en op degezondheid van mensen. Met de volgende vragen willen we nagaan of er de afgelopen twaalfmaanden een grote verandering is geweest in uw leven. Wilt u achter de gebeurtenis diegenoemd wordt aangeven of u dit de laatste twaalf maanden hebt meegemaakt. Indien er iets isveranderd, wilt u dan aangeven in welke maand dit is gebeurd?
hev21 iev21 month:movementVerhuizing nee/ja Indien ja, in welke maand?hev22 iev22 month:move to institutionOpname in een verzorgingstehuis of verpleeghuis nee/ja Indien ja, in welke maand?
hev21 iev21 hev22 iev22
Value label Value Freq % Freq % Freq % Freq %no answer event -3 51 2.2 51 2.7 66 2.8 69 3.7no event -2 2158 91.8 1718 91.5 2248 95.7 1773 94.5no answer month -1 4 .2 4 .2 8 .3 5 .3january 1 8 .3 7 .4 3 .1 3 .2<interrupted>december 12 16 .7 11 .6 2 .1 2 .1
---- ----- ---- ----- ---- ----- ---- -----Total 2350 100.0 1877 100.0 2350 100.0 1877 100.0
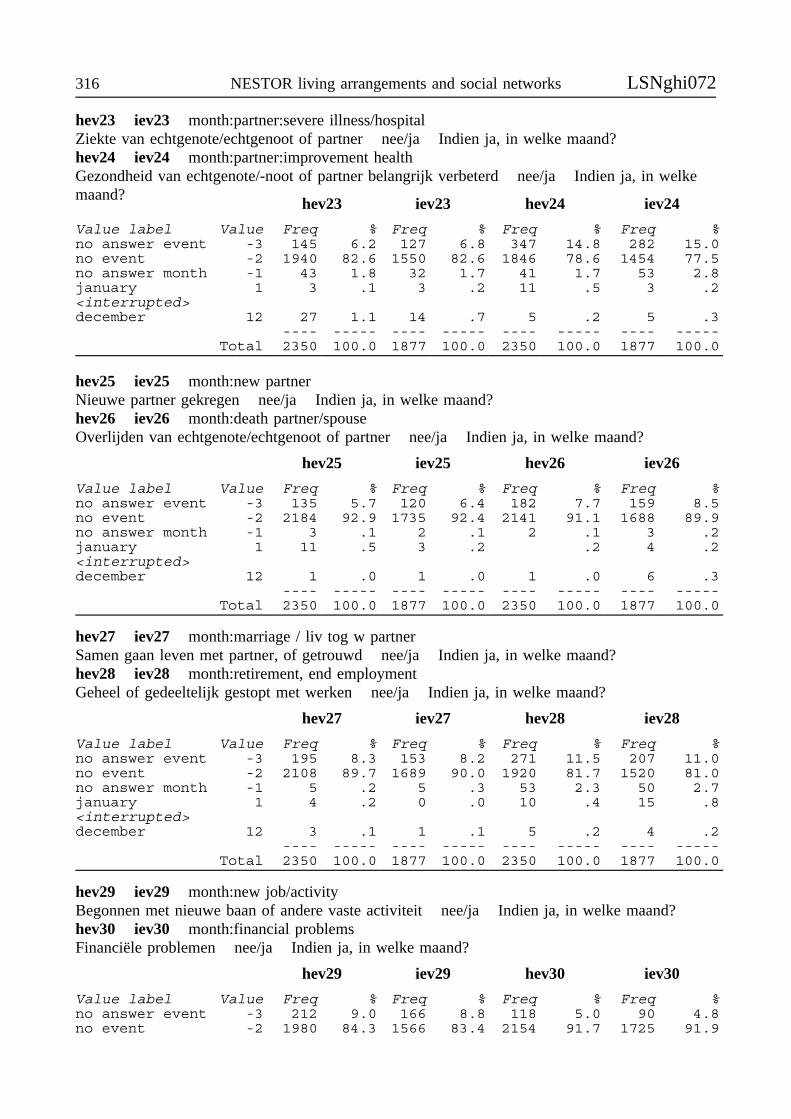
316 NESTOR living arrangements and social networks LSNghi072
hev23 iev23 month:partner:severe illness/hospitalZiekte van echtgenote/echtgenoot of partner nee/ja Indien ja, in welke maand?hev24 iev24 month:partner:improvement healthGezondheid van echtgenote/-noot of partner belangrijk verbeterd nee/ja Indien ja, in welkemaand?
hev23 iev23 hev24 iev24
Value label Value Freq % Freq % Freq % Freq %no answer event -3 145 6.2 127 6.8 347 14.8 282 15.0no event -2 1940 82.6 1550 82.6 1846 78.6 1454 77.5no answer month -1 43 1.8 32 1.7 41 1.7 53 2.8january 1 3 .1 3 .2 11 .5 3 .2<interrupted>december 12 27 1.1 14 .7 5 .2 5 .3
---- ----- ---- ----- ---- ----- ---- -----Total 2350 100.0 1877 100.0 2350 100.0 1877 100.0
hev25 iev25 month:new partnerNieuwe partner gekregen nee/ja Indien ja, in welke maand?hev26 iev26 month:death partner/spouseOverlijden van echtgenote/echtgenoot of partner nee/ja Indien ja, in welke maand?
hev25 iev25 hev26 iev26
Value label Value Freq % Freq % Freq % Freq %no answer event -3 135 5.7 120 6.4 182 7.7 159 8.5no event -2 2184 92.9 1735 92.4 2141 91.1 1688 89.9no answer month -1 3 .1 2 .1 2 .1 3 .2january 1 11 .5 3 .2 .2 4 .2<interrupted>december 12 1 .0 1 .0 1 .0 6 .3
---- ----- ---- ----- ---- ----- ---- -----Total 2350 100.0 1877 100.0 2350 100.0 1877 100.0
hev27 iev27 month:marriage / liv tog w partnerSamen gaan leven met partner, of getrouwd nee/ja Indien ja, in welke maand?hev28 iev28 month:retirement, end employmentGeheel of gedeeltelijk gestopt met werken nee/ja Indien ja, in welke maand?
hev27 iev27 hev28 iev28
Value label Value Freq % Freq % Freq % Freq %no answer event -3 195 8.3 153 8.2 271 11.5 207 11.0no event -2 2108 89.7 1689 90.0 1920 81.7 1520 81.0no answer month -1 5 .2 5 .3 53 2.3 50 2.7january 1 4 .2 0 .0 10 .4 15 .8<interrupted>december 12 3 .1 1 .1 5 .2 4 .2
---- ----- ---- ----- ---- ----- ---- -----Total 2350 100.0 1877 100.0 2350 100.0 1877 100.0
hev29 iev29 month:new job/activityBegonnen met nieuwe baan of andere vaste activiteit nee/ja Indien ja, in welke maand?hev30 iev30 month:financial problemsFinanciële problemen nee/ja Indien ja, in welke maand?
hev29 iev29 hev30 iev30
Value label Value Freq % Freq % Freq % Freq %no answer event -3 212 9.0 166 8.8 118 5.0 90 4.8no event -2 1980 84.3 1566 83.4 2154 91.7 1725 91.9
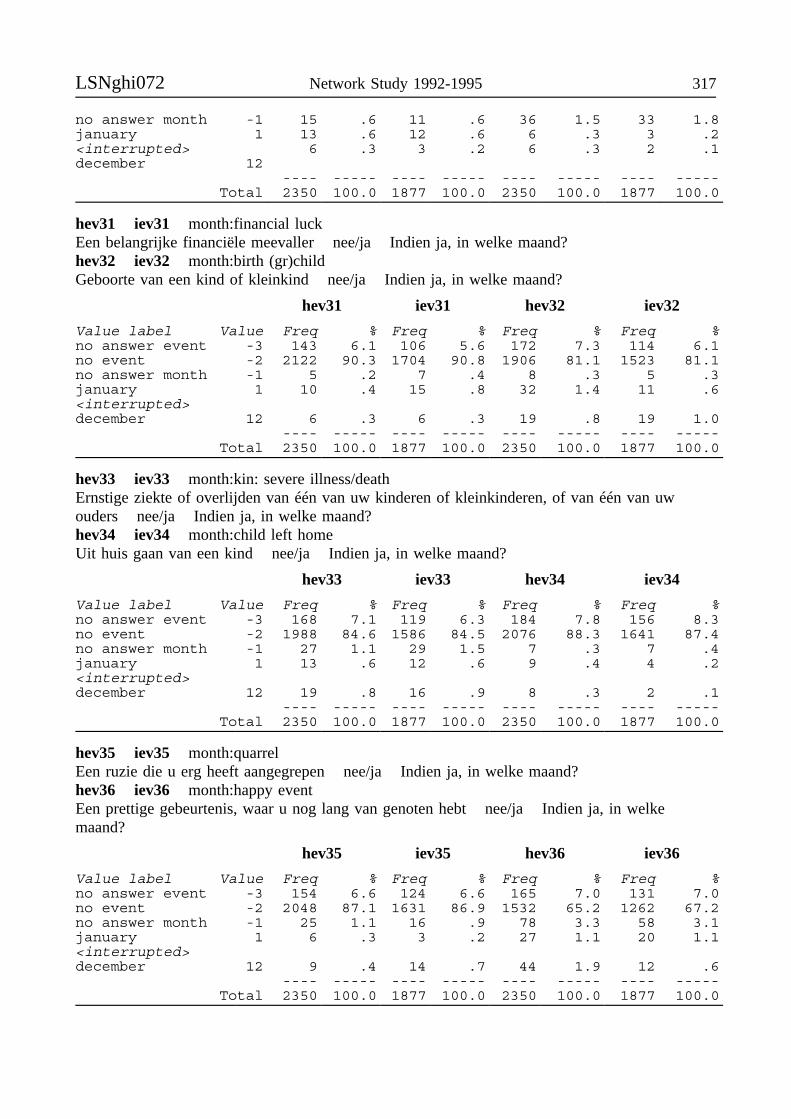
LSNghi072 Network Study 1992-1995 317
no answer month -1 15 .6 11 .6 36 1.5 33 1.8january 1 13 .6 12 .6 6 .3 3 .2<interrupted> 6 .3 3 .2 6 .3 2 .1december 12
---- ----- ---- ----- ---- ----- ---- -----Total 2350 100.0 1877 100.0 2350 100.0 1877 100.0
hev31 iev31 month:financial luckEen belangrijke financiële meevaller nee/ja Indien ja, in welke maand?hev32 iev32 month:birth (gr)childGeboorte van een kind of kleinkind nee/ja Indien ja, in welke maand?
hev31 iev31 hev32 iev32
Value label Value Freq % Freq % Freq % Freq %no answer event -3 143 6.1 106 5.6 172 7.3 114 6.1no event -2 2122 90.3 1704 90.8 1906 81.1 1523 81.1no answer month -1 5 .2 7 .4 8 .3 5 .3january 1 10 .4 15 .8 32 1.4 11 .6<interrupted>december 12 6 .3 6 .3 19 .8 19 1.0
---- ----- ---- ----- ---- ----- ---- -----Total 2350 100.0 1877 100.0 2350 100.0 1877 100.0
hev33 iev33 month:kin: severe illness/deathErnstige ziekte of overlijden van één van uw kinderen of kleinkinderen, of van één van uwouders nee/ja Indien ja, in welke maand?hev34 iev34 month:child left homeUit huis gaan van een kind nee/ja Indien ja, in welke maand?
hev33 iev33 hev34 iev34
Value label Value Freq % Freq % Freq % Freq %no answer event -3 168 7.1 119 6.3 184 7.8 156 8.3no event -2 1988 84.6 1586 84.5 2076 88.3 1641 87.4no answer month -1 27 1.1 29 1.5 7 .3 7 .4january 1 13 .6 12 .6 9 .4 4 .2<interrupted>december 12 19 .8 16 .9 8 .3 2 .1
---- ----- ---- ----- ---- ----- ---- -----Total 2350 100.0 1877 100.0 2350 100.0 1877 100.0
hev35 iev35 month:quarrelEen ruzie die u erg heeft aangegrepen nee/ja Indien ja, in welke maand?hev36 iev36 month:happy eventEen prettige gebeurtenis, waar u nog lang van genoten hebt nee/ja Indien ja, in welkemaand?
hev35 iev35 hev36 iev36
Value label Value Freq % Freq % Freq % Freq %no answer event -3 154 6.6 124 6.6 165 7.0 131 7.0no event -2 2048 87.1 1631 86.9 1532 65.2 1262 67.2no answer month -1 25 1.1 16 .9 78 3.3 58 3.1january 1 6 .3 3 .2 27 1.1 20 1.1<interrupted>december 12 9 .4 14 .7 44 1.9 12 .6
---- ----- ---- ----- ---- ----- ---- -----Total 2350 100.0 1877 100.0 2350 100.0 1877 100.0
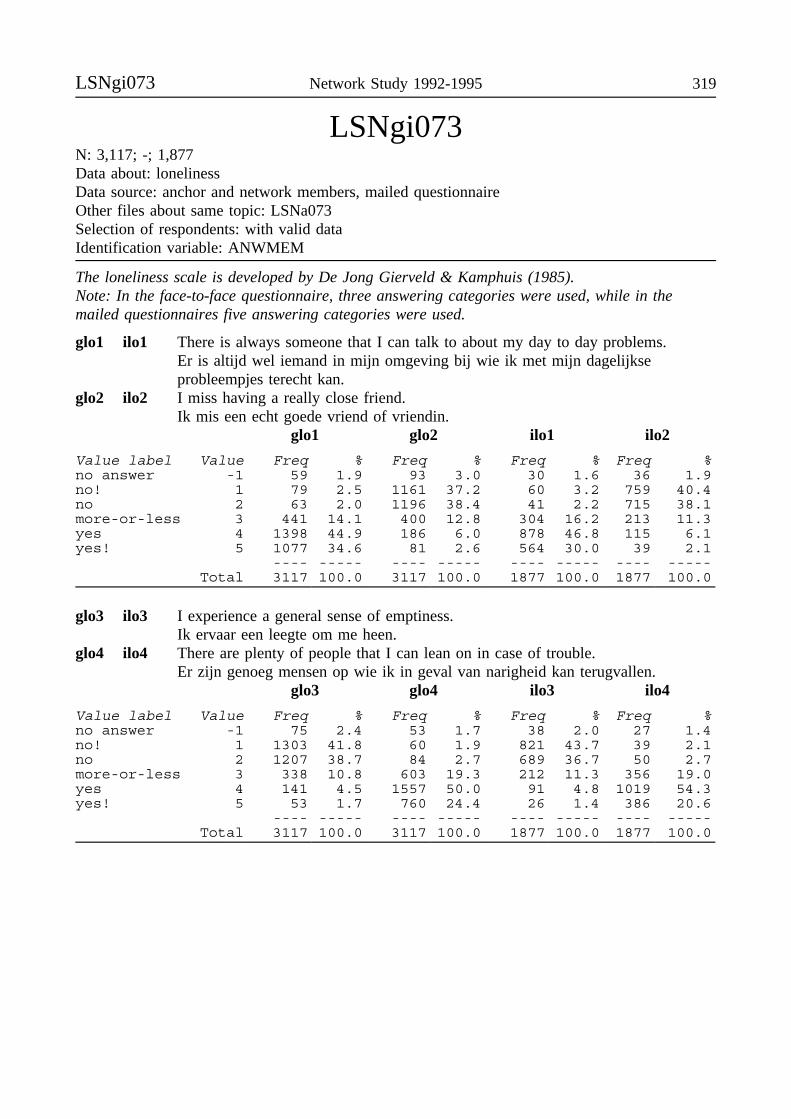
LSNgi073 Network Study 1992-1995 319
LSNgi073N: 3,117; -; 1,877Data about: lonelinessData source: anchor and network members, mailed questionnaireOther files about same topic: LSNa073Selection of respondents: with valid dataIdentification variable: ANWMEM
The loneliness scale is developed by De Jong Gierveld & Kamphuis (1985).Note: In the face-to-face questionnaire, three answering categories were used, while in themailed questionnaires five answering categories were used.
glo1 ilo1 There is always someone that I can talk to about my day to day problems.Er is altijd wel iemand in mijn omgeving bij wie ik met mijn dagelijkseprobleempjes terecht kan.
glo2 ilo2 I miss having a really close friend.Ik mis een echt goede vriend of vriendin.
glo1 glo2 ilo1 ilo2
Value label Value Freq % Freq % Freq % Freq %no answer -1 59 1.9 93 3.0 30 1.6 36 1.9no! 1 79 2.5 1161 37.2 60 3.2 759 40.4no 2 63 2.0 1196 38.4 41 2.2 715 38.1more-or-less 3 441 14.1 400 12.8 304 16.2 213 11.3yes 4 1398 44.9 186 6.0 878 46.8 115 6.1yes! 5 1077 34.6 81 2.6 564 30.0 39 2.1
---- ----- ---- ----- ---- ----- ---- -----Total 3117 100.0 3117 100.0 1877 100.0 1877 100.0
glo3 ilo3 I experience a general sense of emptiness.Ik ervaar een leegte om me heen.
glo4 ilo4 There are plenty of people that I can lean on in case of trouble.Er zijn genoeg mensen op wie ik in geval van narigheid kan terugvallen.
glo3 glo4 ilo3 ilo4
Value label Value Freq % Freq % Freq % Freq %no answer -1 75 2.4 53 1.7 38 2.0 27 1.4no! 1 1303 41.8 60 1.9 821 43.7 39 2.1no 2 1207 38.7 84 2.7 689 36.7 50 2.7more-or-less 3 338 10.8 603 19.3 212 11.3 356 19.0yes 4 141 4.5 1557 50.0 91 4.8 1019 54.3yes! 5 53 1.7 760 24.4 26 1.4 386 20.6
---- ----- ---- ----- ---- ----- ---- -----Total 3117 100.0 3117 100.0 1877 100.0 1877 100.0
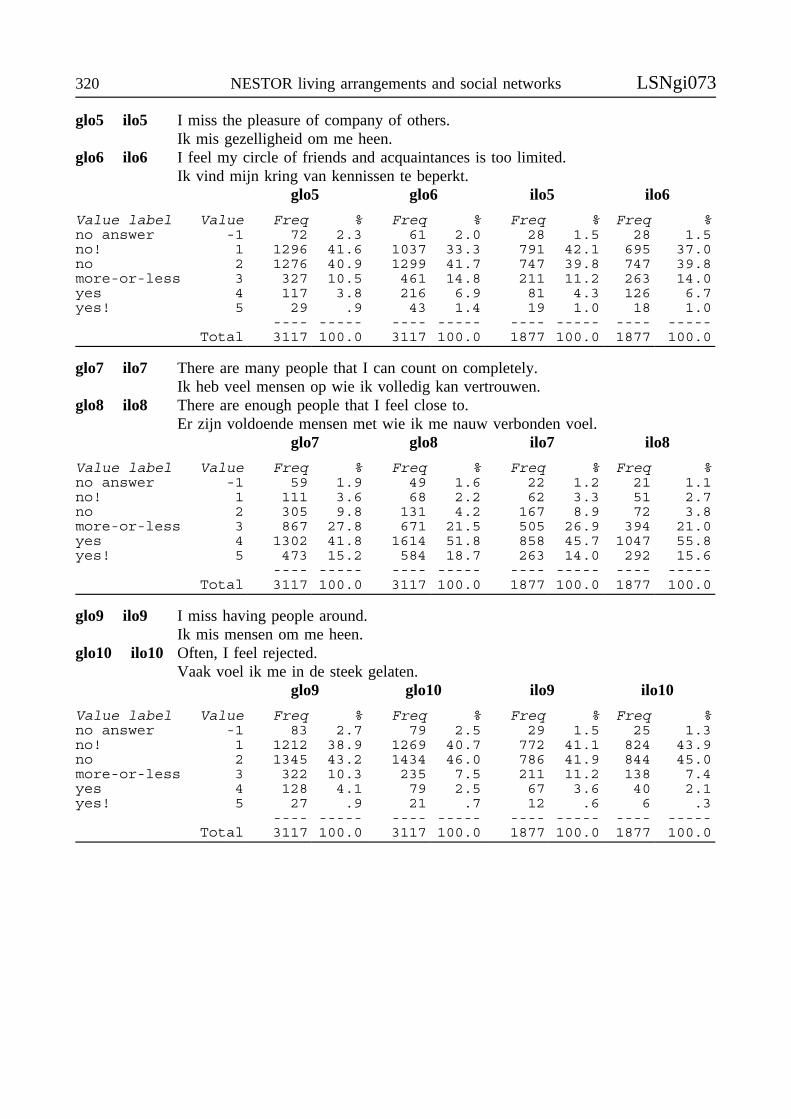
320 NESTOR living arrangements and social networks LSNgi073
glo5 ilo5 I miss the pleasure of company of others.Ik mis gezelligheid om me heen.
glo6 ilo6 I feel my circle of friends and acquaintances is too limited.Ik vind mijn kring van kennissen te beperkt.
glo5 glo6 ilo5 ilo6
Value label Value Freq % Freq % Freq % Freq %no answer -1 72 2.3 61 2.0 28 1.5 28 1.5no! 1 1296 41.6 1037 33.3 791 42.1 695 37.0no 2 1276 40.9 1299 41.7 747 39.8 747 39.8more-or-less 3 327 10.5 461 14.8 211 11.2 263 14.0yes 4 117 3.8 216 6.9 81 4.3 126 6.7yes! 5 29 .9 43 1.4 19 1.0 18 1.0
---- ----- ---- ----- ---- ----- ---- -----Total 3117 100.0 3117 100.0 1877 100.0 1877 100.0
glo7 ilo7 There are many people that I can count on completely.Ik heb veel mensen op wie ik volledig kan vertrouwen.
glo8 ilo8 There are enough people that I feel close to.Er zijn voldoende mensen met wie ik me nauw verbonden voel.
glo7 glo8 ilo7 ilo8
Value label Value Freq % Freq % Freq % Freq %no answer -1 59 1.9 49 1.6 22 1.2 21 1.1no! 1 111 3.6 68 2.2 62 3.3 51 2.7no 2 305 9.8 131 4.2 167 8.9 72 3.8more-or-less 3 867 27.8 671 21.5 505 26.9 394 21.0yes 4 1302 41.8 1614 51.8 858 45.7 1047 55.8yes! 5 473 15.2 584 18.7 263 14.0 292 15.6
---- ----- ---- ----- ---- ----- ---- -----Total 3117 100.0 3117 100.0 1877 100.0 1877 100.0
glo9 ilo9 I miss having people around.Ik mis mensen om me heen.
glo10 ilo10 Often, I feel rejected.Vaak voel ik me in de steek gelaten.
glo9 glo10 ilo9 ilo10
Value label Value Freq % Freq % Freq % Freq %no answer -1 83 2.7 79 2.5 29 1.5 25 1.3no! 1 1212 38.9 1269 40.7 772 41.1 824 43.9no 2 1345 43.2 1434 46.0 786 41.9 844 45.0more-or-less 3 322 10.3 235 7.5 211 11.2 138 7.4yes 4 128 4.1 79 2.5 67 3.6 40 2.1yes! 5 27 .9 21 .7 12 .6 6 .3
---- ----- ---- ----- ---- ----- ---- -----Total 3117 100.0 3117 100.0 1877 100.0 1877 100.0
LSNgi073 Network Study 1992-1995 321
glo11 ilo11 I can call on my friends whenever I need them.Wanneer ik daar behoefte aan heb kan ik altijd bij mijn vrienden terecht.
glo11 ilo11
Value label Value Freq % Freq %no answer -1 103 3.3 28 1.5no! 1 75 2.4 42 2.2no 2 137 4.4 79 4.2more-or-less 3 744 23.9 439 23.4yes 4 1533 49.2 985 52.5yes! 5 525 16.8 304 16.2
---- ----- ---- -----Total 3117 100.0 1877 100.0
LSNgi273N: 2,976; -; 1,829Data about: lonelinessData source: systemOther files about same topic: LSNgi073, LSNa273Selection of respondents: less than two items with missing valuesIdentification variable: ANWMEM
glo ilo loneliness <11 items dichotomous>
Computation of variable glo from original variables:count glo= glo1 glo4 glo7 glo8 glo11 (1,2,3)
glo2 glo3 glo5 glo6 glo9 glo10 (3,4,5).count mis= glo1 to glo11 (-1).select if (mis<2).
glo ilo
Value label Value Freq % Freq %no loneliness 0 1008 33.9 663 36.2<interrupted>severe loneliness 11 39 1.3 26 1.4
---- ----- ---- -----Total 2976 100.0 1829 100.0
gloo iloo loneliness 11 items ordinal
Computation of variable gloo from original variables:count mis= glo1 to glo11 (-1).select if (mis<2).recode glo1 glo4 glo7 glo8 glo11 (5=1)(4=2)(2=4)(1=5).recode glo1 to glo11 (1,2=1)(3=2)(4,5=3).* missing values are replaced by the mean of the valid values.compute gloo=glo1+glo2+glo3+glo4+glo5+glo6+glo7+glo8+glo9+glo10+glo11.
322 NESTOR living arrangements and social networks LSNgi273
gloo iloo
Value label Value Freq % Freq %no loneliness 11.0 978 32.9 647 35.4<interrupted>severe loneliness 33.0 3 .1 3 .2
---- ----- ---- -----Total 2976 100.0 1829 100.0
Psychometric properties (Loevingers H and Reliability ρ)
glo T1 ilo T3 gloo T1 iloo T3H ρ H ρ H ρ H ρ
all .45 .87 .46 .88 .44 .88 .44 .88anchors only .45 .87 .43 .89 .45 .89 .42 .89
LSNghi075N: 3,094; 2,358; 1,884Data about: exchange / communal orientationData source: anchor and network members, mailed questionnaireOther files about same topic: LSNa075Selection of respondents: with valid dataIdentification variable: ANWMEM
Based on a scale developed by Clark et al (1987).
gec1 hec1 iec1 It bothers me when other people neglect my needs.Het stoort me wanneer andere mensen geen rekening houden met wat iknodig heb.
gec1 hec1 iec1
Value label Value Freq % Freq % Freq %no answer -1 64 2.1 58 2.5 31 1.6no! 1 429 13.9 348 14.8 302 16.0no 2 609 19.7 346 14.7 350 18.6more-or-less 3 1236 39.9 1164 49.4 764 40.6yes 4 639 20.7 374 15.9 381 20.2yes! 5 117 3.8 68 2.9 56 3.0
---- ----- ---- ----- ---- -----Total 3094 100.0 2358 100.0 1884 100.0
LSNghi075 Network Study 1992-1995 323
gec2 hec2 iec2 When someone I know helps me out on a project, I feel I have to pay themback.Als iemand me ergens mee helpt, voel ik me verplicht om iets terug tedoen.
gec2 hec2 iec2
Value label Value Freq % Freq % Freq %no answer -1 31 1.0 20 .8 12 .6no! 1 312 10.1 272 11.5 247 13.1no 2 628 20.3 399 16.9 339 18.0more-or-less 3 1357 43.9 1240 52.6 917 48.7yes 4 646 20.9 384 16.3 338 17.9yes! 5 120 3.9 43 1.8 31 1.6
---- ----- ---- ----- ---- -----Total 3094 100.0 2358 100.0 1884 100.0
gec3 hec3 iec3 When making a decision, I take other people’s needs and feelings intoaccount.Als ik een beslissing neem, houd ik rekening met de wensen en gevoelensvan andere betrokkenen.
gec3 hec3 iec3
Value label Value Freq % Freq % Freq %no answer -1 29 .9 30 1.3 15 .8no! 1 38 1.2 43 1.8 33 1.8no 2 44 1.4 17 .7 13 .7more-or-less 3 771 24.9 718 30.4 451 23.9yes 4 1777 57.4 1290 54.7 1172 62.2yes! 5 435 14.1 260 11.0 200 10.6
---- ----- ---- ----- ---- -----Total 3094 100.0 2358 100.0 1884 100.0
gec4 hec4 iec4 I would feel exploited if someone failed to repay me for a favor.Ik zou me misbruikt voelen, als iemand die ik geholpen heb, niets terugdeed.
gec4 hec4 iec4
Value label Value Freq % Freq % Freq %no answer -1 29 .9 16 .7 14 .7no! 1 1197 38.7 1050 44.5 815 43.3no 2 1302 42.1 991 42.0 844 44.8more-or-less 3 452 14.6 263 11.2 179 9.5yes 4 86 2.8 30 1.3 29 1.5yes! 5 28 .9 8 .3 3 .2
---- ----- ---- ----- ---- -----Total 3094 100.0 2358 100.0 1884 100.0
324 NESTOR living arrangements and social networks LSNghi075
gec5 hec5 iec5 I bother to keep track of benefits I have given others.Ik vind het de moeite waard om precies bij te houden wat ik voor anderendoe.
gec5 hec5 iec5
Value label Value Freq % Freq % Freq %no answer -1 25 .8 28 1.2 14 .7no! 1 1693 54.7 1336 56.7 1056 56.1no 2 1269 41.0 911 38.6 756 40.1more-or-less 3 72 2.3 70 3.0 40 2.1yes 4 26 .8 12 .5 14 .7yes! 5 9 .3 4 .2
---- ----- ---- ----- ---- -----Total 3094 100.0 2358 100.0 1884 100.0
gec6 I expect people I know to be responsive to my needs and feelings.Ik verwacht van mensen die ik ken, dat ze open staan voor mijn behoeftenen gevoelens.
gec7 It’s best to make sure things are always kept ’even’ between two people ina relationship.Ik let er op dat mijn relatie met een ander in evenwicht blijft.
gec6 gec7
Value label Value Freq % Freq %no answer -1 52 1.7 73 2.4no! 1 431 13.9 110 3.6no 2 678 21.9 196 6.3more-or-less 3 1438 46.5 1054 34.1yes 4 431 13.9 1421 45.9yes! 5 64 2.1 240 7.8
---- ----- ---- -----Total 3094 100.0 3094 100.0
gec8 hec8 iec8 When I have a need that others ignore, I’m hurt.Het kwetst me wanneer mensen een bepaalde wens van mij negeren.
gec8 hec8 iec8
Value label Value Freq % Freq % Freq %no answer -1 56 1.8 33 1.4 25 1.3no! 1 369 11.9 345 14.6 266 14.1no 2 714 23.1 430 18.2 411 21.8more-or-less 3 1373 44.4 1186 50.3 880 46.7yes 4 513 16.6 326 13.8 280 14.9yes! 5 69 2.2 38 1.6 22 1.2
---- ----- ---- ----- ---- -----Total 3094 100.0 2358 100.0 1884 100.0
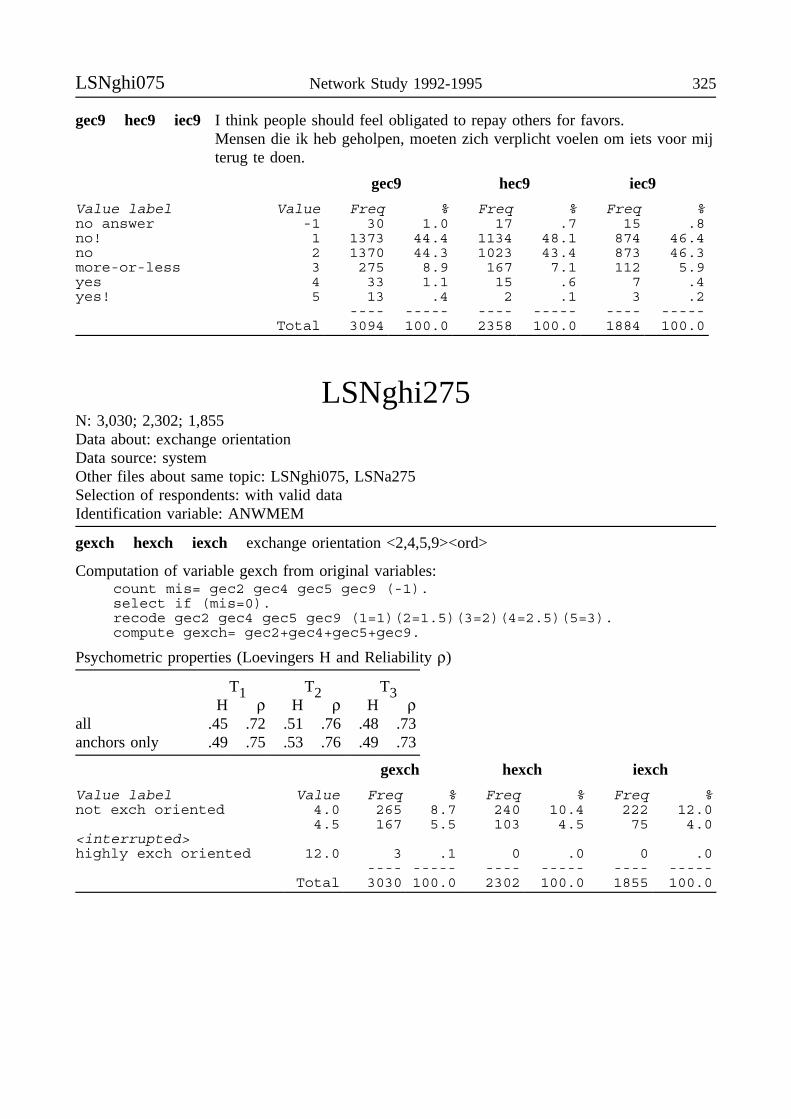
LSNghi075 Network Study 1992-1995 325
gec9 hec9 iec9 I think people should feel obligated to repay others for favors.Mensen die ik heb geholpen, moeten zich verplicht voelen om iets voor mijterug te doen.
gec9 hec9 iec9
Value label Value Freq % Freq % Freq %no answer -1 30 1.0 17 .7 15 .8no! 1 1373 44.4 1134 48.1 874 46.4no 2 1370 44.3 1023 43.4 873 46.3more-or-less 3 275 8.9 167 7.1 112 5.9yes 4 33 1.1 15 .6 7 .4yes! 5 13 .4 2 .1 3 .2
---- ----- ---- ----- ---- -----Total 3094 100.0 2358 100.0 1884 100.0
LSNghi275N: 3,030; 2,302; 1,855Data about: exchange orientationData source: systemOther files about same topic: LSNghi075, LSNa275Selection of respondents: with valid dataIdentification variable: ANWMEM
gexch hexch iexch exchange orientation <2,4,5,9><ord>
Computation of variable gexch from original variables:count mis= gec2 gec4 gec5 gec9 (-1).select if (mis=0).recode gec2 gec4 gec5 gec9 (1=1)(2=1.5)(3=2)(4=2.5)(5=3).compute gexch= gec2+gec4+gec5+gec9.
Psychometric properties (Loevingers H and Reliability ρ)
T1 T2 T3H ρ H ρ H ρ
all .45 .72 .51 .76 .48 .73anchors only .49 .75 .53 .76 .49 .73
gexch hexch iexch
Value label Value Freq % Freq % Freq %not exch oriented 4.0 265 8.7 240 10.4 222 12.0
4.5 167 5.5 103 4.5 75 4.0<interrupted>highly exch oriented 12.0 3 .1 0 .0 0 .0
---- ----- ---- ----- ---- -----Total 3030 100.0 2302 100.0 1855 100.0
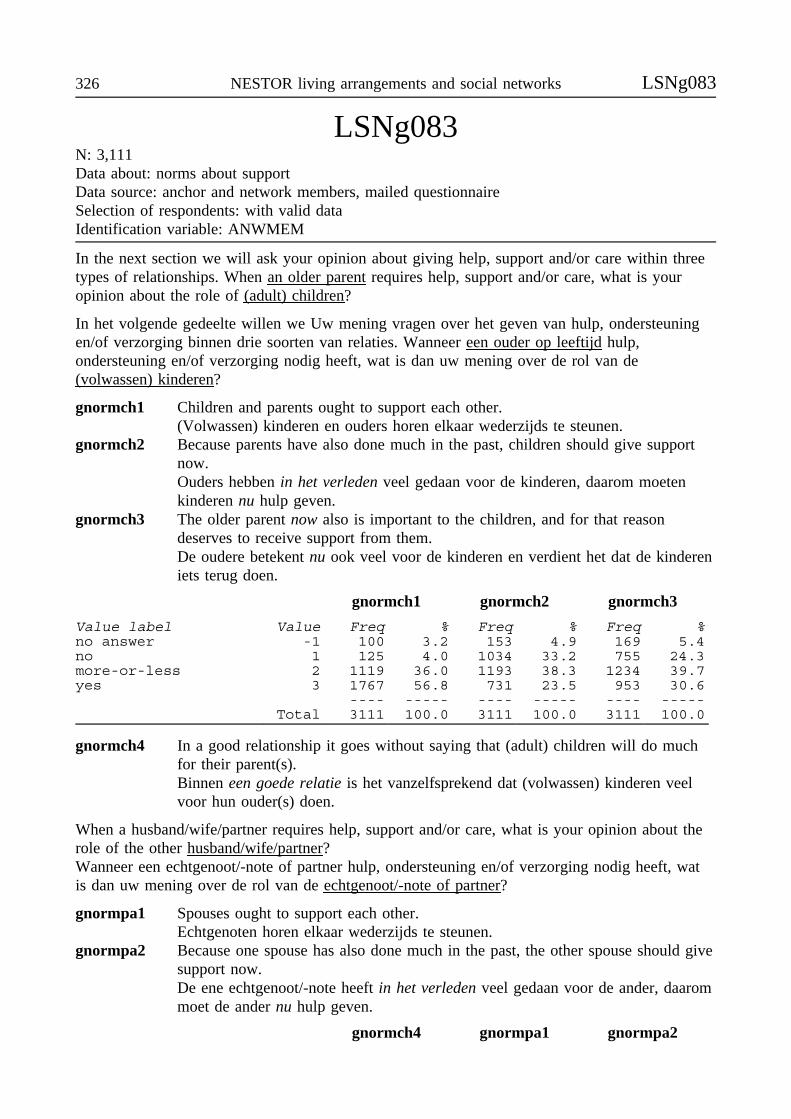
326 NESTOR living arrangements and social networks LSNg083
LSNg083N: 3,111Data about: norms about supportData source: anchor and network members, mailed questionnaireSelection of respondents: with valid dataIdentification variable: ANWMEM
In the next section we will ask your opinion about giving help, support and/or care within threetypes of relationships. When an older parent requires help, support and/or care, what is youropinion about the role of (adult) children?
In het volgende gedeelte willen we Uw mening vragen over het geven van hulp, ondersteuningen/of verzorging binnen drie soorten van relaties. Wanneer een ouder op leeftijd hulp,ondersteuning en/of verzorging nodig heeft, wat is dan uw mening over de rol van de(volwassen) kinderen?
gnormch1 Children and parents ought to support each other.(Volwassen) kinderen en ouders horen elkaar wederzijds te steunen.
gnormch2 Because parents have also done much in the past, children should give supportnow.Ouders hebben in het verleden veel gedaan voor de kinderen, daarom moetenkinderen nu hulp geven.
gnormch3 The older parent now also is important to the children, and for that reasondeserves to receive support from them.De oudere betekent nu ook veel voor de kinderen en verdient het dat de kindereniets terug doen.
gnormch1 gnormch2 gnormch3
Value label Value Freq % Freq % Freq %no answer -1 100 3.2 153 4.9 169 5.4no 1 125 4.0 1034 33.2 755 24.3more-or-less 2 1119 36.0 1193 38.3 1234 39.7yes 3 1767 56.8 731 23.5 953 30.6
---- ----- ---- ----- ---- -----Total 3111 100.0 3111 100.0 3111 100.0
gnormch4 In a good relationship it goes without saying that (adult) children will do muchfor their parent(s).Binnen een goede relatie is het vanzelfsprekend dat (volwassen) kinderen veelvoor hun ouder(s) doen.
When a husband/wife/partner requires help, support and/or care, what is your opinion about therole of the other husband/wife/partner?Wanneer een echtgenoot/-note of partner hulp, ondersteuning en/of verzorging nodig heeft, watis dan uw mening over de rol van de echtgenoot/-note of partner?
gnormpa1 Spouses ought to support each other.Echtgenoten horen elkaar wederzijds te steunen.
gnormpa2 Because one spouse has also done much in the past, the other spouse should givesupport now.De ene echtgenoot/-note heeft in het verleden veel gedaan voor de ander, daarommoet de ander nu hulp geven.
gnormch4 gnormpa1 gnormpa2
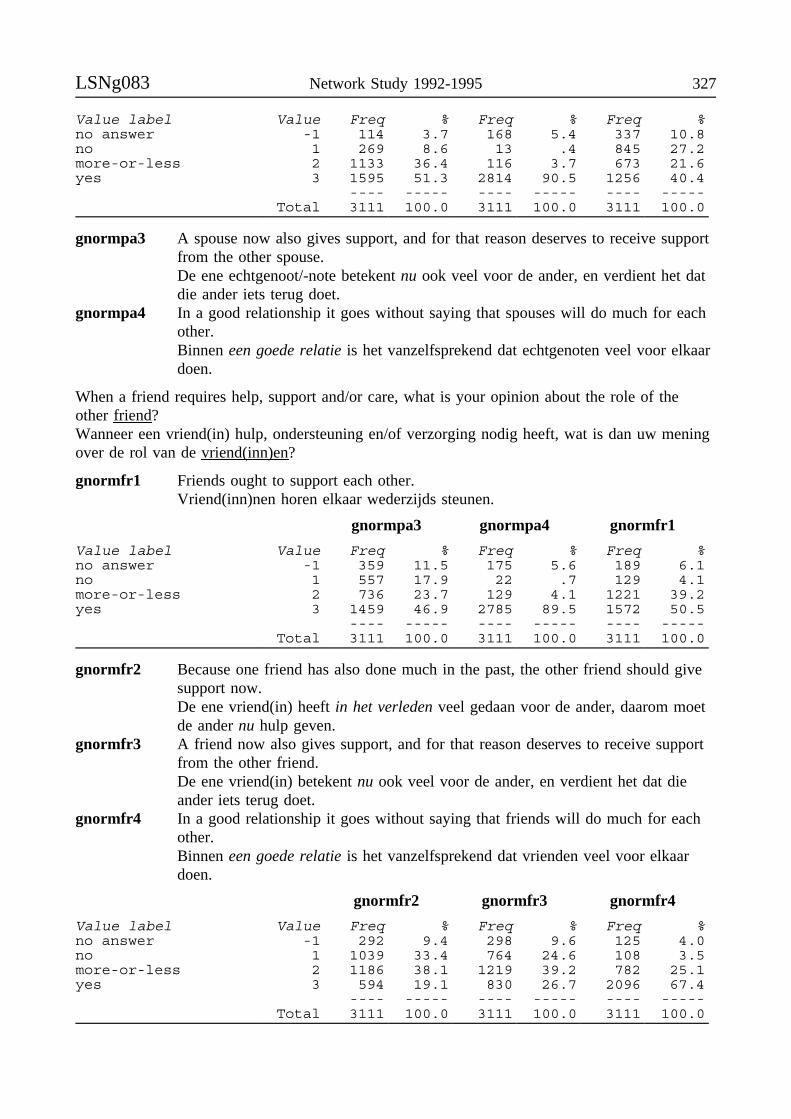
LSNg083 Network Study 1992-1995 327
Value label Value Freq % Freq % Freq %no answer -1 114 3.7 168 5.4 337 10.8no 1 269 8.6 13 .4 845 27.2more-or-less 2 1133 36.4 116 3.7 673 21.6yes 3 1595 51.3 2814 90.5 1256 40.4
---- ----- ---- ----- ---- -----Total 3111 100.0 3111 100.0 3111 100.0
gnormpa3 A spouse now also gives support, and for that reason deserves to receive supportfrom the other spouse.De ene echtgenoot/-note betekent nu ook veel voor de ander, en verdient het datdie ander iets terug doet.
gnormpa4 In a good relationship it goes without saying that spouses will do much for eachother.Binnen een goede relatie is het vanzelfsprekend dat echtgenoten veel voor elkaardoen.
When a friend requires help, support and/or care, what is your opinion about the role of theother friend?Wanneer een vriend(in) hulp, ondersteuning en/of verzorging nodig heeft, wat is dan uw meningover de rol van de vriend(inn)en?
gnormfr1 Friends ought to support each other.Vriend(inn)nen horen elkaar wederzijds steunen.
gnormpa3 gnormpa4 gnormfr1
Value label Value Freq % Freq % Freq %no answer -1 359 11.5 175 5.6 189 6.1no 1 557 17.9 22 .7 129 4.1more-or-less 2 736 23.7 129 4.1 1221 39.2yes 3 1459 46.9 2785 89.5 1572 50.5
---- ----- ---- ----- ---- -----Total 3111 100.0 3111 100.0 3111 100.0
gnormfr2 Because one friend has also done much in the past, the other friend should givesupport now.De ene vriend(in) heeft in het verleden veel gedaan voor de ander, daarom moetde ander nu hulp geven.
gnormfr3 A friend now also gives support, and for that reason deserves to receive supportfrom the other friend.De ene vriend(in) betekent nu ook veel voor de ander, en verdient het dat dieander iets terug doet.
gnormfr4 In a good relationship it goes without saying that friends will do much for eachother.Binnen een goede relatie is het vanzelfsprekend dat vrienden veel voor elkaardoen.
gnormfr2 gnormfr3 gnormfr4
Value label Value Freq % Freq % Freq %no answer -1 292 9.4 298 9.6 125 4.0no 1 1039 33.4 764 24.6 108 3.5more-or-less 2 1186 38.1 1219 39.2 782 25.1yes 3 594 19.1 830 26.7 2096 67.4
---- ----- ---- ----- ---- -----Total 3111 100.0 3111 100.0 3111 100.0
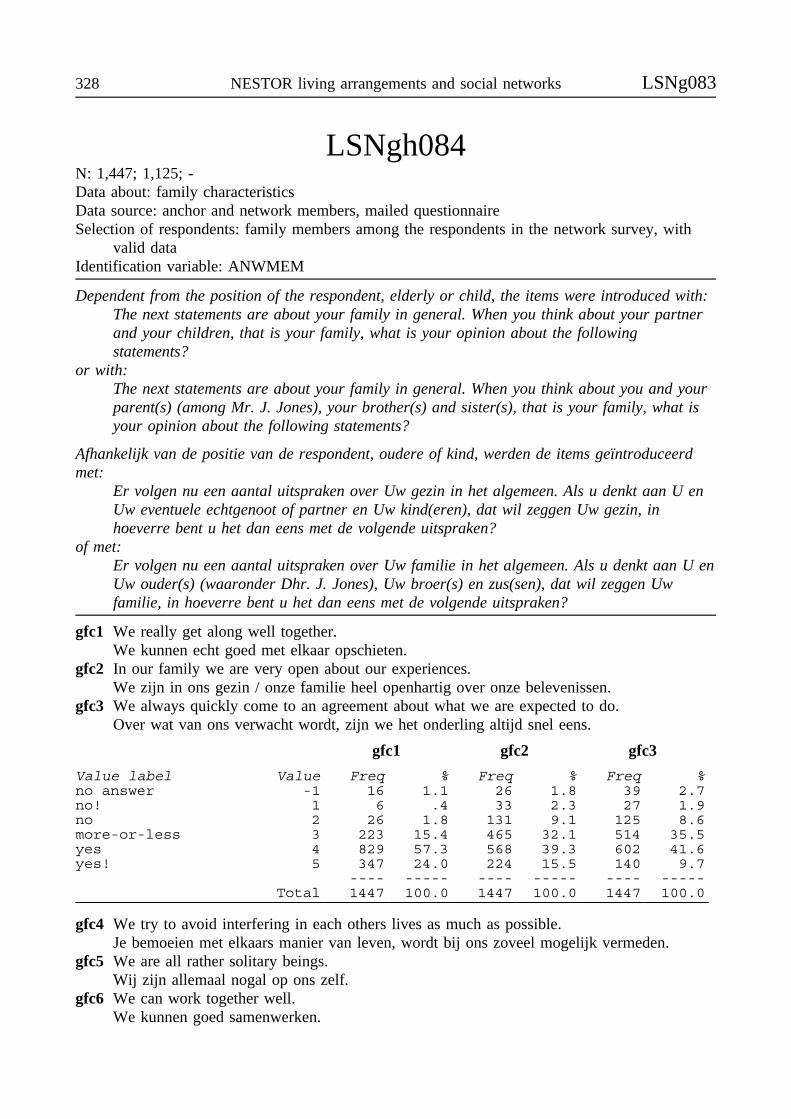
328 NESTOR living arrangements and social networks LSNg083
LSNgh084N: 1,447; 1,125; -Data about: family characteristicsData source: anchor and network members, mailed questionnaireSelection of respondents: family members among the respondents in the network survey, with
valid dataIdentification variable: ANWMEM
Dependent from the position of the respondent, elderly or child, the items were introduced with:The next statements are about your family in general. When you think about your partnerand your children, that is your family, what is your opinion about the followingstatements?
or with:The next statements are about your family in general. When you think about you and yourparent(s) (among Mr. J. Jones), your brother(s) and sister(s), that is your family, what isyour opinion about the following statements?
Afhankelijk van de positie van de respondent, oudere of kind, werden de items geïntroduceerdmet:
Er volgen nu een aantal uitspraken over Uw gezin in het algemeen. Als u denkt aan U enUw eventuele echtgenoot of partner en Uw kind(eren), dat wil zeggen Uw gezin, inhoeverre bent u het dan eens met de volgende uitspraken?
of met:Er volgen nu een aantal uitspraken over Uw familie in het algemeen. Als u denkt aan U enUw ouder(s) (waaronder Dhr. J. Jones), Uw broer(s) en zus(sen), dat wil zeggen Uwfamilie, in hoeverre bent u het dan eens met de volgende uitspraken?
gfc1 We really get along well together.We kunnen echt goed met elkaar opschieten.
gfc2 In our family we are very open about our experiences.We zijn in ons gezin / onze familie heel openhartig over onze belevenissen.
gfc3 We always quickly come to an agreement about what we are expected to do.Over wat van ons verwacht wordt, zijn we het onderling altijd snel eens.
gfc1 gfc2 gfc3
Value label Value Freq % Freq % Freq %no answer -1 16 1.1 26 1.8 39 2.7no! 1 6 .4 33 2.3 27 1.9no 2 26 1.8 131 9.1 125 8.6more-or-less 3 223 15.4 465 32.1 514 35.5yes 4 829 57.3 568 39.3 602 41.6yes! 5 347 24.0 224 15.5 140 9.7
---- ----- ---- ----- ---- -----Total 1447 100.0 1447 100.0 1447 100.0
gfc4 We try to avoid interfering in each others lives as much as possible.Je bemoeien met elkaars manier van leven, wordt bij ons zoveel mogelijk vermeden.
gfc5 We are all rather solitary beings.Wij zijn allemaal nogal op ons zelf.
gfc6 We can work together well.We kunnen goed samenwerken.
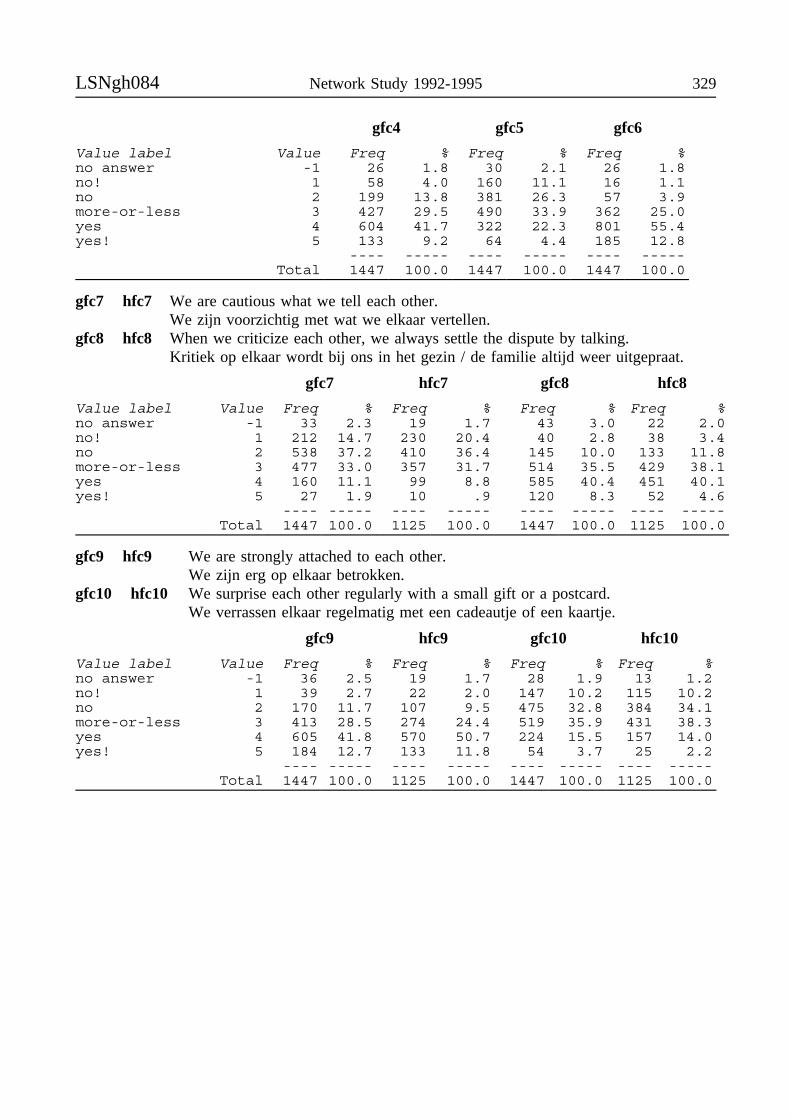
LSNgh084 Network Study 1992-1995 329
gfc4 gfc5 gfc6
Value label Value Freq % Freq % Freq %no answer -1 26 1.8 30 2.1 26 1.8no! 1 58 4.0 160 11.1 16 1.1no 2 199 13.8 381 26.3 57 3.9more-or-less 3 427 29.5 490 33.9 362 25.0yes 4 604 41.7 322 22.3 801 55.4yes! 5 133 9.2 64 4.4 185 12.8
---- ----- ---- ----- ---- -----Total 1447 100.0 1447 100.0 1447 100.0
gfc7 hfc7 We are cautious what we tell each other.We zijn voorzichtig met wat we elkaar vertellen.
gfc8 hfc8 When we criticize each other, we always settle the dispute by talking.Kritiek op elkaar wordt bij ons in het gezin / de familie altijd weer uitgepraat.
gfc7 hfc7 gfc8 hfc8
Value label Value Freq % Freq % Freq % Freq %no answer -1 33 2.3 19 1.7 43 3.0 22 2.0no! 1 212 14.7 230 20.4 40 2.8 38 3.4no 2 538 37.2 410 36.4 145 10.0 133 11.8more-or-less 3 477 33.0 357 31.7 514 35.5 429 38.1yes 4 160 11.1 99 8.8 585 40.4 451 40.1yes! 5 27 1.9 10 .9 120 8.3 52 4.6
---- ----- ---- ----- ---- ----- ---- -----Total 1447 100.0 1125 100.0 1447 100.0 1125 100.0
gfc9 hfc9 We are strongly attached to each other.We zijn erg op elkaar betrokken.
gfc10 hfc10 We surprise each other regularly with a small gift or a postcard.We verrassen elkaar regelmatig met een cadeautje of een kaartje.
gfc9 hfc9 gfc10 hfc10
Value label Value Freq % Freq % Freq % Freq %no answer -1 36 2.5 19 1.7 28 1.9 13 1.2no! 1 39 2.7 22 2.0 147 10.2 115 10.2no 2 170 11.7 107 9.5 475 32.8 384 34.1more-or-less 3 413 28.5 274 24.4 519 35.9 431 38.3yes 4 605 41.8 570 50.7 224 15.5 157 14.0yes! 5 184 12.7 133 11.8 54 3.7 25 2.2
---- ----- ---- ----- ---- ----- ---- -----Total 1447 100.0 1125 100.0 1447 100.0 1125 100.0
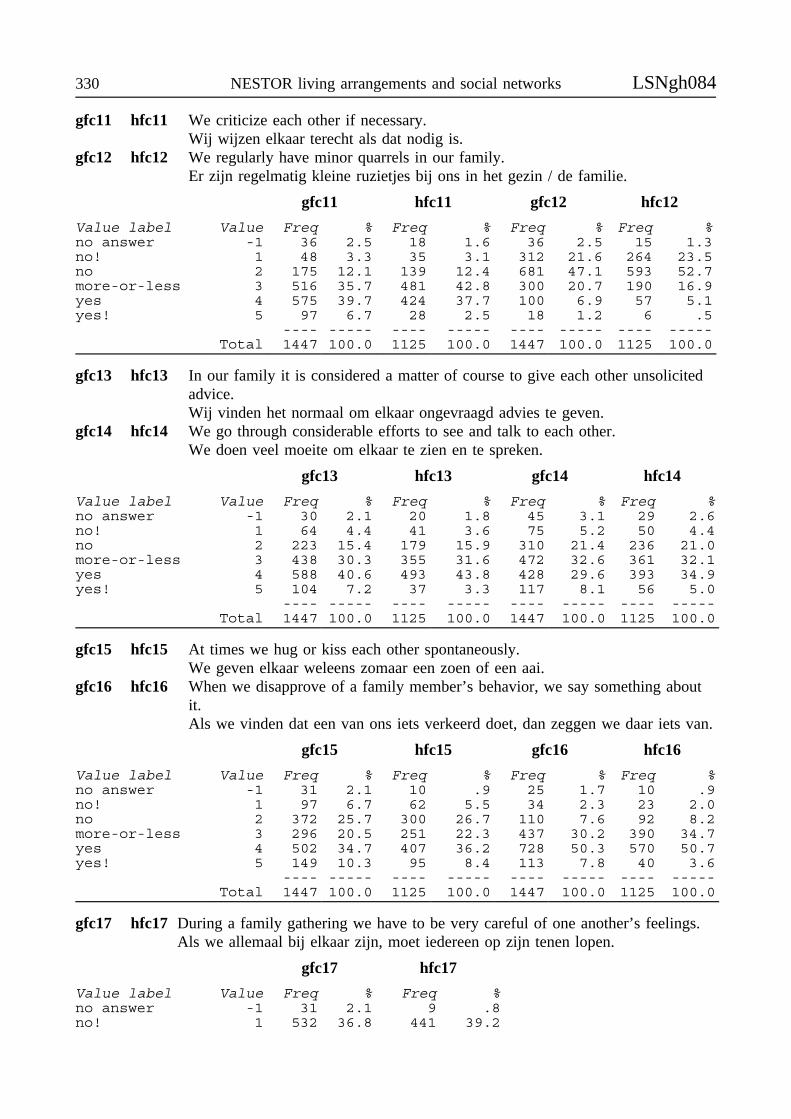
330 NESTOR living arrangements and social networks LSNgh084
gfc11 hfc11 We criticize each other if necessary.Wij wijzen elkaar terecht als dat nodig is.
gfc12 hfc12 We regularly have minor quarrels in our family.Er zijn regelmatig kleine ruzietjes bij ons in het gezin / de familie.
gfc11 hfc11 gfc12 hfc12
Value label Value Freq % Freq % Freq % Freq %no answer -1 36 2.5 18 1.6 36 2.5 15 1.3no! 1 48 3.3 35 3.1 312 21.6 264 23.5no 2 175 12.1 139 12.4 681 47.1 593 52.7more-or-less 3 516 35.7 481 42.8 300 20.7 190 16.9yes 4 575 39.7 424 37.7 100 6.9 57 5.1yes! 5 97 6.7 28 2.5 18 1.2 6 .5
---- ----- ---- ----- ---- ----- ---- -----Total 1447 100.0 1125 100.0 1447 100.0 1125 100.0
gfc13 hfc13 In our family it is considered a matter of course to give each other unsolicitedadvice.Wij vinden het normaal om elkaar ongevraagd advies te geven.
gfc14 hfc14 We go through considerable efforts to see and talk to each other.We doen veel moeite om elkaar te zien en te spreken.
gfc13 hfc13 gfc14 hfc14
Value label Value Freq % Freq % Freq % Freq %no answer -1 30 2.1 20 1.8 45 3.1 29 2.6no! 1 64 4.4 41 3.6 75 5.2 50 4.4no 2 223 15.4 179 15.9 310 21.4 236 21.0more-or-less 3 438 30.3 355 31.6 472 32.6 361 32.1yes 4 588 40.6 493 43.8 428 29.6 393 34.9yes! 5 104 7.2 37 3.3 117 8.1 56 5.0
---- ----- ---- ----- ---- ----- ---- -----Total 1447 100.0 1125 100.0 1447 100.0 1125 100.0
gfc15 hfc15 At times we hug or kiss each other spontaneously.We geven elkaar weleens zomaar een zoen of een aai.
gfc16 hfc16 When we disapprove of a family member’s behavior, we say something aboutit.Als we vinden dat een van ons iets verkeerd doet, dan zeggen we daar iets van.
gfc15 hfc15 gfc16 hfc16
Value label Value Freq % Freq % Freq % Freq %no answer -1 31 2.1 10 .9 25 1.7 10 .9no! 1 97 6.7 62 5.5 34 2.3 23 2.0no 2 372 25.7 300 26.7 110 7.6 92 8.2more-or-less 3 296 20.5 251 22.3 437 30.2 390 34.7yes 4 502 34.7 407 36.2 728 50.3 570 50.7yes! 5 149 10.3 95 8.4 113 7.8 40 3.6
---- ----- ---- ----- ---- ----- ---- -----Total 1447 100.0 1125 100.0 1447 100.0 1125 100.0
gfc17 hfc17 During a family gathering we have to be very careful of one another’s feelings.Als we allemaal bij elkaar zijn, moet iedereen op zijn tenen lopen.
gfc17 hfc17
Value label Value Freq % Freq %no answer -1 31 2.1 9 .8no! 1 532 36.8 441 39.2
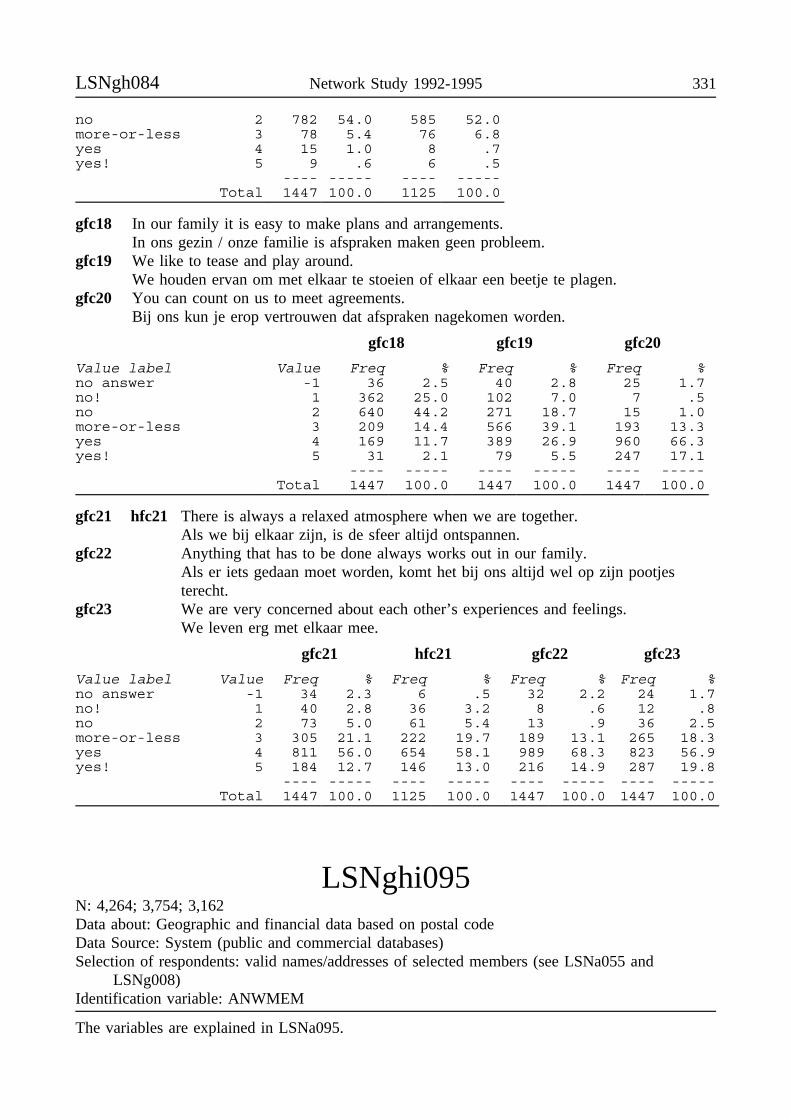
LSNgh084 Network Study 1992-1995 331
no 2 782 54.0 585 52.0more-or-less 3 78 5.4 76 6.8yes 4 15 1.0 8 .7yes! 5 9 .6 6 .5
---- ----- ---- -----Total 1447 100.0 1125 100.0
gfc18 In our family it is easy to make plans and arrangements.In ons gezin / onze familie is afspraken maken geen probleem.
gfc19 We like to tease and play around.We houden ervan om met elkaar te stoeien of elkaar een beetje te plagen.
gfc20 You can count on us to meet agreements.Bij ons kun je erop vertrouwen dat afspraken nagekomen worden.
gfc18 gfc19 gfc20
Value label Value Freq % Freq % Freq %no answer -1 36 2.5 40 2.8 25 1.7no! 1 362 25.0 102 7.0 7 .5no 2 640 44.2 271 18.7 15 1.0more-or-less 3 209 14.4 566 39.1 193 13.3yes 4 169 11.7 389 26.9 960 66.3yes! 5 31 2.1 79 5.5 247 17.1
---- ----- ---- ----- ---- -----Total 1447 100.0 1447 100.0 1447 100.0
gfc21 hfc21 There is always a relaxed atmosphere when we are together.Als we bij elkaar zijn, is de sfeer altijd ontspannen.
gfc22 Anything that has to be done always works out in our family.Als er iets gedaan moet worden, komt het bij ons altijd wel op zijn pootjesterecht.
gfc23 We are very concerned about each other’s experiences and feelings.We leven erg met elkaar mee.
gfc21 hfc21 gfc22 gfc23
Value label Value Freq % Freq % Freq % Freq %no answer -1 34 2.3 6 .5 32 2.2 24 1.7no! 1 40 2.8 36 3.2 8 .6 12 .8no 2 73 5.0 61 5.4 13 .9 36 2.5more-or-less 3 305 21.1 222 19.7 189 13.1 265 18.3yes 4 811 56.0 654 58.1 989 68.3 823 56.9yes! 5 184 12.7 146 13.0 216 14.9 287 19.8
---- ----- ---- ----- ---- ----- ---- -----Total 1447 100.0 1125 100.0 1447 100.0 1447 100.0
LSNghi095N: 4,264; 3,754; 3,162Data about: Geographic and financial data based on postal codeData Source: System (public and commercial databases)Selection of respondents: valid names/addresses of selected members (see LSNa055 and
LSNg008)Identification variable: ANWMEM
The variables are explained in LSNa095.
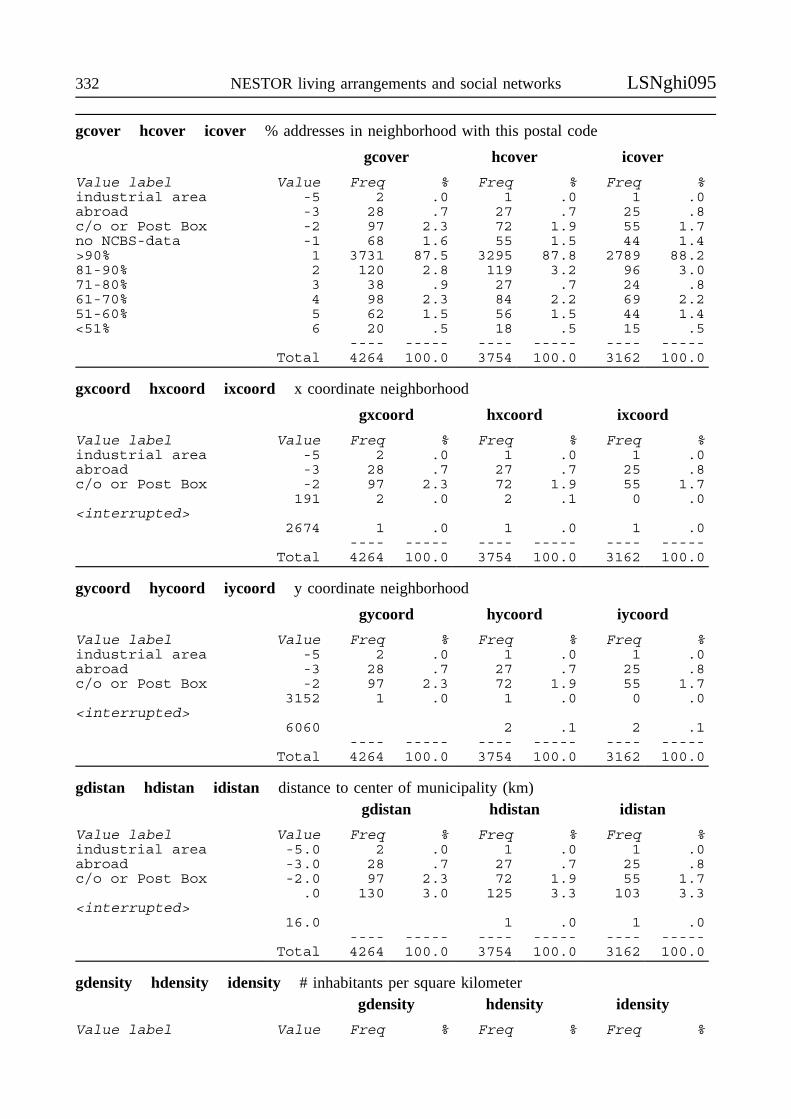
332 NESTOR living arrangements and social networks LSNghi095
gcover hcover icover % addresses in neighborhood with this postal code
gcover hcover icover
Value label Value Freq % Freq % Freq %industrial area -5 2 .0 1 .0 1 .0abroad -3 28 .7 27 .7 25 .8c/o or Post Box -2 97 2.3 72 1.9 55 1.7no NCBS-data -1 68 1.6 55 1.5 44 1.4>90% 1 3731 87.5 3295 87.8 2789 88.281-90% 2 120 2.8 119 3.2 96 3.071-80% 3 38 .9 27 .7 24 .861-70% 4 98 2.3 84 2.2 69 2.251-60% 5 62 1.5 56 1.5 44 1.4<51% 6 20 .5 18 .5 15 .5
---- ----- ---- ----- ---- -----Total 4264 100.0 3754 100.0 3162 100.0
gxcoord hxcoord ixcoord x coordinate neighborhood
gxcoord hxcoord ixcoord
Value label Value Freq % Freq % Freq %industrial area -5 2 .0 1 .0 1 .0abroad -3 28 .7 27 .7 25 .8c/o or Post Box -2 97 2.3 72 1.9 55 1.7
191 2 .0 2 .1 0 .0<interrupted>
2674 1 .0 1 .0 1 .0---- ----- ---- ----- ---- -----
Total 4264 100.0 3754 100.0 3162 100.0
gycoord hycoord iycoord y coordinate neighborhood
gycoord hycoord iycoord
Value label Value Freq % Freq % Freq %industrial area -5 2 .0 1 .0 1 .0abroad -3 28 .7 27 .7 25 .8c/o or Post Box -2 97 2.3 72 1.9 55 1.7
3152 1 .0 1 .0 0 .0<interrupted>
6060 2 .1 2 .1---- ----- ---- ----- ---- -----
Total 4264 100.0 3754 100.0 3162 100.0
gdistan hdistan idistan distance to center of municipality (km)gdistan hdistan idistan
Value label Value Freq % Freq % Freq %industrial area -5.0 2 .0 1 .0 1 .0abroad -3.0 28 .7 27 .7 25 .8c/o or Post Box -2.0 97 2.3 72 1.9 55 1.7
.0 130 3.0 125 3.3 103 3.3<interrupted>
16.0 1 .0 1 .0---- ----- ---- ----- ---- -----
Total 4264 100.0 3754 100.0 3162 100.0
gdensity hdensity idensity # inhabitants per square kilometergdensity hdensity idensity
Value label Value Freq % Freq % Freq %

LSNghi095 Network Study 1992-1995 333
industrial area -5 2 .0 1 .0 1 .0abroad -3 28 .7 27 .7 25 .8c/o or Post Box -2 97 2.3 72 1.9 55 1.7
0 67 1.6 61 1.6 54 1.7<interrupted>
43800 14 .3 15 .4 6 .2---- ----- ---- ----- ---- -----
Total 4264 100.0 3754 100.0 3162 100.0
gadrden hadrden iadrden # addresses per square kilometergadrden hadrden iadrden
Value label Value Freq % Freq % Freq %industrial area -5 2 .0 1 .0 1 .0abroad -3 28 .7 27 .7 25 .8c/o or Post Box -2 97 2.3 72 1.9 55 1.7
3 1 .0 1 .0 1 .0<interrupted>
10697 3 .1 3 .1 2 .1---- ----- ---- ----- ---- -----
Total 4264 100.0 3754 100.0 3162 100.0
gurban hurban iurban level of urbanizationgurban hurban iurban
Value label Value Freq % Freq % Freq %industrial area -5 2 .0 1 .0 1 .0abroad -3 28 .7 27 .7 25 .8c/o or Post Box -2 97 2.3 72 1.9 55 1.7not (<500) 1 755 17.7 647 17.2 567 17.9little (500-1000) 2 916 21.5 830 22.1 729 23.1somewhat (1000-1500) 3 855 20.1 743 19.8 618 19.5highly (1500-2500) 4 729 17.1 665 17.7 532 16.8very highly (>2500) 5 882 20.7 769 20.5 635 20.1
---- ----- ---- ----- ---- -----Total 4264 100.0 3754 100.0 3162 100.0
gage1524 hage1524 iage1524 % neighborhood age 15-24
gage1524 hage1524 iage1524
Value label Value Freq % Freq % Freq %industrial area -5 2 .0 1 .0 1 .0abroad -3 28 .7 27 .7 25 .8c/o or Post Box -2 97 2.3 72 1.9 55 1.7no NCBS-data -1 8 .2 8 .2 8 .3<interrupted>
55 2 .0 1 .0 1 .0---- ----- ---- ----- ---- -----
Total 4264 100.0 3754 100.0 3162 100.0
gage2544 hage2544 iage2544 % neighborhood age 25-44gage4564 hage4564 iage4564 % neighborhood age 45-64gage65 hage65 iage65 % neighborhood age 65 and over
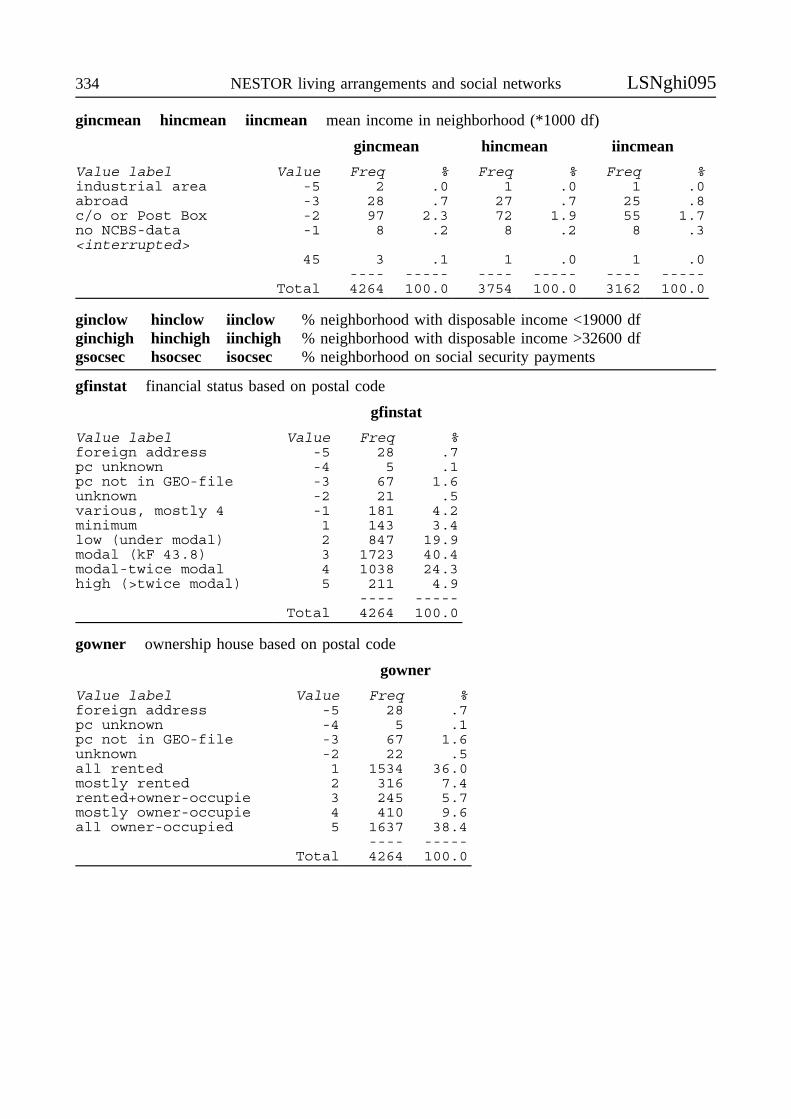
334 NESTOR living arrangements and social networks LSNghi095
gincmean hincmean iincmean mean income in neighborhood (*1000 df)
gincmean hincmean iincmean
Value label Value Freq % Freq % Freq %industrial area -5 2 .0 1 .0 1 .0abroad -3 28 .7 27 .7 25 .8c/o or Post Box -2 97 2.3 72 1.9 55 1.7no NCBS-data -1 8 .2 8 .2 8 .3<interrupted>
45 3 .1 1 .0 1 .0---- ----- ---- ----- ---- -----
Total 4264 100.0 3754 100.0 3162 100.0
ginclow hinclow iinclow % neighborhood with disposable income <19000 dfginchigh hinchigh iinchigh % neighborhood with disposable income >32600 dfgsocsec hsocsec isocsec % neighborhood on social security payments
gfinstat financial status based on postal code
gfinstat
Value label Value Freq %foreign address -5 28 .7pc unknown -4 5 .1pc not in GEO-file -3 67 1.6unknown -2 21 .5various, mostly 4 -1 181 4.2minimum 1 143 3.4low (under modal) 2 847 19.9modal (kF 43.8) 3 1723 40.4modal-twice modal 4 1038 24.3high (>twice modal) 5 211 4.9
---- -----Total 4264 100.0
gowner ownership house based on postal code
gowner
Value label Value Freq %foreign address -5 28 .7pc unknown -4 5 .1pc not in GEO-file -3 67 1.6unknown -2 22 .5all rented 1 1534 36.0mostly rented 2 316 7.4rented+owner-occupie 3 245 5.7mostly owner-occupie 4 410 9.6all owner-occupied 5 1637 38.4
---- -----Total 4264 100.0

LSNghi095 Network Study 1992-1995 335
grentpr rental price house (df/month)
grentpr
Value label Value Freq %foreign address -5 28 .7pc unknown -4 5 .1pc not in GEO-file -3 67 1.6unknown -2 1815 42.6various -1 108 2.5<150 1 16 .4<interrupted>>1500 13 8 .2
---- -----Total 4264 100.0
gpurchpr purchase price house (df)
gpurchpr
Value label Value Freq %foreign address -5 28 .7pc unknown -4 5 .1pc not in GEO-file -3 67 1.6unknown -2 1669 39.1various -1 266 6.2<50.000 1 14 .3<interrupted>>750.000 12 9 .2
---- -----Total 4264 100.0
gincompc income based on postal code
gincompc
Value label Value Freq %foreign address -5 28 .7pc unknown -4 5 .1pc not in GEO-file -3 67 1.6unknown -2 197 4.6various -1 179 4.2minimum 1 135 3.2minimum-modal 2 815 19.1modal (kF 43.8) 3 1615 37.9modal-twice modal 4 1021 23.9high (>twice modal) 5 202 4.7
---- -----Total 4264 100.0
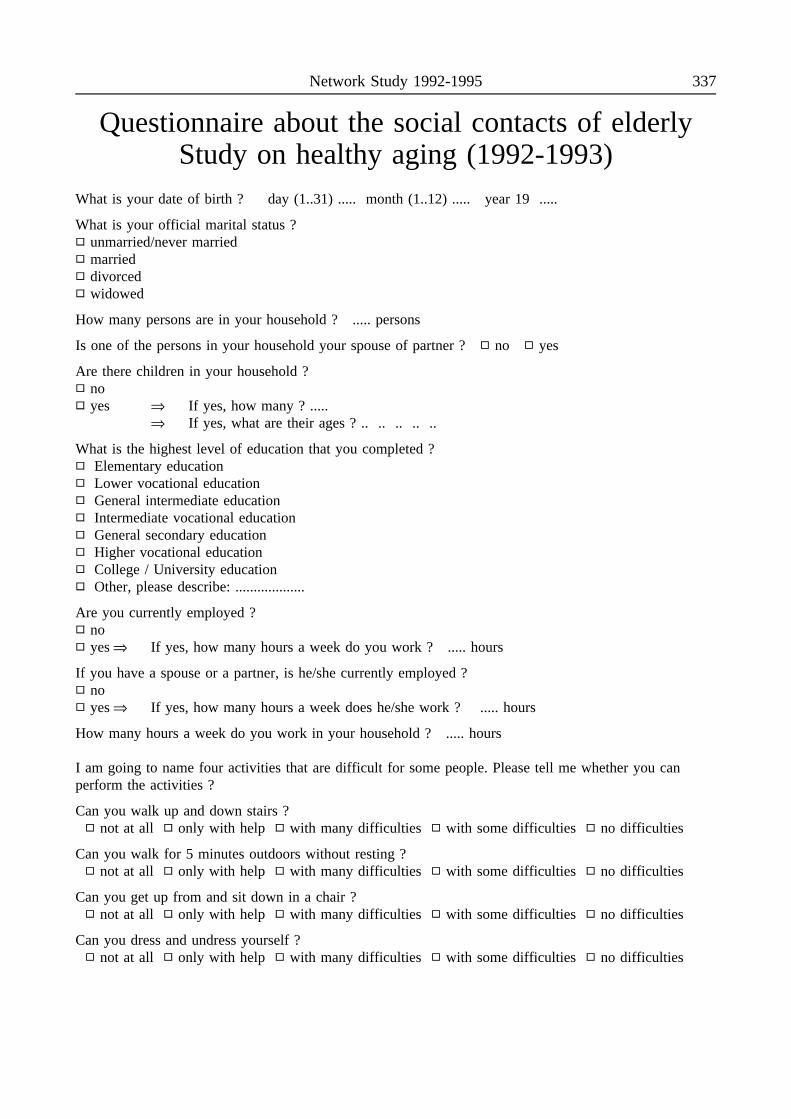
Network Study 1992-1995 337
Questionnaire about the social contacts of elderlyStudy on healthy aging (1992-1993)
What is your date of birth ? day (1..31) ..... month (1..12) ..... year 19 .....
What is your official marital status ?unmarried/never marriedmarrieddivorcedwidowed
How many persons are in your household ? ..... persons
Is one of the persons in your household your spouse of partner ? no yes
Are there children in your household ?noyes ⇒ If yes, how many ? .....
⇒ If yes, what are their ages ? .. .. .. .. ..
What is the highest level of education that you completed ?Elementary educationLower vocational educationGeneral intermediate educationIntermediate vocational educationGeneral secondary educationHigher vocational educationCollege / University educationOther, please describe: ...................
Are you currently employed ?noyes ⇒ If yes, how many hours a week do you work ? ..... hours
If you have a spouse or a partner, is he/she currently employed ?noyes ⇒ If yes, how many hours a week does he/she work ? ..... hours
How many hours a week do you work in your household ? ..... hours
I am going to name four activities that are difficult for some people. Please tell me whether you canperform the activities ?
Can you walk up and down stairs ?not at all only with help with many difficulties with some difficulties no difficulties
Can you walk for 5 minutes outdoors without resting ?not at all only with help with many difficulties with some difficulties no difficulties
Can you get up from and sit down in a chair ?not at all only with help with many difficulties with some difficulties no difficulties
Can you dress and undress yourself ?not at all only with help with many difficulties with some difficulties no difficulties
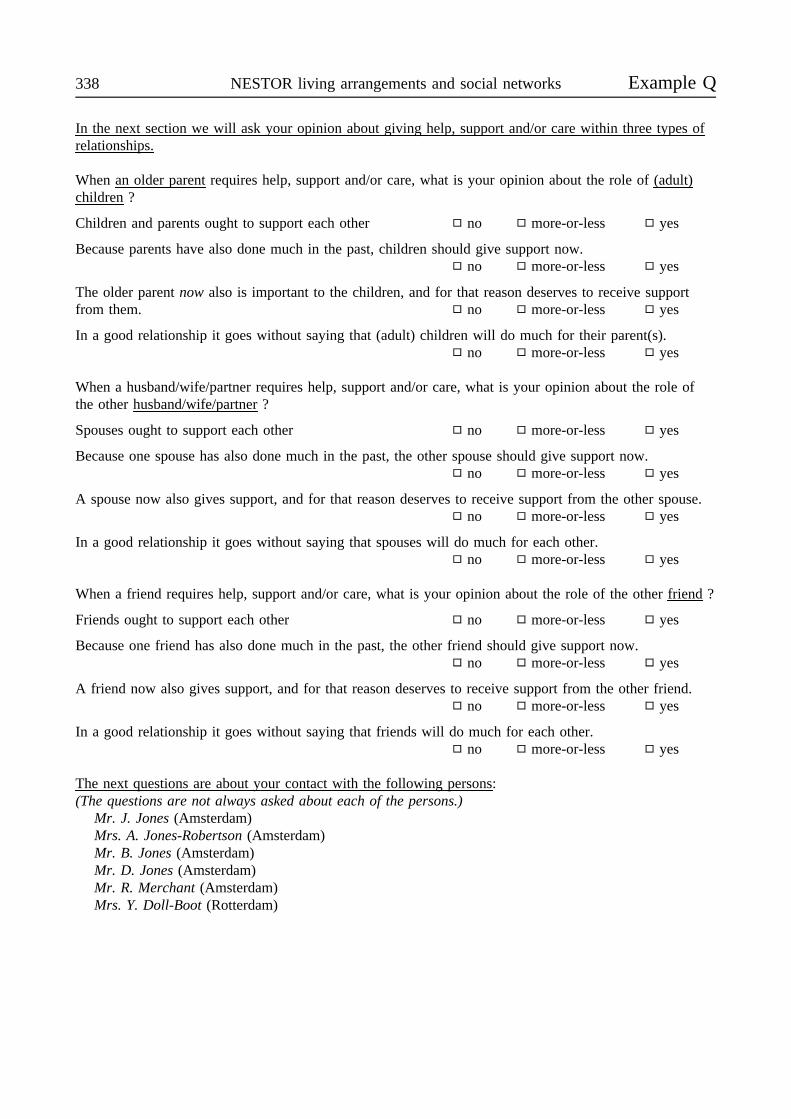
338 NESTOR living arrangements and social networks Example Q
In the next section we will ask your opinion about giving help, support and/or care within three types ofrelationships.
When an older parent requires help, support and/or care, what is your opinion about the role of (adult)children ?
Children and parents ought to support each other no more-or-less yes
Because parents have also done much in the past, children should give support now.no more-or-less yes
The older parent now also is important to the children, and for that reason deserves to receive supportfrom them. no more-or-less yes
In a good relationship it goes without saying that (adult) children will do much for their parent(s).no more-or-less yes
When a husband/wife/partner requires help, support and/or care, what is your opinion about the role ofthe other husband/wife/partner ?
Spouses ought to support each other no more-or-less yes
Because one spouse has also done much in the past, the other spouse should give support now.no more-or-less yes
A spouse now also gives support, and for that reason deserves to receive support from the other spouse.no more-or-less yes
In a good relationship it goes without saying that spouses will do much for each other.no more-or-less yes
When a friend requires help, support and/or care, what is your opinion about the role of the other friend ?
Friends ought to support each other no more-or-less yes
Because one friend has also done much in the past, the other friend should give support now.no more-or-less yes
A friend now also gives support, and for that reason deserves to receive support from the other friend.no more-or-less yes
In a good relationship it goes without saying that friends will do much for each other.no more-or-less yes
The next questions are about your contact with the following persons:(The questions are not always asked about each of the persons.)
Mr. J. Jones (Amsterdam)Mrs. A. Jones-Robertson (Amsterdam)Mr. B. Jones (Amsterdam)Mr. D. Jones (Amsterdam)Mr. R. Merchant (Amsterdam)Mrs. Y. Doll-Boot (Rotterdam)
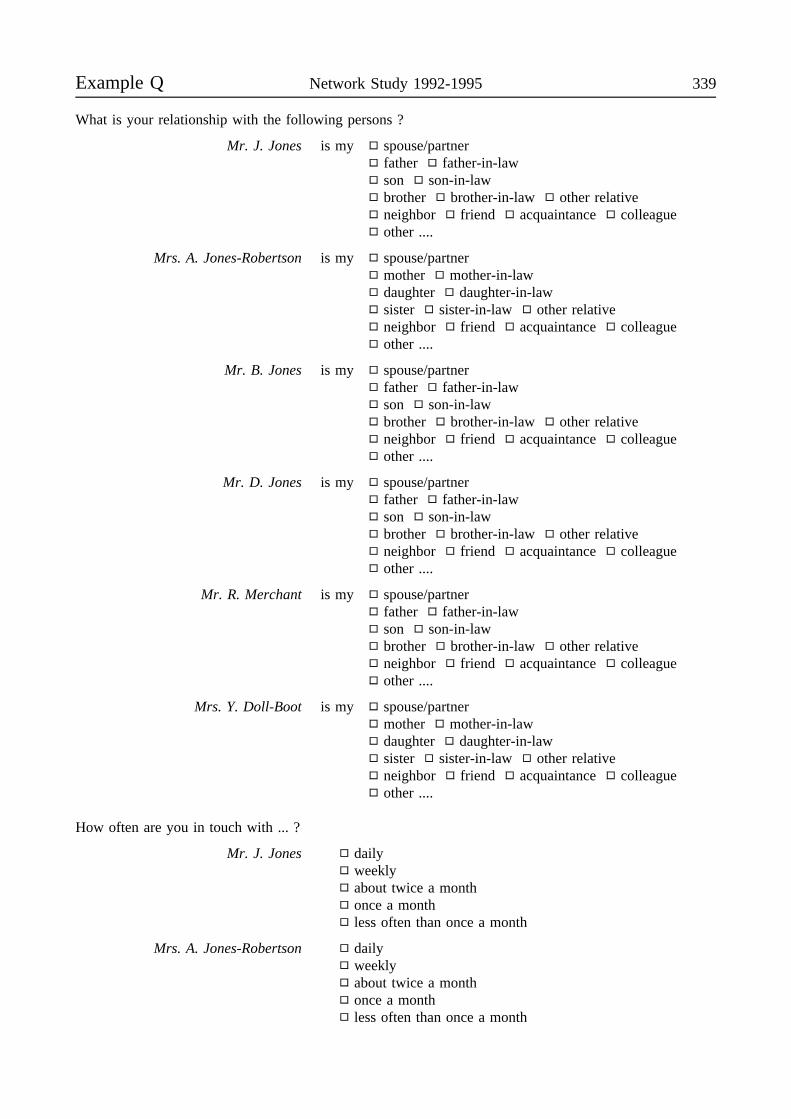
Example Q Network Study 1992-1995 339
What is your relationship with the following persons ?
Mr. J. Jones is my spouse/partnerfather father-in-lawson son-in-lawbrother brother-in-law other relativeneighbor friend acquaintance colleagueother ....
Mrs. A. Jones-Robertson is my spouse/partnermother mother-in-lawdaughter daughter-in-lawsister sister-in-law other relativeneighbor friend acquaintance colleagueother ....
Mr. B. Jones is my spouse/partnerfather father-in-lawson son-in-lawbrother brother-in-law other relativeneighbor friend acquaintance colleagueother ....
Mr. D. Jones is my spouse/partnerfather father-in-lawson son-in-lawbrother brother-in-law other relativeneighbor friend acquaintance colleagueother ....
Mr. R. Merchant is my spouse/partnerfather father-in-lawson son-in-lawbrother brother-in-law other relativeneighbor friend acquaintance colleagueother ....
Mrs. Y. Doll-Boot is my spouse/partnermother mother-in-lawdaughter daughter-in-lawsister sister-in-law other relativeneighbor friend acquaintance colleagueother ....
How often are you in touch with ... ?
Mr. J. Jones dailyweeklyabout twice a monthonce a monthless often than once a month
Mrs. A. Jones-Robertson dailyweeklyabout twice a monthonce a monthless often than once a month

340 NESTOR living arrangements and social networks Example Q
Mr. B. Jones dailyweeklyabout twice a monthonce a monthless often than once a month
Mr. D. Jones dailyweeklyabout twice a monthonce a monthless often than once a month
Mr. R. Merchant dailyweeklyabout twice a monthonce a monthless often than once a month
Mrs. Y. Doll-Boot dailyweeklyabout twice a monthonce a monthless often than once a month
When you look back on your ties with the following persons in the last months, have you made a lot ofefforts to keep in touch ?
Mr. R. Merchant I made a lot of efforts to keep in touchI made some efforts to keep in touchI made no effortsI made some efforts to break the contact offI made a lot of efforts to break the contact off
Mrs. Y. Doll-Boot I made a lot of efforts to keep in touchI made some efforts to keep in touchI made no effortsI made some efforts to break the contact offI made a lot of efforts to break the contact off
Has the frequency of contact, compared with a year ago, changed ?Mr. R. Merchant increased equal decreased
Mrs. Y. Doll-Boot increased equal decreased
Do you want to continue your relationship with the next persons ?Mr. R. Merchant yes! yes ? no no!
Mrs. Y. Doll-Boot yes! yes ? no no!
If you compare your relationship with the next persons with your other relationships, is your relationshipwith the next persons in general better, about the same in quality, or worse ?
Mr. R. Merchant better same worseMrs. Y. Doll-Boot better same worse
Example Q Network Study 1992-1995 341
How long does it take you to travel to ..., by means of the way you usually travel ?Mr. J. Jones ...... hours and ...... minutes
Mrs. A. Jones-Robertson ...... hours and ...... minutesMr. B. Jones ...... hours and ...... minutesMr. D. Jones ...... hours and ...... minutes
Mr. R. Merchant ...... hours and ...... minutesMrs. Y. Doll-Boot ...... hours and ...... minutes
The next questions are about the support you receive.
How often during the past year did it occur that the following persons helped you with daily householdtasks (e.g. preparing meals, cleaning the house, transport, a chore) ?
Mr. J. Jones never rarely sometimes oftenMrs. A. Jones-Robertson never rarely sometimes often
Mr. B. Jones never rarely sometimes oftenMr. D. Jones never rarely sometimes often
Mr. R. Merchant never rarely sometimes oftenMrs. Y. Doll-Boot never rarely sometimes often
How often during the past year did it occur that the following persons gave you advice (e.g. on animportant decision or on filling out forms) ?
Mr. J. Jones never rarely sometimes oftenMrs. A. Jones-Robertson never rarely sometimes often
Mr. B. Jones never rarely sometimes oftenMr. D. Jones never rarely sometimes often
Mr. R. Merchant never rarely sometimes oftenMrs. Y. Doll-Boot never rarely sometimes often
How often during the past year did it occur that the following persons gave your help when you neededit, e.g. when you were ill ?
Mr. J. Jones never rarely sometimes oftenMrs. A. Jones-Robertson never rarely sometimes often
Mr. B. Jones never rarely sometimes oftenMr. D. Jones never rarely sometimes often
Mr. R. Merchant never rarely sometimes oftenMrs. Y. Doll-Boot never rarely sometimes often
How often during the past year did it occur that the following persons gave you a present ?Mr. J. Jones never rarely sometimes often
Mrs. A. Jones-Robertson never rarely sometimes oftenMr. B. Jones never rarely sometimes oftenMr. D. Jones never rarely sometimes often
Mr. R. Merchant never rarely sometimes oftenMrs. Y. Doll-Boot never rarely sometimes often
342 NESTOR living arrangements and social networks Example Q
How often during the past year did it occur that the following persons showed you they cared for you ?Mr. J. Jones never rarely sometimes often
Mrs. A. Jones-Robertson never rarely sometimes oftenMr. B. Jones never rarely sometimes oftenMr. D. Jones never rarely sometimes often
Mr. R. Merchant never rarely sometimes oftenMrs. Y. Doll-Boot never rarely sometimes often
How often during the past year did it occur that you told the following persons about your personalfeelings ?
Mr. J. Jones never rarely sometimes oftenMrs. A. Jones-Robertson never rarely sometimes often
Mr. B. Jones never rarely sometimes oftenMr. D. Jones never rarely sometimes often
Mr. R. Merchant never rarely sometimes oftenMrs. Y. Doll-Boot never rarely sometimes often
The next questions are about the support you give.
How often during the past year did it occur that you helped the following persons with daily householdtasks (e.g. preparing meals, cleaning the house, transport, a chore) ?
Mr. J. Jones never rarely sometimes oftenMrs. A. Jones-Robertson never rarely sometimes often
Mr. B. Jones never rarely sometimes oftenMr. D. Jones never rarely sometimes often
Mr. R. Merchant never rarely sometimes oftenMrs. Y. Doll-Boot never rarely sometimes often
How often during the past year did it occur that you gave the following persons advice (e.g. o animportant decision or on filling out forms) ?
Mr. J. Jones never rarely sometimes oftenMrs. A. Jones-Robertson never rarely sometimes often
Mr. B. Jones never rarely sometimes oftenMr. D. Jones never rarely sometimes often
Mr. R. Merchant never rarely sometimes oftenMrs. Y. Doll-Boot never rarely sometimes often
How often during the past year did it occur that you gave the following persons ?Mr. J. Jones never rarely sometimes often
Mrs. A. Jones-Robertson never rarely sometimes oftenMr. B. Jones never rarely sometimes oftenMr. D. Jones never rarely sometimes often
Mr. R. Merchant never rarely sometimes oftenMrs. Y. Doll-Boot never rarely sometimes often
Example Q Network Study 1992-1995 343
How often during the past year did it occur that you gave the following persons a present ?Mr. J. Jones never rarely sometimes often
Mrs. A. Jones-Robertson never rarely sometimes oftenMr. B. Jones never rarely sometimes oftenMr. D. Jones never rarely sometimes often
Mr. R. Merchant never rarely sometimes oftenMrs. Y. Doll-Boot never rarely sometimes often
How often during the past year did it occur that you showed the following persons you cared for them ?Mr. J. Jones never rarely sometimes often
Mrs. A. Jones-Robertson never rarely sometimes oftenMr. B. Jones never rarely sometimes oftenMr. D. Jones never rarely sometimes often
Mr. R. Merchant never rarely sometimes oftenMrs. Y. Doll-Boot never rarely sometimes often
How often during the past year did it occur that the following persons told you about their personalfeelings ?
Mr. J. Jones never rarely sometimes oftenMrs. A. Jones-Robertson never rarely sometimes often
Mr. B. Jones never rarely sometimes oftenMr. D. Jones never rarely sometimes often
Mr. R. Merchant never rarely sometimes oftenMrs. Y. Doll-Boot never rarely sometimes often
To close the section about the mutual support, two questions follow.
Do you think that the following persons need social support ?Mr. J. Jones yes, very much yes, some scarcely
Mrs. A. Jones-Robertson yes, very much yes, some scarcelyMr. B. Jones yes, very much yes, some scarcelyMr. D. Jones yes, very much yes, some scarcely
Mr. R. Merchant yes, very much yes, some scarcelyMrs. Y. Doll-Boot yes, very much yes, some scarcely
If you gave support in the last twelve months, did they ask for it, or was is it your initiative ?
Mr. J. Jones I did not gave supportpredominantly on request of himpredominantly on my initiativesometimes on request, sometimes on my initiative
Mrs. A. Jones-Robertson I did not gave supportpredominantly on request of herpredominantly on my initiativesometimes on request, sometimes on my initiative
Mr. B. Jones I did not gave supportpredominantly on request of himpredominantly on my initiativesometimes on request, sometimes on my initiative
344 NESTOR living arrangements and social networks Example Q
Mr. D. Jones I did not gave supportpredominantly on request of himpredominantly on my initiativesometimes on request, sometimes on my initiative
Mr. R. Merchant I did not gave supportpredominantly on request of himpredominantly on my initiativesometimes on request, sometimes on my initiative
Mrs. Y. Doll-Boot I did not gave supportpredominantly on request of herpredominantly on my initiativesometimes on request, sometimes on my initiative
The next questions are about your situation.
Did you experience a life event in the last twelve months ?movementbirth (grand)childretirementnew jobsevere illness/hospitalization of yousevere illness/hospital of partnersevere illness/hospital of kindeatha marriage (e.g. of children)a divorceother
If an event happened, please describe shortly what happened, who experienced the event, and in whichmonth the event happened ?
Please indicate for each of the following statements, the extent to which they apply to your situation, theway you feel nowadays.
There is always someone that I can talk to about my day to day problems.no! no more-or-less yes yes!
I miss having a really close friend.no! no more-or-less yes yes!
I experience a general sense of emptiness.no! no more-or-less yes yes!
There are plenty of people that I can lean on in case of trouble.no! no more-or-less yes yes!
I miss the pleasure of company of others.no! no more-or-less yes yes!
Example Q Network Study 1992-1995 345
I feel my circle of friends and acquaintances is too limited.no! no more-or-less yes yes!
There are many people that I can count on completely.no! no more-or-less yes yes!
There are enough people that I feel close to.no! no more-or-less yes yes!
I miss having people around.no! no more-or-less yes yes!
Often, I feel rejected.no! no more-or-less yes yes!
I can call on my friends whenever I need them.no! no more-or-less yes yes!
Please indicate for each of the following statements, the extent to which they apply to you.
It bothers me when other people neglect my needs.no! no more-or-less yes yes!
When making a decision, I take other people’s needs and feelings into account.no! no more-or-less yes yes!
I think people should feel obligated to repay others for favors.no! no more-or-less yes yes!
I would feel exploited if someone failed to repay me for a favor.no! no more-or-less yes yes!
I bother to keep track of benefits I have given others.no! no more-or-less yes yes!
I expect people I know to be responsive to my needs and feelings.no! no more-or-less yes yes!
It’s best to make sure things are always kept ’even’ between two people in a relationship.no! no more-or-less yes yes!
When someone I know helps me out on a project, I feel I have to pay them back.no! no more-or-less yes yes!
When I have a need that others ignore, I’m hurt.no! no more-or-less yes yes!
346 NESTOR living arrangements and social networks Example Q
The next statements are about your family in general.When you think about you and your parent(s) (among Mr. J. Jones), your brother(s) and sister(s), that isyour family, what is your opinion about the following statements ?
We really get along well together.no! no more-or-less yes yes!
In our family we are very open about our experiences.no! no more-or-less yes yes!
We always quickly come to an agreement about what we are expected to do.no! no more-or-less yes yes!
We try to avoid interfering in each others lives as much as possible.no! no more-or-less yes yes!
We are all rather solitary beings.no! no more-or-less yes yes!
We can work together well.no! no more-or-less yes yes!
We are cautious what we tell each other.no! no more-or-less yes yes!
When we criticize each other, we always settle the dispute by talking.no! no more-or-less yes yes!
We are strongly attached to each other.no! no more-or-less yes yes!
We surprise each other regularly with a small gift of a postcard.no! no more-or-less yes yes!
We criticize each other if necessary.no! no more-or-less yes yes!
We regularly have minor quarrels in our family.no! no more-or-less yes yes!
In our family it is considered a matter of course to give each other unsolicited advice.no! no more-or-less yes yes!
We go through considerable efforts to see and talk to each other.no! no more-or-less yes yes!
At times we hug or kiss each other spontaneously.no! no more-or-less yes yes!
When we disapprove of a family member’s behavior, we say something about it.no! no more-or-less yes yes!
Example Q Network Study 1992-1995 347
During a family gathering we have to be very careful of one another’s feelings.no! no more-or-less yes yes!
In our family it is easy to make plans and arrangements.no! no more-or-less yes yes!
We like to tease and play around.no! no more-or-less yes yes!
You can count on us to meet agreements.no! no more-or-less yes yes!
There is always a relaxed atmosphere when we are together.no! no more-or-less yes yes!
Anything that has to be done always works out in our family.no! no more-or-less yes yes!
We are very concerned about each other’s experiences and feelings.no! no more-or-less yes yes!
This is the end of the questionnaire.If you want to tell something, or if you missed something in the questionnaire, please describe it below.
Thank you for your cooperation.You will receive a summary of results.
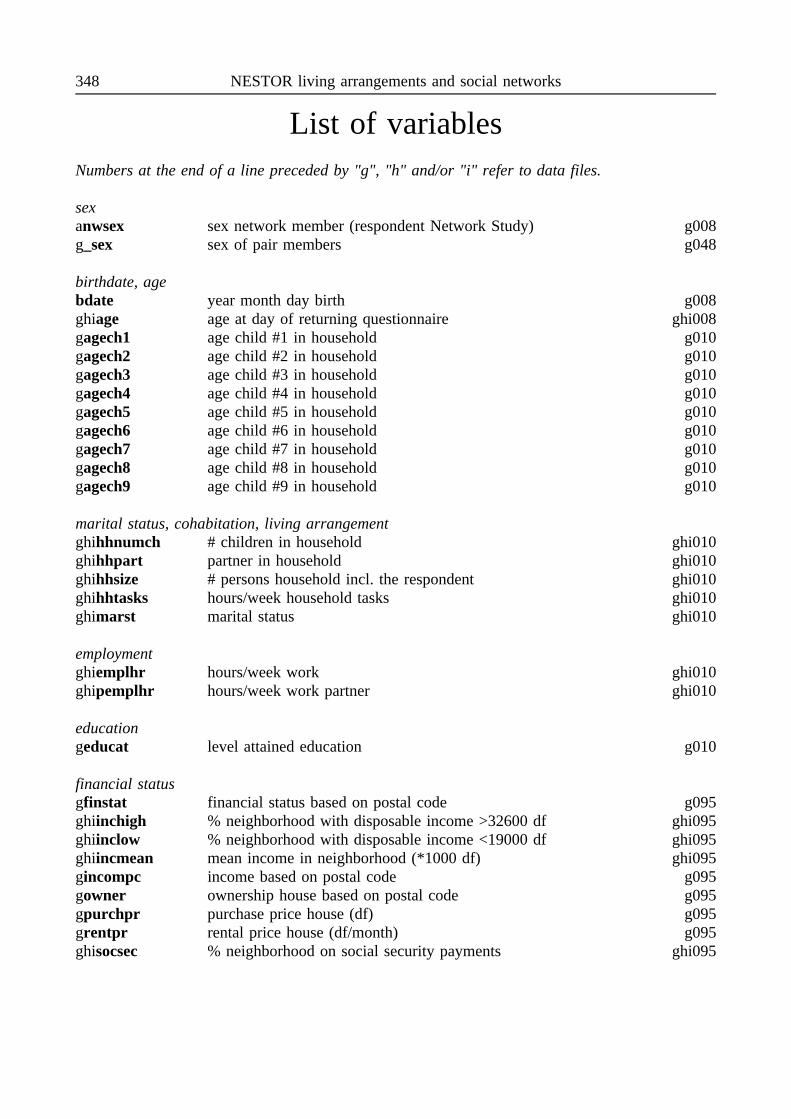
348 NESTOR living arrangements and social networks
List of variablesNumbers at the end of a line preceded by "g", "h" and/or "i" refer to data files.
sexanwsex sex network member (respondent Network Study) g008g_sex sex of pair members g048
birthdate, agebdate year month day birth g008ghiage age at day of returning questionnaire ghi008gagech1 age child #1 in household g010gagech2 age child #2 in household g010gagech3 age child #3 in household g010gagech4 age child #4 in household g010gagech5 age child #5 in household g010gagech6 age child #6 in household g010gagech7 age child #7 in household g010gagech8 age child #8 in household g010gagech9 age child #9 in household g010
marital status, cohabitation, living arrangementghihhnumch # children in household ghi010ghihhpart partner in household ghi010ghihhsize # persons household incl. the respondent ghi010ghihhtasks hours/week household tasks ghi010ghimarst marital status ghi010
employmentghiemplhr hours/week work ghi010ghipemplhr hours/week work partner ghi010
educationgeducat level attained education g010
financial statusgfinstat financial status based on postal code g095ghiinchigh % neighborhood with disposable income >32600 df ghi095ghiinclow % neighborhood with disposable income <19000 df ghi095ghiincmean mean income in neighborhood (*1000 df) ghi095gincompc income based on postal code g095gowner ownership house based on postal code g095gpurchpr purchase price house (df) g095grentpr rental price house (df/month) g095ghisocsec % neighborhood on social security payments ghi095
Variables Network Study 1992-1995 349
healthghiadl activities daily living <4 items ordinal> ghi230ghiadl1 stairs up and down ghi030ghiadl2 walking outdoor 5 minutes ghi030ghiadl3 sitting/standing chair ghi030ghiadl4 dressing/changing clothes ghi030hiadl5 using own/public transportation hi030hiadl6 cutting feet nails hi030
social supportghige emotional support given ghi251ghigi instrumental support given ghi251ghire emotional support received ghi251ghiri instrumental support received ghi251ghisgiv1 daily household tasks (instrumental support given) ghi051ghisgiv2 advice (instrumental support given) ghi051ghisgiv3 help ill (instrumental support given) ghi051ghisgiv4 give present (emotional support given) ghi051ghisgiv5 show care (emotional support given) ghi051ghisgiv6 tell personal feelings (emotional support given) ghi051ghisinia request other network member or initiative respondent ghi051ghisneed other network member needs support ghi051ghisrec1 daily household tasks (instrumental support received) ghi051ghisrec2 advice (instrumental support received) ghi051ghisrec3 help ill (instrumental support received) ghi051ghisrec4 give present (emotional support received) ghi051ghisrec5 show care (emotional support received) ghi051ghisrec6 tell personal feelings (emotional support received) ghi051ghissequ sequence questions support ghi051
frequency of contactgcchan changes in contact g051gccont continuation relationship? g051ghiceffo efforts to keep in touch ghi051ghinwfreq frequency of contact ghi051
travel time, characteristics neighborhoodghiadrden # addresses per square kilometer ghi095ghiage1524 % neighborhood age 15 till 24 ghi095ghiage2544 % neighborhood age 25 till 44 ghi095ghiage4564 % neighborhood age 45 till 64 ghi095ghiage65 % neighborhood age 65 and over ghi095ghicover % addresses in neighborhood with this postal code ghi095ghidensity # inhabitants per square kilometer ghi095ghidisstr distance in a straight line (kilometers) ghi048ghidisdrt distance in driving time (hours) ghi048ghidiskm distance by car (kilometers) ghi048ghidistan distance to center of municipality ghi095ghi_post equality of the postal code ghi048ghinwtrav travel time between two network members ghi051
350 NESTOR living arrangements and social networks Variables
ghiurban level of urbanization ghi095ghixcoord x coordinate neighborhood ghi095ghiycoord y coordinate neighborhood ghi095
network (incl. family, other than support, frequency of contact, etcetera)g_typ type relationship in pair g048ghidomtyp domain and type of network member in relation to anchor ghi008ghinpers relationship with number of persons in network ghi008ghiqual comparison of the quality of the relationship ghi051
lonelinessgilo loneliness <scale score, based on dichotomized items> gi273giloo loneliness <scale score, based on ordinal items> gi273gilo1 can talk about daily problems gi073gilo2 miss really close friend gi073gilo3 experience emptiness gi073gilo4 people to lean on if in trouble gi073gilo5 miss the pleasure of company gi073gilo6 circle of friends too limited gi073gilo7 many people I can count on gi073gilo8 enough people I feel close to gi073gilo9 miss having people around gi073gilo10 often, I feel rejected gi073gilo11 can rely on friends whenever necessary gi073
exchange / communal orientation, relationship normsghiec1 bothers me when others neglect my needs ghi075ghiec2 someone helps me, I have to pay back ghi075ghiec3 making decis, take others needs into acc ghi075ghiec4 feel exploited if someone failed repay m ghi075ghiec5 keep track of benefits I have given othe ghi075gec6 expect people to be responsive to my nee g075gec7 make sure things kept even in a relation g075ghiec8 have need that others ignore, I am hurt ghi075ghiec9 people feel obligated to repay me for fa ghi075ghiexch exchange orientation <2,4,5,9><ordinal> ghi275gnormch1 commitment parent-child g083gnormch2 delayed reciprocity parent-child g083gnormch3 direct reciprocity parent-child g083gnormch4 mutual reciprocity parent-child g083gnormfr1 commitment friends g083gnormfr2 delayed reciprocity friends g083gnormfr3 direct reciprocity friends g083gnormfr4 mutual reciprocity friends g083gnormpa1 commitment partners g083gnormpa2 delayed reciprocity partners g083gnormpa3 direct reciprocity partners g083gnormpa4 mutual reciprocity partners g083
life events
Variables Network Study 1992-1995 351
gev experienced life events g072gev7s sex person severe illness event 7 g072gev7t type person severe illness event 7 g072gev8s sex person died event 8 g072gev8t type person died event 8 g072hiev21 movement hi072hiev22 move to institution hi072hiev23 partner:severe illness/hospital hi072hiev24 partner:improvement health hi072hiev25 new partner hi072hiev26 death partner/spouse hi072hiev27 marriage or living together with partner hi072hiev28 retirement, end employment hi072hiev29 new job/activity hi072hiev30 financial problems hi072hiev31 financial luck hi072hiev32 birth (grand) child hi072hiev33 kin: severe illness/death hi072hiev34 child left home hi072hiev35 quarrel hi072hiev36 happy event hi072
family characteristicsgfc1 We really get along well together g084gfc2 In our family we are very open about our g084gfc3 We always quickly come to an agreement g084gfc4 We try to avoid interfering in each g084gfc5 We are all rather solitary beings g084gfc6 We can work together well g084ghfc7 We are cautious what we tell each other gh084ghfc8 When we criticize each other, we always gh084ghfc9 We are strongly attached to each other gh084ghfc10 We surprise each other regularly with gh084ghfc11 We criticize each other if necessary gh084ghfc12 We regularly have minor quarrels in our gh084ghfc13 In our family it is considered a matter gh084ghfc14 We go through considerable efforts to gh084ghfc15 At times we hug or kiss each other spont gh084ghfc16 When we disapprove of a family member gh084ghfc17 During a family gathering we have to be gh084gfc18 In our family it is easy to make plans g084gfc19 We like to tease and play around g084gfc20 You can count on us to meet agreements g084ghfc21 There is always a relaxed atmosphere whe gh084gfc22 Anything that has to be done always work g084gfc23 We are very concerned about each other g084
352 NESTOR living arrangements and social networks Variables
response, respondent identificationgequalg equal to respondent in Network Study (LSNg) g008gequala equal to respondent in Main Survey (LSNa) g008ghianchor anchor returned ghi055ghinwcoop cooperation Network Study (network level) ghi055ghipctdat response rate within networks (% data / #relationships) ghi055ghirespons response mailed questionnaire (level of the network members) ghi008ghirpdat date of response ghi008ghisent questionnaire sent ghi002ghis1dat Q sent <yymmdd> ghi008ghis2dat first reminder sent <yymmdd> ghi008ghis3dat second reminder sent <yymmdd> ghi008ghisizeq # questionnaires sent ghi055ghisizer # questionnaires returned ghi055
Network Study 1992-1995 353
List of filesFile Size Date Time File Size Date TimeLSNg002.SYS 157024 961129 13:54LSNg008.SYS 322624 961202 13:55LSNg010.SYS 146472 951208 09:46LSNg030.SYS 101720 950113 15:54LSNg048.SYS 805336 950426 18:21LSNg051.SYS 638936 951205 12:19LSNg055.SYS 137160 951208 09:46LSNg072.SYS 122024 941221 14:14LSNg073.SYS 123064 950113 15:54LSNg075.SYS 116760 950113 15:55LSNg083.SYS 137848 941221 13:42LSNg084.SYS 88072 941221 13:43LSNg095.SYS 340952 950222 15:25LSNg230.SYS 91472 950920 16:55LSNg251.SYS 417944 951205 11:37LSNg273.SYS 92392 950512 14:09LSNg275.SYS 100208 950510 10:25LSNh002.SYS 157648 961129 13:54LSNh008.SYS 236296 961202 13:55LSNh010.SYS 86656 950113 15:55LSNh030.SYS 83304 950113 15:55LSNh048.SYS 969792 950223 10:07LSNh051.SYS 466080 951205 13:39LSNh055.SYS 26440 951012 13:54LSNh072.SYS 104008 950224 16:43LSNh075.SYS 83144 950113 15:55LSNh084.SYS 46696 941223 14:55LSNh095.SYS 279240 950222 16:45LSNh230.SYS 70936 950113 15:55LSNh251.SYS 317000 950317 13:03LSNh275.SYS 74848 950510 10:32
LSNi002.SYS 160000 961129 13:54LSNi008.SYS 191328 961202 13:55LSNi010.SYS 69992 950825 10:51LSNi030.SYS 69144 950825 10:52LSNi048.SYS 562464 951005 15:26LSNi051.SYS 369824 951205 13:43LSNi055.SYS 24256 951012 13:48LSNi072.SYS 87656 950825 10:51LSNi073.SYS 77496 950825 10:52LSNi075.SYS 69176 950825 10:52LSNi095.SYS 484320 951005 14:59LSNi230.SYS 58824 950825 10:52LSNi251.SYS 247040 950825 11:16LSNi273.SYS 57888 950825 10:53LSNi275.SYS 62928 950825 10:52
354 Living arrangements and social networks
ReferencesAkkerman, A.E. (1974). De 5-persoonlijkheidsfactorentest: Constructie en poging tot validatie
[The 5-personality factor test: Construction and validation attempt]. Department ofPsychology, University of Amsterdam.
Andrews, F.M., & Withey, S.B. (1976). Social indicators of well-being. American’s perceptionsof life quality. New York: Plenum.
Antonucci, T.C., & Israel, B.A. (1986). Veridicality of social support: A comparison of principaland network members’ responses. Journal of Consulting and Clinical Psychology, 54, 432-437.
Berkel-Van Schaik, A.B. van, & Tax, B. (1990). Naar een standaard operationalisatie vansociaal-economische status voor epidemiologisch en sociaal-medisch onderzoek [To astandard operationalization of socio-economic status for epidemiologic and social-medicalresearch]. Den Haag, DOP.
Bethlehem, J.G. & Kersten, H.M.P. (1986). Werken met nonrespons [Working with non-response]. Doctoral dissertation, University of Amsterdam.
Borgatti, S.P., Everett, M.G., & Freeman, L.C. (1992). UCINET IV version 1.00. Columbia:Analytic Technologies.
Brinkman, W. (1977). Een assertiviteitsschaal II [An assertivity scale II]. PsychologischLaboratorium, Universiteit van Amsterdam.
Broese van Groenou, M.I. (1995). The proximate network. In C.P.M. Knipscheer, J. de JongGierveld, T.G. van Tilburg & P.A. Dykstra (Eds.), Living arrangements and socialnetworks of older adults (pp. 115-130). Amsterdam: VU University Press.
Broese van Groenou, M.I., Tilburg, T.G. van, Leeuw, E.D. de, & Liefbroer, A.C. (1995). Datacollection. In C.P.M. Knipscheer, J. de Jong Gierveld, T.G. van Tilburg & P.A. Dykstra(Eds.), Living arrangements and social networks of older adults (pp. 185-197). Amsterdam:VU University Press.
Cantril, H. (1965). The pattern of human concerns. New Brunswick: Rutgers University Press.Clark, M.S., Ouellette, R., Powell, M.C., & Milberg, S. (1987). Recipient’s mood, relationship
type, and helping. Journal of Personality and Social Psychology, 53, 94-103.Cochran, M., Larner, M., Riley, D., Gunnarson, L., & Henderson, C.R. (1990). Extending
families: The social networks of parents and their children. Cambridge: CambridgeUniversity Press.
Deeg, D.J.H., Knipscheer, C.P.M. & Tilburg, W. van. (Eds.). (1993). Autonomy and well-beingin the aging population: Concepts and design of the Longitudinal Aging Study Amsterdam.Bunnik, Netherlands Institute of Gerontology.
Deeg, D.J.H., & Westendorp - de Serière, M. (Eds.). (1994). Autonomy and well-being in theaging population 1: Report from the Longitudinal Aging Study Amsterdam 1992-1993.Amsterdam: VU University Press.
Dulk, C.J. den, Stadt, H. van de, & Vliegen, J.M. (1992). Een nieuwe maatstaf voorstedelijkheid: De omgevingsadressendichtheid [A new measure of urbanization: Theaddress density of the area]. Maandstatistiek van de Bevolking, 40, juli.
Dykstra, P.A. (1995). Network composition. In C.P.M. Knipscheer, J. de Jong Gierveld, T.G.van Tilburg & P.A. Dykstra (Eds.), Living arrangements and social networks of olderadults (pp. 97-114). Amsterdam: VU University Press.
Dykstra, P.A. (1995). Age differences in social participation: The importance of restrictions. InC.P.M. Knipscheer, J. de Jong Gierveld, T.G. van Tilburg & P.A. Dykstra (Eds.), Livingarrangements and social networks of older adults (pp. 59-82). Amsterdam: VU UniversityPress.

References Living arrangements and social networks 355
Dykstra, P.A., & Knipscheer, C.P.M. (1995). The availability and intergenerational structure offamily relationships. In C.P.M. Knipscheer, J. de Jong Gierveld, T.G. van Tilburg & P.A.Dykstra (Eds.), Living arrangements and social networks of older adults (pp. 37-58).Amsterdam: VU University Press.
Folstein, M.F., Folstein, S.E., & McHugh, P.R. (1975). Mini-mental state: A practical instrumentfor grading the cognitive status of patients for the clinician. Journal of PsychiatricResearch, 12, 189-198.
Goldthorpe, J.H., & Hope, K. (1974). The social gradings of occupations. Oxford: OxfordUniversity Press.
Goyder, J. (1987). The silent majority: Nonrespondents on sample surveys. Cambridge: PolityPress.
Groves, R.M. (1989). Survey errors and survey costs. New York: Wiley.Heer, W. de. (1992). International survey on non-response. Netherlands Central Bureau of
Statistics.Herzog, A.R., & Rodgers, W.L. (1988). Age and response rates to interview sample surveys.
Journal of Gerontology: Social Sciences, 43, S200-205.Herzog, A.R., & Rodgers, W.L. (1989). The use of survey methods in research on older
Americans. University of Michigan, Institute for Social Research.Hoinville, G. (1983). Carrying out surveys among the elderly. Journal of the Market Research
Society, 25, 223-227.Jong Gierveld, J. de, & Kamphuis, F.H. (1985). The development of a Rasch-type Loneliness
scale. Applied Psychological Measurement, 9, 289-299.Jong Gierveld, J. de, & Tilburg, T.G. van. (1990). Manual of the loneliness scale. Vrije
Universiteit Amsterdam, Dept. of Social Research Methodology.Jong Gierveld, J. de, & Tilburg, T.G. van. (1991). Kwaliteitsbepaling van meetinstrumenten via
triangulatie [Assessment of the quality of measuring instruments via triangulation]. In P.G.Swanborn, J. de Jong Gierveld, T.G. van Tilburg, A.E. Bronner & G.W. Meijnen, Aspectenvan onderzoek: Theorie, variabelen en praktijk (pp. 29-64). Rijksuniversiteit Utrecht,Vakgroepen Planning, Organisatie & Beleid en Empirisch Theoretische Sociologie.
Jong Gierveld, J. de, & Tilburg, T.G. van. (1992). Triangulatie in operationaliseringsmethoden[Triangulation in methods of operationalization]. In G.J.N. Bruinsma en M.A. Zwanenburg(Red.), Methodologie voor bestuurskundigen: Stromingen en methoden (pp. 273-298).Muiderberg: Coutinho.
Jong Gierveld, J. de, & Tilburg, T.G. van (1995). Social relationships, integration, andloneliness. In C.P.M. Knipscheer, J. de Jong Gierveld, T.G. van Tilburg & P.A. Dykstra(Eds.), Living arrangements and social networks of older adults (pp. 155-172). Amsterdam:VU University Press.
Knipscheer, C.P.M., Jong Gierveld, J. de, Tilburg, T.G. van, & Dykstra, P.A. (1990). Livingarrangements and social networks of older adults: Research program proposal. VrijeUniversiteit, Amsterdam.
Knipscheer, C.P.M., Jong Gierveld, J. de, Tilburg, T.G. van, & Dykstra, P.A. (1995). Livingarrangements and social networks of older adults. Amsterdam: VU University Press.
Liefbroer, A.C., & Jong Gierveld, J. de (1995). Living arrangements, socio-economic resources,and health. In C.P.M. Knipscheer, J. de Jong Gierveld, T.G. van Tilburg & P.A. Dykstra(Eds.), Living arrangements and social networks of older adults (pp. 15-36). Amsterdam:VU University Press.
Louwen, F. (1992). Nonrespons: Bereidwillig maar niet bereikbaar of bereikbaar maar nietbereidwillig [Non-response: Willing but unreachable or reachable but unwilling].Onderzoek, 6/7, 5-9.
356 Living arrangements and social networks References
Mokken, R.J. (1971). A theory and procedure of scaling: With applications in political research.Den Haag: Mouton.
Molenaar, I.W., Debets, P., Sijtsma, K. & Hemker, B.T. (1994). MSP: A program for Mokkenscale analysis for polychotomous items (version 3.0). Groningen: iec ProGAMMA.
Netherlands Central Bureau of Statistics (1990a). Leeftijdsopbouw per gemeente op 1 januari1990 [Age distribution for each municipality on January 1, 1990].
Netherlands Central Bureau of Statistics (1990b). Leeftijdsopbouw per gemeentegroep naarurbanisatiegraad op 1 januari 1990 [Age distribution for each group in the municipalityaccording to degree of urbanization on January 1, 1990].
Netherlands Central Bureau of Statistics (1990c). Overlevingstafels voor mannen en vrouwennaar leeftijd, 1985-1989 [Survival tables for men and women according to age, 1985-1989]. Maandstatistiek voor de Bevolking, 90/9, 50-51.
Netherlands Central Bureau of Statistics (1992a). Leeftijdsopbouw per gemeente naar burgerlijkestaat en geslacht [Age distribution for each municipality according to marital status andsex]. Electronic information.
Netherlands Central Bureau of Statistics (1992b). Maandstatistiek voor de Bevolking, 10.Netherlands Central Bureau of Statistics (1993). Personele inkomensverdeling 1989: Regionale
gegevens deel 1 en deel 2 [Individual income distribution 1989: Regional figures part 1and part 2]. Centraal Bureau voor de Statistiek, Heerlen.
Osgood, C., Succi, G., & Tannenbaum, P. (1957). The measurement of meaning. Urbana:University of Illinois Press.
Pfennig, A., Pfennig, U., & Mohler, P.P. (1991). Zur Realiabilitt von egozentrierten Netzwerkenin Massenumfragen [Reliability of ego centered networks in surveys]. ZUMA Nachrichten,15, 92-93.
Pijper, W.M. de, & Saris, W.E. (1986). The formulation of interviews using the programINTERV. Sociometric Research Foundation, Amsterdam.
Russell, D., Peplau, L.A., & Cutrona, C.E. (1980). The revised UCLA loneliness scale. Journalof Personality and Social Psychology, 39, 471-480.
Schenk, M., Mohler, P.P., & Pfenning, U. (1992). Egozentrierte Netzwerke in derForschungspraxis: Ausschöpfungsquoten und Validität soziodemographischer Variablen[Ego centered networks in research practice]. ZUMA Nachrichten, 16, 87-120.
Sixma, H. & Ultee, W.C. (1983). Een beroepsprestigeschaal voor Nederland in de jaren tachtig[An occupational prestige scale for the Netherlands in the eighties]. Mens en Maatschappij,58, 360-382.
Tilburg, T.G. van. (1988). Verkregen en gewenste ondersteuning in het licht van eenzaamheids-ervaringen [Obtained and desired social support in association with loneliness]. Dissertatie,Vrije Universiteit Amsterdam.
Tilburg, T.G. van. (1990). The size of the supportive network in association with the degree ofloneliness. In C.P.M. Knipscheer & T.C. Antonucci (Eds.), Social network research:Substantive issues and methodological questions (pp. 137-150). Lisse: Swets & Zeitlinger.
Tilburg, T.G. van. (1992a). Question sequence effects in the measurement of reciprocity. Qualityand Quantity, 26, 395-408.
Tilburg, T.G. van. (1992b). De operationalisering van wederkerigheid in het ondersteunendrelatienetwerk: Vergelijking van instrumenten [The operationalization of reciprocity withinthe supportive network: Comparison of instruments]. In W. Jansen & G.L.H. van denWittenboer (Eds.), Sociale netwerken en hun invloed (pp. 72-89). Meppel: Boom.
Tilburg, T.G. van. (1995). Delineation of the social network and differences in network size. InC.P.M. Knipscheer, J. de Jong Gierveld, T.G. van Tilburg & P.A. Dykstra (Eds.), Living
References Living arrangements and social networks 357
arrangements and social networks of older adults (pp. 83-96). Amsterdam: VU UniversityPress.
Tilburg, T.G. van, & Dykstra, P.A. (1995). Geografische spreiding van het sociale netwerk vanouderen. Rooilijn, Tijdschrift voor wetenschap en beleid in de ruimtelijke ordening, 28,140-146.
Tilburg, T.G. van, Broese van Groenou, M.I., & Thomése, G.C.F. (1995). Flow of support. InC.P.M. Knipscheer, J. de Jong Gierveld, T.G. van Tilburg & P.A. Dykstra (Eds.), Livingarrangements and social networks of older adults (pp. 131-154). Amsterdam: VUUniversity Press.
Winshop, C., & Radbill, L. (1994). Sampling weights and regression analysis. SociologicalMethods & Research, 23, 230-257.
Wolf, C. (1993). Egozentrierte Netzwerke: Datenorganisation und Datenanalyse [Ego centerednetworks: Data organisation and data analysis]. ZA-Information, 32, 72-94.
Top Related
Copyright © 2022 FDOKUMEN

