


Bahasa
Halaman
Hukum

Paper No. 27 2006- Schoonbeek
Slip Line Field Solutions as an Approach to Understand Ice Subgouge Deformation Patterns
Ima S.S. Schoonbeek1, May X. Xin2, Walther G.M. van Kesteren3, Ken Been4 1,3 Department of Civil Engineering and Geosciences, Delft University of Technology, Delft, The Netherlands
2,4 Golder Associates, Inc. Houston, Texas, USA
ABSTRACT In the Arctic where drifting ice contacts the sea floor, oil and gas pipes need to be buried at a certain depth beneath the sea floor to avoid damage caused by ice scour and the soil plastic deformation induced by ice scour. For a safe design, knowledge is required about the depth and magnitude of the soil deformation, referred to as the subgouge. This paper presents the centrifuge testing results of subgouge deformation and examines the viability of using slip line field solutions as a theoretical approach to estimate the subgouge deformation induced by ice scouring. For centrifuge testing, variables included ice keel speed, undrained shear strength of soil and ice keel scour depth. The soil deformations were determined by image processing of video camera data; and the horizontal and vertical loads were measured using load cells. For the theoretical approach, Petryk’s (1987) slip line field solutions for a rigid wedge sliding over a flat surface of ductile material are used as an analogy to the processes occurring in ice scouring, where ice is the rigid hard material and soil is the ductile material. Investigation shows the deformation mechanism in Petryk’s slip line field solutions resemble what was observed during model tests of ice scouring in clay. The results from the slip line solutions are compared with the testing data. Discussions on the validity of the theoretical approach and empirical equations are presented. KEY WORDS: ice scour; subgouge; centrifuge testing; slip line field solutions; soil plastic deformation; arctic. NOMENCLATURE: cu: undrained shear strength of the soil in kPa. Dg: ice gouge (scour) depth. Dsg : ice subgouge (sub scour) depth. k: shear yield strength of the soil in kPa. m: interface adhesion/roughness coefficient between keel and soil, defined as the absolute value of the maximum interface shear stress divided by the soil yield strength |τ/k|max. θ: ice keel inclination angle to the horizontal surface in degrees. ρ: soil density in kgf/m3. τ: interface shear stress between the ice keel and the soil in kPa.
INTRODUCTION In the Arctic, the sea is often covered by ice at certain times of a year and this has an impact for design of oil and gas pipelines buried in the sea floor. The moving ice masses tend to plough sea floor, which is referred to as “ice scour.” Ice scour may not only damage pipes that are in direct contact with the ice, but may also cause large shear strain in the soil, and thereby endanger the pipes buried in the soil. The subsurface soil deformation zone caused by ice scour is called subgouge. For a safe design, knowledge is required about the soil deformation induced by an ice floe scouring the sea floor. Ice scouring is a soil-structure interaction problem associated with large soil deformation. Since the theory of large plastic deformations is a relatively unexplored area in geotechnics, theoretical analysis of ice scour mechanisms is difficult. An analogy can be made with large plastic deformations in ductile metals. The soil shear patterns observed in the ice scour tests resemble the slip line patterns in metal deformations of a rigid hard metal sliding over softer metal. Petryk (1987) proposed slip line field solutions for a rigid wedge shaped material sliding over a flat surface of ductile material under steady-state conditions. Although soil deformation occurring in ice scouring is not a static but a dynamic process, Petryks slip line field solutions are used as an analogy to the processes occurring in ice scouring. The ice is modelled as the rigid hard material and the soil as the incompressible ductile material. Comparison between slip line field solutions and centrifuge test results are presented to assess the validity of slip line field solutions as a theoretical approach to describe deformation mechanisms observed ice scouring. To investigate soil deformation during an ice scouring event and the influence of geotechnical parameters on subgouge deformation, a test program was carried out at the Geotechnical Centrifuge Laboratory of Delft University of Technology (Allersma and Schoonbeek, 2005). All tests were performed on cohesive soils. Small scale tests in a centrifuge allow the soil stress to be increased by elevating the gravity. Cohesive soil then behaves more realistically and the loads applied to structures can be measured reliably. During the tests, several parameters were varied, including: velocity of the ice floe model (referred to as “keel” or “ice “keel”), undrained shear
strength of subsurface soil and ice scour depth. Tests were performed in homogeneous soil samples with undrained shear strengths of 18-120 kPa. Keel angles of 14, 27 or 45 degrees were tested. The ice keel was displaced over 80 mm. The subgouge deformation was measured by means of image processing. A grid was placed on the clay sample so the deformation pattern could be visualised and captured by a video camera. The horizontal and vertical loads were also logged. Test results of both deformation and forces were analysed and related to slip line theory. Based on the testing results of subgouge deformations, a depth (Z3) was defined where the horizontal subgouge deformation was 3 mm at 100g centrifuge test, which corresponds to 0.3m in prototype conditions. Since subgouge deformation is proportional to gouge depth, Z3 was normalized by the gouge depth Dg. CENTRIFUGE TESTING
Centrifuge Facility All tests were performed using the geotechnical centrifuge of Delft University of Technology. The centrifuge has a diameter of 2.5m and allows maximum sample weight of approximately 300N. The maximum space available for the model and the actuator is 400x400x400mm3. A computer system located in the spinning arm of the centrifuge was used to perform data acquisition and to control the tests in flight. Image processing was used to measure soil deformation in flight from images taken by the on-board video camera. A two-dimensional loading system (Allersma, 1994) was used in the test program. A translation in two perpendicular directions is provided by tempered steel shafts and linear ball bearings. The loading path during a test can be defined in advance and entered into a computer program. The program is written in a common computer language, so that it can be modified easily by the user. The loading device has been used to displace the model of the ice keel in horizontal direction. Sample Preparation and Test Procedure The undrained shear strength of the saturated clay samples was measured by in situ vane shear test. The dry and wet densities of soil were determined. After placing the sample in a strongbox the keel model is placed in the clay at the desired scour depth. To visualize subgouge deformation, a grid with 10 mm spacing for both horizontal and vertical directions is placed on the side of the clay sample. A wooden ice keel model as shown in Figure 1 was used, which was connected to the loading system. The keel is 178 mm long, 60 mm wide, and 35 mm high. The standard keel angle was 27 degrees, except in two tests a smaller and larger keel angle of 14 and 45 degrees were used. A summary of the test specifications is included in Table 1. The clay samples of the higher undrained shear strength of 95 and 110 kPa were consolidated in the centrifuge for two days. The undrained shear strength was measured at different depths in the sample to check if the sample was homogeneous. An “odometer” test was performed to determine the compressibility and the vertical consolidation coefficient by means of the “log t” method from which the permeability of the sample was also calculated. Because the goal was to simulate undrained conditions, humid tissues were placed on the soil sample to prevent it from dehydrating. To reach the steady state conditions faster, a mound of clay was placed in front of the keel by hand before the test to simulate build-up of the mound during the first few meters (or mm in the model test) of keel displacement.
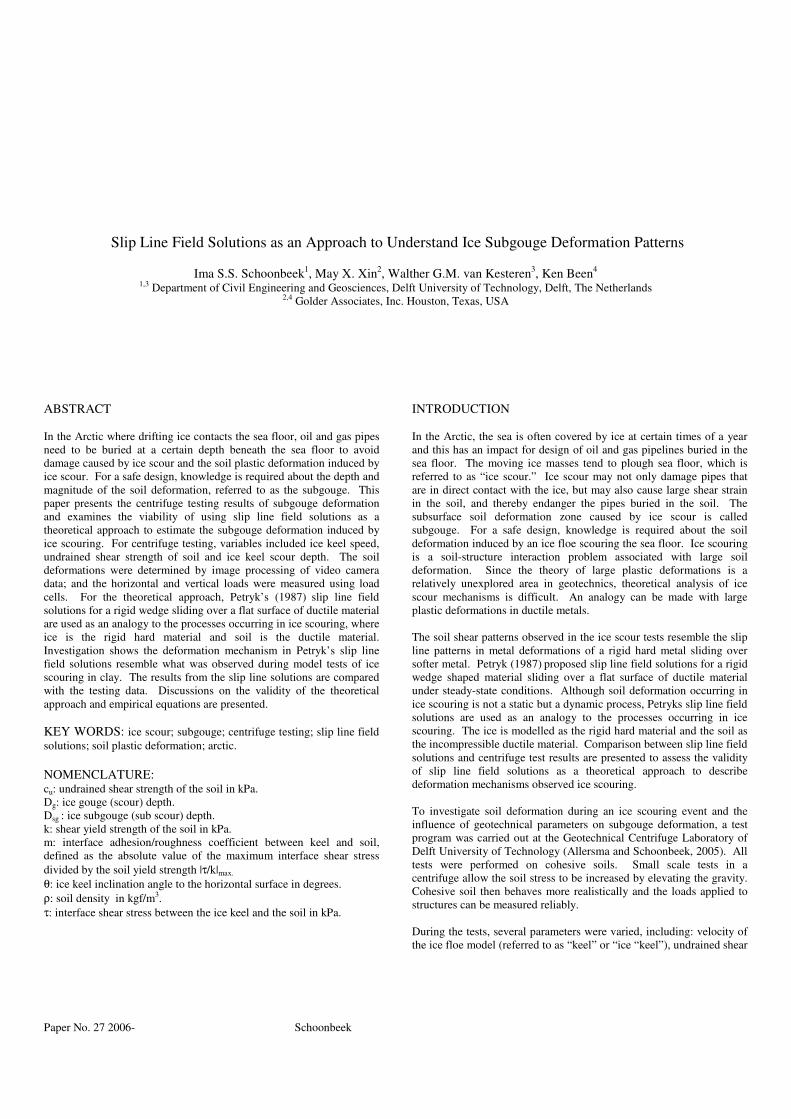
To start the test, the centrifuge was first accelerated to the desired g-level and the keel was lifted slightly to determine the self-weight of the keel model. This self-weight was corrected for in all subsequent load measurements. Then, the keel was returned to its original position and a small load (50 N) was applied to ensure contact between clay and keel. The video camera recording starts when the scour test starts and continues until the centrifuge is halted. The model is removed from the centrifuge and a photograph of the final state is taken. The ice keel model was moved in horizontal direction at velocities of 1 mm/s and 0.06 mm/s in saturated clay, representing undrained tests. To Figure 1. Schematic diagram of ice scouring process (not to scale) Table 1: Test Sample Specifications
Test No
Description cu [kPa]
Depth gouge [mm]
Weight Sample [kg]
Water Cont.
1 Standard 35 10 14.46 24% 2 Low velocity ice floe
(.06 mm/s) 25 12 13.60 24%
3 Low velocity ice floe (.06 mm/s)
18 10 14.45 27%
4 Remoulded layer 18 8 13.73 24% 5 Multiple scouring 30 8 to 30 14.90 24% 6 Standard 18 15 13.10 26% 7 Small keel angle (14
degrees) 18 7 13.11 26%
8 Deep scour overcons. Clay
95 22 14.03 26%
9 Layered bed: soft on hard
25/110 22 15.21 20/26%
10 Layered bed: soft on hard
25/110 15 15.85 20/26%
11 Smoother surface 20 10 15.13 26% 12 Low vel. (.06 mm/s),
high cu 95 15 13.12 20%
13 Three model pipelines, 3D effects, width floe 300 mm
20 10 15.35 26%
14 Larger g (150 g) 20 10 14.36 26% 15 Large keel angle (45
degrees) 30 15 15.23 24%
Schematised ice floe (keel)
Pipe
Sea
Small keel angle
θ Dg
-8
-7
-6
-5
-4
-3
-2
-1
0
0 2 4 6 8 10 12
X x10
Yx10[mm] t0
tend
verify that soil is under undrained conditions, the Peclet number for pore water pressure was calculated. The Peclet number Pe is a measurement of the ratio of advection and diffusion of pore water (Winterwerp et al. 2004). Pore water pressure dissipates by advection or water flow, and thus also depends on the velocity at which the ice mass moves. A fully undrained condition is assumed if the Pe is larger than 10. The Peclet number is defined as:
Pe = VDg /ci (1) Where V is the velocity of ice keel, Dg is the scour depth and ci is the isotropic consolidation coefficient. Among all the test configurations in Table 1, test 3 has the smallest Peclet number. For test 3, scour depth Dg =10 mm and velocity V = 0.06 mm/s. The isotropic consolidation coefficient ci can be assumed to equal to cv, the value of the vertical consolidation coefficient. The measured value of cv is 5 x 10⁻⁸
m2/sec. Using equation 1, Pe = 12 for test 3. For an increased velocity of 1 mm/s, Pe = 200, therefore it is reasonable to assume that the test conditions are undrained in all cases. To consider the Peclet number in the simulated prototype condition, scaling factor needs to be taken into account. Ng is the of gravity scale factor in the model test, then the model scaling factor for length, Nl, is 1/Ng,, and the velocity scaling factor for V=L/t, Nv, is also 1/Ng. The consolidation coefficient is a material parameter and remains unaltered. Therefore Pe will be multiplied with Ng
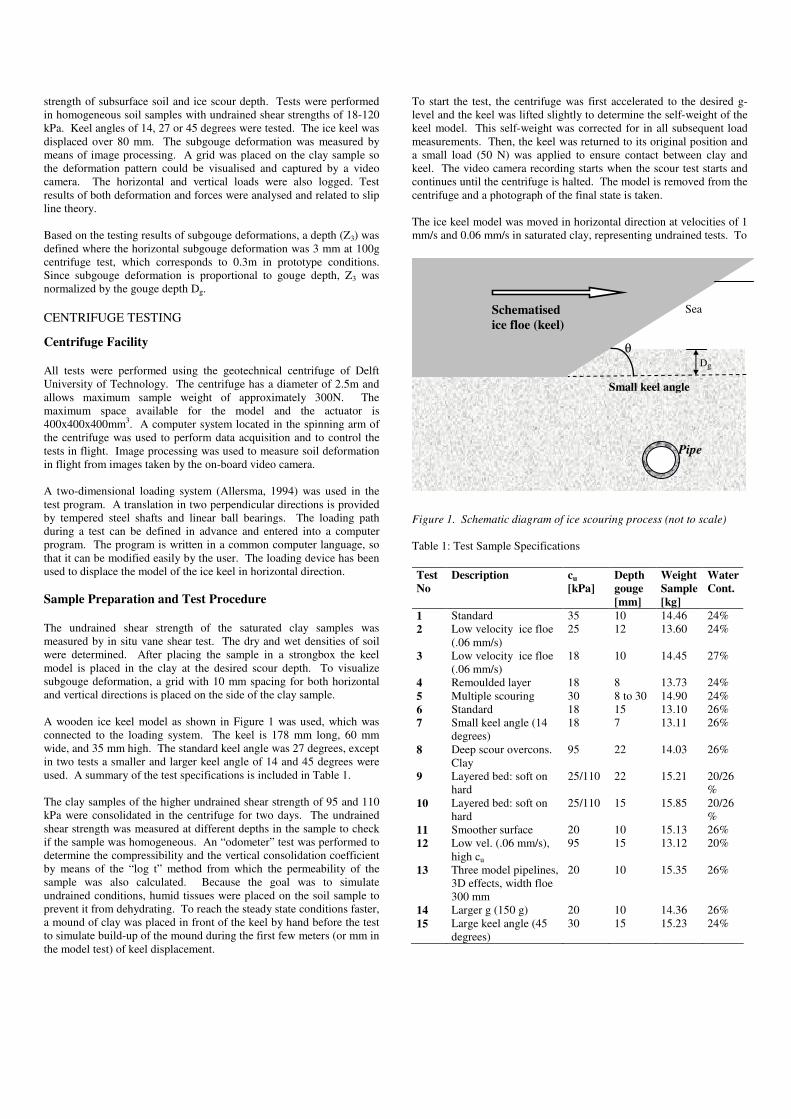
2 for prototype conditions, which also means fully undrained conditions. Centrifuge Test Results The initial position of the keel is shown in Fig. 2 a) and Fig. 2 b) shows the keel after the maximum displacement (80 mm). The displacements of the deformed grid are measured by image processing with an accuracy of 0.3mm. The deformation of the grid is visualized by subtraction in Fig. 2 c). In Fig. 2 d), the deformation of a vertical line located 60 mm to the right of the keel’s starting location is visualized to determine the depth of the subsoil large deformation zone. A distance of 60 mm was chosen since from the subtraction images it appeared at this point deformations were largest. It can be seen that clay is moved laterally and dragged forward in by the keel and that the distance to the bottom boundary is sufficiently large. In this test series, subgouge deformation patterns of soil of high undrained shear strength differed from those of softer soils. For tests 8 and 12 of higher shear strength soils, a larger shear plane which extends more in front of the keel was observed. In several tests shear bands, resembling slip lines were observed. Figure 2 shows that slip line patterns resembling Petryk slip line field solutions (Figure 3) are observed. For the slower deformation rates, tests 2, 3 and 12, larger shear bands, both horizontally and vertically, seem to occur. This could be due to a partial drainage effect. Localized shear failure in a shear plane or shear band, like tensile failure, depends on local drainage of the shear band and energy release from the material surrounding it (Winterterp et al. 2004), and therefore it also depends on the fracture energy and local shear strength. The forces measured by the loading system are 100 to 800 N in magnitude, corresponding to 1 to 8 MN in the prototype. These forces within the range that can be applied by a scouring ice mass. More test results are presented in the following sections in conjunction with the results from the slip line field solutions.
a) b) c) d) Figure 2. a) Sample before test. b) After centrifuge test at 100g and displacement of 80 mm. c) Visualization of soil deformation by subtraction of images. d) Deformation of vertical gridline. SLIP LINE FIELD SOLUTIONS Basis for the Slip Line Field Theory Slip-line field theory is an analytical technique to solve boundary value problems, including problems involving large deformations and velocity discontinuities. The theory includes three restrictive assumptions: a) plane strain deformation; b) quasi-static loading, or steady state conditions, and c) the solid is rigid-perfectly plastic and follows the associative flow rule. To use slip line theory, it is necessary to check if the above assumptions are applicable to the clay subgouge. a) Generally, observed scours are wide in comparison with their depth and plane strain assumption is reasonable. b) Considering that the ice movement is relatively slow and scours typically continue for several hundreds of meters, steady-state condition can be reasonably assumed. c) For the assumption that soil is rigid-plastic with associated flow consider the following. When clay is deformed in an ice scouring event, undrained conditions occur. The undrained behaviour of clay is characterised by a small elastic range and large plastic strains occur during scouring. Therefore, rigid plastic assumption for clay soils under undrained conditions is considered acceptable. In addition, there is no volume change by definition under undrained conditions so that associated flow is reasonable. Such an assumption, however, does not apply to granular materials such as sand, since the yield surface depends on the mean stress and dilation and volume change occur. The Von Mises yield criterion is used and the plane strain yield stress (k) of clay soil is calculated as:
2 / 3 1.15u uk c c= ≈ (2)
Since the assumption is made that associative plastic behaviour occurs, plastic strain increments are perpendicular to the yield surface. Slip lines are perpendicular to each other. The soil plastic flow directions
10 ≤≤ m
depend on the slip line pattern in the soil. The Hencky equations determine the characteristic equations that hold along the two sets of slip lines, the α- and β-slip lines. The minimum work hypothesis states that a kinematically admissible velocity field will occur where the energy or work it involves is at the minimum. The Hencky equations determine the relation of p, the mean compressive stress, s, the distance along the slip lines, and ψ, the anti-clockwise angular rotation of the α-line from x-axis (Hencky 1923):
02 =+αα δ
δψδδ
sk
sp
(3)
02 =−ββ δ
δψδδ
sk
sp
(4)
The slip line field must obey certain constraints at the boundaries: 1) for a free surface, the slip lines must meet the surface at an angle of 45°. There will be in general no stress acting normal to the surface. In case of a frictionless surface, the shear stress must be zero tangential to a frictionless surface, which means tangential and normal directions must be principal directions. Hence the slip lines must meet the surface at 45°. 2) In case of a perfectly rough surface, the friction is so high that all tangential movement is prevented; the shearing must be of maximum value in a direction that is also tangential to the surface. One set of slip lines is tangential to the surface and the other set normal to it. How soil fails depends on the slip line pattern in the soil. The Hencky equations determine the characteristic equations along the slip lines. The velocity components along slip lines are expressed in Geiringer equations (Geiringer 1930):
αβ
α
α ψdsdv
dsdv = (5)
β
αβ
β ψdsd
vdsdv
= (6)
Where αv and βv are the velocities along slip lines α and β.
Construction of slip line field A slip line pattern is first derived from observations and checked by calculating the stresses. As mentioned in the test results section, deformation patterns observed during testing resemble Petryk’s deformation mechanisms. Thus it is expected that slip line field solution may be a good theoretical approach to estimate failure patterns in large soil deformations. Constructing the slip line field (also called characteristics) is a boundary value problem and is usually done by trial and error. Observed slip line patterns are used as a first approximation. At the free surface to the right of the ice mass, the slip lines must meet the surface at an angle of π/4. The boundary conditions require that σyy =0. Slipping can only occur if the absolute value of the shear stress reaches the shear strength ⏐τ⏐=mk. m is a measure for the adhesion along the soil-ice interface and is a constant parameter independent of the normal pressure σn. Petryk states that the shear contact stress τ on the material
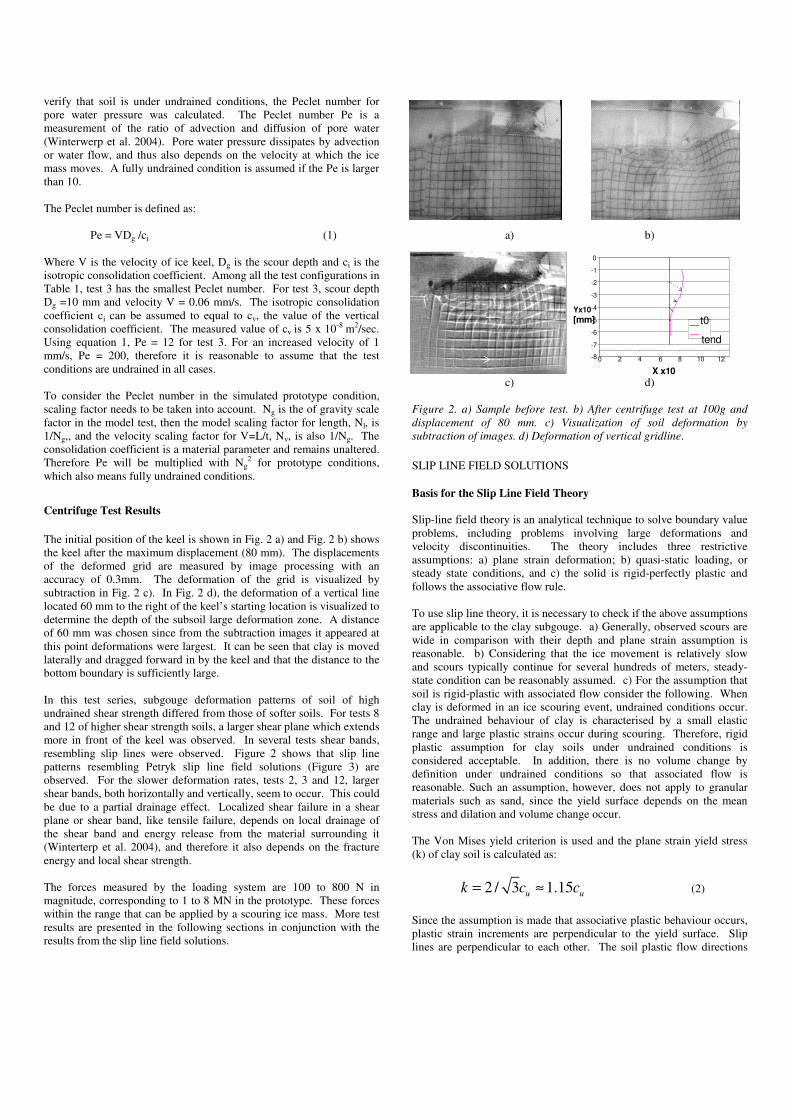
cannot exceed the yield stress k multiplied by the adhesion coefficient m: !τ/k !≤ !τ/k!max = m. From soil model testing, it is known the interface adhesion coefficient has an effect on the vertical force that can be transmitted to the soil. If the surface of the ice keel is smooth and adhesion is small, slipping will occur and the vertical force are high in relation to horizontal forces. If the adhesion coefficient m=0, then total slipping occurs, and if the angle of attack θ is 0, then no horizontal force can be exerted on the soil. Initially slip lines are straight. When slipping occurs at the interface, slip lines meet the keel, at an angle λ as is shown in Figure 3a.
m1cos)2/1( −=λ or λπ −2/ (7) and: The shear contact stress τ is equal to mk or –mk and opposes slipping. Distribution of shear and normal stresses can now be derived from Hencky’s equations. The velocity field can be calculated using Geiringer equations. Petryk (1987) derived complete solutions that satisfy the boundary conditions according to the minimum work hypothesis, for a range of 0<m<1 and 0<θ<π/2, and including six plastic flow mechanisms. Once θ and m are given then a steady-state mechanism can be specified. These deformation modes and slip line field solutions can be used as an approach to determine subgouge deformation under a scouring ice keel. Petryk’s Type III mode of slippage is depicted in Figure 3.
λλλλ
a)
σnσn
ττψψψψ
b)
!"#$%&'()*&+,-./ψ0
ψψψψ
ββββ
!"#
"$"#
"$%
c) Figure 3. a) Slip line field resembling Petryk Slip line fields b) Normal stress σn and shear stress τ. c) Forces on ice floe / rigid wedge.
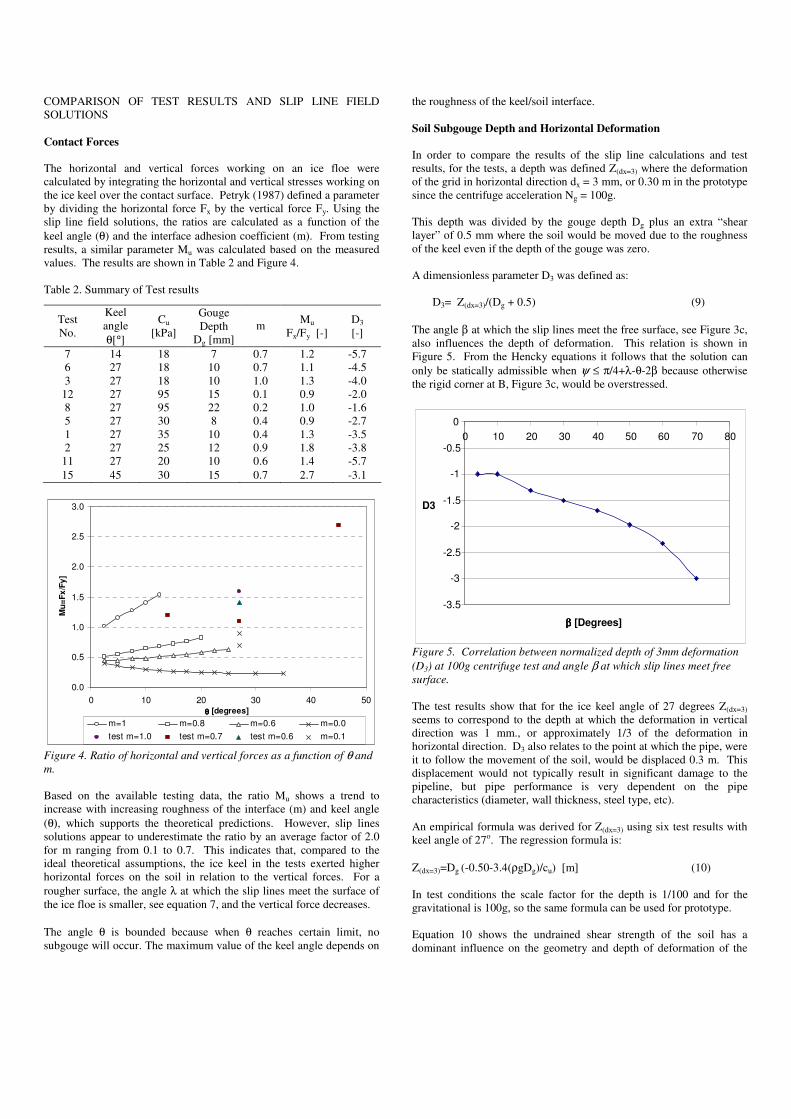
COMPARISON OF TEST RESULTS AND SLIP LINE FIELD SOLUTIONS Contact Forces The horizontal and vertical forces working on an ice floe were calculated by integrating the horizontal and vertical stresses working on the ice keel over the contact surface. Petryk (1987) defined a parameter by dividing the horizontal force Fx by the vertical force Fy. Using the slip line field solutions, the ratios are calculated as a function of the keel angle (θ) and the interface adhesion coefficient (m). From testing results, a similar parameter Mu was calculated based on the measured values. The results are shown in Table 2 and Figure 4. Table 2. Summary of Test results
0.0
0.5
1.0
1.5
2.0
2.5
3.0
0 10 20 30 40 50θθθθ [degrees]
Mu=
Fx/F
y]
m=1 m=0.8 m=0.6 m=0.0test m=1.0 test m=0.7 test m=0.6 m=0.1
Figure 4. Ratio of horizontal and vertical forces as a function of θ and m. Based on the available testing data, the ratio Mu shows a trend to increase with increasing roughness of the interface (m) and keel angle (θ), which supports the theoretical predictions. However, slip lines solutions appear to underestimate the ratio by an average factor of 2.0 for m ranging from 0.1 to 0.7. This indicates that, compared to the ideal theoretical assumptions, the ice keel in the tests exerted higher horizontal forces on the soil in relation to the vertical forces. For a rougher surface, the angle λ at which the slip lines meet the surface of the ice floe is smaller, see equation 7, and the vertical force decreases. The angle θ is bounded because when θ reaches certain limit, no subgouge will occur. The maximum value of the keel angle depends on
the roughness of the keel/soil interface. Soil Subgouge Depth and Horizontal Deformation In order to compare the results of the slip line calculations and test results, for the tests, a depth was defined Z(dx=3) where the deformation of the grid in horizontal direction dx = 3 mm, or 0.30 m in the prototype since the centrifuge acceleration Ng = 100g. This depth was divided by the gouge depth Dg plus an extra “shear layer” of 0.5 mm where the soil would be moved due to the roughness of the keel even if the depth of the gouge was zero. A dimensionless parameter D3 was defined as: D3= Z(dx=3)/(Dg + 0.5) (9) The angle β at which the slip lines meet the free surface, see Figure 3c, also influences the depth of deformation. This relation is shown in Figure 5. From the Hencky equations it follows that the solution can only be statically admissible when ψ ≤ π/4+λ-θ-2β because otherwise the rigid corner at B, Figure 3c, would be overstressed. Figure 5. Correlation between normalized depth of 3mm deformation (D3) at 100g centrifuge test and angle β at which slip lines meet free surface. The test results show that for the ice keel angle of 27 degrees Z(dx=3) seems to correspond to the depth at which the deformation in vertical direction was 1 mm., or approximately 1/3 of the deformation in horizontal direction. D3 also relates to the point at which the pipe, were it to follow the movement of the soil, would be displaced 0.3 m. This displacement would not typically result in significant damage to the pipeline, but pipe performance is very dependent on the pipe characteristics (diameter, wall thickness, steel type, etc). An empirical formula was derived for Z(dx=3) using six test results with keel angle of 27o. The regression formula is: Z(dx=3)=Dg (-0.50-3.4(ρgDg)/cu) [m] (10) In test conditions the scale factor for the depth is 1/100 and for the gravitational is 100g, so the same formula can be used for prototype. Equation 10 shows the undrained shear strength of the soil has a dominant influence on the geometry and depth of deformation of the
Test No.
Keel angle θ[°]
Cu [kPa]
Gouge Depth
Dg [mm]
m Mu
Fx/Fy [-] D3 [-]
7 14 18 7 0.7 1.2 -5.7 6 27 18 10 0.7 1.1 -4.5 3 27 18 10 1.0 1.3 -4.0
12 27 95 15 0.1 0.9 -2.0 8 27 95 22 0.2 1.0 -1.6 5 27 30 8 0.4 0.9 -2.7 1 27 35 10 0.4 1.3 -3.5 2 27 25 12 0.9 1.8 -3.8
11 27 20 10 0.6 1.4 -5.7 15 45 30 15 0.7 2.7 -3.1
-3.5
-3
-2.5
-2
-1.5
-1
-0.5
00 10 20 30 40 50 60 70 80
ββββ [Degrees]
D3
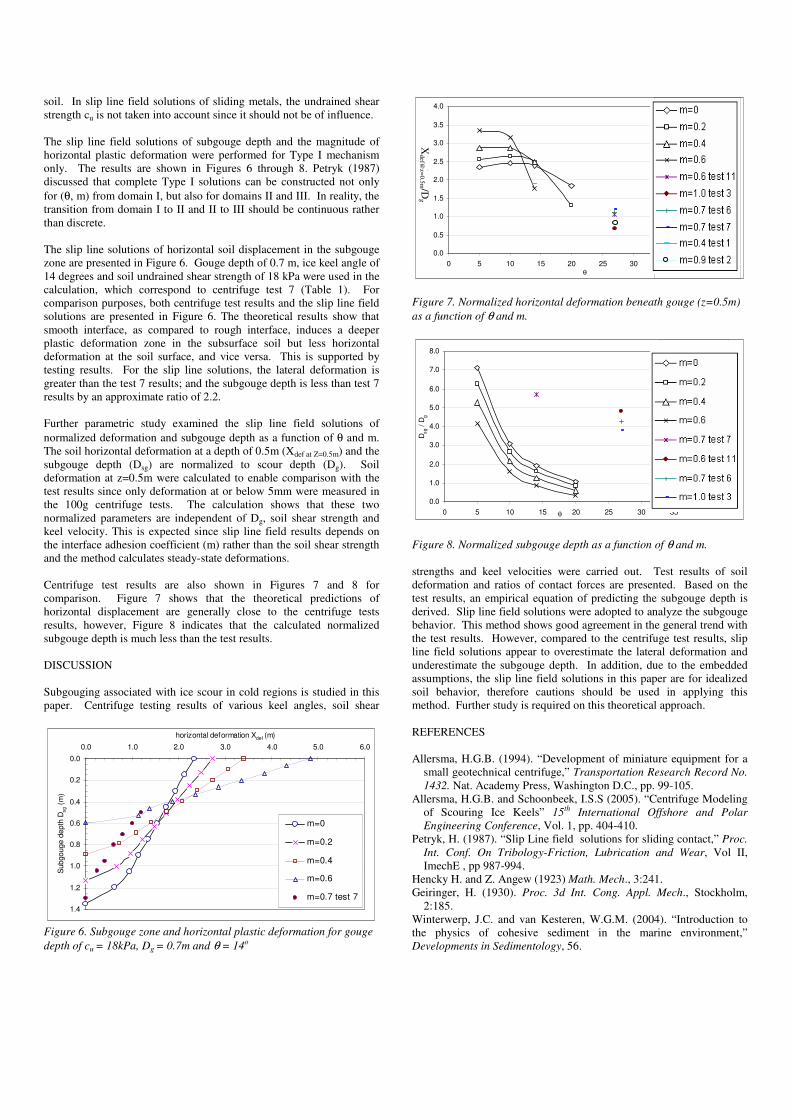
soil. In slip line field solutions of sliding metals, the undrained shear strength cu is not taken into account since it should not be of influence. The slip line field solutions of subgouge depth and the magnitude of horizontal plastic deformation were performed for Type I mechanism only. The results are shown in Figures 6 through 8. Petryk (1987) discussed that complete Type I solutions can be constructed not only for (θ, m) from domain I, but also for domains II and III. In reality, the transition from domain I to II and II to III should be continuous rather than discrete. The slip line solutions of horizontal soil displacement in the subgouge zone are presented in Figure 6. Gouge depth of 0.7 m, ice keel angle of 14 degrees and soil undrained shear strength of 18 kPa were used in the calculation, which correspond to centrifuge test 7 (Table 1). For comparison purposes, both centrifuge test results and the slip line field solutions are presented in Figure 6. The theoretical results show that smooth interface, as compared to rough interface, induces a deeper plastic deformation zone in the subsurface soil but less horizontal deformation at the soil surface, and vice versa. This is supported by testing results. For the slip line solutions, the lateral deformation is greater than the test 7 results; and the subgouge depth is less than test 7 results by an approximate ratio of 2.2. Further parametric study examined the slip line field solutions of normalized deformation and subgouge depth as a function of θ and m. The soil horizontal deformation at a depth of 0.5m (Xdef at Z=0.5m) and the subgouge depth (Dsg) are normalized to scour depth (Dg). Soil deformation at z=0.5m were calculated to enable comparison with the test results since only deformation at or below 5mm were measured in the 100g centrifuge tests. The calculation shows that these two normalized parameters are independent of Dg, soil shear strength and keel velocity. This is expected since slip line field results depends on the interface adhesion coefficient (m) rather than the soil shear strength and the method calculates steady-state deformations. Centrifuge test results are also shown in Figures 7 and 8 for comparison. Figure 7 shows that the theoretical predictions of horizontal displacement are generally close to the centrifuge tests results, however, Figure 8 indicates that the calculated normalized subgouge depth is much less than the test results. DISCUSSION Subgouging associated with ice scour in cold regions is studied in this paper. Centrifuge testing results of various keel angles, soil shear
0.0
0.2
0.4
0.6
0.8
1.0
1.2
1.4
0.0 1.0 2.0 3.0 4.0 5.0 6.0horizontal deformation Xdef (m)
Subg
ouge
dep
th D
sg (m
)
m=0
m=0.2
m=0.4
m=0.6
m=0.7 test 7
Figure 6. Subgouge zone and horizontal plastic deformation for gouge depth of cu = 18kPa, Dg = 0.7m and θ = 14o
0.0
0.5
1.0
1.5
2.0
2.5
3.0
3.5
4.0
0 5 10 15 20 25 30 35 40 45θ
X def a
t Z=0
.7D
g / D
g
m=0
m=0.2
m=0.4
m=0.6
m=0 test 11
m=0.6 test 3
m=0.6 test 6
m-0.6 test 7
m=0.6 test 1
m=0.6 test 2
Figure 7. Normalized horizontal deformation beneath gouge (z=0.5m) as a function of θ and m.
0.0
1.0
2.0
3.0
4.0
5.0
6.0
7.0
8.0
0 5 10 15 20 25 30 35θ
D sg /
D g
m=0
m=0.2
m=0.4
m=0.6
test7m-0.6
test11m=0
test6m=0.6
test3m=0.6
Figure 8. Normalized subgouge depth as a function of θ and m. strengths and keel velocities were carried out. Test results of soil deformation and ratios of contact forces are presented. Based on the test results, an empirical equation of predicting the subgouge depth is derived. Slip line field solutions were adopted to analyze the subgouge behavior. This method shows good agreement in the general trend with the test results. However, compared to the centrifuge test results, slip line field solutions appear to overestimate the lateral deformation and underestimate the subgouge depth. In addition, due to the embedded assumptions, the slip line field solutions in this paper are for idealized soil behavior, therefore cautions should be used in applying this method. Further study is required on this theoretical approach. REFERENCES Allersma, H.G.B. (1994). “Development of miniature equipment for a
small geotechnical centrifuge,” Transportation Research Record No. 1432. Nat. Academy Press, Washington D.C., pp. 99-105.
Allersma, H.G.B. and Schoonbeek, I.S.S (2005). “Centrifuge Modeling of Scouring Ice Keels” 15th International Offshore and Polar Engineering Conference, Vol. 1, pp. 404-410.
Petryk, H. (1987). “Slip Line field solutions for sliding contact,” Proc. Int. Conf. On Tribology-Friction, Lubrication and Wear, Vol II, ImechE , pp 987-994.
Hencky H. and Z. Angew (1923) Math. Mech., 3:241. Geiringer, H. (1930). Proc. 3d Int. Cong. Appl. Mech., Stockholm,
2:185. Winterwerp, J.C. and van Kesteren, W.G.M. (2004). “Introduction to the physics of cohesive sediment in the marine environment,” Developments in Sedimentology, 56.
Xdef@
z=0.5m /Dg
Top Related
Copyright © 2022 FDOKUMEN

