


Bahasa
Halaman
Hukum


ASIAN INSIGHTS VICKERS SECURITIES ed: TH / sa:JC, PY
Rocky Road, Take me home
Luxury residential and office subsectors to bottom
out ahead of other subsectors in 2017
Diversification remain a key strategy for most real
estate companies, cheap valuations could spark M&A
Deleveraging trend to kick in from 2017
Luxury residential and office are our sector picks in 2017. While the Singapore property market is expected to remain on a declining trend (suburban residential homes, industrial, retail and hospitality), we see green shoots in the office and luxury residential subsectors. This is mainly coming from expected higher transaction volumes and take-up rates for new buildings in 2017.
Continued focus on diversification while cheap valuations could spark M&A. We see continued interest from S-REITs and developers to invest overseas but see fewer completed deals given higher currency volatility. In Singapore, land-hungry developers are likely to turn towards the En-bloc market given limited sites in the public land tenders. S-REITs are likely to seek asset recycling in order to fund growth as cost of equity edge higher. Fueled by strong capital flows and attractive valuations of listed firms, we also see a sector consolidation as larger players look to gain access to land banks and income-producing properties at attractive prices.
Deleveraging trend in 2017 and beyond. With higher rates on the horizon, we expect selected developers and REITs to pare down debt over time when the opportunity arises. Of focus is close to c.S$6.3bn worth of bonds expiring in 2017-2018, where refinancingcould prove difficult for some given investor risk aversion post recent defaults in the oil & gas space.
Developers – too cheap to ignore. We see a myriad of catalysts for developers especially from M&A activities which will lift investor sentiment for the sector. Our picks are CDL and UOL. A wildcard could be a potential unwinding of government policies.
Singapore REITs – capital preservation is key. We prefer those with good earnings visibility and minimal downside to our/consensus estimates. Picks are K-REIT, A-REIT and MCT. Small cap picks are FLT, KDC REIT and Croesus.
STI : 2,880.76
Analyst Derek TAN +65 6682 3716 Mervin SONG CFA +65 6682 3715 [email protected] [email protected]
Rachel TAN +65 6682 3713 Singapore Research Team [email protected] [email protected]
Source: DBS Bank, Bloomberg Finance L.P.
Closing price as of 4 Jan 2017
DBS Group Research . Equity 6 Jan 2017
Singapore Industry Focus
Singapore Developers & REITs Refer to important disclosures at the end of this report
STOCKS
Price Mkt Cap Target Price Performance (%)
S$ US$m S$ 3 mth 12 mth Rating
Developers
City Developments 8.39 5,341 9.90 (8.5) 11.8 BUY UOL Group 6.12 3,448 7.20 7.5 1.2 BUY
REITs Ascendas REIT 2.31 4,597 2.65 (6.1) 3.1 BUY Keppel REIT 1.02 2,315 1.23 (8.0) 11.3 BUY Mapletree Commercial Trust 1.42 2,800 1.62 (8.0) 10.6 BUY
Frasers Logistics & Industrial Trust 0.94 925 1.10 (5.0) N.A BUY
Keppel DC REIT 1.20 938 1.33 2.5 20.4 BUY Croesus Retail Trust 0.85 452 0.99 (1.2) 3.9 BUY
Page 1

Industry Focus
Singapore Developers & REITs
ASIAN INSIGHTS VICKERS SECURITIES Page 2
The DBS Asian Insights SparX report is a deep dive look into thematic angles impacting the longer-term investment thesis for a sector, country or the region. We view this as an ongoing conversation rather than a one-off treatise on the topic, and invite feedback from our readers, and in particular welcome follow-on questions worthy of closer examination.
Table of Contents
1. Investment Summary 3
2. Peer Comparisons 5
3. Key Charts 7
4. Developers – Catalysts abound to lift valuations from multi-year lows4.1 Attractive valuations with upcoming catalysts. 4.2 Diversification to remain a key strategy for developers. 4.3 Improved transactions in the luxury end of the market to continue. 4.4 Looming ABSD deadlines not a precursor for a significant price cuts.
4.5 Potential land-banking opportunities in Singapore. 4.6 More En-bloc transactions in 2017. 4.7 Merger and Acquisition (M&A) activities could pick up. 4.8 Will Developers need to deleverage?
10
5. Singapore REITs – Déjà vu 5.1 Impact of higher interest rates on prices and distributions 5.2 Modest DPU growth.
5.3 Potential risk to property values in the industrial and hospitality sectors.
5.4 Acquisitions may be difficult to execute with redevelopments an attractive option.
31
6. Residential Subsector Outlook: Luxury home prices to bottom out in 20176.1 Trends, demand and supply outlook
6.2 Scenarios where government could relax policy measures
47
7. Office Subsector Outlook: Grade A office space to bottom by end 20177.1 Trends, demand and supply outlook
55
8. Retail Subsector Outlook: Hampered by weakening retail sales8.1 Trends, demand and supply outlook
63
9. Industrial Subsector Outlook: Year of consolidation post supply spikes9.1 Trends, demand and supply outlook
67
10. Hospitality Subsector Outlook: No turnaround in sight yet10.1 Trends, demand and supply outlook
74
11. Charts: S-REIT yield and P/Bk NAV Charts: Developers P/Bk NAV
83
Stocks Profiles 102
Note: Prices used as of 04 Jan-2017
Page 2

Industry Focus
Singapore Developers & REITs
ASIAN INSIGHTS VICKERS SECURITIES Page 3
Investment Summary
2017 remains a tenants' market as heightened supply completion poses a risk for most real estate sectors. It will be another year of moderation for the Singapore property market as we believe that most real estate subsectors will continue to see downside in rents and/or prices on the back of soft demand given the current economic slowdown. Meanwhile, heightened supply completion in 2017 means that it will remain a tenants' market.
Key Themes
1. Luxury-end of residential market and office sectors
bottoming out
Luxury residential and office sectors the brighter spot. However, among the real estate sectors, we see brighter prospects in the luxury end of the residential market and office subsectors. We believe that luxury residential prices in Singapore are attractive on a relative basis compared to home prices in the region which we expect higher investment transaction volumes in 2017. The office sector is projected to see slower rental declines of (5-10%) mainly due to better-than-projected take-up in upcoming new office buildings and see the sector bottoming out by end of 2017.
However, the retail, hospitality and industrial sectors are still expected to feel the pressure from projected negative net absorption, given excess supply outlook.
Singapore Property Clock
Source: DBS Bank
2. Developers and REITs to continue seeking overseas
opportunities; en-bloc deals to pick up in 2017
Diversification remains a key strategy but opportunities limited as currency volatility arises. We believe that property developers and REITs will continue their strategy to diversify overseas for growth but expect the acquisition momentum to taper on the back of increased currency volatility, coupled with higher cost of funds. Countries that we believe remain attractive on a currency-adjusted basis are London, Australia (Melbourne and Sydney) and selected Tier 1 cities of China like Shanghai.
Apart from acquisitions, REITs could also capitalize on the increased development limits (25% cap vs 10% previously subject to conditions) accorded by Monetary Authority of Singapore (MAS) to take on more asset enhancements to rejuvenate their portfolios and boost returns.
Developers are hungry for land in Singapore, more en-bloc deals in 2017. We expect continued increased participation from developers in the upcoming first half 2017 government land sales program (GLS) as developers look to replenish diminishing land banks which will mean that land prices are likely to remain firm. In addition, we expect to see more en-bloc deals for opportunities, especially in the luxury end of the market. These activities in our view, likely signal expectations that home prices should remain fairly stable in the coming years.
3. Privatisations, mergers and acquisitions to pick up
Privatizations, mergers and acquisitions (M&A) in the developer space to pick up. We believe that more listed property developers will take the delisting route along with the wave of privatizations that we saw in recent years. This puts valuations for property developers again in the spot light. Developers are trading at an attractive average 0.75x P/NAV, close to the -1SD of their historical trading range.
Reasons that drive this trend could be (i) sea of capital looking to deploy in Asian real estate, and (ii) strategic capital partners or major shareholders looking to recalibrate their strategies given the lacklustre capital markets and thus capturing the upside in the medium term.
We believe that such M&A activities highlight the attractive valuations of listed developers, namely City Developments, CapitaLand, Global Logistics Properties and UOL which are trading at close to -1 standard deviation (SD) to their 5-year historical trading range.
Page 3

Industry Focus
Singapore Developers & REITs
ASIAN INSIGHTS VICKERS SECURITIES Page 4
4. Deleveraging a focus as interest rate risks loom
Balance sheet deleveraging a major wildcard; spike in bond expiry in 2017-2018 a key data-point to watch. In view of the uncertainty of the pace of interest rate hikes in 2017, we believe that the early refinancing and hedging of interest rates will be a key focus for developers and REITs going forward. Of noteworthy is close to S$6.3 worth of bonds (S$4.0bn among developers) expiring over 2017-2018 where issuers will need to source for refinancing or alternative means to repay the bonds. While we believe that refinancing for REITs are likely to be more straight forward given that credits are backed by consistent recurring cash flows, we believe that certain developers, especially those in the mid-cap space which have been more opportunistic in tapping the bond market in recent years could face more hurdles. The recent bond defaults in 2016 among the oil & gas firms have cooled investors’ interest in bonds and we believe that investors will be more selective on the credit for future bond issuances. As such, the inability to refinance these expiring bonds could mean that issuers (developers or REITs) might seek alternative financing sources such as banks or even issuance of equity. Strategies for:
Singapore REITs – Capital preservation a key strategy Projected more hawkish four FED hikes to limit upside performance. We see increasing road-bumps to further outperformance for Singapore REITs (S-REITs) going into 2017, especially faced with a slowing DPU growth profile of 1.0% amidst a rising interest rate environment. DBS economist projects four FED rate hikes over the course of the year and as a result, the Singapore 10-year yield is expected to increase another 0.7% to a normalized c.3.0%. Forward FY17F yield spreads of 4.0% are already at historical mean levels which indicate that valuations for REITs are fair. Capital preservation is key. In an environment of low growth and rising interest rates, we believe that investors will look at stock-specific catalysts to maintain relative outperformance with the sector. These are S-REITs that provide (i) higher confidence in earnings sustainability and visibility, (ii) stronger relative growth, and (iii) lower gearing which limits impact of rising rates on distributions.
Our picks are Ascendas REIT (A-REIT), Keppel REIT (K-REIT), and Mapletree Commercial Trust (MCT). Among the mid-cap space, we like Croesus Retail Trust (CRT) , Keppel DC REIT (KDC REIT) and Frasers Logistics Trust (FLT). Singapore Developers – Catalysts abound to re-rate Potential policy relaxation and M&A could lift sentiment on developer stocks. Our call on the developers is mainly due to valuations supported by an improved outlook. Firstly, we view current trading levels of (P/Bk NAV of 0.75 and 0.65x P/RNAV) as attractive given that developers are trading at close to historical -1SD level. We believe that re-rating opportunities will come from the following data-points: (i) improved sell-through rates for existing developments on the back of improved transaction momentum, (ii) potential relaxation of selective government policy in 2017 driving higher demand for homes and investors’ sentiment, and (iii) potential privatization, M&A activities among developers or value-locking events like asset divestments which will provide a lift for NAVs and thus share prices for developers. Our picks are City Developments and UOL. Risks
1. Faster-than-projected rise in shorter-term interest rates which will negatively impact earnings and potentially capital values in the medium term.
2. External shocks impacting on GDP outlook and unemployment rates in Singapore which will have an overhang on demand/supply dynamics.
Page 4

Industry Focus
Singapore Developers & REITs
ASIAN INSIGHTS VICKERS SECURITIES Page 5
2. Peer Comparison
Singapore REITs Peer Comparisons
REIT FYE Price Rec Target Price
Mkt Cap
Total Return
DPU (S Cts) CAGR Yield (%)
P/NAV
(S$) (S$) S$'Bn (%) FY16/ 17F
FY17/ 18F
FY18F/ 19F
FY16/ 17F
FY17/ 18F
FY18F/ 19F
(x)
Office CCT Dec 1.505 BUY 1.70 4.5 18% 9.0 9.3 9.2 1% 5.9% 6.1% 6.1% 0.87 FCOT Sep 1.270 BUY 1.49 1.0 25% 9.8 9.8 9.8 0% 7.8% 7.8% 7.8% 0.83 KREIT Dec 1.020 BUY 1.23 3.5 26% 6.5 6.5 6.5 0% 6.3% 6.3% 6.3% 0.74 OUECT Dec 0.695 HOLD 0.74 0.9 15% 5.3 5.2 5.0 -3% 7.7% 7.6% 7.3% 0.71 Suntec Dec 1.650 HOLD 1.71 4.3 9% 10.0 10.0 10.0 0% 6.0% 6.0% 6.0% 0.78 Retail - - - - 6.4% 6.3% 6.4% 0.80 CRCT Dec 1.385 BUY 1.60 1.2 22% 10.3 10.5 10.3 0% 7.4% 7.6% 7.4% 0.78 CMT Dec 1.930 BUY 2.25 6.9 21% 11.2 11.2 11.3 0% 5.8% 5.8% 5.8% 1.01 CRT Jun 0.850 BUY 0.99 0.6 26% 7.5 8.2 8.5 7% 8.8% 9.6% 10.0% 0.88 FCT Sep 1.930 BUY 2.29 1.8 23% 11.8 11.8 12.1 2% 6.0% 6.0% 6.2% 1.02 SPH REIT Aug 0.955 HOLD 1.00 2.4 9% 5.5 5.7 5.7 2% 5.8% 5.9% 5.9% 1.00 MCT Mar 1.415 BUY 1.62 4.1 19% 8.7 8.9 9.1 2% 6.0% 6.2% 6.3% 1.11 MAGIC Mar 0.945 BUY 1.11 2.7 24% 7.2 7.3 7.4 1% 7.5% 7.7% 7.8% 0.77 SGREIT Dec 0.755 BUY 0.87 1.6 21% 5.2 5.2 5.4 2% 6.8% 6.8% 7.1% 0.81 Industrial - - - - 6.3% 6.4% 6.5% 0.97 a-itrust Mar 1.010 BUY 1.13 1.0 18% 5.9 6.4 6.2 3% 5.8% 6.3% 6.1% 1.52 A-REIT Mar 2.310 BUY 2.65 6.7 19% 15.7 15.6 15.7 0% 6.7% 6.6% 6.7% 1.14 Cache Dec 0.815 HOLD 0.93 0.7 22% 7.9 7.5 7.5 -2% 9.6% 9.2% 9.2% 0.81 CREIT Dec 0.540 HOLD 0.54 0.7 6% 4.1 4.2 4.2 1% 7.5% 7.6% 7.6% 0.79 FLT Sep 0.940 BUY 1.10 1.3 23% 6.6 6.6 6.8 1% 7.0% 7.0% 7.2% 1.10 MINT Mar 1.645 BUY 1.90 2.9 23% 11.3 11.5 12.0 3% 6.9% 7.0% 7.3% 1.18 MLT Mar 1.020 BUY 1.15 2.5 19% 7.2 7.4 7.6 3% 7.0% 7.2% 7.3% 0.99 SBREIT Dec 0.655 BUY 0.75 0.7 22% 6.1 6.1 6.2 1% 9.2% 9.3% 9.4% 0.80 Hospitality - - - - 7.1% 7.1% 7.2% 1.07 ASCHT Mar 0.700 BUY 0.84 0.8 27% 5.5 5.4 5.6 1% 7.8% 7.6% 8.0% 0.81 ART Dec 1.155 BUY 1.32 1.9 21% 8.2 8.1 8.3 1% 7.1% 7.0% 7.2% 0.81 CDREIT Dec 1.360 BUY 1.59 1.3 23% 9.4 9.0 9.3 0% 6.9% 6.6% 6.8% 0.84 FEHT Dec 0.595 HOLD 0.62 1.1 10% 4.3 4.0 4.2 0% 7.1% 6.6% 7.0% 0.62 FHT Sep 0.645 BUY 0.75 1.2 15% 5.2 5.0 5.3 2% 8.0% 7.7% 8.2% 0.85 OUEHT Dec 0.685 BUY 0.72 1.2 13% 4.3 4.5 4.6 3% 6.4% 6.7% 6.8% 0.78 Healthcare - - - - 7.2% 7.1% 7.4% 0..80 P-Life Dec 2.390 BUY 2.75 1.5 20% 12.1 12.2 12.3 1% 5.1% 5.1% 5.1% 1.47 Others - - - - IREIT Dec 0.720 HOLD 0.75 0.4 1% 6.3 6.4 6.3 0% 8.7% 8.8% 8.7% 1.16 KDCREIT Dec 1.200 BUY 1.33 1.4 -3% 6.8 7.2 7.5 5% 5.6% 5.8% 6.1% 1.33 Manulife US REIT
Jan 0.835 BUY 0.93 0.7 19% 5.6 6.0 6.1 n/a 6.7% 7.2% 7.2% 1.06
Sector Average 6.8% 6.8% 6.9% 0.95
Note: Prices used as of 04 Jan-2017
Source: Bloomberg Finance L.P., DBS Bank
Page 5

Industry Focus
Singapore Developers & REITs
ASIAN INSIGHTS VICKERS SECURITIES Page 6
Singapore Developers Peer Comparisons
Mkt Price 12-mth Company FYE Cap 4-Jan-17 RNAV *Assumed Target Price Upside P/RNAV Latest Qtr (S$m) (S$) (S$) Discount
(%) (S$) % Rcmd (x) P/NBV
Developers Capitaland Dec 13.0 3.06 4.80 -25% 3.60 17% BUY 0.64 0.77 City Dev Dec 7.5 8.39 11.90 -17% 9.90 19% BUY 0.70 0.84 Frasers Centrepoint Ltd
Sep 4.4 1.60 2.86 -30% 2.00 31% BUY 0.53 0.67
Global Logistics Properties
Mar 10.1 2.24 3.53 -30% 2.47 14% BUY 0.61 0.83
UOL Dec 4.7 6.12 10.23 -30% 7.20 23% BUY 0.57 0.59 Average 0.57 0.75 Non-Covered Guocoland Dec 10.9 2.40 - - - - - na 0.90 UIC Dec 3.9 2.79 - - - - - na 0.66 Ho Bee Dec 1.4 2.04 - - - - - na 0.50 Wheelock Dec 1.8 1.49 - - - - - na 0.60 Wing Tai Jun 1.3 1.62 - - - - - na 0.40 Bukit Sembawang Dec 1.2 4.48 - - - - - na 0.90 United Engineers Dec 1.6 2.57 - - - - - na 0.90 Tuan Sing Dec 0.4 0.29 - - - - - na 0.39 Hiap Hoe Dec 0.3 0.72 - - - - - na 0.51 Heeton Holdings Dec 0.1 0.39 - - - - - na 0.41 Average na 0.63 Average sector 0.68
Note: Prices used as of 04 Jan-2017 Source: Bloomberg Finance L.P., DBS Bank
Page 6

Industry Focus
Singapore Developers & REITs
ASIAN INSIGHTS VICKERS SECURITIES Page 7
2. Key Charts
Residential
Outlook – Positive (Luxury) Negative (Suburban)
Luxury end of the residential market bottoming out
Price differential across major cities (luxury hoe prices)
A tenants' market as vacancy rates spike
Home prices in the suburbs to see more downside
Key Assertions
DBS project prices for luxury residential homes (0% to +1%) to bottom out as transaction volumes and foreigner interests pick up within the Core Central region.
Prices for homes in suburban region to fall further by as much as -3 to -5% as affordability remain curbed for upgraders given higher-than-average differential in prices between HDB resale prices and prices of suburban homes.
Potential policy relaxation in 2017 given macro uncertainties in 2017 coming on the back of the pace of interest rate increases and its impact on mortgages.
Risks
Looming from higher mortgage rates, diminishing rental spreads amidst higher market vacancy rates could worsen the holding power for households.
• External shocks causing a downturn in the Singapore economy and a loss of jobs, resulting in a significant decline in the property market.
Source: URA, CBRE, DBS Bank
-10%
-5%
0%
5%
10%
15%
20%
25%
30%
0
20
40
60
80
100
120
140
160
180
1Q2004 3Q2005 1Q2007 3Q2008 1Q2010 3Q2011 1Q2013 3Q2014 1Q2016
(2010=100)
Property Price index (Outside Central Area) Spread vs HDB
High Demand From Upgraders
(P ublic to Private)
Af fordability Curbed but
spread is closing
-25%
-20%
-15%
-10%
-5%
0%
5%
10%
15%
20%
-
200
400
600
800
1,000
1,200
1,400
1,600
1,800
20
11
Q1
20
11
Q2
20
11
Q3
20
11
Q4
20
12
Q1
20
12
Q2
20
12
Q3
20
12
Q4
20
13
Q1
20
13
Q2
20
13
Q3
20
13
Q4
20
14
Q1
20
14
Q2
20
14
Q3
20
14
Q4
20
15
Q1
20
15
Q2
20
15
Q3
20
15
Q4
20
16
Q1
20
16
Q2
20
16
Q3
Un its Units Sold in Core Central Region (LHS) Rolling 4 Quarters Growth (%)
-
500
1,000
1,500
2,000
2,500
3,000
3,500
4,000
4,500
5,000
Monaco HongKong
London New York LosAngeles
Japan Singapore Toronto
US$ psf
60.0
70.0
80.0
90.0
100.0
110.0
120.0
130.0
4.0%
5.0%
6.0%
7.0%
8.0%
9.0%
10.0%
Jun-
04D
ec-0
4Ju
n-05
Dec
-05
Jun-
06D
ec-0
6Ju
n-07
Dec
-07
Jun-
08D
ec-0
8Ju
n-09
Dec
-09
Jun-
10D
ec-1
0Ju
n-11
Dec
-11
Jun-
12D
ec-1
2Ju
n-13
Dec
-13
Jun-
14D
ec-1
4Ju
n-15
Dec
-15
Jun-
164Q
16
Index Value(%)
Vacancy Rate (Non-Landed) (LHS) Rental Index (Non-Landed) (RHS)
Page 7

Industry Focus
Singapore Developers & REITs
ASIAN INSIGHTS VICKERS SECURITIES Page 8
Retail Outlook - Neutral
Rental reversions to moderate as RSI declines
Upcoming supply are mainly in the fringe
Key Assertions
Muted retail sales outlook poses a risk to landlords’ occupancy costs and rental reversions.
• Consolidation among retailers to intensify in 2017 amid rising labour costs and labour shortage.
• Better-performing malls with sizeable operational scale, strong record of recurring traffic which will continue to attract retailers.
Risks
• Increased penetration of e-commerce causing decline in retail sales.
• Weaker-than-expected economic growth (GDP), affecting consumer sentiment and expenditure.
• Weaker-than-expected tourist arrivals which will have an impact on retail sales performance in Orchard Road malls.
Source: DBS Bank
Office Outlook - Positive
Supply to fall off from 2018 onwards
Two-tier Market with Premium Grade A office leading
Key Assertions
• Demand outlook remains uncertain with a merry-go-round of tenants gravitating towards Grade A office space.
• A two-tier market to emerge; with Grade A office space leading the pack and Grade B office space needing to drop rents or undergo refurbishments to attract tenants.
• Office rents could bottom by end of 2017 as pre-commitment rates for key office buildings remain strong.
Risks
• Earlier completion of new office supply. • Shadow space from further contraction in demand from
the financial services sector.
Source: DBS Bank
-
0.50
1.00
1.50
2.00
2.50
2016 2017 2018 2019 2020
m'sqft
Downtown Core Fringe Area Rest of Central Area
Orchard Outside Central Region
-4%-2%0%2%4%6%8%10%12%
7.00
8.00
9.00
10.00
11.00
12.00
13.00
Spread between Premium Grade vs Grade A (RHS)
Colliers Premium Grade Raffles Place/New Downtown (LHS)
CBRE Grade A Core CBD (LHS)
S$ psf / mth
‐
2.0
4.0
6.0
8.0
10.0
12.0
14.0
16.0
18.0
20.0
‐1,500
‐1,000
‐500
0
500
1,000
1,500
2,000
2,500
2000
2001
2002
2003
2004
2005
2006
2007
2008
2009
2010
2011
2012
2013
2014
2015
2016
2017
2018
2019
2020
2021
'000 sqft
Net supply: Downtown Core (LHS)
Net demand: Downtown Core (LHS)
CBRE Grade A office rents (RHS)
S$ psf pm
Post GFC2010‐2014 average:1.10m sqft
2015‐2019 average:1.15m sqft
Page 8

Industry Focus
Singapore Developers & REITs
ASIAN INSIGHTS VICKERS SECURITIES Page 9
Industrial Outlook – Negative (Factory & Warehouse Space)
Positive (Business Parks)
Time to absorb supply that entered the market
Rental reversions remain negative
Key Assertions
Market rents to moderate 5% p.a. due to time needed to absorb supply completion in 2016-2017. Market vacancy rates to hit a high of 10%.
Business Park space to remain stable; given lack of new supply but downside risk persists if CBD office rents weaken further.
Industrial REITs' rental reversions to remain generally negative over 2017-2018.
Risks
Weaker than-expected Singapore economy resulting in further-than-expected declines in rents.
Shadow space in the single-user factory/warehouse sectors which result in increased competition for tenants.
Source: DBS Bank
Hospitality Outlook - Negative
Supply to continue outpace demand growth in 2017
RevPAR to remain under pressure in 2017
Key Assertions
We expect demand in 2017 to grow by 4% y-o-y. However, as corporate demand is expected to remain soft, projected demand for accommodation growth should remain modest.
Persistent supply pressures arising from a 6% increase in room stock will pressure room and occupancy rates. We project RevPAR to fall by 4% in 2017 before rebounding thereafter.
Risks
Slower-than-expected rebound in Chinese tourist arrivals and greater level of competition from regional markets would cause RevPAR to drop more than expected.
Upside risk would come from delays in opening of new hotels.
Source: DBS Bank
0%
2%
4%
6%
8%
10%
12%
-
5.0
10.0
15.0
20.0
25.0
30.0
35.0
2,007 2,008 2,009 2,010 2,011 2,012 2,013 2,014 2,015 2016F 2017F 2018F 2019F 2020F
m' sqft
Demand Supply Vacancy Rate (RHS)-20%
-10%
0%
10%
20%
30%
40%
50%
2009 2010 2011 2012 2013 2014 2015 2016F 2017F 2018F
Business Park Warehouse Factory
7%
-3%
1%
9%
4%4%
6%
3%
-2%
3.4%
5%4%
7%
4%
7%
4%
6%
2%
-1% -1%
-5%-4% -4%
3%
-6.0%
-4.0%
-2.0%
0.0%
2.0%
4.0%
6.0%
8.0%
10.0%
2013 2014 2015 2016F 2017F 2018F
Visitor Arrivals Visitor Days Room supply RevPAR
y-o-y growth
61,287 2,520 3,857
1,355
45,000
50,000
55,000
60,000
65,000
70,000
75,000
2015 2016F 2017F 2018F
Rooms
Hotel rooms Expected net additions
4.1%
6.0%2.0%
Page 9

Industry Focus
Singapore Developers & REITs
ASIAN INSIGHTS VICKERS SECURITIES Page 10
4. Developers – Catalysts abound to lift valuations from multi-year lows
Key Points
Developers to continue looking for opportunities overseas, high-end residential space
M&A and potential policy relaxation could lift sentiment for the sector
Top picks: City Developments Limited (CDL), UOL
Range bound in 2016. The Singapore Property Developers (measured by the FSTREH index) has fallen by close to 5% since the start of 2016 and prices are generally c.9% below prices from the start of 2015. The FSTREH lagged the S-REITs for the most of 2016 but caught up after the recent spike in bond yields saw S-REIT prices weaken on the back of market expectations of a more hawkish FED rate hike momentum in 2017.
4.1 Attractive valuations with upcoming catalysts Looking forward, we believe that the Singapore developers (SG Developers) can outperform the S-REITs, especially with expected headwinds from the uncertainty in the number of
subsequent FED hikes over 2017 to mean limited re-rating opportunities for the S-REITs. We see re-rating catalysts for Singapore Developers come 2017 on the back of (i) improved investor sentiment on increasing expectations of a government policy easing in 2017 as property prices fall by as much as 12-15% from the peak (currently 11%) (ii) potential merger and acquisition (M&A) activities, and (iii) improved balance sheets on the back of expected asset recycling/deleveraging trend. The Singapore Developers, which are trading at an average P/NAV of 0.7x, close to its -1SD is attractive. Current P/NAV valuations are close to multi-year lows. At a 0.7x P/NAV, valuations for developers are similar during past periods of economic stress in 1997, 2003 and 2009, which we believe will not be the case going forward, especially with the Singapore GDP projected to grow by c.1.3% in 2017 according to our DBS economists. While we continue to expect Singapore residential prices to fall marginally in 2017, most negatives are priced in, in our view. We believe that we are closer to the trough, especially with expectations that the government will likely tweak policy measures to negate a further fall in prices.
Figure 1: Developers underperformed S-REITs in 2016 but caught up in 4Q16
Source: Bloomberg Finance L.P., DBS Bank
600.00
650.00
700.00
750.00
800.00
850.00
900.00
‐10%
‐8%
‐6%
‐4%
‐2%
0%
2%
4%
6%
1/1/15 1/4/15 1/7/15 1/10/15 1/1/16 1/4/16 1/7/16 1/10/16
Index Value Relative Performance (%)
Relative Performance Developers
Page 10

Industry Focus
Singapore Developers & REITs
ASIAN INSIGHTS VICKERS SECURITIES Page 11
Figure 2: Valuations attractive as developers still trade at close to past 3 market down-cycle troughs
Source: Bloomberg Finance L.P., DBS Bank
Figure 3: Historical developers Price-to-Bk NAV vs
PPI
Figure 4: Developers trading at 45% discount to
RNAVs (-1.0 standard deviation)
Source: URA, DBS Bank
-
0.50
1.00
1.50
2.00
2.50
-
20.0
40.0
60.0
80.0
100.0
120.0
140.0
160.0
180.0 (x )Index Value
Property Price Index Developer P/Bk NAV
1997-98 Asian Financial Crisis
2008-2009 Global Financial Crisis
2002-2003 Dot Com Crash
2011 Euro Crisis
Mean: 0.95x
-1 SD: 0.60x
+1 SD: 1.30x
-
0.50
1.00
1.50
2.00
2.50
Jan-97 Jan-99 Jan-01 Jan-03 Jan-05 Jan-07 Jan-09 Jan-11 Jan-13 Jan-15 Jan-17
P/NAV (x)
P/NAV (w/o GLP) Mean - 1 SD +1 SD P/NAV (with GLP)
-60%
-50%
-40%
-30%
-20%
-10%
0%2006 2007 2008 2009 2010 2011 2012 2013 2014 2015 2016
Discount to RNAV Mean +1 SD - 1 SD
Page 11
Industry Focus
Singapore Developers & REITs
ASIAN INSIGHTS VICKERS SECURITIES Page 12
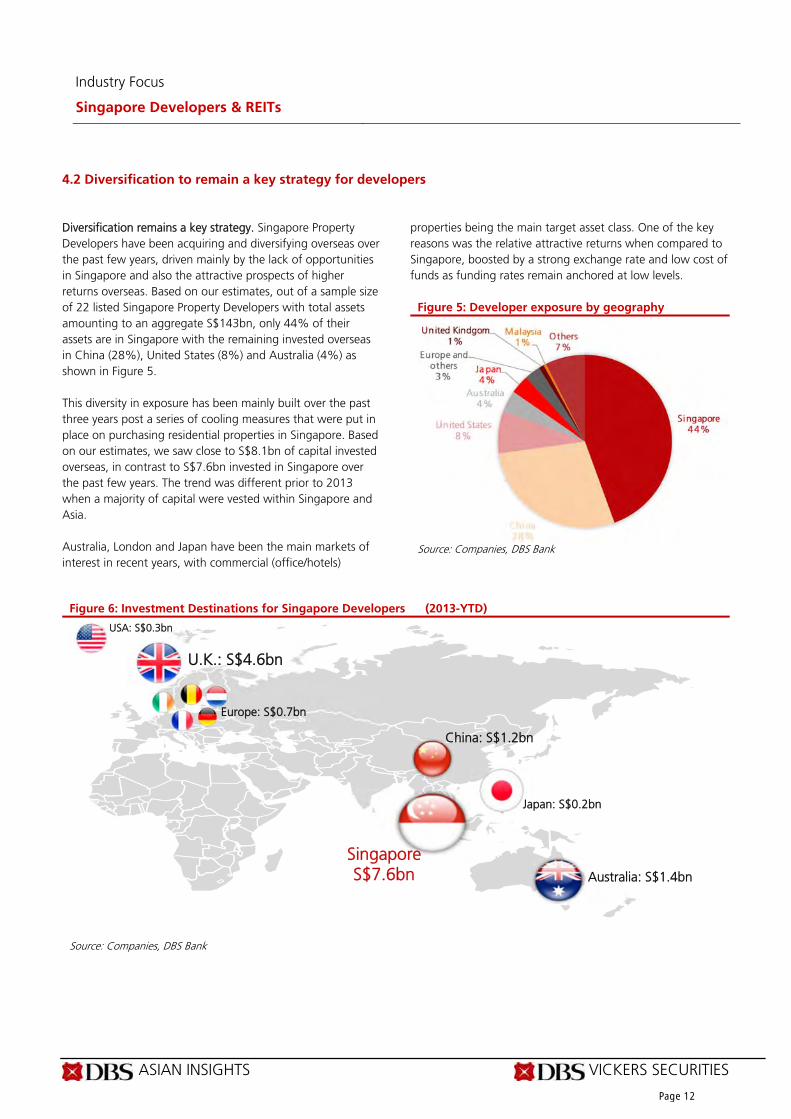
4.2 Diversification to remain a key strategy for developers Diversification remains a key strategy. Singapore Property Developers have been acquiring and diversifying overseas over the past few years, driven mainly by the lack of opportunities in Singapore and also the attractive prospects of higher returns overseas. Based on our estimates, out of a sample size of 22 listed Singapore Property Developers with total assets amounting to an aggregate S$143bn, only 44% of their assets are in Singapore with the remaining invested overseas in China (28%), United States (8%) and Australia (4%) as shown in Figure 5. This diversity in exposure has been mainly built over the past three years post a series of cooling measures that were put in place on purchasing residential properties in Singapore. Based on our estimates, we saw close to S$8.1bn of capital invested overseas, in contrast to S$7.6bn invested in Singapore over the past few years. The trend was different prior to 2013 when a majority of capital were vested within Singapore and Asia. Australia, London and Japan have been the main markets of interest in recent years, with commercial (office/hotels)
properties being the main target asset class. One of the key reasons was the relative attractive returns when compared to Singapore, boosted by a strong exchange rate and low cost of funds as funding rates remain anchored at low levels.
Figure 5: Developer exposure by geography
Source: Companies, DBS Bank
Figure 6: Investment Destinations for Singapore Developers (2013-YTD)
Source: Companies, DBS Bank
Australia: S$1.4bn
Singapore S$7.6bn
U.K.: S$4.6bn
Europe: S$0.7bn
USA: S$0.3bn
Japan: S$0.2bn
China: S$1.2bn
Page 12

Industry Focus
Singapore Developers & REITs
ASIAN INSIGHTS VICKERS SECURITIES Page 13
Overseas capital deployment to continue but opportunities limited as currency volatility impact returns. While we believe that developers will continue to seek higher returns overseas, the yield compression seen for prime assets over the past few years will mean that market focus will likely change. According to JLL, an SGD investor total foreign currency (FX) adjusted total return will diminish over 2016-2018 and is forecasted to yield in the -3% to 10% range with Shanghai, Sydney and Melbourne offering the highest returns which will continue to feature regularly on developers’ horizon over time. We believe that London will remain one of the key investment markets, despite Brexit going forward and JLL expecting returns to moderate, mainly due to weak GBP in the medium term. Developers are likely to be still keen on the UK if it maintains its financial hub status in Europe. As developers are expected to continue targeting to grow their recurring income base, we believe that core assets in the commercial space which offer stable cash flows will be key acquisition targets.
DBS economist believes that most major currencies will depreciate against the US dollar over 2017, as the normalization of the US monetary policy and hawkish policies from new President Trump might lead to flows from emerging markets back to the US. Looking forward, currency volatility will continue to have a big impact on total returns for investors diversifying into real estate outside their home markets, and it is important to closely monitor currency movements.
In Singapore, developers could turn to M&A and en-bloc opportunities to land bank. Developers who are looking to replenish their property land banks in Singapore have turned up in force in the government land sales program (GLS) in 2016 and have also ventured into the En-bloc market to gain access to land banks. Looking ahead, we believe that another avenue will be in the listed space, especially with listed developers trading at 0.7x P/NAV and certain mid-cap developers trading below that. As pressure from additional buyer stamp duties (ABSD) on land purchase and Qualifying Charges (QC) increase from 2017 onwards, we believe this could spark merger and acquisition (M&A) activities going forward.
Figure 7: FX adjusted returns over time
Source: JLL, DBS Bank
-20%
-15%
-10%
-5%
0%
5%
10%
15%
20%
Sing
apor
e
Mel
bour
ne
Sydn
ey
Hon
g Ko
ng
Seou
l
Toky
o
Lond
on
New
Yor
k
Beiji
ng
Shan
ghai
Del
hi
Mum
bai
Kual
a Lu
mpu
r
Sing
apor
e
Mel
bour
ne
Sydn
ey
Hon
g Ko
ng
Seou
l
Toky
o
Lond
on
New
Yor
k
Beiji
ng
Shan
ghai
Del
hi
Mum
bai
Kual
a Lu
mpu
r
Sing
apor
e
Mel
bour
ne
Sydn
ey
Hon
g Ko
ng
Seou
l
Toky
o
Lond
on
New
Yor
k
Beiji
ng
Shan
ghai
Del
hi
Mum
bai
Kual
a Lu
mpu
r
FX gain/loss Property Return FX adjusted total return
2016 2017 2018
Page 13
Industry Focus
Singapore Developers & REITs
ASIAN INSIGHTS VICKERS SECURITIES Page 14
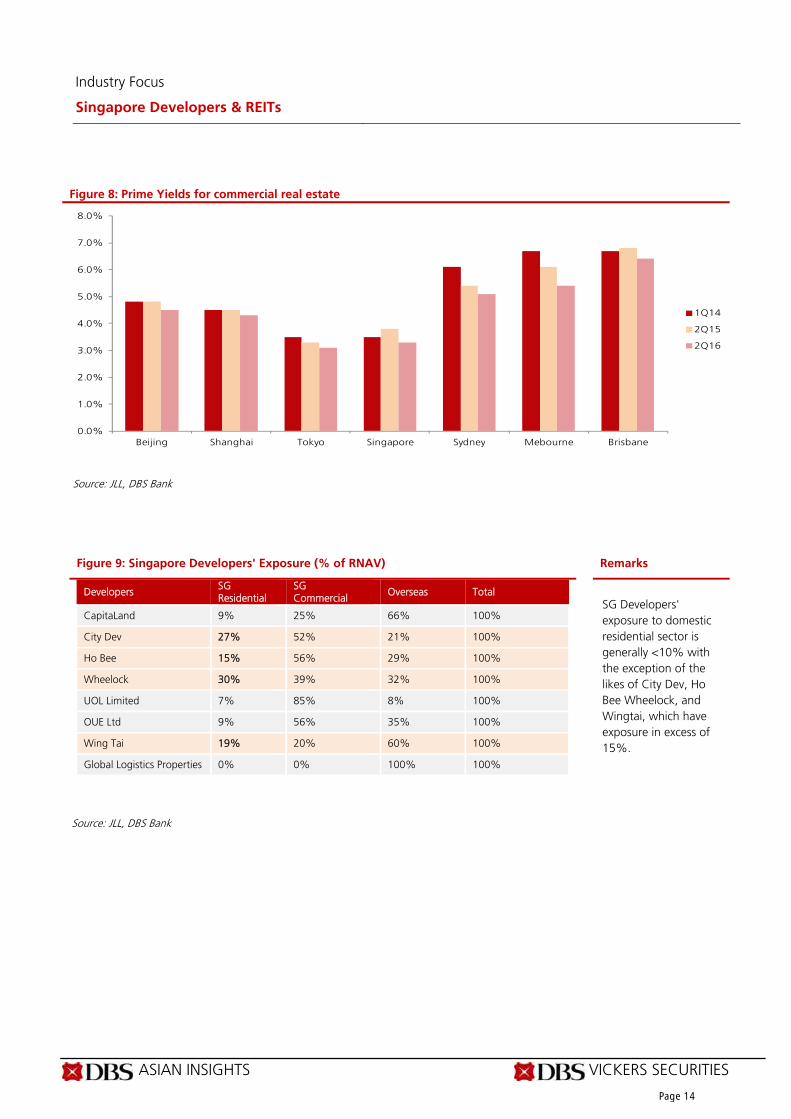
Figure 8: Prime Yields for commercial real estate
Source: JLL, DBS Bank
Figure 9: Singapore Developers' Exposure (% of RNAV) Remarks
Developers SG Residential
SG Commercial
Overseas Total
CapitaLand 9% 25% 66% 100%
City Dev 27% 52% 21% 100%
Ho Bee 15% 56% 29% 100%
Wheelock 30% 39% 32% 100%
UOL Limited 7% 85% 8% 100%
OUE Ltd 9% 56% 35% 100%
Wing Tai 19% 20% 60% 100%
Global Logistics Properties 0% 0% 100% 100%
SG Developers' exposure to domestic residential sector is generally <10% with the exception of the likes of City Dev, Ho Bee Wheelock, and Wingtai, which have exposure in excess of 15%.
Source: JLL, DBS Bank
0.0%
1.0%
2.0%
3.0%
4.0%
5.0%
6.0%
7.0%
8.0%
Beijing Shanghai Tokyo Singapore Sydney Mebourne Brisbane
1Q14
2Q15
2Q16
Page 14

Industry Focus
Singapore Developers & REITs
ASIAN INSIGHTS VICKERS SECURITIES Page 15
4.3 Improved transactions in the luxury end of the market to continue Pick-up in transactions in the luxury residential market. We believe that the luxury end of the market is approaching a near-term bottom, judging by the increased number of transactions seen in the core central region. According to URA-lodged caveats, YTD 9M16 transactions by Foreigners (excluding Singapore permanent residents) rose by close to 12% compared to the same period a year ago. We note that the increase in transactions mainly come from buyers in China, Malaysia and Indonesia, up more than 15% y-o-y respectively. If transaction volumes sustain, it will imply investors’ confidence in Singapore’s fundamentals and prospects of long-term capital gains from current levels. Attractive relative pricing compared to other popular investment destinations. According to JLL, Singapore remains an attractive investment destination, especially with additional
stamp duties recently levied on foreign purchases by other popular residential investment destinations such as London, Melbourne, Sydney which somewhat makes Singapore attractive again for international investors looking for real estate purchases. In addition, we note that (figure 1212) Singapore luxury home prices have corrected 11% over the past few years and the gap has widened over time, when compared to other residential investment destinations such as Hong Kong, London and New York, where prices have continued to increase over the past few years (figure 13). Therefore, we believe that Singapore luxury home is attractive from a relative pricing across countries with potential capital upside in the medium term once the current over-supply situation normalizes.
Figure 10: Transactions in Core Central region growing Figure 11: Core Central Region transactions
outpacing overall total Singapore market
Source: Companies, DBS Bank Figure 12: % Growth in prices Figure 13: Prices of luxury residential homes
-25%
-20%
-15%
-10%
-5%
0%
5%
10%
15%
20%
-
200
400
600
800
1,000
1,200
1,400
1,600
1,800
20
11
Q1
20
11
Q2
20
11
Q3
20
11
Q4
20
12
Q1
20
12
Q2
20
12
Q3
20
12
Q4
20
13
Q1
20
13
Q2
20
13
Q3
20
13
Q4
20
14
Q1
20
14
Q2
20
14
Q3
20
14
Q4
20
15
Q1
20
15
Q2
20
15
Q3
20
15
Q4
20
16
Q1
20
16
Q2
20
16
Q3
Un its Units Sold in Core Central Region (LHS) Rolling 4 Quarters Growth (%)
-30%
-25%
-20%
-15%
-10%
-5%
0%
5%
10%
15%
20%
25%
20
11
Q1
20
11
Q2
20
11
Q3
20
11
Q4
20
12
Q1
20
12
Q2
20
12
Q3
20
12
Q4
20
13
Q1
20
13
Q2
20
13
Q3
20
13
Q4
20
14
Q1
20
14
Q2
20
14
Q3
20
14
Q4
20
15
Q1
20
15
Q2
20
15
Q3
20
15
Q4
20
16
Q1
20
16
Q2
20
16
Q3
% Change (Rolling 4 Quarters)
Overall Transactions Core Central Region
-
500
1,000
1,500
2,000
2,500
3,000
3,500
4,000
4,500
5,000
Monaco HongKong
London New York LosAngeles
Japan Singapore Toronto
US$ psf
90.0
110.0
130.0
150.0
170.0
190.0
210.0
230.0
Q1
201
0
Q2
201
0
Q3
201
0
Q4
201
0
Q1
201
1
Q2
201
1
Q3
201
1
Q4
201
1
Q1
201
2
Q2
201
2
Q3
201
2
Q4
201
2
Q1
201
3
Q2
201
3
Q3
201
3
Q4
201
3
Q1
201
4
Q2
201
4
Q3
201
4
Q4
201
4
Q1
201
5
Q2
201
5
Q3
201
5
Q1
201
6
Q2
201
6
Q3
201
6
Index Value
Hong Kong Korea Malaysia Singapore Taiwan Thailand
Source: URA, MAS, Christie Real Estate, JLL, Knight Frank, DBS Bank
Page 15

Industry Focus
Singapore Developers & REITs
ASIAN INSIGHTS VICKERS SECURITIES Page 16
4.4 Looming ABSD deadlines not a precursor for a significant price cuts for all developments. Strong sales in the core central region could mean firmer prices going forward. There were close to 22,502 unsold units (both completed and uncompleted) as of 3Q16 of which 24% of 5,464 units were located in the Core Central region as of 3Q16. The strong sales seen in recent quarters (especially for recently re-launched completed projects – Gramercy Park, OUE Twin Peaks near downtown Orchard) have brought the number of available units for sale down by 6% q-o-q, which is one of the fastest fall compared to homes in other regions. Based on the current run-rate for residential transactions, we estimate that total transactions in 2016 will likely come in at close to 15,500 (c.8,000 primary sales and 7,500 secondary sales), which implies close to 10% growth y-o-y. The increase is mainly driven from a marked increase in both the primary and secondary transactions. The former is mainly due to generally more aggressive marketing activities and price discounts. The improvement seen in the secondary market mainly came from i) higher transactions in the Core Central region and ii) innovative financing schemes and price discounts offered by developers for selected de-licensed projects which resulted in fairly good response from buyers (see figure 14).
Selected impact of ABSD deadlines as most projects continue to enjoy healthy margins. Developers with projects that are subjected to deadlines on the ABSD remission on residential sites in 2017-2018 have also done well, in our view. Based on our analysis of selected projects with significant unsold inventories at the start of 2016 and are likely to be under pressure to clear stock due to looming ABSD deadlines in 2017-2018, most have cleared a substantial portion of their inventory. This is mainly coming from more aggressive marketing activities while prices dipped slightly by 4-12%, with some staying steady as shown in Figure 15. This is against investors’ initial concern that developers might have to suffer deep cuts in prices in order to move unsold inventories. The pick-up in sales momentum, in our view, will likely give developers more optimism to continue marketing existing projects while upcoming property launches in the Central region could also increase in order to capture the current improved sentiment in that space. We believe that developers are likely to pay the ABSD for most projects come 2017 as margins are expected to remain healthy (figure 16).
Figure 14. Pipeline supply of unsold private homes (excluding executive condominiums) as of end of 3rd quarter 2016
Total Units Core Central Region
Rest of Central Region
Outside Central Region
Remarks
(units) (units) (units) (units) Units Available for sale (3Q16): Unsold uncompleted units 20,577 4,711 7,130 8,736 Unsold completed units 1,925 753 543 629 Total unsold units 22,502 5,464 7,673 9,365 % Chg Q-o-Q -3% -6% 1% -5% Demand : Primary Sales (YTD 9M16) 5,253 444 1,715 3,094 Secondary Sales 6,337 1568 1792 2977 Total Sales 11,590 2,012 3,507 6,071
Ratio (Supply/ annualised primary sales) 3.2 9.2 3.4 2.3 Ratios for CCR and RCR regions improved while OCR ratios declined.
Primary Sales (2015) 7,440 407 1,884 5,147 Secondary Sales (2015) 6,677 1,452 1,944 3,281 14,117 1,859 3,828 8,428 Ratio of Supply/Demand 3.0 13.4 4.1 1.8 Ratios for CCR highest due to
low number of primary sales. Average Primary Sales (2013-2016) 7,030 530 4,400 2,100 Average Secondary Sales (2013-2016) 7,475 1,572 2,071 3,464 14,505 2,102 6,471 5,564
Source: URA, DBS Bank
Page 16

Industry Focus
Singapore Developers & REITs
ASIAN INSIGHTS VICKERS SECURITIES Page 17
Figure 15: ABSD payable for selected projects with high unsold inventory in 2017 / 2018
ABSD liability
Region Project Developer Total Units
Unsold (Jan’16)
Unsold Unsold (Nov’16)
Unsold Units Sold in
2016
Land Cost
Estimated ABSD
(%) (%) (S$’m) (S$’m)
ABSD Payable for projects from government land sites
Jan’17 OCR The Trilinq IOI Properties 755 528 70% 303 40% 225 408 52.1
Feb’17 RCR Mon Jervois Singapore Land 140 61 44% 45 32% 16 118.9 15.2
Mar’17 OCR Kingsford Hillview Peak
Kingsford 512 249 49% 22 4% 227 243.2 31
Jun’17 OCR Vue 8 Residences
Capital Devt. 463 172 37% 84 18% 88 211 26.9
Jul’17 CCR Pollen & Bleu Singapore Land 106 94 89% 93 88% 1 113.2 14.4
Jul’17 RCR Sant Ritz Santarli Corp 214 24 11% 10 5% 14 114.8 14.7
Sep’17 CCR The Siena Far East Org. 54 22 41% 12 22% 10 45.8 5.8
Sep’17 RCR The Crest Wingtai,Metro,UE
469 366 78% 325 69% 41 516 65.9
Oct’17 OCR The Glades Keppel Land 726 343 47% 134 18% 209 434.6 55.5
Dec’17 RCR Alex Residences
Singapore Land 429 173 40% 152 35% 21 332.7 41.6
Jan’18 OCR The Panorama Wheelock 698 126 18% 28 4% 98 550 70.2
Apr’18 OCR Riverbank @ Fernvale
UOL Group 555 188 34% 64 12% 124 262.1 50.2
Jun’18 RCR Highline Residences
Keppel Land 500 320 64% 215 43% 105 550.3 105.3
Apr’18 OCR The Santorini MCC Land 597 390 65% 328 55% 62 289.7 55.5
Sep’18 CCR Sophia Hills Hoi Hup 493 437 89% 346 70% 91 442.3 84.7
ABSD Payable for projects from private land sites
Mar’17 CCR Meyer Melodia Cang Properties
16 15 94% 15 94% 0 9.4 1.2
Mar’17 CCR Robin Suites Robin25 Pte Ltd
92 26 28% 6 7% 20 54 6.8
Jan’17 RCR Ascent @ 456 Quest Homes 28 13 46% 10 36% 3 24 3.1
Apr’17 OCR The Bently Residences
Goodland Group
48 15 31% 5 10% 10 27 3.4
Jun’17 RCR Neem Tree Aylesbury Pte Ltd
84 67 80% 64 76% 3 46 5.9
Sep’17 OCR The Creek @ Bukit
Chiu Teng Group
260 144 55% 107 41% 37 190 24.5
Sep’17 OCR Rezi3Two Tee, KSH and Heeton
65 22 34% 7 11% 15 22.6 2.8
Oct’17 OCR Lotus Ville JVA Venture 11 8 72% 7 64% 1 18 2.3
Nov’17 CCR The Rise @ Oxley
Hao Yuan 120 51 43% 25 21% 26 130 16.6
Source: URA, DBS Bank
Page 17

Industry Focus
Singapore Developers & REITs
ASIAN INSIGHTS VICKERS SECURITIES Page 18
Figure 16: Selling prices indicate that most projects will still earn good margins after payment of ABSD
Project Est. Breakeven
Est. Breakeven with ABSD
Selling Prices
< 2016
Selling prices in
2016 % Chg Average
Prices Margins
(q/o ABSD) Margins
(with ABSD)
(S$’psf) (S$’psf) (S$’psf) (S$’psf) (%) (S$’psf) (%) (%)
ABSD Payable for projects from government land sites
The Trilinq 920 990 1,405 1,404 0% 1,404 53% 42%
Mon Jervois 1,265 1,400 1,981 1,832 -8% 1,907 51% 36%
Kingsford Hillview Peak 1,010 1,090 1,367 1,286 -6% 1,326 31% 22%
Vue 8 Residences 780 830 983 992 1% 988 27% 19%
Pollen & Bleu 1,450 1,575 1,922 1,801 -6% 1,862 28% 18%
Sant Ritz 1,000 1,080 1,419 1,358 -4% 1,388 39% 29%
The Siena 1,500 1,650 2,067 1,826 -12% 1,947 30% 18%
The Crest 1,350 1,470 1,698 1,718 1% 1,708 27% 16%
The Glades 1,530 1,675 1,454 1,412 -3% 1,433 -6% -14%
Alex Residences 1,350 1,500 1,705 1,943 14% 1,824 35% 22%
The Panorama 1,180 1,300 1,243 1,220 -2% 1,232 4% -5%
Riverbank @ Fernvale 850 940 976 992 2% 984 16% 5%
Highline Residences 1,600 1,800 1,879 1,735 -8% 1,807 13% 0%
The Santorini 950 1,035 1,131 1,082 -4% 1,106 16% 7%
Sophia Hills 1,450 1,650 1,995 1,916 -4% 1,955 35% 19%
ABSD Payable for projects from private land sites
Mayer Melodia 510 530 2,226 - 0% 1,113 >100% >100%
Robin Suites 1,450 1,600 2,496 2,276 -9% 2,386 65% 49%
Ascent @ 456 1,400 1,580 1,506 1,527 1% 1,516 8% -4%
The Bently Residences 1,000 1,050 1,408 1,229 -13% 1,319 32% 26%
Neem Tree 1,180 1,285 1,616 1,756 9% 1,686 43% 31%
The Creek @ Bukit 1,180 1,400 1,589 1,656 4% 1,622 37% 16%
Rezi3Two 1,000 1,050 1,507 1,533 2% 1,520 52% 45%
Lotus Ville 775 830 803 754 -6% 779 0% -6%
The Rise @ Oxley 1,525 1,685 2,335 2,283 -2% 2,309 51% 37%
Source: URA, DBS Bank
Page 18

Industry Focus
Singapore Developers & REITs
ASIAN INSIGHTS VICKERS SECURITIES Page 19
4.5 Potential land-banking opportunities in Singapore
Developers could turn towards the en-bloc sites or even M&A to grow. The government residential land tenders have remained competitive, driving land bid prices high, following the dearth of land supply since the property market peaked in 2013, coupled by developers having pre-sold most of their inventory on their balance sheets on hand. Looking ahead, as the government continues to maintain a low supply in the upcoming 1H17 land tenders, we believe that developers could turn towards the en-bloc market or even look to M&A to continue land banking and to seek growth.
Apart from government land sales, developers have turned to opportunities in the private market as evidenced by the recent pick-up in en-bloc transactions.
Smaller developers, some of which on average trade at a 50% discount to book values, could be attractive acquisition or privatisation candidates.
Limited government land sales (GLS) to result in sticky
land bid prices
Government residential land sales at its lowest level since GFC. Since the property market peaked in 2013, the government has been moderating the land supply into the market. Total GFA of government residential land sales
tendered out in 2016 has reached its lowest level at approximately 4.4m sqft, 75% below the peak in 2012.
Unsold inventory at the lowest since 2001. With the government moderating the land supply for a few years now, unsold inventory of residential properties has reached its lowest levels since 2001. As at 3Q2016, unsold inventory had almost halved since its peak in 2011.
Land prices have remained sticky. While land prices from the government land tenders have moderated marginally in 2014 to 2015 (highest land prices within the respective year fell c.27% to close to S$900psf ppr levels from a high of S$1,163psf ppr in 2013), we saw land prices in 2016 achieve a record high of S$1,239 psf ppr.
Land bids are increasingly more competitive as spreads thin. The spreads between the winning bid compared to the 2nd and median bids have also narrowed from 15% back in 2013 (peak of 62% in 2009) to 3% in 2016. The number of bids has increased to an average of 12 in 2016, above the historical average of eight bids.
Figure 17: Shortage of land supply from the government
Figure 18: Land prices remain steady as competition remains high
Source: Realis, DBS Bank Source: Realis, DBS Bank
197 245 350 318 228 203 280 320 291
418 489 438 483 481
285 268 350
507
639
460 533
607
869
1,108 1,163
849 871
1,239
241 256 350
413 436 310
463 404
463
681 724650 695
809
-
200
400
600
800
1,000
1,200
1,400
2002
2003
2005
2006
2007
2008
2009
2010
2011
2012
2013
2014
2015
2016
Pri
ce (S$psf
)
Min Average Max
-
100
200
300
400
500
600
700
800
1995
1996
1997
1998
1999
2000
2001
2002
2003
2004
2005
2006
2007
2008
2009
2010
2011
2012
2013
2014
2015
2016
-
2,000
4,000
6,000
8,000
10,000
12,000
14,000
16,000
18,000
Aver
age
Land P
rices
(S$'p
sf)
Govern
men
t La
nd S
ale
s by
GFA
(sq
ft)
GLS by GFA (sqft) Average Land Price (S$'psf)
Page 19

Industry Focus
Singapore Developers & REITs
ASIAN INSIGHTS VICKERS SECURITIES Page 20
Figure 19: Winning margin and average range of bid have narrowed
Figure 20: Number of bidders has increased
Source: Realis, DBS Bank Source: Realis, DBS Bank
Figure 21: GLS Sites awarded in 2016 Date of Award Location Type of
Development Lease (yrs)
No. of Bids
Name of Successful Tenderer Developer Successful Tender
Price (S$'m)
$S$ psf per plot
ratio
Units
6-Dec-16 (tender closed)
Margaret Drive Residential 99 14 MCL Land (Regency) Pte Ltd SG Listed 238.4 997.8 275
1-Oct-16 Fernvale Road Residential 99 14 Sing Development (Pte) Ltd and Wee Hur Development Pte Ltd
SG Listed 287.1 517.2 575
5-Sep-16 Anchorvale Lane
Executive Condominium
99 16 Hoi Hup Realty Pte Ltd and Sunway Developments Pte Ltd
Foreign 240.9 355.2 635
1-Jul-16 Martin Place Residential 99 13 First Bedok Land Pte Ltd (Guocoland)
SG Listed 595.1 1,239.4 450
30-May-16 Bukit Batok West Avenue 6
Commercial & Residential
99 11 Qingjian Realty (BBR) Pte Ltd. And Qingjian Realty (BBC) Pte Ltd
Foreign 301.2 634.8 425
13-Apr-16 Jalan Kandis Residential 99 9 Dillenia Land Pte Ltd Foreign 51.1 481.2 110
29-Feb-16 Yio Chu Kang Road
Executive Condominium
99 10 Hoi Hup Realty Pte Ltd Foreign 183.8 331.1 520
26-Feb-16 New Upper Changi Road (Parcel B)
Residential 99 8 CEL Residential Development Pte Ltd
SG Listed 419.4 760.8 570
18-Jan-16 Siglap Road Residential 99 8 FCL Topaz Pte Ltd, Sekisui House Ltd and KH Capital Pte Ltd
SG Listed 624.2 858.3 800
Total 2,702.8 4,085
Source: Companies, DBS Bank
-20%
0%
20%
40%
60%
80%
100%
120%
140%
160%
180%
200%
2005
2006
2007
2008
2009
2010
2011
2012
2013
2014
2015
2016
Ave
rage
aver
age
range
of bid
(%
)
Highest vs Lowest Highest vs Median Highest vs 2nd
winning bid margin and average range of bid has narrowed
12
6
8
6
16
8 8 8
10
8
10
12
-
2
4
6
8
10
12
14
16
18
2005
2006
2007
2008
2009
2010
2011
2012
2013
2014
2015
2016
Aver
age
no. of
bid
s
A verage no. of bids = 8
Page 20Page 20

Industry Focus
Singapore Developers & REITs
ASIAN INSIGHTS VICKERS SECURITIES Page 21
Figure 22: 1H17 Government Land Sales Program
S/N Location
Site area (ha)
Proposed GPR
Est. No. of Housing
Units
Est, No. of hotel
rooms
Estimated commercial
space (sqm)
Estimated launch
date
Sales agent
CONFIRMED LIST 2H15
Residential Sites
1 Toh Tuck Road 1.87 1.4 325 - - Feb-17 URA 2 Tampines Avenue 10 (Parcel C) 2.17 2.8 715 - - Mar-17 URA 3 Lorong 1 Realty Park 1.31 Landed 50 - - Apr-17 URA 4 Serangoon North Avenue 1 1.72 2.5 505 - - May-17 URA 4 Woodleigh Lane 1.96 3 735 - - May-17 URA
Total (Confirmed List) 2,330 - -
RESERVE LIST Residential sites 1 Stirling Road 2.11 4.2 1110 - - Available URA 2 Bartley Road / Jalan Bunga Rampai 0.47 2.1 115 - - Available URA 3 Sumang Walk (EC) 2.71 3 775 - - Available HDB 4 Yishun Avenue 9 2.17 2.8 715 - - May-17 URA 5 Owen Road 1.38 3.5 605 - - Jun-17 URA 6 Jiak Kim Street 1.33 3.8 515 - 1,500 Jun-17 URA 7 Fourth Avenue 2.02 1.8 455 - - Jun-17 URA 8 1.72 3 575 - - Jun-16 URA Commercial & Residential Sites 9 Holland Road 2.3 2.6 570 - 13,500 Available URA Commercial Sites 10 Beach Road 2.1 4.2 - - 88,200 Available URA 11 Woodlands Square 2.24 3.5 260 - 60,030 Available URA
Total (Reserve List) 5,135 - 158,080 Total (Confirmed List and Reserve List) 7,465 - 158,080
Source: URA, DBS Bank
Page 21

Industry Focus
Singapore Developers & REITs
ASIAN INSIGHTS VICKERS SECURITIES Page 22
4.6 More En-bloc transactions in 2017
Increase in en-bloc transactions in 2016. From 2005-2007, we saw a pick-up in en-bloc transactions when there was a shortage of government land supply. Following the implementation of property cooling measures, en-bloc transactions have dwindled down since 2011 to no transactions in 2014. In 2015, only one successful transaction (the sale of Thong Sia building) was recorded. Nevertheless, we have seen a pick-up of en-bloc transactions in 2016 with Harbour View Gardens being successfully transacted in August 2016 at an average price of S$1.3k psf, five en-bloc deals announced, and increasing media / news on property owners engaging property consultants (such as JLL and CBRE) to set up collective sales committee. The five en-bloc deals announced (excluding en-bloc sales for asset recycling purposes or specifically to be exempted from ABSD or QC charges) were i) Shunfu Ville, Bishan which was the first en-bloc sale of privatised former HUDC estate in nine years at
S$639m (S$557 psf ppr), ii) Raintree Gardens, Potong Pasir second en-bloc sale of privatised former HUDC estate at S$334m (S$593psf ppr) to UOL / UIC JV, iii) No.3 Cuscaden Walk, Orchard at S$103.8m (S$1,826 psf ppr) to SL Capital, a consortium led by Sustained Land, iv) No. 120 Grange Road, Orchard at S$48.5m (S$1,841 psf ppr) to Roxy-Pacific Holdings, and v) No. 8 Hullet Road, Orchard at S$38.2m (S$2,073 psf ppr) to a consortium led by Patrick Kho of Lian Huat Group. Media / news reported properties for sale including two apartments at The Claymore, Lakeside Towers in Jurong, Villa D’Este on Dalvey Road and Cairnhill Mansion on Orchard Road. Despite the tighter rules on en-bloc sales and more tedious process to complete an en-bloc transaction, developers are now willing to undertake these properties, implying that i) developers are hungry for land bank, and ii) developers are taking a more positive outlook in the medium term.
Figure 23: Shortage of land supply from the government Figure 24: Land prices remain high due to competitive bids
Source: URA, DBS Bank Source: URA, DBS Bank
Figure 25: Pick-up in en-bloc sales during shortage of government land supply
Figure 26: Total land transactions has fallen from 2013 onwards, post the implementation of cooling measures
Source: URA, DBS Bank Source: URA, DBS Bank
Page 22

Industry Focus
Singapore Developers & REITs
ASIAN INSIGHTS VICKERS SECURITIES Page 23
4.7 Merger and Acquisition (M&A) activities could pick up With the recent proposed privatisation of various property-related companies and news reports on potential takeovers of United Engineers (UE) (please refer to our report: Another Centenarian for Sale) and Global Logistic Properties (GLP), we believe that some of the smaller-cap developers which are trading at deep discounts to NAV could look attractive for potential M&A as an alternative to acquire assets / land
banking. We reviewed a list of smaller-cap developers with the key summary of each of the developers below. The smaller-cap developers are trading at an average discount to NAV of 29% with most trading at a range of 40-93% discount to NAV. Companies that are in deep discounts with attractive assets includes Bukit Sembawang (93% discount), Wing Tai (60%), Hiap Hoe (51%), and Hobee (50%).
Figure 27: Sample list of mid-cap developers that could head the M&A route
Bukit Sembawang Wing Tai Hiap Hoe Bloomberg / Reuters BS SP / BSES.SI WINGT SP / WTHS.SI HIAP SP / HIAP.SI Market Cap (S$'m) 1,177 1,298 335
Shareholding Structure Lee Family 44% Cheng Family 50% Teo Family 70%Aberdeen 11% Others 2% Others 1%Asia Fountain Inv (Guoco Grp)
5% Free Float 48% Free float 29%
Free float 39% Disc / (Prem) to NAV 93% 60% 51%
Debt / Equity no debt 0.4 0.7
Net debt / Equity no debt 0.1 0.6
Cash balance (S$'m) 401 966 23
Cash % of Market Cap 34% 74% 7%
Assets by business units Development properties 99.6% Development properties 57.0% Investment properties 45%Investment properties 0.4% Investment properties 39.0% Hotel 11%
Retail 2.0% Development properties 8%
Others 2.0% Construction 4%
Leisure 0%
Others 31%
Assets by countries n/a SG 47% SG 82%
HK 29% AU 18%
CH 11% MY 13%
Key assets Paterson Collection, Orchard, SG - Resi
The Crest, SG - Resi Signature At Lewis, SG - Resi
St Thomas Walk, River Valley, SG - Resi
Le Nouvel KLCC, MY - Resi HH @ Kallang, SG - Industrial
Luxus Hill, Seletar, SG - Landed resi Winsland House, SG - comm Zhongshan Park Integrated, Novena, SG - Mixed
Watercove, Sembawang, SG - Landed resi
Development in Suzhou Industrial Park - Comm
Lanson Place, Shanghai - hospitality Source: DBS Bank
Page 23

Industry Focus
Singapore Developers & REITs
ASIAN INSIGHTS VICKERS SECURITIES Page 24
Figure 27: Sample list of mid-cap developers that could head the M&A route (continued) Hobee Roxy Wheelock Bloomberg / Reuters HOBEE SP / HBEE.SI ROXY SP / RXYP.SI WP SP / WPSL.SI Market Cap (S$'m) 1,477 501 1,789
Shareholding Structure Chua Family 76% Teo Family 72% Wheelock and Company Limited
76%
Others 1% Others 6% Aberdeen 6%Free float 23% Free float 22% Free Float 18%
Disc / (Prem) to NAV 50% 45% 40%
Debt / Equity 0.5 1.9 0.0
Net debt / Equity 0.5 1.2 (0.4)
Cash balance (S$'m) 77 327 1,319
Cash % of Market Cap 5% 65% 74%
Assets by business units Commercial 63% Development properties 57% Development properties 58%Residential 35% Hotel 11% Investment properties 35%Industrial 1% Investment properties 16% Investments 7%
Others 17% Assets by countries SG 55% SG 42% SG 80%
UK 29% AU 36% Other 20%CH 12% JP 8% AU 4% TH 4% MY 4% HK 5% ID 1%
Key assets Turquoise, Seascape & Cape Royale, Sentosa Cove, SG
Hotel properties in SG, JP, AU, TH & Maldives
Ardmore Three, Orchard, SG - Resi
Residential projects in Shanghai, Tangshan, Zhuhai
Sunnyvale Residences, SG - Resi Scotts Square, Orchard, SG - Resi
6 commercial buildings in London Trilive, SG - Resi / Retail Fuyang project, Hangzhou, CHThe Metropolis, Buona Vista, SG - Comm / Retail
New World Towers, South Brisbane, AU - Resi
Wheelock Place, SG - Comm / Retail
HB Centre 1 & 2, SG - Ind Land banks in SG, AU, ID Source: DBS Bank
Page 24

Industry Focus
Singapore Developers & REITs
ASIAN INSIGHTS VICKERS SECURITIES Page 25
Figure 27: Sample list of mid-cap developers that could head the M&A route (continued)
Metro UE Aspial Oxley Bloomberg / Reuters METRO SP / MTHL.SI UEM SP / UTES.SI ASP SP / ASPA.SI OHL SP / OXHL.SI Market Cap (S$'m) 844 1,676 525 1,282
Shareholding Structure Ong Family 36% Great Eastern 13% Koh Family 84% Ching Chiat Kwong 43%Ngee Ann Dev Pte Ltd
10% OCBC 10% Others 6% Low See Ching (Liu Shijin)
29%
Others 6% Lee Foundation 9% Free float 11% Tee Wee Sien (Zheng Weixian)
12%
Free float 49% WBL Corp 3% Others 15%
Free float 65% Free float 1%
Disc / (Prem) to NAV 37% 15% -60% -63%
Debt / Equity 0.0 0.6 4.2 3.1
Net debt / Equity (0.3) 0.3 3.9 2.6
Cash balance (S$'m) 418 671 72 367
Cash % of Market Cap
50% 40% 14% 29%
Assets by business units
Property 96% Development properties
22% Real estate 44% Development properties
68%
Retail 4% Investment properties
47% Financial service 10% Hotel 13%
Technology & Manufacturing
17% Jewellery 5% Investment properties
7%
Corporate Services & Other Assets
14% Others 41% Corporate 12%
Assets by countries CH 79% SG 85% Singapore 99.9% SG 97%ASEAN 15% CH 10% Malaysia 0.1% MY 2%Others 7% USA 1% UK 1%
MY 1% Japan 0%
TW 1% Cambodia 0%
ASEAN (ex SG & MY)
0% Others 1%
HK 0% Rest of Asia 0% Others 2%
Key assets Nanchang Fashion Mark, Jiangxi, CH - Mixed
UE Bizhub City, SG - Mixed Kensington Square, SG - Retail / Resi
The Flow, East Coast, SG - Comm
The Crest at Prince Charles Crescent, SG - Resi
UE Bizhub West, SG - Ind / Comm
City Gate, SG - Retail / Resi The Rise@Oxley, Oxley Rise Rd, SG - Residences / Retail
Sheffield Digital Campus, Sheffield, UK - Comm
Mixed Development One North, SG - Mixed
Nova City, Cairns, AU - Mixed
Floraville / Floraview / Floravista, Ang Mo Kio, SG - Mixed
Middlewood Locks, Manchester, UK - Resi
Land banks in Brisbane & Penang
Space@Tampines, SG - Industrial
Metro Tower / City, Shanghai - Comm / retail
Novotel & Ibis on Stevens,SG - hospitality
GIE Tower, Guangzhou, CH - Comm
Development properties in Cambodia, Malaysia, Myanmar, etc
Source: DBS Bank
Page 25
Industry Focus
Singapore Developers & REITs
ASIAN INSIGHTS VICKERS SECURITIES Page 26
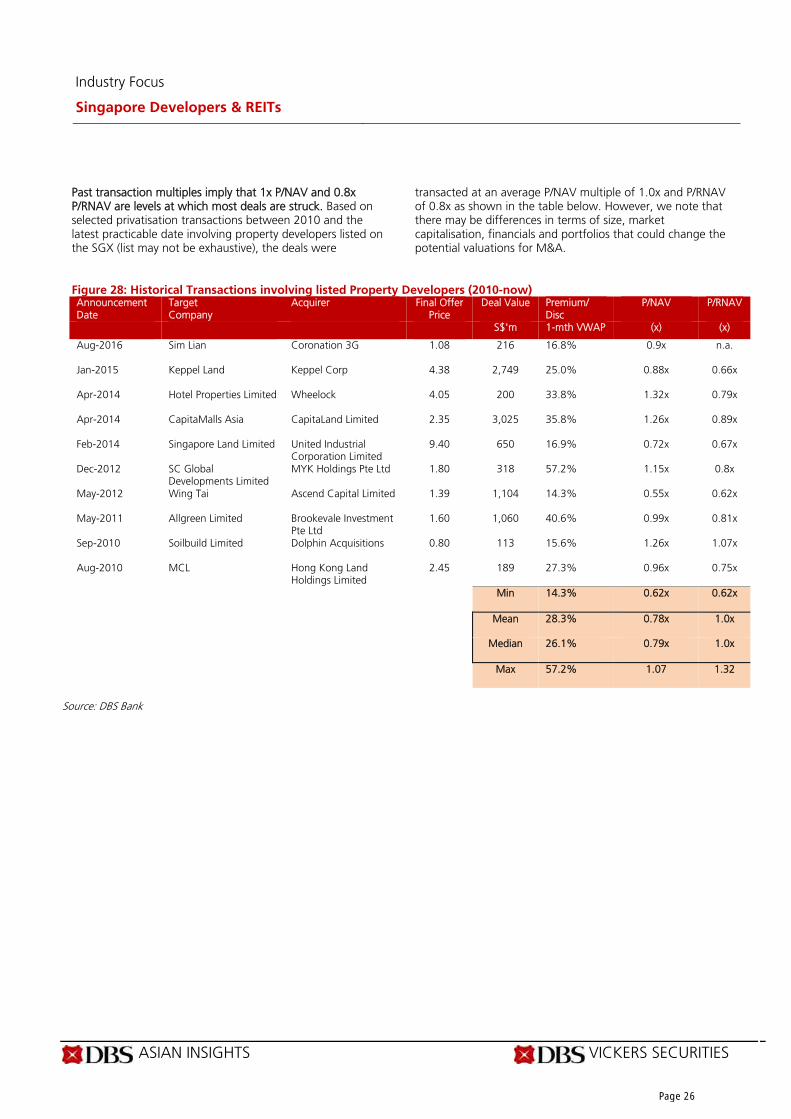
Past transaction multiples imply that 1x P/NAV and 0.8x P/RNAV are levels at which most deals are struck. Based on selected privatisation transactions between 2010 and the latest practicable date involving property developers listed on the SGX (list may not be exhaustive), the deals were
transacted at an average P/NAV multiple of 1.0x and P/RNAV of 0.8x as shown in the table below. However, we note that there may be differences in terms of size, market capitalisation, financials and portfolios that could change the potential valuations for M&A.
Figure 28: Historical Transactions involving listed Property Developers (2010-now) Announcement Date
Target Company
Acquirer Final Offer Price
Deal Value Premium/ Disc
P/NAV P/RNAV
S$'m 1-mth VWAP (x) (x)
Aug-2016 Sim Lian Coronation 3G 1.08 216 16.8% 0.9x n.a.
Jan-2015 Keppel Land Keppel Corp 4.38 2,749 25.0% 0.88x 0.66x
Apr-2014 Hotel Properties Limited Wheelock 4.05 200 33.8% 1.32x 0.79x
Apr-2014 CapitaMalls Asia CapitaLand Limited 2.35 3,025 35.8% 1.26x 0.89x
Feb-2014 Singapore Land Limited United Industrial Corporation Limited
9.40 650 16.9% 0.72x 0.67x
Dec-2012 SC Global Developments Limited
MYK Holdings Pte Ltd 1.80 318 57.2% 1.15x 0.8x
May-2012 Wing Tai Ascend Capital Limited 1.39 1,104 14.3% 0.55x 0.62x
May-2011 Allgreen Limited Brookevale Investment Pte Ltd
1.60 1,060 40.6% 0.99x 0.81x
Sep-2010 Soilbuild Limited Dolphin Acquisitions 0.80 113 15.6% 1.26x 1.07x
Aug-2010 MCL Hong Kong Land Holdings Limited
2.45 189 27.3% 0.96x 0.75x
Min 14.3% 0.62x 0.62x
Mean 28.3% 0.78x 1.0x
Median 26.1% 0.79x 1.0x
Max 57.2% 1.07 1.32
Source: DBS Bank
Page 26

Industry Focus
Singapore Developers & REITs
ASIAN INSIGHTS VICKERS SECURITIES Page 27
4.8 Will Developers need to deleverage? Average indebtedness across developers over time remain stable; larger-cap developers have been generally more conservative. Property developers have generally been conservative in their approach towards capital management and over the past few years, kept net gearing in the range of 0.4-0.6x. Tracking the average indebtedness across developers over time, we found that mid-sized developers (defined as those with market capitalisation of up to S$2bn) have generally taken more debt in recent years and thus average gearing of c.0.8x in the last four years, higher than the sector’s average of c.0.7x over the same period. On average, over the same period, the large-cap developers have an average net gearing ratio of c.0.5x. Developers that stand out in terms of higher gearing than their peers as of the latest reported quarter are the likes of Guocoland (large-sized developer) at 1.2x and in the mid-sized developer space - Oxley, Tee Land and Roxy-Pacific which all have net gearing in excess of 1.0x (Fig. 30). Chip Eng Seng and Tuan Sing also have high net gearing of above 0.9x. Developers to deleverage as outlook remains subdued. 2017 will turn out to be a tough year for developers to deploy
capital. Firstly, we expect the land-banking climate to remain competitive in Singapore given limited land sites available for tender from the government, which means that most mid-sized developers could be crowded out by their larger competitors or foreign developers. Secondly, increased currency volatility going forward is expected to be a drag on returns when deploying more capital overseas. As such, given limited avenues to deploy capital and fairly strong balance sheets, we believe that a possible avenue where developers could look to deleverage their balance sheet or if not pay higher dividends going forward. The recent spike in swap-offer rates (SOR) could imply higher refinancing costs going forward. As such, faced with a slowing top-line growth and increasing prospects of higher interest obligations, we believe that a viable strategy will be to utilise proceeds that are recognised from subsequent years’ pre-sales to pare down on debt obligations when they come due in 2017-2018. In our interest rate analysis, we estimate impact on PATMI for the developers from a 1% increase in interest rates result in a 4-40% impact on PATMI.
Figure 29: Gearing levels of Property Developers over
time have remained fairly stable Figure 30: Net gearing of Selected Mid-Cap
Developers (Latest Quarter)
Source: Bloomberg Finance L.P., DBS Bank
Source: Bloomberg Finance L.P., DBS Bank
0.47 0.50 0.54 0.71
0.85 0.94 0.98 1.07 1.16
2.15
0.00
0.50
1.00
1.50
2.00
2.50
Hobee
Hia
p H
oe
OU
E
Fragra
nce
Heeto
n
Chip
Eng S
eng
Tuan S
ing
TEE L
and
Roxy
-Paci
fic
Oxl
ey
0.10
0.15
0.20
0.25
0.30
0.35
0.40
0.45
0.50
2005
2006
2007
2008
2009
2010
2011
2012
2013
2014
2015
Ne
t D
eb
t/Equit
y (x
)
Large cap Mid cap Average
Page 27

Industry Focus
Singapore Developers & REITs
ASIAN INSIGHTS VICKERS SECURITIES Page 28
Figure 31: Summary of Developers Financial position (As of latest quarter ended Sept-2016)
Developer Type* Market Cap
Total Assets
Total Debt
Total Equity
Cash Total Debt/
Equity
Net Debt/
Equity
Total Debt/
EBITDA (TTM)
Net Debt/
EBITDA
EBITDA/Interest
expense (TTM)
(S$'bn) (S$'bn) (S$'bn) (S$'bn) (S$'bn) (x) (x) (x) (x) (x)
Capitaland Large 13.56 46.21 15.58 23.88 4.24 0.7 0.5 11 8 3.0
GLP Large 8.77 27.73 6.21 18.30 2.47 0.3 0.2 10 6 3.0
Citydev Large 7.40 19.93 6.35 11.02 3.29 0.6 0.3 5 3 11.8
UOL Large 4.52 11.60 2.57 8.51 0.27 0.3 0.3 8 7 9.8
FCL Large 4.32 24.20 9.80 11.84 2.17 0.8 0.6 12 9 5.1
UIC Large 3.86 8.62 1.31 6.98 0.08 0.2 0.2 4 4 28.9
Guocoland Large 2.21 8.15 4.05 3.47 1.13 1.2 0.8 22 16 3.9
Wheelock Mid 1.78 3.28 0.02 3.02 0.40 0.0 (0.1) 0l0 (7) 55
OUE Mid 1.57 8.09 2.97 4.59 0.21 0.6 0.6 17 14 1.5
Perennial RE Mid 1.49 6.71 2.52 3.64 0.19 0.7 0.6 221 1 1.2
Ho Bee Mid 1.44 4.29 1.39 2.79 0.08 0.5 0.5 9 8 21
Wingtai Mid 1.31 4.71 1.13 3.34 0.97 0.3 0.0 89 13 0.3
Oxley Mid 1.23 4.48 2.43 0.96 0.37 2.5 2.1 8 7 8.4
Bukit Sembawang Mid 1.16 1.42 - 1.27 0.40 - (0.3) 0.0 (4) 0.0
Fragrance Mid 1.09 2.00 0.82 1.06 0.06 0.8 0.7 93 85 1.6
Roxy-Pacific Mid 0.53 1.50 0.89 0.48 0.33 1.8 1.2 12 8 4.8
Chip Eng Seng Small 0.39 2.18 1.17 0.75 0.46 1.6 0.9 12 7 5
Tuan Sing Small 0.35 2.09 1.04 0.89 0.16 1.2 1.0 16 14 2.4
Hiap Hoe Small 0.33 1.30 0.45 0.69 0.02 0.7 0.6 8 6 4.4
SingHaiyi Small 0.30 0.95 0.30 0.47 0.12 0.6 0.4 -29 -17 -1.3
Heeton Small 0.14 0.72 0.31 0.33 0.03 0.9 0.9 -85 -77 -0.2
TEE Land Small 0.09 0.42 0.21 0.17 0.03 1.2 1.1 153 135 0.3
Total Debt/
Equity
Net Debt/
Equity
(x) (x)
Average Sector 0.6 0.4
Average Large Cap 0.6 0.4
Average Mid Cap 0.7 0.5
Average Small Cap 1.1 0.9
*Large Cap denotes Market Cap > S$2.0bn, Mid-Cap Developers refer to those with market cap > S$0.5bn to less than S$2.0bn, Small Cap <S$0.5bn in market cap Source: Bloomberg Finance L.P., DBS Bank
Page 28

Industry Focus
Singapore Developers & REITs
ASIAN INSIGHTS VICKERS SECURITIES Page 29
Bond markets issuances have increased in recent years. With strong investor demand for yields in recent years amidst the low interest rate environment, we have seen an increase in new bond issuances in Singapore. In the real estate space, we saw close to S$34bn of new issues over the past five years, which is more than 20% of the total amount of new bond issuances over the preceding five years. In the real estate sector, bond issuances peaked in 2011, and again reached new highs in 2012 and 2015. In 2015, bond issuances totalled S$8.7bn across the real estate sector. We also note that mid-sized developers have also been tapping the bond markets in recent years. A total of S$3.5bn worth of bonds will be due in 2017. Average cost of funds has also been falling over time, hovering at about 3% since 2008.
S$3.4bn worth of bonds from developers due in 2017 that need to be refinanced. Continued access to funding is a key enabler to a healthy real estate development and investment market. However, recent bond defaults in the oil & gas space has resulted in heightened risk aversion among investors in bonds. In addition, the market for future bond issues appears to be shut for most aspiring issuers for now. If the current risk-off sentiment remains in the medium term, it might be a headwind for issuers in the real estate sector who need to refinance upcoming bond expires in 2017-2018 which total S$6.3bn, out of which S$4.0bn will be from real estate developers. We note that among the bonds due in 2017, developers like Guocoland and OUE will need to refinance expiring bonds. Developers such as OUE and Heeton’s existing cash balances and receivables may not be sufficient for repayment of bonds. Additional financing may be required in due time for bond repayments.
Figure 32: Bond issuances by developers peaked in
2015 Figure 33: Bonds Expiry profile
Source: Bloomberg Finance L.P., DBS Bank
Source: Bloomberg Finance L.P., DBS Bank
0.0%
0.5%
1.0%
1.5%
2.0%
2.5%
3.0%
3.5%
4.0%
4.5%
0
1,000
2,000
3,000
4,000
5,000
6,000
7,000
8,000
9,000
10,000
2005 2006 2007 2008 2009 2010 2011 2012 2013 2014 2015 2016
S$'m
Total amount issued (S$m) Average cost of debt
2.9
1.1 1.2
3.6
0.7
2.6
1.40.9
6.00.8
1.5 1.3
1.3
2.1
1.2
1
0.9
3.2
2 0 1 7 2 0 1 8 2 0 1 9 2 0 2 0 2 0 2 1 2 0 2 2 2 0 2 3 2 0 2 4 > 2 0 2 4
S$'BN Developers REITs
Page 29

Industry Focus
Singapore Developers & REITs
ASIAN INSIGHTS VICKERS SECURITIES Page 30
Figure 34. Selected property developers’ outstanding bonds, 2017-2018 (S$m)
Issuer Maturity Amount Outstanding (S$'m)
SingHaiyi Group Ltd Jan-17 100
Fragrance Group Ltd Jan-17 85
OUE Ltd Feb-17 300
City Developments Ltd Feb-17 250
GLL IHT Pte Ltd (Guocoland) Feb-17 160
UOL Group Ltd May-17 75
Oxley Holdings Ltd May-17 150
Heeton Holdings Ltd Jun-17 60
CapitaLand Treasury Ltd Jul-17 50
GLL IHT Pte Ltd (Guocoland) Aug-17 170
Keppel Land Ltd Aug-17 100
GLL IHT Pte Ltd (Guocoland) Sep-17 105
Chip Eng Seng Corp Ltd Oct-17 150
TEE Land Ltd Oct-17 30
Hongkong Land Dec-17 50
City Developments Ltd Mar-18 100
Perennial Treasury Pte Ltd (Perennial) Mar-18 100
UOL Treasury Services Pte Ltd (UOL) Apr-18 175
Global Logistic Properties Ltd May-18 67
Centurion Corp Ltd Jul-18 65
Roxy-Pacific Holdings Ltd Jul-18 60
GLL IHT Pte Ltd (Guocoland) Sep-18 75
Citydev Nahdah Pte Ltd Sep-18 50
City Developments Ltd Sep-18 50
Perennial Real Estate Holdings Ltd Oct-18 300
Source: Bloomberg Finance L.P., DBS Bank
Page 30

Industry Focus
Singapore Developers & REITs
ASIAN INSIGHTS VICKERS SECURITIES Page 31
5. Singapore REITs: Déjà vu
Key Assertions
Back to square one with REITs facing expectations of rising interest rates
Some buffer with yield spreads at average levels even after accounting for 3% 10-year bond yield
Combination of growth and/or large discount to book best positioned to ride out 2017
Large-cap picks: A-REIT, KREIT, MCT,
Mid-cap picks: CRT, FLT, KDCREIT
Negative 2016 outlook for S-REITs fails to materialise until towards later half of the year. At the end of 2015 after the first rate hike by the US Federal Reserve in December 2015, the market was pricing in three rate hikes. These expectations resulted in S-REITs correcting in January 2016. However, as the year progressed, the impact of (1) negative interest rates in Europe and Japan, (2) further correction in oil prices, (3) disappointing nonfarm payroll data in May, and (4) uncertainty caused by Brexit, caused expectations for rate hikes to be dialed back significantly. Consequently, the S-REIT index (excluding dividends) rallied by 11% till early September, outperforming the 0.4% rise in the STI and 2% fall in the property developers index. However, with an improving US economy causing interest expectations to rise, further accelerated by the victory by President-Elect Trump on 8 November 2016, the S-REIT index fell by 8%, underperforming the 0.4% and 0.3%% drop in both the STI and developers index. DBS more hawkish on interest rates means S-REITs performance to be capped. Going into 2017, consensus expectations are for three rate hikes with our DBS economists being more hawkish, forecasting the US Federal Reserve to increase the Fed Funds rate by 25bps once every quarter next with the US 10-year bond yield rising to 3.25% versus current spot rate of 2.3% and consensus forecasts of 2.5%. The Singapore 10-year bond yield is also expected to increase in tandem to 3.05%. Should our DBS house view come to fruition, we believe the performance of S-REITs will likely be capped. Deteriorating rental outlook for most real estate subsectors. Revenues across the office, retail, industrial and hospitality sectors were under pressure in 2016 due to a combination of sluggish demand as well as increase in physical completions and anticipated supply. Demand for the more cyclical sectors office, hotel and industrial sectors were also negatively
impacted by the uncertain economic environment. Meanwhile, the retail sector was affected by Singaporeans spending their disposable income overseas and shopping online. Going into 2017, we believe these negative trends are likely to continue, resulting in a modest 1.1% growth in DPU for the sector. Current forward yields offer some buffer with yield spread at average levels assuming a normalised 10-year yield of 3.0%. While S-REITs are likely to face headwinds in the form of falling rents and rising interest rates, we believe the recent correction has provided some downside buffer. The current FY17F yield spread to a normalised 3% bond yield stands at 4.0% which is slightly above the historical average spread of 3.8% and close to the 4.1% average since 2010. Full impact on DPU from rise in interest rates will not be felt immediately. While investors are rightfully concerned about the impact of an increase in interest rates on DPU, based on our analysis, the full impact will only be felt over the course of the next two to three years. This is because S-REITs in general have hedged 75-85% of their debt into fixed rates and have only 9%, 21% and 20% of total debt up for refinancing over 2017, 2018 and 2019 respectively. We estimate that a 1% rise in interest rates will have a 2.9% and 4.9% impact on distributions in 2017 and 2018 respectively. Sector preferences – (1) Office, (2) Retail, (3) Industrial, and (4) Hospitality. In terms of sectors, our preference is for the office REITs despite the expected decline in office rents given that the sector trades at 20% discount to book value and 10-30% discount to recent market transactions. In addition, we think the sector remains under-owned relative to other sectors. Our second preference is the retail sector for its resilient income stream (i.e. exposure to suburban necessity shopping malls) and the fact that it now trades close to 1x P/BV versus the sector’s typically 10-20% premium to book value. The industrial sector's third ranking is mainly attributed to our positive view on the larger REITs such as Ascendas REIT which offer a combination of strong balance sheets, decent yields and growth options. While we see long-term value in the hospitality sector given that the sectors trades at 20-40% discount to book, we believe there is limited re-rating catalyst at least for 1H17 as RevPAR is expected to remain under pressure. However, we recommend that investors look for opportunities to re-enter in 2H17 on the
Page 31

Industry Focus
Singapore Developers & REITs
ASIAN INSIGHTS VICKERS SECURITIES Page 32
back of a potential recovery in 2018 as the oversupply situation in Singapore normalises. Stocks with growth and/or trading at a discount to recent market transactions/book to outperform. With a challenging 2017 to come, we believe REITs with a clear and visible growth driver will do well. On that front in the large-cap space, Mapletree Commercial Trust (MCT) stands out given its DPU-accretive acquisition of Mapletree Business City Phase I which is under-rented as well as continued growth at its core asset Vivocity. We also believe the risk reward for Ascendas REIT (AREIT) is favorable given its exposure to the business park space which is supply constrained. Moreover, AREIT will be under geared balance sheet post conversion of the outstanding convertible bonds next year which will allow AREIT to further deepen its presence in Australia through acquisitions.
In the mid-cap space, Frasers Logistics and Industrial Trust (FLT) and Keppel DC REIT (KDCREIT), with inbuilt annual rental escalations and the ability to deploy their lowly geared balance sheets, offer visible growth in DPU. Growth in DPU is also evident at Croesus Retail Trust (CRT) which will benefit from favorable hedges, with additional upside should it be taken over. Finally, our top pick for stocks that trade at a discount relative to book and recent market transactions is Keppel REIT (KREIT). The implied value for KREIT’s Singapore portfolio on a per sqft basis stands at S$2,250 versus recent market transactions of S$2,700 and above, and it trades at 0.76x P/BV.
Figure 35: Price performance of Singapore REITs vs
Singapore Developers and STI Index Figure 36: S-REIT yields and yield spread chart
Source: Bloomberg Finance L.P., DBS Bank
Source: Bloomberg Finance L.P., DBS Bank
0.75
0.80
0.85
0.90
0.95
1.00
1.05
1.10
1.15
FSTREI (ex dividend) STI Index Developers
+12%
0%
2%
4%
6%
8%
10%
12%
14%Sector Yield spread
Sector Yield
MAS 10 Year
Page 32

Industry Focus
Singapore Developers & REITs
ASIAN INSIGHTS VICKERS SECURITIES Page 33
Key Issues in 2017 With a sense of déjà vu, as we approach 2017, we are faced with the similar issues confronting investors at the start of 2016 and 2015. These include risk of rising interest rates, slowing growth, higher cost of capital potentially constraining the ability to raise capital to fund growth plans, and heightened risk of write-downs of property values given falling rents. With economic outlook now softer than at the start of 2015 and 2016, we believe that S-REITs with stronger relative growth will command an increasing premium. In addition, S-REITs which offered resiliency in the past and trade at a premium but are now only able to offer flattish DPU growth might be vulnerable, given rising risks of earnings disappointment. Key themes in 2017 are as follows: 5.1 Impact of an increase in interest rates on
share price, distributions DBS economists project interest rates to rise faster than consensus. We believe investors’ attention is now focused on the pace of interest rates in 2017. Thus far, consensus is expecting three rate hikes with the US 10-year bond yield forecast to rise to 2.5-2.6%. With share prices for S-REITs having already corrected in anticipation of this outcome, we believe S-REITs will likely deliver steady returns. In contrast, the more hawkish forecasts by our DBS economists, who anticipate four rate hikes (25bps once a quarter), would take the Fed funds rate to 1.5% by end-2017, the US 10-year bond yield to 3.25% and the Singapore 10-year bond yield to 3.05%. Under our house view, the overall performance of S-REITs will likely to capped.
But expectations could be dialled back again. While the market remains focused on rate hikes, there is a possibility that 2016 could repeat again, with interest rate expectations being reduced. This could arise from the European Central Bank (ECB) and Bank of Japan’s (BOJ) decision to push interest rates further into negative territory and concerns over the potential breakup of the Euro on the back of victories by nationalist parties in several European elections next year. Furthermore, the policies actually implemented by President-elect Trump may not be as inflationary as first thought and/or concerns over impact on curtailment of global trade/economies weigh more on long-term bond yields.
Potential return of capital to the US a headwind (Figure 38). The SGD strengthened against the USD between 2009 and 2013, when the US Federal Reserve implemented three rounds of quantitative easing. During this period, the carry trade was prevalent with USD-based investors taking advantage of the stronger SGD by taking positions in yield instruments including S-REITs. This resulted in the FSTREI Index rallying c.44% to its peak in May 2013. However, with the end of the quantitative easing by the US Federal Reserve and the interest rate up cycle commencing from December 2015, the FSTREI Index has become more volatile, moving in sync with changes in interest rate expectations and movements in the USD. Going forward, should US interest rates continue on an aggressive path upwards, in line with our DBS economists view, capital from Asia would likely return back to the US, presenting a headwind to the performance of S-REITs.
Figure 37: DBS Interest Rates Forecasts Figure 38: Singapore REITs vs currency
Current (8 Dec'16) 1Q17F 2Q17F 3Q17F 4Q17F
US 10- Year Bond
2.35% 2.65% 2.85% 3.05% 3.25%
US 2-year bond
1.10% 1.50% 1.70% 1.90% 2.10%
US yield Curve
1.25% 1.15% 1.15% 1.15% 1.15%
SG 10 year bond
2.34% 2.65% 2.75% 2.85% 3.05%
SG 2-year bond
1.17% 1.50% 1.65% 1.80% 1.95%
SG Yield Curve
1.17% 1.15% 1.10% 1.05% 1.10%
Source: Bloomberg Finance L.P., DBS Bank
Source: Bloomberg Finance L.P., DBS Bank
1.00
1.10
1.20
1.30
1.40
1.50
1.60
1.70
1.80
-
200
400
600
800
1,000
1,200
FSTREI Index (LHS) USDSGD Rate (RHS)
WeakerSGD a
potential headwind
Period whenstrengtheningSGD a tailwind
Page 33
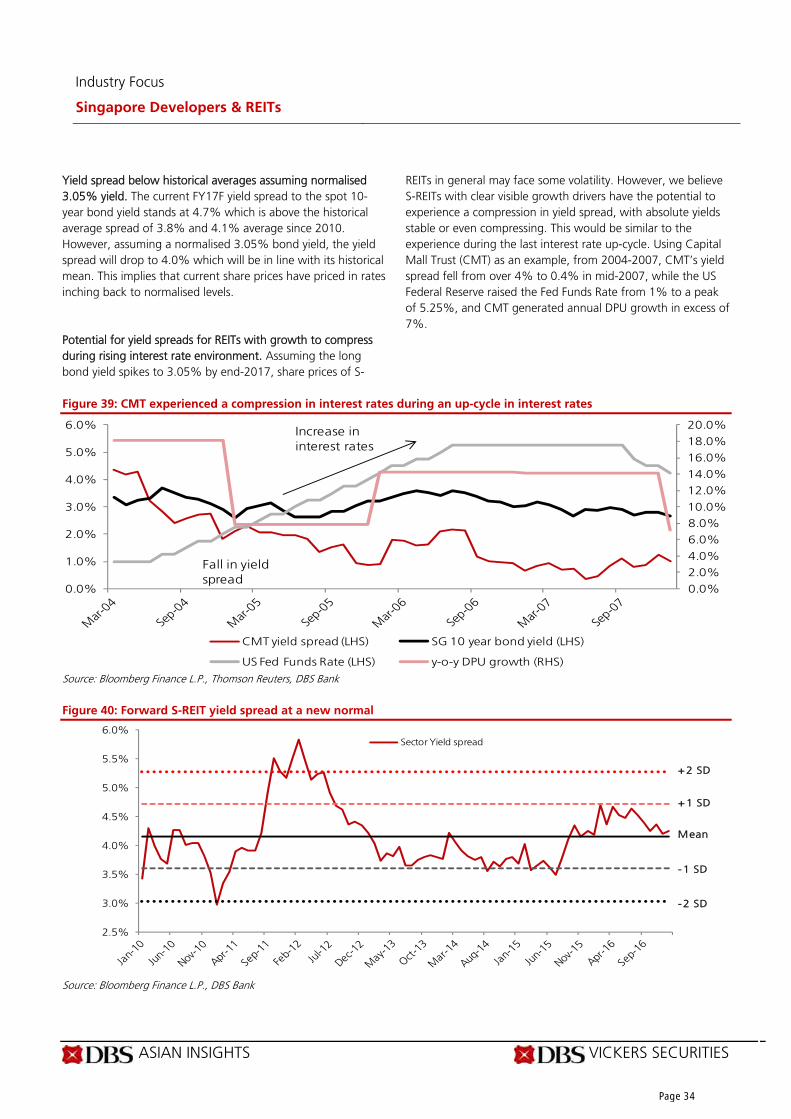
Industry Focus
Singapore Developers & REITs
ASIAN INSIGHTS VICKERS SECURITIES Page 34
Yield spread below historical averages assuming normalised 3.05% yield. The current FY17F yield spread to the spot 10-year bond yield stands at 4.7% which is above the historical average spread of 3.8% and 4.1% average since 2010. However, assuming a normalised 3.05% bond yield, the yield spread will drop to 4.0% which will be in line with its historical mean. This implies that current share prices have priced in rates inching back to normalised levels. Potential for yield spreads for REITs with growth to compress during rising interest rate environment. Assuming the long bond yield spikes to 3.05% by end-2017, share prices of S-
REITs in general may face some volatility. However, we believe S-REITs with clear visible growth drivers have the potential to experience a compression in yield spread, with absolute yields stable or even compressing. This would be similar to the experience during the last interest rate up-cycle. Using Capital Mall Trust (CMT) as an example, from 2004-2007, CMT’s yield spread fell from over 4% to 0.4% in mid-2007, while the US Federal Reserve raised the Fed Funds Rate from 1% to a peak of 5.25%, and CMT generated annual DPU growth in excess of 7%.
Figure 39: CMT experienced a compression in interest rates during an up-cycle in interest rates
Source: Bloomberg Finance L.P., Thomson Reuters, DBS Bank
Figure 40: Forward S-REIT yield spread at a new normal
Source: Bloomberg Finance L.P., DBS Bank
0.0%
2.0%
4.0%
6.0%
8.0%
10.0%
12.0%
14.0%
16.0%
18.0%
20.0%
0.0%
1.0%
2.0%
3.0%
4.0%
5.0%
6.0%
CMT yield spread (LHS) SG 10 year bond yield (LHS)
US Fed Funds Rate (LHS) y-o-y DPU growth (RHS)
Increase in interest rates
Fall in yieldspread
2.5%
3.0%
3.5%
4.0%
4.5%
5.0%
5.5%
6.0%Sector Yield spread
+1 SD
-1 SD
-2 SD
+2 SD
Mean
Page 34

Industry Focus
Singapore Developers & REITs
ASIAN INSIGHTS VICKERS SECURITIES Page 35
Figure 41. Historical S-REIT yield and S-REIT yield spread (2005-current)
Period Years 10 Year bond (%)
S-REIT Yields (%)
S-REIT Yield Spreads (%)
Comments
2005 2.9% 4.8% 2.1% 2006-2008 was a period of high growth for the S-REITs where average distribution growth was c.13% over 2006-2008. Key catalysts were acquisitions
“High Growth” 2006 3.4% 5.0% 1.6%
2007 2.9% 4.1% 1.2%
“Aberration in valuations due to
the GFC”
2008 2.8% 7.3% 4.5% Yield spread expanded to >5.1% due to financial crisis 2009 2.3% 9.6% 7.3%
2010 2.4% 6.3% 3.9%
Post-global financial crisis period, the sector saw yield compression in 2012-2013 before the Fed hinted of rate hikes in mid-2013
“Liquidity driven recovery”
2011 2.2% 6.4% 4.2%
2012 1.5% 6.5% 5.0%
2013 2.0% 5.8% 3.8%
2014 2.4% 6.2% 3.8%
2015 2.4% 6.3% 3.9%
Periods
2005-cuurent 2.5% 6.2% 3.8%
2006-2008 3.0% 5.4% 2.4%
2010-current 2.1% 6.3% 4.1%
Forward
Current (FY17F) 2.3% 7.0 % 4.7%
Forward(FY17F) 3.0% 7.0% 4.0%
Source: Bloomberg Finance L.P. Finance L.P, DBS Bank
Page 35
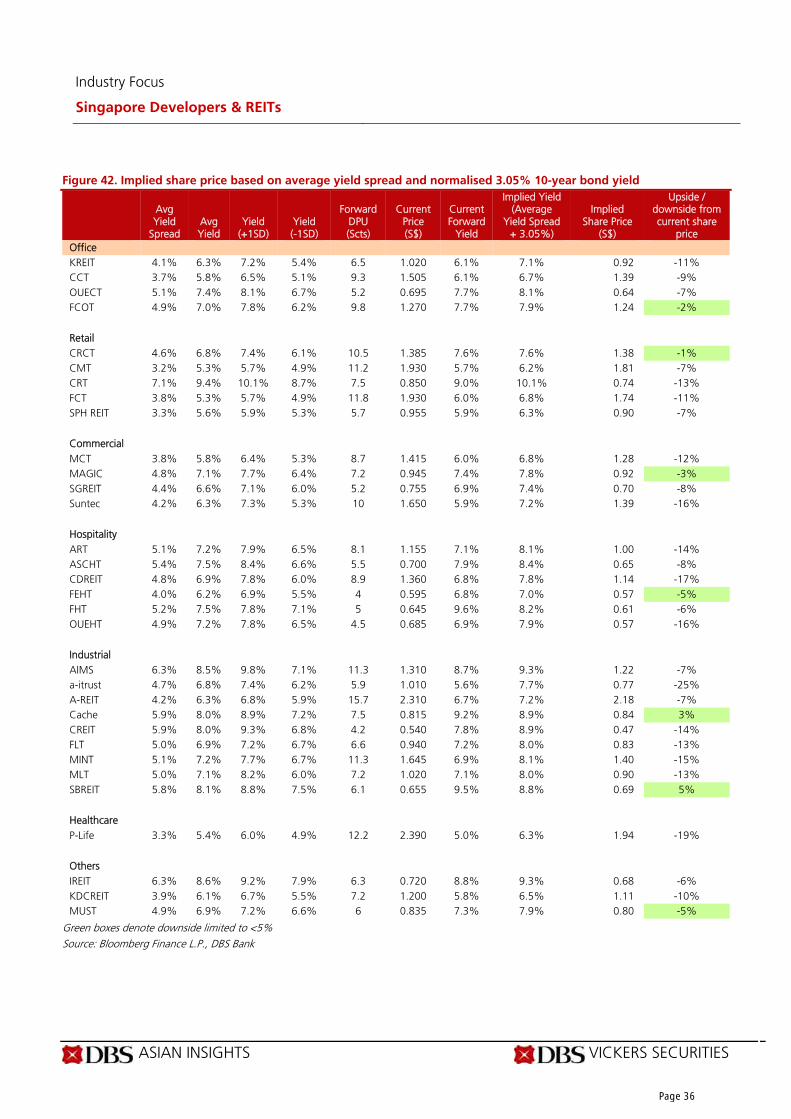
Industry Focus
Singapore Developers & REITs
ASIAN INSIGHTS VICKERS SECURITIES Page 36
Figure 42. Implied share price based on average yield spread and normalised 3.05% 10-year bond yield
Avg Yield
Spread Avg Yield
Yield (+1SD)
Yield (-1SD)
Forward DPU (Scts)
Current Price (S$)
Current Forward
Yield
Implied Yield (Average
Yield Spread + 3.05%)
Implied Share Price
(S$)
Upside / downside from current share
price Office KREIT 4.1% 6.3% 7.2% 5.4% 6.5 1.020 6.1% 7.1% 0.92 -11% CCT 3.7% 5.8% 6.5% 5.1% 9.3 1.505 6.1% 6.7% 1.39 -9% OUECT 5.1% 7.4% 8.1% 6.7% 5.2 0.695 7.7% 8.1% 0.64 -7% FCOT 4.9% 7.0% 7.8% 6.2% 9.8 1.270 7.7% 7.9% 1.24 -2% Retail CRCT 4.6% 6.8% 7.4% 6.1% 10.5 1.385 7.6% 7.6% 1.38 -1% CMT 3.2% 5.3% 5.7% 4.9% 11.2 1.930 5.7% 6.2% 1.81 -7% CRT 7.1% 9.4% 10.1% 8.7% 7.5 0.850 9.0% 10.1% 0.74 -13% FCT 3.8% 5.3% 5.7% 4.9% 11.8 1.930 6.0% 6.8% 1.74 -11% SPH REIT 3.3% 5.6% 5.9% 5.3% 5.7 0.955 5.9% 6.3% 0.90 -7% Commercial MCT 3.8% 5.8% 6.4% 5.3% 8.7 1.415 6.0% 6.8% 1.28 -12% MAGIC 4.8% 7.1% 7.7% 6.4% 7.2 0.945 7.4% 7.8% 0.92 -3% SGREIT 4.4% 6.6% 7.1% 6.0% 5.2 0.755 6.9% 7.4% 0.70 -8% Suntec 4.2% 6.3% 7.3% 5.3% 10 1.650 5.9% 7.2% 1.39 -16% Hospitality ART 5.1% 7.2% 7.9% 6.5% 8.1 1.155 7.1% 8.1% 1.00 -14% ASCHT 5.4% 7.5% 8.4% 6.6% 5.5 0.700 7.9% 8.4% 0.65 -8% CDREIT 4.8% 6.9% 7.8% 6.0% 8.9 1.360 6.8% 7.8% 1.14 -17% FEHT 4.0% 6.2% 6.9% 5.5% 4 0.595 6.8% 7.0% 0.57 -5% FHT 5.2% 7.5% 7.8% 7.1% 5 0.645 9.6% 8.2% 0.61 -6% OUEHT 4.9% 7.2% 7.8% 6.5% 4.5 0.685 6.9% 7.9% 0.57 -16% Industrial AIMS 6.3% 8.5% 9.8% 7.1% 11.3 1.310 8.7% 9.3% 1.22 -7% a-itrust 4.7% 6.8% 7.4% 6.2% 5.9 1.010 5.6% 7.7% 0.77 -25% A-REIT 4.2% 6.3% 6.8% 5.9% 15.7 2.310 6.7% 7.2% 2.18 -7% Cache 5.9% 8.0% 8.9% 7.2% 7.5 0.815 9.2% 8.9% 0.84 3% CREIT 5.9% 8.0% 9.3% 6.8% 4.2 0.540 7.8% 8.9% 0.47 -14% FLT 5.0% 6.9% 7.2% 6.7% 6.6 0.940 7.2% 8.0% 0.83 -13% MINT 5.1% 7.2% 7.7% 6.7% 11.3 1.645 6.9% 8.1% 1.40 -15% MLT 5.0% 7.1% 8.2% 6.0% 7.2 1.020 7.1% 8.0% 0.90 -13% SBREIT 5.8% 8.1% 8.8% 7.5% 6.1 0.655 9.5% 8.8% 0.69 5% Healthcare P-Life 3.3% 5.4% 6.0% 4.9% 12.2 2.390 5.0% 6.3% 1.94 -19% Others IREIT 6.3% 8.6% 9.2% 7.9% 6.3 0.720 8.8% 9.3% 0.68 -6% KDCREIT 3.9% 6.1% 6.7% 5.5% 7.2 1.200 5.8% 6.5% 1.11 -10% MUST 4.9% 6.9% 7.2% 6.6% 6 0.835 7.3% 7.9% 0.80 -5%
Green boxes denote downside limited to <5% Source: Bloomberg Finance L.P., DBS Bank
Page 36

Industry Focus
Singapore Developers & REITs
ASIAN INSIGHTS VICKERS SECURITIES Page 37
Impact of interest rates on distributions
Still some breathing room as impact of interest rates will be felt over time. While interest rates are anticipated to rise next year, the majority of S-REITs have hedged 75-85% of their borrowings and with a weighted average debt maturity of 2-3 years. For FY17, on average about 9% of debt is due to be refinanced, thus the full impact from higher costs of borrowings will not be felt in 2017 but over the next few years. In addition, the impact from a rise in interest rates is likely to be felt by the REITs which predominantly borrow in SGD. In contrast, REITs with exposure to European, Japanese and Australia assets with commensurate debt in EUR, JPY and Australia, may even report declining or face a slower
increase in borrowing costs as they refinancing their debt. This is due to current interest rates in Europe, Japan and Australia being lower than when the REITS first borrowed in the respective local currencies. Assuming a 1% lift in the cost of borrowing above our current estimates (we have already assumed up to a 25-bp increase in cost of debt compared to FY16) and the impact only occurs when the various S-REITs refinance 9% and 21% of all loans outstanding in 2017 and 2018 respectively, as well as only impacting the current outstanding floating rate debt, we estimate up to 2.9% and 4.9% impact on FY17F and FY18F overall S-REIT DPU respectively.
Figure 43. Potential impact on DPU with 1% increase in interest rates
REIT Percentage Fixed
rate debt (%)
Percentage floating rate debt
(%)
Percentage of debt ue for refinancing
(%) Change in DPU
2017 2018 FY17F FY18F Ascendas Hospitality Trust 97 3 31 37 -2.8% -5.6% Ascendas India Trust 100 - 11 12 -0.6% -1.4% Ascendas REIT 78 22 6 22 -2.2% -3.8% Ascott Residence Trust 80 20 13 11 -4.9% -6.4% Cache Logistics Trust 64 36 14 43 -3.9% -7.2% Cambridge Industrial Trust 88 12 0 29 -1.1% -4.0% CapitaLand Commercial Trust* 80 20 5 16 -3.0% -4.7% CapitaLand Mall Trust* 90 10 7 16 -1.5% -2.9% CapitaLand Retail China Trust 53 47 43 10 -9.6% -10.7% CDL Hospitality Trust 60 40 0 35 -3.7% -6.6% Croesus Retail Trust 100 - 14 41 -1.8% -6.3% Far East Hospitality Trust 71 29 30 28 -6.6% -9.1% Frasers Centrepoint Trust 59 41 30 8 -4.8% -5.2% Frasers Commercial Trust 85 15 24 24 -3.7% -6.0% Frasers Hospitality Trust 86 14 14 15 -2.7% -4.0% Frasers Logistics & Industrial Trust 84 16 0 0 -0.9% -0.8% IREIT Global 88 12 12 0 -1.8% -1.8% Keppel REIT* 74 26 0 14 -4.0% -6.1% Keppel DC REIT 86 14 1 44 -0.6% -2.4% Manulife US REIT 100 - 0 0 0.0% 0.0% Mapletree Commercial Trust 74 26 2 2 -2.5% -2.6% Mapletree Greater China Commercial Trust
85 15 9 29 -2.8% -6.1%
Mapletree Industrial Trust 69 31 1 9 -3.3% -4.0% Mapletree Logistics Trust 81 19 1 15 -2.2% -3.8% OUE Commercial REIT 78 22 27 49 -9.1% -18.9% OUE Hospitality Trust 68 32 0 34 -3.4% -6.8% Parkway Life REIT 98 2 0 14 -0.2% -1.4% Soilbuild Business Space REIT 88 12 0 33 -0.9% -3.2% SPH REIT 86 14 0 38 -0.8% -3.0% Suntec REIT* 60 40 3 37 -5.0% -9.2% YTL Starhill Global REIT 96 4 35 28 -3.8% -6.2% Total S-REIT Debt 77 23 9 21 -2.9% -4.9%
Source: Bloomberg Finance L.P., DBS Bank
Page 37

Industry Focus
Singapore Developers & REITs
ASIAN INSIGHTS VICKERS SECURITIES Page 38
S-REIT debt maturity profile
Figure 44. Debt Expiry Profile Figure 45. S-REIT debt by sector
Source: Bloomberg Finance LLP, DBS Bank
Source: Bloomberg Finance LLP, DBS Bank
Figure 46. Debt maturity profile for individual S-REITs (%)
REIT Total Debt (S$bn) 2016 2017 2018 2019 2020 >2020 AIMS AMP Capital Industrial REIT 0.61 0% 0% 31% 40% 13% 16% Ascendas Hospitality Trust 0.54 4% 31% 37% 0% 28% 0% Ascendas India Trust 0.40 0% 11% 12% 21% 20% 36% Ascendas REIT 3.37 10% 6% 22% 15% 16% 31% Ascott Residence Trust 1.98 0% 13% 11% 8% 15% 53% Cache Logistics Trust 0.53 0% 14% 43% 34% 10% 0% Cambridge Industrial Trust 0.53 0% 0% 29% 19% 30% 21% CapitaLand Commercial Trust* 3.28 0% 5% 16% 21% 37% 20% CapitaLand Mall Trust* 3.84 0% 7% 16% 13% 12% 53% CapitaLand Retail China Trust 1.00 4% 43% 10% 18% 10% 15% CDL Hospitality Trust 0.93 0% 0% 35% 24% 20% 22% Croesus Retail Trust 0.78 0% 14% 41% 14% 17% 14% Far East Hospitality Trust 0.82 5% 30% 28% 12% 0% 24% First REIT 0.46 0% 31% 34% 26% 9% 0% Frasers Centrepoint Trust 0.73 0% 30% 8% 16% 10% 36% Frasers Commercial Trust 0.75 0% 24% 24% 28% 10% 13% Frasers Hospitality Trust 0.80 0% 14% 15% 70% 0% 0% Frasers Logistics Trust 0.52 0% 0% 0% 34% 32% 34% IREIT Global 0.30 0% 12% 0% 49% 39% 0% Keppel REIT* 3.32 0% 0% 14% 28% 23% 36% Kepple DC REIT 0.34 9% 1% 44% 38% 8% 0% Manulife US REIT 0.30 0% 0% 0% 36% 23% 41% Mapletree Commercial Trust 2.34 0% 2% 2% 12% 19% 65% Mapletree Greater China Commercial Trust 2.42 0% 9% 29% 16% 16% 30% Mapletree Industrial Trust 2.11 0% 1% 9% 26% 30% 34% Mapletree Logistics Trust 2.05 0% 1% 15% 16% 14% 54% OUE Commercial REIT 1.28 0% 27% 49% 22% 0% 2% OUE Hospitality Trust 0.86 0% 0% 34% 31% 34% 0% Parkway Life REIT 0.68 2% 0% 14% 31% 27% 27% Religare Health Trust 0.18 0% 5% 54% 35% 7% 0% Soilbuild Business Space REIT 0.47 0% 0% 33% 6% 39% 21% SPH REIT 0.85 0% 0% 38% 15% 33% 15% Suntec REIT* 2.99 0% 3% 37% 27% 10% 22% YTL Starhill Global REIT 1.14 1% 35% 28% 9% 15% 12% Total S-REIT Debt 44.37 1.1% 8.8% 21.3% 20.4% 18.6% 29.7%
Source: Various REITs, DBS Bank
1.1%
8.8%
21.3% 20.4%18.6%
29.7%
0.0%
5.0%
10.0%
15.0%
20.0%
25.0%
30.0%
35.0%
0.0
2.0
4.0
6.0
8.0
10.0
12.0
14.0
2016 2017 2018 2019 2020 >2020
S$bnIndustrial
27%
Hospitality 13%
Office33%
Retail24%
Healthcare3%
Page 38

Industry Focus
Singapore Developers & REITs
ASIAN INSIGHTS VICKERS SECURITIES Page 39
5.2 Moderating DPU performance
Grinding out DPU growth in 2017. On the back of an increasingly uncertain economic environment, supply pressures across various property segments and an uptick in borrowing costs, delivery of DPU growth will increasingly become more challenging in 2017. Nevertheless, we still expect S-REITs in general to grind out a 1.1% y-o-y growth in DPU. This is marginally higher than 0.4% DPU growth in FY16, which was partially impacted by several rights issues, predominantly in the hospitality sector. The slightly higher growth in 2017 is also a function of a low-base effect from a fairly challenging 2016 This came from several industrial REITs facing lower rents on the renewal of master leases and/or loss of income from the conversions of single-tenanted buildings to multi-tenanted buildings.
Meanwhile, the slowdown for the retail sector is largely due to CMT and FCT being in a transition as they embark on the redevelopment of Funan and Northpoint respectively. For the office/commercial sector, DPU growth is expected to moderate on the back of the decline in office rents. However, the office/commercial sector provides the strongest DPU growth in 2017. This is largely due to stronger performances from CCT and MCT which will benefit from the full-year contribution from the acquisitions of CapitaGreen and Mapletree Business City respectively. Despite the headwinds in 2017, there are several REITS with attractive growth prospects next year. These include CCT, MCT, AIT, CRT, OUEHT and KDCREIT.
Figure 47: Office/Commercial REITs forecasted to
deliver strongest growth in DPUs Figure 48: DBSV forecasts vs consensus estimates
Source: Bloomberg Finance LLP, DBS Bank
Source: Bloomberg Finance LLP, DBS Bank
Figure 49: Selected S-REITs offer strong growth profiles
REIT Sector Sector Growth FY16-17F DPU growth
Growth driver
CCT Office 1.3% 3.7% Acquisition of 60% remaining interest in CapitaGreen
MCT Office/ Commercial 1.3% 2.5% Acquisition of Mapletree Business City
AIT Industrial 0.8% 8.1% New developments and acquisition of BlueRidge Phase II
CRT Retail (Japan) 1.1% 8.7% Improved SGD/JPY hedge rate
OUEHT Hospitality -1.3% 5.0% Acquisition of Crown Plaza Changi Airport Extension, opening of Michael Kors and Victoria Secret store and low-base effect
KDCREIT Data-centre (industrial) 0.8% 5.0% Acquisition of data centres in Milan and Singapore
MUST Office (USA) 1.3% 7.8% Improvement in US office market
Source: Various REITs, DBS Bank
0.4%
2.5%
1.2%
1.2%
0.0%
-6.7%
1.1%
1.3%
1.1%
0.5%
0.8%
-1.3%
-8.0% -6.0% -4.0% -2.0% 0.0% 2.0% 4.0%
S-REITs
Office/ Commercial
Retail
Singapore Retail
Industrial
Hospitality
FY17/18
FY16/171.1%
1.3%
1.1%
0.5%
0.8%
-1.3%
1.5%
-0.2%
2.3%
1.2%
2.5%
-0.7%
-2.0% -1.0% 0.0% 1.0% 2.0% 3.0%
S-REITs
Office/ Commercial
Retail
Singapore Retail
Industrial
Hospitality
Consensus
FY17/18
Page 39

Industry Focus
Singapore Developers & REITs
ASIAN INSIGHTS VICKERS SECURITIES Page 40
5.3 Potential risk to property values in the industrial and hospitality sectors
Capital values most resilient for office and retail sector. Cap rates have generally been compressing over the past few years due to low interest rates and ample liquidity boosting transactions velocity and value. Looking ahead, with projected decline in rents and RevPAR for the industrial and hotels in 2016, there is potential downside to the capital values for some industrial and hospitality REITs. While rents for the office and retail sector are under pressure near term, we expect capital values to remain steady, given abundant liquidity chasing both these asset classes. This can be seen by recent office transactions such as the sale of Asia Square Tower 1 and Straits Trading Building for approximately S$2,700 and S$3,500 per sqft respectively. In addition, the implied price for the Central Boulevard land tender made by IOI Properties was over S$3,000 per sqft.
For retail space, CityVibe at Clementi was sold at a net yield of slightly above 4% while vendors for Jurong Point is seeking to sell the mall for over S$2bn at a sub-4% net yield. The values ascribed to these transactions are in line or above the valuations of the properties of the various office and retail REITs.
Figure 50: Implied price per sqft of NLA for Singapore
portfolio on completed basis
REIT Price (S$)
Total attributable SG
NLA (m sqft)
Implied psf (S$)
CCT 1.505 3.1 1,850 KREIT 1.020 2.6 2,250 OUECT 0.695 1.0 2,320 Suntec 1.650 2.4 2,050
*Calculated as EV less value of non Grade A office properties divided by attributed property
Figure 51: Recent office transactions
Date Property Location Land tenure Net Lettable Area (sq ft)
Price ($) Price per NLA (S$)
Aug-14 Equity Plaza Raffles Place 74 years remaining 252,135 550,000,000 2,181
Jul-14 Anson House Tanjong Pagar Area
82 years remaining 76,362 172,000,000 2,252
Sep-14 MBFC Tower 3 Marina Bay 92 447,327 1,248,000,000 2,790
Jan-15 AXA Tower Tanjong Pagar 66.5 remaining (2015) 675,000 1,170,000,000 1,733
Jun-15 One Raffles Place Raffles Place 99/FH 600,000 1,429,166,667 2,382
Nov-15 CPF Building 79 Robinson Road 99 LH (2067) 324,000 550,000,000 1,698
May-16 Remaining 60% interest in CapitaGreen
Raffles Place 57 remaining expiring 31Mar2073
703,122 1,600,500,000* 2,276 (2,700 assuming 99 year leasehold)
May-16 Straits Trading Building 9 Battery Road 999 LH 158,897 560,000,000 3,524
Jun-16 Asia Square Tower 1 Marina Bay 99 LH from 2007 1,200,000 sqft office & 40,000 sqft retail
3,400,000,000 2,668
*Based on 100% equity interest Source: Various press reports, DBS Bank
Page 40
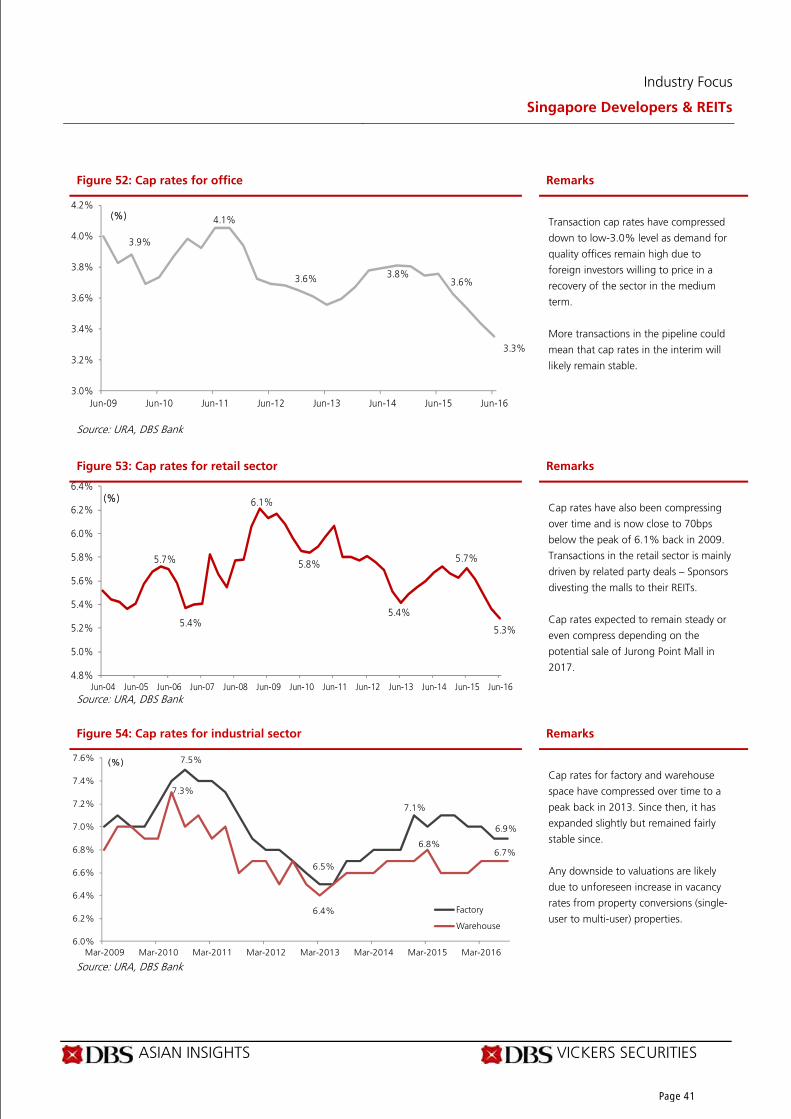
Industry Focus
Singapore Developers & REITs
ASIAN INSIGHTS VICKERS SECURITIES Page 41
Figure 52: Cap rates for office Remarks
Source: URA, DBS Bank
Transaction cap rates have compressed
down to low-3.0% level as demand for
quality offices remain high due to
foreign investors willing to price in a
recovery of the sector in the medium
term.
More transactions in the pipeline could
mean that cap rates in the interim will
likely remain stable.
Figure 53: Cap rates for retail sector Remarks
Source: URA, DBS Bank
Cap rates have also been compressing
over time and is now close to 70bps
below the peak of 6.1% back in 2009.
Transactions in the retail sector is mainly
driven by related party deals – Sponsors
divesting the malls to their REITs.
Cap rates expected to remain steady or
even compress depending on the
potential sale of Jurong Point Mall in
2017.
Figure 54: Cap rates for industrial sector Remarks
Source: URA, DBS Bank
Cap rates for factory and warehouse
space have compressed over time to a
peak back in 2013. Since then, it has
expanded slightly but remained fairly
stable since.
Any downside to valuations are likely
due to unforeseen increase in vacancy
rates from property conversions (single-
user to multi-user) properties.
3.9%
4.1%
3.6% 3.8%3.6%
3.3%
3.0%
3.2%
3.4%
3.6%
3.8%
4.0%
4.2%
Jun-09 Jun-10 Jun-11 Jun-12 Jun-13 Jun-14 Jun-15 Jun-16
(%)
5.7%
5.4%
6.1%
5.8%
5.4%
5.7%
5.3%
4.8%
5.0%
5.2%
5.4%
5.6%
5.8%
6.0%
6.2%
6.4%
Jun-04 Jun-05 Jun-06 Jun-07 Jun-08 Jun-09 Jun-10 Jun-11 Jun-12 Jun-13 Jun-14 Jun-15 Jun-16
(%)
7.5%
6.5%
7.1%
6.9%
7.3%
6.4%
6.8%6.7%
6.0%
6.2%
6.4%
6.6%
6.8%
7.0%
7.2%
7.4%
7.6%
Mar-2009 Mar-2010 Mar-2011 Mar-2012 Mar-2013 Mar-2014 Mar-2015 Mar-2016
(%)
Factory
Warehouse
Page 41

Industry Focus
Singapore Developers & REITs
ASIAN INSIGHTS VICKERS SECURITIES Page 42
5.4 Acquisitions may be difficult to execute with redevelopments an attractive option
Slowdown in acquisitions in 2016.At the end of 2015, we expected the high cost of equity to potentially constrain the ability of S-REITs to raise equity to fund acquisitions. This partially came to fruition with total announced acquisitions dropping 16% y-o-y to S$6.2bn. The most active sectors were the Industrial (S$3.0bn), followed by Office/Commercial (S$1.9bn) and Hospitality (S$0.8bn). Notable transactions include MCT’s purchase of Mapletree Business City Phase I (S$1.8bn), CCT’s acquisition of the remaining 60% interest in CapitaGreen (S$1.6bn) and CRCT’s purchase of Galleria Mall (S$0.3bn). In terms of country allocation, Singapore returned as the primary market (66% of total acquisitions worth S$3.8bn) for acquisitions. This was mainly driven by the purchase of Mapletree Business City Phase I and 60% interest in CapitaGreen. Australia remains a popular destination with total
acquisitions worth S$861m as industrial REITs such as AREIT, FLT and MLT sought freehold properties with annual rental escalations. Suntec and FHT also bought a 25% interest in Southgate, Melbourne (S$289m) and Novotel Melbourne (S$246m) respectively. In 2016, the S-REIT sector made its maiden acquisition in Italy with KDCREIT’s purchase of a data centre in Milan. S-REITs increased the number of assets sold from S$306m in 2015 to S$555m in 2016 as AREIT exited China and redeployed its capital to Australia, while RHT sold its 51% economic interest in its Gurgaon property given the inability of the trust to obtain the necessary regulatory approval to buy a direct 51% equity interest in the hospital. Meanwhile, the share of properties acquired from the S-REITs' sponsors jumped to 72% in 2016 from 49% in 2015 as MCT and CCT bought from their respective sponsors. Stripping out these two transactions, the majority of acquisitions were made from third parties.
Figure 55: Acquisition value marginally down Figure 56: Acquisitions were mainly Singapore-centric
Source: Various S-REITs, DBS Bank Figure 57: Industrial REITs remain most active Figure 58: Sponsor remains key source of acquisitions
in 2016
Source: Various REITs, DBS Bank
32%51% 57% 49%
72%
68%49% 43% 51%
28%
0%10%20%30%40%50%60%70%80%90%
100%
2012 2013 2014 2015 2016
Sponsor/Strategic partner 3rd party
36%
6%3%
38%
3% 14%
2015
Singapore
China
Japan
Australia
Indonesia
Others
66%5%
2%
15%
3%8%
2016
Singapore
China
Japan
Australia
Indonesia
Others0
1,000
2,000
3,000
4,000
5,000
6,000
7,000
8,000
2012 2013 2014 2015 2016
S$'m
Others
Indonesia
Australia
Japan
China
Singapore
0 2,000 4,000 6,000 8,000
Office/Commercial
Retail
Industrial
Hospitality
Healthcare
Total
2016
2015
2014
2013
2012S$m
Page 42

Industry Focus
Singapore Developers & REITs
ASIAN INSIGHTS VICKERS SECURITIES Page 43
Figure 59: Announced acquisitions by S-REITs in 2016
REIT Property Country Sector Value (S$m)
Vendor
LMRT Lippo Mall Kuta Indonesia Retail 81.6 Sponsor Related LMRT Lippo Plaza Jogja Indonesia Retail 51.0 Sponsor Related FIRT Siloam Hospitals Yogyakarta Indonesia Healthcare 40.8 Sponsor Related ART Sheraton Tribeca New York Hotel US Hospitality 218.0 3rd Party AIT Building at CyberVale, Chennai India Industrial 13.2 3rd Party P-Life Silver Heights Hitsujigaoka Ichiban-kan & Niban-kan Japan Healthcare 13.6 3rd Party CRT Fuji Grand Natalie Japan Retail 40.2 3rd Party FHT Maritim Hotel Dresden, Germany Germany Hospitality 90.4 3rd Party CRT Mallage Saga and Feeeal Asahikawa Japan Retail 74.5 3rd Party CCT Remaining 60% interest in CapitaGreen Singapore Office 960.0 Sponsor Related MLT Four dry warehouse facilities located in Sydney, NSW, Australia Australia Industrial 84.4 3rd Party MLT Mapletree Shah Alam Logistics Park Malaysia Industrial 53.2 Sponsor Related SBREIT Bukit Batok Connection Singapore Industrial 96.3 Sponsor Related MCT Mapletree Business City (Phase 1) Singapore Industrial/Office 1,780.0 Sponsor Related OUEHT Crowne Plaza Extension Singapore Hospitality 205.0 Sponsor Related Suntec Southgate Complex Australia Office/Retail 289.0 3rd Party KDCREIT Data Centre in Milan, Italy Italy Industrial 57.3 3rd Party CRCT Galleria China Retail 304.9 3rd Party FLT 111 Indian Drive, Keysborough, Melbourne & Lot 1 Pearson
Road, Yatala, Brisbane (Call option properties) Australia Industrial 71.2 Sponsor Related
FHT Novotel Melbourne on Collins, Australia Australia Hospitality 245.9 3rd Party AREIT 197-201 Coward Street, Sydney & Stage 4, Power Park Estate,
Dandenong South, Melbourne Australia Industrial 170.8 3rd Party
MLT Mapletree Logistics Park Phase 2, Vietnam Vietnam Industrial 20.6 Sponsor Related KDCREIT Keppel DC Singapore 3 Singapore Industrial 141.0 Sponsor Related FIRT Siloam Hospitals Labuan Bajo Indonesia Healthcare 20.0 Sponsor Related AREIT 2 Science Park Properties Singapore Business Park 420.0 Sponsor Related MLT 4 warehouses in Australia Australia Industrial 151.9 3rd Party Total 5,696 Industrial 3,162 Retail 393 Office 1,277 Hospitality 551 Healthcare 313
Source: Various REITs, DBS Bank
Figure 60: Announced disposals by S-REITs in 2016
REIT Property Country Sector Value (S$m) Buyer RHT 51% economic interest in Gurgaon Clinical Establishment and
Shalimar Bagh Clinical Establishment India Healthcare 299.8 Sponsor Related
CIT 23 Tuas Avenue 10 & 2 Ubi View Singapore Industrial 27.0 3rd Party AREIT A-REIT City @ Jingqiao China Industrial 228.1 3rd Party FIRT Siloam Hospitals Surabaya - Plot A and existing hospital Indonesia Healthcare 35.7 Sponsor Related ART Salcedo Residences Philippines Hospitality 7.2 3rd Party Cache Changi Districentre 3 Singapore Industrial 25.5 3rd Party PREIT 4 Nursing Homes Japan Healthcare 48.9 3rd Party
Source: Various REITs, DBS Bank More redevelopments to potentially occur. Given depressed share prices causing difficulty in raising equity to fund acquisitions and potential investor reluctance to gear up
balance sheets in a rising interest rate environment, we believe the pace of acquisitions may slow further in 2017.
Page 43

Industry Focus
Singapore Developers & REITs
ASIAN INSIGHTS VICKERS SECURITIES Page 44
Nevertheless, redevelopments may come to fore especially with the increase in the development limit from 10% previously to 25%. To date, we have seen CMT redevelop Funan and CCT announce plans to building a Grade A office building at its
existing Golden Shoe property. For 2017, we anticipate that CRT will announce plans to maximise its One’s Mall and Torius property, while FCOT may redevelop Alexandra Technopark should the anchor tenant HP move out.
Figure 61: S-REITs' gearing headroom and sponsor pipeline
REIT Gearing end FY16/17F*
Headroom 40%
Sponsor Potential Pipeline Remarks
Office CCT 38% 316 CapitaLand Remaining stake in
CapitaGreen Contingent on performance of CapitaGreen
FCOT 36% 137 Frasers Centrepoint Land
Valley Point/Alexandra Point/Cecil Street Office property/Australand properties
High likelihood for Australand's properties though subject to FCOT share price
KREIT 39% 141 Keppel Land N/A Limited near-term pipeline from sponsor OUECT 38% 91 OUE Limited OUE Downtown Potential in 2017-2018 Retail CRCT 36% 180 CapitaLand Malls in China Subject to valuation and malls being
stabilised CMT 35% 831 CapitaLand Westgate, Star Vista,
Bedok Mall, Ion Orchard
Possible acquisition of Westgate
CRT 45% n/a Croesus Group, Daiwa House, Marubeni
Mallage Saga, China properties
No immediate plans to purchase Chinese properties
FCT 28% 423 Frasers Centrepoint Limited
Waterway Point, Northpoint City
Pipeline assets under construction
SPH REIT 26% 798 SPH Seletar Mall Seletar Mall yet to be stabilised as it only opened in Dec-14
Commercial MCT 37% 344 Mapletree
Investments Mapletree Business City (MBC) 1&2
MBC 2 under construction
MAGIC 39% 70 Mapletree Investments
Kowloon East Office Kowloon East Office under construction, MAGIC looking at opportunities in China
SGREIT 35% 277 YTL Corporation
- Focused on existing assets at the moment
Suntec 38% 304 Cheung Kong / ARA
- No acquisitions expected
Source: Various REITs, DBS Bank
Page 44

Industry Focus
Singapore Developers & REITs
ASIAN INSIGHTS VICKERS SECURITIES Page 45
Figure 62: S-REITs' gearing headroom and sponsor pipeline (cont’d)
REIT Gearing end FY16/17F
Headroom 40%
Sponsor Potential Pipeline Remarks
Industrial a-itrust 36% 78 Ascendas Group Other Ascendas Group
Indian properties Subject to share price performance and stabilisation of INR
A-REIT 34% 921 Ascendas Group Industrial assets Acquisitions likely to be from sponsor (business park properties in Singapore)
Cache 41% n/a CWT/ARA Ramp up warehouses from CWT
Unlikely to acquire from sponsor
CREIT 38% 56 N/A Exploring opportunities in Australia, Japan and Malaysia
MINT 30% 612 Mapletree Group Tai Seng development Under development and not likely to be acquired in the near term
MLT 37% 223 Mapletree Group Properties in Hong Kong, China
High likelihood of M&A to supplement growth, given headwinds in Singapore
SBREIT 33% 152 Soilbuild Group Holdings
Various industrial properties
Hospitality ASCHT 33% 196 Ascendas
Group/Accor Asia Pacific properties Potential disposal of Pullman
Cairns to provide additional financial flexibility
ART 41% n/a Ascott Group Serviced apartments in Europe, Quest apartments in Australia
Subject to ability to recycle capital and raise equity
CDREIT 36% 176 City Developments St Regis, South Beach project
Lower gearing provides firepower for acquisitions
FEHT 33% 303 Far East Organisation 7 hotels & serviced residences
Assets not ready to be injected
FHT 34% 46 Frasers Centrepoint Limited and TCC Group
17 hotels and serviced residences
Subject to ability to raise equity
OUEHT 38% 92 OUE Limited OUE Downtown serviced apartments
Limited, given proposed acquisition of Crowne Plaza Changi and extension
Healthcare P-Life 38% 66 IHH Hospitals in the region
including Novena Mt Elizabeth
Others KDCREIT 29% 300 Keppel T&T T27 Asset not stabilised yet IREIT 42% n/a Stella Holdings,
Shanghai Summit, Mr Lim Chap Huat
Low likelihood, given current share price
Source: Various REITs, DBS Bank
Page 45

Industry Focus
Singapore Developers & REITs
ASIAN INSIGHTS VICKERS SECURITIES Page 46
Figure 63: S-REITs with development potential and/or asset recycling potential REIT Assets with redevelopment potential Potential asset recycling opportunity
Office CCT Golden Shoe n/a FCOT Alexandra Techno Park if HP/Microsoft moves out n/a KREIT n/a n/a OUECT n/a n/a
Retail CRCT n/a n/aCMT Funan n/aCRT One’s Mall and Torius Mall n/aFCT Integration with Northpoint extension n/aSPH REIT n/a n/a
Commercial MCT n/a n/aMAGIC n/a n/aSGREIT n/a n/aSuntec Park Mall n/a
Industrial a-itrust n/a n/aA-REIT Selected properties with unutilised GFA Older properties with limited medium upside Cache n/a n/aCREIT Selected properties with unutilised GFA Older properties with limited medium upside MINT Selected properties with unutilised GFA Older properties with limited medium upside MLT Selected properties with unutilised GFA Older properties with limited medium upside SBREIT Selected properties with unutilised GFA n/a
Hospitality ASCHT n/a
ART n/a Rental properties in Japan / Assets in lower-tier cities in Europe CDREIT n/a n/aFEHT n/a n/aFHT n/a n/aOUEHT n/a n/a
Healthcare P-Life n/a n/aRHT n/a n/a
Other KDCREIT n/a n/a IREIT n/a n/a
Source: Various REITs, DBS Bank
Page 46

Industry Focus
Singapore Developers & REITs
ASIAN INSIGHTS VICKERS SECURITIES Page 47
6. Residential Subsector Outlook: Luxury home prices to bottom out
Key Assertions
Luxury residential home prices (CCR) to bottom out on the back of improved transaction velocity & foreigner buying interest.
Suburban home prices (OCR) to see up to a 3%-5% further drop in prices impacted by higher mortgage rates and market vacancy rates.
Government could relax policy given uncertain macro-outlook and pace of interest rate rise.
Prices for luxury residential homes to further stabilise come 2017; downside for home prices in the suburbs. We believe that the property market may have stabilised at these low levels in the near term with further downside risk likely to come only from a deterioration of the economic outlook for Singapore. The bright spots are that luxury and central market segments have likely bottomed out, while we expect up to a further 5% drop for property prices in the Outside Central Region (OCR).
We believe the stabilisation of the market could be led by the following:
1. PPI has declined 11.4% from the peak in September 2013 (with the inclusion of net prices in 3Q), inching closer to the government’s trigger point for intervention at c.13% decline from the peak based on historical incidences. Potential relaxation of government policies which will be supportive of prices.
2. At these price levels, sales volume has improved (+9.8% in 9M16) largely led by executive condominium (EC) and secondary sales which may moderate further decline in property prices.
3. Vacancy rate remains high with continued pressure on rental rates.
4. While the 3Q16’s economic data were worse than expected, coupled with unemployment concerns, our economist believes that the downside risk is beginning to moderate (DBS Economics: Singapore: down but not out).
Figure 64: Residential Market Summary
Key Indicators % Chg 1Q16 2Q16 3Q16 Price Index -1.5% 140.6 140.0 137.9
Rental Index -1.2% 107.5 106.9 105.6
Transactions* -12.2% 1,419 2,256 1,981
Pipeline of supply -7.5% 53,512 47,250 43,693
Vacancy rate -0.2% points 7.5% 8.9% 8.7%
*Excludes Executive condominiums Source: URA
Page 47

Industry Focus
Singapore Developers & REITs
ASIAN INSIGHTS VICKERS SECURITIES Page 48
6.1 Trends, demand & supply Outlook
Price Trends
3Q16 Property Price Index saw the sharpest drop partly due to the inclusion of net prices of de-licensed projects (Chart 1). Private property prices saw the largest q-o-q decline of 1.5% in 3Q16 since the streak of falling prices following the September 2013 peak. This was partly due to the inclusion of net prices of de-licensed projects for the first time which does not present a ‘clean’ q-o-q price movement for this quarter. The landed private property price index (PPI landed) recorded the largest decline of 6.9% y-o-y and a 2.3% q-o-q decrease in 3Q16. The PPI has declined 11.4% since peaking in September 2013 with landed PPI and non-landed PPI dropping by 15.9% and 9.8% respectively.
PPI has fallen 11.4% from September 2013 peak (Chart 1). Following the new inclusion, PPI has declined 11.4% from the peak in September 2013 with landed properties recording the largest decline of 15.9%, followed by RCR (-11.0%) and CCR (10.6%). Based on the past two incidences (AFC in 1998 and dot com collapse in 2000), the government has been seen to intervene when property prices fell c.13% from the peak. If history is a good indicator, the quantum of the decline is inching closer to the government’s trigger point.
Central region bottoming out (Chart 1). Property prices fell in all three regions in Singapore partially due to the inclusion of net prices with Core Central Region (CCR) recording the highest decline at 1.9% q-o-q. Property prices in Rest of Central Region (RCR) and Outside Central Region (OCR) each recorded a 1% decline q-o-q. With the inclusion of net prices, property prices in CCR and RCR recorded 10.6% and 11.0% declines from their peaks. OCR, which previously held up better than the central region, is now inching closer at 9.8%. Nevertheless, we believe the central region is bottoming out as previously, property prices in the central region saw two consecutive quarters of marginal increase in PPI of 0.3% q-o-q in the CCR in both 1Q16 and 2Q16, while RCR saw three consecutive quarters of flat-to-marginal increase of 0.2% q-o-q (2Q16: +0.2% q-o-q).
Transactions
Total transactions inch up as secondary volumes lead the way (Charts 2 and 3). Total residential transactions rose by 11% y-o-y and 1% q-o-q to 4,596 units. This was mainly due to a rise in resale transactions of 53% y-o-y to 2,615 units while executive condominiums saw a 15% increase to 1,398 units. Primary sales volumes (excluding EC) fell 18% after four quarters of improved y-o-y transactions.
Higher 9M16 transactions lead by EC and secondary sales. Total residential transactions rose by 9.8% y-o-y to 12,000 units led by a 65% increase in EC sales and a 25% increase in secondary sales. Primary sales volumes fell 3.1%. We believe that signs of transactions returning to the market albeit from a lower base, implies that after a close to 10% drop in price index, buyers are seeing value in the current market.
Supply
Supply completion to start moderating from 2017 onwards. The cut in the number of sites available for tender in the government land sales programme and lack of collective sales in recent years mean that supply growth will peak in 2016 at 51,210 units (25,000 public housing units, 21,650 private units and 4,560 ECs) and moderate from 2017 onwards. The total supply under construction stands at 155,750 units (88,000 public housing units, 53,150 private units and 14,600 ECs). Given the declining completion outlook, we believe that the oversupply situation in the residential market will also start to improve and normalise over the coming years. We expect vacancy rates to inch up from 8.9% as of 2Q16 to 9-10% over 2016-2017 before reversing.
Page 48

Industry Focus
Singapore Developers & REITs
ASIAN INSIGHTS VICKERS SECURITIES Page 49
Rentals
Increased supply and weak employment outlook to result in further pressure on rental yields. The 3Q16 residential rental index fell 1.2% q-o-q led by non-landed residential homes rental (-1.4%) while rental for landed homes was flat. The residential rental index (non-landed) for residential homes (non-landed) declined by 1.4% compared to a quarter ago and is now more than 10.7% down from its 3Q13 peak. The q-o-q fall is evenly spread across the various parts of the island, with rental for residential homes in OCR leading the decline at 2.4% followed by CCR's -1.4% and RCR's -0.6%.
Vacancy rates improved marginally by 0.2ppt to 8.7% as at end of 3Q16, still above the historical average of 6.6%. The weakness in rental can be attributed to the ramp-up in supply completions in recent years. Despite the marginal improvement, we continue to expect vacancy to rise and further downward pressure for rents but at a more muted rate.
The uncertainty in the employment outlook, and the ongoing job rationalisation at financial institutions and tighter regulations impacting expatriates’ employment in Singapore may add pressure on demand for some homes, especially those in the CCR.
Figure 65: Residential Price Indices – Gradual decline in prices
Period All-Residential
Index
Landed
Index
Non-Landed Non-Landed Index HDB
Index Core Central Region
Rest of Central Region
Outside Central Region
3Q13 0.4% 0.3% 0.6% -0.3% -0.9% 2.2% -0.9% 4Q13 -0.9% -1.0% -0.9% -2.1% 0.4% -0.9% -1.6% 1Q14 -1.2% -0.7% -1.3% -1.0% -3.3% -0.1% -1.6% 2Q14 -1.1% -1.7% -0.8% -1.5% -0.3% -0.9% -1.4% 3Q14 -0.7% -1.8% -0.4% -0.8% -0.4% -0.4% -1.7% 4Q14 -1.1% -1.3% -1.0% -0.9% -1.3% -0.8% -1.5% 1Q15 -1.0% -0.9% -1.1% -0.4% -1.7% -1.1% -1.0% 2Q15 -0.9% -1.0% -0.8% -0.6% -0.6% -1.1% -0.4% 3Q15 -1.3% -0.4% -1.5% -1.2% -2.2% -1.6% -0.3% 4Q15 -0.5% -1.8% -0.2% -0.3% 0.2% 0.0% 0.1% 1Q16 -0.7% -1.1% -0.6% 0.3% 0.0% -1.3% -0.1% 2Q16 -0.4% -1.9% -0.1% 0.3% 0.2% -0.5% 0.0% 3Q16 -1.5% -2.3% -1.2% -1.9% -1.0% -1.0% 0.0% %yoy Chg (3Q16) -3.1% -6.9% -2.0% -1.6% -0.6% -2.8% 0.1%
% Chg (Peak) -11.4% -15.9% -9.8% -10.6% -11.0% -9.8% -9.4%
3Q16 (index) 137.9 152.4 134.9 126.9 139.2 154.9 134.7
Source: URA, HDB, DBS Bank
Page 49

Industry Focus
Singapore Developers & REITs
ASIAN INSIGHTS VICKERS SECURITIES Page 50
Charts on Property Transactions
Figure 66: Developers' Sales by Type Remarks
We note that given increased transactions in recent months, there has been an increase in sales launches.
Developers sold 73% of total new units launched in 3Q16, an improved q-o-q take-up rate led by new launches.
Source: URA, DBS Bank
Figure 67: Developers' Sales by Type Remarks
3Q16 was one of the more active quarters in recent years.
Resale Transactions (Secondary Market) contributed close to 57% of total transactions in 3Q16, one of the highest since 2013.
Source: URA, DBS Bank
0.0%
20.0%
40.0%
60.0%
80.0%
100.0%
120.0%
‐
1,000
2,000
3,000
4,000
5,000
6,000
1Q13 2Q13 3Q13 4Q13 1Q14 2Q14 3Q14 4Q14 1Q15 2Q15 3Q15 4Q15 1Q16 2Q16 3Q16
Units
Private Residential Units Launched (uncompleted)Total Direct Sales (Uncompleted)
-
1,000
2,000
3,000
4,000
5,000
6,000
7,000
8,000
9,000
1Q13 2Q13 3Q13 4Q13 1Q14 2Q14 3Q14 4Q14 1Q15 2Q15 3Q15 4Q15 1Q16 2Q16 3Q16
UnitsSecondary Market (Private)
Primary Sales (Private)
Executive Condominiums
Page 50

Industry Focus
Singapore Developers & REITs
ASIAN INSIGHTS VICKERS SECURITIES Page 51
Figure 68: Developers' Sales by Region Remarks
Transactions in the Rest of Central Region (RCR) and Core Central Region (CCR) contributed 27% and 17% of total transactions respectively in 3Q16.
Source: URA, DBS Bank
Charts on Residential Supply Outlook
Figure 69: Supply of new residential units by expected year of completion Remarks
Close to 29,000 units were completed in 1H16.
Looking ahead, we are looking at a more modest rate of increase in new units completing, due to fewer units available for sale as a result of the cuts in land for tenders from the government's land sale program.
Public housing supply remains fairly constant at close to 19,000-25,000 new units completing each year.
Source: MND, DBS Bank
-
10,000
20,000
30,000
40,000
50,000
60,000
2H16 2017 2018 2019
Units
Competed Private Residential Executive Condo Public Housing
-
1,000
2,000
3,000
4,000
5,000
6,000
7,000
8,000
9,000
1Q13 2Q13 3Q13 4Q13 1Q14 2Q14 3Q14 4Q14 1Q15 2Q15 3Q15 4Q15 1Q16 2Q16 3Q16
units
CCR RCR OCR
Page 51

Industry Focus
Singapore Developers & REITs
ASIAN INSIGHTS VICKERS SECURITIES Page 52
Charts on Residential Rents
Figure 70: Rental index has been weakening since 4Q13, in line with property prices
Remarks
The residential rental index remains in decline, dropping further by 1.2% in 3Q16.
Given the positive correlation between rental and prices, we expect prices to continue moderating as rentals weaken further.
`Source: URA, HDB, DBS Bank
Figure 71: Rental index remains weak on high vacancy rates Remarks
With expectations that the residential vacancy rate will continue to inch up towards the 8-10% level from the current 8.7%, we expect rentals to remain weak.
Source: URA, HDB, DBS Bank
60.0
70.0
80.0
90.0
100.0
110.0
120.0
130.0
4.0%
5.0%
6.0%
7.0%
8.0%
9.0%
10.0%
Jun-0
4D
ec-0
4Ju
n-0
5D
ec-0
5Ju
n-0
6D
ec-0
6Ju
n-0
7D
ec-0
7Ju
n-0
8D
ec-0
8Ju
n-0
9D
ec-0
9Ju
n-1
0D
ec-1
0Ju
n-1
1D
ec-1
1Ju
n-1
2D
ec-1
2Ju
n-1
3D
ec-1
3Ju
n-1
4D
ec-1
4Ju
n-1
5D
ec-1
5Ju
n-1
64Q
16
Index Value(%)
Vacancy Rate (Non-Landed) (LHS) Rental Index (Non-Landed) (RHS)
-
20.0
40.0
60.0
80.0
100.0
120.0
140.0
160.0
180.0
-10%
-5%
0%
5%
10%
15% Index Value% Chg
Q0Q Chg in Rental Index PPI Index
Page 52

Industry Focus
Singapore Developers & REITs
ASIAN INSIGHTS VICKERS SECURITIES Page 53
6.2 Scenarios where government could relax policy measures
Government to tinker only if “material stress” is seen in the system. The Singapore property prices have been in a controlled and modest decline of approximately c.5% per annum from the peak of 3Q13. With prices now fallen by 11% from the peak in 3Q13 and we expect the market to remain on a downside bias in 2017. The government’s key focus is still the overall health of the Singapore’s economy and its intertwining relationship with property prices. With property forming close to 45% of total household wealth as of 3Q16, it is not in the government’s interest to have a rapidly declining property market. Emerging risk in the horizon stemming from increased volatility in interest rates, coupled with a weak rental outlook due to heightened supply completion outlook, will likely warrant the government to consider tweaking its macro prudential policies. What are potential scenarios or datapoints that could lead to a policy easing? A marked drop in prices in a quarter or a peak-to-trough price drop of 13-15% might point to a first round of policy unwinding. If history is a good indicator, the current PPI, having fallen close to 11% from the peak, is inching closer to the government’s trigger point of c.13%. Historically (during the Asian Financial Crisis (AFC) in 1998 and the dot com collapse in 2000), the government has been seen to intervene when property prices fell c.13% from the peak over a period of approximately one year. Current mortgage-to-household income ratio stands at 1.5x (mortgage-to-household income ratio ranged from 1.4-1.9x from 1997-2014). The government’s initial responses were: 1) suspend the seller stamp duty during the AFC; and 2) tax exemptions (capital
gains tax and property tax for land under development) were given and the government opened the market to foreigners again by allowing them to obtain loans in SGD during the dot com collapse. However, we believe the scenarios that may warrant a re-look at policies will be a marked drop in prices in a certain quarter or a potential tweak in certain policies on a selective basis. On that front, we believe that “cyclical measures” such as the buyer stamp duties/seller stamp duties which have been effective in curbing speculative demand, could be re-looked if transaction volumes continue to remain tepid over 2017. Singapore citizen unemployment rate rising towards 4.0%. The uncertain employment outlook in Singapore might be a dampener for prospects for price increases in 2017. As of 3Q16, it was reported that unemployment rate among Singapore citizens rose by 0.6ppt to 3.0% as of June 2016 but has held steady (fallen marginally to 2.9% as of September 2016) since. While not sounding any alarm bells at this point, we caution that prices tend to weaken in the event that unemployment rate rises to 4.0% and above (figure 74). DBS economist believes that the unemployment outlook is likely to remain fairly stable at the 3.0% level and not expected to deteriorate in a big way. Sharp increase in interest rates. The recent spike in SIBOR rates, which a majority of home loans is a risk for prices in our view given that it will a rise in mortgage payments going forward. The pace of increase in base rates are likely to be closely watched by the government in order to avoid an unwarranted fallout in property prices which might pose a risk to an already weak economic outlook.
Figure 72: Summary of possible Scenarios that could warrant a potential policy action
Scenario Description Potential Impact on property market What has history taught us? 1. A peak-to-trough fall
in property price of 13-15%.
Usually accompanied with a weakening GDP outlook, this will dampen homebuyer sentiment as the “loss of wealth” effect on home-owners could cascade to a downward spiral in prices.
Government had back in 1998 and 2000 intervened when property price dropped 13% from the peak.
2. Unemployment Rate rising towards 4.0%.
Given the high ownership rate of c.91%, an increase in unemployment will impact on households’ ability to maintain mortgage payments.
A rise in unemployment rate to close to 4.0% and beyond typically results in a fall in property prices.
3. Sharp increase in interest rates.
Impact on affordability as a larger portion of disposable income is channelled to mortgage repayments.
No real correlation historically but likely be one of the key reasons of assessing household affordability.
Source: URA, HDB, DBS Bank
Page 53

Industry Focus
Singapore Developers & REITs
ASIAN INSIGHTS VICKERS SECURITIES Page 54
Figure 73: Measures that government tweaked during previous fall in the Singapore Property Price Index
Blue denotes relaxation measures Source: URA, HDB, DBS Bank Figure 74: Unemployment spikes to close to 4% typically result in a slide in property prices
Source: URA, HDB, DBS Bank
Figure 75: Sensitivity of interest rates to mortgage payments
Monthly Mortgage Payments** Typical Property Type
Price S$’000
Loan S$’000* 2.0% 3.0% 4.0% 5.0%
HDB BTO 500 400 $1,695 $1,897 $2,111 $2,338 Resale 600 480 $2,035 $2,276 $2,534 $2,806 Resale/EC 800 640 $2,713 $3,035 $3,378 $3,741 EC / Private 1,000 800 $3,391 $3,794 $4,223 $4,677 Private 1,250 1,000 $4,239 $4,742 $5,278 $5,846 Private 1,500 1,200 $5,086 $5,691 $6,334 $7,015 Private 1,750 1,400 $5,934 $6,639 $7,390 $8,184 Private 2,000 1,600 $6,782 $7,587 $8,445 $9,353
0.0%
1.0%
2.0%
3.0%
4.0%
5.0%
6.0%
7.0%Mar-92 Mar-94 Mar-96 Mar-98 Mar-00 Mar-02 Mar-04 Mar-06 Mar-08 Mar-10 Mar-12 Mar-14 Mar-16
0
20
40
60
80
100
120
140
160
180
(%) Index Value
Property Price Index
Unemployment Rate (Inverse)
‐
1.00
2.00
3.00
4.00
5.00
6.00
7.00
8.00
Mar‐9
5
Dec‐9
5
Sep‐9
6
Jun‐97
Mar‐9
8
Dec‐9
8
Sep‐9
9
Jun‐00
Mar‐0
1
Dec‐0
1
Sep‐0
2
Jun‐03
Mar‐0
4
Dec‐0
4
Sep‐0
5
Jun‐06
Mar‐0
7
Dec‐0
7
Sep‐0
8
Jun‐09
Mar‐1
0
Dec‐1
0
Sep‐1
1
Jun‐12
Mar‐1
3
Dec‐1
3
Sep‐1
4
Jun‐15
Sept 02: ECdownpayment ‐ 10% cash and 10% CPF
Dec 02: 2 yrs property tax exempt on land under dev; 30% reduction in
stamp duty
Jun 98: deferralof buyer stamp duty
1997: seller stamp duty
suspended
Nov 98: 10%CPF housing grant cut
May 99: 2nd CPF housing grant cut
Feb 00: taxexemption on land dev
removed; DC rates on resi land increased
Jun 00: HDBtightened regulations
Oct 01: CGT lifted; foreigners can use SGD loans; property
tax exempted for land under dev
Jul 05: LTV raised from 80% to 90%; cash payment reduced fr 10% to 5%; relax foreign
ownership rules; relaxation on non‐related singles joint purchasesNov 05: Waived security
requirement of developers on DPS
Dec 06: buyer stamp duty concession
removed
Oct 07: DPS removed
Series of tightening measures
Sep’97-Dec’98 Unemployment Rate: 1.9% - 4.7% Property Price Index: Fell by 36%
Sep’00-Dec’01 Unemployment Rate: 2.6% - 5.2% Property Price Index: Fell by 17%
Sep’07-Sep’09 Unemployment Rate: 2.4% - 4.9% Property Price Index: Fell by 25%
* Assumed 80% loan for a tenure of 25 years Source: URA, HDB, DBS Bank
Page 54

Industry Focus
Singapore Developers & REITs
ASIAN INSIGHTS VICKERS SECURITIES Page 55
7. Office Subsector Outlook: Grade A office space to bottom by end 2017
Key Assertions
Office rents projected to bottom in 2017 as new supply sees good pre-commitment.
Improving pre-commitment rates for key new buildings mainly driven by tenant relocation rather than a net office absorption.
A two-tier market to emerge with Grade A office to emerge out of the downtown first; Business Park space remain attractive.
7.1 Trends, Demand and Supply outlook
Office rents to bottom in 2017. With Marina One slated to be completed in the first half of next year, we project office rents to bottom in mid or late 2017. Our base scenario assumes Grade A office rents to hit a trough at c.S$8.50 per square foot per month (psf/mth) from S$9.30 psf/mth currently. Not only is this reflective of the expected spike in vacancy rates in the
overall Downtown Core area but is also at a market clearing level to entice a company to move into a new office given fit-out costs of S$2.00-2.50 psf/mth and office rents of between S$10.40-11.40 psf/mth over the past year. In our bear case scenario, we project Grade A office rents to hit a low of S$7.50-8.00 psf/mth, which is 14-19% below current Grade A office rents of S$9.30 psf/mth. Office rents continued to trend down in 3Q16. Office rents continued on their downward trajectory since peaking in the first quarter of 2015. According to CB Richard Ellis (CBRE), Grade A office rents fell 2% q-o-q (-15% y-o-y) to S$9.30 psf/mth after falling 4% q-o-q in the second quarter of 2016. Grade B rents also dropped 2% q-o-q to S$7.50 psf/mth. Meanwhile, Grade A occupancies improved to 95.9% from 94.8% in the second quarter of 2016 as CBRE reported positive net absorption of 820k sqft islandwide which ended four consecutive quarters of negative absorption numbers.
Figure 76 Office rents and occupancies Rents 3Q15 2Q16 3Q16 q-o-q y-o-y
URA Office Rental Index: Central Area 187.0 174.1 172.0 -1% -8%
URA Office Rental Index: Fringe Area 147.8 135.3 135.0 0% -9%
CBRE Grade A Core CBD (psf/mth) 10.90 9.50 9.30 -2% -15%
CBRE Grade B Core CBD (psf/mth) 8.35 7.65 7.50 -2% -10%
Occupancy 3Q15 2Q16 3Q16 q-o-q (bps) y-o-y (bps)
URA occupancy private sector: Central Downtown Core 91.1% 90.9% 88.5% -235 -260
URA occupancy private sector: Central Fringe Area 86.7% 88.8% 89.6% 76 287
CBRE Grade A 94.8% 94.8% 95.9% 110 110
CBRE Core CBD 95.8% 95.1% 95.9% 80 10
Source: URA, Corporate Locations, CBRE, various REITs and corporate, press reports, DBS Bank
Page 55

Industry Focus
Singapore Developers & REITs
ASIAN INSIGHTS VICKERS SECURITIES Page 56
Demand
Uncertain outlook for new office demand. Over the past three years, employment growth in the four key sectors driving office demand were (1) Financial Services, (2) IT and other information services, (3) Legal, Accounting and Management Services, and (4) Insurance Services, and had been healthy. The three-year compound annual growth rate (CAGR) for those sectors ranged from 3-9% to end-September 2016. However, given a slowing economy, announced job losses in the financial services industry and businesses moving out of the CBD to business parks/suburban locations, we believe the demand for new office space will be sluggish but still positive. This is evidenced by c.13,000 sqm of net new space in Downtown Core area during the first nine months of the year. In addition, the number of people employed in the services sector continues to grow, expanding by 2% in the nine months to September compared to the same period last year. Improving pre-commitment rates for key new buildings. Compared to earlier this year where the pace of securing tenants for new offices was muted, the environment has since improved. Guoco Tower, according to press reports, has now been 80% pre-leased, while pre-commitments level has increased to 30-40% for Marina One with Duo Tower stable at 30%. With less urgency for Guoco Tower to secure tenants and Marina One potentially increasing pre-commitment levels in the coming months, the incremental pressure on Premium Grade A rents may start to ease. Supply
16% jump in downtown core office supply. Approximately 5.4m sqft of office net lettable area (NLA) will be completed within Singapore’s downtown core between 2016 and 2018; translating into a 16% increase in existing downtown CBD stock, or at a three-year CAGR of 5%. Approximately 73% of new office supply (by NLA) will be concentrated in four assets: (a) DUO Tower located in Bugis; (b) Guoco Tower, located in Tanjong Pagar; (c) Marina One in Marina Bay; and (d) Frasers Tower, located at Tanjong Pagar (Table 1). Based on press reports, the majority of the remaining developments will likely be sub-divided and strata sold to end-users.
Forecasts
Spike in vacancy but market moves to two-tier market. On the back of sluggish demand and jump in supply, we anticipated Private Sector Downtown Core vacancy rate to potentially spike from 11.5% at the end of September 2016 to 17% in 2017 and 18% in 2018, approaching the levels seen in 2004 and surpassing the 14% vacancy level in 2010 and 2011. While the headline vacancy rate is high, the figure will be composed of two very different markets. One would consist of the older buildings such as those in Shenton Way and Raffles Place where there will be a “structural” or persistent high vacancy potentially in excess of 20% as these buildings are unable to compete against the new buildings currently under construction or recently completed due to less efficient floorplates and modern specifications. In contrast, vacancy at the newer buildings or those defined as Category 1 office buildings by URA will enjoy substantially lower vacancies, closer to the 10% level, as the “flight to quality” takes place, i.e. tenants seeking better quality offices to cater to their expansion plans or consolidate their various offices into a single location. According to URA, Category 1 office buildings are defined as those located in core business areas in Downtown Core and Orchard Planning Area which are relatively modern or recently refurbished, command relatively high rentals, and have large floor plate sizes and gross floor areas. Recovery from 2018 onwards. While we expect office vacancy rates to peak in late 2017 or early 2018, with new office supply easing from 2018 onwards, we anticipate rents to start recovering as early as the end of 2017, as both tenants and landlords anticipate vacancies to drop due to a fall in supply. However, we expect a recovery in rents to largely occur in the premium spectrum of Grade A office space, as the older buildings at Shenton Way and Raffles Place will unlikely be able to raise rents due to their still high occupancies and uncompetitive products. On that front, we expect Grade A office rents to recover from the S$8.50 psf/mth low in 2017 towards S$10 psf/mth in 2018, similar to the 14% rise in office rents experienced between mid-2013 and 2015 as we approached a dearth of new supply in 2015 and demand normalises to historical average in 2019. The projected recovery in Grade A office rents is also partially a result of the increased proportion of premium quality office stock commanding higher office rents.
Page 56

Industry Focus
Singapore Developers & REITs
ASIAN INSIGHTS VICKERS SECURITIES Page 57
Key Charts
Figure 78: Office supply in the Central Business District (CBD) Remarks Office (CBD) Location Developer Estimated
NLA (sqft)
Property Type
2016
Guoco Tower Peck Seah Street Guocoland 890,000 Leasing
EON Shenton Shenton Way Roxy Pacific Holdings 101,045 Strata Sale
SBF Center Robinson Road Far East 353,480 Strata Sale
DUO Tower Rochor Road M + S 570,475 Leasing
GSH Plaza Cecil Street GSH/TYJ/Vibrant/DB2 282,000 Strata Sale
OUE Downtown 1 Shenton Way OUE 50,000 Leasing
2,247,000
2017
Marina One Marina Bay M + S 1,876,000 Leasing
UIC Building Shenton Way UIC 278,000 Strata Sale
Oxley Tower Robinson Road Oxley Consortium 112,000 Strata Sale
Crown @ Robinson Robinson Road WyWy Developments 70,000 Strata Sale
2,299,000
2018
Redevelopment of International Factors Building and Robinson Towers
Robinson Road Tuan Sing 194,380 Strata Sale
Frasers Tower Cecil Street Frasers Centrepoint Limited 645,000 Leasing
858,380
2019
Funan North Bridge Road
CapitaLand Mall Trust 204,000 Leasing
204,000
2020
CPF Building Shenton Way Ascendas-Singbridge, Mitsui and Tokyo Tatemono
500,000 Leasing
500,000
2021
Golden Shoe Market Street CapitaLand Commercial Trust
800,000 Leasing
Central Boulevard White Site
Marina Bay In bidding stage 1,070,000 Leasing
1,870,000
Estimated 5.4m sqft of office net lettable area (NLA) is expected to complete within the Downtown Core between 2016 and 2018, representing a 16% total increase in current Downtown Core office stock.
Around 4.0m sqft of NLA will be held for leasing purposes, while the rest will likely be strata sold.
Key office projects to watch out for are Guoco Tower (2016), DUO Tower (2016), Marina One (2017) and Frasers Tower (2018).
Following the easing of supply in 2018 and 2019, a pickup in new CBD supply will only occur in 2020/2021 when CPF Building, Golden Shoe and Central Boulevard White site are scheduled to be completed.
Source: URA, Corporate Locations, CBRE, various REITs and corporate, press reports, DBS Bank
Page 57

Industry Focus
Singapore Developers & REITs
ASIAN INSIGHTS VICKERS SECURITIES Page 58
Figure 79: Decentralised office supply Remarks Office (Decentralised)
Location Developer Estimated NLA (sqft)
Property Type
2016 M18 Eastern Suburbs
- Paya Lebar Mapletree 56,000 Leasing
Havelock II River Valley / Havelock
Guthrie GTS 64,850 Strata Sale
120,850 2017 Arc 380 Eastern Suburbs
- Jalan Besar Tong Eng Group 103,500 Strata
Sale
Vision Exchange Western Suburbs - Jurong
500,000 Strata Sale
603,500 2018 Paya Lebar Central Eastern Suburbs
- Paya Lebar Lend Lease / ADIA 750,000 Leasing
750,000 2019 Woods Square Northern Suburbs
- Woodlands Far East Organisation 534,500 Strata
Sale
534,500
Over the next few years, supply of decentralised office space will be steady. Given a large majority of this new supply is being sold as strata units potentially for smaller users and owner occupiers, they will compete directly with CBD space.
However, in 2018, Paya Lebar Central may pose some form of competition to CBD office space if Lend Lease/ADIA is able to position the property as a viable alternative.
Source: URA, Corporate Locations, CBRE, various REITs and corporate, press reports, DBS Bank
Figure 80: Average new supply per annum over 2015-2019 in line with average from 2010-2014
Remarks
While the headline supply is expected to be large from 2015-2019, the average supply of 1.15m sqft p.a. is comparable to 2010-2014’s average of 1.10m sqft p.a. Despite the large supply in 2010-2014, central area office rents still recorded positive growth.
Source: URA, DBS Bank
‐
2.0
4.0
6.0
8.0
10.0
12.0
14.0
16.0
18.0
20.0
‐1,500
‐1,000
‐500
0
500
1,000
1,500
2,000
2,500
2000
2001
2002
2003
2004
2005
2006
2007
2008
2009
2010
2011
2012
2013
2014
2015
2016
2017
2018
2019
2020
2021
'000 sqft
Net supply: Downtown Core (LHS)
Net demand: Downtown Core (LHS)
CBRE Grade A office rents (RHS)
S$ psf pm
Post GFC2010‐2014 average:1.10m sqft
2015‐2019 average:1.15m sqft
Page 58

Industry Focus
Singapore Developers & REITs
ASIAN INSIGHTS VICKERS SECURITIES Page 59
Figure 81: URA rental index (central) growth vs. changes in employment for financial institutions (1998 – present)
Remarks
Between 1998 and 2015, there was 90% correlation between changes in the URA rental index (central) and employment growth in the financial services sector.
Lower correlation in rents and financial services employment from 2012 onwards (73%) reflects a diversification in demand for CBD office space from other sectors such as technology, media and telecommunications, commodities/resources and professional services.
Employment in the financial institution sector will still have a large influence on the direction of rents in the CBD.
Source: URA, Singstat, CEIC, DBS Bank
Figure 82: Business Park rents still cheaper than Grade A but pricing advantage has narrowed
Remarks
Business Park rents have stayed fairly flattish over the past five years, and the pricing advantage expanded when Grade A rents increased by around 20% from 3Q13 to its peak in 1Q15-2Q15.
Firms which wanted to achieve significant cost savings and were eligible to be located in business parks, had thus relocated from the CBD while maintaining a leaner presence in the CBD.
Source: CBRE, DBS Bank
‐5%
0%
5%
10%
15%
20%
‐30%
‐20%
‐10%
0%
10%
20%
30%
40%
50%
60%
70%
URA rental index ‐ central (LHS) Employment ‐ Financial & Insurance Services (RHS)
0%
5%
10%
15%
20%
25%
30%
35%
40%
45%
50%
0
2
4
6
8
10
12
14
16
18
20
1Q07
2Q07
3Q07
4Q07
1Q08
2Q08
3Q08
4Q08
1Q09
2Q09
3Q09
4Q09
1Q10
2Q10
3Q10
4Q10
1Q11
2Q11
3Q11
4Q11
1Q12
2Q12
3Q12
4Q12
1Q13
2Q13
3Q13
4Q13
1Q14
2Q14
3Q14
4Q14
1Q15
2Q15
3Q15
4Q15
1Q16
2Q16
3Q16
Grade A and BP rent spread (RHS) Grade A office rent (LHS)
Business Park rent (LHS)
S$ psf/mth
Page 59

Industry Focus
Singapore Developers & REITs
ASIAN INSIGHTS VICKERS SECURITIES Page 60
Figure 83: Uncertain demand outlook for key sectors that drive CBD office demand Remarks
Key drivers of CBD office demand include financial services, legal and accounting sectors, as well as IT and other information services. Between 2012 and 2015, these key sectors led CBD office demand, and reported headcount increases of between 3-9% p.a.
With an uncertain economic environment ahead, the outlook across these sectors has turned more cautious. Nevertheless, given still positive GDP growth ahead as projected by our DBS economists, we expect net positive demand for space though at a slower pace than the more buoyant times during 2012-2013. For 9M16, the amount of occupied space in the Downtown Core area rose by 237k sqft, according to the latest URA statistics.
Source: Singstat, CEIC, DBS Bank
7%
3%
5%
8%
5%
0.0% 5.0% 10.0%
IT and Other information
Services
Financial Services
Insurance Serivces
Legal, Accounting and
Management Services
Total
3‐year headcount CAGR (2012‐2015) Outlook
IT and Other information
Services, 21%
Financial Services, 41%Insurance
Serivces, 8%
Legal, Accounting
and Management Services, 30%
Key sectors for CBD office demand
Page 60

Industry Focus
Singapore Developers & REITs
ASIAN INSIGHTS VICKERS SECURITIES Page 61
Figure 84: Office vacancies to spike on sluggish demand and increase in supply Remarks
We expect the soft demand outlook to result in c.40k sqft of net demand for space in the Downtown core region for the next three years.
Given the large increase in supply, this will result in Downtown Core vacancy rates spiking to 17% and 18% in 2017 and 2018 respectively from 11.5% as at the end of September 2016.
Vacancy rates should start trending down from 2019 onwards as demand normalises back up to historical averages, and supply eases.
Source: URA, CBRE, DBS Bank
Figure 85: DBS Grade A office rental forecast (2016-2017) Remarks
Based on the projected increase in vacancies, we expect Grade A rents to bottom out at around S$8.50 in 2017 before recovering to c.S$10 by end-2018.
While overall vacancy rates are likely to remain elevated in 2018, we believe Grade A rents will recover to c.S$10 as the proportion of Premium Grade buildings (which typically charge higher rents) become an increasing proportion of the Grade A category.
In our bear-case scenario, rents could fall to S$7.50-8.00, from S$9.30 currently before recovering to S$9.00 in 2019.
Source: URA, CBRE, DBS Bank
-
2.0
4.0
6.0
8.0
10.0
12.0
14.0
16.0
18.0
20.0
-1,500
-1,000
-500
0
500
1,000
1,500
2,000
2,500
3,000
2000
2001
2002
2003
2004
2005
2006
2007
2008
2009
2010
2011
2012
2013
2014
2015
2016
2017
2018
2019
'000 sqft
Net Supply: Downtown Core (LHS)Net demand: Downtown Core (LHS)CBRE Grade A office rents (RHS)
S$ psf pm
-
5.0
10.0
15.0
20.0
-1,000
-500
0
500
1,000
1,500
2,000
2,500
3,000
2000
2001
2002
2003
2004
2005
2006
2007
2008
2009
2010
2011
2012
2013
2014
2015
2016
2017
2018
2019
'000 sqft
Net Supply: Downtown Core (LHS)Net demand: Downtown Core (LHS)CBRE Grade A office rents (RHS)DBS Base case (RHS)DBS Bear Case (RHS)
S$ psf pm
-1,500
Page 61

Industry Focus
Singapore Developers & REITs
ASIAN INSIGHTS VICKERS SECURITIES Page 62
Figure 86: Two-tier Grade A office market to develop Remarks
While we expect overall Downtown Core vacancy rate to rise to c.18% by 2018, we believe a two-tier market will develop.
The first submarket will be related to the older buildings in Shenton Way and Raffles Place where vacancy levels will be structurally higher given an uncompetitive product (lower efficiency and older specifications) resulting in lower rents.
The other category will be the premium grade buildings, largely consisting of new buildings currently under construction or built over the past 5-6 years. These will command higher rents and achieve lower vacancies. This can already be evidenced by the increasing spread between Premium Grade rents as reported by Colliers and overall Grade A core CBD rents as estimated by CBRE.
Going forward, Premium Grade offices will continue to command 11% higher rents relative to overall Grade A offices, and this spread may widen.
Source: URA, CBRE, DBS Bank
-4%
-2%
0%
2%
4%
6%
8%
10%
12%
7.00
8.00
9.00
10.00
11.00
12.00
13.00
Spread between Premium Grade vs Grade A (RHS)
Colliers Premium Grade Raffles Place/New Downtown (LHS)
CBRE Grade A Core CBD (LHS)
S$ psf / mth
Page 62

Industry Focus
Singapore Developers & REITs
ASIAN INSIGHTS VICKERS SECURITIES Page 63
8. Retail subsector Outlook: Hampered by weakening retail sales
Key Assertions
Retail sector outlook tempered by impact of e-commerce and dampened consumer sentiment.
More demand in the outskirts; Orchard roadexpect to remain weak.
Rental reversion remain flattish to marginallynegative.
8.1 Trends, demand and supply outlook
We see the next supply spike in 2018 adding more pressure in rental and occupancy. The years 2013 and 2014 saw Singapore’s largest influx of retail space since 2006. Recent supply has been largely located outside the central region (Figure 88), an indication that the government’s push towards a live, work and play concept in regional hubs is bearing fruit. The recently completed Waterway Point (95% tenanted) continues to see good demand, an indication that retailers remain keen to tap into suburban demand for goods and services. Much more limited supply is expected in 2016 and 2017, before another spike in completions in 2018, stemming from two key projects: Changi Jewel and Northpoint City (Figure 89-90).
Demand
Tempered by retail headwinds. Despite strong take-up rates in recently completed malls, net absorption has been negative since 2015 (Figure 92). Existing malls have, in general, been under occupancy and rental pressure. As of 3Q16, shop occupancy rates across the country had fallen to 91.3%, from a high of 95.5% in 2013. Occupancy for Frasers Centrepoint Trust fell by 1ppt on-year to 94.9% (adjusted to exclude Northpoint which is undergoing an asset enhancement initiative); though occupancy for CapitaLand Mall Trust was more stable, down marginally to 98.6% from 98.8% at the end of 2014, its rental reversions dropped to 1.3% for 9M16,
significantly below the 6% average over the past few years, and the lowest since 2009. Retailers have been hit by several factors: (a) declining sales efficiency (revenue per square foot) as a result of e-commerce and leakage from residents travelling abroad; (b) a manpower shortage due to government restrictions on foreign labour; and (c) rising labour costs from minimum wage policies. Faced with declining revenues and rising costs, retailers have, since 2014, begun to consolidate their operations, cutting down on the number of stores they operate while maintaining a presence in better-performing malls. The impact of retail headwinds will not be felt evenly across all malls, in our view. We believe that in order for a mall to outperform, it needs to be well located with a strong track record of recurring footfall and tenant sales, and have active asset management and advertising and promotion efforts.
Supply
Moving to the outskirts. The retail experience for locals will be an increasingly suburban affair. The majority of shopping mall completions in the past year have been located in the suburbs: One KM in Tanjong Katong, Big Box in Jurong East, Paya Lebar Square in Paya Lebar and Seletar Mall in Seletar, for example. Looking ahead, new retail space will still be largely focused in the suburbs. Waterway Point in Punggol opened in January 2016, and Northpoint City in Yishun (2018) and Changi Jewel (2018) are largest suburban developments in the pipeline. Just as we have seen in Jurong East, the government has been actively encouraging the continued development of regional centres in decentralised areas as key working and leisure destinations, as a means of relieving the congestion in the central business district and Orchard Road. As a result, we have seen many retailers that were previously only in the Orchard Road area moving into suburban shopping malls in order to directly cater to residents living in those areas. Examples include Zara, Coach, Kate Spade and Isetan.
Figure 87: Retail Market Summary Key Indicators % Chg 2Q16 3Q16Price Index -0.6% 123.1 122.3
Rental Index -1.5% 107.0 105.4
Pipeline of supply -11.2% 734k sqm GFA 652k sqm (GFA)
Vacancy rate +0.6% points 7.8% 8.4%
Source: URA
Page 63

Industry Focus
Singapore Developers & REITs
ASIAN INSIGHTS VICKERS SECURITIES Page 64
Figure 88: Net Additions to Shop Space Supply - suburban retail stock has been growing at a quicker pace than that in the central region
Remarks
Retail supply additions in recent years have been mainly in the Outside Central Region (a.k.a. OCR; dark grey column) and Fringe of City Centre (pink column).
In the OCR, major completions since 2013 include Westgate, JEM, Sports Hub, One KM, Seletar Mall, Paya Lebar Square, Capitol Piazza and Big Box.
Waterway Point, the latest mall to obtain its temporary occupation permit – in 4Q2015 –added around another30,000 square metres (sqm) of space to the retail sector.
Source: URA, CEIC, DBS Bank
Figure 89: Upcoming retail developments by planning region (478,230 sqm of gross floor area)
Remarks
New retail supply will be heavily skewed to the suburbs (OCR) with around 46% of total gross floor area (GFA).
This is in line with the government’s strategy of decentralising and creating regional “work, live, play” hubs.
Large proportion of OCR retail supply will be in the East Region (i.e. Changi Jewel).
New supply of Downtown Core is concentrated on Funan Redevelopment (2019), OUE Downtown (2016) and Marina One (2017).
Source: URA, CEIC, DBS Bank
(0.60)
(0.40)
(0.20)
-
0.20
0.40
0.60
0.80
1.00
1.20
1.40
2005 2006 2007 2008 2009 2010 2011 2012 2013 2014 2015 9M16
m' sqft
Downtown Orchard Rest of Central Fringe Outside Central Region
Orchard5.0%
Orchard5.0%
Fringe Area31.7%
Rest of Central Area2.1% East Region
25.6%
North Region14.9%
West Region9.1%
North East Region6.6%
Outside Central Region46.0%
Page 64
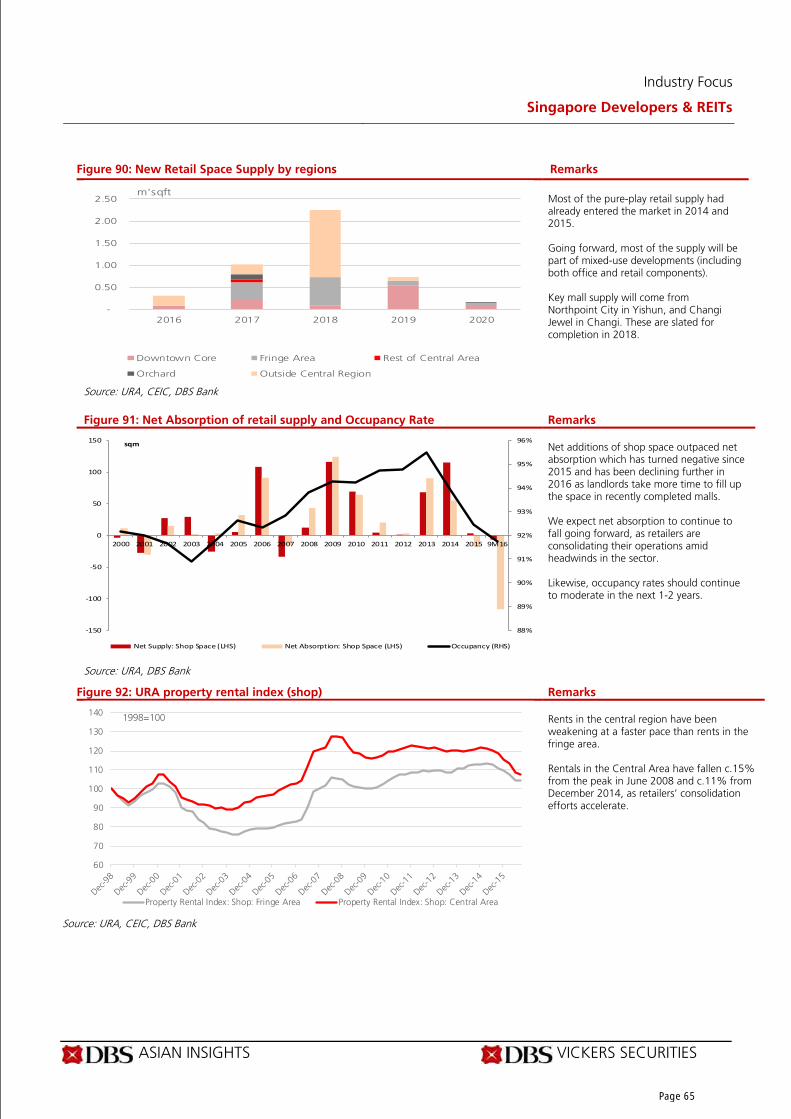
Industry Focus
Singapore Developers & REITs
ASIAN INSIGHTS VICKERS SECURITIES Page 65
Figure 90: New Retail Space Supply by regions Remarks
Most of the pure-play retail supply had already entered the market in 2014 and 2015.
Going forward, most of the supply will be part of mixed-use developments (including both office and retail components).
Key mall supply will come from Northpoint City in Yishun, and Changi Jewel in Changi. These are slated for completion in 2018.
Source: URA, CEIC, DBS Bank
Figure 91: Net Absorption of retail supply and Occupancy Rate Remarks
Net additions of shop space outpaced net absorption which has turned negative since 2015 and has been declining further in 2016 as landlords take more time to fill up the space in recently completed malls.
We expect net absorption to continue to fall going forward, as retailers are consolidating their operations amid headwinds in the sector.
Likewise, occupancy rates should continue to moderate in the next 1-2 years.
Source: URA, DBS Bank
Figure 92: URA property rental index (shop) Remarks
Rents in the central region have been weakening at a faster pace than rents in the fringe area.
Rentals in the Central Area have fallen c.15% from the peak in June 2008 and c.11% from December 2014, as retailers’ consolidation efforts accelerate.
Source: URA, CEIC, DBS Bank
-
0.50
1.00
1.50
2.00
2.50
2016 2017 2018 2019 2020
m'sqft
Downtown Core Fringe Area Rest of Central Area
Orchard Outside Central Region
88%
89%
90%
91%
92%
93%
94%
95%
96%
‐150
‐100
‐50
0
50
100
150
2000 2001 2002 2003 2004 2005 2006 2007 2008 2009 2010 2011 2012 2013 2014 2015 9M16
sqm
Net Supply: Shop Space (LHS) Net Absorption: Shop Space (LHS) Occupancy (RHS)
60
70
80
90
100
110
120
130
140 1998=100
Property Rental Index: Shop: Fringe Area Property Rental Index: Shop: Central Area
Page 65

Industry Focus
Singapore Developers & REITs
ASIAN INSIGHTS VICKERS SECURITIES Page 66
Figure 93: Upcoming retail developments by project name
Project Name Street Name Developer Region Total Retail Space (000'sqft)
2016 548.0
Hillion Mall Jelebu Road Sim Lian JV Outside Central Region 221.1
OUE Downtown 1 Shenton Way Alkas Realty Pte Ltd Downtown Core 237.2
Guoco Tower (retail) Wallich Street GuocoLand Downtown Core 77.0
Others 12.69
2017 1,316.8
DUO Galleria Bencoolen Street Kah Motor Co Sdn Bhd Rest of Central Area 79.8
Marina One Yishun Ring Road Northern Resi Pte Ltd/Northern Retail Pte Ltd
Outside Central Region 197.9
Northshore Plaza Punggol Way Housing & Development Board North East Region 91.2
Oasis Terraces Punggol Drive Housing & Development Board North East Region 96.6
Office/retail development Hoe Chiang Road Fragrance Grandeur Pte Ltd Central Region 120.2
Singapore Post Centre (AEI) Eunos Road 8 Singapore Post Limited Central Region 269.0
Tripleone Somerset (AEI) Somerset Road Perennial (Somerset) Pte Ltd Central Region 122.3
Others 339.7
2018 2,323.7
City Gate Beach Road Bayfront Ventures Pte Ltd Central Region 101.7
Frasers Tower Cecil Street FC Commercial Trustee Pte Ltd Central Region 30.9
Changi Jewel Airport Boulevard Changi Airport Group (S) Pte Ltd
East Region 968.4
IMall Marine Parade Central Marine Parade Central Pte Ltd Central Region 74.5
Mapletree 18 Tai Seng Street Mapletree Trustee Pte Ltd North East Region 63.4
Northpoint City Yishun Central 1 Fraser Centrepoint Limited North Region 420.2
Office/retail development Robinson Road Superluck Properties Pte Ltd Central Region 79.7
Oxley Tower Robinson Road Oxley Consortium Pte Ltd Central Region 49.8
Paya Lebar Quarter Paya Lebar Road/Sims Avenue
Roma Central Pte Ltd/Milano Central Pte Ltd/Verona Central Pte Ltd
Central Region 475.5
Woods Square Woodlands Square Woodlands Square Pte Ltd North Region 59.7
2019 and onwards 957.6
Office/retail development Hoe Chiang Road Mansfield Developments Pte Ltd
Central Region 100.2
Funan (redevelopment) North Bridge Road HSBC Institutional Trust Services (S) Limited
Central Region 536.7
Wisteria Mall Yishun Ring Road Northern Resi Pte Ltd/Northern Retail Pte Ltd
North Region 83.3
Others 237.5
* We have selectively shown retail properties that are over 45,000 sqft in size in this table. Source: URA, DBS Bank
Page 66

Industry Focus
Singapore Developers & REITs
ASIAN INSIGHTS VICKERS SECURITIES Page 67
9. Industrial Sector Summary: Year of consolidation post supply spike
Key Assertions
Supply absorption remain the key drag on rentalgrowth prospects.
Demand outlook weak given firms remain on aconsolidation trend; vacancy rates to hike up to11% by end-2018.
Business Park space offers the best visibility.
9.1 Trends, demand and supply outlook
Downside as pre-commitments for new supply remain low. We believe that the industrial sector outlook remains soft and is projected to remain on a decline with rental rates expected to edge down by 5-10% per annum over the coming two years, weighed down by a spike in supply completions over 2016-2107. Demand for space is expected to lag behind supply
growth in the coming years as firms continue to look to consolidate or downsize their space requirements in order to remain cost efficient. Vacancy rates are expected to remain on an uptrend to 11% by end-2018. Manufacturing Sector expanded in September 2016 but outlook remains weak. The Singapore PMI increased to 50.1 in September 2016 which is an expansion in factory activity for the first time in 15 months, led by higher new orders, new exports, and output. It was a first month of expansion in over a year for the country with the electronics sector rising to 50.3 (50.2 in August 2016). However, the outlook is likely to remain uncertain with anaemic growth in Singapore’s major industrial sectors. Industrial leasing volumes inched up in 3Q16, closing 4% higher y-o-y and flat q-o-q to 2,172 leasing deals (inclusive of factory, warehouse and business park space).
Figure 94: Industrial Market Summary Key Indicators % Chg 2Q16 3Q16Price Index Industrial Property -1.70% 100.0 98.3Multi-User -0.98% 101.8 100.8Rental Index Industrial Property -1.98% 96.2 94.3Single-User Factory -1.28% 93.4 92.2Multi-User Factory -2.12% 104.0 101.8Warehouse -4.40% 95.4 91.2Business Park -0.19% 104.4 104.2Vacancy rate Industrial Property -0.1% 10.6% 10.5%Single-User Factory 0.8% 8.6% 9.4%Multi-User Factory -0.2% 13.1% 12.9%Warehouse 0.0% 10.9% 10.9%Business Park -0.1% 19.0% 18.9%Pipeline under construction Industrial Property -8.90% 57.2 52.1Single-User Factory -14.10% 23.5 20.2Multi-User Factory -4.29% 18.0 17.3Warehouse -6.66% 15.2 14.2Business Park 2.33% 0.5 0.5
Source: JTC
Page 67
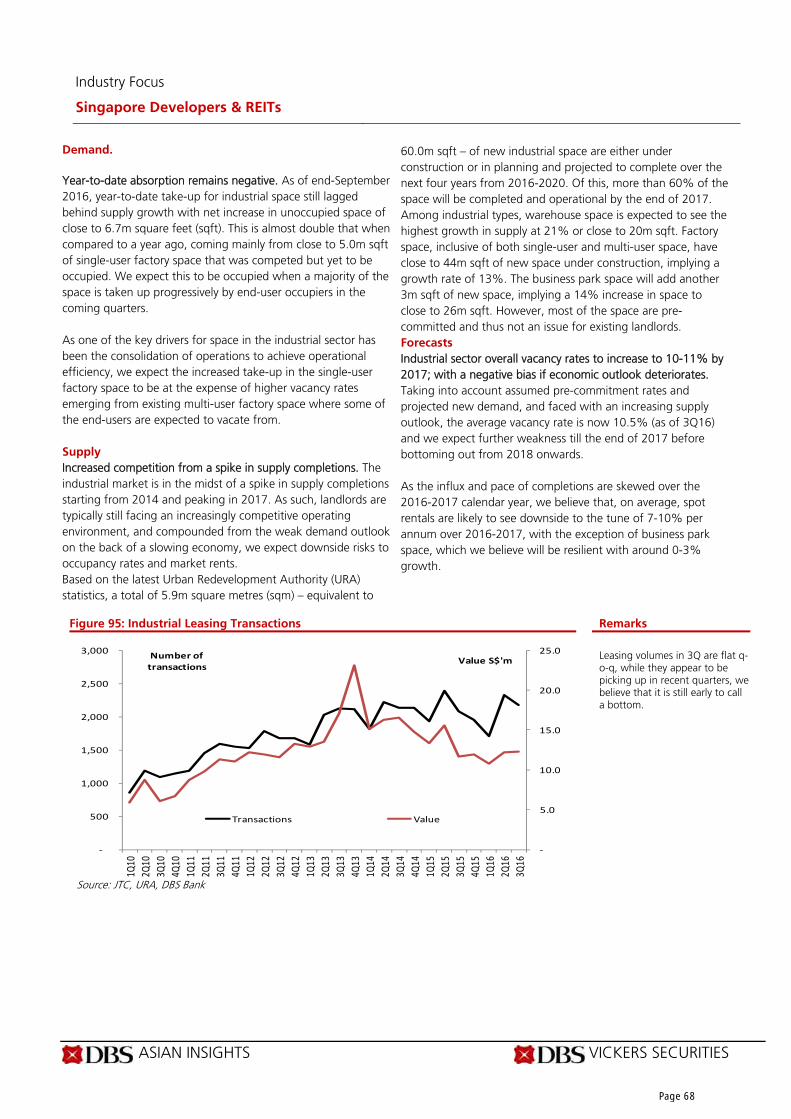
Industry Focus
Singapore Developers & REITs
ASIAN INSIGHTS VICKERS SECURITIES Page 68
Demand.
Year-to-date absorption remains negative. As of end-September 2016, year-to-date take-up for industrial space still lagged behind supply growth with net increase in unoccupied space of close to 6.7m square feet (sqft). This is almost double that when compared to a year ago, coming mainly from close to 5.0m sqft of single-user factory space that was competed but yet to be occupied. We expect this to be occupied when a majority of the space is taken up progressively by end-user occupiers in the coming quarters.
As one of the key drivers for space in the industrial sector has been the consolidation of operations to achieve operational efficiency, we expect the increased take-up in the single-user factory space to be at the expense of higher vacancy rates emerging from existing multi-user factory space where some of the end-users are expected to vacate from.
Supply
Increased competition from a spike in supply completions. The industrial market is in the midst of a spike in supply completions starting from 2014 and peaking in 2017. As such, landlords are typically still facing an increasingly competitive operating environment, and compounded from the weak demand outlook on the back of a slowing economy, we expect downside risks to occupancy rates and market rents. Based on the latest Urban Redevelopment Authority (URA) statistics, a total of 5.9m square metres (sqm) – equivalent to
60.0m sqft – of new industrial space are either under construction or in planning and projected to complete over the next four years from 2016-2020. Of this, more than 60% of the space will be completed and operational by the end of 2017. Among industrial types, warehouse space is expected to see the highest growth in supply at 21% or close to 20m sqft. Factory space, inclusive of both single-user and multi-user space, have close to 44m sqft of new space under construction, implying a growth rate of 13%. The business park space will add another 3m sqft of new space, implying a 14% increase in space to close to 26m sqft. However, most of the space are pre-committed and thus not an issue for existing landlords. Forecasts
Industrial sector overall vacancy rates to increase to 10-11% by 2017; with a negative bias if economic outlook deteriorates. Taking into account assumed pre-commitment rates and projected new demand, and faced with an increasing supply outlook, the average vacancy rate is now 10.5% (as of 3Q16) and we expect further weakness till the end of 2017 before bottoming out from 2018 onwards.
As the influx and pace of completions are skewed over the 2016-2017 calendar year, we believe that, on average, spot rentals are likely to see downside to the tune of 7-10% per annum over 2016-2017, with the exception of business park space, which we believe will be resilient with around 0-3% growth.
Figure 95: Industrial Leasing Transactions Remarks
Leasing volumes in 3Q are flat q-o-q, while they appear to be picking up in recent quarters, we believe that it is still early to call a bottom.
Source: JTC, URA, DBS Bank
‐
5.0
10.0
15.0
20.0
25.0
‐
500
1,000
1,500
2,000
2,500
3,000
1Q10
2Q10
3Q10
4Q10
1Q11
2Q11
3Q11
4Q11
1Q12
2Q12
3Q12
4Q12
1Q13
2Q13
3Q13
4Q13
1Q14
2Q14
3Q14
4Q14
1Q15
2Q15
3Q15
4Q15
1Q16
2Q16
3Q16
Value S$'mNumber of transactions
Transactions Value
Page 68

Industry Focus
Singapore Developers & REITs
ASIAN INSIGHTS VICKERS SECURITIES Page 69
Figure 96: Close to 50m sqft of new space to complete over 2016-2019 Remarks
Supply completions to spike from 2014 and peak in 2016-2017 with an average of 25m sqft of space, thereafter it will drop significantly to 5.3m sqft from 2017 onwards.
Supply completions to be more than double that of the past five years.
Source: JTC, URA, DBS Bank
Figure 97: We project net absorption to remain negative over 2016F-2020F with vacancy rates inching up to 11%
Source: JTC, URA, DBS Bank
0%
2%
4%
6%
8%
10%
12%
(10)
(8)
(6)
(4)
(2)
‐
2
4
6
2007 2008 2009 2010 2011 2012 2013 2014 2015 2016F 2017F 2018F 2019F 2020F
m'sqft
Net Suplus/(Net deficit) Vacancy Rate (RHS)
0%
2%
4%
6%
8%
10%
12%
-
5.0
10.0
15.0
20.0
25.0
30.0
35.0
2,007 2,008 2,009 2,010 2,011 2,012 2,013 2,014 2,015 2016F 2017F 2018F 2019F 2020F
m' sqft
Demand Supply Vacancy Rate (RHS)
Page 69Page 69
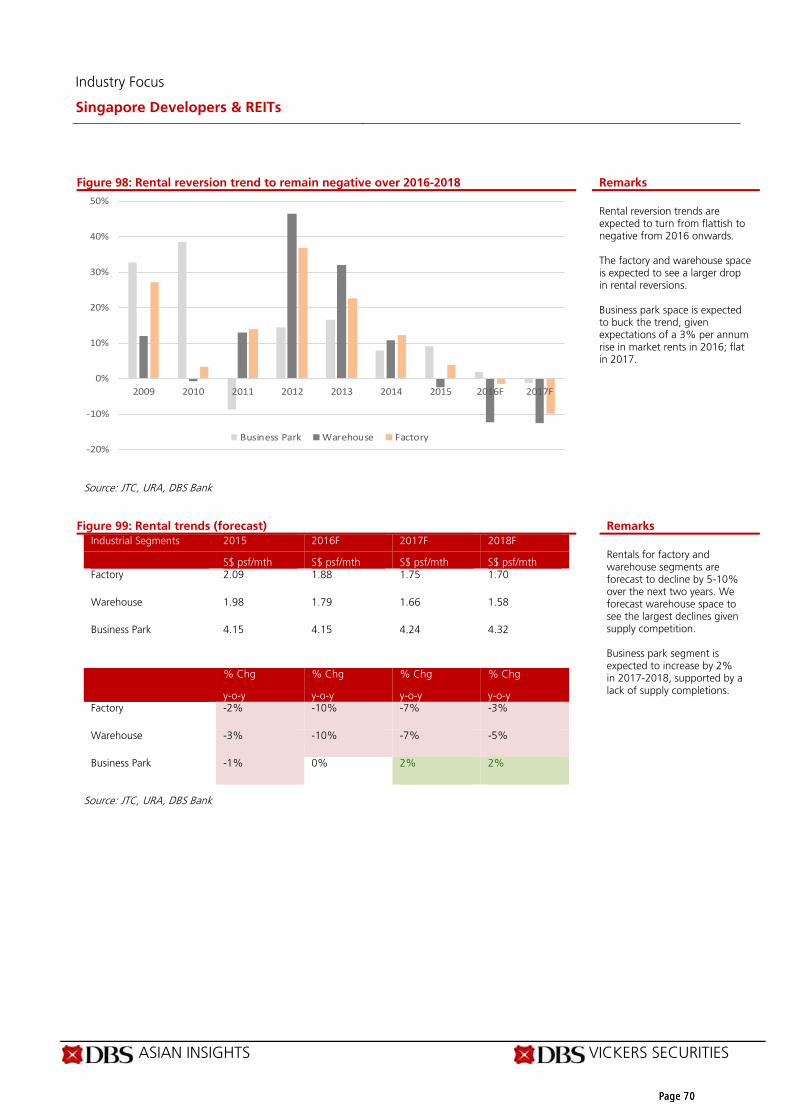
Industry Focus
Singapore Developers & REITs
ASIAN INSIGHTS VICKERS SECURITIES Page 70
Figure 98: Rental reversion trend to remain negative over 2016-2018 Remarks
Rental reversion trends are expected to turn from flattish to negative from 2016 onwards.
The factory and warehouse space is expected to see a larger drop in rental reversions.
Business park space is expected to buck the trend, given expectations of a 3% per annum rise in market rents in 2016; flat in 2017.
Source: JTC, URA, DBS Bank
Figure 99: Rental trends (forecast) RemarksIndustrial Segments 2015 2016F 2017F 2018F
S$ psf/mth S$ psf/mth S$ psf/mth S$ psf/mth Factory 2.09 1.88 1.75 1.70
Warehouse 1.98 1.79 1.66 1.58
Business Park 4.15 4.15 4.24 4.32
% Chg % Chg % Chg % Chg
y-o-y y-o-y y-o-y y-o-y Factory -2% -10% -7% -3%
Warehouse -3% -10% -7% -5%
Business Park -1% 0% 2% 2%
Rentals for factory and warehouse segments are forecast to decline by 5-10% over the next two years. We forecast warehouse space to see the largest declines given supply competition.
Business park segment is expected to increase by 2% in 2017-2018, supported by a lack of supply completions.
Source: JTC, URA, DBS Bank
‐20%
‐10%
0%
10%
20%
30%
40%
50%
2009 2010 2011 2012 2013 2014 2015 2016F 2017F
Business Park Warehouse Factory
Page 70Page 70

Industry Focus
Singapore Developers & REITs
ASIAN INSIGHTS VICKERS SECURITIES Page 71
Industrial Sub-sector – Multi-User Factory
Figure 100: Multi-user factory supply: Supply spike in 2016 to be an overhang Remarks
Source: JTC, URA, DBS Bank
Supply completions to spike in 2016-2018; resulting in vacancy rates increasing to more than 14%.
However, we see risk emerging from “shadow space” arising from the single-user factory segment if end-users decide to sub-lease part of their space (bottom chart).
Rentals are expected to remain under pressure as competition heats up. We project a 7-10% drop over 2016-2017 followed by a more modest 3% fall in 2018.
Figure 101 Multi-user factory: Occupancy and rental rates to dip
Source: JTC, URA, DBS Bank
0%
2%
4%
6%
8%
10%
12%
14%
16%
-
1.0
2.0
3.0
4.0
5.0
6.0
7.0 Mil lion Sqft
Demand Supply Vacancy Rate (%)
84%
85%
86%
87%
88%
89%
90%
91%
92%
(1.0)
-
1.0
2.0
3.0
4.0
5.0
6.0
7.0 Million Sqft
Annual Demand (sqm) LHS Annual Supply (Sqm) LHS Occupancy Rate (%) RHS
Page 71

Industry Focus
Singapore Developers & REITs
ASIAN INSIGHTS VICKERS SECURITIES Page 72
Industrial Sub-sector – Warehouse
Figure 102: Warehouse: Oversupply situation to persist till 2018 Remarks
Supply under construction remains one of the highest among industrial subsectors, at close to 21%.
While new supply appears to be pre-committed, we believe that shadow space will emerge from tenant consolidation from multiple locations to single warehouses for efficiency purposes.
Source: JTC, URA, DBS Bank
Figure 103: Warehouse: Occupancy to dip below 90% Remarks
Warehouse rents expected to decline 7-10% over 2016-2017.
Occupancy rates projected to dip below 90% going forward.
Source: JTC, URA, DBS Bank
85%
86%
87%
88%
89%
90%
91%
92%
93%
94%
95%
(2.0)
-
2.0
4.0
6.0
8.0
10.0
12.0 (%)Million sqft
Annual Demand (m'sqft) LHS Annual Supply (m'sqft) LHSOccupancy Rate (%) RHS
0%
2%
4%
6%
8%
10%
12%
-
2.0
4.0
6.0
8.0
10.0
12.0 Million Sqft
Demand Supply Vacancy (%) RHS
Page 72
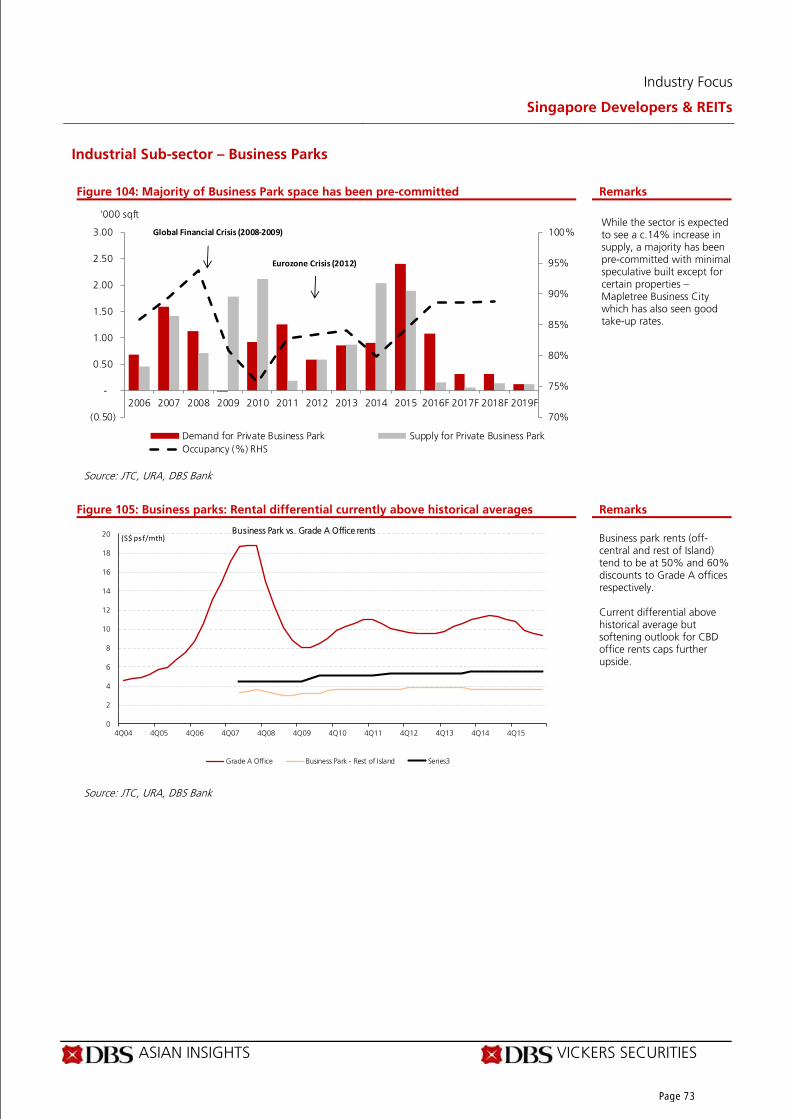
Industry Focus
Singapore Developers & REITs
ASIAN INSIGHTS VICKERS SECURITIES Page 73
Industrial Sub-sector – Business Parks
Figure 104: Majority of Business Park space has been pre-committed Remarks
While the sector is expected to see a c.14% increase in supply, a majority has been pre-committed with minimal speculative built except for certain properties – Mapletree Business City which has also seen good take-up rates.
Source: JTC, URA, DBS Bank
Figure 105: Business parks: Rental differential currently above historical averages Remarks
Business park rents (off-central and rest of Island) tend to be at 50% and 60% discounts to Grade A offices respectively.
Current differential above historical average but softening outlook for CBD office rents caps further upside.
Source: JTC, URA, DBS Bank
70%
75%
80%
85%
90%
95%
100%
(0.50)
-
0.50
1.00
1.50
2.00
2.50
3.00
2006 2007 2008 2009 2010 2011 2012 2013 2014 2015 2016F 2017F 2018F 2019F
'000 sqft
Demand for Private Business Park Supply for Private Business ParkOccupancy (%) RHS
Global Financial Crisis (2008‐2009)
Eurozone Crisis (2012)
0
2
4
6
8
10
12
14
16
18
20
4Q04 4Q05 4Q06 4Q07 4Q08 4Q09 4Q10 4Q11 4Q12 4Q13 4Q14 4Q15
Business Park vs. Grade A Office rents
Grade A Office Business Park - Rest of Island Series3
(S$ psf/mth)
Page 73

Industry Focus
Singapore Developers & REITs
ASIAN INSIGHTS VICKERS SECURITIES Page 74
10. Hospitality Outlook Summary
Key Assertions
Supply remains the key drag on RevPAR growth
prospects.
Corporate demand to remain soft; demand for
accommodation to lag supply growth.
Hotel sector to bottom only from 2H17-2018
onwards.
10.1 Trends, demand and supply outlook Decline in 3Q16 RevPAR. Following a soft second-quarter where RevPAR was weak and declined 3% y-o-y to S$191, RevPAR in the third-quarter (3Q16) continued to fall, based on the Singapore Tourism Board (STB) statistics. The 4% fall in RevPAR was a result of a decrease in both occupancy (87.2% vs 88.3% in 3Q15) and average daily rate (ADR; S$244 versus S$249 in 3Q15) as excess supply continued to weigh on the market despite an increase in tourists arrivals. However, tourist arrivals for 3Q16 was positive, up 4%, driven largely by Chinese tourists (+20%).
2017 will be another challenging year. While we expect tourist arrivals into Singapore to increase in 2016 by 9% to 16.6 million, largely led by a 35% jump Chinese visitors (+41% in Jan-Sep), we forecast total visitor days to rise by only 4% due to the shorter average length of stay. In addition, while the increase in new supply this year is now lower than earlier expected due to delays in completion of some hotels (2,520 net rooms to be added this year versus 3,930 previously), we remain cautious on the outlook for revenue per available room (RevPAR) given soft demand from the corporate sector which typically offers higher yields, and excess supply. Thus, we project that RevPAR in 2016 will drop by 4% year-on-year (y-o-y) to S$201. For 2017, we expect tourist arrivals to grow at a more modest rate of 4%, but average length of stay to lengthen, resulting in 5% uplift in total visitor days. However, with corporate demand expected to remain soft and persistent supply pressures arising from a 6% increase in room stock, 2017 RevPAR is projected to fall 4%.
Figure 106: Hospitality sector remained under pressure in 3Q16
3Q15 2Q16 3Q16 q-o-q y-o-y
Industry Occupancy 88.3% 83.2% 87.2% 4.0% -1.2%
Industry average daily rate (S$) 249 229 244 6.6% -1.9%
Industry RevPAR (S$) 220 191 212 11.2% -3.6%
Tourist* arrivals 4,096,271 4,022,046 4,248,079 5.6% 3.7%
Luxury RevPAR (S$)* 409 348 421 21.2% 3.1%
Upscale RevPAR (S$)* 242 215 233 8.4% -3.8%
Mid-Tier RevPAR (S$)* 157 144 151 5.2% -3.8%
Economy RevPAR (S$)* 90 81 84 3.7% -6.9%
Source: Singapore Tourism Board, STR Global, DBS Bank
Page 74

Industry Focus
Singapore Developers & REITs
ASIAN INSIGHTS VICKERS SECURITIES Page 75
Demand
Overall increase in seat capacity to Singapore points to growth in tourist arrivals offset by decline in average length of stay. Based on data from Centre for Asia Pacific Aviation (CAPA), seat capacity between Singapore and the rest of the world is projected to increase 3% on-year in the fourth quarter of this year following an increase of 3% during January-September. Overall seat capacity is expected to increase by a further 5% y-o-y in the first quarter of 2017. We believe this is supportive of a sustained recovery in Singapore arrivals and underpins our forecast for a 9% and 3% increase in tourist arrivals in 2016 and 2017 respectively. However, given the lower “quality” of tourists coming in such as tour groups, which typically only stay 1-2 days in Singapore, we forecast total visitor days to rise by only 3% in 2016 due to a shorter average length of stay of 3.42 days, down from 3.61 days in 2015. For 2017, we expect a slight increase in the average length of stay to 3.46 days as the proportion of Chinese visitors fall, resulting in total visitor days rising by 5% y-o-y. Recovery in Chinese tourists. Following an extremely weak 2014
where Chinese tourist arrivals (Singapore’s second largest source
market) dropped 24% on‐year to 1.7 million due to Chinese tour
groups avoiding Southeast Asia as a consequence of the MH370
incident and the political uncertainty in Thailand, Chinese visitor
arrivals recovered in 2015, rising 22% on‐year to 2.1 million. We
expect the recovery to continue in 2016. With visitor arrivals from
China growing 41% y‐o‐y during January to September, the
recovery is on track to hit our 35% growth projection for this year.
Beyond 2016, we expect Singapore to remain an attractive
destination for Chinese visitors, and we expect arrivals from China
will increase by 10% and 7.5% in 2017 and 2018 respectively.
Recovery in Indonesian visitors. We project Indonesian tourist
arrivals (Singapore’s largest source market) to grow by 6% this year
due to a healthy performance during January to September
(arrivals up by 6%), and low base effect as overall tourist arrivals in
2015 was down 10% y‐o‐y. This is despite a 2% decline in seat
capacity between Indonesia and Singapore in 2016 based on data
from CAPA. For 2017 and 2018, we expect growth to normalise to
3% per annum.
Competition from other markets. Singapore faces increased competition from other tourism markets through a variety of factors which include easier access to other countries through the relaxation of visa restrictions, e.g. multiple entry visas for Chinese visitors into Japan; devaluation of the other regional currencies, potentially making its cheaper to visit other countries compared to Singapore, e.g. a weaker Korean won and Japanese yen; and Singapore already having a high market
share, e.g. Singapore accounts for 38-39% of total Indonesian outbound travel. Potential headwinds from near-term currency volatility. The recent depreciation of regional currencies, especially the IDR and MYR, could pose near-term headwinds to tourist arrivals into Singapore. Nevertheless, the number of Indonesian and Malaysian visitors (third largest source market) to Singapore is expected to remain on an upward trajectory as the SGD was weak against the IDR and MYR over the past six months. Supply
Pressure from new room supply. While new room supply in 2016 is projected to be lower than the 4,237 rooms added in 2015, supply pressures should still persist with a net addition of 2,520 rooms. This is despite a reduction from the 3,930 rooms projected earlier this year, on account of delays in the completion of hotels. As a consequence of hotels such as Intercontinental Robertson Quay and Sofitel at Tanjong Pagar Centre which were originally scheduled to open in 2016 being shifted to 2017, supply for 2017 now stands at 3,857 rooms, up from 2,727 rooms previously. Thus, the demand and supply situation in Singapore is likely to become more balanced only in 2018, when supply pressures ease and new room inventory is projected to increase by only 2%. 2016 supply mainly outside traditional areas with 2017 supply growth to come from Central Business District (CBD) and Orchard. The majority of new supply in 2016 is concentrated outside the traditional areas of Bras Basah, CBD, Orchard and Singapore River, such as Changi, Joo Chiat and East Coast. These hotels account for 1,413 rooms or 45% of supply in 2016. Meanwhile, the second largest cluster of hotels opening in 2016 are located in the Singapore River precinct (20% of 2016 supply). These include M Social, and The Warehouse Hotel. Combined with the completion of refurbishment works at Swissotel Merchant Court, an estimated 507 rooms (9% of existing supply in the precinct) will hit the market. Beyond the new supply in the Singapore River area, the rebranding of Riverview Hotel as Four Points by Sheraton would also raise the level of competition in this sub-market. In 2017, the majority of supply will switch back to Orchard (1,612 rooms, equivalent to 14% of existing Orchard inventory, from Novotel on Stevens and Ascott Orchard) and the CBD area (c.748 rooms from hotels such as JW Marriot, Sofitel Singapore Tanjong Pagar, The Murray Hotel and Grand Park City Hall). More evenly balanced across tiers in 2016 with growth in luxury in 2017. In 2015, the growth in supply was driven by the Mid-Tier segment, which represented 64% of total net new supply in 2015 and 20% of existing Mid-Tier stock. For 2016, the new
Page 75

Industry Focus
Singapore Developers & REITs
ASIAN INSIGHTS VICKERS SECURITIES Page 76
supply of 2,520 rooms is more evenly spread across all the different categories, 25% in Economy, 40% in Mid-Tier and 25% in Upscale, with no hotels opened in the Luxury segment. Nevertheless, similar to 2015, we expect Mid-Tier and Economy categories to face the greatest pressure on ADR and occupancies. For 2017, the proportion of new room supply to Economy, Mid-Tier and Upscale hotels is expected to drop to 21%, 34% and 25% respectively, with Luxury hotels making a return with 21% of 2017 supply. With a larger proportion of new rooms being added in the Upscale and Luxury segment in 2017, there may be more pricing discipline compared to 2016 given constraints by these upper-tier brands to cut room rates without affecting their brand status. Forecasts Supply pressures to weigh on RevPAR in 2016. The Singapore hospitality market is facing the same issues in 2016 as in 2015, i.e. excess supply. While we expect a 9% bounce in tourist arrivals, we believe this will only translate to a 4% increase in visitor days due to a higher proportion of Chinese tour groups which typically have a shorter average length of stay. In addition, while there has been a delay in the opening of some
hotels this year, supply growth is still projected to increase by 4%. Combined with continued weak corporate demand, which is typically higher yielding, we project a 4% decline in RevPAR to S$201. This will be led by a decline in ADR (down 4% to S$236) with occupancy relatively stable at c.85%. 2017 still weak with recovery only in 2018. With the carryover of new hotels which were originally scheduled to open in 2016 into 2017, our earlier expectation of a more balanced market in 2017 is likely to be delayed into 2018 where the supply of new hotels drops off. The decline in new room supply in 2018 is due to the lack of new land released by the Singapore government for hotel developments over the past two years. On the back of a 6% jump in supply in 2017 and still weak corporate demand, we expect ADR to remain under pressure, down 4% with occupancy stable at 85%. This translates to a 4% decline in RevPAR. Going into 2018, we expect a 3% recovery in RevPAR, as demand (+4% growth in visitor arrivals) exceeds the 2% growth in new room supply.
Figure 107: Number of visitors rising year-to-date but growth in visitor days still modest and RevPAR remains soft on supply pressure
Remarks
Tourist arrivals jumped 4% in 3Q16, led by China (+20%), Indonesia (+ 3%) and India (+6%) But visitor days were only up by 1% due to decline in average length of stay RevPAR remains weak, down 4% in 3Q16 on excess supply and weak corporate demand
Source: Singapore Tourism Board, STR Global, DBS Bank
Page 76

Industry Focus
Singapore Developers & REITs
ASIAN INSIGHTS VICKERS SECURITIES Page 77
Figure 108: Uptick in overall airline capacity points to sustained recovery in tourist arrivals
Remarks
Historically, there is a positive correlation between seat capacity growth and inbound tourist arrivals Inbound tourist arrivals have recovered following a reduction in seat capacity in 2014 second half and 2015 first half
Airline seat capacity into Singapore is projected to grow by 3% and 5% y-o-y in fourth quarter 2016 and first quarter 2017 which underpins growth of tourist arrivals into Singapore. We project 9% and 4% growth in visitor arrivals for 2016 and 2017
Source: Centre for Asia Pacific Aviation, Singapore Tourism Board, Bloomberg Finance L.P., DBS Bank
Figure 109: Chinese visitor arrivals on a recovery path Remarks
Downturn in Chinese arrivals started from October 2013 due to new tourism laws which banned “shopping tours”. Chinese visitors avoided Singapore/Southeast Asia in 2014 due to the MH370 incident and political instability in Thailand. Recovery in Chinese visitors over 2015-2016. Expect growth in visitors from China to continue but at a slower rate than in first half 2016.
Source: Singapore Tourism Board, DBS Bank
-60%
-40%
-20%
0%
20%
40%
60%
80%
100%
Jan-
13M
ar-1
3M
ay-1
3Ju
l-13
Sep-
13N
ov-1
3Ja
n-14
Mar
-14
May
-14
Jul-1
4Se
p-14
Nov
-14
Jan-
15M
ar-1
5M
ay-1
5Ju
l-15
Sep-
15N
ov-1
5Ja
n-16
Mar
-16
May
-16
Jul-1
6Se
p-16
Mar14 - MH370 incident
Oct13 - NewChinese tourism laws
Recovery fromweak 2014
May14 - Thai military coup
y-o-y growth
Page 77

Industry Focus
Singapore Developers & REITs
ASIAN INSIGHTS VICKERS SECURITIES Page 78
Figure 110: Stable 2H16 seat capacity between Indonesia and Singapore with pick-up in1Q17
Remarks
Growth in Indonesian arrivals from 4Q12 to 2Q14 on the back of increases in seat capacity between Indonesia and Singapore, despite a weaker rupiah against Singapore dollar. The trend reversed from 3Q14 to 4Q15 on the back of declines in seat capacity especially in the low cost carrier segment
Healthy start to 2016, with 6% y-o-y growth in tourist arrivals from Indonesia in Jan to Sep despite a decline in overall airline seat capacity
Stable seat capacity between Indonesia and Singapore in 4Q16; 7% y-o-y pick up in 1Q17 points to continued growth in Indonesian tourist arrivals. We project 5.5% and 3% increases for 2016 and 2017 respectively
Source: Centre for Asia Pacific Aviation, Singapore Tourism Board, Bloomberg Finance L.P., DBS Bank
Page 78
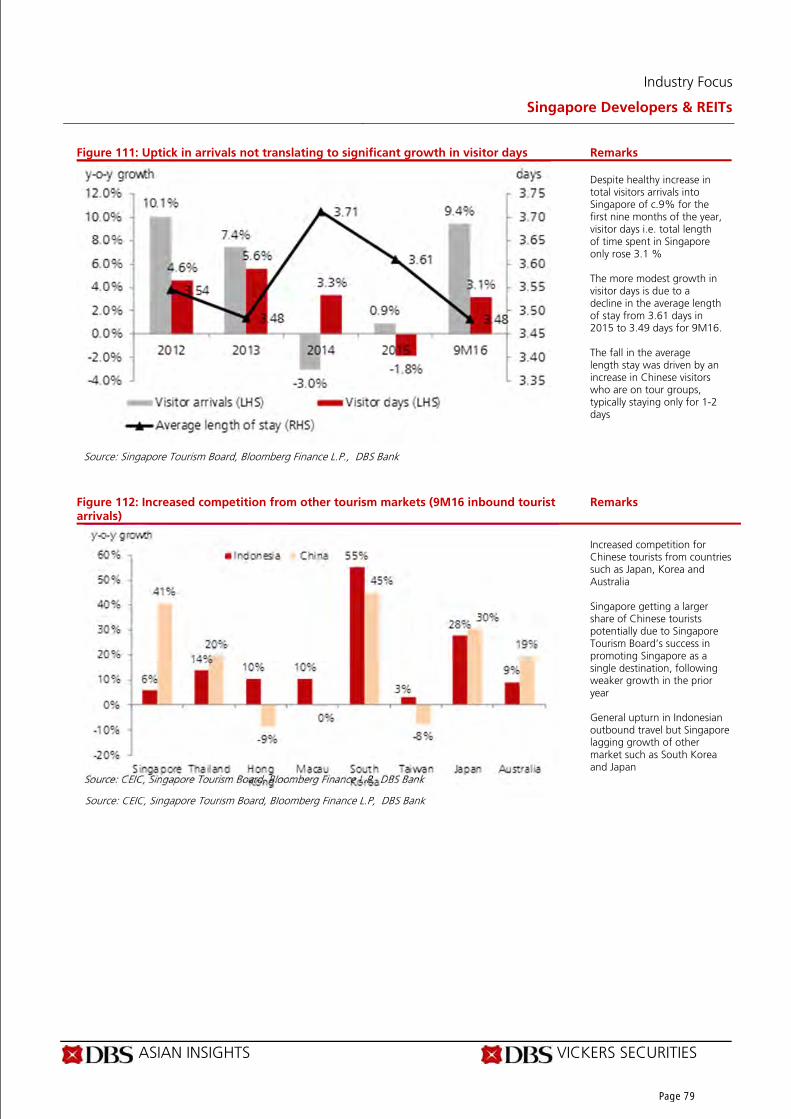
Industry Focus
Singapore Developers & REITs
ASIAN INSIGHTS VICKERS SECURITIES Page 79
Figure 111: Uptick in arrivals not translating to significant growth in visitor days Remarks
Despite healthy increase in total visitors arrivals into Singapore of c.9% for the first nine months of the year, visitor days i.e. total length of time spent in Singapore only rose 3.1 %
The more modest growth in visitor days is due to a decline in the average length of stay from 3.61 days in 2015 to 3.49 days for 9M16.
The fall in the average length stay was driven by an increase in Chinese visitors who are on tour groups, typically staying only for 1-2 days
Source: Singapore Tourism Board, Bloomberg Finance L.P., DBS Bank
Figure 112: Increased competition from other tourism markets (9M16 inbound tourist arrivals)
Remarks
Increased competition for Chinese tourists from countries such as Japan, Korea and Australia
Singapore getting a larger share of Chinese tourists potentially due to Singapore Tourism Board’s success in promoting Singapore as a single destination, following weaker growth in the prior year
General upturn in Indonesian outbound travel but Singapore lagging growth of other market such as South Korea and Japan
Source: CEIC, Singapore Tourism Board, Bloomberg Finance L.P, DBS Bank
Page 79

Industry Focus
Singapore Developers & REITs
ASIAN INSIGHTS VICKERS SECURITIES Page 80
Figure 113: Recent FX volatility in regional currencies a potential headwind Remarks
Recent correction in regional currencies for Singapore’s top five source markets a potential headwind. However, weakening of SGD over the last six months provides some buffer.
* Inbound travel statistics for Singapore and Thailand related to 8M16 Source: CEIC, Singapore Tourism Board, Bloomberg Finance L.P., DBS Bank
Figure 114: Opening of some hotels delayed from 2016 to 2017 Remarks
Despite delays in the completion of new hotels resulting in 2,520 net new rooms being added in 2016 (down from 3,930 previously), supply pressures are expected to persist due to a 4% growth in supply. Delay in the demand and supply situation in Singapore being more balanced as hotels previously expected to open in 2016 are now shifted to 2017 resulting in a 6% growth in room inventory in 2017.
Potential recovery in 2018 only when supply pressures ease.
Source: CDL Hospitality Trust, Singapore Tourism Board, DBS Bank
-15%
-10%
-5%
0%
5%
10%
15%
AUD CNY INR MYR IDR Top 5 weighted average
Winners versus SGD - IDR, AUD, Avg
Losers versus SGD - INR, CNY
IDR
CNY
INR
MYR
AUD
Avg
61,287 2,520 3,857
1,355
45,000
50,000
55,000
60,000
65,000
70,000
75,000
2015 2016F 2017F 2018F
Rooms
Hotel rooms Expected net additions
4.1%
6.0%2.0%
Page 80

Industry Focus
Singapore Developers & REITs
ASIAN INSIGHTS VICKERS SECURITIES Page 81
Figure 115: More supply in Singapore River and CBD areas in 2016 switching to Orchard in 2017
Remarks
New supply switching from Orchard and Bras Basah in 2015 to Singapore River and CBD areas in 2016. For 2017, the majority of supply will come from Orchard and CBD areas. Growth in new supply also coming from outside core city centre areas.
Source: CDL Hospitality Trust, Singapore Tourism Board, DBS Bank
Figure 116: Majority of supply growth in 2016 coming from the Mid-Tier category Remarks
Majority of new supply in 2016 coming from the Mid-Tier category. For 2017, there is greater share of new rooms being opened in the luxury and upscale category which may result in more pricing discipline in the industry.
Source: CEIC, Singapore Tourism Board, DBS Bank
Figure 117: RevPAR to remain weak in 2016 and 2017 with recovery from 2018 Remarks
9% growth in visitor arrivals is expected for 2016 but this will be partially offset by the shorter average length of stay which translates to 3% growth in visitor days. However, a 5% increase in room supply remains a key issue for hoteliers, with RevPAR expected to decline by 4% this year. 2017 to remain a challenging year due to a 6% growth in supply with a recovery only occurring in 2018 when supply pressures ease.
Source: CDL Hospitality Trust, Singapore Tourism Board, DBS Bank
-1,000-500
0500
1,0001,5002,0002,5003,0003,5004,0004,500
2014 2015 2016 2017 2018
Bras Basah/Bugis CBD Orchard Singapore River Others Total
Number of rooms
0
500
1,000
1,500
2,000
2,500
3,000
3,500
4,000
4,500
Economy Mid-Tier Upscale Luxury Total
2015 2016 2017 2018
number of rooms
7%
-3%
1%
9%
4%4%
6%
3%
-2%
3.4%
5%4%
7%
4%
7%
4%
6%
2%
-1% -1%
-5%-4% -4%
3%
-6.0%
-4.0%
-2.0%
0.0%
2.0%
4.0%
6.0%
8.0%
10.0%
2013 2014 2015 2016F 2017F 2018F
Visitor Arrivals Visitor Days Room supply RevPAR
y-o-y growth
Page 81

Industry Focus
Singapore Developers & REITs
ASIAN INSIGHTS VICKERS SECURITIES Page 82
Figure 118: Supply of new rooms
Year of opening Hotel Net room addition 2016 The South Beach -654 2016 Hotel Grand Central 46 2016 Ibis Styles 298 2016 Oasia Downtown Hotel 314 2016 Grand Park City Hall -165 2016 Hotel Clover @ 7 HK St 27 2016 Hotel Indigo Singapore Katong 131 2016 Mercure Singapore Middle Road 395 2016 M Social 293 2016 Holiday Inn Express Singapore Katong 451 2016 Crowne Plaza Changi Airport (extension) 243 2016 Premier Inn Singapore 300 2016 JW Marriott Hotel Singapore South Beach (formerly The South Beach) 634 2016 Swissôtel Merchant Court 150 2016 Villa Samadhi 20 2016 The Warehouse Hotel 37 2017 Andaz Singapore (DUO Project) 342 2017 Novotel Singapore on Stevens 254 2017 InterContinental Singapore Robertson Quay (Gallery Hotel after refurbishment) 225 2017 Sofitel Singapore City Centre Hotel (Tanjong Pagar Centre) 222 2017 The Ascott Orchard Singapore 220 2017 The Patina Capitol Singapore 157 2017 Duxton Terrace (formerly Murray House) 138 2017 Duxton House (formerly Blakes) 50 2017 Laguna Dusit Thani 197 2017 Ibis Singapore on Stevens 528 2017 Grand Park City Hall 181 2017 Park Hotel Farrer Park 300 2017 Courtyard Marriott at Novena 250 2017 YOTEL Orchard Road 610 2017 Aqueen Hotel Geylang 100 2017 Aqueen Hotel Little India 83 2018 Frasers @ China Street 306 2018 Yotel Changi Jewel 130 2018 Aqueen Hotel Lavender (Additional rooms) 69 2018 Outpost Hotel Sentosa & Village Hotel Sentosa 850
Source: CDL Hospitality Trust, Singapore Tourism Board, DBS Bank
Page 82

Industry Focus
Singapore Developers & REITs
ASIAN INSIGHTS VICKERS SECURITIES Page 83
11. Charts
Page 83
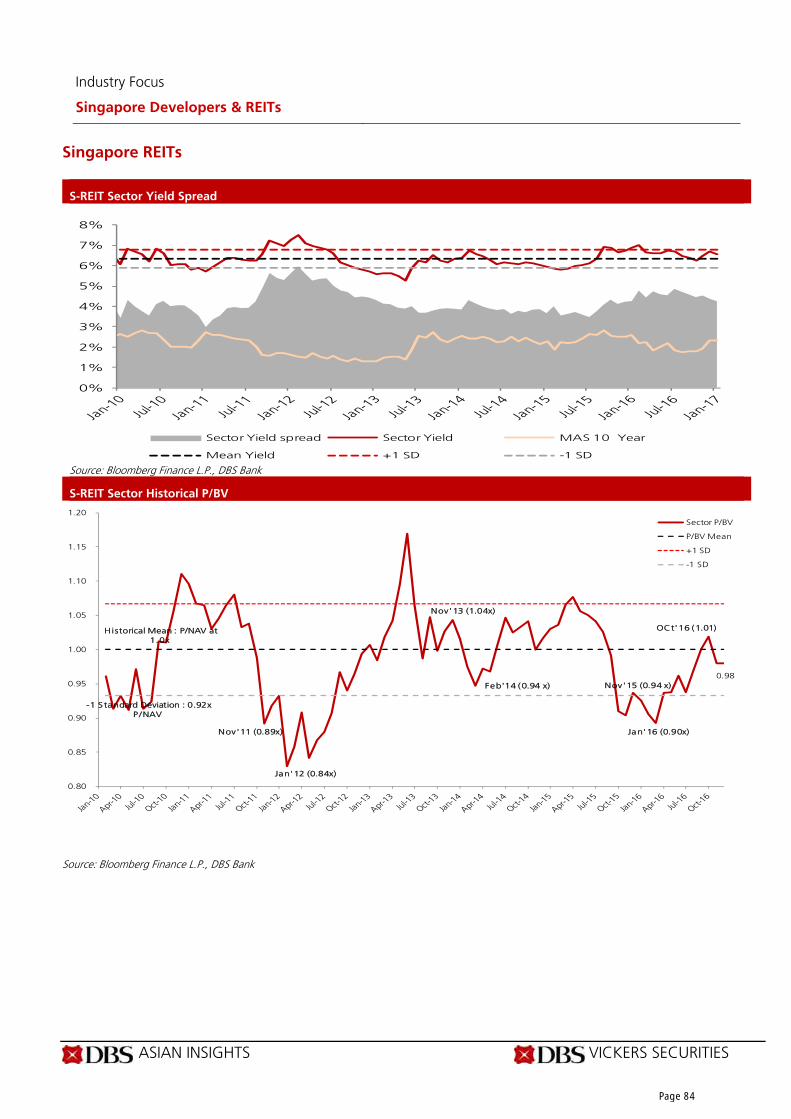
Industry Focus
Singapore Developers & REITs
ASIAN INSIGHTS VICKERS SECURITIES Page 84
Singapore REITs
S-REIT Sector Yield Spread Source: Bloomberg Finance L.P., DBS Bank
S-REIT Sector Historical P/BV
Source: Bloomberg Finance L.P., DBS Bank
0%
1%
2%
3%
4%
5%
6%
7%
8%
Sector Yield spread Sector Yield MAS 10 Year
Mean Yield +1 SD -1 SD
Nov'11 (0.89x)
Jan'12 (0.84x)
Nov'13 (1.04x)
Feb'14 (0.94 x) Nov'15 (0.94 x)
Jan'16 (0.90x)
OCt'16 (1.01)
0.98
Historical Mean : P/NAV at 1.0x
-1 S tandard Deviation : 0.92x P /NAV
0.80
0.85
0.90
0.95
1.00
1.05
1.10
1.15
1.20 Sector P/BV
P/BV Mean
+1 SD
-1 SD
Page 84

Industry Focus
Singapore Developers & REITs
ASIAN INSIGHTS VICKERS SECURITIES Page 85
Office REIT Sector Yield Spread Office REIT Sector Historical P/BV
Source: Bloomberg Finance L.P., DBS Bank
Source: Bloomberg Finance L.P., DBS Bank
CapitaLand Commercial Trust Historical Yield Spread CapitaLand Commercial Trust Historical P/BV
Source: Bloomberg Finance L.P., DBS Bank
Source: Bloomberg Finance L.P., DBS Bank
Frasers Commercial Trust Historical Yield Spread Frasers Commercial Trust Historical P/BV
Source: Bloomberg Finance L.P., DBS Bank
Source: Bloomberg Finance L.P., DBS Bank
0.5
0.6
0.7
0.8
0.9
1.0
1.1
1.2
Jan-2010 Jan-2011 Jan-2012 Jan-2013 Jan-2014 Jan-2015 Jan-2016 JanFCOT P/BV Mean +1 SD -1 SD
0.5
0.6
0.7
0.8
0.9
1.0
1.1
1.2
Jan-2010 Jan-2011 Jan-2012 Jan-2013 Jan-2014 Jan-2015 Jan-2016 Jan-2017
Office REITs P/BV Mean +1 SD -1 SD
0.0%
1.0%
2.0%
3.0%
4.0%
5.0%
6.0%
7.0%
8.0%
9.0%
Jan-2010 Jan-2011 Jan-2012 Jan-2013 Jan-2014 Jan-2015 Jan-2016CCT Yield Spread CCT Yield Mean Yield-1 SD +1 SD
0.0%
1.0%
2.0%
3.0%
4.0%
5.0%
6.0%
7.0%
8.0%
9.0%
Jan-2010 Jan-2011 Jan-2012 Jan-2013 Jan-2014 Jan-2015 Jan-2016 Jan-2
FCOT Yield Spread FCOT Yield Mean -1 SD +1 SD
0.0%
1.0%
2.0%
3.0%
4.0%
5.0%
6.0%
7.0%
8.0%
9.0%
Jan-2010 Jan-2011 Jan-2012 Jan-2013 Jan-2014 Jan-2015 Jan-2016 Jan-2017
Office REITs Yield Spread Office REITs Yield Mean Yield
-1 SD +1 SD
0.5
0.6
0.7
0.8
0.9
1.0
1.1
1.2
Jan-2010 Jan-2011 Jan-2012 Jan-2013 Jan-2014 Jan-2015 Jan-2016 Jan-20
CCT P/BV Mean +1 SD -1 SD
Page 85

Industry Focus
Singapore Developers & REITs
ASIAN INSIGHTS VICKERS SECURITIES Page 86
IREIT Global Yield Spread IREIT Global Historical P/BV Source: Bloomberg Finance L.P., DBS Bank
Source: Bloomberg Finance L.P., DBS Bank
Keppel REIT Historical Yield Spread Keppel REIT Historical P/BV Source: Bloomberg Finance L.P., DBS Bank
Source: Bloomberg Finance L.P., DBS Bank
Manulife US REIT Historical Yield Spread Manulife US REIT Historical P/BV
Source: Bloomberg Finance L.P., DBS Bank
Source: Bloomberg Finance L.P., DBS Bank
0.0%
1.0%
2.0%
3.0%
4.0%
5.0%
6.0%
7.0%
8.0%
9.0%
10.0%
Sep-2014 Mar-2015 Sep-2015 Mar-2016 Sep-2016IREIT Yield Spread IREIT Yield Mean -1 SD +1 SD 0.9
1.0
1.1
1.2
1.3
1.4
Sep-2014 Mar-2015 Sep-2015 Mar-2016 Sep-2016IREIT P/BV Mean +1 SD -1 SD
0.0%
1.0%
2.0%
3.0%
4.0%
5.0%
6.0%
7.0%
8.0%
9.0%
Jan-2010 Jan-2011 Jan-2012 Jan-2013 Jan-2014 Jan-2015 Jan-2016KREIT Yield Spread KREIT Yield Mean Yield -1 SD +1 SD
0.5
0.6
0.7
0.8
0.9
1.0
1.1
1.2
Jan-2010 Jan-2011 Jan-2012 Jan-2013 Jan-2014 Jan-2015 Jan-2016
KREIT P/BV Mean +1 SD -1 SD
0.0%
1.0%
2.0%
3.0%
4.0%
5.0%
6.0%
7.0%
8.0%
Jun-2016 Sep-2016 Dec-2016MUST Yield Spread MUST Yield Mean -1 SD +1 SD
0.90
0.93
0.95
0.98
1.00
1.03
1.05
Jun-2016 Sep-2016 Dec-2016MUST P/BV Mean +1 SD -1 SD
Page 86

Industry Focus
Singapore Developers & REITs
ASIAN INSIGHTS VICKERS SECURITIES Page 87
OUE Commercial Trust Historical Yield Spread OUE Commercial Trust Historical P/BV
Source: Bloomberg Finance L.P., DBS Bank
Source: Bloomberg Finance L.P., DBS Bank
0.0%
1.0%
2.0%
3.0%
4.0%
5.0%
6.0%
7.0%
8.0%
9.0%
Feb-2014 Aug-2014 Feb-2015 Aug-2015 Feb-2016 Aug-2016OUECT Yield Spread OUECT Yield Mean -1 SD +1
0.5
0.6
0.7
0.8
0.9
1.0
1.1
1.2
Feb-2014 Aug-2014 Feb-2015 Aug-2015 Feb-2016 Aug-2016OUECT P/BV Mean +1 SD -1 SD
Page 87

Industry Focus
Singapore Developers & REITs
ASIAN INSIGHTS VICKERS SECURITIES Page 88
Retail REIT Sector Yield Spread Retail REIT Sector Historical P/BV
Source: Bloomberg Finance L.P., DBS Bank
Source: Bloomberg Finance L.P., DBS Bank
CapitaLand Mall Trust Historical Yield Spread CapitaLand Mall Trust Historical P/BV
Source: Bloomberg Finance L.P., DBS Bank
Source: Bloomberg Finance L.P., DBS Bank
CapitaLand Retail China Trust Historical Yield Spread CapitaLand Retail China Trust Historical P/BV Source: Bloomberg Finance L.P., DBS Bank
Source: Bloomberg Finance L.P., DBS Bank
0.0%
1.0%
2.0%
3.0%
4.0%
5.0%
6.0%
7.0%
8.0%
Jan-2010 Jan-2011 Jan-2012 Jan-2013 Jan-2014 Jan-2015 Jan-2016 Jan-20CMT Yield Spread CMT Yield Mean Yield
-1 SD +1 SD 0.6
0.7
0.8
0.9
1.0
1.1
1.2
1.3
1.4
1.5
Jan-2010 Jan-2011 Jan-2012 Jan-2013 Jan-2014 Jan-2015 Jan-2016CMT P/BV Mean +1 SD -1 SD
0.0%
1.0%
2.0%
3.0%
4.0%
5.0%
6.0%
7.0%
8.0%
Jan-2010 Jan-2011 Jan-2012 Jan-2013 Jan-2014 Jan-2015 Jan-2016 Jan-2017CRCT Yield Spread CRCT Yield Mean Yield
-1 SD +1 SD
0.0%
1.0%
2.0%
3.0%
4.0%
5.0%
6.0%
7.0%
8.0%
Jan-2010 Jan-2011 Jan-2012 Jan-2013 Jan-2014 Jan-2015 Jan-2016 Jan-2017
Retail REITs Yield Spread Retail REITs Yield Mean Yield
-1 SD +1 SD
0.60
0.70
0.80
0.90
1.00
1.10
1.20
1.30
1.40
1.50
Jan-10 Jan-11 Jan-12 Jan-13 Jan-14 Jan-15 Jan-16 Jan-17
Retail REITs P/BV Mean +1 SD -1 SD
0.8
0.9
1.0
1.1
1.2
1.3
1.4
Jan-2010 Jan-2011 Jan-2012 Jan-2013 Jan-2014 Jan-2015 Jan-2016 Jan-2017
CRCT P/BV Mean +1 SD -1 SD
Page 88

Industry Focus
Singapore Developers & REITs
ASIAN INSIGHTS VICKERS SECURITIES Page 89
Croesus Retail Trust Historical Yield Spread Croesus Retail Trust Historical P/BV
Source: Bloomberg Finance L.P., DBS Bank
Source: Bloomberg Finance L.P., DBS Bank
Frasers Centrepoint Trust Historical Yield Spread Frasers Centrepoint Trust Historical P/BV
Source: Bloomberg Finance L.P., DBS Bank
Source: Bloomberg Finance L.P., DBS Bank
Mapletree Greater China Commercial Trust Historical Yield Spread
Mapletree Greater China Commercial Trust Historical
P/BV
Source: Bloomberg Finance L.P., DBS Bank
Source: Bloomberg Finance L.P., DBS Bank
0.0%
1.0%
2.0%
3.0%
4.0%
5.0%
6.0%
7.0%
8.0%
9.0%
10.0%
11.0%
Jun-2013 Jun-2014 Jun-2015 Jun-2016
Croesus Yield Spread Croesus Yield Mean Yield
-1 SD +1 SD
0.8
0.9
1.0
1.1
1.2
Jun-2013 Dec-2013 Jun-2014 Dec-2014 Jun-2015 Dec-2015 Jun-2016 Dec-2016
Croesus P/BV Mean +1 SD -1 SD
0.0%
1.0%
2.0%
3.0%
4.0%
5.0%
6.0%
7.0%
8.0%
Jan-2010 Jan-2011 Jan-2012 Jan-2013 Jan-2014 Jan-2015 Jan-2016 Jan-20FCT Yield Spread FCT Yield Mean Yield-1 SD +1 SD
0.6
0.7
0.8
0.9
1.0
1.1
1.2
1.3
1.4
1.5
Jan-2010 Jan-2011 Jan-2012 Jan-2013 Jan-2014 Jan-2015 Jan-2016 Jan-201FCT P/BV Mean +1 SD -1 SD
0.7
0.8
0.9
1.0
1.1
1.2
1.3
Mar-2013 Mar-2014 Mar-2015 Mar-2016
MAGIC P/BV Mean +1 SD -1 SD
0.0%
1.0%
2.0%
3.0%
4.0%
5.0%
6.0%
7.0%
8.0%
9.0%
2013 2014 2015 2016
MAGIC Yield Spread MAGIC Yield Mean
-1 SD +1 SD
Page 89

Industry Focus
Singapore Developers & REITs
ASIAN INSIGHTS VICKERS SECURITIES Page 90
[SPH REIT Historical Yield Spread SPH REIT Historical P/BV
Source: Bloomberg Finance L.P., DBS Bank
Source: Bloomberg Finance L.P., DBS Bank
Starhill Global REIT Historical Yield Spread Starhill Global REIT Historical P/BV
Source: Bloomberg Finance L.P., DBS Bank
Source: Bloomberg Finance L.P., DBS Bank
0.5
0.6
0.7
0.8
0.9
1.0
1.1
1.2
1.3
1.4
1.5
Jul-2013 Jul-2014 Jul-2015 Jul-2016
SPH REIT P/BV Mean +1 SD -1 SD
0.5
0.6
0.7
0.8
0.9
1.0
1.1
1.2
1.3
1.4
1.5
Jan-2010 Jan-2011 Jan-2012 Jan-2013 Jan-2014 Jan-2015 Jan-2016
SGREIT P/BV Mean +1 SD -1 SD
0.0%
1.0%
2.0%
3.0%
4.0%
5.0%
6.0%
7.0%
8.0%
Jul-2013 Jul-2014 Jul-2015 Jul-2016SPH REIT Yield Spread SPH REIT Yield Mean Yield-1 SD +1 SD
0.0%
1.0%
2.0%
3.0%
4.0%
5.0%
6.0%
7.0%
8.0%
Jan-2010 Jan-2011 Jan-2012 Jan-2013 Jan-2014 Jan-2015 Jan-2016 JanSGREIT Yield Spread SGREIT Yield Mean Yield-1 SD +1 SD
Page 90

Industry Focus
Singapore Developers & REITs
ASIAN INSIGHTS VICKERS SECURITIES Page 91
Mixed Commercial REIT Sector Yield Spread Mixed Commercial REIT Sector Historical P/BV
Source: Bloomberg Finance L.P., DBS Bank
Source: Bloomberg Finance L.P., DBS Bank
Mapletree Commercial Trust Historical Yield Spread Mapletree Commercial Trust Historical P/BV
Source: Bloomberg Finance L.P., DBS Bank
Source: Bloomberg Finance L.P., DBS Bank
Suntec REIT Historical Yield Spread Suntec REIT Historical P/BV
Source: Bloomberg Finance L.P., DBS Bank
Source: Bloomberg Finance L.P., DBS Bank
0.0%
1.0%
2.0%
3.0%
4.0%
5.0%
6.0%
7.0%
8.0%
9.0%
Jan-2010 Jan-2011 Jan-2012 Jan-2013 Jan-2014 Jan-2015 Jan-2016 Jan-2017
Mixed Use REITs Yield Spread Mixed Use REITs Yield
Mean Yield -1 SD
+1 SD
0.5
0.7
0.9
1.1
1.3
1.5
1.7
Jan-2010 Jan-2011 Jan-2012 Jan-2013 Jan-2014 Jan-2015 Jan-2016 Jan-2017
Mixed Use REITs P/BV Mean +1 SD -1 SD
0.0%
1.0%
2.0%
3.0%
4.0%
5.0%
6.0%
7.0%
8.0%
9.0%
Apr-2011 Apr-2012 Apr-2013 Apr-2014 Apr-2015 Apr-2016MCT Yield Spread MCT Yield Mean Yield
-1 SD +1 SD
0.5
0.7
0.9
1.1
1.3
1.5
1.7
Apr-2011 Apr-2012 Apr-2013 Apr-2014 Apr-2015 Apr-2016
MCT P/BV Mean +1 SD -1 SD
0.5
0.6
0.7
0.8
0.9
1.0
1.1
1.2
1.3
1.4
1.5
Jan-2010 Jan-2011 Jan-2012 Jan-2013 Jan-2014 Jan-2015 Jan-2016
Suntec P/BV Mean +1 SD -1 SD
0.0%
1.0%
2.0%
3.0%
4.0%
5.0%
6.0%
7.0%
8.0%
9.0%
Jan-2010 Jan-2011 Jan-2012 Jan-2013 Jan-2014 Jan-2015 Jan-2016 Jan-20Suntec Yield Spread Suntec Yield Mean
-1 SD +1 SD
Page 91

Industry Focus
Singapore Developers & REITs
ASIAN INSIGHTS VICKERS SECURITIES Page 92
Hospitality REIT Sector Yield Spread Hospitality REIT Sector Historical P/BV
Source: Bloomberg Finance L.P., DBS Bank
Source: Bloomberg Finance L.P., DBS Bank
Ascendas Hospitality Trust Historical Yield Spread Ascendas Hospitality Trust Historical P/BV
Source: Bloomberg Finance L.P., DBS Bank
Source: Bloomberg Finance L.P., DBS Bank
Ascott Residence Trust Historical Yield Spread Ascott Residence Trust Historical P/BV Source: Bloomberg Finance L.P., DBS Bank
Source: Bloomberg Finance L.P., DBS Bank
0.0%
1.0%
2.0%
3.0%
4.0%
5.0%
6.0%
7.0%
8.0%
9.0%
10.0%
Jul-2012 Jul-2013 Jul-2014 Jul-2015 Jul-2016
ASCHT Yield Spread ASHT Yield Mean -1 SD +1 SD
0.0%
1.0%
2.0%
3.0%
4.0%
5.0%
6.0%
7.0%
8.0%
9.0%
10.0%
Jan-2010 Jan-2011 Jan-2012 Jan-2013 Jan-2014 Jan-2015 Jan-2016 Jan-2017
Hospitality REITs Yield Spread Hospitality REITs Yield
Mean Yield -1 SD
+1 SD
0.6
0.7
0.8
0.9
1.0
1.1
1.2
1.3
1.4
1.5
1.6
Jan-2010 Jan-2011 Jan-2012 Jan-2013 Jan-2014 Jan-2015 Jan-2016 Jan-2017
Hospitality REITs P/BV Mean +1 SD -1 SD
0.6
0.8
1.0
1.2
1.4
1.6
Jul-2012 Jul-2013 Jul-2014 Jul-2015 Jul-2016
ASCHT P/BV Mean +1 SD -1 SD
0.0%
1.0%
2.0%
3.0%
4.0%
5.0%
6.0%
7.0%
8.0%
9.0%
10.0%
Jan-2010 Jan-2011 Jan-2012 Jan-2013 Jan-2014 Jan-2015 Jan-2016 Jan-2
Ascott Yield Spread Ascott Yield Mean Yield
-1 SD +1 SD
0.6
0.8
1.0
1.2
1.4
1.6
Jan-2010 Jan-2011 Jan-2012 Jan-2013 Jan-2014 Jan-2015 Jan-2016 Jan-2
Ascott P/BV Mean +1 SD -1 SD
Page 92

Industry Focus
Singapore Developers & REITs
ASIAN INSIGHTS VICKERS SECURITIES Page 93
CDL Hospitality Trust Historical Yield Spread CDL Hospitality Trust Historical P/BV
Source: Bloomberg Finance L.P., DBS Bank Source: Bloomberg Finance L.P., DBS Bank
Far East Hospitality Trust Historical Yield Spread Far East Hospitality Trust Historical P/BV
Source: Bloomberg Finance L.P., DBS Bank
Source: Bloomberg Finance L.P., DBS Bank
Frasers Hospitality Trust Historical Yield Spread Frasers Hospitality Trust Historical P/BV
Source: Bloomberg Finance L.P., DBS Bank
Source: Bloomberg Finance L.P., DBS Bank
-2.0%
0.0%
2.0%
4.0%
6.0%
8.0%
10.0%
Jan-2010 Jan-2011 Jan-2012 Jan-2013 Jan-2014 Jan-2015 Jan-2016
CDREIT Yield Spread CDREIT Yield Mean Yield-1 SD +1 SD
0.6
0.8
1.0
1.2
1.4
1.6
Jan-2010 Jan-2011 Jan-2012 Jan-2013 Jan-2014 Jan-2015 Jan-2016 Jan-2017
CDREIT P/BV Mean +1 SD -1 SD
0.0%
1.0%
2.0%
3.0%
4.0%
5.0%
6.0%
7.0%
8.0%
9.0%
10.0%
Aug-2012 Aug-2013 Aug-2014 Aug-2015 Aug-2016FEHT Yield Spread FEHT Yield Mean -1 SD +1 S
0.60
0.80
1.00
1.20
1.40
1.60
Aug-2012 Aug-2013 Aug-2014 Aug-2015 Aug-2016FEHT P/BV Mean +1 SD -1 SD
0.0%
1.0%
2.0%
3.0%
4.0%
5.0%
6.0%
7.0%
8.0%
9.0%
10.0%
Aug-2014 Feb-2015 Aug-2015 Feb-2016 Aug-2016FHT Yield Spread FHT Yield Mean -1 SD +1 SD
0.6
0.8
1.0
1.2
1.4
1.6
Aug-2014 Feb-2015 Aug-2015 Feb-2016 Aug-2016FHT P/BV Mean +1 SD -1 SD
Page 93

Industry Focus
Singapore Developers & REITs
ASIAN INSIGHTS VICKERS SECURITIES Page 94
OUE Hospitality Trust Historical Yield Spread OUE Hospitality Trust Historical P/BV
Source: Bloomberg Finance L.P., DBS Bank Source: Bloomberg Finance L.P., DBS Bank
0.0%
1.0%
2.0%
3.0%
4.0%
5.0%
6.0%
7.0%
8.0%
9.0%
10.0%
Jul-2013 Jul-2014 Jul-2015 Jul-2016OUEHT Yield Spread OUEHT Yield Mean Yield
-1 SD +1 SD
0.6
0.7
0.8
0.9
1.0
1.1
1.2
1.3
1.4
1.5
1.6
Jul-2013 Jan-2014 Jul-2014 Jan-2015 Jul-2015 Jan-2016 Jul-2016 Jan-20OUEHT P/BV Mean +1 SD -1 SD
Page 94

Industry Focus
Singapore Developers & REITs
ASIAN INSIGHTS VICKERS SECURITIES Page 95
Industrial REIT Sector Yield Spread Industrial REIT Sector Historical P/BV
Source: Bloomberg Finance L.P., DBS Bank
Source: Bloomberg Finance L.P., DBS Bank
Ascendas REIT Historical Yield Spread Ascendas REIT Historical P/BV
Source: Bloomberg Finance L.P., DBS Bank
Source: Bloomberg Finance L.P., DBS Bank
Cambridge Industrial Trust Historical Yield Spread Cambridge Industrial Historical P/BV
S Source: Bloomberg Finance L.P., DBS Bank
Source: Bloomberg Finance L.P., DBS Bank
0.0%1.0%2.0%3.0%4.0%5.0%6.0%7.0%8.0%9.0%
10.0%11.0%
Jan-2010 Jan-2011 Jan-2012 Jan-2013 Jan-2014 Jan-2015 Jan-2016 Jan-
AREIT Yield Spread AREIT Yield Mean Yield -1 SD +1 S
0.7
0.9
1.1
1.3
1.5
1.7
Jan-2010 Jan-2011 Jan-2012 Jan-2013 Jan-2014 Jan-2015 Jan-2016 Jan
AREIT P/BV Mean +1 SD -1 SD
0.0
0.2
0.4
0.6
0.8
1.0
1.2
1.4
1.6
1.8
2006 2007 2008 2009 2010 2011 2012 2013 2014 2015 2016
CREIT P/BV Mean +1 SD -1 SD
0.7
0.8
0.9
1.0
1.1
1.2
1.3
1.4
1.5
1.6
1.7
1.8
Jan-2010 Jan-2011 Jan-2012 Jan-2013 Jan-2014 Jan-2015 Jan-2016 Jan-2017
Industrial REITs P/BV Mean +1 SD -1 SD
0.0%
1.0%
2.0%
3.0%
4.0%
5.0%
6.0%
7.0%
8.0%
9.0%
10.0%
11.0%
Jan-2010 Jan-2011 Jan-2012 Jan-2013 Jan-2014 Jan-2015 Jan-2016 Jan-20
Industrial REITs Yield Spread Industrial REITs Yield
Mean +1 SD
-1 SD
0.0%
1.0%
2.0%
3.0%
4.0%
5.0%
6.0%
7.0%
8.0%
9.0%
10.0%
11.0%
Jan-2010 Jan-2011 Jan-2012 Jan-2013 Jan-2014 Jan-2015 Jan-2016 Jan-2
CREIT Yield Spread CREIT Yield Mean Yield-1 SD +1 SD
Page 95

Industry Focus
Singapore Developers & REITs
ASIAN INSIGHTS VICKERS SECURITIES Page 96
Cache Logistics Trust Historical Yield Spread Cache Logistics Trust Historical P/BV
Source: Bloomberg Finance L.P., DBS Bank
Source: Bloomberg Finance L.P., DBS Bank
Frasers Logistics & Industrial Trust Yield Spread Frasers Logistics & Industrial Trust Historical P/BV
Source: Bloomberg Finance L.P., DBS Bank
Source: Bloomberg Finance L.P., DBS Bank
Keppel DC REIT Historical Yield Spread Keppel DC REIT Historical P/BV
Source: Bloomberg Finance L.P., DBS Bank
Source: Bloomberg Finance L.P., DBS Bank
0.0%
1.0%
2.0%
3.0%
4.0%
5.0%
6.0%
7.0%
8.0%
9.0%
10.0%
11.0%
Apr-2010 Apr-2011 Apr-2012 Apr-2013 Apr-2014 Apr-2015 Apr-2016
Cache Yield Spread Cache Yield Mean Yield-1 SD +1 SD
0.7
0.9
1.1
1.3
1.5
1.7
Apr-2010 Apr-2011 Apr-2012 Apr-2013 Apr-2014 Apr-2015 Apr-2016Cache P/BV Mean +1 SD -1 SD
0.0%
1.0%
2.0%
3.0%
4.0%
5.0%
6.0%
7.0%
8.0%
Jul-2016 Aug-2016 Sep-2016 Oct-2016 Nov-2016 Dec-201
FLT Yield Spread FLT Yield Mean Yield -1 SD +1 SD
1.02
1.04
1.06
1.08
1.10
1.12
1.14
Jul-2016FLT P/BV Mean +1 SD -1 SD
0.0%
1.0%
2.0%
3.0%
4.0%
5.0%
6.0%
7.0%
8.0%
9.0%
10.0%
Jan-2015 Jul-2015 Jan-2016 Jul-2016KDCREIT Yield Spread KDCREIT Yield Mean -1 SD +1 S
0.7
0.8
0.9
1.0
1.1
1.2
1.3
1.4
1.5
1.6
1.7
1.8
Jan-2015 Jul-2015 Jan-2016 Jul-2016KDCREIT P/BV Mean +1 SD -1 SD
Page 96

Industry Focus
Singapore Developers & REITs
ASIAN INSIGHTS VICKERS SECURITIES Page 97
Mapletree Industrial Trust Historical Yield Spread Mapletree Industrial Trust Historical P/BV
Source: Bloomberg Finance L.P., DBS Bank
Source: Bloomberg Finance L.P., DBS Bank
Mapletree Logistic Trust Historical Yield Spread Mapletree Logistic Trust Historical P/BV
Source: Bloomberg Finance L.P., DBS Bank
Source: Bloomberg Finance L.P., DBS Bank
Soilbuild Business Space REIT Historical Yield Spread Soilbuild Business Space REIT Historical P/BV
Source: Bloomberg Finance L.P., DBS Bank
Source: Bloomberg Finance L.P., DBS Bank
0.0%
1.0%
2.0%
3.0%
4.0%
5.0%
6.0%
7.0%
8.0%
9.0%
10.0%
Apr-2011 Apr-2012 Apr-2013 Apr-2014 Apr-2015 Apr-2016
MINT Yield Spread MINT Yield Mean Yield-1 SD +1 SD
0.5
0.6
0.7
0.8
0.9
1.0
1.1
1.2
1.3
1.4
1.5
Oct-2010 Oct-2011 Oct-2012 Oct-2013 Oct-2014 Oct-2015 Oct-201MINT P/BV Mean +1 SD -1 SD
0.0%
1.0%
2.0%
3.0%
4.0%
5.0%
6.0%
7.0%
8.0%
9.0%
10.0%
Jan-2010 Jan-2011 Jan-2012 Jan-2013 Jan-2014 Jan-2015 Jan-2016
MLT Yield Spread MLT Yield Mean Yield -1 SD +1
0.5
0.6
0.7
0.8
0.9
1.0
1.1
1.2
1.3
1.4
1.5
Jan-2010 Jan-2011 Jan-2012 Jan-2013 Jan-2014 Jan-2015 Jan-2016
MLT P/BV Mean +1 SD -1 SD
0.0%
1.0%
2.0%
3.0%
4.0%
5.0%
6.0%
7.0%
8.0%
9.0%
10.0%
Aug-2013 Aug-2014 Aug-2015 Aug-2016
SBREIT Yield Spread SBREIT Yield Mean Yield-1 SD +1 SD
0.50
0.60
0.70
0.80
0.90
1.00
1.10
1.20
1.30
1.40
1.50
Aug-2013 Aug-2014 Aug-2015 Aug-2016
SBREIT P/BV Mean +1 SD -1 SD
Page 97

Industry Focus
Singapore Developers & REITs
ASIAN INSIGHTS VICKERS SECURITIES Page 98
Ascendas India Trust Historical Yield Spread Ascendas India Trust Historical P/BV
Source: Bloomberg Finance L.P., DBS Bank
Source: Bloomberg Finance L.P., DBS Bank
0.0%
1.0%
2.0%
3.0%
4.0%
5.0%
6.0%
7.0%
8.0%
9.0%
Jan-2010 Jan-2011 Jan-2012 Jan-2013 Jan-2014 Jan-2015 Jan-2016 Jan-20
AIT Yield Spread AIT Yield Mean Yield -1 SD +1 SD
0.9
1.0
1.1
1.2
1.3
1.4
1.5
1.6
1.7
Jan-2010 Jan-2011 Jan-2012 Jan-2013 Jan-2014 Jan-2015 Jan-2016 Jan
AIT P/BV Mean +1 SD -1 SD
Page 98

Industry Focus
Singapore Developers & REITs
ASIAN INSIGHTS VICKERS SECURITIES Page 99
Healthcare REIT Sector Yield Spread Healthcare REIT Sector Historical P/BV
Source: Bloomberg Finance L.P., DBS Bank
Source: Bloomberg Finance L.P., DBS Bank
Parkway Life REIT Historical Yield Spread Parkway Life REIT Historical P/BV
Source: Bloomberg Finance L.P., DBS Bank
Source: Bloomberg Finance L.P., DBS Bank
Religare Health Trust Historical Yield Spread Religare Health Trust Historical P/BV
Source: Bloomberg Finance L.P., DBS Bank
Source: Bloomberg Finance L.P., DBS Bank
0.0%
1.0%
2.0%
3.0%
4.0%
5.0%
6.0%
7.0%
8.0%
Jan-2010 Jan-2011 Jan-2012 Jan-2013 Jan-2014 Jan-2015 Jan-2016 Jan-20
Healthcare REITs Yield Spread Healthcare REITs Yield
Mean -1 SD
+1 SD
0.0%
1.0%
2.0%
3.0%
4.0%
5.0%
6.0%
7.0%
8.0%
9.0%
10.0%
Jan-2010 Jan-2011 Jan-2012 Jan-2013 Jan-2014 Jan-2015 Jan-2016
PREIT Yield Spread PREIT Yield Mean-1 SD +1 SD
0.5
0.7
0.9
1.1
1.3
1.5
1.7
Jan-2010 Jan-2011 Jan-2012 Jan-2013 Jan-2014 Jan-2015 Jan-2016PREIT P/BV Mean +1 SD -1 SD
0.8
0.9
1.0
1.1
1.2
1.3
1.4
1.5
Jan-2010 Jan-2011 Jan-2012 Jan-2013 Jan-2014 Jan-2015 Jan-2016 Jan-2
Healthcare REITs P/BV Mean +1 SD -1 SD
0.0%
1.0%
2.0%
3.0%
4.0%
5.0%
6.0%
7.0%
8.0%
9.0%
10.0%
Nov-12 Nov-13 Nov-14 Nov-15 Nov-1
RHT Yield Spread RHT Yield Mean Yield-1 SD +1 SD
0.9
1.0
1.1
1.2
1.3
1.4
1.5
1.6
1.7
Nov-2012 Nov-2013 Nov-2014 Nov-2015 Nov-2016
RHT P/BV Mean +1 SD -1 SD
Page 99

Industry Focus
Singapore Developers & REITs
ASIAN INSIGHTS VICKERS SECURITIES Page 100
Singapore Developers
CapitaLand Limited P/NAV City Developments Limited P/NAV
Source: Bloomberg Finance L.P., DBS Bank
Source: Bloomberg Finance L.P., DBS Bank
Global Logistics Properties Limited P/NAV UOL Limited P/NAV
Source: Bloomberg Finance L.P., DBS Bank
Source: Bloomberg Finance L.P., DBS Bank
Wheelcok Properties P/NAV Wingtai P/NAV
Source: Bloomberg Finance L.P., DBS Bank
Source: Bloomberg Finance L.P., DBS Bank
0.0
0.5
1.0
1.5
2.0
2.5
3.0
3.5
2001 2002 2003 2004 2005 2006 2007 2008 2009 2010 2011 2012 2013 2014 2015 2016
(X)
City Dev P/NAV Mean -1 SD +1 SD
0.0
0.2
0.4
0.6
0.8
1.0
1.2
1.4
1.6
2010 2011 2012 2013 2014 2015 2016
(X)
GLP P/NAV Mean -1 SD +1 SD
0.0
0.2
0.4
0.6
0.8
1.0
1.2
1.4
2001 2002 2003 2004 2005 2006 2007 2008 2009 2010 2011 2012 2013 2014 2015 2016
(X)
UOL P/NAV Mean -1 SD +1 SD
0.0
0.5
1.0
1.5
2.0
2.5
2001 2002 2003 2004 2005 2006 2007 2008 2009 2010 2011 2012 2013 2014 2015 2016
(X)
Wheelock P/NAV Mean -1 SD +1 SD
0.0
0.2
0.4
0.6
0.8
1.0
1.2
1.4
1.6
1.8
2.0
2001 2002 2003 2004 2005 2006 2007 2008 2009 2010 2011 2012 2013 2014 2015 2016
(X)
Wingtai P/NAV Mean -1 SD +1 SD
0.0
0.5
1.0
1.5
2.0
2.5
2001 2002 2003 2004 2005 2006 2007 2008 2009 2010 2011 2012 2013 2014 2015 2016
(X)
CapitaLand P/NAV Mean -1 SD +1 SD
Page 100

Industry Focus
Singapore Developers & REITs
ASIAN INSIGHTS VICKERS SECURITIES Page 101
UIC Limited P/NAV Perennial Real Estate P/NAV
Source: Bloomberg Finance L.P., DBS Bank
Source: Bloomberg Finance L.P., DBS Bank
Ho Bee Group Limited P/NAV Bukit Sembawang Limited P/NAV
Source: Bloomberg Finance L.P., DBS Bank
Source: Bloomberg Finance L.P., DBS Bank
United Engineers P/NAV Tuan Sing P/NAV
Source: Bloomberg Finance L.P., DBS Bank
Source: Bloomberg Finance L.P., DBS Bank
0.0
0.2
0.4
0.6
0.8
1.0
1.2
1.4
1.6
2001 2002 2003 2004 2005 2006 2007 2008 2009 2010 2011 2012 2013 2014 2015 2016
(X)
UIC P/NAV Mean -1 SD +1 SD
0.0
0.2
0.4
0.6
0.8
1.0
1.2
1.4
2014 2015 2016
(X)
Perennial RE P/NAV Mean -1 SD +1 SD
0.0
0.5
1.0
1.5
2.0
2.5
2001 2002 2003 2004 2005 2006 2007 2008 2009 2010 2011 2012 2013 2014 2015 2016
(X)
Ho Bee P/NAV Mean -1 SD +1 SD
0.0
0.5
1.0
1.5
2.0
2.5
3.0
3.5
2001 2002 2003 2004 2005 2006 2007 2008 2009 2010 2011 2012 2013 2014 2015 2016
(X)
Bukit Sembawang P/NAV Mean -1 SD +1 SD
0.0
0.2
0.4
0.6
0.8
1.0
1.2
1.4
2001 2002 2003 2004 2005 2006 2007 2008 2009 2010 2011 2012 2013 2014 2015 2016
(X)
United Engineers P/NAV Mean -1 SD +1 SD
0.0
0.2
0.4
0.6
0.8
1.0
1.2
2001 2002 2003 2004 2005 2006 2007 2008 2009 2010 2011 2012 2013 2014 2015 2016
(X)
Tuan Sing P/NAV Mean -1 SD +1 SD
Page 101

Industry Focus
Singapore Developers & REITs
ASIAN INSIGHTS VICKERS SECURITIES Page 102
Stock Profiles
Page 102

ASIAN INSIGHTS VICKERS SECURITIES ed: JS / sa:JC, PY
BUY Last Traded Price (4 Jan 2017): S$3.06 (STI : 2,921.31)
Price Target 12-mth: S$3.60 (18% upside)
Potential Catalyst: Stronger than anticipated residential sales
Where we differ: Estimates are more conservative than consensus
Analyst Derek TAN +65 6682 3716 [email protected] Rachel TAN +65 6682 3713 [email protected]
Price Relative
Forecasts and Valuation FY Dec (S$ m) 2015A 2016F 2017F 2018F
Revenue 4,762 4,109 4,959 4,730 EBITDA 2,325 1,651 1,851 1,961 Pre-tax Profit 1,839 1,152 1,313 1,357 Net Profit 1,066 661 753 779 Net Pft (Pre Ex.) 1,066 661 753 779 Net Pft Gth (Pre-ex) (%) (8.2) (38.0) 14.0 3.4 EPS (S cts) 25.0 15.5 17.7 18.3 EPS Pre Ex. (S cts) 25.0 15.5 17.7 18.3 EPS Gth Pre Ex (%) (8) (38) 14 3 Diluted EPS (S cts) 25.0 15.5 17.7 18.3 Net DPS (S cts) 9.00 9.00 9.00 9.00 BV Per Share (S cts) 420 427 436 445 PE (X) 12.3 19.9 17.5 16.9 PE Pre Ex. (X) 12.3 19.9 17.5 16.9 P/Cash Flow (X) 5.3 nm 11.9 17.5 EV/EBITDA (X) 13.8 21.0 18.9 18.2 Net Div Yield (%) 2.9 2.9 2.9 2.9 P/Book Value (X) 0.7 0.7 0.7 0.7 Net Debt/Equity (X) 0.5 0.6 0.6 0.6 ROAE (%) 6.1 3.7 4.1 4.2 Earnings Rev (%): - - - Consensus EPS (S cts): 17.0 19.0 20.8 Other Broker Recs: B: 18 S: 0 H: 3
Source of all data on this page: Company, DBS Bank, Bloomberg Finance L.P
Strong earnings quality Improving earnings quality. We believe that CapitaLand Limited (CAPL) offers good value, trading at an attractive 0.7x P/B and 0.6x P/RNAV. The group’s strategy to focus on growing its commercial portfolio is bearing fruit, offering better earnings visibility. Coupled with opportunistic asset recycling of mature assets into its listed REITs/funds, there is ample upside potential to our earnings estimates. We maintain our BUY call with a target price of S$3.60. Growing recurring revenues from retail mall portfolio and Ascott. Its property portfolio has c. 75% of assets in retail malls, and commercial integrated developments, including Ascott Group, which offers strong income visibility in the medium term. The operating performance of its malls will improve as the properties reach maturity, boosted by the completion of four Raffles City mega developments in China in the medium term. Robust set of 3Q16 results. CAPL reported a robust 28.4% growth in net profit to S$247.5m, on the back of stronger revenues which was up 27.7% to S$1,373m. The better performance was seen across its portfolio, but mainly driven by development projects in Singapore and China, and higher performance from its Singapore commercial portfolio. Tenant sales across its malls in Singapore and China were stable. Valuation:
Our target price of S$3.60 is based on a 25% discount to our
adjusted RNAV of S$4.80/share. Our RNAV is based on our
estimates of the market valuations of its various property
developments and investment property assets across its various
divisions.
Key Risks to Our View:
Slowdown in Asian economies. The risk to our view is if there
is a slowdown in Asian economies, especially China, which
could dampen demand for housing and private consumption
expenditure and retail sales. At A Glance Issued Capital (m shrs) 4,237
Mkt. Cap (S$m/US$m) 12,966 / 9,167
Major Shareholders (%)
Temasek Holdings Pte Ltd 40.1
Blackrock 6.0
Free Float (%) 53.9
3m Avg. Daily Val (US$m) 17.4
ICB Industry : Real Estate / Real Estate
DBS Group Research . Equity
4 Jan 2017
Singapore Company Guide
CapitaLand Version 6 | Bloomberg: CAPL SP | Reuters: CATL.SI Refer to important disclosures at the end of this report
67
87
107
127
147
167
187
207
2.4
2.9
3.4
3.9
4.4
Jan-13 Jan-14 Jan-15 Jan-16 Jan-17
Relative IndexS$
CapitaLand (LHS) Relative STI (RHS)
Page 103

ASIAN INSIGHTS VICKERS SECURITIES
Page 2
Company Guide
CapitaLand
CRITICAL DATA POINTS TO WATCH
Earnings Drivers:
Growing recurring revenues from retail mall portfolio and
Ascott. While trading properties (residential development and
strata offices) account for 24% of assets, we see continued
strength from CAPL’s retail mall division (CapitaMalls Asia) and
commercial integrated developments, including Ascott Group,
its successful serviced residence brand, which form a significant
76% of total assets and is expected to contribute to growing
recurring income for the group.
CapitaMalls Asia continues to perform steadily despite ongoing
operational headwinds. There are 87 operating properties
across Asia (56 of it in China). As at Sep-16, the group’s
shopping malls continue to record steady sales and occupancy
rates. Portfolio tenant sales remained healthy at 2.5% for
Singapore and 5.2% in China on the back of improving traffic.
For China, sales performance varies, with malls in Tier 1 cities
performing better (tenant sales +2.8%) while those in Tier 2
and Tier 3 cities marginally higher by 2.4% and 1.7%
respectively. Looking ahead, CAPL is expected to open another
16 properties (nine in China) in the next few years.
In addition, Raffles City integrated developments in China will
continue to offer stable returns (7-8% for stabilised properties
in Shanghai and Beijing, c.3% for stabilising properties in
Chengdu and Ningbo). Looking ahead, the group will be
opening four more Raffles City developments in 2016-2018,
which will boost the group’s returns and profitability when
completed.
The Ascott Limited remains on the fast track to achieve its
80,000-unit target by year 2020 and will add another 770 units
by 4Q16. Ascott’s investment in China’s largest and fastest-
growing online apartment sharing platform, Tujia has yet to
bear fruit meaningfully but we continue to believe in its longer
term synergies and ability to leverage on Tujia’s platform to
reach out to a wider addressable market in the medium term.
Launch of new PE funds. Leveraging on its fund management
expertise, CAPL aims to launch 5-6 private equity (PE) funds
with funds under management of S$8-10bn by 2020. We think
that by tapping on third-party capital, CAPL would be able to
leverage on larger economies of scale, better capitalise on
market opportunities and at the same time de-risk its property
level exposure. The group launched the US$1.5bn Raffles City
China Investment Partners III (RCCIP III) aimed at prime
integrated developments in gateway cities in China which will
likely be seeded by their properties.
Revenue (S$’m)
Breakdown of Revenues (FY17)
Operating PATMI (Ex Revaluations)
RNAV of CapitaLand S$'bn
Value of CapitaLand Singapore 7,082.5
Value of CapitaLand China 9,818.5
CapitaMalls Asia 17,446.0
Ascott 4,237.1
Others 855.0
GDV of CAPL Group 39,439.2
Less: Net Debt (11,552.3)
Less: devt capex (7,548.6)
RNAV of CAPL 20,458.3
Total Shares 4,258.6
RNAV per share 4.80
Discount to RNAV 25%
Target price 3.60
Source: Company, DBS Bank
-
1,000.0
2,000.0
3,000.0
4,000.0
5,000.0
6,000.0
13A 14A 15A 16F 17F 18F
S$'m
CapitaLand Singapore
21%
Capitaland China 29%
CapitaMalls Asia31%
Ascott 16%
Others3%
-
100.0
200.0
300.0
400.0
500.0
600.0
700.0
800.0
900.0
13A 14A 15A 16F 17F 18F
S$'m
Page 104

ASIAN INSIGHTS VICKERS SECURITIES Page 3
Company Guide
CapitaLand
Balance Sheet:
Balance sheet remains strong. We forecast debt/equity ratio to remain stable, at below c.0.6x over the coming years. Debt maturity profile remains long at 3.5 years (as of 3Q16) with an average cost of 3.4%. Approximately 70% of the interest cost is hedged into fixed rate debt. Share Price Drivers:
De-risking its Singapore residential exposure/replenishing land bank. CAPL has been actively de-risking its Singapore residential exposure through active marketing of its unsold units across its projects and most completed projects are substantially sold. Singapore residential is only c.6% of its total asset value, and is not likely to have a major impact on earnings if further risks arise. Looking ahead, while the group has not been an active investor in Singapore’s residential market, winning any new land tenders will imply improved confidence in the outlook for Singapore’s residential market in the medium term. Relaxation of government policies. Expectations of policy relaxation (especially cyclical measures like the Buyers’ and Sellers’ stamp duties) may improve buyers’ market sentiment and spark a revival in transactional volumes in the Singapore residential market. This is also expected to lift sentiment on property stocks, which we believe will enable CAPL to close the gap between stock price and its NAV. Asset recycling into listed S-REITs. CAPL will continue to demonstrate its ability to crystallise value through strategic divestments of mature assets to its listed REITs, which are market leaders in their respective subsectors of retail, office and hospitality. The ability to recycle capital efficiently will enable the group to free up capital, improve its balance sheet position and deploy capital to projects with higher returns. Key Risks:
Slowdown in Asian economies. The risk to our view is a further slowdown in Asian economies which could dampen demand for housing and private consumption expenditure and retail sales. This in turn could result in slower-than-expected projections. Company Background
CapitaLand is one of Asia’s largest real estate companies headquartered and listed in Singapore. Its two core markets are Singapore and China; while Indonesia, Malaysia and Vietnam have been identified as new growth markets.
Leverage & Asset Turnover (x)
Capital Expenditure
ROE (%)
Forward PE Band (x)
PB Band (x)
Source: Company, DBS Bank
0.0
0.0
0.0
0.1
0.1
0.1
0.1
0.1
0.2
0.2
0.2
0.00
0.10
0.20
0.30
0.40
0.50
0.60
0.70
2014A 2015A 2016F 2017F 2018F
Gross Debt to Equity (LHS) Asset Turnover (RHS)
0.0
20.0
40.0
60.0
80.0
100.0
120.0
140.0
160.0
180.0
2014A 2015A 2016F 2017F 2018F
Capital Expenditure (-)
S$m
0.0%
1.0%
2.0%
3.0%
4.0%
5.0%
6.0%
7.0%
2014A 2015A 2016F 2017F 2018F
Avg: 15.3x
+1sd: 18.3x
+2sd: 21.2x
‐1sd: 12.4x
‐2sd: 9.4x8.4
10.4
12.4
14.4
16.4
18.4
20.4
22.4
Jan-13 Jan-14 Jan-15 Jan-16
(x)
Avg: 0.82x
+1sd: 0.91x
+2sd: 1.01x
‐1sd: 0.72x
‐2sd: 0.62x
0.5
0.6
0.7
0.8
0.9
1.0
1.1
1.2
1.3
Jan-13 Jan-14 Jan-15 Jan-16
(x)
Page 105

ASIAN INSIGHTS VICKERS SECURITIES Page 4
Company Guide
CapitaLand
Segmental Breakdown
FY Dec 2014A 2015A 2016F 2017F 2018F Revenues (S$m) CapitaLand Singapore 1,242 1,229 890 1,030 1,053 CapitaLand China 638 2,039 1,505 2,005 1,601 CMA 1,178 663 840 997 1,128 Ascott 683 744 725 775 794 Others 185 86.1 148 151 153 Total 3,925 4,761 4,109 4,959 4,730
Income Statement (S$m)
FY Dec 2014A 2015A 2016F 2017F 2018F Revenue 3,925 4,762 4,109 4,959 4,730 Cost of Goods Sold (2,543) (3,287) (2,245) (2,851) (2,498) Gross Profit 1,382 1,475 1,864 2,107 2,232 Other Opng (Exp)/Inc (513) (431) (465) (489) (513) Operating Profit 869 1,044 1,398 1,619 1,719 Other Non Opg (Exp)/Inc 541 490 0.0 0.0 0.0 Associates & JV Inc 970 726 188 167 177 Net Interest (Exp)/Inc (382) (422) (435) (473) (539) Exceptional Gain/(Loss) 0.0 0.0 0.0 0.0 0.0 Pre-tax Profit 1,997 1,839 1,152 1,313 1,357 Tax (238) (344) (207) (236) (244) Minority Interest (599) (430) (283) (323) (334) Preference Dividend 0.0 0.0 0.0 0.0 0.0 Net Profit 1,161 1,066 661 753 779 Net Profit before Except. 1,161 1,066 661 753 779 EBITDA 2,444 2,325 1,651 1,851 1,961 Growth Revenue Gth (%) 11.8 21.3 (13.7) 20.7 (4.6) EBITDA Gth (%) 7.4 (4.9) (29.0) 12.1 6.0 Opg Profit Gth (%) 27.8 20.2 33.9 15.8 6.2 Net Profit Gth (Pre-ex) (%) 32.7 (8.2) (38.0) 14.0 3.4 Margins & Ratio Gross Margins (%) 35.2 31.0 45.4 42.5 47.2 Opg Profit Margin (%) 22.1 21.9 34.0 32.6 36.3 Net Profit Margin (%) 29.6 22.4 16.1 15.2 16.5 ROAE (%) 7.1 6.1 3.7 4.1 4.2 ROA (%) 2.6 2.3 1.4 1.6 1.7 ROCE (%) 1.9 2.0 2.7 3.0 3.1 Div Payout Ratio (%) 33.0 36.0 58.0 50.9 49.2 Net Interest Cover (x) 2.3 2.5 3.2 3.4 3.2
Source: Company, DBS Bank
Mainly from residential sales in China and Singapore
Page 106

ASIAN INSIGHTS VICKERS SECURITIES Page 5
Company Guide
CapitaLand
Quarterly / Interim Income Statement (S$m)
FY Dec 3Q2015 4Q2015 1Q2016 2Q2016 3Q2016 Revenue 1,076 1,740 894 1,132 1,374 Cost of Goods Sold (738) (1,359) (615) (828) (950) Gross Profit 338 381 279 304 423 Other Oper. (Exp)/Inc (30.2) (28.4) 2.70 77.9 (89.3) Operating Profit 308 352 282 382 334 Other Non Opg (Exp)/Inc 0.0 0.0 0.0 0.0 0.0 Associates & JV Inc 140 224 165 198 149 Net Interest (Exp)/Inc (105) (97.1) (108) (102) (101) Exceptional Gain/(Loss) 0.0 0.0 0.0 0.0 0.0 Pre-tax Profit 343 479 339 477 383 Tax (64.4) (84.7) (51.6) (82.1) (61.2) Minority Interest (85.6) (147) (69.6) (101) (74.1) Net Profit 193 248 218 294 248 Net profit bef Except. 193 248 218 294 248 EBITDA 448 576 447 580 483 Growth Revenue Gth (%) 4.3 61.7 (48.6) 26.6 21.4 EBITDA Gth (%) (17.4) 28.6 (22.4) 29.6 (16.6) Opg Profit Gth (%) 0.5 14.4 (19.9) 35.3 (12.5) Net Profit Gth (Pre-ex) (%) 36.1 28.5 (11.9) 34.7 (15.8) Margins Gross Margins (%) 31.4 21.9 31.2 26.8 30.8 Opg Profit Margins (%) 28.6 20.3 31.5 33.7 24.3 Net Profit Margins (%) 17.9 14.2 24.4 26.0 18.0
Balance Sheet (S$m)
FY Dec 2014A 2015A 2016F 2017F 2018F Net Fixed Assets 1,047 808 908 1,007 1,107 Invts in Associates & JVs 12,781 12,858 13,130 13,389 13,654 Other LT Assets 18,705 20,760 21,260 21,760 22,260 Cash & ST Invts 2,941 4,257 2,151 2,477 2,431 Inventory 0.0 0.0 0.0 0.0 0.0 Debtors 963 1,424 1,027 1,240 1,154 Other Current Assets 7,676 6,945 6,808 6,259 6,299 Total Assets 44,113 47,053 45,285 46,131 46,904 ST Debt 3,469 2,246 2,246 2,246 2,246 Creditor 3,070 4,064 1,386 1,088 690 Other Current Liab 463 620 684 777 879 LT Debt 12,517 13,812 14,312 14,812 15,312 Other LT Liabilities 1,386 1,373 1,373 1,373 1,373 Shareholder’s Equity 16,758 17,905 18,183 18,553 18,949 Minority Interests 6,451 7,032 7,101 7,282 7,455 Total Cap. & Liab. 44,113 47,053 45,285 46,131 46,904 Non-Cash Wkg. Capital 5,107 3,685 5,766 5,633 5,883 Net Cash/(Debt) (13,045) (11,801) (14,407) (14,581) (15,127) Debtors Turn (avg days) 99.1 91.5 108.9 83.4 92.3 Creditors Turn (avg days) 438.9 404.1 456.1 162.1 133.4 Inventory Turn (avg days) N/A N/A N/A N/A N/A Asset Turnover (x) 0.1 0.1 0.1 0.1 0.1 Current Ratio (x) 1.7 1.8 2.3 2.4 2.6 Quick Ratio (x) 0.6 0.8 0.7 0.9 0.9 Net Debt/Equity (X) 0.6 0.5 0.6 0.6 0.6 Net Debt/Equity ex MI (X) 0.8 0.7 0.8 0.8 0.8 Capex to Debt (%) 0.8 0.4 1.0 1.0 0.9 Z-Score (X) 1.1 1.1 1.1 1.1 1.1
Source: Company, DBS Bank
Gearing to remain stable
Page 107

ASIAN INSIGHTS VICKERS SECURITIES Page 6
Company Guide
CapitaLand
Cash Flow Statement (S$m)
FY Dec 2014A 2015A 2016F 2017F 2018F Pre-Tax Profit 1,997 1,839 1,152 1,313 1,357 Dep. & Amort. 64.6 65.0 65.0 65.0 65.0 Tax Paid (256) (145) (144) (143) (142) Assoc. & JV Inc/(loss) (970) (726) (188) (167) (177) Chg in Wkg.Cap. 51.9 1,264 (2,144) 39.3 (352) Other Operating CF 111 169 0.0 0.0 0.0 Net Operating CF 999 2,466 (1,259) 1,107 751 Capital Exp.(net) (127) (64.0) (164) (164) (164) Other Invts.(net) (1,357) (718) (500) (500) (500) Invts in Assoc. & JV 841 509 (150) (150) (150) Div from Assoc & JV 406 394 65.8 58.5 62.1 Other Investing CF (102) 33.0 0.0 0.0 0.0 Net Investing CF (339) 154 (749) (756) (752) Div Paid (705) (727) (598) (525) (545) Chg in Gross Debt 177 (212) 500 500 500 Capital Issues 1.38 0.0 0.0 0.0 0.0 Other Financing CF (3,746) (274) 0.0 0.0 0.0 Net Financing CF (4,272) (1,213) (98.1) (24.9) (44.7) Currency Adjustments 55.0 16.9 0.0 0.0 0.0 Chg in Cash (3,557) 1,424 (2,106) 326 (45.8) Opg CFPS (S cts) 22.2 28.2 20.8 25.1 25.9 Free CFPS (S cts) 20.5 56.4 (33.4) 22.1 13.8
Source: Company, DBS Bank
Target Price & Ratings History
Source: DBS Bank
Analyst: Derek TAN, Rachel TAN
S.No.Date of Report
Closing Price
12-mth Target Price
Rat ing
1: 08 Jan 16 3.16 3.73 BUY
2: 18 Jan 16 3.02 3.73 BUY
3: 16 Feb 16 2.90 3.73 BUY
4: 18 Feb 16 2.91 3.70 BUY
5: 02 Mar 16 3.07 3.70 BUY
6: 16 Mar 16 3.14 3.70 BUY
7: 18 Apr 16 3.16 3.70 BUY
8: 20 Apr 16 3.17 3.70 BUY
9: 27 May 16 2.98 3.70 BUY
10: 31 May 16 2.99 3.70 BUY
11: 09 Jun 16 3.05 3.70 BUY12: 05 Aug 16 3.22 3.60 BUY13: 16 Sep 16 3.12 3.60 BUY14: 30 Sep 16 3.20 3.60 BUY
Note : Share price and Target price are adjusted for corporate actions. 15: 18 Oct 16 3.13 3.60 BUY16: 24 Oct 16 3.17 3.60 BUY17: 07 Nov 16 3.04 3.60 BUY18: 10 Nov 16 3.08 3.60 BUY19: 14 Nov 16 3.00 3.60 BUY20: 16 Nov 16 2.99 3.60 BUY21: 21 Nov 16 2.98 3.60 BUY22: 25 Nov 16 3.02 3.60 BUY
12
3
45
6
7
8
91011
12
13
14
15
16
17
18
19
20
21
22
2.67
2.77
2.87
2.97
3.07
3.17
3.27
3.37
Jan-16 May-16 Sep-16 Jan-17
S$
Assumed capex
Page 108

ASIAN INSIGHTS VICKERS SECURITIES ed: TH / sa: JC, PY
BUY Last Traded Price (4 Jan 2017): S$8.39 (STI : 2,921.31) Price Target 12-mth: S$9.90 (18% upside) Potential Catalyst: Further injections into PPS structure Where we differ: Below consensus Analyst Rachel TAN +65 6682 3713 [email protected] Derek TAN +65 6682 3716 [email protected]
Price Relative
Forecasts and Valuation FY Dec (S$ m) 2015A 2016F 2017F 2018F Revenue 3,304 3,654 3,875 4,437 EBITDA 948 1,092 1,135 1,246 Pre-tax Profit 985 787 830 937 Net Profit 760 548 577 653 Net Pft (Pre Ex.) 436 548 577 653 Net Pft Gth (Pre-ex) (%) 8.6 25.7 5.3 13.2 EPS (S cts) 83.6 60.2 63.5 71.8 EPS Pre Ex. (S cts) 47.9 60.2 63.5 71.8 EPS Gth Pre Ex (%) 9 26 5 13 Diluted EPS (S cts) 79.7 57.4 60.5 68.4 Net DPS (S cts) 16.0 11.5 12.1 13.7 BV Per Share (S cts) 989 1,034 1,085 1,145 PE (X) 10.0 13.9 13.2 11.7 PE Pre Ex. (X) 17.5 13.9 13.2 11.7 P/Cash Flow (X) 98.0 8.0 11.3 5.4 EV/EBITDA (X) 13.4 11.4 11.0 9.5 Net Div Yield (%) 1.9 1.4 1.4 1.6 P/Book Value (X) 0.8 0.8 0.8 0.7 Net Debt/Equity (X) 0.3 0.3 0.3 0.2 ROAE (%) 8.7 6.0 6.0 6.4 Earnings Rev (%): - - - Consensus EPS (S cts): 62.5 63.3 69.2 Other Broker Recs: B: 19 S: 1 H: 3
Source of all data on this page: Company, DBS Bank, Bloomberg Finance L.P
Solitaire PPS Club member Attractive valuations. We continue to see good value at 0.8x FY17F P/NAV, at 1SD below historical average. Key catalysts are: i) potential injection of assets into Profit Participation Securities (PPS), ii) improvement in hotel operations, and iii) accretive acquisitions/land banking. 9M16 net profit grew 13% on one-off gains. 9M16 net profit grew 13% y-o-y to S$409m (68% of consensus’ full-year estimates) driven by revenue growth of 12% y-o-y (largely contributions from property development), one-off gains from disposal of 53% stake in City E-Solutions (CES) and insurance claims. Property development continues to record strong growth coupled with a 24% y-o-y increase in 9M16 property sales value (number of units sold was stable y-o-y). Weak performance from the hotel properties continue to weigh down earnings. Some light from overseas investments. CDL’s decision to diversify into the overseas property market amid a challenging outlook in the Singapore property market is finally coming to fruition. With most of its Singapore property projects having been completed or are soon-to-be-completed, we expect international properties (UK and China) to drive property sales/revenue recognition in 2017/2018. We believe this could partly offset the impact of a weak property market in Singapore. Valuation:
We maintain our BUY call with TP to S$9.90 pegged to a 20% discount to our RNAV of S$11.90. Supported by a strong balance sheet and diversified earnings base, CDL should be able to navigate well around the current uncertain market conditions. Key Risks to Our View:
Decline in residential prices in Singapore. As a proxy to Singapore’s residential market, a deteriorating operating environment will cap share price performance. At A Glance Issued Capital (m shrs) 909 Mkt. Cap (S$m/US$m) 7,629 / 5,341 Major Shareholders (%) Davos Investments 16.4 Hong Leong Investment 15.4 Aberdeen Asset Management 14.0
Free Float (%) 54.2 3m Avg. Daily Val (US$m) 8.9 ICB Industry : Real Estate / Real Estate
DBS Group Research . Equity 4 Jan 2017
Singapore Company Guide
City Developments Version 5 | Bloomberg: CIT SP | Reuters: CTDM.SI Refer to important disclosures at the end of this report
56
76
96
116
136
156
176
196
216
6.0
7.0
8.0
9.0
10.0
11.0
12.0
13.0
14.0
Jan-13 Jan-14 Jan-15 Jan-16 Jan-17
Relative IndexS$
City Developments (LHS) Relative STI (RHS)
Page 109

ASIAN INSIGHTS VICKERS SECURITIES Page 2
Company Guide
City Developments
CRITICAL DATA POINTS TO WATCH
Earnings Drivers:
Aiming for a higher proportion of recurring earnings base. Weighed down by weak sentiment and depleting land bank for its development projects, CDL’s focus in 2015-2016 has been to focus on its commercial portfolio; building up a recurring income base in order to sustain profitability. In 2015, CDL had close to 64% of its revenues from recurring and stable segments. Hotel operations are the largest revenue contributor (49%) among all divisions despite showing some signs of weakness, which implies a substantial proportion of stable income. Potential headwinds in this segment are further deterioration of RevPAR especially in Asian hotels and further depreciation of GBP. The group’s investment property division (office and retail malls mainly in Singapore) is projected to offer steady returns. In total, the hotel and investment property divisions contribute c. 64-67% of revenues. Looking overseas to sustain growth. We continue to see good progress for the group’s overseas investments. London – CDL recorded strong sales at its 82-unit Reading project, and is expected to book in revenues of c. GBP18.4m (S$36m), while its other projects will be launched progressively in the coming quarters. The Teddington Studios and Stag Brewery sites (planning approvals expected in 1Q18) are expected to be launched in phases in the medium term. CDL has also signed a contract to purchase 56-64 Leonard Street in Shoreditch for GBP37.4m (S$73.5m), to be redeveloped into an office tower block. In China, CDL has launched some projects in Suzhou (Hong Leong City Center continues to see steady sales). Phase 1 of the project (30-storey, 462-unit residential tower and 912-unit Soho Tower) has seen good sales momentum, selling 995 units to date, locking in sales proceeds of over RMB2.12bn (S$424m) which will be booked when completed. Tower 2 of the project was launched and fully sold in an hour. The group’s Hongqiao Royal Lake project also moved 32 units (out of 85), locking in sales of RMB634m (S$127m). CDL’s other projects in Chongqing and Suzhou will likely take more time before they can be launched. In Australia, the group’s JV residential project in Brisbane is 93% sold (Ivy and Eve, two 30-storey towers comprising 472 apartments), and will be booked in 2018. The group’s developments in Tokyo will likely be launched in the medium term. New PPS structure. Post the successful launch of three PPS structures, management is keen to continue unlocking value through fund management and/or new private equity structures. The successful launch will enable the group to book in substantial gains given that assets are recorded at cost.
Revenue growth (FY14A-18F)
Breakdown in revenues (FY16F)
Revenue growth from hotel segment
RNAV breakdown
RNAV S$'m Investment Portfolio (office) 3,122.2 Investment Portfolio (mixed Development ) 1,505.1 Investment Portfolio (hotels) 1,071.5 Investment Portfolio (retail) 893.5 Investment Portfolio (industrial and others) 137.4 GDV of residential portfolio 4,757.6 Listed Stakes in M&C 1,856.7 CDL HT 338.1 Others 86.7 Gross Asset Value 13,768.8 Less: pref conversion (211.8) Less: Net debt (1,835.9) RNAV of CDL 11,721.2 No of shares 954.3 RNAV/share 12.3 Discount -20% TP 9.90
Source: Company, DBS Bank
0.0
500.0
1,000.0
1,500.0
2,000.0
2,500.0
3,000.0
3,500.0
4,000.0
4,500.0
5,000.0
2014A 2015A 2016F 2017F 2018F
S$'m
Others Hotel operations Rental income Property devt
Property devt36%
Rental income11%
Hotel operations
49%
Others4%
40%
42%
44%
46%
48%
50%
52%
1,350.0
1,400.0
1,450.0
1,500.0
1,550.0
1,600.0
1,650.0
1,700.0
1,750.0
1,800.0
1,850.0
2013A 2014A 2015A 2016F 2017F
S$'m
Revenue % of topline
Page 110

ASIAN INSIGHTS VICKERS SECURITIES Page 3
Company Guide
City Developments
Balance Sheet:
Undervalued Net Asset Value (NAV). As the group has chosen to account for investment properties on a historical cost basis, its NAV is conservative as we estimate that current fair values of CDL’s properties are much higher than carrying values. Low gearing of 26%. CDL’s gearing is estimated to remain low at <30% (and closer to mid-teens assuming that its investment property values are marked-to-market) which is within management’s comfortable range. This provides greater financial flexibility and debt headroom for the group to acquire opportunistically. Share Price Drivers:
Replenishing land bank is key to income sustainability. The ongoing tight government measures have taken a toll on the group’s residential business segment, with the group staying selective on land banking activities. However, CDL has been active in the Executive Condos (ECs) segment; The Brownstone EC and The Criteron saw brisk sales when launched. CDL launch 40 units in Gramercy Park, a high-end condominium in May 2016 and has achieved 90% sales. The group has been marketing the project regionally and is understood to have received positive responses from investors. The successful launch of its ongoing project will be positive to investor sentiment on property stocks, which we believe will enable CDL to close the gap between its stock price and NAV. Key Risks:
Decline in residential prices in Singapore. Seen as a proxy to Singapore’s residential market, a worsening of the operating environment is expected to cap any upside potential for the stock. Unsold inventories are mainly in the high-end and executive segments whose unsold stock typically take time to clear. Interest rate risk. A rise in interest rates will have a negative impact on property transactions, given lower affordability and thus could adversely affect the group’s outlook. Company Background
City Developments Limited (CDL) is one of the pioneers in Singapore's property sector. It is a property and hotel conglomerate involved in real estate development and investment, hotel ownership and management, and facility management.
Leverage & Asset Turnover (x)
Capital Expenditure
ROE (%)
Forward PE Band (x)
PB Band (x)
Source: Company, DBS Bank
0.1
0.2
0.2
0.3
0.3
0.00
0.10
0.20
0.30
0.40
0.50
0.60
0.70
0.80
2014A 2015A 2016F 2017F 2018F
Gross Debt to Equity (LHS) Asset Turnover (RHS)
0.0
100.0
200.0
300.0
400.0
500.0
600.0
700.0
800.0
900.0
1,000.0
2014A 2015A 2016F 2017F 2018F
Capital Expenditure (-)
S$m
0.0%
1.0%
2.0%
3.0%
4.0%
5.0%
6.0%
7.0%
8.0%
9.0%
2014A 2015A 2016F 2017F 2018F
Avg: 17.6x
+1sd: 21.2x
+2sd: 24.7x
‐1sd: 14.1x
‐2sd: 10.6x9.5
11.5
13.5
15.5
17.5
19.5
21.5
23.5
25.5
Jan-13 Jan-14 Jan-15 Jan-16
(x)
Avg: 1.05x
+1sd: 1.25x
+2sd: 1.45x
‐1sd: 0.85x
‐2sd: 0.65x
0.5
0.7
0.9
1.1
1.3
1.5
1.7
Jan-13 Jan-14 Jan-15 Jan-16
(x)
Page 111

ASIAN INSIGHTS VICKERS SECURITIES Page 4
Company Guide
City Developments
Segmental Breakdown
FY Dec 2014A 2015A 2016F 2017F 2018F Revenues (S$m) Property devt 1,581 1,037 1,324 1,478 1,960 Rental income 385 405 394 420 428 Hotel operations 1,678 1,698 1,773 1,814 1,885 120 163 163 163 163 Others 0.0 0.0 0.0 0.0 0.0 Total 3,764 3,304 3,654 3,875 4,437
Income Statement (S$m)
FY Dec 2014A 2015A 2016F 2017F 2018F Revenue 3,764 3,304 3,654 3,875 4,437 Cost of Goods Sold (2,132) (1,648) (1,888) (2,003) (2,316) Gross Profit 1,632 1,656 1,766 1,872 2,121 Other Opng (Exp)/Inc (948) (1,030) (926) (982) (1,124) Operating Profit 684 626 840 891 997 Other Non Opg (Exp)/Inc 0.0 0.0 0.0 0.0 0.0 Associates & JV Inc 54.8 107 37.3 30.1 33.9 Net Interest (Exp)/Inc (90.5) (72.2) (90.8) (90.7) (94.4) Exceptional Gain/(Loss) 356 325 0.0 0.0 0.0 Pre-tax Profit 1,004 985 787 830 937 Tax (95.1) (119) (135) (144) (163) Minority Interest (139) (92.7) (91.3) (96.0) (108) Preference Dividend (12.9) (12.9) (12.9) (12.9) (12.9) Net Profit 757 760 548 577 653 Net Profit before Except. 401 436 548 577 653 EBITDA 939 948 1,092 1,135 1,246 Growth Revenue Gth (%) 17.1 (12.2) 10.6 6.1 14.5 EBITDA Gth (%) (7.4) 1.0 15.3 3.9 9.8 Opg Profit Gth (%) (12.8) (8.5) 34.2 6.0 12.0 Net Profit Gth (Pre-ex) (%) (40.4) 8.6 25.7 5.3 13.2 Margins & Ratio Gross Margins (%) 43.4 50.1 48.3 48.3 47.8 Opg Profit Margin (%) 18.2 18.9 23.0 23.0 22.5 Net Profit Margin (%) 20.1 23.0 15.0 14.9 14.7 ROAE (%) 9.4 8.7 6.0 6.0 6.4 ROA (%) 4.1 3.8 2.7 2.7 3.0 ROCE (%) 3.6 3.0 3.7 3.8 4.2 Div Payout Ratio (%) 19.2 19.1 19.1 19.1 19.1 Net Interest Cover (x) 7.6 8.7 9.3 9.8 10.6
Source: Company, DBS Bank
Recognition of locked-in sales
Page 112

ASIAN INSIGHTS VICKERS SECURITIES Page 5
Company Guide
City Developments
Quarterly / Interim Income Statement (S$m)
FY Dec 3Q2015 4Q2015 1Q2016 2Q2016 3Q2016 Revenue 809 855 723 1,092 923 Cost of Goods Sold (396) (392) (365) (652) (493) Gross Profit 413 463 358 440 430 Other Oper. (Exp)/Inc (258) (3.9) (82.9) (98.5) (50.6) Operating Profit 156 459 209 214 245 Other Non Opg (Exp)/Inc 0.0 0.0 0.0 0.0 0.0 Associates & JV Inc 20.6 29.2 10.6 12.5 16.5 Net Interest (Exp)/Inc (22.0) (17.1) (14.8) (21.4) (22.7) Exceptional Gain/(Loss) 0.0 0.0 0.0 0.0 0.0 Pre-tax Profit 155 471 205 205 239 Tax (24.4) (44.1) (14.5) (37.6) (35.6) Minority Interest (23.7) (16.8) (18.6) (33.7) (33.1) Net Profit 106 410 172 134 170 Net profit bef Except. 106 410 172 134 170 EBITDA 234 546 272 280 313 Growth Revenue Gth (%) (1.9) 5.7 (15.4) 51.0 (15.5) EBITDA Gth (%) (8.9) 133.5 (50.2) 3.1 12.0 Opg Profit Gth (%) (18.0) 194.5 (54.4) 2.2 14.6 Net Profit Gth (Pre-ex) (%) (20.3) 285.8 (58.1) (22.2) 27.3 Margins Gross Margins (%) 51.1 54.2 49.5 40.3 46.6 Opg Profit Margins (%) 19.3 53.7 28.9 19.6 26.6 Net Profit Margins (%) 13.1 48.0 23.8 12.2 18.5
Balance Sheet (S$m)
FY Dec 2014A 2015A 2016F 2017F 2018F Net Fixed Assets 4,918 5,175 5,260 5,346 5,431 Invts in Associates & JVs 1,128 1,307 1,527 1,740 1,957 Other LT Assets 3,324 2,949 2,949 2,949 2,949 Cash & ST Invts 3,933 3,597 3,913 3,988 4,799 Inventory 11.2 11.2 12.9 13.7 15.8 Debtors 1,589 1,762 1,948 2,066 2,366 Other Current Assets 4,797 5,519 5,312 5,509 5,067 Total Assets 19,701 20,319 20,921 21,610 22,584 ST Debt 2,233 1,911 1,911 1,911 1,911 Creditor 1,463 1,602 1,836 1,948 2,251 Other Current Liab 261 319 195 204 222 LT Debt 4,466 4,572 4,572 4,572 4,572 Other LT Liabilities 501 702 702 702 702 Shareholder’s Equity 8,410 8,996 9,398 9,870 10,413 Minority Interests 2,365 2,217 2,309 2,405 2,513 Total Cap. & Liab. 19,701 20,319 20,921 21,610 22,584 Non-Cash Wkg. Capital 4,672 5,371 5,242 5,438 4,975 Net Cash/(Debt) (2,766) (2,885) (2,569) (2,495) (1,684) Debtors Turn (avg days) 156.6 185.0 185.3 189.1 182.3 Creditors Turn (avg days) 263.6 390.3 375.0 386.1 364.7 Inventory Turn (avg days) 1.9 2.9 2.6 2.7 2.6 Asset Turnover (x) 0.2 0.2 0.2 0.2 0.2 Current Ratio (x) 2.6 2.8 2.8 2.9 2.8 Quick Ratio (x) 1.4 1.4 1.5 1.5 1.6 Net Debt/Equity (X) 0.3 0.3 0.3 0.3 0.2 Net Debt/Equity ex MI (X) 0.3 0.3 0.3 0.3 0.2 Capex to Debt (%) 14.0 (13.0) 4.6 4.6 4.6 Z-Score (X) 1.7 1.7 1.7 1.7 1.7
Source: Company, DBS Bank
Weaker property development division, rental and hotel divisions
Conservative gearing
Page 113

ASIAN INSIGHTS VICKERS SECURITIES Page 6
Company Guide
City Developments
Cash Flow Statement (S$m)
FY Dec 2014A 2015A 2016F 2017F 2018F Pre-Tax Profit 1,004 985 787 830 937 Dep. & Amort. 200 215 215 215 215 Tax Paid (188) (194) (259) (135) (144) Assoc. & JV Inc/(loss) (54.8) (107) (37.3) (30.1) (33.9) Chg in Wkg.Cap. (482) (712) 252 (204) 444 Other Operating CF (187) (110) 0.0 0.0 0.0 Net Operating CF 292 77.8 957 675 1,418 Capital Exp.(net) (936) 843 (300) (300) (300) Other Invts.(net) 0.0 0.0 0.0 0.0 0.0 Invts in Assoc. & JV 828 (227) (200) (200) (200) Div from Assoc & JV 17.9 16.9 16.9 16.9 16.9 Other Investing CF 47.6 (113) 0.0 0.0 0.0 Net Investing CF (41.8) 520 (483) (483) (483) Div Paid (275) (271) (158) (118) (123) Chg in Gross Debt 172 (310) 0.0 0.0 0.0 Capital Issues 0.0 0.0 0.0 0.0 0.0 Other Financing CF 842 (333) 0.0 0.0 0.0 Net Financing CF 739 (914) (158) (118) (123) Currency Adjustments 189 (16.6) 0.0 0.0 0.0 Chg in Cash 1,178 (333) 316 74.6 811 Opg CFPS (S cts) 85.1 86.8 77.5 96.7 107 Free CFPS (S cts) (70.7) 101 72.3 41.3 123
Source: Company, DBS Bank
Target Price & Ratings History
Source: DBS Bank
Analyst: Rachel TAN, Derek TAN
S.No.Date of Report
Closing Price
12-mth Target Price
Rat ing
1: 08 Jan 16 7.58 10.26 BUY
2: 18 Jan 16 7.18 10.26 BUY
3: 16 Feb 16 6.93 10.26 BUY
4: 26 Feb 16 7.20 10.26 BUY
5: 16 Mar 16 7.58 10.26 BUY
6: 18 Apr 16 8.76 10.26 BUY
7: 12 May 16 7.97 9.60 BUY
8: 27 May 16 8.35 9.60 BUY
9: 09 Jun 16 8.80 9.60 BUY
10: 12 Aug 16 8.80 9.90 BUY
11: 16 Sep 16 8.86 9.90 BUY12: 27 Sep 16 8.99 9.90 BUY13: 30 Sep 16 9.07 9.90 BUY14: 18 Oct 16 8.77 9.90 BUY
Note : Share price and Target price are adjusted for corporate actions. 15: 24 Oct 16 8.82 9.90 BUY16: 10 Nov 16 8.60 9.90 BUY17: 16 Nov 16 8.38 9.90 BUY
1 2
3
4 5
6
7
8 9
10
11
12
1314
15
16
17
6.34
6.84
7.34
7.84
8.34
8.84
9.34
Jan-16 May-16 Sep-16 Jan-17
S$
Page 114

ASIAN INSIGHTS VICKERS SECURITIES ed: JS / sa: YM, PY
BUY Last Traded Price ( 4 Jan 2017): S$1.60 (STI : 2,921.31) Price Target 12-mth: S$2.00 (25% upside) Potential Catalyst: Better operating results Where we differ: Our estimates are conservative Analyst Rachel TAN +65 6682 3713 [email protected] Derek TAN +65 6682 3716 [email protected]
Price Relative
Forecasts and Valuation FY Sep (S$ m) 2016A 2017F 2018F 2019F Revenue 3,440 2,412 3,103 2,633 EBITDA 993 1,051 1,153 1,107 Pre-tax Profit 960 830 886 836 Net Profit 533 387 415 378 Net Pft (Pre Ex.) 368 387 415 378 Net Pft Gth (Pre-ex) (%) (23.8) 5.0 7.2 (8.8) EPS (S cts) 18.4 13.3 14.3 13.0 EPS Pre Ex. (S cts) 12.7 13.3 14.3 13.0 EPS Gth Pre Ex (%) (24) 5 7 (9) Diluted EPS (S cts) 18.4 13.3 14.3 13.0 Net DPS (S cts) 8.61 8.60 8.60 8.60 BV Per Share (S cts) 230 234 240 245 PE (X) 8.7 12.0 11.2 12.2 PE Pre Ex. (X) 12.6 12.0 11.2 12.2 P/Cash Flow (X) 4.2 nm 14.4 nm EV/EBITDA (X) 17.6 18.7 17.4 19.2 Net Div Yield (%) 5.4 5.4 5.4 5.4 P/Book Value (X) 0.7 0.7 0.7 0.7 Net Debt/Equity (X) 0.6 0.8 0.8 0.8 ROAE (%) 8.1 5.7 6.0 5.4 Earnings Rev (%): 0 0 0 Consensus EPS (S cts): 17.0 19.3 19.0 Other Broker Recs: B: 8 S: 0 H: 0
Source of all data on this page: Company, DBS Bank, Bloomberg Finance L.P
Yielding like a REIT Growing developer with high dividend yields. We maintain our BUY rating on Frasers Centrepoint Ltd (FCL) for its attractive valuations at 0.7x P/NAV and FY17F PE of 11x, and offering one of the highest dividend yields among developers at c.5.7%. We continue to expect re-rating catalysts coming from potential asset monetisation from ongoing strategies to crystallise value across its portfolio. FY16 core net profit fell 11% (in line) weighed down by weak earnings from development properties. FY16 net profit fell 23% y-o-y to S$597m, mainly due to lower core net profit and lower fair value gains. FY16 fair value gains was 34% lower at S$160m, mainly due to fair value losses in Singapore and Hospitality units offset by fair value gains in Australia (including S$77m fair value gain from the injection of properties into Frasers Logistics and Industrial Trust (FLT)). FY16 profit before interest and tax (PBIT) from development properties fell 29% while recurring income from investment properties dropped by 9% (partly due absence of one-off gains). Property sales were lower in FY16, falling 25% to 4.9k units. Management remains cautious and is selective in the residential sector, and continues to look for opportunities to strengthen its recurring income from commercial properties. Asset recycling into its listed S-REITs. FCL will continue to demonstrate its ability to crystallise value by strategically divesting matured assets to its listed REITs. The group is thus able to free up capital, improve its balance sheet position and recycle capital to projects with higher returns. Valuation: We maintain our BUY rating on FCL, TP maintained at S$2.00 (30% discount to RNAV). Key Risks to Our View: Dependent on the outlook of the Australian real estate market and currency. The group derives an estimated 30% of PBIT from Australia, and returns could be impacted by the weakening AUD/SGD exchange rate. At A Glance Issued Capital (m shrs) 2,900 Mkt. Cap (S$m/US$m) 4,625 / 3,213 Major Shareholders (%) TCC Assets Ltd 59.2 Thai Beverage 28.4 Free Float (%) 12.4 3m Avg. Daily Val (US$m) 0.24 ICB Industry : Real Estate / Real Estate Investment & Services
DBS Group Research . Equity 4 Jan 2017
Singapore Company Guide
Frasers Centrepoint Ltd Version 5 | Bloomberg: FCL SP | Reuters: FRCT.SI Refer to important disclosures at the end of this report
88
108
128
148
168
188
208
1.3
1.4
1.5
1.6
1.7
1.8
1.9
2.0
2.1
2.2
Jan-14 Jan-15 Jan-16
Relative IndexS$
Frasers Centrepoint Ltd (LHS) Relative STI (RHS)
Page 115
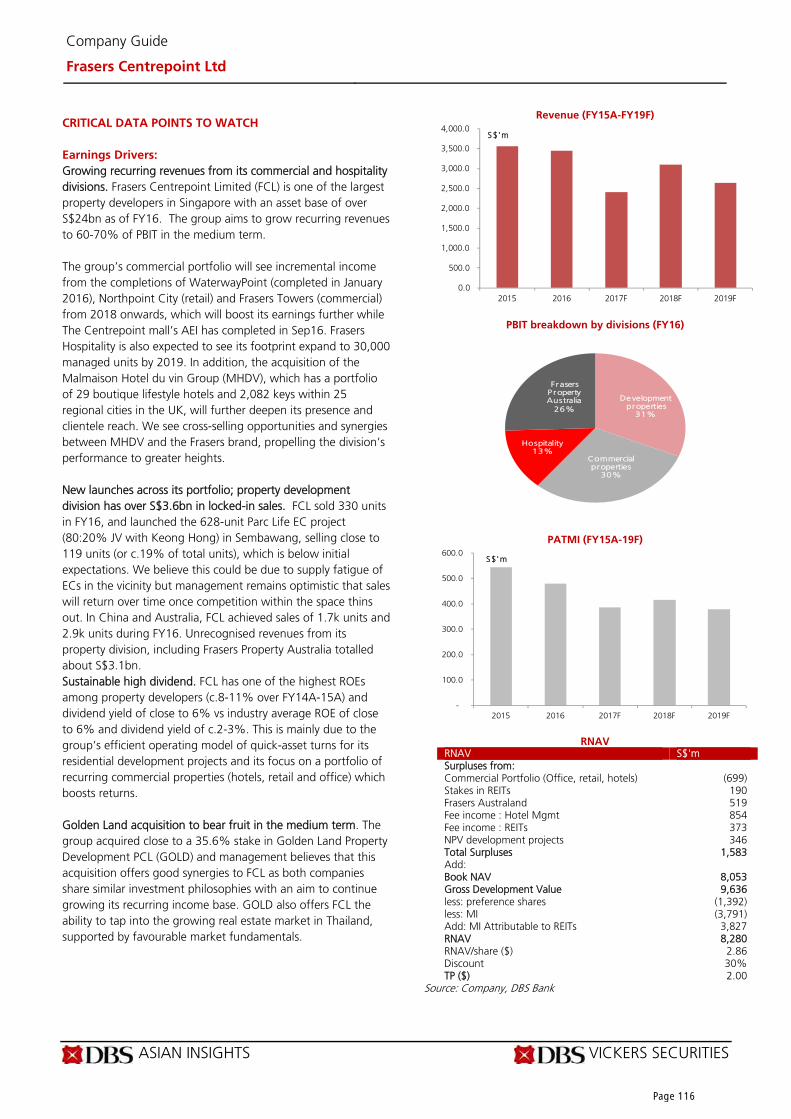
ASIAN INSIGHTS VICKERS SECURITIES Page 2
Company Guide
Frasers Centrepoint Ltd
CRITICAL DATA POINTS TO WATCH
Earnings Drivers:
Growing recurring revenues from its commercial and hospitality divisions. Frasers Centrepoint Limited (FCL) is one of the largest property developers in Singapore with an asset base of over S$24bn as of FY16. The group aims to grow recurring revenues to 60-70% of PBIT in the medium term. The group’s commercial portfolio will see incremental income from the completions of WaterwayPoint (completed in January 2016), Northpoint City (retail) and Frasers Towers (commercial) from 2018 onwards, which will boost its earnings further while The Centrepoint mall’s AEI has completed in Sep16. Frasers Hospitality is also expected to see its footprint expand to 30,000 managed units by 2019. In addition, the acquisition of the Malmaison Hotel du vin Group (MHDV), which has a portfolio of 29 boutique lifestyle hotels and 2,082 keys within 25 regional cities in the UK, will further deepen its presence and clientele reach. We see cross-selling opportunities and synergies between MHDV and the Frasers brand, propelling the division’s performance to greater heights. New launches across its portfolio; property development division has over S$3.6bn in locked-in sales. FCL sold 330 units in FY16, and launched the 628-unit Parc Life EC project (80:20% JV with Keong Hong) in Sembawang, selling close to 119 units (or c.19% of total units), which is below initial expectations. We believe this could be due to supply fatigue of ECs in the vicinity but management remains optimistic that sales will return over time once competition within the space thins out. In China and Australia, FCL achieved sales of 1.7k units and 2.9k units during FY16. Unrecognised revenues from its property division, including Frasers Property Australia totalled about S$3.1bn. Sustainable high dividend. FCL has one of the highest ROEs among property developers (c.8-11% over FY14A-15A) and dividend yield of close to 6% vs industry average ROE of close to 6% and dividend yield of c.2-3%. This is mainly due to the group’s efficient operating model of quick-asset turns for its residential development projects and its focus on a portfolio of recurring commercial properties (hotels, retail and office) which boosts returns. Golden Land acquisition to bear fruit in the medium term. The group acquired close to a 35.6% stake in Golden Land Property Development PCL (GOLD) and management believes that this acquisition offers good synergies to FCL as both companies share similar investment philosophies with an aim to continue growing its recurring income base. GOLD also offers FCL the ability to tap into the growing real estate market in Thailand, supported by favourable market fundamentals.
Revenue (FY15A-FY19F)
PBIT breakdown by divisions (FY16)
PATMI (FY15A-19F)
RNAV RNAV S$'m Surpluses from: Commercial Portfolio (Office, retail, hotels) (699) Stakes in REITs 190 Frasers Australand 519 Fee income : Hotel Mgmt 854 Fee income : REITs 373 NPV development projects 346 Total Surpluses 1,583 Add: Book NAV 8,053 Gross Development Value 9,636 less: preference shares (1,392) less: MI (3,791) Add: MI Attributable to REITs 3,827 RNAV 8,280 RNAV/share ($) 2.86 Discount 30% TP ($) 2.00
Source: Company, DBS Bank
0.0
500.0
1,000.0
1,500.0
2,000.0
2,500.0
3,000.0
3,500.0
4,000.0
2015 2016 2017F 2018F 2019F
S$'m
Development properties
31%
Commercial properties
30%
Hospitality13%
Frasers P roperty Australia
26%
-
100.0
200.0
300.0
400.0
500.0
600.0
2015 2016 2017F 2018F 2019F
S$'m
Page 116

ASIAN INSIGHTS VICKERS SECURITIES Page 3
Company Guide
Frasers Centrepoint Ltd
Balance Sheet:
Balance sheet remains strong. Debt/equity ratio is expected to remain fairly stable at between 0.8-0.9x over FY15F-17F which is within management's comfortable range. Debt maturity profile remains long at 3.0 years with an average cost of debt of 3.1%. Fixed rate percentage of its loans remains high at 81%. Share Price Drivers:
Replenishing land bank key to income sustainability. The group currently has 9.3m sq ft of development space, mainly in Australia. It is actively looking for efficient means to replenish its land bank especially in Singapore but remains selective, given the sustained high land prices seen in recent government land tenders. The ability to secure additional land bank at lower prices will mean upside to RNAVs and could re-rate the stock. Relaxation of property cooling measures in Singapore. Expectations of policy relaxation (especially cyclical measures like the Buyers’ and Sellers’ stamp duties) might improve buyers’ market sentiment and spark a revival in transaction volumes in the Singapore residential market. This is also expected to lift sentiment on property stocks, which we believe will enable FCL to close the gap between its stock price and NAV. Gains from asset recycling into its listed S-REITs to boost share price. Recycling activities are perceived positively by investors as FCL is able to free up capital by selling its matured assets to its listed REITs, which will improve the group’s balance sheet position and recycle capital to projects with higher returns. Key Risks:
Small free float. The stock has a low free float with 87.9% of the company held by major shareholders TCC Group and Thai Beverage, thus leading to low liquidity. Dependent on the outlook of Australia's real estate market, currency outlook. The group derives an estimated 30% of PBIT from Australia which is dependent on the real estate market and whose returns could be impacted by the weakening AUD/SGD exchange rate. Company Background
Frasers Centrepoint Ltd (FCL) is a one of Singapore’s main real estate companies with assets exceeding S$23bn. The group has four key core businesses focused on residential, commercial, hospitality and industrial sectors spanning 77 cities across Asia, Australasia, Europe and the Middle East.
Leverage & Asset Turnover (x)
Capital Expenditure
ROE (%)
Forward PE Band (x)
PB Band (x)
Source: Company, DBS Bank
0.0
0.0
0.0
0.1
0.1
0.1
0.1
0.1
0.2
0.2
0.2
0.00
0.20
0.40
0.60
0.80
1.00
2015A 2016A 2017F 2018F 2019F
Gross Debt to Equity (LHS) Asset Turnover (RHS)
0.0
10.0
20.0
30.0
40.0
50.0
60.0
2015A 2016A 2017F 2018F 2019F
Capital Expenditure (-)
S$m
0.0%
2.0%
4.0%
6.0%
8.0%
10.0%
2015A 2016A 2017F 2018F 2019F
Avg: 11.6x
+1sd: 12.6x
+2sd: 13.6x
‐1sd: 10.5x
‐2sd: 9.5x
8.2
9.2
10.2
11.2
12.2
13.2
14.2
Jan-14 Jan-15 Jan-16
(x)
Avg: 0.66x
+1sd: 0.8x
+2sd: 0.94x
‐1sd: 0.52x
‐2sd: 0.37x
0.2
0.3
0.4
0.5
0.6
0.7
0.8
0.9
1.0
1.1
Jan-14 Jan-15 Jan-16
(x)
Page 117

ASIAN INSIGHTS VICKERS SECURITIES Page 4
Company Guide
Frasers Centrepoint Ltd
Income Statement (S$m)
FY Sep 2015A 2016A 2017F 2018F 2019F Revenue 3,562 3,440 2,412 3,103 2,633 Cost of Goods Sold (2,479) (2,407) (1,337) (1,827) (1,440) Gross Profit 1,082 1,033 1,075 1,276 1,193 Other Opng (Exp)/Inc (257) (266) (193) (248) (184) Operating Profit 825 767 882 1,028 1,009 Other Non Opg (Exp)/Inc 0.0 0.0 0.0 0.0 0.0 Associates & JV Inc 279 171 114 70.6 44.1 Net Interest (Exp)/Inc (149) (142) (166) (212) (216) Exceptional Gain/(Loss) 241 164 0.0 0.0 0.0 Pre-tax Profit 1,197 960 830 886 836 Tax (184) (194) (141) (151) (142) Minority Interest (241) (169) (238) (257) (252) Preference Dividend (46.9) (64.5) (64.3) (64.3) (64.3) Net Profit 724 533 387 415 378 Net Profit before Except. 483 368 387 415 378 EBITDA 1,146 993 1,051 1,153 1,107 Growth Revenue Gth (%) 61.7 (3.4) (29.9) 28.6 (15.1) EBITDA Gth (%) 47.2 (13.3) 5.9 9.7 (4.0) Opg Profit Gth (%) 33.0 (7.1) 15.1 16.5 (1.9) Net Profit Gth (Pre-ex) (%) 16.6 (23.8) 5.0 7.2 (8.8) Margins & Ratio Gross Margins (%) 30.4 30.0 44.6 41.1 45.3 Opg Profit Margin (%) 23.2 22.3 36.6 33.1 38.3 Net Profit Margin (%) 20.3 15.5 16.0 13.4 14.4 ROAE (%) 11.2 8.1 5.7 6.0 5.4 ROA (%) 3.3 2.3 1.6 1.6 1.4 ROCE (%) 3.4 2.8 3.2 3.7 3.5 Div Payout Ratio (%) 34.4 46.9 64.5 60.1 65.9 Net Interest Cover (x) 5.5 5.4 5.3 4.8 4.7
Source: Company, DBS Bank
Page 118

ASIAN INSIGHTS VICKERS SECURITIES Page 5
Company Guide
Frasers Centrepoint Ltd
Quarterly / Interim Income Statement (S$m)
FY Sep 4Q2015 1Q2016 2Q2016 3Q2016 4Q2016 Revenue 1,037 672 898 682 1,188 Cost of Goods Sold (1,176) (420) (610) (453) (924) Gross Profit (138) 252 288 229 264 Other Oper. (Exp)/Inc 249 (73.8) (57.3) (85.6) 210 Operating Profit 110 178 231 143 474 Other Non Opg (Exp)/Inc 0.0 0.0 0.0 0.0 0.0 Associates & JV Inc 162 32.8 4.77 23.8 110 Net Interest (Exp)/Inc (37.8) (32.7) (37.3) (38.2) (33.9) Exceptional Gain/(Loss) 180 (1.3) 9.41 64.0 92.3 Pre-tax Profit 415 177 207 193 643 Tax (62.8) (35.6) (37.2) (29.0) (92.4) Minority Interest (92.4) (42.7) (47.0) (9.5) (69.7) Net Profit 213 98.7 123 154 481 Net profit bef Except. 32.8 100.0 114 90.0 388 EBITDA 292 241 262 192 611 Growth Revenue Gth (%) 2.7 (35.3) 33.7 (24.0) 74.2 EBITDA Gth (%) (12.3) (17.4) 8.8 (26.7) 218.4 Opg Profit Gth (%) (57.9) 61.6 29.4 (38.0) 231.7 Net Profit Gth (Pre-ex) (%) (81.9) 204.4 13.9 (20.9) 331.4 Margins Gross Margins (%) (13.3) 37.5 32.1 33.5 22.2 Opg Profit Margins (%) 10.6 26.5 25.7 21.0 39.9 Net Profit Margins (%) 20.5 14.7 13.7 22.6 40.5
Balance Sheet (S$m)
FY Sep 2015A 2016A 2017F 2018F 2019F Net Fixed Assets 1,991 1,972 1,919 1,867 1,814 Invts in Associates & JVs 585 793 907 978 1,022 Other LT Assets 14,150 14,467 14,615 14,764 14,912 Cash & ST Invts 1,393 2,169 576 633 455 Inventory 7.47 5.68 2.12 2.93 2.29 Debtors 844 678 345 443 376 Other Current Assets 4,096 4,120 6,961 8,088 8,721 Total Assets 23,067 24,204 25,326 26,774 27,302 ST Debt 1,020 1,470 1,470 1,470 1,470 Creditor 1,315 1,695 2,137 2,954 2,310 Other Current Liab 218 284 188 198 189 LT Debt 9,255 8,325 8,725 8,925 9,725 Other LT Liabilities 608 586 586 586 586 Shareholder’s Equity 7,803 8,053 8,190 8,356 8,485 Minority Interests 2,848 3,791 4,028 4,285 4,537 Total Cap. & Liab. 23,067 24,204 25,326 26,774 27,302 Non-Cash Wkg. Capital 3,415 2,825 4,983 5,383 6,601 Net Cash/(Debt) (8,882) (7,627) (9,620) (9,763) (10,740) Debtors Turn (avg days) 84.8 80.7 77.4 46.3 56.8 Creditors Turn (avg days) 196.8 263.0 608.3 608.3 608.3 Inventory Turn (avg days) 1.1 0.9 0.6 0.6 0.6 Asset Turnover (x) 0.2 0.1 0.1 0.1 0.1 Current Ratio (x) 2.5 2.0 2.1 2.0 2.4 Quick Ratio (x) 0.9 0.8 0.2 0.2 0.2 Net Debt/Equity (X) 0.8 0.6 0.8 0.8 0.8 Net Debt/Equity ex MI (X) 1.1 0.9 1.2 1.2 1.3 Capex to Debt (%) 0.4 (0.5) 0.0 0.0 0.0
Source: Company, DBS Bank
Gearing to remain stable at 0.8x
Page 119

ASIAN INSIGHTS VICKERS SECURITIES Page 6
Company Guide
Frasers Centrepoint Ltd
Cash Flow Statement (S$m)
FY Sep 2015A 2016A 2017F 2018F 2019F Pre-Tax Profit 955 766 830 886 836 Dep. & Amort. 781 54.5 54.5 54.5 54.5 Tax Paid (184) (194) (237) (141) (151) Assoc. & JV Inc/(loss) (279) (171) (114) (70.6) (44.1) Chg in Wkg.Cap. 302 344 (2,063) (409) (1,210) Other Operating CF (891) 298 0.0 0.0 0.0 Net Operating CF 684 1,097 (1,529) 320 (514) Capital Exp.(net) (45.3) 50.6 0.0 0.0 0.0 Other Invts.(net) (1,501) (264) (150) (150) (150) Invts in Assoc. & JV (57.9) (317) 0.0 0.0 0.0 Div from Assoc & JV 350 197 0.0 0.0 0.0 Other Investing CF (146) (389) 0.0 0.0 0.0 Net Investing CF (1,401) (722) (150) (150) (150) Div Paid (249) (456) (249) (249) (249) Chg in Gross Debt 936 (940) 400 200 800 Capital Issues 649 1,000 0.0 0.0 0.0 Other Financing CF (111) 340 (64.3) (64.3) (64.3) Net Financing CF 1,225 (56.2) 86.3 (114) 486 Currency Adjustments (8.4) 39.1 0.0 0.0 0.0 Chg in Cash 500 358 (1,593) 56.5 (177) Opg CFPS (S cts) 13.2 26.0 18.4 25.1 24.0 Free CFPS (S cts) 22.1 39.6 (52.7) 11.0 (17.7)
Source: Company, DBS Bank
Target Price & Ratings History
Source: DBS Bank
Analyst: Rachel TAN
Derek TAN
S.No.Date of Report
Closing Price
12-mth Target Price
Rat ing
1: 08 Jan 16 1.65 2.05 BUY
2: 18 Jan 16 1.60 2.05 BUY
3: 04 Feb 16 1.60 2.05 BUY
4: 16 Feb 16 1.58 2.05 BUY
5: 16 Mar 16 1.58 2.05 BUY
6: 05 Apr 16 1.65 2.05 BUY
7: 18 Apr 16 1.69 2.05 BUY
8: 11 May 16 1.67 2.05 BUY
9: 08 Aug 16 1.53 1.90 BUY
10: 30 Sep 16 1.49 1.90 BUY
11: 18 Oct 16 1.50 1.90 BUY12: 10 Nov 16 1.53 2.00 BUY
Note : Share price and Target price are adjusted for corporate actions.
1 2
3
4
5
67
8
910
11
12
1.39
1.44
1.49
1.54
1.59
1.64
1.69
1.74
Jan-16 May-16 Sep-16 Jan-17
S$
Page 120

ASIAN INSIGHTS VICKERS SECURITIES ed: TH / sa: YM, PY
BUY Last Traded Price ( 4 Jan 2017): S$2.24 (STI : 2,921.31) Price Target 12-mth: S$2.47 (10% upside) Potential Catalyst: Better-than-expected results Where we differ: More positive than consensus in the medium-term Analyst Rachel TAN +65 6682 3713 [email protected] Derek TAN +65 6682 3716 [email protected]
Price Relative
Forecasts and Valuation FY Mar (US$ m) 2016A 2017F 2018F 2019F Revenue 777 851 946 1,029 EBITDA 735 615 688 746 Pre-tax Profit 1,343 473 540 592 Net Profit 690 269 311 341 Net Pft (Pre Ex.) (30.0) 269 311 341 Net Pft Gth (Pre-ex) (%) nm nm 15.6 9.6 EPS (S cts) 20.8 8.10 9.36 10.3 EPS Pre Ex. (S cts) (0.9) 8.10 9.36 10.3 EPS Gth Pre Ex (%) nm nm 16 10 Diluted EPS (S cts) 20.8 8.10 9.36 10.3 Net DPS (S cts) 6.25 6.98 8.07 8.84 BV Per Share (S cts) 250 253 256 260 PE (X) 10.7 27.4 23.7 21.6 PE Pre Ex. (X) nm 27.4 23.7 21.6 P/Cash Flow (X) 17.6 nm 14.5 14.1 EV/EBITDA (X) 21.7 27.8 25.5 24.4 Net Div Yield (%) 2.8 3.1 3.6 4.0 P/Book Value (X) 0.9 0.9 0.9 0.9 Net Debt/Equity (X) 0.3 0.4 0.4 0.4 ROAE (%) 8.4 3.2 3.7 4.0 Earnings Rev (%): - - - Consensus EPS (S cts): 7.4 8.2 9.3 Other Broker Recs: B: 10 S: 2 H: 4
Source of all data on this page: Company, DBS Bank, Bloomberg Finance L.P
In pursuit of growth Value at current prices. We maintain BUY on Global Logistics Properties (GLP) with TP of S$2.47, pegged at 30% discount to RNAV to reflect ongoing uncertainties in the operating environment. Trading at 0.9x P/BV, below the lower end of historical range, we believe the cautious outlook is priced in. 1H17 results driven by higher rental income, management fees and development completions; core results in line. Core 1H17 net profit (excluding revaluation gains and one-off items) grew 36% y-o-y to S$137m, in line with street’s FY17 estimates, led by higher rental income mainly from Japan (+21%) and US (+67%) and higher management fees from Japan (+47%) and US (+165%). In 1H17, GLP recorded development profit of US$128m at 30% margin (vs 27% in FY16), achieving 64% (ahead) of its full-year target of US$200m. GLP achieved 42% and 46% of its development starts and completion targets respectively. Management has turned positive on Brazil, and cautiously positive on China, while Japan and US continue to show strong demand. AUM of fund management platform rose to US$38bn. As at 1H17, total AUM had risen to US$38bn, and the group has another US$12bn of uncalled capital, expected to be deployed in the next two years. Given that this business is a highly scalable and an ROE-enhancing business arm of the group, management is focusing on driving returns and operational scale by establishing new funds. Valuation:
We maintain our BUY call and target price of S$2.47, pegged at a 30% discount to RNAV. Despite a weaker outlook, we believe the current share price, which is at 0.9x P/BV, below the lower end of historical range, is attractive. Key Risks to Our View:
Faster-than-expected ramp-up in competing supply on the back of a slowdown in China's retail sector would impact demand for logistics warehouses. At A Glance Issued Capital (m shrs) 4,687 Mkt. Cap (S$m/US$m) 10,499 / 7,292 Major Shareholders (%) GIC Pte Ltd 36.9 Hillhouse Capital 8.2 Blackrock 6.0
Free Float (%) 43.5 3m Avg. Daily Val (US$m) 28.3 ICB Industry : Real Estate / Real Estate
DBS Group Research . Equity 4 Jan 2017
Singapore Company Guide
Global Logistic Properties Version 7 | Bloomberg: GLP SP | Reuters: GLPL.SI Refer to important disclosures at the end of this report
Page 121

ASIAN INSIGHTS VICKERS SECURITIES Page 2
Company Guide
Global Logistic Properties
CRITICAL DATA POINTS TO WATCH
Earnings Drivers:
Riding on the growing demand from e-commerce players for logistics space. Riding on the tailwinds of China’s rising consumerism and thriving e-commerce sector, Global Logistics Properties (GLP) remains in the front seat to take advantage of China’s rapidly changing retail landscape. With an extensive portfolio of warehouses (11.8m sqm of space) in 35 cities in China, the group is one of the leading providers of modern logistics solutions to end-users. GLP’s network of warehouses enables customers to expand; this has been positively received by current users of its space. Its strong network of warehouses enables management to enjoy recurring demand from existing clients. Close to 90% of GLP’s portfolio is occupied by businesses geared towards domestic consumption. Strong operational momentum across markets. As expected, FY16 recorded a strong year largely led by positive effective rent growth on renewal and same-property net operating income. The group’s lease ratio remains relatively stable at 92% with WALE of 2.6-5.5 years. While management has turned cautious on China and Japan, hence reducing development targets, the US market appears to have strong growth potential. Fund management platform delivers superior returns at lower risk. GLP’s fund management platform delivers superior returns at lower risk. Management fees increased 80% to US$130m in FY16 and this segment is expected to potentially earn US$400m in the medium term. As of end-March 2016, total AUM had risen to US$35bn, with another US$11bn of uncalled capital to be deployed. We expect the fund management business to continue growing through new funds due to its scalable nature, boosting returns and ROEs for the group. Going forward, the group is looking to launch a new China fund with equity capital of c.US$3bn to increase its reach in China. Development starts and completion pipeline. In FY17, GLP has set lower targets for development starts and completions of US$2.1bn (vs US$2.8bn in FY16) and US$1.5bn (vs US$2.1bn in FY16) respectively as management turns cautious. Nevertheless, value creation margin at 27% remains above historical average of 25%. Deepening presence in US. We are positive on GLP’s announcement of a US$1.1bn (at valuation) logistics portfolio in the US from Hillwood, a property developer. The acquisition will be in various tranches – initial closing of US$700m is fully leased and income producing by end of December 2016 and the remaining US$400m, when the target properties under development complete and achieve pre-agreed lease ratios. GLP intends to pare down its effective stake in this portfolio to 10% upon syndication to third-party capital partners. Assets are located in key markets of Dallas, Chicago and Atlanta, which according to Colliers, have one of the brightest outlooks for absorption and rental growth in the US.
Top line and EIBT (US’m)
Revenue Breakdown by segment (US$’m)
EBIT Margins (%)
RNAV
Source: Company, DBS Bank
0.0
100.0
200.0
300.0
400.0
500.0
600.0
700.0
800.0
900.0
1,000.0
FY15A FY16A FY17F FY18F
US
$'m
n
Revenue Operating profit (ex reval)
-
200.0
400.0
600.0
800.0
1,000.0
1,200.0
FY15A FY16A FY17F FY18F FY19F
US
$'m
n
China Japan US & Brazil
45.0
47.0
49.0
51.0
53.0
55.0
57.0
59.0
FY15A FY16A FY17F FY18F FY19F
EB
IT M
argi
ns (%
)
Valuation of GLP S$'m
Japan Logistics Business (Stabalized) 2,173.8
China Logistics Business (Stabalized) 4,953.7
China Landbank (NPB of future devt) 3,815.0
Other Assets 58.1
GLP J-REIT 413.5
Brazil 523.1
USA 337.0
Fee income business (15x P/E) 1,054.4
Gross Asset Value 13,296
Less: Estimated net debt -660.57
RNAV 12,668
RNAV/ share (US$) 2.62
RNAV/ share (S$) 3.53
Discount 30%
Target Price 2.47
Page 122

ASIAN INSIGHTS VICKERS SECURITIES Page 3
Company Guide
Global Logistic Properties
Balance Sheet:
Low leverage ratio. Total debt-to-asset ratio is expected to remain fairly stable at c.0.40x, which is well within management's comfortable level. As such, this provides GLP with additional debt headroom for future debt-funded acquisitions. Currently, the group has 70% of its debt on fixed rate with a weighted average cost of debt of 3.0% and a long debt maturity of 5.2 years. Share Price Drivers:
Robust outlook for e-commerce in China. GLP has a large (11.8m sqm in completed properties) portfolio in China that is positioned strategically to benefit from growth in e-commerce through its modern logistics space, and it has another US$5.3bn slated for completion in FY17-19. We expect the group’s assets to hit higher occupancies and pricier leases, if e-commerce increases in scale (8-year CAGR was 80%) on the back of strong consumer demand (11-year CAGR was 63%, expected to double over the next three years). Incremental earnings contribution from China would be a share price catalyst. Realisation of value through its fund business. GLP continues to expand through its fund platform. Looking ahead, the potential conversion of its development funds in China and Japan into income funds could unlock performance fees, offering upside to the earnings that are currently not in our estimates. Additionally, GLP continues to look for opportunities in the US and potentially Europe to expand its fund management business. Key Risks:
Slowdown in Chinese economy If a slowdown in the Chinese economy leads to a reduced appetite for logistics warehouse space, there could be slower-than-projected revenue growth. Foreign currency risks Exposure to various currencies (CNY, JPY, BRL) could lead to volatility in the group's USD earnings. Company Background
Global Logistics Properties (GLP) is a leading provider of modern logistics facilities in China, Japan, Brazil and the US. The group develops, owns and manages c.41m sqm GFA of logistics properties, catering to growing domestic consumption.
Leverage & Asset Turnover (x)
Capital Expenditure
ROE (%)
PB Band (x)
Source: Company, DBS Bank
0.0
200.0
400.0
600.0
800.0
1,000.0
1,200.0
1,400.0
1,600.0
2015A 2016A 2017F 2018F 2019F
Capital Expenditure (-)
US$m
Page 123

ASIAN INSIGHTS VICKERS SECURITIES Page 4
Company Guide
Global Logistic Properties
Income Statement (US$m)
FY Mar 2015A 2016A 2017F 2018F 2019F Revenue 708 777 851 946 1,029 Cost of Goods Sold (139) (157) (137) (173) (204) Gross Profit 570 620 714 773 825 Other Opng (Exp)/Inc (165) (229) (241) (245) (250) Operating Profit 405 392 473 527 575 Other Non Opg (Exp)/Inc 0.0 91.1 23.6 25.4 26.6 Associates & JV Inc 71.4 241 107 124 133 Net Interest (Exp)/Inc (47.9) (101) (130) (136) (143) Exceptional Gain/(Loss) 434 720 0.0 0.0 0.0 Pre-tax Profit 862 1,343 473 540 592 Tax (194) (310) (50.3) (56.8) (62.6) Minority Interest (182) (314) (125) (144) (160) Preference Dividend (32.0) (28.7) (28.7) (28.7) (28.7) Net Profit 454 690 269 311 341 Net Profit before Except. 201 (30.0) 269 311 341 EBITDA 488 735 615 688 746 Growth Revenue Gth (%) 13.3 9.8 9.4 11.2 8.8 EBITDA Gth (%) (4.4) 50.7 (16.3) 11.9 8.4 Opg Profit Gth (%) 6.0 (3.2) 20.8 11.5 9.0 Net Profit Gth (Pre-ex) (%) (18.6) nm nm 15.6 9.6 Margins & Ratio Gross Margins (%) 80.4 79.8 83.9 81.7 80.2 Opg Profit Margin (%) 57.2 50.4 55.6 55.8 55.8 Net Profit Margin (%) 64.2 88.8 31.6 32.9 33.1 ROAE (%) 5.6 8.4 3.2 3.7 4.0 ROA (%) 2.9 3.4 1.2 1.3 1.4 ROCE (%) 2.1 1.7 2.2 2.4 2.5 Div Payout Ratio (%) 41.7 30.1 86.2 86.2 86.2 Net Interest Cover (x) 8.4 3.9 3.6 3.9 4.0
Source: Company, DBS Bank
Top line driven mainly by development completions in China, supported by stable occupancy rates in Japan. In addition, top line is driven from increased fund management fees in US and Brazil
Page 124

ASIAN INSIGHTS VICKERS SECURITIES Page 5
Company Guide
Global Logistic Properties
Quarterly / Interim Income Statement (US$m)
FY Mar 2Q2016 3Q2016 4Q2016 1Q2017 2Q2017 Revenue 189 199 199 207 214 Cost of Goods Sold (38.9) (39.2) (41.3) (38.2) (37.5) Gross Profit 150 160 158 168 176 Other Oper. (Exp)/Inc (62.1) (57.3) (78.3) (54.3) (56.2) Operating Profit 88.3 102 79.6 114 120 Other Non Opg (Exp)/Inc 17.1 55.8 (0.4) 7.86 3.03 Associates & JV Inc 34.3 48.5 38.9 57.3 70.7 Net Interest (Exp)/Inc (20.8) (44.7) (39.6) (70.0) (29.5) Exceptional Gain/(Loss) 110 202 214 208 117 Pre-tax Profit 229 364 292 317 281 Tax (52.9) (94.6) (82.7) (67.0) (60.6) Minority Interest (62.3) (84.9) (78.1) (47.2) (47.8) Net Profit 114 184 131 203 173 Net profit bef Except. 3.79 (17.4) (82.2) (5.0) 55.9 EBITDA 91.3 105 82.6 114 120 Growth Revenue Gth (%) (0.4) 5.1 0.1 3.7 3.4 EBITDA Gth (%) (11.2) 15.2 (21.6) 38.2 5.2 Opg Profit Gth (%) (11.6) 15.9 (22.3) 43.4 5.2 Net Profit Gth (Pre-ex) (%) (89.8) nm (371.6) 93.9 nm Margins Gross Margins (%) 79.5 80.3 79.3 81.5 82.4 Opg Profit Margins (%) 46.7 51.5 40.0 55.2 56.2 Net Profit Margins (%) 60.2 92.6 65.9 98.2 81.0
Balance Sheet (US$m)
FY Mar 2015A 2016A 2017F 2018F 2019F Net Fixed Assets 52.2 52.9 52.9 52.9 52.9 Invts in Associates & JVs 1,544 1,954 2,485 3,034 3,592 Other LT Assets 12,479 14,656 14,856 15,053 15,368 Cash & ST Invts 1,446 1,025 350 301 112 Inventory 0.0 0.0 0.0 0.0 0.0 Debtors 475 548 709 788 858 Other Current Assets 1,467 4,895 4,895 4,895 4,895 Total Assets 17,462 23,129 23,348 24,124 24,878 ST Debt 371 1,021 1,021 1,021 1,021 Creditor 811 1,026 724 933 1,111 Other Current Liab 21.9 2,965 2,962 2,968 2,974 LT Debt 2,476 3,750 4,050 4,350 4,650 Other LT Liabilities 1,019 1,208 1,208 1,208 1,208 Shareholder’s Equity 8,780 8,888 8,987 9,103 9,214 Minority Interests 3,983 4,272 4,398 4,541 4,701 Total Cap. & Liab. 17,462 23,129 23,348 24,124 24,878 Non-Cash Wkg. Capital 1,109 1,451 1,917 1,782 1,667 Net Cash/(Debt) (1,402) (3,746) (4,720) (5,070) (5,558) Debtors Turn (avg days) 227.0 240.1 269.6 288.8 291.9 Creditors Turn (avg days) 2,092.7 2,307.7 2,547.5 1,872.9 1,939.8 Inventory Turn (avg days) N/A N/A N/A N/A N/A Asset Turnover (x) 0.0 0.0 0.0 0.0 0.0 Current Ratio (x) 2.8 1.3 1.3 1.2 1.1 Quick Ratio (x) 1.6 0.3 0.2 0.2 0.2 Net Debt/Equity (X) 0.1 0.3 0.4 0.4 0.4 Net Debt/Equity ex MI (X) 0.2 0.4 0.5 0.6 0.6 Capex to Debt (%) 53.5 0.2 4.0 3.7 5.6 Z-Score (X) 0.0 0.8 0.8 0.8 0.7
Source: Company, DBS Bank
Gearing (D/E) to remain conservative at 0.4x
Page 125

ASIAN INSIGHTS VICKERS SECURITIES Page 6
Company Guide
Global Logistic Properties
Cash Flow Statement (US$m)
FY Mar 2015A 2016A 2017F 2018F 2019F Pre-Tax Profit 862 1,343 473 540 592 Dep. & Amort. 11.6 11.8 11.8 11.8 11.8 Tax Paid (28.5) (31.5) (53.5) (50.3) (56.8) Assoc. & JV Inc/(loss) (71.4) (241) (107) (124) (133) Chg in Wkg.Cap. 45.5 27.3 (463) 129 109 Other Operating CF (375) (691) 0.0 0.0 0.0 Net Operating CF 444 418 (138) 507 522 Capital Exp.(net) (1,523) (8.0) (204) (200) (318) Other Invts.(net) (1,467) 212 0.0 0.0 0.0 Invts in Assoc. & JV (422) (472) (425) (425) (425) Div from Assoc & JV 12.9 2.77 0.0 0.0 0.0 Other Investing CF (10.5) (4,672) 0.0 0.0 0.0 Net Investing CF (3,409) (4,937) (629) (625) (743) Div Paid (174) (200) (208) (232) (268) Chg in Gross Debt 687 1,964 300 300 300 Capital Issues 159 0.0 0.0 0.0 0.0 Other Financing CF 2,246 2,525 0.0 0.0 0.0 Net Financing CF 2,918 4,289 92.4 68.3 32.2 Currency Adjustments 0.0 0.0 0.0 0.0 0.0 Chg in Cash (47.0) (230) (674) (49.6) (188) Opg CFPS (S cts) 11.8 11.8 9.78 11.4 12.5 Free CFPS (S cts) (31.8) 12.4 (10.3) 9.25 6.16
Source: Company, DBS Bank
Target Price & Ratings History
Source: DBS Bank
Analyst: Rachel TAN, Derek TAN
Page 126

ASIAN INSIGHTS VICKERS SECURITIES ed: JS / sa: JC, PY
BUY Last Traded Price (4 Jan 2017): S$6.12 (STI : 2,921.31)
Price Target 12-mth: S$7.20 (18% upside)
Potential Catalyst: Strong pre-sales for residential projects
Where we differ: Earnings generally more conservative vs peers Analyst Derek TAN +65 6682 3716 [email protected] Rachel TAN +65 6682 3713 [email protected]
Price Relative
Forecasts and Valuation FY Dec (S$ m) 2015A 2016F 2017F 2018F
Revenue 1,279 1,228 1,324 1,410 EBITDA 514 567 601 618 Pre-tax Profit 460 424 453 470 Net Profit 391 355 372 386 Net Pft (Pre Ex.) 343 355 372 386 Net Pft Gth (Pre-ex) (%) (5.9) 3.6 4.8 3.6 EPS (S cts) 49.2 44.6 46.7 48.4 EPS Pre Ex. (S cts) 43.0 44.6 46.7 48.4 EPS Gth Pre Ex (%) (7) 4 5 4 Diluted EPS (S cts) 49.2 44.6 46.7 48.4 Net DPS (S cts) 15.0 15.0 15.0 15.0 BV Per Share (S cts) 991 1,021 1,053 1,086 PE (X) 12.5 13.7 13.1 12.6 PE Pre Ex. (X) 14.2 13.7 13.1 12.6 P/Cash Flow (X) 9.4 28.7 13.8 13.4 EV/EBITDA (X) 14.8 13.9 13.0 12.4 Net Div Yield (%) 2.5 2.5 2.5 2.5 P/Book Value (X) 0.6 0.6 0.6 0.6 Net Debt/Equity (X) 0.3 0.3 0.3 0.2 ROAE (%) 5.0 4.4 4.5 4.5 Earnings Rev (%): 0 0 0 Consensus EPS (S cts): 47.6 47.8 46.6 Other Broker Recs: B: 9 S: 0 H: 3
Source of all data on this page: Company, DBS Bank, Bloomberg Finance L.P
Diversification is key to sustainability Potential headwinds ahead; but valuations still attractive. Despite the weak operating outlook and potential headwinds, we maintain our BUY rating on UOL Group (UOL) based on its attractive valuations of c.0.6x P/NAV, which is below the low end of its historical range, making it one of the cheapest large cap landlords in Singapore. 3Q16 results in line; outlook improves. UOL’s 3Q16 net profit fell 14% y-o-y to S$87.1m, mainly due to lower contribution from JVs. However, the Group’s recent purchases in London should add to its recurring income stream and improve earnings visibility. Key positives from the results are: i) 11% revenue growth from all divisions, and ii) rental reversions were generally positive for its office and retail properties with stable occupancy rates remained stable. However, RevPAR for most of its hotels in all markets were marginally lower except for hotels in Australia. New launches in 2H16/2017. Management saw good take-up for its recent Park Eleven project in Shangai, selling 131 out of 168 units and there will be subsequent launches in phases in 2017. In addition, UOL is positioning to launch The Clement Canopy (1Q17; 505 units), and Bishopsgate, London (160 units). The purchase of a recent enbloc site at Potong Pasir Ave 1 will be finalised soon, the project is planned for launch in 2018. Valuation:
Maintain BUY on attractive valuations. Our TP of S$7.20 is
pegged to a 30% discount to our RNAV of S$10.23.
Key Risks to Our View:
Economic slowdown. The downside risk to our projections is if
residential sales are slower than our projections or if
commercial properties and hotels operations are impacted by
slower-than-projected growth in rental/room rates. At A Glance
Issued Capital (m shrs) 805
Mkt. Cap (S$m/US$m) 4,924 / 3,448
Major Shareholders (%)
CY Wee & Co Pte Ltd 13.9
Wee Investment Pte Ltd 13.4
United Overseas Bank 7.5
Free Float (%) 59.8
3m Avg. Daily Val (US$m) 3.7
ICB Industry : Real Estate / Real Estate
DBS Group Research . Equity
4 Jan 2017
Singapore Company Guide
UOL Group Version 6 | Bloomberg: UOL SP | Reuters: UTOS.SI Refer to important disclosures at the end of this report
89
109
129
149
169
189
209
4.7
5.2
5.7
6.2
6.7
7.2
7.7
8.2
8.7
Jan-13 Jan-14 Jan-15 Jan-16 Jan-17
Relative IndexS$
UOL Group (LHS) Relative STI (RHS)
Page 127

ASIAN INSIGHTS VICKERS SECURITIES
Page 2
Company Guide
UOL Group
CRITICAL DATA POINTS TO WATCH
Earnings Drivers:
Retail and office sub-segments to offer stable returns. UOL
Group Limited (UOL) derives a significant 47%-58% of its
revenues from retail, office and hotel segments which should
continue delivering stable cashflows in the coming years.
While we see headwinds in both the retail and office segments
ahead, we believe that the positioning and location of UOL’s
portfolio of commercial properties mainly along the fringe areas
of the CBD will result in lower volatility in rents. Thus,
operational performance is likely to remain stable going
forward.
Its retail malls - United Square and Novena Square - are located
in the Novena area, close to the emerging medical hub. The
malls have formed a niche, which should result in high tenant
stickiness. This is especially so for United Square, which houses
tenants well known for providing various children’s education
programs. On the other hand, Novena Square’s tenant mix
mainly caters to necessity shopping and the needs of the
vicinity’s growth as a medical hub.
Hotel performance – weakness in Asia; overall outlook stable.
Growth will be driven by the addition of close to 1,582 rooms
(6 hotels), implying 16% growth in total rooms under
management. Performances from hotels and serviced residences
are expected to remain mixed. We expect the operational
performance of the group’s hotels & residences in Singapore
and Malaysia to be weak, but partially offset by a better
performance from its hotels in Australia. We project portfolio
RevPAR to remain fairly flattish.
Presales for residential projects doing well amid muted
residential outlook. Despite tepid residential transactions year-
to-date, UOL’s projects have continued to do fairly well. As at
Sep 2016, the Group has substantially sold most of its projects
that are completed or currently under development and its
latest project - Principal Garden - has seen good take-up rate of
50% (vs 33.5% last quarter). Park Eleven in Shanghai had a
private launch in 3Q2016 and sold 131units out of the 168
units approved for sale. Looking ahead, UOL will launch further
phases of Park Eleven in Shanghai, The Clement Canopy in
Singapore and its London project in 2017.
The 555-unit Riverbank @ Fernvale (78.2% sold as at Sep 2016),
and 797-unit Botanique at Bartley (95.9% sell-through rate)
have sold well. Despite the low sales take-up rate, Principal
Garden recorded steady sales and is now 43.4% sold. We view
this as a testament of the Group’s ability to design residential
projects that are well liked and attractively priced.
Revenue (S$’m)
PATMI (S$’m)
Operating Margins (%)
RNAV (S$’m) Breakdown of RNAV Properties OMV ($m) Investment Properties 2,950.8 less book value -4,137.0 Surplus/deficit -1,186.2 NPV of devt profits 390.6 Mark to TP value of quoted holdings Listed equities/Strategic Holdings 3,145.9 Hotel operations 2,219.8 Total 5,365.7 less book value -4,367.4 Surplus 998.3 Book NAV 7,894.2 RNAV 8,096.8 Total Shares 787.0 RNAV/share ($) 10.29 Discount 30% Price Target ($) 7.20
Source: Company, DBS Bank
0.0
200.0
400.0
600.0
800.0
1,000.0
1,200.0
1,400.0
1,600.0
15 16F 17F 18F
S$'m
Investments Management ServicesHotel Operations Property InvestmentsProperty Development
330.0
340.0
350.0
360.0
370.0
380.0
390.0
400.0
15 16F 17F 18F
S$'m
0.0%
5.0%
10.0%
15.0%
20.0%
25.0%
30.0%
35.0%
FY13 FY14 FY15F FY16F FY17F
Page 128

ASIAN INSIGHTS VICKERS SECURITIES
Page 3
Company Guide
UOL Group
Balance Sheet:
Balance sheet remains strong. Debt to equity ratio is expected
to remain stable at 0.3x to 0.4x from FY16F-FY18F. This leaves
UOL with sufficient headroom to acquire projects / new land
when such opportunities come by.
Share Price Drivers:
Replenishing land bank key to income sustainability. The Group
turns around its projects quickly and has little land bank on its
balance sheet. UOL has always been active in land tenders to
replenish its land bank especially in Singapore but remains
selective given the high competitive environment seen in recent
government land tenders. The ability to secure additional land
bank at lower prices will mean upside to RNAVs and this could
re-rate the stock.
Relaxation of property cooling measures in Singapore.
Expectations of policy relaxation (especially cyclical measures like
the buyers’ and sellers’ stamp duties) may improve market
sentiment and spark a revival in transacted volumes in the
Singapore residential market. This would also lift sentiment on
property stocks, which should enable UOL to close the gap
between its stock price and its NAV.
Deep value from its hotel business. We believe that deep value
lies in the group’s portfolio of well located hotels and serviced
residences in Singapore, Malaysia and Australia. These hotels
are held on a historical cost basis, which we believe are
conservative compared to potential realisable value. We
estimate potential upside of more than S$1bn if these
properties are valued on marked-to-market basis.
Key Risks:
Economic slowdown. The downside risk to our projections is if
residential sales are slower than projected or if its hotel
operations are impacted by slower-than-projected RevPAR
performance. The upside risks to our view and target price
would be higher-than-expected selling prices or upgrades to
the target prices of its listed investment holdings.
Company Background
With a track record of nearly 50 years, UOL Group's impressive
list of property development projects includes best-selling
residential units, office towers, shopping centres, hotels and
serviced suites.
Leverage & Asset Turnover (x)
Capital Expenditure
ROE (%)
Forward PE Band (x)
PB Band (x)
Source: Company, DBS Bank
0.1
0.1
0.1
0.1
0.1
0.2
0.2
0.2
0.2
0.2
0.2
0.00
0.05
0.10
0.15
0.20
0.25
0.30
0.35
0.40
0.45
2014A 2015A 2016F 2017F 2018F
Gross Debt to Equity (LHS) Asset Turnover (RHS)
0.0
50.0
100.0
150.0
200.0
250.0
300.0
2014A 2015A 2016F 2017F 2018F
Capital Expenditure (-)
S$m
0.0%
1.0%
2.0%
3.0%
4.0%
5.0%
6.0%
7.0%
8.0%
9.0%
2014A 2015A 2016F 2017F 2018F
Avg: 14.8x
+1sd: 16.7x
+2sd: 18.7x
-1sd: 12.8x
-2sd: 10.8x
9.7
11.7
13.7
15.7
17.7
19.7
Jan-13 Jan-14 Jan-15 Jan-16
(x)
Avg: 0.69x
+1sd: 0.77x
+2sd: 0.86x
-1sd: 0.6x
-2sd: 0.51x
0.4
0.5
0.6
0.7
0.8
0.9
1.0
Jan-13 Jan-14 Jan-15 Jan-16
(x)
Page 129

ASIAN INSIGHTS VICKERS SECURITIES
Page 4
Company Guide
UOL Group
Segmental Breakdown
FY Dec 2014A 2015A 2016F 2017F 2018F Revenues (S$m)
Property Development 676 578 595 675 754
Property Investment 198 219 200 214 218
Hotel Operations 438 419 369 371 374
Investments 20.3 42.3 42.3 42.3 42.3
Others 28.8 20.2 20.8 21.4 22.0
Total 1,361 1,279 1,228 1,324 1,410
Income Statement (S$m)
FY Dec 2014A 2015A 2016F 2017F 2018F
Revenue 1,361 1,279 1,228 1,324 1,410
Cost of Goods Sold (780) (775) (782) (839) (904)
Gross Profit 581 504 446 485 506
Other Opng (Exp)/Inc (209) (231) (184) (199) (211)
Operating Profit 372 273 261 287 295
Other Non Opg (Exp)/Inc 13.4 18.4 18.4 18.4 18.4
Associates & JV Inc 158 156 220 229 238
Net Interest (Exp)/Inc (28.5) (35.6) (74.9) (81.6) (81.1)
Exceptional Gain/(Loss) 322 48.8 0.0 0.0 0.0
Pre-tax Profit 837 460 424 453 470
Tax (76.7) (47.2) (50.9) (54.3) (56.4)
Minority Interest (74.3) (21.8) (18.5) (26.2) (28.2)
Preference Dividend 0.0 0.0 0.0 0.0 0.0
Net Profit 686 391 355 372 386
Net Profit before Except. 364 343 355 372 386
EBITDA 604 514 567 601 618
Growth
Revenue Gth (%) 28.5 (6.0) (4.0) 7.8 6.5
EBITDA Gth (%) 15.1 (14.8) 10.1 6.1 2.8
Opg Profit Gth (%) 10.1 (26.6) (4.3) 9.6 2.8
Net Profit Gth (Pre-ex) (%) 39.5 (5.9) 3.6 4.8 3.6
Margins & Ratio
Gross Margins (%) 42.7 39.4 36.3 36.6 35.9
Opg Profit Margin (%) 27.3 21.4 21.3 21.6 20.9
Net Profit Margin (%) 50.4 30.6 28.9 28.1 27.3
ROAE (%) 9.5 5.0 4.4 4.5 4.5
ROA (%) 6.2 3.4 3.0 3.1 3.1
ROCE (%) 3.2 2.2 2.0 2.1 2.1
Div Payout Ratio (%) 17.2 30.5 33.6 32.1 31.0
Net Interest Cover (x) 13.0 7.7 3.5 3.5 3.6
Source: Company, DBS Bank
Pre-sales of residential units to add to earnings.
Page 130

ASIAN INSIGHTS VICKERS SECURITIES
Page 5
Company Guide
UOL Group
Quarterly / Interim Income Statement (S$m)
FY Dec 3Q2015 4Q2015 1Q2016 2Q2016 3Q2016
Revenue 354 344 330 364 393
Cost of Goods Sold (217) (221) (216) (238) (263)
Gross Profit 137 123 114 125 130
Other Oper. (Exp)/Inc (52.2) (56.2) (55.0) (55.2) (56.5)
Operating Profit 84.5 67.1 59.0 70.2 73.7
Other Non Opg (Exp)/Inc (2.4) (2.4) 5.33 3.86 6.75
Associates & JV Inc 44.8 36.8 34.1 38.1 29.1
Net Interest (Exp)/Inc (11.3) (9.8) (4.8) (6.3) (5.7)
Exceptional Gain/(Loss) 2.89 (15.1) 0.17 (26.5) 0.0
Pre-tax Profit 118 76.6 93.7 79.3 104
Tax (13.7) (10.5) (12.4) (10.7) (12.3)
Minority Interest (4.0) (2.3) (4.3) 0.19 (4.4)
Net Profit 101 63.8 77.1 68.8 87.1
Net profit bef Except. 97.9 79.0 76.9 95.3 87.1
EBITDA 144 123 115 128 123
Growth
Revenue Gth (%) 3.4 (2.7) (4.1) 10.1 8.2
EBITDA Gth (%) 7.2 (14.8) (6.3) 11.7 (4.3)
Opg Profit Gth (%) (0.4) (20.5) (12.1) 18.9 5.1
Net Profit Gth (Pre-ex) (%) 6.2 (19.4) (2.6) 23.9 (8.5)
Margins
Gross Margins (%) 38.6 35.8 34.5 34.5 33.1
Opg Profit Margins (%) 23.9 19.5 17.9 19.3 18.7
Net Profit Margins (%) 28.5 18.5 23.3 18.9 22.1
Balance Sheet (S$m)
FY Dec 2014A 2015A 2016F 2017F 2018F Net Fixed Assets 1,241 1,179 1,384 1,517 1,500
Invts in Associates & JVs 3,162 3,366 3,586 3,815 4,053
Other LT Assets 4,528 4,981 4,981 4,981 4,981
Cash & ST Invts 935 276 254 288 482
Inventory 0.80 0.73 0.70 0.76 0.81
Debtors 248 197 189 204 217
Other Current Assets 1,735 1,501 1,561 1,449 1,334
Total Assets 11,848 11,501 11,955 12,255 12,567
ST Debt
1,292 523 523 523 523
Creditor 282 238 229 247 263
Other Current Liab 75.2 42.1 51.2 54.6 56.7
LT Debt 1,737 1,980 2,180 2,180 2,180
Other LT Liabilities 332 317 317 317 317
Shareholder’s Equity 7,643 7,894 8,130 8,382 8,648
Minority Interests 488 507 525 552 580
Total Cap. & Liab. 11,848 11,501 11,955 12,255 12,567
Non-Cash Wkg. Capital 1,626 1,419 1,470 1,353 1,233
Net Cash/(Debt) (2,094) (2,227) (2,449) (2,415) (2,222)
Debtors Turn (avg days) 83.9 63.5 57.4 54.2 54.5
Creditors Turn (avg days) 184.8 134.1 119.3 112.5 111.2
Inventory Turn (avg days) 0.4 0.4 0.4 0.3 0.3
Asset Turnover (x) 0.1 0.1 0.1 0.1 0.1
Current Ratio (x) 1.8 2.5 2.5 2.4 2.4
Quick Ratio (x) 0.7 0.6 0.6 0.6 0.8
Net Debt/Equity (X) 0.3 0.3 0.3 0.3 0.2
Net Debt/Equity ex MI (X) 0.3 0.3 0.3 0.3 0.3
Capex to Debt (%) 5.2 1.9 10.1 7.4 1.8
Z-Score (X) 1.9 2.0 2.0 2.0 2.0
Source: Company, DBS Bank
Gearing to remain healthy
Page 131

ASIAN INSIGHTS VICKERS SECURITIES
Page 6
Company Guide
UOL Group
Cash Flow Statement (S$m)
FY Dec 2014A 2015A 2016F 2017F 2018F
Pre-Tax Profit 760 413 424 453 470
Dep. & Amort. 60.1 67.2 67.2 67.2 67.2
Tax Paid (96.5) (66.7) (41.8) (50.9) (54.3)
Assoc. & JV Inc/(loss) (158) (156) (220) (229) (238)
Chg in Wkg.Cap. (726) 259 (60.8) 114 118
Other Operating CF (250) (0.1) 0.0 0.0 0.0
Net Operating CF (411) 517 170 354 363
Capital Exp.(net) (157) (47.0) (273) (200) (50.0)
Other Invts.(net) (0.8) 0.68 0.0 0.0 0.0
Invts in Assoc. & JV (1.6) 79.8 0.0 0.0 0.0
Div from Assoc & JV 18.7 42.0 0.0 0.0 0.0
Other Investing CF 8.89 (12.3) 0.0 0.0 0.0
Net Investing CF (132) 63.2 (273) (200) (50.0)
Div Paid (57.1) (64.3) (119) (119) (119)
Chg in Gross Debt 690 (466) 200 0.0 0.0
Capital Issues 3.58 7.93 0.0 0.0 0.0
Other Financing CF (103) (62.1) 0.0 0.0 0.0
Net Financing CF 534 (584) 80.6 (119) (119)
Currency Adjustments 2.42 (5.7) 0.0 0.0 0.0
Chg in Cash (6.9) (10.1) (22.6) 34.5 193
Opg CFPS (S cts) 40.1 32.4 28.9 30.1 30.7
Free CFPS (S cts) (72.2) 59.0 (13.0) 19.3 39.3
Source: Company, DBS Bank
Target Price & Ratings History
Source: DBS Bank
Analyst: Derek TAN
Rachel TAN
S.No.Date of
Report
Closing
Price
12-mth
Target
Price
Rat ing
1: 18 Jan 16 5.54 8.47 BUY
2: 29 Feb 16 5.66 7.39 BUY
3: 13 May 16 5.70 7.39 BUY
4: 27 May 16 5.68 7.39 BUY
5: 09 Jun 16 5.61 7.39 BUY
6: 05 Aug 16 5.83 7.20 BUY
7: 16 Sep 16 5.51 7.20 BUY
8: 30 Sep 16 5.61 7.20 BUY
9: 07 Oct 16 5.85 7.20 BUY
10: 18 Oct 16 5.76 7.20 BUY
11: 11 Nov 16 5.66 7.20 BUY
Note : Share price and Target price are adjusted for corporate actions.
1
2
3
4
5
6
7
89
10
11
4.99
5.19
5.39
5.59
5.79
5.99
6.19
6.39
6.59
Jan-16 May-16 Sep-16 Jan-17
S$
Acquisition of 2 properties in London and Raintree Gardens in 2017
Page 132

ASIAN INSIGHTS VICKERS SECURITIES ed: JS / sa: YM, PY
BUY Last Traded Price ( 4 Jan 2017): S$0.70 (STI : 2,921.31) Price Target 12-mth: S$0.84 (20% upside and 7.9% yield) Potential Catalyst: Earnings recovery/further acquisitions/potential takeover offer Where we differ: DBS is the sole broker covering this REIT Analyst Mervin SONG CFA +65 6682 3715 [email protected] Derek TAN +65 6682 3716 [email protected]
What’s New 2Q17 DPU of 1.38 Scts flat y-o-y but up 4% y-o-y
on normalised basis
Some near term headwinds but there are levers to
drive earnings
Low gearing (c.32%) provides capacity to pursue
acquisitions
Price Relative
Forecasts and Valuation FY Mar (S$m) 2015A 2016A 2017F 2018F Gross Revenue 227 215 226 225 Net Property Inc 93.3 90.9 92.3 91.6 Total Return 28.6 147 34.4 33.2 Distribution Inc 56.3 63.7 65.4 64.3 EPU (S cts) 1.72 0.10 3.06 2.94 EPU Gth (%) 137 (94) 3,072 (4) DPU (S cts) 5.06 5.41 5.52 5.39 DPU Gth (%) (8) 7 2 (2) NAV per shr (S cts) 74.2 86.0 85.8 85.7 PE (X) 40.7 726.0 22.9 23.8 Distribution Yield (%) 7.2 7.7 7.9 7.7 P/NAV (x) 0.9 0.8 0.8 0.8 Aggregate Leverage (%) 37.2 32.7 32.8 32.8 ROAE (%) 2.3 0.1 3.6 3.4 Distn. Inc Chng (%): 0 0
Source of all data on this page: Company, DBS Bank, Bloomberg Finance L.P.
Untapped balance sheet
Attractive yield and discount to book value. We maintain our BUY recommendation and TP of S$0.84. We believe at current levels, Ascendas Hospitality Trust’s (ASCHT) offers a compelling yield in excess of 7% which is based on a 95% payout ratio. In addition, the stock trades at 16% discount to its NAV per unit of S$0.88 and speculated offer price in excess of S$0.80 when several parties were considering a takeover bid for ASCHT earlier this year. Mitigating factors against known headwinds. While ASCHT’s faces several headwinds in the form of an oversupply in the Singapore and Brisbane hospitality markets and recent strengthening of the JPY, we believe ASCHT can still deliver relatively stable DPUs going forward. This is premised on higher earnings from a renegotiated management contract at its Osaka property, uplift from the recently completed refurbishment at Courtyard by Marriott North Ryde, and still positive increase in tourist arrivals into Australia and Japan boosting demand for ASCHT’s Sydney, Melbourne and Tokyo properties. Acquisition capability enhanced due to low gearing and new Chairman with extensive hospitality experience. With gearing of only c.32%, ASCHT is in a strong financial position to pursue debt-funded acquisitions. In addition, we believe the ability to execute on non-organic opportunities is enhanced by the recent appointment of Mr Miguel Ko as Chairman of ASCHT. Mr Ko, who is currently the CEO of ASCHT’s sponsor, was formerly the Chairman and President of Starwoods Hotels & Resorts (Asia Pacific Division) and Deputy Chairman and CEO of CDL Hotels International. Valuation:
We maintain our DCF-based TP at S$0.80. With 20% capital upside and attractive 7.9% yield, we reiterate our BUY call. Key Risks to Our View:
Significant drop in AUD/JPY and demand/supply imbalance. If the AUD/JPY drops significantly from current levels and there is excess supply in ASCHT’s respective markets, there will be downside risks to our DPU estimates and ASCHT may continue to trade at a discount to book value. At A Glance Issued Capital (m shrs) 1,123 Mkt. Cap (S$m/US$m) 786 / 589 Major Shareholders (%) TJ Holdings 27.1 Tang Yigang 6.2 Jinquan Tong 4.9
Free Float (%) 61.8 3m Avg. Daily Val (US$m) 0.30 ICB Industry : Real Estate / Real Estate Investment Trusts
DBS Group Research . Equity 4 Jan 2017
Singapore Company Guide
Ascendas Hospitality Trust Version 6 | Bloomberg: ASCHT SP | Reuters: ASHP.SI Refer to important disclosures at the end of this report
Page 133

ASIAN INSIGHTS VICKERS SECURITIES Page 2
Company Guide
Ascendas Hospitality Trust
CRITICAL DATA POINTS TO WATCH
Earnings Drivers:
Australia – the largest contributor. ASCHT’s Australian portfolio contributed c.55% of FY16 NPI. With a positive outlook for the Australian hospitality market, driven by a combination of continued growth in tourist arrivals (+12% y-o-y for 8M16 following 8% growth in CY15) and modest new hotel supply in Sydney and Melbourne in the near term, we expect ASCHT’s Australian operations to drive the REIT’s performance going forward. Contribution from Australia should also rise in 2019 as ASCHT inked an agreement to acquire the serviced apartment component at Aurora Melbourne Central for A$120m, on an NPI yield of 7.6%. Construction of Aurora Melbourne Central is due to be completed in 2H19. Due to uncertainty over how ASCHT will fund the acquisition of Aurora Melbourne and RevPAR in 2019, we have yet to include this investment in our estimates. Japan is another growth driver. Despite potential softening in ASCHT’s Japanese operations due to the recent strengthening of the JPY, we remain positive on the outlook for ASCHT’s Japanese properties (c.21% of FY16 NPI). This is because while the pace of inbound tourists may slow, it should remain on an uptrend as the Japanese government continues to support the tourism sector through the relaxation of visa requirements. Overall tourist arrivals climbed 24% y-o-y in 9M16 following a 47% y-o-y increase in CY15. New operator for Osaka Namba hotel. Another boost for ASCHT in FY17 is the 13% uplift in annual fixed rents for its Osaka Namba Washington Hotel, as ASCHT has recently appointed a new operator, Sunroute Co Ltd. As part of the new 10-year agreement, the hotel will undergo a refurbishment and will be rebranded under the “Sunroute” name. Modest contribution from Singapore and China. In FY17, we see modest contributions from ASCHT’s Singapore (16% of FY16 NPI) and China (8%) properties due to challenging operating conditions induced by new hotel supply. For Singapore, we project a decline in RevPAR. However, the downside from Singapore is limited given an annual fixed rent of c.S$12m with a 3% annual escalation. Financial flexibility to pursue acquisitions. Following recent revaluation gains, ASCHT’s gearing has fallen to c.32%. This provides the REIT with some debt headroom to pursue acquisitions.
Net Property Income and Margins (%)
Net Property Income and Margins (%)
Distribution Paid / Net Operating CF
Interest Cover (x)
Source: Company, DBS Bank
Page 134

ASIAN INSIGHTS VICKERS SECURITIES Page 3
Company Guide
Ascendas Hospitality Trust
Balance Sheet:
Stable gearing. Excluding revaluation gains, we expect ASCHT’s gearing to remain stable at around the 32% level in the near term. However, this may increase should ASCHT fund the acquisition of Aurora Melbourne in 2019. Share Price Drivers:
Consistent delivery with upside risk from potential takeover. ASCHT’s share price has been negatively impacted since its IPO due to a patchy DPU track record. We believe a more stable DPU will re-rate ASCHT in the medium term given that ASCHT trades at a c.80bps yield premium to other listed hospitality SREITs. Should ASCHT’s manager fail to deliver, there is potential for activist unitholders soliciting a takeover offer from a third party to crystallise the full value for ASCHT’s portfolio. Inorganic drivers. While ASCHT's ability to raise equity in the short term is constrained by the fact the trust is trading on a relative high distribution yield (above 7%), we think its gearing of c.32% provides ASCHT with some headroom to pursue debt funded acquisitions. Key Risks:
Interest rate risk. As the US Fed is expected to raise interest rates, ASCHT faces the challenge of higher interest costs. Nevertheless, with c.97% of the group’s debt on fixed rates, ASCHT is partially insulated in the near term. FX risks. Significant volatility in AUD and JPY would negatively impact our DPU estimates. However, this risk is tempered by ASCHT entering into 15-month rolling hedges. Supply risk. Any significant increase in the number of hotel rooms without a commensurate growth in demand could limit income growth for the REIT, as hotels may have to lower their room rates in order to remain competitive and maintain high occupancies. Company Background
A-HTRUST is a stapled group comprising Ascendas Hospitality Business Trust (A-HBT) and Ascendas Hospitality REIT (A-HREIT), established to invest in a diversified portfolio of hotel assets in Asia, Australia and New Zealand.
Aggregate Leverage (%)
ROE (%)
Distribution Yield (%)
PB Band (x)
Source: Company, DBS Bank
Page 135

ASIAN INSIGHTS VICKERS SECURITIES Page 4
Company Guide
Ascendas Hospitality Trust
Income Statement (S$m)
FY Mar 2014A 2015A 2016A 2017F 2018F Gross revenue 214 227 215 226 225 Property expenses (131) (134) (124) (134) (133) Net Property Income 83.5 93.3 90.9 92.3 91.6 Other Operating expenses (40.7) (35.9) (34.6) (36.0) (36.0) Other Non Opg (Exp)/Inc (13.7) (15.0) (3.9) 0.0 0.0 Net Interest (Exp)/Inc (15.0) (17.2) (17.9) (18.4) (18.8) Exceptional Gain/(Loss) 0.0 0.0 0.0 0.0 0.0 Net Income 14.3 28.4 38.5 37.9 36.8 Tax (7.7) (9.9) (37.4) (3.6) (3.6) Minority Interest 0.0 0.0 0.0 0.0 0.0 Preference Dividend 0.0 0.0 0.0 0.0 0.0 Net Income After Tax 6.66 18.5 1.08 34.4 33.2 Total Return 16.7 28.6 147 34.4 33.2 Non-tax deductible Items 38.0 37.8 62.6 31.1 31.1 Net Inc available for Dist. 54.6 56.3 63.7 65.4 64.3 Growth & Ratio Revenue Gth (%) 55.5 6.0 (5.3) 5.1 (0.4) N Property Inc Gth (%) 73.4 11.8 (2.7) 1.5 (0.7) Net Inc Gth (%) (25.3) 177.5 (94.2) 3,090.0 (3.4) Dist. Payout Ratio (%) 100.0 100.0 95.0 95.0 95.0 Net Prop Inc Margins (%) 39.0 41.1 42.2 40.8 40.7 Net Income Margins (%) 3.1 8.1 0.5 15.2 14.8 Dist to revenue (%) 25.5 24.8 29.6 28.9 28.6 Managers & Trustee’s fees 19.0 15.8 16.1 15.9 16.0 ROAE (%) 0.9 2.3 0.1 3.6 3.4 ROA (%) 0.5 1.3 0.1 2.1 2.0 ROCE (%) 1.8 3.0 0.1 3.6 3.5 Int. Cover (x) 2.9 3.3 3.1 3.1 3.0
Source: Company, DBS Bank
Growth driven by ASCHT’s Australian and Japanese properties
Page 136
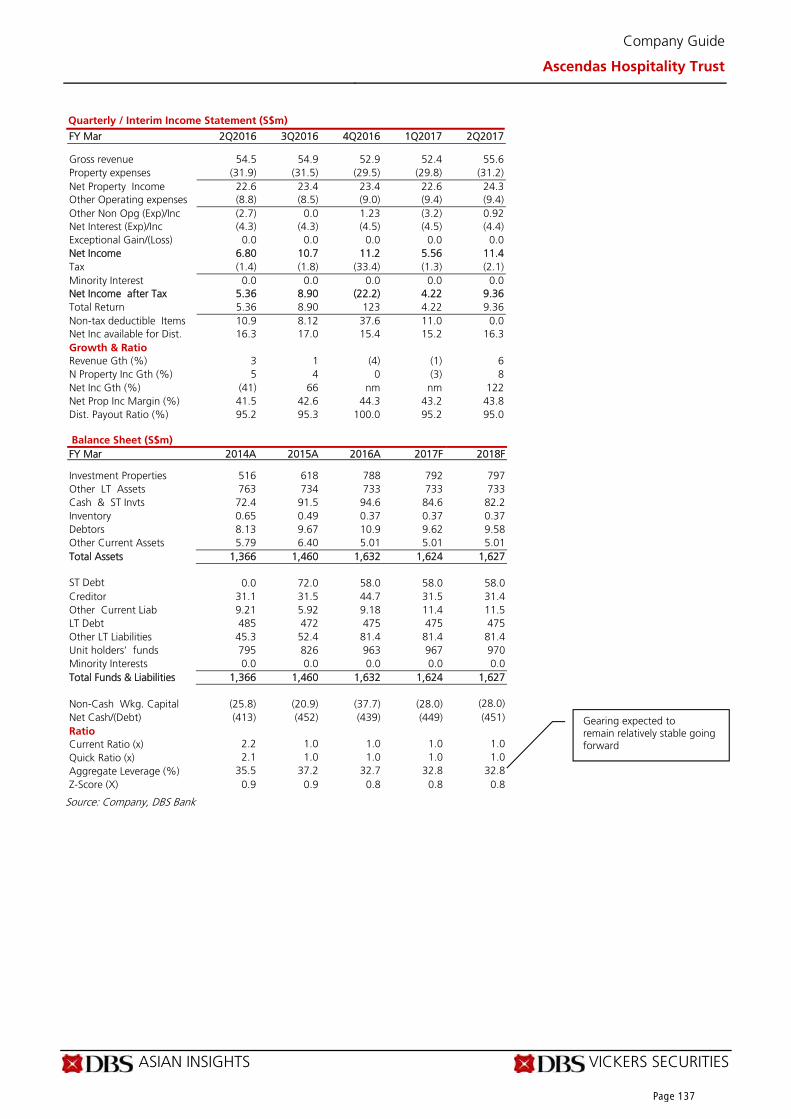
ASIAN INSIGHTS VICKERS SECURITIES Page 5
Company Guide
Ascendas Hospitality Trust
Quarterly / Interim Income Statement (S$m)
FY Mar 2Q2016 3Q2016 4Q2016 1Q2017 2Q2017 Gross revenue 54.5 54.9 52.9 52.4 55.6 Property expenses (31.9) (31.5) (29.5) (29.8) (31.2) Net Property Income 22.6 23.4 23.4 22.6 24.3 Other Operating expenses (8.8) (8.5) (9.0) (9.4) (9.4) Other Non Opg (Exp)/Inc (2.7) 0.0 1.23 (3.2) 0.92 Net Interest (Exp)/Inc (4.3) (4.3) (4.5) (4.5) (4.4) Exceptional Gain/(Loss) 0.0 0.0 0.0 0.0 0.0 Net Income 6.80 10.7 11.2 5.56 11.4 Tax (1.4) (1.8) (33.4) (1.3) (2.1) Minority Interest 0.0 0.0 0.0 0.0 0.0 Net Income after Tax 5.36 8.90 (22.2) 4.22 9.36 Total Return 5.36 8.90 123 4.22 9.36 Non-tax deductible Items 10.9 8.12 37.6 11.0 0.0 Net Inc available for Dist. 16.3 17.0 15.4 15.2 16.3 Growth & Ratio Revenue Gth (%) 3 1 (4) (1) 6 N Property Inc Gth (%) 5 4 0 (3) 8 Net Inc Gth (%) (41) 66 nm nm 122 Net Prop Inc Margin (%) 41.5 42.6 44.3 43.2 43.8 Dist. Payout Ratio (%) 95.2 95.3 100.0 95.2 95.0
Balance Sheet (S$m)
FY Mar 2014A 2015A 2016A 2017F 2018F Investment Properties 516 618 788 792 797 Other LT Assets 763 734 733 733 733 Cash & ST Invts 72.4 91.5 94.6 84.6 82.2 Inventory 0.65 0.49 0.37 0.37 0.37 Debtors 8.13 9.67 10.9 9.62 9.58 Other Current Assets 5.79 6.40 5.01 5.01 5.01 Total Assets 1,366 1,460 1,632 1,624 1,627 ST Debt 0.0 72.0 58.0 58.0 58.0 Creditor 31.1 31.5 44.7 31.5 31.4 Other Current Liab 9.21 5.92 9.18 11.4 11.5 LT Debt 485 472 475 475 475 Other LT Liabilities 45.3 52.4 81.4 81.4 81.4 Unit holders’ funds 795 826 963 967 970 Minority Interests 0.0 0.0 0.0 0.0 0.0 Total Funds & Liabilities 1,366 1,460 1,632 1,624 1,627 Non-Cash Wkg. Capital (25.8) (20.9) (37.7) (28.0) (28.0) Net Cash/(Debt) (413) (452) (439) (449) (451) Ratio Current Ratio (x) 2.2 1.0 1.0 1.0 1.0 Quick Ratio (x) 2.1 1.0 1.0 1.0 1.0 Aggregate Leverage (%) 35.5 37.2 32.7 32.8 32.8 Z-Score (X) 0.9 0.9 0.8 0.8 0.8
Source: Company, DBS Bank
Gearing expected to remain relatively stable going forward
Page 137

ASIAN INSIGHTS VICKERS SECURITIES Page 6
Company Guide
Ascendas Hospitality Trust
Cash Flow Statement (S$m)
FY Mar 2014A 2015A 2016A 2017F 2018F Pre-Tax Income 14.3 28.4 38.5 37.9 36.8 Dep. & Amort. 27.4 27.9 26.0 26.0 26.0 Tax Paid (2.5) (6.8) (3.1) (1.3) (3.6) Associates &JV Inc/(Loss) (0.2) (3.1) (4.0) 0.0 0.0 Chg in Wkg.Cap. 11.7 7.26 9.19 (12.0) 0.0 Other Operating CF 17.0 1.94 2.92 5.06 5.06 Net Operating CF 67.7 55.6 69.5 55.7 64.3 Net Invt in Properties (300) (110) (11.4) (3.6) (5.6) Other Invts (net) 0.0 0.0 29.5 0.0 0.0 Invts in Assoc. & JV 0.0 0.0 0.0 0.0 0.0 Div from Assoc. & JVs 1.15 1.33 1.02 0.0 0.0 Other Investing CF (24.3) (10.0) (13.8) 0.0 0.0 Net Investing CF (323) (119) 5.26 (3.6) (5.6) Distribution Paid (51.5) (56.9) (58.2) (62.1) (61.0) Chg in Gross Debt 120 85.7 (8.8) 0.0 0.0 New units issued 198 49.2 0.0 0.0 0.0 Other Financing CF 0.0 0.0 0.0 0.0 0.0 Net Financing CF 266 77.9 (67.0) (62.1) (61.0) Currency Adjustments 2.84 1.14 (1.2) 0.0 0.0 Chg in Cash 13.1 15.8 6.48 (10.0) (2.4) Operating CFPS (S cts) 6.09 4.50 5.40 6.02 5.69 Free CFPS (S cts) (25.3) (5.1) 5.19 4.64 5.19
Source: Company, DBS Bank
Target Price & Ratings History
Source: DBS Bank
Analyst: Mervin SONG CFA
Derek TAN
Page 138

ASIAN INSIGHTS VICKERS SECURITIES ed: JS / sa: YM, PY
BUY
Last Traded Price ( 4 Jan 2017): S$1.01 (STI : 2,921.31) Price Target 12-mth: S$1.13 (12% upside and 5.8% yield) Potential Catalyst: Acquisitions and/or further redevelopments Where we differ: Above consensus due to incorporation of Blue Ridge Phase II acquisition Analyst Mervin SONG CFA +65 6682 3715 [email protected] Derek TAN +65 6682 3716 [email protected]
Price Relative
Forecasts and Valuation FY Mar (S$m) 2015A 2016A 2017F 2018F Gross Revenue 129 144 168 196 Net Property Inc 77.6 93.7 104 125 Total Return 65.9 105 53.6 57.9 Distribution Inc 49.8 56.5 60.9 66.2 EPU (S cts) 2.97 1.01 5.76 6.19 EPU Gth (%) 59 (66) 470 8 DPU (S cts) 4.86 5.50 5.89 6.37 DPU Gth (%) 7 13 7 8 NAV per shr (S cts) 66.2 67.2 66.6 66.1 PE (X) 34.0 99.9 17.5 16.3 Distribution Yield (%) 4.8 5.4 5.8 6.3 P/NAV (x) 1.5 1.5 1.5 1.5 Aggregate Leverage (%) 25.1 26.9 36.0 37.1 ROAE (%) 4.6 1.5 8.4 9.1 Distn. Inc Chng (%): - - Consensus DPU (S cts): 6.00 6.40 Other Broker Recs: B: 3 S: 0 H: 1
Source of all data on this page: Company, DBS Bank, Bloomberg Finance L.P.
Still under the radar Still has legs to run. We maintain our BUY call on Ascendas India Trust (a-iTrust), with a revised TP of S$1.13. While a-iTrust has rallied over 30% since we upgraded the stock to BUY in late January, and investor interest has picked up, we believe a-iTrust’s growth story still has yet to gain recognition among investors at large. With Singapore-focused REITs increasingly facing headwinds translating into slowing DPU growth (average DPU CAGR of 1%), we anticipate investors will gravitate to a-iTrust given its healthy 2-year DPU CAGR of 8% and a still decent 5.5% yield. Clear growth drivers with prospects of healthy rental reversions ahead. Over the past year, a-iTrust has announced several developments including the construction of The V, a new 408k sqft IT building, as well as acquisitions of CyberVale, aVance 3 & 4 and BlueRidge Phase 2. Coupled with the potential for healthy rental reversions ahead, of 12-20% in Chennai and up to 5% for Hyderabad and Bangalore, provides confidence over a-iTrust’s ability to deliver a robust 8% DPU CAGR over the next two years. Untapped land bank and acquisition pipeline. Through its untapped land bank and sponsor pipeline, a-iTrust has access to c.5.9m sqft of floor area. This provides the trust with a visible and sustainable source of growth over the long term. The ability to execute on these growth opportunities is supported by its healthy balance sheet (current gearing is low at 29%, rising to c.36% with planned developments and acquisitions in the next couple of years). Valuation:
We maintain our DDM-based TP of S$1.13. Key Risks to Our View:
The key risk to our bullish stance is a significant depreciation of the INR, downturn in the Indian economy which will depress rents or delays in the completion of announced acquisitions and development projects. At A Glance Issued Capital (m shrs) 930 Mkt. Cap (S$m/US$m) 939 / 652 Major Shareholders (%) Ascendas Pte Ltd 23.9 Massachusetts Financial Services 12.7 JPMorgan Chase & Co 9.5
Free Float (%) 53.9 3m Avg. Daily Val (US$m) 0.37 ICB Industry : Real Estate / Real Estate Investment Trust
DBS Group Research . Equity 4 Jan 2017
Singapore Company Guide
Ascendas India Trust Version 7 | Bloomberg: AIT SP | Reuters: AINT.SI Refer to important disclosures at the end of this report
Page 139

ASIAN INSIGHTS VICKERS SECURITIES Page 2
Company Guide
Ascendas India Trust
CRITICAL DATA POINTS TO WATCH
Earnings Drivers:
Leveraged on offshoring trends. a-iTrust provides exposure to India, which remains a leading IT and offshoring hub. The growing demand for offshoring services is underpinned by the country's low-cost environment. According to PayScale, the average salary for IT/software, developers or programmers in India stands at US$5,451 p.a. which is way below that of other competing and/or developed countries such as the US (US$73,031), Australia (US$51,331), Hong Kong (US$23,600) and Malaysia (US$10,165). Combined with an abundant skilled labour force and qualified English-speaking talent pool, based on NASSCOM (National Association of Software and Services Companies) estimates, IT-BPM (business process management) revenues are forecast to grow by 10-12% in FY16/17 to US$157-160bn. Balanced lease expiry to capture upside in rents. a-iTrust’s WALE stands at 5.7 years, with 8% and 30% of leases up for renewal in FY17 and FY18 respectively. Given the favourable demand backdrop and limited supply in certain markets such as Chennai, we believe a-iTrust’s lease expiry profile provides it with ample opportunities to capture the upside in rents. Boost from recent acquisitions and developments. Over the past year, a-iTrust announced the construction of The V, a new 408k-sqft IT building, as well as the acquisitions of CyberVale, aVance 3 & 4 and BlueRidge Phase II. These organic and inorganic developments should boost a-iTrust’s DPU, contributing to a healthy 8% DPU CAGR over the next two years. Potential one-third increase in floor area. a-iTrust currently has a portfolio of properties with 9.7m sqft of space with announced plans to take it to c.12m sqft. Beyond this, through its sponsors and assuming a-iTrust exercises its right of first refusal (ROFR), it could access c.2.3m sqft worth of properties. In addition, we understand the trust is also open to the acquisition of third-party properties. Currently, it is exploring acquisition opportunities in Mumbai, Delhi and Gurgaon, thereby expanding its presence beyond its current core markets of Bangalore, Chennai, Hyderabad and Pune.
Net Property Income and Margins (%)
Net Property Income and Margins (%)
Distribution Paid / Net Operating CF
Interest Cover (x)
Source: Company, DBS Bank
Page 140

ASIAN INSIGHTS VICKERS SECURITIES Page 3
Company Guide
Ascendas India Trust
Balance Sheet:
Flexible balance sheet. a-iTrust’s current gearing remains low at <30%. However, we expect gearing to rise to c.36% by end-FY17 after including the trust’s existing development projects and announced acquisitions. This is within management comfortable level of 35%-45%. 100% of debt fixed. As at end September 2016, 100% of the trust’s debt was fixed with an all-in cost of debt of 7.0%. This minimises the trust’s exposure to short-term volatility in interest rates. Share Price Drivers:
Stronger INR. Since a-iTrust’s IPO in 2008, NPI in INR terms has grown at a CAGR of 8%. However, due to the weak INR, a-iTrust’s share price has been capped and net property income in SGD terms has only grown at c.5% CAGR. Should the INR appreciate, this will be a major tailwind for a-iTrust’s share price. Crystallisation of development and sponsor pipeline. The trust has a development and sponsor pipeline of c.3m sqft and 2.3m sqft respectively. The delivery of the development pipeline and acquisition of its sponsor’s properties with resultant increase in earnings/DPU should drive the stock price higher over the medium term. Key Risks:
Currency risk. a-iTrust’s distributions are generated in INR but paid in SGD. While the trust hedges each half-yearly distribution, DPU from the trust will be negatively impacted on a lagged basis if the INR depreciates. In addition, as 75% and 25% of the trust’s borrowings are in INR and SGD respectively, while all its assets are in India, a depreciation of the INR would also be negative to its NAV per share. Economic risk. Deterioration in the Indian economic outlook and/or companies outsourcing their operations to India may negatively impact demand for space and rents at a-iTrust’s properties. Interest rate risk. Increases in interest rates will result in higher interest payments which would reduce income available for distribution. This risk is partially mitigated by the fact that 100% of the trust’s debt is fixed. Company Background
Ascendas India Trust ("a-iTrust") was listed in August 2007 as the first Indian property trust in Asia. Its principal objective is to own income-producing real estate used primarily as business space in India. a-iTrust may also develop and acquire land or uncompleted developments to be used primarily as business space, with the objective of holding the properties upon completion. a-iTrust is managed by Ascendas Property Fund Trustee Pte Ltd, a subsidiary of the Ascendas Group.
Aggregate Leverage (%)
ROE (%)
Distribution Yield (%)
PB Band (x)
Source: Company, DBS Bank
Page 141

ASIAN INSIGHTS VICKERS SECURITIES Page 4
Company Guide
Ascendas India Trust
Income Statement (S$m)
FY Mar 2014A 2015A 2016A 2017F 2018F Gross revenue 121 129 144 168 196 Property expenses (48.6) (51.2) (50.2) (64.4) (71.5) Net Property Income 72.1 77.6 93.7 104 125 Other Operating expenses (7.9) (8.4) (16.1) (11.6) (14.1) Other Non Opg (Exp)/Inc 0.0 0.0 0.0 0.0 0.0 Net Interest (Exp)/Inc (3.9) (2.8) (9.2) (14.8) (27.1) Exceptional Gain/(Loss) (8.1) 4.31 0.0 0.0 0.0 Net Income 52.2 70.7 68.4 77.6 83.5 Tax (30.4) (38.3) (51.1) (20.8) (22.2) Minority Interest (4.8) (5.1) (8.0) (3.2) (3.3) Preference Dividend 0.0 0.0 0.0 0.0 0.0 Net Income After Tax 17.1 27.3 9.34 53.6 57.9 Total Return 50.1 65.9 105 53.6 57.9 Non-tax deductible Items (13.3) (16.1) (11.9) 7.34 8.28 Net Inc available for Dist. 46.1 49.8 56.5 60.9 66.2 Growth & Ratio Revenue Gth (%) (4.4) 6.7 11.8 17.0 16.5 N Property Inc Gth (%) (0.1) 7.6 20.8 11.0 19.8 Net Inc Gth (%) (25.4) 59.8 (65.8) 473.2 8.2 Dist. Payout Ratio (%) 90.0 90.0 90.0 90.0 90.0 Net Prop Inc Margins (%) 59.7 60.3 65.1 61.8 63.5 Net Income Margins (%) 14.2 21.2 6.5 31.8 29.5 Dist to revenue (%) 38.2 38.7 39.2 36.2 33.8 Managers & Trustee’s fees 6.5 6.5 11.2 6.9 7.2 ROAE (%) 2.9 4.6 1.5 8.4 9.1 ROA (%) 1.6 2.4 0.7 3.7 3.7 ROCE (%) 2.6 2.8 1.6 4.9 5.4 Int. Cover (x) 16.3 24.4 8.4 6.2 4.1
Source: Company, DBS Bank
Improvement in earnings on the back of positive rental reversions and contributions from new properties/acquisitions
Page 142

ASIAN INSIGHTS VICKERS SECURITIES Page 5
Company Guide
Ascendas India Trust
Quarterly / Interim Income Statement (S$m)
FY Mar 2Q2016 3Q2016 4Q2016 1Q2017 2Q2017 Gross revenue 36.5 37.5 35.9 36.1 37.1 Property expenses (12.8) (12.7) (12.7) (12.4) (12.0) Net Property Income 23.7 24.8 23.2 23.6 25.2 Other Operating expenses 0.11 2.35 (2.2) (2.5) (2.9) Other Non Opg (Exp)/Inc 0.0 0.0 0.0 0.0 0.0 Net Interest (Exp)/Inc (2.6) (3.0) (2.8) (3.6) (3.3) Exceptional Gain/(Loss) 0.17 (5.7) 0.13 (2.6) 3.00 Net Income 21.4 18.5 18.4 14.9 21.9 Tax (6.1) (8.0) (30.2) (4.6) (3.6) Minority Interest (1.1) (0.8) (5.2) (1.0) (1.2) Net Income after Tax 14.2 9.70 (17.0) 9.39 17.1 Total Return 16.8 9.70 72.6 9.39 17.1 Non-tax deductible Items (4.6) (5.2) (4.0) (0.9) (3.0) Net Inc available for Dist. 14.0 14.0 14.4 14.0 14.2 Growth & Ratio Revenue Gth (%) 7 3 (4) 1 3 N Property Inc Gth (%) 8 5 (6) 2 6 Net Inc Gth (%) 75 (32) nm nm 82 Net Prop Inc Margin (%) 65.0 66.2 64.7 65.6 67.7 Dist. Payout Ratio (%) 90.0 90.0 90.0 90.0 90.0
Balance Sheet (S$m)
FY Mar 2014A 2015A 2016A 2017F 2018F Investment Properties 0.41 0.26 3.29 3.21 3.13 Other LT Assets 953 1,150 1,222 1,442 1,488 Cash & ST Invts 74.4 69.7 85.9 44.2 35.9 Inventory 0.71 0.74 0.69 0.97 1.12 Debtors 20.3 22.8 15.1 29.8 34.7 Other Current Assets 13.9 13.6 22.8 22.8 22.8 Total Assets 1,063 1,257 1,350 1,543 1,586 ST Debt 49.9 89.9 45.0 45.0 45.0 Creditor 39.3 42.6 57.4 55.7 64.9 Other Current Liab 0.97 0.71 0.51 0.51 0.51 LT Debt 184 225 318 511 543 Other LT Liabilities 180 222 238 238 238 Unit holders’ funds 566 627 639 637 636 Minority Interests 42.0 49.3 52.9 56.1 59.4 Total Funds & Liabilities 1,063 1,257 1,350 1,543 1,586 Non-Cash Wkg. Capital (5.4) (6.1) (19.4) (2.6) (6.7) Net Cash/(Debt) (160) (246) (277) (512) (552) Ratio Current Ratio (x) 1.2 0.8 1.2 1.0 0.9 Quick Ratio (x) 1.0 0.7 1.0 0.7 0.6 Aggregate Leverage (%) 22.1 25.1 26.9 36.0 37.1 Z-Score (X) 1.5 1.1 1.1 0.9 0.9
Source: Company, DBS Bank
Increase in gearing due to new properties
Page 143

ASIAN INSIGHTS VICKERS SECURITIES Page 6
Company Guide
Ascendas India Trust
Cash Flow Statement (S$m)
FY Mar 2014A 2015A 2016A 2017F 2018F Pre-Tax Income 52.2 70.7 68.4 77.6 83.5 Dep. & Amort. 0.10 0.08 0.08 0.08 0.08 Tax Paid (11.3) (12.4) (51.1) (20.8) (22.2) Associates &JV Inc/(Loss) 0.0 0.0 0.0 0.0 0.0 Chg in Wkg.Cap. 14.2 3.73 13.3 (16.8) 4.10 Other Operating CF 22.2 17.4 66.5 0.0 0.0 Net Operating CF 77.4 79.6 97.1 40.0 65.5 Net Invt in Properties (35.5) (17.7) (51.8) (198) (68.0) Other Invts (net) (8.6) (91.8) 0.0 (22.2) 22.2 Invts in Assoc. & JV 0.0 0.0 0.0 0.0 0.0 Div from Assoc. & JVs 0.0 0.0 0.0 0.0 0.0 Other Investing CF 0.04 0.08 0.0 0.0 0.0 Net Investing CF (44.0) (109) (51.8) (220) (45.8) Distribution Paid (40.2) (43.4) (48.0) (54.8) (59.6) Chg in Gross Debt 17.7 80.5 24.7 193 31.6 New units issued 0.0 0.0 0.0 0.0 0.0 Other Financing CF 0.0 (16.3) (0.4) 0.0 0.0 Net Financing CF (22.5) 20.8 (23.7) 138 (28.0) Currency Adjustments (6.4) 4.27 0.0 0.0 0.0 Chg in Cash 4.52 (4.7) 21.6 (41.8) (8.3) Operating CFPS (S cts) 6.91 8.25 9.07 6.11 6.56 Free CFPS (S cts) 4.59 6.73 4.90 (17.0) (0.3)
Source: Company, DBS Bank
Target Price & Ratings History
Source: DBS Bank
Analyst: Mervin SONG CFA
Derek TAN
Includes $133m investment in BlueRidge Phase 2
Page 144
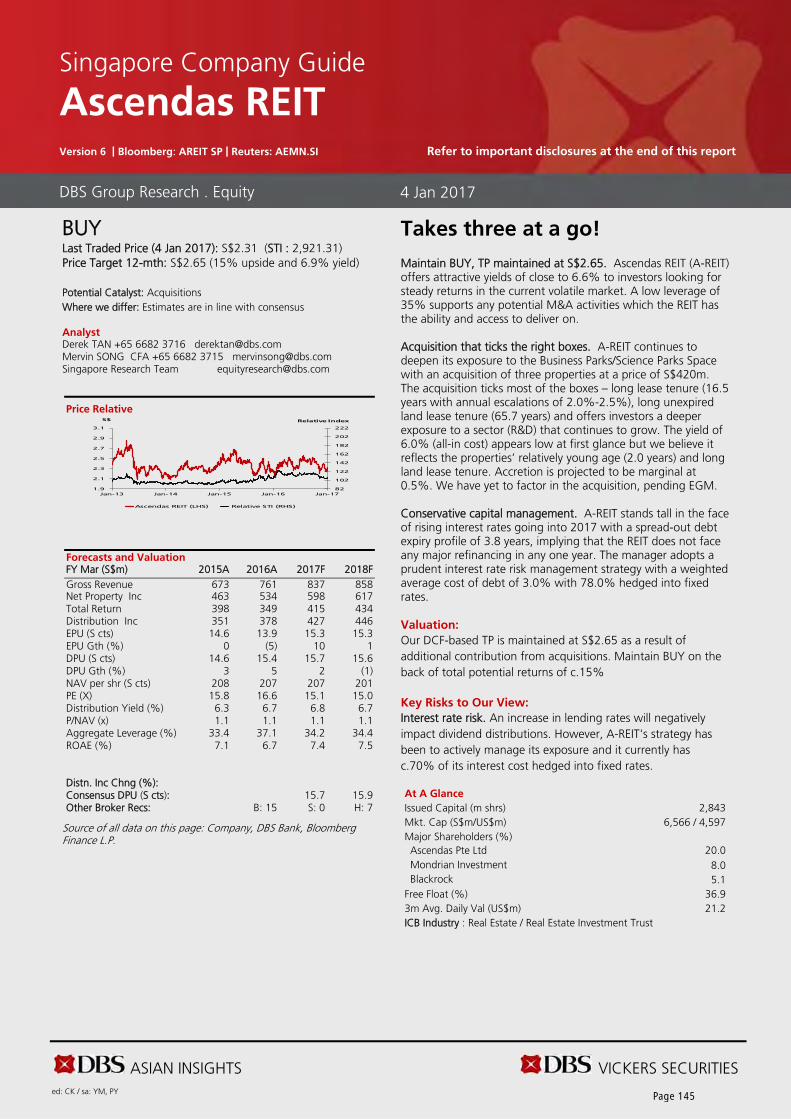
ASIAN INSIGHTS VICKERS SECURITIES ed: CK / sa: YM, PY
BUY Last Traded Price (4 Jan 2017): S$2.31 (STI : 2,921.31) Price Target 12-mth: S$2.65 (15% upside and 6.9% yield) Potential Catalyst: Acquisitions Where we differ: Estimates are in line with consensus Analyst Derek TAN +65 6682 3716 [email protected] Mervin SONG CFA +65 6682 3715 [email protected] Singapore Research Team [email protected]
Price Relative
Forecasts and Valuation FY Mar (S$m) 2015A 2016A 2017F 2018F Gross Revenue 673 761 837 858 Net Property Inc 463 534 598 617 Total Return 398 349 415 434 Distribution Inc 351 378 427 446 EPU (S cts) 14.6 13.9 15.3 15.3 EPU Gth (%) 0 (5) 10 1 DPU (S cts) 14.6 15.4 15.7 15.6 DPU Gth (%) 3 5 2 (1) NAV per shr (S cts) 208 207 207 201 PE (X) 15.8 16.6 15.1 15.0 Distribution Yield (%) 6.3 6.7 6.8 6.7 P/NAV (x) 1.1 1.1 1.1 1.1 Aggregate Leverage (%) 33.4 37.1 34.2 34.4 ROAE (%) 7.1 6.7 7.4 7.5 Distn. Inc Chng (%): Consensus DPU (S cts): 15.7 15.9 Other Broker Recs: B: 15 S: 0 H: 7
Source of all data on this page: Company, DBS Bank, Bloomberg Finance L.P.
Takes three at a go! Maintain BUY, TP maintained at S$2.65. Ascendas REIT (A-REIT) offers attractive yields of close to 6.6% to investors looking for steady returns in the current volatile market. A low leverage of 35% supports any potential M&A activities which the REIT has the ability and access to deliver on. Acquisition that ticks the right boxes. A-REIT continues to deepen its exposure to the Business Parks/Science Parks Space with an acquisition of three properties at a price of S$420m. The acquisition ticks most of the boxes – long lease tenure (16.5 years with annual escalations of 2.0%-2.5%), long unexpired land lease tenure (65.7 years) and offers investors a deeper exposure to a sector (R&D) that continues to grow. The yield of 6.0% (all-in cost) appears low at first glance but we believe it reflects the properties’ relatively young age (2.0 years) and long land lease tenure. Accretion is projected to be marginal at 0.5%. We have yet to factor in the acquisition, pending EGM. Conservative capital management. A-REIT stands tall in the face of rising interest rates going into 2017 with a spread-out debt expiry profile of 3.8 years, implying that the REIT does not face any major refinancing in any one year. The manager adopts a prudent interest rate risk management strategy with a weighted average cost of debt of 3.0% with 78.0% hedged into fixed rates. Valuation:
Our DCF-based TP is maintained at S$2.65 as a result of additional contribution from acquisitions. Maintain BUY on the back of total potential returns of c.15% Key Risks to Our View:
Interest rate risk. An increase in lending rates will negatively impact dividend distributions. However, A-REIT's strategy has been to actively manage its exposure and it currently has c.70% of its interest cost hedged into fixed rates. At A Glance Issued Capital (m shrs) 2,843 Mkt. Cap (S$m/US$m) 6,566 / 4,597 Major Shareholders (%) Ascendas Pte Ltd 20.0 Mondrian Investment 8.0 Blackrock 5.1
Free Float (%) 36.9 3m Avg. Daily Val (US$m) 21.2 ICB Industry : Real Estate / Real Estate Investment Trust
DBS Group Research . Equity 4 Jan 2017
Singapore Company Guide
Ascendas REIT Version 6 | Bloomberg: AREIT SP | Reuters: AEMN.SI Refer to important disclosures at the end of this report
82
102
122
142
162
182
202
222
1.9
2.1
2.3
2.5
2.7
2.9
3.1
Jan-13 Jan-14 Jan-15 Jan-16 Jan-17
Relative IndexS$
Ascendas REIT (LHS) Relative STI (RHS)
Page 145

ASIAN INSIGHTS VICKERS SECURITIES Page 2
Company Guide
Ascendas REIT
CRITICAL DATA POINTS TO WATCH
Earnings Drivers:
Rebound in occupancy rates to provide upside to earnings. A-REIT’s Singapore portfolio occupancy rates dipped marginally to 87.9%, compared to c.88.3% in 1QFY17 and 89.9% a year ago. The dip was mainly due to non-renewals of leases at 40 Penjuru Lane and Pioneer hub. Given A-REIT’s scale in Singapore, the manager continues to attract a diverse tenant base to its properties, despite the current economic slowdown. The manager is still seeing expansionary and new demand mainly from businesses in the transport and storage, distribution, and electronics sectors. Looking ahead, with close to 13% of the portfolio still vacant, the ability to back-fill the unoccupied space provides potential upside to our earnings estimates. A long portfolio-weighted average lease expiry (WALE) profile of 3.7 years (4.4 years post latest acquisition) means good earnings visibility for the REIT. Still positive rental reversions, but spread will likely narrow. Rental reversionary trends are moderating and reached a low of 0.9% in 2QFY17. Looking ahead, leases representing close to 12% in Singapore and given the narrowing spread between passing and market rents, we expect rental reversionary trends to remain flattish or even turn negative. In Australia, given the well-spread lease expiry profile, we do not anticipate too much volatility in the rentals and the manager is pro-actively engaging tenants ahead of expiry to renew their leases. In Australia, the manager is seeing a pick-up in demand for space in the recent quarter and reported a 4.2 percentage point increase in occupancy to 94.2%, back-filling most of the empty space in the previous quarter. Australia continues to offer the strongest earnings visibility with a WALE of 5.1 years. Inorganic growth to drive contributions in Australia and Singapore. A-REIT has regularly embarked on acquisitions and development projects, which have helped the REIT to deliver sustained growth in distributions over time. Given the limited opportunities in Singapore and the fragmented market in China, the manager has looked overseas for higher returns. The manager remains focused on deepening its presence in the core markets of Singapore, Australia and China, when the opportunity arises. Apart from the recently acquired acquisitions in Australia (A$179m in total), A-REIT will be embarking on a new asset enhancement project at 50 Kallang Avenue for S$45.2m which will be anchored by a new tenant on a long lease. A-REIT has in total S$113.1m in asset enhancements currently underway. The manager is also looking at further asset refurbishment options at its portfolio in Singapore in order to position the assets to capture changing tenant needs.
Net Property Income and Margins (%)
Net Property Income and Margins (%)
Distribution Paid / Net Operating CF
Interest Cover (x)
Source: Company, DBS Bank
65.3%
67.3%
69.3%
71.3%
73.3%
75.3%
77.3%
0
100
200
300
400
500
600
700
2014A 2015A 2016A 2017F 2018F
S$ m
Net Property Income Net Property Income Margin %
62%
64%
66%
68%
70%
72%
74%
76%
109
119
129
139
149
159
1Q20
15
2Q20
15
3Q20
15
4Q20
15
1Q20
16
2Q20
16
3Q20
16
4Q20
16
1Q20
17
2Q20
17
Net Property Income Net Property Income Margin %
0.3
0.4
0.5
0.6
0.7
0.8
0.9
1.0
1.1
1.2
2014A 2015A 2016A 2017F 2018F
(x)
0.00
2.00
4.00
6.00
8.00
10.00
12.00
2014A 2015A 2016A 2017F 2018F
(x)
Page 146

ASIAN INSIGHTS VICKERS SECURITIES Page 3
Company Guide
Ascendas REIT
Balance Sheet:
Optimal gearing level of c.34%. A-REIT’s gearing is estimated to dip to 34% (from c.37%) upon the assumed full conversion of S$300m of Exchange Collateralised Securities (ECS) by end of FY17F. This will be at the lower end of management’s comfortable 35-40% range. We believe that there is still capacity for management to utilise its debt headroom for further acquisitions but any significant deals could mean potential issuance of new equity. Well-staggered debt maturity profile. The manager adopts a prudent interest rate risk management strategy with a weighted average cost of debt of 3.0% with 78.0% hedged into fixed rates. The debt tenure is long at 3.8 years, with a well spread-out refinancing profile ensuring no concentration risk. Share Price Drivers:
Direction of 10-year long bonds impacts share price. Seen by investors as a key S-REIT proxy, A-REIT’s share price has typically been closely linked to investors’ perception on the direction of the US benchmark 10-year bond yields. A fall in 10-year bond yields on the back of a delay in Fed hikes is likely to mean a higher share price. Capital recycling strategy. With limited acquisition opportunities in Singapore, A-REIT regularly looks to divest older, lower-yielding properties and re-cycle the capital into asset- enhancement exercises (AEI), development projects or acquisitions. The aim is to optimise the portfolio returns and distributions which have a positive impact on its share price. Key Risks:
Interest rate risk. Any increase in interest rates will result in higher interest payments, which will reduce income available for distribution and result in lower distribution per unit (DPU) to unitholders. Economic risk. A deterioration in the economic outlook could have a negative impact on industrial rents and occupancies as companies cut back production and require less space, given that industrial rents have a strong correlation with GDP growth. Company Background
A-REIT is Singapore’s first and largest listed business space and industrial real estate investment trust. It has a diversified portfolio comprising assets in Singapore, China and Australia. A-REIT is managed by Ascendas Funds Management (S) Limited, a wholly owned subsidiary of the Singapore-based Ascendas Group.
Aggregate Leverage (%)
ROE (%)
Distribution Yield (%)
PB Band (x)
Source: Company, DBS Bank
10.0%
15.0%
20.0%
25.0%
30.0%
35.0%
2014A 2015A 2016A 2017F 2018F
0.0%
1.0%
2.0%
3.0%
4.0%
5.0%
6.0%
7.0%
2014A 2015A 2016A 2017F 2018F
Avg: 6.2%
+1sd: 6.6%
+2sd: 7%
‐1sd: 5.8%
‐2sd: 5.3%
4.3
4.8
5.3
5.8
6.3
6.8
7.3
7.8
2013 2014 2015 2016
(%)
Avg: 1.16x
+1sd: 1.24x
+2sd: 1.32x
‐1sd: 1.09x
‐2sd: 1.01x
0.9
1.0
1.1
1.2
1.3
1.4
1.5
1.6
1.7
Jan-13 Jan-14 Jan-15 Jan-16
(x)
Page 147

ASIAN INSIGHTS VICKERS SECURITIES Page 4
Company Guide
Ascendas REIT
p Income Statement (S$m)
FY Mar 2014A 2015A 2016A 2017F 2018F Gross revenue 614 673 761 837 858 Property expenses (178) (211) (227) (238) (241) Net Property Income 436 463 534 598 617 Other Operating expenses (40.8) (43.8) (67.4) (55.2) (55.4) Other Non Opg (Exp)/Inc 2.67 41.7 (5.7) 0.0 0.0 Net Interest (Exp)/Inc (35.9) (105) (77.5) (109) (108) Exceptional Gain/(Loss) 12.1 2.02 0.0 0.0 0.0 Net Income 374 357 383 434 454 Tax (23.2) (6.7) (25.1) (4.2) (4.7) Minority Interest 0.0 0.0 0.0 0.0 0.0 Preference Dividend 0.0 0.0 (6.6) (15.0) (15.0) Net Income After Tax 351 351 351 415 434 Total Return 482 398 349 415 434 Non-tax deductible Items (8.7) 0.57 26.9 11.6 11.7 Net Inc available for Dist. 342 351 378 427 446 Growth & Ratio Revenue Gth (%) 6.6 9.8 13.0 9.9 2.5 N Property Inc Gth (%) 6.6 6.1 15.3 12.1 3.1 Net Inc Gth (%) 32.8 0.0 0.2 18.1 4.6 Dist. Payout Ratio (%) 100.0 100.0 100.0 100.0 100.0 Net Prop Inc Margins (%) 71.1 68.7 70.1 71.5 72.0 Net Income Margins (%) 57.2 52.1 46.2 49.6 50.6 Dist to revenue (%) 55.7 52.1 49.7 51.0 52.0 Managers & Trustee’s fees 6.6 6.5 8.9 6.6 6.5 ROAE (%) 7.4 7.1 6.7 7.4 7.5 ROA (%) 4.9 4.5 3.9 4.2 4.4 ROCE (%) 5.3 5.5 5.0 5.6 5.7 Int. Cover (x) 11.0 4.0 6.0 5.0 5.2
Source: Company, DBS Bank
Driven by acquisitions and development projects.
Page 148

ASIAN INSIGHTS VICKERS SECURITIES Page 5
Company Guide
Ascendas REIT
Quarterly / Interim Income Statement (S$m)
FY Mar 2Q2016 3Q2016 4Q2016 1Q2017 2Q2017 Gross revenue 183 194 204 208 205 Property expenses (58.8) (51.6) (60.6) (58.1) (53.0) Net Property Income 124 142 143 149 152 Other Operating expenses (12.2) (21.3) (23.1) (14.9) (15.7) Other Non Opg (Exp)/Inc 32.3 3.16 (12.6) (9.3) (13.2) Net Interest (Exp)/Inc (5.3) (22.8) (37.0) (36.8) (28.2) Exceptional Gain/(Loss) 0.0 0.0 0.0 0.0 5.70 Net Income 123 101 70.8 88.7 101 Tax (0.7) (7.3) (16.7) (2.1) 13.7 Minority Interest 0.38 0.03 0.0 0.0 0.01 Net Income after Tax 123 93.9 54.1 86.6 115 Total Return 123 93.9 47.3 86.6 115 Non-tax deductible Items (23.9) 3.02 41.8 15.7 (7.8) Net Inc available for Dist. 99.3 96.9 89.1 102 107 Growth & Ratio Revenue Gth (%) 1 6 5 2 (1) N Property Inc Gth (%) 0 15 1 4 2 Net Inc Gth (%) 41 (24) (42) 60 33 Net Prop Inc Margin (%) 67.8 73.4 70.3 72.0 74.2 Dist. Payout Ratio (%) 100.0 100.0 102.0 104.5 105.1
Balance Sheet (S$m)
FY Mar 2014A 2015A 2016A 2017F 2018F Investment Properties 6,923 7,868 9,599 9,665 9,695 Other LT Assets 290 135 96.2 96.2 96.2 Cash & ST Invts 67.3 41.6 56.2 8.64 15.3 Inventory 0.0 0.0 0.0 0.0 0.0 Debtors 65.1 90.1 89.3 98.2 101 Other Current Assets 12.9 25.8 35.6 35.6 35.6 Total Assets 7,358 8,160 9,876 9,903 9,942 ST Debt 893 286 1,180 1,190 1,220 Creditor 128 189 172 189 194 Other Current Liab 85.8 32.8 43.5 39.8 40.4 LT Debt 1,231 2,442 2,485 2,195 2,205 Other LT Liabilities 171 198 199 205 210 Unit holders’ funds 4,849 5,014 5,797 6,085 6,074 Minority Interests 0.03 0.04 0.02 0.02 0.02 Total Funds & Liabilities 7,358 8,160 9,876 9,903 9,942 Non-Cash Wkg. Capital (136) (105) (90.6) (95.1) (98.0) Net Cash/(Debt) (2,057) (2,686) (3,608) (3,376) (3,409) Ratio Current Ratio (x) 0.1 0.3 0.1 0.1 0.1 Quick Ratio (x) 0.1 0.3 0.1 0.1 0.1 Aggregate Leverage (%) 28.9 33.4 37.1 34.2 34.4 Z-Score (X) 1.4 1.3 0.9 1.1 1.1
Source: Company, DBS Bank
Steady gearing profile
Page 149

ASIAN INSIGHTS VICKERS SECURITIES Page 6
Company Guide
Ascendas REIT
Cash Flow Statement (S$m)
FY Mar 2014A 2015A 2016A 2017F 2018F Pre-Tax Income 374 357 383 434 454 Dep. & Amort. 0.70 0.37 0.18 0.0 0.0 Tax Paid (0.8) (2.4) (4.5) (7.9) (4.2) Associates &JV Inc/(Loss) 0.0 0.0 0.0 0.0 0.0 Chg in Wkg.Cap. (1.4) (10.2) 11.5 8.22 2.28 Other Operating CF 28.5 17.4 (6.6) (15.0) (15.0) Net Operating CF 401 362 384 420 437 Net Invt in Properties 0.0 0.0 0.0 0.0 0.0 Other Invts (net) (94.7) (643) (1,496) (66.0) (30.0) Invts in Assoc. & JV 0.0 0.0 0.04 0.0 0.0 Div from Assoc. & JVs 0.0 0.0 0.0 0.0 0.0 Other Investing CF (40.2) 5.50 5.50 5.50 5.50 Net Investing CF (135) (638) (1,491) (60.5) (24.5) Distribution Paid (326) (261) (442) (427) (446) Chg in Gross Debt 170 577 1,218 (280) 40.0 New units issued (0.1) 0.0 342 300 0.0 Other Financing CF (70.8) (68.1) 0.0 0.0 0.0 Net Financing CF (227) 249 1,118 (407) (406) Currency Adjustments 8.53 0.80 (1.7) 0.0 0.0 Chg in Cash 47.8 (25.7) 9.56 (47.6) 6.67 Operating CFPS (S cts) 16.8 15.5 14.7 15.1 15.4 Free CFPS (S cts) 16.7 15.1 15.2 15.4 15.4
Source: Company, DBS Bank
Target Price & Ratings History
Source: DBS Bank
Analyst: Derek TAN
Mervin SONG CFA
Singapore Research Team
S.No.Date of Report
Closing Price
12-mth Target Price
Rat ing
1: 08 Jan 16 2.25 2.52 BUY
2: 04 Feb 16 2.34 2.52 BUY
3: 18 May 16 2.32 2.50 BUY
4: 10 Jun 16 2.32 2.50 BUY
5: 12 Jul 16 2.48 2.55 BUY
6: 21 Jul 16 2.49 2.61 BUY
7: 22 Jul 16 2.53 2.61 BUY
8: 22 Aug 16 2.42 2.61 BUY
9: 29 Aug 16 2.44 2.61 BUY
10: 20 Sep 16 2.42 2.61 BUY
11: 26 Sep 16 2.46 2.61 BUY12: 21 Oct 16 2.40 2.65 BUY13: 08 Nov 16 2.34 2.65 BUY14: 06 Dec 16 2.37 2.65 BUY
Note : Share price and Target price are adjusted for corporate actions.
1
2
3
4
5
6
7 8
9
10
1112
13
14
2.02
2.12
2.22
2.32
2.42
2.52
2.62
Jan-16 May-16 Sep-16 Jan-17
S$
Page 150

ASIAN INSIGHTS VICKERS SECURITIES ed: JS / sa: JC, PY
BUY Last Traded Price ( 4 Jan 2017): S$1.16 (STI : 2,921.31) Price Target 12-mth: S$1.32 (14% upside and 7.0% yield) Potential Catalyst: Further acquisitions and asset recycling to accelerate growth, improvement in performance of ART’s Chinese properties Where we differ: Below consensus on lower assumed sales Analyst Mervin SONG CFA +65 6682 3715 [email protected]
Price Relative
Forecasts and Valuation FY Dec (S$m) 2014A 2015A 2016F 2017F Gross Revenue 357 421 464 490 Net Property Inc 180 205 219 229 Total Return 121 152 111 102 Distribution Inc 126 123 134 134 EPU (S cts) 4.83 4.61 6.14 6.13 EPU Gth (%) (5) (4) 33 0 DPU (S cts) 8.20 7.99 8.20 8.11 DPU Gth (%) (2) (3) 3 (1) NAV per shr (S cts) 137 141 137 134 PE (X) 23.9 25.0 18.8 18.8 Distribution Yield (%) 7.1 6.9 7.1 7.0 P/NAV (x) 0.8 0.8 0.8 0.9 Aggregate Leverage (%) 37.6 38.4 39.4 39.6 ROAE (%) 3.5 3.3 4.5 4.5 Distn. Inc Chng (%): 0 0 Consensus DPU (S cts): 8.20 8.40 Other Broker Recs: B: 8 S: 0 H: 4
Source of all data on this page: Company, DBS Bank, Bloomberg Finance L.P.
Unrealised potential
Diversified portfolio underpins resilience. We maintain our BUY recommendation on Ascott Residence Trust (ART) and TP of S$1.32. Amid the volatility in the Singapore hospitality market, we believe ART’s diversified portfolio with serviced residences and rental housing across 14 countries in the Asia Pacific, Europe and the US, offers investors a more resilient DPU outlook. ART’s resiliency and cashflow visibility also comes from having 40-50% of its income sourced from master leases and management contracts with minimum guaranteed income. Value from recent acquisitions/AEIs yet to be fully realised. ART has announced c.S$1.2bn worth of acquisitions over the last two years, increasing the value of its assets under management (AUM) by one-third to S$5bn. Combined with completed and ongoing asset enhancement initiatives (AEIs), ART should progressively realise benefits over the next few years. Divestments to strengthen balance sheet. ART’s headline gearing of c.41% is slightly elevated and we are mindful of ART’s adjusted gearing (treating 50% of perpetual securities as debt) which stands at 42-44%. However, we understand this is temporary as ART is reviewing its portfolio mix, and looking to divest some of its lower yielding properties. Valuation: We maintain our DCF-based TP and DPU forecasts which have incorporated the realised forex gains in 3Q16 and lower assumed interest rates given prospects of achieving interest savings as ART refinances its borrowings over the next couple of years, partially offset by moderation of average daily rate (ADR) growth in Japan due to potential impact of the recent strengthening of the JPY. Key Risks to Our View: Oversupply and forex volatility. The key risk to our call is potential oversupply in ART’s key markets as well as impact from forex volatility. These risks are mitigated by ART’s diversified portfolio with no country contributing more than 20% of the group’s net property income. At A Glance Issued Capital (m shrs) 1,653 Mkt. Cap (S$m/US$m) 1,910 / 1,317 Major Shareholders (%) CapitaLand Limited 43.8 Aia Group Ltd 5.0
Free Float (%) 51.2 3m Avg. Daily Val (US$m) 0.89 ICB Industry : Real Estate / Real Estate Investment Trust
DBS Group Research . Equity 4 Jan 2017
Singapore Company Guide
Ascott Residence Trust Version 5 | Bloomberg: ART SP | Reuters: ASRT.SI Refer to important disclosures at the end of this report
76
96
116
136
156
176
196
216
1.0
1.1
1.2
1.3
1.4
1.5
1.6
1.7
Jan-13 Jan-14 Jan-15 Jan-16 Jan-17
Relative IndexS$
Ascott Residence Trust (LHS) Relative STI (RHS)
Page 151

ASIAN INSIGHTS VICKERS SECURITIES Page 2
Company Guide
Ascott Residence Trust
CRITICAL DATA POINTS TO WATCH
Earnings Drivers:
Value of past acquisitions yet to be realised. ART has had an active two years, marking its maiden entries into Malaysia and the US. In addition, ART has deepened its presence in Australia, China and Japan. All in, ART has acquired c.S$1.2bn worth of properties on an average yield of 5-8%. The benefits from these acquisitions should accrue over the next few years. Asset enhancements to drive earnings. Beyond the announced acquisitions, another growth driver for ART are the asset enhancement initiatives it has undertaken or in the process of completing. Refurbishments, which are initiated every 7-10 years, are designed to enhance the market positioning of ART’s various properties and should translate to higher occupancies and room rates. It has announced c.S$95m worth of renovations over the last 18 months in various cities including Barcelona, Dalian, Ho Chi Minh City, London, Manila, Singapore, Shanghai and Tianjin. Australia, Japan and US - key growth markets. With a timely expansion into Australia and Japan, ART is well positioned to take advantage of the growing Australian and Japanese hospitality markets which should translate to healthy RevPAR growth. In addition, ART’s entry into New York provides exposure to the recovering US economy. The abovementioned markets, representing c.34% of ART’s 9M16 net property income (NPI), should help offset potential weakness from its Chinese properties (c.9% of group NPI) which are affected by the economic slowdown in China. Steady income base from Europe and Japan rental properties. Around a third of ART’s NPI comes from properties under master leases in France, Germany, Singapore and Japan (rental properties). With the prudent use of forex hedges, and having properties under management contracts with minimum guaranteed income (14% of group NPI) in Belgium, Spain and UK, ART provides investors with a solid income base. Ambitions to grow portfolio size to S$6bn. ART has ambitions to grow its portfolio from S$5bn currently to S$6bn by 2017. The properties will be sourced from its Sponsor and third parties.
Net Property Income and Margins (%)
Net Property Income and Margins (%)
Distribution Paid / Net Operating CF
Interest Cover (x)
Source: Company, DBS Bank
44.4%
46.4%
48.4%
50.4%
52.4%
54.4%
0
50
100
150
200
250
300
2013A 2014A 2015A 2016F 2017F
S$ m
Net Property Income Net Property Income Margin %
42%
44%
46%
48%
50%
52%
54%
41
43
45
47
49
51
53
55
57
59
2Q20
14
3Q20
14
4Q20
14
1Q20
15
2Q20
15
3Q20
15
4Q20
15
1Q20
16
2Q20
16
3Q20
16
Net Property Income Net Property Income Margin %
0.3
0.4
0.5
0.6
0.7
0.8
0.9
2013A 2014A 2015A 2016F 2017F
(x)
0.00
0.50
1.00
1.50
2.00
2.50
3.00
3.50
4.00
4.50
5.00
2013A 2014A 2015A 2016F 2017F
(x)
Page 152

ASIAN INSIGHTS VICKERS SECURITIES Page 3
Company Guide
Ascott Residence Trust
Balance Sheet:
Temporary increase in gearing. Post ART’s recent acquisition of properties in Australia, Japan and the US, ART’s headline gearing is expected to settle at around the 40-41% level. However, on an adjusted basis treating 50% of the perpetual securities as debt (in line with Moody’s treatment), gearing is expected to hover around 42-44%. While cognizant of the higher gearing near term, we understand ART will look to pare down its debt by disposing some of its lower-yielding properties. Share Price Drivers:
Overcoming past disappointments. ART’s share price has been range bound over the last year due to inconsistent DPU growth over the last two years on account of the dilution impact from the rights issue in late 2013 and weakness from its Chinese properties. However, we believe ART will re-rate as the full benefits from c.S$1.2bn worth of acquisitions and refurbishment activities over the past two years are realised. Key Risks:
Interest rate risks. Any increase in interest rates will result in higher interest payments and reduce the income available for distribution, which will result in lower distribution per unit (DPU) for unitholders. As at 30 September 2016, 80% of ART’s debts are on fixed rates. Currency risk. As ART earns rental income in various currencies, a depreciation of any foreign currency against the SGD could negatively impact DPU. Nevertheless, through the use of currency hedges for EUR and JPY sourced income, as well as the benefits from having a diversified portfolio, FX volatility has had a minimal impact on ART’s earnings historically. In FY13-FY15, changes in ART’s basket of currencies had only a net 0.8-1.5% negative impact on earnings. Company Background
Ascott REIT's Investment portfolio primarily comprises real estate used mainly as serviced residences or rental housing properties (including investments in real estate-related assets and/or other related value-enhancing assets or instruments).
Aggregate Leverage (%)
ROE (%)
Distribution Yield (%)
PB Band (x)
Source: Company, DBS Bank
10.0%
15.0%
20.0%
25.0%
30.0%
35.0%
40.0%
2013A 2014A 2015A 2016F 2017F
0.0%
0.5%
1.0%
1.5%
2.0%
2.5%
3.0%
3.5%
4.0%
4.5%
2013A 2014A 2015A 2016F 2017F
Avg: 6.8%
+1sd: 7.1%
+2sd: 7.5%
‐1sd: 6.4%
‐2sd: 6%
5.1
5.6
6.1
6.6
7.1
7.6
8.1
2013 2014 2015 2016 2017
(%)
Avg: 0.89x
+1sd: 0.96x
+2sd: 1.02x
‐1sd: 0.82x
‐2sd: 0.75x
0.6
0.7
0.8
0.9
1.0
1.1
1.2
1.3
Jan-13 Jan-14 Jan-15 Jan-16 Jan-17
(x)
Page 153

ASIAN INSIGHTS VICKERS SECURITIES Page 4
Company Guide
Ascott Residence Trust
Income Statement (S$m)
FY Dec 2013A 2014A 2015A 2016F 2017F Gross revenue 317 357 421 464 490 Property expenses (155) (177) (217) (245) (261) Net Property Income 161 180 205 219 229 Other Operating expenses (13.0) (19.9) (30.4) (23.2) (23.7) Other Non Opg (Exp)/Inc 0.0 1.29 9.25 0.0 0.0 Net Interest (Exp)/Inc (42.6) (41.2) (48.3) (45.2) (52.3) Exceptional Gain/(Loss) 6.63 0.0 0.0 0.0 0.0 Net Income 112 120 135 151 153 Tax (36.2) (36.9) (36.8) (25.7) (26.1) Minority Interest (6.7) (7.9) (13.8) (6.3) (6.4) Preference Dividend 0.0 (1.4) (13.4) (19.2) (19.2) Net Income After Tax 69.3 74.1 71.2 99.9 102 Total Return 209 121 152 111 102 Non-tax deductible Items (93.8) 4.51 (28.4) 22.5 32.8 Net Inc available for Dist. 115 126 123 134 134 Growth & Ratio Revenue Gth (%) 4.2 12.8 17.9 10.2 5.6 N Property Inc Gth (%) 1.3 11.8 13.5 7.2 4.4 Net Inc Gth (%) 11.2 6.9 (4.0) 40.4 1.7 Dist. Payout Ratio (%) 100.0 100.0 100.0 100.0 100.0 Net Prop Inc Margins (%) 50.9 50.4 48.6 47.2 46.7 Net Income Margins (%) 21.9 20.7 16.9 21.5 20.7 Dist to revenue (%) 36.3 35.2 29.3 28.8 27.4 Managers & Trustee’s fees 4.1 5.6 7.2 5.0 4.8 ROAE (%) 3.8 3.5 3.3 4.5 4.5 ROA (%) 2.1 1.9 1.6 2.1 2.1 ROCE (%) 3.2 3.0 3.0 3.5 3.6 Int. Cover (x) 3.5 3.9 3.6 4.3 3.9
Source: Company, DBS Bank
Growth driven by acquisitions in China, Malaysia, Australia, US and Japan over the past 18 months
Page 154

ASIAN INSIGHTS VICKERS SECURITIES Page 5
Company Guide
Ascott Residence Trust
Quarterly / Interim Income Statement (S$m)
FY Dec 3Q2015 4Q2015 1Q2016 2Q2016 3Q2016 Gross revenue 113 119 106 119 124 Property expenses (58.0) (62.4) (57.0) (61.5) (66.4) Net Property Income 55.2 56.8 48.6 57.9 57.5 Other Operating expenses (6.5) (12.5) (2.6) (7.3) (7.1) Other Non Opg (Exp)/Inc 10.3 6.23 (0.1) (1.1) (1.3) Net Interest (Exp)/Inc (12.1) (13.2) (12.2) (11.7) (12.0) Exceptional Gain/(Loss) 0.0 0.0 0.0 0.0 0.0 Net Income 46.9 37.4 33.7 37.7 37.1 Tax (10.3) (16.6) (6.3) (17.3) (5.6) Minority Interest (1.2) (1.8) (1.4) (1.1) (1.4) Net Income after Tax 35.5 19.0 26.0 19.3 30.0 Total Return 45.8 68.1 25.9 55.6 32.1 Non-tax deductible Items (8.9) (31.2) 6.25 (25.3) 11.5 Net Inc available for Dist. 32.0 32.1 27.3 35.0 38.7 Growth & Ratio Revenue Gth (%) 15 5 (11) 13 4 N Property Inc Gth (%) 12 3 (14) 19 (1) Net Inc Gth (%) 174 (46) 37 (26) 56 Net Prop Inc Margin (%) 48.8 47.7 46.0 48.5 46.4 Dist. Payout Ratio (%) 100.0 100.0 100.0 100.0 100.0
Balance Sheet (S$m)
FY Dec 2013A 2014A 2015A 2016F 2017F Investment Properties 3,177 3,724 4,290 4,567 4,577 Other LT Assets 81.1 80.9 80.2 75.7 71.7 Cash & ST Invts 205 193 220 174 147 Inventory 0.37 0.29 0.30 0.30 0.30 Debtors 11.7 36.4 49.7 50.2 53.0 Other Current Assets 107 87.8 84.2 84.2 84.2 Total Assets 3,582 4,122 4,725 4,951 4,933 ST Debt 50.3 249 258 258 258 Creditor 4.37 119 136 143 151 Other Current Liab 114 7.85 5.24 5.24 5.24 LT Debt 1,147 1,302 1,557 1,695 1,695 Other LT Liabilities 79.1 91.4 99.2 99.2 99.2 Unit holders’ funds 2,093 2,255 2,587 2,663 2,630 Minority Interests 94.1 97.8 81.8 88.0 94.4 Total Funds & Liabilities 3,582 4,122 4,725 4,951 4,933 Non-Cash Wkg. Capital 0.68 (2.0) (7.5) (13.4) (18.5) Net Cash/(Debt) (993) (1,358) (1,595) (1,779) (1,806) Ratio Current Ratio (x) 1.9 0.8 0.9 0.8 0.7 Quick Ratio (x) 1.3 0.6 0.7 0.6 0.5 Aggregate Leverage (%) 33.4 37.6 38.4 39.4 39.6 Z-Score (X) 1.0 0.9 0.8 0.7 0.7
Source: Company, DBS Bank
Increase in gearing on the back of announced acquisitions
Page 155

ASIAN INSIGHTS VICKERS SECURITIES Page 6
Company Guide
Ascott Residence Trust
Cash Flow Statement (S$m)
FY Dec 2013A 2014A 2015A 2016F 2017F Pre-Tax Income 112 120 135 151 153 Dep. & Amort. 13.5 16.3 16.6 16.4 16.4 Tax Paid (13.3) (22.4) (24.1) (25.7) (26.1) Associates &JV Inc/(Loss) 0.00 0.0 0.0 (0.2) (0.2) Chg in Wkg.Cap. 2.30 (25.8) (14.8) 5.91 5.15 Other Operating CF 37.2 64.1 64.5 0.0 0.0 Net Operating CF 152 153 177 147 149 Net Invt in Properties (42.2) (40.0) (46.8) (267) (12.3) Other Invts (net) (180) (428) (352) (10.0) (10.0) Invts in Assoc. & JV 0.0 0.0 0.0 0.0 0.0 Div from Assoc. & JVs 0.0 0.0 0.0 0.0 0.0 Other Investing CF 2.23 7.76 1.76 0.0 0.0 Net Investing CF (220) (461) (397) (277) (22.3) Distribution Paid (107) (116) (125) (134) (134) Chg in Gross Debt (89.8) 315 581 138 0.0 New units issued 398 0.0 0.0 98.5 0.0 Other Financing CF (52.3) 99.7 (213) (19.2) (19.2) Net Financing CF 149 298 243 83.7 (154) Currency Adjustments (0.8) (2.0) 3.66 0.0 0.0 Chg in Cash 79.3 (12.0) 27.9 (46.1) (27.4) Operating CFPS (S cts) 10.9 11.6 12.5 8.69 8.65 Free CFPS (S cts) 8.03 7.33 8.48 (7.4) 8.22
Source: Company, DBS Bank
Target Price & Ratings History
Source: DBS Bank
Analyst: Mervin SONG CFA
S.No.Date of Report
Closing Price
12-mth Target Price
Rat ing
1: 26 Jan 16 1.12 1.33 BUY
2: 15 Mar 16 1.08 1.33 BUY
3: 13 Apr 16 1.12 1.33 BUY
4: 18 Apr 16 1.11 1.28 BUY
5: 21 Jul 16 1.16 1.31 BUY
6: 21 Oct 16 1.15 1.32 BUY
Note : Share price and Target price are adjusted for corporate actions.
1 23
45
6
1.00
1.05
1.10
1.15
1.20
1.25
Jan-16 May-16 Sep-16 Jan-17
S$
Acquisition of properties in Australia, Japan and US partially offset by asset disposals in Japan and Philippines
Page 156

ASIAN INSIGHTS VICKERS SECURITIES ed: JS / sa: YM, PY
HOLD Last Traded Price ( 4 Jan 2017): S$0.82 (STI : 2,921.31) Price Target 12-mth: S$0.93 (14% upside and 9.2% yield) Potential Catalyst: Better than expected results Where we differ: Estimates are below consensus on lower rental reversion assumption Analyst Derek TAN +65 6682 3716 [email protected] Singapore Research Team [email protected] Mervin SONG CFA +65 6682 3715 [email protected]
Price Relative
Forecasts and Valuation FY Dec (S$m) 2015A 2016F 2017F 2018F Gross Revenue 89.7 116 120 124 Net Property Inc 76.2 91.1 89.1 92.5 Total Return (12.3) (2.5) 58.7 61.3 Distribution Inc 67.9 70.8 67.7 68.2 EPU (S cts) 6.66 6.84 6.50 6.75 EPU Gth (%) (8) 3 (5) 4 DPU (S cts) 8.50 7.87 7.51 7.50 DPU Gth (%) (1) (7) (5) 0 NAV per shr (S cts) 100 91.1 90.1 89.4 PE (X) 12.2 11.9 12.5 12.1 Distribution Yield (%) 10.4 9.7 9.2 9.2 P/NAV (x) 0.8 0.9 0.9 0.9 Aggregate Leverage (%) 39.9 39.1 39.2 39.3 ROAE (%) 6.7 7.7 7.2 7.5 Distn. Inc Chng (%): - - - Consensus DPU (S cts): 8.10 7.80 7.90 Other Broker Recs: B: 2 S: 1 H: 7
Source of all data on this page: Company, DBS Bank, Bloomberg Finance L.P.
Operational weakness to persist Maintain HOLD, TP unchanged at S$0.93. Maintain our HOLD call on Cache Logistics Trust (Cache) on uncertainty regarding the outcome of the holding arrangement with Schenker. This currently has a negative impact on outlook and portfolio valuation. While yields are attractive at 8.5%, we believe that uncertainties owing to the oversupply in the overall Singapore warehouse market and more pressure on Cache’s organic growth potential will cap re-rating opportunities. Interim solution to 51 Alps Avenue a key overhang. 3Q16 DPU fell 13.7% y-o-y on the back of an enlarged share base. Looking ahead, we expect pressure on earnings arising from the holding arrangement with Schenker in relation to 51 Alps Avenue until the Court’s final judgement of the dispute. In the interim, Cache has agreed to receive in “protest” Schenker’s rent of S$0.77 per square foot (psf)/ month until further resolution. Under the worst-case scenario, FY17F DPU will drop by 4.0% to 7.2 Scts. We understand that the decline in future cashflows will also result in a c.S$44m write-off on the property valuation and thus, gearing may inch higher to c.42%. Cache may need to address its gearing in the near term. A scenario of higher gearing of 42% (vs 45% regulatory cap), which is above the management’s comfortable level of 35-40% is likely to result in an overhang in the share price of Cache in the immediate term. We believe that the Manager may consider divestments or acquisitions (funding through equity) to pare down its gearing. Depending on the strategy, potential DPU dilution is possible, this has not been factored in our model yet. Valuation: Our target price remains at S$0.93. Maintain HOLD. Key Risks to Our View: Schenker’s rent dispute. The rent dispute at 51 Alps Avenue (Schenker Megahub) is pending the Court’s resolution with an uncertain timeline. If the Court rules to settle the rent significantly below the market price (which is also our assumption), there could be further pressure on TP and DPU. At A Glance Issued Capital (m shrs) 898 Mkt. Cap (S$m/US$m) 732 / 504 Major Shareholders (%) Bank of New York Mellon Corp 4.4 CWT Ltd 4.4 Capital Group Companies Inc 4.3
Free Float (%) 86.9 3m Avg. Daily Val (US$m) 1.1 ICB Industry : Real Estate / Real Estate Investment Trusts
DBS Group Research . Equity 4 Jan 2017
Singapore Company Guide
Cache Logistics Trust Version 7 | Bloomberg: CACHE SP | Reuters: CALT.SI Refer to important disclosures at the end of this report
64
84
104
124
144
164
184
204
0.7
0.8
0.9
1.0
1.1
1.2
1.3
1.4
1.5
1.6
Jan-13 Jan-14 Jan-15 Jan-16 Jan-17
Relative IndexS$
Cache Logistics Trust (LHS) Relative STI (RHS)
Page 157

ASIAN INSIGHTS VICKERS SECURITIES Page 2
Company Guide
Cache Logistics Trust
CRITICAL DATA POINTS TO WATCH
Earnings Drivers:
Well-spread out lease profile offers strong income visibility. Cache Logistics Trust (Cache) offers investors strong income visibility supported by a weighted average lease to expiry (WALE) of 3.8 years by revenues. Cache has renewed a majority of leases up till 2017 and is actively managing these expiries in order to limit disruption to distributions. The REIT has a stable occupancy rate of 96.5% as of 3Q16. Stable underlying occupancy for expiring master-leases. The underlying occupancies for both properties (Schenker Megahub and Hi-Speed Logistics Centre) are fairly high and given the strategic location at the airport logistics hub where there is minimal new supply. Hence, demand for the space should remain resilient, despite the current weak operating climate, made worse by high supply from completions. The non-renewal of the master lease at Hi-Speed Logistics Centre (40 Alps Ave) is not expected to impact earnings significantly. We anticipate that net property income (NPI) for the property will dip by on the back of lower rents and efficiency for the property. However, given that the property only contributes c.5% of top line, actual impact to distributions is expected to be marginal. The court case regarding the renewal of the lease at Schenker Megahub from the anchor tenant (Schenker) is expected to take some time to resolve. Given this uncertainty, we have assumed that rental from this property will fall to the “pre-agreed” rent levels, which reflects a worst-case scenario, in our view. Deepening its presence in Australia to diversify and grow earnings stream. Cache has been able to diversify its earnings base through an acquisition of six properties in Australia, which now contribute close to 14% of top line. The acquisition of these properties in Australia has enabled the REIT to weather the downturn in Singapore better as the long leases from Australia helps provide the REIT with strong income visibility. DHL project a key driver of growth from FY16 onwards. Revenue contribution the DHL property will be a key earnings driver for Cache in 2016 and beyond. The weighted average occupancy for the property is >85% (100% for block 1 by DHL and the tenant is expected to take up the remaining space at block 2 in two years' time). The long 10-year lease, coupled with extension options to the end of the land lease offers strong income visibility for the REIT.
Net Property Income and Margins (%)
Net Property Income and Margins (%)
Distribution Paid / Net Operating CF
Interest Cover (x)
Source: Company, DBS Bank
70.8%
75.8%
80.8%
85.8%
90.8%
95.8%
100.8%
0
10
20
30
40
50
60
70
80
90
100
2014A 2015A 2016F 2017F 2018F
S$ m
Net Property Income Net Property Income Margin %
70%
75%
80%
85%
90%
95%
100%
18
19
20
21
22
23
24
2Q20
14
3Q20
14
4Q20
14
1Q20
15
2Q20
15
3Q20
15
4Q20
15
1Q20
16
2Q20
16
3Q20
16
Net Property Income Net Property Income Margin %
0.4
0.5
0.6
0.7
0.8
0.9
1.0
1.1
2014A 2015A 2016F 2017F 2018F
(x)
0.00
1.00
2.00
3.00
4.00
5.00
6.00
2014A 2015A 2016F 2017F 2018F
(x)
Page 158

ASIAN INSIGHTS VICKERS SECURITIES Page 3
Company Guide
Cache Logistics Trust
Balance Sheet:
Gearing close to optimal level of 40%; limited capacity to acquire further. Cache’s gearing is expected to hover around 40% in FY16-18F. We note that this is at the higher end of management’s comfortable range of 35-40%, and will likely mean that further acquisition capacity will be limited. However, given more acquisition opportunities on the horizon, we believe that new deals will be partly funded by raising new equity. No refinancing required in 2016. Cache has a weighted average debt to maturity of 2.4 years with no refinancing requirements till 2017. It has 64% of its borrowings hedged into fixed rates. Share Price Drivers:
Acquisition of assets in its ROFR. Cache has been granted the Rights of First Refusal (ROFR) to 15 properties by its Sponsor (CWT) and C&P in the Asia Pacific. These 15 properties can approximately contribute 5.7m sq ft in gross floor area which when acquired, is expected to significantly increase its portfolio size, earnings and thus provide uplift to share price. Beating market outlook. While the warehouse market is expected to see a deluge of new supply completions over 2016-2018, a majority of Cache’s leases are MNCs and 3PLs, and hence we believe occupancy rates should remain steady. Higher rents achieved given its quality portfolio could outperform market expectations that rents would moderate. Key Risks:
Interest rate risk Any increase in interest rates will result in higher interest payments for the REIT, hence reducing the income available for distribution, which will result in lower distribution per unit (DPU) for unitholders. Economic risk A weaker economic outlook could have a negative impact on industrial rents and occupancies as companies cut back on production and require less space. Industrial rents have a strong historical correlation with GDP growth. Company Background
Cache is a REIT whose investment mandate is to invest primarily in logistics properties located in the Pan Pacific region.
Aggregate Leverage (%)
ROE (%)
Distribution Yield (%)
PB Band (x)
Source: Company, DBS Bank
10.0%
15.0%
20.0%
25.0%
30.0%
35.0%
40.0%
2014A 2015A 2016F 2017F 2018F
0.0%
1.0%
2.0%
3.0%
4.0%
5.0%
6.0%
7.0%
2014A 2015A 2016F 2017F 2018F
Avg: 7.9%
+1sd: 9.1%
+2sd: 10.2%
‐1sd: 6.8%
‐2sd: 5.7%
5.1
6.1
7.1
8.1
9.1
10.1
11.1
2013 2014 2015 2016 2017
(%)
Avg: 1.11x
+1sd: 1.27x
+2sd: 1.43x
‐1sd: 0.96x
‐2sd: 0.8x
0.7
0.9
1.1
1.3
1.5
1.7
Jan-13 Jan-14 Jan-15 Jan-16 Jan-17
(x)
Page 159

ASIAN INSIGHTS VICKERS SECURITIES Page 4
Company Guide
Cache Logistics Trust
Income Statement (S$m)
FY Dec 2014A 2015A 2016F 2017F 2018F Gross revenue 82.9 89.7 116 120 124 Property expenses (4.9) (13.6) (25.0) (30.4) (31.6) Net Property Income 78.0 76.2 91.1 89.1 92.5 Other Operating expenses (8.6) (9.5) (10.1) (10.2) (10.3) Other Non Opg (Exp)/Inc 0.0 0.0 0.0 0.0 0.0 Net Interest (Exp)/Inc (12.2) (13.7) (18.9) (19.5) (20.1) Exceptional Gain/(Loss) 0.0 0.0 0.0 0.0 0.0 Net Income 57.2 53.0 62.1 59.4 62.1 Tax (0.5) (0.6) (0.6) (0.8) (0.8) Minority Interest 0.0 0.0 0.0 0.0 0.0 Preference Dividend 0.0 0.0 0.0 0.0 0.0 Net Income After Tax 56.7 52.4 61.5 58.7 61.3 Total Return 65.7 (12.3) (2.5) 58.7 61.3 Non-tax deductible Items 1.07 75.2 6.00 6.05 6.09 Net Inc available for Dist. 66.8 67.9 70.8 67.7 68.2 Growth & Ratio Revenue Gth (%) 2.3 8.3 29.4 2.9 3.9 N Property Inc Gth (%) 1.5 (2.4) 19.7 (2.2) 3.8 Net Inc Gth (%) (0.4) (7.7) 17.3 (4.6) 4.6 Dist. Payout Ratio (%) 100.0 100.0 100.0 100.0 100.0 Net Prop Inc Margins (%) 94.1 84.9 78.5 74.6 74.6 Net Income Margins (%) 68.5 58.4 53.0 49.1 49.4 Dist to revenue (%) 80.6 75.7 61.0 56.7 55.0 Managers & Trustee’s fees 10.3 10.6 8.7 8.5 8.3 ROAE (%) 7.4 6.7 7.7 7.2 7.5 ROA (%) 5.1 4.3 4.6 4.3 4.5 ROCE (%) 6.3 5.4 6.0 5.8 6.0 Int. Cover (x) 5.7 4.9 4.3 4.0 4.1
Source: Company, DBS Bank
Driven mainly from conversion of single user to multi-user properties
Page 160

ASIAN INSIGHTS VICKERS SECURITIES Page 5
Company Guide
Cache Logistics Trust
Quarterly / Interim Income Statement (S$m)
FY Dec 3Q2015 4Q2015 1Q2016 2Q2016 3Q2016 Gross revenue 23.1 24.0 27.9 28.1 28.0 Property expenses (4.4) (4.9) (5.8) (5.5) (6.0) Net Property Income 18.8 19.2 22.1 22.6 22.1 Other Operating expenses (2.0) (3.0) (2.6) (2.6) (3.0) Other Non Opg (Exp)/Inc 0.00 0.00 0.0 0.15 0.0 Net Interest (Exp)/Inc (4.1) (4.7) (4.8) (4.7) (4.9) Exceptional Gain/(Loss) 0.0 0.0 0.0 0.0 0.0 Net Income 12.6 11.5 14.6 15.5 14.2 Tax (0.2) (0.2) (0.4) 0.12 (0.3) Minority Interest 0.0 0.0 0.0 0.0 0.0 Net Income after Tax 12.4 11.3 14.2 15.6 13.9 Total Return 12.4 (53.4) 14.2 15.6 (22.2) Non-tax deductible Items 4.36 68.9 4.08 2.22 38.7 Net Inc available for Dist. 16.8 15.5 18.2 17.8 16.6 Growth & Ratio Revenue Gth (%) 7 4 16 1 0 N Property Inc Gth (%) 2 2 15 2 (2) Net Inc Gth (%) (8) (9) 25 10 (11) Net Prop Inc Margin (%) 81.2 79.8 79.1 80.3 78.7 Dist. Payout Ratio (%) 100.0 100.0 100.0 100.0 100.0
Balance Sheet (S$m)
FY Dec 2014A 2015A 2016F 2017F 2018F Investment Properties 1,122 1,311 1,345 1,345 1,346 Other LT Assets 0.24 1.84 1.84 1.84 1.84 Cash & ST Invts 11.3 8.05 7.37 6.09 6.99 Inventory 0.0 0.0 0.0 0.0 0.0 Debtors 3.46 4.98 2.90 2.99 3.10 Other Current Assets 0.09 0.42 0.42 0.42 0.42 Total Assets 1,137 1,326 1,357 1,356 1,358 ST Debt 6.62 8.31 8.31 8.31 8.31 Creditor 20.5 14.3 9.68 9.96 10.3 Other Current Liab 0.0 0.0 0.64 0.78 0.81 LT Debt 343 515 517 519 521 Other LT Liabilities 0.41 2.06 2.06 2.06 2.06 Unit holders’ funds 767 787 819 816 815 Minority Interests 0.0 0.0 0.0 0.0 0.0 Total Funds & Liabilities 1,137 1,326 1,357 1,356 1,358 Non-Cash Wkg. Capital (17.0) (8.9) (7.0) (7.3) (7.6) Net Cash/(Debt) (338) (515) (518) (521) (522) Ratio Current Ratio (x) 0.5 0.6 0.6 0.5 0.5 Quick Ratio (x) 0.5 0.6 0.6 0.5 0.5 Aggregate Leverage (%) 31.1 39.9 39.1 39.2 39.3 Z-Score (X) 1.5 1.1 1.3 1.2 1.2
Source: Company, DBS Bank
Gearing level remains close to 40%.
Outlook remains flattish given limited expiries.
Page 161

ASIAN INSIGHTS VICKERS SECURITIES Page 6
Company Guide
Cache Logistics Trust
Cash Flow Statement (S$m)
FY Dec 2014A 2015A 2016F 2017F 2018F Pre-Tax Income 57.2 53.0 62.1 59.4 62.1 Dep. & Amort. 0.22 0.65 0.0 0.0 0.0 Tax Paid (0.3) (0.6) 0.0 (0.6) (0.8) Associates &JV Inc/(Loss) 0.0 0.0 0.0 0.0 0.0 Chg in Wkg.Cap. 13.2 (8.1) (2.5) 0.20 0.27 Other Operating CF 3.51 30.1 6.00 6.05 6.09 Net Operating CF 73.8 75.1 65.6 65.0 67.7 Net Invt in Properties (63.5) (263) (97.5) (0.6) (0.6) Other Invts (net) 0.0 0.0 0.0 0.0 0.0 Invts in Assoc. & JV 0.0 0.0 0.0 0.0 0.0 Div from Assoc. & JVs 0.0 0.0 0.0 0.0 0.0 Other Investing CF 0.17 0.06 0.0 0.0 0.0 Net Investing CF (63.3) (263) (97.5) (0.6) (0.6) Distribution Paid (66.7) (74.2) (70.8) (67.7) (68.2) Chg in Gross Debt 42.2 173 2.00 2.00 2.00 New units issued 0.0 98.5 100 0.0 0.0 Other Financing CF (15.5) (12.8) 0.0 0.0 0.0 Net Financing CF (40.1) 185 31.2 (65.7) (66.2) Currency Adjustments 0.04 0.0 0.0 0.0 0.0 Chg in Cash (29.5) (3.2) (0.7) (1.3) 0.90 Operating CFPS (S cts) 7.76 10.6 7.58 7.19 7.42 Free CFPS (S cts) 1.33 (23.9) (3.5) 7.14 7.38
Source: Company, DBS Bank
Target Price & Ratings History
Source: DBS Bank
Analyst: Derek TAN
Singapore Research Team
Mervin SONG CFA
S.No.Date of Report
Closing Price
12-mth Target Price
Rat ing
1: 26 Jan 16 0.88 0.96 BUY
2: 25 Apr 16 0.89 0.93 BUY
3: 31 May 16 0.87 0.93 BUY
4: 21 Jul 16 0.88 0.93 BUY
5: 22 Aug 16 0.91 0.93 BUY
6: 28 Sep 16 0.91 0.93 HOLD
7: 24 Oct 16 0.87 0.93 HOLD
Note : Share price and Target price are adjusted for corporate actions.
1
2
3
4 5
6
7
0.75
0.80
0.85
0.90
0.95
Jan-16 May-16 Sep-16 Jan-17
S$
Page 162

ASIAN INSIGHTS VICKERS SECURITIES ed: JS / sa: YM, PY
HOLD
Last Traded Price (4 Jan 2017): S$0.54 (STI : 2,921.31)
Price Target 12-mth: S$0.54 (0% upside and 7.6% yield)
Potential Catalyst: Turnaround in rental prospects.
Where we differ: Estimates are below consensus Derek TAN +65 6682 3716 [email protected] Singapore Research Team [email protected]
Price Relative
Forecasts and Valuation FY Dec (S$m) 2015A 2016F 2017F 2018F
Gross Revenue 112 110 112 113 Net Property Inc 86.2 80.3 81.5 82.6 Total Return 52.5 52.2 53.2 53.1 Distribution Inc 61.8 53.2 54.2 54.1 EPU (S cts) 4.33 4.03 4.08 4.07 EPU Gth (%) 3 (7) 1 0 DPU (S cts) 4.79 4.11 4.16 4.15 DPU Gth (%) (4) (14) 1 0 NAV per shr (S cts) 67.7 66.9 66.8 66.7 PE (X) 12.6 13.5 13.3 13.4 Distribution Yield (%) 8.8 7.5 7.6 7.6 P/NAV (x) 0.8 0.8 0.8 0.8 Aggregate Leverage (%) 36.7 37.6 37.9 38.1 ROAE (%) 6.3 6.0 6.1 6.1 Distn. Inc Chng (%): 0 0 0 Consensus DPU (S cts): 4.20 4.20 4.30
Other Broker Recs: B: 3 S: 0 H: 2
Source of all data on this page: Company, DBS Bank, Bloomberg Finance L.P.
Still Feeling the Pain of Transition Transitional pain to continue, HOLD. TP S$0.54. Cambridge Industrial Trust (CREIT) remains in the midst of a portfolio reposition in the midst of the current downtown in the industrial space. While portfolio occupancy remains fairly high, it is at the expense of declining rents, a painful but justified strategy for the REIT. A couple of roadbumps : (i) its Australian partner is terminating its joint venture, putting a pause to plans to develop and grow an Australian business; and (ii) more potential downside to DPUs on the back of more conversions from single-tenanted properties to multi-tenanted ones. Our TP and estimates are cut by 8% on the back of lower margin assumptions. Maintain HOLD, TP S$0.54. Asset recycling to redeploy capital; looking to Australia. CREIT has been active in acquisitions, and is focusing on optimizing its portfolio performance through strategic asset enhancement initiatives (AEIs) and divestments to redeploy capital to higher-yielding sources. While its Australia JV partner has ceased the partnership, the Manager remains committed to its long-term acquisition strategy in Australia and is actively exploring other opportunities. Outcome of strategic review key to re-rating. The Manager is conducting a strategic review of CREIT’s business and operations to fulfill its strategy of maximising value for its unitholders and has appointed Goldman Sachs (Singapore) Pte to assist in its analysis. The strategic review may open up a myriad of scenarios (M&A, trade sale or even an internalisation). Any incremental steps taken by the Manager to drive value should be well received by investors. Valuation:
Our DCF-backed TP is S$0.54. The stock is offering a forward yield
over 7.5%, which we believe will cap further downside to share
price. Maintain HOLD.
Key Risks to Our View:
Interest rate risk. Any increase in interest rates will result in higher
interest payments which will reduce income available for
distribution and DPUs.
At A Glance Issued Capital (m shrs) 1,304
Mkt. Cap (S$m/US$m) 704 / 498
Major Shareholders (%)
Jinquan Tong 17.84
Chan Wai Kheong 5.39
Credit Suisse Group AG 5.00
Free Float (%) 71.77
3m Avg. Daily Val (US$m) 0.60
ICB Industry : Real Estate / Real Estate Investment Trust
CRITICAL DATA POINTS TO WATCH
Earnings Drivers:
DBS Group Research . Equity
4 Jan 2017
Singapore Company Guide
Cambridge Industrial Trust Version 5 | Bloomberg: CREIT SP | Reuters: CMIT.SI Refer to important disclosures at the end of this report
76
96
116
136
156
176
196
216
0.4
0.5
0.5
0.6
0.6
0.7
0.7
0.8
0.8
0.9
0.9
Jan-13 Jan-14 Jan-15 Jan-16 Jan-17
Relative IndexS$
Cambridge Industrial Trust (LHS) Relative STI (RHS)
Page 163

ASIAN INSIGHTS VICKERS SECURITIES
Page 2
Company Guide
Cambridge Industrial Trust
Property conversions to cause headwinds to occupancy rates.
While we note that CREIT offers strong income visibility with a
relatively long weighted average lease expiry of 3.8 years,
property conversions (from single-tenanted properties to multi-
tenanted ones when the leases expire) which account for
11.3% and 23.6% of revenues over FY16-17F will translate to
near-term pressure to top line. This is due to the loss of property
efficiency and higher vacancy rates when these conversions take
place. However, the pace of conversions is expected to taper off
from FY17 onwards, meaning that further downside in vacancy
rates will likely be limited.
In view of the competitive environment, the Manager is
focusing on maintaining occupancy rates and thus rental
reversionary rates are likely to turn slightly negative over these
two years.
Optimal gearing level implies that upside from acquisitions is
likely to be limited. Gearing level of c.37% is within
management's comfortable range of 35-40% and is optimal, in
our view. This is likely to mean that while the Manager remains
keen to grow the portfolio via acquisitions and is looking to
venture overseas for potential opportunities, there is a cap to
the number of deals it can look at.
Asset rejuvenation strategy. CREIT has recently completed the
sale of 23 Tuas Ave 10. The divestment price is 5% above
valuation. Proceeds are expected to be utilised towards debt
repayment and/or asset enhancement opportunities. The
Manager will be embarking on asset enhancement initiative at
120 Pioneer Road (completing in 3Q17) which will increase the
property’s attractiveness to end-users.
Strategic review. The Manager is conducting a strategic review
of CREIT’s business and operations to fulfill its strategy of
maximising value for unitholders of CREIT and has appointed
Goldman Sachs (Singapore) Pte to assist in its analysis.
Net Property Income and Margins (%)
Net Property Income and Margins (%)
Distribution Paid / Net Operating CF
Interest Cover (x)
Source: Company, DBS Bank
69.4%
71.4%
73.4%
75.4%
77.4%
79.4%
81.4%
83.4%
85.4%
0
10
20
30
40
50
60
70
80
90
100
2014A 2015A 2016F 2017F 2018F
S$ m
Net Property Income Net Property Income Margin %
68%
70%
72%
74%
76%
78%
80%
82%
19
19
20
20
21
21
22
22
23
2Q20
14
3Q20
14
4Q20
14
1Q20
15
2Q20
15
3Q20
15
4Q20
15
1Q20
16
2Q20
16
3Q20
16
Net Property Income Net Property Income Margin %
0.2
0.4
0.6
0.8
1.0
1.2
2014A 2015A 2016F 2017F 2018F
(x)
3.20
3.30
3.40
3.50
3.60
3.70
3.80
3.90
4.00
2014A 2015A 2016F 2017F 2018F
(x)
Page 164

ASIAN INSIGHTS VICKERS SECURITIES Page 3
Company Guide
Cambridge Industrial Trust
Balance Sheet:
Gearing remains stable Looking ahead, there is limited capacity to pursue acquisition opportunities with gearing at c.37%. Pro-active capital management. CREIT has refinanced most of its loans expiring and has no refinancing due till 2H18. In addition, the Manager has fixed c.88% of its interest rates over the next 3.2 years, meaning that volatility from a hike in interest rates to have a marginal impact to distributions. Share Price Drivers:
Pick-up in occupancy rate. We believe that expected vacancies and earnings weakness arising from property conversions from single-tenanted to multi-tenanted could be an overhang on the stock. The ability to retain tenants will alleviate such risks and may result in higher prices. Not likely to see acquisitions given gearing of 37%. The Manager remains keen to grow the portfolio through acquisitions. Given limited accretive deals in Singapore, CREIT has broadened its investment focus to Australia, Japan and Malaysia, which the Manager has identified as having similar sovereign risks and transparency characteristics with Singapore. Key Risks:
Interest rate risk. Any increase in interest rates will result in higher interest payments which will reduce income available for distribution and result in lower distribution per unit (DPU) to unitholders. That said, CREIT has substantially hedged its interest rate exposure. Economic risk. A deterioration in the economic outlook could have a negative impact on industrial rents and occupancies as companies cut back production and require less space. Industrial rents have a strong correlation with GDP growth. Company Background
Cambridge Industrial Trust (CREIT) is a real estate investment trust which invests primarily in income-producing industrial assets located in Singapore.
Aggregate Leverage (%)
ROE (%)
Distribution Yield (%)
PB Band (x)
Source: Company, DBS Bank
10.0%
15.0%
20.0%
25.0%
30.0%
35.0%
40.0%
2014A 2015A 2016F 2017F 2018F
0.0%
1.0%
2.0%
3.0%
4.0%
5.0%
6.0%
2014A 2015A 2016F 2017F 2018F
Avg: 7.4%
+1sd: 8.1%
+2sd: 8.8%
‐1sd: 6.6%
‐2sd: 5.9%
5.0
6.0
7.0
8.0
9.0
10.0
2013 2014 2015 2016
(%)
Avg: 0.97x
+1sd: 1.09x
+2sd: 1.22x
‐1sd: 0.85x
‐2sd: 0.72x
0.6
0.7
0.8
0.9
1.0
1.1
1.2
1.3
1.4
1.5
Jan-13 Jan-14 Jan-15 Jan-16
(x)
Page 165

ASIAN INSIGHTS VICKERS SECURITIES Page 4
Company Guide
Cambridge Industrial Trust
Income Statement (S$m)
FY Dec 2014A 2015A 2016F 2017F 2018F Gross revenue 99.3 112 110 112 113 Property expenses (21.5) (26.1) (29.7) (30.1) (30.6) Net Property Income 77.8 86.2 80.3 81.5 82.6 Other Operating expenses (9.7) (9.4) (7.7) (7.7) (7.7) Other Non Opg (Exp)/Inc 0.0 0.0 0.0 0.0 0.0 Net Interest (Exp)/Inc (17.5) (22.1) (20.4) (20.6) (21.8) Exceptional Gain/(Loss) 1.14 0.40 0.0 0.0 0.0 Net Income 52.3 55.2 52.2 53.2 53.1 Tax (0.1) 0.0 0.0 0.0 0.0 Minority Interest 0.0 0.0 0.0 0.0 0.0 Preference Dividend 0.0 0.0 0.0 0.0 0.0 Net Income After Tax 52.2 55.2 52.2 53.2 53.1 Total Return 45.3 52.5 52.2 53.2 53.1 Non-tax deductible Items 12.3 7.20 1.00 1.00 1.00 Net Inc available for Dist. 63.0 61.8 53.2 54.2 54.1 Growth & Ratio Revenue Gth (%) 3.0 13.0 (2.0) 1.5 1.4 N Property Inc Gth (%) (3.2) 10.7 (6.8) 1.5 1.4 Net Inc Gth (%) 4.2 5.8 (5.3) 1.9 (0.3) Dist. Payout Ratio (%) 100.0 100.0 100.0 100.0 100.0 Net Prop Inc Margins (%) 78.3 76.8 73.0 73.0 73.0 Net Income Margins (%) 52.5 49.1 47.5 47.7 46.9 Dist to revenue (%) 63.5 55.1 48.4 48.6 47.8 Managers & Trustee’s fees 9.7 8.4 7.0 6.9 6.8 ROAE (%) 6.0 6.3 6.0 6.1 6.1 ROA (%) 3.9 3.9 3.7 3.7 3.7 ROCE (%) 5.3 5.6 5.1 5.2 5.3 Int. Cover (x) 3.9 3.5 3.6 3.6 3.4
Source: Company, DBS Bank
Earnings outlook to remain flattish in the absence of acquisitions
Page 166

ASIAN INSIGHTS VICKERS SECURITIES Page 5
Company Guide
Cambridge Industrial Trust
Quarterly / Interim Income Statement (S$m)
FY Dec 3Q2015 4Q2015 1Q2016 2Q2016 3Q2016 Gross revenue 28.5 28.5 28.4 28.3 27.6 Property expenses (6.8) (6.9) (6.9) (7.1) (7.7) Net Property Income 21.7 21.6 21.5 21.2 19.9 Other Operating expenses (2.3) (2.2) (2.3) (2.3) (2.3) Other Non Opg (Exp)/Inc 0.0 0.0 0.0 0.0 0.0 Net Interest (Exp)/Inc (4.8) (5.3) (5.0) (5.5) (5.5) Exceptional Gain/(Loss) 0.0 (0.2) (0.4) (0.9) 0.0 Net Income 14.7 14.0 13.8 12.5 12.2 Tax 0.0 0.0 0.0 0.0 0.0 Minority Interest 0.0 0.0 0.0 0.0 0.0 Net Income after Tax 14.7 14.0 13.8 12.5 12.2 Total Return 14.7 12.5 13.8 12.5 12.9 Non-tax deductible Items 0.87 2.30 0.73 1.53 0.0 Net Inc available for Dist. 15.6 14.8 14.5 14.1 12.9 Growth & Ratio Revenue Gth (%) 2 0 0 0 (2) N Property Inc Gth (%) 1 (1) (1) (2) (6) Net Inc Gth (%) 37 (5) (1) (9) (3) Net Prop Inc Margin (%) 76.3 75.8 75.8 74.8 72.0 Dist. Payout Ratio (%) 100.0 100.0 100.0 100.0 100.0
Balance Sheet (S$m)
FY Dec 2014A 2015A 2016F 2017F 2018F Investment Properties 1,335 1,377 1,379 1,381 1,383 Other LT Assets 16.4 0.0 0.0 0.0 0.0 Cash & ST Invts 6.10 2.66 2.20 4.28 6.37 Inventory 0.0 0.0 0.0 0.0 0.0 Debtors 10.9 9.65 1.69 1.72 1.74 Other Current Assets 11.9 41.2 41.2 41.2 41.2 Total Assets 1,381 1,431 1,424 1,429 1,433 ST Debt 50.0 0.0 0.0 0.0 0.0 Creditor 26.4 24.0 7.58 7.70 7.80 Other Current Liab 0.0 0.0 0.0 0.0 0.0 LT Debt 426 525 536 541 546 Other LT Liabilities 12.3 8.74 8.74 8.74 8.74 Unit holders’ funds 866 873 872 871 870 Minority Interests 0.0 0.0 0.0 0.0 0.0 Total Funds & Liabilities 1,381 1,431 1,424 1,429 1,433 Non-Cash Wkg. Capital (3.6) 26.9 35.3 35.2 35.1 Net Cash/(Debt) (469) (523) (534) (537) (540) Ratio Current Ratio (x) 0.4 2.2 5.9 6.1 6.3 Quick Ratio (x) 0.2 0.5 0.5 0.8 1.0 Aggregate Leverage (%) 35.6 36.7 37.6 37.9 38.1 Z-Score (X) 1.0 1.0 1.1 1.1 1.1
Source: Company, DBS Bank
Gearing to remain at the optimal level of c.38%
Lower distributable income mainly due to higher finance costs and zero management fees paid in units.
Page 167

ASIAN INSIGHTS VICKERS SECURITIES Page 6
Company Guide
Cambridge Industrial Trust
Cash Flow Statement (S$m)
FY Dec 2014A 2015A 2016F 2017F 2018F Pre-Tax Income 52.3 55.2 52.2 53.2 53.1 Dep. & Amort. 0.0 0.0 0.0 0.0 0.0 Tax Paid 0.0 (0.1) 0.0 0.0 0.0 Associates &JV Inc/(Loss) (0.5) (0.1) 0.0 0.0 0.0 Chg in Wkg.Cap. (4.2) (0.3) (8.5) 0.09 0.08 Other Operating CF 19.3 24.5 0.0 0.0 0.0 Net Operating CF 66.9 79.1 43.8 53.3 53.2 Net Invt in Properties (195) (40.6) (2.0) (2.0) (2.0) Other Invts (net) 0.0 (10.6) 0.0 0.0 0.0 Invts in Assoc. & JV 0.0 0.0 0.0 0.0 0.0 Div from Assoc. & JVs 0.0 0.0 0.0 0.0 0.0 Other Investing CF 0.82 1.08 0.0 0.0 0.0 Net Investing CF (194) (50.1) (2.0) (2.0) (2.0) Distribution Paid (42.6) (48.4) (53.2) (54.2) (54.1) Chg in Gross Debt 102 16.1 11.0 5.00 5.00 New units issued (0.2) (0.3) 0.0 0.0 0.0 Other Financing CF 0.0 0.0 0.0 0.0 0.0 Net Financing CF 59.4 (32.6) (42.2) (49.2) (49.1) Currency Adjustments 0.0 0.0 0.0 0.0 0.0 Chg in Cash (67.9) (3.6) (0.5) 2.09 2.08 Operating CFPS (S cts) 5.73 6.23 4.03 4.08 4.07 Free CFPS (S cts) (10.3) 3.02 3.22 3.94 3.92 Source: Company, DBS Bank
Target Price & Ratings History
Source: DBS Bank
Analyst: Derek TAN, Singapore Research Team
S.No.Date of Report
Closing Price
12-mth Target Price
Rat ing
1: 28 Apr 16 0.55 0.56 HOLD
2: 25 Jul 16 0.56 0.60 HOLD
3: 22 Aug 16 0.55 0.60 HOLD
4: 26 Oct 16 0.55 0.54 HOLD
5: 28 Nov 16 0.53 0.54 HOLD
Note : Share price and Target price are adjusted for corporate actions.
1
2
3
4
5
0.46
0.48
0.50
0.52
0.54
0.56
0.58
0.60
Jan-16 May-16 Sep-16 Jan-17
S$
Page 168

ASIAN INSIGHTS VICKERS SECURITIES ed: JS / sa: YM, PY
BUY Last Traded Price ( 4 Jan 2017): S$1.51 (STI : 2,921.31) Price Target 12-mth: S$1.70 (13% upside and 6.2% yield) Potential Catalyst: Delivery of DPU growth in the midst of a downturn in the Singapore office market Where we differ: Above consensus after incorporating the acquisition of 60% interest in CapitaGreen Analyst Mervin SONG CFA +65 6682 3715 [email protected] Derek TAN +65 6682 3716 [email protected]
Price Relative
Forecasts and Valuation FY Dec (S$m) 2014A 2015A 2016F 2017F Gross Revenue 263 273 277 348 Net Property Inc 205 213 217 273 Total Return 449 307 241 259 Distribution Inc 249 254 266 280 EPU (S cts) 12.6 10.4 8.15 8.62 EPU Gth (%) 38 (18) (22) 6 DPU (S cts) 8.46 8.62 8.98 9.31 DPU Gth (%) 3 2 4 4 NAV per shr (S cts) 175 177 177 175 PE (X) 11.9 14.4 18.5 17.5 Distribution Yield (%) 5.6 5.7 6.0 6.2 P/NAV (x) 0.9 0.8 0.9 0.9 Aggregate Leverage (%) 30.4 30.0 37.5 37.5 ROAE (%) 7.3 5.9 4.6 4.9 Distn. Inc Chng (%): - - Consensus DPU (S cts): 8.90 9.10 Other Broker Recs: B: 13 S: 4 H: 7
Source of all data on this page: Company, DBS Bank, Bloomberg Finance L.P.
Moving from green to gold
Timely acquisition of CapitaGreen. Despite the expected decline in the office market, we believe the timely acquisition of the remaining 60% in CapitaGreen not only helps to offset potential negative rental reversions and lower occupancies for the rest of CapitaLand Commercial Trust (CCT)’s portfolio but will allow CCT to deliver a 2-year DPU CAGR of 4% (2015-2017 excluding impact from redevelopment of Golden Shoe), which is among the highest in the office sector (average of 2%) and above the S-REIT DPU CAGR of 1%.
Trading at a discount to physical office transactions. Investors have been concerned over the value of CCT’s portfolio given falling office rents. We believe this is unwarranted given the resiliency of office property values in Singapore. CCT’s Singapore Grade A office portfolio trades at an implied value of c.S$1,900 per square foot (psf) compared to recent sales of between c.S$2,700 (adjusted for 99-year leasehold for CapitaGreen) and $3,500 psf. While CCT’s Grade A portfolio is unlikely to trade up to c.S$2,700 given the older profile of some of its properties, we believe the current strength of the physical market and 999-year leasehold status of some of its buildings, warrants CCT to trade close to its book value per unit of S$1.72 or an implied valuation of S$2,000 psf.
Medium term upside from redevelopment of Golden Shoe Car Park. CCT announced the redevelopment of its Golden Shoe Car Park property. Subject to obtaining the necessary government approvals, the property will be developed into one with c.1m square feet (sqft) of commercial space in terms of gross floor area (GFA) and comprise an office tower of up to 280 metres high. Upon completion in 2021, the property will provide a medium term uplift to CCT’s current NAV per unit of S$1.72.
Valuation:
Our DCF-based TP of S$1.70 implies a price of c.S$2,000 psf for CCT’s Singapore portfolio.
Key Risks to Our View:
A key risk to our view is new office supply causing spot rents to fall below S$7 psf, which is likely to lead to lower-than-expected asking rents and rental income.
At A Glance Issued Capital (m shrs) 2,963 Mkt. Cap (S$m/US$m) 4,460 / 3,075 Major Shareholders (%) Capitaland Limited 31.1 Blackrock 6.6 CBRE Group Inc 4.9
Free Float (%) 57.4 3m Avg. Daily Val (US$m) 10.1 ICB Industry : Real Estate / Real Estate Investment Trust
DBS Group Research . Equity 4 Jan 2017
Singapore Company Guide
CapitaLand Commercial Trust Version 6 | Bloomberg: CCT SP | Reuters: CACT.SI Refer to important disclosures at the end of this report
74
94
114
134
154
174
194
214
1.1
1.2
1.3
1.4
1.5
1.6
1.7
1.8
1.9
2.0
2.1
Jan-13 Jan-14 Jan-15 Jan-16 Jan-17
Relative IndexS$
CapitaLand Commercial Trust (LHS) Relative STI (RHS)
Page 169

ASIAN INSIGHTS VICKERS SECURITIES Page 2
Company Guide
CapitaLand Commercial Trust
CRITICAL DATA POINTS TO WATCH
Earnings Drivers:
Staggered weighted lease expiry profile to help mitigate negative rental reversions. We have factored in lower occupancies and negative reversions at Capital Tower, Six Battery Road, and One George Street for FY16 and FY17. CCT’s defensive weighted average lease expiry (WALE) of 6.8 years (by net lettable area (NLA)) should also help ensure that the negative impact from an anticipated decline in rents over the next two years will be gradual rather than immediate. Thus, CCT offers investors a measure of earnings stability and certainty amid record office completions over the next two years. Defensive portfolio with >70% of office leases expiring in FY19 and beyond, coinciding with the period when Singapore faces no new office supply. CCT has maintained a defensive leasing strategy amid stiff competition for larger tenants by locking in longer-term leases for most of its top 10 tenants. With proactive forward renewals, more than 70% of office leases now expire in FY19 and beyond. This fortuitously coincides with the period when the Singapore office market should be on an upturn as no new office buildings will be completed from FY18 onwards. CapitaGreen contribution to weather CCT through tough times. CCT’s near-term earnings will be driven by the acquisition of the 60% remaining interest in CapitaGreen. We believe the increased contribution from CapitaGreen will not only help offset potential negative rental reversions at CCT’s other properties but also contribute to 4% DPU CAGR over the next couple of years (excluding any loss of income from redevelopment of Golden Shoe). Beyond the boost from the higher equity interest in CapitaGreen (40% previously to 100%), CCT should benefit from the higher underlying earnings at CapitaGreen as tenants progressively move into the building and rent-free periods start to expire. Medium term upside from redevelopment of Golden Shoe Car Park. CCT announced the redevelopment of its Golden Shoe Car Park property. Subject to obtaining the necessary government approvals, the property will be developed into one with c.1m sqft of commercial GFA and comprise an office tower of up to 280 metres high. Upon completion in 2021, the property will provide a medium term uplift to CCT’s current NAV per unit of S$1.72 and earnings. This is on top of any value creation from disposal of its stake in One George Street (50% interest) and Wilkie Edge as speculated by the press.
Net Property Income and Margins (%)
Net Property Income and Margins (%)
Distribution Paid / Net Operating CF
Interest Cover (x)
Source: Company, DBS Bank
74.0%
76.0%
78.0%
80.0%
82.0%
84.0%
86.0%
0
50
100
150
200
250
300
2013A 2014A 2015A 2016F 2017F
S$ m
Net Property Income Net Property Income Margin %
75%
75%
76%
76%
77%
77%
78%
78%
79%
79%
80%
48
50
52
54
56
58
2Q20
14
3Q20
14
4Q20
14
1Q20
15
2Q20
15
3Q20
15
4Q20
15
1Q20
16
2Q20
16
3Q20
16
Net Property Income Net Property Income Margin %
0.5
0.6
0.7
0.8
0.9
1.0
1.1
1.2
1.3
1.4
2013A 2014A 2015A 2016F 2017F
(x)
0.00
1.00
2.00
3.00
4.00
5.00
6.00
7.00
2013A 2014A 2015A 2016F 2017F
(x)
Page 170

ASIAN INSIGHTS VICKERS SECURITIES Page 3
Company Guide
CapitaLand Commercial Trust
Balance Sheet:
Increase in gearing post acquisition of CapitaGreen. Post acquisition of the remaining 60% interest in CapitaGreen, its gearing has risen to c.38% from c.30% previously. While this is higher than CCT’s average gearing over the last few years, we believe this remains prudent, as it is below the 45% gearing cap imposed by MAS and provides some buffer in the event of any decline in the value of CCT’s portfolio. Share Price Drivers:
Higher-than-average DPU growth. Following the acquisition of the remaining 60% interest CapitaGreen, CCT will have the highest 2-year DPU growth among the office REITs (average of 2%) which is also higher than the average S-REIT growth of 1.7%. With a superior growth profile in a slowing growth environment, we believe investors will gravitate towards CCT, causing the stock to re-rate. Key Risks:
Risk of higher vacancies and negative rental reversions for FY16. In FY16-17, c.10% of CCT’s office leases will be due for expiry, the majority of which stems from One George Street, Six Battery Road and Raffles City, where expiring rents are close to or higher than market rents. As the Manager has prioritised tenant retention, there is a possibility of negative rental reversions, which would impede earnings growth. Competition from other landlords. Between 2016 and 2018, c.5.3m sqft of office (NLA) will be completed within the downtown core, translating to a 15% increase in existing stock, or 3-year CAGR of 4.6%. Due to weaker net absorption rates of <1m sqft in recent years, CCT could face higher competition for large tenants from landlords of newer buildings, which have large floor plates of 30-40k sqft. Pressure on rents from shadow space. We see some downsizing activity from banks and financial institutions, and shadow space (particularly in the Marina Bay area) could put some pressure on rents for CCT’s portfolio, which is located primarily in the Raffles Place/Tanjong Pagar areas. Company Background
CapitaLand Commercial Trust (CCT) is a real investment trust investing exclusively in commercial properties in Singapore.
Aggregate Leverage (%)
ROE (%)
Distribution Yield (%)
PB Band (x)
Source: Company, DBS Bank
10.0%
15.0%
20.0%
25.0%
30.0%
35.0%
2013A 2014A 2015A 2016F 2017F
0.0%
1.0%
2.0%
3.0%
4.0%
5.0%
6.0%
7.0%
2013A 2014A 2015A 2016F 2017F
Avg: 5.5%
+1sd: 6.1%
+2sd: 6.6%
‐1sd: 5%
‐2sd: 4.4%
3.9
4.4
4.9
5.4
5.9
6.4
6.9
7.4
2013 2014 2015 2016 2017
(%)
Avg: 0.89x
+1sd: 0.97x
+2sd: 1.05x
‐1sd: 0.8x
‐2sd: 0.72x
0.6
0.7
0.8
0.9
1.0
1.1
1.2
1.3
Jan-13 Jan-14 Jan-15 Jan-16 Jan-17
(x)
Page 171

ASIAN INSIGHTS VICKERS SECURITIES Page 4
Company Guide
CapitaLand Commercial Trust
Income Statement (S$m)
FY Dec 2013A 2014A 2015A 2016F 2017F Gross revenue 251 263 273 277 348 Property expenses (54.3) (57.4) (60.5) (59.8) (74.6) Net Property Income 197 205 213 217 273 Other Operating expenses (15.2) (16.2) (17.6) (29.5) (25.1) Other Non Opg (Exp)/Inc (4.6) (3.5) 0.87 0.0 0.0 Net Interest (Exp)/Inc (46.3) (32.7) (32.1) (41.2) (77.4) Exceptional Gain/(Loss) 2.52 (2.5) 47.5 0.0 0.0 Net Income 261 368 309 242 260 Tax 0.0 0.0 (0.1) (0.7) (0.9) Minority Interest 0.0 0.0 0.0 0.0 0.0 Preference Dividend 0.0 0.0 0.0 0.0 0.0 Net Income After Tax 261 368 307 241 259 Total Return 367 449 307 241 259 Non-tax deductible Items (139) (200) (52.8) 24.6 20.9 Net Inc available for Dist. 234 249 254 266 280 Growth & Ratio Revenue Gth (%) (33.1) 4.4 4.0 1.3 25.7 N Property Inc Gth (%) (33.3) 4.1 3.7 2.0 26.0 Net Inc Gth (%) 26.9 40.9 (16.4) (21.4) 7.4 Dist. Payout Ratio (%) 100.0 100.0 100.0 100.0 100.0 Net Prop Inc Margins (%) 78.4 78.2 77.9 78.4 78.6 Net Income Margins (%) 103.8 140.0 112.5 87.2 74.5 Dist to revenue (%) 93.1 94.9 93.1 96.1 80.5 Managers & Trustee’s fees 6.0 6.2 6.4 10.6 7.2 ROAE (%) 5.4 7.3 5.9 4.6 4.9 ROA (%) 3.9 5.8 4.7 3.3 3.3 ROCE (%) 2.8 3.0 3.0 2.6 3.1 Int. Cover (x) 3.9 5.8 6.1 4.6 3.2
Source: Company, DBS Bank
Earnings growth will be driven by increased contribution from CapitaGreen, which should offset income loss from lower occupancies and negative rental reversions at existing office assets such as Capital Tower, 6 Battery Road and One George Street
Page 172

ASIAN INSIGHTS VICKERS SECURITIES Page 5
Company Guide
CapitaLand Commercial Trust
Quarterly / Interim Income Statement (S$m)
FY Dec 3Q2015 4Q2015 1Q2016 2Q2016 3Q2016 Gross revenue 68.3 67.6 66.9 67.6 74.4 Property expenses (15.7) (15.3) (14.8) (16.1) (17.4) Net Property Income 52.7 52.3 52.0 51.5 57.0 Other Operating expenses (4.3) (4.4) (4.2) (4.5) (3.9) Other Non Opg (Exp)/Inc 0.11 (0.3) 1.66 0.0 1.22 Net Interest (Exp)/Inc (8.3) (8.5) (8.1) (8.3) (11.4) Exceptional Gain/(Loss) 0.0 0.0 0.0 0.0 (13.5) Net Income 56.7 68.0 61.9 74.3 51.6 Tax 0.0 (0.1) (0.2) 0.0 (0.2) Minority Interest 0.0 0.0 0.0 0.0 0.0 Net Income after Tax 56.7 68.0 61.7 74.3 51.4 Total Return 0.0 0.0 0.0 0.0 0.0 Non-tax deductible Items 0.0 0.0 0.0 0.0 0.0 Net Inc available for Dist. 63.2 64.1 64.8 65.1 68.3 Growth & Ratio Revenue Gth (%) (1) (1) (1) 1 10 N Property Inc Gth (%) (2) (1) 0 (1) 11 Net Inc Gth (%) (26) 20 (9) 20 (31) Net Prop Inc Margin (%) 77.1 77.3 77.8 76.1 76.6 Dist. Payout Ratio (%) 100.0 100.0 100.0 100.0 100.0
Balance Sheet (S$m)
FY Dec 2013A 2014A 2015A 2016F 2017F Investment Properties 4,769 4,882 4,962 6,578 6,582 Other LT Assets 1,359 1,499 1,504 1,199 1,199 Cash & ST Invts 84.1 101 81.2 140 156 Inventory 0.0 0.0 0.0 0.0 0.0 Debtors 33.7 38.3 45.3 17.2 21.6 Other Current Assets 0.01 0.0 0.0 0.0 0.0 Total Assets 6,245 6,521 6,593 7,934 7,959 ST Debt 0.0 270 0.0 0.0 0.0 Creditor 50.9 47.4 37.3 64.2 80.7 Other Current Liab 12.0 11.4 8.68 9.34 9.47 LT Debt 1,218 970 1,255 2,546 2,379 Other LT Liabilities 51.6 68.6 57.6 57.6 57.6 Unit holders’ funds 4,913 5,153 5,234 5,257 5,432 Minority Interests 0.0 0.0 0.0 0.0 0.0 Total Funds & Liabilities 6,245 6,521 6,593 7,934 7,959 Non-Cash Wkg. Capital (29.1) (20.5) (0.7) (56.4) (68.6) Net Cash/(Debt) (1,134) (1,139) (1,174) (2,406) (2,223) Ratio Current Ratio (x) 1.9 0.4 2.8 2.1 2.0 Quick Ratio (x) 1.9 0.4 2.8 2.1 2.0 Aggregate Leverage (%) 30.3 30.4 30.0 37.5 37.5 Z-Score (X) 2.1 2.2 2.2 1.2 1.3
Source: Company, DBS Bank
Increased gearing due the acquisition of remaining 60% interest in CapitaGreen
Page 173

ASIAN INSIGHTS VICKERS SECURITIES Page 6
Company Guide
CapitaLand Commercial Trust
Cash Flow Statement (S$m)
FY Dec 2013A 2014A 2015A 2016F 2017F Pre-Tax Income 261 368 307 242 260 Dep. & Amort. 1.39 3.51 3.51 3.51 3.51 Tax Paid (0.1) 0.0 0.0 (0.1) (0.7) Associates &JV Inc/(Loss) (127) (217) (97.3) (95.8) (89.2) Chg in Wkg.Cap. 7.68 (4.6) (19.8) 55.0 12.1 Other Operating CF 52.5 39.3 3.05 24.6 20.9 Net Operating CF 195 189 197 229 207 Net Invt in Properties (21.4) (29.8) (21.3) (401) (8.0) Other Invts (net) (1.0) 0.0 0.0 0.0 0.0 Invts in Assoc. & JV (526) (397) 0.0 0.0 0.0 Div from Assoc. & JVs 82.6 86.1 85.0 95.8 89.2 Other Investing CF 526 392 0.0 0.0 0.0 Net Investing CF 60.5 51.7 63.7 (305) 81.2 Distribution Paid (231) (243) (252) (266) (280) Chg in Gross Debt 40.2 50.3 5.00 401 8.00 New units issued 0.0 0.0 0.0 0.0 0.0 Other Financing CF (98.8) (30.7) (33.4) 0.0 0.0 Net Financing CF (290) (223) (280) 135 (272) Currency Adjustments 0.0 0.0 0.0 0.0 0.0 Chg in Cash (34.3) 17.0 (19.9) 59.2 15.7 Operating CFPS (S cts) 6.55 6.63 7.35 5.89 6.47 Free CFPS (S cts) 6.07 5.45 5.95 (5.8) 6.60
Source: Company, DBS Bank
Target Price & Ratings History
Source: DBS Bank
Analyst: Mervin SONG CFA
Derek TAN
S.No.Date of Report
Closing Price
12-mth Target Price
Rat ing
1: 20 Jan 16 1.33 1.45 BUY
2: 15 Apr 16 1.43 1.53 BUY
3: 24 May 16 1.39 1.61 BUY
4: 21 Jul 16 1.56 1.70 BUY
5: 05 Sep 16 1.59 1.70 BUY
6: 19 Oct 16 1.58 1.70 BUY
7: 09 Nov 16 1.56 1.70 BUY
Note : Share price and Target price are adjusted for corporate actions.
1
2
3
45
6
7
1.22
1.32
1.42
1.52
1.62
1.72
Jan-16 May-16 Sep-16 Jan-17
S$
Higher capex due to the acquisition of remaining 60% interest in CapitaGreen
Page 174

ASIAN INSIGHTS VICKERS SECURITIES ed: JS / sa: YM, PY
BUY
Last Traded Price ( 4 Jan 2017): S$1.93 (STI : 2,921.31) Price Target 12-mth: S$2.25 (16% upside and 5.8% yield) Potential Catalyst: Delay in rate hike expectations; more uncertainties from Brexit execution plans; better-than-expected rental reversion Where we differ: We are line with consensus Analyst Singapore Research Team [email protected] Derek TAN +65 6682 3716 [email protected] Mervin SONG CFA +65 6682 3715 [email protected]
Price Relative
Forecasts and Valuation FY Dec (S$m) 2015A 2016F 2017F 2018F Gross Revenue 669 697 695 700 Net Property Inc 466 488 480 481 Total Return 580 413 418 417 Distribution Inc 405 417 418 421 EPU (S cts) 13.5 11.7 11.8 11.8 EPU Gth (%) 2 (14) 1 0 DPU (S cts) 11.1 11.2 11.2 11.3 DPU Gth (%) 2 1 0 1 NAV per shr (S cts) 192 189 190 190 PE (X) 14.3 16.5 16.4 16.4 Distribution Yield (%) 5.7 5.8 5.8 5.8 P/NAV (x) 1.0 1.0 1.0 1.0 Aggregate Leverage (%) 33.0 33.3 34.3 35.3 ROAE (%) 7.3 6.2 6.2 6.2 Distn. Inc Chng (%): - - - Consensus DPU (S cts): 11.0 11.0 11.2 Other Broker Recs: B: 10 S: 0 H: 12
Source of all data on this page: Company, DBS Bank, Bloomberg Finance L.P.
Christmas Present is Still in the Box
Negative DPU in 3Q16 is a false alarm as retention is boxed for distribution in 4Q16. CapitaLand Mall Trust (CMT)’s reported 3Q16 DPU was 2.78Scts and 9M16 DPU was 8.25Scts, down 6.7% and 1.4% y-o-y, respectively. Investors should not be alarmed by the negative growth, as a higher base was set by the DPU in 3Q15 due to S$8.0m (or 0.23Scts) retention paid out in 3Q15, out of S$12.5m retained from 1Q15. Stripping out the payment of S$8m in 3Q15, DPU growth was up a marginal 1.1% in 3Q16. CMT retained S$12.0m of its taxable income in 1Q16, equivalent to c.0.34Scts in DPU terms, and will pay this out in the festive season next quarter. We expect flattish DPU growth for the full year. Funan’s redevelopment plans are within our expectations. Plans for Funan 2.0, including a cycle-through mall, two Grade A office towers, and co-living apartment units, were largely in line with our scenario study published on 1 July 2016 (Rhapsody of Funan 2.0). We are supportive of CMT’s decision to undertake the redevelopment. Apart from a potential 4 Scts (or 2.0%) boost to NAV, we applaud the proactive asset management strategy to turn the ageing mall into a ’lifestyle destination’. Gearing has room to finance asset enhancement programs and other developments. As CMT will fund Funan’s redevelopment cost of S$560m entirely with debt, which is comfortably below the S$800m headroom available, gearing is expected to increase to 38%, which is still healthy. Valuation:
We have a DCF-backed TP of S$2.25. The stock offers FY16/17F DPU yields over 5.0%. Key Risks to Our View:
A rate hike surprise before December. While consensus is still ruling out a hike in November just days before the US election, any surprise move by the Fed may cause ripples in the market. In the unlikely scenario of a rate hike ahead of consensus’ year-end expectation, we believe this will be an opportunity for investors to accumulate the stock on any dips. At A Glance Issued Capital (m shrs) 3,543 Mkt. Cap (S$m/US$m) 6,838 / 4,715 Major Shareholders (%) Capitaland 29.3 Blackrock 5.0 NTUC Enterprise Co-operativ 5.0
Free Float (%) 60.7 3m Avg. Daily Val (US$m) 13.4 ICB Industry : Real Estate / Real Estate Investment Trust
DBS Group Research . Equity 4 Jan 2017
Singapore Company Guide
CapitaLand Mall Trust Version | Bloomberg: CT SP | Reuters: CMLT.SI Refer to important disclosures at the end of this report
79
99
119
139
159
179
199
219
1.6
1.7
1.8
1.9
2.0
2.1
2.2
2.3
2.4
2.5
2.6
Jan-13 Jan-14 Jan-15 Jan-16 Jan-17
Relative IndexS$
CapitaLand Mall Trust (LHS) Relative STI (RHS)
Page 175

ASIAN INSIGHTS VICKERS SECURITIES Page 2
Company Guide
CapitaLand Mall Trust
CRITICAL DATA POINTS TO WATCH
Earnings Drivers:
Mall owner of choice despite retail headwinds. CMT’s portfolio of malls stands out in Singapore’s retail landscape due to its (a) accessibility, (b) excellent asset management track record, and (c) strong rewards/marketing programme. Despite recent retail headwinds, we believe that CMT’s malls will continue to see good demand as retailers look to consolidate their footprints within CMT’s malls. Ability to deliver value through AEIs. Strategic asset enhancement initiatives (AEIs) across its properties will result in increased shopper traffic in the medium term. For instance, the completion of AEI at IMM building in November 2015 has repositioned the mall as the largest outlet mall in Singapore with wider offerings, which should help to further differentiate the mall in the midst of new supply. The upcoming redevelopment of Funan 2.0 could also offer upside potential to the Trust. Expect rental reversions to underperform historical levels. CMT’s rental reversion trends have been moderating (3.7% for FY15 and 1.7% for 9M16) and as retailers’ profitability continues to be squeezed by high labour costs and falling retail sales. We believe that rental reversions are likely to fall within the 1-2% range in the next 1-2 years, compounded by pressure from escalating labour costs and labour shortage. NPI margins could decline as the Manager expands marketing efforts. The Manager is looking to ramp up marketing efforts to attract a younger audience by deploying various digital and social media initiatives and the rollout of the enhanced CapitaStar reward programme to attract and retain shoppers. In addition, the Manager intends to step up the installation and adoption of mobile and internet-enabled infrastructure within its malls to allow complementary e-commerce activities (J Avenue website for shoppers to buy online and collect in store). While the immediate benefits are not obvious and are likely to drive up operating expenses in the medium term, we laud the efforts of the management in embracing changes in shoppers' expectations.
Net Property Income and Margins (%)
Net Property Income and Margins (%)
Distribution Paid / Net Operating CF
Interest Cover (x)
Source: Company, DBS Bank
64.6%
66.6%
68.6%
70.6%
72.6%
74.6%
76.6%
0
50
100
150
200
250
300
350
400
450
500
2014A 2015A 2016F 2017F 2018F
S$ m
Net Property Income Net Property Income Margin %
60%
62%
64%
66%
68%
70%
72%
101
106
111
116
121
126
131
2Q20
14
3Q20
14
4Q20
14
1Q20
15
2Q20
15
3Q20
15
4Q20
15
1Q20
16
2Q20
16
3Q20
16
Net Property Income Net Property Income Margin %
0.4
0.5
0.6
0.7
0.8
0.9
1.0
1.1
1.2
2014A 2015A 2016F 2017F 2018F
(x)
3.60
3.80
4.00
4.20
4.40
4.60
4.80
2014A 2015A 2016F 2017F 2018F
(x)
Page 176

ASIAN INSIGHTS VICKERS SECURITIES Page 3
Company Guide
CapitaLand Mall Trust
Balance Sheet:
Gearing to remain stable. CMT’s gearing ratio is forecast to remain fairly stable at 35-38% over FY16-18F. This is after the placement of new units as consideration for the purchase of Bedok Mall in 3Q15 and assuming 100% debt financing for the redevelopment of Funan. Gearing level is within management's comfortable level of between 35% and 40%. Cost of debt to remain stable. The average debt cost is 3.2%, which should remain stable in the immediate term. With interest rates on the rise, we have priced in a 25 bps increase in average interest cost once hedges are rolled over in the coming two years. Share Price Drivers:
Acquisitions to drive earnings. CMT has the right of first refusal to acquire its Sponsor’s retail assets in Singapore. CapitaLand has several retail assets in its portfolio which could be injected into the REIT, including Star Vista and the remaining 70% stake in Westgate. Better-than-expected operational results. We believe that CMT’s portfolio will continue to remain resilient despite headwinds. The Trust's ability to maintain a steady growth in top line while holding occupancies will be a strong testament of the Manager's capability to stand out among its peers. IMM could be a positive surprise. With the completion of phase two, IMM is now the largest outlet mall in Singapore, with 85 outlet stores. Feedback has been positive as the mall renewed 22.0% of its NLA over 9M16 at 4.6% reversion rate which is highest among all properties. Key Risks:
Downside risk to rental reversions. A worse-than-expected slowdown in consumer sentiment and consumption outlook may result in lower reversionary potential (vs our 2% estimate) for leases expiring in 2016. Funan’s redevelopment could be a near-term catalyst. Further upside risk is from interest savings. The Trust has been proactive in extending its debt profile, locking in long-tenure MTNs at lower rates than previously achieved. Further interest savings from refinancing associate debt would offer upside to our estimates. The uncertainties from the implementation of Brexit following the referendum on 24 June 2016 will continue to cause ripples in the market. Company Background
CapitaMall Trust is a real estate investment trust which owns and invests in retail properties in the suburban areas and downtown core of Singapore.
Aggregate Leverage (%)
ROE (%)
Distribution Yield (%)
PB Band (x)
Source: Company, DBS Bank
10.0%
15.0%
20.0%
25.0%
30.0%
35.0%
2014A 2015A 2016F 2017F 2018F
0.0%
1.0%
2.0%
3.0%
4.0%
5.0%
6.0%
7.0%
2014A 2015A 2016F 2017F 2018F
Avg: 5.2%
+1sd: 5.6%
+2sd: 6%
‐1sd: 4.9%
‐2sd: 4.5%
3.6
4.1
4.6
5.1
5.6
6.1
6.6
2013 2014 2015 2016 2017
(%)
Avg: 1.13x
+1sd: 1.21x
+2sd: 1.29x
‐1sd: 1.04x
‐2sd: 0.96x
0.8
0.9
1.0
1.1
1.2
1.3
1.4
1.5
1.6
Jan-13 Jan-14 Jan-15 Jan-16 Jan-17
(x)
Page 177

ASIAN INSIGHTS VICKERS SECURITIES Page 4
Company Guide
CapitaLand Mall Trust
Income Statement (S$m)
FY Dec 2014A 2015A 2016F 2017F 2018F Gross revenue 659 669 697 695 700 Property expenses (210) (203) (209) (215) (220) Net Property Income 448 466 488 480 481 Other Operating expenses (46.3) (45.8) (49.4) (49.2) (49.7) Other Non Opg (Exp)/Inc 0.0 0.0 0.0 0.0 0.0 Net Interest (Exp)/Inc (99.3) (91.6) (103) (91.7) (94.1) Exceptional Gain/(Loss) 4.89 72.8 0.0 0.0 0.0 Net Income 457 473 413 418 417 Tax 0.0 (0.6) 0.0 0.0 0.0 Minority Interest 0.0 0.0 0.0 0.0 0.0 Preference Dividend 0.0 0.0 0.0 0.0 0.0 Net Income After Tax 457 473 413 418 417 Total Return 619 580 413 418 417 Non-tax deductible Items (44.6) (68.3) 3.95 0.0 4.00 Net Inc available for Dist. 412 405 417 418 421 Growth & Ratio Revenue Gth (%) 3.3 1.5 4.2 (0.3) 0.8 N Property Inc Gth (%) 2.2 4.0 4.7 (1.7) 0.2 Net Inc Gth (%) 12.3 3.5 (12.6) 1.1 (0.2) Dist. Payout Ratio (%) 91.0 96.9 95.0 95.0 95.0 Net Prop Inc Margins (%) 68.1 69.7 70.1 69.0 68.6 Net Income Margins (%) 69.3 70.7 59.3 60.2 59.6 Dist to revenue (%) 62.6 60.5 59.9 60.2 60.2 Managers & Trustee’s fees 7.0 6.8 7.1 7.1 7.1 ROAE (%) 7.4 7.3 6.2 6.2 6.2 ROA (%) 4.8 4.7 4.0 3.9 3.8 ROCE (%) 4.3 4.2 4.3 4.2 4.1 Int. Cover (x) 4.1 4.6 4.3 4.7 4.6
Source: Company, DBS Bank
Earnings from Bedok Mall will more than offset the loss of earnings from Funan for 3 years from 2H16. (Bedok's FY16 NPI was S$10.9m vs Funan's S$5.6m)
Page 178

ASIAN INSIGHTS VICKERS SECURITIES Page 5
Company Guide
CapitaLand Mall Trust
Quarterly / Interim Income Statement (S$m)
FY Dec 3Q2015 4Q2015 1Q2016 2Q2016 3Q2016 Gross revenue 162 180 180 171 170 Property expenses (48.4) (54.7) (51.9) (54.8) (50.2) Net Property Income 113 126 128 116 120 Other Operating expenses (11.1) (12.1) (12.1) (12.6) (12.1) Other Non Opg (Exp)/Inc 0.0 0.0 0.0 0.0 0.0 Net Interest (Exp)/Inc (20.9) (25.3) (23.4) (23.0) (24.2) Exceptional Gain/(Loss) 0.0 72.7 (0.6) 0.06 (0.2) Net Income 101 181 111 98.2 104 Tax 0.0 (0.6) 0.0 0.0 0.0 Minority Interest 0.0 0.0 0.0 0.0 0.0 Net Income after Tax 101 180 111 98.2 104 Total Return 101 234 111 154 104 Non-tax deductible Items (0.7) (2.7) 1.31 1.80 (0.8) Net Inc available for Dist. 102 102 115 97.1 105 Growth & Ratio Revenue Gth (%) 1 12 0 (5) (1) N Property Inc Gth (%) 3 11 2 (9) 3 Net Inc Gth (%) 14 78 (38) (12) 6 Net Prop Inc Margin (%) 70.1 69.7 71.1 67.9 70.4 Dist. Payout Ratio (%) 101.4 100.0 84.0 99.9 93.8
Balance Sheet (S$m)
FY Dec 2014A 2015A 2016F 2017F 2018F Investment Properties 7,510 8,366 8,287 8,463 8,639 Other LT Assets 1,194 1,357 1,357 1,357 1,357 Cash & ST Invts 1,130 604 870 892 913 Inventory 0.0 0.0 0.0 0.0 0.0 Debtors 25.1 28.8 32.9 32.8 33.1 Other Current Assets 0.0 0.0 0.0 0.0 0.0 Total Assets 9,858 10,356 10,546 10,744 10,941 ST Debt 762 0.0 0.0 0.0 0.0 Creditor 217 200 282 281 283 Other Current Liab 35.8 3.56 0.0 0.0 0.0 LT Debt 2,407 3,312 3,405 3,581 3,757 Other LT Liabilities 153 147 147 147 147 Unit holders’ funds 6,282 6,693 6,712 6,735 6,754 Minority Interests 0.0 0.0 0.0 0.0 0.0 Total Funds & Liabilities 9,858 10,356 10,546 10,744 10,941 Non-Cash Wkg. Capital (228) (175) (249) (248) (250) Net Cash/(Debt) (2,040) (2,708) (2,536) (2,689) (2,844) Ratio Current Ratio (x) 1.1 3.1 3.2 3.3 3.3 Quick Ratio (x) 1.1 3.1 3.2 3.3 3.3 Aggregate Leverage (%) 33.0 33.0 33.3 34.3 35.3 Z-Score (X) 5.8 5.6 5.5 5.4 5.3
Source: Company, DBS Bank
S$12m of 1Q16 taxable income has been retained for distribution in 4Q16, equivalent to c.0.34Scts in DPU terms
Page 179

ASIAN INSIGHTS VICKERS SECURITIES Page 6
Company Guide
CapitaLand Mall Trust
Cash Flow Statement (S$m)
FY Dec 2014A 2015A 2016F 2017F 2018F Pre-Tax Income 457 473 413 418 417 Dep. & Amort. 0.0 0.0 0.0 0.0 0.0 Tax Paid (0.5) 0.0 (3.6) 0.0 0.0 Associates &JV Inc/(Loss) (149) (71.8) (77.9) (79.2) (80.5) Chg in Wkg.Cap. 5.21 0.91 78.0 (0.7) 1.89 Other Operating CF 96.3 19.9 0.0 0.0 0.0 Net Operating CF 409 422 410 338 339 Net Invt in Properties (64.7) (95.0) 79.0 (176) (176) Other Invts (net) 0.0 0.0 0.0 0.0 0.0 Invts in Assoc. & JV 12.3 (17.6) 0.0 0.0 0.0 Div from Assoc. & JVs 96.6 70.8 77.9 79.2 80.5 Other Investing CF 6.47 (422) 0.0 0.0 0.0 Net Investing CF 50.6 (464) 157 (96.8) (95.4) Distribution Paid (370) (389) (397) (397) (400) Chg in Gross Debt 315 (890) 93.0 176 176 New units issued 0.0 151 1.88 1.89 1.91 Other Financing CF (105) 644 0.0 0.0 0.0 Net Financing CF (160) (484) (302) (219) (222) Currency Adjustments 0.0 0.0 0.0 0.0 0.0 Chg in Cash 300 (525) 265 22.1 20.9 Operating CFPS (S cts) 11.7 12.0 9.37 9.56 9.50 Free CFPS (S cts) 9.94 9.35 13.8 4.58 4.59
Source: Company, DBS Bank
Target Price & Ratings History
Source: DBS Bank
Analyst: Singapore Research Team
Derek TAN
Mervin SONG CFA
S.No.Date of Report
Closing Price
12-mth Target Price
Rat ing
1: 22 Jan 16 1.97 2.10 BUY
2: 25 Jan 16 1.97 2.10 BUY
3: 18 Apr 16 2.16 2.10 HOLD
4: 01 Jul 16 2.17 2.20 HOLD
5: 25 Jul 16 2.15 2.23 HOLD
6: 22 Sep 16 2.12 2.25 BUY
7: 24 Oct 16 2.15 2.25 BUY
Note : Share price and Target price are adjusted for corporate actions.
1
2
3 4
5
6
7
1.77
1.87
1.97
2.07
2.17
2.27
Jan-16 May-16 Sep-16 Jan-17
S$
Funan’s earnings have been removed for c.3.5 years from 2H16 (expected opening in 4QFY19). After which, our new forecasts for Funan 2.0 have been incorporated in the model
Page 180

ASIAN INSIGHTS VICKERS SECURITIES ed: JS / sa: YM, PY
BUY Last Traded Price ( 4 Jan 2017): S$1.36 (STI : 2,921.31) Price Target 12-mth: S$1.59 (17% upside and 6.6% yield) Potential Catalyst: Recovery in the Singapore hospitality market, and acquisitions Where we differ: Below due to assumption of excess supply of new rooms in Singapore Analyst Mervin SONG CFA +65 6682 3715 [email protected] Derek TAN +65 6682 3716 [email protected]
Price Relative
Forecasts and Valuation FY Dec (S$m) 2015A 2016F 2017F 2018F Gross Revenue 172 175 174 182 Net Property Inc 137 136 135 143 Total Return 58.4 89.6 85.5 90.2 Distribution Inc 109 103 99.3 104 EPU (S cts) 8.99 9.02 8.56 8.97 EPU Gth (%) (16) 0 (5) 5 DPU (S cts) 10.1 9.37 8.95 9.33 DPU Gth (%) (8) (7) (5) 4 NAV per shr (S cts) 159 159 159 159 PE (X) 15.1 15.1 15.9 15.2 Distribution Yield (%) 7.4 6.9 6.6 6.9 P/NAV (x) 0.9 0.9 0.9 0.9 Aggregate Leverage (%) 36.2 35.9 35.7 35.5 ROAE (%) 5.6 5.7 5.4 5.6 Distn. Inc Chng (%): 0 0 0 Consensus DPU (S cts): 9.50 9.50 9.80 Other Broker Recs: B: 6 S: 2 H: 9
Source of all data on this page: Company, DBS Bank, Bloomberg Finance L.P.
Unloved now but offers outstanding value Attractive valuations. We maintain our BUY call on CDL Hospitality Trusts (CDREIT) and TP of S$1.59. Although we now expect the Singapore market to only recover in 2018, we believe the current low share price has largely priced in the current downturn and CDREIT offers compelling long-term value given its Singapore portfolio trades on a heavily discounted implied price per key. In addition, CDREIT offers patient investors an attractive 6.8% yield (based on 90% payout ratio) ahead of the eventual upturn. Cheapest REIT to ride the eventual upturn. CDREIT’s implied price per key for its Singapore portfolio stands at less than c.S$500k which is below its replacement cost of c.S$700k, recent market transactions of above S$650k and that of other listed Singapore hospitality REITs of between S$650k and S$1m. Given the quality of the portfolio and CREIT’s long-term track record, we believe this discount is unwarranted. Thus, CDREIT is the cheapest REIT providing exposure to the eventual upturn in the Singapore hospitality market which we project will occur in 2018 as supply pressures ease. Several mitigating factors during downturn in the Singapore hospitality market. While CDREIT’s core Singapore market faces a downturn, we believe this will be tempered by higher earnings contribution from New Zealand, following the appointment of Millennium & Copthorne Hotels as the new operator of CDREIT’s Auckland property and the negotiation of a more favourable lease structure. In addition, we see upside to our DPU estimates should it decide to utilise its S$382m debt headroom for acquisitions.
Valuation:
We maintain our TP and DPU forecast which have incorporated the delayed expectations of the recovery of Singapore’s hospitality market. Key Risks to Our View:
Weaker-than-expected demand supply outlook in Singapore. The key risk to our view is a weaker-than-expected demand-supply outlook for the Singapore hospitality market. At A Glance Issued Capital (m shrs) 992 Mkt. Cap (S$m/US$m) 1,349 / 937 Major Shareholders (%) Hospitality Holdings Pte Ltd 31.7 Aberdeen 5.0 M & C Reit Management Ltd 5.0
Free Float (%) 54.3 3m Avg. Daily Val (US$m) 1.3 ICB Industry : Real Estate / Real Estate Investment Trust
DBS Group Research . Equity 4 Jan 2017
Singapore Company Guide
CDL Hospitality Trusts Version 6 | Bloomberg: CDREIT SP | Reuters: CDLT.SI Refer to important disclosures at the end of this report
Page 181
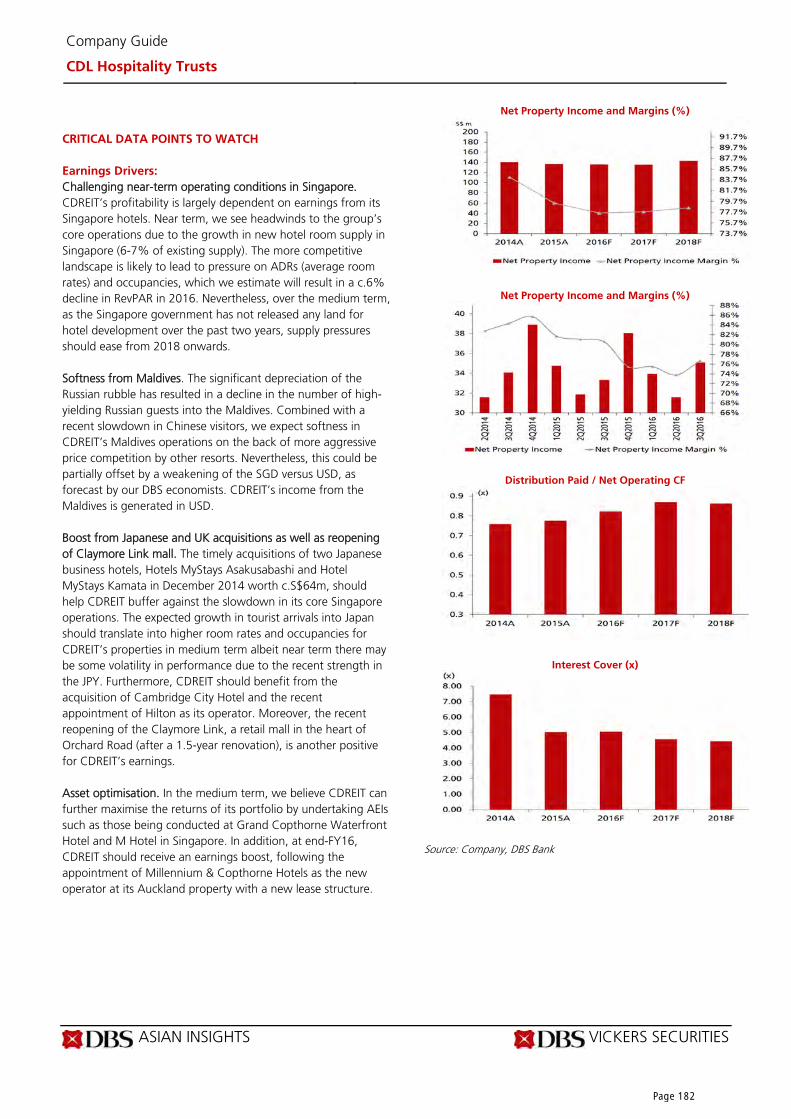
ASIAN INSIGHTS VICKERS SECURITIES Page 2
Company Guide
CDL Hospitality Trusts
CRITICAL DATA POINTS TO WATCH
Earnings Drivers:
Challenging near-term operating conditions in Singapore. CDREIT’s profitability is largely dependent on earnings from its Singapore hotels. Near term, we see headwinds to the group’s core operations due to the growth in new hotel room supply in Singapore (6-7% of existing supply). The more competitive landscape is likely to lead to pressure on ADRs (average room rates) and occupancies, which we estimate will result in a c.6% decline in RevPAR in 2016. Nevertheless, over the medium term, as the Singapore government has not released any land for hotel development over the past two years, supply pressures should ease from 2018 onwards. Softness from Maldives. The significant depreciation of the Russian rubble has resulted in a decline in the number of high-yielding Russian guests into the Maldives. Combined with a recent slowdown in Chinese visitors, we expect softness in CDREIT’s Maldives operations on the back of more aggressive price competition by other resorts. Nevertheless, this could be partially offset by a weakening of the SGD versus USD, as forecast by our DBS economists. CDREIT’s income from the Maldives is generated in USD. Boost from Japanese and UK acquisitions as well as reopening of Claymore Link mall. The timely acquisitions of two Japanese business hotels, Hotels MyStays Asakusabashi and Hotel MyStays Kamata in December 2014 worth c.S$64m, should help CDREIT buffer against the slowdown in its core Singapore operations. The expected growth in tourist arrivals into Japan should translate into higher room rates and occupancies for CDREIT’s properties in medium term albeit near term there may be some volatility in performance due to the recent strength in the JPY. Furthermore, CDREIT should benefit from the acquisition of Cambridge City Hotel and the recent appointment of Hilton as its operator. Moreover, the recent reopening of the Claymore Link, a retail mall in the heart of Orchard Road (after a 1.5-year renovation), is another positive for CDREIT’s earnings. Asset optimisation. In the medium term, we believe CDREIT can further maximise the returns of its portfolio by undertaking AEIs such as those being conducted at Grand Copthorne Waterfront Hotel and M Hotel in Singapore. In addition, at end-FY16, CDREIT should receive an earnings boost, following the appointment of Millennium & Copthorne Hotels as the new operator at its Auckland property with a new lease structure.
Net Property Income and Margins (%)
Net Property Income and Margins (%)
Distribution Paid / Net Operating CF
Interest Cover (x)
Source: Company, DBS Bank
Page 182
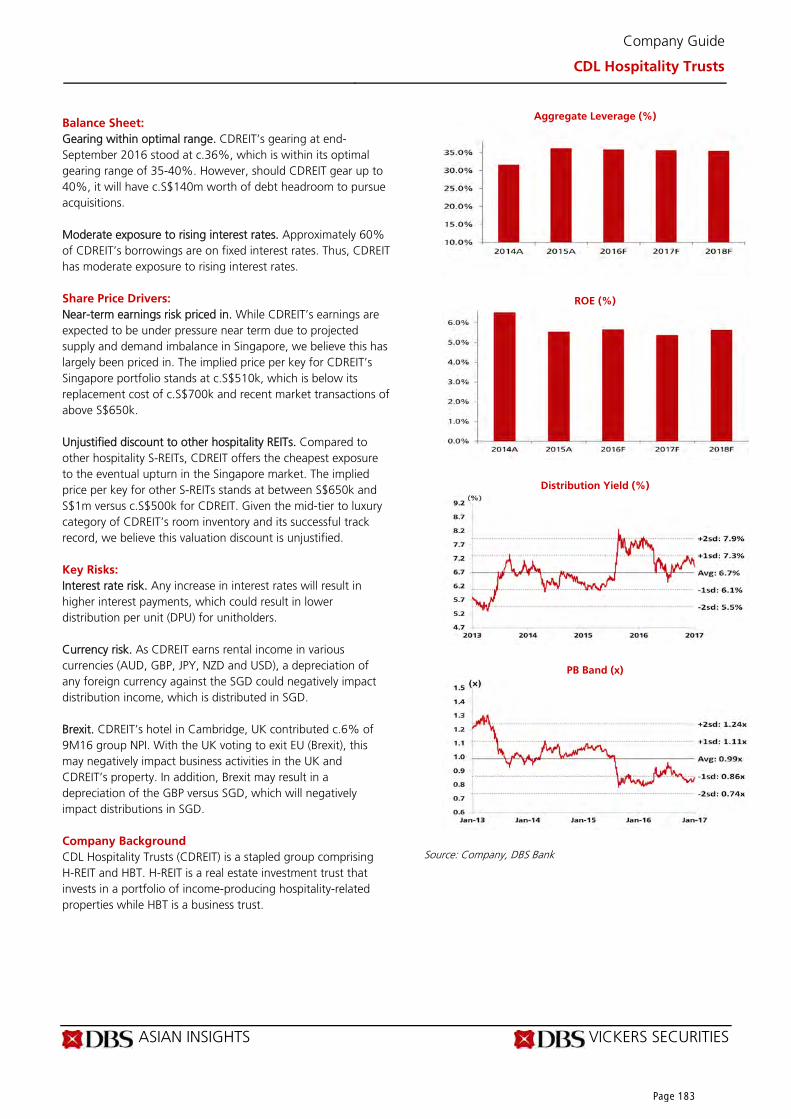
ASIAN INSIGHTS VICKERS SECURITIES Page 3
Company Guide
CDL Hospitality Trusts
Balance Sheet:
Gearing within optimal range. CDREIT’s gearing at end-September 2016 stood at c.36%, which is within its optimal gearing range of 35-40%. However, should CDREIT gear up to 40%, it will have c.S$140m worth of debt headroom to pursue acquisitions. Moderate exposure to rising interest rates. Approximately 60% of CDREIT’s borrowings are on fixed interest rates. Thus, CDREIT has moderate exposure to rising interest rates. Share Price Drivers:
Near-term earnings risk priced in. While CDREIT’s earnings are expected to be under pressure near term due to projected supply and demand imbalance in Singapore, we believe this has largely been priced in. The implied price per key for CDREIT’s Singapore portfolio stands at c.S$510k, which is below its replacement cost of c.S$700k and recent market transactions of above S$650k. Unjustified discount to other hospitality REITs. Compared to other hospitality S-REITs, CDREIT offers the cheapest exposure to the eventual upturn in the Singapore market. The implied price per key for other S-REITs stands at between S$650k and S$1m versus c.S$500k for CDREIT. Given the mid-tier to luxury category of CDREIT’s room inventory and its successful track record, we believe this valuation discount is unjustified. Key Risks:
Interest rate risk. Any increase in interest rates will result in higher interest payments, which could result in lower distribution per unit (DPU) for unitholders. Currency risk. As CDREIT earns rental income in various currencies (AUD, GBP, JPY, NZD and USD), a depreciation of any foreign currency against the SGD could negatively impact distribution income, which is distributed in SGD. Brexit. CDREIT’s hotel in Cambridge, UK contributed c.6% of 9M16 group NPI. With the UK voting to exit EU (Brexit), this may negatively impact business activities in the UK and CDREIT’s property. In addition, Brexit may result in a depreciation of the GBP versus SGD, which will negatively impact distributions in SGD. Company Background
CDL Hospitality Trusts (CDREIT) is a stapled group comprising H-REIT and HBT. H-REIT is a real estate investment trust that invests in a portfolio of income-producing hospitality-related properties while HBT is a business trust.
Aggregate Leverage (%)
ROE (%)
Distribution Yield (%)
PB Band (x)
Source: Company, DBS Bank
Page 183

ASIAN INSIGHTS VICKERS SECURITIES Page 4
Company Guide
CDL Hospitality Trusts
Income Statement (S$m)
FY Dec 2014A 2015A 2016F 2017F 2018F Gross revenue 167 172 175 174 182 Property expenses (26.3) (35.4) (39.3) (38.6) (39.0) Net Property Income 141 137 136 135 143 Other Operating expenses (17.8) (25.2) (21.5) (21.5) (21.7) Other Non Opg (Exp)/Inc 0.0 0.0 0.0 0.0 0.0 Net Interest (Exp)/Inc (16.4) (22.3) (22.6) (25.0) (27.3) Exceptional Gain/(Loss) 0.0 0.0 0.0 0.0 0.0 Net Income 106 89.6 91.9 89.0 93.8 Tax (1.4) (0.9) (2.3) (3.5) (3.6) Minority Interest 0.0 0.0 0.0 0.0 0.0 Preference Dividend 0.0 0.0 0.0 0.0 0.0 Net Income After Tax 105 88.7 89.6 85.5 90.2 Total Return 122 58.4 89.6 85.5 90.2 Non-tax deductible Items 11.4 50.5 13.8 13.8 14.1 Net Inc available for Dist. 120 109 103 99.3 104 Growth & Ratio Revenue Gth (%) 12.1 3.4 1.6 (0.7) 4.5 N Property Inc Gth (%) 2.3 (2.5) (0.7) (0.4) 5.5 Net Inc Gth (%) 1.0 (15.4) 1.0 (4.5) 5.5 Dist. Payout Ratio (%) 90.0 90.0 90.0 90.0 90.0 Net Prop Inc Margins (%) 84.2 79.5 77.6 77.8 78.5 Net Income Margins (%) 62.8 51.4 51.1 49.1 49.6 Dist to revenue (%) 71.6 63.2 59.0 57.1 57.4 Managers & Trustee’s fees 10.7 14.6 12.3 12.3 11.9 ROAE (%) 6.5 5.6 5.7 5.4 5.6 ROA (%) 4.4 3.5 3.5 3.3 3.5 ROCE (%) 5.1 4.5 4.4 4.3 4.6 Int. Cover (x) 7.5 5.0 5.1 4.6 4.4
Source: Company, DBS Bank
Improvement in earnings in FY18 due to a recovery in the Singapore hospitality market
Page 184
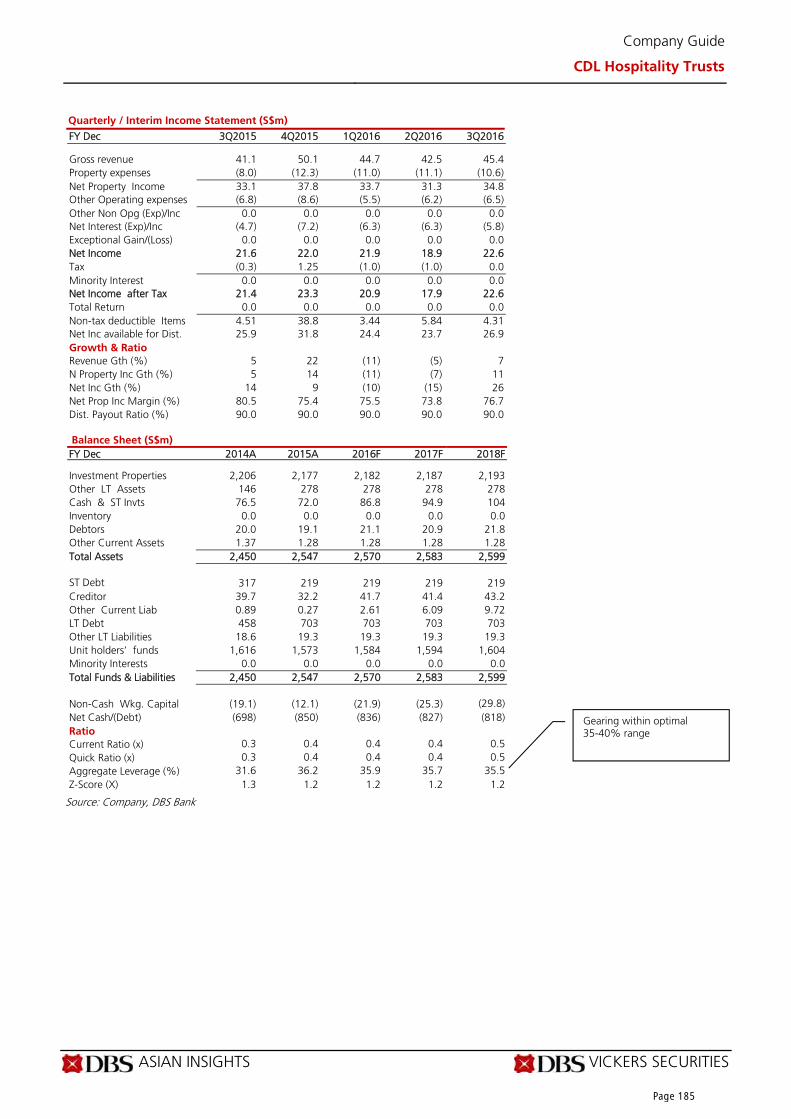
ASIAN INSIGHTS VICKERS SECURITIES Page 5
Company Guide
CDL Hospitality Trusts
Quarterly / Interim Income Statement (S$m)
FY Dec 3Q2015 4Q2015 1Q2016 2Q2016 3Q2016 Gross revenue 41.1 50.1 44.7 42.5 45.4 Property expenses (8.0) (12.3) (11.0) (11.1) (10.6) Net Property Income 33.1 37.8 33.7 31.3 34.8 Other Operating expenses (6.8) (8.6) (5.5) (6.2) (6.5) Other Non Opg (Exp)/Inc 0.0 0.0 0.0 0.0 0.0 Net Interest (Exp)/Inc (4.7) (7.2) (6.3) (6.3) (5.8) Exceptional Gain/(Loss) 0.0 0.0 0.0 0.0 0.0 Net Income 21.6 22.0 21.9 18.9 22.6 Tax (0.3) 1.25 (1.0) (1.0) 0.0 Minority Interest 0.0 0.0 0.0 0.0 0.0 Net Income after Tax 21.4 23.3 20.9 17.9 22.6 Total Return 0.0 0.0 0.0 0.0 0.0 Non-tax deductible Items 4.51 38.8 3.44 5.84 4.31 Net Inc available for Dist. 25.9 31.8 24.4 23.7 26.9 Growth & Ratio Revenue Gth (%) 5 22 (11) (5) 7 N Property Inc Gth (%) 5 14 (11) (7) 11 Net Inc Gth (%) 14 9 (10) (15) 26 Net Prop Inc Margin (%) 80.5 75.4 75.5 73.8 76.7 Dist. Payout Ratio (%) 90.0 90.0 90.0 90.0 90.0
Balance Sheet (S$m)
FY Dec 2014A 2015A 2016F 2017F 2018F Investment Properties 2,206 2,177 2,182 2,187 2,193 Other LT Assets 146 278 278 278 278 Cash & ST Invts 76.5 72.0 86.8 94.9 104 Inventory 0.0 0.0 0.0 0.0 0.0 Debtors 20.0 19.1 21.1 20.9 21.8 Other Current Assets 1.37 1.28 1.28 1.28 1.28 Total Assets 2,450 2,547 2,570 2,583 2,599 ST Debt 317 219 219 219 219 Creditor 39.7 32.2 41.7 41.4 43.2 Other Current Liab 0.89 0.27 2.61 6.09 9.72 LT Debt 458 703 703 703 703 Other LT Liabilities 18.6 19.3 19.3 19.3 19.3 Unit holders’ funds 1,616 1,573 1,584 1,594 1,604 Minority Interests 0.0 0.0 0.0 0.0 0.0 Total Funds & Liabilities 2,450 2,547 2,570 2,583 2,599 Non-Cash Wkg. Capital (19.1) (12.1) (21.9) (25.3) (29.8) Net Cash/(Debt) (698) (850) (836) (827) (818) Ratio Current Ratio (x) 0.3 0.4 0.4 0.4 0.5 Quick Ratio (x) 0.3 0.4 0.4 0.4 0.5 Aggregate Leverage (%) 31.6 36.2 35.9 35.7 35.5 Z-Score (X) 1.3 1.2 1.2 1.2 1.2
Source: Company, DBS Bank
Gearing within optimal 35-40% range
Page 185

ASIAN INSIGHTS VICKERS SECURITIES Page 6
Company Guide
CDL Hospitality Trusts
Cash Flow Statement (S$m)
FY Dec 2014A 2015A 2016F 2017F 2018F Pre-Tax Income 106 89.6 91.9 89.0 93.8 Dep. & Amort. 0.0 0.0 0.0 0.0 0.0 Tax Paid (0.2) (1.0) 0.0 0.0 0.0 Associates &JV Inc/(Loss) 0.0 0.0 0.0 0.0 0.0 Chg in Wkg.Cap. 3.83 0.39 7.46 (0.2) 0.92 Other Operating CF 29.6 43.4 13.8 13.8 14.1 Net Operating CF 139 132 113 103 109 Net Invt in Properties (93.0) (150) (5.3) (5.2) (5.5) Other Invts (net) 0.0 0.0 0.0 0.0 0.0 Invts in Assoc. & JV 0.0 0.0 0.0 0.0 0.0 Div from Assoc. & JVs 0.0 0.0 0.0 0.0 0.0 Other Investing CF 0.35 (2.0) 0.0 0.0 0.0 Net Investing CF (92.6) (152) (5.3) (5.2) (5.5) Distribution Paid (106) (103) (93.0) (89.4) (93.9) Chg in Gross Debt 83.2 138 0.0 0.0 0.0 New units issued 0.0 0.0 0.0 0.0 0.0 Other Financing CF (16.6) (19.7) 0.0 0.0 0.0 Net Financing CF (39.1) 15.3 (93.0) (89.4) (93.9) Currency Adjustments 0.0 0.46 0.0 0.0 0.0 Chg in Cash 7.72 (4.0) 14.9 8.04 9.53 Operating CFPS (S cts) 13.9 13.4 10.6 10.3 10.7 Free CFPS (S cts) 4.75 (1.8) 10.9 9.75 10.3
Source: Company, DBS Bank
Target Price & Ratings History
Source: DBS Bank
Analyst: Mervin SONG CFA
Derek TAN
Increase in capex due to acquisition of Cambridge City Hotel
Page 186

ASIAN INSIGHTS VICKERS SECURITIES ed: JS / sa: AS, PY
BUY Last Traded Price ( 4 Jan 2017): S$0.85 (STI : 2,921.31) Price Target 12-mth: S$0.99 (16% upside and 8.9% yield) Potential Catalyst: DPU accretive acquisitions Where we differ: Below on lower top line Analyst Mervin SONG CFA +65 6682 3715 [email protected] Derek TAN +65 6682 3716 [email protected]
Price Relative
Forecasts and Valuation FY Jun (JPYm) 2015A 2016A 2017F 2018F Gross Revenue 7,635 9,581 12,153 12,325 Net Property Inc 4,681 5,449 6,402 6,494 Total Return 7,579 6,003 3,666 3,735 Distribution Inc 3,358 3,981 4,957 5,034 EPU (S cts) 3.22 0.59 5.99 5.77 EPU Gth (%) (31) (82) 914 (4) DPU (S cts) 7.64 6.95 7.52 8.18 DPU Gth (%) (3) (9) 8 9 NAV per shr (S cts) 103 94.7 86.4 84.5 PE (X) 26.4 143.9 14.2 14.7 Distribution Yield (%) 9.0 8.2 8.9 9.7 P/NAV (x) 0.8 0.9 1.0 1.0 Aggregate Leverage (%) 47.3 45.3 45.1 45.2 ROAE (%) 3.3 0.6 6.6 6.8 Distn. Inc Chng (%): 0 0 Consensus DPU (S cts): 9.3 9.6 Other Broker Recs: B: 4 S: 0 H: 0
Source of all data on this page: Company, DBS Bank, Bloomberg Finance L.P.
Onwards and upwards
Internally managed to improve alignment and removes one barrier to a takeover. We maintain our BUY call and TP of S$0.99. We believe the perception of a greater alignment between the interest of Croesus Retail Trust (CRT)’s unitholders and management following CRT’s move to be the first internally managed trust will help close the discount to our TP. This is despite dissatisfaction from some unitholders with the price paid to buy out CRT’s trustee-manager (c.S$50m) and concerns over the large upfront cash payment to the current management team for their stake in the trustee-manager. In addition, with CRT no longer having an external trustee-manager, we believe this may remove a hurdle to a potential takeover by a J-REIT as speculated by some market participants due to CRT’s persistent high yield and discount to its NAV. Boost from recent acquisitions. Going forward, CRT should benefit from the full-year contribution from the acquisition of Torius property in Fukuoka (7.8% yield based on net property income (NPI)) in Sep15 and recent purchase of three retail malls (Fuji Grand Natalie, Mallage Saga and Feeeal Asahikawa) on 7.1% NPI yield. In addition, with FY18 income hedged at SGD/JPY rate of 76.4, down from 83.6 in FY17, CRT has one of the highest growth rates among our SREIT universe with a two-year DPU CAGR of 8% in SGD terms. This is before any interest savings on the back of lower Japanese interest rates which we have yet to fully price in. Medium-term upside potential from asset enhancement initiatives (AEIs). Over the medium term, CRT should also receive a boost from potential AEI and/or tenant remixing at One’s Mall, Torius Mall and Feeeal Asahikawa. This is in addition to any further acquisitions.
Valuation:
We maintain our DCF-based TP of S$0.99. Key Risks to Our View:
The key risks to our view include: (1) weaker JPY versus SGD, (2) higher-than-expected take-up of its Dividend Reinvestment Plan (DRP) which we have assumed c.25% take-up and (3) lower-than-expected uplift in rents At A Glance Issued Capital (m shrs) 758 Mkt. Cap (S$m/US$m) 644 / 444 Major Shareholders (%) GKG Investment 6.8 Value Partners Group Ltd 6.2 DBS Group Holdings Ltd 5.7
Free Float (%) 81.8 3m Avg. Daily Val (US$m) 0.53 ICB Industry : Real Estate / Real Estate Investment Trusts
DBS Group Research . Equity 4 Jan 2017
Singapore Company Guide
Croesus Retail Trust Version 5 | Bloomberg: CRT SP | Reuters: CROE.SI Refer to important disclosures at the end of this report
88
108
128
148
168
188
208
0.7
0.8
0.8
0.9
0.9
1.0
1.0
1.1
1.1
1.2
1.2
May-13 May-14 May-15 May-16
Relative IndexS$
Croesus Retail Trust (LHS) Relative STI (RHS)
Page 187

ASIAN INSIGHTS VICKERS SECURITIES Page 2
Company Guide
Croesus Retail Trust
CRITICAL DATA POINTS TO WATCH
Earnings Drivers: Strong cashflow visibility. CRT has a weighted average lease expiry (WALE) by net lettable area (NLA) of seven years, which is among the longest in the S-REIT market. Its occupancy of close to 100% provides investors with significant cashflow visibility. In addition, with c.88% and c.79% of FY17 and FY18 rents already locked in respectively, CRT offers a stable income stream. This, combined with lease expiry profile of 11.9%, 9.0% and 6.7% of leases (by NLA) in FY17, FY18 and FY19 respectively, gives CRT the opportunity to change the tenant mix and/or drive higher rentals. This in turn provides upside to our earnings and DPU estimates. Contribution from recent acquisitions and favourable hedges. Moving forward, CRT should also receive an earnings boost from the acquisition of Torius property in Fukuoka (7.8% NPI yield) in Sep15 and recent purchase of three retail malls (Fuji Grand Natalie, Mallage Saga and Feeeal Asahikawa) on a 7.1% NPI yield. In addition, with CRT having already hedged its FY18 income at SGD/JPY rate of 76.4, we project a two-year SGD DPU CAGR of 8%. Continued benefits from renewal of Mallage Shobu. CRT’s Mallage Shobu property which contributed c.26% of the trust’s 4Q16 NPI undertook a major renewal exercise in March 2015 which consisted of (1) AEI works including family-friendly improvement works to restrooms, nursing rooms and rest areas, as well as improved LED lightning facilities, (2) introduction of 69 new brands/tenants such as Toys R Us, Kurashiki Coffee and Majestic Legon (women’s apparel and fashion), (3) tenant renewal exercise for 155 out of 242 leases, and (4) positive rental reversions in the double digits. We believe CRT’s earnings should continue to benefit from this AEI as the mall gains further traction from its nearby residents. Favourable lease structures. Approximately 62% of the CRT’s leases are under fixed term leases. Under this lease structure, which are typically shorter in tenure (between 3-5 years), CRT has the flexibility to adjust rents and tenant composition upon expiry of leases. This compares to the standard lease, which is more favourable to tenants as upon expiry of the lease, the tenants can opt to stay and renew the lease at market rates. Medium-term upside at One’s Mall, Torius property and Feeeal Asahikawa. We understand there are opportunities to drive rents higher at One’s Mall, Torius property and Feeeal Asahikawa in the medium term. This will come primarily from the change in tenant mix as some tenants/anchor tenants are low yielding at the moment. At this stage, CRT has not provided any details on its AEI plans. Costs savings from internalisation. We expect CRT to benefit from its decision to bring in house its trustee-manager. This should result in costs savings as fees paid to a third party manager are now eliminated and replaced with lower internal overheads. Partially offset this benefit is the higher units on issue following the preferential offering use to help fund the purchase of the third party trustee-manager.
Net Property Income and Margins (%)
Net Property Income and Margins (%)
Distribution Paid / Net Operating CF
Interest Cover (x)
Source: Company, DBS Bank
50.0%
55.0%
60.0%
65.0%
70.0%
0
1,000
2,000
3,000
4,000
5,000
6,000
2014A 2015A 2016A 2017F 2018F
JPY m
Net Property Income Net Property Income Margin %
-350%
-300%
-250%
-200%
-150%
-100%
-50%
0%
50%
100%
150%
-589
-89
411
911
1,411
4Q20
14
1Q20
15
2Q20
15
3Q20
15
4Q20
15
1Q20
16
2Q20
16
3Q20
16
4Q20
16
1Q20
17
Net Property Income Net Property Income Margin %
0.4
0.6
0.8
1.0
1.2
1.4
1.6
1.8
2.0
2014A 2015A 2016A 2017F 2018F
(x)
0.00
1.00
2.00
3.00
4.00
5.00
6.00
2014A 2015A 2016A 2017F 2018F
(x)
Page 188

ASIAN INSIGHTS VICKERS SECURITIES Page 3
Company Guide
Croesus Retail Trust
Balance Sheet:
Gearing on downtrend. Following proceeds from the recent rights issue, CRT’s gearing fell to 44.6% from 45.3% at end June 2016. While this is high compared to other S-REITs, given that CRT’s underlying properties are located in Japan, the willingness of Japanese banks to extend credit to CRT and its business trust structure provides CRT the ability to sustain a gearing closer to 50% level. 100% hedged. To manage its interest exposure, CRT has fully hedged all its borrowings, with its all-in cost of debt standing at c.1.9%. Share Price Drivers:
Re-rating on internally managed trust. With the recent buy-out of CRT’s trustee-manager, CRT will be the first trust in Singapore to be internally managed. We believe the improved perception that the management team of CRT is aligned with its unitholders, will help close the discount between CRT’s share price and its NAV per share of c.S$1.00 (JPY75.14). Inorganic growth through acquisitions. CRT continues to look for acquisition opportunities. Such DPU-accretive transactions should boost CRT’s DPU and help re-rate its share price. Near term it has the funding advantage to secure to pursue DPU accretive acquisitions as CRT is able to secure cheap debt (sub 1% interest rate). Key Risks:
Downturn in Japanese economy. The quantitative easing (QE) programme initiated by the BOJ was designed to boost the Japanese economy and inflationary expectations. Should the QE fail to deliver on its objectives, there is risk that a weaker economy may negatively impact rents and capital values of CRT’s portfolio. FX risks. While CRT has hedged its projected distributable income until June 2018, should the JPY depreciate against the SGD, going forward, CRT’s DPU would be negatively impacted. Company Background
Croesus Retail Trust is a business trust that focuses on income-generating retail assets in Japan. Its portfolio comprises seven assets which are close to fully occupied and backed by a long lease expiry profile.
Aggregate Leverage (%)
ROE (%)
Distribution Yield (%)
PB Band (x)
Source: Company, DBS Bank
20.0%
25.0%
30.0%
35.0%
40.0%
45.0%
50.0%
2014A 2015A 2016A 2017F 2018F
0.0%
1.0%
2.0%
3.0%
4.0%
5.0%
6.0%
2014A 2015A 2016A 2017F 2018F
Avg: 8.6%
+1sd: 9.2%
+2sd: 9.7%
‐1sd: 8.1%
‐2sd: 7.6%
6.0
6.5
7.0
7.5
8.0
8.5
9.0
9.5
10.0
10.5
2014 2015 2016
(%)
Avg: 0.91x
+1sd: 0.98x
+2sd: 1.06x
‐1sd: 0.84x
‐2sd: 0.76x
0.6
0.7
0.8
0.9
1.0
1.1
1.2
Jun-14 Dec-14 Jun-15 Dec-15 Jun-16 Dec-16
(x)
Page 189

ASIAN INSIGHTS VICKERS SECURITIES Page 4
Company Guide
Croesus Retail Trust
Income Statement (JPYm)
FY Jun 2014A 2015A 2016A 2017F 2018F Gross revenue 6,261 7,635 9,581 12,153 12,325 Property expenses (2,232) (2,954) (4,132) (5,751) (5,830) Net Property Income 4,029 4,681 5,449 6,402 6,494 Other Operating expenses (765) (720) (976) (775) (779) Other Non Opg (Exp)/Inc (44.4) 370 (1,239) 0.0 0.0 Net Interest (Exp)/Inc (705) (1,001) (1,096) (1,126) (1,129) Exceptional Gain/(Loss) 0.0 0.0 0.0 0.0 0.0 Net Income 2,515 3,330 2,137 4,501 4,586 Tax (1,551) (2,087) (1,840) (835) (851) Minority Interest 0.0 0.0 0.0 0.0 0.0 Preference Dividend 0.0 0.0 0.0 0.0 0.0 Net Income After Tax 964 1,242 297 3,666 3,735 Total Return 4,793 7,579 6,003 3,666 3,735 Non-tax deductible Items 2,215 2,116 3,684 1,290 1,298 Net Inc available for Dist. 3,180 3,358 3,981 4,957 5,034 Growth & Ratio Revenue Gth (%) N/A 21.9 25.5 26.8 1.4 N Property Inc Gth (%) nm 16.2 16.4 17.5 1.4 Net Inc Gth (%) nm 28.8 (76.1) 1,134.5 1.9 Dist. Payout Ratio (%) 100.0 100.0 100.0 100.0 100.0 Net Prop Inc Margins (%) 64.3 61.3 56.9 52.7 52.7 Net Income Margins (%) 15.4 16.3 3.1 30.2 30.3 Dist to revenue (%) 50.8 44.0 41.5 40.8 40.8 Managers & Trustee’s fees 12.2 9.4 10.2 6.4 6.3 ROAE (%) 6.0 3.3 0.6 6.6 6.8 ROA (%) 2.5 1.4 0.3 2.8 2.8 ROCE (%) 3.6 1.9 0.6 4.2 4.3 Int. Cover (x) 4.6 4.0 4.1 5.0 5.1
Source: Company, DBS Bank
Growth arising from acquisition of One’s Mall, Torius property, Fuji Grand Natalie, Mallage Saga and Feeeal Asahikawa
Page 190

ASIAN INSIGHTS VICKERS SECURITIES Page 5
Company Guide
Croesus Retail Trust
Quarterly / Interim Income Statement (JPYm)
FY Jun 1Q2016 2Q2016 3Q2016 4Q2016 1Q2017 Gross revenue 2,007 2,434 2,466 2,675 3,126 Property expenses (774) (1,066) (1,057) (1,236) (1,529) Net Property Income 1,233 1,368 1,409 1,440 1,596 Other Operating expenses (232) (246) (255) (300) (787) Other Non Opg (Exp)/Inc 0.0 0.0 0.0 0.0 0.0 Net Interest (Exp)/Inc (257) (268) (264) (307) (316) Exceptional Gain/(Loss) (584) 136 29.2 (821) 14.0 Net Income 160 989 919 12.2 507 Tax (174) (248) (187) (1,231) (245) Minority Interest 0.0 0.0 0.0 0.0 0.0 Net Income after Tax (13.7) 741 732 (1,219) 262 Total Return (13.7) 794 732 4,434 262 Non-tax deductible Items 932 179 289 (3,366) 890 Net Inc available for Dist. 919 973 1,021 1,068 1,152 Growth & Ratio Revenue Gth (%) 1 21 1 9 17 N Property Inc Gth (%) 2 11 3 2 11 Net Inc Gth (%) 96 nm (1) nm nm Net Prop Inc Margin (%) 61.4 56.2 57.1 53.8 51.1 Dist. Payout Ratio (%) 100.0 100.0 100.0 100.0 100.0
Balance Sheet (JPYm)
FY Jun 2014A 2015A 2016A 2017F 2018F Investment Properties 68,870 87,930 112,640 112,762 113,008 Other LT Assets 3,335 5,063 6,628 6,628 6,628 Cash & ST Invts 2,754 2,942 5,385 6,046 6,069 Inventory 0.0 0.0 0.0 0.0 0.0 Debtors 708 491 1,655 1,736 1,761 Other Current Assets 2,883 3,975 4,866 4,866 4,866 Total Assets 78,551 100,401 131,175 132,038 132,332 ST Debt 358 647 8,337 8,337 8,337 Creditor 885 1,219 2,151 2,300 2,332 Other Current Liab 681 914 2,112 2,705 2,721 LT Debt 40,244 46,840 51,057 51,179 51,425 Other LT Liabilities 3,990 7,194 12,204 12,204 12,204 Unit holders’ funds 32,394 43,586 55,313 55,313 55,313 Minority Interests 0.0 0.0 0.0 0.0 0.0 Total Funds & Liabilities 78,551 100,401 131,175 132,038 132,332 Non-Cash Wkg. Capital 2,026 2,333 2,258 1,598 1,574 Net Cash/(Debt) (37,848) (44,546) (54,010) (53,471) (53,694) Ratio Current Ratio (x) 3.3 2.7 0.9 0.9 0.9 Quick Ratio (x) 3.3 2.7 0.9 0.9 0.9 Aggregate Leverage (%) 51.7 47.3 45.3 45.1 45.2 Z-Score (X) 0.5 0.6 0.4 0.5 0.5
Source: Company, DBS Bank
Decline due to asset revaluation gains
Page 191

ASIAN INSIGHTS VICKERS SECURITIES Page 6
Company Guide
Croesus Retail Trust
Cash Flow Statement (JPYm)
FY Jun 2014A 2015A 2016A 2017F 2018F Pre-Tax Income 2,515 3,330 2,137 4,501 4,586 Dep. & Amort. 0.0 0.0 0.0 0.0 0.0 Tax Paid (148) (337) (400) (243) (835) Associates &JV Inc/(Loss) 0.0 0.0 0.0 0.0 0.0 Chg in Wkg.Cap. (2,661) (344) (1,588) 68.4 7.18 Other Operating CF 1,204 561 2,278 1,290 1,298 Net Operating CF 909 3,210 2,427 5,617 5,057 Net Invt in Properties (66,053) (11,712) (19,004) (122) (246) Other Invts (net) 0.0 0.0 0.0 0.0 0.0 Invts in Assoc. & JV 0.0 0.0 0.0 0.0 0.0 Div from Assoc. & JVs 0.0 0.0 0.0 0.0 0.0 Other Investing CF 0.0 0.0 0.0 0.0 0.0 Net Investing CF (66,053) (11,712) (19,004) (122) (246) Distribution Paid (1,810) (3,101) (4,652) (4,957) (5,034) Chg in Gross Debt 40,305 5,634 13,420 122 246 New units issued 29,404 6,108 10,273 0.0 0.0 Other Financing CF 0.0 0.0 0.0 0.0 0.0 Net Financing CF 67,898 8,642 19,040 (4,835) (4,787) Currency Adjustments 0.07 46.4 (19.5) 0.0 0.0 Chg in Cash 2,754 187 2,443 660 23.4 Operating CFPS (S cts) 17.3 9.21 7.98 9.06 7.80 Free CFPS (S cts) (316) (22.0) (33.0) 8.98 7.43
Source: Company, DBS Bank
Target Price & Ratings History
Source: DBS Bank
Analyst: Mervin SONG CFA, Derek TAN
S.No.Date of Report
Closing Price
12-mth Target Price
Rat ing
1: 11 Feb 16 0.79 0.86 HOLD
2: 16 May 16 0.82 0.90 BUY
3: 13 Jun 16 0.81 0.90 BUY
4: 29 Aug 16 0.86 0.99 BUY
5: 08 Nov 16 0.87 0.99 BUY
6: 11 Nov 16 0.85 0.99 BUY
Note : Share price and Target price are adjusted for corporate actions.
1
2
3
4
56
0.72
0.77
0.82
0.87
0.92
Jan-16 May-16 Sep-16 Jan-17
S$
Acquisition of Torius property, Fuji Grand Natalie, Mallage Saga and Feeeal Asahikawa
Two rights issues and placement for acquisitions and to fund internalisation of the trustee-manager
Page 192

ASIAN INSIGHTS VICKERS SECURITIES ed: TH / sa: JC, PY
HOLD Last Traded Price (4 Jan 2017): S$0.595 (STI : 2,921.31)
Price Target 12-mth: S$0.62 (4% upside and 6.6% yield)
Potential Catalyst: Recovery in the Singapore hospitality market, and
acquisitions
Where we differ: Below consensus due to expected decline in RevPAR
Analyst Mervin SONG CFA +65 6682 3715 [email protected] Derek TAN +65 6682 3716 [email protected]
Price Relative
Forecasts and Valuation FY Dec (S$m) 2015A 2016F 2017F 2018F
Gross Revenue 115 111 109 114 Net Property Inc 104 100 97.9 103 Total Return 33.2 65.5 62.8 68.2 Distribution Inc 82.2 76.6 73.8 79.5 EPU (S cts) 4.20 3.65 3.48 3.75 EPU Gth (%) (5) (13) (5) 8 DPU (S cts) 4.60 4.26 3.95 4.23 DPU Gth (%) (11) (7) (7) 7 NAV per shr (S cts) 93.9 93.7 93.1 92.6 PE (X) 14.2 16.3 17.1 15.9 Distribution Yield (%) 7.7 7.2 6.6 7.1 P/NAV (x) 0.6 0.6 0.6 0.6 Aggregate Leverage (%) 32.4 32.8 33.3 33.3 ROAE (%) 4.4 3.9 3.7 4.0 DPU Chng (%): - 0 - Consensus DPU (S cts): 4.2 4.2 4.4 Other Broker Recs: B: 1 S: 2 H: 5
Source of all data on this page: Company, DBS Bank, Bloomberg Finance L.P.
Headwinds still present Limited re-rating catalysts. We maintain our HOLD call and TP of S$0.62. As a Singapore-focused REIT and with competitive pressures in the Singapore hospitality market that are expected to persist, we believe there are limited re-rating catalysts for Far East Hospitality Trust (FEHT) in the near term. This is despite the inherent long-term value given that FEHT is trading at 0.6x P/BV. Competitive pressures to persist. While the majority of new hotel supply in Singapore this year is largely concentrated within the Singapore River precinct away from FEHT’s hotels, we believe the 5-6% increase in overall industry room inventory will still put pressure on FEHT’s operations. In addition, with new room supply not easing until 2018, corporate demand still soft and FEHT’s new hotel in Sentosa only completing in 2018, we expect FEHT’s DPU performance to remain muted over the coming year. Strong balance sheet. Even though we are cautious on FEHT’s near-term earnings, there is significant upside to our forecast if FEHT deploys its strong balance sheet well. FEHT’s gearing as at end-September 2016 stood at approximately 32% and its sponsor provides a clear and visible ROFR pipeline of seven properties. Valuation:
We maintain our DCF-based TP of S$0.62 which has
incorporated the delayed expectations of the recovery of the
Singapore office market from 2017 to 2018.
Key Risks to Our View:
Rebound in demand and acquisitions. Our cautious stance on
FEHT is premised on a supply imbalance in the Singapore
hospitality market. However, a significant rebound in demand,
absorbing the new room supply, and FEHT utilising its strong
balance sheet, would lead to upside risks to our DPU estimates
and TP. At A Glance Issued Capital (m shrs) 1,801
Mkt. Cap (S$m/US$m) 1,072 / 750
Major Shareholders (%)
Golden Development Pte Ltd 20.4
Golden Landmark Pte Ltd 10.7
Far East Organization 10.1
Free Float (%) 44.3
3m Avg. Daily Val (US$m) 0.53
ICB Industry : Real Estate / Real Estate Investment Trusts
DBS Group Research . Equity
4 Jan 2017
Singapore Company Guide
Far East Hospitality Trust Version 5 | Bloomberg: FEHT SP | Reuters: FAEH.SI Refer to important disclosures at the end of this report
58
78
98
118
138
158
178
198
218
0.5
0.6
0.7
0.8
0.9
1.0
1.1
1.2
1.3
Jan-13 Jan-14 Jan-15 Jan-16 Jan-17
Relative IndexS$
Far East Hospitality Trust (LHS) Relative STI (RHS)
Page 193

ASIAN INSIGHTS VICKERS SECURITIES
Page 2
Company Guide
Far East Hospitality Trust
CRITICAL DATA POINTS TO WATCH
Earnings Drivers:
Downturn in the Singapore hospitality market. The Singapore
hospitality market faces the challenge of navigating a 5-6%
increase in hotel room supply this year but at the same time,
only a modest recovery in total visitors days and weak corporate
demand which is typically higher yielding. In such an
environment, we believe hotels including those owned by FEHT,
will face pressure on occupancy and ADRs. With supply
expected to increase by 6% in 2017, we believe pressure on
RevPAR will persist. Thus, we estimate that the price-heightened
competition will lead to 5-7% and 4% declines in FEHT’s FY16F
and FY17F hotel and serviced residence RevPAR/RevPAU.
Some cushion from asset enhancement initiatives. Partially
mitigating the effects of a supply imbalance in the Singapore
hospitality market are the asset enhancement initiatives (AEI)
that FEHT has undertaken. The refurbishments are expected to
help maintain FEHT’s relevance in the market place as well as
boost occupancy and ADR over the medium term. The following
are the AEIs that FEHT has completed across its portfolio: (1)
extension of outdoor refreshment area at Village Residence
Robertson Quay, (2) soft refurbishment of club & suite rooms
and meeting areas at Village Hotel Changi, (iii) reconfiguration
of the serviced office space to create nine additional units as
well as the upgrade of the main lobby, breakfast lounge and
pantry at Central Square (Village Residence Clarke Quay), (iv)
refurbishment of 2- and 3-bedroom units at Regency House,
and (v) upgrading of the swimming pool, function rooms, lobby
area and lobby bar.
Medium-term outlook remains bright. Despite the short-term
headwinds, the medium-term outlook for FEHT remains bright.
With no new hotel land sites being released by the Singapore
government over the last two years, supply could be
constrained from 2018 onwards. In addition, FEHT should
benefit from the opening of the 850-room Sentosa hotel
development in 2018.
Acquisitions yet to be priced in. With gearing at only 32%,
FEHT is well positioned to expand its portfolio through
acquisitions. Assuming FEHT gears up to the 40% level, we
estimate the trust to have c.S$300-350m of debt headroom.
Through its sponsor, Far East Organization, FEHT has a visible
acquisition pipeline. In particular, it has the right of first refusal
over seven properties.
Net Property Income and Margins (%)
Net Property Income and Margins (%)
Distribution Paid / Net Operating CF
Interest Cover (x)
Source: Company, DBS Bank
85.4%
87.4%
89.4%
91.4%
93.4%
95.4%
97.4%
99.4%
0
20
40
60
80
100
120
140
160
180
200
2014A 2015A 2016F 2017F 2018F
S$ m
Net Property Income Net Property Income Margin %
89%
89%
90%
90%
91%
91%
92%
22
23
24
25
26
27
28
29
2Q20
14
3Q20
14
4Q20
14
1Q20
15
2Q20
15
3Q20
15
4Q20
15
1Q20
16
2Q20
16
3Q20
16
Net Property Income Net Property Income Margin %
0.3
0.4
0.5
0.6
0.7
0.8
0.9
1.0
2014A 2015A 2016F 2017F 2018F
(x)
0.00
1.00
2.00
3.00
4.00
5.00
6.00
2014A 2015A 2016F 2017F 2018F
(x)
Page 194

ASIAN INSIGHTS VICKERS SECURITIES
Page 3
Company Guide
Far East Hospitality Trust
Balance Sheet:
Gearing unchanged. FEHT’s gearing at end-3Q16 was stable at
c.32% which is comfortably below management’s 40% and
MAS’s new 45% gearing limit.
Moderate exposure to rising interest rates. Currently, 71% of
FEHT’s borrowings are under fixed rates, reducing its exposure
to volatility in interest rates.
Share Price Drivers:
Negative near-term sentiment. FEHT’s share price has been
weak over the past year due to a combination of soft tourist
arrivals and large new room supply which has translated into a
fall in RevPAR and DPU. While tourist arrivals are recovering,
new hotel supply should continue to outpace demand. Thus, we
believe there are limited re-rating catalysts for the stock in the
near term.
Key Risks:
Interest rate risk. Any increase in interest rates will result in
higher interest payments that the REIT has to make annually to
service its loans. This reduces the income available for
distribution, which will result in lower distribution per unit
(DPU) for unitholders.
Competitive landscape. The Singapore hospitality market has
been impacted by a decline in tourist arrivals in 2014 and 2015
thus far. With an increase in new hotel supply in 2016 and
2017 and if demand does not recover, FEHT’s earnings may be
impacted.
Company Background
Far East Hospitality Trust (FEHT) is a hospitality stapled group
comprising Far East H-REIT and Far East H-Business Trust. Far
East H-REIT is a Singapore-based real estate investment trust,
which invests in hospitality assets including both hotels and
serviced residences.
Aggregate Leverage (%)
ROE (%)
Distribution Yield (%)
PB Band (x)
Source: Company, DBS Bank
10.0%
15.0%
20.0%
25.0%
30.0%
35.0%
2014A 2015A 2016F 2017F 2018F
0.0%
0.5%
1.0%
1.5%
2.0%
2.5%
3.0%
3.5%
4.0%
4.5%
2014A 2015A 2016F 2017F 2018F
Avg: 6.1%
+1sd: 7.5%
+2sd: 9%
-1sd: 4.7%
-2sd: 3.3%
1.9
2.9
3.9
4.9
5.9
6.9
7.9
8.9
9.9
2013 2014 2015 2016
(%)
Avg: 0.82x
+1sd: 0.97x
+2sd: 1.12x
-1sd: 0.67x
-2sd: 0.53x
0.4
0.5
0.6
0.7
0.8
0.9
1.0
1.1
1.2
1.3
1.4
Jan-13 Jan-14 Jan-15 Jan-16
(x)
Page 195

ASIAN INSIGHTS VICKERS SECURITIES
Page 4
Company Guide
Far East Hospitality Trust
Income Statement (S$m)
FY Dec 2014A 2015A 2016F 2017F 2018F
Gross revenue 122 115 111 109 114
Property expenses (11.7) (11.0) (11.0) (11.1) (11.5)
Net Property Income 110 104 100 97.9 103
Other Operating expenses (13.8) (13.1) (12.9) (12.8) (13.2)
Other Non Opg (Exp)/Inc (0.8) 4.93 0.0 0.0 0.0
Net Interest (Exp)/Inc (17.5) (20.4) (22.0) (22.3) (22.6)
Exceptional Gain/(Loss) 0.0 0.0 0.0 0.0 0.0
Net Income 78.0 75.0 65.5 62.8 68.6
Tax 0.0 0.0 0.0 0.0 (0.4)
Minority Interest 0.0 0.0 0.0 0.0 0.0
Preference Dividend 0.0 0.0 0.0 0.0 0.0
Net Income After Tax 78.0 75.0 65.5 62.8 68.2
Total Return 71.3 33.2 65.5 62.8 68.2
Non-tax deductible Items 20.2 48.9 11.1 11.0 11.3
Net Inc available for Dist. 91.5 82.2 76.6 73.8 79.5
Growth & Ratio
Revenue Gth (%) (0.6) (5.8) (2.8) (2.2) 5.0
N Property Inc Gth (%) (1.7) (5.8) (3.1) (2.5) 5.2
Net Inc Gth (%) (15.5) (3.9) (12.6) (4.2) 8.6
Dist. Payout Ratio (%) 100.0 100.0 100.0 97.0 97.0
Net Prop Inc Margins (%) 90.4 90.4 90.1 89.8 90.0
Net Income Margins (%) 64.1 65.4 58.8 57.6 59.6
Dist to revenue (%) 75.2 71.7 68.7 67.7 69.5
Managers & Trustee’s fees to sales %)
11.3 11.4 11.6 11.8 11.5
ROAE (%) 4.5 4.4 3.9 3.7 4.0
ROA (%) 3.1 3.0 2.6 2.5 2.7
ROCE (%) 3.9 3.6 3.5 3.4 3.6
Int. Cover (x) 5.5 4.4 4.0 3.8 4.0
Source: Company, DBS Bank
The decline in earnings is largely a result of a projected decline in FEHT’s FY16 and FY17 serviced residence and hotel RevPAR
Page 196

ASIAN INSIGHTS VICKERS SECURITIES
Page 5
Company Guide
Far East Hospitality Trust
Quarterly / Interim Income Statement (S$m)
FY Dec 3Q2015 4Q2015 1Q2016 2Q2016 3Q2016
Gross revenue 29.7 28.9 27.4 26.1 28.0
Property expenses (2.8) (2.6) (2.7) (2.7) (2.7)
Net Property Income 26.9 26.3 24.7 23.5 25.4
Other Operating expenses (3.3) (3.3) (3.2) (3.1) (3.2)
Other Non Opg (Exp)/Inc 2.78 0.60 (7.5) (1.2) (1.9)
Net Interest (Exp)/Inc (5.2) (5.3) (5.2) (5.0) (4.9)
Exceptional Gain/(Loss) 0.0 0.0 0.0 0.0 0.0
Net Income 21.1 18.3 8.82 14.2 15.4
Tax 0.0 0.0 0.0 0.0 0.0
Minority Interest 0.0 0.0 0.0 0.0 0.0
Net Income after Tax 21.1 18.3 8.82 14.2 15.4
Total Return 21.1 (23.5) 8.82 14.2 15.4
Non-tax deductible Items 0.45 2.38 10.6 4.10 4.87
Net Inc available for Dist. 21.6 20.7 19.4 18.3 20.3
Growth & Ratio
Revenue Gth (%) 3 (3) (5) (4) 7
N Property Inc Gth (%) 3 (2) (6) (5) 8
Net Inc Gth (%) 30 (13) (52) 61 9
Net Prop Inc Margin (%) 90.7 91.1 90.2 89.8 90.5
Dist. Payout Ratio (%) 100.0 100.0 100.0 100.0 100.0
Balance Sheet (S$m)
FY Dec 2014A 2015A 2016F 2017F 2018F Investment Properties 2,476 2,439 2,443 2,446 2,449
Other LT Assets 15.6 15.5 31.5 47.5 47.6
Cash & ST Invts 20.9 25.4 35.8 36.2 36.3
Inventory 0.0 0.0 0.0 0.0 0.0
Debtors 19.3 30.5 17.6 17.2 18.1
Other Current Assets 5.45 10.4 10.4 10.4 10.4
Total Assets 2,537 2,521 2,538 2,557 2,562
ST Debt
116 36.9 36.9 36.9 36.9
Creditor 3.28 2.80 3.01 2.94 3.09
Other Current Liab 6.26 10.1 10.1 10.1 10.5
LT Debt 680 780 797 814 815
Other LT Liabilities 8.49 7.21 7.21 7.21 7.21
Unit holders’ funds 1,724 1,684 1,684 1,686 1,688
Minority Interests 0.0 0.0 0.0 0.0 0.0
Total Funds & Liabilities 2,537 2,521 2,538 2,557 2,562
Non-Cash Wkg. Capital 15.2 27.9 14.9 14.5 14.8
Net Cash/(Debt) (774) (792) (798) (815) (816)
Ratio
Current Ratio (x) 0.4 1.3 1.3 1.3 1.3
Quick Ratio (x) 0.4 1.3 1.3 1.3 1.3
Aggregate Leverage (%) 31.3 32.4 32.8 33.3 33.3
Z-Score (X) 0.9 0.9 0.9 0.8 0.8
Source: Company, DBS Bank
FEHT remains in a strong financial position with gearing in the low 30s
Page 197

ASIAN INSIGHTS VICKERS SECURITIES
Page 6
Company Guide
Far East Hospitality Trust
Cash Flow Statement (S$m)
FY Dec 2014A 2015A 2016F 2017F 2018F
Pre-Tax Income 78.0 75.0 65.5 62.8 68.6
Dep. & Amort. 0.0 0.0 0.0 0.0 0.0
Tax Paid 0.0 0.0 0.0 0.0 0.0
Associates &JV Inc/(Loss) 0.0 0.08 0.0 0.0 (1.5)
Chg in Wkg.Cap. 2.56 9.55 13.1 0.32 (0.7)
Other Operating CF 29.0 26.0 11.1 11.0 11.3
Net Operating CF 110 111 89.7 74.1 77.7
Net Invt in Properties (8.1) (5.0) (3.3) (3.3) (3.4)
Other Invts (net) 0.0 0.0 0.0 0.0 0.0
Invts in Assoc. & JV (15.6) (21.3) (16.0) (16.0) 0.0
Div from Assoc. & JVs 0.0 0.0 0.0 0.0 1.30
Other Investing CF 0.0 0.0 0.0 0.0 0.0
Net Investing CF (23.7) (26.3) (19.3) (19.2) (2.1)
Distribution Paid (93.4) (84.0) (76.6) (71.6) (77.1)
Chg in Gross Debt 15.6 21.3 16.6 17.1 1.59
New units issued 0.0 0.0 0.0 0.0 0.0
Other Financing CF (16.3) (17.1) 0.0 0.0 0.0
Net Financing CF (94.1) (79.8) (60.0) (54.5) (75.5)
Currency Adjustments 0.0 0.0 0.0 0.0 0.0
Chg in Cash (8.3) 4.54 10.4 0.41 0.08
Operating CFPS (S cts) 6.04 5.66 4.27 4.09 4.32
Free CFPS (S cts) 5.73 5.92 4.81 3.93 4.09
Source: Company, DBS Bank
Target Price & Ratings History
Source: DBS Bank
Analyst: Mervin SONG CFA, Derek TAN
S.No.Date of
Report
Closing
Price
12-mth
Target
Price
Rat ing
1: 21 Jan 16 0.64 0.63 HOLD
2: 13 Apr 16 0.66 0.63 HOLD
3: 27 Apr 16 0.67 0.63 HOLD
4: 01 Aug 16 0.63 0.65 HOLD
5: 05 Sep 16 0.61 0.65 HOLD
6: 11 Nov 16 0.60 0.62 HOLD
Note : Share price and Target price are adjusted for corporate actions.
1
23
4
5
6
0.54
0.56
0.58
0.60
0.62
0.64
0.66
0.68
0.70
Jan-16 May-16 Sep-16 Jan-17
S$
Equity contribution for FEHT’s 30% stake in the 850-room Sentosa hotel development
Page 198

ASIAN INSIGHTS VICKERS SECURITIES ed: JS / sa: YM, PY
BUY Last Traded Price ( 4 Jan 2017): S$1.93 (STI : 2,921.31)
Price Target 12-mth: S$2.29 (19% upside and 6.1% yield)
Potential Catalyst: Delay in rate hike expectations; better-than-expected
rental reversion
Where we differ: Lower cost of capital assumptions than consensus
Analyst Singapore Research Team [email protected] Derek TAN +65 6682 3716 [email protected]
Price Relative
Forecasts and Valuation FY Sep (S$m) 2015A 2016A 2017F 2018F
Gross Revenue 189 184 186 204 Net Property Inc 131 130 132 146 Total Return 171 123 95.7 107 Distribution Inc 106 108 109 112 EPU (S cts) 11.7 10.3 10.4 11.6 EPU Gth (%) 4 (12) 0 12 DPU (S cts) 11.6 11.8 11.8 12.1 DPU Gth (%) 4 1 0 3 NAV per shr (S cts) 191 193 191 191 PE (X) 16.5 18.7 18.6 16.7 Distribution Yield (%) 6.0 6.1 6.1 6.3 P/NAV (x) 1.0 1.0 1.0 1.0 Aggregate Leverage (%) 28.2 28.3 30.5 30.6 ROAE (%) 6.2 5.4 5.4 6.1 Distn. Inc Chng (%): 0 0 Consensus DPU (S cts): 12.0 12.2 Other Broker Recs: B: 13 S: 1 H: 3
Source of all data on this page: Company, DBS Bank, Bloomberg Finance L.P.
Fruits from Floating Rates Ability to maintain stable DPUs. While many other S-REITs are expected to face declining DPUs over the next couple of years due to the slowing Singapore economy, Frasers Centrepoint Trust (FCT) offers investors a steady DPU profile. This is made possible by FCT’s conservative strategy of paying the majority of its management fees in cash, which enables FCT to temporarily increase payment of fees in units to sustain DPU. Near-monopoly of shopping malls in the north. Northpoint and Causeway Point together contribute c.70% of FCT’s Net Property Income (NPI). While it is still 15 months away until Northpoint completes its asset enhancement initiative (AEI), we believe strong rental reversion at Causeway Point will support earnings and cushion any pressures from any decline in occupancy rates. Significant reduction in cost of debt. The Manager has proactively reduced the percentage of borrowings hedged into fixed rates to 59% from 74%, to benefit from their view that interest rates may stay low for an extended period. As such, we have brought down our cost of debt assumptions to account lower interest expense in the near term. Valuation:
DCF-based TP of S$2.29. The stock offers a forward yield over
6.0%. Maintain BUY.
Key Risks to Our View:
Lease renewal in FY17. We estimate that 39.6% of total gross
rent will be due for renewal in FY17. Reversion rate at
Northpoint will test tenant’s confidence in the mall after AEI,
whereas tactical lease management at Changi City Point and
Bedok Point will help in the repositioning of the two malls.
Interest rate risks. If expectations of rate hikes increase, the
41% exposure to floating interest rate will amplify the increase
in the REIT’s cost of debt, putting pressure on valuation. At A Glance Issued Capital (m shrs) 920
Mkt. Cap (S$m/US$m) 1,775 / 1,224
Major Shareholders (%)
Frasers Centrepoint Ltd 41.5
Schroders Plc 5.6
Free Float (%) 52.9
3m Avg. Daily Val (US$m) 1.7
ICB Industry : Real Estate / Real Estate Investment Trust
DBS Group Research . Equity
4 Jan 2017
Singapore Company Guide
Frasers Centrepoint Trust Version 6 | Bloomberg: FCT SP | Reuters: FCRT.SI Refer to important disclosures at the end of this report
81
101
121
141
161
181
201
221
1.5
1.7
1.9
2.1
2.3
2.5
Jan-13 Jan-14 Jan-15 Jan-16 Jan-17
Relative IndexS$
Frasers Centrepoint Trust (LHS) Relative STI (RHS)
Page 199

ASIAN INSIGHTS VICKERS SECURITIES
Page 2
Company Guide
Frasers Centrepoint Trust
CRITICAL DATA POINTS TO WATCH
Earnings Drivers:
Strong rental reversion at Causeway Point. FCT’s largest asset
(50% of top line) has achieved an average rental reversion of
9.6% in FY16, thanks to its low occupancy cost relative to its
near-monopolistic position in Woodlands, one of Singapore’s
most populous residential estates. FCT has a short Weight
Average Lease Renewal (WALE) of 1.38/1.36 years by NLA/Gross
Rent as 39.6% of the portfolio’s NLA will be due for renewal in
FY17, out of which, 161,501sqft comes from Causeway Point.
We believe the strong reversion trend at this mall is likely to
continue and should cushion any pressures from declining
portfolio occupancy rates and may even bring more earnings
surprise on the upside in the next 12-18 months.
Northpoint AEI is the turnkey to accelerate growth. We remain
excited about the planned AEI and integration of the Northpoint
asset with the extension wing currently being built by the
Sponsor. With an enlarged footprint, we see Northpoint as a
key driver in accelerating growth in the medium term. We are
positive on the AEI given that (i) the northern region has the
lowest retail space density in Singapore; (ii) the fast population
growth in the North region should support retail spending in
the medium term; and (iii) relatively low occupancy costs in the
15-17% range. FCT is in a strong negotiating position with
tenants who want a presence in the north where the group has
close to 75% market share of retail malls (For detailed analysis
on Northpoint’s AEI, please refer to the Company Focus Report:
Igniting the northern start, published on 7 Mar 2016).
Acquisition growth potential from Sponsor’s pipeline. FCT is
able to purchase retail assets from its Sponsor, Frasers
Centrepoint Limited (FCL). We believe a potential target is
Waterway Point, in which the Sponsor has a 33% stake, which
was completed in Jan 2016 and well received by shoppers and
tenants. Given a one- or two-year stabilisation period, a realistic
timeline for this acquisition would be in 2017-18. An acquisition
value of S$300-400m (given estimated development costs of
S$1bn) would allow FCT to grow its portfolio considerably. We
have not included this into our model.
Net Property Income and Margins (%)
Net Property Income and Margins (%)
Distribution Paid / Net Operating CF
Interest Cover (x)
Source: Company, DBS Bank
65.8%
67.8%
69.8%
71.8%
73.8%
75.8%
77.8%
0
20
40
60
80
100
120
140
160
180
200
2014A 2015A 2016A 2017F 2018F
S$ m
Net Property Income Net Property Income Margin %
64%
65%
66%
67%
68%
69%
70%
71%
72%
73%
28
29
30
31
32
33
34
35
3Q20
14
4Q20
14
1Q20
15
2Q20
15
3Q20
15
4Q20
15
1Q20
16
2Q20
16
3Q20
16
4Q20
16
Net Property Income Net Property Income Margin %
0.4
0.5
0.6
0.7
0.8
0.9
1.0
2014A 2015A 2016A 2017F 2018F
(x)
5.00
5.20
5.40
5.60
5.80
6.00
6.20
6.40
6.60
6.80
2014A 2015A 2016A 2017F 2018F
(x)
Page 200

ASIAN INSIGHTS VICKERS SECURITIES
Page 3
Company Guide
Frasers Centrepoint Trust
Balance Sheet:
Healthy balance sheet. Gearing to remain <30%, one of the
lowest in the S-REIT universe, and well within the Manager’s
comfortable level of 35%.
Increased floating rates exposure. Percentage of borrowings on
fixed rates has been reduced to 59% from 74% in 3QFY16.
This enables the REIT to benefit from lower cost of debt due to
lower expectations of rate hikes for now. Its average cost of
borrowings of 2.1% is among the lowest in S-REITs.
Share Price Drivers:
Keep an eye on the risk-free rate. As a yield play, FCT’s share
price is sensitive to fluctuations in the risk-free rate. Anticipated
hikes in the US Fed Funds rate have a negative impact on the
stock. Correspondingly, any delay in rate hikes would be a
positive catalyst for share price performance.
Key Risks:
Near-term fall in NPI margin. As Northpoint’s average
occupancy drops to 76% during its AEI period (Mar 2016-Sep
2017), some narrowing in the portfolio NPI margin is expected.
While we have priced in a temporary decline in occupancy at
Northpoint and generally weaker occupancy rates at other
malls in the next 2 years, any unexpected sharp decline in
occupancy and/or rents may drag down NPI margin and the
share price.
Interest rate risks. If expectations of rate hikes increase, the
41% exposure to floating interest rates will amplify the
increase in the REIT’s cost of debt, putting pressure on
valuation.
Company Background
Frasers Centrepoint Trust (FCT) is a retail real estate investment
trust with a portfolio of shopping malls located in suburban
areas in Singapore. Its two largest assets are Causeway Point
and Northpoint.
Aggregate Leverage (%)
ROE (%)
Distribution Yield (%)
PB Band (x)
Source: Company, DBS Bank
10.0%
15.0%
20.0%
25.0%
30.0%
2014A 2015A 2016A 2017F 2018F
0.0%
1.0%
2.0%
3.0%
4.0%
5.0%
6.0%
2014A 2015A 2016A 2017F 2018F
Avg: 5.8%
+1sd: 6.2%
+2sd: 6.6%
-1sd: 5.4%
-2sd: 5%
4.0
4.5
5.0
5.5
6.0
6.5
7.0
2013 2014 2015 2016 2017
(%)
Avg: 1.06x
+1sd: 1.15x
+2sd: 1.24x
-1sd: 0.98x
-2sd: 0.89x
0.7
0.8
0.9
1.0
1.1
1.2
1.3
1.4
1.5
1.6
Jan-13 Jan-14 Jan-15 Jan-16 Jan-17
(x)
Page 201
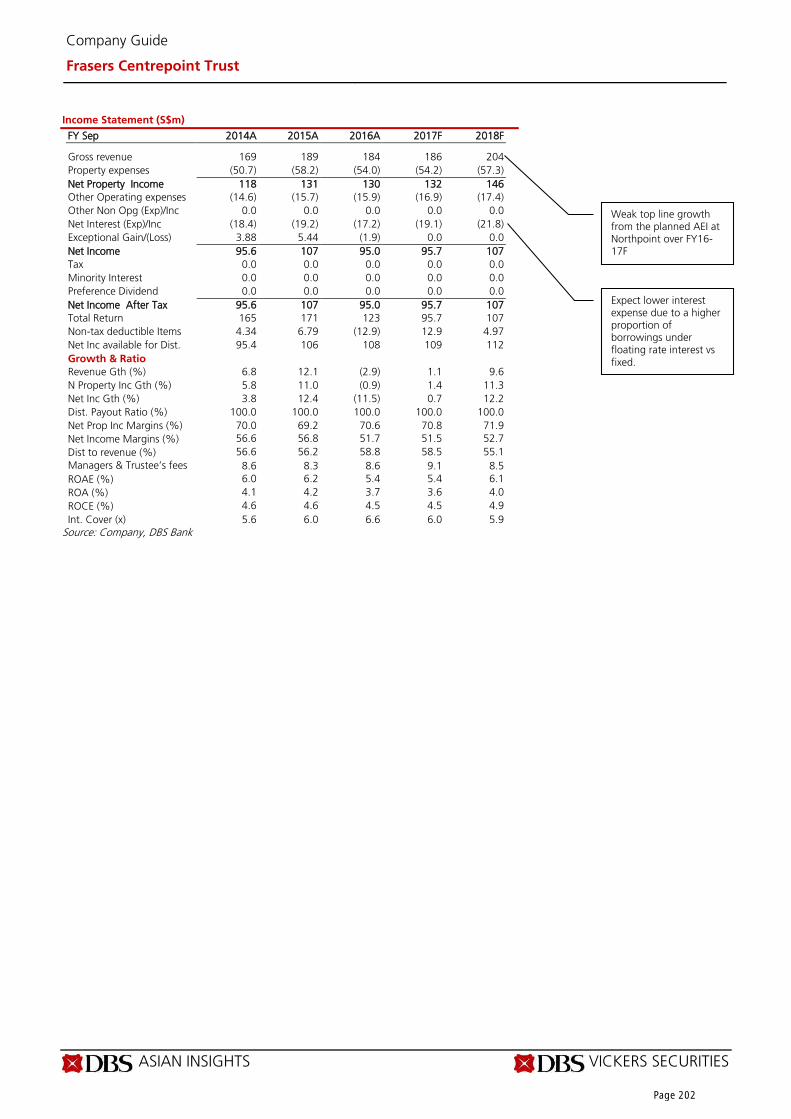
ASIAN INSIGHTS VICKERS SECURITIES
Page 4
Company Guide
Frasers Centrepoint Trust
Income Statement (S$m)
FY Sep 2014A 2015A 2016A 2017F 2018F
Gross revenue 169 189 184 186 204
Property expenses (50.7) (58.2) (54.0) (54.2) (57.3)
Net Property Income 118 131 130 132 146
Other Operating expenses (14.6) (15.7) (15.9) (16.9) (17.4)
Other Non Opg (Exp)/Inc 0.0 0.0 0.0 0.0 0.0
Net Interest (Exp)/Inc (18.4) (19.2) (17.2) (19.1) (21.8)
Exceptional Gain/(Loss) 3.88 5.44 (1.9) 0.0 0.0
Net Income 95.6 107 95.0 95.7 107
Tax 0.0 0.0 0.0 0.0 0.0
Minority Interest 0.0 0.0 0.0 0.0 0.0
Preference Dividend 0.0 0.0 0.0 0.0 0.0
Net Income After Tax 95.6 107 95.0 95.7 107
Total Return 165 171 123 95.7 107
Non-tax deductible Items 4.34 6.79 (12.9) 12.9 4.97
Net Inc available for Dist. 95.4 106 108 109 112
Growth & Ratio
Revenue Gth (%) 6.8 12.1 (2.9) 1.1 9.6
N Property Inc Gth (%) 5.8 11.0 (0.9) 1.4 11.3
Net Inc Gth (%) 3.8 12.4 (11.5) 0.7 12.2
Dist. Payout Ratio (%) 100.0 100.0 100.0 100.0 100.0
Net Prop Inc Margins (%) 70.0 69.2 70.6 70.8 71.9
Net Income Margins (%) 56.6 56.8 51.7 51.5 52.7
Dist to revenue (%) 56.6 56.2 58.8 58.5 55.1
Managers & Trustee’s fees to sales %)
8.6 8.3 8.6 9.1 8.5
ROAE (%) 6.0 6.2 5.4 5.4 6.1
ROA (%) 4.1 4.2 3.7 3.6 4.0
ROCE (%) 4.6 4.6 4.5 4.5 4.9
Int. Cover (x) 5.6 6.0 6.6 6.0 5.9
Source: Company, DBS Bank
Weak top line growth from the planned AEI at Northpoint over FY16- 17F
Expect lower interest expense due to a higher proportion of borrowings under floating rate interest vs fixed.
Page 202

ASIAN INSIGHTS VICKERS SECURITIES
Page 5
Company Guide
Frasers Centrepoint Trust
Quarterly / Interim Income Statement (S$m)
FY Sep 4Q2015 1Q2016 2Q2016 3Q2016 4Q2016
Gross revenue 47.5 47.1 47.1 45.0 44.6
Property expenses (15.8) (13.5) (13.4) (13.9) (13.2)
Net Property Income 31.7 33.5 33.7 31.2 31.5
Other Operating expenses (3.9) (4.0) (4.0) (4.0) (3.9)
Other Non Opg (Exp)/Inc 0.0 0.0 0.0 0.0 0.0
Net Interest (Exp)/Inc (4.4) (4.4) (4.4) (4.3) (4.1)
Exceptional Gain/(Loss) 1.07 0.15 (5.4) (0.4) (0.3)
Net Income 25.8 26.4 21.1 23.5 24.0
Tax 0.0 0.0 0.0 0.0 0.0
Minority Interest 0.0 0.0 0.0 0.0 0.0
Net Income after Tax 25.8 26.4 21.1 23.5 24.0
Total Return 25.2 26.8 29.2 25.6 89.8
Non-tax deductible Items (64.1) 1.29 7.88 2.27 (26.8)
Net Inc available for Dist. 25.7 27.7 29.0 25.8 25.6
Growth & Ratio
Revenue Gth (%) 1 (1) 0 (4) (1)
N Property Inc Gth (%) (4) 6 0 (7) 1
Net Inc Gth (%) 1 2 (20) 12 2
Net Prop Inc Margin (%) 66.8 71.3 71.5 69.3 70.5
Dist. Payout Ratio (%) 101.9 95.0 96.3 108.3 101.1
Balance Sheet (S$m)
FY Sep 2014A 2015A 2016A 2017F 2018F Investment Properties 2,400 2,464 2,509 2,591 2,595
Other LT Assets 74.7 63.2 60.0 60.0 60.0
Cash & ST Invts 47.1 21.6 18.7 17.4 19.4
Inventory 0.0 0.0 0.0 0.0 0.0
Debtors 0.0 0.0 6.80 6.80 6.80
Other Current Assets 0.0 0.0 0.0 0.0 0.0
Total Assets 2,522 2,549 2,594 2,675 2,681
ST Debt
95.0 278 218 218 218
Creditor 39.9 31.8 40.0 40.7 44.6
Other Current Liab 18.3 17.9 20.8 20.8 20.8
LT Debt 644 440 516 598 602
Other LT Liabilities 25.9 26.5 24.0 24.0 24.0
Unit holders’ funds 1,699 1,755 1,776 1,774 1,772
Minority Interests 0.0 0.0 0.0 0.0 0.0
Total Funds & Liabilities 2,522 2,549 2,594 2,675 2,681
Non-Cash Wkg. Capital (58.2) (49.7) (54.0) (54.7) (58.7)
Net Cash/(Debt) (692) (696) (715) (799) (800)
Ratio
Current Ratio (x) 0.3 0.1 0.1 0.1 0.1
Quick Ratio (x) 0.3 0.1 0.1 0.1 0.1
Aggregate Leverage (%) 29.3 28.2 28.3 30.5 30.6
Z-Score (X) 1.4 1.5 1.4 1.3 1.3
Source: Company, DBS Bank
Payout ratios in 2HFY16 were greater than 100% thanks to cash conservation from the previous two quarters.
Page 203

ASIAN INSIGHTS VICKERS SECURITIES
Page 6
Company Guide
Frasers Centrepoint Trust
Cash Flow Statement (S$m)
FY Sep 2014A 2015A 2016A 2017F 2018F
Pre-Tax Income 95.6 107 95.0 95.7 107
Dep. & Amort. 0.0 0.0 (0.5) 0.0 0.0
Tax Paid 0.0 0.0 0.0 0.0 0.0
Associates &JV Inc/(Loss) (6.6) (5.8) (0.1) (0.1) (0.1)
Chg in Wkg.Cap. (6.4) 2.25 4.33 0.73 3.92
Other Operating CF 17.6 16.1 5.89 10.9 2.97
Net Operating CF 100 120 105 107 114
Net Invt in Properties (299) (5.4) (22.6) (82.0) (3.7)
Other Invts (net) 0.0 0.0 0.0 0.0 0.0
Invts in Assoc. & JV 0.0 0.0 0.0 0.0 0.0
Div from Assoc. & JVs 4.58 4.60 0.12 0.12 0.12
Other Investing CF (1.5) 0.18 0.0 0.0 0.0
Net Investing CF (296) (0.6) (22.5) (81.9) (3.5)
Distribution Paid (94.5) (106) (108) (109) (112)
Chg in Gross Debt 150 (21.0) 22.6 82.0 3.66
New units issued 162 0.0 0.0 0.0 0.0
Other Financing CF (19.6) (18.2) 0.0 0.0 0.0
Net Financing CF 197 (145) (85.5) (26.7) (109)
Currency Adjustments 0.0 0.0 0.0 0.0 0.0
Chg in Cash 2.03 (25.5) (3.3) (1.3) 1.92
Operating CFPS (S cts) 12.6 12.8 10.9 11.5 11.9
Free CFPS (S cts) (23.4) 12.5 8.93 2.74 11.9
Source: Company, DBS Bank
Target Price & Ratings History
Source: DBS Bank
Analyst: Singapore Research Team
Derek TAN
S.No.Date of
Report
Closing
Price
12-mth
Target
Price
Rat ing
1: 08 Jan 16 1.83 2.04 BUY
2: 04 Feb 16 1.90 2.04 BUY
3: 07 Mar 16 1.93 2.11 BUY
4: 05 Apr 16 2.01 2.11 BUY
5: 25 Apr 16 2.00 2.10 BUY
6: 16 Jul 16 2.12 2.29 BUY
7: 18 Jul 16 2.17 2.29 BUY
8: 24 Oct 16 2.10 2.29 BUY
9: 07 Nov 16 2.03 2.29 BUY
Note : Share price and Target price are adjusted for corporate actions.
1
2
3
4
5
67 8
9
1.73
1.83
1.93
2.03
2.13
2.23
2.33
Jan-16 May-16 Sep-16 Jan-17
S$
Page 204

ASIAN INSIGHTS VICKERS SECURITIES ed: TH / sa: YM, PY
BUY Last Traded Price ( 4 Jan 2017): S$0.94 (STI : 2,921.31) Price Target 12-mth: S$1.10 (17% upside and 7.0% yield) Potential Catalyst: Acquisitions Where we differ: Estimates are more conservative than consensus Analyst Derek TAN +65 6682 3716 [email protected] Mervin SONG CFA +65 6682 3715 [email protected]
Price Relative
Forecasts and Valuation FY Sep (A$m) 2016A 2017F 2018F 2019F Gross Revenue 43.1 162 162 162 Net Property Inc 35.7 137 136 135 Total Return 3.87 83.3 86.5 90.2 Distribution Inc 26.4 95.0 98.3 102 EPU (S cts) 0.53 6.07 6.26 6.47 EPU Gth (%) nm nm 3 3 DPU (S cts) 1.85 6.61 6.79 7.0 DPU Gth (%) nm 258 3 3 NAV per shr (S cts) 87.0 87.0 87.0 87.0 PE (X) *15.8 15.5 15.0 14.5 Distribution Yield (%) *6.7 7.0 7.1 7.3 P/NAV (x) 1.0 1.0 1.0 1.1 Aggregate Leverage (%) 29.3 30.6 30.8 30.9 ROAE (%) 0.6 6.7 6.9 7.2 Distn. Inc Chng (%): 0 0 0 Consensus DPU (S cts): 6.91 6.70 7.02 Other Broker Recs: B: 4 S: 0 H: 1
*annualised
Source of all data on this page: Company, DBS Bank, Bloomberg Finance L.P.
Positioned to grow
Maintain BUY, TP S$1.10. We believe that Frasers Logistics & Industrial Trust (FLT) offers good returns with a prospective yield of close to 7.0% which is attractive in the current low-yield environment. With an under-geared balance sheet, FLT is poised to grow through acquisitions from a visible pipeline of development and completed properties from their sponsor. Maintain BUY and TP at S$1.10. In addition, upside to earnings will come potentially from the rollover of forex hedges (currently A$1 to S$1) to current spot rates which are 6% higher. Maiden distribution exceeds forecasts. FLT’s maiden distribution (DPU ) of 1.84 Scts exceeds IPO forecasts by close to 2.8%. This was mainly due to lower-than-projected interest costs at 2.8% vs 3.4% (forecasted during IPO). Revenue and net property income of A$43.1m and A$32.7m were marginally ahead of IPO forecasts at +0.8% and 0.02% respectively. Portfolio occupancy increased marginally to 99.2%. The forward outlook remains stable given limited expiries over the coming year. Visible ROFR pipeline. The Sponsor has granted FLT a right of first refusal (ROFR) over any of the completed income-producing industrial properties it intends to divest. This currently comprises 11 properties which can be acquired in the medium term. Valuation:
BUY maintained, TP S$1.10. Our TP is based on DCF and we have not assumed any further acquisitions. Our TP offers 15% upside to current price. Key Risks to Our View:
Currency risk. As the manager pays its distributions in SGD but earns in AUD, the REIT is exposed to currency fluctuations. The manager attempts to reduce foreign fluctuations by hedging distributions regularly. At A Glance Issued Capital (m shrs) 1,427 Mkt. Cap (S$m/US$m) 1,342 / 925 Major Shareholders (%) FCL Investments (Industrial) Pte 20.5 TCC Group Investments Limited 6.3 Principal Financial Group 5.0
Free Float (%) 68.2 3m Avg. Daily Val (US$m) 2.7 ICB Industry : Financials / Real Estate Investment Trusts
DBS Group Research . Equity 4 Jan 2017
Singapore Company Guide
Frasers Logistics & Industrial Trust Version 1 | Bloomberg: FLT SP | Reuters: FRAE.SI Refer to important disclosures at the end of this report
87
107
127
147
167
187
207
0.8
0.9
0.9
1.0
1.0
1.1
1.1
Jun-16 Sep-16 Dec-16
Relative IndexS$
Frasers Logistics & Industrial Trust (LHS) Relative STI (RHS)
Page 205

ASIAN INSIGHTS VICKERS SECURITIES Page 2
Company Guide
Frasers Logistics & Industrial Trust
CRITICAL DATA POINTS TO WATCH
Earnings Drivers:
Unique pure-play Australia play. Frasers Logistics & Industrial Trust (FLT) offers investors the unique opportunity to invest in a portfolio of 53 assets (as at end of September 2016) that are concentrated within major industrial markets in Australia, including Melbourne, Sydney and Brisbane. Apart from a geographically diversified portfolio, the REIT’s tenants are mainly in the consumer and logistics sectors which are expected to remain resilient and continue growing as Australia’s economy transitions itself from being resource-led to consumption-led. Long WALE of 6.6 years with in-built organic growth a key trait in current uncertain environment. In our view, the long WALE by Adjusted Gross Rental Income of 6.6 years, which is longer than the majority of Singapore industrial REITs (between 2.9 and 4.7 years), provides strong cashflow visibility. In addition, FLT’s organic growth is underpinned by in-built rental escalations. All of the leases of the initial portfolio have fixed and/or Consumer Price Index-linked (CPI-linked) increments. The fixed rental increments, which are built into the existing leases, range from 2.5-3.75% which translates to an average annual rental increment of c.3.2% for the Initial Portfolio. Predominantly freehold and long leasehold land tenure is a positive. FLT’s portfolio predominantly comprises properties on freehold (60.0% by appraised value) and long leasehold land (30.2% on leasehold land with a tenure of more than 80 years). FLT’s weighted land lease expiry of c.82 years is double that of other industrial S-REITs' average of 41 years. Based on our estimates, the component of capital return based on the remaining leasehold tenure on FLT’s annual distribution yield (at c.0.5%) is much smaller than the average of 2-3% for most industrial S-REITs. Strong Sponsor with long track record of development and management of Australian Industrial assets. FLT's subsidiary Frasers Property Australia Pty Limited (FPA) offers FLT access to a strong and fully integrated real estate platform. In particular, FPA’s industrial business has an end-to-end capability and leadership in the development of industrial assets, having developed over A$3.5bn worth of industrial assets since 2001. The Sponsor has granted FLT a right of first refusal (ROFR) over any of the completed income-producing industrial properties it intends to divest. This currently comprises eleven existing properties in Australia.
Net Property Income and Margins (%)
Net Property Income and Margins (%)
Distribution Paid / Net Operating CF
Interest Cover (x)
Source: Company, DBS Bank
78.7%
80.7%
82.7%
84.7%
86.7%
88.7%
90.7%
92.7%
0
20
40
60
80
100
120
140
160
180
200
2016A 2017F 2018F 2019F
A$ m
Net Property Income Net Property Income Margin %
0%
10%
20%
30%
40%
50%
60%
70%
80%
90%
34
34
35
35
36
36
37
37
3Q20
14
4Q20
14
1Q20
15
2Q20
15
3Q20
15
4Q20
15
1Q20
16
2Q20
16
3Q20
16
4Q20
16
Net Property Income Net Property Income Margin %
0.3
0.4
0.5
0.6
0.7
0.8
0.9
1.0
1.1
2016A 2017F 2018F 2019F
(x)
5.60
5.80
6.00
6.20
6.40
6.60
6.80
7.00
2016A 2017F 2018F 2019F
(x)
Page 206

ASIAN INSIGHTS VICKERS SECURITIES Page 3
Company Guide
Frasers Logistics & Industrial Trust
Balance Sheet:
Balance sheet; gearing up for acquisitions. Gearing is projected to remain fairly stable at c.31% in the medium term. The low gearing level allows significant headroom for the manager to execute on opportunistic acquisitions when the time arises. The manager has a medium-term target gearing level of c.35-40%, implying there is headroom to gear up. Healthy financial metrics. The REIT has minimal debt expiries till FY19 with a weighted average cost of borrowing of 2.8%. Interest coverage ratio remains healthy at >7.0%. Close to 84% of the debt is hedged, implying minimal volatility to distributions in the event of an interest rate hike. Share Price Drivers:
Executing on acquisitions. FLT is looking to complete the planned acquisition of Martin Brower property in the coming quarter which will bring gearing up to the c.30-31% level. Despite this, we believe that the portfolio remains under-geared in relation to peers and optimal level. With opportunities abound in the market, we believe that the execution of more acquisitions which is projected to be accretive to earnings, will be a catalyst for its stock price. Key Risks:
Single-country concentration. While FLT provides exposure to the Australian industrial market, as a pure-play REIT, its portfolio is 100% concentrated in Australia. However, this risk is mitigated by the fact that its portfolio is diversified across five states in Australia and various industries. The geographic and tenant diversity across various industries imply that the REIT is not dependent and over-reliant on the performance of any particular industry. Company Background
Frasers Logistics & Industrial Trust (FLT) offers investors a unique opportunity to invest in a quality portfolio of industrial assets in Australia. FLT’s initial portfolio consists of 51 properties spread across five states in Australia with an appraised value of A$1,584.6m. The initial portfolio is well diversified across the key states of Victoria (40% of appraised value), New South Wales (28%) and Queensland (28%).
Aggregate Leverage (%)
ROE (%)
Distribution Yield (%) PB Band (x)
Source: Company, DBS Bank
10.0%
15.0%
20.0%
25.0%
30.0%
2016A 2017F 2018F 2019F
0.0%
1.0%
2.0%
3.0%
4.0%
5.0%
6.0%
7.0%
2016A 2017F 2018F 2019F
Avg: 15.9x
+1sd: 17.5x
+2sd: 19.1x
-1sd: 14.2x
-2sd: 12.6x
11.3
12.3
13.3
14.3
15.3
16.3
17.3
18.3
19.3
20.3
21
-Ju
n-
20
16
23
-Ju
l-2
01
6
24
-A
ug
-2
01
6
25
-S
ep
-2
01
6
27
-O
ct-
20
16
(x)
Page 207

ASIAN INSIGHTS VICKERS SECURITIES Page 4
Company Guide
Frasers Logistics & Industrial Trust
Income Statement (A$m)
FY Sep 2016A 2017F 2018F 2019F Gross revenue 43.1 162 162 162 Property expenses (7.4) (24.9) (25.7) (26.5) Net Property Income 35.7 137 136 135 Other Operating expenses (12.8) (14.0) (14.2) (14.2) Other Non Opg (Exp)/Inc (5.7) 0.0 0.0 0.0 Net Interest (Exp)/Inc (3.8) (18.1) (18.3) (18.3) Exceptional Gain/(Loss) 0.0 (12.5) (7.7) (2.8) Net Income 13.4 92.5 96.2 100 Tax (6.1) (9.3) (9.6) (10.0) Minority Interest 0.0 0.0 0.0 0.0 Preference Dividend 0.0 0.0 0.0 0.0 Net Income After Tax 7.24 83.3 86.5 90.2 Total Return 3.87 83.3 86.5 90.2 Non-tax deductible Items 22.5 11.7 11.8 11.8 Net Inc available for Dist. 26.4 95.0 98.3 102 Growth & Ratio Revenue Gth (%) N/A 276.3 0.0 0.0 N Property Inc Gth (%) nm 284.2 (0.6) (0.6) Net Inc Gth (%) nm 1,049.9 3.9 4.2 Dist. Payout Ratio (%) 100.0 100.0 100.0 100.0 Net Prop Inc Margins (%) 82.9 84.6 84.1 83.6 Net Income Margins (%) 16.8 51.4 53.4 55.7 Dist to revenue (%) 61.3 58.6 60.7 62.9 Managers & Trustee’s fees 29.7 8.7 8.7 8.7 ROAE (%) 0.6 6.7 6.9 7.2 ROA (%) 0.4 4.7 4.8 5.0 ROCE (%) 0.7 6.3 6.1 6.1 Int. Cover (x) 6.0 6.8 6.7 6.6
Source: Company, DBS Bank
Driven mainly by annual rental escalations coupled with acquisitions
Interest cost locked in
Page 208

ASIAN INSIGHTS VICKERS SECURITIES Page 5
Company Guide
Frasers Logistics & Industrial Trust
Quarterly / Interim Income Statement (A$m)
FY Sep 4Q2016 Gross revenue 43.1 Property expenses (7.4) Net Property Income 35.7 Other Operating expenses (12.8) Other Non Opg (Exp)/Inc (5.7) Net Interest (Exp)/Inc (3.8) Exceptional Gain/(Loss) 0.0 Net Income 13.4 Tax (6.1) Minority Interest 0.0 Net Income after Tax 7.24 Total Return 3.87 Non-tax deductible Items 22.5 Net Inc available for Dist. 26.4 Growth & Ratio Revenue Gth (%) N/A N Property Inc Gth (%) nm Net Inc Gth (%) nm Net Prop Inc Margin (%) 82.9 Dist. Payout Ratio (%) 100.0
Balance Sheet (A$m)
FY Sep 2016A 2017F 2018F 2019F Investment Properties 1,678 1,753 1,757 1,761 Other LT Assets 0.0 0.0 0.0 0.0 Cash & ST Invts 85.8 50.6 51.0 51.4 Inventory 0.0 0.0 0.0 0.0 Debtors 4.96 8.10 8.10 8.10 Other Current Assets 0.0 0.0 0.0 0.0 Total Assets 1,768 1,811 1,816 1,820 ST Debt 0.0 0.0 0.0 0.0 Creditor 2.24 8.10 8.10 8.10 Other Current Liab 17.2 9.25 9.62 10.0 LT Debt 492 537 541 545 Other LT Liabilities 8.21 8.21 8.21 8.21 Unit holders’ funds 1,249 1,249 1,249 1,249 Minority Interests 0.0 0.0 0.0 0.0 Total Funds & Liabilities 1,768 1,811 1,816 1,820 Non-Cash Wkg. Capital (14.5) (9.3) (9.6) (10.0) Net Cash/(Debt) (406) (486) (490) (493) Ratio Current Ratio (x) 4.7 3.4 3.3 3.3 Quick Ratio (x) 4.7 3.4 3.3 3.3 Aggregate Leverage (%) 29.3 30.6 30.8 30.9
Source: Company, DBS Bank
Gearing to remain stable
Maiden distributions
Page 209

ASIAN INSIGHTS VICKERS SECURITIES Page 6
Company Guide
Frasers Logistics & Industrial Trust
Cash Flow Statement (A$m)
FY Sep 2016A 2017F 2018F 2019F Pre-Tax Income 13.4 92.5 96.2 100 Dep. & Amort. 0.0 0.0 0.0 0.0 Tax Paid 0.0 (17.2) (9.3) (9.6) Associates &JV Inc/(Loss) 0.0 0.0 0.0 0.0 Chg in Wkg.Cap. 12.1 2.72 0.0 0.0 Other Operating CF 6.69 11.7 11.8 11.8 Net Operating CF 32.1 89.8 98.7 102 Net Invt in Properties (1,365) (75.0) (4.0) (4.0) Other Invts (net) 0.0 0.0 0.0 0.0 Invts in Assoc. & JV 0.0 0.0 0.0 0.0 Div from Assoc. & JVs 0.0 0.0 0.0 0.0 Other Investing CF (29.6) 0.0 0.0 0.0 Net Investing CF (1,394) (75.0) (4.0) (4.0) Distribution Paid (26.4) (95.0) (98.3) (102) Chg in Gross Debt 491 45.0 4.00 4.00 New units issued 982 0.0 0.0 0.0 Other Financing CF (9.0) 0.0 0.0 0.0 Net Financing CF 1,438 (50.0) (94.3) (97.9) Currency Adjustments 0.0 0.0 0.0 0.0 Chg in Cash 75.8 (35.2) 0.36 0.40 Operating CFPS (S cts) 1.47 6.35 7.14 7.34 Free CFPS (S cts) (97.6) 1.08 6.85 7.05
Source: Company, DBS Bank
Target Price & Ratings History
Source: DBS Bank
Analyst: Derek TAN
Mervin SONG CFA
S.No. DateClosing
PriceTarget Price
Rat ing
1 29 Jul 16 0.99 1.10 BUY
Note: Share price and Target price are adjusted for corporate actions.
0.80
0.85
0.90
0.95
1.00
1.05
Jun-16 Jul-16 Aug-16 Sep-16 Oct-16
S$
Assumed acquisition of Martin Brower property
Page 210

ASIAN INSIGHTS VICKERS SECURITIES ed: TH / sa: AS, PY
HOLD Last Traded Price ( 4 Jan 2017): S$0.72 (STI : 2,921.31)
Price Target 12-mth: S$0.75 (4% upside and 8.9% yield)
Potential Catalyst: Acquisitions/increase in Germany’s CPI
Where we differ: In line with consensus
Analyst Mervin SONG CFA +65 6682 3715 [email protected] Derek TAN +65 6682 3716 [email protected]
Price Relative
Forecasts and Valuation FY Dec (EURm) 2015A 2016F 2017F 2018F
Gross Revenue 26.9 33.1 33.4 33.7 Net Property Inc 24.0 30.3 30.6 30.9 Total Return 11.8 23.4 22.6 23.9 Distribution Inc 20.8 25.4 25.6 25.9 EPU (S cts) 3.03 5.77 5.49 5.78 EPU Gth (%) nm 90 (5) 5 DPU (S cts) 5.24 6.32 6.41 6.34 DPU Gth (%) 155 21 1 (1) NAV per shr (S cts) 61.8 63.4 62.7 62.2 PE (X) 23.8 12.5 13.1 12.5 Distribution Yield (%) 7.3 8.8 8.9 8.8 P/NAV (x) 1.2 1.1 1.1 1.2 Aggregate Leverage (%) 42.3 42.0 42.2 42.4 ROAE (%) 5.2 9.2 8.8 9.3 Distn. Inc Chng (%): 0 0 0 Consensus DPU (S cts): 6.34 6.34 - Other Broker Recs: B: 1 S: 0 H: 1
Source of all data on this page: Company, DBS Bank, Bloomberg Finance L.P.
Waiting for new sponsor’s direction
Uncertainty over IREIT’s new sponsor. We maintain our HOLD
recommendation on IREIT Global (IREIT) and TP of S$0.75. While
IREIT offers an attractive yield in excess of 8%, uncertainty over
the direction of IREIT’s new sponsor Tikehau Capital, a European
investment manager, will likely cap IREIT’s near-term share price
performance. Furthermore, with IREIT’s gearing at c.42%, any
growth plans are likely to entail an equity-raising exercise to
fund the acquisition of new properties in Europe which may be
DPU dilutive in the near term, given IREIT’s already high
distribution yield.
Strong cashflow visibility. With a weighted average lease expiry
(WALE) by gross rental income of 6.2 years, IREIT provides
strong cashflow visibility. The strength of its cashflows is also
underpinned by its blue chip tenants, such as Allianz, Deutsche
Telekom, Deutsche Rentenversicherung Bund and ST
Microelectronics.
Full-year contribution from Berlin acquisition. IREIT's earnings
this year should benefit from the full-year contribution from a
Berlin property which was acquired in mid-2015 and on a
proforma 7.1% NPI yield. We estimate that this will translate to
a 21% uplift in FY16 DPU (SGD basis). Valuation:
We maintain our DCF valuation of S$0.75 to account for the
recent depreciation of the EUR versus SGD, after imputing a
new EURSGD rate of 1.51.
Key Risks to Our View:
The key risk to our view is a significant depreciation of EUR
versus SGD. For every 0.10 change in the EURSGD FX rate, our
DCF valuation changes by 6%. In addition, a weaker-than-
expected inflation rate would also delay any increase in rents. At A Glance
Issued Capital (m shrs) 619
Mkt. Cap (S$m/US$m) 446 / 309
Major Shareholders (%)
Jinquan Tong 55.9
Chap Huat Lim 18.4
Free Float (%) 25.7
3m Avg. Daily Val (US$m) 0.05
ICB Industry : Financials / Real Estate Investment Trusts
DBS Group Research . Equity
4 Jan 2017
Singapore Company Guide
IREIT Global Version 5 | Bloomberg: IREIT SP | Reuters: IREI.SI Refer to important disclosures at the end of this report
Page 211
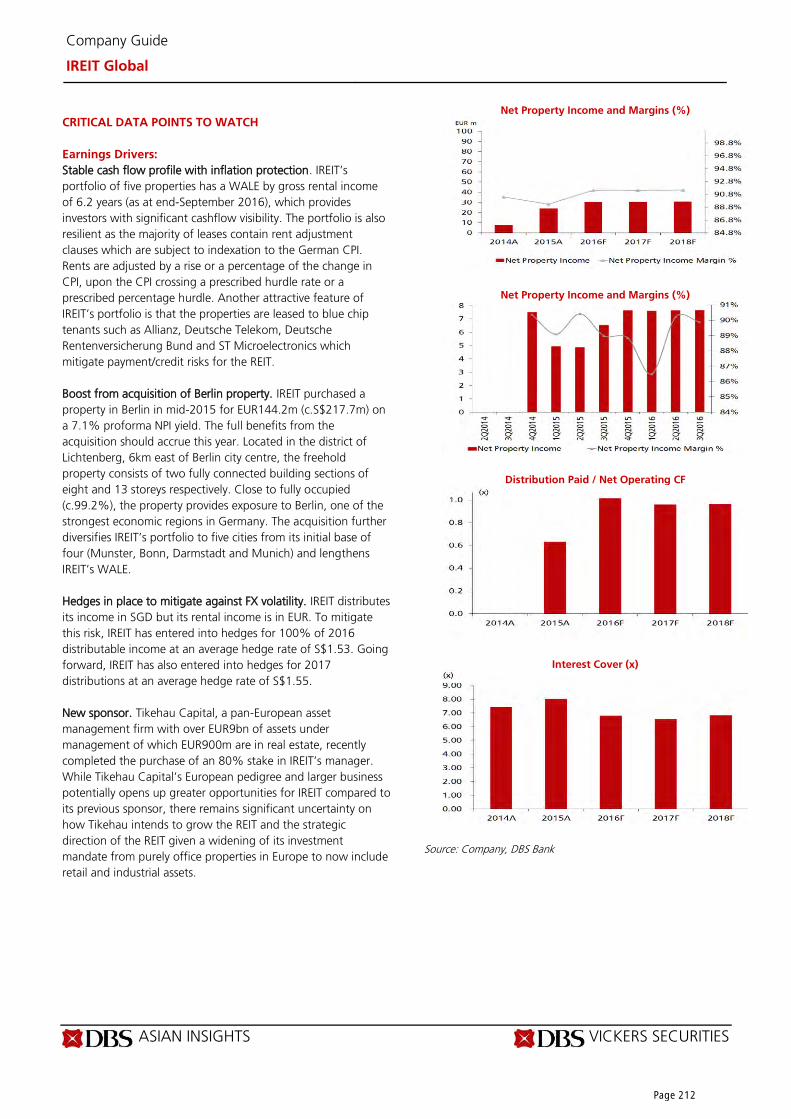
ASIAN INSIGHTS VICKERS SECURITIES
Page 2
Company Guide
IREIT Global
CRITICAL DATA POINTS TO WATCH
Earnings Drivers:
Stable cash flow profile with inflation protection. IREIT’s
portfolio of five properties has a WALE by gross rental income
of 6.2 years (as at end-September 2016), which provides
investors with significant cashflow visibility. The portfolio is also
resilient as the majority of leases contain rent adjustment
clauses which are subject to indexation to the German CPI.
Rents are adjusted by a rise or a percentage of the change in
CPI, upon the CPI crossing a prescribed hurdle rate or a
prescribed percentage hurdle. Another attractive feature of
IREIT’s portfolio is that the properties are leased to blue chip
tenants such as Allianz, Deutsche Telekom, Deutsche
Rentenversicherung Bund and ST Microelectronics which
mitigate payment/credit risks for the REIT.
Boost from acquisition of Berlin property. IREIT purchased a
property in Berlin in mid-2015 for EUR144.2m (c.S$217.7m) on
a 7.1% proforma NPI yield. The full benefits from the
acquisition should accrue this year. Located in the district of
Lichtenberg, 6km east of Berlin city centre, the freehold
property consists of two fully connected building sections of
eight and 13 storeys respectively. Close to fully occupied
(c.99.2%), the property provides exposure to Berlin, one of the
strongest economic regions in Germany. The acquisition further
diversifies IREIT’s portfolio to five cities from its initial base of
four (Munster, Bonn, Darmstadt and Munich) and lengthens
IREIT’s WALE.
Hedges in place to mitigate against FX volatility. IREIT distributes
its income in SGD but its rental income is in EUR. To mitigate
this risk, IREIT has entered into hedges for 100% of 2016
distributable income at an average hedge rate of S$1.53. Going
forward, IREIT has also entered into hedges for 2017
distributions at an average hedge rate of S$1.55.
New sponsor. Tikehau Capital, a pan-European asset
management firm with over EUR9bn of assets under
management of which EUR900m are in real estate, recently
completed the purchase of an 80% stake in IREIT’s manager.
While Tikehau Capital’s European pedigree and larger business
potentially opens up greater opportunities for IREIT compared to
its previous sponsor, there remains significant uncertainty on
how Tikehau intends to grow the REIT and the strategic
direction of the REIT given a widening of its investment
mandate from purely office properties in Europe to now include
retail and industrial assets.
Net Property Income and Margins (%)
Net Property Income and Margins (%)
Distribution Paid / Net Operating CF
Interest Cover (x)
Source: Company, DBS Bank
Page 212

ASIAN INSIGHTS VICKERS SECURITIES
Page 3
Company Guide
IREIT Global
Balance Sheet:
Naturally hedged portfolio. As at end-September 2016, IREIT’s
gearing stood at 42.5%. While its gearing is higher than other
S-REITs, this risk is mitigated by the fact that all of IREIT’s
borrowings are in EUR. In addition, interest rate risk is managed
by having c.88% of its borrowings on fixed interest rates.
Share Price Drivers:
Uncertainty arising from IREIT’s new sponsor. Tikehau Capital, a
European investment manager, recently completed the
acquisition of an 80% stake in IREIT’s manager and announced
plans to broaden IREIT’s investment mandate beyond European
offices to include retail and industrial properties. Given the lack
of details over which asset classes Tikehau Capital plans to focus
on and how it intends to grow the REIT given IREIT’s already
high gearing, we believe IREIT’s share price performance will be
capped in the near term.
Boost to capital values from negative interest rates. As negative
interest rates in Europe incentivise investors to invest in riskier
assets, we believe this will lead to further cap rate compression
of European properties. As a German property REIT, IREIT is well
positioned to capture the expected increase in property values.
Key Risks:
Deflation risk. Should Germany experience another bout of
deflation, this may cause a delay a potential rise in rents in the
future. This would negatively impact projected distributions
going forward.
Interest rates risks. Any increase in interest rates will result in
higher interest payments and reduce the income available for
distribution, which will result in lower distribution per unit
(DPU) for unitholders.
Single-tenant leases. IREIT is reliant on GMG, a wholly owned
subsidiary of Deutsche Telekom for c. 60% of gross rental
income (GRI). Non-performance by GMG will negatively impact
distributions to unitholders.
Changes in tax regime. Any changes in the tax regime could
negatively impact IREIT’s distributions.
Company Background
IREIT is a Singapore REIT established with the investment
strategy of principally investing, directly or indirectly, in a
portfolio of income-producing real estate in Europe which is
used primarily for office purposes.
Aggregate Leverage (%)
ROE (%)
Distribution Yield (%)
PB Band (x)
Source: Company, DBS Bank
Avg: 6.5%
+1sd: 8.3%
-1sd: 4.8%
-2sd: 3%
0.0%
1.0%
2.0%
3.0%
4.0%
5.0%
6.0%
7.0%
8.0%
9.0%
10.0%
Dec-14 Jun-15 Dec-15 Jun-16
Page 213

ASIAN INSIGHTS VICKERS SECURITIES
Page 4
Company Guide
IREIT Global
Income Statement (EURm)
FY Dec 2015A 2016F 2017F 2018F
Gross revenue 26.9 33.1 33.4 33.7
Property expenses (2.9) (2.8) (2.9) (2.9)
Net Property Income 24.0 30.3 30.6 30.9
Other Operating expenses (3.0) (3.3) (4.5) (3.4)
Other Non Opg (Exp)/Inc (1.0) 0.0 0.0 0.0
Net Interest (Exp)/Inc (2.6) (4.0) (4.0) (4.0)
Exceptional Gain/(Loss) (5.2) 0.0 0.0 0.0
Net Income 12.2 23.0 22.1 23.5
Tax (0.4) 0.44 0.44 0.44
Minority Interest 0.0 0.0 0.0 0.0
Preference Dividend 0.0 0.0 0.0 0.0
Net Income After Tax 11.8 23.4 22.6 23.9
Total Return 11.8 23.4 22.6 23.9
Non-tax deductible Items 3.72 1.92 3.08 1.98
Net Inc available for Dist. 20.8 25.4 25.6 25.9
Growth & Ratio
Revenue Gth (%) 223.4 22.9 1.0 0.9
N Property Inc Gth (%) 219.3 25.9 1.0 1.0
Net Inc Gth (%) nm 98.2 (3.7) 6.0
Dist. Payout Ratio (%) 100.0 100.0 100.0 100.0
Net Prop Inc Margins (%) 89.2 91.4 91.4 91.5
Net Income Margins (%) 43.9 70.8 67.5 70.9
Dist to revenue (%) 77.2 76.6 76.7 76.8
Managers & Trustee’s fees to sales %)
11.1 9.9 13.3 9.9
ROAE (%) 5.2 9.2 8.8 9.3
ROA (%) 3.1 5.0 4.7 5.0
ROCE (%) 5.8 6.2 6.0 6.2
Int. Cover (x) 8.0 6.8 6.6 6.8
Source: Company, DBS Bank
Increase in earnings from the acquisition of the Berlin property
Page 214

ASIAN INSIGHTS VICKERS SECURITIES
Page 5
Company Guide
IREIT Global
Quarterly / Interim Income Statement (EURm)
FY Dec 3Q2015 4Q2015 1Q2016 2Q2016 3Q2016
Gross revenue 7.35 8.62 8.80 8.48 8.54
Property expenses (0.8) (1.0) (1.2) (0.8) (0.9)
Net Property Income 6.54 7.66 7.61 7.65 7.68
Other Operating expenses (1.1) (0.8) (0.8) (0.8) (1.1)
Other Non Opg (Exp)/Inc (1.0) (0.2) 0.41 0.71 (0.4)
Net Interest (Exp)/Inc (0.8) (0.8) (1.0) (1.0) (1.0)
Exceptional Gain/(Loss) 0.0 0.0 0.0 0.0 0.0
Net Income 3.68 5.81 6.25 6.54 5.12
Tax 0.74 (0.7) (0.3) (1.7) (0.4)
Minority Interest 0.0 0.0 0.0 0.0 0.0
Net Income after Tax 4.43 5.11 5.91 4.85 4.70
Total Return (3.6) 6.65 5.83 13.0 4.60
Non-tax deductible Items 9.14 (0.2) 0.58 (6.6) 1.74
Net Inc available for Dist. 5.60 6.46 6.41 6.41 6.34
Growth & Ratio
Revenue Gth (%) 36 17 2 (4) 1
N Property Inc Gth (%) 34 17 (1) 0 0
Net Inc Gth (%) 35 16 15 (18) (3)
Net Prop Inc Margin (%) 89.0 88.8 86.5 90.2 89.9
Dist. Payout Ratio (%) 100.0 100.0 100.0 100.0 100.0
Balance Sheet (EURm)
FY Dec 2015A 2016F 2017F 2018F Investment Properties 441 450 452 454
Other LT Assets 2.30 2.30 2.30 2.30
Cash & ST Invts 21.2 19.8 19.8 19.8
Inventory 0.0 0.0 0.0 0.0
Debtors 1.56 2.76 2.79 2.81
Other Current Assets 0.0 0.44 0.44 0.44
Total Assets 466 475 477 479
ST Debt
0.0 0.0 0.0 0.0
Creditor 3.90 4.14 4.18 4.22
Other Current Liab 12.5 12.5 12.5 12.5
LT Debt 197 199 201 203
Other LT Liabilities 1.66 1.66 1.66 1.66
Unit holders’ funds 251 257 257 257
Minority Interests 0.0 0.0 0.0 0.0
Total Funds & Liabilities 466 475 477 479
Non-Cash Wkg. Capital (14.8) (13.4) (13.4) (13.4)
Net Cash/(Debt) (176) (180) (182) (184)
Ratio
Current Ratio (x) 1.4 1.4 1.4 1.4
Quick Ratio (x) 1.4 1.4 1.4 1.4
Aggregate Leverage (%) 42.3 42.0 42.2 42.4
Source: Company, DBS Bank
Increase in gearing due to acquisition of the Berlin property
Page 215

ASIAN INSIGHTS VICKERS SECURITIES
Page 6
Company Guide
IREIT Global
Cash Flow Statement (EURm)
FY Dec 2015A 2016F 2017F 2018F
Pre-Tax Income 17.4 23.0 22.1 23.5
Dep. & Amort. 1.00 1.00 1.00 1.00
Tax Paid (0.4) 0.44 0.44 0.44
Associates &JV Inc/(Loss) 0.0 0.0 0.0 0.0
Chg in Wkg.Cap. (0.2) (1.4) 0.01 0.01
Other Operating CF 6.06 1.92 3.08 1.98
Net Operating CF 23.9 25.0 26.7 26.9
Net Invt in Properties (156) (2.0) (2.0) (2.0)
Other Invts (net) 0.0 0.0 0.0 0.0
Invts in Assoc. & JV 0.0 0.0 0.0 0.0
Div from Assoc. & JVs 0.0 0.0 0.0 0.0
Other Investing CF 0.0 0.0 0.0 0.0
Net Investing CF (156) (2.0) (2.0) (2.0)
Distribution Paid (15.1) (25.4) (25.6) (25.9)
Chg in Gross Debt 101 2.00 2.00 2.00
New units issued 58.0 0.0 0.0 0.0
Other Financing CF (2.2) 0.0 0.0 0.0
Net Financing CF 142 (23.4) (23.6) (23.9)
Currency Adjustments 0.0 0.0 0.0 0.0
Chg in Cash 9.94 (0.4) 1.01 1.01
Operating CFPS (S cts) 6.18 6.49 6.48 6.50
Free CFPS (S cts) (33.9) 5.65 6.00 6.02
Source: Company, DBS Bank
Target Price & Ratings History
Source: DBS Bank
Analyst: Mervin SONG CFA
Derek TAN
Acquisition of Berlin property
Page 216

ASIAN INSIGHTS VICKERS SECURITIES ed: TH / sa: YM, PY
BUY Last Traded Price ( 4 Jan 2017): S$1.20 (STI : 2,921.31)
Price Target 12-mth: S$1.33 (11% upside and 6.0% yield)
Potential Catalyst: Acquisitions
Where we differ: Estimates are more conservative than consensus
Analyst Derek TAN +65 6682 3716 [email protected] Singapore Research Team [email protected] Mervin SONG CFA +65 6682 3715 [email protected]
Price Relative
Forecasts and Valuation FY Dec (S$m) 2015A 2016F 2017F 2018F
Gross Revenue 102 102 136 141 Net Property Inc 86.9 83.5 115 120 Total Return 105 57.9 80.0 84.2 Distribution Inc 57.5 60.2 80.3 84.5 EPU (S cts) 7.17 6.55 7.98 7.50 EPU Gth (%) 32 (9) 22 (6) DPU (S cts) 6.51 6.81 7.15 7.52 DPU Gth (%) 20 5 5 5 NAV per shr (S cts) 92.1 92.1 97.0 97.0 PE (X) 16.7 18.3 15.0 16.0 Distribution Yield (%) 5.4 5.7 6.0 6.3 P/NAV (x) 1.3 1.3 1.2 1.2 Aggregate Leverage (%) 33.7 40.3 29.7 35.1 ROAE (%) 8.0 7.1 8.4 7.7 Distn. Inc Chng (%): 0 0 0 Consensus DPU (S cts): 6.60 7.20 7.40 Other Broker Recs: B: 9 S: 0 H: 1
Source of all data on this page: Company, DBS Bank, Bloomberg Finance L.P.
Destiny in its own hands
BUY with S$1.33 TP. Keppel DC REIT (KDC REIT) remains one of
the few REITs in Singapore that is projected to deliver a solid 5%
CAGR in distributions supported by positive market dynamics.
Low gearing of c.30% and low cost of capital empower the REIT
with financial capacity to acquire accretive assets. Maintain BUY
and TP of S$1.33 which has already priced in the recently
announced acquisition of Keppel DC Singapore 3 (KDC SG 3).
Acquisition of KDC SG 3 to power earnings forward; impact on
DPUs estimated to be significant. The acquisition of KDC SG 3
further diversifies the REIT’s earnings base and fuels a stronger
earnings growth trajectory of 5% going forward. Apart from
being a significantly accretive deal, upside will come from the
ability for management to garner tax transparency status, which
allows an additional 3.5% upside to our estimates, which is not
factored in.
Further flexibility to acquire post balance sheet recapitalisation
exercise. The S$279.5m in new equity raised improved the
REIT’s liquidity and further strengthened its balance sheet,
positioning KDC REIT for another year of strong growth driven
from acquisitions. This is supported by low gearing of c.30%
coupled with low cost of capital. We have not factored in
further acquisitions in our estimates.
Valuation:
We currently have a BUY recommendation, with a DCF-backed
TP of S$1.33. The stock offers attractive FY17F yields of 6.0%
and upside will hinge on better-than-expected returns from
acquisitions.
Key Risks to Our View:
Rising interest rates. A faster than anticipated rise in interest
rates will negatively impact distributions. At A Glance Issued Capital (m shrs) 1,125
Mkt. Cap (S$m/US$m) 1,350 / 938
Major Shareholders (%)
Keppel Corp Ltd 27.5
Free Float (%) 72.5
3m Avg. Daily Val (US$m) 2.0
ICB Industry : Financials / Real Estate Investment Trusts
DBS Group Research . Equity
4 Jan 2017
Singapore Company Guide
Keppel DC REIT Version 6 | Bloomberg: KDCREIT SP | Reuters: KEPE.SI Refer to important disclosures at the end of this report
Page 217

ASIAN INSIGHTS VICKERS SECURITIES
Page 2
Company Guide
Keppel DC REIT
CRITICAL DATA POINTS TO WATCH
Earnings Drivers:
Tapping on global data storage and usage growth. As an owner
of data centres in key data gateways and financial centres
across Asia Pacific and Europe, KDC REIT is poised to ride the
wave of rising global data usage and demand for data centres.
The Trust offers investors a stable and visible earnings growth
profile, with 30% of NPI derived from long-dated master leases
with embedded rental step-ups of 2-4% p.a. With 61% of
leases by rental income due for renewal between 2015 and
2017, earnings will be further driven by positive rental
reversions and higher occupancies at its co-location data centres
in Singapore (T25, S25), Australia (part of Gore Hill), and Ireland
(Citadel 100). As it stands, the Trust has a WALE of 2.6 years for
co-location properties, 9.9 years for fully fitted properties, and
16 years for shell & core properties.
Strong ambitions to grow portfolio. The acquisition of KDC SG
3 for S$202.5m is well anticipated but highly accretive to
portfolio earnings estimates, given the high initial yield of
10.25%. The REIT raised S$279.5m which will fully fund the
acquisition with equity. The remaining S$65m will be utilised to
pay down short-term loans for the purchase of Intellicentre 2
(previously announced) and future acquisitions which are not
factored in at this point.
We estimate the deal to be accretive and project the full-year
impact from this acquisition to grow FY17F DPU by 5.0%
(FY16F DPU estimate of 6.8 Scts vs FY17F DPU of 7.2 Scts).
Assuming that IRAS approves tax transparency status for the
REIT, impact to DPU is estimated to be close to 8.5%.
Occupancy saw marginal improvement to 92.7% from 92.3%,
mainly due to the take-up of half of the lease renewal (6,800
sqft in total or 6.2% of the property NLA) at Keppel DC
Singapore 1 (aka S25) that was previously committed and
announced. The remaining half is intended to be taken up in
2H17. WALE remains healthy at 8.6 years.
Expansion to Italy and the UK: The REIT had recently announced
acquisitions in two new markets, a shell and core building of a
data centre in Milan, Italy, and another one in Cardiff, UK. Both
backed by long master leases with embedded rental escalations,
the former has been fully leased to one of the world’s largest
telecommunications companies for 12 years, whereas the latter
has been fully leased to one of the largest global cloud service
providers for 15 years.
Net Property Income and Margins (%)
Net Property Income and Margins (%)
Distribution Paid / Net Operating CF
Interest Cover (x)
Source: Company, DBS Bank
Page 218

ASIAN INSIGHTS VICKERS SECURITIES
Page 3
Company Guide
Keppel DC REIT
Balance Sheet:
Conservative hedging policies. Major currencies that will impact
earnings - AUD and EUR - have been hedged for two years at
better-than-current spot rates, minimising any currency
fluctuations going forward. While the Manager has hedged the
majority of its foreign-sourced income until 1H17, we note that
the REIT could face translation losses upon rolling forward these
hedges if the AUD and EUR remain at current levels.
Conservative balance sheet. KDC REIT’s gearing stands at below
c.30%, with an all-in cost of debt of 2.4%. As at end-3Q16,
87% of the Trust’s borrowings were hedged into fixed rate
debt, which will provide earnings visibility in a volatile interest
rate environment.
Share Price Drivers:
Acquisitions to be a key share price driver. Given that earnings
profile is fairly stable; growth in DPUs is likely to be driven by
acquisitions, which the Manager alludes to be considering.
Given its current share price, target acquisition returns of c.7-
8% should mean that acquisitions are likely to be accretive.
Key Risks:
Higher maintenance capex relative to other asset classes. Due
to the shorter lifespan of a datacentre’s infrastructure, it is
possible that the REIT may have to rely on borrowings to fund
maintenance capex at certain properties, which could impact
gearing.
Competition from larger third-party data centre players. The
data centre market is dominated by several large international
operators which have been aggressively expanding into
markets where KDC REIT has a presence. KDC REIT may face
higher barriers to entry and stiffer competition to attract and
retain tenants.
Company Background
Keppel DC REIT (KDC REIT) is a Singapore-based real estate
investment trust (REIT), established with the principal
investment strategy of investing, directly or indirectly, in a
portfolio of income-producing real estate assets which are
used primarily for data centre purposes, with an initial focus on
Asia Pacific and Europe.
Aggregate Leverage (%)
ROE (%)
Distribution Yield (%)
PB Band (x)
Source: Company, DBS Bank
Page 219

ASIAN INSIGHTS VICKERS SECURITIES
Page 4
Company Guide
Keppel DC REIT
Income Statement (S$m)
FY Dec 2015A 2016F 2017F 2018F
Gross revenue 102 102 136 141
Property expenses (15.6) (18.3) (20.8) (21.0)
Net Property Income 86.9 83.5 115 120
Other Operating expenses (7.3) (12.7) (16.6) (16.4)
Other Non Opg (Exp)/Inc 0.77 0.0 0.0 0.0
Net Interest (Exp)/Inc (11.4) (9.5) (11.7) (12.4)
Exceptional Gain/(Loss) 0.0 0.0 0.0 0.0
Net Income 69.0 61.3 87.0 91.5
Tax (5.6) (3.4) (7.0) (7.3)
Minority Interest 0.0 0.0 0.0 0.0
Preference Dividend 0.0 0.0 0.0 0.0
Net Income After Tax 63.3 57.9 80.0 84.2
Total Return 105 57.9 80.0 84.2
Non-tax deductible Items (46.9) 2.30 0.30 0.30
Net Inc available for Dist. 57.5 60.2 80.3 84.5
Growth & Ratio
Revenue Gth (%) 28.2 (0.7) 33.8 3.8
N Property Inc Gth (%) 28.8 (3.9) 38.2 4.3
Net Inc Gth (%) 32.3 (8.6) 38.2 5.2
Dist. Payout Ratio (%) 100.0 100.0 100.0 100.0
Net Prop Inc Margins (%) 84.8 82.0 84.7 85.1
Net Income Margins (%) 61.8 56.9 58.8 59.5
Dist to revenue (%) 56.1 59.1 59.0 59.7
Managers & Trustee’s fees to sales %)
7.1 12.5 12.2 11.6
ROAE (%) 8.0 7.1 8.4 7.7
ROA (%) 5.4 4.6 5.6 5.3
ROCE (%) 6.4 5.3 6.4 6.0
Int. Cover (x) 7.0 7.5 8.4 8.4
Source: Company, DBS Bank
Earnings growth mainly from KDC SG 3 acquisition
Page 220

ASIAN INSIGHTS VICKERS SECURITIES
Page 5
Company Guide
Keppel DC REIT
Quarterly / Interim Income Statement (S$m)
FY Dec 3Q2015 4Q2015 1Q2016 2Q2016 3Q2016
Gross revenue 25.7 24.6 24.8 24.9 22.7
Property expenses (4.4) (2.7) (3.6) (2.8) (2.8)
Net Property Income 21.4 21.8 21.2 22.1 19.9
Other Operating expenses (1.0) (3.7) (3.6) 0.31 4.87
Other Non Opg (Exp)/Inc 0.0 0.0 0.64 0.0 0.0
Net Interest (Exp)/Inc (2.9) (2.8) (2.8) (2.8) (2.8)
Exceptional Gain/(Loss) 0.0 0.0 0.0 0.0 0.0
Net Income 17.5 15.3 15.5 19.6 22.0
Tax (0.6) (2.4) (0.9) (1.2) (0.9)
Minority Interest 0.0 0.0 0.0 0.0 (0.1)
Net Income after Tax 16.9 12.9 14.6 18.4 21.0
Total Return 16.9 54.8 14.6 18.4 21.0
Non-tax deductible Items (2.4) (40.3) 0.13 (3.6) (4.3)
Net Inc available for Dist. 14.5 14.5 14.8 14.7 16.7
Growth & Ratio
Revenue Gth (%) (1) (5) 1 0 (9)
N Property Inc Gth (%) (3) 2 (3) 4 (10)
Net Inc Gth (%) 10 (24) 13 26 14
Net Prop Inc Margin (%) 83.0 88.9 85.5 88.9 87.8
Dist. Payout Ratio (%) 100.0 100.0 100.0 100.0 100.0
Balance Sheet (S$m)
FY Dec 2015A 2016F 2017F 2018F Investment Properties 1,103 1,224 1,431 1,550
Other LT Assets 17.3 17.3 17.3 17.3
Cash & ST Invts 37.2 41.9 34.1 32.8
Inventory 0.0 0.0 0.0 0.0
Debtors 53.1 40.7 54.5 56.5
Other Current Assets 1.01 1.01 1.01 1.01
Total Assets 1,211 1,325 1,538 1,657
ST Debt
33.6 33.6 33.6 33.6
Creditor 17.8 6.78 9.08 9.42
Other Current Liab 0.14 3.51 7.10 7.46
LT Debt 338 460 392 510
Other LT Liabilities 7.78 7.78 7.78 7.78
Unit holders’ funds 813 813 1,089 1,089
Minority Interests 0.37 0.41 0.45 0.49
Total Funds & Liabilities 1,211 1,325 1,538 1,657
Non-Cash Wkg. Capital 36.1 31.4 39.3 40.7
Net Cash/(Debt) (335) (451) (391) (511)
Ratio
Current Ratio (x) 1.8 1.9 1.8 1.8
Quick Ratio (x) 1.7 1.9 1.8 1.8
Aggregate Leverage (%) 33.7 40.3 29.7 35.1
Z-Score (X) 1.9 1.5 1.9 1.7
Source: Company, DBS Bank
Gearing to remain within comfortable range
Page 221

ASIAN INSIGHTS VICKERS SECURITIES
Page 6
Company Guide
Keppel DC REIT
Cash Flow Statement (S$m)
FY Dec 2015A 2016F 2017F 2018F
Pre-Tax Income 69.0 61.3 87.0 91.5
Dep. & Amort. 0.0 0.0 0.0 0.0
Tax Paid (0.2) 0.0 (3.4) (7.0)
Associates &JV Inc/(Loss) 0.0 0.0 0.0 0.0
Chg in Wkg.Cap. (24.4) 1.36 (11.5) (1.7)
Other Operating CF 11.9 2.30 0.30 0.30
Net Operating CF 56.3 64.9 72.5 83.1
Net Invt in Properties (477) (121) (207) (118)
Other Invts (net) (8.8) 0.0 0.0 0.0
Invts in Assoc. & JV 0.0 0.0 0.0 0.0
Div from Assoc. & JVs 0.0 0.0 0.0 0.0
Other Investing CF (47.6) 0.0 0.0 0.0
Net Investing CF (533) (121) (207) (118)
Distribution Paid (31.4) (60.2) (80.3) (84.5)
Chg in Gross Debt 149 121 (68.1) 118
New units issued 507 0.0 275 0.0
Other Financing CF (118) 0.0 0.0 0.0
Net Financing CF 507 61.2 127 33.9
Currency Adjustments (0.7) 0.0 0.0 0.0
Chg in Cash 29.7 4.76 (7.8) (1.3)
Operating CFPS (S cts) 9.14 7.20 8.37 7.56
Free CFPS (S cts) (47.6) (6.4) (13.4) (3.1)
Source: Company, DBS Bank
Target Price & Ratings History
Source: DBS Bank
Analyst: Derek TAN
Singapore Research Team
Mervin SONG CFA
Investments in KDC SG 3 (2017) and mainCubes (2018)
Page 222

ASIAN INSIGHTS VICKERS SECURITIES ed: JS / sa: YM, PY
BUY Last Traded Price ( 4 Jan 2017): S$1.02 (STI : 2,921.31)
Price Target 12-mth: S$1.23 (21% upside and 6.4% yield)
Potential Catalyst: Better than expected rental reversions, resilient office
property values
Where we differ: In line with consensus
Analyst Mervin SONG CFA +65 6682 3715 [email protected] Derek TAN +65 6682 3716 [email protected]
Price Relative
Forecasts and Valuation FY Dec (S$m) 2014A 2015A 2016F 2017F
Gross Revenue 184 170 159 158 Net Property Inc 151 137 130 129 Total Return 372 337 161 158 Distribution Inc 206 217 212 216 EPU (S cts) 5.46 3.71 4.95 4.77 EPU Gth (%) 0 (32) 33 (4) DPU (S cts) 7.23 6.76 6.51 6.51 DPU Gth (%) (8) (7) (4) 0 NAV per shr (S cts) 154 143 139 136 PE (X) 18.7 27.5 20.6 21.4 Distribution Yield (%) 7.1 6.6 6.4 6.4 P/NAV (x) 0.7 0.7 0.7 0.7 Aggregate Leverage (%) 43.3 40.0 38.9 38.9 ROAE (%) 3.8 2.6 3.5 3.4 DPU Chng (%): (2) (2) Consensus DPU (S cts): 6.70 6.50 Other Broker Recs: B: 8 S: 4 H: 9
Source of all data on this page: Company, DBS Bank, Bloomberg Finance L.P.
Money left on the table
Recent rally to continue. Keppel REIT (KREIT)’s share price has
rallied over 25% since its lows in January 2016. KREIT’s
valuation is still attractive on the basis of its cheap valuation on
a per square foot (sqft) basis and decent yield of c.6.5%. In
addition, through proactive lease renewals, KREIT has derisked
its portfolio to mitigate against potential downside from
occupancies and rental rates. Thus, we maintain our BUY call
with a TP of S$1.23.
Tenancy risk in 2017 and 2018 significantly reduced. The impact
on DPU from the potential loss of key tenants in 2017 and 2018
has been reduced considerably. With forward renewal efforts
year-to-date, there are only 5% of leases left for renewal in
each of 2017 and 2018 with no further leases due for the
remainder of 2016. While expiring rents over the next two
years are in the low S$9 level, close to current Grade A rents of
S$9.30, we believe premium status of KREIT’s properties will
help mitigate the potential decline in overall office rents.
Furthermore, with S$50-60m of disposal gains yet to be
distributed, KREIT has the flexibility to stabilise its DPU going
forward.
Compelling valuations on per sqft valuation basis. KREIT’s
Singapore Grade A office portfolio is trading at an implied value
of c.S$2,400 per sqft compared to recent office market
transactions including the sale of Asia Square Tower 1, 60%
interest in CapitaGreen and Straits Trading Building at between
S$2,700 (adjusted for 99-year leasehold for CapitaGreen) to
S$3,500 psf. With abundant liquidity as well as long term
investors being positive on the Singapore office market and
looking beyond short term supply headwinds, we believe capital
values for office properties will remain resilient near term and
KREIT’s discount to the physical market is unwarranted.
Valuation:
We maintain our DCF-based TP of S$1.23 which has
incorporated higher number of shares on issue and near term
drag from loss of California Fitness at Bugis Junction Towers.
Our TP implies a valuation of c.S$2,500 per sqft for KREIT’s
Grade A offices in Singapore.
Key Risks to Our View:
A key risk to our view is new offices supply causing spot rents
to fall below S$7 per sqft, which will likely lead to lower asking
rents, coming in below our expectations.
At A Glance
Issued Capital (m shrs) 3,292
Mkt. Cap (S$m/US$m) 3,357 / 2,315
Major Shareholders (%)
Keppel Land 46.0
Free Float (%) 54.0
3m Avg. Daily Val (US$m) 3.0
ICB Industry : Real Estate / Real Estate Investment Trust
DBS Group Research . Equity
4 Jan 2017
Singapore Company Guide
Keppel REIT Version 6 | Bloomberg: KREIT SP | Reuters: KASA.SI Refer to important disclosures at the end of this report
70
90
110
130
150
170
190
210
0.8
0.9
1.0
1.1
1.2
1.3
1.4
1.5
1.6
1.7
1.8
Jan-13 Jan-14 Jan-15 Jan-16 Jan-17
Relative IndexS$
Keppel REIT (LHS) Relative STI (RHS)
Page 223
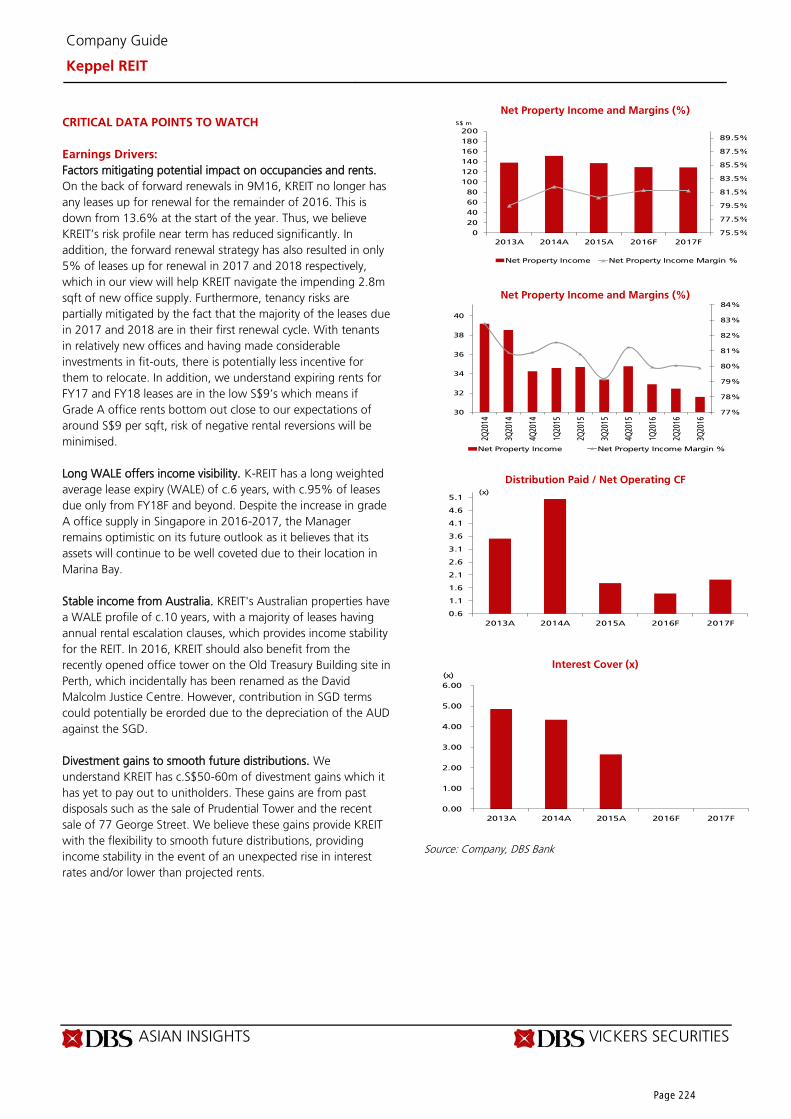
ASIAN INSIGHTS VICKERS SECURITIES
Page 2
Company Guide
Keppel REIT
CRITICAL DATA POINTS TO WATCH
Earnings Drivers:
Factors mitigating potential impact on occupancies and rents.
On the back of forward renewals in 9M16, KREIT no longer has
any leases up for renewal for the remainder of 2016. This is
down from 13.6% at the start of the year. Thus, we believe
KREIT’s risk profile near term has reduced significantly. In
addition, the forward renewal strategy has also resulted in only
5% of leases up for renewal in 2017 and 2018 respectively,
which in our view will help KREIT navigate the impending 2.8m
sqft of new office supply. Furthermore, tenancy risks are
partially mitigated by the fact that the majority of the leases due
in 2017 and 2018 are in their first renewal cycle. With tenants
in relatively new offices and having made considerable
investments in fit-outs, there is potentially less incentive for
them to relocate. In addition, we understand expiring rents for
FY17 and FY18 leases are in the low S$9’s which means if
Grade A office rents bottom out close to our expectations of
around S$9 per sqft, risk of negative rental reversions will be
minimised.
Long WALE offers income visibility. K-REIT has a long weighted
average lease expiry (WALE) of c.6 years, with c.95% of leases
due only from FY18F and beyond. Despite the increase in grade
A office supply in Singapore in 2016-2017, the Manager
remains optimistic on its future outlook as it believes that its
assets will continue to be well coveted due to their location in
Marina Bay.
Stable income from Australia. KREIT's Australian properties have
a WALE profile of c.10 years, with a majority of leases having
annual rental escalation clauses, which provides income stability
for the REIT. In 2016, KREIT should also benefit from the
recently opened office tower on the Old Treasury Building site in
Perth, which incidentally has been renamed as the David
Malcolm Justice Centre. However, contribution in SGD terms
could potentially be erorded due to the depreciation of the AUD
against the SGD.
Divestment gains to smooth future distributions. We
understand KREIT has c.S$50-60m of divestment gains which it
has yet to pay out to unitholders. These gains are from past
disposals such as the sale of Prudential Tower and the recent
sale of 77 George Street. We believe these gains provide KREIT
with the flexibility to smooth future distributions, providing
income stability in the event of an unexpected rise in interest
rates and/or lower than projected rents.
Net Property Income and Margins (%)
Net Property Income and Margins (%)
Distribution Paid / Net Operating CF
Interest Cover (x)
Source: Company, DBS Bank
75.5%
77.5%
79.5%
81.5%
83.5%
85.5%
87.5%
89.5%
0
20
40
60
80
100
120
140
160
180
200
2013A 2014A 2015A 2016F 2017F
S$ m
Net Property Income Net Property Income Margin %
77%
78%
79%
80%
81%
82%
83%
84%
30
32
34
36
38
40
2Q20
14
3Q20
14
4Q20
14
1Q20
15
2Q20
15
3Q20
15
4Q20
15
1Q20
16
2Q20
16
3Q20
16
Net Property Income Net Property Income Margin %
0.6
1.1
1.6
2.1
2.6
3.1
3.6
4.1
4.6
5.1
2013A 2014A 2015A 2016F 2017F
(x)
0.00
1.00
2.00
3.00
4.00
5.00
6.00
2013A 2014A 2015A 2016F 2017F
(x)
Page 224

ASIAN INSIGHTS VICKERS SECURITIES
Page 3
Company Guide
Keppel REIT
Balance Sheet:
Gearing now below 40%. With recent asset revaluation gains
and the disposal of 77 King Street in Sydney, KREIT’s gearing is
now at c.39%. Going forward, we expect gearing to remain
below 40%.
Decent debt maturity. KREIT has a weighted average debt to
expiry of 3.7 years, with c.74% of debt on fixed rates.
Share Price Drivers:
Sentiment too negative on office capital values? With the
looming new office supply and spot Grade A office rents
declining recently, investors have generally avoided the office
sector. However, with KREIT’s share price having already
corrected significantly from peak levels in 2013 causing KREIT to
trade at 0.8x P/BV, and evidence that physical office asset values
are unlikely to correct further near term based on recent market
transactions, we believe KREIT’s decent 5.8% yield deserves
another relook by investors.
Key Risks:
Risks to capital values. Should an increase in office supply and
a persistently weak office market outlook lead to a larger than
expected fall in rents, valuers could downgrade rental and
growth outlook, and this could trigger a decline in capital
values, which would put the REIT’s NAV at risk.
Interest rate risk. Any increase in interest rates will result in
higher interest payments that the REIT has to make annually to
service its loans. Nevertheless, the risk is partially mitigated by
the fact that c.74% of the KREIT’s debt is on fixed rates.
Currency risk. As KREIT earns rental income from its Australian
assets in AUD, any depreciation in the AUD would result in
relatively lower contributions from Australia to K-REIT's total
distributable income. To manage this risk, almost all of KRETI’s
income from Australia has been hedged for 2016.
Company Background
Keppel REIT is a real estate investment trust investing in
predominantly commercial properties in Singapore and key
gateway cities in Australia.
Aggregate Leverage (%)
ROE (%)
Distribution Yield (%)
PB Band (x)
Source: Company, DBS Bank
20.0%
25.0%
30.0%
35.0%
40.0%
45.0%
2013A 2014A 2015A 2016F 2017F
0.0%
0.5%
1.0%
1.5%
2.0%
2.5%
3.0%
3.5%
4.0%
2013A 2014A 2015A 2016F 2017F
Avg: 6.3%
+1sd: 6.8%
+2sd: 7.4%
-1sd: 5.8%
-2sd: 5.3%
4.3
4.8
5.3
5.8
6.3
6.8
7.3
7.8
8.3
2013 2014 2015 2016 2017
(%)
Avg: 0.8x
+1sd: 0.91x
+2sd: 1.03x
-1sd: 0.69x
-2sd: 0.58x
0.5
0.6
0.7
0.8
0.9
1.0
1.1
1.2
1.3
1.4
Jan-13 Jan-14 Jan-15 Jan-16 Jan-17
(x)
Page 225

ASIAN INSIGHTS VICKERS SECURITIES
Page 4
Company Guide
Keppel REIT
Income Statement (S$m)
FY Dec 2013A 2014A 2015A 2016F 2017F
Gross revenue 174 184 170 159 158
Property expenses (35.7) (32.7) (32.9) (28.9) (28.8)
Net Property Income 138 151 137 130 129
Other Operating expenses (49.8) (52.9) (56.8) (50.0) (50.0)
Other Non Opg (Exp)/Inc 28.0 12.6 5.60 1.17 (0.1)
Net Interest (Exp)/Inc (18.2) (22.7) (30.4) 8.24 7.29
Exceptional Gain/(Loss) 0.0 12.3 0.0 0.0 0.0
Net Income 163 171 149 172 170
Tax (16.8) (11.6) (28.0) (3.7) (3.9)
Minority Interest 0.0 (0.1) (0.1) 0.0 0.0
Preference Dividend 0.0 0.0 (1.2) (7.5) (7.5)
Net Income After Tax 146 160 119 161 158
Total Return 535 372 337 161 158
Non-tax deductible Items 132 (166) (120) 50.8 57.5
Net Inc available for Dist. 214 206 217 212 216
Growth & Ratio
Revenue Gth (%) 10.9 5.8 (7.5) (6.9) (0.5)
N Property Inc Gth (%) 10.9 9.5 (9.2) (5.7) (0.6)
Net Inc Gth (%) 25.5 9.4 (25.1) 35.0 (1.9)
Dist. Payout Ratio (%) 100.0 100.0 100.0 100.0 100.0
Net Prop Inc Margins (%) 79.5 82.3 80.7 81.8 81.7
Net Income Margins (%) 83.8 86.7 70.1 101.7 100.3
Dist to revenue (%) 123.0 112.0 127.5 133.7 136.8
Managers & Trustee’s fees to sales %)
28.6 28.8 33.3 31.5 31.7
ROAE (%) 4.0 3.8 2.6 3.5 3.4
ROA (%) 2.3 2.3 1.6 2.2 2.2
ROCE (%) 1.3 1.3 0.9 1.1 1.1
Int. Cover (x) 4.9 4.3 2.7 NM NM
Source: Company, DBS Bank
We expect distribution income to be fairly stable going forward, as KREIT’s portfolio average rents are below market. This limits downside from negative reversions as well as KREIT’s ability to payout past disposal gains
Page 226

ASIAN INSIGHTS VICKERS SECURITIES
Page 5
Company Guide
Keppel REIT
Quarterly / Interim Income Statement (S$m)
FY Dec 3Q2015 4Q2015 1Q2016 2Q2016 3Q2016
Gross revenue 42.2 42.8 41.2 40.6 39.5
Property expenses (8.8) (8.0) (8.3) (8.1) (8.0)
Net Property Income 33.4 34.8 32.9 32.5 31.6
Other Operating expenses (14.7) (13.4) (14.9) (13.2) (15.7)
Other Non Opg (Exp)/Inc 1.37 1.32 0.36 1.15 3.07
Net Interest (Exp)/Inc (7.8) (8.0) (7.4) (9.5) (9.7)
Exceptional Gain/(Loss) 0.0 0.0 0.0 0.0 0.0
Net Income 34.6 36.7 36.6 39.4 41.8
Tax (4.5) (19.8) (7.0) (3.0) (1.8)
Minority Interest 0.0 (0.1) 0.0 0.0 0.0
Net Income after Tax 30.1 15.6 27.7 34.5 40.0
Total Return 51.0 213 56.0 96.5 40.0
Non-tax deductible Items 3.42 (159) (1.6) (44.0) 12.5
Net Inc available for Dist. 54.4 52.8 54.4 52.5 52.5
Growth & Ratio
Revenue Gth (%) (2) 1 (4) (1) (3)
N Property Inc Gth (%) (4) 4 (5) (1) (3)
Net Inc Gth (%) (19) (48) 77 24 16
Net Prop Inc Margin (%) 79.2 81.3 79.9 80.0 79.9
Dist. Payout Ratio (%) 100.0 100.0 100.0 100.0 100.0
Balance Sheet (S$m)
FY Dec 2013A 2014A 2015A 2016F 2017F Investment Properties 4,015 3,614 3,691 3,551 3,554
Other LT Assets 2,635 3,490 3,570 3,570 3,570
Cash & ST Invts 90.6 200 145 152 121
Inventory 0.0 0.0 0.0 0.0 0.0
Debtors 33.9 25.0 18.1 26.4 26.3
Other Current Assets 1.36 0.76 1.29 1.29 1.29
Total Assets 6,776 7,329 7,425 7,301 7,273
ST Debt
282 275 25.4 25.4 25.4
Creditor 94.3 84.5 51.2 96.4 96.1
Other Current Liab 23.0 21.0 13.4 13.4 13.4
LT Debt 2,401 2,390 2,464 2,314 2,314
Other LT Liabilities 76.5 99.1 93.4 93.4 93.4
Unit holders’ funds 3,897 4,457 4,776 4,756 4,728
Minority Interests 1.98 2.05 2.10 2.10 2.10
Total Funds & Liabilities 6,776 7,329 7,425 7,301 7,273
Non-Cash Wkg. Capital (82.0) (79.7) (45.2) (82.1) (82.0)
Net Cash/(Debt) (2,592) (2,466) (2,345) (2,188) (2,219)
Ratio
Current Ratio (x) 0.3 0.6 1.8 1.3 1.1
Quick Ratio (x) 0.3 0.6 1.8 1.3 1.1
Aggregate Leverage (%) 39.6 43.3 40.0 38.9 38.9
Z-Score (X) 0.7 0.8 0.9 1.0 1.0
Source: Company, DBS Bank
Expected decline in gearing due to recent revaluation gains and disposal of 77 George Street
Page 227

ASIAN INSIGHTS VICKERS SECURITIES
Page 6
Company Guide
Keppel REIT
Cash Flow Statement (S$m)
FY Dec 2013A 2014A 2015A 2016F 2017F
Pre-Tax Income 163 171 149 172 170
Dep. & Amort. 0.0 0.0 0.0 0.0 0.0
Tax Paid (15.4) (14.3) (7.6) (3.7) (3.9)
Associates &JV Inc/(Loss) (64.2) (70.6) (92.9) (83.3) (83.5)
Chg in Wkg.Cap. (45.3) (74.0) (5.5) 36.9 (0.2)
Other Operating CF 22.6 30.0 71.5 30.9 30.1
Net Operating CF 60.3 42.6 114 153 112
Net Invt in Properties 504 504 (12.1) 140 (3.2)
Other Invts (net) 0.0 0.0 0.0 0.0 0.0
Invts in Assoc. & JV (585) (585) 63.2 0.0 0.0
Div from Assoc. & JVs 65.4 73.4 89.5 83.3 83.5
Other Investing CF (208) 99.6 0.0 0.0 0.0
Net Investing CF (224) 92.2 141 223 80.4
Distribution Paid (211) (215) (204) (212) (216)
Chg in Gross Debt 258 (20.9) (346) (150) 0.0
New units issued 173 225 150 0.0 0.0
Other Financing CF (54.9) (56.5) 0.0 (7.5) (7.5)
Net Financing CF 165 (67.4) (400) (369) (223)
Currency Adjustments (12.4) 41.7 0.0 0.0 0.0
Chg in Cash (11.3) 109 (145) 6.99 (30.7)
Operating CFPS (S cts) 3.95 3.99 3.72 3.57 3.39
Free CFPS (S cts) 21.1 18.7 3.18 9.00 3.29
Source: Company, DBS Bank
Target Price & Ratings History
Source: DBS Bank
Analyst: Mervin SONG CFA
Derek TAN
S.No.Date of
Report
Closing
Price
12-mth
Target
Price
Rat ing
1: 15 Apr 16 1.01 1.11 BUY
2: 20 Jul 16 1.08 1.26 BUY
3: 22 Jul 16 1.07 1.26 BUY
4: 29 Aug 16 1.07 1.26 BUY
5: 05 Sep 16 1.12 1.26 BUY
6: 26 Sep 16 1.10 1.26 BUY
7: 19 Oct 16 1.10 1.23 BUY
8: 08 Nov 16 1.09 1.23 BUY
Note : Share price and Target price are adjusted for corporate actions.
1
2
3
4
56 7
8
0.81
0.86
0.91
0.96
1.01
1.06
1.11
1.16
Jan-16 May-16 Sep-16 Jan-17
S$
Net gain of c.S$140m from the disposal of 77 George Street
Page 228

ASIAN INSIGHTS VICKERS SECURITIES ed: TH / sa: YM, PY
BUY Last Traded Price ( 4 Jan 2017): US$0.84 (STI : 2,921.31)
Price Target 12-mth: US$0.93 (12% upside and 7.3% yield)
Potential Catalyst: Exceeding IPO forecasts, and acquisitions
Where we differ: na Analyst Mervin SONG CFA +65 6682 3715 [email protected] Derek TAN +65 6682 3716 [email protected]
Price Relative
Forecasts and Valuation FY Dec (US$m) 2015P* 2016F* 2017F 2018F
Gross Revenue 71.0 78.7 79.3 80.7 Net Property Inc 44.2 48.7 48.6 49.5 Total Return 26.0 27.2 30.8 33.9 Distribution Inc 34.3 35.4 38.4 38.8 EPU (US cts.) 4.15 4.32 4.84 5.29 EPU Gth (%) nm 4 12 9 DPU (US cts.) 5.48 5.61 6.05 6.06 DPU Gth (%) nm 2 8 0 NAV per shr (US cts.) 78.4 82.0 80.8 80.2 PE (X) 20.1 19.3 17.2 15.8 Distribution Yield (%) 6.6 6.7 7.2 7.3 P/NAV (x) 1.1 1.0 1.0 1.0 Aggregate Leverage (%) 36.6 36.2 37.1 37.6 ROAE (%) 10.6 5.4 6.0 6.6 Distn. Inc Chng (%): - - - Other Broker Recs: B: 4 S: 0 H: 0
* FY15 numbers are on a proforma basis while FY16 are on an annualised basis
Source of all data on this page: Company, DBS Bank, Bloomberg Finance L.P.
America’s office is great Play on exposure to an improving US office market. We maintain our BUY call and TP of US$0.93. We continue to like Manulife US REIT's (MUST) attractive prospective 7.3% yield, strong organic growth prospects and exposure to the favourable demand and supply fundamentals in the US office markets where MUST’s properties are located. This translates to an 8% DPU growth in FY17, one of the highest among REITs in Singapore. The expected strength of the USD/SGD exchange rate could also result in inflows into the stock. Increased confidence on the REIT’s ability to deliver. Our recent visit to properties in the US and meetings with various property brokers as well as MUST’s strong maiden results indicate that market fundamentals remain firm. We believe that MUST's properties in Midtown Atlanta and Downtown Los Angeles submarkets will continue to see steadily increasing rents, continued expansionary tenant demand, increased employment opportunities and also a lack of competitive new supply. Apart from upside when leases come due, 84.2% of leases (by NLA) have annual rental escalations of around 3%, and 15.0% have provisions for mid-term or period rent increases. Acquisitions to be the next driver of growth. The manager has been disciplined towards acquisitions and with the recent decline in gearing to 34.6%, MUST is well placed to execute on DPU-accretive acquisitions. Apart from that, we expect any acquisition to diversify the REIT’s geographic earnings base and tenant concentration. Markets that are of interest are core submarkets that enjoy demand from a diversified type of industries (i.e. manufacturing, financial, technology and law firms) which imply stability across market cycles. We have not priced in acquisitions in our forecasts. Valuation: TP is maintained at US$0.93 based on DCF. The stock offers attractive FY16-17F yields of 6.8-7.3%. Key Risks to Our View: Lower-than-expected rental income. The key risk to our view is lower-than-expected rental income, arising from the non-replacement/renewal of leases and/or slower-than-expected recovery of office rents in the US. At A Glance Issued Capital (m shrs) 628
Mkt. Cap (US$m) 524
Major Shareholders (%)
Manulife International 7.5
Free Float (%) 92.5
3m Avg. Daily Val (US$m) 0.98
ICB Industry : Financials / Real Estate Investment Trusts
DBS Group Research . Equity
4 Jan 2017
Singapore Company Guide
Manulife US Real Estate Inv Version 3 | Bloomberg: MUST SP | Reuters: MANU.SI Refer to important disclosures at the end of this report
Page 229

ASIAN INSIGHTS VICKERS SECURITIES
Page 2
Company Guide
Manulife US Real Estate Inv
CRITICAL DATA POINTS TO WATCH
Earnings Drivers:
Exposure to the recovery of US real estate market. According to
Colliers International (Colliers), the office market outlook for
Downtown Los Angeles, Orange County and Atlanta are
attractive given (i) rising demand due to projected falling
unemployment rates on the back of a pick-up in business
activities, and (ii) a deep pool of local talents and skilled workers
which attract companies to set up and maintain their presence
there.
The sub-markets where Manulife US REIT’s properties are
located are also characterised by a lack of new competitive
supply due to limited land availability and high construction
costs. Given supportive market dynamics, Colliers expects Class
A rents in the respective markets to improve by 1.5-23.0% per
annum over 2015-2017. Through the initial portfolio and
potential acquisitions in the future, we believe that MUST offers
a cyclical recovery story, with rents and capital values at or close
to an upswing, underpinned by improved business activity in the
US and real estate values that are off previous highs.
Inbuilt organic growth. MUST’s properties are well positioned to
experience strong organic growth delivered through built-in
rental escalations embedded into their lease contracts. As at 30
September 2016, (1) approximately 84.2% of leases (by NLA)
for the initial portfolio had built-in annual rental escalations,
mostly between 2.5% and 3.5%, and (2) 15% of leases (by
NLA) had mid-term or period rent increases, thus providing a
visible and growing rental income stream.
Long WALE of 6.1 years offers strong income visibility. With
leases typically signed on a 3- to 10-year lease and some in
excess of 10 years, the initial portfolio enjoyed a long WALE of
6.1 years (by NLA) as at 30 September 2016. As such, the initial
portfolio has minimal expiries in the following years - only 5.1%
and 1.7% of its leases (by cash rental income) are expiring in
2017 and 2018 respectively, and we are expecting these leases
to revert positively when leases are due for renewal.
Growth through acquisitions by tapping into the expertise of its
Sponsor. MUST’s Sponsor is The Manufacturer’s Life Insurance
Company, which is part of Manulife Financial Group, a Canada-
based financial services group. Through its subsidiary, Manulife
Real Estate (MRE), the Sponsor has a strong acquisition
capability and track record, demonstrated by the acquisition of
85 properties worth US$6.2bn since 2010. This has resulted in a
CAGR of 17.5% per annum in the value of MRE’s AUM.
Therefore, we believe MUST will be able to tap on its Sponsor’s
real estate platform, to source deals, access local market
expertise and gain assistance in securing financing to grow its
portfolio through DPU-accretive acquisitions in the US.
Net Property Income and Margins (%)
Net Property Income and Margins (%)
Distribution Paid / Net Operating CF
Interest Cover (x)
Source: Company, DBS Bank
Page 230

ASIAN INSIGHTS VICKERS SECURITIES
Page 3
Company Guide
Manulife US Real Estate Inv
Balance Sheet:
Stable gearing. Post recent portfolio revaluation gains, MUST’s
gearing has fallen to 34.7% from 36.8% as at end-December
2015. This provides for a debt headroom of c.US$75m should
MUST increase its gearing back up to 40%.
Conservative interest rate profiles. To manage its interest rate
risks, MUST has hedged 100% of its interest exposure at an
average interest rate of 2.46% till 2019.
Share Price Drivers:
Establishing a track record. A key pushback from potential
investors is the lack of familiarity with the US office market,
which we believe after a few quarters of strong results, will allay
most of investors' concerns. This may lead to a re-rating of the
stock. Another key share price driver is the potential
outperformance relative to MUST’s IPO forecast. This could be
driven by stronger-than-expected recovery of the US office
market leading to higher rental reversions.
Key Risks:
Risk of non-renewal and non-replacement of leases. MUST’s
financials, results of operations, and capital growth may be
adversely affected by bankruptcy, insolvency or downturn in
the businesses of one or more of the tenants, as well as the
decision by one or more of these tenants not to renew their
lease/s at the end of a lease cycle.
Foreign currency risks. All of the REIT’s assets are located in the
US and generate revenues in USD. Thus, investors who elect to
receive distributions in SGD have exposure to volatility in the
USD/SGD FX rate. This is mitigated should investors elect to
receive distributions in USD.
Regulatory risks. MUST's tax efficiency relies in part on its
Parent US REIT and Sub-US REITs being able to maintain their
status as US REITs as well as qualifying for US portfolio interest
exemption when repatriating cashflows back to Singapore as
interest. Should there be any changes in tax or REIT
regulations in either the US or Singapore which affects the
current REIT structure or ability to repatriate cash in a tax-
efficient manner, distributions paid to MUST’s unitholders may
be adversely impacted.
Company Background
Manulife US REIT (MUST) is the first pure-play US office REIT
listed in Asia. Its portfolio consists of three freehold, Class A or
Trophy quality office properties in Atlanta, Los Angeles, and
Orange County with aggregate net lettable area (NLA) of
c.1.8m sqft.
Aggregate Leverage (%)
ROE (%)
Distribution Yield (%)
PB Band (x)
Source: Company, DBS Bank
Avg: 6.7%
+1sd: 6.9%
+2sd: 7%
-1sd: 6.6%
-2sd: 6.4%
6.2
6.3
6.4
6.5
6.6
6.7
6.8
6.9
7.0
7.1
7.2
May-16 Jun-16 Jul-16 Aug-16 Sep-16 Oct-16
(%)
Avg: 1.03x
+1sd: 1.05x
+2sd: 1.07x
-1sd: 1.01x
-2sd: 0.98x
0.90
0.95
1.00
1.05
1.10
May-16 Jun-16 Jul-16 Aug-16 Sep-16 Oct-16
(x)
Page 231

ASIAN INSIGHTS VICKERS SECURITIES
Page 4
Company Guide
Manulife US Real Estate Inv
Income Statement (US$m)
FY Dec 2016F 2017F 2018F
Gross revenue 78.7 79.3 80.7
Property expenses (30.0) (30.7) (31.1)
Net Property Income 48.7 48.6 49.5
Other Operating expenses (5.4) (5.4) (5.7)
Other Non Opg (Exp)/Inc 0.0 0.0 0.0
Net Interest (Exp)/Inc (8.2) (8.3) (8.7)
Exceptional Gain/(Loss) (6.6) (2.9) 0.0
Net Income 28.6 32.1 35.2
Tax (1.3) (1.3) (1.2)
Minority Interest 0.0 0.0 0.0
Preference Dividend 0.0 0.0 0.0
Net Income After Tax 27.2 30.8 33.9
Total Return 27.2 30.8 33.9
Non-tax deductible Items 8.14 7.65 4.91
Net Inc available for Dist. 35.4 38.4 38.8
Growth & Ratio
Revenue Gth (%) 11.0 0.8 1.7
N Property Inc Gth (%) 10.4 (0.2) 1.9
Net Inc Gth (%) 4.9 13.1 10.2
Dist. Payout Ratio (%) 100.0 100.0 100.0
Net Prop Inc Margins (%) 61.9 61.3 61.4
Net Income Margins (%) 34.6 38.8 42.1
Dist to revenue (%) 44.9 48.4 48.2
Managers & Trustee’s fees to sales %)
6.9 6.8 7.0
ROAE (%) 5.4 6.0 6.6
ROA (%) 3.3 3.7 4.0
ROCE (%) 5.3 5.2 5.2
Int. Cover (x) 5.3 5.2 5.1
Source: Company, DBS Bank
Growth driven by recovery in the US office market
Page 232

ASIAN INSIGHTS VICKERS SECURITIES
Page 5
Company Guide
Manulife US Real Estate Inv
Quarterly / Interim Income Statement (US$m)
FY Dec 3Q2016
Gross revenue 28.2
Property expenses (10.6)
Net Property Income 17.6
Other Operating expenses (1.7)
Other Non Opg (Exp)/Inc 0.0
Net Interest (Exp)/Inc (3.1)
Exceptional Gain/(Loss) 0.0
Net Income 12.8
Tax (12.0)
Minority Interest 0.0
Net Income after Tax 0.85
Total Return 33.7
Non-tax deductible Items (21.1)
Net Inc available for Dist. 12.6
Growth & Ratio
Revenue Gth (%) N/A
N Property Inc Gth (%) nm
Net Inc Gth (%) nm
Net Prop Inc Margin (%) 62.4
Dist. Payout Ratio (%) 100.0
Balance Sheet (US$m)
FY Dec 2016F 2017F 2018F Investment Properties 813 821 827
Other LT Assets 0.0 0.0 0.0
Cash & ST Invts 20.3 20.3 20.4
Inventory 0.0 0.0 0.0
Debtors 3.15 3.17 3.23
Other Current Assets 0.70 0.70 0.70
Total Assets 837 845 851
ST Debt
0.0 0.0 0.0
Creditor 7.87 7.93 8.07
Other Current Liab 4.34 4.34 4.34
LT Debt 303 314 320
Other LT Liabilities 5.10 5.10 5.10
Unit holders’ funds 517 514 514
Minority Interests 0.0 0.0 0.0
Total Funds & Liabilities 837 845 851
Non-Cash Wkg. Capital (8.4) (8.4) (8.5)
Net Cash/(Debt) (283) (294) (299)
Ratio
Current Ratio (x) 2.0 2.0 2.0
Quick Ratio (x) 2.0 2.0 2.0
Aggregate Leverage (%) 36.2 37.1 37.6
Source: Company, DBS Bank
Page 233

ASIAN INSIGHTS VICKERS SECURITIES
Page 6
Company Guide
Manulife US Real Estate Inv
Cash Flow Statement (US$m)
FY Dec 2016F 2017F 2018F
Pre-Tax Income 35.1 35.0 35.2
Dep. & Amort. 0.0 0.0 0.0
Tax Paid (1.3) (1.3) (1.2)
Associates &JV Inc/(Loss) 0.0 0.0 0.0
Chg in Wkg.Cap. (4.3) 0.04 0.08
Other Operating CF 1.56 4.79 4.91
Net Operating CF 31.1 38.5 38.9
Net Invt in Properties (0.6) (2.1) (0.8)
Other Invts (net) 0.0 0.0 0.0
Invts in Assoc. & JV 0.0 0.0 0.0
Div from Assoc. & JVs 0.0 0.0 0.0
Other Investing CF (8.8) (8.4) (5.0)
Net Investing CF (9.4) (10.6) (5.8)
Distribution Paid (35.4) (38.4) (38.8)
Chg in Gross Debt 9.44 10.6 5.83
New units issued 0.0 0.0 0.0
Other Financing CF 0.0 0.0 0.0
Net Financing CF (25.9) (27.9) (33.0)
Currency Adjustments 0.0 0.0 0.0
Chg in Cash (4.3) 0.04 0.08
Operating CFPS (US cts.) 5.61 6.05 6.06
Free CFPS (US cts.) 4.84 5.72 5.95
Source: Company, DBS Bank
Target Price & Ratings History
Source: DBS Bank
Analyst: Mervin SONG CFA, Derek TAN
Minimal capex due to recently refurbished buildings
Page 234

ASIAN INSIGHTS VICKERS SECURITIES ed: JS / sa: YM, PY
BUY Last Traded Price ( 4 Jan 2017): S$1.42 (STI : 2,921.31) Price Target 12-mth: S$1.62 (14% upside and 6.2% yield) Potential Catalyst: Stronger-than-expected rental reversion; further delay in interest rate hike expectations Where we differ: We have slightly more optimistic assumptions in our earnings forecast than consensus. Analyst Singapore Research Team [email protected] Derek TAN +65 6682 3716 [email protected] Mervin SONG CFA +65 6682 3715 [email protected]
Price Relative
Forecasts and Valuation FY Mar (S$m) 2016A 2017F 2018F 2019F
Gross Revenue 288 375 446 458 Net Property Inc 221 291 346 356 Total Return 299 198 246 255 Distribution Inc 172 219 260 270 EPU (S cts) 7.46 6.83 8.38 8.57 EPU Gth (%) 1 (8) 23 2 DPU (S cts) 8.13 8.72 8.94 9.13 DPU Gth (%) 2 7 2 2 NAV per shr (S cts) 130 130 130 130 PE (X) 19.0 20.7 16.9 16.5 Distribution Yield (%) 5.7 6.2 6.3 6.4 P/NAV (x) 1.1 1.1 1.1 1.1 Aggregate Leverage (%) 35.1 37.3 36.7 36.2 ROAE (%) 5.9 6.0 6.4 6.5 Distn. Inc Chng (%): 19 38 Consensus DPU (S cts): 8.80 8.90 Other Broker Recs: B: 10 S: 1 H: 3
Source of all data on this page: Company, DBS Bank, Bloomberg Finance L.P.
An Eye on the Future MBC I is a rare gem. We believe the acquisition of Mapletree Business City – Phase 1 (MBC I) represents a rare gem, not only due to the scarcity of supply in Grade A Business Parks, but also adds diversification to the portfolio by adding a new property type. After the acquisition, the portfolio breakdown by valuation will be 22.2% for business parks, 58.2% office and 42.1% retail from 40.2% office and 59.8% retail. This acquisition is expected to be DPU accretive and is reflected in our TP of S$1.62 and forecasted DPU which translates to DPU growth of 7-10% for the next two years from the pre-acquisition level in FY16. VivoCity a preferred retail destination: As anticipated, the REIT has utilised the opportunity of lease expiries to rebalance the tenant mix at VivoCity. This has enabled it to achieve a whopping rental reversion of 13.8% in 1H17 without compromising on the occupancy rate. Adequate debt headroom: As the S$1.8bn acquisition of MBC I was financed by approximately 45/55 split in debt and equity, gearing edged up to 37.3% from 35.0%, which translates to a debt headroom of S$487.9m based on the regulatory cap of 45%. This gives the REIT adequate debt headroom to finance future asset enhancement initiatives. Valuation: We maintain our DCF-backed target price to S$1.62. The stock offers a dividend yield of 6.2-6.3% for FY17-18F at the current price. BUY call maintained. Key Risks to Our View: Weaker operational performance from VivoCity While VivoCity’s performance has been very encouraging, the mall is gradually phasing into a matured stage with potential decline in growth ahead. Nonetheless, the acquisition of MBC I, still a segment in high demand, would mitigate the slowdown in growth at VivoCity. At A Glance
Issued Capital (m shrs) 2,870
Mkt. Cap (S$m/US$m) 4,061 / 2,800
Major Shareholders (%)
Mapletree Investments Pte Ltd 38.38
AIA Group Ltd 6.00
Schroders Plc 5.98
Free Float (%) 49.64
3m Avg. Daily Val (US$m) 5.0
ICB Industry : Real Estate / Real Estate Investment Trusts
DBS Group Research . Equity
4 Jan 2017
Singapore Company Guide
Mapletree Commercial Trust Version 5 | Bloomberg: MCT SP | Reuters: MACT.SI Refer to important disclosures at the end of this report
Page 235

ASIAN INSIGHTS VICKERS SECURITIES
Company Guide
Mapletree Commercial Trust
CRITICAL DATA POINTS TO WATCH
Earnings Drivers:
VivoCity a preferred destination mall in Singapore. MCT
achieved a credible 12.3% in retail rental reversions in FY16
(from 142 leases) on the back of a retention rate of 87.9%
despite the current tough operating climate. The success
continues to 1H17 where 114 leases were renewed with a
reversion rate of 13.8%. Occupancy cost for the mall was stable
at 19%, in line with its peers. While the performance growth of
the mall will gradually slowdown as it enters into a more
matured stage, VivoCity will prove its resilience to the retail
headwinds as one of the most popular retail destinations in
Singapore.
Minimal office expiries until FY17/FY18. Over FY16/17,
office/business park’s lease expiries will only account for less
than 10% of the Trust’s leases by gross rental revenue. This will
help to minimise the risk of negative office rental reversions,
particularly at Mapletree Anson, should CBD office rents start to
decline across the market. Amid potential volatility in office
rents and vacancies due to (a) lack of strong demand drivers,
and (b) large office supply completing over the next two years,
MCT offers investors both earnings visibility as well as downside
protection.
Potential acquisitions from the Sponsor. While we applaud to
the yield accretive acquisition of Mapletree Business City –
Phase 1, Mapletree Investments’ progressive redevelopment of
the Harbourfront and Alexandra precincts ensures a steady
pipeline of refurbished or newly developed assets ready to be
injected into the REIT.
Net Property Income and Margins (%)
Net Property Income and Margins (%)
Distribution Paid / Net Operating CF
Interest Cover (x)
Source: Company, DBS Bank
Page 236

ASIAN INSIGHTS VICKERS SECURITIES
Company Guide
Mapletree Commercial Trust
Balance Sheet:
MBC I acquisition edged up gearing slightly. As MBC was
funded by approximately 45/55 in debt and equity, a healthy
balance sheet is maintained with 37.7% aggregate leverage, up
from 35.0%. This level is within the Management’s comfortable
range of below 40% and gives adequate debt headroom based
on the regulatory 45%.
Average debt maturity extended to four years. MBC I’s
acquisition has brought the weighted average all-in cost of debt
down to 2.66% from 2.73%, and extended MCT’s debt tenure
to 4.3 years from 3.7 years. More than 95% of its total debt will
due only from FY18/19 onwards.
Share Price Drivers:
We have made a conservative assumption of low single-digit
rental reversion at VivoCity over the next two years. Any
improvement in the rent renewals may bring upside to share
price.
Moreover, the Management has guided for c.40% top line
growth as a result of the MBC I acquisition. Better performance
realised from the new asset could be a positive catalyst.
Key Risks:
Sustained drop in CBD office rents could impact office
earnings in the medium term. Although the REIT’s office
portfolio is largely located outside the CBD and therefore less
exposed to the large office supply completing from 2016
onwards, any prolonged decline in CBD rents would have a
negative spillover effect to the city fringe, as narrowing rental
differentials could entice tenants to relocate to the CBD
instead.
Company Background Mapletree Commercial Trust (MCT) is a real estate investment trust that invests in income-producing office and retail properties in Singapore. The majority of its earnings are derived from VivoCity, the largest retail mall in Singapore, and the recent acquisition of Mapletree Business City – Phase 1.
Aggregate Leverage (%)
ROE (%)
Distribution Yield (%)
PB Band (x)
Source: Company, DBS Bank
Page 237

ASIAN INSIGHTS VICKERS SECURITIES
Company Guide
Mapletree Commercial Trust
Income Statement (S$m)
FY Mar 2015A 2016A 2017F 2018F 2019F
Gross revenue 282 288 375 446 458
Property expenses (70.8) (67.1) (84.3) (100) (102)
Net Property Income 212 221 291 346 356
Other Operating expenses (20.1) (26.3) (41.2) (36.9) (37.3)
Other Non Opg (Exp)/Inc 0.0 0.0 0.0 0.0 0.0
Net Interest (Exp)/Inc (35.8) (39.3) (51.7) (63.1) (63.6)
Exceptional Gain/(Loss) 0.0 3.63 0.0 0.0 0.0
Net Income 156 159 198 246 255
Tax 0.0 0.0 0.0 0.0 0.0
Minority Interest 0.0 0.0 0.0 0.0 0.0
Preference Dividend 0.0 0.0 0.0 0.0 0.0
Net Income After Tax 156 159 198 246 255
Total Return 312 299 198 246 255
Non-tax deductible Items 12.5 13.7 21.3 14.6 14.8
Net Inc available for Dist. 168 172 219 260 270
Growth & Ratio
Revenue Gth (%) 5.7 1.9 30.3 18.9 2.6
N Property Inc Gth (%) 8.4 4.3 31.7 19.0 2.8
Net Inc Gth (%) 9.3 1.9 24.6 24.3 3.6
Dist. Payout Ratio (%) 100.0 100.0 100.0 100.0 100.0
Net Prop Inc Margins (%) 74.9 76.7 77.5 77.6 77.7
Net Income Margins (%) 55.1 55.2 52.8 55.1 55.7
Dist to revenue (%) 59.6 59.9 58.4 58.4 58.9
Managers & Trustee’s fees to sales %)
7.1 9.1 11.0 8.3 8.1
ROAE (%) 6.2 5.9 6.0 6.4 6.5
ROA (%) 3.7 3.7 3.7 3.9 4.0
ROCE (%) 4.6 4.5 4.7 5.0 5.1
Int. Cover (x) 5.4 5.0 4.8 4.9 5.0
Source: Company, DBS Bank
Increase in top line due to MBC I acquisition
Page 238

ASIAN INSIGHTS VICKERS SECURITIES
Company Guide
Mapletree Commercial Trust
Quarterly / Interim Income Statement (S$m)
FY Mar 2Q2016 3Q2016 4Q2016 1Q2017 2Q2017
Gross revenue 71.3 73.8 73.0 73.4 88.1
Property expenses (16.5) (17.2) (18.0) (17.1) (19.7)
Net Property Income 54.8 56.6 55.0 56.3 68.4
Other Operating expenses (5.4) (5.1) (8.2) (5.5) (6.7)
Other Non Opg (Exp)/Inc (6.9) 0.0 0.0 (9.9) (3.5)
Net Interest (Exp)/Inc (9.8) (10.1) (9.9) (10.6) (12.0)
Exceptional Gain/(Loss) 8.57 (0.2) 0.73 10.6 2.64
Net Income 41.3 41.3 37.7 40.9 48.9
Tax 0.0 0.0 0.0 0.0 0.0
Minority Interest 0.0 0.0 0.0 0.0 0.0
Net Income after Tax 41.3 41.3 37.7 40.9 48.9
Total Return 41.3 198 178 40.9 48.9
Non-tax deductible Items 10.1 2.81 5.98 13.2 7.43
Net Inc available for Dist. 42.8 44.3 42.9 43.5 53.7
Growth & Ratio
Revenue Gth (%) 2 3 (1) 1 20
N Property Inc Gth (%) 1 3 (3) 2 22
Net Inc Gth (%) 7 0 (9) 9 20
Net Prop Inc Margin (%) 76.9 76.7 75.4 76.7 77.7
Dist. Payout Ratio (%) 100.0 100.0 100.0 100.0 100.0
Balance Sheet (S$m)
FY Mar 2015A 2016A 2017F 2018F 2019F
Investment Properties 4,199 4,342 6,129 6,140 6,152
Other LT Assets 4.91 3.52 3.52 3.52 3.52
Cash & ST Invts 54.9 63.6 92.7 110 113
Inventory 0.0 0.0 0.0 0.0 0.0
Debtors 3.29 5.04 6.56 7.81 8.01
Other Current Assets 0.57 1.08 1.08 1.08 1.08
Total Assets 4,263 4,415 6,302 6,332 6,346
ST Debt 189 355 355 355 355
Creditor 61.7 51.8 65.1 77.3 78.9
Other Current Liab 5.15 5.15 5.15 5.15 5.15
LT Debt 1,358 1,197 1,993 1,972 1,944
Other LT Liabilities 32.3 42.8 42.8 42.8 42.8
Unit holders’ funds 2,617 2,764 3,841 3,880 3,921
Minority Interests 0.0 0.0 0.0 0.0 0.0
Total Funds & Liabilities 4,263 4,415 6,302 6,332 6,346
Non-Cash Wkg. Capital (63.0) (50.8) (62.6) (73.6) (75.0)
Net Cash/(Debt) (1,492) (1,488) (2,255) (2,216) (2,186)
Ratio
Current Ratio (x) 0.2 0.2 0.2 0.3 0.3
Quick Ratio (x) 0.2 0.2 0.2 0.3 0.3
Aggregate Leverage (%) 36.3 35.1 37.3 36.7 36.2
Z-Score (X) 1.3 1.2 1.2 1.2 1.3
Source: Company, DBS Bank
Both new asset (MBC I) and existing assets contributed to the positive performance over the quarter
Page 239

ASIAN INSIGHTS VICKERS SECURITIES
Company Guide
Mapletree Commercial Trust
Cash Flow Statement (S$m)
FY Mar 2015A 2016A 2017F 2018F 2019F
Pre-Tax Income 156 159 198 246 255
Dep. & Amort. 0.0 0.0 0.0 0.0 0.0
Tax Paid 0.33 0.0 0.0 0.0 0.0
Associates &JV Inc/(Loss) 0.0 0.0 0.0 0.0 0.0
Chg in Wkg.Cap. 3.07 3.81 11.8 11.0 1.39
Other Operating CF 44.3 50.1 21.3 14.6 14.8
Net Operating CF 204 213 231 271 271
Net Invt in Properties (7.9) (7.4) (1,856) (11.2) (11.4)
Other Invts (net) 0.0 0.0 0.0 0.0 0.0
Invts in Assoc. & JV 0.0 0.0 0.0 0.0 0.0
Div from Assoc. & JVs 0.0 0.0 0.0 0.0 0.0
Other Investing CF 0.03 0.46 0.0 0.0 0.0
Net Investing CF (7.8) (6.9) (1,856) (11.2) (11.4)
Distribution Paid (136) (157) (186) (221) (229)
Chg in Gross Debt (40.0) 0.0 797 (21.7) (27.6)
New units issued 0.0 0.0 1,044 0.0 0.0
Other Financing CF (34.9) (40.3) 0.0 0.0 0.0
Net Financing CF (211) (197) 1,655 (243) (257)
Currency Adjustments 0.0 0.0 0.0 0.0 0.0
Chg in Cash (15.6) 8.72 29.1 17.2 2.75
Operating CFPS (S cts) 9.49 9.81 7.57 8.88 9.06
Free CFPS (S cts) 9.26 9.64 (56.1) 8.87 8.73
Source: Company, DBS Bank
Target Price & Ratings History
Source: DBS Bank
Analyst: Singapore Research Team
Derek TAN
Mervin Song
Page 240

ASIAN INSIGHTS VICKERS SECURITIES
ed: JS / sa: JC, PY
BUYLast Traded Price ( 4 Jan 2017): S$0.95 (STI : 2,921.31)
Price Target 12-mth: S$1.11 (17% upside and 7.6% yield)
Potential Catalyst: Acquisitions and delivery of positive rental reversions
despite concerns over a downturn in the HK retail market
Where we differ: Below consensus due to impact of higher property taxes at
Gateway Plaza
Analyst Mervin SONG CFA +65 6682 3715 [email protected] Derek TAN +65 6682 3716 [email protected]
Price Relative
Forecasts and Valuation FY Mar (S$m) 2015A 2016A 2017F 2018F
Gross Revenue 281 337 351 365 Net Property Inc 229 277 283 295 Total Return 319 415 152 155 Distribution Inc 178 200 200 205 EPU (S cts) 4.55 6.40 5.46 5.54 EPU Gth (%) 4 41 (15) 1 DPU (S cts) 6.54 7.25 7.17 7.27 DPU Gth (%) 4 11 (1) 1 NAV per shr (S cts) 120 124 123 121 PE (X) 20.8 14.8 17.3 17.1 Distribution Yield (%) 6.9 7.7 7.6 7.7 P/NAV (x) 0.8 0.8 0.8 0.8 Aggregate Leverage (%) 36.2 39.4 39.3 39.3 ROAE (%) 4.0 5.3 4.4 4.5
Distn. Inc Chng (%): 0 0 Consensus DPU (S cts): 7.20 7.30 Other Broker Recs: B: 7 S: 0 H: 2
Source of all data on this page: Company, DBS Bank, Bloomberg Finance L.P.
Only a speed hump
Quality will shine through. We maintain our BUY call and TP of S$1.11 for Mapletree Greater China Commercial Trust (MAGIC). While MAGIC faces the challenge of a stronger SGD and higher property taxes at Gateway Plaza, we believe these factors are only speed humps in the near term. As MAGIC cycles through these headwinds over the next few quarters, the strength of core asset Festival Walk (c.70% of net property income (NPI)) as well as the boost from the Sandhill acquisition will shine through. Moreover, MAGIC offers an attractive yield in excess of 6% which we believe is high considering that its portfolio of quality properties is still delivering healthy (7-23%) rental reversions.
Festival Walk’s defensive positioning. The strong market positioning of Festival Walk makes it well placed to weather the headwinds in the HK retail market. Located in Kowloon Tong’s mid to upper residential area and next to City University of Hong Kong, it serves the needs of the local community rather than mainland Chinese tourists which have been the main reason for the fall in HK retail sales. In addition, due to the mall’s strong track record, we understand there remains a queue of potential tenants eager to be located within the mall. Combined with occupancy costs of c.19% which is in the middle of the 16-22% range for other malls in HK, this bodes well for rents going forward. This is evidenced by rental reversions of 15% in 1H17.
Full contribution from Sandhill Plaza yet to be realised. With the S$412m acquisition of Sandhill Plaza in Shanghai only completed in June 2015, MAGIC’s earnings should receive a boost over the coming year, which should help mitigate any potential slowdown in HK, negative drag from higher property taxes in Beijing, and a strengthening SGD.
Valuation: We maintain our DCF-based TP of S$1.11 which has incorporated lower occupancy and higher taxes at Gateway Plaza partially offset by higher occupancies at Sandhill Plaza.
Key Risks to Our View: The key risk to our view is a significant downturn in the HK and Chinese economies, causing a decline in rents at Festival Walk, Gateway Plaza and Sandhill Plaza.
At A Glance Issued Capital (m shrs) 2,787
Mkt. Cap (S$m/US$m) 2,633 / 1,816
Major Shareholders (%)
Mapletree Investment Pte Ltd 30.6
Norges Bank 7.7
AIA Co Ltd 6.0
Free Float (%) 55.7
3m Avg. Daily Val (US$m) 3.9
ICB Industry : Real Estate / Real Estate Investment Trusts
DBS Group Research . Equity
4 Jan 2017
Singapore Company Guide
Mapletree Greater China Commercial Trust Version 6 | Bloomberg: MAGIC SP | Reuters: MAPE.SI Refer to important disclosures at the end of this report
80
100
120
140
160
180
200
220
0.7
0.8
0.9
1.0
1.1
1.2
1.3
Mar-13 Mar-14 Mar-15 Mar-16
Relative IndexS$
Mapletree Greater China Commercial Trust (LHS)
Relative STI (RHS)
Page 241

ASIAN INSIGHTS VICKERS SECURITIES
Page 2
Company Guide
Mapletree Greater China Commercial Trust
CRITICAL DATA POINTS TO WATCH
Earnings Drivers:
Festival Walk still the star. Investors have raised concerns over
the slowing retail market in Hong Kong impacting MAGIC’s
core property Festival Walk. However, we believe Festival Walk
will continue to deliver, although achieving lower rental
reversions (estimated at 10-15%) than the 20-21% delivered
over the past two years. We believe overall rental income will
remain on an uptrend and not turn negative due to the
following factors: (1) the mall’s prime location in Kowloon Tong
offering tenants exposure to nearby established upscale
residential areas, students and staff from the nearby City
University of Hong Kong, and high transit crowd as the mall is
located next to Kowloon Tong Station which is an interchange
between Kwun Tong Line (which serves Kowloon East) and East
Rail Line (which connects to the Shenzhen border) and, (2) the
mall’s strong track record and resiliency. During the SARS
epidemic and GFC, tenant sales were flattish.
Full-year contribution from Sandhill Plaza. This year, MAGIC’s
earnings should receive a boost from the full year contribution
of the Sandhill Plaza acquisition which was only completed in
June 2015. MAGIC should also benefit from positive rental
reversions as passing rents are approximately 10% below
market rates.
Past rental reversions still provide support to Gateway Plaza’s
earnings. Gateway Plaza has achieved 25-33% uplift in rents
over the past two years. The benefits from the positive rental
reversions should continue to flow through, despite potential
headwinds in the near term due to increase in supply within the
Beijing office market and recent jump in vacancy. In the
medium/long term, Gateway Plaza should remain well placed
given the recent decision in August 2015 by the Beijing
Municipal Commission of Development and Reform to ban new
large-scale public developments including office buildings within
the East Fifth Ring Road, West Fifth Ring Road, North Fifth Ring
Road and South Fourth Ring Road which covers the central area
of six urban districts of Beijing.
Acquisition pipeline from sponsor. MAGIC’s sponsor has several
malls, office buildings and business parks in China and HK
which have yet to be stabilised or are in the process of being
constructed. Subject to the price paid, these properties could
potentially provide MAGIC with a pipeline of DPU-enhancing
acquisitions.
Net Property Income and Margins (%)
Net Property Income and Margins (%)
Distribution Paid / Net Operating CF
Interest Cover (x)
Source: Company, DBS Bank
76.6%
78.6%
80.6%
82.6%
84.6%
86.6%
88.6%
90.6%
0
50
100
150
200
250
300
2014A 2015A 2016A 2017F 2018F
S$ m
Net Property Income Net Property Income Margin %
79%
80%
80%
81%
81%
82%
82%
83%
83%
84%
50
55
60
65
70
75
1Q20
15
2Q20
15
3Q20
15
4Q20
15
1Q20
16
2Q20
16
3Q20
16
4Q20
16
1Q20
17
2Q20
17
Net Property Income Net Property Income Margin %
0.2
0.3
0.4
0.5
0.6
0.7
0.8
0.9
1.0
2014A 2015A 2016A 2017F 2018F
(x)
0.00
1.00
2.00
3.00
4.00
5.00
6.00
2014A 2015A 2016A 2017F 2018F
(x)
Page 242

ASIAN INSIGHTS VICKERS SECURITIES
Page 3
Company Guide
Mapletree Greater China Commercial Trust
Balance Sheet:
Optimised gearing levels. As at end-September 2016, MAGIC’s
gearing stood at c.40% which is at an optimal level.
Nevertheless, given the new 45% gearing limit for S-REITs in
January 2016, MAGIC’s ability to pursue further acquisitions
without further equity raisings is constrained.
Moderate exposure to rising interest rates. Currently, 85% of
the MAGIC’s borrowings are on fixed rates which partially
insulates the REIT against rising interest rates in the near term.
Share Price Drivers:
Festival Walk continuing to deliver. Investors have been
concerned over the outlook for retail rents in Hong Kong and
risk of negative rental reversions at Festival Walk. While
acknowledging a moderating outlook, we think these fears are
overplayed given Festival Walk’s suburban location, low
exposure to tourists (c.10-15% of tenant sales) and lack of
exposure to luxury products. Evidence of this can be seen by the
ability to achieve 15% positive rentals reversions in 1H17. This
and continued delivery of DPU growth over the coming few
quarters should allay the growth fears and trigger a re-rating.
Key Risks:
Foreign exchange risks. While FX over the past two years has
been a tailwind, the depreciation of the HKD and CNY would
negatively impact MAGIC’s DPU and NAV per share on a
lagged basis. MAGIC hedges its income to smooth out the
volatility from movements in FX rates.
Economic risks. A significant economic downturn in Hong
Kong and China would cause a decline in rents for retail and
office properties. This in turn would negatively impact
MAGIC’s earnings and DPU.
Company Background
MAGIC is a Singapore real estate investment trust (S-REIT)
established with the investment strategy of principally
investing, directly or indirectly, in a diversified portfolio of
income-producing commercial real estate in the Greater China
region.
Aggregate Leverage (%)
ROE (%)
Distribution Yield (%)
PB Band (x)
Source: Company, DBS Bank
10.0%
15.0%
20.0%
25.0%
30.0%
35.0%
40.0%
2014A 2015A 2016A 2017F 2018F
0.0%
1.0%
2.0%
3.0%
4.0%
5.0%
2014A 2015A 2016A 2017F 2018F
Avg: 6.1%
+1sd: 8.1%
+2sd: 10.1%
-1sd: 4.1%
-2sd: 2.1%
0.0
2.0
4.0
6.0
8.0
10.0
2013 2014 2015 2016 2017
(%)
Avg: 0.85x
+1sd: 0.94x
+2sd: 1.04x
-1sd: 0.75x
-2sd: 0.65x
0.5
0.6
0.7
0.8
0.9
1.0
1.1
1.2
1.3
1.4
Apr-13 Apr-14 Apr-15 Apr-16
(x)
Page 243

ASIAN INSIGHTS VICKERS SECURITIES
Page 4
Company Guide
Mapletree Greater China Commercial Trust
Income Statement (S$m)
FY Mar 2014A 2015A 2016A 2017F 2018F
Gross revenue 268 281 337 351 365
Property expenses (51.4) (51.8) (59.2) (68.0) (70.4)
Net Property Income 216 229 277 283 295
Other Operating expenses (24.4) (25.1) (40.6) (23.0) (24.3)
Other Non Opg (Exp)/Inc (2.0) (7.0) 40.7 0.0 0.0
Net Interest (Exp)/Inc (42.0) (40.4) (64.5) (72.2) (78.2)
Exceptional Gain/(Loss) 0.0 0.0 0.0 0.0 0.0
Net Income 148 157 213 187 192
Tax (30.5) (33.8) (37.8) (35.9) (37.0)
Minority Interest 0.0 0.0 0.0 0.0 0.0
Preference Dividend 0.0 0.0 0.0 0.0 0.0
Net Income After Tax 117 123 175 152 155
Total Return 387 319 415 152 155
Non-tax deductible Items 50.9 55.0 24.6 48.4 49.9
Net Inc available for Dist. 168 178 200 200 205
Growth & Ratio
Revenue Gth (%) 137.0 5.1 19.7 4.2 4.1
N Property Inc Gth (%) 140.7 6.1 21.0 1.8 4.3
Net Inc Gth (%) 113.4 4.9 42.5 (13.6) 2.4
Dist. Payout Ratio (%) 100.0 100.0 100.0 100.0 100.0
Net Prop Inc Margins (%) 80.8 81.6 82.4 80.6 80.7
Net Income Margins (%) 43.8 43.8 52.1 43.2 42.5
Dist to revenue (%) 62.9 63.3 59.4 57.0 56.2
Managers & Trustee’s fees to sales %)
9.1 8.9 12.1 6.6 6.6
ROAE (%) 4.4 4.0 5.3 4.4 4.5
ROA (%) 2.5 2.4 3.0 2.5 2.5
ROCE (%) 3.5 3.3 3.6 3.7 3.9
Int. Cover (x) 4.6 5.1 3.7 3.6 3.5
Source: Company, DBS Bank
Recovery in distributable income on the back of positive rental reversions at Festival Walk, improvement in occupancy at Gateway Plaza as well as increased contribution from the recently acquired Sandhill Plaza
Page 244

ASIAN INSIGHTS VICKERS SECURITIES
Page 5
Company Guide
Mapletree Greater China Commercial Trust
Quarterly / Interim Income Statement (S$m)
FY Mar 2Q2016 3Q2016 4Q2016 1Q2017 2Q2017
Gross revenue 84.6 88.2 87.8 85.0 83.1
Property expenses (15.1) (15.7) (14.8) (15.5) (15.8)
Net Property Income 69.5 72.5 73.0 69.4 67.3
Other Operating expenses (6.8) (7.3) (7.8) (6.0) (5.2)
Other Non Opg (Exp)/Inc (0.5) 1.33 4.66 1.12 1.01
Net Interest (Exp)/Inc (16.6) (17.0) (17.3) (17.5) (17.3)
Exceptional Gain/(Loss) 0.0 0.0 0.0 0.0 0.0
Net Income 45.6 49.5 52.6 47.1 45.8
Tax (7.1) (7.5) (16.4) (7.7) (7.6)
Minority Interest 0.0 0.0 0.0 0.0 0.0
Net Income after Tax 38.5 42.0 36.2 39.4 38.3
Total Return 38.5 42.0 276 39.4 38.3
Non-tax deductible Items 11.1 8.96 16.9 11.8 10.8
Net Inc available for Dist. 49.5 51.0 53.0 51.3 49.1
Growth & Ratio
Revenue Gth (%) 11 4 0 (3) (2)
N Property Inc Gth (%) 11 4 1 (5) (3)
Net Inc Gth (%) (46) 9 (14) 9 (3)
Net Prop Inc Margin (%) 82.1 82.2 83.1 81.7 81.0
Dist. Payout Ratio (%) 100.0 100.0 100.0 100.0 100.0
Balance Sheet (S$m)
FY Mar 2014A 2015A 2016A 2017F 2018F Investment Properties 4,722 5,349 5,922 5,927 5,932
Other LT Assets 8.00 1.00 9.30 9.30 9.30
Cash & ST Invts 133 125 207 208 203
Inventory 0.62 0.77 0.85 0.85 0.85
Debtors 8.33 11.1 10.7 11.2 11.6
Other Current Assets 0.87 0.80 4.05 4.05 4.05
Total Assets 4,873 5,488 6,154 6,160 6,161
ST Debt
0.0 274 462 462 462
Creditor 64.0 76.3 147 153 154
Other Current Liab 37.6 45.2 37.9 37.9 37.9
LT Debt 1,853 1,710 1,960 1,960 1,960
Other LT Liabilities 79.0 122 130 130 130
Unit holders’ funds 2,840 3,260 3,416 3,416 3,416
Minority Interests 0.0 0.0 0.0 0.0 0.0
Total Funds & Liabilities 4,873 5,488 6,154 6,160 6,161
Non-Cash Wkg. Capital (91.8) (109) (169) (175) (175)
Net Cash/(Debt) (1,720) (1,859) (2,215) (2,214) (2,219)
Ratio
Current Ratio (x) 1.4 0.3 0.3 0.3 0.3
Quick Ratio (x) 1.4 0.3 0.3 0.3 0.3
Aggregate Leverage (%) 38.0 36.2 39.4 39.3 39.3
Z-Score (X) 0.9 0.7 0.6 0.6 0.6
Source: Company, DBS Bank
Increase in gearing on the back of the debt-funded acquisition of Sandhill Plaza
Page 245

ASIAN INSIGHTS VICKERS SECURITIES ed: JS / sa: YM, PY
BUY Last Traded Price (4 Jan 2017): S$1.65 (STI : 2,921.31)
Price Target 12-mth: S$1.90 (15% upside and 6.8% yield)
Potential Catalyst: Better than expected results
Where we differ: Our estimates more conservative than consensus
Analyst Derek TAN +65 6682 3716 [email protected] Singapore Research Team [email protected] Mervin SONG CFA +65 6682 3715 [email protected]
Price Relative
Forecasts and Valuation FY Mar (S$m) 2016A 2017F 2018F 2019F
Gross Revenue 332 343 362 378 Net Property Inc 245 253 262 274 Total Return 273 196 202 213 Distribution Inc 198 203 208 217 EPU (S cts) 10.6 10.9 11.2 11.8 EPU Gth (%) 4 3 3 5 DPU (S cts) 11.2 11.3 11.5 12.0 DPU Gth (%) 8 1 2 4 NAV per shr (S cts) 137 137 136 136 PE (X) 15.6 15.2 14.7 14.0 Distribution Yield (%) 6.8 6.8 7.0 7.3 P/NAV (x) 1.2 1.2 1.2 1.2 Aggregate Leverage (%) 30.3 30.2 30.3 30.4 ROAE (%) 8.0 8.0 8.2 8.6 Distn. Inc Chng (%): - - - Consensus DPU (S cts): 11.1 11.8 12.3 Other Broker Recs: B: 9 S: 1 H: 7
Source of all data on this page: Company, DBS Bank, Bloomberg Finance L.P.
Bring on HP! Maintain BUY, TP S$1.90. We maintain our BUY call and TP of S$1.90 on Mapletree Industrial Trust (MINT) on the back of a steady DPU growth profile of 2.3% over FY17-19F (vs 1.2% industrial REIT average). The REIT offers high earnings visibility and we have confidence that the Manager has the flexibility to execute on more developments to exploit its conservative balance sheet. This implies potential upside to earnings. Steady set of results with upside from 3QFY17 onwards. 2QFY17 (FYE Mar) topline and net property income (NPI) was up 1.8% and 4.3% to S$84.2m and S$63.6m respectively, mainly on the back of higher rentals achieved coupled with better cost containment. As a result, NPI margins came in higher at 75.6% vs 73.8% a year ago. Interest costs were fairly stable. As a result, distributable income was 3.4% higher at S$50.6m, but DPU rose a slower 1.4% mainly due to higher units in issue (dividend reinvestment scheme coupled with management fees issued in units previously). Flexibility from low gearing. MINT’s balance sheet is lowly geared at c.30%, which is one of the lowest in the industrial REIT sector, and gives the Manager significant debt-funded capacity for acquisitions or to undertake developments by taking part in built-to-suit projects (BTS) or asset enhancement initiatives. We have not assumed any further acquisitions or developments (apart from those announced) in our forecast. Valuation:
MINT’s resilience is a value trait in this market and has yet to
be reflected in its current share price. We maintain our BUY
call and TP S$1.90.
Key Risks to Our View:
Rising interest rates An increase in refinancing rates will
negatively impact distributions. However, we note that MINT
has minimised these risks by having c.68% of its interest cost
hedged into fixed rates. At A Glance Issued Capital (m shrs) 1,802
Mkt. Cap (S$m/US$m) 2,964 / 2,082
Major Shareholders (%)
Mapletree Investments Pte Ltd 34.2
Schroders Plc 7.0
AIA Group 5.0
Free Float (%) 53.8
3m Avg. Daily Val (US$m) 3.0
ICB Industry : Real Estate / Real Estate Investment Trusts
DBS Group Research . Equity
4 Jan 2017
Singapore Company Guide
Mapletree Industrial Trust Version 7 | Bloomberg: MINT SP | Reuters: MAPI.SI Refer to important disclosures at the end of this report
87
107
127
147
167
187
207
1.1
1.2
1.3
1.4
1.5
1.6
1.7
1.8
1.9
2.0
Jan-13 Jan-14 Jan-15 Jan-16 Jan-17
Relative IndexS$
Mapletree Industrial Trust (LHS) Relative STI (RHS)
Page 246

ASIAN INSIGHTS VICKERS SECURITIES
Page 2
Company Guide
Mapletree Industrial Trust
CRITICAL DATA POINTS TO WATCH
Earnings Drivers:
Modest organic growth outlook. MINT has consistently
delivered strong returns to shareholders post IPO, driven mainly
from the marking to market of its leases which were below
market rates. As most of its properties have already undergone
at least one round of reversions, most of the leases are now at
or near-market levels in our view.
With the softening of market rents due to a slowing economy,
we are forecasting rental reversions to moderate further and
expect the Manager to be increasingly focused on maintaining
occupancies, a strategy which we believe will result in the trust
delivering steady dividends in an increasingly competitive
environment.
MINT’s earnings growth outlook is double that of the industrial
REIT average. With organic growth slowing, the next thrust of
growth will come from the completion of its built-to-suit project
from HP, which emerges from the redevelopment of the Telok
Blangah cluster (expected TOP for phases 1 and 2 in 2H16 and
1H17 respectively).
Contribution from the new HP property will be timely just when
the REIT is facing rental pressure on its portfolio. The
restructuring of the rent free is a positive surprise. The
redistribution of the six-month rent free for both phase 1
(completing in 4QCY16) and phase 2 (completing in 2QCY17)
over the first 18 months will mean a more even distribution in
topline and costs for the REIT. This implies minimal downside
risk to DPUs in 2017 which has been a concern for investors.
Instead, we now see a steady growth profile of 2.3% over
FY17-FY19 vs industrial average of 1.2%.
Development projects in Kallang Basin cluster to optimise
portfolio rent. MINT has also kick-started the development of a
new hi-tech building at Kallang Basin cluster 4 at an estimated
cost of S$77m, returning c.8% when completed in 4Q17. We
believe that demand for the property will be strong given the
good location in the central part of Singapore. The Manager has
ample headroom to fund this development.
Low gearing a positive. MINT’s gearing is low at close to 30%,
makes it one of the lowest-geared industrial REITs, offering the
Manager significant debt-funded capacity for acquisitions or to
undertake development by taking part in built-to-suit projects
(BTS) or asset enhancement initiatives. With a centrally located
industrial portfolio, we believe that there is an opportunity to do
more re-development projects which will be value accretive (to
NAV and DPUs).
Net Property Income and Margins (%)
Net Property Income and Margins (%)
Distribution Paid / Net Operating CF
Interest Cover (x)
Source: Company, DBS Bank
68.8%
70.8%
72.8%
74.8%
76.8%
78.8%
80.8%
0
50
100
150
200
250
300
2015A 2016A 2017F 2018F 2019F
S$ m
Net Property Income Net Property Income Margin %
70%
71%
72%
73%
74%
75%
76%
77%
53
55
57
59
61
63
65
1Q20
15
2Q20
15
3Q20
15
4Q20
15
1Q20
16
2Q20
16
3Q20
16
4Q20
16
1Q20
17
2Q20
17
Net Property Income Net Property Income Margin %
0.2
0.3
0.4
0.5
0.6
0.7
0.8
0.9
1.0
2015A 2016A 2017F 2018F 2019F
(x)
7.70
7.80
7.90
8.00
8.10
8.20
8.30
8.40
8.50
8.60
2015A 2016A 2017F 2018F 2019F
(x)
Page 247

ASIAN INSIGHTS VICKERS SECURITIES
Page 3
Company Guide
Mapletree Industrial Trust
Balance Sheet:
Low gearing allows for opportunistic acquisitions,
developments. Current gearing is conservative, implying that
the Manager has the capability to take on debt-funded
acquisitions when the opportunity arises. The Manager will be
utilising its headroom towards higher-yielding development
projects (built-to-suit project for HP and Kallang Basin cluster 4)
which we estimate to yield 8-9%, which is higher than
acquisitions. Post development, we believe gearing will still be
within management's comfortable level at around 30%.
Stable weighted average debt-to-maturity. MINT has a well-
staggered debt profile with a majority of debt due for
repayment only from FY17/18 onwards. With c.68% of its
borrowings on fixed interest rates, MINT is well protected
against future increases in interest rates.
Share Price Drivers:
Better-than-expected rental reversions/acquisitions will boost
earnings and share price. We are forecasting modest rental
uplifts of 0-3%. The REIT's ability to maintain or beat
expectations will mean upside to our/consensus forecasts. In
addition, acquisitions or further development projects which are
accretive to earnings will likely result in upside to TP and share
price.
Key Risks:
Rising interest rates. An increase in refinancing rates will
negatively impact distributions. However, MINT has minimised
the impact as c.80% of its interest cost has been fixed.
Economic risk. A deterioration of the economic outlook could
have a negative impact on industrial rents and occupancies as
companies cut back on production and require less space.
Industrial rents have a strong historical correlation with GDP
growth.
Company Background
Mapletree Industrial Trust (MINT) is a real estate investment
trust which invests primarily in income-producing industrial
assets located in Singapore. Its portfolio includes a diverse mix
of business parks, science parks, ramp-up warehouses and
flatted factories.
Aggregate Leverage (%)
ROE (%)
Distribution Yield (%)
PB Band (x)
Source: Company, DBS Bank
10.0%
15.0%
20.0%
25.0%
30.0%
2015A 2016A 2017F 2018F 2019F
0.0%
1.0%
2.0%
3.0%
4.0%
5.0%
6.0%
7.0%
8.0%
2015A 2016A 2017F 2018F 2019F
Avg: 6.9%
+1sd: 7.2%
+2sd: 7.6%
-1sd: 6.6%
-2sd: 6.2%
5.2
5.7
6.2
6.7
7.2
7.7
8.2
2013 2014 2015 2016
(%)
Avg: 1.19x
+1sd: 1.26x
+2sd: 1.32x
-1sd: 1.13x
-2sd: 1.06x
0.9
1.0
1.1
1.2
1.3
1.4
1.5
1.6
Jan-13 Jan-14 Jan-15 Jan-16
(x)
Page 248

ASIAN INSIGHTS VICKERS SECURITIES
Page 4
Company Guide
Mapletree Industrial Trust
Income Statement (S$m)
FY Mar 2015A 2016A 2017F 2018F 2019F
Gross revenue 314 332 343 362 378
Property expenses (85.3) (86.5) (90.1) (99.8) (103)
Net Property Income 229 245 253 262 274
Other Operating expenses (27.1) (28.9) (30.5) (31.0) (31.5)
Other Non Opg (Exp)/Inc 0.0 0.0 0.0 0.0 0.0
Net Interest (Exp)/Inc (23.6) (25.6) (26.4) (28.8) (30.4)
Exceptional Gain/(Loss) 0.0 0.0 0.0 0.0 0.0
Net Income 178 191 196 202 213
Tax (1.1) 0.0 0.0 0.0 0.0
Minority Interest 0.0 0.0 0.0 0.0 0.0
Preference Dividend 0.0 0.0 0.0 0.0 0.0
Net Income After Tax 177 191 196 202 213
Total Return 374 273 196 202 213
Non-tax deductible Items (194) (74.8) 6.99 5.53 4.06
Net Inc available for Dist. 181 198 203 208 217
Growth & Ratio
Revenue Gth (%) 4.9 5.6 3.5 5.5 4.4
N Property Inc Gth (%) 6.5 7.2 3.2 3.6 4.7
Net Inc Gth (%) 8.2 7.7 2.9 3.1 5.1
Dist. Payout Ratio (%) 100.0 100.0 100.0 100.0 100.0
Net Prop Inc Margins (%) 72.8 73.9 73.7 72.4 72.6
Net Income Margins (%) 56.4 57.5 57.2 55.9 56.3
Dist to revenue (%) 57.6 59.7 59.2 57.4 57.3
Managers & Trustee’s fees to sales %)
8.6 8.7 8.9 8.6 8.3
ROAE (%) 8.2 8.0 8.0 8.2 8.6
ROA (%) 5.2 5.3 5.3 5.4 5.6
ROCE (%) 6.0 6.2 6.2 6.3 6.6
Int. Cover (x) 8.6 8.4 8.4 8.0 8.0
Source: Company, DBS Bank
Driven mainly from the contribution from HP building
Page 249

ASIAN INSIGHTS VICKERS SECURITIES
Page 5
Company Guide
Mapletree Industrial Trust
Quarterly / Interim Income Statement (S$m)
FY Mar 2Q2016 3Q2016 4Q2016 1Q2017 2Q2017
Gross revenue 82.7 83.3 84.0 84.1 84.2
Property expenses (21.7) (21.4) (22.0) (20.3) (20.6)
Net Property Income 61.0 61.9 62.0 63.8 63.6
Other Operating expenses (7.3) (7.3) (7.2) (7.3) (7.4)
Other Non Opg (Exp)/Inc 0.0 0.0 0.0 0.0 0.0
Net Interest (Exp)/Inc (6.3) (6.4) (6.6) (6.4) (6.6)
Exceptional Gain/(Loss) 0.0 0.0 0.0 0.0 0.0
Net Income 47.4 48.2 48.3 50.1 49.7
Tax 0.0 0.0 0.0 0.0 0.0
Minority Interest 0.0 0.0 0.0 0.0 0.0
Net Income after Tax 47.4 48.2 48.3 50.1 49.7
Total Return 47.4 48.2 130 50.1 49.7
Non-tax deductible Items 1.51 2.08 (79.9) 1.38 0.89
Net Inc available for Dist. 48.9 50.3 50.4 51.5 50.6
Growth & Ratio
Revenue Gth (%) 1 1 1 0 0
N Property Inc Gth (%) 1 1 0 3 0
Net Inc Gth (%) 2 2 0 4 (1)
Net Prop Inc Margin (%) 73.8 74.3 73.8 75.9 75.6
Dist. Payout Ratio (%) 200.0 200.0 200.0 200.0 200.0
Balance Sheet (S$m)
FY Mar 2015A 2016A 2017F 2018F 2019F Investment Properties 3,424 3,558 3,660 3,702 3,706
Other LT Assets 3.63 0.36 0.36 0.36 0.36
Cash & ST Invts 72.0 54.3 78.8 38.6 42.5
Inventory 0.0 0.0 0.0 0.0 0.0
Debtors 16.2 11.4 16.4 17.3 18.1
Other Current Assets 0.0 0.0 0.0 0.0 0.0
Total Assets 3,516 3,624 3,755 3,758 3,767
ST Debt
125 47.4 47.4 47.4 47.4
Creditor 70.3 79.7 100 106 110
Other Current Liab 0.0 0.0 0.0 0.0 0.0
LT Debt 949 974 1,089 1,089 1,094
Other LT Liabilities 58.8 57.9 57.9 57.9 57.9
Unit holders’ funds 2,312 2,465 2,461 2,458 2,457
Minority Interests 0.0 0.0 0.0 0.0 0.0
Total Funds & Liabilities 3,516 3,624 3,755 3,758 3,767
Non-Cash Wkg. Capital (54.0) (68.3) (83.9) (88.5) (92.4)
Net Cash/(Debt) (1,003) (967) (1,057) (1,098) (1,099)
Ratio
Current Ratio (x) 0.5 0.5 0.6 0.4 0.4
Quick Ratio (x) 0.5 0.5 0.6 0.4 0.4
Aggregate Leverage (%) 28.2 30.3 30.2 30.3 30.4
Z-Score (X) 1.7 1.9 1.7 1.7 1.7
Source: Company, DBS Bank
Gearing to remain steady at close to 30%.
Page 250
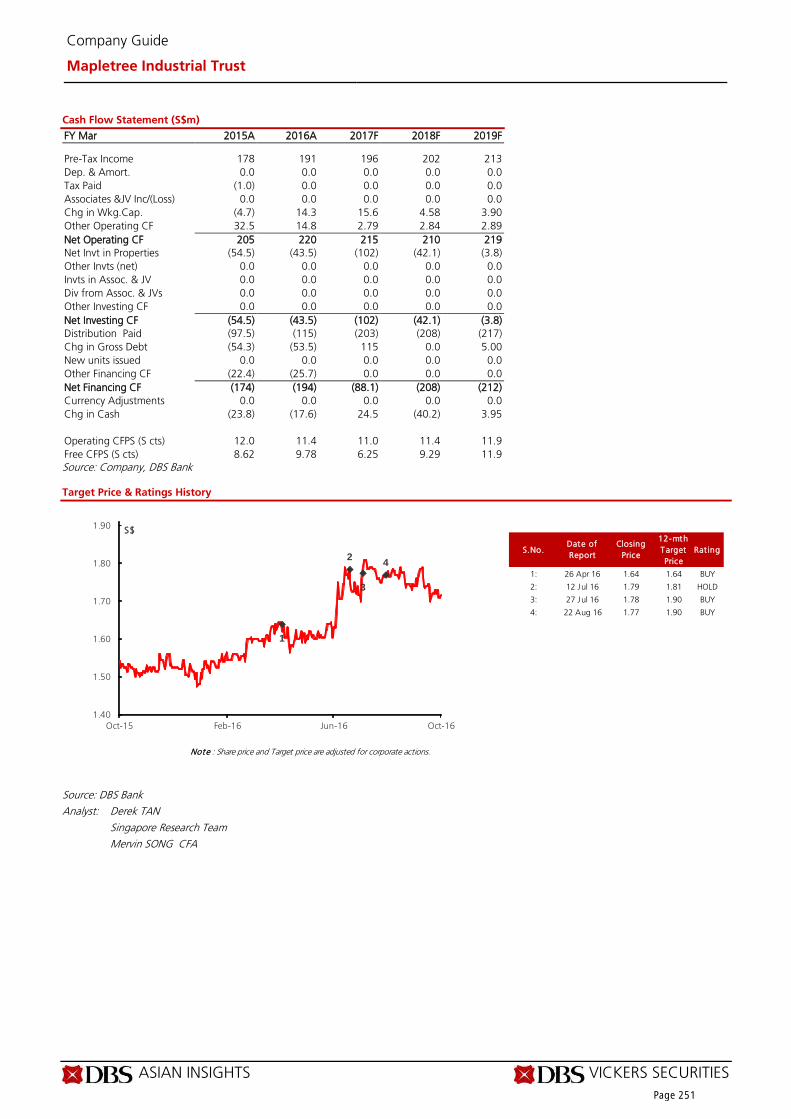
ASIAN INSIGHTS VICKERS SECURITIES
Page 6
Company Guide
Mapletree Industrial Trust
Cash Flow Statement (S$m)
FY Mar 2015A 2016A 2017F 2018F 2019F
Pre-Tax Income 178 191 196 202 213
Dep. & Amort. 0.0 0.0 0.0 0.0 0.0
Tax Paid (1.0) 0.0 0.0 0.0 0.0
Associates &JV Inc/(Loss) 0.0 0.0 0.0 0.0 0.0
Chg in Wkg.Cap. (4.7) 14.3 15.6 4.58 3.90
Other Operating CF 32.5 14.8 2.79 2.84 2.89
Net Operating CF 205 220 215 210 219
Net Invt in Properties (54.5) (43.5) (102) (42.1) (3.8)
Other Invts (net) 0.0 0.0 0.0 0.0 0.0
Invts in Assoc. & JV 0.0 0.0 0.0 0.0 0.0
Div from Assoc. & JVs 0.0 0.0 0.0 0.0 0.0
Other Investing CF 0.0 0.0 0.0 0.0 0.0
Net Investing CF (54.5) (43.5) (102) (42.1) (3.8)
Distribution Paid (97.5) (115) (203) (208) (217)
Chg in Gross Debt (54.3) (53.5) 115 0.0 5.00
New units issued 0.0 0.0 0.0 0.0 0.0
Other Financing CF (22.4) (25.7) 0.0 0.0 0.0
Net Financing CF (174) (194) (88.1) (208) (212)
Currency Adjustments 0.0 0.0 0.0 0.0 0.0
Chg in Cash (23.8) (17.6) 24.5 (40.2) 3.95
Operating CFPS (S cts) 12.0 11.4 11.0 11.4 11.9
Free CFPS (S cts) 8.62 9.78 6.25 9.29 11.9
Source: Company, DBS Bank
Target Price & Ratings History
Source: DBS Bank
Analyst: Derek TAN
Singapore Research Team
Mervin SONG CFA
S.No.Date of
Report
Closing
Price
12-mth
Target
Price
Rat ing
1: 26 Apr 16 1.64 1.64 BUY
2: 12 Jul 16 1.79 1.81 HOLD
3: 27 Jul 16 1.78 1.90 BUY
4: 22 Aug 16 1.77 1.90 BUY
Note : Share price and Target price are adjusted for corporate actions.
1
2
3
4
1.40
1.50
1.60
1.70
1.80
1.90
Oct-15 Feb-16 Jun-16 Oct-16
S$
Page 251

ASIAN INSIGHTS VICKERS SECURITIES ed: TH / sa: YM, PY
BUY Last Traded Price (4 Jan 2017): S$1.02 (STI : 2,921.31)
Price Target 12-mth: S$1.15 (13% upside and 7.1% yield)
Potential Catalyst: In line
Where we differ: Estimates are in line with consensus
Analyst Derek TAN +65 6682 3716 [email protected] Singapore Research Team [email protected] Mervin SONG CFA +65 6682 3715 [email protected]
Price Relative
Forecasts and Valuation FY Mar (S$m) 2016A 2017F 2018F 2019F
Gross Revenue 350 360 375 390 Net Property Inc 291 299 316 327 Total Return 190 172 182 187 Distribution Inc 183 179 185 188 EPU (S cts) 7.66 6.91 7.29 7.53 EPU Gth (%) 20 (10) 5 3 DPU (S cts) 7.38 7.19 7.41 7.57 DPU Gth (%) (2) (3) 3 2 NAV per shr (S cts) 102 101 101 101 PE (X) 13.3 14.8 14.0 13.5 Distribution Yield (%) 7.2 7.1 7.3 7.4 P/NAV (x) 1.0 1.0 1.0 1.0 Aggregate Leverage (%) 39.5 37.0 37.5 37.5 ROAE (%) 7.5 6.8 7.2 7.4 Distn. Inc Chng (%): - - - Consensus DPU (S cts): 7.30 7.50 7.80 Other Broker Recs: B: 7 S: 0 H: 9
Source of all data on this page: Company, DBS Bank, Bloomberg Finance L.P.
Firepower to acquire
Maintain BUY, TP S$1.15. Mapletree Logistics Trust (MLT) is
emerging stronger post balance sheet recapitalisation and we
see acquisitions as a catalyst to drive earnings and share price
upside. With firepower to execute on strategic purchases, MLT
remains on a growth path. BUY maintained, yield of 7.0-7.2% is
attractive for a strong quality name.
Acquisitions and developments to drive growth The issuance of
S$250m perpetual securities in May 2016 @ 4.18% has enabled
MLT to lock in attractive long-term funding for the REIT. Since
then, MLT has deployed close to S$161m and we see more
acquisitions in the pipeline. We believe that opportunities will
come from its Sponsor, and third parties in Australia, Korea, and
China. Acquisitions should more than compensate for
weaknesses in the various markets that MLT operates in.
2Q16 results in line. Top line and net property income are up
4.7% and 5.3% y-o-y to S$91.5m and S$76.8m respectively.
Higher revenues were mainly driven from acquisitions
(portfolio expanded by six properties to 124 as of 2QFY17).
Distributable income is up by 1.0% while DPU is flat mainly
due to higher interest incurred on the issuance of close to
S$250m worth of perpetual securities.
Valuation:
We upgrade our BUY call and TP at S$1.15 which has imputed
acquisitions in our forecasts.
Key Risks to Our View:
Acquisitions ramping up faster than expected. A faster-than-
projected acquisition pace or a better-than-expected outlook
for the Singapore warehouse market will translate to positive
surprises to earnings estimates, and re-rate the stock higher. At A Glance Issued Capital (m shrs) 2,500
Mkt. Cap (S$m/US$m) 2,550 / 1,785
Major Shareholders (%)
Temasek Holdings Private Ltd 39.4
Free Float (%) 60.5
3m Avg. Daily Val (US$m) 2.9
ICB Industry : Real Estate / Real Estate Investment Trust
DBS Group Research . Equity
4 Jan 2017
Singapore Company Guide
Mapletree Logistics Trust Version 5 | Bloomberg: MLT SP | Reuters: MAPL.SI Refer to important disclosures at the end of this report
82
102
122
142
162
182
202
222
0.8
0.9
1.0
1.1
1.2
1.3
1.4
1.5
Jan-13 Jan-14 Jan-15 Jan-16 Jan-17
Relative IndexS$
Mapletree Logistics Trust (LHS) Relative STI (RHS)
Page 252

ASIAN INSIGHTS VICKERS SECURITIES
Page 2
Company Guide
Mapletree Logistics Trust
CRITICAL DATA POINTS TO WATCH
Earnings Drivers:
Pressure on margins to ease as pace of property conversions
slow. We are forecasting a modest decline/flattish outlook for
distributions over FY17F-18F on the back of ongoing headwinds
from a weakening rental outlook in Singapore and also Korea.
However, downside risk is expected to ease given the lower
pace of conversions. This stems from efficiency loss and higher
vacancy rates as master-tenants look to return un-utilised space
in the assets. Looking ahead, with only 10.1% of leases left to
be renewed in FY17, we believe downside risk should be
marginal.
Acquisitions to buffer against modest organic growth prospects.
The issuance of S$250m perpetual securities in May 2016 was
locked in at 4.18%, a good rate in our view. Since then, MLT
has deployed close to S$161m into four properties in Australia
(c.S$84.4m), and one each in Vietnam and Malaysia at yields of
c.7.1-9.9%. The Manager remains on a lookout for acquisitions,
targeting to deploy capital from its recent perpetual issuance.
Based on a S$161m worth of deals announced year-to-date, the
Manager is looking to deploy a further S$90m in opportunities.
Markets of Australia and from the Sponsor's pipeline remain key
sources of acquisition possibilities. Apart from that, the
Manager is keen to re-deploy capital through selective
divestments. They are reviewing potential sale of mature, low-
yielding assets in Japan, China and Malaysia.
In the longer term, we see a sizeable and growing pipeline of
development properties from the Sponsor, Mapletree
Investments that is available for MLT to acquire in the medium
term. Potential assets for acquisitions are mainly in the
development stages across Asia, especially in China, Japan, HK
and Vietnam, where demand for logistics warehouses remains
robust. China remains a key growth area, where the
proliferation of e-commerce will drive demand for more logistic
space.
Development projects to drive value in the medium term. MLT
has completed the AEI at Mapletree Logistics Hub in Toh Guan
(GFA expanded by 2.7x to 63,500 sqm). Occupancy is estimated
to be c.92% as of 2Q16. There is another development project
in the works at 76 Pioneer Road, which will develop into a 5-
storey ramp-up warehouse, increasing its GFA by 1.8x to
72,000 sqm. This project will complete in 3QFY18F.
Net Property Income and Margins (%)
Net Property Income and Margins (%)
Distribution Paid / Net Operating CF
Interest Cover (x)
Source: Company, DBS Bank
79.0%
81.0%
83.0%
85.0%
87.0%
89.0%
91.0%
0
50
100
150
200
250
300
350
400
2015A 2016A 2017F 2018F 2019F
S$ m
Net Property Income Net Property Income Margin %
81%
81%
82%
82%
83%
83%
84%
84%
85%
85%
86%
65
67
69
71
73
75
77
79
1Q20
15
2Q20
15
3Q20
15
4Q20
15
1Q20
16
2Q20
16
3Q20
16
4Q20
16
1Q20
17
2Q20
17
Net Property Income Net Property Income Margin %
0.3
0.4
0.5
0.6
0.7
0.8
0.9
1.0
2015A 2016A 2017F 2018F 2019F
(x)
0.00
1.00
2.00
3.00
4.00
5.00
6.00
7.00
8.00
9.00
2015A 2016A 2017F 2018F 2019F
(x)
Page 253
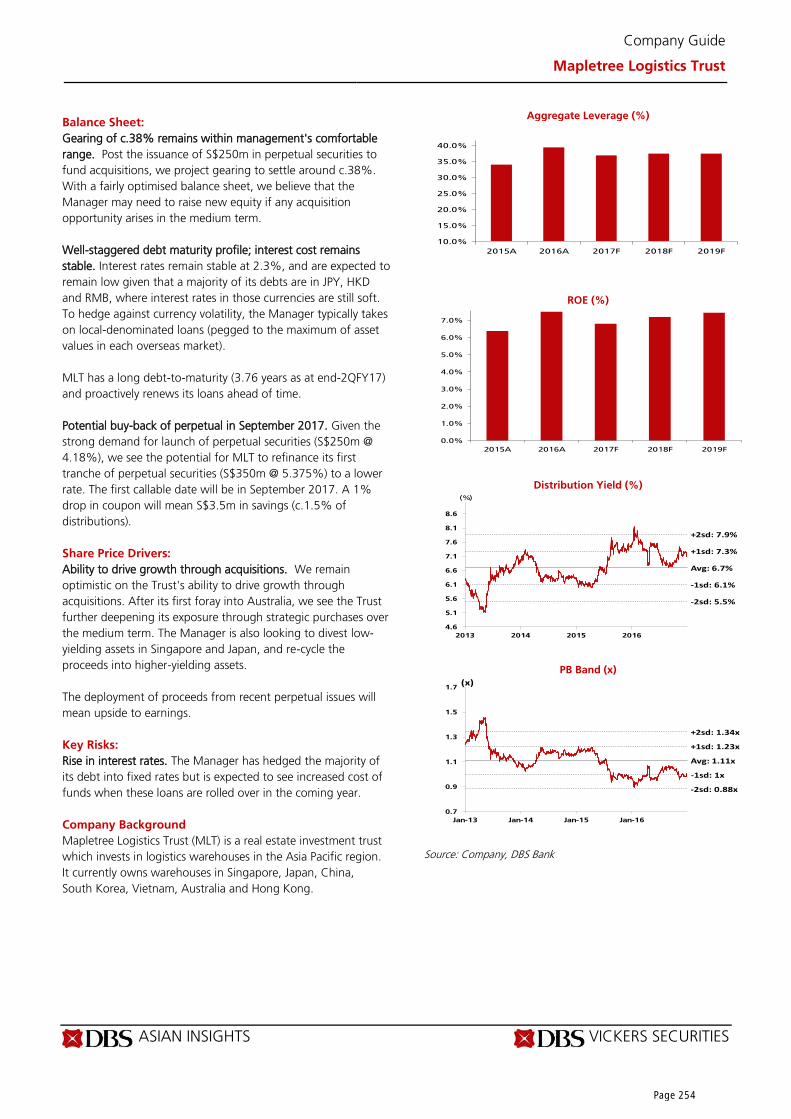
ASIAN INSIGHTS VICKERS SECURITIES
Page 3
Company Guide
Mapletree Logistics Trust
Balance Sheet:
Gearing of c.38% remains within management's comfortable
range. Post the issuance of S$250m in perpetual securities to
fund acquisitions, we project gearing to settle around c.38%.
With a fairly optimised balance sheet, we believe that the
Manager may need to raise new equity if any acquisition
opportunity arises in the medium term.
Well-staggered debt maturity profile; interest cost remains
stable. Interest rates remain stable at 2.3%, and are expected to
remain low given that a majority of its debts are in JPY, HKD
and RMB, where interest rates in those currencies are still soft.
To hedge against currency volatility, the Manager typically takes
on local-denominated loans (pegged to the maximum of asset
values in each overseas market).
MLT has a long debt-to-maturity (3.76 years as at end-2QFY17)
and proactively renews its loans ahead of time.
Potential buy-back of perpetual in September 2017. Given the
strong demand for launch of perpetual securities (S$250m @
4.18%), we see the potential for MLT to refinance its first
tranche of perpetual securities (S$350m @ 5.375%) to a lower
rate. The first callable date will be in September 2017. A 1%
drop in coupon will mean S$3.5m in savings (c.1.5% of
distributions).
Share Price Drivers:
Ability to drive growth through acquisitions. We remain
optimistic on the Trust's ability to drive growth through
acquisitions. After its first foray into Australia, we see the Trust
further deepening its exposure through strategic purchases over
the medium term. The Manager is also looking to divest low-
yielding assets in Singapore and Japan, and re-cycle the
proceeds into higher-yielding assets.
The deployment of proceeds from recent perpetual issues will
mean upside to earnings.
Key Risks:
Rise in interest rates. The Manager has hedged the majority of
its debt into fixed rates but is expected to see increased cost of
funds when these loans are rolled over in the coming year.
Company Background
Mapletree Logistics Trust (MLT) is a real estate investment trust
which invests in logistics warehouses in the Asia Pacific region.
It currently owns warehouses in Singapore, Japan, China,
South Korea, Vietnam, Australia and Hong Kong.
Aggregate Leverage (%)
ROE (%)
Distribution Yield (%)
PB Band (x)
Source: Company, DBS Bank
10.0%
15.0%
20.0%
25.0%
30.0%
35.0%
40.0%
2015A 2016A 2017F 2018F 2019F
0.0%
1.0%
2.0%
3.0%
4.0%
5.0%
6.0%
7.0%
2015A 2016A 2017F 2018F 2019F
Avg: 6.7%
+1sd: 7.3%
+2sd: 7.9%
-1sd: 6.1%
-2sd: 5.5%
4.6
5.1
5.6
6.1
6.6
7.1
7.6
8.1
8.6
2013 2014 2015 2016
(%)
Avg: 1.11x
+1sd: 1.23x
+2sd: 1.34x
-1sd: 1x
-2sd: 0.88x
0.7
0.9
1.1
1.3
1.5
1.7
Jan-13 Jan-14 Jan-15 Jan-16
(x)
Page 254

ASIAN INSIGHTS VICKERS SECURITIES
Page 4
Company Guide
Mapletree Logistics Trust
Income Statement (S$m)
FY Mar 2015A 2016A 2017F 2018F 2019F
Gross revenue 330 350 360 375 390
Property expenses (52.7) (59.0) (60.8) (58.9) (62.1)
Net Property Income 277 291 299 316 327
Other Operating expenses (24.3) (56.9) (43.5) (43.0) (43.2)
Other Non Opg (Exp)/Inc (15.4) 34.0 0.0 0.0 0.0
Net Interest (Exp)/Inc (32.3) (43.4) (41.5) (46.0) (50.6)
Exceptional Gain/(Loss) 0.0 10.8 0.0 0.0 0.0
Net Income 205 235 214 227 234
Tax (29.1) (25.8) (15.0) (15.9) (16.4)
Minority Interest (0.5) (0.5) (0.5) (0.5) (0.5)
Preference Dividend (18.8) (18.9) (26.7) (29.3) (29.3)
Net Income After Tax 157 190 172 182 187
Total Return 241 190 172 182 187
Non-tax deductible Items (56.1) (6.9) 2.00 1.00 1.00
Net Inc available for Dist. 185 183 179 185 188
Growth & Ratio
Revenue Gth (%) 6.2 6.0 2.9 4.2 3.8
N Property Inc Gth (%) 3.7 4.8 2.9 5.7 3.5
Net Inc Gth (%) (16.2) 21.1 (9.5) 5.5 3.3
Dist. Payout Ratio (%) 100.0 100.0 100.0 100.0 100.0
Net Prop Inc Margins (%) 84.0 83.1 83.1 84.3 84.0
Net Income Margins (%) 47.6 54.4 47.8 48.4 48.1
Dist to revenue (%) 56.0 52.4 49.8 49.2 48.4
Managers & Trustee’s fees to sales %)
7.4 16.3 12.1 11.5 11.1
ROAE (%) 6.4 7.5 6.8 7.2 7.4
ROA (%) 3.4 3.8 3.3 3.4 3.5
ROCE (%) 4.9 4.3 4.6 4.9 5.0
Int. Cover (x) 7.8 5.4 6.2 5.9 5.6
Source: Company, DBS Bank
Growth driven mainly from acquisitions as organic growth remains modest
Page 255

ASIAN INSIGHTS VICKERS SECURITIES
Page 5
Company Guide
Mapletree Logistics Trust
Quarterly / Interim Income Statement (S$m)
FY Mar 2Q2016 3Q2016 4Q2016 1Q2017 2Q2017
Gross revenue 87.5 88.9 88.5 89.6 91.6
Property expenses (14.5) (14.8) (15.8) (14.4) (14.8)
Net Property Income 73.0 74.2 72.6 75.2 76.8
Other Operating expenses (19.2) (13.0) (18.1) (15.5) (19.0)
Other Non Opg (Exp)/Inc (1.5) 3.44 (5.0) (17.2) (9.2)
Net Interest (Exp)/Inc (10.0) (12.0) (12.1) (11.6) (11.4)
Exceptional Gain/(Loss) 0.0 0.0 0.0 0.0 0.0
Net Income 42.3 52.6 37.4 30.9 37.2
Tax (4.5) (6.0) (11.8) (3.5) (4.8)
Minority Interest (0.1) (0.2) (0.1) (0.2) (0.2)
Net Income after Tax 32.9 41.7 20.9 21.5 24.8
Total Return 32.9 49.1 57.2 21.5 24.8
Non-tax deductible Items 13.2 (2.6) (12.4) 24.6 21.8
Net Inc available for Dist. 46.2 46.5 44.8 46.0 46.6
Growth & Ratio
Revenue Gth (%) 3 2 (1) 1 2
N Property Inc Gth (%) 3 2 (2) 4 2
Net Inc Gth (%) (35) 27 (50) 3 15
Net Prop Inc Margin (%) 83.4 83.4 82.1 84.0 83.9
Dist. Payout Ratio (%) 100.0 100.0 100.0 100.0 100.0
Balance Sheet (S$m)
FY Mar 2015A 2016A 2017F 2018F 2019F Investment Properties 4,631 5,070 5,311 5,355 5,359
Other LT Assets 12.4 14.8 14.8 14.8 14.8
Cash & ST Invts 107 93.3 3.83 6.89 11.3
Inventory 0.0 0.0 0.0 0.0 0.0
Debtors 20.5 18.2 9.00 9.38 9.74
Other Current Assets 16.7 11.5 11.5 11.5 11.5
Total Assets 4,788 5,207 5,350 5,397 5,406
ST Debt
56.7 234 234 234 234
Creditor 164 154 120 125 130
Other Current Liab 8.84 6.36 16.2 17.1 17.5
LT Debt 1,575 1,824 1,747 1,791 1,795
Other LT Liabilities 94.6 111 111 111 111
Unit holders’ funds 2,882 2,872 3,115 3,112 3,111
Minority Interests 6.04 6.03 6.53 7.02 7.52
Total Funds & Liabilities 4,788 5,207 5,350 5,397 5,406
Non-Cash Wkg. Capital (136) (130) (116) (121) (126)
Net Cash/(Debt) (1,525) (1,965) (1,978) (2,018) (2,018)
Ratio
Current Ratio (x) 0.6 0.3 0.1 0.1 0.1
Quick Ratio (x) 0.6 0.3 0.0 0.0 0.1
Aggregate Leverage (%) 34.1 39.5 37.0 37.5 37.5
Z-Score (X) 1.0 0.8 0.8 0.8 0.8
Source: Company, DBS Bank
Gearing remains stable
Page 256

ASIAN INSIGHTS VICKERS SECURITIES
Page 6
Company Guide
Mapletree Logistics Trust
Cash Flow Statement (S$m)
FY Mar 2015A 2016A 2017F 2018F 2019F
Pre-Tax Income 205 235 214 227 234
Dep. & Amort. 0.0 0.0 0.0 0.0 0.0
Tax Paid (3.9) (3.7) (5.2) (15.0) (15.9)
Associates &JV Inc/(Loss) 0.0 0.0 0.0 0.0 0.0
Chg in Wkg.Cap. (0.8) (7.0) (24.5) 4.65 4.45
Other Operating CF 35.5 6.28 0.0 0.0 0.0
Net Operating CF 236 231 185 217 222
Net Invt in Properties (247) (389) (242) (43.8) (3.9)
Other Invts (net) 0.0 0.0 0.0 0.0 0.0
Invts in Assoc. & JV 0.0 0.0 0.0 0.0 0.0
Div from Assoc. & JVs 0.0 0.0 0.0 0.0 0.0
Other Investing CF 0.82 (0.6) 0.0 0.0 0.0
Net Investing CF (246) (390) (242) (43.8) (3.9)
Distribution Paid (177) (183) (179) (185) (188)
Chg in Gross Debt 207 426 (76.8) 43.8 3.90
New units issued 0.0 17.9 0.0 0.0 0.0
Other Financing CF (29.9) (18.9) 223 (29.3) (29.3)
Net Financing CF 0.08 242 (32.5) (170) (214)
Currency Adjustments 2.78 0.0 0.0 0.0 0.0
Chg in Cash (7.4) 83.3 (89.5) 3.06 4.39
Operating CFPS (S cts) 9.63 9.59 8.40 8.52 8.74
Free CFPS (S cts) (0.5) (6.4) (2.3) 6.95 8.76
Source: Company, DBS Bank
Target Price & Ratings History
Source: DBS Bank
Analyst: Derek TAN
Singapore Research Team
Mervin SONG CFA
S.No.Date of
Report
Closing
Price
12-mth
Target
Price
Rat ing
1: 08 Jan 16 0.99 1.15 BUY
2: 04 Feb 16 0.94 1.15 BUY
3: 03 May 16 1.05 1.10 HOLD
4: 31 May 16 0.98 1.10 HOLD
5: 27 Jul 16 1.08 1.15 BUY
6: 22 Aug 16 1.08 1.15 BUY
7: 26 Oct 16 1.06 1.15 BUY
Note : Share price and Target price are adjusted for corporate actions.
1 2
3
4
5
6
7
0.86
0.91
0.96
1.01
1.06
1.11
Jan-16 May-16 Sep-16 Jan-17
S$
Page 257

ASIAN INSIGHTS VICKERS SECURITIES ed: JS / sa: YM, PY
HOLD Last Traded Price ( 4 Jan 2017): S$0.70 (STI : 2,921.31)
Price Target 12-mth: S$0.74 (6% upside and 7.5% yield)
Potential Catalyst: Better than expected results
Where we differ: In line with consensus Analyst Mervin SONG CFA +65 6682 3715 [email protected] Derek TAN +65 6682 3716 [email protected]
Price Relative
Forecasts and Valuation FY Dec (S$m) 2015A 2016F 2017F 2018F
Gross Revenue 101 177 178 177 Net Property Inc 75.6 137 138 137 Total Return 79.2 43.0 42.2 39.8 Distribution Inc 56.1 69.0 68.3 65.9 EPU (S cts) 5.09 3.31 3.23 3.02 EPU Gth (%) nm (35) (3) (7) DPU (S cts) 4.38 5.30 5.22 4.99 DPU Gth (%) (8) 21 (2) (4) NAV per shr (S cts) 94.6 93.6 92.7 91.9 PE (X) 13.7 21.0 21.5 23.1 Distribution Yield (%) 6.3 7.6 7.5 7.2 P/NAV (x) 0.7 0.7 0.7 0.8 Aggregate Leverage (%) 37.5 37.5 37.5 37.6 ROAE (%) 5.2 3.5 3.4 3.2 Distn. Inc Chng (%): 0 0 0 Consensus DPU (S cts): 5.1 5.2 5.2 Other Broker Recs: B: 1 S: 0 H: 3
Source of all data on this page: Company, DBS Bank, Bloomberg Finance L.P.
Concerns to weigh on share price Impediments to re-rating. We maintain our HOLD call for OUE Commercial REIT (OUECT) and a TP of S$0.74. While we see long term value in OUECT as it trades at over 20% discount to its book value and offers >7% yield, we believe the stock will be range bound near term, due to its above-average gearing (around 41%), relatively small capitalisation and fears over falling office rents ahead of new office supply in 2017. Uplift from One Raffles Place (ORP). With an income support arrangement providing income stability to OUE Bayfront, contributing a third of net property income (NPI) till 2018, earnings upside would come from driving a better performance at ORP. With initial yield estimated at 3.4%, the Manager is actively seeking to push occupancy rates closer to c.95% from c.91% currently. Earnings risk possible in FY17. As OUECT’s proactive forward renewals have reduced the number of leases expiring in FY16, the greatest earnings risk for OUECT is in FY17. There are approximately 16% of leases by net lettable area (NLA) at OUE Bayfront and 26% at ORP that are up for renewal in FY17. The risk of negative rental reversions arises as rents for these leases were signed during the better times in FY14/15. The potential magnitude of falling rents is still uncertain as it is unclear how aggressive the management of the new office buildings will be in discounting rental rates. Valuation:
We maintain our DCF-based TP of S$0.74.
Key Risks to Our View:
The key risk to our view is a greater-than-expected fall in spot
Grade A office rents to below S$7 per square foot per month
(psf/mth). At A Glance Issued Capital (m shrs) 1,298
Mkt. Cap (S$m/US$m) 902 / 622
Major Shareholders (%)
OUE Realty Pte Ltd 65.1
Tong Gordon 5.9
Free Float (%) 29.0
3m Avg. Daily Val (US$m) 0.07
ICB Industry : Financials / Real Estate Investment Trusts
DBS Group Research . Equity
4 Jan 2017
Singapore Company Guide
OUE Commercial REIT Version 6 | Bloomberg: OUECT SP | Reuters: OUEC.SI Refer to important disclosures at the end of this report
Page 258

ASIAN INSIGHTS VICKERS SECURITIES
Page 2
Company Guide
OUE Commercial REIT
CRITICAL DATA POINTS TO WATCH
Earnings Drivers:
Prime office assets in the Central Business District (CBD). OUE
Commercial Trust (OUECT) comprises three Grade A commercial
assets – OUE Bayfront Property and One Raffles Place (ORP) in
downtown Central Business District in Singapore, and Lippo
Plaza Property in Shanghai, China. The REIT’s total asset under
management (AUM) is S$3.4bn, where Singapore contributes
close to c.84% of the value.
Better earnings diversity from the acquisition of a quality asset.
The acquisition of ORP (completed in October 2015) was a
significant milestone for OUECT as the acquisition more than
doubled OUECT’s Singapore NLA (to c.1m sqft from c.400k
presently) and portfolio size. From an operational standpoint,
we see increased flexibility for the property manager to cross-
sell and expand its addressable tenant base, as ORP is a
different office product when compared to OUE Bayfront. This
will thus improve its product offerings to existing and
prospective tenants, as well as result in a higher portfolio
retention rate.
Immediate earnings uplift from ORP to drive earnings growth
through operational optimisation. OUECT's acquisition of the
c.68% beneficial interest in ORP at an average valuation of
S$2,382 psf is attractive in our view. While initial yield is
estimated to be c.3.4%, the Manager has continued to deliver
operationally, through optimising occupancy and rents since
taking over.
Earnings visibility through Sponsor’s income support for OUE
Bayfront till 2018. OUE Bayfront is under an income support
arrangement, whereby the Sponsor has undertaken to top up
any revenue shortfall below S$14.25m per quarter (or S$57m a
year) for a period of five years, up to a maximum sum of
S$50m. This provides earnings visibility and downside protection
amid potential supply-induced market volatility in 2016-17.
With OUECT outperforming its initial estimates and thus
drawing less from the annual income support amount, this
demonstrates the Manager’s flexibility in leasing arrangements
in order to maintain a steady earnings profile going forward.
Net Property Income and Margins (%)
Net Property Income and Margins (%)
Distribution Paid / Net Operating CF
Interest Cover (x)
Source: Company, DBS Bank
Page 259

ASIAN INSIGHTS VICKERS SECURITIES
Page 3
Company Guide
OUE Commercial REIT
Balance Sheet:
Gearing remains high compared to peers. At c.41% post
acquisition of ORP, OUECT has one of the highest gearing levels
among S-REIT peers, which average in the mid-30’s.
Long debt tenure minimises refinancing risk. OUECT’s weighted
average debt-to-expiry was 1.8 years in 3Q16, with c.78% of
debt hedged into fixed rates for 2.7 years. The REIT will have no
debt expiring until FY17, reducing near-term refinancing risk.
Share Price Drivers:
Lower gearing level will partly allay concerns. We believe that
the recent lacklustre share price performance could be due to
OUECT’s higher gearing versus the S-REITs’ average of c.35%.
Given a deteriorating office outlook, investors are concerned
that OUECT may need to raise further equity to shore up its
balance sheet in the event of deterioration in office values,
resulting in the REIT breaching the 45% gearing limit.
Rebound in operational results. The office market is on a
downtrend, in our view, given looming supply in the midst of
weak demand for space. While OUECT has still been able to
achieve positive rental reversions for 9M16, we believe this will
moderate with risk of negative reversions ahead.
Key Risks:
Concentration risk. While the acquisition of ORP will diversify
asset-specific risks, OUECT is still heavily exposed to
Singapore’s CBD office market via ORP and OUE Bayfront,
which account for >80% of earnings. Any downturn or
weakness in the Singapore office market could have a
significant negative impact on ORP, and the REIT.
Decline in office rents. Given the expected increase in office
supply over the next two years, there is risk that office rents
could fall beyond our expectations, causing OUECT to miss our
DPU estimates.
Interest rate risk. A rise in interest rate will have a negative
impact on distributions. However, the Manager is actively
overseeing its exposure through forward hedges and has
c.78% of its interest cost hedged into fixed rates with a fairly
long duration of 2.7 years.
Company Background
OUE Commercial REIT (OUECT) is an office REIT with a
portfolio of office assets located in prime CBD locations in
Singapore and China.
Aggregate Leverage (%)
ROE (%)
Distribution Yield (%)
PB Band (x)
Source: Company, DBS Bank
Page 260

ASIAN INSIGHTS VICKERS SECURITIES
Page 4
Company Guide
OUE Commercial REIT
Income Statement (S$m)
FY Dec 2015A 2016F 2017F 2018F
Gross revenue 101 177 178 177
Property expenses (25.4) (39.9) (40.3) (39.9)
Net Property Income 75.6 137 138 137
Other Operating expenses (12.5) (18.4) (17.1) (15.7)
Other Non Opg (Exp)/Inc 0.0 0.0 0.0 0.0
Net Interest (Exp)/Inc (26.0) (54.8) (57.5) (60.3)
Exceptional Gain/(Loss) 32.1 0.0 0.0 0.0
Net Income 69.3 63.7 63.5 61.0
Tax (10.4) (13.4) (13.9) (13.9)
Minority Interest (1.5) (7.3) (7.3) (7.3)
Preference Dividend 0.0 0.0 0.0 0.0
Net Income After Tax 57.4 43.0 42.2 39.8
Total Return 79.2 43.0 42.2 39.8
Non-tax deductible Items (21.8) 31.3 31.4 31.4
Net Inc available for Dist. 56.1 69.0 68.3 65.9
Growth & Ratio
Revenue Gth (%) 41.2 75.0 0.8 (0.8)
N Property Inc Gth (%) 40.5 81.0 0.8 (0.8)
Net Inc Gth (%) nm (25.1) (1.7) (5.7)
Dist. Payout Ratio (%) 100.0 100.0 100.0 100.0
Net Prop Inc Margins (%) 74.9 77.4 77.4 77.4
Net Income Margins (%) 56.8 24.3 23.7 22.5
Dist to revenue (%) 55.5 39.0 38.3 37.3
Managers & Trustee’s fees to sales %)
12.3 10.4 9.6 8.9
ROAE (%) 5.2 3.5 3.4 3.2
ROA (%) 2.2 1.2 1.2 1.1
ROCE (%) 2.1 2.7 2.8 2.7
Int. Cover (x) 2.4 2.2 2.1 2.0
Source: Company, DBS Bank
Driven mainly by better performance at Lippo Plaza, offsetting weakness in Singapore
Page 261

ASIAN INSIGHTS VICKERS SECURITIES
Page 5
Company Guide
OUE Commercial REIT
Quarterly / Interim Income Statement (S$m)
FY Dec 3Q2015 4Q2015 1Q2016 2Q2016 3Q2016
Gross revenue 20.6 40.3 42.9 45.7 44.2
Property expenses (5.1) (10.7) (9.7) (10.5) (8.9)
Net Property Income 15.6 29.7 33.3 35.2 35.3
Other Operating expenses 0.03 (9.3) (3.5) (4.4) (4.1)
Other Non Opg (Exp)/Inc 0.28 30.6 (0.4) (0.3) 0.01
Net Interest (Exp)/Inc (5.5) (11.4) (13.7) (13.8) (14.2)
Exceptional Gain/(Loss) 0.0 21.8 0.0 0.0 0.0
Net Income 10.4 61.4 15.7 16.8 17.1
Tax (1.3) (6.5) (3.9) (4.5) (4.4)
Minority Interest 0.0 0.0 0.0 0.0 0.0
Net Income after Tax 9.13 55.0 11.8 12.4 12.7
Total Return 8.04 53.5 9.97 10.7 11.0
Non-tax deductible Items 5.05 (34.6) 8.44 8.45 7.58
Net Inc available for Dist. 13.1 17.6 17.0 17.7 17.2
Growth & Ratio
Revenue Gth (%) 5 96 6 6 (3)
N Property Inc Gth (%) 6 91 12 6 0
Net Inc Gth (%) (3) 502 (79) 5 3
Net Prop Inc Margin (%) 75.5 73.6 77.5 77.1 80.0
Dist. Payout Ratio (%) 100.0 100.0 100.0 100.0 100.0
Balance Sheet (S$m)
FY Dec 2015A 2016F 2017F 2018F Investment Properties 3,403 3,408 3,414 3,419
Other LT Assets 21.4 21.4 21.4 21.4
Cash & ST Invts 25.9 48.8 56.5 63.3
Inventory 0.0 0.0 0.0 0.0
Debtors 13.6 12.3 12.4 12.3
Other Current Assets 0.03 0.03 0.03 0.03
Total Assets 3,464 3,491 3,504 3,516
ST Debt
1.73 1.73 1.73 1.73
Creditor 54.1 68.2 68.8 68.2
Other Current Liab 11.0 11.0 11.0 11.0
LT Debt 1,302 1,307 1,313 1,318
Other LT Liabilities 99.9 99.9 99.9 99.9
Unit holders’ funds 1,762 1,762 1,762 1,762
Minority Interests 233 240 248 255
Total Funds & Liabilities 3,464 3,491 3,504 3,516
Non-Cash Wkg. Capital (51.4) (66.9) (67.3) (66.9)
Net Cash/(Debt) (1,278) (1,260) (1,258) (1,257)
Ratio
Current Ratio (x) 0.6 0.8 0.8 0.9
Quick Ratio (x) 0.6 0.8 0.8 0.9
Aggregate Leverage (%) 37.5 37.5 37.5 37.6
Source: Company, DBS Bank
Page 262

ASIAN INSIGHTS VICKERS SECURITIES
Page 6
Company Guide
OUE Commercial REIT
Cash Flow Statement (S$m)
FY Dec 2015A 2016F 2017F 2018F
Pre-Tax Income 69.3 63.7 63.5 61.0
Dep. & Amort. 4.24 0.0 0.0 0.0
Tax Paid (1.6) (13.4) (13.9) (13.9)
Associates &JV Inc/(Loss) 0.0 0.0 0.0 0.0
Chg in Wkg.Cap. (3.4) 15.5 0.45 (0.5)
Other Operating CF 9.00 31.3 31.4 31.4
Net Operating CF 77.6 97.1 81.3 78.0
Net Invt in Properties (594) (5.3) (5.4) (5.3)
Other Invts (net) 0.0 0.0 0.0 0.0
Invts in Assoc. & JV 0.0 0.0 0.0 0.0
Div from Assoc. & JVs 0.0 0.0 0.0 0.0
Other Investing CF (1.2) 0.0 0.0 0.0
Net Investing CF (595) (5.3) (5.4) (5.3)
Distribution Paid (50.2) (69.0) (68.3) (65.9)
Chg in Gross Debt 363 5.31 5.35 5.30
New units issued 212 0.0 0.0 0.0
Other Financing CF (12.6) (5.3) (5.3) (5.3)
Net Financing CF 512 (69.0) (68.2) (65.9)
Currency Adjustments 2.50 0.0 0.0 0.0
Chg in Cash (2.8) 22.8 7.78 6.81
Operating CFPS (S cts) 7.18 6.30 6.18 5.94
Free CFPS (S cts) (45.8) 7.08 5.81 5.50
Source: Company, DBS Bank
Target Price & Ratings History
Source: DBS Bank
Analyst: Mervin SONG CFA
Derek TAN
Page 263

ASIAN INSIGHTS VICKERS SECURITIES ed: JS / sa: YM, PY
BUY Last Traded Price ( 4 Jan 2017): S$0.69 (STI : 2,921.31)
Price Target 12-mth: S$0.72 (5% upside and 6.6% yield)
Potential Catalyst: Acquisitions and better than expected results
Where we differ: Below consensus on expectations of recovery in the
Singapore hospitality market in 2018
Analyst Mervin SONG CFA +65 6682 3715 [email protected] Derek TAN +65 6682 3716 [email protected]
Price Relative
Forecasts and Valuation FY Dec (S$m) 2015A 2016F 2017F 2018F
Gross Revenue 125 116 120 125 Net Property Inc 109 101 105 109 Total Return 77.7 62.5 67.8 69.6 Distribution Inc 87.4 77.2 81.6 83.7 EPU (S cts) 5.21 3.86 3.76 3.84 EPU Gth (%) (6) (26) (2) 2 DPU (S cts) 6.07 4.30 4.52 4.60 DPU Gth (%) (3) (29) 5 2 NAV per shr (S cts) 83.6 80.1 79.4 78.7 PE (X) 13.2 17.8 18.2 17.8 Distribution Yield (%) 8.9 6.3 6.6 6.7 P/NAV (x) 0.8 0.9 0.9 0.9 Aggregate Leverage (%) 41.8 37.6 37.7 37.7 ROAE (%) 6.2 4.7 4.7 4.9 Distn. Inc Chng (%): (1) 0 - Consensus DPU (S cts): 44.5 5.0 5.2 Other Broker Recs: B: 3 S: 0 H: 4
Source of all data on this page: Company, DBS Bank, Bloomberg Finance L.P.
Keep the faith Boost from timely acquisition. We reiterate our BUY call with a TP of S$0.72. While we now expect the recovery in the Singapore hospitality market to only occur in 2018 from 2017, OUE Hospitality Trust (OUEHT) is one of the best-positioned hospitality REITs to ride out near term headwinds. In fact, through the rebasing of its DPU in FY16 and its timely acquisition of Crown Plaza Changi Airport extension (CPEX) OUEHT should still deliver healthy 5% growth in DPU in 2017. Multiple levers to pull to drive earnings in 2017. We expect Mandarin Orchard Singapore (MOS) to report a 4% decline in revenue per available room (RevPAR) in FY17 versus 0% growth previously. However, we believe DPU growth is still achievable in 2017. This is underpinned by full year contribution of CPEX, draw down of S$7.5m income support for CPEX, as well as the increased contribution from Mandarin Gallery following the opening of the Michael Kors and Victoria Secret stores in 2H16. Removal of overhang. OUEHT’s share price corrected over the past year due to the overhang from (1) potential capital raising to fund the acquisition of CPEX, and (2) gearing that was over 40%. However, these concerns have now been addressed, following the recent rights issue which resulted in OUEHT’s gearing falling to c.37%. Valuation:
We maintain our DCF-based TP of S$0.72 which has
incorporated delayed expectations for a recovery in the
Singapore hospitality market from 2017 to 2018.
Key Risks to Our View:
Competitive landscape. The key risk to our view is a weaker-
than-expected outlook for the Singapore hospitality market. In
addition, rents at Mandarin Gallery may fall below
expectations if there is a significant deterioration in the
Singapore retail scene. At A Glance Issued Capital (m shrs) 1,790
Mkt. Cap (S$m/US$m) 1,226 / 852
Major Shareholders (%)
OUE Realty Ptd Ltd 40.0
Free Float (%) 60.0
3m Avg. Daily Val (US$m) 0.43
ICB Industry : Real Estate / Real Estate Investment Trusts
DBS Group Research . Equity
4 Jan 2017
Singapore Company Guide
OUE Hospitality Trust Version 6 | Bloomberg: OUEHT SP | Reuters: OUER.SI Refer to important disclosures at the end of this report
75
95
115
135
155
175
195
215
0.6
0.7
0.7
0.8
0.8
0.9
0.9
1.0
1.0
Aug-13 Aug-14 Aug-15 Aug-16
Relative IndexS$
OUE Hospitality Trust (LHS) Relative STI (RHS)
Page 264

ASIAN INSIGHTS VICKERS SECURITIES
Page 2
Company Guide
OUE Hospitality Trust
CRITICAL DATA POINTS TO WATCH
Earnings Drivers:
Increased contribution from Crowne Plaza Changi Airport. The
main earnings driver for OUEHT over the coming year is the
increased contribution from the acquisition of the Crown Plaza
Changi Airport extension (CPEX) in August 2016 which will add
another 243 rooms to the 320-room Crowne Plaza Changi
Airport (CPCA) acquired on 30 January 2015. The enlarged
CPCA caters to transit passengers as well as visitors to the
Singapore Expo and businesses at Changi Business Park. The
property offers OUEHT exposure to a submarket that has limited
competition, and is a diversification away from Mandarin
Orchard which is more focused on the tourism market. While
underlying contribution from CPEX is likely to be lower than
originally anticipated, this is mitigated by S$7.5m worth of
income support that OUEHT is available for draw down over
three years.
Stability from fixed rentals. Besides having a more diversified
portfolio following the acquisitions of CPCA and CPEX, a
significant proportion of OUEHT’s earnings is stable and visible.
This arises from minimum S$45m rental from its Sponsor for
Mandarin Orchard, and S$22.5m from Crown Plaza Changi
Airport.
Recovery at Mandarin Gallery. In 2016, Mandarin Gallery Mall
suffered from a dip in occupancies, negative rental reversions
and fit out period associated with the new Michael Kors and
Victoria Secret stores. Nevertheless, earnings from the property
should recover in 2016, as occupancies have since recovered
and the retail mall will no longer contend with the loss of
income from the fit out period for Michael Kors and Victoria
Secret.
Short-term headwinds at Mandarin Orchard but supply
constrained in the medium term. OUEHT’s Mandarin Orchard
(MOS) hotel faces some short-term headwinds due to the 5-6%
p.a. growth in new hotel rooms in 2016 and 2017 as well as
weak corporate demand. This is likely to result in a decline in
RevPAR for MOS. Nevertheless, with the Singapore government
not releasing any new hotel sites for development over the last
two years constraining supply in the medium term, and supply
only projected to only increase by 0.3% in 2018, we expect a
recovery for MOS and the Singapore hospitality market in a
couple of years’ time.
Expansion through acquisitions. Over the medium term, we
expect OUEHT to make DPU-accretive acquisitions to expand its
portfolio of properties. Its sponsor, OUE Limited, owns service
residences at OUE Downtown and a 30% stake in Marina
Mandarin, which are potential acquisition targets for OUEHT. In
addition, we understand the REIT is exploring acquisition
opportunities in Europe, Japan and the US.
Net Property Income and Margins (%)
Net Property Income and Margins (%)
Distribution Paid / Net Operating CF
Interest Cover (x)
Source: Company, DBS Bank
82.7%
84.7%
86.7%
88.7%
90.7%
92.7%
94.7%
96.7%
0
20
40
60
80
100
120
140
160
180
200
2014A 2015A 2016F 2017F 2018F
S$ m
Net Property Income Net Property Income Margin %
85%
85%
86%
86%
87%
87%
88%
88%
89%
89%
90%
22
23
24
25
26
27
28
29
30
2Q20
14
3Q20
14
4Q20
14
1Q20
15
2Q20
15
3Q20
15
4Q20
15
1Q20
16
2Q20
16
3Q20
16
Net Property Income Net Property Income Margin %
0.3
0.4
0.5
0.6
0.7
0.8
0.9
1.0
1.1
1.2
2014A 2015A 2016F 2017F 2018F
(x)
0.00
1.00
2.00
3.00
4.00
5.00
6.00
7.00
8.00
2014A 2015A 2016F 2017F 2018F
(x)
Page 265

ASIAN INSIGHTS VICKERS SECURITIES
Page 3
Company Guide
OUE Hospitality Trust
Balance Sheet:
Equity raising to fund acquisition. Following the recent S$239m
rights issue (441.9m units at S$0.54 per unit) and acquisition of
Crown Plaza Changi Airport extension, OUEHT’s gearing has
settled around the 37% level.
Share Price Drivers:
Delivery of DPU. OUEHT’s share price corrected over the past
year due to the overhang from (1) the potential capital raising
to fund the acquisition of CPEX, (2) gearing that was over 40%
and (3) weakness in the overall Singapore hospitality market.
While the Singapore market is likely to remain weak, having
taken the dilution associated with the rights issue and suffered
lower occupancies and earnings at Mandarin Gallery to secure
Michael Kors and Victoria Secret as tenants in 2016, OUEHT is
poised to deliver DPU growth on the back of the acquisition of
CPEX as well as full contribution from new stores at Mandarin
Gallery. We believe the delivery of an increase in DPU in 2017,
will re-rate OUEHT ahead of a potential recovery in the
Singapore hospitality market in 2018.
Influx of tourists and lack of new supply. The performance of
hospitality REITs is correlated to the growth in tourist arrivals
and hotel supply. Should Singapore receive an influx of tourists,
sentiment towards OUEHT’s stock price will improve. In
addition, with no hotel sites being released by the government
over the last two years, this will constrain supply in the medium
term which should increase OUEHT’s scarcity value over time.
Key Risks:
Interest rate risk. Any increase in interest rates will result in
higher interest payments that the REIT has to make annually to
service its loan. This reduces the income available for
distribution, which will result in lower DPU for unitholders. We
understand c.90% of the group’s borrowings are on fixed
rates.
Competitive landscape. The Singapore hospitality market has
been impacted by a decline in tourist arrivals this year. Any
further deterioration in demand would pose a downside risk to
our earnings estimates.
Company Background
OUE H-Trust is a Singapore-based REIT, with the principal
investment strategy of investing, directly or indirectly, in a
portfolio of income-producing hospitality assets.
Aggregate Leverage (%)
ROE (%)
Distribution Yield (%)
PB Band (x)
Source: Company, DBS Bank
10.0%
15.0%
20.0%
25.0%
30.0%
35.0%
40.0%
2014A 2015A 2016F 2017F 2018F
0.0%
1.0%
2.0%
3.0%
4.0%
5.0%
6.0%
2014A 2015A 2016F 2017F 2018F
Avg: 5.2%
+1sd: 8.3%
+2sd: 11.5%
-1sd: 2%
-1.0
1.0
3.0
5.0
7.0
9.0
11.0
2013 2014 2015 2016 2017
(%)
Avg: 0.93x
+1sd: 1.01x
+2sd: 1.1x
-1sd: 0.84x
-2sd: 0.76x
0.6
0.7
0.8
0.9
1.0
1.1
1.2
1.3
Dec-13 Dec-14 Dec-15 Dec-16
(x)
Page 266

ASIAN INSIGHTS VICKERS SECURITIES
Page 4
Company Guide
OUE Hospitality Trust
Income Statement (S$m)
FY Dec 2014A 2015A 2016F 2017F 2018F
Gross revenue 116 125 116 120 125
Property expenses (12.7) (15.5) (15.0) (15.3) (15.8)
Net Property Income 103 109 101 105 109
Other Operating expenses (11.1) (12.1) (13.4) (10.1) (10.2)
Other Non Opg (Exp)/Inc 0.0 0.0 0.0 0.0 0.0
Net Interest (Exp)/Inc (13.4) (22.2) (25.2) (27.3) (29.6)
Exceptional Gain/(Loss) 0.0 0.0 0.0 0.0 0.0
Net Income 78.7 74.8 62.5 67.8 69.6
Tax 0.0 0.0 0.0 0.0 0.0
Minority Interest 0.0 0.0 0.0 0.0 0.0
Preference Dividend 0.0 0.0 0.0 0.0 0.0
Net Income After Tax 78.7 74.8 62.5 67.8 69.6
Total Return 78.6 77.7 62.5 67.8 69.6
Non-tax deductible Items 10.4 9.64 14.7 13.9 14.0
Net Inc available for Dist. 89.0 87.4 77.2 81.6 83.7
Growth & Ratio
Revenue Gth (%) 128.8 7.5 (6.8) 3.7 4.0
N Property Inc Gth (%) 130.2 5.8 (7.3) 4.0 4.1
Net Inc Gth (%) 166.5 (5.0) (16.4) 8.4 2.7
Dist. Payout Ratio (%) 100.0 100.0 100.0 100.0 100.0
Net Prop Inc Margins (%) 89.0 87.6 87.1 87.3 87.4
Net Income Margins (%) 67.9 60.0 53.8 56.3 55.6
Dist to revenue (%) 76.8 70.1 66.5 67.8 66.8
Managers & Trustee’s fees to sales %)
9.6 9.7 11.6 8.4 8.2
ROAE (%) 6.5 6.2 4.7 4.7 4.9
ROA (%) 4.3 3.8 2.8 2.9 3.0
ROCE (%) 5.3 5.1 4.1 4.2 4.4
Int. Cover (x) 6.9 4.4 3.5 3.5 3.4
Source: Company, DBS Bank
Growth in distributable income largely due to the full year contribution from recently acquired Crown Plaza Changi extension as well as drawdown of S$7.5m worth of income support.
Page 267

ASIAN INSIGHTS VICKERS SECURITIES
Page 5
Company Guide
OUE Hospitality Trust
Quarterly / Interim Income Statement (S$m)
FY Dec 3Q2015 4Q2015 1Q2016 2Q2016 3Q2016
Gross revenue 32.7 33.0 30.1 26.9 33.3
Property expenses (3.9) (4.1) (3.9) (3.7) (3.9)
Net Property Income 28.8 28.8 26.3 23.2 29.4
Other Operating expenses (3.1) (3.0) (3.0) (2.9) (3.6)
Other Non Opg (Exp)/Inc 0.0 0.0 0.0 0.0 0.0
Net Interest (Exp)/Inc (5.7) (6.6) (6.5) (7.1) (5.8)
Exceptional Gain/(Loss) 0.0 0.0 0.0 0.0 0.0
Net Income 19.9 19.3 16.8 13.2 20.0
Tax 0.0 0.0 0.0 0.0 0.0
Minority Interest 0.0 0.0 0.0 0.0 0.0
Net Income after Tax 19.9 19.3 16.8 13.2 20.0
Total Return 19.9 22.2 16.8 13.2 19.0
Non-tax deductible Items 3.07 0.57 2.86 3.39 2.21
Net Inc available for Dist. 23.0 22.8 19.7 16.6 22.3
Growth & Ratio
Revenue Gth (%) 10 1 (9) (11) 24
N Property Inc Gth (%) 12 0 (9) (12) 27
Net Inc Gth (%) 17 (3) (13) (22) 52
Net Prop Inc Margin (%) 88.1 87.4 87.2 86.2 88.4
Dist. Payout Ratio (%) 100.0 100.0 100.0 100.0 100.0
Balance Sheet (S$m)
FY Dec 2014A 2015A 2016F 2017F 2018F Investment Properties 1,756 2,054 2,264 2,267 2,271
Other LT Assets 0.0 6.25 6.25 6.25 6.25
Cash & ST Invts 31.3 31.4 52.2 46.3 39.7
Inventory 0.0 0.0 0.0 0.0 0.0
Debtors 9.27 8.88 8.88 8.88 8.88
Other Current Assets 0.0 0.37 0.37 0.37 0.37
Total Assets 1,797 2,101 2,332 2,329 2,326
ST Debt
0.0 292 292 292 292
Creditor 7.19 11.4 11.4 11.4 11.4
Other Current Liab 2.58 2.01 2.01 2.01 2.01
LT Debt 583 585 585 585 585
Other LT Liabilities 5.36 3.25 3.25 3.25 3.25
Unit holders’ funds 1,198 1,207 1,438 1,435 1,432
Minority Interests 0.0 0.0 0.0 0.0 0.0
Total Funds & Liabilities 1,797 2,101 2,332 2,329 2,326
Non-Cash Wkg. Capital (0.5) (4.1) (4.1) (4.1) (4.1)
Net Cash/(Debt) (552) (846) (825) (831) (838)
Ratio
Current Ratio (x) 4.2 0.1 0.2 0.2 0.2
Quick Ratio (x) 4.2 0.1 0.2 0.2 0.2
Aggregate Leverage (%) 32.5 41.8 37.6 37.7 37.7
Z-Score (X) 1.2 0.7 0.8 0.8 0.8
Source: Company, DBS Bank
Decrease in gearing due to the recent S$239m rights issue
Page 268

ASIAN INSIGHTS VICKERS SECURITIES
Page 6
Company Guide
OUE Hospitality Trust
Cash Flow Statement (S$m)
FY Dec 2014A 2015A 2016F 2017F 2018F
Pre-Tax Income 78.7 74.8 62.5 67.8 69.6
Dep. & Amort. 0.0 0.0 0.0 0.0 0.0
Tax Paid 0.0 0.0 0.0 0.0 0.0
Associates &JV Inc/(Loss) 0.0 0.0 0.0 0.0 0.0
Chg in Wkg.Cap. (13.8) 0.76 0.0 0.0 0.0
Other Operating CF 22.9 32.9 11.9 11.0 11.2
Net Operating CF 87.9 108 74.4 78.8 80.8
Net Invt in Properties (0.1) (293) (210) (3.0) (3.8)
Other Invts (net) 0.0 0.0 0.0 0.0 0.0
Invts in Assoc. & JV 0.0 0.0 0.0 0.0 0.0
Div from Assoc. & JVs 0.0 0.0 0.0 0.0 0.0
Other Investing CF 0.03 0.04 0.0 0.0 0.0
Net Investing CF (0.1) (293) (210) (3.0) (3.8)
Distribution Paid (104) (88.2) (77.2) (81.6) (83.7)
Chg in Gross Debt 0.0 292 0.0 0.0 0.0
New units issued 0.0 0.0 234 0.0 0.0
Other Financing CF (13.8) (19.2) 0.0 0.0 0.0
Net Financing CF (117) 185 156 (81.6) (83.7)
Currency Adjustments 0.0 0.0 0.0 0.0 0.0
Chg in Cash (29.5) 0.06 20.8 (5.9) (6.6)
Operating CFPS (S cts) 7.14 7.49 4.59 4.37 4.46
Free CFPS (S cts) 6.17 (12.8) (8.4) 4.21 4.25
Source: Company, DBS Bank
Target Price & Ratings History
Source: DBS Bank
Analyst: Mervin SONG CFA
Derek TAN
S.No.Date of
Report
Closing
Price
12-mth
Target
Price
Rat ing
1: 06 Jan 16 0.71 0.85 BUY
2: 21 Jan 16 0.69 0.85 BUY
3: 09 May 16 0.67 0.75 BUY
4: 02 Aug 16 0.69 0.75 BUY
5: 05 Sep 16 0.68 0.75 BUY
6: 01 Nov 16 0.69 0.72 BUY
Note : Share price and Target price are adjusted for corporate actions.
1 2
3
4
5
6
0.60
0.62
0.64
0.66
0.68
0.70
0.72
0.74
0.76
0.78
Jan-16 May-16 Sep-16 Jan-17
S$
Net proceeds from recent right issue (441.9m units at S$0.54 per unit)
Page 269

ASIAN INSIGHTS VICKERS SECURITIES ed: JS/ sa: YM, PY
BUY Last Traded Price ( 4 Jan 2017): S$0.66 (STI : 2,921.31)
Price Target 12-mth: S$0.75 (15% total return and 9.3% yield )
Potential Catalyst: Better than expected results
Where we differ: More conservative estimates than consensus
Analyst Derek TAN +65 6682 3716 [email protected] Singapore Research Team [email protected] Mervin SONG CFA +65 6682 3715 [email protected]
Price Relative
Forecasts and Valuation FY Dec (S$m) 2015A 2016F 2017F 2018F
Gross Revenue 79.3 85.8 92.7 95.3 Net Property Inc 67.8 72.7 79.4 81.6 Total Return 51.7 51.0 55.7 57.5 Distribution Inc 57.9 58.4 63.3 64.5 EPU (S cts) 5.28 5.32 5.38 5.51 EPU Gth (%) 2 1 1 2 DPU (S cts) 6.49 6.09 6.11 6.18 DPU Gth (%) 5 (6) 0 1 NAV per shr (S cts) 79.8 84.5 78.4 78.4 PE (X) 12.4 12.3 12.2 11.9 Distribution Yield (%) 9.9 9.3 9.3 9.4 P/NAV (x) 0.8 0.8 0.8 0.8 Aggregate Leverage (%) 36.2 35.8 35.6 35.5 ROAE (%) 6.7 6.5 6.9 7.0 Distn. Inc Chng (%): 0 0 0 Consensus DPU (S cts): 6.10 6.30 5.90 Other Broker Recs: B: 4 S: 0 H: 1
Source of all data on this page: Company, DBS Bank, Bloomberg Finance L.P.
A helping hand from the sponsor
Negatives priced in, BUY and TP of S$0.75 maintained. With a
dividend yield of close to 9.0%, Soilbuild Business Space Reit
(SBREIT) offers one of the highest in the industrial space. Despite
operational headwinds, we believe that the worst is over.
SBREIT’s recent asset acquisition will diversify its portfolio, and
updates on back-filling of vacated space at 72 Loyang Way will
increase investor confidence for the stock. Maintain BUY.
Acquisition of Bukit Batok Connection to drive earnings as
portfolio undergoes tenant churn. The timely acquisition of
Bukit Batok Connection from sponsor Soilbuild Group will
diversify the REIT’s earnings and lengthen its weighted average
lease expiry (WALE) to 4.7 years. This more than compensates
for potential operational headwinds from other assets in the
portfolio. In addition, the Manager is actively re-tenanting 72
Loyang Way where Technics is expected to progressively vacate.
We understand that the Manager has found tenants for a
substantial portion of the space but at lower rents.
Look out for asset revaluation. We believe that portfolio
valuation could soften come year end, mainly from weaker net
property income portfolio-wide, and from 72 Loyang Way after
the loss of income from its master tenant. Based on our
estimates, a 10%-20% drop in valuations in its properties will
only result in gearing rising to 37% (from 36% currently), which
is well within the REIT’s comfortable level. Valuation:
We have a DCF-backed TP of S$0.75 which has factored in the
likely NAV devaluation. Maintain BUY, supported by an
attractive yield of over 9.0%.
Key Risks to Our View:
Interest rate risks. Rise in interest rates in the medium term will
have a negative impact on distributions but the Manager has
substantially hedged out these risks with a high percentage of
fixed-rate borrowings. At A Glance
Issued Capital (m shrs) 1,042
Mkt. Cap (S$m/US$m) 683 / 471
Major Shareholders (%)
Chap Huat Lim 24.9
Schroders Plc 8.0
Jinquan Tong 6.9
Free Float (%) 59.4
3m Avg. Daily Val (US$m) 0.68
ICB Industry : Real Estate / Real Estate Investment Trusts
DBS Group Research . Equity
4 Jan 2017
Singapore Company Guide
Soilbuild Business Space Reit Version 6 | Bloomberg: SBREIT SP | Reuters: SBSR.SI Refer to important disclosures at the end of this report
Page 270

ASIAN INSIGHTS VICKERS SECURITIES
Page 2
Company Guide
Soilbuild Business Space Reit
CRITICAL DATA POINTS TO WATCH
Earnings Drivers:
Well-staggered lease expiry profile offers income stability.
SBREIT has a healthy weighted average lease-to-expiry (WALE)
profile of 4.7 years by gross rental income as at 3Q16. Within
SBREIT’s portfolio, 49% of net property income is derived from
master lease agreements that provide long-term leases ranging
from 5-15 years which contain annual escalations in the range
of 2.0-5.0%, ensuring a steady growth profile.
Steady occupancy rates; Manager to focus on tenant retention
rate. In view of the increasing supply outlook, the Manager of
SBREIT is looking to forward renew expiring leases with the aim
of maintaining a high level of portfolio occupancy.
Outlook remains modest with rental reversions expected to
moderate for its main properties (West Park Biz Central and
Tuas Connection). Given the competitive industrial landscape,
the Manager is aiming to retain tenants rather than pushing
rents higher, which in our view, is a right strategy to underpin
earnings resiliency.
Acquisitions to drive earnings. The acquisition of Bukit Batok
Connection will contribute from 4Q16. We expect distributions
(and DPUs) to increase q-o-q from the full-quarter contribution
of Bukit Batok Connection. This is expected to compensate for
the expected weakness in rental reversions from WestPark Biz
Central and Tuas Connection 9 and back-filling of vacated
space at 72 Loyang Way. While the property will be leased-back
to the sponsor on a 7–year lease, we understand that
underlying occupancy is improving, currently at c.43%-44%
with tenants from diversified industries taking up space. We
believe that the acquisition provides much needed stability and
visibility to the REIT’s earnings especially coming from the
uncertainty regarding 72 Loyang Way and the general negative
rental reversions felt across the assets in the portfolio
Technics re-tenanting update. Impact of Technics not paying
rent is compensated by the drawdown of cash from 18-month
deposit that SBREIT has called on. As at 3Q16, we understand
that the Manager is already in discussions with a number of
tenants who might be interested to take up the vacated space
as 72 Loyang Way (Technics’ Property) is undergoing a judicial
management process. If these discussions are concluded, most
of the vacated space is expected to be filled up. However, rental
rates are expected to be lower that the estimated c. S$3.0psf
that Technics was paying. That said, we believe that the
successful back-filing of space at 72 Loyang Way will provide
investors with increased comfort on the income stability going
forward.
Net Property Income and Margins (%)
Net Property Income and Margins (%)
Distribution Paid / Net Operating CF
Interest Cover (x)
Source: Company, DBS Bank
Page 271

ASIAN INSIGHTS VICKERS SECURITIES
Page 3
Company Guide
Soilbuild Business Space Reit
Balance Sheet:
Gearing remains within management's comfort level. SBREIT's
current gearing remains at the lower end of management’s
range of 35-40% which provides sufficient headroom and
financial flexibility for the REIT to acquire opportunistically.
Prudent capital management; 100% of interest costs hedged
into fixed rates. All-in cost of debt fell marginally to 3.42% from
3.44%. Average debt maturity stays at 3.1 years and interest
rate for 88.5% of borrowings has been fixed.
Share Price Drivers:
High yields of >8.0%; one of the highest among S-REITs. SBREIT
currently offers one of the highest yields among industrial REITs.
We believe this is unjustified given the REIT’s superior portfolio
of high-quality industrial assets with a niche exposure in the
business park segment, which is expected to deliver a more
resilient performance than peers. In addition, with 49% of its
income pegged to single-tenant properties, we believe that
SBREIT offers one of the strongest income visibilities among
industrial REITs.
Better-than-expected operational performance. Better-than-
projected rental reversions from its main assets - namely West
Park Biz Central and Tuas Connection - will mean upside to our
DPU forecasts, implying higher TPs. In addition, with investors’
concerns of rising vacancy risks due to increased competition
from new completing supply, the ability to maintain a sustained
occupancy profile will lift investors’ confidence in SBREIT’s ability
to deliver consistent returns over time.
Key Risks:
Higher interest rates. Any increase in refinancing rates will
negatively impact distributions. The Manager has put in place
interest rate swaps/MTNs of 1-4 years to essentially convert
c.98% of its debt into fixed rates.
Company Background
Soilbuild Business Space REIT is a real estate investment trust
that invests in income-producing real estate used primarily for
business space purposes in Singapore. Its flagship asset is
Solaris, located in the one-north business park. The REIT is
backed by Soilbuild Group, a household name in the
construction and real estate business in Singapore.
Aggregate Leverage (%)
ROE (%)
Distribution Yield (%)
PB Band (x)
Source: Company, DBS Bank
Page 272

ASIAN INSIGHTS VICKERS SECURITIES
Page 4
Company Guide
Soilbuild Business Space Reit
Income Statement (S$m)
FY Dec 2014A 2015A 2016F 2017F 2018F
Gross revenue 68.1 79.3 85.8 92.7 95.3
Property expenses (10.8) (11.6) (13.1) (13.3) (13.6)
Net Property Income 57.4 67.8 72.7 79.4 81.6
Other Operating expenses (6.5) (7.8) (8.5) (8.5) (7.6)
Other Non Opg (Exp)/Inc 0.0 0.0 0.0 0.0 0.0
Net Interest (Exp)/Inc (9.7) (12.8) (13.2) (15.2) (16.5)
Exceptional Gain/(Loss) 0.90 0.0 0.0 0.0 0.0
Net Income 42.1 47.1 51.0 55.7 57.5
Tax 0.0 0.0 0.0 0.0 0.0
Minority Interest 0.0 0.0 0.0 0.0 0.0
Preference Dividend 0.0 0.0 0.0 0.0 0.0
Net Income After Tax 42.1 47.1 51.0 55.7 57.5
Total Return 42.1 51.7 51.0 55.7 57.5
Non-tax deductible Items 8.11 6.21 7.39 7.57 7.02
Net Inc available for Dist. 50.2 57.9 58.4 63.3 64.5
Growth & Ratio
Revenue Gth (%) 177.4 16.4 8.1 8.1 2.7
N Property Inc Gth (%) 178.4 18.2 7.2 9.3 2.8
Net Inc Gth (%) 180.7 12.0 8.2 9.3 3.2
Dist. Payout Ratio (%) 100.0 100.0 100.0 100.0 100.0
Net Prop Inc Margins (%) 84.2 85.4 84.7 85.6 85.7
Net Income Margins (%) 61.7 59.4 59.4 60.1 60.4
Dist to revenue (%) 73.6 72.9 68.1 68.3 67.7
Managers & Trustee’s fees to sales %)
9.6 9.8 9.9 9.1 8.0
ROAE (%) 6.5 6.7 6.5 6.9 7.0
ROA (%) 4.2 4.2 4.0 4.2 4.3
ROCE (%) 5.1 5.3 5.1 5.4 5.6
Int. Cover (x) 5.3 4.7 4.9 4.7 4.5
Source: Company, DBS Bank
Driven by acquisitions
Page 273

ASIAN INSIGHTS VICKERS SECURITIES
Page 5
Company Guide
Soilbuild Business Space Reit
Quarterly / Interim Income Statement (S$m)
FY Dec 3Q2015 4Q2015 1Q2016 2Q2016 3Q2016
Gross revenue 20.7 20.4 20.1 19.6 19.7
Property expenses (2.9) (2.9) (2.9) (2.2) (2.5)
Net Property Income 17.8 17.5 17.2 17.3 17.3
Other Operating expenses (1.8) (2.4) (1.8) (1.7) (1.8)
Other Non Opg (Exp)/Inc 0.0 0.0 0.0 0.0 0.0
Net Interest (Exp)/Inc (3.5) (3.1) (3.1) (3.2) (3.4)
Exceptional Gain/(Loss) 0.0 0.0 0.0 0.0 0.0
Net Income 12.5 12.0 12.4 12.4 12.1
Tax 0.0 0.0 0.0 0.0 0.0
Minority Interest 0.0 0.0 0.0 0.0 0.0
Net Income after Tax 12.5 12.0 12.4 12.4 12.1
Total Return 12.5 16.5 12.4 12.4 12.1
Non-tax deductible Items 2.65 (1.4) 2.24 2.31 2.47
Net Inc available for Dist. 15.1 15.1 14.6 14.7 14.6
Growth & Ratio
Revenue Gth (%) 6 (1) (1) (3) 1
N Property Inc Gth (%) 6 (2) (2) 1 0
Net Inc Gth (%) 8 (4) 3 0 (3)
Net Prop Inc Margin (%) 85.9 85.6 85.4 88.5 87.5
Dist. Payout Ratio (%) 100.0 100.0 100.0 100.0 100.0
Balance Sheet (S$m)
FY Dec 2014A 2015A 2016F 2017F 2018F Investment Properties 1,031 1,191 1,289 1,291 1,293
Other LT Assets 0.96 3.41 3.41 3.41 3.41
Cash & ST Invts 21.0 16.8 23.1 27.0 29.9
Inventory 0.0 0.0 0.0 0.0 0.0
Debtors 0.82 2.44 0.86 0.93 0.95
Other Current Assets 0.55 1.24 1.24 1.24 1.24
Total Assets 1,054 1,215 1,318 1,324 1,329
ST Debt
94.6 0.0 0.0 0.0 0.0
Creditor 8.68 10.1 8.58 9.27 9.53
Other Current Liab 2.58 2.72 2.72 2.72 2.72
LT Debt 274 399 439 439 439
Other LT Liabilities 23.0 57.2 57.2 57.2 57.2
Unit holders’ funds 651 746 811 816 821
Minority Interests 0.0 0.0 0.0 0.0 0.0
Total Funds & Liabilities 1,054 1,215 1,318 1,324 1,329
Non-Cash Wkg. Capital (9.9) (9.2) (9.2) (9.8) (10.1)
Net Cash/(Debt) (348) (382) (415) (412) (409)
Ratio
Current Ratio (x) 0.2 1.6 2.2 2.4 2.6
Quick Ratio (x) 0.2 1.5 2.1 2.3 2.5
Aggregate Leverage (%) 35.8 36.2 35.8 35.6 35.5
Z-Score (X) 0.9 1.0 1.0 1.0 1.1
Source: Company, DBS Bank
Gearing to remain steady
Page 274

ASIAN INSIGHTS VICKERS SECURITIES
Page 6
Company Guide
Soilbuild Business Space Reit
Cash Flow Statement (S$m)
FY Dec 2014A 2015A 2016F 2017F 2018F
Pre-Tax Income 42.1 47.1 51.0 55.7 57.5
Dep. & Amort. 0.0 0.0 0.0 0.0 0.0
Tax Paid 0.0 0.0 0.0 0.0 0.0
Associates &JV Inc/(Loss) 0.0 0.0 0.0 0.0 0.0
Chg in Wkg.Cap. 3.41 (0.7) 0.04 0.63 0.23
Other Operating CF 8.40 10.7 5.59 5.77 5.22
Net Operating CF 53.9 57.1 56.6 62.1 63.0
Net Invt in Properties (94.8) (124) (98.3) (2.0) (2.0)
Other Invts (net) 0.0 0.0 0.0 0.0 0.0
Invts in Assoc. & JV 0.0 0.0 0.0 0.0 0.0
Div from Assoc. & JVs 0.0 0.0 0.0 0.0 0.0
Other Investing CF 0.0 0.0 0.0 0.0 0.0
Net Investing CF (94.8) (124) (98.3) (2.0) (2.0)
Distribution Paid (49.4) (55.7) (58.4) (63.3) (64.5)
Chg in Gross Debt 91.5 29.6 40.0 0.0 0.0
New units issued (0.1) 90.0 66.4 7.07 6.52
Other Financing CF 0.0 (1.6) 0.0 0.0 0.0
Net Financing CF 41.9 62.3 48.0 (56.2) (58.0)
Currency Adjustments 0.0 0.0 0.0 0.0 0.0
Chg in Cash 1.00 (4.2) 6.33 3.90 2.95
Operating CFPS (S cts) 6.24 6.48 5.90 5.93 6.01
Free CFPS (S cts) (5.1) (7.5) (4.3) 5.80 5.84
Source: Company, DBS Bank
Target Price & Ratings History
Source: DBS Bank
Analyst: Derek TAN
Singapore Research Team
Mervin SONG CFA
Page 275

ASIAN INSIGHTS VICKERS SECURITIES ed: TH / sa: JC, PY
HOLD
Last Traded Price ( 4 Jan 2017): S$0.96 (STI : 2,921.31)
Price Target 12-mth: S$1.00 (4% upside and 5.9% yield)
Potential Catalyst: Better-than-expected rental reversion; acquisition of
Seletar Mall
Where we differ: More bullish on rents at selected Orchard Rd malls
Analyst Singapore Research Team Derek TAN +65 6682 3716 [email protected]
Price Relative
Forecasts and Valuation FY Aug (S$m) 2015A 2016A 2017F 2018F
Gross Revenue 205 210 226 231 Net Property Inc 156 161 164 168 Total Return 154 128 127 129 Distribution Inc 139 141 145 148 EPU (S cts) 6.08 5.02 4.97 5.02 EPU Gth (%) (29) (17) (1) 1 DPU (S cts) 5.47 5.55 5.66 5.72 DPU Gth (%) 1 1 2 1 NAV per shr (S cts) 94.3 93.4 92.7 92.1 PE (X) 15.7 19.0 19.2 19.0 Distribution Yield (%) 5.7 5.8 5.9 6.0 P/NAV (x) 1.0 1.0 1.0 1.0 Aggregate Leverage (%) 25.5 25.5 26.0 26.2 ROAE (%) 6.5 5.3 5.3 5.4 Distn. Inc Chng (%): - - Consensus DPU (S cts): 5.7 5.7 Other Broker Recs: B: 3 S: 0 H: 3
Source of all data on this page: Company, DBS Bank, Bloomberg Finance L.P.
Potential influx of new traffic to Paragon Stock is fairly priced. We currently have a HOLD recommendation, with TP of S$1.00. SPH REIT's dividend yield of 5.7% reflects the strength of its assets and stability of earnings. However, at this point we believe that comparable retail S-REITs offer more attractive yields. Paragon to continue to drive earnings growth. We believe that Paragon will continue to outperform the rest of Orchard Road for both retail and office assets, due to its (a) location and frontage in the prime Orchard Road shopping district, as well as (b) proximity to the Mount Elizabeth medical cluster. As such, we assume reversions of 3.5-4.0% for Paragon. A linkbridge connecting Cairnhill redevelopment and Paragon, to be opened in November/December 2016, may draw new traffic to the mall. At Clementi Mall, more than 50% lease expirations in FY17 could set a new base for rent. Potential acquisition a catalyst. With a healthy gearing of 25.7% and cost of debt of 2.82%, SPH REIT is well poised for debt-funded acquisitions. The next growth catalyst for the REIT will be the acquisition of the Sponsor’s 70% stake in Seletar Mall. However, we believe this acquisition is likely to be more of a medium term-prospect, as the mall was only completed in December 2014 and is still on its first lease cycle. Valuation:
We have a DCF-backed target price of S$1.00, implying a
dividend yield of 5.7% for FY17F-18F. Due to the lack of near-
term catalysts and limited upside to TP, we maintain our HOLD
call.
Key Risks to Our View:
Short WALE due to lease expirations at Clementi Mall. The
portfolio has a relatively short WALE of 2.3 years by NLA.
18.5% of portfolio NLA (c.166,000 sqft) will expire in FY17.
The majority comes from Clementi Mall where more than 50%
or close of 104,000 sqft of the mall’s NLA are due in the next
12 months. At A Glance Issued Capital (m shrs) 2,551
Mkt. Cap (S$m/US$m) 2,436 / 1,692
Major Shareholders (%)
Singapore Press Holdings 68.7
Free Float (%) 31.3
3m Avg. Daily Val (US$m) 0.70
ICB Industry : Real Estate / Real Estate Investment Trusts
DBS Group Research . Equity
4 Jan 2017
Singapore Company Guide
SPH REIT Version 4 | Bloomberg: SPHREIT SP | Reuters: SPHR.SI Refer to important disclosures at the end of this report
Page 276
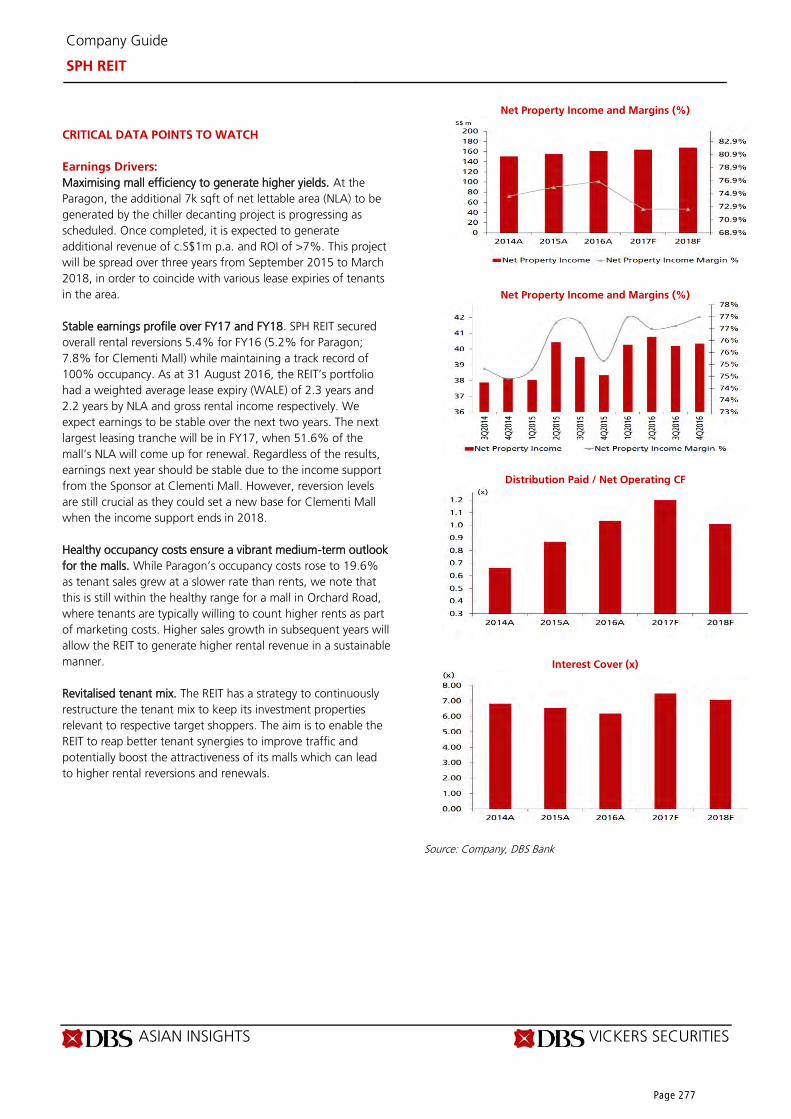
ASIAN INSIGHTS VICKERS SECURITIES
Page 2
Company Guide
SPH REIT
CRITICAL DATA POINTS TO WATCH
Earnings Drivers:
Maximising mall efficiency to generate higher yields. At the
Paragon, the additional 7k sqft of net lettable area (NLA) to be
generated by the chiller decanting project is progressing as
scheduled. Once completed, it is expected to generate
additional revenue of c.S$1m p.a. and ROI of >7%. This project
will be spread over three years from September 2015 to March
2018, in order to coincide with various lease expiries of tenants
in the area.
Stable earnings profile over FY17 and FY18. SPH REIT secured
overall rental reversions 5.4% for FY16 (5.2% for Paragon;
7.8% for Clementi Mall) while maintaining a track record of
100% occupancy. As at 31 August 2016, the REIT’s portfolio
had a weighted average lease expiry (WALE) of 2.3 years and
2.2 years by NLA and gross rental income respectively. We
expect earnings to be stable over the next two years. The next
largest leasing tranche will be in FY17, when 51.6% of the
mall’s NLA will come up for renewal. Regardless of the results,
earnings next year should be stable due to the income support
from the Sponsor at Clementi Mall. However, reversion levels
are still crucial as they could set a new base for Clementi Mall
when the income support ends in 2018.
Healthy occupancy costs ensure a vibrant medium-term outlook
for the malls. While Paragon’s occupancy costs rose to 19.6%
as tenant sales grew at a slower rate than rents, we note that
this is still within the healthy range for a mall in Orchard Road,
where tenants are typically willing to count higher rents as part
of marketing costs. Higher sales growth in subsequent years will
allow the REIT to generate higher rental revenue in a sustainable
manner.
Revitalised tenant mix. The REIT has a strategy to continuously
restructure the tenant mix to keep its investment properties
relevant to respective target shoppers. The aim is to enable the
REIT to reap better tenant synergies to improve traffic and
potentially boost the attractiveness of its malls which can lead
to higher rental reversions and renewals.
Net Property Income and Margins (%)
Net Property Income and Margins (%)
Distribution Paid / Net Operating CF
Interest Cover (x)
Source: Company, DBS Bank
Page 277

ASIAN INSIGHTS VICKERS SECURITIES
Page 3
Company Guide
SPH REIT
Balance Sheet:
Gearing. SPH REIT has maintained a healthy gearing ratio at
25.7% that is well within the Manager’s comfortable range of
up to 40%. This provides the REIT with significantly larger
headroom for debt financing should it decide to gear up on
acquisitions.
Net Asset Value (NAV) per unit. NAV of S$0.94 is underpinned
by stable asset valuations.
Share Price Drivers:
Potential acquisitions. With a healthy gearing at 25.7% and cost
of debt of 2.82%, SPH REIT is well poised for debt-funded
acquisition activities. The next growth catalyst for the REIT will
be the acquisition of the Sponsor’s 70% stake in Seletar Mall,
which was completed in December 2014. However, this
acquisition is likely to be more of a medium-term prospect, as
the mall is still in its first leasing cycle and has yet to stabilise.
Key Risks:
Interest rate risk. The REIT has muted exposure to changes in
interest rates with no debt maturing until 2018 and 85.9% of
its S$850m debt facility on a fixed rate basis.
Visitor traffic is trending down by 2.5% and 2.4% for FY16
full year at Paragon and Clementi Mall respectively. However,
we do not believe it is a concern. Paragon’s tenant sales
registered a positive growth of 1.4%, and more traffic could
be drawn from the opening of the linkbridge. Decline at
Clementi Mall was most likely from the unproductive traffic as
a new MRT exit at Clementi station opened early in the year
provides an alternative route for the train passengers.
Short WALE mainly due to Clementi Mall. The portfolio has a
relatively short WALE of 2.3 years by NLA. 18.5% of portfolio
NLA (c.166,000 sqft) will expire in FY17. The majority comes
from Clementi Mall.
Management fees payable in units. The REIT is one of the few
S-REITs that pays 100% of management fees in units as
opposed to cash (S$16.3m in FY16, 11.7% boost to
distributions). We believe that DPU growth may not be
sustainable in the longer term due to continuous share dilution
and the Management has no plans to tweak the payment
structure.
Company Background
SPH REIT is a real estate investment trust that invests in
income-producing retail malls in Singapore. It currently owns
the Paragon Mall within the Orchard Road district, as well as
Clementi Mall, located in the west of Singapore.
Aggregate Leverage (%)
ROE (%)
Distribution Yield (%)
PB Band (x)
Source: Company, DBS Bank
Avg: 5.5%
+1sd: 5.8%
+2sd: 6.1%
-1sd: 5.2%
-2sd: 4.9%
4.5
4.7
4.9
5.1
5.3
5.5
5.7
5.9
6.1
6.3
2013 2014 2015 2016
(%)
Page 278

ASIAN INSIGHTS VICKERS SECURITIES
Page 4
Company Guide
SPH REIT
Income Statement (S$m)
FY Aug 2014A 2015A 2016A 2017F 2018F
Gross revenue 202 205 210 226 231
Property expenses (51.6) (49.5) (48.7) (62.0) (63.6)
Net Property Income 151 156 161 164 168
Other Operating expenses (17.2) (17.7) (17.9) (16.9) (17.2)
Other Non Opg (Exp)/Inc 0.0 0.0 0.0 0.0 0.0
Net Interest (Exp)/Inc (19.6) (21.0) (23.1) (19.6) (21.3)
Exceptional Gain/(Loss) 103 36.6 7.69 0.0 0.0
Net Income 217 154 128 127 129
Tax 0.0 0.0 0.0 0.0 0.0
Minority Interest 0.0 0.0 0.0 0.0 0.0
Preference Dividend 0.0 0.0 0.0 0.0 0.0
Net Income After Tax 217 154 128 127 129
Total Return 217 154 128 127 129
Non-tax deductible Items 22.5 21.6 21.2 18.2 18.4
Net Inc available for Dist. 136 139 141 145 148
Growth & Ratio
Revenue Gth (%) (6.7) 1.4 2.2 7.7 2.4
N Property Inc Gth (%) (5.2) 3.3 3.4 1.8 2.4
Net Inc Gth (%) 85.0 (29.1) (16.9) (0.3) 1.7
Dist. Payout Ratio (%) 100.0 100.0 100.0 100.0 100.0
Net Prop Inc Margins (%) 74.5 75.9 76.8 72.5 72.5
Net Income Margins (%) 107.1 74.9 60.9 56.3 55.9
Dist to revenue (%) 67.4 67.5 67.3 64.4 63.9
Managers & Trustee’s fees to sales %)
8.5 8.6 8.6 7.5 7.4
ROAE (%) 9.6 6.5 5.3 5.3 5.4
ROA (%) 6.8 4.7 3.9 3.8 3.9
ROCE (%) 4.2 4.2 4.4 4.5 4.6
Int. Cover (x) 6.8 6.6 6.2 7.5 7.1
Source: Company, DBS Bank
Page 279

ASIAN INSIGHTS VICKERS SECURITIES
Page 5
Company Guide
SPH REIT
Quarterly / Interim Income Statement (S$m)
FY Aug 4Q2015 1Q2016 2Q2016 3Q2016 4Q2016
Gross revenue 50.8 52.1 53.1 52.2 52.2
Property expenses (12.6) (12.0) (12.5) (12.2) (12.0)
Net Property Income 38.2 40.1 40.6 40.0 40.2
Other Operating expenses (4.3) (4.5) (4.6) (4.6) (4.3)
Other Non Opg (Exp)/Inc 0.0 0.0 0.0 0.0 0.0
Net Interest (Exp)/Inc (5.8) (5.8) (5.8) (5.8) (5.7)
Exceptional Gain/(Loss) 36.6 0.0 0.0 0.0 7.69
Net Income 64.7 29.8 30.3 29.6 37.9
Tax 0.0 0.0 0.0 0.0 0.0
Minority Interest 0.0 0.0 0.0 0.0 0.0
Net Income after Tax 64.7 29.8 30.3 29.6 37.9
Total Return 132 28.6 30.7 29.3 28.1
Non-tax deductible Items 5.42 5.48 6.18 5.36 4.17
Net Inc available for Dist. 33.6 35.3 36.4 35.0 34.4
Growth & Ratio
Revenue Gth (%) (1) 3 2 (2) 0
N Property Inc Gth (%) (3) 5 1 (1) 0
Net Inc Gth (%) 121 (54) 1 (2) 28
Net Prop Inc Margin (%) 75.1 77.0 76.5 76.6 77.0
Dist. Payout Ratio (%) 104.8 95.4 97.5 98.8 104.5
Balance Sheet (S$m)
FY Aug 2014A 2015A 2016A 2017F 2018F Investment Properties 3,159 3,213 3,230 3,240 3,245
Other LT Assets 13.5 14.4 7.99 7.99 7.99
Cash & ST Invts 90.7 77.4 67.4 43.3 46.6
Inventory 0.0 0.0 0.0 0.0 0.0
Debtors 5.91 5.01 5.89 5.89 5.89
Other Current Assets 0.0 0.37 0.0 0.0 0.0
Total Assets 3,269 3,310 3,311 3,297 3,305
ST Debt
0.0 249 0.0 0.0 0.0
Creditor 35.1 30.2 34.2 11.9 12.2
Other Current Liab 0.0 0.0 0.0 0.0 0.0
LT Debt 843 596 846 856 866
Other LT Liabilities 37.7 36.7 42.7 42.7 42.7
Unit holders’ funds 2,353 2,398 2,389 2,387 2,385
Minority Interests 0.0 0.0 0.0 0.0 0.0
Total Funds & Liabilities 3,269 3,310 3,311 3,297 3,305
Non-Cash Wkg. Capital (29.2) (24.9) (28.3) (6.0) (6.3)
Net Cash/(Debt) (752) (768) (779) (813) (819)
Ratio
Current Ratio (x) 2.7 0.3 2.1 4.1 4.3
Quick Ratio (x) 2.7 0.3 2.1 4.1 4.3
Aggregate Leverage (%) 25.8 25.5 25.5 26.0 26.2
Z-Score (X) 3.5 3.4 3.5 3.5 3.5
Source: Company, DBS Bank
Page 280

ASIAN INSIGHTS VICKERS SECURITIES
Page 6
Company Guide
SPH REIT
Cash Flow Statement (S$m)
FY Aug 2014A 2015A 2016A 2017F 2018F
Pre-Tax Income 114 117 120 127 129
Dep. & Amort. 0.12 0.16 0.21 0.0 0.0
Tax Paid 0.0 0.0 0.0 0.0 0.0
Associates &JV Inc/(Loss) 0.0 0.0 0.0 0.0 0.0
Chg in Wkg.Cap. 21.0 1.28 (1.9) (22.3) 0.29
Other Operating CF 39.5 40.0 16.1 16.3 16.5
Net Operating CF 175 158 134 121 146
Net Invt in Properties (2.7) (15.3) (8.5) (9.9) (5.0)
Other Invts (net) (0.2) (0.1) (0.1) 0.0 0.0
Invts in Assoc. & JV 0.0 0.0 0.0 0.0 0.0
Div from Assoc. & JVs 0.0 0.0 0.0 0.0 0.0
Other Investing CF 0.21 0.61 0.85 0.0 0.0
Net Investing CF (2.7) (14.8) (7.8) (9.9) (5.0)
Distribution Paid (115) (138) (139) (145) (148)
Chg in Gross Debt 0.0 (0.2) (1.0) 10.0 10.0
New units issued (9.0) (18.8) (22.3) 0.0 0.0
Other Financing CF (17.8) 0.0 0.0 0.0 0.0
Net Financing CF (142) (157) (162) (135) (138)
Currency Adjustments 0.0 0.0 0.0 0.0 0.0
Chg in Cash 29.8 (13.3) (35.6) (24.1) 3.37
Operating CFPS (S cts) 6.10 6.22 5.36 5.61 5.66
Free CFPS (S cts) 6.82 5.66 4.95 4.35 5.48
Source: Company, DBS Bank
Target Price & Ratings History
Source: DBS Bank
Analyst: Singapore Research Team
Derek TAN
Page 281
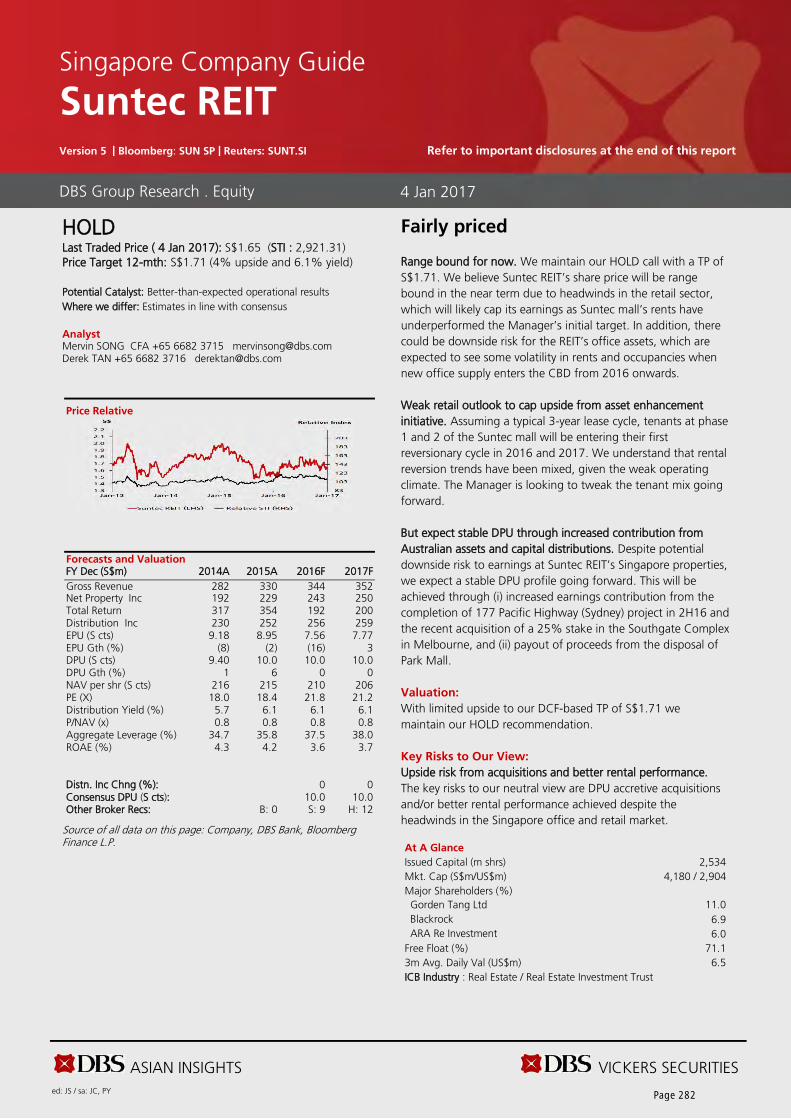
ASIAN INSIGHTS VICKERS SECURITIES ed: JS / sa: JC, PY
HOLD Last Traded Price ( 4 Jan 2017): S$1.65 (STI : 2,921.31)
Price Target 12-mth: S$1.71 (4% upside and 6.1% yield)
Potential Catalyst: Better-than-expected operational results
Where we differ: Estimates in line with consensus
Analyst Mervin SONG CFA +65 6682 3715 [email protected] Derek TAN +65 6682 3716 [email protected]
Price Relative
Forecasts and Valuation FY Dec (S$m) 2014A 2015A 2016F 2017F
Gross Revenue 282 330 344 352 Net Property Inc 192 229 243 250 Total Return 317 354 192 200 Distribution Inc 230 252 256 259 EPU (S cts) 9.18 8.95 7.56 7.77 EPU Gth (%) (8) (2) (16) 3 DPU (S cts) 9.40 10.0 10.0 10.0 DPU Gth (%) 1 6 0 0 NAV per shr (S cts) 216 215 210 206 PE (X) 18.0 18.4 21.8 21.2 Distribution Yield (%) 5.7 6.1 6.1 6.1 P/NAV (x) 0.8 0.8 0.8 0.8 Aggregate Leverage (%) 34.7 35.8 37.5 38.0 ROAE (%) 4.3 4.2 3.6 3.7 Distn. Inc Chng (%): 0 0 Consensus DPU (S cts): 10.0 10.0 Other Broker Recs: B: 0 S: 9 H: 12
Source of all data on this page: Company, DBS Bank, Bloomberg Finance L.P.
Fairly priced
Range bound for now. We maintain our HOLD call with a TP of
S$1.71. We believe Suntec REIT’s share price will be range
bound in the near term due to headwinds in the retail sector,
which will likely cap its earnings as Suntec mall’s rents have
underperformed the Manager’s initial target. In addition, there
could be downside risk for the REIT’s office assets, which are
expected to see some volatility in rents and occupancies when
new office supply enters the CBD from 2016 onwards.
Weak retail outlook to cap upside from asset enhancement
initiative. Assuming a typical 3-year lease cycle, tenants at phase
1 and 2 of the Suntec mall will be entering their first
reversionary cycle in 2016 and 2017. We understand that rental
reversion trends have been mixed, given the weak operating
climate. The Manager is looking to tweak the tenant mix going
forward.
But expect stable DPU through increased contribution from
Australian assets and capital distributions. Despite potential
downside risk to earnings at Suntec REIT’s Singapore properties,
we expect a stable DPU profile going forward. This will be
achieved through (i) increased earnings contribution from the
completion of 177 Pacific Highway (Sydney) project in 2H16 and
the recent acquisition of a 25% stake in the Southgate Complex
in Melbourne, and (ii) payout of proceeds from the disposal of
Park Mall.
Valuation:
With limited upside to our DCF-based TP of S$1.71 we
maintain our HOLD recommendation.
Key Risks to Our View:
Upside risk from acquisitions and better rental performance.
The key risks to our neutral view are DPU accretive acquisitions
and/or better rental performance achieved despite the
headwinds in the Singapore office and retail market. At A Glance Issued Capital (m shrs) 2,534
Mkt. Cap (S$m/US$m) 4,180 / 2,904
Major Shareholders (%)
Gorden Tang Ltd 11.0
Blackrock 6.9
ARA Re Investment 6.0
Free Float (%) 71.1
3m Avg. Daily Val (US$m) 6.5
ICB Industry : Real Estate / Real Estate Investment Trust
DBS Group Research . Equity
4 Jan 2017
Singapore Company Guide
Suntec REIT Version 5 | Bloomberg: SUN SP | Reuters: SUNT.SI Refer to important disclosures at the end of this report
Page 282

ASIAN INSIGHTS VICKERS SECURITIES
Page 2
Company Guide
Suntec REIT
CRITICAL DATA POINTS TO WATCH
Earnings Drivers:
Office portfolio faces some earnings risk. Suntec REIT currently
owns three office assets in Singapore’s CBD – Suntec Office,
One Raffles Quay (ORQ; 33%), and MBFC Towers 1 and 2
(33%). With the expected oversupply of the Singapore office
market upon the completion of several new offices at the end
of 2016 and 2017, Suntec REIT’s properties may face stiffer
competition for its tenants as well as downward pressure on
rents. Partially mitigating this is the significant forward renewals
already completed at ORQ and MBFC Tower 2 as well as the
strong positioning of Suntec Office which has the advantage of
ample car parking spaces, connectivity to two MRT stations and
a wide choice of amenities given its location next to Suntec City
Mall.
Retail headwinds. With Singapore consumers cutting back on
discretionary spending and compared to the initial rents signed
at Suntec Mall during more buoyant times, rents at Suntec Mall
will likely continue to be under pressure. Nevertheless, with the
recent appointment of Mr Chan Kong Leong formerly of
CapitaMalls Asia, recent changes in tenant mix including the
introduction of new to market retail brands, improved
marketing, greater number of events as well as better
engagement with its tenants, tenant sales and foot traffic have
improved. This should largely arrest the decline in rents,
signaling a potential a stabilisation of retail rents if the
improvement in tenant sales and foot traffic is sustained.
Secure income contribution from 177 Pacific Highway. Suntec
REIT’s 177 Pacific Highway property located in North Sydney
which was finally completed in August 2016 will provide
geographic diversification to its portfolio and improve the REIT’s
income stream. The property is anchored by Leighton Holdings
will take up 76% of the net lettable area for an approximate
lease period of 10 years.
30% stake in redevelopment of Park Mall offers development
upside. Suntec REIT completed the sale of Park Mall for S$412m
in 4Q15, and has taken a 30% stake in the JV which will
completely redevelop Park Mall into a commercial development
comprising two office towers with an ancillary retail podium.
Suntec REIT will subsequently have the option to acquire one of
the two office towers. While details of this redevelopment
project have yet to be finalised, acquisition of the office tower
will be a long-term growth driver for the REIT.
Recent acquisition of Southgate property in Melbourne. Suntec
REIT recently announced the acquisition of 25% stake in
Southgate, a mixed office retail property in Melbourne for
A$154.9m. This acquisition adds another leg of growth that will
mitigate the slowdown faced by Suntec REIT in Singapore.
Net Property Income and Margins (%)
Net Property Income and Margins (%)
Distribution Paid / Net Operating CF
Interest Cover (x)
Source: Company, DBS Bank
Page 283

ASIAN INSIGHTS VICKERS SECURITIES
Page 3
Company Guide
Suntec REIT
Balance Sheet:
Comfortable level of gearing. Post the acquisition of 25%
interest in the Southgate Complex, Suntec REIT’s gearing is
expected to stabilise around the 37% level.
Minimal refinancing needs in FY16-17. Suntec REIT has more
than 60% of its borrowings hedged and minimal refinancing
requirements for the remainder of FY16 and in FY17. As such,
the REIT is fairly well protected against near-term interest rate
volatility.
Share Price Drivers:
Better-than-expected performance at Suntec City retail. Higher
occupancy rates at Suntec City retail, as well as better-than-
expected rental reversions, would present upside to our
earnings estimates.
Acquisitions. The Manager could redeploy remaining proceeds
of c.S$284m from the divestment of Park Mall into yield-
accretive acquisitions, which would boost DPU growth and
diversify the REIT’s earnings base.
Key Risks:
Retail rental reversion risk. With a slowdown in retail sector,
rents at Suntec City Mall may face downward pressure causing
weakness in Suntec REIT’s DPU.
Vacancies at Suntec office. While we have flagged MBFC and
ORQ as key earnings risks in the Trust’s office portfolio, we
believe that occupancy and rents will remain stable at Suntec
Towers (office) due to its more differentiated product
offerings. Thanks to Suntec office’s staggered lease expiry
profile, any decline in rents will not be evident immediately.
However, higher vacancies could present some downside risks
to our earnings assumptions.
Company Background
Suntec REIT has a portfolio of office and retail properties in
Singapore and Australia. Its most prominent asset is Suntec
City, which comprises four office towers, a retail mall, and a
convention centre, located close to the city area of Singapore.
Aggregate Leverage (%)
ROE (%)
Distribution Yield (%)
PB Band (x)
Source: Company, DBS Bank
Page 284

ASIAN INSIGHTS VICKERS SECURITIES
Page 4
Company Guide
Suntec REIT
Income Statement (S$m)
FY Dec 2013A 2014A 2015A 2016F 2017F
Gross revenue 234 282 330 344 352
Property expenses (85.4) (90.8) (100) (101) (102)
Net Property Income 149 192 229 243 250
Other Operating expenses (57.7) (77.2) (59.1) (46.0) (46.8)
Other Non Opg (Exp)/Inc 20.1 19.3 13.8 0.0 0.0
Net Interest (Exp)/Inc (55.3) (44.8) (47.2) (43.6) (54.4)
Exceptional Gain/(Loss) 11.0 (3.4) 7.34 0.0 0.0
Net Income 239 225 244 210 219
Tax 4.72 (7.0) (6.7) (10.2) (11.7)
Minority Interest (17.6) 1.75 (12.1) (7.5) (7.9)
Preference Dividend 0.0 0.0 0.0 0.0 0.0
Net Income After Tax 226 219 225 192 200
Total Return 364 317 354 192 200
Non-tax deductible Items (172) (97.6) (121) 63.8 58.9
Net Inc available for Dist. 211 230 252 256 259
Growth & Ratio
Revenue Gth (%) (10.6) 20.6 16.7 4.3 2.5
N Property Inc Gth (%) (9.0) 28.9 19.6 5.8 3.1
Net Inc Gth (%) (6.7) (2.8) 2.7 (14.6) 3.8
Dist. Payout Ratio (%) 100.0 100.0 100.0 100.0 100.0
Net Prop Inc Margins (%) 63.5 67.9 69.6 70.6 71.0
Net Income Margins (%) 96.4 77.7 68.4 56.0 56.7
Dist to revenue (%) 90.2 81.5 76.5 74.6 73.5
Managers & Trustee’s fees to sales %)
24.7 27.3 17.9 13.4 13.3
ROAE (%) 4.7 4.3 4.2 3.6 3.7
ROA (%) 2.8 2.6 2.6 2.1 2.2
ROCE (%) 1.1 1.3 1.9 2.1 2.1
Int. Cover (x) 1.6 2.6 3.6 4.5 3.7
Source: Company, DBS Bank
Driven mainly from the contribution of 177 Pacific Highway and Southgate in Australia
Page 285

ASIAN INSIGHTS VICKERS SECURITIES
Page 5
Company Guide
Suntec REIT
Quarterly / Interim Income Statement (S$m)
FY Dec 3Q2015 4Q2015 1Q2016 2Q2016 3Q2016
Gross revenue 86.1 87.5 78.3 78.9 82.4
Property expenses (27.6) (25.1) (24.4) (26.3) (25.1)
Net Property Income 58.5 62.5 54.0 52.7 57.2
Other Operating expenses (12.4) (12.6) (12.3) (12.2) (13.0)
Other Non Opg (Exp)/Inc 1.01 1.17 0.0 0.0 0.0
Net Interest (Exp)/Inc (14.8) (10.6) (20.5) (9.1) (10.9)
Exceptional Gain/(Loss) 5.08 (2.9) (2.1) (1.7) 1.33
Net Income 51.2 94.1 35.0 46.2 55.3
Tax (2.0) (1.6) (1.3) (1.4) (1.7)
Minority Interest (2.3) (5.4) (1.3) (1.4) (1.4)
Net Income after Tax 46.9 87.1 32.4 43.4 52.2
Total Return 46.9 216 32.4 43.4 52.2
Non-tax deductible Items 12.1 11.8 14.7 16.0 8.13
Net Inc available for Dist. 63.6 228 51.1 67.4 64.3
Growth & Ratio
Revenue Gth (%) 6 2 (11) 1 4
N Property Inc Gth (%) 3 7 (14) (2) 9
Net Inc Gth (%) 6 86 (63) 34 20
Net Prop Inc Margin (%) 67.9 71.4 68.9 66.7 69.5
Dist. Payout Ratio (%) 100.0 100.0 100.0 100.0 100.0
Balance Sheet (S$m)
FY Dec 2013A 2014A 2015A 2016F 2017F Investment Properties 5,741 5,948 5,800 5,852 5,854
Other LT Assets 2,370 2,488 2,704 2,859 2,859
Cash & ST Invts 181 150 445 396 395
Inventory 0.01 0.0 0.0 0.0 0.0
Debtors 29.1 16.7 12.8 13.4 13.7
Other Current Assets 0.0 0.14 3.04 3.04 3.04
Total Assets 8,322 8,602 8,965 9,123 9,125
ST Debt
772 0.0 370 370 370
Creditor 91.2 107 108 109 110
Other Current Liab 20.8 23.3 21.7 30.6 32.1
LT Debt 2,389 2,981 2,843 3,048 3,098
Other LT Liabilities 64.0 73.0 60.2 60.2 60.2
Unit holders’ funds 4,844 5,305 5,444 5,380 5,321
Minority Interests 141 113 119 126 134
Total Funds & Liabilities 8,322 8,602 8,965 9,123 9,125
Non-Cash Wkg. Capital (82.9) (113) (114) (123) (125)
Net Cash/(Debt) (2,980) (2,831) (2,767) (3,022) (3,072)
Ratio
Current Ratio (x) 0.2 1.3 0.9 0.8 0.8
Quick Ratio (x) 0.2 1.3 0.9 0.8 0.8
Aggregate Leverage (%) 38.0 34.7 35.8 37.5 38.0
Z-Score (X) 0.8 0.9 0.9 0.8 0.8
Source: Company, DBS Bank
Gearing to inch higher to 38%
Page 286

ASIAN INSIGHTS VICKERS SECURITIES
Page 6
Company Guide
Suntec REIT
Cash Flow Statement (S$m)
FY Dec 2013A 2014A 2015A 2016F 2017F
Pre-Tax Income 239 225 244 210 219
Dep. & Amort. 0.0 0.0 0.0 0.0 0.0
Tax Paid (4.1) 0.0 (1.8) (1.3) (10.2)
Associates &JV Inc/(Loss) (172) (139) (100) (57.2) (70.5)
Chg in Wkg.Cap. (1.3) 14.4 3.70 0.25 0.87
Other Operating CF 91.2 95.7 85.3 0.0 0.0
Net Operating CF 153 196 231 152 140
Net Invt in Properties (189) (96.4) (40.8) (52.0) (2.0)
Other Invts (net) 0.0 0.0 304 0.0 0.0
Invts in Assoc. & JV 0.0 0.0 (15.0) (155) 0.0
Div from Assoc. & JVs 0.0 0.0 56.2 57.2 70.5
Other Investing CF (32.6) 30.5 (123) 0.0 0.0
Net Investing CF (222) (65.9) 181 (150) 68.5
Distribution Paid (208) (224) (247) (256) (259)
Chg in Gross Debt 260 98.2 139 205 50.0
New units issued 0.0 342 0.0 0.0 0.0
Other Financing CF (1.0) (376) (7.1) 0.0 0.0
Net Financing CF 50.6 (160) (115) (51.4) (209)
Currency Adjustments 0.0 (1.7) (1.7) 0.0 0.0
Chg in Cash (18.6) (31.6) 296 (49.2) (0.8)
Operating CFPS (S cts) 6.81 7.59 9.04 5.96 5.39
Free CFPS (S cts) (1.6) 4.15 7.57 3.93 5.34
Source: Company, DBS Bank
Target Price & Ratings History
Source: DBS Bank
Analyst: Mervin SONG CFA
Derek TAN
Page 287
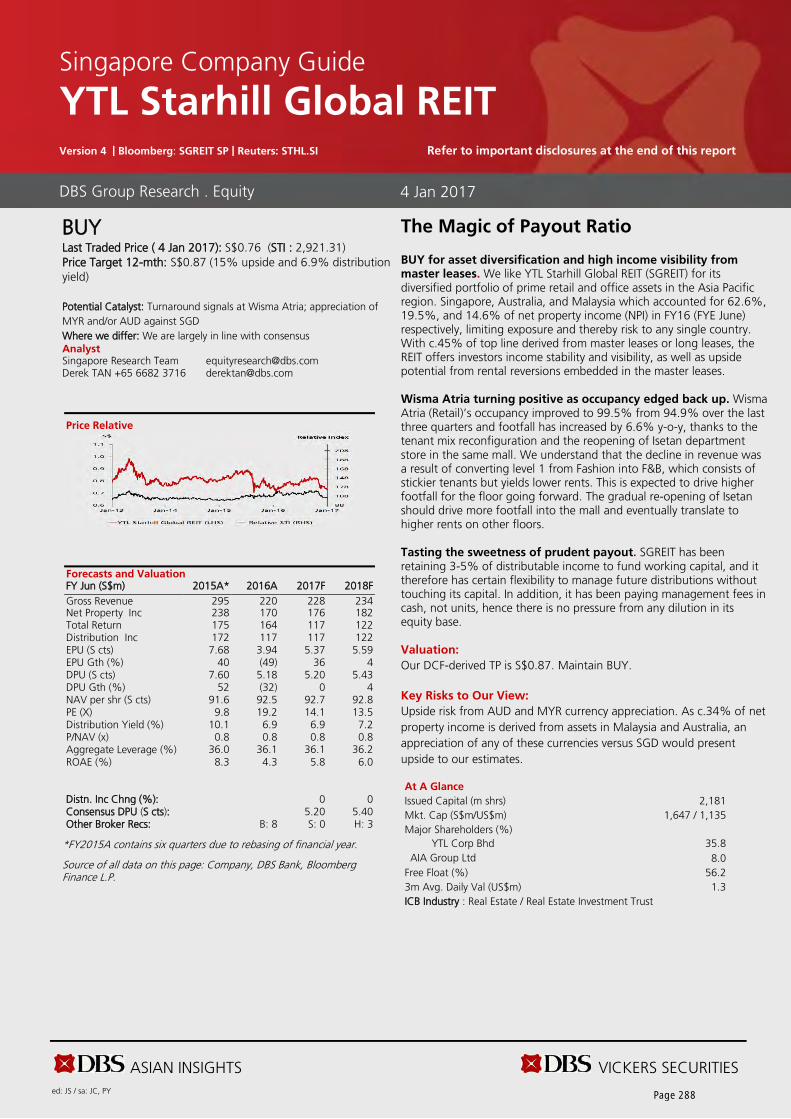
ASIAN INSIGHTS VICKERS SECURITIES ed: JS / sa: JC, PY
BUY
Last Traded Price ( 4 Jan 2017): S$0.76 (STI : 2,921.31)
Price Target 12-mth: S$0.87 (15% upside and 6.9% distribution
yield)
Potential Catalyst: Turnaround signals at Wisma Atria; appreciation of
MYR and/or AUD against SGD
Where we differ: We are largely in line with consensus
Analyst Singapore Research Team [email protected] Derek TAN +65 6682 3716 [email protected]
Price Relative
Forecasts and Valuation FY Jun (S$m) 2015A* 2016A 2017F 2018F
Gross Revenue 295 220 228 234 Net Property Inc 238 170 176 182 Total Return 175 164 117 122 Distribution Inc 172 117 117 122 EPU (S cts) 7.68 3.94 5.37 5.59 EPU Gth (%) 40 (49) 36 4 DPU (S cts) 7.60 5.18 5.20 5.43 DPU Gth (%) 52 (32) 0 4 NAV per shr (S cts) 91.6 92.5 92.7 92.8 PE (X) 9.8 19.2 14.1 13.5 Distribution Yield (%) 10.1 6.9 6.9 7.2 P/NAV (x) 0.8 0.8 0.8 0.8 Aggregate Leverage (%) 36.0 36.1 36.1 36.2 ROAE (%) 8.3 4.3 5.8 6.0 Distn. Inc Chng (%): 0 0 Consensus DPU (S cts): 5.20 5.40 Other Broker Recs: B: 8 S: 0 H: 3
*FY2015A contains six quarters due to rebasing of financial year.
Source of all data on this page: Company, DBS Bank, Bloomberg Finance L.P.
The Magic of Payout Ratio BUY for asset diversification and high income visibility from master leases. We like YTL Starhill Global REIT (SGREIT) for its diversified portfolio of prime retail and office assets in the Asia Pacific region. Singapore, Australia, and Malaysia which accounted for 62.6%, 19.5%, and 14.6% of net property income (NPI) in FY16 (FYE June) respectively, limiting exposure and thereby risk to any single country. With c.45% of top line derived from master leases or long leases, the REIT offers investors income stability and visibility, as well as upside potential from rental reversions embedded in the master leases. Wisma Atria turning positive as occupancy edged back up. Wisma Atria (Retail)’s occupancy improved to 99.5% from 94.9% over the last three quarters and footfall has increased by 6.6% y-o-y, thanks to the tenant mix reconfiguration and the reopening of Isetan department store in the same mall. We understand that the decline in revenue was a result of converting level 1 from Fashion into F&B, which consists of stickier tenants but yields lower rents. This is expected to drive higher footfall for the floor going forward. The gradual re-opening of Isetan should drive more footfall into the mall and eventually translate to higher rents on other floors. Tasting the sweetness of prudent payout. SGREIT has been retaining 3-5% of distributable income to fund working capital, and it therefore has certain flexibility to manage future distributions without touching its capital. In addition, it has been paying management fees in cash, not units, hence there is no pressure from any dilution in its equity base. Valuation:
Our DCF-derived TP is S$0.87. Maintain BUY.
Key Risks to Our View:
Upside risk from AUD and MYR currency appreciation. As c.34% of net
property income is derived from assets in Malaysia and Australia, an
appreciation of any of these currencies versus SGD would present
upside to our estimates. At A Glance Issued Capital (m shrs) 2,181
Mkt. Cap (S$m/US$m) 1,647 / 1,135
Major Shareholders (%)
YTL Corp Bhd 35.8
AIA Group Ltd 8.0
Free Float (%) 56.2
3m Avg. Daily Val (US$m) 1.3
ICB Industry : Real Estate / Real Estate Investment Trust
DBS Group Research . Equity
4 Jan 2017
Singapore Company Guide
YTL Starhill Global REIT Version 4 | Bloomberg: SGREIT SP | Reuters: STHL.SI Refer to important disclosures at the end of this report
Page 288

ASIAN INSIGHTS VICKERS SECURITIES
Page 2
Company Guide
YTL Starhill Global REIT
CRITICAL DATA POINTS TO WATCH
Earnings Drivers:
Strong performance from local assets. SGREIT is primarily
exposed to Ngee Ann City and Wisma Atria in Singapore, which
together account for 63% of top line and 68% of asset value.
These assets offer a mix of stability from Toshin’s master lease
at Ngee Ann City and upside potential from Wisma Atria,
whose shorter leases provide exposure to strong retailer
demand for prime Orchard Road space in Singapore.
Weaker reversions for Wisma Atria on the horizon. That said,
we would not be surprised if reversions in upcoming quarters
turn negative, as a portion of leases expiring in the year ahead
will come from fashion tenants on the first floor, whose
performances have been generally weak. These tenants are
more reticent about committing to space given (a) lacklustre
fashion sales, and (b) uncertainty over the outcome of the newly
renovated Isetan. However, we expect earnings at Wisma to still
see good growth, driven by stronger reversions from tenants on
the basement and second floors (selling watches & jewellery).
Growing presence in Australia. The REIT acquired Myer Centre
Adelaide for A$288m, located in Adelaide’s prime CBD retail
core, in May 2015. With the inclusion of the Myer Centre
acquisition, rental income contribution from Australia doubled
from 10% to 20% in FY16.
Visible earnings growth from rental reviews at master leased
assets. In FY16, the base rent for Toshin (master tenant at Ngee
Ann City, Singapore) increased 5.5%, whereas Katagree (master
tenant at Starhill Gallery and Lot 10, Malaysia) extended its
lease with 6.7% rental uplift. Looking ahead, SGREIT has annual
rent review for key tenants in Australia; David Jones’ next lease
review is in August 2017.
Net Property Income and Margins (%)
Net Property Income and Margins (%)
Distribution Paid / Net Operating CF
Interest Cover (x)
Source: Company, DBS Bank
Page 289

ASIAN INSIGHTS VICKERS SECURITIES
Page 3
Company Guide
YTL Starhill Global REIT
Balance Sheet:
Future acquisitions to be partly funded via equity. Gearing rose
to 35% after the acquisition of Myer Centre Adelaide. Given
the Manager’s comfortable range of 35% gearing, any further
acquisitions or developments could trigger an equity fund
raising exercise.
Debt free in FY2017. Weighted debt tenure is 3.4 years at an
average interest cost of 3.06%. With 96% of debt hedged into
fixed rates and less than 1% of total debt requiring refinancing
in FY16/17, exposure to volatile short rates is minimised.
Share Price Drivers:
Development/ AEI opportunities in Singapore and Australia. The
Manager has several AEI opportunities to improve portfolio
performance in the near and medium term. SGREIT will be
undertaking AEI works in Central Plaza, Perth, renovating the
shop façade to incorporate anchor tenants, as well as
converting some of the upper floors from office and storage to
retail use. Other potential development/AEI opportunities
include activating 116k sqft of vacant retail space in the fourth
and fifth floors of Myer Centre, Adelaide, as well as developing
the Spanish Steps between Wisma Atria and Ngee Ann City,
where the REIT has unutilised gross floor area of c.100k sqft.
Key Risks:
Currency risk. SGREIT’s overseas properties have been affected
by forex volatility and operational headwinds. In Malaysia and
Australia, stable underlying asset performance has been
masked by the depreciation of the MYR and AUD against the
SGD, resulting in currency translation losses and weaker DPU
performance.
Macroeconomic risks in China – retail oversupply and austerity
hits Chengdu asset. Contributions from Chengdu have been
hit by ongoing austerity measures and oversupply of retail
space, resulting in steady declining earnings contribution since
2013. The property in Chengdu has revalued downwards from
S$66.3m to S$44.7m as at 30 Jun 2016. The property will be
converted from a fashion retailer to a home furnishing mall,
with a 10-year tenancy. While the asset’s contribution to
portfolio NPI is expected to drop to 1% from 1.5%, we believe
the long-term tenancy has mitigated any further downside risk.
Company Background
Starhill Global REIT is a real estate investment trust that invests
in income-producing upscale retail and/or office assets in the
Asia Pacific region. In Singapore, it owns portions of Ngee Ann
City and Wisma Atria. It also owns assets in Malaysia, Australia,
Japan and China.
Aggregate Leverage (%)
ROE (%)
Distribution Yield (%)
PB Band (x)
Source: Company, DBS Bank
Page 290

ASIAN INSIGHTS VICKERS SECURITIES
Page 4
Company Guide
YTL Starhill Global REIT
Income Statement (S$m)
FY Jun 2014A 2015A 2016A 2017F 2018F
Gross revenue 201 295 220 228 234
Property expenses (42.8) (57.2) (49.4) (52.4) (52.5)
Net Property Income 158 238 170 176 182
Other Operating expenses (17.6) (26.5) (48.9) (21.8) (21.8)
Other Non Opg (Exp)/Inc 0.0 0.0 0.0 0.0 0.0
Net Interest (Exp)/Inc (29.6) (45.3) (37.9) (37.3) (38.2)
Exceptional Gain/(Loss) 4.68 (1.0) 0.0 0.0 0.0
Net Income 115 165 83.6 117 122
Tax (2.9) 0.56 2.32 0.40 0.41
Minority Interest 0.0 0.0 0.0 0.0 0.0
Preference Dividend 0.0 0.0 0.0 0.0 0.0
Net Income After Tax 112 165 85.9 117 122
Total Return 250 175 164 117 122
Non-tax deductible Items (139) (3.0) (47.4) 0.0 0.0
Net Inc available for Dist. 111 172 117 117 122
Growth & Ratio
Revenue Gth (%) 7.9 46.9 (25.5) 3.8 2.7
N Property Inc Gth (%) 6.3 50.5 (28.3) 3.2 3.4
Net Inc Gth (%) 5.1 47.1 (48.1) 36.2 4.2
Dist. Payout Ratio (%) 97.3 95.6 97.0 97.0 97.0
Net Prop Inc Margins (%) 78.7 80.6 77.5 77.0 77.6
Net Income Margins (%) 56.1 56.1 39.1 51.3 52.1
Dist to revenue (%) 55.3 58.2 53.0 51.3 52.1
Managers & Trustee’s fees to sales %)
8.8 9.0 22.2 9.5 9.3
ROAE (%) 5.8 8.3 4.3 5.8 6.0
ROA (%) 3.9 5.4 2.7 3.7 3.8
ROCE (%) 4.8 7.0 3.8 4.8 5.0
Int. Cover (x) 4.7 4.7 3.2 4.1 4.2
Source: Company, DBS Bank
FY2015 consists of 6 quarters due to the revision of its financial year end.
Room to increase payout ratio in order to maintain DPU when necessary
Page 291

ASIAN INSIGHTS VICKERS SECURITIES
Page 5
Company Guide
YTL Starhill Global REIT
Quarterly / Interim Income Statement (S$m)
FY Jun 1Q2016 2Q2016 3Q2016 4Q2016 1Q2017
Gross revenue 56.8 55.6 53.6 53.7 55.3
Property expenses (13.2) (11.9) (12.1) (12.3) (12.4)
Net Property Income 43.6 43.7 41.6 41.4 42.9
Other Operating expenses (4.9) (4.9) (4.7) (4.8) (4.9)
Other Non Opg (Exp)/Inc 0.0 0.0 0.0 0.0 0.0
Net Interest (Exp)/Inc (9.4) (9.5) (9.8) (9.2) (9.3)
Exceptional Gain/(Loss) (2.2) 1.74 (9.7) (19.4) (3.3)
Net Income 27.1 31.1 17.4 8.03 25.4
Tax (0.9) (0.9) (0.2) 4.21 (0.3)
Minority Interest 0.0 0.0 0.0 0.0 0.0
Net Income after Tax 26.2 30.2 17.2 12.2 25.1
Total Return 0.0 0.0 0.0 0.0 0.0
Non-tax deductible Items 3.81 (0.2) 10.7 (61.8) 4.33
Net Inc available for Dist. 28.6 28.8 27.5 28.1 28.4
Growth & Ratio
Revenue Gth (%) 10 (2) (4) 0 3
N Property Inc Gth (%) 6 0 (5) 0 4
Net Inc Gth (%) (7) 15 (43) (29) 105
Net Prop Inc Margin (%) 76.8 78.6 77.5 77.2 77.6
Dist. Payout Ratio (%) 95.1 95.8 98.3 98.9 96.3
Balance Sheet (S$m)
FY Jun 2014A 2015A 2016A 2017F 2018F Investment Properties 2,854 3,116 3,137 3,139 3,151
Other LT Assets 20.5 20.4 2.54 2.54 2.54
Cash & ST Invts 58.0 51.6 77.0 18.4 19.0
Inventory 0.0 0.0 0.0 0.0 0.0
Debtors 10.2 5.18 5.93 29.7 30.5
Other Current Assets 0.03 0.12 0.14 0.14 0.14
Total Assets 2,943 3,193 3,222 3,190 3,203
ST Debt
53.6 146 15.4 15.4 25.4
Creditor 43.0 37.2 39.5 3.53 3.63
Other Current Liab 2.14 2.23 2.66 2.66 2.66
LT Debt 792 983 1,108 1,108 1,108
Other LT Liabilities 41.9 41.9 39.5 39.5 39.5
Unit holders’ funds 2,010 1,983 2,018 2,021 2,025
Minority Interests 0.0 0.0 0.0 0.0 0.0
Total Funds & Liabilities 2,943 3,193 3,222 3,190 3,203
Non-Cash Wkg. Capital (35.0) (34.1) (36.1) 23.6 24.3
Net Cash/(Debt) (788) (1,078) (1,046) (1,105) (1,114)
Ratio
Current Ratio (x) 0.7 0.3 1.4 2.2 1.6
Quick Ratio (x) 0.7 0.3 1.4 2.2 1.6
Aggregate Leverage (%) 29.4 36.0 36.1 36.1 36.2
Z-Score (X) 1.1 1.0 0.9 1.0 1.0
Source: Company, DBS Bank
Revenue consists of a one-off compensation of S$1.9m from an early termination at Wisma Atria which has been filled up
Page 292

ASIAN INSIGHTS VICKERS SECURITIES
Page 6
Company Guide
YTL Starhill Global REIT
Cash Flow Statement (S$m)
FY Jun 2014A 2015A 2016A 2017F 2018F
Pre-Tax Income 115 165 83.6 117 122
Dep. & Amort. 0.0 0.0 0.28 0.0 0.0
Tax Paid (3.5) (3.8) (1.7) 0.40 0.41
Associates &JV Inc/(Loss) 0.0 0.0 0.0 0.0 0.0
Chg in Wkg.Cap. 24.6 52.3 73.1 (59.8) (0.7)
Other Operating CF 4.68 (1.0) 0.0 0.0 0.0
Net Operating CF 141 212 155 57.3 121
Net Invt in Properties (59.4) (317) 27.2 (2.3) (12.3)
Other Invts (net) 0.0 (0.8) 0.0 0.0 0.0
Invts in Assoc. & JV 0.0 0.0 0.0 0.0 0.0
Div from Assoc. & JVs 0.0 0.0 0.0 0.0 0.0
Other Investing CF 0.53 1.55 0.92 0.0 0.0
Net Investing CF (58.9) (316) 28.0 (2.3) (12.3)
Distribution Paid (100) (162) (113) (114) (118)
Chg in Gross Debt 38.4 308 (9.8) 0.0 10.0
New units issued 0.0 0.0 0.0 0.0 0.0
Other Financing CF (39.9) (45.9) (37.3) 0.0 0.0
Net Financing CF (102) 99.8 (160) (114) (108)
Currency Adjustments (1.8) (2.8) 2.15 0.0 0.0
Chg in Cash (21.3) (6.5) 25.4 (58.5) 0.62
Operating CFPS (S cts) 5.69 7.44 3.77 5.37 5.59
Free CFPS (S cts) 3.99 (4.8) 8.36 2.52 5.00
Source: Company, DBS Bank
Target Price & Ratings History
Source: DBS Bank
Analyst: Singapore Research Team
Derek TAN
S$10m AEI on Australia property
Page 293
Industry Focus
Singapore Developers & REITs
ASIAN INSIGHTS VICKERS SECURITIES Page 103
Research Team Directory Analyst Sector E-mail Regional Timothy Wong Head, Group Research [email protected] Joanne Goh Regional Equity Strategist [email protected] Paul Yong, CFA Transport [email protected] Ben Santoso Plantations, Animal Protein [email protected] Sachin Mittal Telecoms [email protected] Lim Sue Lin Banking [email protected] Chong Tjen-San, CFA infrastructure, Conglomerates [email protected] Hong Kong / China Carol Wu Head of Research, China Property [email protected] Alice Hui, CFA Deputy HOR, Consumer [email protected] Addison Dai Basic materials, Clean energy (wind power, nuclear) [email protected] Alexander Lee, CFA Strategy [email protected] Alison Fok Consumer [email protected] Andy Yee, CFA China Property [email protected] Chris Ko Small Mid Caps [email protected] Danielle Wang, CFA China Property [email protected] Dennis Lam Small Mid Caps [email protected] Eric Yee Consumer [email protected] Ian Chui Hong Kong Property [email protected] Jeff Yau, CFA Hong Kong Property [email protected] Keith Tsang Automobile, Infrastructure, Machinery [email protected] Ken HE, CFA China Property [email protected] Mark Kong, CFA Healthcare [email protected] Mavis Hui Consumer [email protected] Patricia Yeung Environmental, Industrial [email protected] Rachel Miu Automobile, Infrastructure, Machinery [email protected] Susanna Chui Telecom/Media/Tech [email protected] Tam Tsz-Wang, CFA Telecom/Media/Tech [email protected] Tony Wu, CFA Small Mid Caps [email protected] Trista Qin China Property [email protected] Indonesia Maynard Arif Head of Research, Strategy, Automotive, Consumer [email protected] Tiesha Narandha Putri Infrastructure, Transportation, Consumer [email protected] William Simadiputra Telecommunications, Mining [email protected] Benedictus Agung Swandono Banks and Multifinance [email protected] Research Team Infrastructure, Transportation, Consumer, Bank & Multifinance Plantation, Animal Protein, Telecommunications, Property & Industrial [email protected] Estate, Healthcare Malaysia Wong Ming Tek Executive Director [email protected] Bernard Ching Head of Malaysian Research [email protected] Cheah King Yoong, CFA Consumer, Gaming [email protected] Quah He Wei, CFA Property, Utilities [email protected] Toh Woo Kim Telecommunication, Media, Technology [email protected] Lynette Cheng Banks, Non-bank Financials [email protected] Marvin Khor Transport , Plantation [email protected] Ruzanna Faruk Auto, Rubber Glove [email protected] Inani Rozidin Oil & Gas [email protected] Singapore Janice Chua Head of Research, Strategy, Industrials [email protected] Andy Sim, CFA Consumer Services [email protected] Derek Tan Property, Reits [email protected] Ho Pei Hwa Industrials [email protected] Mervin Song, CFA Property, Reits [email protected] Rachel Tan Property, Healthcare [email protected] Suvro Sarkar Industrials, Transport [email protected] Allfie Yeo Consumer Services [email protected] Thailand Chanpen Sirithanarattanakul Head of Research, Strategy, Property, REITs [email protected] Thanawat Patchimkul Oversea research [email protected] Thaninee Satirareungchai Banking & Finance [email protected] Chaipat Thanawattano Energy & Utilities, Petrochemicals [email protected] Namida Artispong Food and Beverage, Tourism, Commerce [email protected] Wasu Mattanapotchanart Telecom, Property, REITs [email protected] Apichaya Ketruttanaborvorn Construction, Healthcare, Small-caps [email protected] Research Team Commerce, Electronics, Air Transportation, Small-caps [email protected] Korea Lee Eun Young Basic Materials, Utilities [email protected]
Page 294

Industry Focus
Singapore Developers & REITs
ASIAN INSIGHTS VICKERS SECURITIES Page 104
DBS Bank recommendations are based an Absolute Total Return* Rating system, defined as follows:
STRONG BUY (>20% total return over the next 3 months, with identifiable share price catalysts within this time frame)
BUY (>15% total return over the next 12 months for small caps, >10% for large caps)
HOLD (-10% to +15% total return over the next 12 months for small caps, -10% to +10% for large caps)
FULLY VALUED (negative total return i.e. > -10% over the next 12 months)
SELL (negative total return of > -20% over the next 3 months, with identifiable catalysts within this time frame)
Share price appreciation + dividends Completed Date: 6 Jan 2017 18:50:56 (SGT) Dissemination Date: 6 Jan 2017 20:15:55 (SGT) GENERAL DISCLOSURE/DISCLAIMER This report is prepared by DBS Bank Ltd. This report is solely intended for the clients of DBS Bank Ltd, DBS Vickers Securities (Singapore) Pte Ltd, its respective connected and associated corporations and affiliates only and no part of this document may be (i) copied, photocopied or duplicated in any form or by any means or (ii) redistributed without the prior written consent of DBS Bank Ltd. The research set out in this report is based on information obtained from sources believed to be reliable, but we (which collectively refers to DBS Bank Ltd, its respective connected and associated corporations, affiliates and their respective directors, officers, employees and agents (collectively, the “DBS Group”)) do not make any representation or warranty as to its accuracy, completeness or correctness. Opinions expressed are subject to change without notice. This document is prepared for general circulation. Any recommendation contained in this document does not have regard to the specific investment objectives, financial situation and the particular needs of any specific addressee. This document is for the information of addressees only and is not to be taken in substitution for the exercise of judgement by addressees, who should obtain separate independent legal or financial advice. The DBS Group accepts no liability whatsoever for any direct, indirect and/or consequential loss (including any claims for loss of profit) arising from any use of and/or reliance upon this document and/or further communication given in relation to this document. This document is not to be construed as an offer or a solicitation of an offer to buy or sell any securities. The DBS Group, along with its affiliates and/or persons associated with any of them may from time to time have interests in the securities mentioned in this document. The DBS Group may have positions in, and may effect transactions in securities mentioned herein and may also perform or seek to perform broking, investment banking and other banking services for these companies. Any valuations, opinions, estimates, forecasts, ratings or risk assessments herein constitutes a judgment as of the date of this report, and there can be no assurance that future results or events will be consistent with any such valuations, opinions, estimates, forecasts, ratings or risk assessments. The information in this document is subject to change without notice, its accuracy is not guaranteed, it may be incomplete or condensed and it may not contain all material information concerning the company (or companies) referred to in this report and the DBS Group is under no obligation to update the information in this report. This publication has not been reviewed or authorized by any regulatory authority in Singapore, Hong Kong or elsewhere. There is no planned schedule or frequency for updating research publication relating to any issuer. The valuations, opinions, estimates, forecasts, ratings or risk assessments described in this report were based upon a number of estimates and assumptions and are inherently subject to significant uncertainties and contingencies. It can be expected that one or more of the estimates on which the valuations, opinions, estimates, forecasts, ratings or risk assessments were based will not materialize or will vary significantly from actual results. Therefore, the inclusion of the valuations, opinions, estimates, forecasts, ratings or risk assessments described herein IS NOT TO BE RELIED UPON as a representation and/or warranty by the DBS Group (and/or any persons associated with the aforesaid entities), that: (a) such valuations, opinions, estimates, forecasts, ratings or risk assessments or their underlying assumptions will be achieved, and (b) there is any assurance that future results or events will be consistent with any such valuations, opinions, estimates, forecasts, ratings or risk
assessments stated therein. Please contact the primary analyst for valuation methodologies and assumptions associated with the covered companies or price targets. Any assumptions made in this report that refers to commodities, are for the purposes of making forecasts for the company (or companies) mentioned herein. They are not to be construed as recommendations to trade in the physical commodity or in the futures contract relating to the commodity referred to in this report. DBS Vickers Securities (USA) Inc ("DBSVUSA")"), a U.S.-registered broker-dealer, does not have its own investment banking or research department, has not participated in any public offering of securities as a manager or co-manager or in any other investment banking transaction in the past twelve months and does not engage in market-making.
Page 295
Industry Focus
Singapore Developers & REITs
ASIAN INSIGHTS VICKERS SECURITIES Page 105
ANALYST CERTIFICATION
The research analyst(s) primarily responsible for the content of this research report, in part or in whole, certifies that the views about the companies and their securities expressed in this report accurately reflect his/her personal views. The analyst(s) also certifies that no part of his/her compensation was, is, or will be, directly, or indirectly, related to specific recommendations or views expressed in the report. The DBS Group has procedures in place to eliminate, avoid and manage any potential conflicts of interests that may arise in connection with the production of research reports. As of 6 Jan 2017, the analyst(s) and his/her spouse and/or relatives who are financially dependent on the analyst(s), do not hold interests in the securities recommended in this report (“interest” includes direct or indirect ownership of securities). The research analyst(s) responsible for this report operates as part of a separate and independent team to the investment banking function of the DBS Group and procedures are in place to ensure that confidential information held by either the research or investment banking function is handled appropriately. COMPANY-SPECIFIC / REGULATORY DISCLOSURES
1. DBS Bank Ltd., DBS Vickers Securities (Singapore) Pte Ltd (“DBSVS”), their subsidiaries and/or other affiliates have proprietary positions in CapitaLand Commercial Trust, Frasers Commercial Trust, Keppel REIT, Suntec REIT, CapitaLand Retail China Trust, CapitaLand Mall Trust, Croesus Retail Trust, Frasers Centrepoint Trust, SPH REIT, Mapletree Commercial Trust, Mapletree Greater China Commercial Trust, YTL Starhill Global REIT, Ascendas REIT, Cache Logistics Trust, Cambridge Industrial Trust, Frasers Logistics & Industrial Trust, Mapletree Industrial Trust, Mapletree Logistics Trust, Soilbuild Business Space Reit, Ascendas Hospitality Trust, Ascott Residence Trust, CDL Hospitality Trusts, Far East Hospitality Trust, Frasers Hospitality Trust, OUE Hospitality Trust, Parkway Life Real Estate Investment Trust, RHT Health Trust, Keppel DC REIT, Manulife US REIT, CapitaLand, City Development, Global Logistic Properties, UOL Group, Wing Tai recommended in this report as of 30 Nov 2016.
2. DBS Bank Ltd does not market make in equity securities of the issuer(s) or company(ies) mentioned in this Research Report.
3. DBS Bank Ltd, DBS Vickers Securities (Singapore) Pte Ltd (''DBSVS''), their subsidiaries and/or other affiliates have a net long position exceeding 0.5% of the total issued share capital in Frasers Commercial Trust, CapitaLand Retail China Trust, Croesus Retail Trust, Mapletree Greater China Commercial Trust, YTL Starhill Global REIT, Ascendas REIT, Frasers Logistics & Industrial Trust, Mapletree Logistics Trust, Soilbuild Business Space Reit, Ascott Residence Trust, CDL Hospitality Trusts, Frasers Hospitality Trust, RHT Health Trust, Keppel DC REIT, Manulife US REIT, CapitaLand recommended in this report as of 30 Nov 2016.
4. DBS Bank Ltd., DBSVS, DBSVUSA, their subsidiaries and/or other affiliates beneficially own a total of 1% of any class of common equity securities of Frasers Commercial Trust, Croesus Retail Trust, YTL Starhill Global REIT, Frasers Logistics & Industrial Trust, Soilbuild Business Space Reit, Ascott Residence Trust, CDL Hospitality Trusts, Frasers Hospitality Trust, Keppel DC REIT, Manulife US REIT as of 30 Nov 2016.
5. DBS Bank Ltd., DBSVS, DBSVUSA, their subsidiaries and/or other affiliates beneficially own a total of 5% of any class of common equity securities of Croesus Retail Trust as of 30 Nov 2016. Compensation for investment banking services:
6.
DBS Bank Ltd., DBSVS, their subsidiaries and/or other affiliates of DBSVUSA have received compensation, within the past 12 months for investment banking services from CapitaLand Commercial Trust, Frasers Commercial Trust, OUE Commercial REIT, CapitaLand Mall Trust, Croesus Retail Trust, Mapletree Commercial Trust, Mapletree Greater China Commercial Trust, YTL Starhill Global REIT, Ascendas REIT, Frasers Logistics & Industrial Trust, Mapletree Industrial Trust, Mapletree Logistics Trust, Soilbuild Business Space Reit, Ascendas Hospitality Trust, Ascott Residence Trust, Frasers Hospitality Trust, OUE Hospitality Trust, Parkway Life Real Estate Investment Trust, RHT Health Trust, Keppel DC REIT, Manulife US REIT, City Development, United Engineers as of 30 Nov 2016.
7. DBS Bank Ltd., DBSVS, their subsidiaries and/or other affiliates of DBSVUSA have managed or co-managed a public offering of securities for CapitaLand Commercial Trust, Frasers Commercial Trust, Suntec REIT, CapitaLand Mall Trust, Croesus Retail Trust, Mapletree Commercial Trust, Mapletree Greater China Commercial Trust, YTL Starhill Global REIT, Ascendas REIT, Frasers Logistics & Industrial Trust, Mapletree Industrial Trust, Mapletree Logistics Trust, Soilbuild Business Space Reit, Ascendas Hospitality Trust, Ascott Residence Trust, Frasers Hospitality Trust, OUE Hospitality Trust, Parkway Life Real Estate Investment Trust, RHT Health Trust, Keppel DC REIT, Manulife US REIT, City Development, United Engineers in the past 12 months, as of 30 Nov 2016
8. DBSVUSA does not have its own investment banking or research department, nor has it participated in any public offering of securities as a manager or co-manager or in any other investment banking transaction in the past twelve months. Any US persons wishing to obtain further information, including any clarification on disclosures in this disclaimer, or to effect a transaction in any security discussed in this document should contact DBSVUSA exclusively.
Directorship/trustee interests
9. Euleen Goh Yiu Kiang, a member of DBS Group Holdings Board of Directors, is a Non-Exec Director of CapitaLand as of 1 Jan 2017.
Page 296

Industry Focus
Singapore Developers & REITs
ASIAN INSIGHTS VICKERS SECURITIES Page 106
10 Disclosure of previous investment recommendation produced
DBS Bank Ltd, DBS Vickers Securities (Singapore) Pte Ltd (''DBSVS''), their subsidiaries and/or other affiliates may have published other investment recommendations in respect of the same securities / instruments recommended in this research report during the preceding 12 months. Please contact the primary analyst listed in the first page of this report to view previous investment recommendations published by DBS Bank Ltd, DBS Vickers Securities (Singapore) Pte Ltd (''DBSVS''), their subsidiaries and/or other affiliates in the preceding 12 months.
RESTRICTIONS ON DISTRIBUTION
General This report is not directed to, or intended for distribution to or use by, any person or entity who is a citizen or resident of or located in any locality, state, country or other jurisdiction where such distribution, publication, availability or use would be contrary to law or regulation.
Australia This report is being distributed in Australia by DBS Bank Ltd. (“DBS”) or DBS Vickers Securities (Singapore) Pte Ltd (“DBSVS”), both of which are exempted from the requirement to hold an Australian Financial Services Licence under the Corporation Act 2001 (“CA”) in respect of financial services provided to the recipients. Both DBS and DBSVS are regulated by the Monetary Authority of Singapore under the laws of Singapore, which differ from Australian laws. Distribution of this report is intended only for “wholesale investors” within the meaning of the CA.
Hong Kong This report is being distributed in Hong Kong by or on behalf of, and is attributable to DBS Vickers (Hong Kong) Limited which is licensed and regulated by the Hong Kong Securities and Futures Commission and/or by DBS Bank (Hong Kong) Limited which is regulated by the Hong Kong Monetary Authority and the Securities and Futures Commission. Where this publication relates to a research report, unless otherwise stated in the research report(s), DBS Bank (Hong Kong) Limited is not the issuer of the research report(s). This publication including any research report(s) is/are distributed on the express understanding that, whilst the information contained within is believed to be reliable, the information has not been independently verified by DBS Bank (Hong Kong) Limited. This report is intended for distribution in Hong Kong only to professional investors (as defined in the Securities and Futures Ordinance (Chapter 571 of the Laws of Hong Kong) and any rules promulgated thereunder.) For any query regarding the materials herein, please contact Paul Yong (CE. No. ASE988) at [email protected].
Indonesia This report is being distributed in Indonesia by PT DBS Vickers Securities Indonesia.
Malaysia This report is distributed in Malaysia by AllianceDBS Research Sdn Bhd ("ADBSR"). Recipients of this report, received from ADBSR are to contact the undersigned at 603-2604 3333 in respect of any matters arising from or in connection with this report. In addition to the General Disclosure/Disclaimer found at the preceding page, recipients of this report are advised that ADBSR (the preparer of this report), its holding company Alliance Investment Bank Berhad, their respective connected and associated corporations, affiliates, their directors, officers, employees, agents and parties related or associated with any of them may have positions in, and may effect transactions in the securities mentioned herein and may also perform or seek to perform broking, investment banking/corporate advisory and other services for the subject companies. They may also have received compensation and/or seek to obtain compensation for broking, investment banking/corporate advisory and other services from the subject companies.
Wong Ming Tek, Executive Director, ADBSR
Page 297

Industry Focus
Singapore Developers & REITs
ASIAN INSIGHTS VICKERS SECURITIES Page 107
Singapore This report is distributed in Singapore by DBS Bank Ltd (Company Regn. No. 196800306E) or DBSVS (Company Regn No.
198600294G), both of which are Exempt Financial Advisers as defined in the Financial Advisers Act and regulated by the Monetary Authority of Singapore. DBS Bank Ltd and/or DBSVS, may distribute reports produced by its respective foreign entities, affiliates or other foreign research houses pursuant to an arrangement under Regulation 32C of the Financial Advisers Regulations. Where the report is distributed in Singapore to a person who is not an Accredited Investor, Expert Investor or an Institutional Investor, DBS Bank Ltd accepts legal responsibility for the contents of the report to such persons only to the extent required by law. Singapore recipients should contact DBS Bank Ltd at 6327 2288 for matters arising from, or in connection with the report.
Thailand This report is being distributed in Thailand by DBS Vickers Securities (Thailand) Co Ltd. Research reports distributed are only intended for institutional clients only and no other person may act upon it.
United Kingdom
This report is produced by DBS Bank Ltd which is regulated by the Monetary Authority of Singapore. This report is disseminated in the United Kingdom by DBS Vickers Securities (UK) Ltd, ("DBSVUK"). DBSVUK is authorised and regulated by the Financial Conduct Authority in the United Kingdom. In respect of the United Kingdom, this report is solely intended for the clients of DBSVUK, its respective connected and associated corporations and affiliates only and no part of this document may be (i) copied, photocopied or duplicated in any form or by any means or (ii) redistributed without the prior written consent of DBSVUK. This communication is directed at persons having professional experience in matters relating to investments. Any investment activity following from this communication will only be engaged in with such persons. Persons who do not have professional experience in matters relating to investments should not rely on this communication.
Dubai
This research report is being distributed in The Dubai International Financial Centre (“DIFC”) by DBS Bank Ltd., (DIFC Branch) having its office at PO Box 506538, 3rd Floor, Building 3, East Wing, Gate Precinct, Dubai International Financial Centre (DIFC), Dubai, United Arab Emirates. DBS Bank Ltd., (DIFC Branch) is regulated by The Dubai Financial Services Authority. This research report is intended only for professional clients (as defined in the DFSA rulebook) and no other person may act upon it.
United States This report was prepared by DBS Bank Limited. DBSVUSA did not participate in its preparation. The research analyst(s) named on this report are not registered as research analysts with FINRA and are not associated persons of DBSVUSA. The research analyst(s) are not subject to FINRA Rule 2241 restrictions on analyst compensation, communications with a subject company, public appearances and trading securities held by a research analyst. This report is being distributed in the United States by DBSVUSA, which accepts responsibility for its contents. This report may only be distributed to Major U.S. Institutional Investors (as defined in SEC Rule 15a-6) and to such other institutional investors and qualified persons as DBSVUSA may authorize. Any U.S. person receiving this report who wishes to effect transactions in any securities referred to herein should contact DBSVUSA directly and not its affiliate.
Other jurisdictions
In any other jurisdictions, except if otherwise restricted by laws or regulations, this report is intended only for qualified, professional, institutional or sophisticated investors as defined in the laws and regulations of such jurisdictions.
DBS Bank Ltd. 12 Marina Boulevard, Marina Bay Financial Centre Tower 3
Singapore 018982 Tel. 65-6878 8888
e-mail: [email protected] Company Regn. No. 196800306E
Page 298

Industry Focus
Singapore Developers & REITs
ASIAN INSIGHTS VICKERS SECURITIES Page 108
Asian Equities Sales, Sales Trading and Research Contacts Sales Heads Tel: Email: Singapore Kenneth Tang 65-6398 6951 [email protected] Hong Kong Andrew Au 852-2820 4992 [email protected] London Graham Booth 44-20-7618 1881 [email protected] New York Elaine Yu 1-212-826 3553 [email protected] Thailand Narisara Viseskosin 662 657 7759 [email protected] Sales Trading Contacts Tel: Email: Singapore Vivian Goh 65-6398 6927 [email protected] Hong Kong Franco Law 852-2971 1828 [email protected] London Charles Davies 44 20 7618 1883 [email protected] New York Brenda Wong 1 212 826 3558 [email protected] Research Contacts Tel: Email: Regional Timothy Wong 65 6682 3691 [email protected] Singapore Janice Chua 65 6682 3692 [email protected] Hong Kong Carol Wu 852-2863 8841 [email protected] Malaysia Wong Ming Tek 603-2711 0956 [email protected] Thailand Chanpen Sirithanarattanakul 662-657 7824 [email protected] Indonesia Maynard Priajaya Arif 6221 3003 4930 [email protected] DBS Vickers Securities – Regional Offices HONG KONG MALAYSIA SINGAPORE DBS Vickers (Hong Kong) Ltd AllianceDBS Research Sdn Bhd DBS Bank Ltd 18th Floor Man Yee Building 19th Floor, Menara Multi-Purpose 12 Marina Boulevard 68 Des Voeux Road Central Capital Square, 8 Jalan Munshi Abdullah Level 40, Marina Bay Financial Central Tower 3 Central, Hong Kong 50100 Kuala Lumpur Singapore 018982 Tel: 852-2820 4888 Tel: 603 2604 3333 Tel: 65-6878 8888 Fax: 852-2868 1523 Fax: 603 2604 3921 Member of The Stock Exchange of Hong Kong INDONESIA THAILAND PT DBS Vickers Securities (Indonesia) DBS Vickers Securities (Thailand) Co Ltd DBS Bank Tower, Ciputra World 1, 32/F 15th Floor Siam Tower Jl. Prof. Dr. Satrio Kav. 3-5, 989 Rama 1 Road Jakarta 10350, Indonesia Pathumwan, Bangkok 10330 Tel. 6221-3003 4900, Tel: 66-2-658 1222 Fax: 6221-3003 4943 Fax: 66-2-658 1269 UNITED STATES UNITED KINGDOM DBS Vickers Securities (USA) Inc DBS Vickers Securities (UK) Ltd 777 Third Avenue 4th Floor Paternoster House Suite 26A 65 St Paul's Churchyard New York, New York 10017 London EC4M 8AB United Kingdom Tel: 1-212-826 1888 Tel: 44-20-7618 1888 Fax: 1-212-826 8704 Fax: 44-20-7618 1900 Member of FINRA and SIPC The Financial Conduct Authority (FCA)
Page 299
Copyright © 2022 FDOKUMEN

