


Bahasa
Halaman
Hukum

Ecotoxicology and Environmental Safety 89 (2013) 95–107
Contents lists available at SciVerse ScienceDirect
Ecotoxicology and Environmental Safety
0147-65
http://d
n Corr
E-m
tgkazi@
sngeo@
journal homepage: www.elsevier.com/locate/ecoenv
Simultaneously evaluate the toxic levels of fluoride and arsenic speciesin underground water of Tharparkar and possible contaminant sources:A multivariate study
Kapil Dev Brahman a,n, Tasneem Gul Kazi a,n, Hassan Imran Afridi a, Shahid Naseem b,Sadia Sadaf Arain a, Sham Kumar Wadhwa a, Faheem Shah a
a National Center of Excellence in Analytical Chemistry, University of Sindh, Jamshoro 76080, Pakistanb Department of Geology, University of Karachi, Karachi 75270, Pakistan
a r t i c l e i n f o
Article history:
Received 3 September 2012
Received in revised form
20 November 2012
Accepted 22 November 2012Available online 21 January 2013
Keywords:
Arsenic
Fluoride
Speciation
Sodium absorption ratio
Saturation index
13/$ - see front matter & 2012 Elsevier Inc. A
x.doi.org/10.1016/j.ecoenv.2012.11.023
esponding authors. Fax: þ92 22 2771560.
ail addresses: [email protected] (K.D. B
yahoo.com (T.G. Kazi), hassanimranafridi@ya
yahoo.com (S. Naseem), [email protected]
a b s t r a c t
The present study investigated total arsenic (tAs), inorganic arsenic (iAs) species and fluoride ion (F�)
contamination in underground water of Mithi and Nangarparkar subdistricts of Tharparkar, Pakistan.
Statistical parameters, principal component analysis, cluster analysis, sodium absorption ratio and
saturation indices (SI) were used to detect interrelation and sources of concentration of tAs, iAs
species (As3þ and As5þ), F� and others physicochemical parameters. The concentration of As3þ was
measured by cloud point extraction using ammonium pyrrolidinedithiocarbamate (APDC) as com-
plexing reagent, while inorganic arsenic (iAs) was determined by solid phase extraction, using
titanium dioxide. The positive correlation was observed between F� contents with As species and
other major ions, found in the underground water of the study area. The resulted data indicated that
underground water samples of two areas of Tharparkar were severely contaminated with arsenic
(0.100–3.83 mg/L) and fluoride ion (13.8–49.3 mg/L), which were exceeded the World Health
Organization provisional guideline values, 0.01 mg/L and 1.5 mg/L, respectively. The SI of fluorite
and calcite in the underground water samples showed that most of the samples were oversaturated
with respect to calcite and fluorite.
& 2012 Elsevier Inc. All rights reserved.
1. Introduction
Water is called matrix of life because it is an essential part ofall living systems and is the medium from which life evolved andexists (Franks, 2000). Underground water is the major source ofdrinking water and also used as the alternative source foragricultural and industrial sector in the whole world (Mishraand Bhatt, 2008).
In aquatic systems, elements are present as dissolved ions andcomplexes, suspended, colloids ions and solid in sediments.Concentrations of these ions strongly depend on biologicalprocesses, redox potential, ionic strength, pH, activities of organicand inorganic chelators as well as scavenging processes (Arjonillaet al., 1994).
Arsenic (As) is a toxic element and its aquatic contamination hasbeen receiving worldwide attention by the scientific community(Baig et al., 2009a). The literature studies show that the arsenic in
ll rights reserved.
rahman),
hoo.com (H.I. Afridi),
m (S.S. Arain).
water poses the health hazards to humans, creates non-cancereffects such as hyper-and hypo-pigmentation, keratosis, black footdisease, hypertension, cardiovascular diseases and diabetes, andalso typical skin, lung and bladder cancers (Abernathy et al., 2003;WHO, 2011). High contaminated As in water was observed inBangladesh, India, Argentina, Mexico, Mongolia, Germany, Thailand,China, Chile, USA, Canada, Hungary, Romania Vietnam and Pakistan(Baig et al., 2009b; Berg et al., 2007; Nickson et al., 2005; Dang et al.,2004; Farooqi et al., 2007).
In water, As occurs as inorganic (predominantly As3þ andAs5þ) and organic forms (methyl and dimethyl arsenic com-pounds). In general, inorganic As compounds are much morehazardous than organic As compounds (Vega et al., 2001).The speciation of As is very important for the assessment oftoxicological and environmental impacts of As (Hu et al., 2008;Murata et al., 2005; Zhang et al., 2004).
Fluoride (F�) in small amounts is an essential component fornormal mineralization of bones and formation of dental enamel(Wood, 1974). The main source of F� for human body isusually drinking water, covering about 75–90% of daily intake(Zohouri and Rugg-Gunn, 2000). Excessive F� intake level causesfluorosis (Chen et al., 1997), cancer, arthritis and other diseases
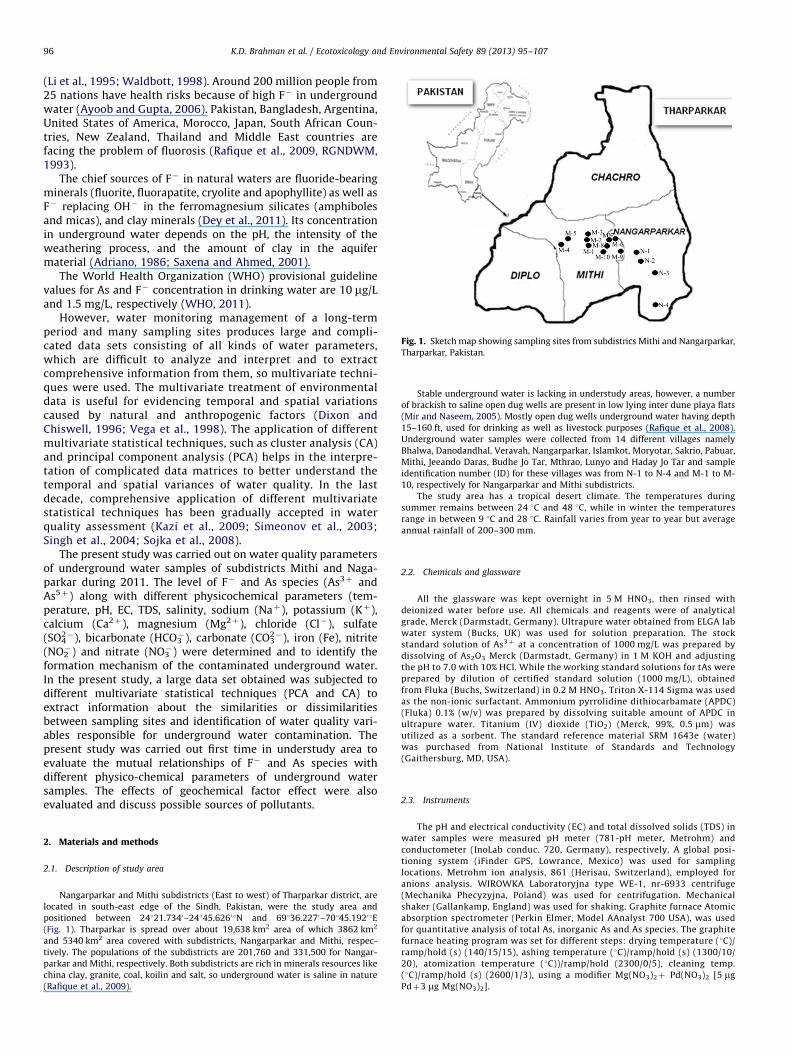
Fig. 1. Sketch map showing sampling sites from subdistrics Mithi and Nangarparkar,
Tharparkar, Pakistan.
K.D. Brahman et al. / Ecotoxicology and Environmental Safety 89 (2013) 95–10796
(Li et al., 1995; Waldbott, 1998). Around 200 million people from25 nations have health risks because of high F� in undergroundwater (Ayoob and Gupta, 2006). Pakistan, Bangladesh, Argentina,United States of America, Morocco, Japan, South African Coun-tries, New Zealand, Thailand and Middle East countries arefacing the problem of fluorosis (Rafique et al., 2009, RGNDWM,1993).
The chief sources of F� in natural waters are fluoride-bearingminerals (fluorite, fluorapatite, cryolite and apophyllite) as well asF� replacing OH� in the ferromagnesium silicates (amphibolesand micas), and clay minerals (Dey et al., 2011). Its concentrationin underground water depends on the pH, the intensity of theweathering process, and the amount of clay in the aquifermaterial (Adriano, 1986; Saxena and Ahmed, 2001).
The World Health Organization (WHO) provisional guidelinevalues for As and F� concentration in drinking water are 10 mg/Land 1.5 mg/L, respectively (WHO, 2011).
However, water monitoring management of a long-termperiod and many sampling sites produces large and compli-cated data sets consisting of all kinds of water parameters,which are difficult to analyze and interpret and to extractcomprehensive information from them, so multivariate techni-ques were used. The multivariate treatment of environmentaldata is useful for evidencing temporal and spatial variationscaused by natural and anthropogenic factors (Dixon andChiswell, 1996; Vega et al., 1998). The application of differentmultivariate statistical techniques, such as cluster analysis (CA)and principal component analysis (PCA) helps in the interpre-tation of complicated data matrices to better understand thetemporal and spatial variances of water quality. In the lastdecade, comprehensive application of different multivariatestatistical techniques has been gradually accepted in waterquality assessment (Kazi et al., 2009; Simeonov et al., 2003;Singh et al., 2004; Sojka et al., 2008).
The present study was carried out on water quality parametersof underground water samples of subdistricts Mithi and Naga-parkar during 2011. The level of F� and As species (As3þ andAs5þ) along with different physicochemical parameters (tem-perature, pH, EC, TDS, salinity, sodium (Naþ), potassium (Kþ),calcium (Ca2þ), magnesium (Mg2þ), chloride (Cl�), sulfate(SO4
2�), bicarbonate (HCO3�), carbonate (CO3
2�), iron (Fe), nitrite(NO2
�) and nitrate (NO3�) were determined and to identify the
formation mechanism of the contaminated underground water.In the present study, a large data set obtained was subjected todifferent multivariate statistical techniques (PCA and CA) toextract information about the similarities or dissimilaritiesbetween sampling sites and identification of water quality vari-ables responsible for underground water contamination. Thepresent study was carried out first time in understudy area toevaluate the mutual relationships of F� and As species withdifferent physico-chemical parameters of underground watersamples. The effects of geochemical factor effect were alsoevaluated and discuss possible sources of pollutants.
2. Materials and methods
2.1. Description of study area
Nangarparkar and Mithi subdistricts (East to west) of Tharparkar district, are
located in south-east edge of the Sindh, Pakistan, were the study area and
positioned between 24121.7340–24145.62601N and 69136.2270–70145.19201E
(Fig. 1). Tharparkar is spread over about 19,638 km2 area of which 3862 km2
and 5340 km2 area covered with subdistricts, Nangarparkar and Mithi, respec-
tively. The populations of the subdistricts are 201,760 and 331,500 for Nangar-
parkar and Mithi, respectively. Both subdistricts are rich in minerals resources like
china clay, granite, coal, koilin and salt, so underground water is saline in nature
(Rafique et al., 2009).
Stable underground water is lacking in understudy areas, however, a number
of brackish to saline open dug wells are present in low lying inter dune playa flats
(Mir and Naseem, 2005). Mostly open dug wells underground water having depth
15–160 ft, used for drinking as well as livestock purposes (Rafique et al., 2008).
Underground water samples were collected from 14 different villages namely
Bhalwa, Danodandhal, Veravah, Nangarparkar, Islamkot, Moryotar, Sakrio, Pabuar,
Mithi, Jeeando Daras, Budhe Jo Tar, Mthrao, Lunyo and Haday Jo Tar and sample
identification number (ID) for these villages was from N-1 to N-4 and M-1 to M-
10, respectively for Nangarparkar and Mithi subdistricts.
The study area has a tropical desert climate. The temperatures during
summer remains between 24 1C and 48 1C, while in winter the temperatures
range in between 9 1C and 28 1C. Rainfall varies from year to year but average
annual rainfall of 200–300 mm.
2.2. Chemicals and glassware
All the glassware was kept overnight in 5 M HNO3, then rinsed with
deionized water before use. All chemicals and reagents were of analytical
grade, Merck (Darmstadt, Germany). Ultrapure water obtained from ELGA lab
water system (Bucks, UK) was used for solution preparation. The stock
standard solution of As3þ at a concentration of 1000 mg/L was prepared by
dissolving of As2O3 Merck (Darmstadt, Germany) in 1 M KOH and adjusting
the pH to 7.0 with 10% HCl. While the working standard solutions for tAs were
prepared by dilution of certified standard solution (1000 mg/L), obtained
from Fluka (Buchs, Switzerland) in 0.2 M HNO3. Triton X-114 Sigma was used
as the non-ionic surfactant. Ammonium pyrrolidine dithiocarbamate (APDC)
(Fluka) 0.1% (w/v) was prepared by dissolving suitable amount of APDC in
ultrapure water. Titanium (IV) dioxide (TiO2) (Merck, 99%, 0.5 mm) was
utilized as a sorbent. The standard reference material SRM 1643e (water)
was purchased from National Institute of Standards and Technology
(Gaithersburg, MD, USA).
2.3. Instruments
The pH and electrical conductivity (EC) and total dissolved solids (TDS) in
water samples were measured pH meter (781-pH meter, Metrohm) and
conductometer (InoLab conduc. 720, Germany), respectively. A global posi-
tioning system (iFinder GPS, Lowrance, Mexico) was used for sampling
locations. Metrohm ion analysis, 861 (Herisau, Switzerland), employed for
anions analysis. WIROWKA Laboratoryjna type WE-1, nr-6933 centrifuge
(Mechanika Phecyzyjna, Poland) was used for centrifugation. Mechanical
shaker (Gallankamp, England) was used for shaking. Graphite furnace Atomic
absorption spectrometer (Perkin Elmer, Model AAnalyst 700 USA), was used
for quantitative analysis of total As, inorganic As and As species. The graphite
furnace heating program was set for different steps: drying temperature (1C)/
ramp/hold (s) (140/15/15), ashing temperature (1C)/ramp/hold (s) (1300/10/
20), atomization temperature (1C))/ramp/hold (2300/0/5), cleaning temp.
(1C)/ramp/hold (s) (2600/1/3), using a modifier Mg(NO3)2þ Pd(NO3)2 [5 mg
Pdþ3 mg Mg(NO3)2].
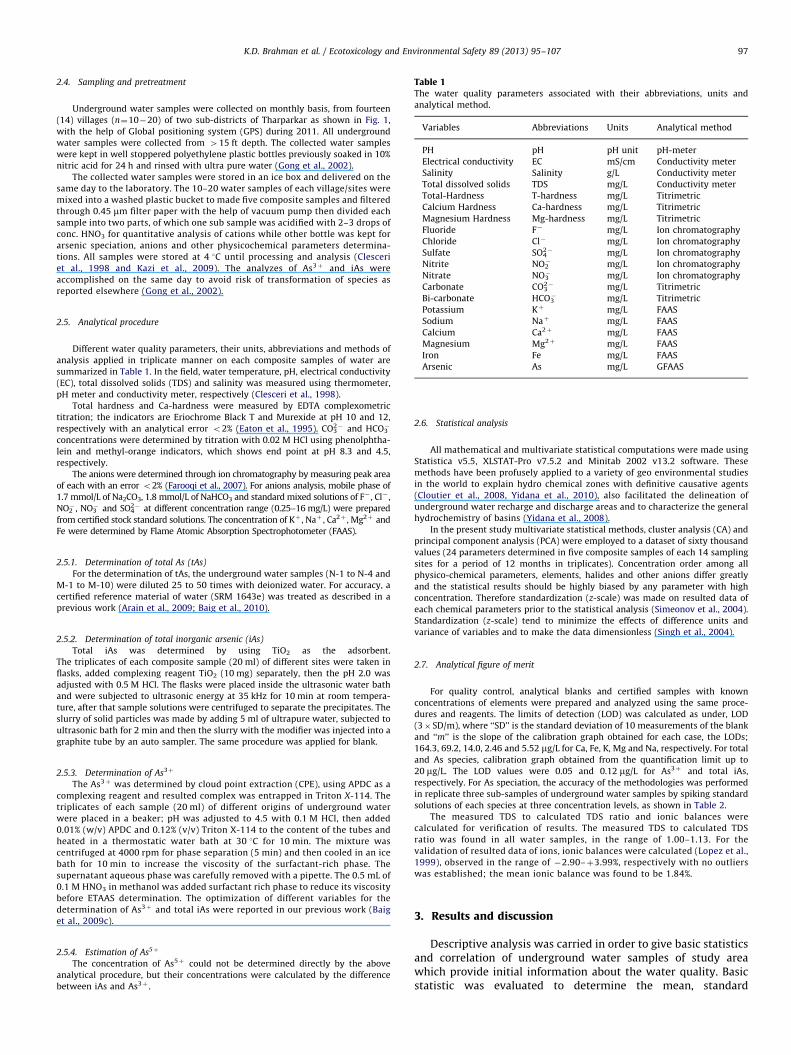
Table 1The water quality parameters associated with their abbreviations, units and
analytical method.
Variables Abbreviations Units Analytical method
PH pH pH unit pH-meter
Electrical conductivity EC mS/cm Conductivity meter
Salinity Salinity g/L Conductivity meter
Total dissolved solids TDS mg/L Conductivity meter
Total-Hardness T-hardness mg/L Titrimetric
Calcium Hardness Ca-hardness mg/L Titrimetric
Magnesium Hardness Mg-hardness mg/L Titrimetric
Fluoride F� mg/L Ion chromatography
Chloride Cl� mg/L Ion chromatography
Sulfate SO42� mg/L Ion chromatography
Nitrite NO2� mg/L Ion chromatography
Nitrate NO3� mg/L Ion chromatography
Carbonate CO32� mg/L Titrimetric
Bi-carbonate HCO3� mg/L Titrimetric
Potassium Kþ mg/L FAAS
Sodium Naþ mg/L FAAS
Calcium Ca2þ mg/L FAAS
Magnesium Mg2þ mg/L FAAS
Iron Fe mg/L FAAS
Arsenic As mg/L GFAAS
K.D. Brahman et al. / Ecotoxicology and Environmental Safety 89 (2013) 95–107 97
2.4. Sampling and pretreatment
Underground water samples were collected on monthly basis, from fourteen
(14) villages (n¼10�20) of two sub-districts of Tharparkar as shown in Fig. 1,
with the help of Global positioning system (GPS) during 2011. All underground
water samples were collected from 415 ft depth. The collected water samples
were kept in well stoppered polyethylene plastic bottles previously soaked in 10%
nitric acid for 24 h and rinsed with ultra pure water (Gong et al., 2002).
The collected water samples were stored in an ice box and delivered on the
same day to the laboratory. The 10–20 water samples of each village/sites were
mixed into a washed plastic bucket to made five composite samples and filtered
through 0.45 mm filter paper with the help of vacuum pump then divided each
sample into two parts, of which one sub sample was acidified with 2–3 drops of
conc. HNO3 for quantitative analysis of cations while other bottle was kept for
arsenic speciation, anions and other physicochemical parameters determina-
tions. All samples were stored at 4 1C until processing and analysis (Clesceri
et al., 1998 and Kazi et al., 2009). The analyzes of As3þ and iAs were
accomplished on the same day to avoid risk of transformation of species as
reported elsewhere (Gong et al., 2002).
2.5. Analytical procedure
Different water quality parameters, their units, abbreviations and methods of
analysis applied in triplicate manner on each composite samples of water are
summarized in Table 1. In the field, water temperature, pH, electrical conductivity
(EC), total dissolved solids (TDS) and salinity was measured using thermometer,
pH meter and conductivity meter, respectively (Clesceri et al., 1998).
Total hardness and Ca-hardness were measured by EDTA complexometric
titration; the indicators are Eriochrome Black T and Murexide at pH 10 and 12,
respectively with an analytical error o2% (Eaton et al., 1995). CO32� and HCO3
�
concentrations were determined by titration with 0.02 M HCl using phenolphtha-
lein and methyl-orange indicators, which shows end point at pH 8.3 and 4.5,
respectively.
The anions were determined through ion chromatography by measuring peak area
of each with an error o2% (Farooqi et al., 2007). For anions analysis, mobile phase of
1.7 mmol/L of Na2CO3, 1.8 mmol/L of NaHCO3 and standard mixed solutions of F� , Cl� ,
NO2� , NO3
� and SO42� at different concentration range (0.25–16 mg/L) were prepared
from certified stock standard solutions. The concentration of Kþ , Naþ , Ca2þ , Mg2þ and
Fe were determined by Flame Atomic Absorption Spectrophotometer (FAAS).
2.5.1. Determination of total As (tAs)
For the determination of tAs, the underground water samples (N-1 to N-4 and
M-1 to M-10) were diluted 25 to 50 times with deionized water. For accuracy, a
certified reference material of water (SRM 1643e) was treated as described in a
previous work (Arain et al., 2009; Baig et al., 2010).
2.5.2. Determination of total inorganic arsenic (iAs)
Total iAs was determined by using TiO2 as the adsorbent.
The triplicates of each composite sample (20 ml) of different sites were taken in
flasks, added complexing reagent TiO2 (10 mg) separately, then the pH 2.0 was
adjusted with 0.5 M HCl. The flasks were placed inside the ultrasonic water bath
and were subjected to ultrasonic energy at 35 kHz for 10 min at room tempera-
ture, after that sample solutions were centrifuged to separate the precipitates. The
slurry of solid particles was made by adding 5 ml of ultrapure water, subjected to
ultrasonic bath for 2 min and then the slurry with the modifier was injected into a
graphite tube by an auto sampler. The same procedure was applied for blank.
2.5.3. Determination of As3þ
The As3þ was determined by cloud point extraction (CPE), using APDC as a
complexing reagent and resulted complex was entrapped in Triton X-114. The
triplicates of each sample (20 ml) of different origins of underground water
were placed in a beaker; pH was adjusted to 4.5 with 0.1 M HCl, then added
0.01% (w/v) APDC and 0.12% (v/v) Triton X-114 to the content of the tubes and
heated in a thermostatic water bath at 30 1C for 10 min. The mixture was
centrifuged at 4000 rpm for phase separation (5 min) and then cooled in an ice
bath for 10 min to increase the viscosity of the surfactant-rich phase. The
supernatant aqueous phase was carefully removed with a pipette. The 0.5 mL of
0.1 M HNO3 in methanol was added surfactant rich phase to reduce its viscosity
before ETAAS determination. The optimization of different variables for the
determination of As3þ and total iAs were reported in our previous work (Baig
et al., 2009c).
2.5.4. Estimation of As5þ
The concentration of As5þ could not be determined directly by the above
analytical procedure, but their concentrations were calculated by the difference
between iAs and As3þ .
2.6. Statistical analysis
All mathematical and multivariate statistical computations were made using
Statistica v5.5, XLSTAT-Pro v7.5.2 and Minitab 2002 v13.2 software. These
methods have been profusely applied to a variety of geo environmental studies
in the world to explain hydro chemical zones with definitive causative agents
(Cloutier et al., 2008, Yidana et al., 2010), also facilitated the delineation of
underground water recharge and discharge areas and to characterize the general
hydrochemistry of basins (Yidana et al., 2008).
In the present study multivariate statistical methods, cluster analysis (CA) and
principal component analysis (PCA) were employed to a dataset of sixty thousand
values (24 parameters determined in five composite samples of each 14 sampling
sites for a period of 12 months in triplicates). Concentration order among all
physico-chemical parameters, elements, halides and other anions differ greatly
and the statistical results should be highly biased by any parameter with high
concentration. Therefore standardization (z-scale) was made on resulted data of
each chemical parameters prior to the statistical analysis (Simeonov et al., 2004).
Standardization (z-scale) tend to minimize the effects of difference units and
variance of variables and to make the data dimensionless (Singh et al., 2004).
2.7. Analytical figure of merit
For quality control, analytical blanks and certified samples with known
concentrations of elements were prepared and analyzed using the same proce-
dures and reagents. The limits of detection (LOD) was calculated as under, LOD
(3� SD/m), where ‘‘SD’’ is the standard deviation of 10 measurements of the blank
and ‘‘m’’ is the slope of the calibration graph obtained for each case, the LODs;
164.3, 69.2, 14.0, 2.46 and 5.52 mg/L for Ca, Fe, K, Mg and Na, respectively. For total
and As species, calibration graph obtained from the quantification limit up to
20 mg/L. The LOD values were 0.05 and 0.12 mg/L for As3þ and total iAs,
respectively. For As speciation, the accuracy of the methodologies was performed
in replicate three sub-samples of underground water samples by spiking standard
solutions of each species at three concentration levels, as shown in Table 2.
The measured TDS to calculated TDS ratio and ionic balances were
calculated for verification of results. The measured TDS to calculated TDS
ratio was found in all water samples, in the range of 1.00–1.13. For the
validation of resulted data of ions, ionic balances were calculated (Lopez et al.,
1999), observed in the range of �2.90–þ3.99%, respectively with no outliers
was established; the mean ionic balance was found to be 1.84%.
3. Results and discussion
Descriptive analysis was carried in order to give basic statisticsand correlation of underground water samples of study areawhich provide initial information about the water quality. Basicstatistic was evaluated to determine the mean, standard
K.D. Brahman et al. / Ecotoxicology and Environmental Safety 89 (2013) 95–10798
deviation, minimum and maximum values (range), which areshown in Table 3.
The analysis of the collected samples indicated that mostof the variables were significantly deviate from WHO guide-line values for drinking water. The pH values of all under-ground water samples were found in the range of 7.48–9.73,which were slightly4WHO guideline values for drinkingwater. In fact 98% of all world underground water is domi-nated by calcium and bicarbonate ions due to lime stoneweathering in the catchments and underground water beds(Meybeck, 1979). TDS and EC in all underground watersamples were found in the range of 701–10218 mg/L and0.92–14.24 mS/cm, respectively. The high values of EC wereattributed to the high salinity (300–8300 mg/L) and solubleelectrolytes in underground water samples. The high levels ofelectric conductivity of water may initiate the pollution rate(Kazi et al., 2009). The long term effects of using high salinitywaters for irrigation is the accumulation of salts in soils,leading to a reduction in the hydraulic properties of irrigationsoils with time. When this happens, the ability of such soils tosupport optimum plant growth and development is greatlyaffected.
In underground water, the concentrations of Naþ , Kþ , Ca2þ Mg2þ
and Fe3þ were found in the range of 72.6–3123 mg/L, 4.7–64.9 mg/L,20.3–447.6 mg/L, 41.6–380.1 mg/L and 0.0765–0.270 mg/L, respec-tively. The range of SO4
2� was observed in underground watersamples as 158–1940 mg/L, while Cl� ranged from 98.8 mg/L to3460 mg/L. The ranges of NO2
� and NO3� in underground water were
observed as 18.0–78.8 mg/L and 25.7–1500 mg/L, respectively.The main cations order are Naþ4Caþ24Mgþ24Kþ4Fe3þ andthe main anions order in the underground water samples wereCl�4SO4
2�4NO3�4NO2
� . These concentration orders in the areawere due to the lithologic composition of this region.
The concentrations of F� was found in the range of 13.8–49.3 mg/L, which was 9.0–33 times higher than permissiblelimit of F by WHO (1.5 mg/L). The tAs, iAs species, As3þ andAs5þ were observed in the range of 0.100–3.83 mg/L, 0.096–3.68 mg/L, 0.032–1.32 mg/L and 0.064–2.36 mg/L, respectively,which was 10–380 times higher than permissible limits ofWHO for As.
The wide variations in the levels of all physicochemicalparameters including F� and As contaminations in undergroundwater, may indicated the involvements of complex geo-chemicalfactors in understudy areas.
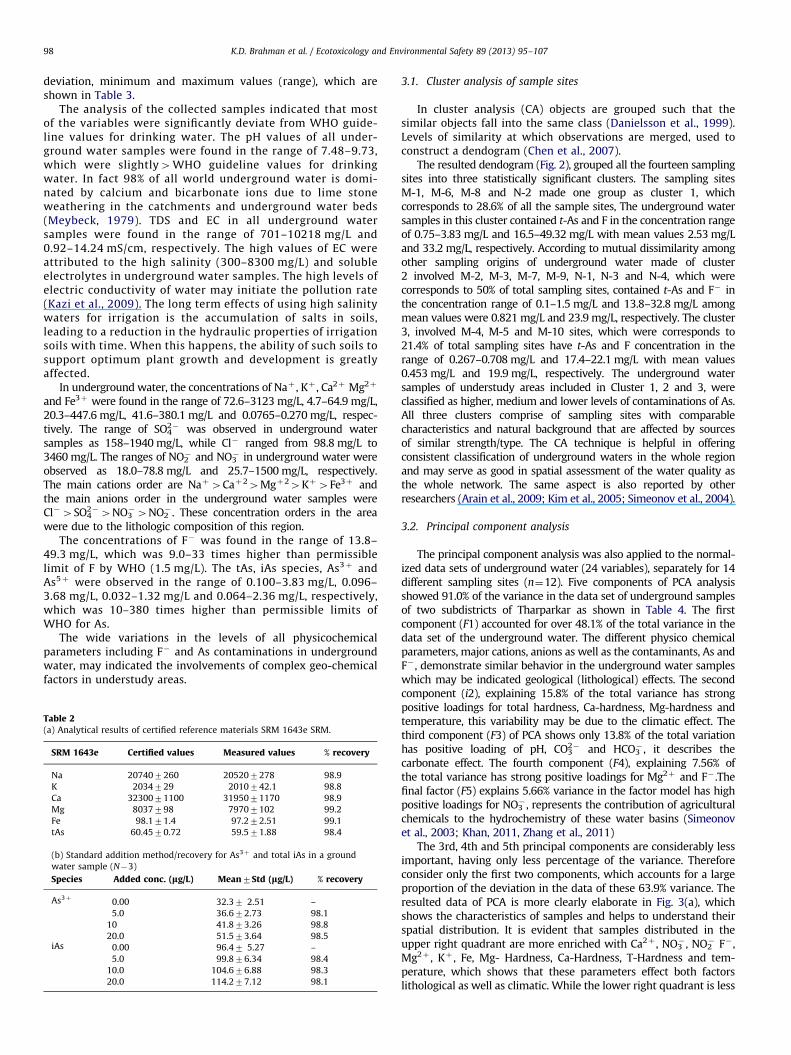
Table 2(a) Analytical results of certified reference materials SRM 1643e SRM.
SRM 1643e Certified values Measured values % recovery
Na 207407260 205207278 98.9
K 2034729 2010742.1 98.8
Ca 3230071100 3195071170 98.9
Mg 8037798 79707102 99.2
Fe 98.171.4 97.272.51 99.1
tAs 60.4570.72 59.571.88 98.4
(b) Standard addition method/recovery for As3þ and total iAs in a ground
water sample (N�3)
Species Added conc. (lg/L) Mean7Std (lg/L) % recovery
As3þ0.00 32.37 2.51 –
5.0 36.672.73 98.1
10 41.873.26 98.8
20.0 51.573.64 98.5iAs 0.00 96.47 5.27 –
5.0 99.876.34 98.4
10.0 104.676.88 98.3
20.0 114.277.12 98.1
3.1. Cluster analysis of sample sites
In cluster analysis (CA) objects are grouped such that thesimilar objects fall into the same class (Danielsson et al., 1999).Levels of similarity at which observations are merged, used toconstruct a dendogram (Chen et al., 2007).
The resulted dendogram (Fig. 2), grouped all the fourteen samplingsites into three statistically significant clusters. The sampling sitesM-1, M-6, M-8 and N-2 made one group as cluster 1, whichcorresponds to 28.6% of all the sample sites, The underground watersamples in this cluster contained t-As and F in the concentration rangeof 0.75–3.83 mg/L and 16.5–49.32 mg/L with mean values 2.53 mg/Land 33.2 mg/L, respectively. According to mutual dissimilarity amongother sampling origins of underground water made of cluster2 involved M-2, M-3, M-7, M-9, N-1, N-3 and N-4, which werecorresponds to 50% of total sampling sites, contained t-As and F� inthe concentration range of 0.1–1.5 mg/L and 13.8–32.8 mg/L amongmean values were 0.821 mg/L and 23.9 mg/L, respectively. The cluster3, involved M-4, M-5 and M-10 sites, which were corresponds to21.4% of total sampling sites have t-As and F concentration in therange of 0.267–0.708 mg/L and 17.4–22.1 mg/L with mean values0.453 mg/L and 19.9 mg/L, respectively. The underground watersamples of understudy areas included in Cluster 1, 2 and 3, wereclassified as higher, medium and lower levels of contaminations of As.All three clusters comprise of sampling sites with comparablecharacteristics and natural background that are affected by sourcesof similar strength/type. The CA technique is helpful in offeringconsistent classification of underground waters in the whole regionand may serve as good in spatial assessment of the water quality asthe whole network. The same aspect is also reported by otherresearchers (Arain et al., 2009; Kim et al., 2005; Simeonov et al., 2004).
3.2. Principal component analysis
The principal component analysis was also applied to the normal-ized data sets of underground water (24 variables), separately for 14different sampling sites (n¼12). Five components of PCA analysisshowed 91.0% of the variance in the data set of underground samplesof two subdistricts of Tharparkar as shown in Table 4. The firstcomponent (F1) accounted for over 48.1% of the total variance in thedata set of the underground water. The different physico chemicalparameters, major cations, anions as well as the contaminants, As andF� , demonstrate similar behavior in the underground water sampleswhich may be indicated geological (lithological) effects. The secondcomponent (i2), explaining 15.8% of the total variance has strongpositive loadings for total hardness, Ca-hardness, Mg-hardness andtemperature, this variability may be due to the climatic effect. Thethird component (F3) of PCA shows only 13.8% of the total variationhas positive loading of pH, CO3
2� and HCO3� , it describes the
carbonate effect. The fourth component (F4), explaining 7.56% ofthe total variance has strong positive loadings for Mg2þ and F� .Thefinal factor (F5) explains 5.66% variance in the factor model has highpositive loadings for NO3
� , represents the contribution of agriculturalchemicals to the hydrochemistry of these water basins (Simeonovet al., 2003; Khan, 2011, Zhang et al., 2011)
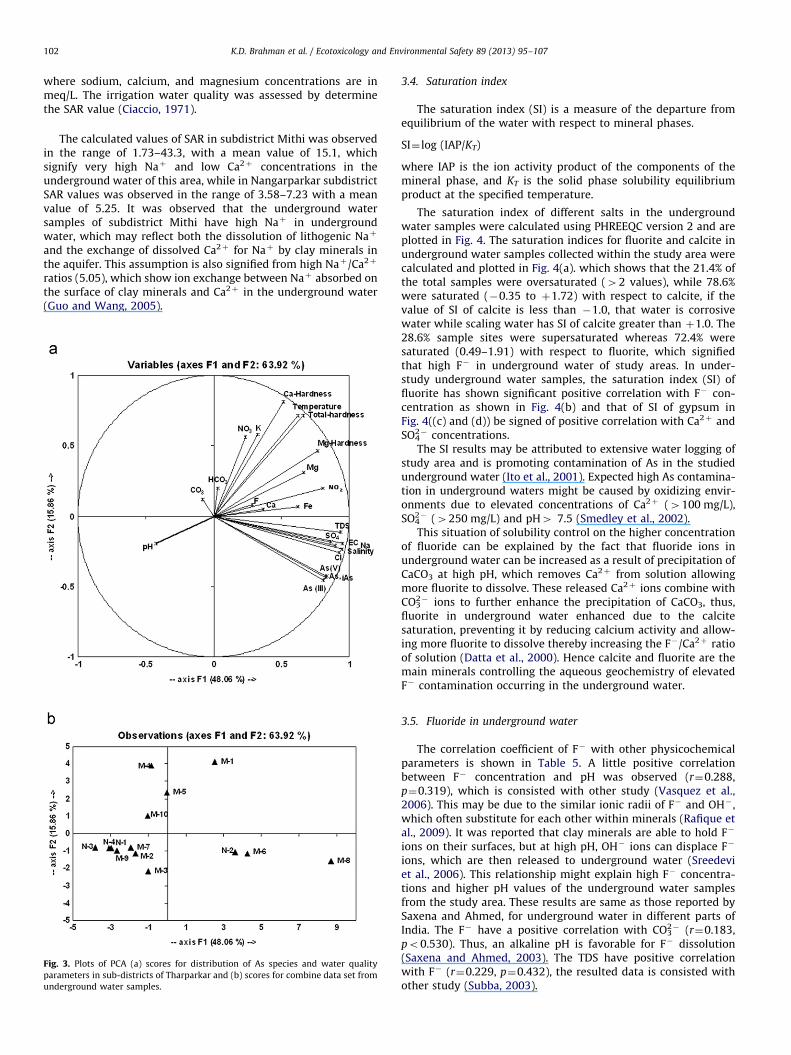
The 3rd, 4th and 5th principal components are considerably lessimportant, having only less percentage of the variance. Thereforeconsider only the first two components, which accounts for a largeproportion of the deviation in the data of these 63.9% variance. Theresulted data of PCA is more clearly elaborate in Fig. 3(a), whichshows the characteristics of samples and helps to understand theirspatial distribution. It is evident that samples distributed in theupper right quadrant are more enriched with Ca2þ , NO3
� , NO2� F� ,
Mg2þ , Kþ , Fe, Mg- Hardness, Ca-Hardness, T-Hardness and tem-perature, which shows that these parameters effect both factorslithological as well as climatic. While the lower right quadrant is less
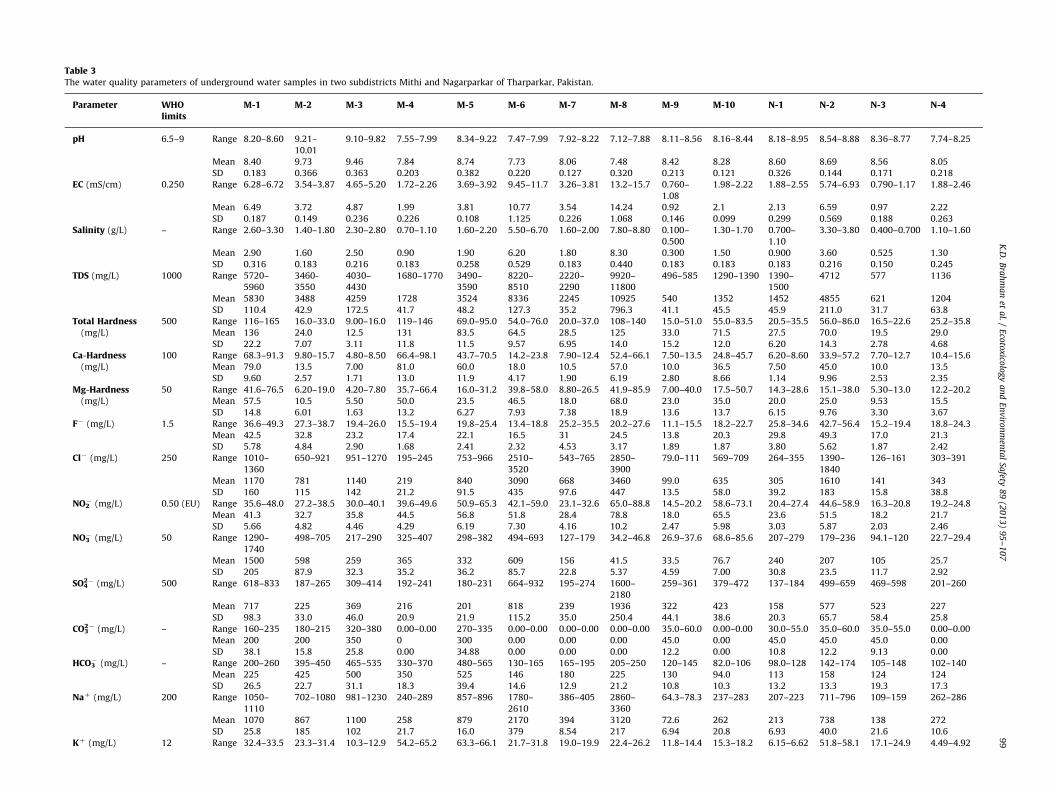
Table 3The water quality parameters of underground water samples in two subdistricts Mithi and Nagarparkar of Tharparkar, Pakistan.
Parameter WHOlimits
M-1 M-2 M-3 M-4 M-5 M-6 M-7 M-8 M-9 M-10 N-1 N-2 N-3 N-4
pH 6.5–9 Range 8.20–8.60 9.21–
10.01
9.10–9.82 7.55–7.99 8.34–9.22 7.47–7.99 7.92–8.22 7.12–7.88 8.11–8.56 8.16–8.44 8.18–8.95 8.54–8.88 8.36–8.77 7.74–8.25
Mean 8.40 9.73 9.46 7.84 8.74 7.73 8.06 7.48 8.42 8.28 8.60 8.69 8.56 8.05
SD 0.183 0.366 0.363 0.203 0.382 0.220 0.127 0.320 0.213 0.121 0.326 0.144 0.171 0.218
EC (mS/cm) 0.250 Range 6.28–6.72 3.54–3.87 4.65–5.20 1.72–2.26 3.69–3.92 9.45–11.7 3.26–3.81 13.2–15.7 0.760–
1.08
1.98–2.22 1.88–2.55 5.74–6.93 0.790–1.17 1.88–2.46
Mean 6.49 3.72 4.87 1.99 3.81 10.77 3.54 14.24 0.92 2.1 2.13 6.59 0.97 2.22
SD 0.187 0.149 0.236 0.226 0.108 1.125 0.226 1.068 0.146 0.099 0.299 0.569 0.188 0.263
Salinity (g/L) – Range 2.60–3.30 1.40–1.80 2.30–2.80 0.70–1.10 1.60–2.20 5.50–6.70 1.60–2.00 7.80–8.80 0.100–
0.500
1.30–1.70 0.700–
1.10
3.30–3.80 0.400–0.700 1.10–1.60
Mean 2.90 1.60 2.50 0.90 1.90 6.20 1.80 8.30 0.300 1.50 0.900 3.60 0.525 1.30
SD 0.316 0.183 0.216 0.183 0.258 0.529 0.183 0.440 0.183 0.183 0.183 0.216 0.150 0.245
TDS (mg/L) 1000 Range 5720–
5960
3460-
3550
4030–
4430
1680–1770 3490–
3590
8220–
8510
2220–
2290
9920–
11800
496–585 1290–1390 1390–
1500
4712 577 1136
Mean 5830 3488 4259 1728 3524 8336 2245 10925 540 1352 1452 4855 621 1204
SD 110.4 42.9 172.5 41.7 48.2 127.3 35.2 796.3 41.1 45.5 45.9 211.0 31.7 63.8
Total Hardness(mg/L)
500 Range 116–165 16.0–33.0 9.00–16.0 119–146 69.0–95.0 54.0–76.0 20.0–37.0 108–140 15.0–51.0 55.0–83.5 20.5–35.5 56.0–86.0 16.5–22.6 25.2–35.8
Mean 136 24.0 12.5 131 83.5 64.5 28.5 125 33.0 71.5 27.5 70.0 19.5 29.0
SD 22.2 7.07 3.11 11.8 11.5 9.57 6.95 14.0 15.2 12.0 6.20 14.3 2.78 4.68
Ca-Hardness(mg/L)
100 Range 68.3–91.3 9.80–15.7 4.80–8.50 66.4–98.1 43.7–70.5 14.2–23.8 7.90–12.4 52.4–66.1 7.50–13.5 24.8–45.7 6.20–8.60 33.9–57.2 7.70–12.7 10.4–15.6
Mean 79.0 13.5 7.00 81.0 60.0 18.0 10.5 57.0 10.0 36.5 7.50 45.0 10.0 13.5
SD 9.60 2.57 1.71 13.0 11.9 4.17 1.90 6.19 2.80 8.66 1.14 9.96 2.53 2.35
Mg-Hardness(mg/L)
50 Range 41.6–76.5 6.20–19.0 4.20–7.80 35.7–66.4 16.0–31.2 39.8–58.0 8.80–26.5 41.9–85.9 7.00–40.0 17.5–50.7 14.3–28.6 15.1–38.0 5.30–13.0 12.2–20.2
Mean 57.5 10.5 5.50 50.0 23.5 46.5 18.0 68.0 23.0 35.0 20.0 25.0 9.53 15.5
SD 14.8 6.01 1.63 13.2 6.27 7.93 7.38 18.9 13.6 13.7 6.15 9.76 3.30 3.67
F� (mg/L) 1.5 Range 36.6–49.3 27.3–38.7 19.4–26.0 15.5–19.4 19.8–25.4 13.4–18.8 25.2–35.5 20.2–27.6 11.1–15.5 18.2–22.7 25.8–34.6 42.7–56.4 15.2–19.4 18.8–24.3
Mean 42.5 32.8 23.2 17.4 22.1 16.5 31 24.5 13.8 20.3 29.8 49.3 17.0 21.3
SD 5.78 4.84 2.90 1.68 2.41 2.32 4.53 3.17 1.89 1.87 3.80 5.62 1.87 2.42
Cl� (mg/L) 250 Range 1010–
1360
650–921 951–1270 195–245 753–966 2510–
3520
543–765 2850–
3900
79.0–111 569–709 264–355 1390–
1840
126–161 303–391
Mean 1170 781 1140 219 840 3090 668 3460 99.0 635 305 1610 141 343
SD 160 115 142 21.2 91.5 435 97.6 447 13.5 58.0 39.2 183 15.8 38.8
NO2� (mg/L) 0.50 (EU) Range 35.6–48.0 27.2–38.5 30.0–40.1 39.6–49.6 50.9–65.3 42.1–59.0 23.1–32.6 65.0–88.8 14.5–20.2 58.6–73.1 20.4–27.4 44.6–58.9 16.3–20.8 19.2–24.8
Mean 41.3 32.7 35.8 44.5 56.8 51.8 28.4 78.8 18.0 65.5 23.6 51.5 18.2 21.7
SD 5.66 4.82 4.46 4.29 6.19 7.30 4.16 10.2 2.47 5.98 3.03 5.87 2.03 2.46
NO3� (mg/L) 50 Range 1290–
1740
498–705 217–290 325–407 298–382 494–693 127–179 34.2–46.8 26.9–37.6 68.6–85.6 207–279 179–236 94.1–120 22.7–29.4
Mean 1500 598 259 365 332 609 156 41.5 33.5 76.7 240 207 105 25.7
SD 205 87.9 32.3 35.2 36.2 85.7 22.8 5.37 4.59 7.00 30.8 23.5 11.7 2.92
SO42� (mg/L) 500 Range 618–833 187–265 309–414 192–241 180–231 664–932 195–274 1600–
2180
259–361 379–472 137–184 499–659 469–598 201–260
Mean 717 225 369 216 201 818 239 1936 322 423 158 577 523 227
SD 98.3 33.0 46.0 20.9 21.9 115.2 35.0 250.4 44.1 38.6 20.3 65.7 58.4 25.8
CO32� (mg/L) – Range 160–235 180–215 320–380 0.00–0.00 270–335 0.00–0.00 0.00–0.00 0.00–0.00 35.0–60.0 0.00–0.00 30.0–55.0 35.0–60.0 35.0–55.0 0.00–0.00
Mean 200 200 350 0 300 0.00 0.00 0.00 45.0 0.00 45.0 45.0 45.0 0.00
SD 38.1 15.8 25.8 0.00 34.88 0.00 0.00 0.00 12.2 0.00 10.8 12.2 9.13 0.00
HCO3� (mg/L) – Range 200–260 395–450 465–535 330–370 480–565 130–165 165–195 205–250 120–145 82.0–106 98.0–128 142–174 105–148 102–140
Mean 225 425 500 350 525 146 180 225 130 94.0 113 158 124 124
SD 26.5 22.7 31.1 18.3 39.4 14.6 12.9 21.2 10.8 10.3 13.2 13.3 19.3 17.3
Naþ (mg/L) 200 Range 1050–
1110
702–1080 981–1230 240–289 857–896 1780–
2610
386–405 2860–
3360
64.3–78.3 237–283 207–223 711–796 109–159 262–286
Mean 1070 867 1100 258 879 2170 394 3120 72.6 262 213 738 138 272
SD 25.8 185 102 21.7 16.0 379 8.54 217 6.94 20.8 6.93 40.0 21.6 10.6
Kþ (mg/L) 12 Range 32.4–33.5 23.3–31.4 10.3–12.9 54.2–65.2 63.3–66.1 21.7–31.8 19.0–19.9 22.4–26.2 11.8–14.4 15.3–18.2 6.15–6.62 51.8–58.1 17.1–24.9 4.49–4.92
K.D
.B
rah
ma
net
al.
/E
coto
xicolo
gy
an
dE
nv
iron
men
tal
Safety
89
(20
13
)9
5–
10
79
9
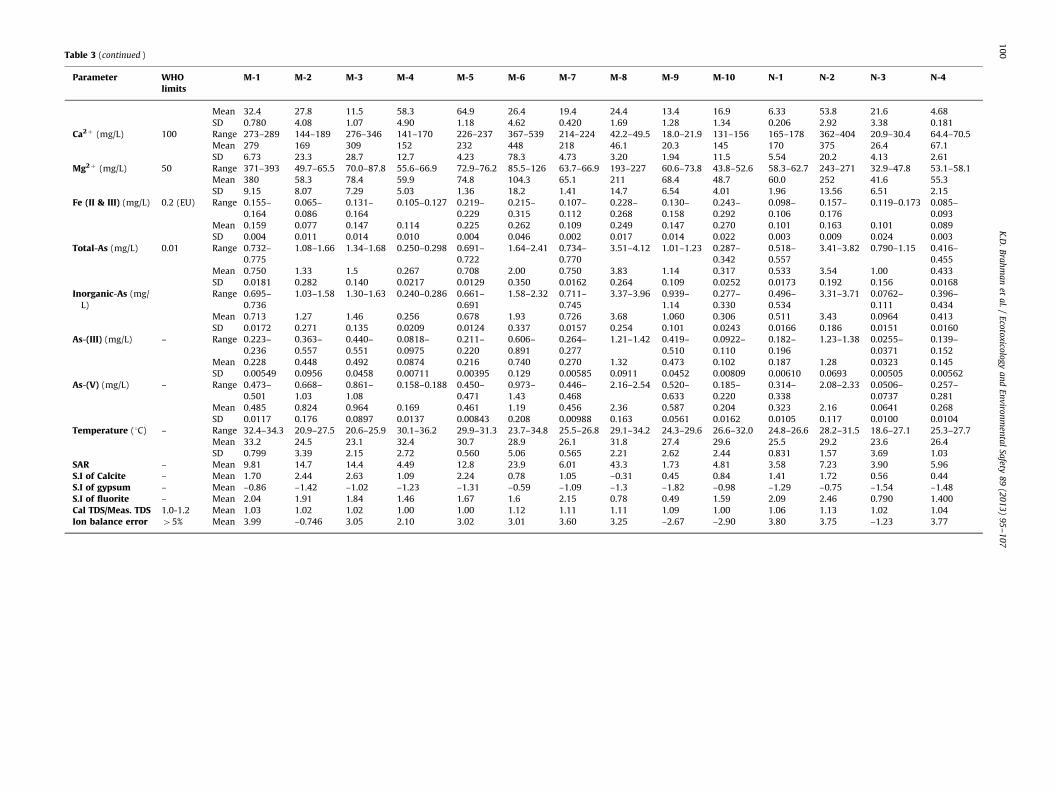
Table 3 (continued )
Parameter WHOlimits
M-1 M-2 M-3 M-4 M-5 M-6 M-7 M-8 M-9 M-10 N-1 N-2 N-3 N-4
Mean 32.4 27.8 11.5 58.3 64.9 26.4 19.4 24.4 13.4 16.9 6.33 53.8 21.6 4.68
SD 0.780 4.08 1.07 4.90 1.18 4.62 0.420 1.69 1.28 1.34 0.206 2.92 3.38 0.181
Ca2þ (mg/L) 100 Range 273–289 144–189 276–346 141–170 226–237 367–539 214–224 42.2–49.5 18.0–21.9 131–156 165–178 362–404 20.9–30.4 64.4–70.5
Mean 279 169 309 152 232 448 218 46.1 20.3 145 170 375 26.4 67.1
SD 6.73 23.3 28.7 12.7 4.23 78.3 4.73 3.20 1.94 11.5 5.54 20.2 4.13 2.61
Mg2þ (mg/L) 50 Range 371–393 49.7–65.5 70.0–87.8 55.6–66.9 72.9–76.2 85.5–126 63.7–66.9 193–227 60.6–73.8 43.8–52.6 58.3–62.7 243–271 32.9–47.8 53.1–58.1
Mean 380 58.3 78.4 59.9 74.8 104.3 65.1 211 68.4 48.7 60.0 252 41.6 55.3
SD 9.15 8.07 7.29 5.03 1.36 18.2 1.41 14.7 6.54 4.01 1.96 13.56 6.51 2.15
Fe (II & III) (mg/L) 0.2 (EU) Range 0.155–
0.164
0.065–
0.086
0.131–
0.164
0.105–0.127 0.219–
0.229
0.215–
0.315
0.107–
0.112
0.228–
0.268
0.130–
0.158
0.243–
0.292
0.098–
0.106
0.157–
0.176
0.119–0.173 0.085–
0.093
Mean 0.159 0.077 0.147 0.114 0.225 0.262 0.109 0.249 0.147 0.270 0.101 0.163 0.101 0.089
SD 0.004 0.011 0.014 0.010 0.004 0.046 0.002 0.017 0.014 0.022 0.003 0.009 0.024 0.003
Total-As (mg/L) 0.01 Range 0.732–
0.775
1.08–1.66 1.34–1.68 0.250–0.298 0.691–
0.722
1.64–2.41 0.734–
0.770
3.51–4.12 1.01–1.23 0.287–
0.342
0.518–
0.557
3.41–3.82 0.790–1.15 0.416–
0.455
Mean 0.750 1.33 1.5 0.267 0.708 2.00 0.750 3.83 1.14 0.317 0.533 3.54 1.00 0.433
SD 0.0181 0.282 0.140 0.0217 0.0129 0.350 0.0162 0.264 0.109 0.0252 0.0173 0.192 0.156 0.0168
Inorganic-As (mg/
L)
Range 0.695–
0.736
1.03–1.58 1.30–1.63 0.240–0.286 0.661–
0.691
1.58–2.32 0.711–
0.745
3.37–3.96 0.939–
1.14
0.277–
0.330
0.496–
0.534
3.31–3.71 0.0762–
0.111
0.396–
0.434
Mean 0.713 1.27 1.46 0.256 0.678 1.93 0.726 3.68 1.060 0.306 0.511 3.43 0.0964 0.413
SD 0.0172 0.271 0.135 0.0209 0.0124 0.337 0.0157 0.254 0.101 0.0243 0.0166 0.186 0.0151 0.0160
As-(III) (mg/L) – Range 0.223–
0.236
0.363–
0.557
0.440–
0.551
0.0818–
0.0975
0.211–
0.220
0.606–
0.891
0.264–
0.277
1.21–1.42 0.419–
0.510
0.0922–
0.110
0.182–
0.196
1.23–1.38 0.0255–
0.0371
0.139–
0.152
Mean 0.228 0.448 0.492 0.0874 0.216 0.740 0.270 1.32 0.473 0.102 0.187 1.28 0.0323 0.145
SD 0.00549 0.0956 0.0458 0.00711 0.00395 0.129 0.00585 0.0911 0.0452 0.00809 0.00610 0.0693 0.00505 0.00562
As-(V) (mg/L) – Range 0.473–
0.501
0.668–
1.03
0.861–
1.08
0.158–0.188 0.450–
0.471
0.973–
1.43
0.446–
0.468
2.16–2.54 0.520–
0.633
0.185–
0.220
0.314–
0.338
2.08–2.33 0.0506–
0.0737
0.257–
0.281
Mean 0.485 0.824 0.964 0.169 0.461 1.19 0.456 2.36 0.587 0.204 0.323 2.16 0.0641 0.268
SD 0.0117 0.176 0.0897 0.0137 0.00843 0.208 0.00988 0.163 0.0561 0.0162 0.0105 0.117 0.0100 0.0104
Temperature (1C) – Range 32.4–34.3 20.9–27.5 20.6–25.9 30.1–36.2 29.9–31.3 23.7–34.8 25.5–26.8 29.1–34.2 24.3–29.6 26.6–32.0 24.8–26.6 28.2–31.5 18.6–27.1 25.3–27.7
Mean 33.2 24.5 23.1 32.4 30.7 28.9 26.1 31.8 27.4 29.6 25.5 29.2 23.6 26.4
SD 0.799 3.39 2.15 2.72 0.560 5.06 0.565 2.21 2.62 2.44 0.831 1.57 3.69 1.03
SAR – Mean 9.81 14.7 14.4 4.49 12.8 23.9 6.01 43.3 1.73 4.81 3.58 7.23 3.90 5.96
S.I of Calcite – Mean 1.70 2.44 2.63 1.09 2.24 0.78 1.05 –0.31 0.45 0.84 1.41 1.72 0.56 0.44
S.I of gypsum – Mean –0.86 –1.42 –1.02 –1.23 –1.31 –0.59 –1.09 –1.3 –1.82 –0.98 –1.29 –0.75 –1.54 –1.48
S.I of fluorite – Mean 2.04 1.91 1.84 1.46 1.67 1.6 2.15 0.78 0.49 1.59 2.09 2.46 0.790 1.400
Cal TDS/Meas. TDS 1.0-1.2 Mean 1.03 1.02 1.02 1.00 1.00 1.12 1.11 1.11 1.09 1.00 1.06 1.13 1.02 1.04
Ion balance error 45% Mean 3.99 –0.746 3.05 2.10 3.02 3.01 3.60 3.25 –2.67 –2.90 3.80 3.75 –1.23 3.77
K.D
.B
rah
ma
net
al.
/E
coto
xicolo
gy
an
dE
nv
iron
men
tal
Safety
89
(20
13
)9
5–
10
71
00
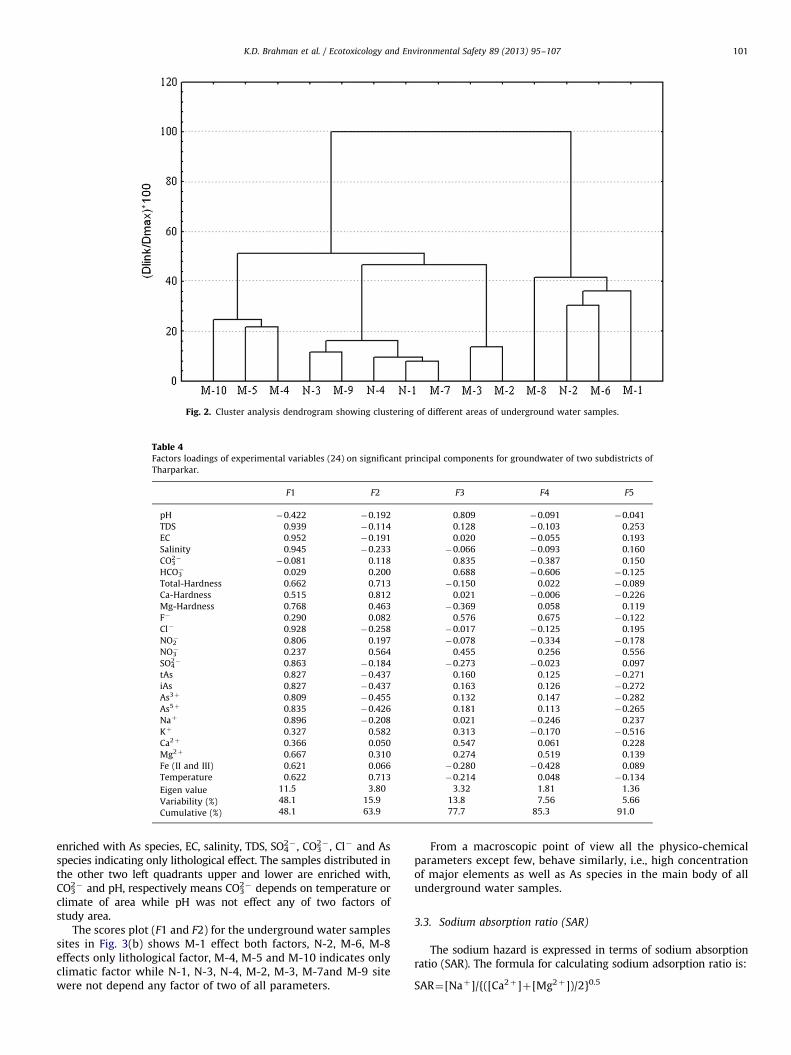
Fig. 2. Cluster analysis dendrogram showing clustering of different areas of underground water samples.
Table 4Factors loadings of experimental variables (24) on significant principal components for groundwater of two subdistricts of
Tharparkar.
F1 F2 F3 F4 F5
pH �0.422 �0.192 0.809 �0.091 �0.041
TDS 0.939 �0.114 0.128 �0.103 0.253
EC 0.952 �0.191 0.020 �0.055 0.193
Salinity 0.945 �0.233 �0.066 �0.093 0.160
CO32�
�0.081 0.118 0.835 �0.387 0.150
HCO3� 0.029 0.200 0.688 �0.606 �0.125
Total-Hardness 0.662 0.713 �0.150 0.022 �0.089
Ca-Hardness 0.515 0.812 0.021 �0.006 �0.226
Mg-Hardness 0.768 0.463 �0.369 0.058 0.119
F� 0.290 0.082 0.576 0.675 �0.122
Cl� 0.928 �0.258 �0.017 �0.125 0.195
NO2� 0.806 0.197 �0.078 �0.334 �0.178
NO3� 0.237 0.564 0.455 0.256 0.556
SO42� 0.863 �0.184 �0.273 �0.023 0.097
tAs 0.827 �0.437 0.160 0.125 �0.271
iAs 0.827 �0.437 0.163 0.126 �0.272
As3þ 0.809 �0.455 0.132 0.147 �0.282
As5þ 0.835 �0.426 0.181 0.113 �0.265
Naþ 0.896 �0.208 0.021 �0.246 0.237
Kþ 0.327 0.582 0.313 �0.170 �0.516
Ca2þ 0.366 0.050 0.547 0.061 0.228
Mg2þ 0.667 0.310 0.274 0.519 0.139
Fe (II and III) 0.621 0.066 �0.280 �0.428 0.089
Temperature 0.622 0.713 �0.214 0.048 �0.134
Eigen value 11.5 3.80 3.32 1.81 1.36
Variability (%) 48.1 15.9 13.8 7.56 5.66
Cumulative (%) 48.1 63.9 77.7 85.3 91.0
K.D. Brahman et al. / Ecotoxicology and Environmental Safety 89 (2013) 95–107 101
enriched with As species, EC, salinity, TDS, SO42� , CO3
2� , Cl� and Asspecies indicating only lithological effect. The samples distributed inthe other two left quadrants upper and lower are enriched with,CO3
2� and pH, respectively means CO32� depends on temperature or
climate of area while pH was not effect any of two factors ofstudy area.
The scores plot (F1 and F2) for the underground water samplessites in Fig. 3(b) shows M-1 effect both factors, N-2, M-6, M-8effects only lithological factor, M-4, M-5 and M-10 indicates onlyclimatic factor while N-1, N-3, N-4, M-2, M-3, M-7and M-9 sitewere not depend any factor of two of all parameters.
From a macroscopic point of view all the physico-chemicalparameters except few, behave similarly, i.e., high concentrationof major elements as well as As species in the main body of allunderground water samples.
3.3. Sodium absorption ratio (SAR)
The sodium hazard is expressed in terms of sodium absorptionratio (SAR). The formula for calculating sodium adsorption ratio is:
SAR¼[Naþ]/{([Ca2þ]þ[Mg2þ])/2}0.5
K.D. Brahman et al. / Ecotoxicology and Environmental Safety 89 (2013) 95–107102
where sodium, calcium, and magnesium concentrations are inmeq/L. The irrigation water quality was assessed by determinethe SAR value (Ciaccio, 1971).
The calculated values of SAR in subdistrict Mithi was observedin the range of 1.73–43.3, with a mean value of 15.1, whichsignify very high Naþ and low Ca2þ concentrations in theunderground water of this area, while in Nangarparkar subdistrictSAR values was observed in the range of 3.58–7.23 with a meanvalue of 5.25. It was observed that the underground watersamples of subdistrict Mithi have high Naþ in undergroundwater, which may reflect both the dissolution of lithogenic Naþ
and the exchange of dissolved Ca2þ for Naþ by clay minerals inthe aquifer. This assumption is also signified from high Naþ/Ca2þ
ratios (5.05), which show ion exchange between Naþ absorbed onthe surface of clay minerals and Ca2þ in the underground water(Guo and Wang, 2005).
Fig. 3. Plots of PCA (a) scores for distribution of As species and water quality
parameters in sub-districts of Tharparkar and (b) scores for combine data set from
underground water samples.
3.4. Saturation index
The saturation index (SI) is a measure of the departure fromequilibrium of the water with respect to mineral phases.
SI¼ log (IAP/KT)
where IAP is the ion activity product of the components of themineral phase, and KT is the solid phase solubility equilibriumproduct at the specified temperature.
The saturation index of different salts in the undergroundwater samples were calculated using PHREEQC version 2 and areplotted in Fig. 4. The saturation indices for fluorite and calcite inunderground water samples collected within the study area werecalculated and plotted in Fig. 4(a). which shows that the 21.4% ofthe total samples were oversaturated (42 values), while 78.6%were saturated (�0.35 to þ1.72) with respect to calcite, if thevalue of SI of calcite is less than �1.0, that water is corrosivewater while scaling water has SI of calcite greater than þ1.0. The28.6% sample sites were supersaturated whereas 72.4% weresaturated (0.49–1.91) with respect to fluorite, which signifiedthat high F� in underground water of study areas. In under-study underground water samples, the saturation index (SI) offluorite has shown significant positive correlation with F� con-centration as shown in Fig. 4(b) and that of SI of gypsum inFig. 4((c) and (d)) be signed of positive correlation with Ca2þ andSO4
2� concentrations.The SI results may be attributed to extensive water logging of
study area and is promoting contamination of As in the studiedunderground water (Ito et al., 2001). Expected high As contamina-tion in underground waters might be caused by oxidizing envir-onments due to elevated concentrations of Ca2þ (4100 mg/L),SO4
2� (4250 mg/L) and pH4 7.5 (Smedley et al., 2002).This situation of solubility control on the higher concentration
of fluoride can be explained by the fact that fluoride ions inunderground water can be increased as a result of precipitation ofCaCO3 at high pH, which removes Ca2þ from solution allowingmore fluorite to dissolve. These released Ca2þ ions combine withCO3
2� ions to further enhance the precipitation of CaCO3, thus,fluorite in underground water enhanced due to the calcitesaturation, preventing it by reducing calcium activity and allow-ing more fluorite to dissolve thereby increasing the F�/Ca2þ ratioof solution (Datta et al., 2000). Hence calcite and fluorite are themain minerals controlling the aqueous geochemistry of elevatedF� contamination occurring in the underground water.
3.5. Fluoride in underground water
The correlation coefficient of F� with other physicochemicalparameters is shown in Table 5. A little positive correlationbetween F� concentration and pH was observed (r¼0.288,p¼0.319), which is consisted with other study (Vasquez et al.,2006). This may be due to the similar ionic radii of F� and OH� ,which often substitute for each other within minerals (Rafique etal., 2009). It was reported that clay minerals are able to hold F�
ions on their surfaces, but at high pH, OH� ions can displace F�
ions, which are then released to underground water (Sreedeviet al., 2006). This relationship might explain high F� concentra-tions and higher pH values of the underground water samplesfrom the study area. These results are same as those reported bySaxena and Ahmed, for underground water in different parts ofIndia. The F� have a positive correlation with CO3
2� (r¼0.183,po0.530). Thus, an alkaline pH is favorable for F� dissolution(Saxena and Ahmed, 2003). The TDS have positive correlationwith F� (r¼0.229, p¼0.432), the resulted data is consisted withother study (Subba, 2003).
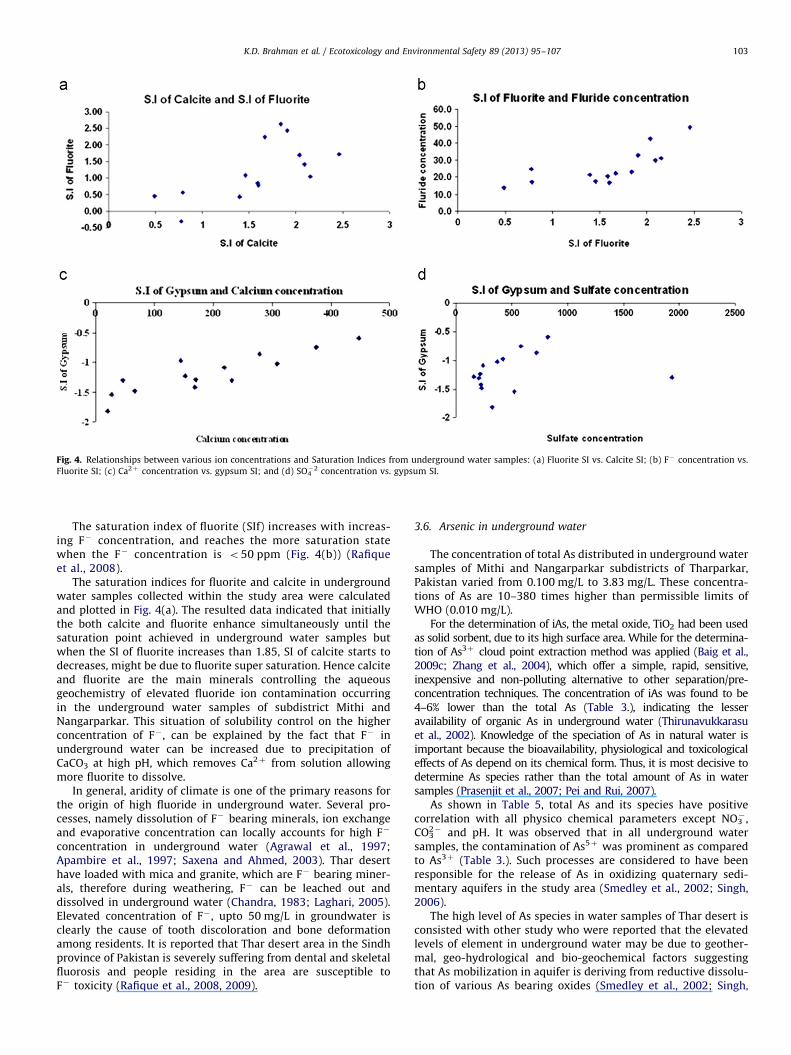
Fig. 4. Relationships between various ion concentrations and Saturation Indices from underground water samples: (a) Fluorite SI vs. Calcite SI; (b) F� concentration vs.
Fluorite SI; (c) Ca2þ concentration vs. gypsum SI; and (d) SO4�2 concentration vs. gypsum SI.
K.D. Brahman et al. / Ecotoxicology and Environmental Safety 89 (2013) 95–107 103
The saturation index of fluorite (SIf) increases with increas-ing F� concentration, and reaches the more saturation statewhen the F� concentration is o50 ppm (Fig. 4(b)) (Rafiqueet al., 2008).
The saturation indices for fluorite and calcite in undergroundwater samples collected within the study area were calculatedand plotted in Fig. 4(a). The resulted data indicated that initiallythe both calcite and fluorite enhance simultaneously until thesaturation point achieved in underground water samples butwhen the SI of fluorite increases than 1.85, SI of calcite starts todecreases, might be due to fluorite super saturation. Hence calciteand fluorite are the main minerals controlling the aqueousgeochemistry of elevated fluoride ion contamination occurringin the underground water samples of subdistrict Mithi andNangarparkar. This situation of solubility control on the higherconcentration of F� , can be explained by the fact that F� inunderground water can be increased due to precipitation ofCaCO3 at high pH, which removes Ca2þ from solution allowingmore fluorite to dissolve.
In general, aridity of climate is one of the primary reasons forthe origin of high fluoride in underground water. Several pro-cesses, namely dissolution of F� bearing minerals, ion exchangeand evaporative concentration can locally accounts for high F�
concentration in underground water (Agrawal et al., 1997;Apambire et al., 1997; Saxena and Ahmed, 2003). Thar deserthave loaded with mica and granite, which are F� bearing miner-als, therefore during weathering, F� can be leached out anddissolved in underground water (Chandra, 1983; Laghari, 2005).Elevated concentration of F� , upto 50 mg/L in groundwater isclearly the cause of tooth discoloration and bone deformationamong residents. It is reported that Thar desert area in the Sindhprovince of Pakistan is severely suffering from dental and skeletalfluorosis and people residing in the area are susceptible toF� toxicity (Rafique et al., 2008, 2009).
3.6. Arsenic in underground water
The concentration of total As distributed in underground watersamples of Mithi and Nangarparkar subdistricts of Tharparkar,Pakistan varied from 0.100 mg/L to 3.83 mg/L. These concentra-tions of As are 10–380 times higher than permissible limits ofWHO (0.010 mg/L).
For the determination of iAs, the metal oxide, TiO2 had been usedas solid sorbent, due to its high surface area. While for the determina-tion of As3þ cloud point extraction method was applied (Baig et al.,2009c; Zhang et al., 2004), which offer a simple, rapid, sensitive,inexpensive and non-polluting alternative to other separation/pre-concentration techniques. The concentration of iAs was found to be4–6% lower than the total As (Table 3.), indicating the lesseravailability of organic As in underground water (Thirunavukkarasuet al., 2002). Knowledge of the speciation of As in natural water isimportant because the bioavailability, physiological and toxicologicaleffects of As depend on its chemical form. Thus, it is most decisive todetermine As species rather than the total amount of As in watersamples (Prasenjit et al., 2007; Pei and Rui, 2007).
As shown in Table 5, total As and its species have positivecorrelation with all physico chemical parameters except NO3
� ,CO3
2� and pH. It was observed that in all underground watersamples, the contamination of As5þ was prominent as comparedto As3þ (Table 3.). Such processes are considered to have beenresponsible for the release of As in oxidizing quaternary sedi-mentary aquifers in the study area (Smedley et al., 2002; Singh,2006).
The high level of As species in water samples of Thar desert isconsisted with other study who were reported that the elevatedlevels of element in underground water may be due to geother-mal, geo-hydrological and bio-geochemical factors suggestingthat As mobilization in aquifer is deriving from reductive dissolu-tion of various As bearing oxides (Smedley et al., 2002; Singh,
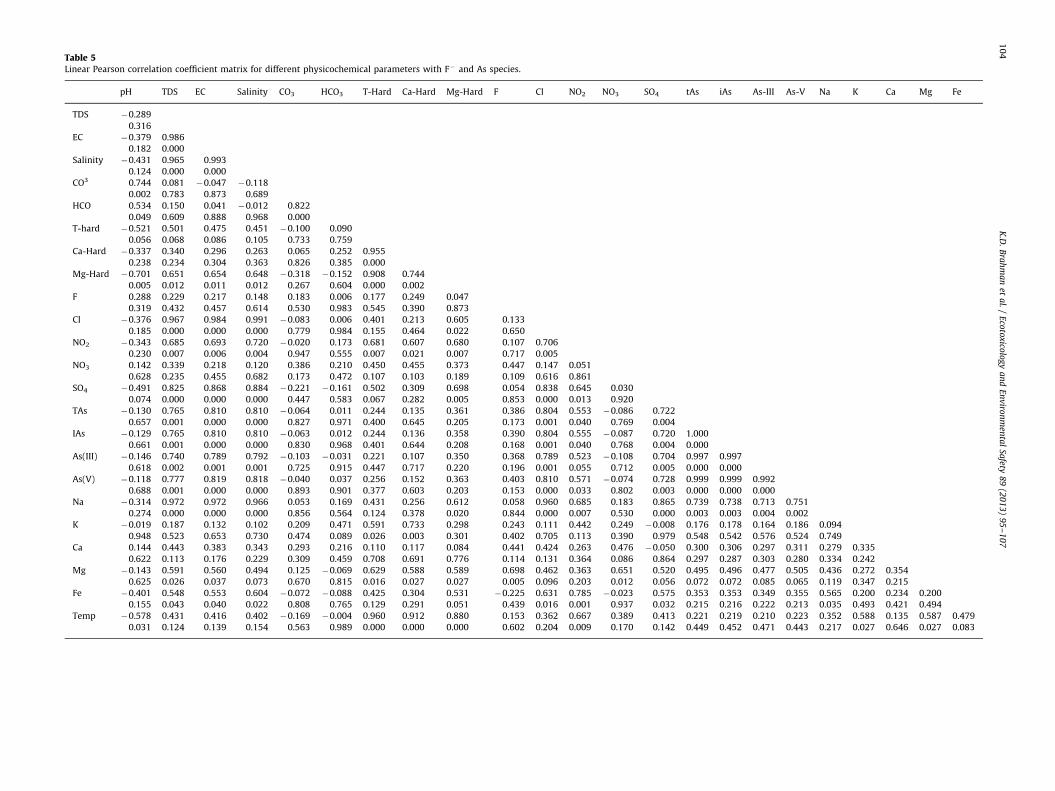
Table 5Linear Pearson correlation coefficient matrix for different physicochemical parameters with F� and As species.
pH TDS EC Salinity CO3 HCO3 T-Hard Ca-Hard Mg-Hard F Cl NO2 NO3 SO4 tAs iAs As-III As-V Na K Ca Mg Fe
TDS �0.289
0.316
EC �0.379 0.986
0.182 0.000
Salinity �0.431 0.965 0.993
0.124 0.000 0.000
CO3 0.744 0.081 �0.047 �0.118
0.002 0.783 0.873 0.689
HCO 0.534 0.150 0.041 �0.012 0.822
0.049 0.609 0.888 0.968 0.000
T-hard �0.521 0.501 0.475 0.451 �0.100 0.090
0.056 0.068 0.086 0.105 0.733 0.759
Ca-Hard �0.337 0.340 0.296 0.263 0.065 0.252 0.955
0.238 0.234 0.304 0.363 0.826 0.385 0.000
Mg-Hard �0.701 0.651 0.654 0.648 �0.318 �0.152 0.908 0.744
0.005 0.012 0.011 0.012 0.267 0.604 0.000 0.002
F 0.288 0.229 0.217 0.148 0.183 0.006 0.177 0.249 0.047
0.319 0.432 0.457 0.614 0.530 0.983 0.545 0.390 0.873
Cl �0.376 0.967 0.984 0.991 �0.083 0.006 0.401 0.213 0.605 0.133
0.185 0.000 0.000 0.000 0.779 0.984 0.155 0.464 0.022 0.650
NO2 �0.343 0.685 0.693 0.720 �0.020 0.173 0.681 0.607 0.680 0.107 0.706
0.230 0.007 0.006 0.004 0.947 0.555 0.007 0.021 0.007 0.717 0.005
NO3 0.142 0.339 0.218 0.120 0.386 0.210 0.450 0.455 0.373 0.447 0.147 0.051
0.628 0.235 0.455 0.682 0.173 0.472 0.107 0.103 0.189 0.109 0.616 0.861
SO4 �0.491 0.825 0.868 0.884 �0.221 �0.161 0.502 0.309 0.698 0.054 0.838 0.645 0.030
0.074 0.000 0.000 0.000 0.447 0.583 0.067 0.282 0.005 0.853 0.000 0.013 0.920
TAs �0.130 0.765 0.810 0.810 �0.064 0.011 0.244 0.135 0.361 0.386 0.804 0.553 �0.086 0.722
0.657 0.001 0.000 0.000 0.827 0.971 0.400 0.645 0.205 0.173 0.001 0.040 0.769 0.004
IAs �0.129 0.765 0.810 0.810 �0.063 0.012 0.244 0.136 0.358 0.390 0.804 0.555 �0.087 0.720 1.000
0.661 0.001 0.000 0.000 0.830 0.968 0.401 0.644 0.208 0.168 0.001 0.040 0.768 0.004 0.000
As(III) �0.146 0.740 0.789 0.792 �0.103 �0.031 0.221 0.107 0.350 0.368 0.789 0.523 �0.108 0.704 0.997 0.997
0.618 0.002 0.001 0.001 0.725 0.915 0.447 0.717 0.220 0.196 0.001 0.055 0.712 0.005 0.000 0.000
As(V) �0.118 0.777 0.819 0.818 �0.040 0.037 0.256 0.152 0.363 0.403 0.810 0.571 �0.074 0.728 0.999 0.999 0.992
0.688 0.001 0.000 0.000 0.893 0.901 0.377 0.603 0.203 0.153 0.000 0.033 0.802 0.003 0.000 0.000 0.000
Na �0.314 0.972 0.972 0.966 0.053 0.169 0.431 0.256 0.612 0.058 0.960 0.685 0.183 0.865 0.739 0.738 0.713 0.751
0.274 0.000 0.000 0.000 0.856 0.564 0.124 0.378 0.020 0.844 0.000 0.007 0.530 0.000 0.003 0.003 0.004 0.002
K �0.019 0.187 0.132 0.102 0.209 0.471 0.591 0.733 0.298 0.243 0.111 0.442 0.249 �0.008 0.176 0.178 0.164 0.186 0.094
0.948 0.523 0.653 0.730 0.474 0.089 0.026 0.003 0.301 0.402 0.705 0.113 0.390 0.979 0.548 0.542 0.576 0.524 0.749
Ca 0.144 0.443 0.383 0.343 0.293 0.216 0.110 0.117 0.084 0.441 0.424 0.263 0.476 �0.050 0.300 0.306 0.297 0.311 0.279 0.335
0.622 0.113 0.176 0.229 0.309 0.459 0.708 0.691 0.776 0.114 0.131 0.364 0.086 0.864 0.297 0.287 0.303 0.280 0.334 0.242
Mg �0.143 0.591 0.560 0.494 0.125 �0.069 0.629 0.588 0.589 0.698 0.462 0.363 0.651 0.520 0.495 0.496 0.477 0.505 0.436 0.272 0.354
0.625 0.026 0.037 0.073 0.670 0.815 0.016 0.027 0.027 0.005 0.096 0.203 0.012 0.056 0.072 0.072 0.085 0.065 0.119 0.347 0.215
Fe �0.401 0.548 0.553 0.604 �0.072 �0.088 0.425 0.304 0.531 �0.225 0.631 0.785 �0.023 0.575 0.353 0.353 0.349 0.355 0.565 0.200 0.234 0.200
0.155 0.043 0.040 0.022 0.808 0.765 0.129 0.291 0.051 0.439 0.016 0.001 0.937 0.032 0.215 0.216 0.222 0.213 0.035 0.493 0.421 0.494
Temp �0.578 0.431 0.416 0.402 �0.169 �0.004 0.960 0.912 0.880 0.153 0.362 0.667 0.389 0.413 0.221 0.219 0.210 0.223 0.352 0.588 0.135 0.587 0.479
0.031 0.124 0.139 0.154 0.563 0.989 0.000 0.000 0.000 0.602 0.204 0.009 0.170 0.142 0.449 0.452 0.471 0.443 0.217 0.027 0.646 0.027 0.083
K.D
.B
rah
ma
net
al.
/E
coto
xicolo
gy
an
dE
nv
iron
men
tal
Safety
89
(20
13
)9
5–
10
71
04
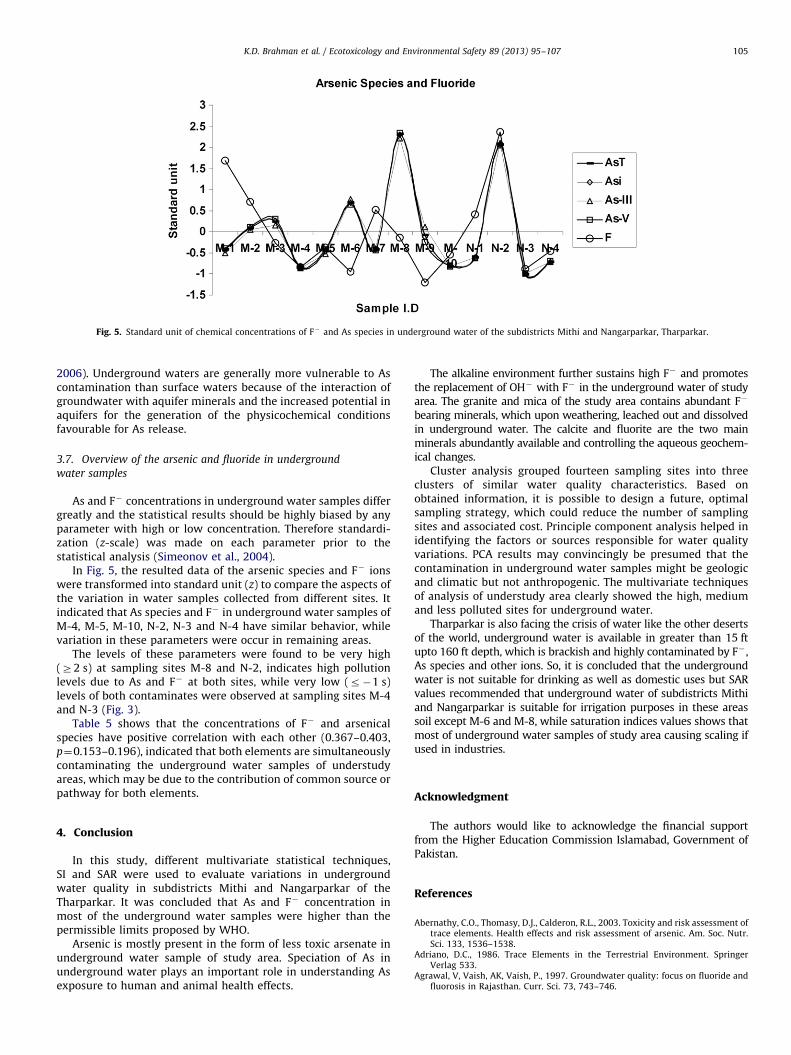
Fig. 5. Standard unit of chemical concentrations of F� and As species in underground water of the subdistricts Mithi and Nangarparkar, Tharparkar.
K.D. Brahman et al. / Ecotoxicology and Environmental Safety 89 (2013) 95–107 105
2006). Underground waters are generally more vulnerable to Ascontamination than surface waters because of the interaction ofgroundwater with aquifer minerals and the increased potential inaquifers for the generation of the physicochemical conditionsfavourable for As release.
3.7. Overview of the arsenic and fluoride in underground
water samples
As and F� concentrations in underground water samples differgreatly and the statistical results should be highly biased by anyparameter with high or low concentration. Therefore standardi-zation (z-scale) was made on each parameter prior to thestatistical analysis (Simeonov et al., 2004).
In Fig. 5, the resulted data of the arsenic species and F� ionswere transformed into standard unit (z) to compare the aspects ofthe variation in water samples collected from different sites. Itindicated that As species and F� in underground water samples ofM-4, M-5, M-10, N-2, N-3 and N-4 have similar behavior, whilevariation in these parameters were occur in remaining areas.
The levels of these parameters were found to be very high(Z2 s) at sampling sites M-8 and N-2, indicates high pollutionlevels due to As and F� at both sites, while very low (r�1 s)levels of both contaminates were observed at sampling sites M-4and N-3 (Fig. 3).
Table 5 shows that the concentrations of F� and arsenicalspecies have positive correlation with each other (0.367–0.403,p¼0.153–0.196), indicated that both elements are simultaneouslycontaminating the underground water samples of understudyareas, which may be due to the contribution of common source orpathway for both elements.
4. Conclusion
In this study, different multivariate statistical techniques,SI and SAR were used to evaluate variations in undergroundwater quality in subdistricts Mithi and Nangarparkar of theTharparkar. It was concluded that As and F� concentration inmost of the underground water samples were higher than thepermissible limits proposed by WHO.
Arsenic is mostly present in the form of less toxic arsenate inunderground water sample of study area. Speciation of As inunderground water plays an important role in understanding Asexposure to human and animal health effects.
The alkaline environment further sustains high F� and promotesthe replacement of OH� with F� in the underground water of studyarea. The granite and mica of the study area contains abundant F�
bearing minerals, which upon weathering, leached out and dissolvedin underground water. The calcite and fluorite are the two mainminerals abundantly available and controlling the aqueous geochem-ical changes.
Cluster analysis grouped fourteen sampling sites into threeclusters of similar water quality characteristics. Based onobtained information, it is possible to design a future, optimalsampling strategy, which could reduce the number of samplingsites and associated cost. Principle component analysis helped inidentifying the factors or sources responsible for water qualityvariations. PCA results may convincingly be presumed that thecontamination in underground water samples might be geologicand climatic but not anthropogenic. The multivariate techniquesof analysis of understudy area clearly showed the high, mediumand less polluted sites for underground water.
Tharparkar is also facing the crisis of water like the other desertsof the world, underground water is available in greater than 15 ftupto 160 ft depth, which is brackish and highly contaminated by F� ,As species and other ions. So, it is concluded that the undergroundwater is not suitable for drinking as well as domestic uses but SARvalues recommended that underground water of subdistricts Mithiand Nangarparkar is suitable for irrigation purposes in these areassoil except M-6 and M-8, while saturation indices values shows thatmost of underground water samples of study area causing scaling ifused in industries.
Acknowledgment
The authors would like to acknowledge the financial supportfrom the Higher Education Commission Islamabad, Government ofPakistan.
References
Abernathy, C.O., Thomasy, D.J., Calderon, R.L., 2003. Toxicity and risk assessment oftrace elements. Health effects and risk assessment of arsenic. Am. Soc. Nutr.Sci. 133, 1536–1538.
Adriano, D.C., 1986. Trace Elements in the Terrestrial Environment. SpringerVerlag 533.
Agrawal, V, Vaish, AK, Vaish, P., 1997. Groundwater quality: focus on fluoride andfluorosis in Rajasthan. Curr. Sci. 73, 743–746.
K.D. Brahman et al. / Ecotoxicology and Environmental Safety 89 (2013) 95–107106
Apambire, W.M., Boyle, D.R., Michel, F.A., 1997. Geochemistry, genesis, and healthimplications of fluoriferous groundwater in the upper regions of Ghana.Environ. Geol. 33, 13–24.
Arain, M.B., Kazi, T.G., Baig, J.A., Jamali, M.K., Afridi, H.I., Shah, A.Q., Jalbani, N.,Sarfraz, R.A., 2009. Determination of arsenic levels in lake water, sediment,and foodstuff from selected area of Sindh, Pakistan: estimation of daily dietaryintake. Food Chem. Toxicol. l47, 242–248.
Arjonilla, M., Forja, J.M., Gomez-Parra, A., 1994. Sediment analysis does notprovide a good measure of heavy metal bioavailability to Cerastodermaglaucum Mollusca: Bivalvia in confined coastal ecosystems. Bull. Environ.Contam. Toxicol. 52, 810–817.
Ayoob, S., Gupta, A.K., 2006. Fluoride in drinking water: a review on the status andstress effects. Crit. Rev. Env. Sci. Technol. 36, 433–487.
Baig, J.A., Kazi, T.G., Arain, M.B., Afridi, H.I., Kandhro, G.A., Sarfraz, R.A., Jamali, M.K.,Shah, A.Q., 2009b. Evaluation of arsenic and other physico-chemical para-meters of surface and ground water of Jamshoro, Pakistan. J. Hazard. Mater.166, 662–669.
Baig, J.A., Kazi, T.G., Arain, M.B., Shah, A.Q., Afridi, H.I., Kandhro, G.A., Sarfraz, R.A.,Jamali, M.K., Khan, S., 2009a. Arsenic fractionation in sediments of differentorigins using BCR sequential and single extraction methods. J. Hazard. Mater.167, 745–751.
Baig, J.A., Kazi, T.G., Shah, A.Q., Arain, M.B., Afridi, H.I., Kandhro, G.A., Khan, S.,2009c. Optimization of cloud point extraction and solid phase extractionmethods for speciation of arsenic in natural water using multivariate techni-que. Anal. Chim. Acta 651, 57–63.
Baig, J.A., Kazi, T.G., Shah, A.Q., Kandhro, G.A., Afridi, H.I., Arain, M.B., Jamali, M.K.,Jalbani, N., 2010. Speciation and evaluation of Arsenic in surface water andground water samples: a multivariate case study. Ecotoxicol. Environ. Saf. 73,914–923.
Berg, M., Caroline, St.P., Pham, T.K.T., Mickey, H.V., Sampson, L., Leng, M., Samreth, S.,Fredericks, D., 2007. Magnitude of arsenic pollution in the Mekong and Red RiverDeltas—Cambodia and Vietnam. Sci. Total Environ. 372, 413–425.
Chandra S., 1983, ‘‘Endemic fluorosis in Rajasthan’’, Indian Association of Pre-ventive and Social Medicine, Rajasthan chapter, Conference, S. P. MedicalCollege, Bikaner.
Chen, K., Jiao, J.J., Huang, J., Huang, R., 2007. Multivariate statistical evaluation oftrace elements in groundwater in a coastal area in Shenzhen, China. Environ.Pollut. 147, 771–780.
Chen, Y.C., Lin, M.Q., Xia, Y.D., Gan, W.M., Min, D., Chen, C., 1997. Nutritionalsurvey in dental fluorosis afflicted area. Fluoride 30, 77–80.
Ciaccio, L.L., 1971. Water and Water Pollution, first ed. Marcel Dekker lnc.,New York 149.
Clesceri, L.S., Greenberg, A.E., Eaton, A.D. (Eds.), 1998. 20th ed. American PublicHealth Association (APHA, American Water Works Association (AWWA) andWater Environment Federation (WEF), Washington, DC.
Cloutier, V., Lefebvre, R., Therrien, R., Savard, M., 2008. Multivariate statisticalanalysis of geochemical data as indicative of the hydrogeochemical evolutionof ground-water in a sedimentary rock aquifer system. J. Hydrol. 353,294–313.
Dang, Q.H., Olga, N., Richard, C.G., 2004. Analytical methods for inorganic arsenicin water: a review. Talanta 64, 269–277.
Danielsson, A., Cato, I., Carman, R., Rahm, L., 1999. Spatial clustering of metals inthe sediments of the Skagerrak/Kattegat. Appl. Geochem. 14, 689–706.
Datta, D.K., Gupta, L.P., Subramanian, V., 2000. Dissolved fluoride in the LowerGanges–Brahmaputra–Meghna River system in the Bengal Basin, Bangladesh.Environ. Geol. 39, 1163–1168.
Dey, R.K., Swain, S.K., Mishra, S., Sharma, P., Patnaik, T., 2011. Hydrogeochemicalprocesses controlling the high fluoride concentration in groundwater: a casestudy at the Boden block area, Orissa, India. Environ. Monit. Assess. 184,3279–3291.
Dixon, W., Chiswell, B., 1996. Review of aquatic monitoring program design. WaterRes. 30, 1935–1948.
Eaton, D.A., Clesceri, L.S., Greenberg, A.E., 1995. Standard Methods, for 14 theExamination of Water and Wastewater, 19th ed. American Public HealthAssociation, Washington, DC 1015.
Farooqi, A., Masuda, H., Firdous, N., 2007. Toxic fluoride and arsenic contaminatedgroundwater in the Lahore and Kasur districts, Punjab, Pakistan and possiblecontaminant sources. Environ. Pollut. 145, 839–849.
Franks, F., 2000. Water: A Matrix of Life, second ed. RSC Paperbacks, UK 225.Gong, Z., Lu, X., Mingsheng, M., Corinn, W., Le, X.C., 2002. Arsenic speciation
analysis. Talanta 58, 77–96.Guo, H., Wang, Y., 2005. Geochemical characteristics of shallow groundwater in
Datong basin, northwestern China. J. Geochem. Explor. 87, 109–120.Hu, W., Zheng, F., Hu, B., 2008. Simultaneous separation and speciation of
inorganic As(III)/As(V) and Cr(III)/Cr(VI) in natural waters utilizing capillarymicroextraction on ordered mesoporous Al2O3 prior to their on-line determi-nation by ICP-MS. J. Hazard. Mater. 151, 58–64.
Ito, A., Takachi, T., Kitada, K., Aizawa, J., Umita, T., 2001. Characteristics of arsenicelution from sewage sludge. Appl. Organomet. Chem. 15, 266–270.
Kazi, T.G., Arain, M.B., Jamali, M.K., Jalbani, N., Afridi, H.I., Sarfraz, R.A., 2009.Assessment of water quality of polluted lake using multivariate statisticaltechniques: a case study. Ecotoxicol. Environ. Saf. 72, 301–309.
Khan, T.A., 2011. Multivariate analysis of hydrochemical data of ground water inparts of Karwan–Sengar sub-basin Central Ganga basin, India. Global NestJ. 13, 229–236.
Kim, J.H., Kim, R.H., Lee, J., Cheong, T.J., Yum, B.W., Chang, H.W., 2005. Multivariatestatistical analysis to identify the major factors governing groundwater qualityin the coastal area of Kimje, South Korea. Hydrol. Processes 19, 1261–1276.
Laghari A., 2005, Petrology of the Nangarparkar Granite and Associated BasicRocks, Thar Desert, Sindh, Pakistan. Ph.D. Thesis. National Center of Excellencein Geology, University of Peshawar, Peshawar, 297.
Li, X.S., Zhi, J.L., Gao, R.O., 1995. Effect of fluoride exposure on intelligence in children.Fluoride 28, 189–192.
Lopez, P.L., Auque, L.F., Garces, I., Chong, W., 1999. Geochemical characteristics andpattern of evolution of salmueras superficiales del Salar de Llamara, ChileBrines surface of Salar Llamara, Chile. Geol. Mag. Chile 26, 89–108.
Meybeck, M., 1979. Concentrations des eaux fluviales en element majeurset apport en solution aux oceans. Rev. Geol. Dyn. Geogr. Phys. 21, 215–246.
Mir M., Naseem S., 2005, Thar Coal: Geology and its Potential for Power GenerationFirst Economic Jordanian Forum, Mafraq–Jorden, 9–11, 55.
Mishra, A., Bhatt, V., 2008. Physico-chemical and microbiological analysis ofunderground water in V.V Nagar and near by places of Anand district, Gujarat,India. E. J. Chem 5, 487–492.
Murata, R., Shimizu, T., Uehara, N., 2005. Speciation arsenic(III) and arsenic(V) innatural water by graphite furnace AAS after coprecipitation with a copper–pyrrolidinedithiocarbamate complex. Bunseki Kagaku 54, 831–836.
Nickson, R.T., McArthur, J.M., Shrestha, B., Kyaw-Myint, T.O., Lowry, D., 2005.Arsenic and other drinking water quality issues, Muzaffargarh District,Pakistan. Appl. Geochem. 2, 55–68.
Pei, L., Rui, L., 2007. Speciation analysis of inorganic arsenic in water samplesby immobilized nanometer titanium dioxide separation and graphitefurnace atomic absorption spectrometric determination. Anal. Chim. Acta602, 32–36.
Prasenjit, M., Chandrajit, B., Bikash, M.A., 2007. A laboratory study for thetreatment of arsenic, iron, and manganese bearing ground water using Fe3þimpregnated activated carbon: effects of shaking time, pH and temperature.J. Hazard. Mater. 144, 420–426.
Rafique, T., Naseem, S., Bhanger, M.I., Usmani, T.H., 2008. Fluoride ion contamination inthe groundwater of Mithi sub-district, the Thar Desert, Pakistan. Environ. Geol. 56,317–326.
Rafique, T., Naseem, S., Usmani, T.H., Bashir, E., Khan, F.A., Bhanger, M.I., 2009.Geochemical factors controlling the occurrence of high fluoride groundwater inthe Nagar Parkar area, Sindh, Pakistan. J. Hazard. Mater. 171, 424–430.
RGNDWM. Prevention & Control of fluorosis in India. 1993, Water Quality andDefluoridation Techniques, Volume II, Published by Rajiv Gandhi NationalDrinking Water Mission, Ministry of Rural Development, New Delhi.
Saxena, V.K., Ahmed, S., 2001. Dissolution of fluoride in groundwater: a water rockinteraction study. Environ. Geol. 40, 1084–1087.
Saxena, V.K., Ahmed, S., 2003. Inferring the chemical parameters for the dissolu-tion of fluoride in groundwater. Environ. Geol. 43, 731–736.
Simeonov, V., Simeonova, P., Tsitouridou, R., 2004. Chemometric qualityassessment of surface waters: two case studies. Chem. Eng. Ecol. 11,449–469.
Simeonov, V., Stratis, J.A., Samara, C., Zachariadis, G., Voutsa, D., Anthemidis, A.,2003. Assessment of the surface water quality in Northern Greece. Water Res.37, 4119–4124.
Singh, A.K., 2006. Chemistry of arsenic in groundwater of Ganges–Brahmaputrariver basin. Curr. Sci. 91, 599–606.
Singh, K.P., Malik, A., Mohan, D., Sinha, S., 2004. Multivariate statistical techniquesfor the evaluation of spatial and temporal variations in water quality of GomtiRiver (India): a case study. Water Res. 38, 3980–3992.
Smedley, P.L., Nicolli, H.B., Macdonald, D.M.J., Barros, A.J., Tullio, J.O., 2002.Hydrogeochemistry of arsenic and other inorganic constituents in ground-waters from La Pampa, Argentina. Appl. Geochem. 17, 259–284.
Sojka, M., Siepak, M., Ziola, A., Frankowski, M., Murat- Blazejewska, S., Siepak, J.,2008. Application of multivariate statistical techniques to evaluation of waterquality in the Mala Welna River (Western Poland). Environ. Monit. Assess. 147,159–170.
Sreedevi, P.D., Ahmed, S., Made, B., Ledoux, E., Gandolfi, J.M., 2006. Association ofhydrological factors in temporal variations of fluoride concentration in acrystalline aquifer in India. Environ. Geol. 50, 1–11.
Subba, R., 2003. Groundwater quality: focus on fluoride concentration in ruralparts of Guntur districts, Andhra Pradesh, India. Hydrol. Sci. J. 48, 877–892.
Thirunavukkarasu, O.S., Viraraghavan, T., Subramanian, K.S., Tanjore, S., 2002.Organic arsenic removal from drinking water. Urban Water J. 4, 415.
Vasquez, L.V., Hernandez, J.R., Lopez, J.R., Uribe, A.S., Mancilla, O.L., 2006.The origin of fluoride in groundwater supply to Hermosillo City, Sonora,Mexico. Environ. Geol. 51, 17–27.
Vega, L., Styblo, M., Patterson, R., Cullen, W., Wang, C., Germolec, D., 2001.Differential effects of trivalent and pentavalent arsenicals on cell proliferationand cytokine secretion in normal human epidermal keratinocytes. Toxicol.Appl. Pharmacol. 172, 225–232.
Vega, M., Pardo, R., Barrado, E., Deban, L., 1998. Assessment of seasonaland polluting effects on the quality of river water by exploratory data analysis.Water Res. 32, 3581–3592.
Waldbott, G.L., 1998. The pre-skeletal phase of chronic fluoride intoxication.Fluoride 31, 13–20.
WHO—Word Health Organization (2011). Guidelines for Drinking-Water Quality,Fourth ed.
Wood, J.M., 1974. Biological cycle for toxic elements in the environmentScience 183, 1049–1052.

K.D. Brahman et al. / Ecotoxicology and Environmental Safety 89 (2013) 95–107 107
Yidana, S.M., Ophori, D., Banoeng-Yakubo, B., 2008. A multivariate statistical analysis ofsurface water chemistry data—the Ankobra basin, Ghana. J. Environ. Manage. 86,80–87.
Yidana, Y.S.M., Banoeng, B., Akabzaa, T.M., 2010. Analysis of groundwater qualityusing multivariate and spatial analyses in the Keta basin, Ghana. J. Afr. Earth.Sci. 58, 220–234.
Zhang, Q., Miniami, H., Inoue, S., Atsuya, I., 2004. Differential determination of traceamounts of arsenic(III) and arsenic(V) in seawater by solid sampling atomic
absorption spectrometry after preconcentration by co precipitation with anickel–pyrrolidine dithiocarbamate complex. Anal. Chim. Acta 508, 99–105.
Zhang, X., Wang, Q., Liu, Y., Wu, J., Yu, M., 2011. Application of multivariatestatistical techniques in the assessment of water quality in the Southwest NewTerritories and Kowloon, Hong Kong. Environ. Monit. Assess. 173, 17–27.
Zohouri, F.V., Rugg-Gunn, A.J., 2000. Sources of dietary fluoride intake in 4-yearoldchildren residing in low, medium and high fluoride areas in Iran. Int. J.Food Sci. Nutr. 51, 317–326.
Top Related
Copyright © 2022 FDOKUMEN

