


Bahasa
Halaman
Hukum

1
Semantic Representation of Tourism on the Internet
Zheng Xiang
Assistant Professor
School of Merchandising and Hospitality Management
University of North Texas
P.O. Box 311100
Denton, Texas 76203-1100
Phone: 940-369-7680
Fax: 940-565-4348
Email: [email protected]
Ulrike Gretzel
Director and Assistant Professor
Laboratory for Intelligent Systems in Tourism
Department of Recreation, Parks and Tourism Sciences
Texas A&M University
2261 TAMU
College Station, TX 77843-2261
Phone: 979-862-4043
Fax: 979-845-0446
Email: [email protected]
Daniel R. Fesenmaier
Director and Professor
National Laboratory for Tourism & eCommerce
School of Tourism and Hospitality Management
Temple University
1700 N. Broad Street, Rm. 201
Philadelphia, PA 19122-0843
Phone: 215-204-5612
Fax: 215-204-8705
Email: [email protected]
Acknowledgement: We would like to thank Dr. Bertrand J. Jansen at Pennsylvania State
University for his generosity in sharing the search engine transaction log files with us.
2
Semantic Representation of Tourism on the Internet
ABSTRACT
With the huge amount of information available on the Internet and the increasing importance of
online search, understanding the tourism domain is essential for effective online marketing. This
study focuses on the semantic representation of the tourism domain with respect to information
provided on tourism-related websites and traveler’s information needs as expressed through
search engine queries. The results show that huge discrepancies exist between a domain ontology
derived from tourism websites and the one emerging from user queries. This study offers useful
insights into the challenge of representing tourism products and services through websites and
provides directions for developing Internet-based systems that can better support travel planning.
Keywords: Search engines; Semantic Web; ontology; semantic representation; online marketing.
3
Semantic Representation of Tourism on the Internet
INTRODUCTION
The Internet can be considered a virtual “galaxy” with entities representing various kinds
of tourism information, among countless other domains. As such, there are many questions one
may ask regarding the nature of online travel information. Arguably, one of the most important
questions is whether the information currently available online matches the information needs of
travelers. Identifying structures and gaps in online travel information is important as it can
provide input for the design of websites and other Internet-based technologies to better support
travel planning (Carroll and Thomas 1982; Crawford 2003; Hevner et al. 2004; Norman 1999;
Werthner 1996). In addition, such knowledge is essential for developing effective strategies for
online tourism marketing (Adomavicius and Tuzhilin 2005; Fesenmaier, Wöber, and Werthner
2006; Riedl and Konstan 2002).
This paper builds upon a series of studies that have focused on understanding the online
tourism domain and the information needs and search strategies of its users (Fesenmaier et al.
2006; Gretzel and Wöber 2004; Pan and Fesenmaier 2006; Wöber 2006; Xiang et al. 2007;
Xiang, Wöber, and Fesenmaier forthcoming). In particular, Pan and Fesenmaier (2006) and
Xiang et al. (2007) demonstrated that the tourism domain is represented differently on the
Internet for tourism providers and consumers. Their findings, however, were based on small
experimental studies and provide very limited descriptions of tourism on the Internet. Therefore,
the goal of this study is to obtain a more comprehensive understanding of the online tourism
domain using larger, more representative data sets derived from actual search engines queries. It
is posited that the results of this study provide useful implications for the design of tourism
4
specific search engines as well as the development of potentially more effective strategies for
online destination marketing.
ONLINE TOURISM DOMAIN ONTOLOGIES
Tourism is a field that manifests unique characteristics in the provision (supply) and
consumption (demand) of products (Smith 1988; Woodside and Dubelaar 2002). Tourism
businesses and tourism-related organizations such as destination marketing organizations present
and promote their offerings online using a language which is largely industry-specific (Dann
1997; Pan and Fesenmaier 2006). The demand side, on the other hand, consists of travelers and
their respective information needs as expressed through searches conducted online (Wöber 2006).
Thus, the online tourism domain is extremely large and complex and includes objects related to
both the tourism industry and the traveler (Pan and Fesenmaier 2006; Xiang et al. forthcoming).
In computer and information science, an ontology is defined as comprised of a
representational vocabulary with precise definitions of the meanings of terms plus a set of formal
axioms that constrain interpretation and well-formed use of these terms (Campbell and Shapiro
1995). Recent studies of Internet-based technologies have shown that an important limitation to
the use of the Internet relate to the domain representations (i.e., ontology) used to support online
search (Berners-Lee 1999; Kim 2002; Lau 2003). These studies indicate that a common
vocabulary is essential because it is used to bridge the various “languages” of computer systems
and users so that meaning (i.e., semantics) can be established and shared between the system and
the user. The notion of the “Semantic Web” has been developed to describe the Internet-based
infrastructure that supports the machine-understandable representation of the world (Berners-Lee
1999). From an information search perspective, emerging technologies such as search engines
5
that have developed the ability to “understand” the semantics of user queries are only now
beginning to be able to answer questions such as: “Can you identify all destinations that have
beautiful beaches in the US?” As such, understanding the semantic representation of tourism and
its use in information search appears to be an important key to the further development of search-
related technologies and online marketing strategies in tourism.
There has been limited research focusing on online representation of the tourism domain
(Pan and Fesenmaier 2006; Wöber 2006; Xiang et al. 2007; Xiang et al. forthcoming). Wöber
(2006), for example, examined the visibility of destination marketing organizations and
individual hotel operations in Europe among six popular search engines. The findings of this
study showed that many tourism websites enjoy very low rankings among the search results,
which makes it extremely difficult for online travelers to directly access individual tourism
websites through these search engines. Pan and Fesenmaier (2006) found that the “language of
tourism” (Dann 1997) is extremely rich; further, their study indicated that the vocabularies used
on destination marketing organization websites differed substantially from those of potential
users. As such, they concluded that the richness in language and the differences in perspectives
make it very difficult for Internet users to have a satisfying online search experience. Following
from Pan and Fesenmaier (2006), Xiang et al. (2007) examined the language use among
consumers and suppliers in describing a specific type of tourism product, i.e., dining experiences.
The results of this study are consistent with Pan and Fesenmaier (2006) in identifying the
substantial differences in how users and producers perceived and represented travel-related
products on the Internet. Unfortunately, both studies were conducted in an experimental setting
by using a very limited number of student subjects. Therefore, these studies are not able to
describe the nature of the online tourism domain to a meaningful extent.
6
It is argued that Pan and Fesenmaier's (2006) conceptual framework, however, provides a
useful foundation for understanding the way travelers utilize the tourism domain in constructing
a trip plan in that it describes the tourism domain as exhibiting a hierarchical, interconnected
structure which can be represented as a semantic network with nodes and interrelationships.
Importantly, Pan and Fesenmaier (2006) showed that quantitative textual analysis, particularly
semantic network analysis, provides a strong theoretical and methodological foundation with
which to describe the semantic nature of the online tourism domain. Quantitative textual analysis,
according to Krippendoff (2004), is underpinned by theories in communication and linguistics
with a fundamental assumption that relative frequency signifies the importance of a specific
word, and the meaning of the word is a function of the proximity to other words. In semantic
network analysis, the semantic structure, i.e., “meanings”, of text can be constructed and
represented in a variety of ways by establishing the associations between different concepts
(Woelfel 1993). Different measures such as proximity and centrality and the strengths of
identical relationships can be derived to measure the structure of a semantic network and to
compare the differences between two semantic structures (Carley 1997; Popping 2000).
Proximity is one of the most important measures in that it can be used to measure the
interrelationships between words within a semantic network. Another important measure is
“centrality”, which describes the “prominence” of a node within the overall network (Wasserman
and Faust 1994) whereby words with higher centrality values represent dominant “themes” in the
text. The similarities (or distance) matrix generated in text analysis can be used as input into
multivariate analyses such as cluster analysis and multidimensional scaling in order to assess
both the content and structure of a semantic network. For example, icicle maps in clustering
analysis and coordination maps derived from multidimensional scaling can be used to assess the
7
meanings of textual data and are, thus, deemed useful for describing the semantic representation
of online tourism (Gretzel et al. 2008). Last, QAP (Quadratic Assignment Procedure) is an
analytical procedure that can be used to compare the structural properties of two networks and
establish similarity or dissimilarity (Krackhardt 1987).
RESEARCH QUESTIONS
This study posits that travelers’ use of search engines establishes the basis with which to
understand the nature of tourism domain ontologies. Search engines such as Google, Yahoo!, and
MSN index a huge number of Web pages on the Internet and thus serve as the “Hubble”
telescope with which people learn about the entire virtual “galaxy” (Castells 2001; Spink et al.
2002). Typically, the interaction between a traveler and a search engine interface begins when a
traveler with an initial search task and a particular mental model enters a query into a search
engine textbox. At this stage, the traveler's mental model consists of a set of factors including the
traveler’s understanding of how the system (search engine) works and knowledge of the domain
as well as the search task itself (Gretzel, Hwang, and Fesenmaier 2006) and where query
formulation involves the mapping of one’s mental model with the system selected (Marchionini
1997). Thus, a query can be seen as the expression of the user’s information needs in the context
of a search task.
Based upon the query, the search engine retrieves and returns a number of search results
that “match” the keyword string and displays them in a pre-defined format (Yu and Meng 2003).
If the search results match the traveler’s expectations, he/she will most likely examine the links
displayed on that page; if not, he/she may enter new keyword(s) to start another round of the
query – website selection process. Thus, this sequence of interaction with a search engine
interface involves the traveler’s reading and understanding of the results of the search with
8
respect to a mental model, and then navigating back and forth between the search engine
interface and the travel information space (Jansen, Brown, and Resnick 2007). Based upon this
understanding, it can be expected that a mapping process occurs between the query terms used
by a traveler and the semantics on webpages that are considered relevant. This implies, then, that
the traveler makes a series of decisions based on the data (i.e., the descriptions included in the
search results as well as the webpages chosen by the traveler) to which he/she has been exposed.
As such, the use of search engines for travel purposes can be seen as the interaction between the
demand and the supply of tourism through one of the most important channels on the Internet.
Of particular interest to this study is the representation of the tourism domain through
search engine results, i.e., the supply, and the queries people use to search for tourism related
information, i.e., the demand. The following research questions were formulated to guide this
study:
Q1. What constitutes the online tourism domain as represented through a search engine?
Q2. What are the commonalities and differences between the language used in search
queries and the language on tourism websites?
RESEARCH METHODS
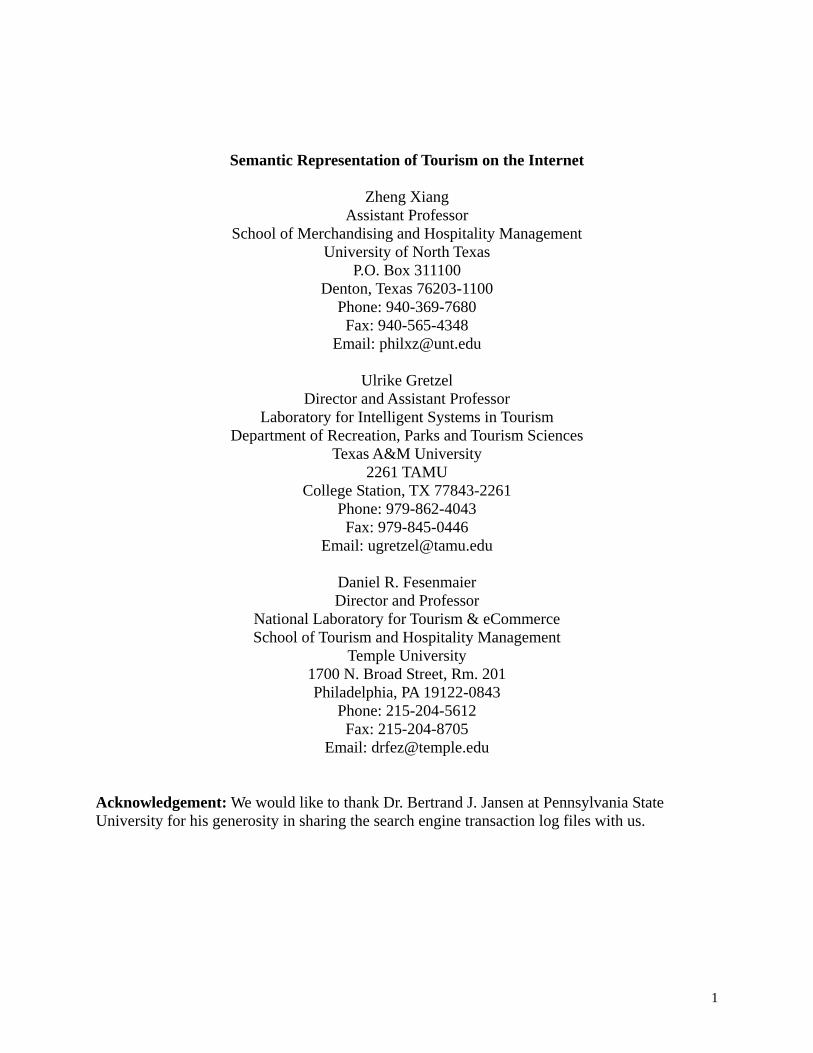
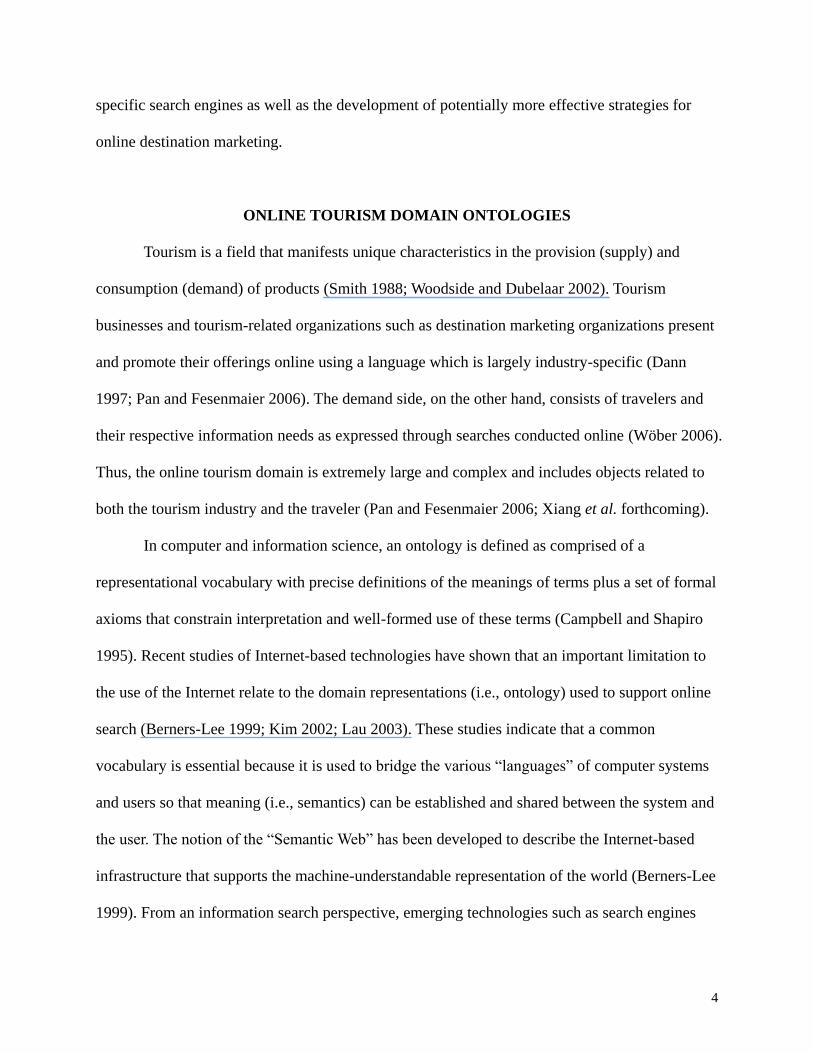
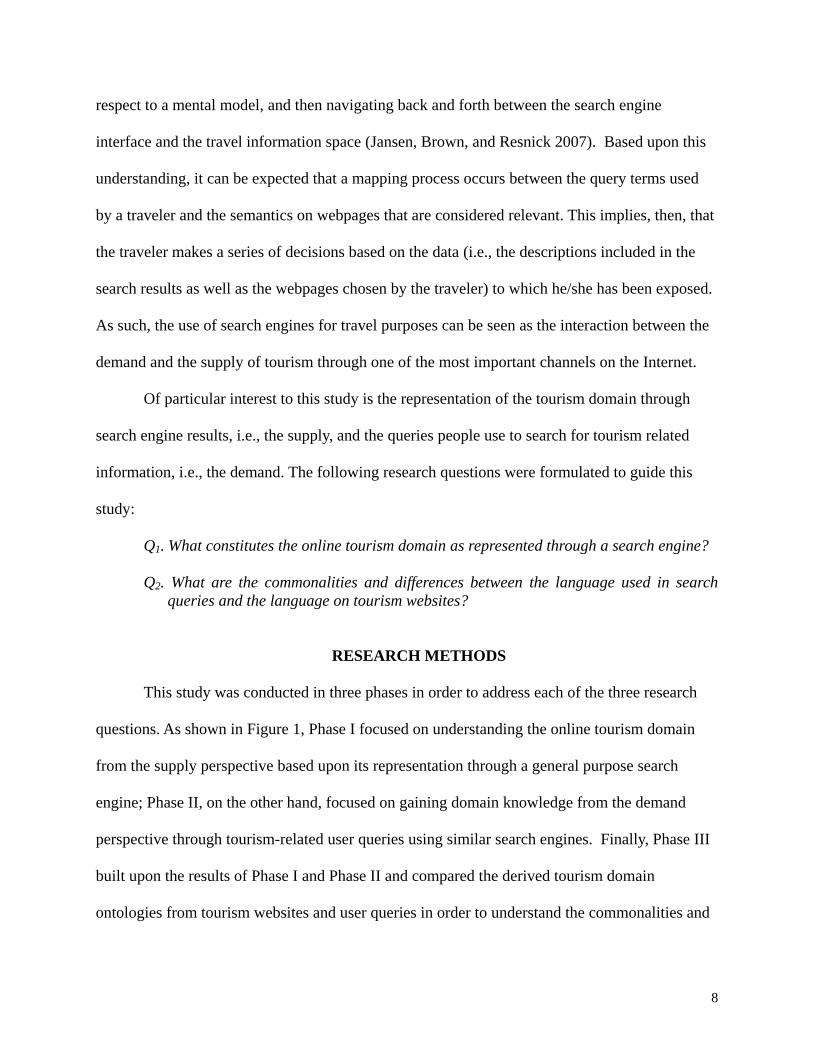
This study was conducted in three phases in order to address each of the three research
questions. As shown in Figure 1, Phase I focused on understanding the online tourism domain
from the supply perspective based upon its representation through a general purpose search
engine; Phase II, on the other hand, focused on gaining domain knowledge from the demand
perspective through tourism-related user queries using similar search engines. Finally, Phase III
built upon the results of Phase I and Phase II and compared the derived tourism domain
ontologies from tourism websites and user queries in order to understand the commonalities and
9
differences between the representation of tourism from the demand and supply perspectives. This
section details the overall research design as well as data collection and analysis corresponding
to each of these three phases.
Insert Figure 1 about here
Research Design
A travel planning scenario was used to mimic travelers’ use of keywords to query a
search engine to plan a trip to a specific destination. Specifically, the city of Chicago was chosen
as a convenient case due to its status as one of the largest urban tourist destinations in the United
States as well as its diversity in cultural and historical resources for tourists. Then, a set of nine
pre-defined keywords (i.e., “accommodation”, “activities”, “area”, “attractions”, “events”,
“information”, “places”, “restaurants”, and “shopping”), that are most likely to be used by
travelers, were identified. In Phase I, these keywords, in combination with the destination name
(i.e., “Chicago”), were used to query Google. Based upon the URLs provided by the search
results, the text-based contents from tourism websites were extracted to represent the tourism
domain from the supply perspective. In Phase II, the same keywords, together with the
destination name (i.e., Chicago), were used as “seeds” with which to extract user queries from a
number of search engine transaction logs.
Two critical considerations guided the development of this approach. First, the pre-
defined keywords must reflect the tourism domain in a comprehensive way. The selection of the
keywords was guided by both the classification schemes used by the tourism industry and actual
queries used by travelers. Specifically, websites of several destination marketing organizations
10
located throughout the United States were used as sources to identify these keywords. That is,
textual labels for the navigational menus on these websites were extracted to obtain the
categories by which DMOs organize their information (e.g., “accommodation”, “attraction”,
“events”, etc). Also, an analysis of the publically available query logs of a European-based
search engine (visiteuropeancities.info) were used to provide a triangulation with the types of
keywords likely to be used by travelers (Wöber 2006). After discounting cultural and geographic
specifics (e.g., the DMO of Chicago had “theatre” as one of the top-level categories while others
did not; and, churches and historic architectures were among the most searched items among
European travelers), these nine keywords consistently occurred in both the supply and demand
sources and, thus, were considered “generic” categories that represent online tourism.
Second, a number of search engines were selected to obtain data describing travel-related
search queries from the demand perspective. Google was used as the sampling frame for the data
collection for Phase I as it represents the state-of-the-art search technology on the Internet. Also,
it is ranked as the most popular search engine on the Internet with reportedly an index of around
25 billion Web pages and 250 million queries a day; this represents approximately half of all the
queries occurring on the Internet (Bertolucci 2007; Brooks 2004; Burns 2007). Further, it is
considered to be one of the most comprehensive text-based search engines on the Internet
(Bertolucci 2007). Phase II utilized a convenience sample of transaction log files from three
search engines that are available publically, namely Excite, AltaVista, and AlltheWeb, to
understand the semantic nature of tourism related queries (Jansen and Spink 2005). While these
search engines might be different from Google in certain aspects (i.e., ranking algorithms, etc.),
all of them have an interface similar to Google. That is, the interaction between a user and the
system is supported by a typical textbox for users to type in queries and the search results are
11
represented in a “list” format. As such, it is argued that these search engines can be considered
essentially equivalent to Google, at least from a user system interaction viewpoint.
Data Collection
Data collection in Phase I followed a two-step procedure. First, the nine keywords were
used to form queries with the destination name (i.e., “Chicago”) and then the search results were
extracted from Google. According to the information retrieval literature (e.g., Spink et al. 2002),
most search engine users (>85%) do not view search results beyond the first three pages
(assuming each page contains 10 search results as the standard practice of most text-based search
engines). As such, the first 30 URLs which comprise the first 3 pages of search results are most
likely to be viewed by travelers. In addition, another two search result pages (i.e., with 20 search
results) were extracted, with one page from the middle of the search results and another page at
the bottom of the search result set, in order to provide a sample with more “depth”. Then, a Web
crawler program written in the Perl programming language was used to retrieve Web page
contents by following these 450 (50 search results * 9 search terms) URLs. The textual content in
the body of the Web pages were then parsed and saved as the “corpus” to represent the supply-
side domain.
In Phase II, user queries from three major search engines were used for the analyses (i.e.,
three sets of log files from Excite, one from AltaVista, and two from AlltheWeb, dated from
September 1997 to May 2002). The detailed descriptions of these transaction logs are provided in
a number of publications by Spink and her colleagues (Jansen and Molina 2006; Jansen and
Spink 2005, 2005; Jansen, Spink, and Pedersen 2005; Spink et al. 2004). Altogether, these
transaction logs included about 11 million distinct queries. However, only the nine pre-defined

12
keywords in combination with the destination name “Chicago” were extracted, resulting in a
total of 3,020 observations (i.e., search queries).
Data Analysis
Quantitative text analysis was employed as the primary analytic approach followed a
three step design. Phase I focused on identifying the semantics that represent the tourism domain
based on the textual data extracted from tourism Web pages. Phase II focused on evaluating the
semantics that were used by search engine users looking for travel information for Chicago. Last,
Phase III compared the results from the previous two phases with a focus on assessing the
commonalities and differences in the words contained in the two data files.
Phase I: Assessing the Online Tourism Domain from a Supply-Side Perspective
The goal of this analysis was to understand the semantic nature of the tourism domain
from the supply perspective. It included two steps: Step 1 aimed to identify the words that truly
represent the domain, i.e., the domain ontology, and Step 2 aimed to understand the semantic
structure of this ontology, focusing on the central words that link others words together in the
text. In Step 1, a pre-processing procedure was carried out with the goal to identify the “stop”
words in the data including articles, prepositions, conjunctions, and transitive verbs that do not
contribute to the meaning of the text (e.g., “a”, “an”, “the”, “and”, “but”, and “also”, etc). Then,
the aggregated text file was imported into the statistical software SPSS to calculate the
frequencies of each unique word. An examination of the distribution of the frequencies of all the
unique words indicated that there are a huge number of unique words in the data and there are a
relatively small number of words that are used often. A cut-off value of the first 787 words with
the highest frequencies was used to include those that “best” represent the tourism domain for
13
two reasons: 1) the cumulative frequencies of these words represent approximately 60% of the
total frequencies of all unique words; and, 2) the lowest frequency among this word is 45.
Considering this text represents 450 Web pages (3 X 50), words that have frequencies of less
than 45 only occur, on average, less than once in 10 Web pages. As such, it was assumed that
they were rarely used on tourism websites. These 787 words were then manually examined with
the goal to identify words that are “representative” of the tourism domain. Words that were
informative about the document itself such as “file”, “total”, and “copyright” were identified and
dropped from the pool. This resulted in a final pool of 364 words which were then used to
represent the online tourism domain for Chicago.
The next step of the analysis identified the semantic structure of the aggregated text using
the identified 364 words. Neural network software CATPAC (Woelfel 1993) was used to assess
the semantic associations between the respective words. In CATPAC the “neuron”, which
represents a pre-specified word, is initiated by passing a "scanning window" of n consecutive
words through the text while ignoring the pre-identified “stop” words (Woelfel 1993). The
proximity between the “neuron” and other words is measured and recorded. The program then
reads the next group of k words, depending on the slide size (i.e., the number of words by which
the scanning window moves). If the slide size is 1, for example, CATPAC moves one word
further in the text and then reads the next word, and so on, until the full text has been examined.
The software will continuously iterate through the full text with a new “neuron” until all words
in the pre-specified word set have been exhausted. The structure of the semantic association can
be represented by a square matrix of numbers where each row and column represents a neuron
(word), while the value of each cell (an updateable weight) represents the strength of connections
between the two neurons.
14
The scanning window size is a critical facet of text analysis in that it has the potential to
impact the resulting semantic structure. Thus, an exploratory experiment was conducted to
determine the appropriate window size to use in the analysis. Specifically, proximity matrices
generated by CATPAC using various window sizes (from 1 – 7) were used as input into
hierarchical cluster analysis based on the criterion that the window size should not lead to too
many clusters (i.e., small clusters are disassociated with each other) or only one cluster (i.e., all
words are “lumped” together). A visual analysis of the results of the cluster analyses indicated
that a window size of 5 words was appropriate.
Since CATPAC does not output statistical measures for cluster adequacy and does not
provide the information about the clustering process (i.e., how and when words are linked
together), the proximity matrix was then imported into the social network analysis program
UCINET (Borgatti, Everett, and Freeman 1992) to further examine the clustering solutions. As
part of the analysis, centrality measures were calculated to identify words the most prominent
words as well as the semantic structure of the text.
Phase II: Assessing the Online Tourism Domain from the Demand Perspective
The primary goal of this analysis was to describe the semantic nature of user queries
related to Chicago tourism through search words extracted from 6 search engine transaction logs.
Analysis followed similar procedures used in Phase I, with the following distinctions after taking
into consideration the unique characteristics of search engine user queries (Spink 2002): 1) the
descriptive analysis not only identified the unique words in user queries but also examined the
length of queries; 2) the pre-processing of the data included identifying the stop words, deleting
sex-related queries and manually fixing user typos and misspellings; 3) the semantic association
was measured using CATPAC with a window size of 2 as the majority of queries were fairly
15
short (1 – 4 words); 4) each query was treated as an individual case; and, 5) all unique words in
the dataset were included in the analysis.
Phase III: Assessing the Commonalities between the Online Tourism Domain and User Queries
The goal of Phase III analysis was to compare the semantic structures identified in the
first two phases of the study. Following Pan and Fesenmaier (2006), it is argued that if there is
high degree of commonality between these two structures, there is a “match” between the supply
and demand side, i.e., the information provided by the industry should be useful in helping users
find what they need. Comparing the words and the semantic relationships can, therefore, reveal
discrepancies between what is offered and promoted by the industry and what is searched for by
travelers. This analysis consisted of two steps; first, common words shared by the online tourism
domain and user queries were identified. A commonality ratio was then calculated based upon
the number of common words and the number of different words to show the degree to which the
online tourism domain and user queries have in common. Second, an N by N proximity matrix,
(where N stands for the number of common words) was constructed using CATPAC in the same
way as used in the first two phases for both the online tourism domain and user queries based
upon the common words. QAP was then used to assess the correlation between these two
proximity matrices (Borgatti et al. 1992).
RESULTS
The following sections present the results of the study corresponding to the three phases
of analysis: 1) the semantic nature of the supply-side tourism domain based upon Website texts
derived from search engine results (Phase I); 2) the semantic nature of the demand-side tourism

16
domain based upon user queries in search engines (Phase II); and, 3) the comparison between the
domain ontologies identified based upon tourism related Web pages and user queries (Phase III).
The Semantic Nature of the Online Tourism Domain from a Supply Perspective
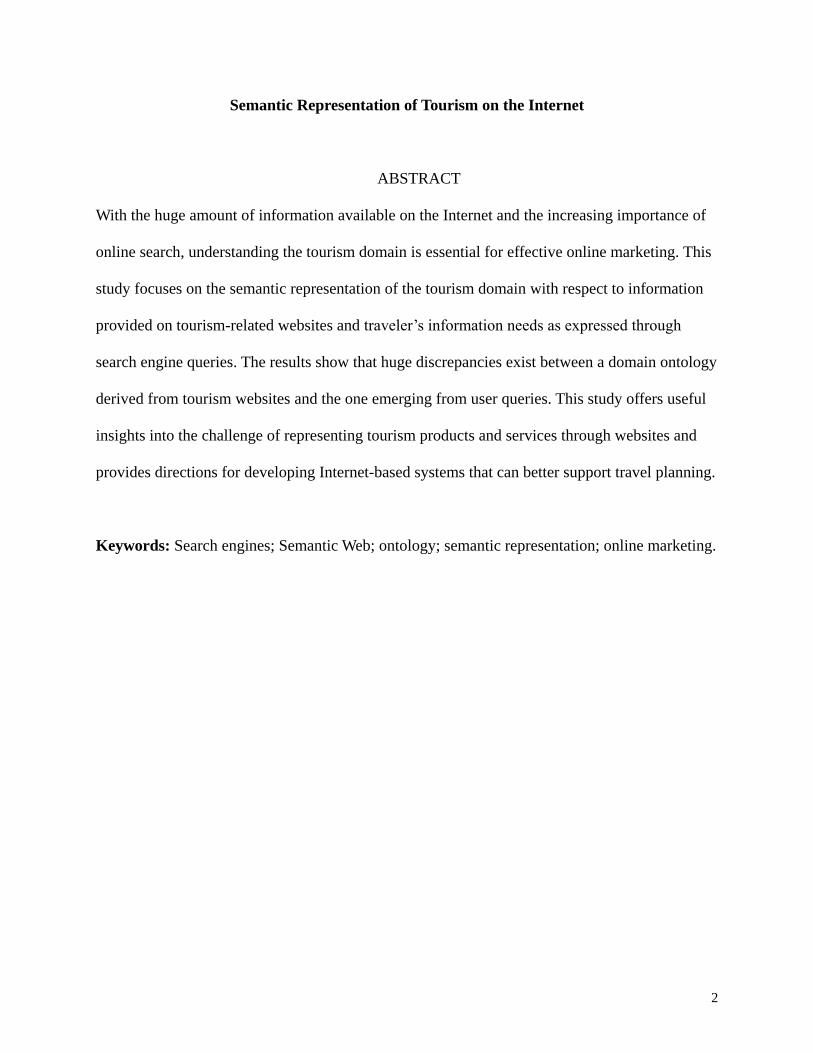
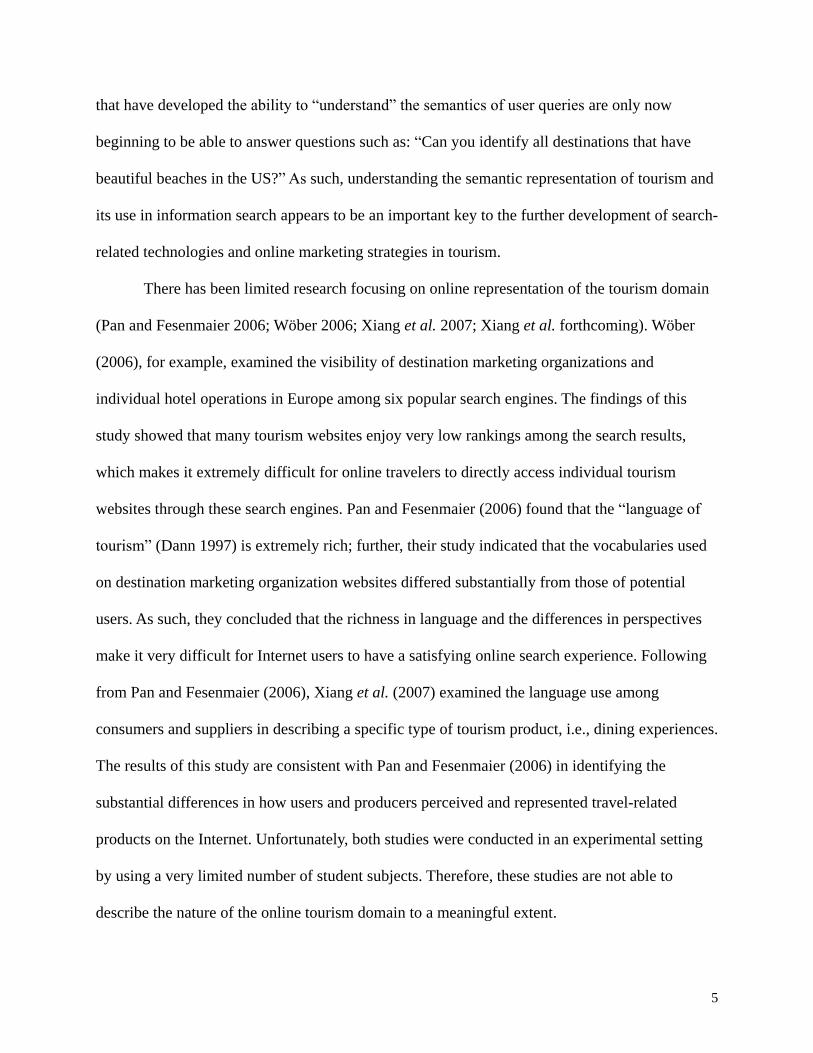
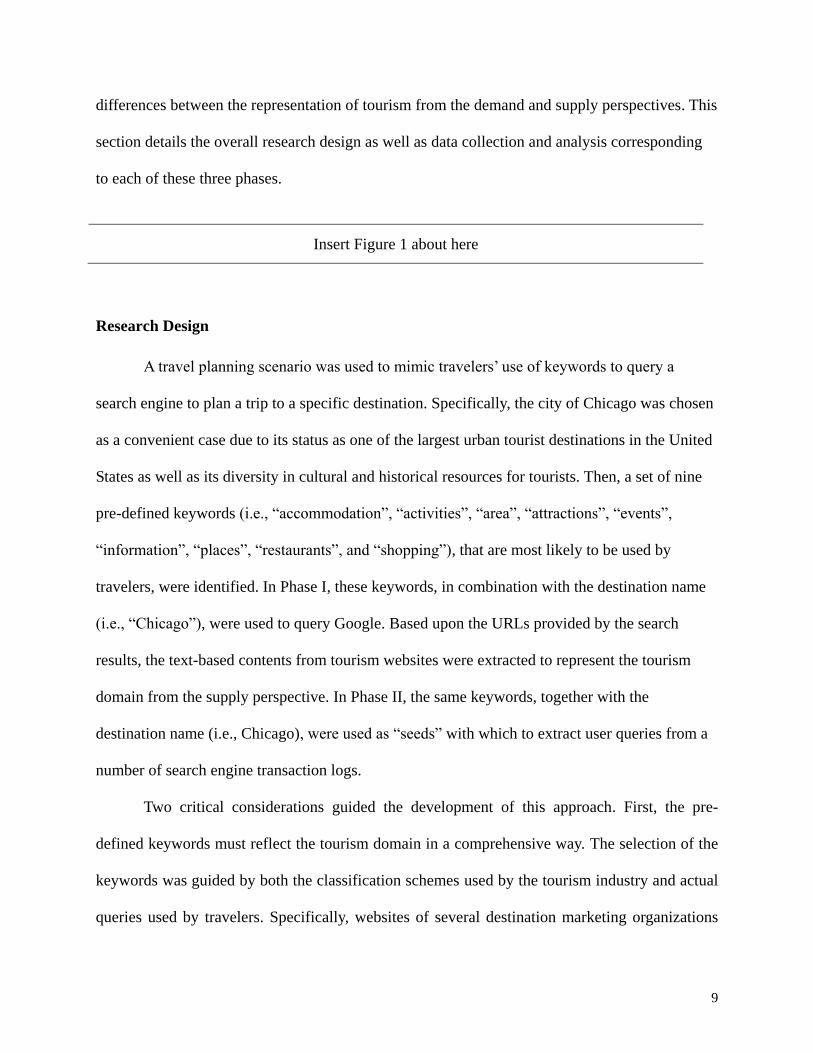
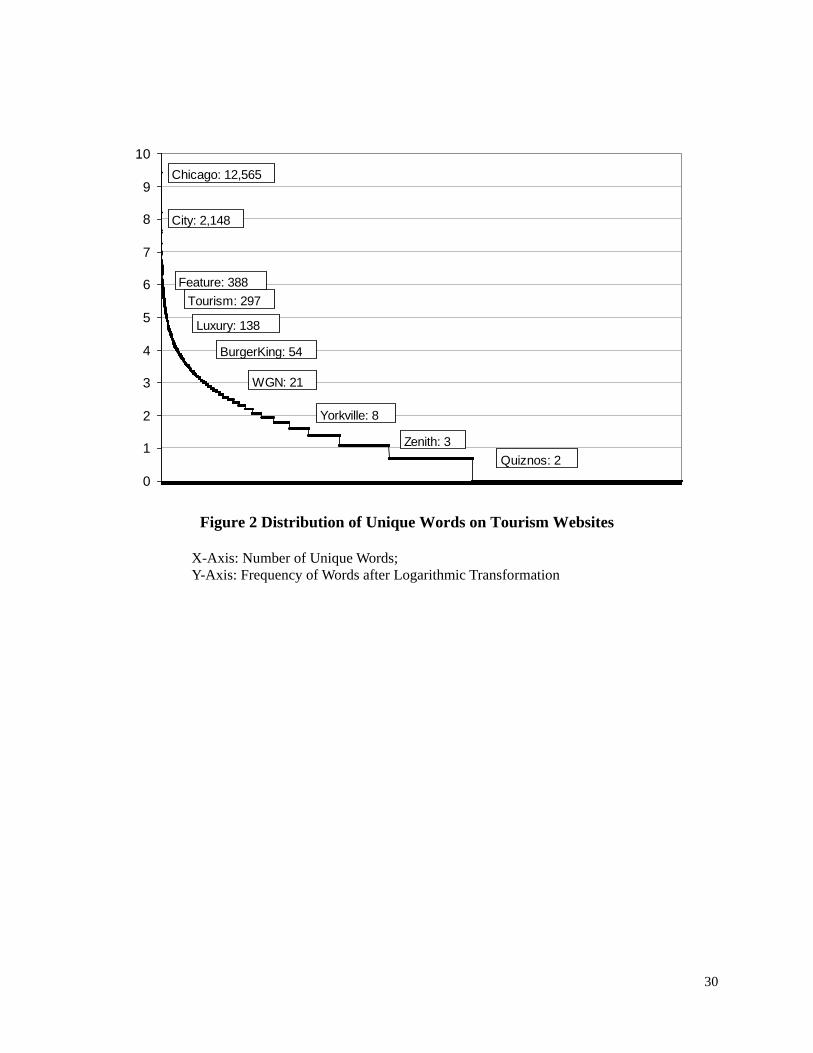
Figure 2 shows the distribution of all the unique words with their frequencies after a
natural logarithmic transformation. As one can see, the top 100 words represent approximately
30% of the total frequencies of all unique words; the top 500 words represent more than 50% of
the total frequencies of all unique words while the top 1,000 words represent more than 60% of
the total frequencies of all unique words. Also, it is important to note that there are a large
number of words that are singletons and represent more than 1/3 of the words used once and
about 2/3 of all unique words used 3 or fewer times. This indicates that the language describing
the tourism domain from the supply perspective is dominated by a small number of words but the
overall domain is extremely rich and largely idiosyncratic. A further analysis of the less
frequently used words showed that while there were a large number of words that did not
exclusively belong to the tourism domain (e.g., words that are part of the “natural language” such
as adjectives like “familiar” and “immediate”, adverbs like “specifically” and “commonly”, and
nouns like “transition” and “threat”), many of these words were proper nouns such as “cabrini”,
“blackwell”, “bloomingdale”, “zenith”, and “quiznos” and reflected place-specific concepts, thus
representing the place-based foundation of the tourism experience.
Insert Figure 2 about here
Based upon the distribution of frequencies, 364 unique words which represented approx.
45% of all unique words were used to represent the tourism domain ontology (not listed due to
17
limitation of space).Their frequencies ranged from the highest (12,565) to the lowest frequency
(38) and represented a huge variety of businesses and services in the tourism industry. The word
“chicago” had the highest frequency among all words as it was used to define the geographic
boundary of the domain. Some of the other popular words were generic words as they related to
tourism; these included “place”, “area”, “information”, “map”, “travel”, and “tour.” Many other
words were specifically related to attractions and activities including “attraction”, “events”,
“center”, and “world” while others related to location such as “west” and “downtown.” Last,
some words suggested an interest in promotions such as “best”, “deal”, and “service”.
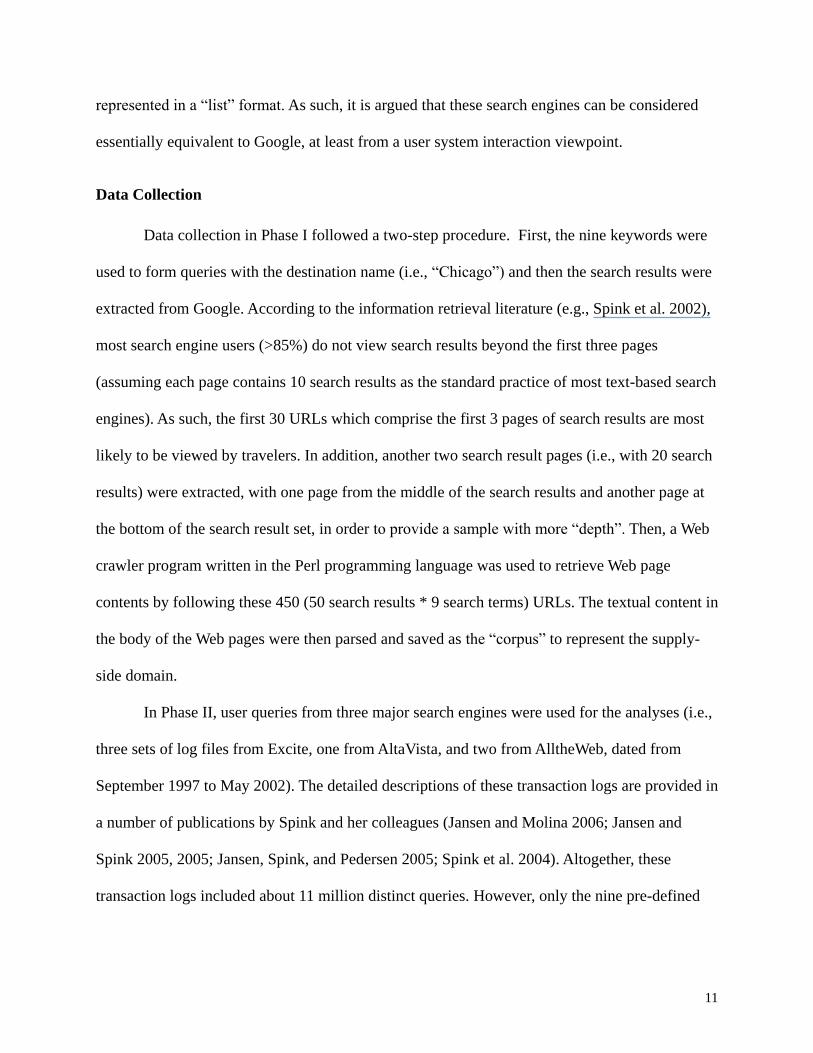
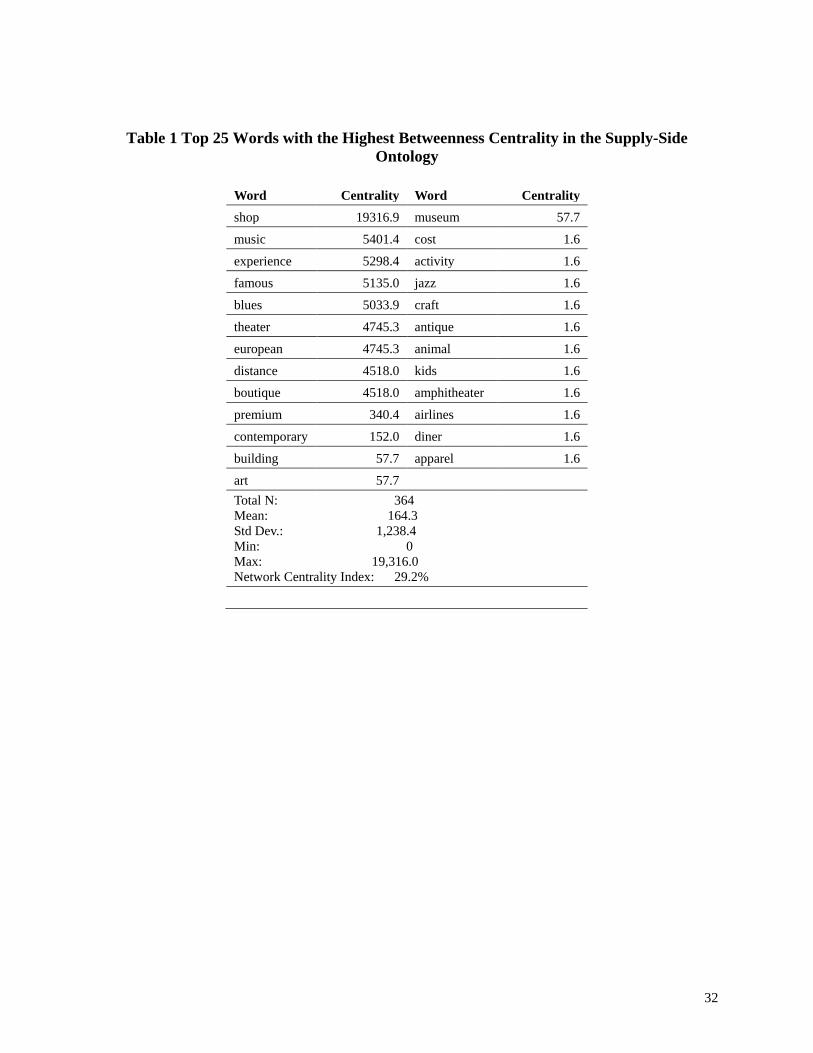
The Freeman Betweenness Centrality measure (Borgatti et al. 1992) was calculated to
identify those words that were prominent in the semantic network and played a central role by
linking different groups of words. Intuitively, this approach can be understood as finding those
words that were commonly shared among different Web pages. Table 1 lists the top 25 words in
the semantic network that have the highest betweenness centrality values. As can be seen, a
number of the words exhibited a relatively high centrality value (mean=164.3 with a standard
deviation of 1,238) and the overall network centralization was high (29.2%). This indicates that
certain concepts were highlighted in the representation of tourism services and products by the
industry and they were commonly “shared” across different websites and sections of websites.
Interestingly, it seems that these words can be placed into “layers” based on their centrality
values. For example, while the word “shop” has the highest betweenness centrality, words such
as “music”, “experience”, “famous”, “blues”, “theater”, “european”, “distance”, and “boutique”
have centrality values much lower than “shop” but much higher than the rest of the words.
Insert Table 1 about here

18
The Semantic Nature of the Online Tourism Domain from a Demand Perspective
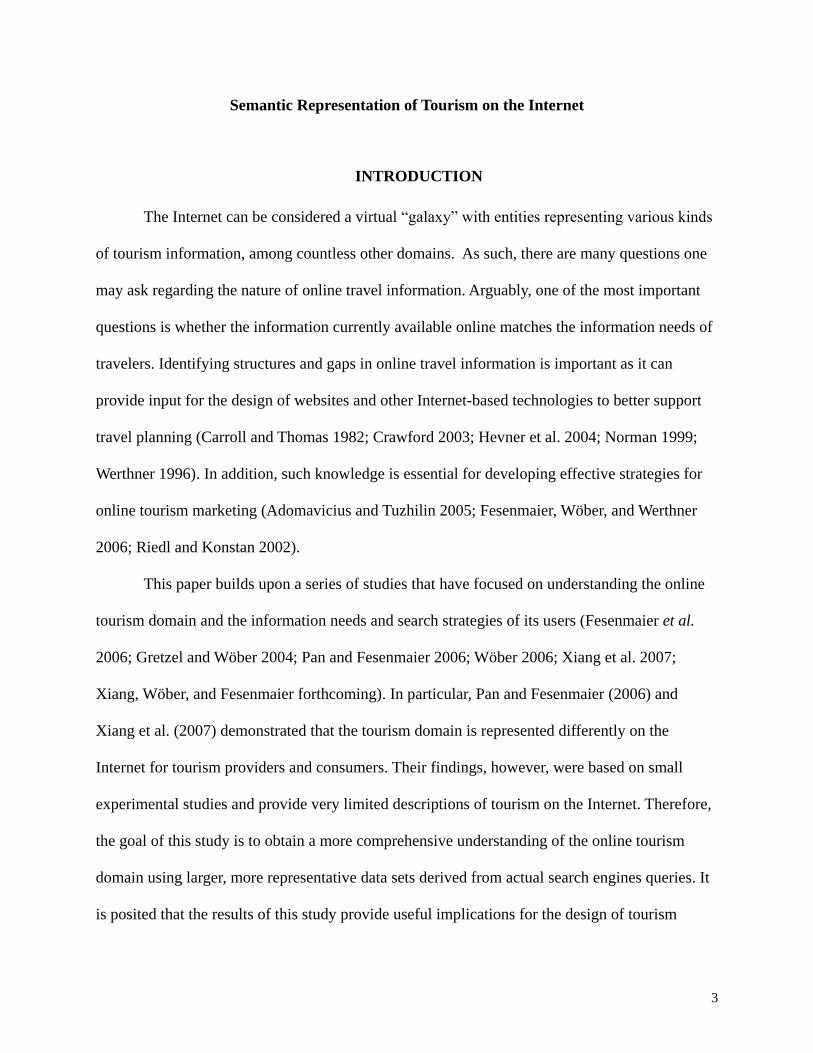
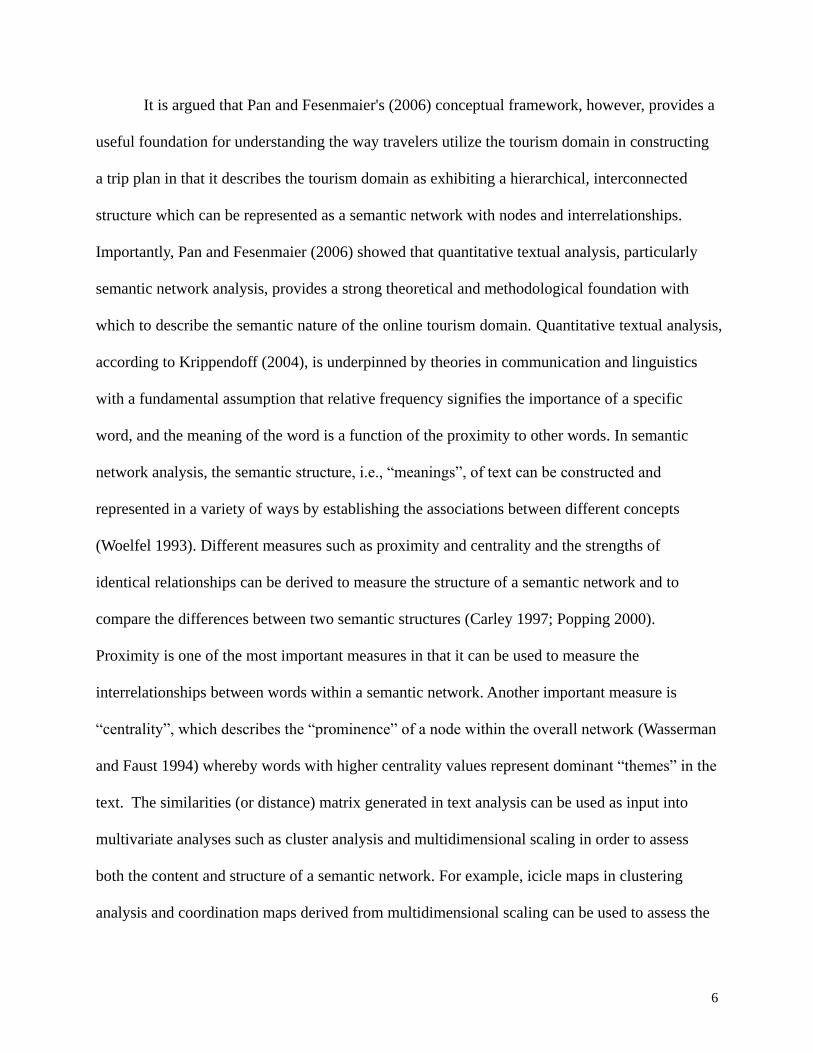
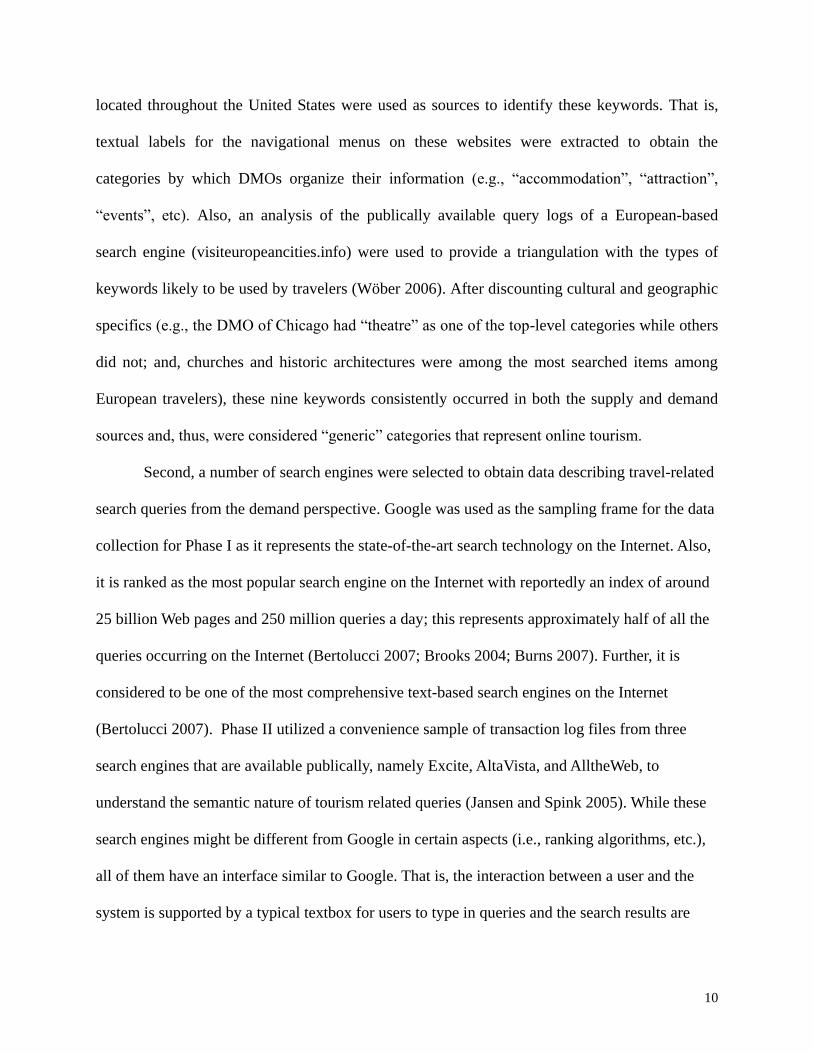
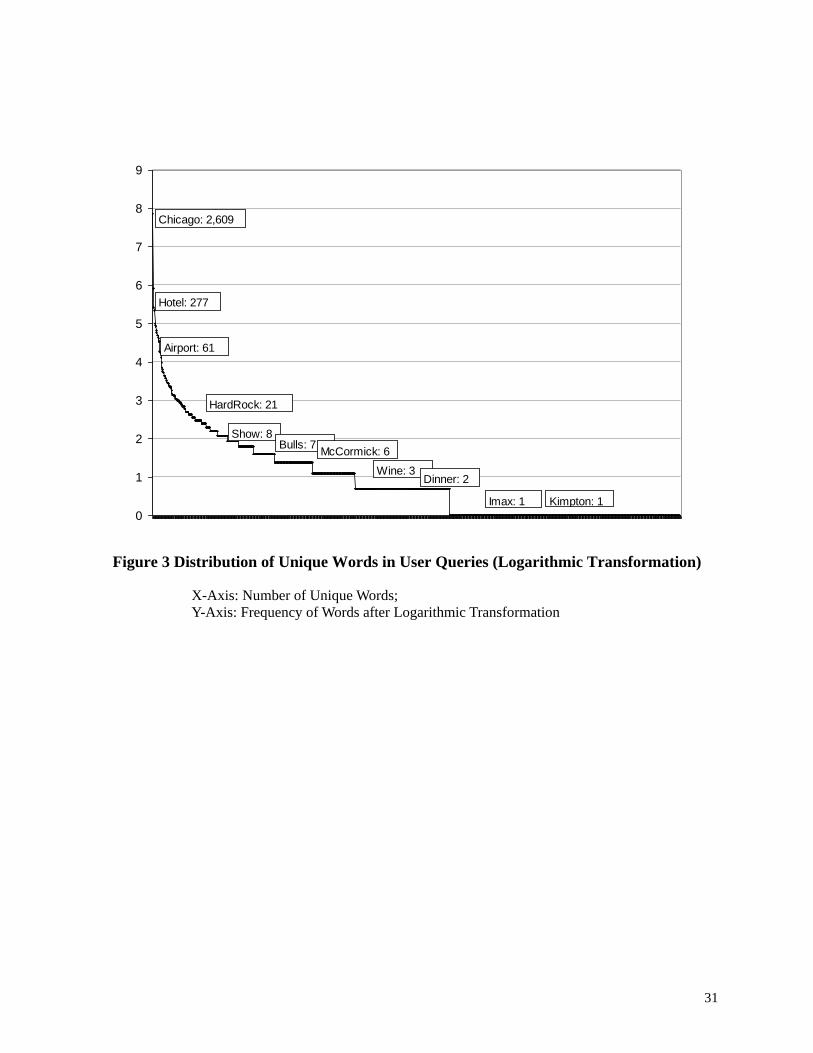
Most user queries were short, ranging from 1 to 4 words, and were either very general
(e.g., “Chicago hotel”) or very specific (e.g., “Chicago Wyndham hotel”). Figure 3 shows the
distribution of frequencies of unique words in user queries, indicating that the top 20 words with
the highest frequencies represented more than half (52%) of the total frequencies of all words
and the top 100 words represented 70% of the total frequency. As can be seen, approximately
two thirds of all the unique words had a frequency lower than or equal to 2 and 45% of all unique
words were used once by search engine users. Overall, the distribution was highly skewed
toward the small set of high frequency words, reflecting travelers’ general interests in tourism
related information (e.g., “hotel”, “direction”, “map”, “downtown”, “reservation”, “spa”,
“discount”, “accommodation”, “lakeview”, etc).
Insert Figure 3 about here
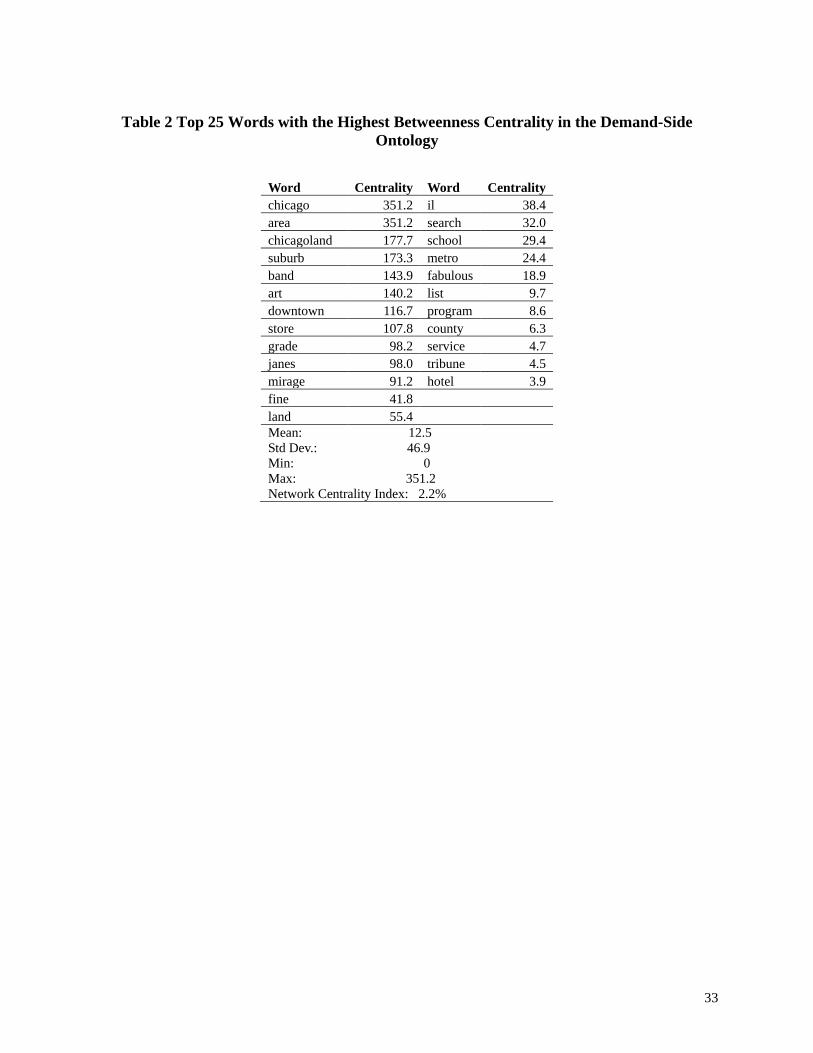
The Freeman Betweenness Centrality measure (Borgatti et al. 1992) was calculated to
identify the words that are prominent in the semantic network. Table 2 lists the top 25 words with
the highest betweenness centrality values and provides the descriptive summary of the
betweenness centrality measure among the semantic network of the 178 unique words. It is not
surprising to see that words such as “chicago”, “area”, “chicagoland”, “suburb”, “art”, and
“downtown” have the highest betweenness centrality values because they were used most often
in combination with other words. For example, the word “downtown” was often used together
with words such as “chicago”, “hotel” and “shop” to form more specific queries. The overall
network centrality was 2.2%, which indicates that the network has a limited degree of centrality,
19
indicating that the network was somewhat connected and dominated by the words with high
centrality values.
Insert Table 2 about here
Comparing the Supply and Demand Ontologies
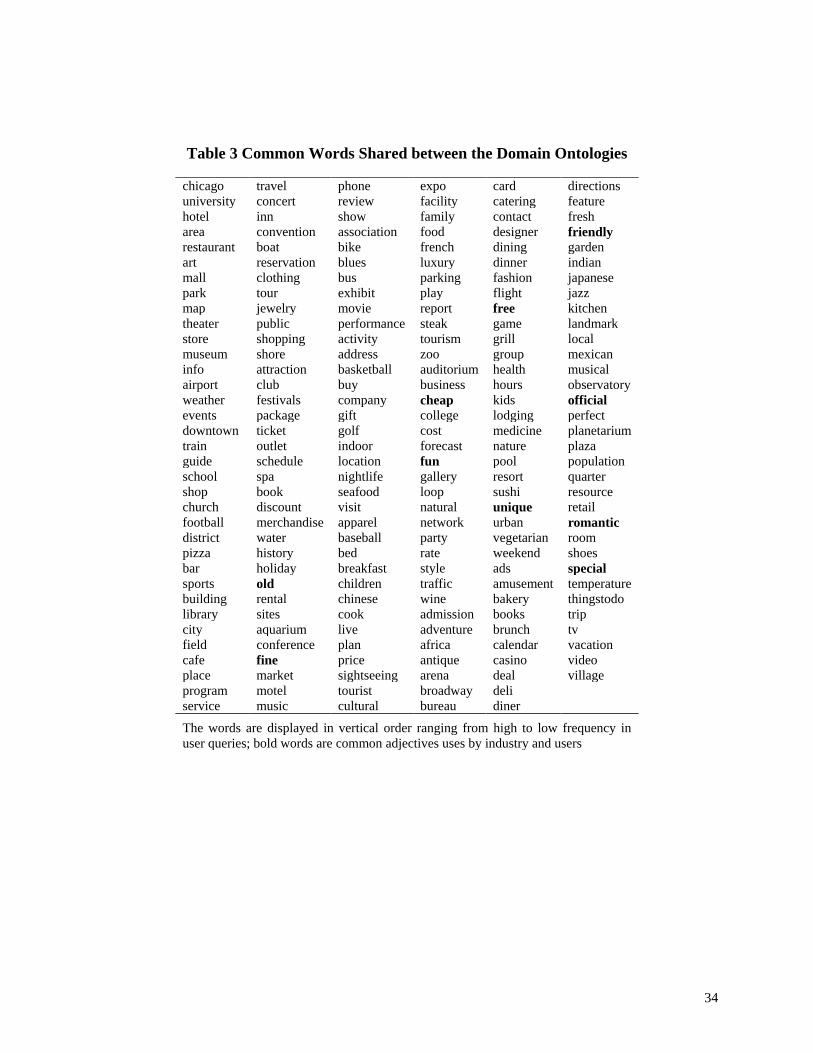
Table 3 lists the common words shared between the domain ontology and user queries.
As can be seen, there were 208 words in user queries that were also found in the domain
ontology derived from the supply side. While most of the common words apparently represented
the business facets in the industry, a number of adjective words (highlighted in bold) including
“fine”, “fun”, “unique”, “free”, “official”, “friendly”, “perfect”, “romantic”, “old”, “cheap”, and
“special” were also commonly used by both search engine users and the industry. It seems that
while these words were used by the industry with the intention to promote their products and
persuade potential visitors, search engine users had also used these words in order to locate
specific information about the products and services they wanted.
Insert Table 3 about here
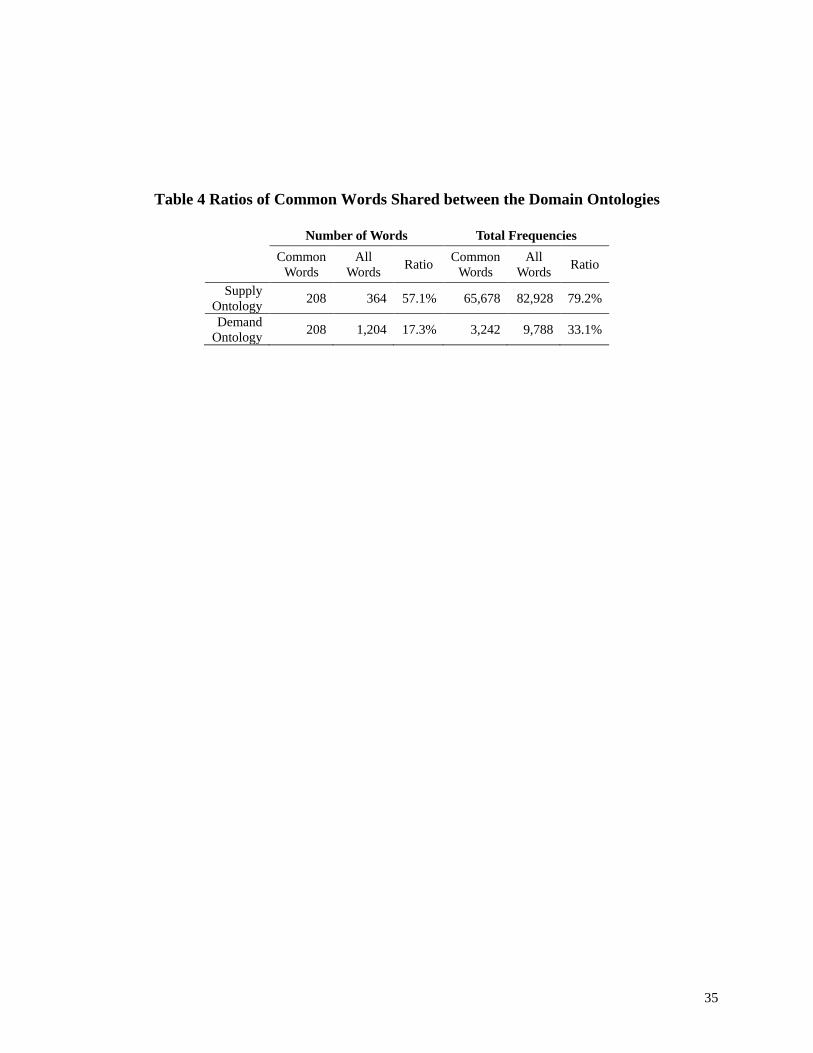
Table 4 provides the ratios of the frequencies of these common words to the total
frequency of all words in both user queries and website results. As can be seen, there was a
relatively small proportion (17.3%) of query words that were actually represented in the website
results, while there was a relatively higher proportion (57.1%) of the words reflected in the
queries people used to search. Taking into account that many of these overlapping words had
high frequencies in both ontologies, the actual ratios that more accurately reflected their
20
prominence were higher; that is, 33.1% for words in user queries and 79.2% in the website text,
respectively. However, there were still a large proportion of words in user queries (approximately
two-thirds) were not reflected in the supply ontology. An examination of these words revealed
that: 1) the words usually had low frequencies, suggesting that they were not popular “items”
people searched for in Chicago; and, 2) many of the words were proper names of an industry
entity such as the name of a restaurant, bar, or store. Last, QAP analysis (Krackhardt 1987) was
conducted using the proximity matrices constructed for the top 50 common words to assess the
correlation between the two ontologies (see Table 5). These words with relatively high
frequencies in both datasets were chosen to represent the core of the shared semantic space
between these two ontologies. The results indicate that no significant relationship existed
between the two semantic structures based on the 50 common words in the supply-side ontology
and the demand-side ontology based on user queries. Thus, this finding indicates that these two
semantic ontologies were structurally different, especially given that one would expect some
degree of communality among the most frequently used words.
Insert Tables 4 and 5 about here
CONCLUSIONS AND IMPLICATIONS
The results of the study indicate that the online tourism domain represented through
websites and travelers' search engine queries includes an incredibly rich amount of information
about the tourism industry within a destination. While the identified domain ontology is
relatively small because it focused on one destination, it is clear that the entire tourism domain is
rich and idiosyncratic with numerous destination specifics. That is, while there are a relatively
small number of words that dominate the tourism domain (e.g., travel, information, hotel, and
21
attractions), there is also a “long tail” with a huge number of words that reflects a wide range of
unique experiences that are offered at the destination. The findings also indicate that online
tourism information exhibits certain structural properties in that words representing the domain
are semantically associated. This semantic space not only contains the various dominant facets of
the tourism industry, but also connotes the meanings embedded in the semantic relationships.
Also, it seems that the tourism ontology contains core and peripheral spaces with certain words
being semantically closer to each other than others. For example, a number of words (e.g.,
“shop”, “music”, “experience”, “famous”, “blues”, “theater”, “european”, “distance”, “boutique”,
“premium”, and “contemporary”) were found to be highly central to the semantic structure of the
Chicago tourism ontology, suggesting their prominence in the semantic space of the domain and
their roles of bridging between clusters of words.
Analyses of tourism-related user queries from search engine transaction files showed that
the majority of queries are short and expressions of travelers’ information needs with the
intention to effectively and efficiently retrieve relevant information from search engines. Overall,
there are relatively few words in user queries that represent the majority of tourism related
“things” (e.g., “chicago hotel”). However, there is also a “long tail” of words that represent users’
heterogeneous information needs and their own mental maps of the tourism experience.
Importantly, these results appear to be consistent with previous studies of tourism information
search (Vogt and Fesenmaier 1998) whereby most information sought when planning travel is
functional rather than hedonic. That is, travelers are much more likely to focus on product
attributes such as location, price, and availability, instead of more experiential ones that are
based upon sensory and emotional aspects of the product (e.g., smell, atmosphere, and sensation,
etc). Also, user queries exhibit a strong semantic structure. That is, the types of information
22
people search for appear to reflect a spectrum of information needs ranging from very general to
highly specific. This finding is consistent with Pan and Fesenmaier (2006) who indicated that the
majority of users search for information that is very general (e.g., “Chicago hotel”), while a
relatively small number of them directly search for specific information by including the name of
the business (e.g., “Chicago Wyndham Hotel”).
The comparison between the ontologies of user queries and the information derived from
tourism websites indicate that there are a small number of words (N=208) common to the two
ontologies. While the majority of the words in the supply ontology were represented in user
queries, these common words represent only a small portion of all the words in user queries. The
differences in the words with high centrality values in the two semantic structures identified the
different orientations in the representation of tourism and users’ information needs. That is, the
results suggest that while the industry aims to promote businesses (such as “shop”, “boutique”)
by using persuasive words (“famous”, “premium”), travelers are more focused on information
about specific businesses or facts. In general, comparison between the ontologies indicate that
although the supply-side does reflect certain aspects of users’ information needs, there is a
substantial number of query terms that are not captured by this ontology.
The results of this study offer important implications for developing search technologies
and strategies for online marketing in travel and tourism. These technologies can be seen as
decision aides in travel planning, providing the means by which online travelers can simplify the
decision-making process by identifying the destinations and tourism businesses that meet the
traveler’s specific needs or desires (Fesenmaier et al. 2006). For a culturally rich domain like
tourism, the key in developing such technologies lies in a better understanding of the nature of
the domain and, consequently, meaningful ways to organize and represent the domain.
23
Specifically, the knowledge gained through this study suggests that new design approaches
should be identified with the aim to bridge the gap between travelers’ information needs and the
rich domain of online tourism. As shown in the empirical analysis in this study, the majority of
search engines users use very short and general queries in order to locate more specific and
relevant information. As such, a search system for tourism should establish a dynamic, more
flexible modality of interaction to allow the online traveler to articulate his/her needs.
Particularly, system feedback not only needs to include search results that are highly relevant to a
specific query but also should provide suggestions to “inspire” the online traveler by expanding
his/her consideration set. Typical examples for such techniques include the recommendation
mechanisms in Amazon’s search functions based on collaborative filtering and Google’s
contextual advertising based on mining user queries and search history (Gretzel and Wöber
2004). Because of the hierarchical structure within the supply-side domain ontology,
vocabularies in the domain can thus be used in the form of keyword association, for example, to
elicit travelers’ information needs or preferences by providing transitions from the general (e.g.,
“chicago hotel”) to the specific (e.g., “chicago downtown hotel with lakeview”). In addition,
consideration should be given to the interface that incorporates useful design factors such as the
visualization of the semantic structure of the domain, narrative logic and metaphors in order to
facilitate and enhance the user-system interaction to support travel search (Gretzel and
Fesenmaier 2002; Xiang and Fesenmaier 2006).
Also, the online tourism domain is understood as the symbolic transformation of tourism
products and experiences in the online environment. That is, the meanings of the domain
represent the purposeful communications between the industry and their prospective customers
in order to engender a positive image of the destination. In particular, the supply-side domain
24
ontology not only is comprised of vocabularies that represent various industry facets, but also
contains the words that the industry uses to describe their products and services. However, as
shown in this study this language is not necessarily used by travelers searching for trip related
information. As such, the development of innovative search technologies should focus on
establishing functions that “understand” the meanings connoted in this representation and
building mapping mechanisms between the supply- and demand-side perspectives. For example,
an intelligent system should be able to differentiate a user query which asks for a “spotless” hotel
room from those for a “reasonably clean” room (Markoff 2006). Thus, understanding the
language used by the travelers as well as the one used by the industry and building an
appropriate bridge between these domain ontologies is necessary for successfully mapping user
queries with industry website contents.
While search engines can play an important role in linking the supply and demand
ontologies of the tourism domain, tourism marketers can contribute to the success of travelers'
queries by better understanding the language used by travelers and adjusting their website
contents accordingly. That is, the best example of persuasive communication takes place on those
websites that address the specific information needs of the traveler using the “language” of the
traveler. It is argued that this language provides the foundation with which the prospective
traveler interprets the informational products offered by the industry. To achieve this goal, further
research and development is needed in a number of areas. Gretzel (2006), for example, suggests
that tourism marketers can turn to many of the readily available consumer generated contents,
e.g., blogs and reviews, to learn about the language travelers use to describe travel products and
their experiences. In addition, tourism websites can be designed to incorporate tools (e.g.,
reviews, tagging, and digging) that enable travelers to directly interact with them so that more
25
knowledge about the way travelers communicate their perceptions and experiences can be
collected and learned. It seems that these consumer-driven communication channels provide new
and promising avenues for tourism marketers to understand and therefore, better interact with
prospective visitors. Thus, it is argued that “the language of tourism” as reflected by both the
industry and the traveler provides an essential foundation necessary to guide the development of
technologies to needed to support travel planning on the Internet. However, much research is
needed to examine the potential impact of emerging technologies, changing demographics and
the roles of consumer knowledge and perception on this language.
26
REFERENCES
Adomavicius, G., and A. Tuzhilin. (2005). "Toward the Next Generation of Recommender
Systems: A Survey of the State-of-the-Art and Possible Extensions." IEEE Transactions
on Knowledge and Data Engineering, 17 (6): 734-749.
Berners-Lee, T. (1999). "Weaving the Web". San Francisco, CA: Harper.
Bertolucci, J. (2007). "Search engine shoot-out." PC World, 25 (6): 86-96.
Borgatti, S., M. Everett, and L. Freeman. (1992). UCINET X: Network analysis software.
Analytic Technologies, Columbia, SC.
Brooks, T. A. (2007). "The nature of meaning in the age of Google" 2004 [cited June 2007].
Available from http://informationr.net/ir/9-3/paper180.html.
Burns, E. (2007). "U.S. search engine rankings and top 50 web rankings" 2007 [cited June
2007]. Available from http://searchenginewatch.com/showPage.html?page=3625081.
Campbell, A. E., and S. C. Shapiro. (1995). "Ontological mediation: an overview". Paper read at
The IJCAI Workshop on Basic Ontological Issues in Knowledge Sharing, at Menlo Park,
CA.
Carley, K. M. (1997). "Network text analysis: The network position of concepts". In Text
Analysis for the Social Sciences: Methods for Drawing Statistical Inferences From Texts
and Transcripts, edited by C. W. Roberts. Mahwah, NJ: LEA, 79-100.
Carroll, J., and J. Thomas. (1982). "Metaphors and the cognitive representation of computing
systems." IEEE Transactions on Systems Man and Cybernetics, 12 (2): 107-116.
Castells, M. (2001). "The Internet Galaxy: Reflections on the Internet, Business and Society".
Oxford: Oxford University Press.
Crawford, C. (2003). "The Art of Interactive Design: A Euphonious and Illuminating Guide to
Building Successful Software". San Francisco: No Starch Press.
Dann, G. M. S. (1997). "The Language of Tourism: A Sociolinguistic Perspective". Wallingford,
UK: CAB International.
Fesenmaier, D. R., K. Wöber, and H. Werthner. (2006). "Introduction: recommendation systems
in tourism". In Destination Recommendation Systems: Behavioral Foundations and
Applications, edited by D. R. Fesenmaier, K. Wöber and H. Werthner. Wallingford, UK:
CABI.
Gretzel, U., and D. R. Fesenmaier. (2002). "Building narrative logic into tourism information
systems." IEEE Intelligent Systems 17 (6): 59-61.
Gretzel, U., Y. H. Hwang, and D. R. Fesenmaier. (2006). "A behavioural framework for
destination recommendation systems design". In Destination Recommendation Systems:
Behavioural Foundations and Applications, edited by D. R. Fesenmaier, K. Wöber and H.
Werthner. Wallingford, UK: CABI, 53-64.
Gretzel, U., and K. Wöber. (2004). "Intelligent search support: building search term associations
for a tourism-specific search domain". Paper read at Eleventh International Conference
on Information and Communication Technology in Tourism (ENTER 2004), January 26-
28, at Cairo, Egypt.
Gretzel, U., Z. Xiang, K. Wöber, and D. R. Fesenmaier. (2008). "Deconstructing destination
perceptions, experiences, stories and Internet search: text analysis in tourism research". In
Tourism Management: Analysis, Behaviour and Strategy, edited by S. Wood and D.
Martin: CABI, 339-357.
27
Hevner, A. R., S. T. March, J. Park, and R. Sudha. (2004). "Design science in information
systems research." MIS Quarterly, 28 (1): 75-105.
Jansen, B. J., A. Brown, and M. Resnick. (2007). "Factors relating to the decision to click on a
sponsored link." Decision Support Systems, 44 (1): 46-59.
Jansen, B. J., and P. R. Molina. (2006). "The effectiveness of Web search engines for retrieving
relevant ecommerce links." Information Processing and Management, 42 (4): 1075-1098.
Jansen, B. J., and A. Spink. (2005). "An analysis of Web searching by European AlltheWeb.com
users." Information Processing and Management, 41 (2): 361-381.
————. (2005). "How are we searching the World Wide Web? A comparison of nine search
engine transaction logs." Information Processing and Management, 42 (1): 248-263.
Jansen, B. J., A. Spink, and J. Pedersen. (2005). "A temporal comparison of AltaVista Web
searching." Journal of the American Society for Information Science and Technology, 56
(6): 559-570.
Kim, H. (2002). "Predicting how ontologies for the Semantic Web will evolve." Communications
of the ACM, 45 (2): 48-54.
Krackhardt, D. (1987). "QAP partialling as a test spuriousness." Social Networks, 9: 171-186.
Krippendorff, K. (2004). "Content Analysis: An Introduction to Its Methodology". 2nd ed.
Thousand Oaks: SAGE.
Lau, M. P. (2003). "The design of domain specific search engines: a literature survey."
Marchionini, G. (1997). "Information Seeking in Electronic Environments". Cambridge, UK:
Cambridge University Press.
Markoff, J. (2006). "Entrepreneurs See a Web Guided by Common Sense". New York Times.
Norman, D. A. (1999). "Affordances, conventions and design." Interactions, 6 (3): 38-43.
Pan, B., and D. R. Fesenmaier. (2006). "Online information search: vacation planning process."
Annals of Tourism Research, 33 (3): 809-832.
Popping, R. (2000). "Computer-Assisted Text Analysis". London: SAGE.
Riedl, J., and J. Konstan. (2002). "Word of Mouse". New York: Warner Books.
Smith, S. L. J. (1988). "Defining tourism: a supply-side view." Annals of Tourism Research, 15
(2): 179-190.
Spink, A. (2002). "A user-centered approach to evaluating human interaction with Web search
engines: an exploratory study." Information Processing and Management, 38: 401-426.
Spink, A., B. J. Jansen, D. Wolfram, and T. Saracevic. (2002). "From e-sex to e-commerce: Web
search changes." IEEE Computer, 35 (3): 107-109.
Spink, A., M. Park, B. J. Jansen, and J. Pedersen. (2004). "Multitasking during Web search
sessions." Information Processing and Management, 42 (1): 264-275.
Vogt, C. A., and D. R. Fesenmaier. (1998). "Expanding the functional information search model."
Annals of Tourism Research, 25 (3): 551-578.
Wasserman, S., and K. Faust. (1994). "Social Network Analysis". Cambridge: Cambridge
University Press.
Werthner, H. (1996). "Design Principles of Tourism Information Systems". In Information and
Communication Technologies in Tourism, edited by S. Klein, B. Schmid, A. M. Tjoa and
H. Werthner. Vienna: Springer, 70-78.
Wöber, K. (2006). "Domain specific search engines". In Destination Recommendation Systems:
Behavioral Foundations and Applications, edited by D. R. Fesenmaier, K. Wöber and H.
Werthner. Wallingford, UK: CABI.
Woelfel, J. K. (1993). "Artificial neural networks in policy research." Journal of Communication,
28
43: 62-80.
Woodside, A. G., and C. Dubelaar. (2002). "A general theory of tourism consumption systems: A
conceptual framework and an empirical exploration." Journal of Travel Research, 41 (2):
120-132.
Xiang, Z., and D. R. Fesenmaier. (2006). "Interface metaphors on travel-related Websites". In
Destination Recommendation Systems: Behavioral Foundations and Applications, edited
by D. R. Fesenmaier, K. Wöber and H. Werthner. London: CAB International, 180-189.
Xiang, Z., S.-E. Kim, C. Hu, and D. R. Fesenmaier. (2007). "Language representation of
restaurants: implications for developing online recommendation systems." International
Journal of Hospitality Management, 26 (4): 1005-1018.
Xiang, Z., K. Wöber, and D. R. Fesenmaier. (forthcoming). "The representation of the tourism
domain in search engines." Journal of Travel Research.
Yu, C., and W. Meng. (2003). "Web search technology." In The Internet Encyclopedia., edited by
H. Bidgoli. Hoboken, NJ: John Wiley & Sons, Inc., 738-751.

29
Goal Research Design Data Collection Data Analysis
Phase I
To understand language
representation of the
tourism domain in search
engines from the supply
perspective.
- Create a travel information search
scenario, i.e., by mimicking
travelers’ use of keywords to
query a search engine to plan a trip
to a destination, to collect textual
corpuses that represent the domain
from the supply and demand sides.
- Critical considerations included:
Selection of keywords that are
most likely to be used by
travelers
Selection of search engines for
data collection
- Use a set of keywords, which
are most likely used by travelers
for planning a trip to a specific
destination, to query Google.
- Extract a sample of 50 links
from search results for each
query and then textual content
from Web pages by following
these links to obtain the supply
side corpus.
- Identify words in Web page
content (i.e., the supply side
corpus) that represent the
domain ontology.
- Semantic network analysis
based on centrality measures
established through word
association.
Phase II
To understand language
representation of the
tourism domain in search
engines from the demand
perspective.
- Extract actual user queries from
a set of search engine log files
using the same destination
name and keywords set to
obtain the demand side corpus.
- Follow the same data analysis
procedure as Phase I to identify
the domain ontology in user
queries (i.e., the demand side
corpus).
Phase III
To understand the
similarities and differences
in the language
representation of the
tourism domain between
the demand and supply
perspectives.
- Compare the demand side and
supply side ontologies based on
the previous two phases.
- Ratios of common and different
words between the two
ontologies.
- Quadratic Analytical Procedure
to measure semantic similarity
between the two ontologies
based on a set of common
words.
Figure 1 An Illustrative View of the Research Methods
30
0
1
2
3
4
5
6
7
8
9
10
Chicago: 12,565
City: 2,148
Feature: 388
Luxury: 138
BurgerKing: 54
WGN: 21
Yorkville: 8
Zenith: 3
Quiznos: 2
Tourism: 297
Figure 2 Distribution of Unique Words on Tourism Websites
X-Axis: Number of Unique Words;
Y-Axis: Frequency of Words after Logarithmic Transformation
31
0
1
2
3
4
5
6
7
8
9
Chicago: 2,609
Airport: 61
Hotel: 277
HardRock: 21
Show: 8
Wine: 3Dinner: 2
Imax: 1
Bulls: 7McCormick: 6
Kimpton: 1
Figure 3 Distribution of Unique Words in User Queries (Logarithmic Transformation)
X-Axis: Number of Unique Words;
Y-Axis: Frequency of Words after Logarithmic Transformation
32
Table 1 Top 25 Words with the Highest Betweenness Centrality in the Supply-Side
Ontology
Word Centrality Word Centrality
shop 19316.9 museum 57.7
music 5401.4 cost 1.6
experience 5298.4 activity 1.6
famous 5135.0 jazz 1.6
blues 5033.9 craft 1.6
theater 4745.3 antique 1.6
european 4745.3 animal 1.6
distance 4518.0 kids 1.6
boutique 4518.0 amphitheater 1.6
premium 340.4 airlines 1.6
contemporary 152.0 diner 1.6
building 57.7 apparel 1.6
art 57.7
Total N: 364
Mean: 164.3
Std Dev.: 1,238.4
Min: 0
Max: 19,316.0
Network Centrality Index: 29.2%
33
Table 2 Top 25 Words with the Highest Betweenness Centrality in the Demand-Side
Ontology
Word Centrality Word Centrality
chicago 351.2 il 38.4
area 351.2 search 32.0
chicagoland 177.7 school 29.4
suburb 173.3 metro 24.4
band 143.9 fabulous 18.9
art 140.2 list 9.7
downtown 116.7 program 8.6
store 107.8 county 6.3
grade 98.2 service 4.7
janes 98.0 tribune 4.5
mirage 91.2 hotel 3.9
fine 41.8
land 55.4
Mean: 12.5
Std Dev.: 46.9
Min: 0
Max: 351.2
Network Centrality Index: 2.2%
34
Table 3 Common Words Shared between the Domain Ontologies
chicago travel phone expo card directions
university concert review facility catering feature
hotel inn show family contact fresh
area convention association food designer friendly
restaurant boat bike french dining garden
art reservation blues luxury dinner indian
mall clothing bus parking fashion japanese
park tour exhibit play flight jazz
map jewelry movie report free kitchen
theater public performance steak game landmark
store shopping activity tourism grill local
museum shore address zoo group mexican
info attraction basketball auditorium health musical
airport club buy business hours observatory
weather festivals company cheap kids official
events package gift college lodging perfect
downtown ticket golf cost medicine planetarium
train outlet indoor forecast nature plaza
guide schedule location fun pool population
school spa nightlife gallery resort quarter
shop book seafood loop sushi resource
church discount visit natural unique retail
football merchandise apparel network urban romantic
district water baseball party vegetarian room
pizza history bed rate weekend shoes
bar holiday breakfast style ads special
sports old children traffic amusement temperature
building rental chinese wine bakery thingstodo
library sites cook admission books trip
city aquarium live adventure brunch tv
field conference plan africa calendar vacation
cafe fine price antique casino video
place market sightseeing arena deal village
program motel tourist broadway deli
service music cultural bureau diner
The words are displayed in vertical order ranging from high to low frequency in
user queries; bold words are common adjectives uses by industry and users
35
Table 4 Ratios of Common Words Shared between the Domain Ontologies
Number of Words Total Frequencies
Common
Words
All
Words Ratio
Common
Words
All
Words Ratio
Supply
Ontology 208 364 57.1% 65,678 82,928 79.2%
Demand
Ontology 208 1,204 17.3% 3,242 9,788 33.1%

36
Table 5 QAP Analysis of the Semantic Structures of Top 50 Common Words
in the Supply and demand Domain Ontologies
Value Significance Average
Standard
Deviation P(Large) P(Small)
Pearson Correlation: 0.184 0.239 0.003 0.302 0.084 0.675
Simple Matching: 0.000 1.000 0.000 0.000 1.000 1.000
Jaccard Coefficient: 1.000 1.000 1.000 0.020 1.000 1.000
Goodman-Kruskal Gamma: 0.000 0.000 0.000 0.000 0.000
Copyright © 2022 FDOKUMEN

