


Bahasa
Halaman
Hukum

frbiol$150
Freshwater Biology (1997) 37, 163–175
SPECIAL APPLIED ISSUES SECTION
Scales of observation of riparian forests anddistributions of suspended detritus in a prairie river
S H E R R I L . J O H N S O N * † A N D A L A N P. C O V I C H ‡*Department of Zoology, University of Oklahoma, Norman, OK 73019, U.S.A.‡Department of Fishery and Wildlife Biology, Colorado State University, Fort Collins, CO 80523, U.S.A.
†Current address: Department of Geosciences, Oregon State University, Corvallis, OR 97331, U.S.A.
S U M M A R Y
1. Detrital inputs from riparian forests can provide the main source of energy to aquaticconsumers in stream communities. However, the supply of coarse organic detritus tostream communities is difficult to predict. Patchy riparian inputs and connectivitybetween reaches have complicated studies and disrupted patterns of the distribution ofsuspended coarse particulate organic matter within streams and rivers.2. In this study we emphasize the importance of spatial and temporal scales indetermining potential distribution of instream leaf litter. Although large pulses ofdetritus are transported by streams during storm flows, the main supply of benthic leaflitter used by shredders and of suspended particulate organic matter used by filterfeeders is transported during prolonged periods of baseflow. The local, fine-scaledistribution of this organic matter is determined by the location and continuity of leaflitter sources (riparian vegetation) and specific features of channel roughness (such aswoody debris, roots and rocks).3. Viewing riparian vegetation at several scales results in variable conclusions regardingthe amount of potential source area of leaf detritus. The percentage of suspended wholeleaves at sites in the Little Washita River, Oklahoma, U.S.A. was best explained by thepercentage of riparian forest cover in 500 m and 1000 m reaches upstream of the sites, asviewed by remote sensing imagery. The amount of leaf fragments was best explained bydistance downstream along the longitudinal gradient. Ash-free dry mass of suspendedcoarse particulate matter did not correlate with any measures of riparian cover.4. Our results suggest that leaves originate over longer reach lengths than thosegenerally considered as source areas. Scale is an important consideration in studies ofriparian patterns and related instream processes because of the need to integrate pointdynamics as well as upstream influences.
Introduction
Detrital inputs serve multiple roles in aquatic (Hawkins, Murphy & Anderson, 1982; Feminella,Power & Resh, 1989), as well as fish and macroinvert-foodwebs and are an essential food for detritivorous
macroinvertebrates and fish. The presence of riparian ebrate functional feeding groups within the streamcommunity (Cummins & Klug, 1979; Vannote et al.,forests along the length of a river influences detrital
inputs (Swanson et al., 1982; Minshall et al., 1983; 1980; Behmer & Hawkins, 1986; Cummins et al., 1989;Gregory et al., 1991; Sweeney, 1993). In some forestedConners & Naiman, 1984) and primary production
© 1997 Blackwell Science Ltd 163
164 S.L. Johnson and A.P. Covich
catchments, up to 90% of the carbon used by stream explicitly state the scale of observation or extent ofreach considered (Culp & Davies, 1982; Hawkinsorganisms originates within riparian forests (Fisher &
Likens, 1973). et al., 1982; Wallace, Ross & Meyer, 1982; Ehrman& Lamberti, 1992; Hill, Gardener & Ekisola, 1992;The functions and influences of riparian forests as
sources of leaf litter have been hypothesized to change Bretschko & Moser, 1993). Descriptions of riparianforest cover are dependent upon the scale of observa-with distance downstream (river continuum concept;
Vannote et al., 1980). Narrow, headwater stream chan- tion (Platts et al., 1987; Allen & Hoekstra, 1992;Malanson, 1993) and must be linked at an appropriatenels are expected to have relatively continuous canopy
that contributes large amounts of leaf detritus. With scale to the process-based hypothesis under study(Muller, Decamps & Dobson, 1993). Hierarchy theoryincreasing stream size, leaf litter inputs from the
riparian forests decrease per unit area of stream. suggests that in any study, it is important to includeboth large-scale phenomena to understand the context,Downstream, a major source of food comes from
leaf detritus that has been fragmented by upstream and fine-scale dynamics to examine mechanisms(Allen & Hoekstra, 1992). Observations from a mis-physical and biotic processes. A change in food base,
from whole leaves in headwater reaches to smaller match of spatial scales can result in erroneous identi-fication of processes or relationships (Weins, 1989;detrital particles and algae in the downstream reaches,
leads to a change in community composition of aquatic Allen & Hoekstra, 1992).Coupled with changes in riparian forest covermacroinvertebrates and fishes as more filter feeders
and grazers dominate the foodweb (Vannote et al., (meso-scale phenomena) and organic inputs along thelength of river, a change in physical factors that limits1980; Minshall et al., 1983).
While the river continuum concept provides general the export of organic materials (fine-scale dynamics)often occurs (Minshall et al., 1983; Webster et al., 1994).predictions of changes in detrital resources along a
river at the scale of stream order, variability in patchi- Generally, as the size of stream increases, there is lessretention of coarse organic matter, possibly due to aness of riparian forests and locally heavy leaf inputs
can alter the predicted pattern of changes along the decrease of physical roughness features downstream(Minshall et al., 1983), an increase in water depth alongriver continuum and complicate tests of the theory
(Minshall et al., 1983, 1985; Wiley, Osborne & Larimore, the gradient (Webster et al., 1994), or an increase indischarge (Sedell et al., 1978; Snaddon, Stewart &1990). Consequently, our ability to evaluate the distri-
bution of coarse organic material has been limited by Davies, 1992).We examined the spatial variability of riparianassumed uniformity of upstream riparian sources. In
addition to natural variability of forests along rivers, forests using differing extents and resolutions ofreaches, and compared these observations with theanthropogenic impacts and land use practices over
the last 200 years have resulted in changes to more amounts and type of organic material collected intransport at multiple sites along the river continuum.than 80% of the riparian forests in the United States
and Europe (Swift, 1984; Decamps et al., 1988; Manci, We asked how the spatial scale of observation ofriparian forests influenced predictions of the availabil-1989; Naiman, Decamps & Pollock, 1993). The implica-
tions of disturbances to and removal of sources of ity of suspended coarse organic detritus. By comparingrelationships between extent of riparian forest coverdetrital inputs can have cascading impacts throughout
the foodweb (Darnell, 1964; Sedell & Froggatt, 1984; and observed suspended organic matter, we tested thehypothesis that riparian leaf inputs have only limitedSweeney, 1993) and increase our need to quantify the
relationship between instream distribution of detritus spatial effects on the distribution of suspended coarseorganic matter.and measurements of riparian forest cover.
Previous descriptions of the spatial distribution andcontinuity of riparian forests have often not been
Materials and methodsadequate to facilitate comparisons of the distributionof coarse particulate matter between sites, streams or Site descriptionregions (Minshall et al., 1983, 1992; Gurtz et al., 1988).Many studies estimate the relative amount of forest This study was conducted on the Little Washita
River in south-central Oklahoma (Fig. 1). The Littlecover above sampling locations but most do not
© 1997 Blackwell Science Ltd, Freshwater Biology, 37, 163–175
Scales of observation of riparian forests 165
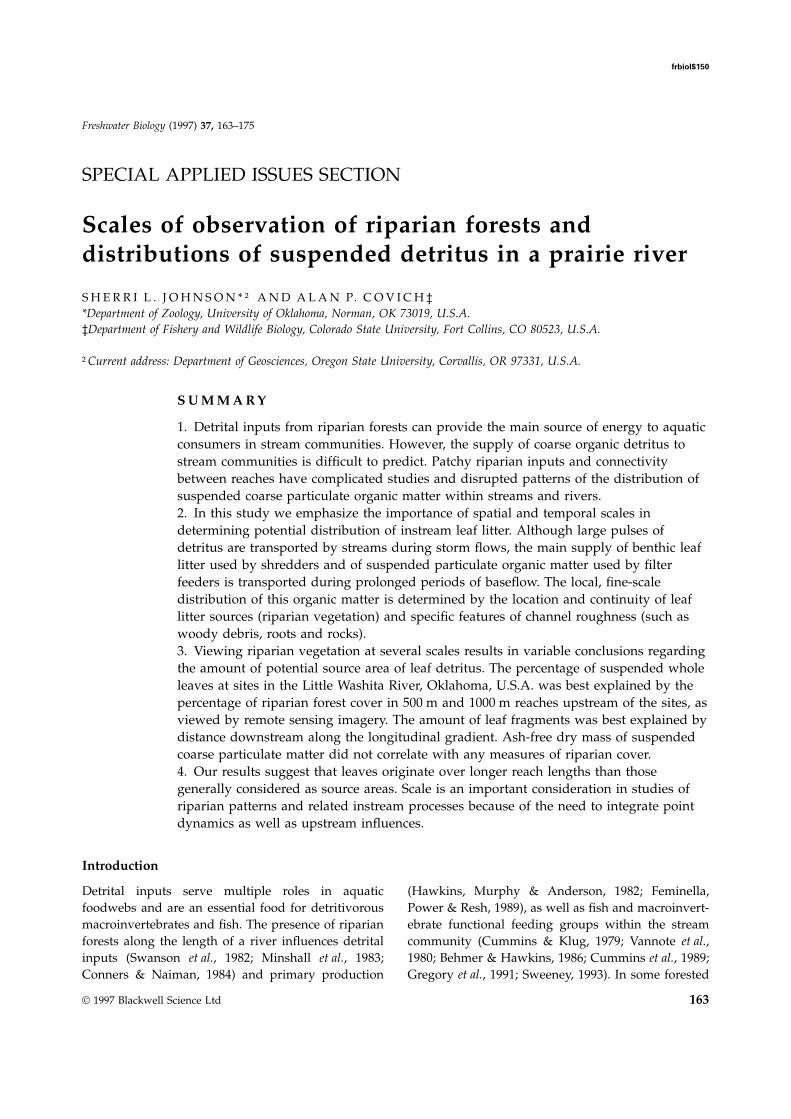
Fig. 1 (a) Map of the Little WashitaBasin in central Oklahoma, showingthe main channel of the river and thesix field sampling sites. Numbersbeside sites indicate the distance of thatsite downstream from the stream origin(km). (b) Example of methods ofobservation of riparian forest cover foreach site. Relative location of the cross-section and transects for observationsof on-site overhead riparian cover of50 m reach are shown as well aslengths of reaches of riparian forestcover extracted from SPOT imagery.
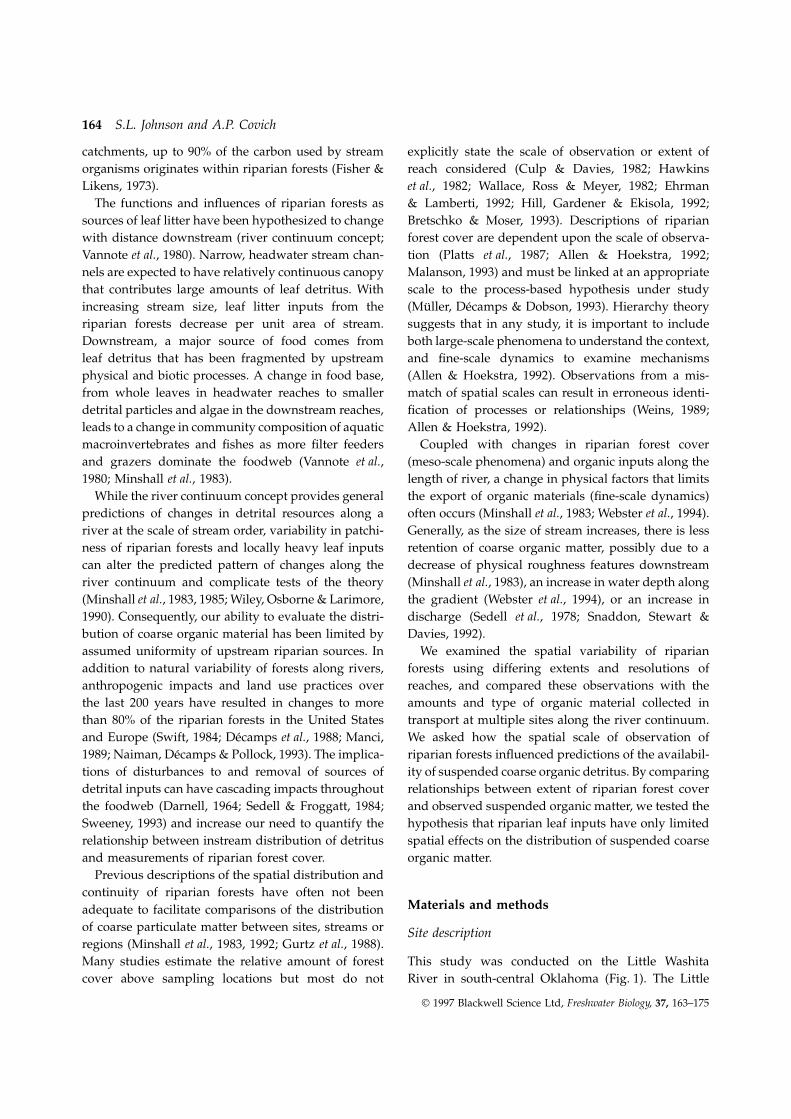
Washita River basin encompasses 64 000 ha and thelength of the river is 62 km. Average annual rainfallis 75 cm (Allen & Naney, 1991) with precipitationbeing evenly distributed throughout the year. AUSGS stream gauge is located at site 19 and thehydrograph for the study period is shown in Fig. 2.The river is deeply incised into alluvial soils; thechannel is 20 m below the surrounding rangelandat some locations. Substrata are primarily silt andfine sand.
Historically, the middle portion of the basin wascovered by dense post-oak and blackjack oak trees.Presently, land use is 63% rangeland, 24% agricultural
Fig. 2 Hydrograph of stream discharge at site 19 during theand 12% woodland (Salisbury, 1992). A diversesampling period. Sampling days are indicated during spring,riparian forest is present along many portions ofsummer and autumn.
the Little Washita River. The most abundant speciesare hackberry (Celtis occidentalis), bois d’arc (Maclurapomifera), elm (Ulmus americana) and juniper (Juniperus organic matter along the longitudinal gradient ofvirginiana). the Little Washita River (Fig. 1). These sites were
numbered by distance downstream (km) from theSix sites were selected for repeated sampling of
© 1997 Blackwell Science Ltd, Freshwater Biology, 37, 163–175
166 S.L. Johnson and A.P. Covich
Table 1 Physical features of the Little Washita River along a longitudinal gradient. Sites are numbered as distance downstreamfrom stream origin along main channel (km)
Site
2 8 16 19 28 40
Watershed area (km2) 10 61 127 160 239 347Stream order 2 3 3 4 4 5Slope (m km–1) 10.0 2.0 1.7 1.2 0.9 0.9Channel width (m) 2.5 5.1 6.7 7.3 9.7 8.1Cross-sectional area (m2) 0.32 1.39 1.95 2.13 2.60 3.43Avg. water depth (m) 0.13 0.28 0.29 0.29 0.27 0.42Water velocity (m s–1) 0.14 0.37 0.51 0.53 0.57 0.65Woody debris (pieces/100 m) 5 10 12 33 11 13
stream origin and represented common conditions canopy cover, using a hand-held sighting tube (James& Shugart, 1970), were made every 2 m along threealong the river. Sites were upstream from bridges to
minimize anthropogenically created gaps in riparian transects within the wetted channel parallel to thebanks (Fig. 1). Our method of quantifying percentageforests. Physical features at each site were inventoried
(Table 1). The numbers of pieces of woody debris cover is similar to that used with a spherical densi-ometer (Lemmon, 1956); however, the sighting tubeswith a diameter greater than 5 cm and a length
greater than 50 cm were mapped for 200 m reaches allowed us to estimate canopy cover for a smaller area(1.5 m 3 1.5 m) and without overlapping observations.upstream of each sampling site. Cross-sections of
the river at each site were surveyed (TOPCON These measurements are referred to throughout as‘on-site’ measures.level, model AG-4; Fig. 3a) and baseflow discharge
calculated. Watershed area above each site was Remote sensing imagery of the sites was analysedto examine larger extents of riparian reaches than werecalculated from a digital elevation model of the
Little Washita Basin and stream order identified practical from the field. Using Panchromatic SPOTimagery (10 m minimum resolution, 3 July 1992), wefrom 1 : 24 000 topographic maps.
Tributaries were not included in this analysis calculated the percentage of forest in three reachlengths upstream from each sampling site (Fig. 1).because they have been extensively modified in the
Little Washita Basin through the construction of First, the centre of the river was digitized from topo-graphic quadrangle maps (1 : 24 000, USGS, updatednumerous farm ponds and small reservoirs (USDA
Soil Conservation Service flood retention structures; 1991) printed on mylar to avoid distortions. Then, tofocus on the riparian forests within the basin, a 150-Allen & Naney, 1991). These ponds may delay
transport of sediment and organic matter so that m-wide corridor centred on the river was overlain onthe imagery, and the remaining terrestrial areas weredetrital inputs from tributaries to the main channel
are similar to those from a first-order stream, disregarded. The image of the corridor was reclassi-fied, using a supervised classification, into vegetationregardless of the size of the tributary (Ward &
Stanford, 1983). categories of forest or grass/other using multipleknown ‘training sites’. The accuracy of the reclassifica-tion was evaluated by comparing the vegetation type
Riparian coverin the imagery with the vegetation at points on aerialphotographs (1 : 7920, December, 1990). In the head-Two sources of data, ground-based observations and
remote sensing imagery, with different spatial reso- waters the vegetation classification was correct 90%of the time (18/20 points), and in downstream reacheslutions were used to examine the distribution of
riparian forests. The amount of overhead riparian points were correctly classified 95% of the time (19/20).The corridor image was divided into sections, withcover was measured in August 1992 for a reach
extending 50 m upstream of each of the surveyed the field sampling site as the most downstream pointof each section. The percentage forest within eachcross-sections. At each site, observations of percentage
© 1997 Blackwell Science Ltd, Freshwater Biology, 37, 163–175
Scales of observation of riparian forests 167
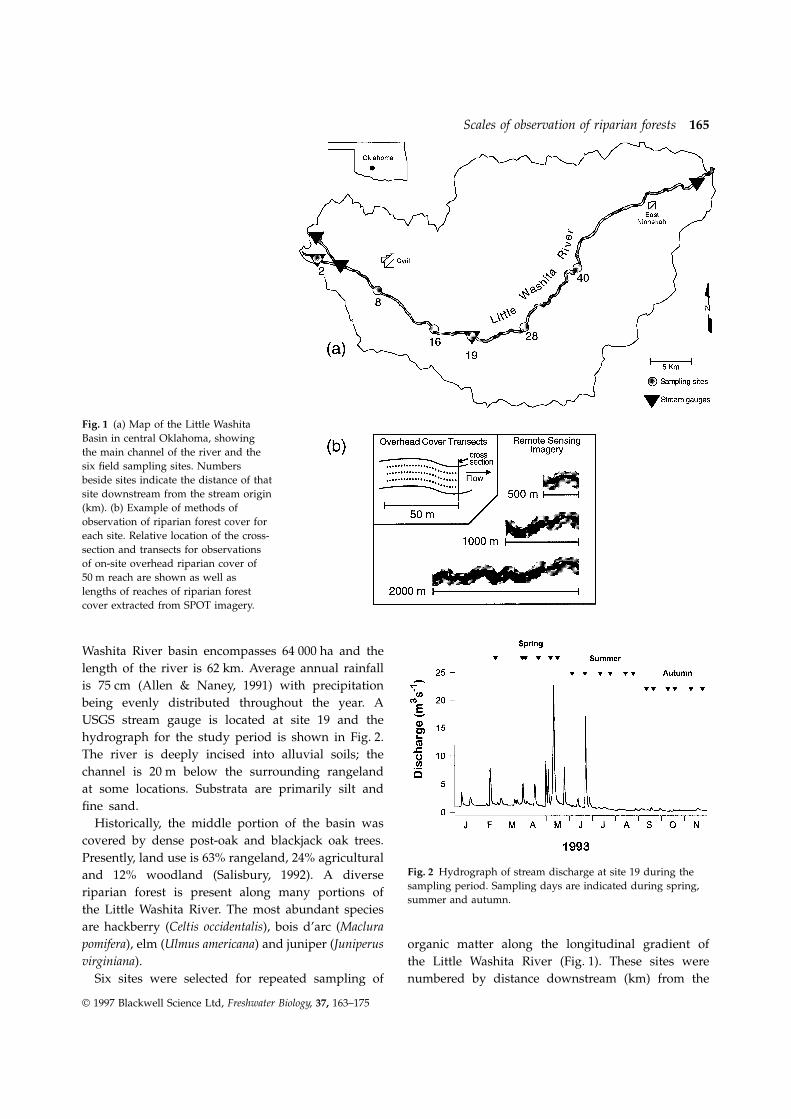
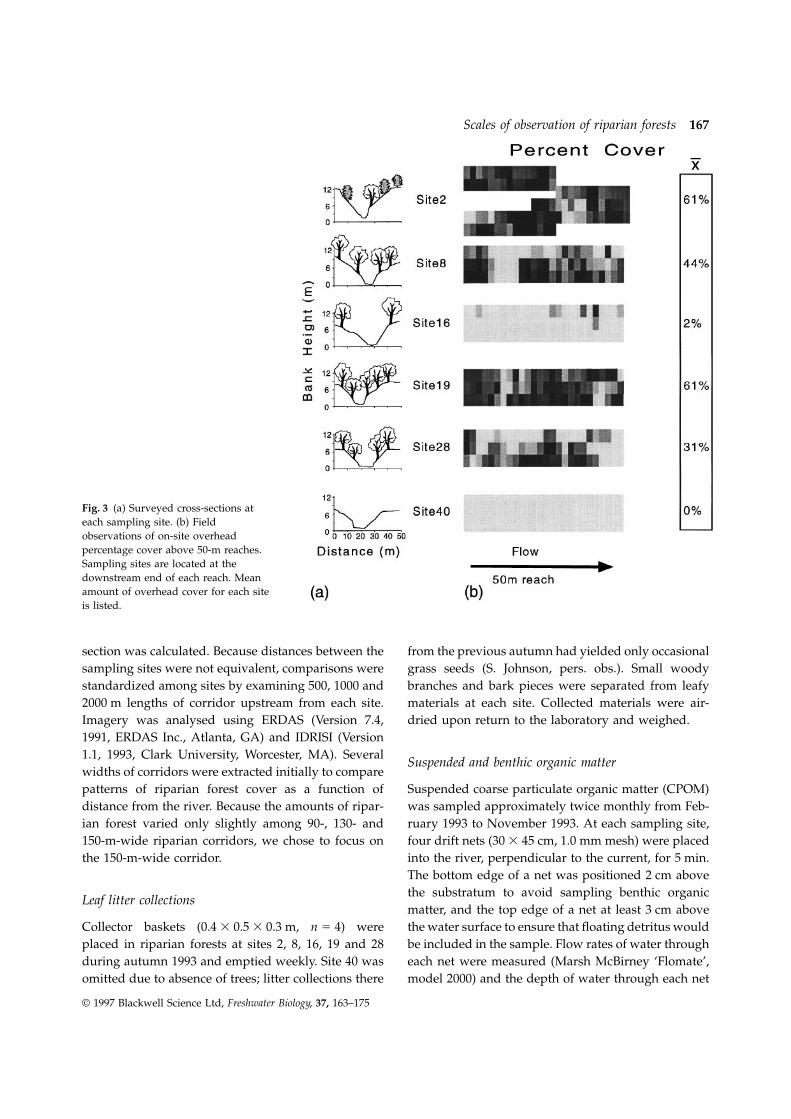
Fig. 3 (a) Surveyed cross-sections ateach sampling site. (b) Fieldobservations of on-site overheadpercentage cover above 50-m reaches.Sampling sites are located at thedownstream end of each reach. Meanamount of overhead cover for each siteis listed.
section was calculated. Because distances between the from the previous autumn had yielded only occasionalgrass seeds (S. Johnson, pers. obs.). Small woodysampling sites were not equivalent, comparisons were
standardized among sites by examining 500, 1000 and branches and bark pieces were separated from leafymaterials at each site. Collected materials were air-2000 m lengths of corridor upstream from each site.
Imagery was analysed using ERDAS (Version 7.4, dried upon return to the laboratory and weighed.1991, ERDAS Inc., Atlanta, GA) and IDRISI (Version1.1, 1993, Clark University, Worcester, MA). Several
Suspended and benthic organic matterwidths of corridors were extracted initially to comparepatterns of riparian forest cover as a function of Suspended coarse particulate organic matter (CPOM)
was sampled approximately twice monthly from Feb-distance from the river. Because the amounts of ripar-ian forest varied only slightly among 90-, 130- and ruary 1993 to November 1993. At each sampling site,
four drift nets (30 3 45 cm, 1.0 mm mesh) were placed150-m-wide riparian corridors, we chose to focus onthe 150-m-wide corridor. into the river, perpendicular to the current, for 5 min.
The bottom edge of a net was positioned 2 cm abovethe substratum to avoid sampling benthic organic
Leaf litter collectionsmatter, and the top edge of a net at least 3 cm abovethe water surface to ensure that floating detritus wouldCollector baskets (0.4 3 0.5 3 0.3 m, n 5 4) were
placed in riparian forests at sites 2, 8, 16, 19 and 28 be included in the sample. Flow rates of water througheach net were measured (Marsh McBirney ‘Flomate’,during autumn 1993 and emptied weekly. Site 40 was
omitted due to absence of trees; litter collections there model 2000) and the depth of water through each net
© 1997 Blackwell Science Ltd, Freshwater Biology, 37, 163–175
168 S.L. Johnson and A.P. Covich
was recorded. Samples were kept cool and processedupon return to the laboratory.
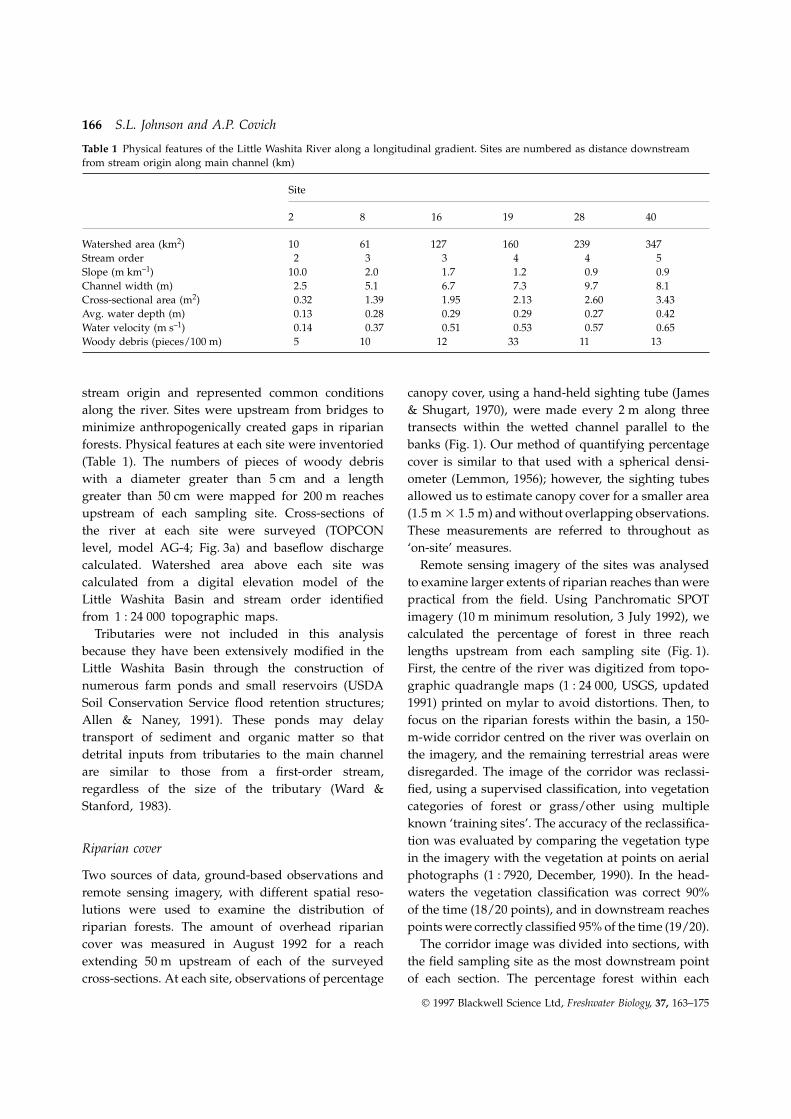
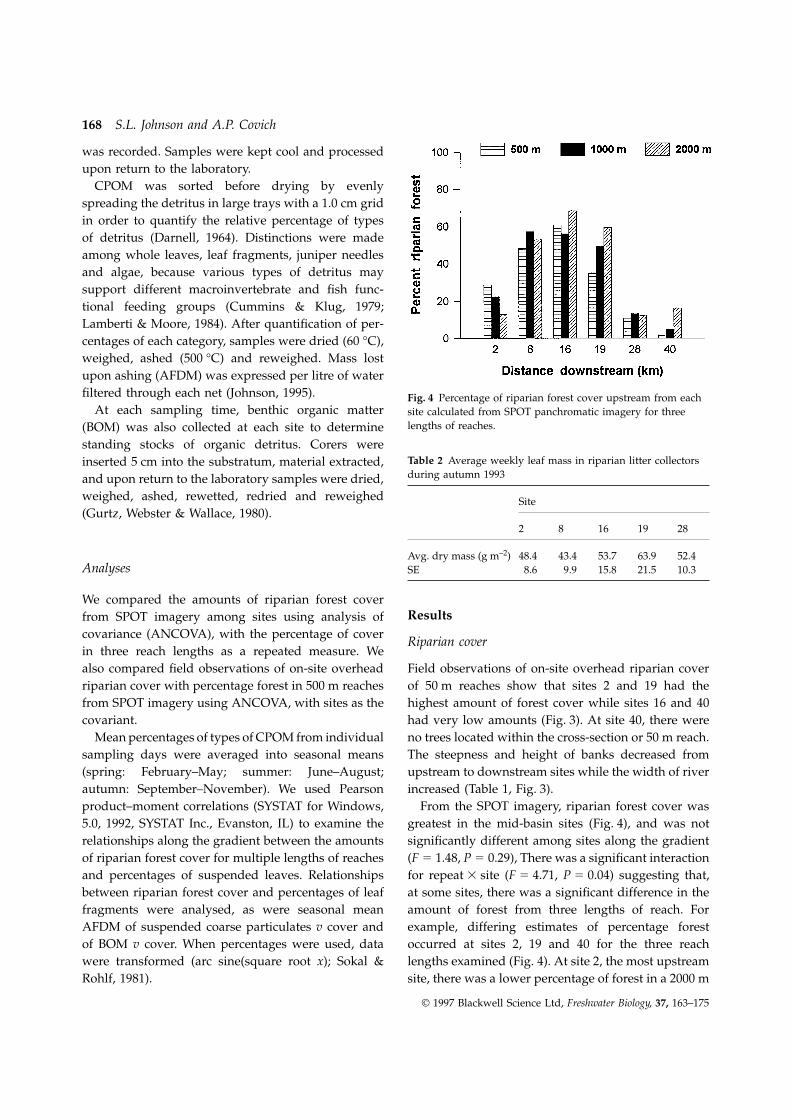
CPOM was sorted before drying by evenlyspreading the detritus in large trays with a 1.0 cm gridin order to quantify the relative percentage of typesof detritus (Darnell, 1964). Distinctions were madeamong whole leaves, leaf fragments, juniper needlesand algae, because various types of detritus maysupport different macroinvertebrate and fish func-tional feeding groups (Cummins & Klug, 1979;Lamberti & Moore, 1984). After quantification of per-centages of each category, samples were dried (60 °C),weighed, ashed (500 °C) and reweighed. Mass lostupon ashing (AFDM) was expressed per litre of waterfiltered through each net (Johnson, 1995). Fig. 4 Percentage of riparian forest cover upstream from each
At each sampling time, benthic organic matter site calculated from SPOT panchromatic imagery for threelengths of reaches.(BOM) was also collected at each site to determine
standing stocks of organic detritus. Corers wereTable 2 Average weekly leaf mass in riparian litter collectorsinserted 5 cm into the substratum, material extracted,during autumn 1993and upon return to the laboratory samples were dried,
weighed, ashed, rewetted, redried and reweighed Site(Gurtz, Webster & Wallace, 1980).
2 8 16 19 28
Avg. dry mass (g m–2) 48.4 43.4 53.7 63.9 52.4Analyses SE 8.6 9.9 15.8 21.5 10.3
We compared the amounts of riparian forest coverResultsfrom SPOT imagery among sites using analysis of
covariance (ANCOVA), with the percentage of coverRiparian cover
in three reach lengths as a repeated measure. Wealso compared field observations of on-site overhead Field observations of on-site overhead riparian cover
of 50 m reaches show that sites 2 and 19 had theriparian cover with percentage forest in 500 m reachesfrom SPOT imagery using ANCOVA, with sites as the highest amount of forest cover while sites 16 and 40
had very low amounts (Fig. 3). At site 40, there werecovariant.Mean percentages of types of CPOM from individual no trees located within the cross-section or 50 m reach.
The steepness and height of banks decreased fromsampling days were averaged into seasonal means(spring: February–May; summer: June–August; upstream to downstream sites while the width of river
increased (Table 1, Fig. 3).autumn: September–November). We used Pearsonproduct–moment correlations (SYSTAT for Windows, From the SPOT imagery, riparian forest cover was
greatest in the mid-basin sites (Fig. 4), and was not5.0, 1992, SYSTAT Inc., Evanston, IL) to examine therelationships along the gradient between the amounts significantly different among sites along the gradient
(F 5 1.48, P 5 0.29), There was a significant interactionof riparian forest cover for multiple lengths of reachesand percentages of suspended leaves. Relationships for repeat 3 site (F 5 4.71, P 5 0.04) suggesting that,
at some sites, there was a significant difference in thebetween riparian forest cover and percentages of leaffragments were analysed, as were seasonal mean amount of forest from three lengths of reach. For
example, differing estimates of percentage forestAFDM of suspended coarse particulates v cover andof BOM v cover. When percentages were used, data occurred at sites 2, 19 and 40 for the three reach
lengths examined (Fig. 4). At site 2, the most upstreamwere transformed (arc sine(square root x); Sokal &Rohlf, 1981). site, there was a lower percentage of forest in a 2000 m
© 1997 Blackwell Science Ltd, Freshwater Biology, 37, 163–175

Scales of observation of riparian forests 169
both summer and autumn were positively correlatedwith the large-scale parameter of distance down-stream (Table 3).
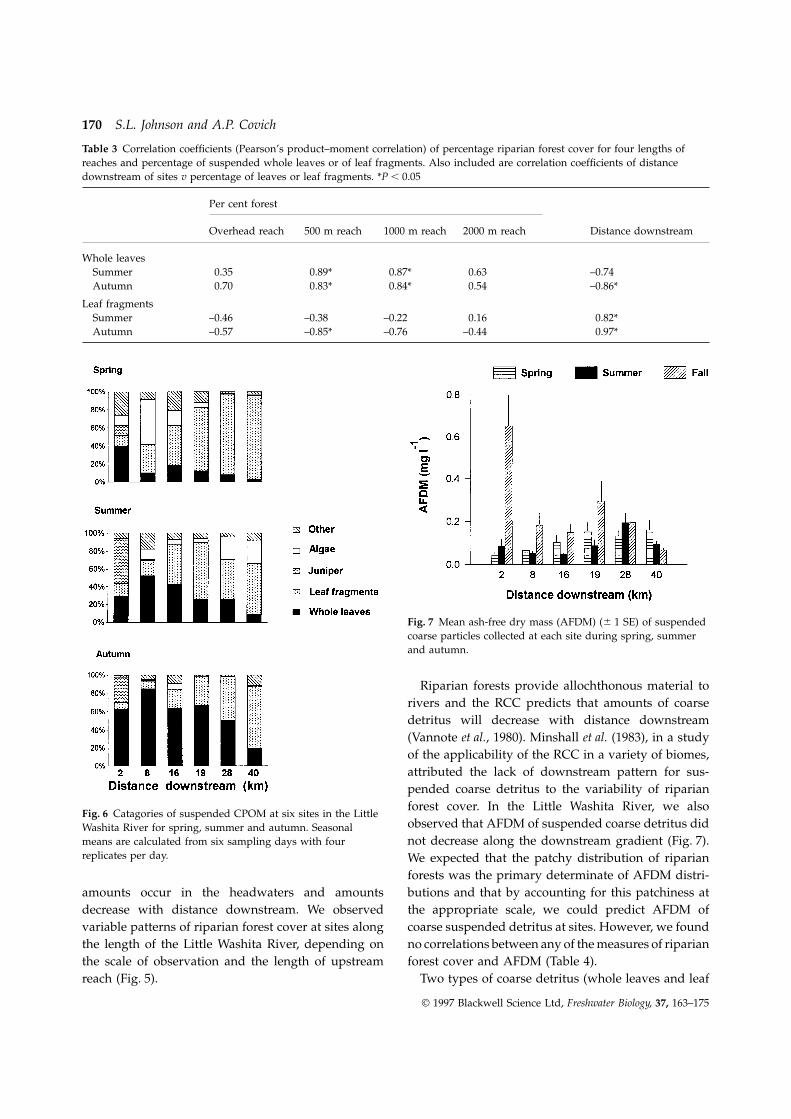
The greatest percentage of leaves occurred at site 8in summer and in autumn (Fig. 6). Spring sampleshad very low percentages of leaves at most sites andleaves were a larger percentage of autumn samplesthan of summer samples at all sites. Juniper needlesand berries were abundant at the headwater site, site2 and occasionally present at site 8, but not at any ofthe downstream sites. Filaments of algae were mostabundant in transport during spring and much lessabundant in autumn. During summer, algal filamentswere a small percentage of the total CPOM at upstreamsites and a greater percentage at downstream sites, 28and 40.
Fig. 5 Comparison of per cent riparian forest cover from on-site overhead observations for 50-m reaches and from SPOT
Ash-free dry masspanchromatic imagery for 500-m reaches at each site.
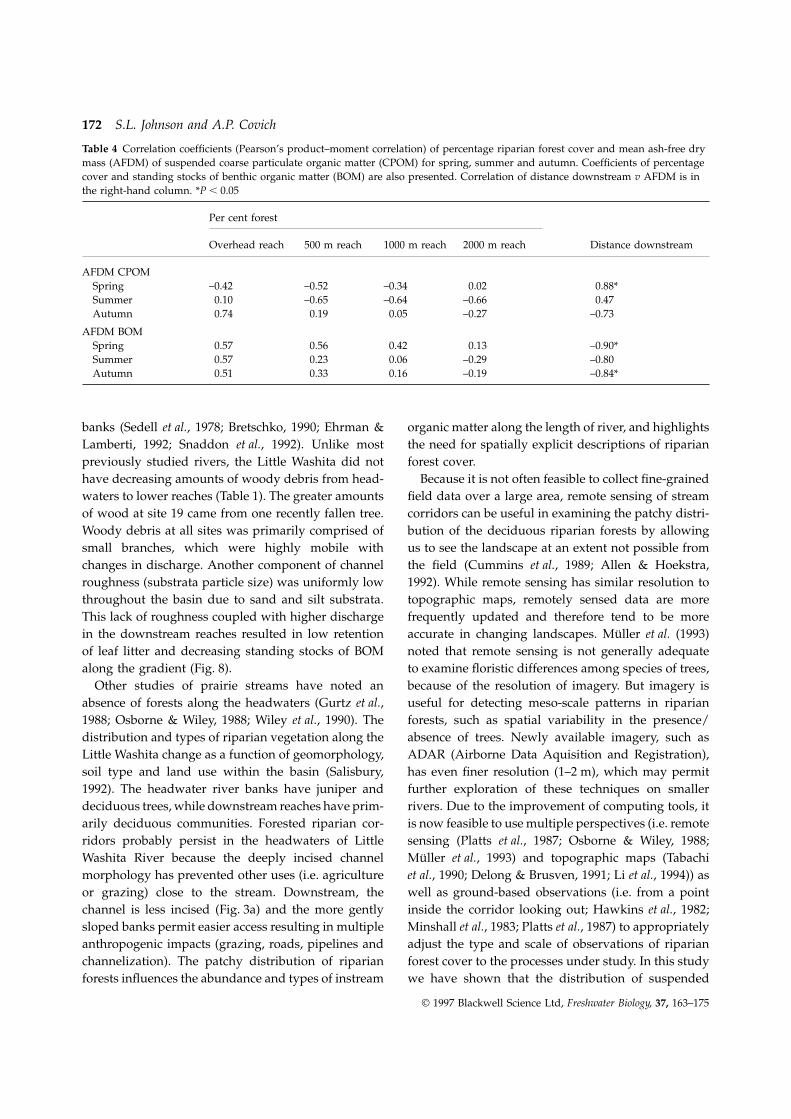
Seasonal mean AFDM of suspended coarse particleswas not significantly correlated with measures of on-reach than in the shorter reaches. Downstream, sites
19 and 40 had greater percentage of forest in the site overhead riparian cover or with percentage forestfrom SPOT remote sensing imagery of longer reaches2000 m reach than for other reach lengths.
Values of percentage cover at a site were not signi- (Table 4). The highest AFDM of suspended coarseparticles at sites (except site 40) occurred duringficantly different between on-site overhead riparian
cover and SPOT imagery of riparian forest cover for autumn (Fig. 7), with the greatest mass at the head-water site, site 2, and the second largest mass at site500 m reaches (F 5 0.01, P 5 0.94); however, the two
types of observations resulted in different patterns 19 (17 km downstream). Spring was the only seasonduring which AFDM was significantly correlated with(Figs 3 and 4) and were uncorrelated (Fig. 5).the distance of the sites downstream. At several sitesthere were only slight differences in AFDM among
Leaf litter collectionsseasons (Fig. 7).
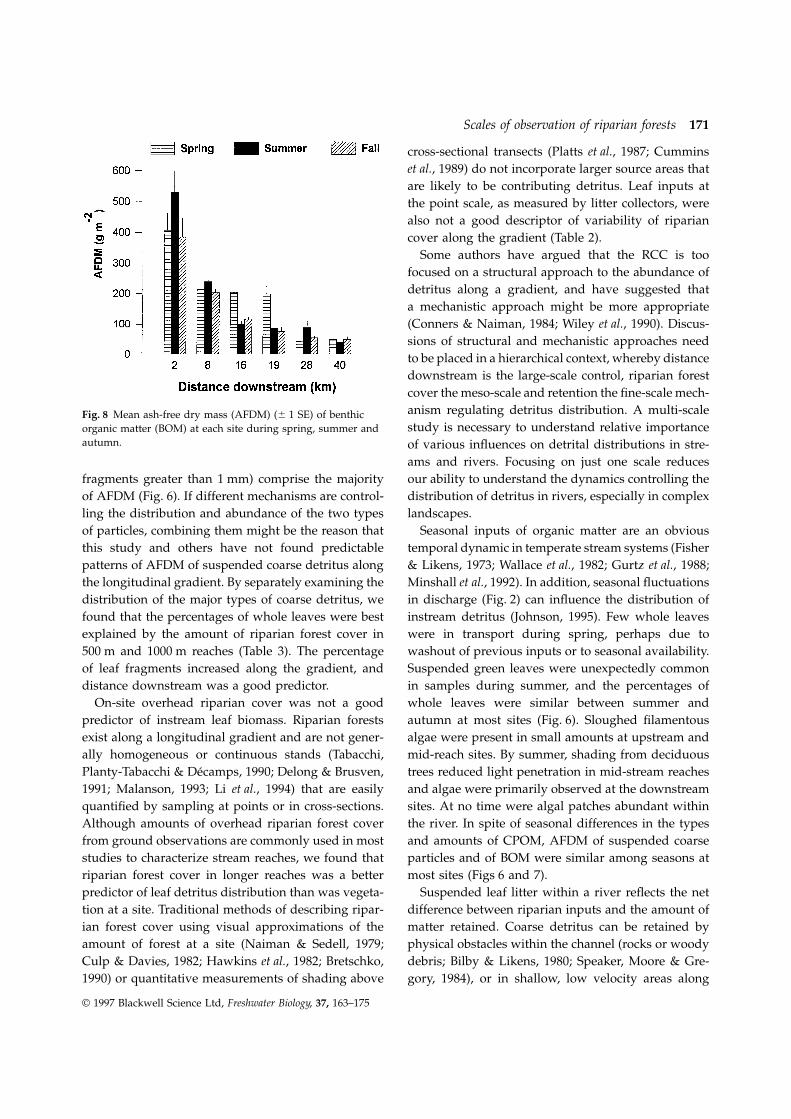
BOM was highest at the headwater site and gener-Average weekly leaf mass in riparian litter collectorsduring autumn ranged from 43 to 64 g m–2 (Table 2). ally decreased at downstream sites (Fig. 8). There were
significant negative correlations between distanceSite 19 had the highest average, while site 8 hadthe lowest. downstream and BOM in spring and autumn (Table 4),
but no relationship between any measures of riparianforest cover and BOM.
Suspended CPOM
On-site overhead riparian cover was not a good pre-Discussion
dictor of percentages of suspended leaves or leaffragments in summer or autumn (Table 3). The percent- In the Little Washita basin, neither the amount of
riparian forest cover observed through remote sensingages of leaves in summer and in autumn were bestexplained by the meso-scale parameters such as per- imagery (Fig. 4), nor observations of on-site overhead
riparian cover (Fig. 3b) corresponded to patterns ofcentage of riparian forest cover for 500 m and 1000 mreach lengths from SPOT imagery. The percentages of riparian forest distribution along the gradient of
unperturbed lotic systems proposed in the river con-suspended whole leaves at sites generally decreasedwith distance downstream while leaf fragments tinuum concept (RCC; Vannote et al., 1980). A common
perception of riparian forest cover is that the greatestincreased (Fig. 6). Percentages of leaf fragments in
© 1997 Blackwell Science Ltd, Freshwater Biology, 37, 163–175
170 S.L. Johnson and A.P. Covich
Table 3 Correlation coefficients (Pearson’s product–moment correlation) of percentage riparian forest cover for four lengths ofreaches and percentage of suspended whole leaves or of leaf fragments. Also included are correlation coefficients of distancedownstream of sites v percentage of leaves or leaf fragments. *P , 0.05
Per cent forest
Overhead reach 500 m reach 1000 m reach 2000 m reach Distance downstream
Whole leavesSummer 0.35 0.89* 0.87* 0.63 –0.74Autumn 0.70 0.83* 0.84* 0.54 –0.86*
Leaf fragmentsSummer –0.46 –0.38 –0.22 0.16 0.82*Autumn –0.57 –0.85* –0.76 –0.44 0.97*
Fig. 7 Mean ash-free dry mass (AFDM) (6 1 SE) of suspendedcoarse particles collected at each site during spring, summerand autumn.
Riparian forests provide allochthonous material torivers and the RCC predicts that amounts of coarsedetritus will decrease with distance downstream(Vannote et al., 1980). Minshall et al. (1983), in a studyof the applicability of the RCC in a variety of biomes,attributed the lack of downstream pattern for sus-pended coarse detritus to the variability of riparianforest cover. In the Little Washita River, we also
Fig. 6 Catagories of suspended CPOM at six sites in the Littleobserved that AFDM of suspended coarse detritus didWashita River for spring, summer and autumn. Seasonalnot decrease along the downstream gradient (Fig. 7).means are calculated from six sampling days with four
replicates per day. We expected that the patchy distribution of riparianforests was the primary determinate of AFDM distri-butions and that by accounting for this patchiness atamounts occur in the headwaters and amounts
decrease with distance downstream. We observed the appropriate scale, we could predict AFDM ofcoarse suspended detritus at sites. However, we foundvariable patterns of riparian forest cover at sites along
the length of the Little Washita River, depending on no correlations between any of the measures of riparianforest cover and AFDM (Table 4).the scale of observation and the length of upstream
reach (Fig. 5). Two types of coarse detritus (whole leaves and leaf
© 1997 Blackwell Science Ltd, Freshwater Biology, 37, 163–175
Scales of observation of riparian forests 171
cross-sectional transects (Platts et al., 1987; Cumminset al., 1989) do not incorporate larger source areas thatare likely to be contributing detritus. Leaf inputs atthe point scale, as measured by litter collectors, werealso not a good descriptor of variability of ripariancover along the gradient (Table 2).
Some authors have argued that the RCC is toofocused on a structural approach to the abundance ofdetritus along a gradient, and have suggested thata mechanistic approach might be more appropriate(Conners & Naiman, 1984; Wiley et al., 1990). Discus-sions of structural and mechanistic approaches needto be placed in a hierarchical context, whereby distancedownstream is the large-scale control, riparian forestcover the meso-scale and retention the fine-scale mech-anism regulating detritus distribution. A multi-scaleFig. 8 Mean ash-free dry mass (AFDM) (6 1 SE) of benthicstudy is necessary to understand relative importanceorganic matter (BOM) at each site during spring, summer and
autumn. of various influences on detrital distributions in stre-ams and rivers. Focusing on just one scale reducesour ability to understand the dynamics controlling thefragments greater than 1 mm) comprise the majority
of AFDM (Fig. 6). If different mechanisms are control- distribution of detritus in rivers, especially in complexlandscapes.ling the distribution and abundance of the two types
of particles, combining them might be the reason that Seasonal inputs of organic matter are an obvioustemporal dynamic in temperate stream systems (Fisherthis study and others have not found predictable
patterns of AFDM of suspended coarse detritus along & Likens, 1973; Wallace et al., 1982; Gurtz et al., 1988;Minshall et al., 1992). In addition, seasonal fluctuationsthe longitudinal gradient. By separately examining the
distribution of the major types of coarse detritus, we in discharge (Fig. 2) can influence the distribution ofinstream detritus (Johnson, 1995). Few whole leavesfound that the percentages of whole leaves were best
explained by the amount of riparian forest cover in were in transport during spring, perhaps due towashout of previous inputs or to seasonal availability.500 m and 1000 m reaches (Table 3). The percentage
of leaf fragments increased along the gradient, and Suspended green leaves were unexpectedly commonin samples during summer, and the percentages ofdistance downstream was a good predictor.
On-site overhead riparian cover was not a good whole leaves were similar between summer andautumn at most sites (Fig. 6). Sloughed filamentouspredictor of instream leaf biomass. Riparian forests
exist along a longitudinal gradient and are not gener- algae were present in small amounts at upstream andmid-reach sites. By summer, shading from deciduousally homogeneous or continuous stands (Tabacchi,
Planty-Tabacchi & Decamps, 1990; Delong & Brusven, trees reduced light penetration in mid-stream reachesand algae were primarily observed at the downstream1991; Malanson, 1993; Li et al., 1994) that are easily
quantified by sampling at points or in cross-sections. sites. At no time were algal patches abundant withinthe river. In spite of seasonal differences in the typesAlthough amounts of overhead riparian forest cover
from ground observations are commonly used in most and amounts of CPOM, AFDM of suspended coarseparticles and of BOM were similar among seasons atstudies to characterize stream reaches, we found that
riparian forest cover in longer reaches was a better most sites (Figs 6 and 7).Suspended leaf litter within a river reflects the netpredictor of leaf detritus distribution than was vegeta-
tion at a site. Traditional methods of describing ripar- difference between riparian inputs and the amount ofmatter retained. Coarse detritus can be retained byian forest cover using visual approximations of the
amount of forest at a site (Naiman & Sedell, 1979; physical obstacles within the channel (rocks or woodydebris; Bilby & Likens, 1980; Speaker, Moore & Gre-Culp & Davies, 1982; Hawkins et al., 1982; Bretschko,
1990) or quantitative measurements of shading above gory, 1984), or in shallow, low velocity areas along
© 1997 Blackwell Science Ltd, Freshwater Biology, 37, 163–175
172 S.L. Johnson and A.P. Covich
Table 4 Correlation coefficients (Pearson’s product–moment correlation) of percentage riparian forest cover and mean ash-free drymass (AFDM) of suspended coarse particulate organic matter (CPOM) for spring, summer and autumn. Coefficients of percentagecover and standing stocks of benthic organic matter (BOM) are also presented. Correlation of distance downstream v AFDM is inthe right-hand column. *P , 0.05
Per cent forest
Overhead reach 500 m reach 1000 m reach 2000 m reach Distance downstream
AFDM CPOMSpring –0.42 –0.52 –0.34 0.02 0.88*Summer 0.10 –0.65 –0.64 –0.66 0.47Autumn 0.74 0.19 0.05 –0.27 –0.73
AFDM BOMSpring 0.57 0.56 0.42 0.13 –0.90*Summer 0.57 0.23 0.06 –0.29 –0.80Autumn 0.51 0.33 0.16 –0.19 –0.84*
banks (Sedell et al., 1978; Bretschko, 1990; Ehrman & organic matter along the length of river, and highlightsthe need for spatially explicit descriptions of riparianLamberti, 1992; Snaddon et al., 1992). Unlike most
previously studied rivers, the Little Washita did not forest cover.Because it is not often feasible to collect fine-grainedhave decreasing amounts of woody debris from head-
waters to lower reaches (Table 1). The greater amounts field data over a large area, remote sensing of streamcorridors can be useful in examining the patchy distri-of wood at site 19 came from one recently fallen tree.
Woody debris at all sites was primarily comprised of bution of the deciduous riparian forests by allowingus to see the landscape at an extent not possible fromsmall branches, which were highly mobile with
changes in discharge. Another component of channel the field (Cummins et al., 1989; Allen & Hoekstra,1992). While remote sensing has similar resolution toroughness (substrata particle size) was uniformly low
throughout the basin due to sand and silt substrata. topographic maps, remotely sensed data are morefrequently updated and therefore tend to be moreThis lack of roughness coupled with higher discharge
in the downstream reaches resulted in low retention accurate in changing landscapes. Muller et al. (1993)noted that remote sensing is not generally adequateof leaf litter and decreasing standing stocks of BOM
along the gradient (Fig. 8). to examine floristic differences among species of trees,because of the resolution of imagery. But imagery isOther studies of prairie streams have noted an
absence of forests along the headwaters (Gurtz et al., useful for detecting meso-scale patterns in riparianforests, such as spatial variability in the presence/1988; Osborne & Wiley, 1988; Wiley et al., 1990). The
distribution and types of riparian vegetation along the absence of trees. Newly available imagery, such asADAR (Airborne Data Aquisition and Registration),Little Washita change as a function of geomorphology,
soil type and land use within the basin (Salisbury, has even finer resolution (1–2 m), which may permitfurther exploration of these techniques on smaller1992). The headwater river banks have juniper and
deciduous trees, while downstream reaches have prim- rivers. Due to the improvement of computing tools, itis now feasible to use multiple perspectives (i.e. remotearily deciduous communities. Forested riparian cor-
ridors probably persist in the headwaters of Little sensing (Platts et al., 1987; Osborne & Wiley, 1988;Muller et al., 1993) and topographic maps (TabachiWashita River because the deeply incised channel
morphology has prevented other uses (i.e. agriculture et al., 1990; Delong & Brusven, 1991; Li et al., 1994)) aswell as ground-based observations (i.e. from a pointor grazing) close to the stream. Downstream, the
channel is less incised (Fig. 3a) and the more gently inside the corridor looking out; Hawkins et al., 1982;Minshall et al., 1983; Platts et al., 1987) to appropriatelysloped banks permit easier access resulting in multiple
anthropogenic impacts (grazing, roads, pipelines and adjust the type and scale of observations of riparianforest cover to the processes under study. In this studychannelization). The patchy distribution of riparian
forests influences the abundance and types of instream we have shown that the distribution of suspended
© 1997 Blackwell Science Ltd, Freshwater Biology, 37, 163–175
Scales of observation of riparian forests 173
Allen T.F.H. & Hoekstra T.W. (1992) Toward a Unifiedleaf litter, in an unretentive prairie river, is best estim-Ecology. Columbia University Press, New York.ated from meso-scale measures of riparian forest cover,
Behmer D.J. & Hawkins C.P. (1986) Effects of overheadand that leaf fragments are best estimated by large-canopy on macroinvertebrate production in a Utahscale measures of distance downstream. Viewing ripar-stream. Freshwater Biology, 16, 287–300.ian forest cover at several scales results in different
Bilby R.E. & Likens G.E. (1980) Importance of organicestimates or conclusions regarding the amount ofdebris dams in the structure and function of streamforest cover that serves as sources for suspendedecosystems. Ecology, 61, 1107–1113.
coarse organic matter.Bretschko G. (1990) The dynamic aspect of coarse
As ecological studies expand in spatial extent, from particulate organic matter (CPOM) on the sedimentsites to watersheds and to intersite comparisons, it surface of a second order stream free of debris damsbecomes critical to be able to evaluate the potential (RITRODAT-LUNZ study area). Hydrobiologia, 203,for organic inputs along the lengths of river corridors 15–28.in a wide range of landscapes. Rivers will not be Bretschko G. & Moser H. (1993) Transport and retention ofuniformly affected by patchy distribution of riparian matter in riparian ecotones. Hydrobiologia, 251, 95–101.forests due to the differences among stream ecosystems Conners M.E. & Naiman R.J. (1984) Particulate
allochthonous inputs: relationships with stream size in(Minshall et al., 1985; Fisher & Grimm, 1991; Gregoryan undisturbed watershed. Canadian Journal of Fisherieset al., 1991; Sweeney, 1993). To interpret the factorsand Aquatic Sciences, 41, 1473–1484.that control the potential abundance of detritus at
Culp J.M. & Davies R.W. (1982) Analysis of longitudinaleven a single study site, knowledge of upstreamzonation and the river continuum concept in theinputs and of fine-scale factors influencing retention isOldman–South Saskatchewan River system. Canadianessential. Examinations of the distribution of instreamJournal of Fisheries and Aquatic Sciences, 39, 1258–1266.detritus and possible effects of the patchy distribution
Cummins K.W. & Klug M.J. (1979) Feeding ecology ofof the riparian forests should be hierarchicallystream invertebrates. Annual Review of Ecology and
addressed using analysis of an ecologically appro-Systematics, 10, 147–172.
priate extent for the description of riparian forestsCummins K.W., Wilzbach M.A., Gates D.M., Perry J.B. &
embedded within a landscape context. Taliaferro W.B. (1989) Shredders and riparianvegetation. BioScience, 39, 24–30.
Darnell R.M. (1964) Organic detritus in relation toAcknowledgments secondary production in aquatic communities.
Verhandlungen der Internationalen Vereinigung furFunding for this work was provided by the National
Theoretische und Angewandte Limnologie, 15, 462–470.Science Foundation EPSCoR Program grant OSR- Decamps H., Fortune M., Gazelle F. & Pautou G. (1988)9108771 and the Oklahoma State Regents for Higher Historical influence of man on the riparian dynamicsEducation. S.L.J. was supported by a Centennial of a fluvial landscape. Landscape Ecology, 1, 163–173.Research Fellowship from the Department of Zoology, Delong M.D. & Brusven M.A. (1991) Classification andUniversity of Oklahoma. We thank C. Vaughn, J. Jones, spatial mapping of riparian habitat with applicationsL. Johnson, D. Allan and two anonymous referees for toward the management of streams impacted bycomments on this manuscript. R. Tucker and nonpoint source pollution. Environmental Management,
15, 565–571.T. Nguyen were valuable assistants during field andEhrman T.P. & Lamberti G.A. (1992) Hydraulic andlaboratory work. C. McCallister drafted Fig. 1. This
particulate matter retention in a 3rd-order Indianaresearch is part of a dissertation submitted by S.L.J.stream. Journal of the North American Benthologicalto the University of Oklahoma.Society, 11, 341–350.
Feminella J.W., Power M.E. & Resh V.H. (1989) Periphytonresponses to invertebrate grazing and riparian canopyReferencesin three northern California coastal streams. FreshwaterBiology, 22, 445–457.Allen P.B. & Naney J.W. (1991) Hydrology of the Little
Fisher S.G. & Grimm N.B. (1991) Streams and disturbance:Washita River Watershed, Oklahoma: Data and Analyses.are cross-ecosystems comparisons useful? ComparativeU.S. Department of Agriculture, Agriculture Research
Service, ARS-90. Analyses of Ecosystems: Patterns, Mechanisms, and Theories
© 1997 Blackwell Science Ltd, Freshwater Biology, 37, 163–175
174 S.L. Johnson and A.P. Covich
(eds J. Cole, G. Lovett and S. Findlay), pp. 196–221. Interbiome comparison of stream ecosystem dynamics.Ecological Monographs, 53, 1–25.Springler-Verlag, New York.
Minshall G.W., Cummins K.W., Peteren R.C., CushingFisher S.G. & Likens G.E. (1973) Energy flow in BearC.E., Bruns D.A., Sedell J.R. & Vannote R.L. (1985)Brook, New Hampshire: an integrative approach toDevelopments in stream ecosystem theory. Canadianstream ecosystem metabolism. Ecological Monographs,Journal of Fisheries and Aquatic Sciences, 42, 1045–1055.43, 421–439.
Minshall G.W., Petersen R.C., Bott T.L., Cushing C.E.,Gregory S.V., Swanson F.J., McKee W.A. & CumminsCummins K.W., Vannote R.L. & Sedell J.R. (1992)K.W. (1991) An ecosystem perspective of riparian zones.Stream ecosystem dynamics of the Salmon River, Idaho:BioScience, 41, 540–551.an eighth order system. Journal of the North AmericanGurtz M.E., Webster J.R. & Wallace J.B. (1980) SestonBenthological Society, 11, 111–137.dynamics in southern Appalachian streams: effects of
Muller E., Decamps H. & Dobson M. (1993) Contributionclear-cutting. Canadian Journal of Fisheries and Aquaticof space remote sensing to river studies. FreshwaterScience, 37, 624–631.Biology, 29, 301–312.Gurtz M.E., Marzolf G.R., Killingbeck K.T., Smith D.L. &
Naiman R.J. & Sedell J.R. (1979) Characterization ofMcArthur J.V. (1988) Hydrologic and riparianparticulate organic matter transported by some Cascadeinfluences on the import and storage of coarseMountain streams. Journal of the Fisheries Research Boardparticulate organic matter in a prairie stream. Canadianof Canada, 36, 17–31.Journal of Fisheries and Aquatic Sciences, 45, 655–665.
Naiman R.J., Decamps H. & Pollock M. (1993) The role ofHawkins C.P., Murphy M.L. & Anderson N.H. (1982)riparian corridors in maintaining regional biodiversity.Effects of canopy, substrate composition and gradientEcological Applications, 3, 209–212.on the structure of macroinvertebrate communities in
Osborne L.L. & Wiley M.J. (1988) Empirical relationshipsthe Cascade Range streams of Oregon. Ecology, 63,between land use/cover patterns and stream water
1840–1856.quality in an agricultural watershed. Journal of
Hill B.H., Gardener T.J. & Ekisola O.F. (1992) PredictabilityEnvironmental Management, 26, 9–27.
of streamflow and particulate organic matterPlatts W.S., Armour C., Booth G.D., Bryant M., Bufford
concentration as indicators of stability in prairieJ.L., Culpin P., Jensen S., Lienkaemper G.W., Minshall
streams. Hydrobiologia, 242, 7–18.G.W., Monsen S.B., Nelson R.L., Sedell J.R. & Tuhy
James F.C. & Shugart H.H. Jr. (1970) A quantitative J.S. (1987) Methods for evaluating riparian habitats withmethod of habitat description. Audubon Field Notes, 24, applications to management. General Technical Report727–736. INT-221, Department of Agriculture, Forest Service,
Johnson S.L. (1995) Riparian input and hydrologic transport Intermountain Research Station. Ogden, UT.of organic seston along a prairie river. PhD Dissertation, Salisbury J.M. (1992) Basin controls and hydrologic responseUniversity of Oklahoma, Norman, OK. in the Little Washita River basin, Oklahoma. PhD
Lamberti G.A. & Moore J.W. (1984) Aquatic insects as Dissertation, University of Oklahoma, Norman, OK.primary consumers. The Ecology of Aquatic Insects (eds Sedell J.R. & Froggatt J.L. (1984) Importance of streamsideV.H. Resh & D.M. Rosenberg), pp. 164–195. Praeger forests to large rivers: the isolation of the WillamettePublishers, New York. River, Oregon, USA, from its floodplain by snagging
Lemmon P.E. (1956) A spherical densiometer for and streamside forest removal. Verhandlungen derestimating forest overstory density. Forest Science, 2, Internationalen Vereinigung fur Theoretische und314–320. Angewandte Limnologie, 22, 1828–1834.
Li H.W., Lamberti G.A., Pearsons T.N., Tait C.K. & Sedell J.R., Naiman R.J., Cummins K. W, Minshall G.W.Buckhouse J.C. (1994) Cumulative effects of riparian & Vannote R.L. (1978) Transport of particulate organicdisturbances along high desert trout streams of the material in streams as a function of physical processes.John Day Basin, Oregon. Transactions of the American Verhandlungen der Internationalen Vereinigung furFisheries Society, 123, 627–640. Theoretische und Angewandte Limnologie, 20, 1366–1375.
Malanson G.P. (1993) Riparian Landscapes. Cambridge Snaddon C.D., Stewart B.A. & Davies B.R. (1992) TheUniversity Press, Cambridge. effect of discharge on leaf retention in two headwater
Manci K.M. (1989) Riparian ecosystem creation and streams. Archiv fur Hydrobiologie, 125, 109–120.restoration: a literature summary. U.S. Fish and Wildlife Sokal R.R. & Rohlf F.J. (1981) Biometry. W.H. FreemanService Biological Report 89 (20), Fort Collins, CO. and Company, New York.
Minshall G.W., Petersen R.C., Cummins K.W., Bott T.L., Speaker R.W., Moore K.M. & Gregory S.V. (1984) Analysisof the process of retention of organic matter in streamSedell J.R., Cushing C.E. & Vannote R.L. (1983)
© 1997 Blackwell Science Ltd, Freshwater Biology, 37, 163–175
Scales of observation of riparian forests 175
ecosystems. Verhandlungen der Internationalen Canadian Journal of Fisheries and Aquatic Sciences, 37,130–137.Vereinigung fur Theoretische und Angewandte Limnologie,
Wallace J.B., Ross D.H. & Meyer J.L. (1982) Seston and22, 1835–1841.dissolved organic carbon dynamics in a southernSwanson F.J., Gregory S.V., Sedell J.R. & Campbell A.G.Appalachian stream. Ecology, 63, 824–838.(1982) Land–water interactions: the riparian zone.
Ward J.V. & Stanford J.A. (1983) The serial discontinuityAnalysis of Coniferous Forest Ecosystems in the Westernconcept of lotic ecosystems. Dynamics of Lotic EcosystemsUnited States (ed. R.L. Edmonds), pp. 267–291.(eds T.D. Fontaine III. and S.M. Bartell), pp. 29–42. AnnHutchinson Ross Publishing, Stroudsburg, PA.Arbor Science Publishers, Ann Arbor, MI.Sweeney B.W. (1993) Effects of streamside vegetation on
Webster J.R., Covich A.P., Tank J.L. & Crockett T.V. (1994)macroinvertebrate communities of White Clay Creek
Retention of coarse organic particles in streams of thein eastern North America. Proceedings of the Academy of
southern Appalachian Mountains. Journal of the NorthNatural Sciences of Philadephia, 144, 291–340. American Benthological Society, 13, 140–150.
Swift B.L. (1984) Status of riparian ecosystems in the Wiens J.A. (1989) Spatial scaling in ecology. FunctionalUnited States. Water Resources Bulletin, 20, 223–228. Ecology, 3, 385–397.
Tabacchi E., Planty-Tabacchi A. & Decamps O. (1990) Wiley M.J., Osborne L.L. & Larimore R.W. (1990)Continuity and discontinuity of the riparian vegetation Longitudinal structure of an agricultural prairie riveralong a fluvial corridor. Landscape Ecology, 5, 9–20. system and its relationship to current stream ecosystem
Vannote R.L., Minshall G.W., Cummins K.W., Sedell J.R. theory. Canadian Journal of Fisheries and Aquatic Sciences,47, 373–384.& Cushing C.E. (1980) The river continuum concept.
© 1997 Blackwell Science Ltd, Freshwater Biology, 37, 163–175
Top Related
Copyright © 2022 FDOKUMEN

