


Bahasa
Halaman
Hukum

www.elsevier.com/locate/geomorph
Geomorphology 72 (
River channel response to short-term human-induced change in
landscape connectivity in Andean ecosystems
Veerle Vanacker a,*, Armando Molina b, Gerard Govers b, Jean Poesen b,
Gerd Dercon c, Seppe Deckers d
a Institute for Mineralogy, Universitaet Hannover, Callinstrasse 3, D-30167 Hannover, Germanyb Physical and Regional Geography Research Group, Katholieke Universiteit Leuven, Redingenstraat 16, 3000 Leuven, Belgium
c International Institute of Tropical Agriculture, Oyo Road, Ibadan, Nigeriad Laboratory for Soil and Water Management, Katholieke Universiteit Leuven, Vital Decosterstraat 102, 3000 Leuven, Belgium
Received 22 October 2004; received in revised form 1 April 2005; accepted 30 May 2005
Available online 25 August 2005
Abstract
The drainage basin of the Deleg River (88 km2), located in the southern Ecuadorian Andes, was studied to assess the
geomorphic and hydrologic response of a fluvial system to human-induced environmental change in its contributing area.
Historical data on land use, channel morphology and sedimentology were collected, based on a spatial analysis of aerial
photographs (1963–1995) and a field survey (2002). Analysis of channel cross-sectional profiles and sedimentological data
revealed a major change in morphology and sedimentology of the Deleg River during the past four decades: (i) the active river
channel narrowed by over 45%, (ii) the riverbed incised on average by over 1.0 m and (iii) the median grain size of the bed
surface decreased from 13.2 cm to 4.7 cm. The spatial pattern of land cover within the Deleg catchment also changed
considerably: highly degraded agricultural land in the low-lying areas was abandoned and partially afforested for timber and
wood production, whereas secondary upland forest was increasingly cleared for expansion of cropland and pastures.
Notwithstanding large changes in the spatial organization of land use within the catchment, the overall land use did not
change significantly during the past four decades. This suggests that the response of the Deleg River to land-use change not
only depends on the overall land-use change, but also on the spatial pattern of land-use/cover change within the catchment.
Although forestation and regeneration of bare gully slopes and floors throughout the catchment only represented a minor part of
the total land-use change, these land-use/cover changes had a major impact on the hydrological and sediment connectivity in the
landscape.
D 2005 Elsevier B.V. All rights reserved.
Keywords: Land-use change; River morphology; River channel change; Sediment connectivity; Aerial photographs; Andes; Ecuador
0169-555X/$ - s
doi:10.1016/j.ge
* Correspondin
E-mail addre
2005) 340–353
ee front matter D 2005 Elsevier B.V. All rights reserved.
omorph.2005.05.013
g author. Tel.: +49 511 762 5974; fax: +49 5 11 762 3045.
ss: [email protected] (V. Vanacker).
V. Vanacker et al. / Geomorphology 72 (2005) 340–353 341
1. Introduction
During the last decades, land use and land cover in
the Andes region have changed drastically due to a
growing population and a changing economy
(Vanacker et al., 2003a; Wiegers et al., 1999). These
alterations in land use/cover on the hillslopes often
have important effects on spatial and temporal
dynamics of hillslope hydrology and sediment pro-
duction, transport and delivery to upper reaches of
streams (Braud et al., 2001; Dunne et al., 1991;
Krishnaswamy et al., 2001; Rey, 2003). Hillslopes
and upstream reaches are closely linked to river chan-
nels downstream, and changes in biophysical and
hydrological processes on the hillslopes are likely to
induce major changes in river channel morphology,
and water and sediment transport downstream (Har-
vey, 1991; Kondolf et al., 2002; Walling, 1983).
The change in channel morphology and fluvial
sediment transport as a response to up-stream
human-induced environmental changes has recently
been investigated in various environments (Chen et
al., 2001; Fryirs and Brierley, 1999; Garcia-Ruiz et
al., 1997; Kondolf et al., 2002; Liebault et al., 2002).
These studies documented historical modifications in
catchment characteristics, as well as their effects on
sediment supply to the fluvial system and river chan-
nel morphology. In most studies, the relationship
between land-use dynamics in the catchment and
fluvial morphology and sedimentology was analysed
using a lumped statistical approach, whereby river
channel dynamics is related to changes in overall
land use (e.g. the percentage forest cover).
Recent investigations by Harvey (1991, 2001),
Hooke (2003) and Vanacker et al. (2003b) have
shown that sediment production, transport and delivery
to river channels downstream is not only dependent on
the overall catchment physiography, but also on the
spatial organization and the internal connectivity of
various physiographic units. Few, if any, of these pre-
vious studies on fluvial response have considered the
impact of changes in the spatial organization of land
use on river channel morphology and sedimentology.
The main objective of this paper is, therefore, to
assess the response of an upland fluvial system in a
tropical mountain environment to human-induced
changes in land-use patterns. The drainage basin of
the Deleg River (88 km2), located in the southern
Ecuadorian Andes, was taken as a case study to high-
light the geomorphic and hydrologic response of an
upland fluvial system to rapid human-induced land-
use change in the upstream area. The specific objec-
tives of this study are: (i) to identify historical change
in channel morphology and sedimentology using aer-
ial photographs and field surveys, (ii) to quantify
historical change in land use, landscape fragmentation
and connectivity using aerial photographs, and (iii) to
investigate to what extent historical changes in the
spatial organization and connectivity of land units
within the catchment have affected river channel mor-
phology and fluvial transport of sediment.
2. Study area
The Deleg River drains an 88 km2 catchment in the
southern part of the Ecuadorian Andes, flowing 20 km
southeast and then 8.5 km eastward to its confluence
with the Burgay River, about 20 km northeast of the
city of Cuenca (Fig. 1). Altitudes range from 2320 m
a.s.1. at the catchment outlet to 3800 m a.s.1. at the
water divide. Catchment slopes are generally very
steep, ranging from 15% to 70%. Locally steeper
slopes (ca. 90%) are found in the deeply dissected
river valleys. Only in the lower part of the Deleg
catchment slopes are much gentler (1–15%). Land
use is dominated by cropland and pastures (ca. 35%
of the catchment area) and so-called wastelands (ca.
24%) interspersed with Eucalyptus plantations, fol-
lowed by rangeland (ca. 15%), native forest (ca.
11%) and high alpine paramo vegetation (ca. 9%).
Wastelands are highly degraded areas, located on
steep slopes, which are used for grazing. The vegeta-
tion cover is variable, but is generally sparse (b20%)
and consists mainly of shrubs and some grasses.
Pastures are also used for grazing, but they have a
nearly 100% vegetation cover consisting of grasses.
The Deleg basin is located in the Inter-Andean
depression and has a complex geological structure.
The basin is primarily underlain by sedimentary, vol-
canic and glacial sediments of the Upper Miocene to
the Present (Coltorti and Ollier, 2000). The lower and
middle part of the basin is made up of continental
sedimentary rocks including alluvial fans as well as
fluvial, lacustrine and pyroclastic deposits of the
Upper Miocene (Noblet et al., 1988). The upper part
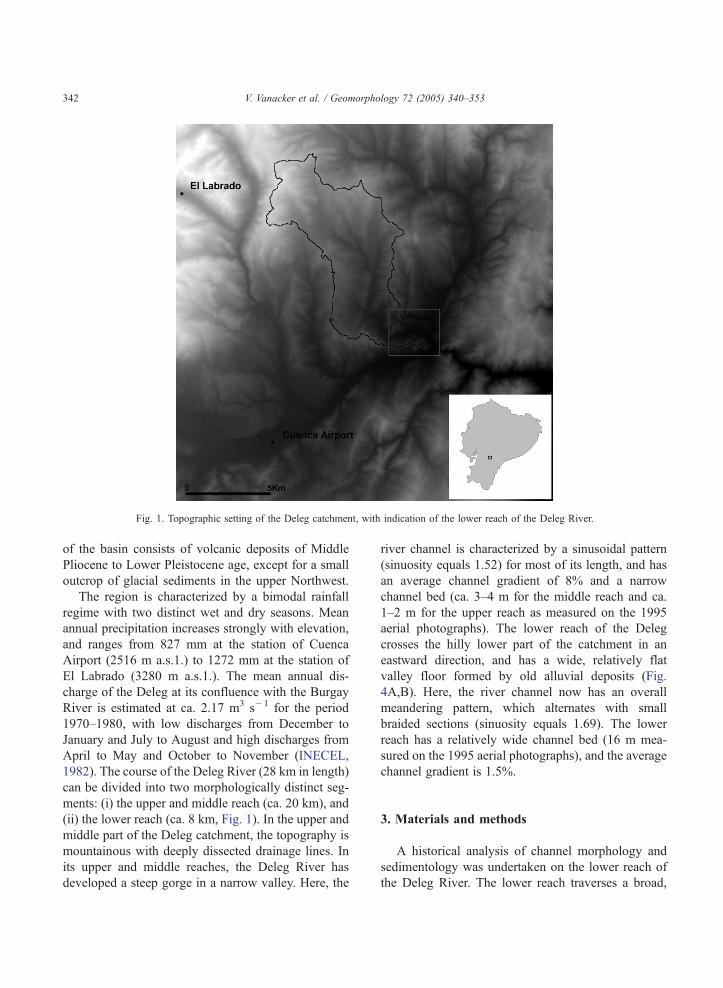
Fig. 1. Topographic setting of the Deleg catchment, with indication of the lower reach of the Deleg River.
V. Vanacker et al. / Geomorphology 72 (2005) 340–353342
of the basin consists of volcanic deposits of Middle
Pliocene to Lower Pleistocene age, except for a small
outcrop of glacial sediments in the upper Northwest.
The region is characterized by a bimodal rainfall
regime with two distinct wet and dry seasons. Mean
annual precipitation increases strongly with elevation,
and ranges from 827 mm at the station of Cuenca
Airport (2516 m a.s.1.) to 1272 mm at the station of
El Labrado (3280 m a.s.1.). The mean annual dis-
charge of the Deleg at its confluence with the Burgay
River is estimated at ca. 2.17 m3 s�1 for the period
1970–1980, with low discharges from December to
January and July to August and high discharges from
April to May and October to November (INECEL,
1982). The course of the Deleg River (28 km in length)
can be divided into two morphologically distinct seg-
ments: (i) the upper and middle reach (ca. 20 km), and
(ii) the lower reach (ca. 8 km, Fig. 1). In the upper and
middle part of the Deleg catchment, the topography is
mountainous with deeply dissected drainage lines. In
its upper and middle reaches, the Deleg River has
developed a steep gorge in a narrow valley. Here, the
river channel is characterized by a sinusoidal pattern
(sinuosity equals 1.52) for most of its length, and has
an average channel gradient of 8% and a narrow
channel bed (ca. 3–4 m for the middle reach and ca.
1–2 m for the upper reach as measured on the 1995
aerial photographs). The lower reach of the Deleg
crosses the hilly lower part of the catchment in an
eastward direction, and has a wide, relatively flat
valley floor formed by old alluvial deposits (Fig.
4A,B). Here, the river channel now has an overall
meandering pattern, which alternates with small
braided sections (sinuosity equals 1.69). The lower
reach has a relatively wide channel bed (16 m mea-
sured on the 1995 aerial photographs), and the average
channel gradient is 1.5%.
3. Materials and methods
A historical analysis of channel morphology and
sedimentology was undertaken on the lower reach of
the Deleg River. The lower reach traverses a broad,

Fig. 2. Aerial photographs of 1963 (A), 1980 (B) and 1995 (C) o
the lower reach of the Deleg River.
V. Vanacker et al. / Geomorphology 72 (2005) 340–353 343
open valley and spreads out over a large area (Fig. 1),
which facilitates the observation of spatial and tem-
poral changes in channel morphology and sedimen-
tology. Historical changes in land use in the catchment
area draining to the lower river reach were mapped
using sets of aerial photographs taken in 1963 and
1995 and were validated during a field survey in
2002. Additional topographic, climatic and socio-eco-
nomic data were collected to explain observed land-
use/cover changes and spatial changes in river mor-
phology and sediment transport.
3.1. Aerial photoanalysis
A spatially consistent database detailing historical
changes in land use and river channel morphology
was developed in a GIS (ILWIS 3.0). Data were
derived from sets of aerial photographs taken in
1963 (scale of ca. 1:50,000) and 1995 (scale of ca.
1:35,000). First, the aerial photographs were con-
verted into a raster graphic format by scanning the
photographs at 1000 dots per inch (dpi) using an A3
flat scanner. The scanning resolution of 1000 dpi
yields pixel dimensions of between ca. 1.27 m and
0.89 m on the ground for the photographs at scales of
1:50,000 and 1:35,000, respectively. Second, the aer-
ial photographs were geometrically corrected for sys-
tematic displacements (e.g. lens distortion, earth
curvature, refraction), and orthorectified for scale var-
iations and image displacement resulting from terrain
relief and camera tilt. The mathematical relationship
between the image (X,Y) and the ground coordinate
system (X,Y,Z) was established using a Digital Eleva-
tion Model (DEM) and a set of Ground Control Points
(GCPs).
These GCPs were collected by measuring the geo-
graphic position of at least 15 reference points by GPS
(Trimble Geo-Explorer) in the field. Prolonged GPS
measurements of two second-order geodetic points
showed a mean horizontal accuracy of 2 to 3 m.
The orthorectified photographs were then resampled
to create digital orthophotos, which have a uniform
scale throughout so that distances, angles and areas
could be measured and mapped on-screen. The hor-
izontal positional accuracy of all orthorectified ima-
gery was consistent and always better than 5 m.
The digital orthophotos of 1963 and 1995 were
interpreted and classified by on-screen digitising
(Fig. 2). All classifications were validated during
an extensive field campaign in 2002. Seven major
land-use categories were distinguished in the catch-
ment area: (1) water; (2) high alpine paramo vegeta-
tion; (3) native forest consisting of semi-evergreen
upland forest (i.e. Polylepis forest), upper montane
rain forest and montane shrub vegetation; (4) planta-
tion forest consisting mainly of Eucalyptus species;
(5) agriculture (i.e. cropland and rangeland); (6)
wasteland with a very poor vegetation cover; and
f

V. Vanacker et al. / Geomorphology 72 (2005) 340–353344
(7) urban areas. The stream channel morphology of
the lower reach of the Deleg River was characterized
by digitising the channel planform on the orthopho-
tos of 1963 and 1995. The edges of the active
channel were traced based on clearly identifiable
changes in vegetation type and density. Stream chan-
nel boundaries and active central and lateral gravel
bar areas were delineated on the aerial photographs
and separately digitised. As old channels and gravel
bars are still clearly visible in the field, the maps of
the river morphology were cross-checked using GPS.
Additionally, this information was confronted with
interviews of local residents.
3.2. Site surveys and measurements
Channel geometry was analysed on the basis of
cross-sectional surveys of the valley bottom mor-
phology. The surveys provide complementary infor-
mation on change in channel morphology, which
also allows a crosscheck of the data derived from
the aerial photographs. Along the 8-km lower reach
of the Deleg River, 11 cross-sections of the valley
Fig. 3. Map of channel trajectory in 1963 (A) an
floor were surveyed. The location of each cross-
section was measured with GPS, and located on
the orthophotos (Fig. 3). Channel cross-sections
were established perpendicular to the direction of
the flow, and extended laterally 2 m beyond the
limits of the valley bottom. At each cross-section,
the main morphological features across the river
valley were identified, and their location and relative
elevation were surveyed (Fig. 3). Some geomorpho-
logical features (old gravel bars, terraces, etc.) could
be dated approximately using archival evidence from
interviews with local older people.
Variations in size of channel deposits may reveal
changes in the flow regime of the Deleg River through
time. Therefore, in addition to the analysis of channel
geometry, a quantitative analysis of river channel
sedimentology was conducted following Kondolf
(1997). The granulometric analysis for the time period
represented on the orthophoto of 1963 was based on
pebble counts at vertical cross-sections through old
gravel bars, which were identified and located in the
field based on the orthophotos of 1963: in total, the
D50 and D90 of the gravel present in the terrace
d 1995 (B) with indication of the transects.

V. Vanacker et al. / Geomorphology 72 (2005) 340–353 345
deposits were measured at 40 locations (Fig. 5). The
mean grain size of these gravel bars was compared
with that of the actual bed material below the armour
layer, which was determined by conducting pebble
counts at ca. 100 locations along the active river
channel.
3.3. Complementary data
In order to analyse the effect of additional vari-
ables potentially influencing sediment and water
transport within the Deleg catchment, data related
to topography, drainage, rainfall and human popula-
tion dynamics were also collected. Altitude, slope
and geomorphic characteristics of the Deleg catch-
ment were derived from a 30 m resolution digital
elevation model (DEM). This DEM was created by
gridding and interpolating vectorised contour lines
with a 20 m interval derived from the 1:10,000-
scale topographical map (INECEL, 1982). The drai-
nage network was automatically generated from the
DEM data using the multiple-flow algorithm of
Quinn et al. (1991). Rainfall records were analysed
to examine possible changes in temporal or spatial
rainfall patterns during the study period (1963–
1995), which could have influenced the catchment
hydrology. As no historical records of daily rainfall
data are available for the area, time series of
monthly rainfall data for two long-running rainfall
stations (i.e. Cuenca Airport, 2516 m a.s.l. and El
Labrado, 3280 m a.s.l.) were studied to detect
potential trends in precipitation patterns. The rainfall
stations of Cuenca Airport and El Labrado are
representative for, respectively, the lower and middle
part, and the upper part of the Deleg catchment
(Fig. 1).
Table 1
Change in channel geometry and bankfull discharge
1 2 3 4 5
Width1963 (m) 32 35 39 25
Width2002 (m) 9.5 9.5 15 10.5
Change in width63-02 (%) �70 �73 �62 �58 �Incision63-02 (m) �0.9 �1.0 �0.9 �0.9 �Qb_1963 (m
3 s�1) 66 65 66 65
Qb_2002 (m3 s�1) 21 18 18 19
Change in Qb_63-02 (%) �68 �73 �72 �70 �The columns represent the 11 cross-sections of the 8-km lower reach of t
4. Historical channel changes (1963–1995/2002)
4.1. Change in channel geometry
Air photoanalysis and field surveys showed that
the lower reach of the Deleg River underwent signifi-
cant changes in channel geometry between 1963 and
1995/2002 (Figs. 2 and 3, Table 1). The river mor-
phology evolved from its braided pattern, with multi-
ple channels of shallow water and large active gravel
bar areas in 1963, to a more sinuous, single-thread and
slightly entrenched meandering channel in 1995/2002.
Throughout the 8 km lower reach, a general trend
of channel narrowing was observed (Fig. 3). The
change could be quantified based on the orthophotos
of 1963 and 1995. Changes in channel width along
the 8 km reach vary between �14 and �58 m or
�49% and �88% (Table 1). Correlation analysis
indicates that both the absolute and relative change
in channel width are a function of the channel width
of 1963 (R2=0.96 and 0.58, respectively).
The cross-sectional surveys of the valley morpho-
logy indicate that the change in channel width is asso-
ciated with channel incision (Fig. 4B). The present
river channel is entrenched in its former riverbed,
which now forms a low terrace close to the present
channel. The rate of channel incision was estimated
from the differences in level between the formerly
active channel identified on the orthophotos of 1963
and the present river channel. Incision rates of between
23 and 44mm year�1 (i.e. between 0.9 and 1.7 m) were
evident throughout the 8 km reach. The recent channel
incision caused large portions of formerly active
braided channels and bars to be disconnected from
the main river channel, and subsequently abandoned,
colonized and stabilized by vegetation (Fig. 4B).
6 7 8 9 10 11
29.5 28.5 29 70 38 52.5 71.0
15 14 11.5 16 15 6.5 13
49 �51 �60 �77 �61 �88 �82
1.2 �1.5 �1.4 �1.7 �1.3 �1.2 �1.0
65 74 64 75 70 80 87
18 19 19 20 21 22 22
72 �74 �70 �73 �71 �72 �74
he Deleg River.

Fig. 4. Photographs of lower part of the Deleg catchment (A), the
lower river reach (B) and gully systems stabilized with Eucalyptus
trees (C).
V. Vanacker et al. / Geomorphology 72 (2005) 340–353346
Bankfull discharges (Qb, m3 s�1) were estimated
for both 1963 and 2002 using the Manning’s formula
(Leopold et al., 1964):
Qb ¼R2=3S1=2
n
� �A
where R =hydraulic radius (m), S =water surface
slope (m m� l), A=channel cross-sectional area (m2)
and n =Manning’s resistance coefficient at bankfull
stage (Table 1). The Manning’s n value for bankfull
discharge was estimated at 0.049, based on roughness
coefficients computed for the adjacent Machangara
river system by Alvarez et al. (1994). Calculated
discharges are an estimate only. Nevertheless, they
reflect past and present flow conditions in the lower
reach of the Deleg River. The relative differences
between the estimates obtained for 1963 and 2002
indicate that the bankfull discharge of the Deleg
river has been significantly reduced.
4.2. Change in channel sedimentology
Pebble counting was used to assess changes in the
size distribution of the bed material, which may reflect
changes in flow conditions in the lower reach of the
Deleg River. Fig. 5 shows the particle size distribution
of the channel deposits of 1963 and 2002. The bed
material of the contemporary channel is characterized
by a geometric mean particle size of 47 mm and a
standard deviation of 21 mm, whereas the old channel
deposits have a mean particle size of 132 mm and a
standard deviation of 35 mm (Fig. 5). The bed mate-
rial critical shear stress (sc) for the mean particle size
was estimated for both 1963 and 2002 using the
Shield criterion approach,
sc ¼ qwgRcrS ¼ hcgD50 qs � qwð Þ
where qs=density of the sediment (kg m�3),
qw=density of water (kg m�3), g =gravitational
acceleration (m s�1), Rcr=critical hydraulic radius
for initiation of motion (m), S =water surface slope
(m m�1), hc=dimensionless critical shear which was
estimated at 0.056 for gravel bed channels, and
D =particle diameter (m) that sc can move. Based
on the estimates of the critical shear stress, the critical
hydraulic radius for initiation of motion (m) was
derived: the critical hydraulic radius decreased from
ca. 1.04 m in 1963 to ca. 0.37 m in 2002. Thus, the
overall decreasing trend of the mean particle size of
the bed material also suggests that the critical flow
depth for motion of sediment and, thus, peak dis-
charges decreased.
5. Land-use change (1963–1995)
Over 32 years, ca. 14% of the total catchment area
has undergone major changes in land use, which are

0
5
10
15
20
0 50 100 150 200 250 300diameter (mm)
proportion (%)
channel deposits representative for 1963
present-day channel deposits
Fig. 5. Grain size distribution of channel deposits of 1963 and those of the present-day channel. (Note that y-axis is rescaled to 100%, i.e. total
number of measurements).
V. Vanacker et al. / Geomorphology 72 (2005) 340–353 347
mainly driven by rapidly changing socio-economic
and demographic conditions. Increasing population
pressure in the fertile low-lying valleys, where the
population was traditionally concentrated, has stimu-
lated (i) the intensification of the farming system, and
(ii) the upward movement of the agricultural frontier.
Approximately 319 ha (i.e. 7%) of the arable land was
taken out of crop production, and was used as urban
land (c. 8 ha) and commercial forest plantations (c.
310 ha, Fig. 6). Secondary native forest was increas-
Fig. 6. Land-use maps of 1963 (A) and 199
ingly cleared and replaced by agriculture, and the area
of native forests reduced by 331 ha (i.e. 26% of the
total forested area in 1962) over a period of 32 years.
Despite these important changes, the overall forest
cover of the catchment did not change significantly:
the deforestation of native forest in the upper area was
almost completely compensated by the reforestation
with Eucalyptus trees along gullies, streams and par-
cels boundaries, and on degraded soils in the low-
lying areas. Also, no major net change in agriculture
5 (B) based on aerial photoanalysis.
V. Vanacker et al. / Geomorphology 72 (2005) 340–353348
or wasteland areas could be observed, despite large
internal spatial dynamics (Table 2, Fig. 6).
Besides changes in overall land use, important
changes occurred within certain landscape units. The
expansion and intensification of the agrarian land use
were not sufficient to cope with the rapidly increasing
population pressure in the area. The fragmentation of
small landholdings due to rapid demographic growth
continuously reduced the efficiency of small farms,
and severely limited agricultural productivity. These
constraints on agricultural productivity forced the
peasant population into national and international
migration to supplement the marginal agricultural
earnings. The village of Deleg, located in the central
part of the catchment, experienced significant out-
bound migration since the 1980s, which is evidenced
by its negative migration index (�1.5 1%; INEC,
1991). However, this official migration index (calcu-
lated as the number of immigrants minus emigrants
accepted per year, divided by the total population
number) is known to be largely underestimated, as
most of the outbound migration is illegal. Therefore,
the proportion of females in the total working age
population (18–55 years) probably provides more
realistic data on the extent of the migration: ca. 71%
of the working age population of Deleg now consists
of females (INEC, 1991). This overrepresentation of
females in the working age population clearly points
to a massive outbound migration of males. The mas-
sive outbound migration of the 1980s and 1990s had
clear impacts on the agrarian land use. Crazing pres-
sure on the wastelands in the lower part of the catch-
ment have significantly decreased (Fig. 2). This has
had positive effects on the regeneration of grasses,
Table 2
Land-use change during the period 1963–1995
Land-use categories 1963 1995 Change (1963–1995)
km2 km2 km2 %
Forest plantation 1.8 4.9 3.1 (+172)
Agriculture 43.4 44.3 0.9 (+2%)
Barren land (very low
vegetated)
22.0 21.2 �0.8 (�4%)
Urban land b0.1 0.1 0.1 (+414%)
Water/lakes 0.1 0.1 0.0
High alpine paramo
vegetation
7.8 7.9 0.1 (+1%)
Native forests 12.6 9.2 �3.4 (�27%)
shrubs and small bushes during the 1990s (Fig. 4C).
The bush density, as measured on the orthophotos of
1963 and 1995 for randomly selected transects within
the degraded areas, increased from 4.2% in 1963 to
5.8% in 1995. Vegetation increase was most notice-
able in drainage lines: these were often actively erod-
ing channels in 1963 while in 1995 most of them were
stabilized by vegetation (mainly shrubs).
6. Potential factors controlling river morphology
and sedimentology
The cross-sectional and sedimentological data
clearly indicate that the Deleg River underwent
major changes in discharge and sediment supply dur-
ing the past four decades. Any understanding of these
changes should be based on the identification of the
causes of these changes. In this case, three potential
factors controlling short-term change in river mor-
phology and sedimentology can be proposed: (i) the
1993 flood, triggered by the Josefina landslide, (ii)
natural short-term variations in the rainfall regime,
and (iii) human-induced land-use/cover change.
In 1993, the Josefina landslide event (estimated to
be 30 million m3) blocked the Paute River in Southern
Ecuador, and flooded the valley 10 km upstream of
the dam. As a consequence of this event, a small
section of the river valley in the lower part of the
Deleg catchment was also temporarily flooded. It is
known that the high water carried willow seeds, which
germinated along the margins of the low flow chan-
nels. The forestation of the riverbanks will probably
have accelerated the stabilization of the river channel
since 1993. However, from the aerial photographs of
1980, it is clear that the observed changes in river
morphology already started well before 1980, as the
river pattern of 1980 is very similar to the sinuous,
single-thread and slightly entrenched meandering
channel of 1995/2002 (Fig. 2). Thus, it can be stated
with certainty that the river narrowing and deepening
is not principally linked to the flood event of 1993.
As no historical gauging data are available for the
southern Ecuadorian Andes, time-series of rainfall data
(1930–1990) were analysed to assess potential hydro-
logical changes in the catchment. Time-series of
monthly precipitation data from the stations of Cuenca
Airport (1930–1990) and El Labrado (1963–1990)

V. Vanacker et al. / Geomorphology 72 (2005) 340–353 349
were collected, and anomalies relative to the mean of
the time period 1964–l990 were calculated to detect
general long-term trends in precipitation. Fig. 7 shows
the percent anomalies in monthly precipitation relative
to the mean monthly precipitation of the period 1964–
1990 for both rainfall stations. There is clearly a large
variability of monthly precipitation for both rainfall
stations over the last decades. However, no general
trend in monthly precipitation can be observed.
Given that the monthly rainfall pattern did not
undergomajor changes during the past decades, changes
in land-use/cover are most probably the major factors
controlling change in river morphology and sedimentol-
ogy. Although the net amount of change between the
major land-use systems (i.e. forest, agriculture and bar-
ren land) was relatively small, the spatial distribution,
fragmentation and vegetation cover of the land-use sys-
tems changed significantly (Fig. 6). The land reforms
together with the demographic boom of the 1960s and
CUENCA A
-100
-50
0
50
100
150
200
1930
1935
1940
1945
1950
1955
196
1930
1935
1940
1945
1950
1955
196
Mo
nth
ly p
reci
pit
atio
n (
mm
)
EL LA
-100
-50
0
50
100
150
200
Mo
nth
ly p
reci
pit
atio
n (
mm
)
Fig. 7. Rainfall anomalies relative to the mean of the time period 1964
1970s induced major shifts in the spatial land-use
pattern. The prevailing land-use systems moved
upwards, and large landholdings were increasingly
redistributed and fragmented in favor of the landless
and smallholders. The landscape pattern principally
changed from large-scale homogeneous land units
managed by a few large-sized farms towards a patchy
landscape fragmented into many middle- and small-
sized landholdings (Figs. 4A,C and 6). Two landscape
parameters were selected to quantify the change in
landscape pattern: (i) the mean perimeter-to-area ratio
(km km�2), and (ii) the mean fragmentation index,
which is calculated as follows (Monmonier, 1974):
F ¼Xmi¼1
n� 1
c� 1
� �.m
!
where n =number of different classes present in the
kernel of 5 by 5 pixels, c =number of cells considered
EROPUERTO
019
6519
7019
7519
8019
8519
90
019
6519
7019
7519
8019
8519
90
BRADO
–1990 for the station of (A) Cuenca Airport and (B) El Labrado.

Table 3
Change in landscape parameters during the period 1963–1995
Fragmentation Perimeter-to-area
ratio (km km-2)
1963 1995 1963 1995
Overall 0.0187 0.0189 15.7 20.3
Forest plantation 0.0404 0.0404 157.2 105.9
Agriculture 0.0124 0.0125 12.8 14.7
Barren land (very low
vegetated)
0.0071 0.0109 7.7 12.5
Urban land 0.0292 0.0228 48.5 32.5
Water/lakes 0.0194 0.0203 26.6 28.2
High alpine paramo
vegetation
0.0069 0.0066 9.0 8.5
Native forests 0.0154 0.0187 23.5 29.2
Fig. 8. Change in landscape connectivity in highly degraded areas
between 1963 (A) and 1995 (B). In 1963 (A), the degraded area is
barren, and highly dissected due to intense gully erosion. It is clear
from (B), that the vegetation cover in the degraded areas is higher in
1995. Particularly in the gully floors, the vegetation has regenerated.
V. Vanacker et al. / Geomorphology 72 (2005) 340–353350
in the 5 by 5 pixels kernel and m =number of pixels in
the image. The mean fragmentation index for the entire
catchment did not change, despite a clear increase in the
overall patch perimeter-to-area ratio, which generally
increased from 15.7 km km�2 in 1963 to 20.3 km
km�2 in 1995 (Table 3). The former result is probably
an artefact due to the definition of rather broad land-use
systems (e.g. agriculture), which means that shifts in
landscape pattern within these large land-use systems
(e.g. parcellization) are undetectable using the frag-
mentation index. There are large differences in the
change measured by the landscape metrics between
the various land-use systems. Generally, barren land
and native forest are characterized by a strong increase
in fragmentation; whereas the fragmentation remained
more or less constant for other land uses.
In addition to the increasing land fragmentation in
the middle and upper areas, the decreasing human
population pressure in the low-lying areas due to
outbound migration during the 1980s and 1990s had
clear impacts on the overall vegetation cover of the
barren land. As the land pressure on these marginal
areas significantly decreased, the natural vegetation
cover could slowly regenerate. At present, the vegeta-
tion cover of the barren land is characterized by
grasses, herbs and shrubs on the hillslopes, and shrubs
and bushes in the formerly active gully systems.
It is clear that the spatial pattern of the observed
land-use/over change had major effects on the hydro-
logical fluxes in the catchment, and influenced the
river morphology and sedimentology. Particularly, the
spatial pattern of land-use/cover change on low-lying
barren land played a key role in understanding the
change in hydrological fluxes and sediment connec-
tivity. These marginal, degraded areas were formerly
characterized by a very low vegetation cover, and
produced large volumes of surface runoff and sedi-
ment during rainfall events. As these degraded areas
are densely rilled and gullied, the runoff and sediment
produced on the barren land was quickly transferred to
the river network causing high peak flows and sedi-
ment fluxes in the river system. First, the overall
increased landscape fragmentation resulted in the
creation of many vegetative barriers within and
between different land units. In the highly degraded
areas, the overall density of bushes (measured as the
ratio of the area covered by bushes to the total area)
increased from 4% in 1963 to 7% in 1995. These
barriers retard and reduce surface runoff by promoting
water retention and re-infiltration, and stimulate the
deposition of eroded sediment. Second, the overall
increased vegetation cover of the degraded land due
to diminishing land pressure increased the surface
infiltration, and reduced the surface runoff (Fig. 8).
This was clearly observed in the catchment of the
Machangara River, where the abandonment of mar-
ginal, degraded areas induced major change in the
water and sediment balance of the barren land. In
the Machangara catchment, evapotranspiration and
infiltration of degraded land increased due to the
development of a protective vegetative and dead leaf
V. Vanacker et al. / Geomorphology 72 (2005) 340–353 351
cover, which likely resulted in a decrease of surface
runoff and sediment detachment and transport. As a
consequence of the reduced runoff volume, formerly
active gully systems became stabilized and started to
function as vegetation barriers for water and sediment
(Vanacker et al., 2003b). Our analyses indicate that
similar land-use/over change and hydrological pro-
cesses occurred in the Deleg catchment (Fig. 4C).
7. Conclusions
The spatial analysis of sequential aerial photo-
graphs (1963–1995) clearly shows that the morphol-
ogy of the lower reach of the Deleg River changed
significantly. The river pattern evolved from its
braided form with multiple shallow branches to form
a more sinusoidal, single-thread and slightly
entrenched channel. Channel cross-sectional surveys
confirm the hypothesis of a narrowing and entrench-
ing river channel, and pebble counts indicate that the
sediment transport in the river channel decreased.
Historical rainfall data were collected to assess poten-
tial trends in the rainfall pattern, but no clear changes
in the monthly rainfall amount could be detected.
Thus, the historical land-use/cover change that
occurred in the Deleg catchment is the main driving
factor for changes in water and sediment transport
from the hillslopes to the river system.
Land-use change analysis indicates that overall
changes in the surface area of the major land-use
systems were relatively small. However, the spatial
distribution, fragmentation and vegetation cover of the
various land-use classes changed significantly during
the last decades. The land reforms, together with the
demographic boom of the 1960s and 1970s, resulted
in a strong redistribution and fragmentation of the
land units, whereas, later on, the decreasing human
population pressure during the 1980s and 1990s, due
to outbound migration, stimulated the abandonment
and subsequent regeneration of the vegetation cover
on the marginal, barren land. The overall increase in
vegetation cover of the wastelands was relatively
limited, but important changes took place in critical
landscape zones. The stabilization of active gullies by
vegetation would have reduced the transfer of water
and sediment from the gully catchment to the river as
well as sediment production within the gully systems.
Particularly, the land-use/cover dynamics of the
degraded land were a key factor in the dynamics of
the river system. These formerly barren lands pro-
duced large surface runoff volumes and sediment
during rainfall events, which were quickly and effec-
tively transported to the river system through a dense
network of actively eroding rills and gullies. The
increased vegetation cover on these degraded lands
promoted the stabilization of formerly active gully
systems, which started to function as barriers for
water and sediment transport. These observations
indicate that the response of the Deleg River to
land-use/cover change mainly depends on the changes
in spatial organization and connectivity of various
land cover types within the catchment, and not so
much on the overall amount of land-use/cover change.
The effect of land-use/cover change on the hydro-
logical and sediment connectivity has often been over-
looked when interpreting river channel changes, as
former studies have tended to analyse the observed
river channel changes in relation to catchment
dynamics using a lumped statistical approach. Our
study shows how relatively small land-use/cover
changes within the catchment have had a clear and
detectable impact on the river channel morphology
and the fluvial transport of sediment. The change in
river morphology and sedimentology was not primar-
ily related to the overall land-use/cover change, but to
the change in spatial organization and connectivity of
land-use systems within the catchment, which largely
affected the routing of water and sediment fluxes from
the hillslopes to the river systems. These findings
have important consequences for integrated catchment
management, as the reduction of sediment transport
on the hillslopes and sediment transfer to the river
system is a key issue in the optimisation of the use of
runoff water as a natural resource (drinking water,
energy production). Our results clearly demonstrate
that the efficiency of erosion control measures on
sediment production and delivery can largely be
improved when these measures are spatially organized
in a strategic way such that the hydrological and
sediment connectivity are mostly reduced. This spatial
organization of erosion control measures reduces
implementation costs, and optimises the existing
land use/cover in the catchment.
Tropical mountain areas are generally considered
to be fragile ecosystems undergoing rapid deteriora-

V. Vanacker et al. / Geomorphology 72 (2005) 340–353352
tion at present (e.g. Lal, 2001; Nyssen et al., 2004).
Although this may generally be true, our study shows
that the situation is sometimes more complex: while
deforestation in the upper part of the Deleg catchment
has continued, the recovery of vegetation in the lower
part of the catchment has led to slope stabilization and
a reduction of river activity, much similar to what has
been observed in reforested mountain areas in Europe
(Kondolf et al., 2002; Liebault et al., 2002).
Acknowledgements
The research in Ecuador was granted by the Fund
for Scientific Research of Flanders (F.W.O.-Vlaan-
deren), a Marie Curie EIF fellowship (QLK6-CT-
2002-51545) and supported by the VLIR-EI project
bDiagnosis and solutions for soil degradation in the
Austro EcuatorianoQ funded by the Flemish Inter-uni-
versity Council (VLIR). Special appreciation is also
extended to all staff members of PROMAS (Programa
para el Manejo de Agua y Suelo, Universidad de
Cuenca, Ecuador) involved in this project.
References
Alvarez, L., Cordero, C., Neira, A. 1994. Determination de 10s
coeficientes de rugosidad de 10s rios que atraviesan la cuidad de
Cuenca. Unpublished Eng. thesis. Universidad de Cuenca,
Facultad de Ingenieria Civil, Cuenca.
Braud, I., Vich, A.I.J., Zuluaga, J., Fomero, L., Pedrani, A., 2001.
Vegetation influence on runoff and sediment yield in the Andes
Region: observation and modeling. Journal of Hydrology 254,
124–144.
Chen, Z., Li, J., Shen, H., Zhanghua, W., 2001. Yangtze River of
China: historical analysis of discharge variability and sediment
flux. Geomorphology 41, 77–91.
Coltorti, M., Ollier, C.D., 2000. Geomorphic and tectonic evolution
of the Ecuadorian Andes. Geomorphology 32, l –19.
Dunne, T., Zhang, W., Aubry, B.F., 1991. The effects of rainfall,
vegetation and microtopography on infiltration and runoff.
Water Resources Research 27, 2271–2285.
Fryirs, K., Brierley, G.J., 1999. Slope–channel decoupling in
Wolumla catchment, New South Wales, Australia: the changing
nature of sediment sources following European settlement.
Catena 35, 41–63.
Garcia-Ruiz, J.M., White, S.M., Lasanta, T., Marti, C., Gonzalez,
C., Errea, M.P., Valero, B., 1997. Assessing the effects of land-
use changes on sediment yield and channel dynamics in the
central Spanish Pyrenees. In: Walling, D.E., Probst, J.L. (Eds.),
Human Impact on Erosion and Sedimentation, vol. 245. Int.
Assoc. Hydrol. Sci. Pub., Wallingford, pp. 151–158.
Harvey, A.M., 1991. The influence of sediment supply on the
channel morphology of upland streams: the Howgill Fells,
northwest England. Earth Surface Processes and Landforms
16, 675–684.
Harvey, A.M., 2001. Coupling between hillslopes and channels in
upland fluvial systems: implications for landscape sensitivity,
illustrated from Howgill Fells, northwest England. Catena 42,
225–250.
Hooke, J., 2003. Coarse sediment connectivity in river channel
systems: a conceptual framework and methodology. Geomor-
phology 56, 79–94.
Instituto Ecuatoriano de Electrification (INECEL), 1982. Proyecto
Hidroelectrico Paute-Mazar: Informe de Factibilidad. INECEL,
Quito, Ecuador.
Instituto National de Estadistica y Censos (INEC), 1991. V Censo
de poblacion y IV de vivienda 1990 resultados definitivos
provincia de1 azuay. INEC, Quito, Ecuador.
Kondolf, G.M., 1997. Application of the pebble count: notes on
purpose, methods and variants. Journal of the American Water
Resources Association 33, 79–87.
Kondolf, G.M., Pigay, H., Landon, N., 2002. Channel response to
increased and decreased bedload supply from land use change:
contrast between two catchments. Geomorphology 45, 35–51.
Krishnaswamy, J., Halpin, P.N., Richter, D.D., 2001. Dynamics of
sediment discharge in relation to land-use and hydro-climatol-
ogy in a humid tropical watershed in Costa Rica. Journal of
Hydrology 253, 91–109.
Lal, R., 2001. Soil degradation by erosion. Land Degradation &
Development 12, 519–539.
Leopold, L.B., Wolman, M., Miller, J.P., 1964. Fluvial Processes in
Geomorphology. Freeman, San Francisco, p. 522.
Liebault, F., Clement, P., Piegay, H., Rogers, C.F., Kondolf, G.M.,
Landon, N., 2002. Contemporary channel changes in the Eygues
basin, southern French Prealps: the relationship between sub-
basin variability and watershed characteristics. Geomorphology
45, 53–66.
Monmonier, M.S., 1974. Measures of pattern complexity for chor-
opleth maps. The American Cartographer 2, 159–169.
Noblet, C., Lavenu, A., Schneider, F., 1988. Etude geodynamique
dun bassin intramontagneux tertiaire sur decrochements dans les
Andes du sud de 1’Equateur: l’exemple du bassin de Cuenca.
Geodynamique l–2, 117–138.
Nyssen, J., Poesen, J., Moeyersons, J., Deckers, J., Haile, M., Lang,
A., 2004. Human impact on the environment in the Ethiopian
and Eritrean highlands—a state of the art. Earth-Science
Reviews 64, 273–320.
Quinn, P., Beven, K., Chevallier, P., Planchon, O., 1991. The
prediction of hillslope flow paths for distributed hydrological
modelling using digital terrain models. Hydrological Processes
5, 59–79.
Rey, F., 2003. The influence of vegetation distribution on sediment
yield in forested marly gullies. Catena 50, 549–562.
Vanacker, V., Vanderschaeghe, M., Govers, G., Willems, E.,
Poesen, J., Deckers, J., De Bievre, B., 2003a. Linking hydro-

V. Vanacker et al. / Geomorphology 72 (2005) 340–353 353
logical, infinite slope stability and land use change models
through GIS for assessing the impact of deforestation on
landslide susceptibility in High Andean watersheds. Geomor-
phology 52, 299–315.
Vanacker, V., Govers, G., Barros, S., Poesen, J., Deckers, J., 2003b.
The effect of short-term socio-economic and demographic
changes on land-use dynamics and its corresponding geomorphic
response with relation to water erosion in a tropical mountainous
catchment, Ecuador. Landscape Ecology 18, 1–15.
Walling, D.E., 1983. The sediment delivery problem. Journal of
Hydrology 65, 209–237.
Wiegers, E.S., Hijmans, R.J., Herve, D., Fresco, L.O., 1999. Land
use intensification and disintensification in the Upper Canete
Valley, Peru. Human Ecology 27, 319–339.
Copyright © 2022 FDOKUMEN

