


Bahasa
Halaman
Hukum


The U.S. Department of Agriculture (USDA) prohibits discrimination in all its programs and activities on the basis of race, color, national origin, age, disability, and, where applicable, sex, marital status, familial status, parental status, religion, sexual orientation, genetic information, political beliefs, reprisal, or because all or a part of an individual's income is derived from any public assistance program. (Not all prohibited bases apply to all programs.) Persons with disabilities who require alternative means for communication of program information (Braille, large print, audiotape, etc.) should contact USDA's TARGET Center at (202) 720-2600 (voice and TDD).
To file a complaint of discrimination write to USDA, Director, Office of Civil Rights, 1400 Independence Avenue, S.W., Washington, D.C. 20250-9410 or call (800) 795-3272 (voice) or (202) 720-6382 (TDD). USDA is an equal opportunity provider and employer.
Recommended citation format for this publication: Fuglie, Keith O., Paul W. Heisey, John L. King, Kelly Day-Rubenstein, David Schimmelpfennig, and Sun Ling Wang. Research Investments and Market Structure in the Food Processing, Agricultural Input, and Biofuel Industries Worldwide: Executive Summary, EIB-90. U.S. Dept. of Agriculture, Econ. Res. Serv. December 2011.
Use of commercial and trade names does not imply approval or constitute endorsement by USDA.
Photos: Thinkstock.
ww
ww
w.wwer
sr .usda.govoo
Visit Our Website To Learn More!
www.ers.usda.gov
This report provides an Executive Summary of ERS Economic Research Report 130 with the same title. The longer report contains nine additional chapters with detailed analysis of seven agricultural input industries, the food manufacturing industry, and the biofuel industry, including fuller discussion of data sources and methods. For the full report, please see www.ers.usda.gov/publications/err130

United StatesDepartmentof Agriculture
www.ers.usda.gov
A Report from the Economic Research Service
Abstract
Meeting growing global demand for food, fiber, and biofuel requires robust investment in agricultural research and development (R&D) from both public and private sectors. This report highlights the major findings of a study examining global R&D spending by private industry in seven agricultural input sectors, food manufacturing, and biofuel and describes the changing structure of these industries. For the full report, see Research Investments and Market Structure in the Food Processing, Agricultural Input, and Biofuel Industries Worldwide, ERR-130. In 2007 (the latest year for which comprehen-sive estimates are available), the private sector spent $19.7 billion on food and agricultural research (56 percent in food manufacturing and 44 percent in agricultural input sectors) and accounted for about half of total public and private spending on food and agricul-tural R&D in high-income countries. In R&D related to biofuel, annual private-sector investments are estimated to have reached $1.47 billion worldwide by 2009. Incentives to invest in R&D are influenced by market structure and other factors. Agricultural input industries have undergone significant structural change over the past two decades, with industry concentration on the rise. A relatively small number of large, multinational firms with global R&D and marketing networks account for most R&D in each input industry. Rising market concentration has not generally been associated with increased R&D invest-ment as a percentage of industry sales.
Keywords: agricultural biotechnology, agricultural chemicals, agricultural inputs, animal breeding, animal health, animal nutrition, aquaculture, biofuel, concentration ratio, crop breeding, crop protection, farm machinery, fertilizers, Herfindahl index, globalization, market share, market structure, research intensity, seed improvement.
Research Investments and Market Structure in the Food Processing, Agricultural Input, and Biofuel Industries WorldwideExecutive Summary
Economic Information Bulletin Number 90
December 2011
Keith O. Fuglie, [email protected], Paul W. Heisey, John L. King, Kelly Day-Rubenstein, David Schimmelpfennig, and Sun Ling Wang

iiResearch Investments and Market Structure in the Food Processing, Agricultural Input, and Biofuel Industries Worldwide: Executive Summary / EIB-90
Economic Research Service/USDA
Contents
Summary. . . . . . . . . . . . . . . . . . . . . . . . . . . . . . . . . . . . . . . . . . . . . . . . . . . iii
Objectives and Methods of Study . . . . . . . . . . . . . . . . . . . . . . . . . . . . . . . . 1
Private-Sector R&D Investment in Agriculture, Food, and Biofuel . . . . 4
R&D Spending Over Time . . . . . . . . . . . . . . . . . . . . . . . . . . . . . . . . . . . . 4
R&D Spending by Region and for Selected Countries . . . . . . . . . . . . . . . 7
Market Size and Private Food and Agricultural R&D . . . . . . . . . . . . . 11
Global Demand for Agricultural Inputs . . . . . . . . . . . . . . . . . . . . . . . . . . . . 11
Price Trends for Some Agricultural Inputs . . . . . . . . . . . . . . . . . . . . . . . . . 13
Market Structure and R&D in Agricultural Input Industries . . . . . . . 15
Changes in Industry Concentration and R&D Intensity Over Time . . . . . . 15
R&D Spending By Firm Size . . . . . . . . . . . . . . . . . . . . . . . . . . . . . . . . . . . 17
Globalization of Private Agricultural R&D . . . . . . . . . . . . . . . . . . . . . . 19
References . . . . . . . . . . . . . . . . . . . . . . . . . . . . . . . . . . . . . . . . . . . . . . . . . . 22

iii Research Investments and Market Structure in the Food Processing, Agricultural Input, and Biofuel Industries Worldwide: Executive Summary / EIB-90
Economic Research Service/USDA
Summary
What Is the Issue?
Growth in the productivity of the global food and agricultural system will be largely determined by today’s investments in research and development (R&D). In recent decades, the private sector has become a major player in developing innovations for food and agriculture. Factors spurring private companies to invest in food and agricultural research include the emergence of biotechnology and other new scientific developments, the strengthening of intellectual property rights (IPR) over agricultural innovations, new regula-tory requirements, the expansion of markets for improved agricultural inputs and food products, and rising consumer demand for more diverse foods. More recently, rapid growth in the market for biofuel has pushed companies to expand their R&D investments in this area as well.
This report quantifies investment trends by for-profit companies in food manufacturing, biofuel, and agricultural input R&D and explores how these trends are affected by changes in market demand and industry structure. In particular, the report examines changes in the organization and structure of agricultural input industries (crop seed and biotechnology, crop protec-tion chemicals, synthetic fertilizers, farm machinery, animal breeding and genetics, animal health, and animal nutrition) and whether increases in market concentration in these industries are associated with increases or decreases in the level and intensity of R&D investments.
For comparative purposes, we present some aggregate statistics on public-sector research spending for food and agriculture and ways in which these investments differ or complement R&D in the private sector. However, we do not delve much into the interactions between public and private R&D. For a detailed examination of the evolving role of the public and private sectors in agricultural R&D in the United States, see Fuglie and Schimmelfpennig (2000).
What Did the Study Find?
During 1994-2007 (the latest year for which comprehensive estimates are available), annual private-sector food and agricultural R&D grew from $11.3 billion to $19.7 billion, or 4.3 percent per year (or, in constant 2006 dollars, from $14.6 billion to $19.2 billion, or 2.1 percent per year). In high-income countries, private-sector R&D spending appeared to be roughly equivalent to public-sector spending on food and agricultural R&D, although public R&D spending continues to be larger if only agri-cultural-related R&D is considered.
Growth in R&D investment was uneven across industries. The most rapid increase in R&D was in crop breeding/biotechnology. Significant growth in R&D spending also occurred in farm machinery and food manufacturing. However, real (inflation-adjusted) R&D spending declined for crop protection chemicals and animal nutrition.

ivResearch Investments and Market Structure in the Food Processing, Agricultural Input, and Biofuel Industries Worldwide: Executive Summary / EIB-90
Economic Research Service/USDA
Other key findings include the following (figures below are in current or nominal dollars, unadjusted for inflation):
• In 2010, global private-sector investments in R&D related to agricultural inputs reached $11.03 billion, an increase from $5.58 billion in 1994.
• In 2007, global private-sector investments in R&D related to food manu-facturing reached $11.48 billion, an increase from $6.02 billion in 1994.
• In 2009, global private-sector investments in R&D related to biofuel reached $1.47 billion, with most growth in this area occurring since 2000.
• Generally, the largest four to eight firms in each sector accounted for about three-fourths of the R&D in that sector, with larger firms spending more than smaller firms on R&D as a percentage of product sales (with the exception of small biotechnology firms). Typically, the large firms are multinational operations with global R&D and marketing networks.
• In most of the agricultural input industries, market concentration increased during 1994-2009, with the highest levels observed in the animal breeding and crop seed sectors and the largest increase observed in the crop seed sector.
• Rising levels of market concentration were not associated with larger R&D investment in agricultural input sectors.
• The globalization of food and agricultural R&D may accelerate the rate of international technology transfer, reducing productivity differences across nations and regions.
How Was the Study Conducted?
We used a number of approaches to construct estimates of private R&D spending by sector. For research-intensive agricultural input industries, we built a database of agriculturally related research spending firm-by firm over time, for all firms in the sector (including “legacy” firms, or firms that exited the industry during the period of study) that have or have had signifi-cant R&D expenditures. For large conglomerates, for which agriculture may be only one business segment, we separated agriculturally related R&D spending from R&D spending on nonagricultural business segments. We gathered this information by canvassing a broad set of material, including company annual reports and websites, reports by industry associations and consulting services, and personal interviews with company representatives. Altogether, we reviewed R&D information on more than 800 agricultural input companies worldwide. These firm-level data also enabled us to examine hypotheses regarding the relationship between industry structure and R&D spending: Do larger firms spend more (as a percentage of product sales) on R&D than smaller firms? Has the rising concentration of several agricultural input industries affected overall levels of R&D spending by that industry?
For agricultural input industries in which firms do not often report their research spending, we estimated agricultural R&D for the industry by taking a percentage of total agricultural input sales, with the percentages (or research intensities) derived from observations on R&D spending from a subset of firms and from previous surveys of the industry. For the food

v Research Investments and Market Structure in the Food Processing, Agricultural Input, and Biofuel Industries Worldwide: Executive Summary / EIB-90
Economic Research Service/USDA
manufacturing industry, we relied on country-level estimates produced by the Organisation for Co-operation and Development, which covers primarily high-income countries.
With these sources, we developed a global time series of R&D expenditure for agricultural input industries from 1994 to 2010, for the food industry from 1990 to 2007, and for biofuel in 2009. We examined how trends in R&D spending were associated with changes in market demand and industry struc-ture and reviewed the evidence on the factors causing structural changes in agricultural input industries.


1 Research Investments and Market Structure in the Food Processing, Agricultural Input, and Biofuel Industries Worldwide: Executive Summary / EIB-90
Economic Research Service/USDA
Objectives and Methods of Study
Over the past several decades, the private sector has become a major player in developing new innovations for food and agriculture. The emergence of biotechnology and other new scientific developments, the strengthening of intel-lectual property rights (IPR) over agricultural innovations, the global expansion of markets for improved agricultural inputs and food products, and consumer demands for more diverse kinds of food products are some of the key factors driving private companies to invest in food and agricultural research. More recently, rapid growth in the market for biofuel has spurred a diverse set of firms to expand their R&D investments in this area as well. This report seeks to quan-tify investment trends by for-profit companies in agricultural, food, and biofuel R&D and explore how changing market demand, industrial structure, and public policy may be affecting these trends. In addition, the report examines the role of government subsidies in stimulating private R&D in the biofuel sector.
Existing information on private spending on food and agricultural research is fragmentary. James (1997) and Alston et al. (2010) are among the few studies that have attempted to provide estimates of such expenditures on a global scale. Based on findings from both studies, private R&D expenditures from the mid-1990s to 2000 are estimated at $13 billion per year, or about two-thirds of total public sector spending for agricultural R&D (about $20 billion per year globally) over the period. These estimates account for R&D by the food manufacturing sector and the agricultural input industries, but the studies did not break down these amounts by sector. Moreover, they provide limited detail (and quite different estimates) about the country-specific loca-tions of private-sector R&D, with James estimating that about 85 percent was conducted in high-income countries and Alston et al. putting the share at 95 percent (in contrast, about 60 percent of public agricultural R&D is conducted in high-income countries, according to Alston et al.).
Other studies have provided more detailed information on private-sector expenditures on food and agricultural R&D at the country level. Klotz et al. (1995) develop comprehensive estimates of private R&D by the food sector and for major agricultural input industries in the United States between 1960 and 1992. Pray and Fuglie (2001) survey private companies in seven Asian countries about their agricultural R&D investments in the mid-1990s, and Echeverria et al. (1996) summarize available information for eight Latin American countries from around the same period.
Some estimates of R&D in specific industries, such as the agricultural chemical, crop seed, and veterinary pharmaceutical industries, are provided by industry groups through surveys of their member companies or consulting services. This information, however, may cover only a portion of an industry and may not be in the public domain.
Finally, a number of studies have examined publicly available data on a range of indicators of private R&D effort, such as number of agricultural patents, plant variety protection certifications, and biotechnology field trials issued or undertaken. For example, Huffman and Evenson (2006) make extensive use of historical patent data to investigate technology flows from manufacturing sectors to agriculture in the United States. The main conceptual difference between these
2Research Investments and Market Structure in the Food Processing, Agricultural Input, and Biofuel Industries Worldwide: Executive Summary / EIB-90
Economic Research Service/USDA
indicators and R&D expenditures is that the indicators reflect outputs from the R&D process whereas expenditures measure R&D inputs. It is expected that the two would be significantly correlated but with a timelag. Some of the main find-ings from studies assessing agricultural R&D indicators are summarized in Pray et al. (2007). In this study, we extend some of the work on R&D output indicators in the chapters on crop seed and agricultural chemicals.
This study provides new, detailed information on R&D spending by private industry for the food processing and biofuel sectors and for seven agricul-tural input sectors (crop seed and biotechnology, crop protection chemicals, synthetic fertilizers, farm machinery, animal health, animal breeding and genetics, and animal nutrition). For the food processing and agricultural input sectors, we report trends in private R&D spending over time. For the newly emerging biofuel sector, our estimates cover only one year, 2009. We also examine the location of private-sector R&D, but the multinational nature of many of the leading companies conducting food and agricultural R&D makes it difficult to do so. For agricultural input sectors, we can estimate total R&D for companies based in a particular country, but this estimate includes R&D by those same companies conducted in other countries and excludes R&D by foreign companies in that country. We discuss the globalization of private-sector R&D in terms of the growing international trade in agricultural inputs and how companies locate their R&D facilities to serve global markets.
The study also examines the changing structure of agricultural input industries. Several of these industries have undergone significant consolidation over the past couple of decades, with many firms exiting, merging, or being acquired by other firms. We discuss factors causing these changes and, for the agricultural input industries that do the most research, we quantify the change in concentra-tion at the global level. Higher levels of concentration may impart greater market power to the largest firms in the industry. If this market power is exercised to raise premiums on firms’ proprietary technology, it could encourage these firms to invest more in R&D. We examine whether market concentration is correlated with the share of industry revenues that is invested in R&D. We do not, however, conduct any formal tests of competitive performance in these markets.
To construct estimates of private R&D spending by sector, we use a number of approaches. For research-intensive agricultural input industries, we build a database of agriculturally related research spending firm by firm (both publicly traded and privately held) over time, for all firms in the sector that have (or have had) significant R&D expenditures. For large conglomerates, in which agriculture may be only one line of business among many, we separate agriculturally related R&D spending from other R&D spending. We gather this information primarily from firms’ annual financial reports and supple-ment it with information from industry associations, consulting services, and personal interviews with company representatives. These firm-level data also enable us to address questions on the relationship between industry structure and R&D spending:
• Do larger firms spend more (as a percentage of product sales) on R&D than smaller firms?
• Has the rising concentration of several agricultural input industries affected overall levels of R&D spending by these industries?

3 Research Investments and Market Structure in the Food Processing, Agricultural Input, and Biofuel Industries Worldwide: Executive Summary / EIB-90
Economic Research Service/USDA
For agricultural input industries in which member firms do not conduct much research, firm-level data on R&D spending is often reported for only a subset of the major companies in the industry. Our estimates of agricultural R&D for such industries reflect a share of total agricultural input sales (or research intensities) derived from observations on R&D spending from a sample of firms in the respective industries.
For the food industry, we rely primarily on country-level estimates provided by the Analytical Business Enterprise Research and Development (ANBERD) database produced by the Organisation for Economic Co-operation and Development (OECD). This database covers most high-income countries and a few developing countries.
For biofuel, we examine R&D spending across a number of sectors that are developing technologies for both biofuel feedstocks and biofuel manufac-turing. Because this is a relatively young industry, we derive an estimate of private R&D for only one year, 2009.
From these sources, we are able to develop a global time series of R&D expenditures by agricultural input industries from 1994 to 2010, food processing industries from 1990 to 2007, and the biofuel industry for 2009. Significant overlap or duplication occurs between R&D reported in the food and agricultural sector and the different segments of the biofuel market chain (i.e., some seed industry R&D is directed toward biofuel feedstocks and is counted as R&D in both sectors); therefore, to avoid double counting, we report biofuel R&D estimates separately from the estimate for total private-sector food and agricultural R&D.
Having assembled data on trends and levels of private food manufacturing and agricultural input R&D spending, we examine several factors that may be influencing these trends. First, we look at market demand. Large and growing markets for agricultural inputs or new food products can be expected to attract more R&D from private firms seeking to meet these needs. Second, we examine industry structure. Mergers and acquisitions have affected many agricultural input industries examined, with the result that fewer firms account for a growing share of the market over time. This devel-opment could influence incentives for private R&D positively, negatively, or not at all. The classic Schumpeterian view is that larger firms invest a greater portion of their revenues in R&D than smaller firms. However, in a detailed study of U.S. manufacturing industries, Cohen et al. (1987) do not find empirical support for this hypothesis. Regarding concentration, Levin et al. (1985) report a general tendency for R&D intensity to first increase and then decrease as industry concentration rises, but the authors note that the differ-ences across industries can be much larger than changes within an industry. Finally, we discuss the effects of changes in policies and technology opportu-nity, namely, the influence of developments in biotechnology on structure and R&D in the research-intensive agricultural input industries. Policies toward intellectual property rights (what is considered patentable) and the regulation of new technology introductions may have significant effects on how much and what kind of R&D is undertaken by the private sector, and what kinds of firms can successfully navigate these policies.

4Research Investments and Market Structure in the Food Processing, Agricultural Input, and Biofuel Industries Worldwide: Executive Summary / EIB-90
Economic Research Service/USDA
Private-Sector R&D Investment in Agriculture, Food, and Biofuel
R&D Spending Over Time
Table 1 shows trends in private-sector R&D spending in various agricul-tural input sectors and the food manufacturing industry in both nominal and constant (inflation-adjusted) dollars. In constant 2006 U.S. dollars, total food and agricultural R&D expenditures in the private sector increased from $14.59 billion in 1994 to $19.18 billion in 2007, or at an average annual rate of 2.1 percent. R&D expenditures in food manufacturing rose faster than those in agricultural input industries, and by 2007, food manufacturing accounted for about 58 percent of the overall annual total. Food manufac-turing has relatively low research intensity (R&D as a percentage of sales), but the overall size of the market is very large. R&D in the industry appears to be directed mostly toward new product development. Food sector R&D that is directly relevant to agriculture, such as R&D on animal feed manufac-turing, is also included in our estimate of R&D in agricultural input indus-tries (but not double counted in the total for food and agriculture). Among agricultural input industries, most of the increase in R&D spending between 1994 and 2010 occurred in the crop input industries, with R&D spending in the animal-related sectors as a whole remaining essentially flat in real (inflation-adjusted) dollars. Across sectors, the most rapid growth in agri-cultural R&D over 1994-2010 was for crop seed and biotechnology, where annual R&D spending increased from about $1.5 billion in the mid-1990s to nearly $3.5 billion in 2010 (constant 2006 U.S. dollars). Real R&D spending declined for crop protection chemicals and animal nutrition.
Comparative statistics for government spending on agricultural research are only available for 2000 (Beintema and Stads, 2008; Alston et al., 2010, table 6-1). Beintema and Stads (2008) estimate that total global public-sector agri-cultural research in 2000 was $16.3 billion in U.S. dollars and $20.8 billion in purchasing-power-parity (PPP) dollars.1 The private sector appears to account for between 39 and 45 percent of the total global investment in food and agricultural R&D worldwide, depending on whether comparisons are made using market or PPP exchange rates, and about half of the total in high-income countries (table 2). For high-income countries, Beintema and Stads estimate total public agricultural R&D in 2000 was $12.3 billion in U.S. dollars and $11.8 billion in PPP dollars, respectively. Of our estimated total of U.S. $13.1 billion (PPP $13.2 billion) in private food and agricultural R&D in 2000, U.S. $12.2 billion (PPP $11.8 billion) was attributed to companies based in high-income countries.
Although none of the global estimates of public research spending break down this investment into food and agricultural sectors, the U.S. data may be illustrative, at least for high-income countries. According to USDA’s Inventory of Agricultural Research, in 2000, about 60 percent of total public agricultural R&D was allocated to research related to plant and animal systems, 15 percent went to food and human nutrition, 18 percent went to environmental issues, and the remaining 7 percent was spread across other topics not directly related to food or farm production.2 Alston et al. (2010) also estimate that about 60 percent of U.S. public agricultural research was
1Beintema and Stads (2008) actu-ally report figures in constant 2005 dollars, which we convert to current 2000 dollars using the U.S. implicit Gross Domestic Product (GDP) price index. Global totals in U.S. dollars are calculated using market exchange rates, while totals in purchasing-power-parity (PPP) dollars are derived using the PPP exchange rates. PPP exchange rates are estimated by the World Bank by comparing the cost of a common basket of consumer goods across coun-tries. The main effect of using PPP exchange rates is to augment estimates of research and development (R&D) spending in developing countries; ag-gregate spending by high-income coun-tries remains about the same whether market or PPP exchange rates are used.
2This breakdown of U.S. public agricultural research expenditures is according to Research Problem Areas as defined by USDA’s Inventory of Agricultural Research (USDA, 2000). Alston et al. (2010) use a more detailed, project-by-project assign-ment to estimate (R&D) expenditures related to production agriculture. Their estimates show that the share of U.S. public agricultural (R&D) allocated to production agriculture has gradually declined over time.

5 Research Investments and Market Structure in the Food Processing, Agricultural Input, and Biofuel Industries Worldwide: Executive Summary / EIB-90
Economic Research Service/USDA
Table 1
Private research and development (R&D) expenditures for food and agriculture worldwideCrop
protection chemicals
Crop seed & biotech.
Farm machinery
FertilizerFood
animal health1
Animal breeding & genetics2
Animal nutrition
Total crop
inputs
Total animal inputs
Total agricultural
inputs
Food manu-
facturing
Total food & agricultural
inputs3
Millions of nominal U.S. dollars
1994 2,296 1,130 920 61 664 196 314 4,407 1,173 5,579 6,016 11,282
1995 2,390 1,213 987 80 778 203 332 4,670 1,313 5,983 6,876 12,528
1996 2,523 1,322 1,110 84 767 210 373 5,039 1,350 6,389 6,468 12,483
1997 2,635 1,522 1,127 64 749 217 345 5,349 1,311 6,660 6,399 12,714
1998 2,636 1,721 1,164 56 720 225 324 5,577 1,269 6,846 6,417 12,939
1999 2,581 1,788 1,079 49 670 232 320 5,496 1,223 6,719 6,490 12,889
2000 2,352 2,055 1,197 56 655 240 329 5,659 1,224 6,883 6,516 13,071
2001 2,263 2,015 1,149 53 592 249 334 5,480 1,175 6,655 6,755 13,075
2002 2,076 1,976 1,136 56 590 258 345 5,245 1,193 6,438 7,203 13,295
2003 2,458 2,064 1,190 74 663 267 360 5,787 1,290 7,076 8,756 15,472
2004 2,628 2,180 1,275 97 712 276 377 6,181 1,365 7,545 9,620 16,789
2005 2,678 2,254 1,369 119 757 285 375 6,420 1,417 7,837 10,531 17,993
2006 2,633 2,374 1,470 99 794 295 375 6,575 1,465 8,040 10,899 18,564
2007 2,754 2,615 1,665 104 816 306 389 7,138 1,511 8,649 11,480 19,741
2008 3,012 3,093 2,003 96 960 316 400 8,205 1,677 9,882 n.a. n.a.
2009 2,987 3,342 2,310 100 930 327 405 8,739 1,663 10,402 n.a. n.a.
2010 3,116 3,726 2,394 100 941 339 410 9,335 1,690 11,026 n.a. n.a.
Millions of constant 2006 U.S. dollars
1994 2,968 1,462 1,189 79 858 253 405 5,697 1,516 7,214 7,778 14,587
1995 3,028 1,536 1,250 101 986 257 421 5,915 1,663 7,578 8,709 15,866
1996 3,136 1,643 1,380 104 953 261 464 6,263 1,678 7,941 8,039 15,516
1997 3,218 1,859 1,377 79 915 265 421 6,533 1,601 8,134 7,815 15,528
1998 3,183 2,078 1,406 67 870 271 391 6,735 1,533 8,268 7,749 15,626
1999 3,071 2,127 1,284 58 798 277 381 6,541 1,455 7,996 7,724 15,339
2000 2,739 2,394 1,395 65 763 280 383 6,592 1,425 8,018 7,590 15,225
2001 2,577 2,295 1,309 61 674 283 381 6,242 1,338 7,580 7,694 14,894
2002 2,328 2,215 1,274 63 662 289 387 5,880 1,337 7,217 8,075 14,905
2003 2,697 2,265 1,306 81 727 292 396 6,350 1,415 7,765 9,609 16,978
2004 2,805 2,326 1,361 104 760 294 402 6,595 1,456 8,052 10,265 17,915
2005 2,765 2,328 1,414 123 781 295 387 6,629 1,463 8,093 10,875 18,581
2006 2,633 2,374 1,470 99 794 295 375 6,575 1,465 8,040 10,899 18,564
2007 2,676 2,540 1,618 101 793 297 378 6,934 1,468 8,402 11,152 19,176
2008 2,864 2,941 1,905 91 913 301 381 7,802 1,595 9,396 n.a. n.a.
2009 2,814 3,149 2,176 94 876 308 382 8,232 1,566 9,799 n.a. n.a.
2010 2,908 3,477 2,234 93 878 316 383 8,711 1,577 10,288 n.a. n.a.
n.a. = not available. Current expenditures adjusted for inflation by the U.S. implicit Gross Domestic Product price deflator.1Animal health R&D is for food animals only, excluding R&D for companion and equine animal health.2Estimates of private animal genetics research spending are only available for 1996 and 2006. We extrapolate for other years assuming 5.24 percent annual growth.3Includes Organisation for Economic Development and Co-operation food industry R&D and total agricultural input R&D (animal nutrition is a subsector of the food industry and is not double counted in the total).
Source: USDA, Economic Research Service. See Fuglie et al. (2011) for sources and estimation methods for specific industries.

6Research Investments and Market Structure in the Food Processing, Agricultural Input, and Biofuel Industries Worldwide: Executive Summary / EIB-90
Economic Research Service/USDA
allocated to research relevant to farm productivity but do not provide a break-down for the other 40 percent. If these fi gures are representative of public agricultural R&D in high-income countries, it would imply that the private sector accounts for roughly 76 percent of total food-related research and 46 percent of research on production agriculture in these countries (table 2).
For the biofuel industry, we estimate total private R&D at $1.47 billion in 2009 (table 3). This total includes $340 million spent by agricultural seed and biotechnology companies to improve biofuel feedstocks.3 Another $1.03 billion was spent by companies in the energy sector to improve the effi ciency of biofuel process manufacturing as well as to develop new types of biofuel feedstocks, such as algae. Enzyme and equipment manufacturers supplying inputs to energy companies for biofuel processing accounted for the remaining $71 million. Not included in these estimates is R&D spending by the transportation industry to modify vehicle and equipment engines for biofuel use. Although our estimates cover only one year, it is clear from industry sources that most of these R&D investments have arisen since 2000.
The largest driver of private biofuel R&D is the expectation of rising demand for alternative energy sources. This demand is sparked by the rising cost of fossil fuels relative to that for biomass-derived fuels and public concerns
3Biofuel feedstocks are the crops and biomass materials used to produce ethanol and biodiesel. First-generation feedstocks include corn, sugarcane, soybeans, and palm oil. Second-generation feedstocks (under develop-ment) include sources of cellulosic biomass, such as switchgrass, mis-canthus, corn stover, sugar bagasse, and forest-based materials. Third-generation biofuel feedstocks include algae and synthetic life forms.
Table 2
Public and private spending on food and agricultural research and development (R&D) worldwide in 2000
Food R&D
Agriculture R&D
Food & ag R&D
Food & ag R&D1
———— Billion U.S. dollars ———— Billion PPP$
Global totalPublic n.a. n.a. 16.3 20.8Private 6.2 6.9 13.1 13.2Total 29.3 33.9Private share of total (%) 45.0 39.0
High-income countriesPublic 1.9(est) 7.4(est) 12.3 11.8Private 5.8 6.3 12.2 11.8Total 7.7(est) 13.7(est) 24.5 23.6Private share of total (%) 76.0 46.0 50.0 50.0
n.a. = not available.
est. = estimate only. The allocation of public R&D into food-related and agriculture-related R&D in high-income countries is based on U.S. public R&D allocation shares and assumes these are roughly similar among all high-income countries. U.S. public R&D allocation is from the USDA's Inventory of Agricultural Research (USDA, 2000), which reports that in 2000, about 60 percent of total public agricultural R&D went to production agriculture, 15 percent went to food and nutri-tion, and the rest went to environmental and other topics. The total for public "food & ag R&D" includes all categories of research at public agricultural research institutions, while the food and agriculture sectors only include research directly related to that sector.1The last column estimates international public R&D using purchasing-power-parity (PPP) ex-change rates rather than the market exchange rates from which the U.S.$ estimates are derived. PPP exchange rates are based the relative price of a common basket of consumer goods. Using PPP exchange rates raises dollar estimates of R&D spending in developing countries signifi -cantly but affects spending estimates for high-income countries only marginally. PPP exchange rates are from the World Bank.
Source: USDA, Economic Research Service. Estimates of public food and agricultural re-search are from Beintema and Stads (2008). Estimates of private food and agricultural R&D are from this study. Private R&D on animal nutrition is included in agriculture excluded from the food sector.

7 Research Investments and Market Structure in the Food Processing, Agricultural Input, and Biofuel Industries Worldwide: Executive Summary / EIB-90
Economic Research Service/USDA
about national energy security and greenhouse gas emissions from fossil fuels. While Government subsidies and regulations have helped stimulate demand for biofuel, public-sector investments in biofuel R&D now appear to be considerably less than private-sector investments. Moreover, business spending on biofuel R&D appears to be almost entirely from private capital: Government subsidies for private-sector biofuel R&D in the United States, historically the country with the largest Government biofuel R&D program, amounted to only $24.4 million in 2009.
R&D Spending by Region and for Selected Countries
Our estimates of private agricultural input R&D expenditures in specific countries or regions are based on the R&D expenditures by companies incor-porated in that country or region.4 The estimates of food industry R&D are based on national surveys of manufacturing enterprises as reported to the OECD, so they should reflect in-country R&D by domestic and foreign firms. While information on R&D spending by the food manufacturing industry is not available for most developing countries, our estimates include data for several, including China, Turkey, South Africa, Chile, and Mexico.
Among all countries in 2006, the United States was the leader in private food and agricultural R&D, accounting for about one-third of the global total (table 4). U.S. companies were particularly dominant in the crop seed/biotechnology and animal breeding sectors, accounting for about half of global private R&D in each sector. This high level of investments partly reflects the large U.S. domestic market for agricultural inputs, a strong and complementary public agricultural R&D system, and a relatively favorable regulatory environment for the commercialization of genetically modified (GM) crops (Fuglie et al., 1996). European firms accounted for about half of total R&D by agricultural input industries and just over a third of total R&D by the food industry (with Germany, Switzerland, and the Netherlands
4This is only an approximate measure of actual (R&D) expendi-tures within a region or country, as it includes (R&D) conducted by those same companies in other regions or countries and excludes (R&D) in those areas by companies based outside the region or country. For example, to the extent that U.S.-based companies conduct some of their R&D in foreign countries, the estimates will overstate research in the United States. But they also understate research in the United States because they exclude research conducted by foreign companies in the United States. Our assessment is that these measures are roughly correct for OECD countries, although they may understate R&D taking place in developing countries. While private-sector agricultural R&D in most developing countries is relatively small, the contribution of foreign firms to that R&D may be significant. In a survey of private business enterprises in seven developing countries in Asia, Pray and Fuglie (2002) find that about 45 percent of total private agricultural R&D in those countries was conducted by foreign firms.
Table 3
Global expenditures for biofuel research and development (R&D) in 2009
Sector and type of firm R&DMillion U.S.
dollarsPrivate-sector market segments
Agricultural input sectors (agricultural seed-biotechnology compa-nies, plantations, forest product companies, and cellulosic biomass firms
340
Energy sector (biofuel producers, biofuel equipment manufacturers, and oil companies)
1,030
Enzyme and equipment input suppliers for biofuel processors 71
Total private biofuel R&D 1,470
Total public bioenergy R&D in industrialized countries 627
Source: USDA, Economic Research Service. Public-sector bioenergy R&D is from the International Energy Agency. The 2009 total includes a one-time increase of $224 million in the United States due to the American Recovery and Reconstruction Act (economic stimulus fund-ing). See Fuglie et al. (2011) for sources and estimation methods for specific industries.

8Research Investments and Market Structure in the Food Processing, Agricultural Input, and Biofuel Industries Worldwide: Executive Summary / EIB-90
Economic Research Service/USDA
being the leading countries in this region). Japan led R&D in the Asia-Pacific region. Japan had the second highest amount of R&D spending in the food industry (after the United States). In the agricultural input industries, Japan was among the leading countries in investing in R&D in the agricultural chemical and farm machinery sectors.
Table 5 presents historical data on R&D spending by U.S. food processing and agricultural input industries. These time series data are reasonably complete for the food manufacturing, agricultural chemical, farm machinery, and animal health sectors. Estimates of R&D spending by the crop seed-biotechnology sector are available for 1993 onwards and for occasional earlier years but enough to establish a trend. R&D data are limited for fertilizer, animal nutrition, and animal genetics, but relatively little R&D is conducted by private companies in these sectors. The available data are sufficient to clearly show substantial growth in private food and agricultural R&D in the United States over the past three decades. Between 1979 and 2006—2 years with R&D estimates for all sectors—R&D spending by the private sector in the food and agricultural sectors increased more than fourfold (and more than doubled, from $2.86 billion to $6.03 billion, when viewed in constant 2006 U.S. dollars), although this growth is less than that for U.S. industry gener-ally. By comparison, total R&D funded and performed by all U.S. private industries increased nearly ninefold, from $25.6 billion to $223.4 billion (nominal dollars), over the same period (NSF, 2010).
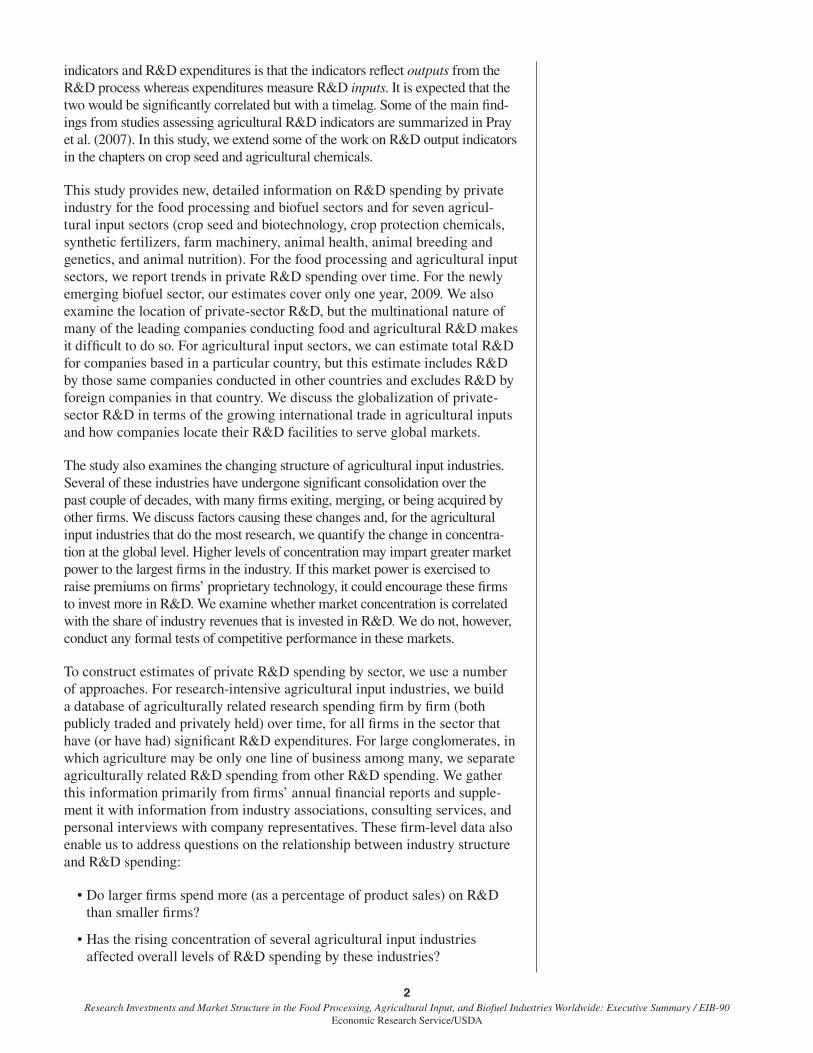
Private spending on food and agricultural R&D in the United States has exceeded public-sector agricultural research expenditures most years since the late 1970s (fig. 1). Federal and State governments invested on average
Table 4
Private-sector expenditures for food and agriculture research and development (R&D) by region in 2006
Sector
North America Europe- Middle East
Asia-Pacific Latin America
Global totalAll
United States
All Japan
Million U.S. dollars
Crop protection chemicals 599 599 1,596 404 368 34 2,633
Crop seed 1,287 1,261 983 96 66 6 2,374
Fertilizers 28 19 33 35 1 3 99
Farm machinery 573 513 579 309 189 9 1,470
Animal health1 279 236 477 36 8 3 794
Animal nutrition 66 63 232 71 19 7 375
Animal breeding 147 132 144 5 0 0 295
Crops 2,486 2,392 3,191 844 623 52 6,575
Animals 491 432 852 111 28 10 1,465
All agriculture 2,978 2,824 4,043 955 651 62 8,040
Food industry2 3,400 3,267 3,692 3,735 2,808 73 10,899
Food and agriculture3 6,312 6,028 7,503 4,619 3,440 128 18,564
1Animal health R&D includes R&D for food animals only. Globally, we estimate that food animal health R&D made up about 60 percent of total
animal health R&D in 2006, based on the percentage of animal health product sales for food animals. 2Food industry R&D is mainly for Organisation for Economic Co-operation and Development countries only.3Sum of food industry R&D and all agriculture R&D. Animal nutrition is a subsector of the food industry and is counted in both food industry R&D and agricultural R&D but not double counted in the total.
Source: USDA, Economic Research Service. See Fuglie et al. (2011) for industry-specific sources and estimation methods.

9 Research Investments and Market Structure in the Food Processing, Agricultural Input, and Biofuel Industries Worldwide: Executive Summary / EIB-90
Economic Research Service/USDA
Table 5
Private food and agricultural research and development (R&D) spending in the United States
Year
Crop protection chemicals
Crop seed & biotech
FertilizersFarm
machinery
Animal health
(all animals)
Animal health
(food animals only)
Animal nutrition
Animal genetics
Food industry
Million nominal U.S. dollars1960 27 4 75 6 1041961 38 65 11 1962 42 70 13 1211963 45 76 15 1301964 48 79 20 1441965 64 6 96 231966 77 100 28 1641967 92 102 35 1811968 99 96 36 1841969 104 99 34
1970 126 11 89 45 2221971 130 90 48 2381972 108 93 53 2581973 114 120 62 2681974 137 131 74 2971975 176 24 3 138 79 28 3351976 205 168 87 3551977 236 221 84 4151978 3 86 30 44 4721979 292 43 3 295 96 33 55 528
1980 111 6201981 487 278 125 6361982 115 129 7771983 587 290 147 8241984 22 154 42 1,0811985 432 368 159 1,1361986 179 1,2801987 398 483 191 1,2061988 221 1,2291989 561 272 281 243 1,275
1990 245 1,4141991 614 413 276 1,2771992 331 1,3861993 686 409 276 315 176 1,3451994 707 425 302 244 134 1,4761995 751 507 361 337 182 1,5661996 834 636 471 342 181 49 118 1,5641997 897 791 507 353 183 1,9081998 847 963 520 369 188 1,9491999 756 991 371 374 187 1,563
2000 703 1,045 420 358 175 1,5622001 531 985 395 349 168 1,9712002 534 1,010 372 342 161 2,2042003 558 1,012 403 417 192 2,1602004 606 1,078 453 478 215 2,8092005 612 1,095 504 524 230 3,2552006 599 1,261 19 513 549 236 63 132 3,2672007 614 1,393 628 641 269 74 2,9392008 683 1,707 813 830 340 92 n.a.2009 740 1,897 1,057 783 313 71 n.a.2010 793 2,176 1,120 772 309 n.a.
Sources: USDA, Economic Research Service. For 1993-2007 continuous time series, see Fuglie et al. (2011) for industry-specific sources and estimation methods. For pre-1993 data: crop seed research: 1960-1979 (Perrin et al., 1983); 1982 (Kalton and Richardson, 1983); 1989 (Kalton et al., 1989). Animal genetics research: 1978-79 (Malmstead, as reported in Ruttan, 1982); 1996 (Narrod and Fuglie, 2001). Agricultural chemi-cals, farm machinery, and food industry (NSF, various issues). Animal health (Pharmaceutical Research and Manufacturers of America, annual reports). Fertilizer and/or animal nutrition: 1975 (Wilcke and Williamson, 1977); 1978-79 (Malmstead, as reported in Ruttan, 1982); 1984 (Crosby, 1987), 1996 (Fuglie et al., 2000).

10Research Investments and Market Structure in the Food Processing, Agricultural Input, and Biofuel Industries Worldwide: Executive Summary / EIB-90
Economic Research Service/USDA
$4.40 billion annually (constant 2006 dollars) in agricultural research between 1980 and 2007, while the private sector spent an average of $4.95 billion per year (constant 2006 dollars) over the same period. But each sector focuses its research resources differently. The private sector accounts for about 80 percent of total food-related research and about 47 percent of total research related to production agriculture. Within these areas, public research is more oriented toward basic or fundamental science and scientific training, as well as topics like food safety, genetic resource conservation, and farming practices to conserve natural resources, research that has high social value but for which private incentives are relatively weak.
Figure 1
Trends in public and private food and agricultural research spending in the United StatesBillions constant 2006 U.S.$
Source: U.S. public agricultural research and development (R&D) spending is from USDA, Economic Research Service. U.S. private R&D spending is derived from the data in table 5, with interpolations for missing data. Nominal research expenditures are adjusted for inflation by the agricultural R&D price index developed by ERS. This price index takes into account changes in the cost of research inputs (scientist salaries, scientific equipment, etc.).
1975 80 85 90 95 2000 05 100
1
2
3
4
5
6
7Private R&D
Public R&D

11 Research Investments and Market Structure in the Food Processing, Agricultural Input, and Biofuel Industries Worldwide: Executive Summary / EIB-90
Economic Research Service/USDA
Market Size and Private Food and Agricultural R&D
One key determinant of private investment in R&D is the size of the market for products or processes developed from the R&D. Sales of new products or cost savings from manufacturing (process improvements) are necessary for firms to earn a return from their R&D. Moreover, firms must be able to price new products above their cost of manufacture, at least for some period of time, to help recoup the sunk costs of R&D, regulatory approval, and market development. Appropriability is the ability of firms to exercise some market power in the marketing and pricing of new products derived from their R&D investments. Securing patents and other forms of intellectual property rights enables firms to exercise appropriability over the economic benefits provided by the application of new technology.
Global Demand for Agricultural Inputs
Information on the size of global markets for agricultural inputs is not readily available. Thus, we assembled data from a variety of sources or made estimates of the wholesale value of market sales for agricultural inputs by product type. We estimate that in 2006, total company sales of these inputs were $355 billion (table 6). Fertilizers and animal feed (not including medi-cated feeds, which we include in the animal health sector) are the largest markets in terms of sales and consist of mostly bulk inputs that do not involve much R&D. These products accounted for about 60 percent of total agricul-tural input sales. Another 21 percent was for farm machinery and equipment. Crop protection chemicals and crop seed together accounted for about 15 percent of inputs purchased by farmers, while animal health and breeding materials accounted for the remaining 4 percent. Measures of the size of the various input markets vary somewhat depending on the source. Estimates of private-sector sales of crop seed and animal breeding materials vary the most. Historically, farmers have met a portion of their demand for crop seed and animal breeding stock through self-supply or by obtaining these inputs through informal markets or from neighboring farms. Over time, specialized breeding firms have increasingly helped meet this demand. By 2006, private seed companies appeared to be supplying about two-thirds of the crop seed used globally. The private-sector share of animal breeding stock is not known with much precision but appears to be very high for poultry, high and rising for swine and dairy cattle, and relatively low for beef cattle, small ruminants, and aquaculture (with the exception of some species, such as salmon).
A comparison of private-sector sales of farm machinery, crop protection chemicals, crop seed, and food animal health products worldwide since 1994 shows that only the markets for farm machinery and crop seed have grown significantly in inflation-adjusted dollars (fig. 2). Global sales of crop protection chemicals recovered somewhat from their low in 2002 but only to mid-1990s levels (to some extent, the increasing use of GM crops with pesti-cidal properties may be substituting for chemicals in crop protection). Most of the growth in sales of animal health products was attributed to markets for nonfood animal species, such as companion and equine animals. The figure does not show market trends for the animal feed and fertilizer markets. Although these are the largest agricultural input markets (in terms of sales),

12Research Investments and Market Structure in the Food Processing, Agricultural Input, and Biofuel Industries Worldwide: Executive Summary / EIB-90
Economic Research Service/USDA
Table 6
Global market for agricultural inputs supplied by the private sector in 2006
Industry SegmentPrivate-
sector sales
Million US$
Crop protection chemicals
Total for agricultural uses 31,962
Herbicides 15,246
Insecticides 7,895
Fungicides 7,671
Other 1,151
Crop fertilizers Total (168 million tons) 74,692
N fertilizer (99 million tons) 48,076
P2O5 fertilizer (39 million tons) 17,875
K2O fertilizer (30 million tons) 8,741
Crop seed Total proprietary seed sales 19,600
Conventional seed (proprietary) 11,800
Genetically modified seed (proprietary) 7,800Public seed sales and farmer-saved seed (not included in total)
9,400
Farm machinery Total 73,579
Farm tractors 21,321
Harvesting machinery 16,455
Planting and fertilizing machinery 35,802
Animal health Total for food animals 9,455
Total (food, companion and equine animals) 16,065
Pharmaceuticals 10,410
Biologicals (vaccines) 3,660
Medicated feed additives 1,995
Animal nutrition Total 141,833
Compound feed (656 million tons) 137,429
Nutritional feed additives 4,404
Medicated feed additives
Animal breeding Total 4,062
Poultry 1,742
Pigs 1,303
Cattle 931
Aquaculture 87
All private-sector sales of farm inputs 355,182
Sources: USDA, Economic Research Service. Agricultural chemicals from AGROW Reports (2007); crop seed sales from Context Network (2007); fertilizer sales derived from quantities of nutrients reported in Food and Agricultural Organization multiplied trade prices (dollars per metric ton of nutrient) from Haver Analytics; animal health products from Vetnosis as reported in International Federation for Animal Health (2007); animal feed sales derived the quantities reported in Best (2008) multiplied by International Monetary Fund corn and soy meal prices adjusted for processing costs; animal breeding are authors' estimates; farm machinery from Freedonia (2006).
(see animal health)

13 Research Investments and Market Structure in the Food Processing, Agricultural Input, and Biofuel Industries Worldwide: Executive Summary / EIB-90
Economic Research Service/USDA
they are mostly characterized by bulk, homogeneous products and little private R&D. Data are unavailable for trends in commercial sales of animal genetics products.
Price Trends for Some Agricultural Inputs
Markets for agricultural inputs can expand through either larger volumes of sales or through higher unit prices. Upward trends in unit prices may reflect rising quality of inputs, such as new technologies embodied in the inputs due to past investments in R&D. Higher input prices may also stem from increases in manufacturing costs due to rising labor, capital, or material costs. Based on a comparison of five categories of agricultural input prices received by farmers in the United States,5 the largest change during 1994-2010 was in crop seed prices, which more than doubled relative to the price received for agricultural commodities sold by farmers (fig. 3). This increase
5Global average prices of agricul-tural inputs are not available, although they can be derived from trade statis-tics. Using trade data, we constructed global price series for farm machin-ery, fertilizer, and animal feed and compared these with global indexes of agricultural commodity prices. We found similar trends to the price trends for the United States shown in figure 3.
Figure 2
Global market sales of selected agricultural inputsBillions constant 2006 U.S.$
Source: USDA, Economic Research Service. See sources listed in notes to table 6.
1994 96 98 2000 02 04 06 080
20
40
60
80
100
Farm machinery
Crop projection chemicals
Crop seed (all sources)
Crop seed (proprietary)
Animal health products (all animals)
Animal health products (food animals only)
Figure 3
U.S. agricultural input prices relative to prices received by farmersIndex, 1990=1.00
Source: USDA, Economic Research Service. Indexes of prices paid and received by farmers from USDA (various issues).
1990 92 94 96 98 2000 02 04 06 08 100
0.5
1.0
1.5
2.0
2.5
3.0 Fertilizer
Crop seed
Farm machinery
Animal feed
Agicultural chemicals

14Research Investments and Market Structure in the Food Processing, Agricultural Input, and Biofuel Industries Worldwide: Executive Summary / EIB-90
Economic Research Service/USDA
was due, at least in part, to the increase in value-added characteristics devel-oped by private seed and biotechnology companies through R&D programs. Le Buanec (2008) estimates that between 32 and 74 percent of the price of seed for corn, soybeans, cotton, and sugar beets in the United States and the European Union (EU) reflects technology fees or the cost of seed treatments. The sharp rise in the price of fertilizer in 2008-09 was driven by a significant increase in the cost of energy and materials used to manufacture fertilizer (especially natural gas, sulfur, and phosphate rock), as well as an increase in transportation costs and the falling value of the U.S. dollar (Huang, 2009). For agricultural chemicals, prices rose relative to commodity prices during 1994-99 but have since fallen. The recent decline partly reflects the rise in crop commodity prices after 2005 as well as an increasing market share for off-patent (generic) crop protection chemicals.

15 Research Investments and Market Structure in the Food Processing, Agricultural Input, and Biofuel Industries Worldwide: Executive Summary / EIB-90
Economic Research Service/USDA
Market Structure and R&D in Agricultural Input Industries
The growth rates in the global market size for agricultural inputs is gener-ally consistent with the trends in private spending on agricultural input R&D (see table 1), with the important exception of crop seed-biotechnology, where R&D grew more rapidly than sales value. We generally expect research investments to be correlated with industry sales (i.e., that research intensity, or the R&D-to-sales ratio, remains stable over time) unless other factors are changing incentives for private R&D. Other factors include (1) expectations that future demand growth will accelerate, (2) advances in scientific knowl-edge that have created new technological opportunities for commercializa-tion, and (3) stronger IPR or changes in market structure that have made it easier for private R&D investors to appropriate economic benefits of new technology. Greater industry concentration, like stronger IPR, can increase appropriability if it strengthens the market power of large firms. Market power enables firms to charge more for new or existing products and recoup their sunk investments in R&D and market development. These factors may not be acting separately but may be working concurrently to change incen-tives for private R&D. For example, scientific advances in molecular biology have created new technological opportunities in agricultural biotechnology and changes in IPR have increased appropriability over biological innova-tions (Fuglie et al., 1996). In such an environment, firms may consolidate to acquire complementary technology and marketing assets, capture economies of scale in R&D, and strengthen their market power. Indeed, across a number of agricultural input industries, mergers, acquisitions, and consolidation among firms are affecting industry concentration and structure.
Changes in Industry Concentration and R&D Intensity Over Time
In each of the five agricultural input industries with significant R&D, the degree of concentration in the global market rose significantly over 1994-2009, although a lack of data prevented us from quantifying this change for the animal breeding sector (table 7). We measure concentration using the Herfindahl index and by four-firm and eight-firm concentration ratios.6 By the end of the present decade, the largest four firms accounted for at least 50 percent of global market sales in each of these five agricultural input sectors. By 2006/07, market concentration was particularly high in the animal breeding sector, where the four-firm concentration ratio reached 56 percent. Growth in market concentration over time was most rapid in the global seed industry, where the market share of the four largest firms more than doubled from 21 to 54 percent between 1994 and 2009.
Table 1.7 also shows the trend in R&D intensity (i.e., R&D spending as a percentage of sales) for each agricultural input industry. With the exception of the crop seed-biotechnology sector, R&D intensity for each sector remained fairly constant over 1994-2009, although it varied significantly across sectors. R&D intensities averaged 8.6 percent for the animal health industry, 6.7 percent for the agricultural chemical industry, and 2.3 percent for the farm machinery industry. For the crop seed industry, R&D intensity increased from 11.0 percent in 1994 to 15.0 percent in 2000 and then fell back
6The Herfindahl index (or Herfindahl-Hirschman index, or HHI) is a commonly used measure of market concentration. Higher levels of HHI indicate that sales are con-centrated among a smaller group of firms and the potential for an increase in market power by the largest firms. The Herfindahl index is calculated as
2Nii
HHI S=å , where Si is the market
share of firm i in a market with N firms. The (four- and eight-firm) con-centration ratio measures the market share of the (four and eight) largest firms. Unlike the concentration ratios, the Herfindahl index reflects the dis-tribution of the market shares among the top firms and the composition of the market outside the top firms. It also gives proportionally greater weight to the market shares of the larger firms (Scherer and Ross, 1990). Note that the concentration measures in table 7 refer to an entire global agricultural input sector. Market concentration in a particular country or for a particular product (corn seed, or a class of herbi-cide, for example) could be consider-ably higher.

16Research Investments and Market Structure in the Food Processing, Agricultural Input, and Biofuel Industries Worldwide: Executive Summary / EIB-90
Economic Research Service/USDA
to 10.5 percent by 2009. For the animal breeding sector, we have an estimate of R&D intensity for 2006/07 only: an average of 7.3 percent across species.
Greater concentration was not associated with a permanent rise in R&D intensity in these input industries. In the crop seed industry, there was a temporary increase in research intensity in the late 1990s and early 2000s as the industry sought to commercialize a number of genentically modified crop varieties. But by the late 2000s, research intensity in the crop seed industry was back to its mid-1990s level. In fact, the underlying causes of growing concentration in these sectors appear to be quite specific to each sector and may not have affected private incentives to invest in R&D (table 8). In the crop seed and animal breeding sectors, the emergence of biotechnology was a major driver of consolidation. Firms sought to acquire relevant tech-nological capacities and serve larger markets to spread the large fixed costs associated with meeting regulatory approval costs for new biotechnology innovations. In the poultry and livestock sectors, vertical integration enabled some large firms to acquire capacity in animal breeding as part of their inte-grated system. In the farm machinery industry, many of the major mergers and acquisitions can be traced to large financial losses sustained by some leading firms during periods in which the farm sector was in prolonged reces-sion, which substantially reduced demand for farm machinery as farmers delayed major capital purchase. Firms experiencing large financial losses are
Table 7
Market concentration and research and development (R&D) intensity in global agricultural input industries
YearHerfindahl
index
4-firm concentration
ratio
8-firm concentration
ratio
Industry R&D intensity
Share of market (%) R&D/sales (%)Crop protection chemicals
1994 398 28.5 50.1 7.02000 645 41.0 62.6 6.82009 937 53.0 74.8 6.4
Crop seed and traits
1994 171 21.1 29.0 11.02000 349 32.5 43.1 15.02009 991 53.9 63.4 10.5
Animal health
1994 510 32.4 57.4 8.62000 657 41.8 67.4 8.52009 827 50.6 72.0 8.6
Farm machinery
1994 264 28.1 40.9 1.92000 353 32.8 44.7 2.32009 791 50.1 61.4 2.7
Animal genetics
1994 n.a. n.a. n.a. n.a.2000 n.a. n.a. n.a. n.a.2006/07 1,025 55.9 72.8 7.3
n.a. = not available.Source: USDA, Economic Research Service estimates based on firm-level sales and R&D ex-penditure data collected for this study. See Fuglie et al. (2011) for sources and methodology.

17 Research Investments and Market Structure in the Food Processing, Agricultural Input, and Biofuel Industries Worldwide: Executive Summary / EIB-90
Economic Research Service/USDA
often vulnerable to acquisition. The crop protection sector has been heavily affected by changes in regulations governing the health, safety, and environ-mental impacts of new and existing pesticide formulations. The consolidation in the animal health sector appears to be largely a byproduct of mergers and acquisitions in the pharmaceutical industry (as most of the leading animal health companies are subsidiaries of large pharmaceutical companies).
R&D Spending By Firm Size
Large firms usually account for most of the R&D spending in an industry. They may have, on average, higher R&D-to-sales ratios than smaller firms. If R&D-oriented large firms acquire small firms that do not make consider-able investments in R&D, such consolidation could lead to greater R&D by the industry as a whole. On the other hand, mergers between R&D-oriented firms could reduce overall R&D spending as duplication and redundancies in their merged R&D programs are eliminated. Merger activity may also be led by firms that specialize in off-patent generic products. A growing market share by these firms may lead to lower R&D in the industry as a whole. But the results reported earlier suggest that with the exception of the crop seed-biotechnology industry, market consolidation has generally not been corre-lated with changes in overall R&D by the sector.
An examination of average R&D intensities, global R&D shares, and global market shares for different classes of firms in four agricultural input sectors reveals trends between R&D and firm size (table 9). The general pattern is for four to eight of the largest firms to have the highest R&D-to-sales ratio and account for most R&D by the sector. For crop protection chemicals, five large, research-oriented (“discovery”) firms accounted for 74 percent of total R&D and 57 percent of total market sales for this sector. Another group of 17 midsized firms also invested in the discovery of new proprietary products and accounted for most of the rest of the R&D related to agricultural chemicals.
Table 8
Factors driving changes in market structure in global agricultural input industries
Sector Factors driving consolidation and concentration
Change in real R&D spending between 1994 and 20101
PercentCrop seed & biotechnology Acquisition of complementary technology and marketing assets,
economics of scale in crop biotechnology R&D 138
Farm machinery Financial losses of major manufacturers during farm sector business cycles (which strongly influence demand for large capital purchases)
88
Animal breeding & genetics Vertical integration of poultry and livestock industries; economics of scale in animal biotechnology R&D 25
Animal health (food animals only)
Forces driving consolidation in the pharmaceutical industry: loss of profit streams and idled capacity when major drugs go off-patent 2
Crop protection chemicals Stricter environmental and safety regulations; maturing markets; rise of generic products -2
1We have data on research and development (R&D) spending by the animal breeding and genetics industry for 1996 and 2006/07 only. The esti-mate of 25 percent growth between 1994 and 2010 is derived by applying the 1996-2006 average annual growth rate to these years. Changes in real R&D spending calculated from the data in table 1.
Source: USDA, Economic Research Service. See Fuglie et al. (2011) for discussion of specific industries.

18Research Investments and Market Structure in the Food Processing, Agricultural Input, and Biofuel Industries Worldwide: Executive Summary / EIB-90
Economic Research Service/USDA
The average R&D intensity for the smaller sized firms was slightly below that of the largest. Generic producers (firms not investing in new product discovery) conducted a small amount of R&D related to product manufacture and registration. In the crop seed-biotechnology sector, the largest eight seed sellers plus BASF (a firm investing significantly in agricultural biotechnology R&D but with few direct seed sales) accounted for 76 percent of private-sector seed research and had an average R&D intensity more than double that of midsized seed firms. However, small agricultural biotechnology firms had by far the largest research intensity in this sector, at about 42 percent. These operations tend to be startup organizations seeking to commercialize new research discoveries. If they are successful, they are likely to partner with large seed-biotechnology firms or be acquired by one of them. They play an important role in bringing high-potential but high-risk technologies into the marketplace. In the animal health and farm machinery sectors, the leading firms also had the highest average R&D intensities. (A number of biotech-nology firms are conducting research on animal health, but few specialize in the agricultural sector and none are included in table 9.)
Table 9
Company size and research and development (R&D) spending in agricultural input industries in 2006
SectorCompanies
Average R&D intensity
Global R&D share
Global market share
——— Number——— ——— Percent ———
Crop protection chemicals
Large discovery companies (>$2 billion sales) 5 9.0 74.1 57.4
Second-tier discovery companies (<$2 billion sales) 17 7.3 19.6 18.7
Other manufacturers 23 2.3 7.7 23.9 est.
Crop seed and biotechnology
Large seed companies (> $600 million sales) + BASF 8 15.8 75.6 48.8
Midsize seed companies ($50-600 million sales) 29 7.3 13.7 19.2
Other seed companies n.a. 2.0 3.1 16.0 est.
Agricultural biotechnology companies 58 42.1 7.6 1.8
Animal health
Large animal health discovery companies (>$800 million in sales) 8 10.0 66.7 79.6
Midsize animal health companies ($250 million-$800 million sales) 5 7.6 11.8 10.6
Other manufacturers n.a. 3.8 21.5 9.8 est.
Farm machinery
Leading multiline farm machinery companies (>$5 billion sales) 4 3.0 57.4 38.7
Second-tier farm machinery manufacturers 30 2.4 27.6 22.9
Other manufacturers n.a. 2.4 0.6 0.5 est.
est. = authors' estimate. n.a. = not available.
Source: USDA, Economic Research Service. See Fuglie et al. (2011) for industry-specific sources and estimation methods.

19 Research Investments and Market Structure in the Food Processing, Agricultural Input, and Biofuel Industries Worldwide: Executive Summary / EIB-90
Economic Research Service/USDA
Globalization of Private Agricultural R&D
All of the leading firms and many of the second-tier firms in food manufac-turing and agricultural input industries are multinational, offering product sales spread across several continents. In fact, global trade in agricultural inputs has grown rapidly over the past two decades (table 10). Between 1990 and 2007, international trade in animal breeding material grew by 260 percent and trade in farm machinery grew by 190 percent (in constant 2006 U.S. dollars). Trade in crop protection chemicals and crop seed also grew over the period (trade statistics for animal health products are not available).
Since the performance of agricultural technologies tends to be site specific (due to variations in weather, soil type, and other environmental conditions), many of the leading agricultural input firms have located R&D facilities around the world. This global R&D presence not only allows firms to develop and adapt new technologies to regional conditions and meet local regulatory requirements, but it also may enable them to achieve cost economies in some R&D activities (e.g., by conducting certain kinds of research in countries where highly trained personnel or specialized R&D services can be hired more cheaply).
While we do not have direct information on R&D investment in foreign countries by these firms, we have assembled information on the global R&D presence for several of the leading agricultural input firms (see table 11). Based on information from company websites, we indicate the sectors in which these firms made R&D investments in 2007 and the countries or regions of their principal agricultural R&D facilities. In addition to these principal research locations, the companies may have field-testing stations and manufacturing facilities in several other countries. For comparative purposes, the last three rows of table 11 show R&D spending by some of the largest public-sector agricultural research institutions. It is noteworthy that at least five firms made larger investments in crop improvement than the world’s largest public-sector agricultural research agency, USDA’s Agricultural Research Service (ARS), and several times the investment in crop genetic conservation and breeding than the network of centers that
Table 10
Global trade in agricultural inputsValue of global exports
Input type 1990 2000 2007
Billion constant 2006 U.S.$
Farm machinery 24.1 33.3 69.6
Crop protection chemicals 10.6 13.0 18.2
Crop seed 4.1 4.3 6.0
Animal breeding material 0.3 0.5 1.2
Sources: USDA, Economic Research Service. Farm machinery and pesticide export values from Food and Agriculture Organization; Crop seed export value from the Le Buanec (2007) and International Seed Federation; trade in animal breeding material includes value of exports of day-old poultry chicks, swine and bovine live breeding animals, and bovine semen (UN ComTrade). Export values adjusted for inflation by the U.S. Gross Domestic Product implicit price deflator (Economic Report of the President, 2009).

20Research Investments and Market Structure in the Food Processing, Agricultural Input, and Biofuel Industries Worldwide: Executive Summary / EIB-90
Economic Research Service/USDA
Table 11
Agricultural research and development (R&D) spending by major multinational corporations and public institutions in 2007
Company
Country of incorporation
Sector of R&D activityAgricultural R&D spending (esti-
mate only)Principal agricultural R&D locations
Million U.S.$
Bayer1 GermanyAg. chemical, crop seed,
animal health 978
Germany, France, Belgium, Nether-lands, U.S., Japan
Syngenta2 Switzerland Ag. chemical, crop seed 830 Switzerland, UK, U.S., China, Australia
Monsanto3 U.S. Ag. chemical, crop seed 770U.S., France, Brazil, Argentina, India, Australia
BASF4 GermanyAg. chemical, crop seed,
animal nutrition655 Germany, U.S., India
Dupont5 U.S.Ag. chemical, crop seed,
food ingredients633 U.S., France, Japan, India
Dow6 U.S. Ag. chemical, crop seed 294-380 U.S., Japan, Argentina, Puerto Rico
Limagrain7 France Crop seed 171EU, U.S., Brazil, Chile, China, Japan, Israel, Morocco
KWS8 Germany Crop seed 104EU, U.S., Argentina, China, Turkey, Russia
John Deere9 U.S. Farm machinery 461 U.S., India, IsraelCNH9 Netherlands Farm machinery 272 U.S., EU, Brazil, Turkey, India, ChinaCLAAS10 Germany Farm machinery 150 GermanyPfizer11 U.S. Animal health 317 U.S., UK, JapanMerial11 U.S. & UK Animal health 250 U.S., France, 9 global locationsSchering-Plough11 U.S. Animal health 113 U.S., 14 global locationsFort Dodge (Wyeth)11 U.S. Animal health 115 U.S., EUDSM12 Netherlands Animal nutrition 114 NetherlandsGenus13 UK Animal genetics 33 U.S., UKPublic – USDA/ARS14 U.S. Crop science 456 U.S. Public – USDA/ARS14 U.S. Animal science 171 U.S.
Public – CGIAR14 GlobalAgricultural biodiversity and
genetic improvement178
9 centers with crop breeding programs, all in developing countries
1Bayer reports spending 506 million euros on crop protection R&D and 131 million euros on environment science/bioscience in 2007 (bioscience is mostly seed and crop biotechnology research while environmental science includes nonagricultural applications of crop protection chemicals and related products). Since 2006, Bayer no longer reports animal health R&D separately from its Consumer Health business segment, but it did report animal health product sales of 956 million euros in 2007. We estimate Bayer spent 8 percent of animal health sales on R&D, or 76 million euros. These figures are from Bayer (2008). 2Syngenta reports spending $496 million on crop protection R&D, $283 million on crop seed R&D, and $51 million on new business development (mostly crop biotechnology) R&D in 2007 (Syngenta, 2008). 3 Monsanto reports spending $770 million on agricultural R&D in 2007, mostly for its seeds and genomics division, with the remainder to support its crop protection products (Monsanto, 2009). 4BASF (2007) reports that the company spent 328 million euros on crop protection R&D in 2007 and 400 million euros on plant sciences R&D over 2006-08 (the latter is included as part of its corporate"Verbund" research for future business development). We assume it spent about one-third of this 3-year total, or 135 million euros, for plant sciences R&D in 2007. In addition, BASF develops animal nutrition specialty products (vitamins, enzymes, and minerals). It does not report animal nutrition sales or R&D separately but includes this in its fine chemicals business segment, although for 2009 it reported that animal nutrition sales made up 16 percent of product sales from this segment (BASF, 2010). We assume animal nutrition products accounted for 16 percent of sales of fine chemicals in 2007 (485 million euros) and that BASF invested 3 percent of this, or 15 million euros, in animal nutrition R&D in 2007. 5Dupont (2008) reports that its agriculture and nutrition division spent $633 million on R&D in 2007. Net sales from this business segment included crop seeds (49 percent), crop protection chemicals (34 percent), and food ingredients (17 percent). 6Dow does not report R&D spending by business segment but is known to invest significantly in both crop protection and crop seed and biotechnology R&D. In 2007, Dow's total R&D spending was $1,305 million (Dow Chemical Co., 2009). We derive a lower bound estimate of Dow’s agricultural R&D spending by multiplying total R&D by the share of agricultural science patents in Dow's total U.S. patent holdings, which were 508 out of 2,266 patents as of December 31, 2008, according to Dow Chemical Co. (2009). Our upper bound estimate is derived assuming Dow invested 10 percent of its crop protection sales and 33 percent of its seed sales in R&D. While this research intensity for seed is high, it reflects Dow's stated intention to expand its market presence in the global seed industry. 7Limagrain spent 102 million euros in crop seed research in 2006/07 (Limagrain, 2007). 8KWS spent 75 million euros in crop seed research in 2006/07 (KWS, 2008). 9John Deere and CNH report total spending for research, development and engineering for agricultural, construction, and other equipment sales. We estimate their R&D spending for agricultural equipment by taking the proportion of agricultural sales in total equipment sales. For Deere, this implies 56 percent of its total R&D spending of $817 million was for agriculture in 2007 (Deere & Company, 2007) and for CNH, 66 percent of total R&D spending of $409 million was for agriculture in 2007 (CNH, 2008). 10CLAAS reports spending 110 million euros on research, development, and engineering for agricultural equipment in 2007 (CLAAS, 2009). 11These pharmaceutical companies do not report animal health R&D separately, although they do report animal health product sales. To estimate animal health R&D for these countries, we use estimates of R&D as percentage of animal health sales as reported in Animal Pharm Reports (2007). These are: 12 percent for Pfizer, 10 percent for Merial and Fort Dodge, and 9 percent for Schering-Plough. See chapter 6 for recent merger activity in animal health. 12DSM develops and markets both animal and human nutrition and health products. Its total R&D spending in 2007 was 136 million euros. We assume that 57 percent of this was for animal nutrition R&D, the same proportion of animal product sales out of total nutrition sales. (DSM, 2007). 13Genus reports 17.7 million euros in R&D spending for livestock (cattle and pigs) research in 2007 (Genus, 2007). 14For comparative purposes, we show agricultural R&D spending for two prominent public-sector institutions: USDA’s Agricultural Research Service (USDA/ARS) and the research centers that are supported by the Consultative Group for International Agricultural Research (CGIAR). USDA/ARS expenditures for crop and animal sciences are from USDA (2007); CGIAR spending on biodiversity conservation and genetic improvement (which is mostly for food crops) is from CGIAR (2007).
We convert foreign currencies into U.S. dollars using the exchange rates reported in the Economic Report of the President (2009).
Sources: USDA, Economic Research Service and others, as noted above.

21 Research Investments and Market Structure in the Food Processing, Agricultural Input, and Biofuel Industries Worldwide: Executive Summary / EIB-90
Economic Research Service/USDA
make up the Consultative Group for International Agricultural Research (CGIAR).7 The three companies that made the largest investments in agri-cultural research in 2007 were the European firms Bayer and Syngenta and the U.S. firm Monsanto, each with over $700 million in R&D spending for crop and/or animal agriculture. By 2007, the agricultural R&D investment by these three firms together was $2.47 billion (and it rose further to over $3 billion by 20098).
Another indicator of the degree of globalization of agricultural input markets is the global distribution of agricultural input sales (see fig. 4). In 2006, member countries of the North American Free Trade Agreement (NAFTA—United States, Canada, and Mexico) accounted for about 23 percent of the global seed market and 30-36 percent of global sales of agricultural chemicals, farm machinery, animal feed, and animal health pharmaceuti-cals (including those for nonfood animals). The Europe-Middle East-Africa market (which is mostly Europe) had the largest aggregate seed sales in 2006, whereas Asia-Pacific countries used the most fertilizers and bought the most farm machinery. Together, Asia-Pacific and Latin America are indicative of a rough estimate of the developing-country share of global agricultural input markets.9 They account for 37-51 percent of global sales of crop seed and chemicals, farm machinery, fertilizers, and animal feed.
These indicators—trade in agricultural inputs, location of R&D facilities, and the wide distribution of agricultural input sales—demonstrate the multina-tional nature of private-sector investments in agricultural R&D and the role of these companies in developing and transferring agricultural technology around the world. One implication of the globalization of private-sector food and agricultural research is that the rate of international technology transfer may accelerate, eventually serving to reduce productivity differences across nations and regions. Moreover, the location of principal R&D centers may be less important than the location of markets and flow of trade in the agricul-tural inputs that embody the technology developed through this R&D.
7These figures are presented to characterize the scale of private R&D, but it should not be inferred that the public and private sectors engage in similar kinds of research. Rather, each sector is likely to play complemen-tary roles. A detailed 1994 survey of public and private crop breeding in the United States, for example, found that about 80 percent of private-sector crop breeding research was on varietal development, while breeders at USDA’s Agricultural Research Service focused exclusively on more “upstream” (basic) research like developing new breeding methods and introducing new genetic diversity into breeding pools (Frey, 1996). See Fuglie et al. (1996) for more information on the roles of the public and private sectors in agricultural research and development.
8Bayer reports $907 million in agricultural R&D by its CropScience division in 2009, while its Consumer Health division likely spent an ad-ditional $110 million on animal health R&D (Bayer, 2010). Monsanto reports total R&D spending of $1.1 billion in 2009 (Monsanto, 2010), while Syngenta reports $960 million in agricultural R&D in the same year (Syngenta, 2010).
9This is not a precise estimate for developing countries, however, because the Asia-Pacific region includes Japan, South Korea, Australia, and New Zealand (high-income countries) while the Europe-Middle East-Africa region includes some developing countries.
Figure 4
Global distribution of agricultural inputs sales in 2006
Note: Global distribution of sales of animal genetics is not available.
USDA, Economic Research Service. See Fuglie et al. (2011) for sources on specific industries.
Percent of global sales
Fertilizers
Animal feed
Animal health products
Farm machinery
Agricultural chemicals
Crop seed
0 20 40 60 80 100
Asia-PacificLatin AmericaEurope-Middle East-AsiaNAFTA

22Research Investments and Market Structure in the Food Processing, Agricultural Input, and Biofuel Industries Worldwide: Executive Summary / EIB-90
Economic Research Service/USDA
References
AGROW Reports. 2007. GM Crops, Informa UK Ltd., London, July.
Alston, J., M. Anderson, J. James, and P. Pardey. 2010. Persistence Pays: U.S. Agricultural Productivity Growth and the Benefits From Public R&D Spending, New York: Springer.
Animal Pharm Reports. 2007. Animal Pharms’ Top Tier Companies: 2007 Edition, Informa UK Ltd., London, September.
BASF. 2007. BASF Annual Report 2007, BASF SE, D-67056 Ludwigshafen, Germany.
BASF. 2010. BASF Factbook 2010, BASF SE, D-67056 Ludwigshafen, Germany, June.
Bayer. 2008. Bayer Annual Report 2007, Bayer AG, 51368 Leverkusen, Germany, February 28.
Bayer. 2010. Bayer Annual Report 2009, Bayer AG, 51368 Leverkusen, Germany, February 26.
Beintema, Nienke M., and Gert-Jan Stads. 2008. “Measuring Agricultural Research Investments: A Revised Global Picture.” ASTI Background Note, Agricultural Science and Technology Indicators, International Food Policy Research Institute, Washington, DC.
Best, Peter. 2009. “World Feed Panorama,” Feed International, January, pp. 12-15.
CLAAS. 2009. CLAAS 2009 Annual Report, CLAAS KGaA mbH, D-33428 Harsewinkel, Germany.
CNH. 2008. Form 20-F for 2007, CNH Global NV, Amsterdam, Netherlands, March 5.
Cohen, Wesley M., Richard C. Levin, and David C. Mowery. 1987. “Firm Size and R&D Intensity: A Re-Examination,” Journal of Industrial Economics 35, 4 (June): 543-565.
Consultative Group for International Agricultural Research (CGIAR). 2007. Financial Report 2007, CGIAR Secretariat, World Bank.
Context Network. 2007. “Sizing Up the Seed Market,” Seed World, pp. 10-12.
Crosby, Edwin A. 1987. “Private Sector Agricultural Research in the United States,” in Policy for Agricultural Research, V.W. Ruttan and C.E. Pray (eds.), Boulder, CO: Westview Press, pp. 395-409.
Deere & Company. 2007. Annual Report 2007, Moline, IL.
Dow Chemical Co. 2009. Form 10-K, 2020 Dow Center, Midland, MI, February 20.

23 Research Investments and Market Structure in the Food Processing, Agricultural Input, and Biofuel Industries Worldwide: Executive Summary / EIB-90
Economic Research Service/USDA
DSM. 2007. DSM Annual Report 2007, Royal DSM NV, 6401 JH Heerlen, Netherlands.
Dupont. 2008. Dupont 2007 Databook, Wilmington, DE.
Echeverria, Ruben G., Eduardo J. Trigo, and Derek Byerlee. 1996. Institutional Change and Effective Financing of Agricultural Research in Latin America, World Bank Technical Paper No. 330, World Bank.
Economic Report of the President. 2009. U.S. Government Printing Office.
Federal Reserve Bank of St. Louis. Producer Price Indexes, FRED Economic Data, available at: http://research.stlouisfed.org/fred2/categories/31 (accessed September, 2009).
Food and Agricultural Organization of the United Nations (FAO). FAOSTAT database, Rome, Italy, available at: http://faostat.fao.org/ (accessed October, 2010).
Freedonia. 2006. World Agricultural Equipment to 2010, Report Number 2089, Freedonia Group.
Frey, Kenneth J. 1996. National Plant Breeding Study-I: Human and Financial Resources Devoted to Plant Breeding Research and Development in the United States in 1994, Special Report 98, Iowa Agriculture and Home Economics Experiment Station, Iowa State University.
Fuglie, Keith O., Nicole Ballenger, Kelly Day, Cassandra Klotz, Michael Ollinger, John Reilly, Utpal Vasavada, and Jet Yee. 1996. Agricultural Research and Development: Public and Private Investments Under Alternative Markets and Institutions, Agricultural Economic Report 735, U.S. Department of Agriculture, Economic Research Service, available at: www.ers.usda.gov/publications/aer735/
Fuglie, Keith O., and D.E. Schimmelpfennig (eds.). 2000. Public-Private Collaboration in Agricultural Research: New Institutional Arrangements and Economic Implications, Ames, IA: Iowa State University Press.
Fuglie, Keith O. Paul Heisey, John King, Carl E. Pray, Kelly Day-Rubenstein, David Schimmelpfennig, Sun Ling Wang, and Rupa Karmarkar Desmukh. 2011. Research Investments and Market Structure in the Food Processing, Agriculture Input, and Biofuel Industries Worldwide. Economic Research Report 130, U.S. Department of Agriculture, Economic Research Service, December. www. ers.usda.gov/publications/err130/
Genus. 2007. Annual Report and Financial Statements 2007, Genus Plc, Basingstoke, Hampshire, United Kingdom.
Haver Analytics. Commodity Prices, International Financial Statistics. DLX Databases, Haver Analytics, Inc., available through www.haver.com/ (subscription required).

24Research Investments and Market Structure in the Food Processing, Agricultural Input, and Biofuel Industries Worldwide: Executive Summary / EIB-90
Economic Research Service/USDA
Huang, Wen-yuan. 2009. Factors Contributing to the Recent Increase in U.S. Fertilizer Prices, 2002-08, Agricultural Resources Situation and Outlook AR-33, U.S. Department of Agriculture, Economic Research Service, available at: www.ers.usda.gov/publications/ar33/
Huffman, Wallace E., and Robert E. Evenson. 2006. Science for Agriculture: A Long-Term Perspective, 2nd edition. Ames, IA: Iowa State University Press.
International Energy Administration. R&D Statistics, IEA/OECD, Paris, France, available at: http://data.iea.org/ (accessed November 30, 2010).
International Federation for Animal Health. 2007. IFAH Annual Report 2008. Brussels, Belgium, April.
International Seed Federation. Seed Statistics, Nyon, Switzerland, available at: www.worldseed.org/isf/seed_statistics.html (accessed November, 2010).
James, Clive. 1997. Progress in Public-Private Sector Partnerships in International Agricultural Research and Development, ISAAA Briefs No. 4-1997, International Service for the Acquisition of Agri-biotech Applications.
Kalton, R.R., and P.A. Richardson. 1983. “Private Sector Plant Breeding Programs: A Major Thrust in U.S. Agriculture,” Diversity, November-December 16-18.
Kalton, R.R., P.A. Richardson, and N.M. Frey. 1989. “Inputs in Private Sector Plant Breeding and Biotechnology Research Programs in the USA,” Diversity 5, 4: 22-25.
Klotz, Cassandra, Keith O. Fuglie, and Carl E. Pray. 1995. Private Sector Agricultural Research Expenditures in the United States, 1960-1992, Staff Paper AGES-9525, U.S. Department of Agriculture, Economic Research Service.
KWS. 2008. Annual Report 2007/08, KWS SAAT AG, 37555 Einbeck, Germany.
Le Buanec, Bernard. 2007. “Evolution of the Seed Industry During the Past Three Decades,” Seed Testing International, ISTA News Bulletin No. 134, October, pp. 6-10.
Le Buanec, Bernard. 2008. “Evolution of the Seed Industry During the Past 40 Years,” SEED News Magazine XII, No. 4 (July/August).
Levin, Richard C., Wesley M. Cohen, and David C. Mowery. 1985. “R&D Appropriability, Opportunity, and Market Structure: New Evidence on Some Schumpeterian Hypotheses,” American Economic Review 72, 2 (May): 20-24.
Limagrain. 2007. Annual Report 2007, 63720 Chappes, France.
Monsanto. 2009. Monsanto 2009 Annual Report, St. Louis, MO.

25 Research Investments and Market Structure in the Food Processing, Agricultural Input, and Biofuel Industries Worldwide: Executive Summary / EIB-90
Economic Research Service/USDA
Narrod, Clare A., and Keith O. Fuglie. 2000. “Private Investments in Livestock Breeding With Implications for Public Research Policy,” Agribusiness 16: 457-470.
National Science Foundation (NSF). 2010. National Patterns of R&D Resources: 2008 Data Update, NSF 10-314, National Science Foundation, Division of Science Resources Statistics, available at: www.nsf.gov/statistics/nsf10314/
National Science Foundation, Division of Science Resource Studies. Research and Development in Industry, (various issues).
Pardey, Philip G., Nienke Beintema, Steven Dehmer, and Stanley Wood. 2006. Agricultural Research: A Growing Global Divide? Food Policy Report, International Food Policy Research Institute.
Perrin, R.K., K.A. Hunnings, and L.A. Ihnen. 1983. Some Effects of the U.S. Plant Variety Protection Act of 1970, Economic Research Report No. 46, North Carolina State University, Department of Economics and Business, August.
Pharmaceutical Research and Manufacturers of America (annual reports). Pharmaceutical Industry Profile, PhRMA, March.
Pray, Carl E., and Keith O. Fuglie. 2000. “The Private Sector and International Technology Transfer in Agriculture,” in Public-Private Collaboration in Agricultural Research: New Institutional Arrangements and Economic Implications, K.O. Fuglie and D.E. Schimmelpfennig (eds.), Ames, IA: Iowa State University Press, pp. 245-68.
Pray, Carl E., and Keith O. Fuglie. 2001. “Policies for Private Agricultural Research in Asian Developing Countries,” in Tomorrow’s Agriculture: Incentives, Institutions, Infrastructure and Innovations, G.H. Peters and Prabhu Pingali (eds.), Hunts, England: Ashgate.
Pray, Carl E., and Keith O. Fuglie. 2001. Private Investment in Agricultural Research and International Technology Transfer in Asia, Agricultural Economic Report 805, U.S. Department of Agriculture, Economic Research Service, available at: www.ers.usda.gov/publications/aer805/aer805/
Pray, Carl E., Keith O. Fuglie, and Daniel K.N. Johnson. 2007. “Private Agricultural Research,” in Handbook of Agricultural Economics, Vol. 3, R.E. Evenson and Prabhu Pingali (eds.), Amsterdam: Elsevier, pp. 2607-2645.
Ruttan, Vernon W. 1982. Agricultural Research Policy, Minneapolis: University of Minnesota Press.
Scherer, F.M., and David Ross. 1990. Industrial Market Structure and Economic Performance, 3rd edition, Boston: Houghton Mifflin.

26Research Investments and Market Structure in the Food Processing, Agricultural Input, and Biofuel Industries Worldwide: Executive Summary / EIB-90
Economic Research Service/USDA
Syngenta. 2008. Syngenta Financial Report 2007, Syngenta International AG, Basel, Switzerland, February.
Syngenta. 2010. Syngenta Financial Report 2009, Syngenta International AG, Basel, Switzerland, February.
U.S. Department of Agriculture, (USDA). 2000. Inventory of Agricultural Research, Current Research Information System, National Institute for Food and Agricultural Research.
U.S. Department of Agriculture (USDA). 2007. Inventory of Agricultural Research, Current Research Information System.
U.S. Department of Agriculture, Economic Research Service (USDA/ERS). Agricultural Research Funding in the Public and Private Sectors, Agricultural Research and Productivity Briefing Room, available at www.ers.usda.gov/data/agresearchfunding/
U.S. Department of Agriculture, National Agricultural Statistics Service (USDA/NASS). Agricultural Prices (various annual issues).
Wilcke, H.G., and J.L. Williamson. 1977. A Survey of U.S. Agricultural Research by Private Industry, Agricultural Research Institute.
World Bank. World Development Indicators Databank, World Bank, available at http://data.worldbank.org/data-catalog/world-development-indicators
Copyright © 2022 FDOKUMEN

