


Bahasa
Halaman
Hukum


doi:10.1182/blood-2008-01-130146Prepublished online February 4, 2008;2008 111: 3675-3683
Raghavachari, Peter J. Munson, Thomas M. Herndon, Jichun Chen and Neal S. YoungXingmin Feng, Sachiko Kajigaya, Elena E. Solomou, Keyvan Keyvanfar, Xiuli Xu, Nalini CD4+CD25highFOXP3+ regulatory T cells in vitroRabbit ATG but not horse ATG promotes expansion of functional
http://bloodjournal.hematologylibrary.org/content/111/7/3675.full.htmlUpdated information and services can be found at:
(5019 articles)Immunobiology �Articles on similar topics can be found in the following Blood collections
http://bloodjournal.hematologylibrary.org/site/misc/rights.xhtml#repub_requestsInformation about reproducing this article in parts or in its entirety may be found online at:
http://bloodjournal.hematologylibrary.org/site/misc/rights.xhtml#reprintsInformation about ordering reprints may be found online at:
http://bloodjournal.hematologylibrary.org/site/subscriptions/index.xhtmlInformation about subscriptions and ASH membership may be found online at:
Copyright 2011 by The American Society of Hematology; all rights reserved.Washington DC 20036.by the American Society of Hematology, 2021 L St, NW, Suite 900, Blood (print ISSN 0006-4971, online ISSN 1528-0020), is published weekly
For personal use only. by guest on June 1, 2013. bloodjournal.hematologylibrary.orgFrom

IMMUNOBIOLOGY
Rabbit ATG but not horse ATG promotes expansion of functionalCD4�CD25highFOXP3� regulatory T cells in vitroXingmin Feng,1 Sachiko Kajigaya,1 Elena E. Solomou,1 Keyvan Keyvanfar,1 Xiuli Xu,2 Nalini Raghavachari,2
Peter J. Munson,3 Thomas M. Herndon,1 Jichun Chen,1 and Neal S. Young1
1Hematology Branch, National Heart, Lung, and Blood Institute (NHLBI), National Institutes of Health (NIH), Bethesda, MD; 2Genomics Core Facility, Pulmonaryand Vascular Medicine Branch, NHLBI, NIH, Bethesda, MD; and 3Mathematical and Statistical Computing Laboratory, Division of Computational Bioscience,Center for Information Technology, NIH, Bethesda, MD
Regulatory T cells (Treg) play importantroles in suppressing immune responsesand maintaining tolerance. Rabbit antithy-mocyte globulin (rATG) and horse ATG(hATG) are widely used in the treatment ofimmune-mediated syndromes, but theireffects on Treg are unknown. We showhere that in vitro culture of normal humanperipheral blood mononuclear cells(PBMCs) with a low-dose rATG resultedin marked expansion of functional Tregby converting CD4�CD25� T cells toCD4�CD25� T cells. hATG did not expand
but rather decreased Treg. Immuno-blot showed increased expression ofFOXP3 and NFAT1 in CD4�CD25� andCD4�CD25� T cells exposed to rATG.PBMCs treated with rATG displayed in-creased interleukin-10 in culture superna-tants than those treated with hATG. Fur-thermore, rATG and hATG showeddifferences in their potential to stimulateCD4� T cells as examined using differentactivation markers. Microarray revealedthat rATG induced markedly differentgene-expression patterns in PBMCs, com-
pared with hATG-treated or untreatedPBMCs. Our findings indicate that rATGexpanded Treg, probably through tran-scriptional regulation by enhanced NFAT1expression, in turn conferring CD4�CD25�
T cell FOXP3 expression and regulatoryactivity. The therapeutic effects of rATGmay occur not only because of lympho-cyte depletion but also enhanced Tregcell number and function. (Blood. 2008;111:3675-3683)
Introduction
Regulatory T cells (Tregs) are implicated in the suppression ofimmune responses and the maintenance of tolerance.1-3 Tregsare characterized by the surface expression of CD4 and theinterleukin-2 (IL-2) receptor (CD25); a member of the forkheadfamily of transcription factors, FOXP3, is expressed in the nuclei ofhuman and murine CD4�CD25� Treg, especially in humanCD4�CD25high populations. FOXP3 acts as a master regulator forcytokine production and is necessary for cell-cell contact-dependent inhibition of effector T-cell activation by Treg.4-6
FOXP3 expression is required for Treg development and conferssuppressive function on peripheral CD4�CD25� Tregs.7 Micelacking the nuclear factor of activated T cells (NFAT1) showed anenhanced immune response, with a tendency toward the develop-ment of a late Th2-like response.8 Recent studies indicate thatNFAT1 induces FOXP3 expression by binding to its promoter,9 andFOXP3 controls Treg function through cooperation with NFAT1.10
Treg numbers are deficient in patients with active systemiclupus erythematosus11 and type 1 diabetes.12 In patients withautoimmune hepatitis, Tregs are depleted and FOXP3 expression isdecreased.13 Patients undergoing stem-cell transplantation have alow risk of developing graft-versus-host disease (GVHD) if theTreg graft content is high.14 In patients with multiple sclerosis,although Treg numbers are consistent with those in healthyindividuals, there is a marked decrease in their effector function.15
We have recently reported that CD4�CD25highFOXP3� Tregs aredecreased in most patients with aplastic anemia (AA).16 CD4�
Tregs tend to be decreased in low-risk myelodysplastic syndrome(MDS) patients but increased in high-risk MDS patients andcorrelated with progression to aggressive subtypes of the disease.17
There is evidence that Tregs have the ability to prevent thedevelopment of autoimmune diseases,18 tumor immunity,19 graftrejection,20 and GVHD21 in mouse models. In these animal models,transfer of Tregs can prevent the autoimmune phenotype thatdevelops after Treg depletion. Infusion of Tregs in a minor antigenH60-mediated AA mice model aborted H60-specific T-cell expan-sion and prevented bone marrow destruction.22
Immunosuppressive drugs, such as antithymocyte globulin(ATG) and cyclosporin A (CsA), are widely used to prevent or treatacute graft rejection in organ transplantation,23 in conditioning fortransplantation, and for the treatment of AA and other autoimmunediseases, and GVHD.24 Because of the important roles of Treg indisease pathophysiology and treatment, the effects of these immu-nosuppressive drugs on the function or expansion of Treg might beclarified. ATG is a purified IgG fraction of sera from rabbits orhorses that have been immunized with human thymocytes or T-celllines. ATG depletes peripheral lymphocytes from the circulatingpool through complement-dependent lysis or activation-associatedapoptosis,23,25 but its effect on Treg has not been fully elucidated.
In this study, we demonstrate that rabbit ATG (rATG) selec-tively expanded functional CD4�CD25� FOXP3� Tregs in vitro.In contrast, horse ATG (hATG) and CsA decreased CD4�CD25�
T cells and CD4�CD25� FOXP3� Tregs. rATG expanded Tregs by
Submitted December 28, 2007; accepted February 1, 2008. Prepublished online asBlood First Edition paper, February 4, 2008; DOI 10.1182/blood-2008-01-130146.
S.K. and E.E.S. contributed equally to this work.
The publication costs of this article were defrayed in part by page chargepayment. Therefore, and solely to indicate this fact, this article is herebymarked ‘‘advertisement’’ in accordance with 18 USC section 1734.
3675BLOOD, 1 APRIL 2008 � VOLUME 111, NUMBER 7
For personal use only. by guest on June 1, 2013. bloodjournal.hematologylibrary.orgFrom

converting CD4�CD25� T cells into CD4�CD25�FOXP3� T cellslikely through enhanced NFAT1 expression.
Methods
Immunosuppressive drugs and control antibodies
rATG (Thymoglobulin; Genzyme, Cambridge, MA), hATG (ATGAM;Pharmacia & Upjohn, Kalamazoo, MI), and CsA (Sigma-Aldrich, St Louis,MO) were tested in this study; rabbit IgG (rIgG) and horse IgG (hIgG)(Santa Cruz Biotechnology, Santa Cruz, CA) were used as controlantibodies.
Isolation of cells
Heparinized blood samples from 10 healthy volunteers were collected afterinformed consent under a protocol approved by the Institutional ReviewBoard of National Heart, Lung, and Blood Institute of Health (NHLBI).Peripheral blood mononuclear cells (PBMCs) were isolated by standardFicoll density gradient centrifugation. CD4�, CD4�CD25�, or CD4�CD25�
T cells were isolated by the CD4�CD25� T cell isolation kit (MiltenyiBiotec, Auburn, CA) as previously described.16 The purity of eachpopulation was 95% to 97% by flow cytometry.
Cell culture
PBMCs (106/mL) from healthy individuals were incubated with rATG,hATG, rIgG, or hIgG (each at 10 �g/mL, unless otherwise indicated) andCsA (1.0 �g/mL) in RPMI 1640 medium supplemented with 10%heat-inactivated fetal calf serum at 37°C, 95% humidity, and 5% CO2 for24 hours or indicated durations (5-72 hours). Supernatants were collectedfor cytokine detection. Cells were collected for flow cytometry or Westernblotting as described below.
Flow cytometry
Cells were harvested after culture in the presence of immunosuppressivebiologics and drugs. Briefly, the cells were first stained with antihumanCD4-fluorescein isothiocyanate (FITC) and CD25-phycoerythrin (PE)(eBioscience, San Diego, CA), washed, resuspended in 1 mL cold Fix/Permbuffer (eBioscience), and incubated at 4°C for 1 hour. After washing with2 mL of permeabilization buffer (eBioscience), cells were blocked with 2%normal rat serum for 15 minutes. Antihuman FOXP3-allophycocyanin(APC; PCH101; eBioscience) was added and cells were incubated at 4°Cfor another 30 minutes in the dark. Finally, cells were washed with 2 mLpermeabilization buffer and analyzed on the FC 500 Flow Cytometer(Beckman Coulter, Fullerton, CA) using the CXP software (BD Bio-sciences, San Jose, CA).
Apoptosis induction by different immunosuppressive drugs at variousconcentrations was detected by staining with annexin V-FITC (BD Phar-Mingen, San Diego, CA), according to the manufacturer’s instructions,followed by flow cytometry.
To compare the binding of rATG and hATG to lymphocytes, 106
PBMCs in 1 mL of phosphate-buffered saline (PBS) were incubated withrATG or hATG (each at 10 �g/mL, or indicated concentrations) for30 minutes at 4°C, washed twice with PBS, and stained with anti–rIgG-FITC or anti–hIgG-FITC (GeneTex, San Antonio, TX); these 2 secondantibodies were stated to have similar binding affinity to IgG by theirmanufacturer (3.5 and 3.7 mol FITC per mol IgG, respectively). Incomparing the blocking capacity of rATG and hATG to surface antigens,106 PBMCs in 100 �L PBS were incubated with 10 �g rATG or hATG for60 minutes at 4°C, washed with PBS, stained with antihuman CD3-APC,antihuman T-cell receptor (TCR)��-FITC, antihuman CD4-APC-Cy7(eBiosciences), and antihuman CD28-PE (Beckman Coulter), respectively,followed by flow cytometry. To evaluate activation of T cells after rATG orhATG exposure for 24 hours, PBMCs were stained with antihumanCD4-FITC, combined with antihuman glucocorticoid-induced TNF recep-tor (GITR)-PE, or antihuman cytotoxic T lymphocyte–associated antigen-4
(CTLA-4)-PE (e-Bioscience), respectively. Intracellular staining of CTLA-4was performed as for FOXP3 staining as described above.
Enzyme-linked immunosorbent assay
Cytokines were measured using the Human Th1/Th2 ELISA kit (eBio-science) according to the manufacturer’s instructions. Briefly, IL-2, IL-4,IL-10, or INF-� in the supernatants was captured by specific primarymonoclonal antibody (mAb) precoated on a plate and detected by horserad-ish peroxidase-labeled secondary mAbs. Plates were read at 450 nm usingthe ELISA reader (PerkinElmer Life and Analytical Sciences, Waltham,MA). Recombinant cytokines were used as standards as recommended bythe manufacturer. Samples and standards were tested in duplicate.
Western blotting
Nuclear or cytoplasmic proteins were extracted from treated or untreatedcells as previously described26 and subject to Western blotting to detectFOXP3 and NFAT1 expression. Protein concentration was determinedusing the Micro-BCA protein assay kit (Pierce, Rockford, IL). Equalamounts (5 �g) of proteins were electrophoresed on 4% to 20% SDS-polyacrylamide gel and transferred onto polyvinylidene fluoride mem-branes. FOXP3 and NFAT1 were immunodetected with mouse antihumanFOXP3 mAb (BioLegend, San Diego, CA) and anti-NFAT1 mAb (BDTransduction Laboratories, San Jose, CA), followed by incubation withalkaline-phosphatase-conjugated antimouse IgG, which was included in theWesternBreeze Chemiluminescent kit (Invitrogen, Carlsbad, CA). AntiactinmAb (Santa Cruz) was used as an internal control.
Carboxyfluorescein diacetate succinimidyl ester labeling
To confirm the effect of rATG on the proliferation of CD4�CD25� T cells,CD4�CD25� T cells were isolated from PBMCs using microbeads andlabeled with 1 �M carboxyfluorescein diacetate succinimidyl ester (CFSE;Invitrogen), then cultured with rATG or hATG. Soluble CD3/CD28 mAb(each at 1.0 �g/mL) and rIgG were used as positive controls and negativecontrols, respectively. Five days later, cells were stained with antihumanCD25-PE. Cell division was analyzed by flow cytometry according toCFSE dilution.
Treg function
T-cell proliferation was assessed by BrdU incorporation using the ELISAcolorimetric assay kit (Roche Diagnostics, Indianapolis, IN). Briefly,PBMCs were treated with rATG, hATG, or CsA for 24 hours, washed, andcultured at a 1:1 ratio with autologous PBMCs (responder) in the presenceof 1 �g/mL soluble anti-CD3 (HIT3a; BD PharMingen) and 1 �g/mLsoluble anti-CD28 (CD28.2; BD PharMingen). After culture for 3 days,cells were pulsed with BrdU and evaluated for its incorporation accordingto the manufacturer’s instructions. Results are expressed as the percentagedetermined by comparing proliferation induced by rATG or hATG toresponder PBMCs stimulated with CD3/CD28 mAb alone. To confirmspecific inhibition of the T-cell response by rATG-expanded Tregs,CD4�CD25� T cells were isolated from rATG-treated PBMCs usingmicrobeads and added at different ratios to CD3/CD28-mAb sti-mulated autologous PBMCs (responder). Inhibition of proliferation wasevaluated in the same way as unisolated rATG- or hATG-treated PBMCs asdescribed above.
RNA preparation and microarray assay
To analyze different gene expression patterns of PBMCs treated with rATGor hATG, microarray was performed as described previously.27 PBMCsfrom 3 healthy controls were cultured with or without rATG or hATG for24 hours, and total RNA was extracted with the RNeasy kit (Qiagen,Valencia, CA). RNA purity was assessed by spectrophotometry. Probeswere prepared using standard Affymetrix protocols and hybridized toAffymetrix HG-U133A 2.0 arrays (Affymetrix, Santa Clara, CA). Theprimary CEL files have been deposited in the public repository Gene
3676 FENG et al BLOOD, 1 APRIL 2008 � VOLUME 111, NUMBER 7
For personal use only. by guest on June 1, 2013. bloodjournal.hematologylibrary.orgFrom

Expression Omnibus (GEO; http://www.ncbi.nlm.nih.gov/geo/) with theseries record (GSE10040).
Statistical analysis of microarray and other data
Primary expression analysis was conducted with the Affymetrix GeneChipOperating System, version 1.4 client software. Expression data weretransformed using a variance stabilizing, quantile normalized functiontermed “S10.” Comparative analysis between expression profiles forsamples with or without treatments was carried out using MSCL Analyst’sToolbox developed by some of us for the JMP statistical software package(http://abs.cit.nih.gov/geneexpression.html; SAS Institute, Cary, NC).A 2-way analysis of variance for time and treatment was used to deriveP values for each probe set. False discovery rates (FDRs) were calculatedand probes having less than 10% FDR were selected for further analysis.Fold changes in response to treatment were calculated as differences ofmean S10 values for each treatment category. When multiple probe sets fora single gene were available, data were summarized by selecting the mostextreme probe set fold-change. Hierarchical cluster analysis was computedusing the Ward’s method based on deviation of S10 expression values fromthe mean. Gene ontology analysis was performed using the DAVIDBioinformatics Resources 2007 (http://david.abcc.ncifcrf.gov/).
The unpaired t test (Prism Software, San Diego, CA) was used forstatistical analysis in flow cytometry data and ELISA data. Differences wereconsidered to be significant at P less than .05.
Results
Optimization of rATG dose and duration for the treatmentof PBMCs
To determine the optimal duration of rATG exposure for expansionof Treg, 106 PBMCs were cultured with 10 �g/mL rIgG or rATGfor 5, 24, 48, and 72 hours. The percentage of CD4�CD25high andCD4�CD25highFOXP3� T cells was measured by flow cytometry.As shown in Figure 1A, the percentage of CD4�CD25high andCD4�CD25highFOXP3 T cells peaked at the 24-hour point andthen decreased.
The optimal concentration of rATG for expansion of Treg wasdetermined by culturing of 106 PBMCs with 1, 2, 5, 10, 20, 50, and100 �g/mL rIgG or rATG for 24 hours. The percentage ofCD4�CD25high or CD4�CD25highFOXP3� T cells among lympho-cytes was determined by flow cytometry. Both CD4�CD25high andCD4�CD25highFOXP3� T cells showed a dose-dependent increaseat 1 to 50 �g/mL rATG concentrations. Exposure to concentrationas high as 100 �g/mL rATG did not enhance but decreased thepercentage of CD4�CD25high and CD4�CD25highFOXP3� T cells.rIgG treatment at different concentrations had no effect on theproportions of CD4�CD25high and CD4�CD25highFOXP3� T cells(Figure 1B).
PBMCs were exposed to rIgG, rATG, hIgG, hATG, or CsA atdifferent concentrations for 24 hours. Apoptotic cells were detectedby flow cytometry using annexin V staining. Low-dose rATG(10 �g/mL) induced little apoptosis similar to no treatment(medium alone), and rIgG, or hIgG treatment, but at 50 �g/mL orhigher doses, rATG and hATG induced apoptosis in lymphocytes(Figure 1C). Because the percentage of CD4�CD25highFOXP3�
T cells was stable and there was little apoptosis induction withrATG at 10 �g/mL and 24 hours of incubation, we selected theseconditions for our experiments.
Expansion of Tregs with rATG
We compared the effects of immunosuppressive drugs on Tregexpansion in vitro. Figure 2 shows representative flow cytometric
results (Figure 2A) and a summary of the results from all theexperiments performed (Figure 2B). rATG treatment significantlyincreased both the proportion and absolute numbers ofCD4�CD25highFOXP3� T cells in lymphocytes and dramatically
Figure 1. Optimization of duration and rATG dose for treatment of PBMCs.(A) Kinetics of Treg expansion in PBMCs treated with rATG. (B) Dose-response ofrATG in expansion of Tregs and percentages of CD4�CD25high T cells andCD4�CD25highFOXP3� T cells are shown. (C) Apoptosis of lymphocytes induced withrATG, rIgG, hATG, hIgG, or CsA. Each data point represents a mean plus or minusSEM of 3 independent experiments.
EXPANSION OF Tregs WITH RABBIT ATG 3677BLOOD, 1 APRIL 2008 � VOLUME 111, NUMBER 7
For personal use only. by guest on June 1, 2013. bloodjournal.hematologylibrary.orgFrom
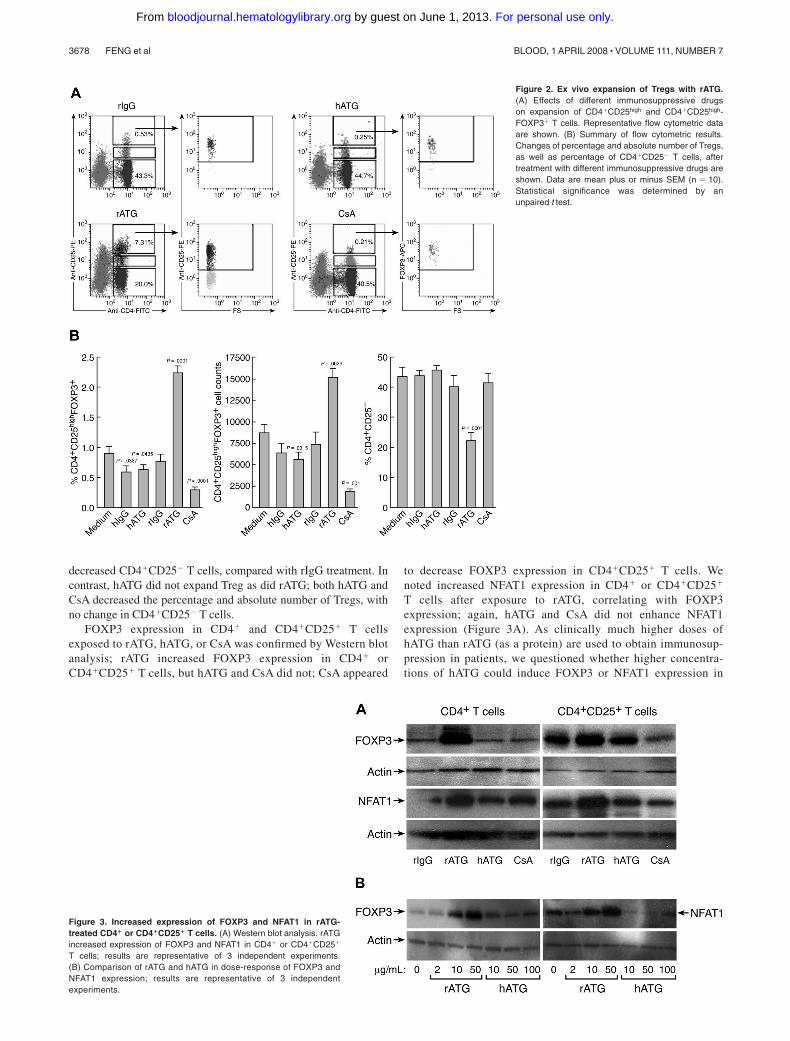
decreased CD4�CD25� T cells, compared with rIgG treatment. Incontrast, hATG did not expand Treg as did rATG; both hATG andCsA decreased the percentage and absolute number of Tregs, withno change in CD4�CD25� T cells.
FOXP3 expression in CD4� and CD4�CD25� T cellsexposed to rATG, hATG, or CsA was confirmed by Western blotanalysis; rATG increased FOXP3 expression in CD4� orCD4�CD25� T cells, but hATG and CsA did not; CsA appeared
to decrease FOXP3 expression in CD4�CD25� T cells. Wenoted increased NFAT1 expression in CD4� or CD4�CD25�
T cells after exposure to rATG, correlating with FOXP3expression; again, hATG and CsA did not enhance NFAT1expression (Figure 3A). As clinically much higher doses ofhATG than rATG (as a protein) are used to obtain immunosup-pression in patients, we questioned whether higher concentra-tions of hATG could induce FOXP3 or NFAT1 expression in
Figure 2. Ex vivo expansion of Tregs with rATG.(A) Effects of different immunosuppressive drugson expansion of CD4�CD25high and CD4�CD25high-FOXP3� T cells. Representative flow cytometric dataare shown. (B) Summary of flow cytometric results.Changes of percentage and absolute number of Tregs,as well as percentage of CD4�CD25� T cells, aftertreatment with different immunosuppressive drugs areshown. Data are mean plus or minus SEM (n � 10).Statistical significance was determined by anunpaired t test.
Figure 3. Increased expression of FOXP3 and NFAT1 in rATG-treated CD4� or CD4�CD25� T cells. (A) Western blot analysis. rATGincreased expression of FOXP3 and NFAT1 in CD4� or CD4�CD25�
T cells; results are representative of 3 independent experiments.(B) Comparison of rATG and hATG in dose-response of FOXP3 andNFAT1 expression; results are representative of 3 independentexperiments.
3678 FENG et al BLOOD, 1 APRIL 2008 � VOLUME 111, NUMBER 7
For personal use only. by guest on June 1, 2013. bloodjournal.hematologylibrary.orgFrom

vitro. We assayed different concentrations of rATG or hATG fortheir effects on FOXP3 and NFAT1 expression in CD4� T cells:rATG increased FOXP3 and NFAT1 expression in a dose-dependent fashion, but hATG was without such activity even at100 �g/mL (Figure 3B).
Conversion of CD4�CD25� T cells into CD4�CD25� T cells with rATG
Because rATG increased the number of CD4�CD25� T cells anddecreased the percentage of CD4�CD25� T cells, we speculatedthat CD4�CD25� T cells were converted into CD4�CD25� T cells.To prove this hypothesis, we isolated CD4�CD25� T cells fromPBMCs using microbeads to a purity of approximately 97%.Isolated cells were incubated with rIgG, rATG, hATG, or CsA for24 hours, and the cells were assessed by flow cytometry to detectCD25 and FOXP3 expression. rATG treatment converted someCD4�CD25� T cells into CD4�CD25� T cells, which expressedFOXP3. rIgG, hATG, or CsA neither converted CD4�CD25�
T cells into CD4�CD25� T cells nor induced FOXP3 expression(Figure 4A). Western blotting showed that there was no FOXP3expression and only weak expression of NFAT1 in untreatedCD4�CD25� T cells; although rATG treatment greatly increasedexpression of FOXP3 and NFAT1 (Figure 4B), theseeffects were not seen with hATG or CsA, consistent with theflow cytometric data.
To clarify how rATG affected the proliferation of CD4�CD25�
T cells, we labeled CD4�CD25� T cells with CFSE, a dye used totrack cell proliferation, and incubated them with rATG for 5 days.Cell divisions were analyzed by flow cytometry. Control rIgGtreatment did not cause cells to proliferate. We estimated by dyedilution that rATG promoted CD4�CD25� T cells to undergoapproximately 5 cycles of division, similar to a positive control thatwas stimulated with CD3/CD28 mAb. hATG did not promote cellproliferation (Figure 4C). When rATG-treated CD4�CD25� T cellswere assessed based on expression of CD25, the convertedCD4�CD25� T cells showed much higher proliferation than didunconverted CD4�CD25� T cells (Figure 4D).
Binding of rATG and hATG to mononuclear cells
We compared the binding of rATG and hATG to lymphocytes.After incubating PBMCs with 10 �g/mL rATG or hATG for30 minutes, the antirabbit IgG-FITC intensity of rATG-treatedlymphocytes was much higher than the antihorse IgG-FITCintensity on lymphocytes treated with hATG (Figure 5A); theantirabbit IgG-FITC reached saturation on increasing the concentra-tion of rATG to 50 �g/mL, whereas the antihorse IgG-FITCreached saturation at 100 �g/mL hATG (data not shown). Weinferred that qualitatively rATG showed more binding to mono-nuclear cells than did hATG. The surface antigens CD3, TCR��,CD28, and CD4 on lymphocytes were then measured on rATG- andhATG-treated lymphocytes. rATG blocked CD3 and TCR�� moreeffectively than did hATG. Both rATG and hATG blocked CD4slightly but did not affect binding of CD28 (Figure 5B), suggestingthat rATG contained more antibodies to CD3 and to TCR�� thandid hATG.
To determine whether rATG and hATG treatment activated CD4�
T cells, we measured expression of T-cell activation markers such asGITR and CTLA-4 on CD4� T cells after treatment. rATG inducedhigher expression of GITR and CTLA-4 in CD4� T cells than did hATGand no treatment (Figure 5C). These data indicated that rATG indeedactivated CD4� T cells, but hATG did not have this effect.
Figure 4. Effects of rATG treatment on CD4�CD25� T cells. (A) rATG convertedCD4�CD25� T cells to CD4�CD25� T cells and conferred FOXP3 expression;representative flow cytometric results are shown. (B) Increased FOXP3 and NFAT1expression in CD4�CD25� T cells with rATG detected by Western blotting; results arerepresentative of 3 independent experiments. (C) Proliferation of CD4�CD25� T cellspromoted with rATG. CFSE intensity was used to evaluate the proliferation. CD3/28mAb stimulation or rIgG treatment was used as a positive or negative control,respectively. Results are representative of 3 independent experiments. (D) CFSEdilution in rATG-treated CD4�CD25� T cells was evaluated based on expression ofCD25; results are representative of 3 independent experiments.
EXPANSION OF Tregs WITH RABBIT ATG 3679BLOOD, 1 APRIL 2008 � VOLUME 111, NUMBER 7
For personal use only. by guest on June 1, 2013. bloodjournal.hematologylibrary.orgFrom

Secretion of cytokines after rATG treatment
To clarify the roles of cytokines in the expansion of Tregs withrATG, we assayed secreted cytokines in the supernatants ofPBMCs exposed for 24 hours to rATG, hATG, or CsA byELISA. rATG treatment of PBMCs induced significantlyhigher levels of IL-10 secretion than did untreated PBMCs(27.6 � 6.5 pg/mL vs 3.7 � 0.8 pg/mL, n � 5, P .001);hATG (3.02 � 0.4 pg/mL, n � 5) or CsA (4.5 � 0.8 pg/mL,n � 5) treatment did not affect IL-10 secretion. Both hATG(26.5 � 10.2 pg/mL, n � 7) and rATG (22.9 � 8.1 pg/mL,n � 7) induced INF-� secretion, but these levels were notstatistically different compared with untreated PBMCs(7.6 � 1.2 pg/mL, n � 7, vs hATG, P � .08; vs rATG, P � .093).IL-2 and IL-4 were undetectable in all supernatants examined.
rATG-expanded Tregs are functional
Although rATG treatment expanded T cells with characteristics ofTreg, based on the CD25 surface phenotype and intracellularFOXP3 expression, we wished to examine whether these cells werefunctional. We incubated PBMCs with rATG, hATG, or CsA for24 hours, then cultured them at a 1:1 ratio with CD3/CD28mAb-stimulated autologous PBMCs (105) for 3 days. A prolifera-tive response was measured by BrdU incorporation. rATG-expanded T cells inhibited autologous T-cell proliferation on TCRstimulation (Figure 6A), suggesting that expanded Tregs withrATG were indeed active. hATG- or CsA-treated cells did notinhibit a T-cell response. When we isolated CD4�CD25� T cellsfrom rATG-treated PBMCs and added them to CD3/CD28 mAb-stimulated autologous PBMCs at various ratios, inhibition of T-cellproliferation with Tregs was dose-dependent (Figure 6B).
Comparison of gene expression in PBMCs treated with rATGor hATG
We used microarray analysis to compare gene expression patternsof PBMCs treated with rATG or hATG to untreated. Fold changeswere compared using 2-way analysis of variance tests for un-treated, rATG- and hATG-treated PBMCs. In PBMCs treated with10 �g/mL rATG, compared with untreated PBMCs, 401 genesshowed up-regulation and 165 genes showed down-regulation at24 hours using 10% FDR and 2-fold change cutoff (Figure 7A).A striking finding was that 10 �g/mL hATG had affected muchfewer genes than did rATG: only 96 genes were up-regulated and35 genes were down-regulated at 24 hours in hATG-treatedPBMCs. When we compared rATG with hATG, rATG up-regulated232 genes and down-regulated 71 genes. These genes belong to thecategories of immune response (77 genes), cytokine-cytokinereceptor interaction (32 genes), regulation of cell proliferation(24 genes), cell cycle (23 genes), cell growth (8 genes), apoptosis(30 genes), and others. To confirm whether the differences betweenrATG and hATG resulted from insufficient dose of hATG, weperformed another microarray assay using 2.5 or 40 �g/mL rATG-or hATG-treated PBMCs and compared them with untreatedPBMCs (Figure 7B). Although we increased the concentration to40 �g/mL, the gene expression pattern in hATG-treated PBMCswas still much different from that in rATG-treated PBMCs, even atthe lowest dose 2.5 �g/mL of rATG, but remained similar tountreated PBMC, implying that different doses are not the mainreasons for the differences between rATG and hATG. In accor-dance with our flow cytometry, Western blotting, and ELISAresults, microarray also showed more increased expression of
Figure 5. Different binding activities between rATG and hATG. (A) Differentbinding of rATG and hATG to lymphocytes evaluated by intensity of antirabbitIgG-FITC and antihorse IgG-FITC. Untreated PBMCs were used as a negativecontrol. Data are derived from lymphocyte gate. Results are representative of3 independent experiments. (B) Blocking capacity for known cell surface antigens,CD3, TCR��, CD4, and CD28, of lymphocytes with rATG or hATG. Data are derivedfrom the lymphocyte gate; untreated PBMCs stained with corresponding surfaceantigens were used as a positive control. Mouse IgG conjugated with the correspond-ing fluorochrome was used as an isotype control. Results show representative of3 independent experiments. (C) Different activation states of CD4� T cells inducedwith rATG or hATG. GITR and CTLA-4 were used to evaluate activation. UntreatedPBMCs were used as a control; mouse IgG conjugated with PE was used as anisotype control; results are representative of 3 independent experiments.
3680 FENG et al BLOOD, 1 APRIL 2008 � VOLUME 111, NUMBER 7
For personal use only. by guest on June 1, 2013. bloodjournal.hematologylibrary.orgFrom

CD25, CTLA-4, and IL-10 in rATG-treated PBMCs compared withhATG-treated PBMCs. Other activation markers, such as CD40L,CD69, and CD59, were also increased, confirming activation ofPBMCs with rATG. More detailed analysis of microarray results isunder development.
Discussion
Recent studies indicate that T cells with regulatory function mayarise in the periphery on conversion of CD4�CD25� T cells intoCD4�CD25� Treg through FOXP3 gene induction, in responseto a variety of stimuli, including prostaglandin E2,28 IL-10/TGF-�,29 and CD3 mAb,30 and several immunosuppressive drugs,such as rapamycin31 and FK778.32 Lopez et al first reported thatin vitro culture of human PBMCs in the presence of rATGresulted in expansion of CD4�CD25� T cells,33 but no mecha-nism was described nor was information concerning hATG
provided. Our data are in agreement with Lopez et al33 with thefurther unexpected finding that hATG did not act to expandTregs. Even at high doses and using different lots, hATG failedto increase the number of CD4�CD25highFOXP3� T cells byflow cytometry (data not shown) or to enhance FOXP3 expres-sion by Western blotting. The cytokine secretion profile inducedby rATG was IL-10�, IL-4�, IL-2�/�, and INF-��. IL-10 is anessential molecule for the suppressive function of Treg andexpanded Tregs belong to Treg type I (Tr1).34 Thus, rATG mayinduce expansion of Tr1 rather than of preexisting CD4�CD25�
T cells. Concordant with increased or acquired FOXP3 expres-sion on rATG exposure, NFAT1 expression in CD4�CD25� orCD4�CD25� T cells also rose. NFAT1 is important in control-ling FOXP3 expression9 and, thus, the function of Treg bycooperation with FOXP3.10 Our findings suggest that rATGacted to expand Tregs by a mechanism of transcriptionalregulation, leading to enhanced NFAT1 expression. We recentlyhave reported low Treg cell numbers in most AA patients; bothFOXP3 and NFAT1 expression in Tregs was also decreased inthese clinical samples, compared with healthy donors. Transfec-tion of FOXP3-deficient CD4�CD25� T cells from AA patientswith a plasmid encoding wild-type NFAT1 resulted in increasedFOXP3 expression in these cells; conversely, knockdown ofNFAT1 in normal CD4�CD25� T cells decreased FOXP3expression.16
rATG targets a broad range of T-cell surface antigens,including CD2, CD3, CD4, CD8, CD25, CD45, T-cell receptor,and CD154 (CD40L).35 The main mechanism of ATG action isthought to be depletion of peripheral T lymphocytes from thecirculation through complement-dependent lysis or activation-associated apoptosis.23,25 In cynomolgus monkeys, ATG-
Figure 6. Functional capacity of rATG-expanded Tregs. (A) Proliferation ofPBMCs inhibited by rATG-expanded T cells was measured by the BrdU incorporationELISA method. (B) CD4�CD25� T cells isolated from rATG-treated PBMCs inhibitedT-cell response in a dose-dependent manner. Results are expressed as thepercentage determined by comparing proliferation induced by rATG or hATG toresponder PBMCs stimulated with CD3/CD28 mAb alone. Bars represent mean plusor minus SD of 3 separate experiments.
Figure 7. Gene expression of PBMCs treated with rATG or hATG. Differentialexpression in PBMCs relative to mean expression level for 852 probe sets havinggreater than 2-fold change in response to 10 �g/mL rATG compared with control andless than a 10% false discovery rate. Red and blue indicate up- or down-regulation,respectively. Probe sets ordered according to a hierarchical clustering. (A) Geneexpression patterns from treatment with rATG or hATG at 10 �g/mL. (B) Dose-response of rATG or hATG. Expression patterns were derived from 3 healthy donorsand generated using Affymetrix HG-U133A 2.0 oligonucleotide GeneChips.
EXPANSION OF Tregs WITH RABBIT ATG 3681BLOOD, 1 APRIL 2008 � VOLUME 111, NUMBER 7
For personal use only. by guest on June 1, 2013. bloodjournal.hematologylibrary.orgFrom

mediated depletion of T cells was observed in the spleen and thelymph nodes as well as in peripheral blood, where depletion ofboth CD4� and CD8� T cells was dependent on the dose ofrATG.36 Thus, ATG causes T-cell depletion beyond circulatinglymphocytes to secondary lymphoid tissues. In the currentexperiments, rATG at less than 50 �g/mL induced similarapoptosis as did medium, but significant cell killing was inducedat higher concentrations. Depletion of T cells by apoptosis maynot contribute to the mechanism of ATG at lower concentrations.In our experiments and those of Lopez et al,33 in vitroTreg-expansion effect of rATG occurred at submitogenic levels( 50 �g/mL) rather than at lymphocyte depletion concentra-tions. Although the serum level of rATG ranges between 50 and100 �g/mL clinically,24 tissue levels, including those achievedin the marrow microenvironment and thymus, may be lower, andexpansion of Tregs might take place in these lymphoid tissues.In 2 recent studies using a murine model, rabbit antimurinethymocyte globulin (mATG) induced Tregs with suppressiveactivity, which functioned in vivo to protect against acuteGVHD. In vitro, mATG induced CD4�CD25� T cells express-ing several cell surface markers representative of Tregs withoutexpression of FOXP3; these cells were suppressive both in vitroand in vivo when adoptively transferred.37 mATG remainedcompletely protective against GVHD to doses of 1 mg/kg;mATG significantly induced FOXP3� CD4� Tregs in the spleenand increased FOXP3 expression in liver and intestines.38 Inboth human and mouse, rATG not only depletes T cells but alsoappears to generate Tregs.
Previous studies have suggested that hATG displays similarbut not identical reactivity to cell surface markers as doesrATG.39,40 Of course, differences in the effects of rATG andhATG on Treg expansion might be the result of their differentbinding specificities to T cells, as we observed here for 2 anti-gens, CD3 and TCR��. Antibodies directed to CD3 activatelymphocytes and convert CD4�CD25� T cells into CD4�CD25�
T cells.30 CD4� T cells treated with rATG showed increasedexpression of activation markers GITR and CTLA-4, in agree-ment with other reports, and these regulatory markers are linkedto but not specific for Tregs.20,31,33 rATG and hATG weredissimilar in inducing activation of T cells, likely explainingtheir effects on expansion of Tregs. Because ATGs in general arehighly heterogeneous, some antibodies may show synergistic oradditive effects and others antagonistic effects on Tregs; thebalance may determine expansion and activation of Tregs.
Our preliminary analysis of microarray data showed the expres-sion pattern of genes from PBMCs treated with rATG wasmarkedly different from the transcriptome of cells treated withhATG or untreated. These differences appeared to be global andextensive, involving many genes and reflecting the polyclonalnature of rATG and hATG: they may bind differently to various cellsurface antigens, cell types (such as B cells, natural killer cells, anddendritic cells),41-43 and multiple epitopes of the same molecule. Asa consequence, rATG and hATG would provide multiple modes ofimmunomodulation.
Differences in pharmacologic properties and mechanisms of actionbetween rATG and hATG may result in different clinical outcomes.Patient studies44-46 in adult renal transplantation reported a significantlylower rate of acute rejection with rATG compared with hATG at 1-yearor 5-year follow-up; graft survivals also were significantly improved inpatients treated with rATG than hATG. The timing of ATG administra-tion during the conditioning regimen and the dose of ATG are importantfactors for overall clinical impact. Although it has been assumed that
hATG and rATG are generally interchangeable in the clinic, rATG hasbeen considered superior in some circumstances. The mechanism ofaction of the ATGs is likely complex and multifactorial, particularly inthe treatment of AA, and important differences in antibody specificityand binding capacity exist between different preparations of ATG.Although hATG does not appear to expand Tregs in vitro while rATGdemonstrates this activity, hATG is effective in the treatment ofAA. Theexperiments we report in the current work used putatively normalPBMCs from healthy donors; other unpublished observations usingPBMCs from AA patients have shown similar in vitro findings. Thus,the main mechanism of action of hATG in the treatment may not berelated to Treg cell expansion in vivo. We should note that, althoughdifferent preparations of horse ATG (ATGAM vs lymphoglobulin) mayhave similar antibody specificities, we did not compare this hATGpreparation in the current experiments. We have successfully expandedTregs in PBMCs of AA patients using rATG at 10 �g/mL (X.F.,unpublished observations, January 2007), reinfusion of such expandedTregs into patients might ultimately be useful in autoimmune diseases.In clinical practice, low ATG doses appear to be not as effective ashigher doses in the treatment of AA patients,47 and clinical responsesmay be achieved by multiple mechanisms of action of which Tregexpansion would be one.
Our data suggest that cyclosporin has a negative impact onTreg. In the treatment of AA, cyclosporin is usually administeredconcurrently with ATG. Although laboratory results should alwaysbe extrapolated with caution to the clinic, our in vitro observationsmight support the use of lower cyclosporin dosing in vivo, ordelaying cyclosporin therapy after ATG, especially as high cyclo-sporin blood levels usually are not needed to maintain favorablehematologic responses.
We demonstrate that rATG induced expansion of functionalTregs, but hATG did not have such effect. The therapeuticeffects of rATG in the treatment of autoimmune diseases andGVHD may be the result of not only lymphocyte depletion butalso enhanced Treg cell number and function. Differencesbetween rATG and hATG may have clinical impact. Ourobservation might also provide a useful method for expansion ofTregs in future cellular treatment in transplantation and autoim-mune diseases.
Acknowledgment
This work was supported by the Intramural Research Programof the NIH.
Authorship
Contribution: X.F. designed the research, performed experiments,analyzed data, and wrote the paper; S.K. and E.E.S. performedexperiments, analyzed data, and revised the paper; K.K. providedtechnical support in flow cytometry experiments; X.X., N.R., andP.J.M. performed microarray and data analysis; T.M.H. and J.C.analyzed data and revised the paper; N.S.Y. designed the researchand wrote the paper.
Conflict-of-interest disclosure: The authors declare no compet-ing financial interests.
Correspondence: Xingmin Feng, Hematology Branch, NHLBI/NIH, Building 10-CRC, Rm 3E-5216, 9000 Rockville Pike,Bethesda, MD 20892; e-mail: [email protected].
3682 FENG et al BLOOD, 1 APRIL 2008 � VOLUME 111, NUMBER 7
For personal use only. by guest on June 1, 2013. bloodjournal.hematologylibrary.orgFrom

References
1. Maloy KJ, Powrie F. Regulatory T cells in the con-trol of immune pathology. Nat Immunol. 2001;2:816-822.
2. Sakaguchi S, Sakaguchi N, Shimizu J, et al. Im-munologic tolerance maintained by CD25�CD4� regulatory T cells: their common role incontrolling autoimmunity, tumor immunity, andtransplantation tolerance. Immunol Rev. 2001;182:18-32.
3. Fehervari Z, Sakaguchi S. Development andfunction of CD25�CD4� regulatory T cells. CurrOpin Immunol. 2004;16:203-208.
4. Fontenot JD, Gavin MA, Rudensky AY. FOXP3programs the development and function ofCD4�CD25� regulatory T cells. Nat Immunol.2003;4:330-336.
5. Hori S, Nomura T, Sakaguchi S. Control of regu-latory T cell development by the transcription fac-tor FOXP3. Science. 2003;299:1057-1061.
6. Khattri R, Cox T, Yasayko SA, Ramsdell F. An es-sential role for Scurfin in CD4�CD25� T regula-tory cells. Nat Immunol. 2003;4:337-342.
7. Ziegler SF. FOXP3: of mice and men. Annu RevImmunol. 2006;24:209-226.
8. Hodge MR, Ranger AM, de la Brousse FC, HoeyT, Grusby M, Glimcher LH. Hyperproliferation anddysregulation of IL-4 expression in NF-ATp-deficient mice. Immunity. 1996;4:397-405.
9. Mantel PY, Ouaked N, Ruckert B, et al. Molecularmechanisms underlying FOXP3 induction in hu-man T cells. J Immunol. 2006;176:3593-3602.
10. Wu Y, Borde M, Heissmeyer V, et al. FOXP3 con-trols regulatory T cell function through coopera-tion with NFAT. Cell. 2006;126:375-387.
11. Valencia X, Yarboro C, Illei G, Lipsky PE. Defi-cient CD4�CD25high T regulatory cell function inpatients with active systemic lupus erythemato-sus. J Immunol. 2007;178:2579-2588.
12. Lindley S, Dayan CM, Bishop A, Roep BO, Peak-man M, Tree TI. Defective suppressor function inCD4(�)CD25(�) T-cells from patients with type 1diabetes. Diabetes. 2005;54:92-99.
13. Longhi MS, Hussain MJ, Mitry RR, et al. Func-tional study of CD4�CD25� regulatory T cells inhealth and autoimmune hepatitis. J Immunol.2006;176:4484-4491.
14. Rezvani K, Mielke S, Ahmadzadeh M, et al. Highdonor FOXP3-positive regulatory T-cell (Treg)content is associated with a low risk of GVHD fol-lowing HLA-matched allogeneic SCT. Blood.2006;108:1291-1297.
15. Viglietta V, Baecher-Allan C, Weiner HL, HaflerDA. Loss of functional suppression byCD4�CD25� regulatory T cells in patients withmultiple sclerosis. J Exp Med. 2004;199:971-979.
16. Solomou EE, Rezvani K, Mielke S, et al. DeficientCD4� CD25� FOXP3� T regulatory cells in ac-quired aplastic anemia. Blood. 2007;110:1603-1606.
17. Kordasti SY, Ingram W, Hayden J, et al.CD4�CD25high FOXP3� regulatory T cells inmyelodysplastic syndrome (MDS). Blood. 2007;110:847-850.
18. Sakaguchi S, Sakaguchi N, Asano M, Itoh M,Toda M. Immunologic self-tolerance maintained
by activated T cells expressing IL-2 receptoralpha-chains (CD25): breakdown of a singlemechanism of self-tolerance causes various au-toimmune diseases. J Immunol. 1995;155:1151-1164.
19. Shimizu J, Yamazaki S, Sakaguchi S. Induction oftumor immunity by removing CD25�CD4� Tcells: a common basis between tumor immunityand autoimmunity. J Immunol. 1999;163:5211-5218.
20. Wood KJ, Sakaguchi S. Regulatory T cells intransplantation tolerance. Nat Rev Immunol.2003;3:199-210.
21. Edinger M, Hoffmann P, Ermann J, et al.CD4�CD25� regulatory T cells preserve graft-versus-tumor activity while inhibiting graft-versus-host disease after bone marrow transplantation.Nat Med. 2003;9:1144-1150.
22. Chen J, Ellison FM, Eckhaus MA, et al. Minor an-tigen h60-mediated aplastic anemia is amelio-rated by immunosuppression and the infusion ofregulatory T cells. J Immunol. 2007;178:4159-4168.
23. Beiras-Fernandez A, Thein E, Hammer C. Induc-tion of immunosuppression with polyclonal anti-thymocyte globulins: an overview. Exp Clin Trans-plant. 2003;1:79-84.
24. Lowsky R, Takahashi T, Liu YP, et al. Protectiveconditioning for acute graft-versus-host disease.N Engl J Med. 2005;353:1321-1331.
25. Genestier L, Fournel S, Flacher M, Assossou O,Revillard JP, Bonnefoy-Berard N. Induction of Fas(Apo-1, CD95)-mediated apoptosis of activatedlymphocytes by polyclonal antithymocyte globu-lins. Blood. 1998;91:2360-2368.
26. Solomou EE, Keyvanfar K, Young NS. T-bet, aTh1 transcription factor, is up-regulated in T cellsfrom patients with aplastic anemia. Blood. 2006;107:3983-3991.
27. Zeng W, Miyazato A, Chen G, Kajigaya S, YoungNS, Maciejewski JP. Interferon-gamma-inducedgene expression in CD34 cells: identification ofpathologic cytokine-specific signature profiles.Blood. 2006;107:167-175.
28. Baratelli F, Lin Y, Zhu L, et al. Prostaglandin E2induces FOXP3 gene expression and T regula-tory cell function in human CD4� T cells. J Immu-nol. 2005;175:1483-1490.
29. Zheng SG, Wang JH, Gray JD, Soucier H, Hor-witz DA. Natural and induced CD4�CD25� cellseducate CD4�CD25� cells to develop suppres-sive activity: the role of IL-2, TGF-beta, and IL-10.J Immunol. 2004;172:5213-5221.
30. Walker MR, Kasprowicz DJ, Gersuk VH, et al.Induction of FOXP3 and acquisition of T regula-tory activity by stimulated human CD4�CD25� Tcells. J Clin Invest. 2003;112:1437-1443.
31. Battaglia M, Stabilini A, Migliavacca B, Horejs-Hoeck J, Kaupper T, Roncarolo MG. Rapamycinpromotes expansion of functionalCD4�CD25�FOXP3� regulatory T cells of bothhealthy subjects and type 1 diabetic patients.J Immunol. 2006;177:8338-8347.
32. Kreijveld E, Koenen HJ, Hilbrands LB, van HooffHJ, Joosten I. The immunosuppressive drugFK778 induces regulatory activity in stimulated
human CD4� CD25� T cells. Blood. 2007;109:244-252.
33. Lopez M, Clarkson MR, Albin M, Sayegh MH, Na-jafian N. A novel mechanism of action for anti-thymocyte globulin: induction ofCD4�CD25�FOXP3� regulatory T cells. J AmSoc Nephrol. 2006;17:2844-2853.
34. Roncarolo MG, Gregori S, Battaglia M, BacchettaR, Fleischhauer K, Levings MK. Interleukin-10-secreting type 1 regulatory T cells in rodents andhumans. Immunol Rev. 2006;212:28-50.
35. Bonnefoy-Berard N, Vincent C, Revillard JP. Anti-bodies against functional leukocyte surface mol-ecules in polyclonal antilymphocyte and antithy-mocyte globulins. Transplantation. 1991;51:669-673.
36. Preville X, Flacher M, LeMauff B, et al. Mecha-nisms involved in antithymocyte globulin immuno-suppressive activity in a nonhuman primatemodel. Transplantation. 2001;71:460-468.
37. Ruzek MC, Waire JS, Hopkins D, et al. Charac-terization of in vitro anti-murine thymocyte globu-lin-induced regulatory T cells which inhibit graft-versus-host disease in vivo. Blood. 2008;111:1726-1734.
38. Ruzek MC, Waire JS, Weber W, Williams JM,Richards SM, Garman RD. Anti-murine thymo-cyte globulin prevents acute graft-versus-hostdisease and induces Foxp3� T cells in target or-gans [abstract]. Blood. 2007;100:3251a.
39. Bourdage JS, Hamlin DM. Comparative poly-clonal antithymocyte globulin and antilymphocyte/antilymphoblast globulin anti-CD antigen analysisby flow cytometry. Transplantation. 1995;59:1194-1200.
40. Greco B, Bielory L, Stephany D, et al. Antithymo-cyte globulin reacts with many normal human celltypes. Blood. 1983;62:1047-1054.
41. Mohty M. Mechanisms of action of antithymocyteglobulin: T-cell depletion and beyond. Leukemia.2007;21:1387-1394.
42. Zand MS, Vo T, Huggins J, et al. Polyclonal rabbitantithymocyte globulin triggers B-cell and plasmacell apoptosis by multiple pathways. Transplanta-tion. 2005;79:1507-1515.
43. Monti P, Allavena P, Di Carlo V, Piemonti L. Ef-fects of anti-lymphocytes and anti-thymocytesglobulin on human dendritic cells. Int Immuno-pharmacol. 2003;3:189-196.
44. Hardinger KL. Rabbit antithymocyte globulin in-duction therapy in adult renal transplantation.Pharmacotherapy. 2006;26:1771-1783.
45. Brennan DC, Flavin K, Lowell JA, et al. A random-ized, double-blinded comparison of Thymoglobu-lin versus Atgam for induction immunosuppres-sive therapy in adult renal transplant recipients.Transplantation. 1999;67:1011-1018.
46. Hardinger KL, Schnitzler MA, Miller B, et al. Five-year follow up of Thymoglobulin versus ATGAMinduction in adult renal transplantation. Trans-plantation. 2004;78:136-141.
47. Killick SB, Cavenagh JD, Davies JK, Marsh JC.Low dose antithymocyte globulin for the treat-ment of older patients with aplastic anaemia.Leuk Res. 2006;30:1517-1520.
EXPANSION OF Tregs WITH RABBIT ATG 3683BLOOD, 1 APRIL 2008 � VOLUME 111, NUMBER 7
For personal use only. by guest on June 1, 2013. bloodjournal.hematologylibrary.orgFrom
Copyright © 2022 FDOKUMEN

