


Bahasa
Halaman
Hukum

De Economist (2011) 159:193–221DOI 10.1007/s10645-011-9162-9
Productivity-Wage Gaps Among Age Groups: Doesthe ICT Environment Matter?
Alessandra Cataldi · Stephan Kampelmann ·François Rycx
Published online: 1 May 2011© Springer Science+Business Media, LLC. 2011
Abstract This paper disentangles the age-productivity-wage nexus by estimatingproductivity and wage equations with longitudinal employer-employee panel data forBelgium. Results indicate that workers above 49 years are significantly less produc-tive than their younger colleagues. Moreover, while relative productivities across agegroups are not found to differ significantly between ICT and non ICT firms, the upwardsloping age-wage profile appears to be somewhat steeper in ICT firms. Yet, whateverthe ICT environment, findings show that young workers are paid below and olderworkers above their marginal productivity. This pattern is in line with the deferredpayment model developed by Lazear (J Polit Econ 87:1261–1284, 1979).
Keywords Wages · Productivity · Ageing · Matched panel data · ICT
JEL Classification J14 · J24 · J31
A. CataldiUniversità di Roma “La Sapienza”, Rome, Italy
A. CataldiSBS-EM (DULBEA), Brussels, Belgium
S. KampelmannUniversité de Lille, CLERSE, SBS-EM (DULBEA), Brussels, Belgium
F. Rycx (B)Université Libre de Bruxelles, SBS-EM (CEB, DULBEA), Brussels, Belgiume-mail: [email protected]
F. RycxIZA, Bonn, Germany
123
194 A. Cataldi et al.
1 Introduction
The ageing of the European population is among the most salient demographic trendsof recent decades and raises tough policy challenges, both from a social and eco-nomic point of view. In particular, the relative increase in the share of older peoplehas led policy makers and economists to focus on the labour market participationof older workers. For instance, the increasing fiscal burden created by the observeddemographic shifts motivated several governments to adopt policies designed to boostemployment rates of older Europeans.
In order to provide sound policy advice, research has to explore the entire range ofpotential advantages and risks that may derive from an increased share of older peoplein the active labour force. According to standard economic theory, the employabilityof older workers depends on the comparison between the costs and benefits associatedwith their labour services. However, we know surprisingly little about such compari-sons. How does the contribution of older workers to firm performance compare withthe average remuneration of this demographic group? How does the productivity ofolder workers compare to the productivity of younger cohorts? These are the over-arching questions we address in this paper. More precisely, our strategy consists incomparing the age-productivity profile and the age-wage profile of three age groups:workers younger than 30; between 30 and 49; and older than 49 years.
Several studies suggest that the labour productivity of different age groups isaffected asymmetrically by the immediate environment in which workers are embed-ded at the firm level (Börsch-Supan et al. 2005; Bertschek and Meyer 2009). A con-sequential aspect of the firm environment that underwent significant change in thelast decades is the intensity with which firms make use of information and commu-nication technology (ICT) (see Autor et al. 1998). In particular, the implementationof ICT in production processes might affect the demand for different types of skills.For instance, the literature on the employment effects of technological change sug-gests that ICT could substitute for routine tasks and complement non-routine tasks(Acemoglu 2002; Bresnahan et al. 2002; Card and DiNardo 2002; Goos and Manning2007; Kampelmann and Rycx 2011).
In addition to workers performing routine tasks, new technologies like ICT mightalso affect the employability of different age groups. For instance, Boockmann andZwick (2004) observe an age bias of technological change given that innovative firmsappear to employ fewer older workers than less technology-intense firms. Beckmann(2004) find a significant negative correlation between the share of older workers withinfirms and their productivity-wage bill ratio. This age bias appears to be distinct fromskill bias since it has also been observed within occupational groups (Aubert et al.2006). Age-biased technological change might be attributed to older workers difficultyin keeping up with the pace of changes in the work environment due to decreasingcognitive and learning capabilities. Firms might be reluctant to employ and train olderworkers given their shorter career horizon during which the training investments couldbe amortized. The effect of ICT on age is, however, by no means clear-cut. Indeed, itis also conceivable that certain types of technology (like improved user interfaces orthe computerization of repetitive tasks) counter-act decreasing abilities and help age-ing workers to maintain stable or even increasing levels of performance (Bartel and
123
Productivity-Wage Gaps Among Age Groups 195
Sichermann 1993). These opposing views have contradictory implications for olderworkers’ incentives and access to on-the-job training and attitudes towards retirementdecisions (Ahituv and Zeira 2002; Bartel and Sichermann 1993).
Given the policy challenges of demographic change and the unclear impact thatrecent waves of technological innovations could have on older workers’ performance,the objective of this paper is twofold. First, we examine the relationship between age,wage and productivity for the overall workforce in the Belgian private sector in order todetermine whether certain age groups are paid below or above their marginal produc-tivity. To do so, we rely on detailed matched employer-employee panel data coveringthe period 1999–2006. Next, we investigate whether results vary according to the ICTenvironment of firms. Our data set does not comprise information on technologicaland innovative activities of firms. Therefore, we make use of the ICT taxonomy devel-oped by O’Mahoney and van Ark (2003), which enables to classify firms accordingto the ICT capital intensity of industrial sectors at the NACE three-digit level. Thismethodology groups detailed industries based on whether they produce ICT goodsand services and whether they intensively use ICT or not.
The present paper contributes to the existing literature in several ways. Firstly,empirical evidence regarding (i) the age-productivity-wage nexus and (ii) the role ofthe ICT environment on the productivity and remuneration of age groups is still verylimited. Secondly, we add to the extant literature by looking at the effect of differentage groups on productivity and wages in terms of hours instead of the inferior employ-ment proxy of head counts. Thirdly, our access to a large employer-employee paneldata set allows us to estimate a model controlling for a wide range of worker and firmcharacteristics. Finally, our estimates address several econometric issues such as thepotential endogeneity of age shares, the existence of unobserved firm characteristicsand the state dependence of firm productivity and wages.
Research questions addressed in this paper are particularly relevant for the Bel-gian economy. Like most OECD member countries, Belgium is facing the challengesassociated with a rapidly ageing population. Projections suggest that the old age depen-dency ratio (i.e. the ratio of the number of persons aged 65 and more divided by thenumber of persons aged 15–64) will increase from around 26% in 2010 to almost45% in 2050 (Giannakouris 2008). Belgium is also characterized by one of the lowestemployment rates for workers aged 55–64 in the OECD area [35% in 2009 (OECD2010)]. This situation is primarily due to the existence of attractive (to both employersand employees) early retirement schemes. Indeed, although the situation is progres-sively changing, it is still fairly common to retire early and to benefit from one ofthe various relatively generous schemes available (OECD 2003). The effective retire-ment age is currently about 5 years below the legal one at 65 years (OECD 2006).The low rate of employment among older workers can also be explained by the factthat employers are often reluctant to hire this category of workers. The point is thatsenior workers are generally considered to be less productive and more costly thantheir younger counterparts. This being said, the employment rate among people aged15–24 is also quite low [25% in 2009 (OECD 2010)]. This is due to increasing years ofschooling and the high unemployment rate among young people [22% in 2009 (OECD2010)], particularly among those with a low level of education. Indeed, employers often
123

196 A. Cataldi et al.
complain that young workers are not sufficiently productive (because of a lack of skillsand experience) and therefore prefer to hire somewhat older workers.
Overall, most employers in Belgium draw on prime age workers (the 25–54 agegroup). This situation, accompanied by strong demographic changes, puts substantialpressure on public finances. To overcome this problem, policy makers aim to increasethe employment rate essentially of older workers. Different strategies have been sug-gested to attain this goal [e.g. measures: (i) reforming early retirement schemes, (ii)creating incentives for older workers to remain in or return to work, (iii) encourag-ing firms to change their practices towards older workers, and (iv) raising the legalretirement age (OECD 2003)]. On any account, changes in the workforce age structureare likely to have important consequences for firms’ productivity and wage bill. Yet,findings regarding the relationship between age, wage and productivity are still quiterare. Moreover, whether the ICT environment of firms affects whether certain agecategories might be paid above or below their marginal productivity remains under-researched. The objective of this paper is to provide more empirical evidence on theseimportant issues.
The structure of the paper is as follows: the next section provides an overview of theexisting literature. Section 3 presents the estimation method used in this paper. Sec-tion 4 contains information on our data set and descriptive statistics. Regression resultsand robustness tests for the baseline model are discussed in Sect. 5. The impact of theICT environment on the productivity and remuneration of age groups is scrutinised inSect. 6. The final section concludes.
2 Review of the Literature
2.1 Age and Productivity
The theoretical literature on the relationship between age and productivity is ambig-uous. While part of the literature underlines the positive impact that elderly and moreexperienced people might have on job performance, other theories suggest that olderworkers might be less productive and less efficient than younger ones.
The former strand of literature draws heavily on the predictions of the human capitalmodel (Mincer 1974) and claims that older workers will perform better than youngerones since they have accumulated better know-how (Czaja and Sharit 1998). In partic-ular, in jobs where verbal abilities and experience are more important than cognitivecapacities and speediness, elderly workers might be more productive than their youn-ger counterparts (Skirbekk 2003). Moreover, some authors stress that older workersare more likely to have correctly matched their job preferences with the employer’srequirements (Johnson 1978) and are more likely to have been assigned to their bestposition in the firm organization (Jovanovic 1979).
By contrast, a second cluster of theories relies on the medical literature and expectsageing to be accompanied by a decline in mental elasticity and physical power andargues that this process may have a negative effect on productivity (Shepard 1999).Some authors also observe that older workers are likely to be less healthy, to suffer
123
Productivity-Wage Gaps Among Age Groups 197
more from frequent or chronic diseases and to show higher rates of absenteeism andlower productivity (Ng and Feldman 2008).
In addition, other theories argue that older workers might be less motivated thanyounger ones since they will have a shorter time to benefit from better performancethrough promotions and career advancements (Tang and MacLeod 2006; Grund andWestergaard-Nielsen 2005). For the same reason older workers may have less incen-tives to invest in training and to acquire new competences. As a consequence, pro-ductivity might be higher in the beginning than in the end of the career, a pattern thatcould be further reinforced as skills acquired through formal education are expectedto be state-of-the-art when graduates enter the labour markets but become more andmore obsolete afterwards (Walewski 2008).
2.2 The Impact of Technology on Relative Productivity
Firms do not all use the same technologies and their economic activities do not requirethe same amount of investment in innovation. This implies that firms may need differ-ent types of skills. Indeed, one may expect that firms using new advanced technologieswill employ individuals with strong cognitive skills and learning capabilities. Sincesuch abilities are presumably decreasing over the worker’s life cycle and innovativefirms are also more likely to invest in on-the-job training programmes, it could be moreprofitable to employ a higher share of younger workers (Brooke 2003; Prskawetz etal. 2006). Older people may be less willing than younger workers to continuouslyupdate their competences due to inferior mental agility, processing speed and learningcapabilities (Bartel and Sichermann 1993; Skirbekk 2003). Older workers may alsofear new technology (Taylor and Rose 2005).
On the other hand, technology can benefit ageing workers in several ways. Firstly,as far as technological progress forces workers to train themselves, it might have apositive effect on older workers’ performance since it induces them to update theirskills and preserve their productivity (Bartel and Sichermann 1993). In addition, newtechnologies might boost productivity to the extent that they can compensate for dis-abilities and for physical or mental decline (eInclusion@EU 2007).
2.3 Empirical Literature
From an empirical perspective, results are not more clear-cut. This may be attributed atleast partially to a lack of a direct measure of productivity (Aubert and Crépon 2003).
Many papers using matched employer-employee data find a hump-shaped rela-tionship between age and productivity (De Koning 2005): productivity increases withage until the age of 50 and decreases thereafter. However, some studies found thatproductivity peaks at 55 years or more (Hellerstein and Neumark 1995; Hellersteinet al. 1999). Tang and MacLeod (2006) evaluate productivity growth in 10 Canadianprovinces and find a negative and significant impact of the share of older workers(aged 55 and more) on productivity growth (measured by GDP). Using data from theZEW ICT survey, Schleife (2008) reports that firms using ICT technology intensivelyemploy smaller shares of older workers. However, in firms where older workers attend
123
198 A. Cataldi et al.
ICT training programmes such composition effects cannot be observed. This suggeststhat training enhances older workers’ productivity. Interestingly, the rise in productiv-ity tends to decrease with the number of older workers trained, suggesting that firmsmay first select older employees for training who are more productive. The effect ofcomputerization of occupations on older workers is studied by Friedberg (2003). Heanalyses data from the Current Population Survey and the Health and Retirement Studyand concludes that impending retirement rather than ageing per se exerts a negativeeffect on the degree of computerization and on skills upgrading. In addition, Friedberg(2003) presents evidence that occupations affect significantly the ICT use of workerseven after controlling for age differences between occupations.
Bertschek and Meyer (2009) analyse firm-level panel data for the German manu-facturing and service industries and measure productivity by sales per worker. Theyfind that older workers (aged 49 and more) are not less productive than prime ageworkers, while younger workers (aged less than 30) are less productive than primeage workers. They find that technological progress, proxied by the use of computers,has a positive impact on older workers productivity. They also stress that the higherproductivity might not depend on the device itself, but on the fact that computer usersare better qualified for using a computer. In line with these results, Göbel and Zwick(2009) find that older workers’ productivity does not decrease dramatically with age.They use panel data from the German economy and measure productivity by valueadded per head. According to their analysis, productivity increases with the share ofemployees until the age of 50–55 years and decreases only slightly afterwards.
A less analysed but equally unresolved issue concerns the relationship betweenage, wage and productivity. Standard theory suggests that wages will in general reflectmarginal productivity. By contrast, other models of wage determination, for instancebased on incentive mechanisms and contract theory, predict a divergence betweenwages and productivity. The deferred payment model developed by Lazear (1979), forinstance, asserts that younger workers might be paid below and older workers abovetheir productivity so as to boost the loyalty and attachment of younger workers.
Aubert and Crépon (2003) quantify productivity with value added in the Frenchmanufacturing, service and commerce sectors and find that individual productivitygrows until the age of 40 and stagnates afterwards. They also examine the possibledivergence between productivity and remuneration, finding no evidence of a produc-tivity-wage gap for elderly people, except for workers older than 55 years. van Ours andStoeldraijer (2011) use matched worker-firm panel data for the Dutch manufacturingsector and proxy productivity with value added. Once they address the endogeneity ofage shares, they observe that both productivity and wage costs increase with age andfind no strong evidence for productivity-wage gaps. Ilmakunnas and Maliranta (2005)analyse Finnish manufacturing plant data and specify different productivity equationsusing value added and sales as proxies of productivity. They observe productivity-wage gaps that increase with age, a finding that they impute to strong seniority effectsin wage setting. A significant productivity-wage gap is also found by Cardoso et al.(2011), but here it has the opposite sign. Using Portuguese firm-level panel data andmeasuring productivity with total sales per worker, the authors observe that productiv-ity peaks around the age of 50 and then remains relatively constant. In contrast, wagesare found to be quite flat after the age of 29 and to decline after 50. Accordingly, their
123
Productivity-Wage Gaps Among Age Groups 199
estimates suggest that the contribution of older workers to firm productivity exceedstheir wages.
The empirical evidence for the Belgian economy is quite limited. Lallemand andRycx (2009), employing cross-sectional matched employer-employee data for the pri-vate sector and using value added per capita to proxy productivity, find that youngworkers are significantly more productive than older ones. They also assess the poten-tial effect of ICT on the relationship between ageing and performance. Their findingsshow that the proportion of young workers is larger in firms using ICT intensivelyand that age-structure effects on productivity are weaker in firms that are less exposedto ICT. Yet, these results should be taken with caution in particular because (i) firmunobserved fixed effects are not controlled for and (ii) instruments used to address theendogeneity of the firm’s age structure may not be the most appropriate.
The relationship between age, productivity and labour costs has been examinedby Vandenberghe and Waltenberg (2010) on the basis of Belgian firm-level paneldata. Addressing the problem of endogeneity and controlling for fixed firm effects,their results suggest that older workers are less productive than prime age workersby between 20 and 40%, and that this productivity differential is not compensated bylower relative labour costs. Their findings thus suggest that firms based in Belgium area priori not willing to employ more older workers. Although rather compelling, theirresults do not account for some important control variables that are either missing oronly available in broad categories in their data (e.g. the composition of the workforceaccording to education skills, previous training and occupations). Moreover, given thefocus on labour costs rather than on workers’ wages, the paper principally deals withthe consequences of population ageing on the labour demand for people of differentage groups. The question whether young and older workers are “paid what they areworth” (i.e. whether workers are paid according to their marginal productivity) is thusonly indirectly tested and deserves to be re-examined with more detailed informationon remuneration and on workforce compositions. This is the first objective of the pres-ent paper. However, we also want to investigate with firm-level panel data whetherthe relationship between age, wage and productivity depends on the ICT environmentof firms [an issue that has not been investigated by Vandenberghe and Waltenberg(2010)].
3 Methodology
The test developed in this article is based on the separate estimation of a value addedfunction and a wage equation at the firm level. The value added function yields param-eter estimates for the average marginal product of each workers’ age group, while thewage equation estimates the respective impact of each age category on the averagewage paid by the firm. Given that both equations are estimated with the same set offirms, age groups and covariates, the parameters for marginal products and wages canbe compared and conclusions on age productivity-wage gaps can be drawn. This tech-nique was pioneered by Hellerstein et al. (1999) and refined by Aubert and Crépon(2003); van Ours (2009); Göbel and Zwick (2009); van Ours and Stoeldraijer (2011)and others.
123
200 A. Cataldi et al.
Equation (1) is a function linking a range of inputs of firm i to its value added Yi .
Yi = F(Ki , QLi ) (1)
where Ki represents the firm’s capital stock and QLi is a quality of labour term. Thelatter allows introducing a heterogeneous labour force into the value added function.
There is an abundant econometric literature on the estimation of relationships asthe one depicted in Eq. (1). In an attempt to reflect more accurately the productionprocess inside the firm, specialists in the field have proposed specifications allowinge.g. for production inefficiencies or different elasticities of substitution between thefactors of production. Since our focus is not on the production process itself, but ratheron the comparison between productivities and wages for a set of workers’ age groups,we use a simple Cobb–Douglas version of Eq. (1), with substitution elasticities equalto one and the assumption of firms operating at the efficiency frontier. This restrictionappears to be unproblematic as previous firm-level studies have shown that productiv-ity coefficients obtained with a Cobb–Douglas structure are robust to other functionalspecifications (see, for instance, Hellerstein and Neumark 2004). Equation (2) is thebasic (Cobb–Douglas) value added function:
log(Yi ) = log(Ai ) + α log(Ki ) + β log(QLi ) (2)
where Ai is a constant. The parameters α and β are the respective marginal produc-tivities of each input factor. QLi can be written as:
QLi = Li
⎛⎝1 + (θi, j − 1)
G∑j=1
Li, j
Li
⎞⎠ (3)
where Li is the total labour force of the firm i and Li, j/Li the proportion of totallabour force in age group j . Substituting Eq. (3) into (2) allows for different marginalproductivities for each of the G age categories. If for age group j the parameter θ j isbigger (smaller) than unity, then this group has a higher (lower) marginal impact onproductivity than the reference age category. If all groups have θ ’s equal to one, thenEq. (3) becomes QLi = Li, i.e. labour is perfectly homogeneous.
As for the wage equation, Aubert and Crépon (2003) show that the average wageof firm i can be expressed as:
wi =∑G
j=1 wi, j Li, j∑Gj=1 Li, j
= wi,0
⎛⎝
G∑j=1
wi, j
wi,0
Li, j
Li
⎞⎠ =wi,0
⎛⎝1 +
G∑j−{0}
(wi, j
wi,0− 1
)Li, j
Li
⎞⎠
(4)
where wi, j is the average wage of Li, j and j = 0 the reference age category withthe wage wi,0. Similar to the interpretation of θ in the production function, if the ratiow j/w0 is bigger (smaller) than unity, then the marginal impact of age group j on theaverage wage in the firm is higher (lower) compared to the reference age category.
123
Productivity-Wage Gaps Among Age Groups 201
Comparing marginal productivities and wage differentials across age groups boilsdown to comparing θ j with the corresponding w j/w0.
4 Data and Descriptive Statistics
Our empirical analysis is based on a combination of two large data sets covering theyears 1999–2006. The first, carried out by Statistics Belgium, is the ‘Structure ofEarnings Survey’ (SES). It covers all firms operating in Belgium that employ at least10 workers and with economic activities within sections C to K of the NACE Rev.1 nomenclature.1 The survey contains a wealth of information, provided by the man-agement of firms, both on the characteristics of the latter (e.g. sector of activity, numberof workers, level of collective wage bargaining) and on the individuals working there(e.g. age, education, tenure, gross earnings, paid hours, sex, occupation).2 The SESprovides no financial information. Therefore, it has been merged with a firm-levelsurvey, the ‘Structure of Business Survey’ (SBS). The SBS, also conducted by Sta-tistics Belgium, provides information on financial variables such as firm-level valueadded and gross operating surplus (per hour and per worker). The coverage of the SBSdiffers from that of the SES in that it does not cover the whole financial sector (NACEJ) but only Other Financial Intermediation (NACE 652) and Activities Auxiliary toFinancial Intermediation (NACE 67). The merge of the SES and SBS data sets hasbeen carried out by Statistics Belgium using firms’ social security numbers.
Three filters have been applied to the original data set. The first derives its rationalefrom neoclassical productivity theory, which relies on the assumption that prices areeconomically meaningful. This is why we deleted firms that are publicly controlledand/or operating in predominantly public sectors from our sample. All regressions aretherefore applied to privately controlled firms only.3
Second, we have eliminated firms with less than 10 observations, the reason forthis being our use of average values at the firm level. In order to assure that averages(like, for instance, the proportion of employees in a specific occupation) are based ona minimum number of observations, we filtered out firms that provided informationon less than ten employees.4 This selection criterion leads to an average number ofobservations per firm in each year that is equal to 35.
In addition to applying these two filters, the final sample on which our estimationsare based consists only of firms that are observed in at least three consecutive yearsdue to the inclusion of lagged differences in our models (see Sect. 5). This leads toa bias towards big firms because of the sample design of the SES in which big firms
1 It thus covers the following sectors: (i) mining and quarrying (C), (ii) manufacturing (D), (iii) electricity,gas and water supply (E), (iv) construction (F), v) wholesale and retail trade, repair of motor vehicles,motorcycles and personal and household goods (G), (vi) hotels and restaurants (H), (vii) transport, storageand communication (I), (viii) financial intermediation (J), and ix) real estate, renting and business activities(K).2 For more details on the SES see Appendix A.3 More precisely, we eliminate firms for which public financial control exceeds 50%. This exclusion reducesthe sample size by less than 4%.4 This selection is unlikely to affect our results as it leads to a small drop in sample size.
123
202 A. Cataldi et al.
are more likely to stay in the sample for several consecutive years than small firms(see Appendix A).
Our final sample consists of an unbalanced panel of 1,735 firms yielding 5,459firm-year-observations during the 6-year period (1999–2006). It is representative ofall medium-sized and large firms employing at least 10 employees within sectionsC to K of the NACE Rev. 1 nomenclature, with the exception of large parts of thefinancial sector (NACE J) and almost all the electricity, gas and water supply industry(NACE E).
The definition of earnings we use in the estimation correspond to the total grosswages, including premia for overtime, weekend and night work, performance bonuses,commissions and other premia. The work hours correspond to the total remuneratedhours in the reference period (including paid overtime hours). The firm’s value addedper hour is measured at factor costs and calculated with the total number of hourseffectively worked by the firm’s employees. All variables in the SES-SBS are notself-reported by the employees, but provided by the firm’s management and thereforemore precise compared to employee or household surveys.
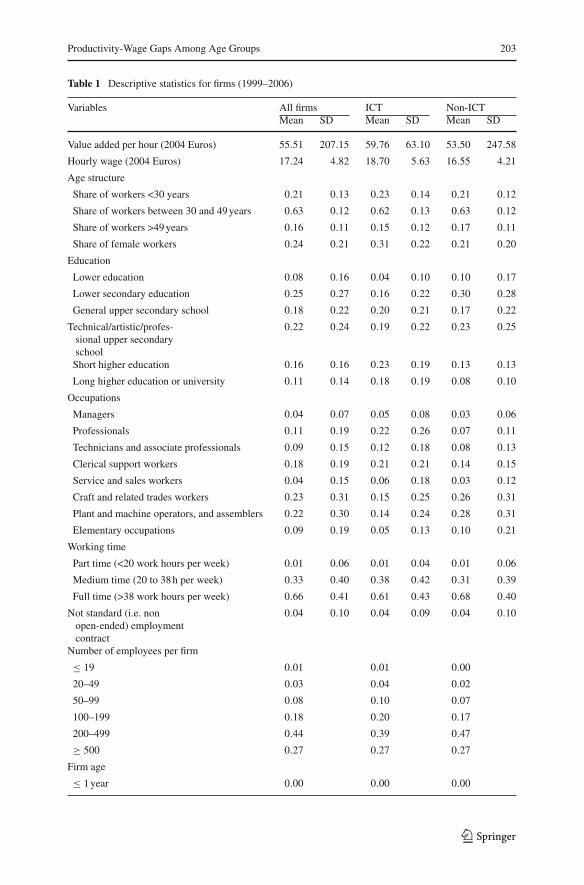
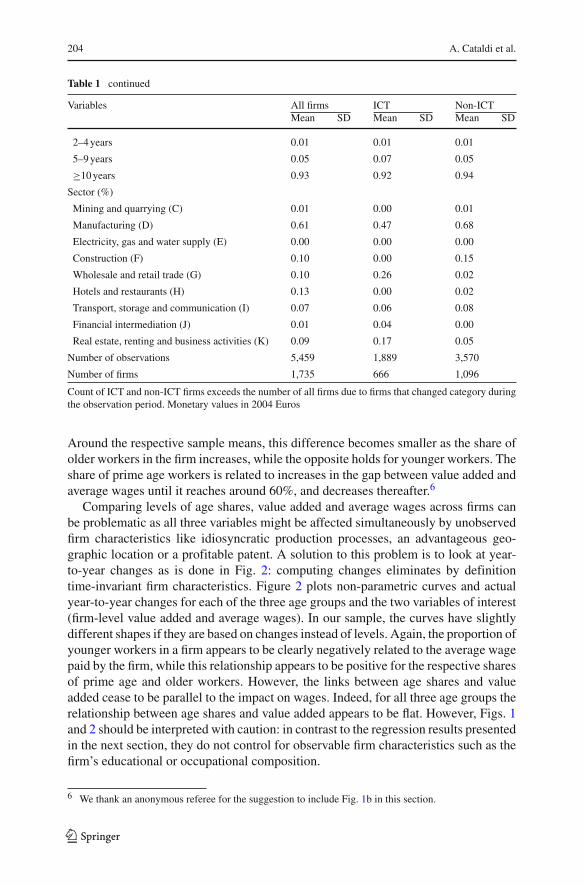
Table 1 sets outs the means and standard deviations of selected variables. We observethat firms have a mean value added per hour worked of 55.51 Euros and that workers’mean gross hourly wage stands at 17.24 Euros. The age structure of the workforcewithin firms is on average composed by: 21% of workers younger than 30 years, 63%of prime aged workers (between 30 and 49 years) and 16% of older workers (with atleast 50 years). We also find that 24% of workers are women, 54% are blue collar5,33% have a low level of education (i.e. lower secondary at most), 34% work less than38 h per week, and 96% have an open-ended employment contract. Moreover, almost90% of workers in our sample are employed in relatively big firms (i.e. firms withat least 100 employees) essentially concentrated in the manufacturing sector (61%),hotels and restaurants (13%), wholesale and retail trade, repair of motor vehicles,motorcycles and personal and household goods (10%), construction (10%) and realestate, renting and business activities (9%).
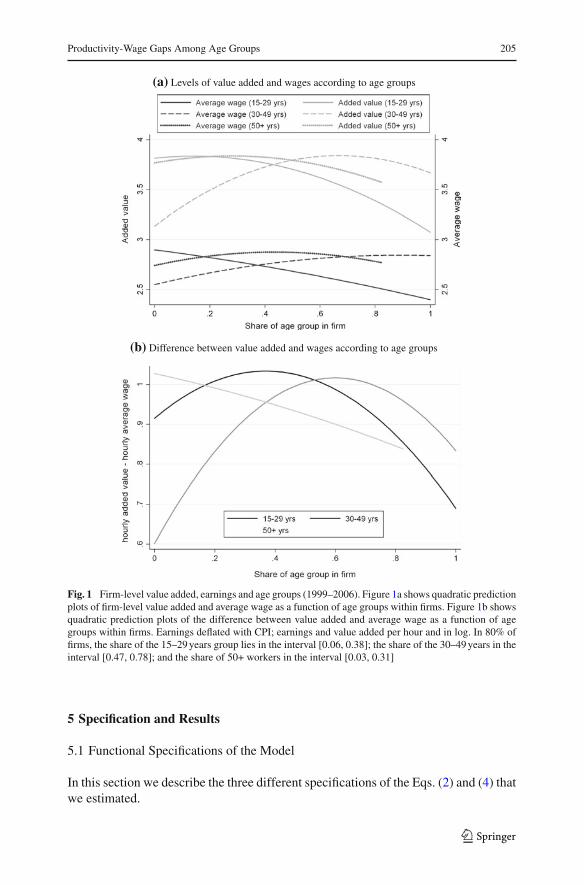
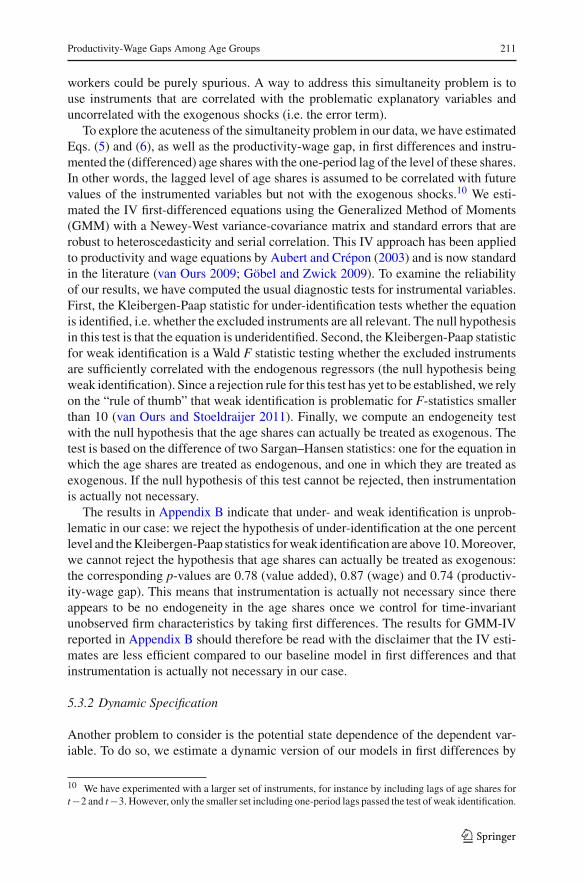
A simple way to explore the age-wage-productivity nexus in our data is to lookat the age-wage and age-productivity relationships at the firm level. Figure 1a chartsthe quadratic prediction plots for value added and average wages as a function of theshares of three age groups: below 30, 30–49, and above 49 years. In the vicinity ofthe sample means for the age groups (21, 63 and 16%, respectively), the curves forvalue added and average wage have a relatively similar shape. Both firm-level valueadded and average wages appear to decrease with the proportion of workers below30 years. As for prime age workers, value added increases until the share of this groupreaches around 65% and decreases for higher shares, while the average wage in thefirm increases with the share of prime age workers. Finally, the proportion of olderworkers has a positive effect on firm-level value added until they reach a share ofaround 30%. The firm wage peaks on average when this group represents around 45%of the firm’s labour force. To make the comparison between value added and wagesmore explicit, Fig. 1b plots the difference between the two as a function of age shares.
5 Blue-collar occupations include “Craft and related trades workers”, “Plant and machine operators, andassemblers”, and “Elementary occupations”.
123
Productivity-Wage Gaps Among Age Groups 203
Table 1 Descriptive statistics for firms (1999–2006)
Variables All firms ICT Non-ICTMean SD Mean SD Mean SD
Value added per hour (2004 Euros) 55.51 207.15 59.76 63.10 53.50 247.58
Hourly wage (2004 Euros) 17.24 4.82 18.70 5.63 16.55 4.21
Age structure
Share of workers <30 years 0.21 0.13 0.23 0.14 0.21 0.12
Share of workers between 30 and 49 years 0.63 0.12 0.62 0.13 0.63 0.12
Share of workers >49 years 0.16 0.11 0.15 0.12 0.17 0.11
Share of female workers 0.24 0.21 0.31 0.22 0.21 0.20
Education
Lower education 0.08 0.16 0.04 0.10 0.10 0.17
Lower secondary education 0.25 0.27 0.16 0.22 0.30 0.28
General upper secondary school 0.18 0.22 0.20 0.21 0.17 0.22
Technical/artistic/profes-sional upper secondaryschool
0.22 0.24 0.19 0.22 0.23 0.25
Short higher education 0.16 0.16 0.23 0.19 0.13 0.13
Long higher education or university 0.11 0.14 0.18 0.19 0.08 0.10
Occupations
Managers 0.04 0.07 0.05 0.08 0.03 0.06
Professionals 0.11 0.19 0.22 0.26 0.07 0.11
Technicians and associate professionals 0.09 0.15 0.12 0.18 0.08 0.13
Clerical support workers 0.18 0.19 0.21 0.21 0.14 0.15
Service and sales workers 0.04 0.15 0.06 0.18 0.03 0.12
Craft and related trades workers 0.23 0.31 0.15 0.25 0.26 0.31
Plant and machine operators, and assemblers 0.22 0.30 0.14 0.24 0.28 0.31
Elementary occupations 0.09 0.19 0.05 0.13 0.10 0.21
Working time
Part time (<20 work hours per week) 0.01 0.06 0.01 0.04 0.01 0.06
Medium time (20 to 38 h per week) 0.33 0.40 0.38 0.42 0.31 0.39
Full time (>38 work hours per week) 0.66 0.41 0.61 0.43 0.68 0.40
Not standard (i.e. nonopen-ended) employmentcontract
0.04 0.10 0.04 0.09 0.04 0.10
Number of employees per firm
≤ 19 0.01 0.01 0.00
20–49 0.03 0.04 0.02
50–99 0.08 0.10 0.07
100–199 0.18 0.20 0.17
200–499 0.44 0.39 0.47
≥ 500 0.27 0.27 0.27
Firm age
≤ 1 year 0.00 0.00 0.00
123
204 A. Cataldi et al.
Table 1 continued
Variables All firms ICT Non-ICTMean SD Mean SD Mean SD
2–4 years 0.01 0.01 0.01
5–9 years 0.05 0.07 0.05
≥10 years 0.93 0.92 0.94
Sector (%)
Mining and quarrying (C) 0.01 0.00 0.01
Manufacturing (D) 0.61 0.47 0.68
Electricity, gas and water supply (E) 0.00 0.00 0.00
Construction (F) 0.10 0.00 0.15
Wholesale and retail trade (G) 0.10 0.26 0.02
Hotels and restaurants (H) 0.13 0.00 0.02
Transport, storage and communication (I) 0.07 0.06 0.08
Financial intermediation (J) 0.01 0.04 0.00
Real estate, renting and business activities (K) 0.09 0.17 0.05
Number of observations 5,459 1,889 3,570
Number of firms 1,735 666 1,096
Count of ICT and non-ICT firms exceeds the number of all firms due to firms that changed category duringthe observation period. Monetary values in 2004 Euros
Around the respective sample means, this difference becomes smaller as the share ofolder workers in the firm increases, while the opposite holds for younger workers. Theshare of prime age workers is related to increases in the gap between value added andaverage wages until it reaches around 60%, and decreases thereafter.6
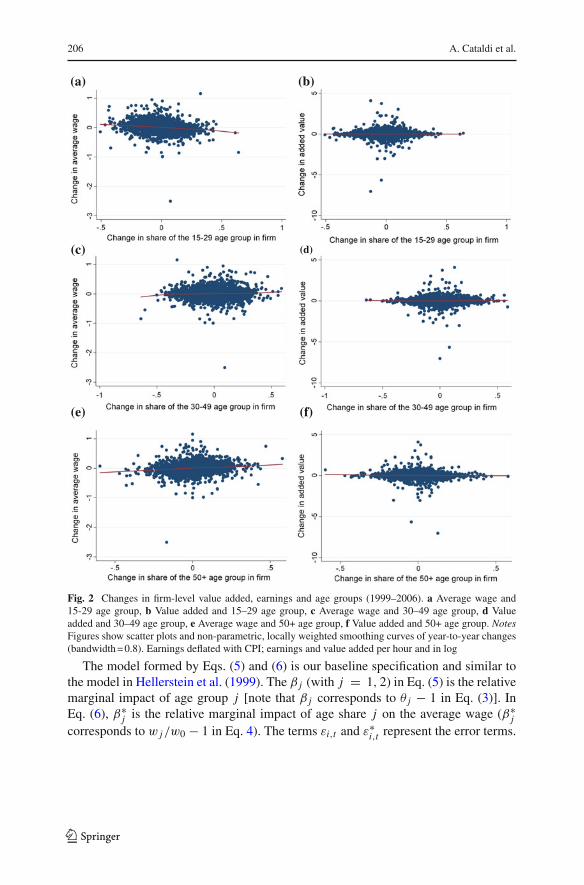
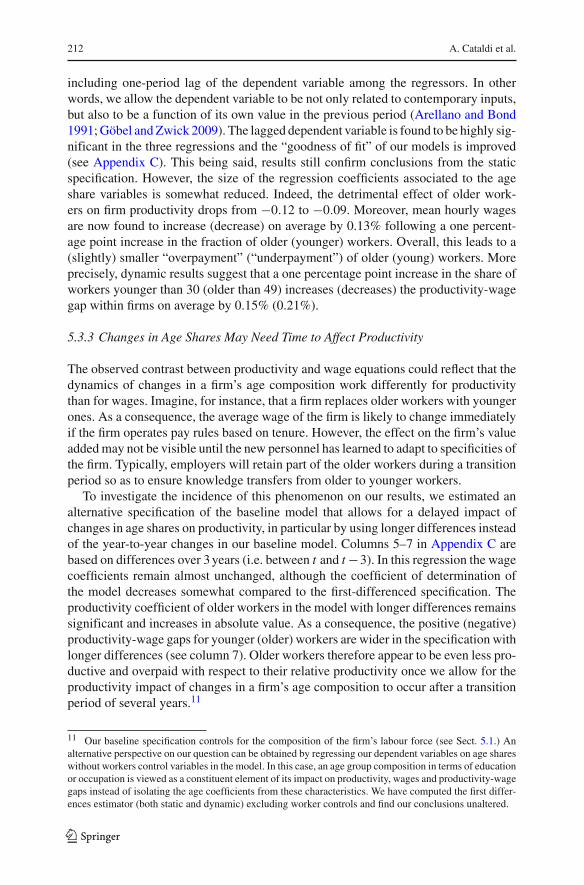
Comparing levels of age shares, value added and average wages across firms canbe problematic as all three variables might be affected simultaneously by unobservedfirm characteristics like idiosyncratic production processes, an advantageous geo-graphic location or a profitable patent. A solution to this problem is to look at year-to-year changes as is done in Fig. 2: computing changes eliminates by definitiontime-invariant firm characteristics. Figure 2 plots non-parametric curves and actualyear-to-year changes for each of the three age groups and the two variables of interest(firm-level value added and average wages). In our sample, the curves have slightlydifferent shapes if they are based on changes instead of levels. Again, the proportion ofyounger workers in a firm appears to be clearly negatively related to the average wagepaid by the firm, while this relationship appears to be positive for the respective sharesof prime age and older workers. However, the links between age shares and valueadded cease to be parallel to the impact on wages. Indeed, for all three age groups therelationship between age shares and value added appears to be flat. However, Figs. 1and 2 should be interpreted with caution: in contrast to the regression results presentedin the next section, they do not control for observable firm characteristics such as thefirm’s educational or occupational composition.
6 We thank an anonymous referee for the suggestion to include Fig. 1b in this section.
123
Productivity-Wage Gaps Among Age Groups 205
(a) Levels of value added and wages according to age groups
(b) Difference between value added and wages according to age groups
Fig. 1 Firm-level value added, earnings and age groups (1999–2006). Figure 1a shows quadratic predictionplots of firm-level value added and average wage as a function of age groups within firms. Figure 1b showsquadratic prediction plots of the difference between value added and average wage as a function of agegroups within firms. Earnings deflated with CPI; earnings and value added per hour and in log. In 80% offirms, the share of the 15–29 years group lies in the interval [0.06, 0.38]; the share of the 30–49 years in theinterval [0.47, 0.78]; and the share of 50+ workers in the interval [0.03, 0.31]
5 Specification and Results
5.1 Functional Specifications of the Model
In this section we describe the three different specifications of the Eqs. (2) and (4) thatwe estimated.
123
206 A. Cataldi et al.
(a) (b)
(c) (d)
(e) (f)
Fig. 2 Changes in firm-level value added, earnings and age groups (1999–2006). a Average wage and15-29 age group, b Value added and 15–29 age group, c Average wage and 30–49 age group, d Valueadded and 30–49 age group, e Average wage and 50+ age group, f Value added and 50+ age group. NotesFigures show scatter plots and non-parametric, locally weighted smoothing curves of year-to-year changes(bandwidth = 0.8). Earnings deflated with CPI; earnings and value added per hour and in log
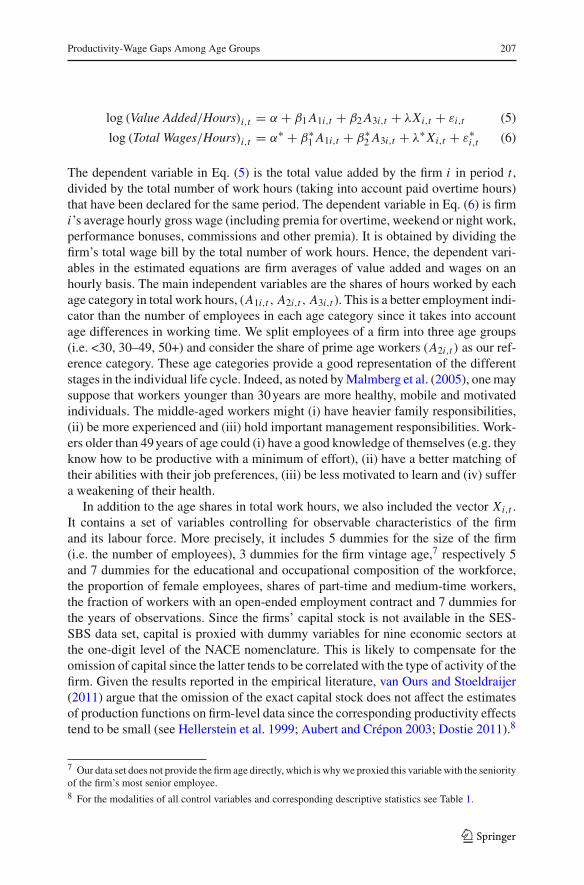
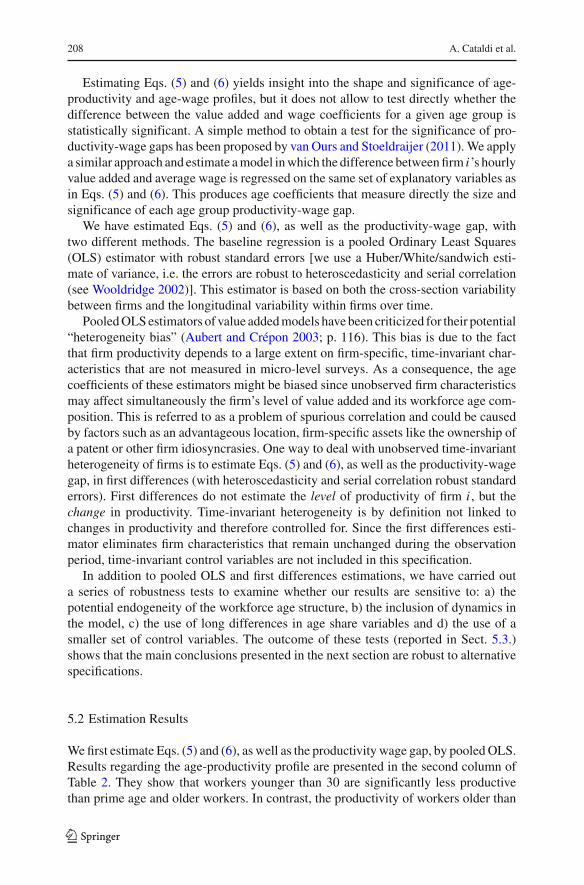
The model formed by Eqs. (5) and (6) is our baseline specification and similar tothe model in Hellerstein et al. (1999). The β j (with j = 1, 2) in Eq. (5) is the relativemarginal impact of age group j [note that β j corresponds to θ j − 1 in Eq. (3)]. InEq. (6), β∗
j is the relative marginal impact of age share j on the average wage (β∗j
corresponds to w j/w0 − 1 in Eq. 4). The terms εi,t and ε∗i,t represent the error terms.
123
Productivity-Wage Gaps Among Age Groups 207
log (Value Added/Hours)i,t = α + β1 A1i,t + β2 A3i,t + λXi,t + εi,t (5)
log (Total Wages/Hours)i,t = α∗ + β∗1 A1i,t + β∗
2 A3i,t + λ∗ Xi,t + ε∗i,t (6)
The dependent variable in Eq. (5) is the total value added by the firm i in period t ,divided by the total number of work hours (taking into account paid overtime hours)that have been declared for the same period. The dependent variable in Eq. (6) is firmi’s average hourly gross wage (including premia for overtime, weekend or night work,performance bonuses, commissions and other premia). It is obtained by dividing thefirm’s total wage bill by the total number of work hours. Hence, the dependent vari-ables in the estimated equations are firm averages of value added and wages on anhourly basis. The main independent variables are the shares of hours worked by eachage category in total work hours, (A1i,t , A2i,t , A3i,t ). This is a better employment indi-cator than the number of employees in each age category since it takes into accountage differences in working time. We split employees of a firm into three age groups(i.e. <30, 30–49, 50+) and consider the share of prime age workers (A2i,t ) as our ref-erence category. These age categories provide a good representation of the differentstages in the individual life cycle. Indeed, as noted by Malmberg et al. (2005), one maysuppose that workers younger than 30 years are more healthy, mobile and motivatedindividuals. The middle-aged workers might (i) have heavier family responsibilities,(ii) be more experienced and (iii) hold important management responsibilities. Work-ers older than 49 years of age could (i) have a good knowledge of themselves (e.g. theyknow how to be productive with a minimum of effort), (ii) have a better matching oftheir abilities with their job preferences, (iii) be less motivated to learn and (iv) suffera weakening of their health.
In addition to the age shares in total work hours, we also included the vector Xi,t .It contains a set of variables controlling for observable characteristics of the firmand its labour force. More precisely, it includes 5 dummies for the size of the firm(i.e. the number of employees), 3 dummies for the firm vintage age,7 respectively 5and 7 dummies for the educational and occupational composition of the workforce,the proportion of female employees, shares of part-time and medium-time workers,the fraction of workers with an open-ended employment contract and 7 dummies forthe years of observations. Since the firms’ capital stock is not available in the SES-SBS data set, capital is proxied with dummy variables for nine economic sectors atthe one-digit level of the NACE nomenclature. This is likely to compensate for theomission of capital since the latter tends to be correlated with the type of activity of thefirm. Given the results reported in the empirical literature, van Ours and Stoeldraijer(2011) argue that the omission of the exact capital stock does not affect the estimatesof production functions on firm-level data since the corresponding productivity effectstend to be small (see Hellerstein et al. 1999; Aubert and Crépon 2003; Dostie 2011).8
7 Our data set does not provide the firm age directly, which is why we proxied this variable with the seniorityof the firm’s most senior employee.8 For the modalities of all control variables and corresponding descriptive statistics see Table 1.
123
208 A. Cataldi et al.
Estimating Eqs. (5) and (6) yields insight into the shape and significance of age-productivity and age-wage profiles, but it does not allow to test directly whether thedifference between the value added and wage coefficients for a given age group isstatistically significant. A simple method to obtain a test for the significance of pro-ductivity-wage gaps has been proposed by van Ours and Stoeldraijer (2011). We applya similar approach and estimate a model in which the difference between firm i’s hourlyvalue added and average wage is regressed on the same set of explanatory variables asin Eqs. (5) and (6). This produces age coefficients that measure directly the size andsignificance of each age group productivity-wage gap.
We have estimated Eqs. (5) and (6), as well as the productivity-wage gap, withtwo different methods. The baseline regression is a pooled Ordinary Least Squares(OLS) estimator with robust standard errors [we use a Huber/White/sandwich esti-mate of variance, i.e. the errors are robust to heteroscedasticity and serial correlation(see Wooldridge 2002)]. This estimator is based on both the cross-section variabilitybetween firms and the longitudinal variability within firms over time.
Pooled OLS estimators of value added models have been criticized for their potential“heterogeneity bias” (Aubert and Crépon 2003; p. 116). This bias is due to the factthat firm productivity depends to a large extent on firm-specific, time-invariant char-acteristics that are not measured in micro-level surveys. As a consequence, the agecoefficients of these estimators might be biased since unobserved firm characteristicsmay affect simultaneously the firm’s level of value added and its workforce age com-position. This is referred to as a problem of spurious correlation and could be causedby factors such as an advantageous location, firm-specific assets like the ownership ofa patent or other firm idiosyncrasies. One way to deal with unobserved time-invariantheterogeneity of firms is to estimate Eqs. (5) and (6), as well as the productivity-wagegap, in first differences (with heteroscedasticity and serial correlation robust standarderrors). First differences do not estimate the level of productivity of firm i , but thechange in productivity. Time-invariant heterogeneity is by definition not linked tochanges in productivity and therefore controlled for. Since the first differences esti-mator eliminates firm characteristics that remain unchanged during the observationperiod, time-invariant control variables are not included in this specification.
In addition to pooled OLS and first differences estimations, we have carried outa series of robustness tests to examine whether our results are sensitive to: a) thepotential endogeneity of the workforce age structure, b) the inclusion of dynamics inthe model, c) the use of long differences in age share variables and d) the use of asmaller set of control variables. The outcome of these tests (reported in Sect. 5.3.)shows that the main conclusions presented in the next section are robust to alternativespecifications.
5.2 Estimation Results
We first estimate Eqs. (5) and (6), as well as the productivity wage gap, by pooled OLS.Results regarding the age-productivity profile are presented in the second column ofTable 2. They show that workers younger than 30 are significantly less productivethan prime age and older workers. In contrast, the productivity of workers older than
123
Productivity-Wage Gaps Among Age Groups 209
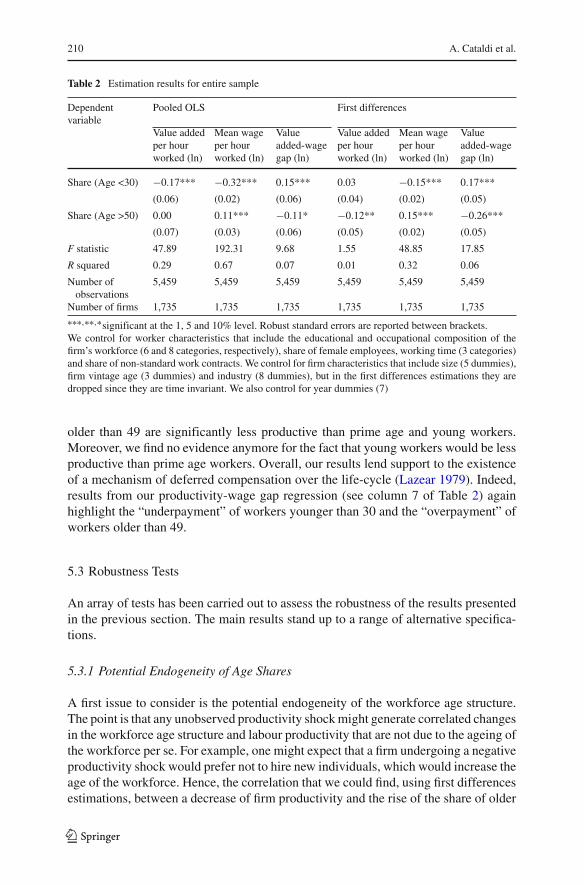
49 is not found to differ significantly from that of middle-aged workers. The regres-sion coefficient associated to the share of young workers is equal to −0.17. Thismeans that if the fraction of younger workers within a firm increases by one unit(i.e. one percentage point), productivity decreases on average by 0.17% (i.e. −0.17*0.01 = −0.0017 = −0.17%). Regression coefficients for the shares of young andolder workers can thus be roughly interpreted as elasticities between productivity andfractions of workers by age groups. Yet, one should keep in mind that a change in onegroup of (young, prime age or older) workers modifies the incidence of workers in theother groups (van Ours and Stoeldraijer 2011). Turning to the relationship betweenage and wage, results show (see column 3 of Table 2) that a one percentage pointincrease in the share of young workers decreases mean hourly wages within firmson average by 0.32%. On the opposite, mean hourly wages are found to increase onaverage by 0.11% following a one percentage point increase in the fraction of olderworkers. Findings thus support the existence of a significant upward sloping age-wageprofile. The comparison of estimates for the age-productivity and age-wage profilessuggests that young workers are paid below their marginal productivity while workersolder than 49 would be overpaid.9 Results from the productivity-wage gap regres-sion (reported in column 4 of Table 2) support this hypothesis. Indeed, the impactof the share of young (older) workers on the productivity-wage gap is found to besignificantly positive (negative).
However, these results should be interpreted with caution. Indeed, they may suf-fer from the fact that time-invariant unobserved workplace characteristics are notaccounted for. Indeed, the Breusch and Pagan (1980) Lagrangian multiplier is 4735.88for the value added and 4060.36 for the wage equation, which is why we refute theadequateness of pooled OLS for the estimation of Eqs. (5) and (6). We thereforere-estimated the model, as well as the productivity-wage gap, in first differences.Results for the age-wage profile are not very different than those in the OLS regression(see column 6 of Table 2). They again highlight that average hourly wages within firmsincrease significantly and monotonically with mean workers’ age. Yet, the regressioncoefficient associated to the share of young workers drops from −0.32 to −0.15 whilethat for the fraction of older workers increases from 0.11 to 0.15. Findings for the age-productivity profile after controlling for firm fixed effects are quite different from thoseobtained with OLS (see column 5 of Table 2). Indeed, results now show that workers
9 It can be argued that comparing β j (the estimate for the relative marginal productivity of age group j) withβ∗
j (the estimate for the difference in relative pay for age group j) may lead to imprecise conclusions as β j
underestimates differences in relative productivities given that β j = β(q j − 1
), whereas β∗
j = w j /w0 − 1
(see section 3). Indeed, Vandenberghe and Waltenberg (2010) propose to compare β∗j with β j /β = q j − 1
in order to adjust the estimates of the relative productivities of the different age groups for total labour pro-ductivity β [see Eq. (2)]. Unfortunately, our data do not allow to estimate β directly. In order to guaranteethe anonymity of firms in the SES-SBS, Statistics Belgium provides information on the total number ofemployees per firm only in 6 thresholds. As a result, firm size is basically a time-invariant variable (in ourdata set) which disappears in first differences specifications. Since values of β have been estimated to rangebetween 0.6 and 0.8 (Vandenberghe and Waltenberg 2010; van Ours and Stoeldraijer 2011), our estimatesshould therefore be interpreted as lower bounds for differences in relative productivities. Given that in mostspecifications discussed in this paper β j and β∗
j have opposite signs, the proposed adjustment would furtherincrease the magnitude (but not necessarily the significance) of the estimated productivity-wage gaps. Weare grateful to an anonymous referee for having pointed out this issue.
123
210 A. Cataldi et al.
Table 2 Estimation results for entire sample
Dependentvariable
Pooled OLS First differences
Value addedper hourworked (ln)
Mean wageper hourworked (ln)
Valueadded-wagegap (ln)
Value addedper hourworked (ln)
Mean wageper hourworked (ln)
Valueadded-wagegap (ln)
Share (Age <30) −0.17*** −0.32*** 0.15*** 0.03 −0.15*** 0.17***
(0.06) (0.02) (0.06) (0.04) (0.02) (0.05)
Share (Age >50) 0.00 0.11*** −0.11* −0.12** 0.15*** −0.26***
(0.07) (0.03) (0.06) (0.05) (0.02) (0.05)
F statistic 47.89 192.31 9.68 1.55 48.85 17.85
R squared 0.29 0.67 0.07 0.01 0.32 0.06
Number ofobservations
5,459 5,459 5,459 5,459 5,459 5,459
Number of firms 1,735 1,735 1,735 1,735 1,735 1,735∗∗∗,∗∗,∗significant at the 1, 5 and 10% level. Robust standard errors are reported between brackets.We control for worker characteristics that include the educational and occupational composition of thefirm’s workforce (6 and 8 categories, respectively), share of female employees, working time (3 categories)and share of non-standard work contracts. We control for firm characteristics that include size (5 dummies),firm vintage age (3 dummies) and industry (8 dummies), but in the first differences estimations they aredropped since they are time invariant. We also control for year dummies (7)
older than 49 are significantly less productive than prime age and young workers.Moreover, we find no evidence anymore for the fact that young workers would be lessproductive than prime age workers. Overall, our results lend support to the existenceof a mechanism of deferred compensation over the life-cycle (Lazear 1979). Indeed,results from our productivity-wage gap regression (see column 7 of Table 2) againhighlight the “underpayment” of workers younger than 30 and the “overpayment” ofworkers older than 49.
5.3 Robustness Tests
An array of tests has been carried out to assess the robustness of the results presentedin the previous section. The main results stand up to a range of alternative specifica-tions.
5.3.1 Potential Endogeneity of Age Shares
A first issue to consider is the potential endogeneity of the workforce age structure.The point is that any unobserved productivity shock might generate correlated changesin the workforce age structure and labour productivity that are not due to the ageing ofthe workforce per se. For example, one might expect that a firm undergoing a negativeproductivity shock would prefer not to hire new individuals, which would increase theage of the workforce. Hence, the correlation that we could find, using first differencesestimations, between a decrease of firm productivity and the rise of the share of older
123
Productivity-Wage Gaps Among Age Groups 211
workers could be purely spurious. A way to address this simultaneity problem is touse instruments that are correlated with the problematic explanatory variables anduncorrelated with the exogenous shocks (i.e. the error term).
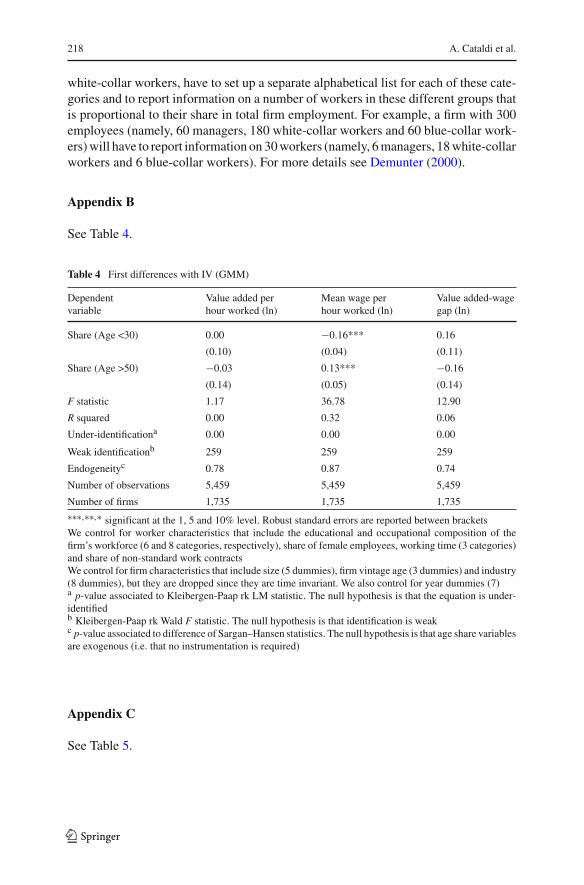
To explore the acuteness of the simultaneity problem in our data, we have estimatedEqs. (5) and (6), as well as the productivity-wage gap, in first differences and instru-mented the (differenced) age shares with the one-period lag of the level of these shares.In other words, the lagged level of age shares is assumed to be correlated with futurevalues of the instrumented variables but not with the exogenous shocks.10 We esti-mated the IV first-differenced equations using the Generalized Method of Moments(GMM) with a Newey-West variance-covariance matrix and standard errors that arerobust to heteroscedasticity and serial correlation. This IV approach has been appliedto productivity and wage equations by Aubert and Crépon (2003) and is now standardin the literature (van Ours 2009; Göbel and Zwick 2009). To examine the reliabilityof our results, we have computed the usual diagnostic tests for instrumental variables.First, the Kleibergen-Paap statistic for under-identification tests whether the equationis identified, i.e. whether the excluded instruments are all relevant. The null hypothesisin this test is that the equation is underidentified. Second, the Kleibergen-Paap statisticfor weak identification is a Wald F statistic testing whether the excluded instrumentsare sufficiently correlated with the endogenous regressors (the null hypothesis beingweak identification). Since a rejection rule for this test has yet to be established, we relyon the “rule of thumb” that weak identification is problematic for F-statistics smallerthan 10 (van Ours and Stoeldraijer 2011). Finally, we compute an endogeneity testwith the null hypothesis that the age shares can actually be treated as exogenous. Thetest is based on the difference of two Sargan–Hansen statistics: one for the equation inwhich the age shares are treated as endogenous, and one in which they are treated asexogenous. If the null hypothesis of this test cannot be rejected, then instrumentationis actually not necessary.
The results in Appendix B indicate that under- and weak identification is unprob-lematic in our case: we reject the hypothesis of under-identification at the one percentlevel and the Kleibergen-Paap statistics for weak identification are above 10. Moreover,we cannot reject the hypothesis that age shares can actually be treated as exogenous:the corresponding p-values are 0.78 (value added), 0.87 (wage) and 0.74 (productiv-ity-wage gap). This means that instrumentation is actually not necessary since thereappears to be no endogeneity in the age shares once we control for time-invariantunobserved firm characteristics by taking first differences. The results for GMM-IVreported in Appendix B should therefore be read with the disclaimer that the IV esti-mates are less efficient compared to our baseline model in first differences and thatinstrumentation is actually not necessary in our case.
5.3.2 Dynamic Specification
Another problem to consider is the potential state dependence of the dependent var-iable. To do so, we estimate a dynamic version of our models in first differences by
10 We have experimented with a larger set of instruments, for instance by including lags of age shares fort −2 and t −3. However, only the smaller set including one-period lags passed the test of weak identification.
123
212 A. Cataldi et al.
including one-period lag of the dependent variable among the regressors. In otherwords, we allow the dependent variable to be not only related to contemporary inputs,but also to be a function of its own value in the previous period (Arellano and Bond1991; Göbel and Zwick 2009). The lagged dependent variable is found to be highly sig-nificant in the three regressions and the “goodness of fit” of our models is improved(see Appendix C). This being said, results still confirm conclusions from the staticspecification. However, the size of the regression coefficients associated to the ageshare variables is somewhat reduced. Indeed, the detrimental effect of older work-ers on firm productivity drops from −0.12 to −0.09. Moreover, mean hourly wagesare now found to increase (decrease) on average by 0.13% following a one percent-age point increase in the fraction of older (younger) workers. Overall, this leads to a(slightly) smaller “overpayment” (“underpayment”) of older (young) workers. Moreprecisely, dynamic results suggest that a one percentage point increase in the share ofworkers younger than 30 (older than 49) increases (decreases) the productivity-wagegap within firms on average by 0.15% (0.21%).
5.3.3 Changes in Age Shares May Need Time to Affect Productivity
The observed contrast between productivity and wage equations could reflect that thedynamics of changes in a firm’s age composition work differently for productivitythan for wages. Imagine, for instance, that a firm replaces older workers with youngerones. As a consequence, the average wage of the firm is likely to change immediatelyif the firm operates pay rules based on tenure. However, the effect on the firm’s valueadded may not be visible until the new personnel has learned to adapt to specificities ofthe firm. Typically, employers will retain part of the older workers during a transitionperiod so as to ensure knowledge transfers from older to younger workers.
To investigate the incidence of this phenomenon on our results, we estimated analternative specification of the baseline model that allows for a delayed impact ofchanges in age shares on productivity, in particular by using longer differences insteadof the year-to-year changes in our baseline model. Columns 5–7 in Appendix C arebased on differences over 3 years (i.e. between t and t −3). In this regression the wagecoefficients remain almost unchanged, although the coefficient of determination ofthe model decreases somewhat compared to the first-differenced specification. Theproductivity coefficient of older workers in the model with longer differences remainssignificant and increases in absolute value. As a consequence, the positive (negative)productivity-wage gaps for younger (older) workers are wider in the specification withlonger differences (see column 7). Older workers therefore appear to be even less pro-ductive and overpaid with respect to their relative productivity once we allow for theproductivity impact of changes in a firm’s age composition to occur after a transitionperiod of several years.11
11 Our baseline specification controls for the composition of the firm’s labour force (see Sect. 5.1.) Analternative perspective on our question can be obtained by regressing our dependent variables on age shareswithout workers control variables in the model. In this case, an age group composition in terms of educationor occupation is viewed as a constituent element of its impact on productivity, wages and productivity-wagegaps instead of isolating the age coefficients from these characteristics. We have computed the first differ-ences estimator (both static and dynamic) excluding worker controls and find our conclusions unaltered.
123
Productivity-Wage Gaps Among Age Groups 213
6 Impact of ICT Intensity on Productivity and Wages of Age Groups
The relationship between age and productivity is likely to differ across firms: the stud-ies reviewed in Sect. 2 suggest that certain characteristics of the work environment suchas computerization or the use of innovative technologies play an asymmetric role foryounger and older workers. Given the scarce empirical evidence on the link betweenage-productivity profiles and ICT, this section presents estimates of our model for twodistinct types of firms: those belonging to sectors intensively using or producing ICTgoods and services and those that do not. The subdivision of firms is based on the ICTtaxonomy developed by O’Mahoney and van Ark (2003).12
Applied to our sample, this ICT taxonomy classifies 666 firms as ICT and 1,096as non-ICT firms.13 These two types differ along several dimensions (see Table 1).Both the average hourly value added and wage are higher in ICT compared to non-ICTfirms (for the period 1999–2006 the ICT values were 12 and 13% higher, respectively),confirming the intuition that ICT firms are in general more productive. Differences inthe educational and occupational composition also exist: the workforce of ICT firmsis on average much more educated and more concentrated in white collar occupationscompared to non-ICT firms. Interestingly, ICT firms are also characterised by a morefeminine labour force and sign more part- and medium-time work contracts. More-over, it is noteworthy that non-ICT employment is predominantly concentrated in themanufacturing sector (around 68%), while a large fraction of workers employed inICT firms is also found in wholesale and retail trade (around 26%) and real estate,renting and business activities (around 17%). By contrast, the age composition of thetwo sectors hardly differs: although ICT firms have a somewhat younger labour force,the respective proportions of our three age groups are relatively close.
12 ICT firms are found in the following sectors: Clothing (NACE 18); Printing and publishing (NACE22); Mechanical engineering (NACE 29); Other electrical machinery and apparatus, except insulated wire(NACE 31); Other instruments, except scientific instruments (NACE 33); Building and repairing of shipsand boats (NACE 351); Aircraft and spacecraft (NACE 353); Furniture, miscellaneous manufacturing; recy-cling (NACE 36–37); Wholesale trade and commission trade, except of motor vehicles and motorcycles(NACE 51); Retail trade, except of motor vehicles and motorcycles; repair of personal and household goods(NACE 52); Financial activities, except insurance and pension funding (NACE 65); Activities auxiliary tofinancial intermediation (NACE 67); Renting of machinery and equipment (NACE 71); Legal, technicaland advertising (NACE 741–743); Office machinery (NACE 30); Insulated wire (NACE 313); Electronicvalves and tubes (NACE 321); Telecommunication equipment (NACE 322); Radio and television receiv-ers (NACE 323); Scientific instruments (NACE 331); Communications (NACE 64); Computer and relatedactivities (NACE 72). Non-ICT firms are found in the following sectors: Quarrying (NACE 14); Food, drinkand tobacco (NACE 15–16); Textiles (NACE 17); Leather and footwear (NACE 19); Wood and products ofof wood and cork (NACE 20); Pulp, paper and paper products (NACE 21); Mineral oil refining, coke andnuclear fuel (NACE 23); Chemicals (NACE 24); Rubbers and plastics (NACE 25); Non-metallic mineralproducts (NACE 26); Basic metals (NACE 27); Fabricated metal products (NACE 28); Motor vehicles(NACE 34); Construction (NACE 45); Sale, maintenance and repair of motor vehicles and motorcycles; retail sale of automotive fuel (NACE 50); Hotels and restaurants (NACE 55); Inland transport (NACE60); Water transport (NACE 61); Air transport (NACE 62); Supporting and auxiliary transport activities;activities of travel agencies (NACE 63); Real estate activities (NACE 70); Other business activities (NACE749).13 The sum of ICT and non-ICT firms (1,762) is greater than the total number of firms in the baseline model(1,735). This is due to a small number of firms that changed NACE codes during the period 1999–2006.Supression of these firms does not affect our conclusions.
123
214 A. Cataldi et al.
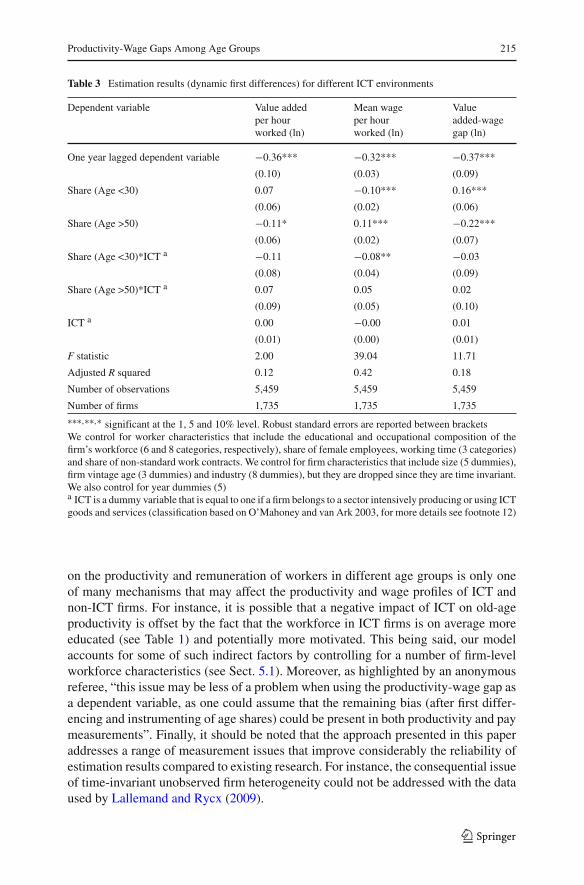
To test formally for differences between ICT and non-ICT firms, we add to ourbaseline model: a) a dummy variable that equals 1 if the firm is classified as beingICT intensive and b) interactions between this ICT dummy and all other explana-tory variables. We focus here on the specification with dynamic first differences. Theconclusions drawn from the baseline regressions and the robustness tests—i.e. hetero-geneity bias in pooled OLS and absence of endogeneity—also apply to specificationswith interaction variables but are not repeated here due to space constraints.
The coefficients for dynamic first-differences are presented in Table 3. Lookingat the wage coefficients (column 3), the estimates suggest that age has a strongerimpact on remuneration in ICT than in non-ICT environments: younger workers inICT firms are paid significantly less (with respect to prime age workers) than in non-ICT firms. By contrast, the relationship between the share of older workers and thefirms’ average wage is not significantly different in ICT and non-ICT environments.This suggests that some of the wider wage dispersion in ICT firms (see Table 1)is due to a more prominent role of the age dimension in the wage setting of ICTcompared to non-ICT firms. We performed a formal Wald test (i.e. a Chow test withthe robust variance estimates) to see whether the interaction coefficients for youngerand older workers are jointly different from zero. The F statistic for the wage equa-tion is 2.98, implying that the age-wage relationship is significantly different in ICTfirms.
As for the productivity coefficients (column 2 in Table 3), the results suggest thatthe lower productivity of older workers relative to the prime age group that we foundin our baseline regression appears in both ICT and non-ICT firms: a one percentagepoint increase of the share of older workers decreases firm productivity by 0.11%for both types of firms. The interaction variables for ICT firms are individually andjointly insignificantly different from zero. This suggests that relative productivitiesacross age groups do not depend on the ICT environment of firms.14
The resulting productivity-wage gaps are also similar in both sectors (column 4 inTable 3): older workers appear to be significantly over- and younger workers underpaidcompared to their relative contributions to the firm value added in both ICT and non-ICT firms. Again, we cannot reject the hypothesis that the ICT interaction coefficientsfor younger and older workers are individually and jointly equal to zero. Althoughthe impact of the share of young workers on wages is found to be smaller in non-ICTfirms, the magnitude of the productivity-wage gaps appear to be similar in both typesof work environment.
Yet, it should be noted that our results do not allow to make any definite statementabout the causality of the observed correlations. The point is that “being ICT intensive”may not be considered as an exogenous treatment that can be assimilated to a naturalexperiment. As a result, what we interpret as the direct impact of the ICT environment
14 Interestingly, our results corroborate other empirical findings according to which age-productivity pro-files are relatively similar between different sectors. For instance, in one of the few studies that exist onBelgium, Vandenberghe and Waltenberg (2010) argue that the lower relative productivity of older workersis not mitigated by the working conditions of the service sector. In contrast, our results do not supportLallemand and Rycx (2009)’s conclusion for the Belgian private sector according to which age structureeffects on productivity would be stronger in ICT than in non-ICT firms. Yet, differences in results canprobably be explained by the fact that Lallemand and Rycx (2009) had only access to cross-sectional data.
123
Productivity-Wage Gaps Among Age Groups 215
Table 3 Estimation results (dynamic first differences) for different ICT environments
Dependent variable Value addedper hourworked (ln)
Mean wageper hourworked (ln)
Valueadded-wagegap (ln)
One year lagged dependent variable −0.36*** −0.32*** −0.37***
(0.10) (0.03) (0.09)
Share (Age <30) 0.07 −0.10*** 0.16***
(0.06) (0.02) (0.06)
Share (Age >50) −0.11* 0.11*** −0.22***
(0.06) (0.02) (0.07)
Share (Age <30)*ICT a −0.11 −0.08** −0.03
(0.08) (0.04) (0.09)
Share (Age >50)*ICT a 0.07 0.05 0.02
(0.09) (0.05) (0.10)
ICT a 0.00 −0.00 0.01
(0.01) (0.00) (0.01)
F statistic 2.00 39.04 11.71
Adjusted R squared 0.12 0.42 0.18
Number of observations 5,459 5,459 5,459
Number of firms 1,735 1,735 1,735∗∗∗,∗∗,∗ significant at the 1, 5 and 10% level. Robust standard errors are reported between bracketsWe control for worker characteristics that include the educational and occupational composition of thefirm’s workforce (6 and 8 categories, respectively), share of female employees, working time (3 categories)and share of non-standard work contracts. We control for firm characteristics that include size (5 dummies),firm vintage age (3 dummies) and industry (8 dummies), but they are dropped since they are time invariant.We also control for year dummies (5)a ICT is a dummy variable that is equal to one if a firm belongs to a sector intensively producing or using ICTgoods and services (classification based on O’Mahoney and van Ark 2003, for more details see footnote 12)
on the productivity and remuneration of workers in different age groups is only oneof many mechanisms that may affect the productivity and wage profiles of ICT andnon-ICT firms. For instance, it is possible that a negative impact of ICT on old-ageproductivity is offset by the fact that the workforce in ICT firms is on average moreeducated (see Table 1) and potentially more motivated. This being said, our modelaccounts for some of such indirect factors by controlling for a number of firm-levelworkforce characteristics (see Sect. 5.1). Moreover, as highlighted by an anonymousreferee, “this issue may be less of a problem when using the productivity-wage gap asa dependent variable, as one could assume that the remaining bias (after first differ-encing and instrumenting of age shares) could be present in both productivity and paymeasurements”. Finally, it should be noted that the approach presented in this paperaddresses a range of measurement issues that improve considerably the reliability ofestimation results compared to existing research. For instance, the consequential issueof time-invariant unobserved firm heterogeneity could not be addressed with the dataused by Lallemand and Rycx (2009).
123
216 A. Cataldi et al.
7 Conclusion
The ageing of the labour force in Europe and elsewhere creates the need to disentanglethe relationship between age, wage and productivity. In this paper, we examine howchanges in the proportion of young (16–29 years), middle-aged (30–49 years) and older(more than 49 years) workers affect the productivity and remuneration of firms. Wefurther investigate the presence of productivity-wage gaps for these age groups in dif-ferent ICT environments. To do so, we use longitudinal matched employer-employeedata covering the Belgian private sector over the period 1999–2006. Our data allows totackle a range of measurement issues that have hampered the existing literature in thisarea of research: the panel data provides accurate information on average productivityand wages within firms; controls for a wide range of worker and firm characteristics;includes age variables in terms of hours worked rather than on a per capita basis; andpermits to deal with time-invariant unobserved firm heterogeneity, the endogeneity ofage shares and state dependence of firm productivity and wages.
Results based on our preferred specification indicate that workers above 49 yearsare significantly less productive than their younger colleagues. Moreover, while rel-ative productivities across age groups are not found to differ significantly betweenICT and non ICT firms, the upward sloping age-wage profile appears to be somewhatsteeper in ICT firms. Yet, whatever the ICT environment, findings show that youngworkers are paid below and older workers above their marginal productivity.
Our results may have important policy implications. Firstly, the fact that older work-ers are found to be less productive than their younger colleagues suggests that policiesaiming to improve the employment rate of older people (e.g. abolishing early retirementschemes or lifting the legal retirement age) may be detrimental for firm productivity.This result also suggests that more effort should be devoted to: a) the improvementof working conditions so as to reduce the impact of ageing on workers’ physical andmental health (and productivity) and b) the implementation of high-quality trainingprogrammes for the elderly.
Secondly, the fact that age-productivity profiles do not appear to depend on theICT environment of firms suggests that one should be cautious with oversimplifi-cations according to which technological change would be intrinsically positive fortechnologically literate youngsters and necessarily bad for veterans who started theircareer in the pre-internet area. New technologies are likely to perform more diver-sified roles than simply rendering accumulated skills obsolete as suggested by partsof the theoretical literature. Some technologies, including ICT, might also help olderworkers to maintain constant levels of productivity by assisting them in a wide rangeof cognitive and physically demanding tasks. By contrast, older workers employed inareas in which the pace of technological change in production processes is slow (like,for instance, in the construction sector) might face more difficulties to keep up withyounger workers’ higher physical and cognitive abilities.
Finally, our conclusion that young workers are paid below their marginal produc-tivity while older workers appear to be “overpaid” is in line with the deferred paymentmodel developed by Lazear (1979). This compensation scheme may be beneficial toboth employers and employees in internal labour markets and raise the present valueof career compensation. Indeed, the adoption of such scheme would improve employ-
123
Productivity-Wage Gaps Among Age Groups 217
ees’ productivity (because it stimulates workers’ effort, reduces monitoring costs andenables firms to hire and retain the best employees) and hence allow firms to pay higherpresent value career compensation than otherwise (Ehrenberg and Smith 2003). As aconsequence, the observed under- and over-payment of respectively young and olderworkers in the Belgian private sector should not be harmful to employers with inter-nal labour markets, except if the present value of career compensation exceeds thatof marginal productivities. The same should be true for their employees unless: (i)career compensation falls short of marginal product value, (ii) the firm goes bankruptbefore they retire, (iii) they are fired before they reach an age at which they benefitfrom potential end-of-career overpayment. The latter reason should not be neglectedbecause deferred compensation schemes may incite firms to dismiss workers beforethey get older so as to maximise their profits (at least in the short run). An importantcaveat of this interpretation is that a significant fraction of firms operate on exter-nal labour markets where workers and firms are more concerned with the immediaterelation between pay and productivity (Lazear and Oyer 2003). The optimality of adeferred compensation scheme on that portion of the labour market is therefore lessstraightforward. Given that age-productivity profiles appear to be similar in ICT andnon-ICT firms, the higher wage penalty we observe for young workers (relative toprime age workers) in ICT firms suggests that deferred payment may be positivelyrelated to ICT-capital intensity.
Acknowledgements We would like to thank two anonymous referees and the managing editor for valuablecomments and suggestions. We are also most grateful to Statistics Belgium for giving access to the data.The usual disclaimer applies.
Appendix A: Further Description of the Data
The ‘Structure of Earnings Survey’ (SES) is a stratified sample. The stratification cri-teria refer respectively to the region (NUTS-groups), the principal economic activity(NACE-groups) and the size of the firm. The sample size in each stratum dependson the size of the firm. Sampling percentages of firms are respectively equal to 10,50 and 100% when the number of workers is lower than 50, between 50 and 99, andabove 100. Within a firm, sampling percentages of employees also depend on size.Sampling percentages of employees reach respectively 100, 50, 25, 14.3 and 10%when the number of workers is lower than 20, between 20 and 50, between 50 and99, between 100 and 199, and between 200 and 299. Firms employing 300 workers ormore have to report information for an absolute number of employees. This numberranges between 30 (for firms with between 300 and 349 workers) and 200 (for firmswith 12,000 workers or more). To guarantee that firms report information on a repre-sentative sample of their workers, they are asked to follow a specific procedure. First,they have to rank their employees in alphabetical order. Next, Statistics Belgium givesthem a random letter (e.g. the letter O) from which they have to start when reportinginformation on their employees (following the alphabetical order of workers’ namesin their list). If they reach the letter Z and still have to provide information on someof their employees, they have to continue from the letter A in their list. Moreover,firms that employ different categories of workers, namely managers, blue- and/or
123
218 A. Cataldi et al.
white-collar workers, have to set up a separate alphabetical list for each of these cate-gories and to report information on a number of workers in these different groups thatis proportional to their share in total firm employment. For example, a firm with 300employees (namely, 60 managers, 180 white-collar workers and 60 blue-collar work-ers) will have to report information on 30 workers (namely, 6 managers, 18 white-collarworkers and 6 blue-collar workers). For more details see Demunter (2000).
Appendix B
See Table 4.
Table 4 First differences with IV (GMM)
Dependentvariable
Value added perhour worked (ln)
Mean wage perhour worked (ln)
Value added-wagegap (ln)
Share (Age <30) 0.00 −0.16*** 0.16
(0.10) (0.04) (0.11)
Share (Age >50) −0.03 0.13*** −0.16
(0.14) (0.05) (0.14)
F statistic 1.17 36.78 12.90
R squared 0.00 0.32 0.06
Under-identificationa 0.00 0.00 0.00
Weak identificationb 259 259 259
Endogeneityc 0.78 0.87 0.74
Number of observations 5,459 5,459 5,459
Number of firms 1,735 1,735 1,735∗∗∗,∗∗,∗ significant at the 1, 5 and 10% level. Robust standard errors are reported between bracketsWe control for worker characteristics that include the educational and occupational composition of thefirm’s workforce (6 and 8 categories, respectively), share of female employees, working time (3 categories)and share of non-standard work contractsWe control for firm characteristics that include size (5 dummies), firm vintage age (3 dummies) and industry(8 dummies), but they are dropped since they are time invariant. We also control for year dummies (7)a p-value associated to Kleibergen-Paap rk LM statistic. The null hypothesis is that the equation is under-identifiedb Kleibergen-Paap rk Wald F statistic. The null hypothesis is that identification is weakc p-value associated to difference of Sargan–Hansen statistics. The null hypothesis is that age share variablesare exogenous (i.e. that no instrumentation is required)
Appendix C
See Table 5.
123
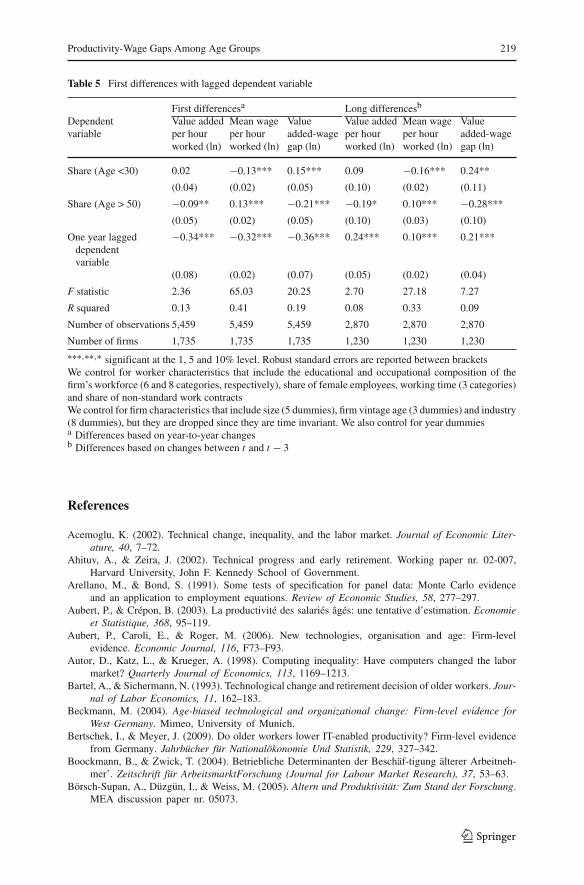
Productivity-Wage Gaps Among Age Groups 219
Table 5 First differences with lagged dependent variable
First differencesa Long differencesb
Dependentvariable
Value addedper hourworked (ln)
Mean wageper hourworked (ln)
Valueadded-wagegap (ln)
Value addedper hourworked (ln)
Mean wageper hourworked (ln)
Valueadded-wagegap (ln)
Share (Age <30) 0.02 −0.13*** 0.15*** 0.09 −0.16*** 0.24**
(0.04) (0.02) (0.05) (0.10) (0.02) (0.11)
Share (Age > 50) −0.09** 0.13*** −0.21*** −0.19* 0.10*** −0.28***
(0.05) (0.02) (0.05) (0.10) (0.03) (0.10)
One year laggeddependentvariable
−0.34*** −0.32*** −0.36*** 0.24*** 0.10*** 0.21***
(0.08) (0.02) (0.07) (0.05) (0.02) (0.04)
F statistic 2.36 65.03 20.25 2.70 27.18 7.27
R squared 0.13 0.41 0.19 0.08 0.33 0.09
Number of observations 5,459 5,459 5,459 2,870 2,870 2,870
Number of firms 1,735 1,735 1,735 1,230 1,230 1,230∗∗∗,∗∗,∗ significant at the 1, 5 and 10% level. Robust standard errors are reported between bracketsWe control for worker characteristics that include the educational and occupational composition of thefirm’s workforce (6 and 8 categories, respectively), share of female employees, working time (3 categories)and share of non-standard work contractsWe control for firm characteristics that include size (5 dummies), firm vintage age (3 dummies) and industry(8 dummies), but they are dropped since they are time invariant. We also control for year dummiesa Differences based on year-to-year changesb Differences based on changes between t and t − 3
References
Acemoglu, K. (2002). Technical change, inequality, and the labor market. Journal of Economic Liter-ature, 40, 7–72.
Ahituv, A., & Zeira, J. (2002). Technical progress and early retirement. Working paper nr. 02-007,Harvard University, John F. Kennedy School of Government.
Arellano, M., & Bond, S. (1991). Some tests of specification for panel data: Monte Carlo evidenceand an application to employment equations. Review of Economic Studies, 58, 277–297.
Aubert, P., & Crépon, B. (2003). La productivité des salariés âgés: une tentative d’estimation. Economieet Statistique, 368, 95–119.
Aubert, P., Caroli, E., & Roger, M. (2006). New technologies, organisation and age: Firm-levelevidence. Economic Journal, 116, F73–F93.
Autor, D., Katz, L., & Krueger, A. (1998). Computing inequality: Have computers changed the labormarket?. Quarterly Journal of Economics, 113, 1169–1213.
Bartel, A., & Sichermann, N. (1993). Technological change and retirement decision of older workers. Jour-nal of Labor Economics, 11, 162–183.
Beckmann, M. (2004). Age-biased technological and organizational change: Firm-level evidence forWest Germany. Mimeo, University of Munich.
Bertschek, I., & Meyer, J. (2009). Do older workers lower IT-enabled productivity? Firm-level evidencefrom Germany. Jahrbücher für Nationalökonomie Und Statistik, 229, 327–342.
Boockmann, B., & Zwick, T. (2004). Betriebliche Determinanten der Beschäf-tigung älterer Arbeitneh-mer’. Zeitschrift für ArbeitsmarktForschung (Journal for Labour Market Research), 37, 53–63.
Börsch-Supan, A., Düzgün, I., & Weiss, M. (2005). Altern und Produktivität: Zum Stand der Forschung.MEA discussion paper nr. 05073.
123
220 A. Cataldi et al.
Bresnahan, T., Brynjolfsson, E., & Lorin, M. (2002). Information technology, workplace organization andthe demand for skilled labour: Firm-level evidence. Quarterly Journal of Economics, 117, 339–376.
Breusch, T., & Pagan, A. (1980). The LM test and its application to model specification in economet-rics. Review of Economic Studies, 47, 239–254.
Brooke, L. (2003). Human resources costs and benefits of maintaining a mature-age workforce. Inter-national Journal of Manpower, 24, 260–284.
Card, D., & DiNardo, J. (2002). Skill-biased technological change and rising wage inequality: Someproblems and puzzles. Journal of Labor Economics, 20, 733–783.
Cardoso, A. R., Guimarães, P., & Varejão, J. (2011). Are older workers worthy of their pay? Anempirical investigation of age-productivity and age-wage nexuses. De Economist. doi:10.1007/s10645-011-9163-8.
Czaja, S., & Sharit, J. (1998). Ability performance relationship as a function of age and task experiencefor a data entry task. Journal of Experimental Psychology: Applied, 4, 332–351.
De Koning, J. (2005). Incentives to take up work and remain at work longer. Paper presented at theThematic Review Seminar of the European Employment Strategy, April 20, 2005.
Demunter, C. (2000). Structure and distribution of earnings survey: Analysis 1995. Statistics Belgiumworking paper, Brussels.
Dostie, B. (2011). Wages, productivity and aging. De Economist, 159. doi:10.1007/s10645-011-9166-5.Ehrenberg, R., & Smith, R. (2003). Modern labor economics. Theory and public policy. Boston: Addison-
Wesley.eInclusion@EU (2007). ICT for active ageing at work. Reflection paper for the i2010 eInclusion
SubGroup, Brussels.Friedberg, L. (2003). The impact of technological change on older workers: Evidence from data on
computer use. Industrial and Labor Relations Review, 56, 511–529.Giannakouris, K. (2008). Ageing characterises the demographic perspectives of the European societies.
Statistics in Focus nr. 72, Eurostat.Göbel, C., & Zwick, T. (2009). Age and productivity—Evidence from linked employer employee data.
ZEW discussion paper nr. 09-020, Mannheim.Goos, M., & Manning, A. (2007). Lousy and lovely jobs: The rising polarization of work in Britain. Review
of Economics and Statistics, 89, 118–133.Grund, C., & Westergaard-Nielsen, N. (2005). Age structure of the workforce and firm performance.
IZA discussion paper nr. 1818, Bonn.Hellerstein, J., & Neumark, D. (1995). Are earnings profiles steeper than productivity profiles? Evidence
from Israeli firm data. Journal of Human Resources, 30, 89–112Hellerstein, J., & Neumark, D. (2004). Production function and wage equation estimation with hetero-
geneous labor: Evidence from a new matched employer-employee data set. NBER working papernr. 10365, Cambridge (Ma.).
Hellerstein, J., Neumark, D., & Troske, K. (1999). Wages, productivity and worker characteristics:Evidence from plant-level production functions and wage equations. Journal of Labor Econom-ics, 17, 409–446.
Ilmakunnas, P., & Maliranta, M. (2005). Technology, labour characteristics and wage-productivitygaps. Oxford Bullettin of Economic and Statistics, 67, 623–644.
Johnson, W. (1978). A theory of job shopping. Quarterly Journal of Economics, 92, 261–277.Jovanovic, B. (1979). Job matching and the theory of turnover. Journal of Political Economy, 87, 972–990.Kampelmann, S., & Rycx, F. (2011). Task-biased changes of employment and remuneration: The case
of occupations. IZA discussion paper nr. 5470, Bonn.Lallemand, T., & Rycx, F. (2009). Are older workers harmful for firm productivity?. De Econo-
mist, 157, 273–292.Lazear, E. (1979). Why is there mandatory retirement?. Journal of Political Economy, 87, 1261–1284.Lazear, E., & Oyer, P. (2003). Internal and external labour markets: A personnel economics approach.
NBER working paper nr. 10191, Cambridge (Ma.).Malmberg, B., Lindh, T., & Halvarsson, M. (2005). Productivity consequences of workforce aging—
Stagnation or horndal effect? Working paper nr. 2005-17, Institute for Futures Studies, Stockholm.Mincer, J. (1974). Schooling, experience and earnings. New York: NBER.Ng, T., & Feldman, D. (2008). The relationship of age to ten dimensions of job performance. Journal
of Applied Psychology, 93, 392–423.OECD. (2003). Ageing and employment policies—Belgium. Paris: OECD.
123
Productivity-Wage Gaps Among Age Groups 221
OECD. (2006). Live longer, work longer. Paris: OECD.OECD. (2010). Employment outlook. Paris: OECD.O’Mahoney, M., & Ark, B.van (2003). EU productivity and competitiveness: An industry perspective.
Can Europe resume the catching-up process?. Luxembourg: European Commission.Prskawetz, A., Mahlberg, B., Skirbekk, V., Freund, I., Winkler-Dworak, M., Lindh, T., Malmberg, B.,
Nordström, O., & Andersson, F. (2006). The impact of population aging on innovation andproductivity growth in Europe. Research report nr. 28 for the European Commission, ViennaInstitute of Demography.
Schleife, K. (2008). IT training and employability of older workers. ZEW discussion paper nr. 08-021.Shepard, R. (1999). Age and physical work capacity. Experimental Aging Research, 25, 331–343.Skirbekk, V. (2003). Age and individual productivity: A literature survey. Technical report nr. 2003-028,
Max Planck Institute for Demographic Research.Tang, J., & MacLeod, C. (2006). Labour force aging and productivity performance in Canada. Canadian
Journal of Economics, 39, 583–603.Taylor, T., & Rose, J. (2005). Bridging the divide: Older learners and new technologies—ICT and older
learners: Strategies and case studies. In Proceedings of the 8th Australian vocational educationand training research association conference, Brisbane.
van Ours, J. (2009). Will you still need me: When I’m 64?’. De Economist, 158, 441–460.van Ours, J. C., & Stoeldraijer, L. (2011). Age, wage and productivity in Dutch manufacturing. De
Economist, 159. doi:10.1007/s10645-011-9159-4.Vandenberghe, V., & Waltenberg, F. (2010). Ageing workforce, productivity and labour costs of Belgian
firms. IRES discussion paper nr. 2010-3, Louvain-la-Neuve.Walewski, M. (2008). Differences in the productivity levels of older workers in the EU A cross country
analysis of the age-wage relationship. ENEPRI research report nr. 49 AIM-WP6.Wooldridge, J. (2002). Econometric analysis of cross section and panel data. Boston: MIT Press.
123
Copyright © 2022 FDOKUMEN

