


Bahasa
Halaman
Hukum


Principals on the Path to Excellence
A High-Impact Support System for Novice Principals
National Institute for School Leadership
A Validation Grant Proposal under the Investing in Innovation Grant Program (CFDA 84.411B)
Absolute Priority 1a—Developing and Implementing Models of Support for Novice Principals
Project Narrative
Contents
Absolute Priority Page 1
A. Significance Page 1
B. Quality of the Project Design Page 12
C. Quality of the Management Plan and Personnel Page 18
D. Quality of Project Evaluation Page 30
Competitive Preference Priorities Page 57

National Institute for School Leadership: Principals on the Path to Excellence 2
ABSOLUTE PRIORITY We submit this i3 Validation Grant proposal under Absolute Priority 1a—Developing and
implementing models of induction and support for novice principals. Our project will:
• Train and support 150 novice middle school principals across three states (California,
Florida and Mississippi) to become highly effective instructional leaders
• Increase student achievement for more than 375,000 students by expanding the EDP
beyond the treatment group to positively impact 750 schools during the five-year project
• Produce high-utility evaluation results from three rigorous, randomized control trials
• Result in broad adoption by building local capacity in three states, codifying critical
elements of the program and disseminating project results
A. SIGNIFICANCE
Hiring a highly effective principal may well be the most powerful and cost-effective method
to improve teacher effectiveness, raise student achievement and transform a school.
Unfortunately, there is strong evidence that the majority of the nation’s 100,000 current
principals are ill prepared to do the job—and most principal training is mediocre at best. The
implementation of the Common Core State Standards is revealing the full extent of the
challenge. Most principals have never been taught how to implement major changes, let alone
create a standards-based school. This proposal addresses the shortfall of highly effective
principals by creating a system that will lead novice principals on the path to excellence.
1) Reimagining School Leadership to Meet a National Need. More than a decade ago, our
parent organization, the National Center on Education and the Economy (NCEE), recognized
that system change and innovation in education required reimagining school leadership—
traditionally a purely administrative job—for the 21st century. No school can achieve the
profound instructional shifts required to spur student achievement without school leaders who

National Institute for School Leadership: Principals on the Path to Excellence 3
truly know how to lead and drive for results. Instructional leadership is in scarce supply in
schools—and districts know it. Yet they are hamstrung by subpar solutions—either homegrown
programs that often lack the research and rigor to achieve results or national, boutique programs
so expensive that districts can afford to train only a handful of school leaders.
Our Executive Development Program for School Leaders (EDP) is different. The program is
the culmination of a four-year, $11 million R&D initiative, with strong philanthropic support
from the Carnegie Foundation, The Broad Foundation, the New Schools Venture Fund, the
Stupski Foundation and NCEE. The R&D effort included benchmarking the best educational
leadership development practices worldwide and identifying the best adult learning methods and
strategies used in business, medicine, law, education and the military.
Exceptional leadership development approaches culled from international best practices,
leading professions and the military are now infused throughout the EDP. The program offers
sustained, cohort-based, job-embedded and applied learning, using a blended learning model of
face-to-face and technology-enhanced learning, including video interviews from leading
educators, case studies, best practice videos, game playing, simulations and online journaling.
The EDP empowers principals to become instructional leaders and drive their schools to high
performance. The program emphasizes the role of principals as strategic thinkers, instructional
leaders and creators of a just, fair and caring culture in which all students, including high-need
students, meet high standards. It ensures that principals can effectively set direction for teachers,
support their staffs and design an efficient organization. Principals learn to establish, share and
reach the vision and goals of world-class schooling in standards-based systems. They are given
tools to become instructional leaders and gain the knowledge to confidently recognize and guide
strong instruction in literacy, math and science. They develop the capacity to promote
National Institute for School Leadership: Principals on the Path to Excellence 4
professional learning, build collaborative teams, drive change and lead for results. And they go
beyond research and theory to apply this training in their schools using Action Learning Projects,
which customize the program to meet principals’ individual needs and connect the curriculum to
real school challenges. (See Appendix J2 for the research supporting the EDP and Appendix J6
for a detailed description of the EDP curriculum).
In 2005, after a successful pilot of the EDP, NCEE launched the National Institute for School
Leadership (NISL) to manage the implementation and scale-up of the program. NISL’s proven
train-the-trainer model, in which state or district leaders are fully trained in the EDP and certified
as facilitators to deliver the program with fidelity, builds state and district capacity to take
ownership of the training at a cost that is affordable and sustainable. More than 8,000 school
leaders in 21 states have successfully completed the program.
The EDP is closely aligned with the most current and highly regarded standards for high-
performing principals, including the Interstate School Leaders Licensure Consortium (ISLLC)
Standards (Council of Chief State School Officers 2008) and Public Impact’s competencies for
turnaround leaders (Public Impact 2008). NISL updated the EDP in 2010 and again in 2013 to
incorporate the latest research and align with the Common Core State Standards. However, the
key building blocks of the EDP—educational best practices, instructional leadership skills,
subject-area knowledge and dynamic adult pedagogy—have remained intact.
NISL also developed a powerful coaching model that complements the EDP. Experienced,
trained and certified coaches support principals in their buildings with personalized coaching,
which adheres to research and experience identified by the Wallace Foundation (2013) as the
main attributes of high-quality principal performance, including a focus on “the most important
behaviors and actions that improve instruction, anchored in leader standards,” an “emphasis on

National Institute for School Leadership: Principals on the Path to Excellence 5
school change,” tools and processes that are “flexible enough to take different school contexts
into account,” addressing “weaknesses or needs identified in the process,” and “multiple
measures of student and school performance.”
In short, the EDP positions principals to be highly effective in their jobs, with student
achievement and student growth the main indicators of success.
Thus, our leadership development program and coaching services are tailor-made to address
the national need for high-quality leadership development at an affordable cost that will create
the highly effective leaders districts need now. This is the program we will use to support novice
principals for this project and overcome the leadership crisis that is rooted in the changing nature
of the job (Davis, Darling-Hammond, LaPointe & Meyerson 2005) and the aging of the
workforce (Gates et al. 2006). The EDP already attends to the special demands on novice
principals, such as the bracing “blast of reality” they encounter when they first enter a school as
its leader, their central responsibility for improving teaching and learning, and the sense of
isolation that can swamp their best intentions and efforts early on (see, e.g., The Wallace
Foundation 2013). Many novice principals are left to sink or swim on their own—with alarming
results. A RAND study, for example, found that one-fifth of novice principals leave their schools
within the first two years (Burkhauser, Gates, Hamilton & Ikemoto 2012), while a study by the
George W. Bush Institute found that almost 50 percent leave the field within their first five years
(Briggs, Davis & Cheney 2012). The EDP and coaching will smooth the way for novice
principals to be equipped with the leadership skills and personalized support needed for success.
Our solution is in stark contrast to the status quo. Even with credentials from principal
preparation programs—typically in graduate degree programs—novice principals often have a
limited capacity to lead. Traditional methods of preparing principals, from schools of education

National Institute for School Leadership: Principals on the Path to Excellence 6
to leadership development and in-service programs, are falling dismally short (Davis et al. 2005;
Levine 2005; Hess & Kelly 2005; Kelley & Peterson 2002; Cotton 2003). A survey of principals
found nearly all—96 percent—considered their colleagues more helpful in preparing them to be
instructional leaders than their graduate training (Farkas, Johnson & Duffet 2003), and two-thirds
say leadership preparation programs are out of touch with school realities (Farkas, Johnson &
Duffet 2003; Johnson, Arumi & Ott 2006).
The fact that principal leadership matters is beyond dispute. Empirical evidence links strong
principals to positive student, teacher and school outcomes. Leadership is second only to
teaching among school influences on student success—and the impact of school leaders is
greatest in schools with the greatest needs (Leithwood, Louis, Anderson & Wahlstrom 2004;
Branch, Hanushek & Rivkin 2009; Hallinger & Heck 1998). Principals’ influence accounts for
about one-quarter of school-level variation in student achievement (Leithwood et al. 2004;
Waters, Marzano & McNulty 2003). Effective leadership is essential for turning around
persistently low-performing schools. “Indeed, there are virtually no documented instances of
troubled schools being turned around without intervention by a powerful leader. … [L]eadership
is the catalyst” (Leithwood et al. 2004).
Furthermore, ineffective principals wreak considerable damage: 38 percent of teachers who
move to a new school and 26 percent of those who leave the profession cite poor principal
support as a primary reason for their decision (Luekens, Lyter, Fox & Chandler 2004; Ingersoll
& Smith 2003). Ineffective principals are more likely to be replaced as well—and principal
turnover has “significant negative effects on student achievement” (Louis, Leithwood,
Wahlstrom & Anderson 2010). Effective principals, in marked contrast, stabilize schools.
2) Strong Likelihood of Impact. We are confident that this project will have the anticipated

National Institute for School Leadership: Principals on the Path to Excellence 7
impact on principal effectiveness and student results. Why? Because NISL has been running a
successful state-wide novice principal program for the past six years in Pennsylvania and has
already demonstrated its positive impact on student achievement. Since 2008, Pennsylvania law
has required all novice principals to complete a rigorous leadership development program. The
only program that qualifies to meet this requirement for state funding is the EDP, the foundation
of this proposal. Independent researchers used a rigorous methodology to evaluate the
Pennsylvania EDP implementation (Nunnery, Yen & Ross 2011) and found statistically
significant gains in student learning in English language arts (ELA) and mathematics as
measured by state test scores. The effect sizes were .08 and .07 in ELA and math, respectively.
This translates to roughly one to two months of additional learning on average for the 57,000
students in 101 Pennsylvania treatment schools. Another way to measure student learning is state
proficiency. In the Pennsylvania study, researchers found that 2.16% more students achieved
ELA proficiency in treatment schools than otherwise would be expected and 1.92% more did so
in math. This translated to 1,225 more proficient students in ELA and 1,089 more in math.
NISL also has run a statewide leadership development program in Massachusetts since 2006.
Whereas the Pennsylvania project focuses on novice principals across all schools, the
Massachusetts project focuses on all principals in high-need schools, including novice principals.
Using a rigorous methodology, researchers from Old Dominion University and Johns Hopkins
University evaluated the results of the second round of training (Nunnery, Ross, Chappell Moots,
Pribesh & Hoag-Carhart 2011). The researchers found statistically significant impact on student
achievement in both ELA and math. The effect sizes were .11 in ELA and .14 in math for the
21,000 students in 38 Massachusetts treatment schools (average poverty level of 69%).
We have found a strong correlation between the number of key concepts that a principal

National Institute for School Leadership: Principals on the Path to Excellence 8
implements after completing the EDP and the gains in student achievement. In fact, student
achievement gains doubled for principals who were identified as more aggressive implementers
versus the average incremental gain (The Meristem Group 2009). Therefore, our project includes
a highly focused coaching model designed to increase the implementation of key EDP concepts.
All 150 novice principals in the treatment schools will be provided with this additional support
during the program. NISL Master Faculty will provide this coaching, using the best practices in
the EDP as a focal point for school change. This support—a total of 11 days per principal—will
be delivered over 15 months in a combination of in-person, Skype, telephone and email.
For 375,000 students to gain a month or two of learning (on average) in both ELA and math
would be an important effect, as would the approximately 7,000 to 14,000 additional students
who would reach proficiency in both ELA and math than would be expected without our
training. The potential magnitude and importance of effects is even greater. The EDP can be
expected to have an impact on student achievement in other subjects, particularly science, which
the program covers with the same intensity as ELA and math. Strengthening school leadership
also should allow other major initiatives, such as Common Core State Standards and more
rigorous teacher and principal evaluations, to be implemented with greater effectiveness as well.
Several factors make us optimistic that this project will lead to even greater gains than have
been documented to date. First, the findings cited above were for cohorts trained simultaneously
in Massachusetts and Pennsylvania only a few years after the EDP launched. We now have much
greater implementation capacity—and have become more effective from training more than
8,000 educators over the past nine years. Second, the studies were performed on statewide
implementations with varying levels of commitment from districts. For this project, we plan to
recruit each district individually to participate. This will increase district buy-in, with a
National Institute for School Leadership: Principals on the Path to Excellence 9
commensurate greater integration of the EDP into district initiatives, which also should yield
greater results. Third, the documented gains to date did not include coaching, which will provide
the novice principals in the treatment group for this project with an extra, sustained “dose” of
professional development that helps them embed their EDP training into their daily practice.
Fourth, the ability of district partners to collaborate in a community of practice with our
implementation team and with one another, along with feedback from top evaluation
organizations, should strengthen continuous improvement.
Increased medial and indirect impacts on teacher effectiveness and teacher retention are
expected as well. Already, principals trained in our program spend more time on instructional
leadership and dissemination and promotion of best practices (The Meristem Group 2009).
Principals’ competencies can directly influence school conditions and professionalism; teacher
quality, placement and retention; instructional quality; collegial, team-based culture; use of data;
resource management; and the successful implementation of programs that impact school
performance and learning (Clifford, Behrstock-Sherratt & Fetters 2012b). In addition, effective
principals are more likely to experience satisfaction with their jobs and more likely to stay at
their schools and within the principal profession (Branch, Hanushek & Rivkin 2012, 2013)—
key challenges with novice principals.
Finally, one study identified seven exemplar leadership training programs (Cheney, Davis,
Garrett & Holleran 2010); all cost between $100,000 to $200,000 per graduate. The EDP has
produced better student achievement results than all seven programs for an average of $10,000 to
$25,000 per graduate (depending on implementation design). This makes this project particularly
important: It will validate a different approach to school leadership that produces stronger results
for a fraction of the investment.
National Institute for School Leadership: Principals on the Path to Excellence 10
3) High Feasibility for National Expansion. The EDP is a rare program in education. It can
significantly boost student achievement in virtually every high-need school in the country at a
cost of just $20 to $40 per student—an increase in spending of less than one half of one percent.
It has a strong track record of success with more than 8,000 graduates. And notably, NISL has
the capacity to scale up the program across the country for three reasons:
1) Rigorous train-the-trainer model ensures fidelity. Most train-the-trainer models don’t
work well. However, our rigorous process has been proven effective in statewide
implementations in Massachusetts and Pennsylvania. We require all facilitator candidates
to go through the entire 27-day EDP facilitated by NISL Master Faculty, complete a two-
day institute to improve their facilitation skills, and spend their first year as facilitators
under the supervision and mentoring of a Master Faculty member. With this model, close
to 3,500 educators have successfully completed the EDP in these two states alone when
NISL had only two full-time state coordinators and four part-time Master Faculty
members when these projects started.
2) More graduates build more capacity. Over the past nine years, more than 8,000
educators in 21 states have completed the EDP. This has increased our capacity for
expansion because, as we train more local educators, more decide to join our team. We
now have more than 60 Master Faculty members and 300 NISL-certified facilitators.
3) Large increases in capacity with only small increases in staff. Most organizations
would need to hire dozens of new staff to start a project like this one and hundreds of new
staff to tackle a national expansion. We can take on large projects with minimal hiring
because most of our Master Faculty members are consultants who work only a few days
per month for us. Our train-the-trainer model leverages their time. When a new project

National Institute for School Leadership: Principals on the Path to Excellence 11
starts, we expand capacity by having our consultants allocate extra days to our work
instead of hiring new staff. For example, when Missouri began a large statewide
implementation involving more than 400 participants, we had to hire only one new
person, a state coordinator, to handle the additional work. This structure gives us the
capacity to expand rapidly, with fidelity, to a large number of schools.
We have both the capacity for national expansion and a plan to do so with key components:
1. We will train and certify 60 local educators—20 in each of our three focus states of
California, Florida and Mississippi—to create efficiencies on this project and also to provide the
local capacity for future expansion in these states. We also will form partnerships with state
education departments, universities or regional education service agencies to act as local training
partners. This will allow us to get our message out to more schools and keep costs lower for
districts wishing to adopt the program.
2. At the end of the project, the results from the randomized control trials in the three states
will provide a tremendous incentive for broader adoption of the EDP nationwide. The
quantitative and qualitative evaluations will provide further evidence that the EDP works—and
how it works. Also, with the economies of scale that will develop, we will be able to reduce the
cost of future participants to around $5,000 per participant. We have successfully reduced the
cost in Massachusetts to $4,075.
3. We chose our three focus states very purposefully. California and Florida have very large
student populations and large numbers of high-need students. They spend below the national
average on education per student. Having a high-exposure project like this one will spur other
districts in these states to adopt the program, especially after the initial start-up costs are paid for
with the i3 grant. On the other hand, we selected Mississippi due to its significant challenges

National Institute for School Leadership: Principals on the Path to Excellence 12
with a high-poverty student population and its highly rural school system. Success in this
environment will convince skeptics nationwide that high-need schools can take a major step
forward even when substantial new funds are not available.
4. We will aggressively disseminate project information while focusing on expansion
opportunities in other states. The EDP is already the most widely used school leadership
development program in the country with 8,000 graduates from 5,000 schools. One of our key
strategies is to work with state education agencies to design and implement statewide programs
tailored for each state’s needs. We now have seven state-led projects in Massachusetts,
Pennsylvania, Missouri, Minnesota, Kentucky, Arizona and Virginia. Obtaining a prestigious i3
grant and producing statistically significant gains on three gold-standard evaluations will allow
us to multiply our past successes. Also, we believe this outreach effort will increase the demand
for other high-quality principal training programs.
In summary, NISL will address the national need for exceptional leadership training and
competencies. An investment in principal leadership is critical to meeting the i3 program’s goal
of reaching large numbers of high-need students and the i3 priority of supporting novice
principals. Empirical evidence linking strong principals to positive student, teacher and school
outcomes underscores the significance of our approach. Our project is highly likely to result in
the desired impacts of increased numbers of effective novice principals and significantly
increased average student achievement and student growth. We are uniquely positioned for
scale-up and have a strong plan to do so.
B. QUALITY OF THE PROJECT DESIGN
1) Clear, Complete and Coherent Goals and a Complete Plan for Achieving Them.

National Institute for School Leadership: Principals on the Path to Excellence 13
Our proposed project will create a strong support system for novice middle school principals to
improve student achievement for large numbers of high-need students. The project goals,
strategies and potential risks are described below.
Goal 1—Recruit a Sufficient Number of Districts to Complete Three Rigorous
Randomized Control Trials and Reach 375,000 Students. Our evaluators indicate that we
need 300 middle school principals for the three randomized control trials (one in each state) in
the rigorous evaluation to meet the What Works Clearinghouse standard. This will allow us to
meet the i3 requirement and help us to meet our goal for national scale-up of the EDP.
The project risk, of course, is failing to attract enough districts willing to be involved in a
randomized control trial. Our project design builds in several strategies to mitigate this risk.
First, the budget includes enough resources to pay nearly all costs for districts to participate.
Second, although the evaluation requires randomizing participants into control and treatment
groups, the control group principals will benefit from EDP training at the end of the project, after
the experiment is over. Third, we will provide all participating districts with three additional
“free seats” for elementary, middle and high school principals at every stage of their careers to
participate in the EDP as another enticement. Fourth, California and Florida have large numbers
of schools. In Mississippi, we have a strong network and reputation. This careful selection of
states makes it highly likely that we will be able to recruit sufficient numbers of districts.
The major activities we will conduct to meet this project goal include contacting the state
education departments and state superintendent associations to solicit their involvement and
contacting districts directly (through phone, email and regular mail) to invite them to be project
partners. In addition, we will ask the superintendents of our partner districts to reach out to their
colleagues as well. We will start this outreach with the districts with the largest numbers of

National Institute for School Leadership: Principals on the Path to Excellence 14
students and the greatest proportion of economically disadvantaged students to reach high
numbers of high-need students and reduce the number of districts needed.
Goal 2—Provide High-Quality Training to 150 Novice Middle School Principals to
Create Highly Effective Principals and Improve Student Achievement. The project design is
to provide the treatment group with the opportunity to participate in the EDP. This powerful and
proven leadership development program will be delivered over a 15-month period consisting of
27 classroom days combined with professional reading, an online self-study curriculum and an
Action Learning Project. The previous large-scale studies of this intervention in Pennsylvania
and Massachusetts showed a direct impact on student learning in ELA and math with an average
incremental gain of one to two months of additional learning and proficiency rate increases of
two percentage points.
The majority of principal preparation programs still do not prepare principals adequately for
their difficult jobs, as described previously. Job-embedded, high-quality leadership development
experience of the kind we provide is necessary to make novice principals effective.
To implement the program we have in mind, we will select the 150 novice middle school
principals for the treatment group, identify six training sites (two in each state), identify the
NISL Master Faculty to act as facilitators, establish the training calendar for each of the six
cohorts, ship the pre-work to the participants three weeks before the first day of training, ship the
curriculum materials to the participants, and then conduct the 27 days of classroom instruction.
In our experience, two key risks are associated with this goal. First, some participants will
miss training sessions, reducing the effectiveness of the program. To mitigate this risk, we
require participants to attend 100% of their 27 classroom days. Participants who miss a session
must make it up. This involves arranging to attend the missed session with another cohort. NISL

National Institute for School Leadership: Principals on the Path to Excellence 15
has 40 to 60 EDP cohorts in training at any point in time across the country. On this project,
there will be a second cohort being conducted within each state, which would be the first option
to explore. We will also establish the 15-month training calendar three months before the
training commences, helping to minimize conflicts.
The second key risk is that principals will try to implement NISL-inspired changes in their
schools and be stymied by their supervisors. We will mitigate this risk first by seeking the buy-in
of all key district staff when recruiting districts for the project. Second, we will hold orientations
of superintendents and principal supervisors before EDP training begins to communicate what to
expect and how to support novice principals in the treatment groups.
Goal 3—Provide Coaching of Novice Principals in the Treatment Group to Further
Enhance Novice Principal Effectiveness. We will provide an intense dose of coaching to
personalize support to fit the needs of each principal, reinforce and deepen principals’ leadership
skills, and increase their use of best practices in schools. The coaching intervention aligns with
The Wallace Foundation’s recommendation to “provide early and sustained support to new
principals in the form of coaches” (October 2013). That study found that principals “clearly
benefited from receiving individualized, one-on-one professional development from someone
without evaluative authority” (October 2013).
Researchers have found that more aggressive use of the best practices taught in the EDP
doubles the impact on student achievement (The Meristem Group 2009). Therefore, our strategy
with the coaching intervention is to use the one-on-one relationship to provide highly customized
reinforcement of the best practices in the EDP, while helping principals fully use the tools
provided in the program. This approach will deepen principals’ knowledge and their
implementation of proven practices in their schools.
National Institute for School Leadership: Principals on the Path to Excellence 16
We added coaching to the project design to mitigate the key risk with all professional
development programs, which is that concepts taught do not make it back into the school. A key
risk of coaching, however, is that it is not focused on the high-leverage leadership knowledge
and competencies that make a difference. We will mitigate this risk by training the coaches to
focus on and reinforce the best practices in the EDP. Every coach will complete five days of
training in coaching skills and strategies to learn and practice how to do this effectively.
The key activities relating to this goal are to select NISL Master Faculty members who will
provide coaching services, provide them with five days of training, have the coaches start the
coaching in the spring of 2016 with two in-person days, have the coaches continue to provide
support to principals during the 2016–17 school year with a half-day in-person session each
month with subsequent phone/email/Skype contact follow-up, and have the coaches complete the
coaching with two in-person days during the summer of 2017.
Goal 4: Finish the Five-Year Project Poised for National Scale-up. Awarding this grant to
NISL will prove to be decisive in leveraging a real national scale-up of high-quality leadership
development. Why? Because we will produce gold-standard evidence that training novice
principals has a direct and substantial impact on student achievement. We will produce these
results in large states that have long been bellwethers of national education reform. And we will
be able to showcase these results with the national attention that comes with being an i3 grantee.
The project design includes three strategies that support this larger goal. First, we will create
strong evidence that high-quality support for principals has a dramatic impact on student
learning. Our evaluation features three randomized control trials conducted in three states. We
will focus on middle schools because they traditionally have been difficult to turn around and the
middle grades are crucial to college and career readiness. Using middle schools, rather than
National Institute for School Leadership: Principals on the Path to Excellence 17
elementary or high schools, also allows us to collect and track three years of state test scores,
using fifth-grade scores as a baseline, which will make for a more rigorous evaluation. Second,
we will use feedback from the evaluation and community of practice to further improve the EDP
training and coaching. We have allocated $2 million of the project budget to evaluation and
significant resources for leadership summits to gather important feedback. Third, we will use
strategic communications and outreach to promote scale-up, as described below in Overcoming
Barriers to National Scale-up.
The key tasks for Goal 4 are selecting 300 principals to participate in the randomized control
trial, assigning 150 principals to the treatment group and 150 to the control group, gathering
baseline data in Year 1, gathering outcome data and feedback, analyzing data and providing
periodic reports to the project team, conducting strategic communications and outreach with the
education community to share project findings, and widely disseminating project results.
A more detailed implementation work plan is included in Appendix J.
2) Overcoming Barriers to National Scale-up. Conventional wisdom holds that the only
way to increase the number of high-quality principals is to invest in principal pipeline programs
to produce new principals. In essence, the underlying belief is that professional development for
existing principals is not an effective investment. This has driven the bulk of reform dollars and
district spending to pipeline programs instead of investments in better professional development
for current principals. This belief is evidenced, in part, by the Wallace Foundation’s $75-million
principal pipeline initiative, the meager 4% of Title II dollars spent on principals (U.S.
Department of Education 2013)—and the fact that the only two i3 Validation and Scale-up grants
awarded for creating highly effective principals both focus on new principals. If “pipeline” is the
only solution, it will take decades to improve school leadership at scale as we wait for current
National Institute for School Leadership: Principals on the Path to Excellence 18
principals to leave their posts and new principals to replace them. Showing that investments in
current principals can pay large dividends with a high-profile project like this one will go far
toward debunking that myth and hastening a revolution in school leadership and student learning
that can help students today.
To promote national scale-up of this innovative approach, we will commission papers and
op-ed pieces and get articles in leading educational publications, such as EdWeek and the ASCD
journal, Educational Leadership, about the results of the work; make presentations to the
Council of Chief State School Officers, American Association of School Administrators,
National Association of Elementary School Principals and National Association of Secondary
School Principals; and use the personal contacts of Felicia Cumings Smith, NISL CEO and
former Deputy Commissioner of Kentucky, David Driscoll, NISL Master Faculty member and
former Massachusetts Commissioner of Education, and Alice Seagren, NISL Ambassador and
former Minnesota Commissioner of Education, to make presentations to individual state chiefs
and their staffs. The strategy is to reach entire states, not simply individual schools or districts.
This communication and outreach will emphasize the components of a proven leadership
development program for sitting principals, the school-wide changes that occur as a result and
the positive impact on student learning.
C. QUALITY OF THE MANAGEMENT PLAN AND PERSONNEL
1) Key Responsibilities, Timelines, Milestones, Progress Metrics and Annual
Performance Targets. NISL’s management plan will allow us to achieve the project goals on
time and within budget. Key Responsibilities for each partnering organization are as follows:
NISL, Eligible Applicant and fiscal agent, will direct the project, monitor results, coordinate
the activities of the i3 partners, establish the training calendar; work with partner districts to
National Institute for School Leadership: Principals on the Path to Excellence 19
deliver Round 1 (treatment group) EDP training and coaching; identify facilitator candidates;
train and certify local facilitators; support Round 2 EDP training; provide curriculum, materials
and technical support to districts; assist with the evaluation plan; monitor fidelity of
implementation to strict quality control standards; ensure continuous improvement; identify and
resolve issues promptly, monitor the budget, and comply with USDOE grant requirements.
School District Partners, Official Partners and key beneficiaries, will support novice
principals’ completion of the EDP (e.g., make the program a priority, work with NISL to identify
facilitator candidates, establish training calendars, coordinate logistics and arrange coverage in
schools), fully participate in the evaluation, bring concerns to NISL and fully participate in the
Project Coordinating Committee. Our Official Partners are Moreno Valley Unified School
District (CA), Vista Unified School District (CA), Lake County Schools (FL), the School
District of Osceola County (FL) and Jackson Public Schools (MS). Letters of commitment
from our partners are in Appendix G; their demographic data is in Appendix J1. We will recruit
25 to 55 more districts in these three states, for a total of 30 to 60 districts, to secure participation
of 300 novice middle principals for the evaluation. Future partners will carry the same
responsibilities as the Official Partners except they will not be part of the Project Coordinating
Committee. However, they will be able to attend meetings to voice concerns, if needed.
Johns Hopkins University (JHU) will be the independent evaluator. In this role, JHU will
gather data needed to provide ongoing performance feedback to NISL, the districts and the
Project Coordinating Committee, execute a randomized experimental research design to
determine the impact of the EDP, gather fidelity of implementation and case study data, evaluate
fidelity of implementation and develop case studies. JHU will subcontract with Old Dominion
University (ODU) to support the quantitative analysis. (See Appendix J5 for full organizational

National Institute for School Leadership: Principals on the Path to Excellence 20
descriptions of our independent evaluators.)
The Project Coordinating Committee will communicate and coordinate activities and
progress and identify and resolve any issues. The Committee will include the NISL Project
Director and Project Manager, the evaluation partner’s co-principal directors, and the
superintendents or designees from Official Partner districts.
Table 1 summarizes the key project milestones and timeline.
Table 1. Key Project Milestones and Timeline
Key Milestones Completion Date
Complete project planning and kickoff; assign principals to treatment
or control group; identify train-the-trainer facilitator candidates; create
training calendar; hire NISL i3 Project Coordinator, California State
Coordinator and Florida State Coordinator; assign Master Faculty
Summer-Fall 2015
Complete Round 1 training (treatment group) Winter 2016
Complete Round 1 coaching (treatment group) Summer 2017
Complete training of facilitation candidates for certification Summer 2018
Complete Round 2 training Fall 2019
Deliver periodic evaluation findings and end-of-evaluation report Fall 2015–18
Final report: Fall 2019
Convene annual in-person meetings of Projection Coordinating
Committee (plus quarterly virtual meetings)
Spring 2015
Summer 2015–19
The first six months will be crucial to a successful project. During this period we will assign
NISL Master Faculty, hire the i3 Project Coordinator and State Coordinators, begin gathering
baseline evaluation data and establishing the training calendar for Round 1 (the treatment group).
National Institute for School Leadership: Principals on the Path to Excellence 21
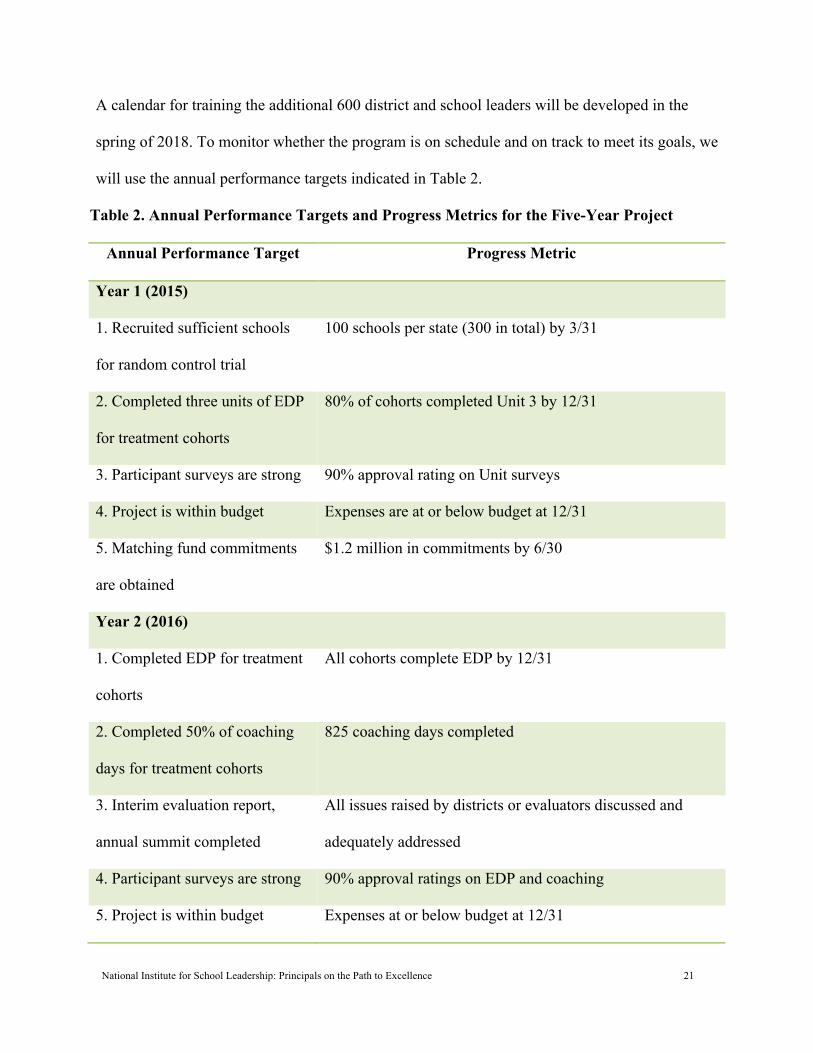
A calendar for training the additional 600 district and school leaders will be developed in the
spring of 2018. To monitor whether the program is on schedule and on track to meet its goals, we
will use the annual performance targets indicated in Table 2.
Table 2. Annual Performance Targets and Progress Metrics for the Five-Year Project
Annual Performance Target Progress Metric
Year 1 (2015)
1. Recruited sufficient schools
for random control trial
100 schools per state (300 in total) by 3/31
2. Completed three units of EDP
for treatment cohorts
80% of cohorts completed Unit 3 by 12/31
3. Participant surveys are strong 90% approval rating on Unit surveys
4. Project is within budget Expenses are at or below budget at 12/31
5. Matching fund commitments
are obtained
$1.2 million in commitments by 6/30
Year 2 (2016)
1. Completed EDP for treatment
cohorts
All cohorts complete EDP by 12/31
2. Completed 50% of coaching
days for treatment cohorts
825 coaching days completed
3. Interim evaluation report,
annual summit completed
All issues raised by districts or evaluators discussed and
adequately addressed
4. Participant surveys are strong 90% approval ratings on EDP and coaching
5. Project is within budget Expenses at or below budget at 12/31

National Institute for School Leadership: Principals on the Path to Excellence 22
Years 3–5 (2017–19)*
1. Identified facilitator
candidates
20 educators per state (60 in total) by 3/31/17
2. Completed coaching days for
treatment cohorts
All 1,650 coaching days have been provided by 8/31/17
3. Completed training of
facilitator candidates
20 educators per state (60 in total) by 6/30/18
4. Completed EDP for non-
treatment cohorts
600 educators complete EDP by 12/31/19
5. Coaching program updated
based on feedback,
documentation completed
95% of updates and documentation completed by 12/31/17
(remainder when final JHU report is completed)
6. Two interim and one final
evaluation reports produced;
annual summits completed
All issues raised by districts or evaluators are discussed and
adequately addressed
7. Participant surveys are strong 90% approval ratings on EDP
8. Project is within budget Expenses at or below budget at 12/31 each year
9. Full matching funds received $1.2 million before 12/31/19
10. Dissemination of project
findings and preparation for
further scale-up
Commitments obtained from districts in California, Florida
and Mississippi to train an additional 900 educators.
Conference presentations made, op-ed pieces run, district
outreach completed.
* More detailed targets and progress metrics will be created by 9/30/16.

National Institute for School Leadership: Principals on the Path to Excellence 23
2) Multi-year Financial and Operating Model and Regional Scale-up Plan. Our plan
calls for 750 educators to complete the EDP within the five-year grant period. This sounds
daunting—and for most organizations, it would be very difficult. However, NISL is different.
With more than 8,000 EDP graduates in nine years, handling 750 EDP participants over five
years will not be difficult.
Our operating plan is to continue using our Master Faculty and train-the-trainer model to
expand rapidly into our three partner states. We will add state coordinators in California and
Florida (we already have one in Mississippi) to coordinate day-to-day activities and use our
Master Faculty to conduct the Round 1 training and provide coaching services. Our more than 60
Master Faculty are primarily part-time consultants. In addition, we have 300 NISL-certified
facilitators, many of whom could become Master Faculty members if needed for this project.
Based on past experience, we are confident that we can quickly recruit 25 to 55 additional
districts in our three partner states to join the project. As soon the grant award is announced, we
will reach out to potential additional district partners. Although we will have only about three
months for this activity, we have a track record of rapid recruitment. For our 2010 i3 application,
we recruited more than 300 districts in less two months. There is a huge unmet demand for high-
quality leadership development; we will be able to tap the demand with an i3 award in hand.
A few important notes about the financial model detailed in the project budget and narrative:
First, the cost-effectiveness of our delivery system will allow us to reach 375,000 students during
the grant period. This is five to ten times more students than most winning Validation grants from
past years, resulting in a per-student cost of just $35. Second, as the train-the-trainer model
reaches economies of scale, our per-participant cost for EDP training will drop from about
$14,000 to less than $7,000. This will encourage broad adoption throughout our partner states.

National Institute for School Leadership: Principals on the Path to Excellence 24
Our plan to operate the project at regional and national levels. NISL’s plan to operate the
project on a regional and eventually national level incorporates a few key strategies.
• First, as each statewide project materializes, NISL will hire a full-time state coordinator
to oversee the work. We hire only highly respected and successful educators to play this
role. They are responsible for monitoring the statewide implementation as well as
recruiting new districts to the project. NISL currently employs state coordinators in
Massachusetts, Pennsylvania, Missouri, Mississippi and Tennessee. If this project is
funded, we will add state coordinators in California and Florida.
• Second, NISL uses a rigorous train-the-trainer model to build local capacity and keep
costs down, allowing us to expand rapidly and with fidelity with only a handful of staff.
• Third, NISL spends between $500,000 and $1 million each year on new research and
enhancements to the EDP to continue improving it and increase its impact. This includes
enhancements designed to make the EDP a strong tool for successful implementation of
the Common Core State Standards and new teacher and principal evaluation systems.
• Fourth, NISL and our evaluation partners will work actively to disseminate project
learnings. We will meet with national association leaders to report on progress and
evidence of effectiveness. We will work with a communications firm to reach the media
about the project and its evidence. We will create a dedicated web portal for this project,
updated quarterly. NISL and district partners will present at major conferences, such as
ASCD, American Association of School Administrators and National School Boards
Association. Finally, our evaluators will publish at least two articles on the project results
in peer-reviewed journals and present their findings at several research conferences.
These strategies—using state coordinators, employing a train-the-trainer model, continuing

National Institute for School Leadership: Principals on the Path to Excellence 25
to improve and enhance the EDP, and disseminating results—have allowed us to implement the
EDP in over 5,000 schools in 21 states in just nine years. Our 8,000 graduates make the EDP the
most widely used leadership development program in the country. This project will further
amplify our capacity to reach more principals and scale up the EDP to support all principals who
need high-quality leadership training across the country.
3) An Experienced Project Director and Project Team. We have carefully chosen key
individuals to execute this project plan. In addition, our district partners have agreed to make this
project a priority of their districts, participate in the Project Coordinating Committee and assign a
strong administrator to serve as district liaison to NISL.
Felicia Cumings Smith, Ed.D., CEO of NISL, will be the Project Director with ultimate
responsibility for a successful project. She will oversee the implementation of EDP training and
coaching in all partner districts. She will assign NISL Master Faculty to train district cohorts,
allocate additional NISL resources to the project if necessary, and plan for the sustainability and
scale-up of the EDP beyond the grant period.
Directing and managing large, complex projects is not new to Smith. Prior to joining NISL,
she served as Associate Commissioner of Education and Chief Academic Officer at the
Kentucky Department of Education. In that position, she oversaw the work of over 200 staff and
led high-profile initiatives to improve learning outcomes toward college and career readiness for
all students, pre-K–20, including principal leadership development, a statewide evaluation
system for principals and teachers, a higher education–district partnership initiative to transform
educator preparation, development of professional learning collaboratives, early childhood
education initiatives, Common Core State Standards implementation, and special education
reform. She also served as the goal lead for the College and Career Readiness, Proficiency, and

National Institute for School Leadership: Principals on the Path to Excellence 26
Next Generation Professionals delivery plans (strategic priorities for the agency), which outline
the goals, strategies, milestones and metrics for state-level success. She also secured and
provided oversight of about $200 million in federal, state and foundation grants and managed
strong relationships with national, state and foundation partner organizations.
Sharon Brumbaugh, NISL Master Faculty member, will be the Project Manager (100% of
her time in Years 1–2 and 50% in Years 3–5). She will manage the day-to-day operations for the
EDP training and coaching, monitor the fidelity and quality of implementation, coordinate all
NISL activities with project partners, and work with the Project Director, i3 Project Coordinator
and State Coordinators to identify and address issues and drive project success in the field. She
will integrate NISL, district and evaluation leadership team partnerships; monitor partner
performance for key deliverables; lead Project Coordinating Committee meetings; manage the
finances; monitor the budget; administer the grant; and comply with U.S. Department of
Education requirements. Brumbaugh has extensive project management experience and is a
proven leader of large state and district education initiatives. She led the implementation of the
statewide novice principals program in Pennsylvania that used the EDP as its core curriculum as
Special Assistant to the Secretary of Education. She will spend more time at the beginning to
launch the project until the NISL i3 Project Coordinator, California State Coordinator and
Florida State Coordinators are hired. Felicia Cumings Smith and NISL’s operations staff also
will put in extra time at the front-end as they do for all new implementation sites. Since there are
only three positions to fill, all vacancies will be filled within 60 to 90 days of the grant start date.
NISL i3 Project Coordinator (to be hired, 100% of time in Years 1–2 and 50% in Years 3–
5). The selection criteria for hiring the Project Coordinator will be experience supporting a
project manager on a large and complex project. The Project Coordinator will be responsible for

National Institute for School Leadership: Principals on the Path to Excellence 27
performing such tasks as gathering and analyzing project management data; organizing logistics
and support of the Project Coordinating Committee; capturing and tracking issues for resolution;
and technical support for instructional, communication and collaboration technology.
In addition, NISL will work closely with leaders and managers at JHU and the 30 to 60
districts to implement the project successfully. Key project partner staff will include:
NISL i3 State Coordinators. NISL will assign three NISL Master Faculty members as i3
State Coordinators, one for each of the three states in the project. They will work with the NISL
i3 Project Director, Manager and Coordinator to coordinate district services, tailor services to
each district’s needs, and monitor fidelity of implementation and quality control across districts
in each state. The State Coordinators will work closely with the District Liaisons to build district
capacity to integrate the EDP permanently into district-wide leadership development. For
Mississippi, Susan Rucker already plays this role and will take on the additional i3 tasks. We will
make every effort to assign or hire State Coordinators in California and Florida who live in or
near these states to facilitate the work. i3 State Coordinators will help expand the EDP to other
districts in these states to leverage the impact of the Validation grant.
District Liaisons. Each of the 30 to 60 district partners will assign a District Liaison, likely a
staff development director or official with similar responsibilities, to work with the NISL i3 State
Coordinators to integrate the EDP permanently into their district leadership development. NISL
i3 State Coordinators will gradually shift their workload, described above, to the District
Liaisons as the districts build their capacity to support EDP implementation on their own.
NISL Master Faculty. NISL Master Faculty will facilitate EDP training for six cohorts in
Round 1 and provide coaching to 150 novice principals (50 in each state). Master Faculty also
will train and certify 60 local educators (20 in each state) as EDP facilitators, and support these
National Institute for School Leadership: Principals on the Path to Excellence 28
local educators in Round 2, when they take over the facilitation for training of the additional 600
participants. NISL has several full-time Master Faculty members and more than 60 consultants
who work part-time in this capacity, plus more than 300 NISL-certified facilitators across the
country, many of whom could step into the Master Faculty role.
NISL-certified Facilitators. The 60 local educators trained and certified as facilitators will
be the EDP facilitators for Round 2. We expect about two-thirds of them will be district staff; the
rest will be semi-retired educators, university professors and consultants. Most will have been
principals and/or superintendents with successful track records with high-need students. NISL
and the districts will carefully select all facilitator candidates, using qualifications including solid
experience as a facilitator, strong communication skills and successful careers in education.
Project Coordinating Committee. To foster collaboration and learning, build in a robust
feedback loop, and plan for sustainability and scale-up, we will form a Project Coordinating
Committee comprised of NISL, JHU and ODU project leaders (identified below) and a leader
from each Official Partner district—either the district liaison, superintendent or other key district
official. This committee will meet for annual, face-to-face summits, convene virtually four times
a year to monitor progress and extend interactions between meetings using collaborative
technologies. Annual face-to-face summits will be held in locations that will help to minimize
travel costs, such as cities that enjoy low-cost airfare as regional hubs.
NISL will facilitate participant interactions so that the committee functions as a community
of practice, modeled on the Wallace Foundation’s “leadership issue group forums” and
collaborative leadership groups for grant recipients. We will foster shared inquiry of leadership
development practices. Participants will learn from one another how districts are leveraging the
EDP to support other initiatives, such as the Common Core State Standards. This committee will

National Institute for School Leadership: Principals on the Path to Excellence 29
hold regional summits in each state to allow more participation from all district partners.
To complement the formal evaluation instruments that will be used to monitor the project
(described in D. Quality of Project Evaluation), this committee also will be used as a forum for
soliciting and capturing feedback on both the successes and challenges of EDP training and
coaching in diverse settings—and for responding to questions or concerns. District experiences
throughout the project will be used to help NISL make any necessary course corrections to the
project implementation and keep us responsive to district and school needs. In addition, this
ongoing monitoring and evaluation will be used to help us improve the EDP and other NISL
leadership offerings—and, potentially, lead to the exploration and creation of new leadership
programs to address unmet needs, which supports the i3 mission of innovation.
Technical Working Group. JHU will convene an external, independent Technical Working
Group (TWG) to ensure that the Validation study is rigorously and independently enacted with
utmost financial efficiency and to standards of quality expected by JHU. The TWG will convene
twice annually in Year 1, and then annually each subsequent year. The TWG will be constituted
of experts in advanced research methodologies and content experts in leadership and professional
development studies.
An exceptional team of researchers will conduct the validation study. Their qualifications
and responsibilities are summarized in D. Quality of Project Evaluation. Resumes for all key
project staff are in Appendix F. A work plan detailing key tasks to be accomplished and the
person responsible for each task is included in Appendix J4. This is based on the key project
milestones, shown in Table 1.
National Institute for School Leadership: Principals on the Path to Excellence 30
D. QUALITY OF PROJECT EVALUATION
1) The clarity and importance of the key questions to be addressed by the evaluation and
the appropriateness of the methods to be used to address each question.
The independent evaluation of the implementation and impact of the NISL EDP will be
conducted by the Center for Research and Reform in Education (CRRE) at Johns Hopkins
University (JHU) and the Center for Educational Partnerships (TCEP) at Old Dominion
University (ODU). To measure EDP effects, the independent evaluators will conduct
longitudinal, multi-site cluster-randomized trials (MSCRT) in three states to estimate the impact
of principal participation in the EDP on such relevant outcomes as student achievement,
principal leadership skills and teaching conditions.
The evaluation will identify critical components of the EDP that are crucial to its success and
sustainability by assessing the mediating effects of the different natural variants of the model as
implemented. The evaluation design for this goal draws from research and theory (see the EDP
Logic Model in Figure 1) that posits leadership effects as “rippling” through direct, medial and
indirect processes that include instructional leadership quality, teaching conditions and student
learning, respectively (Booker & Thomas 2014; Branch, Hanushek & Rivkin 2012, 2013;
Clifford et al. 2012; Clifford & Ross 2012; Gates et al. 2014; Leithwood & Jantzi 2008; Louis,
Leithwood, Wahlstrom & Anderson 2010; Thompson, Gregg & Niska 2004). Finally, a cost-
benefit analyses will be performed to determine productivity gains as measured by the increased
student learning outcomes relative to the increase cost relating to the intervention.
From each of the three states to be included in this project—California, Florida and
Mississippi—we will select 100 schools to participate in the study. For purposes of random
assignment, districts will serve as a blocking variable to control for likely unmeasured district

National Institute for School Leadership: Principals on the Path to Excellence 31
impacts. Randomization within blocks (districts) will (a) ensure baseline equivalency and (b)
militate against confounding unmeasured district variables that may mediate or moderate
treatment effects (Shadish, Cook & Campbell 2002). Outcomes from each state will be examined
in three separate replicated experiments. This will enhance the external validity of the findings
through multi-site replication. Treating each state as a separate experiment also will ensure a
consistency of outcome measurement for each analysis that cannot be attained simply by using
standardized (Z) scores computed within each state, because the various state tests likely measure
somewhat different constructs and almost certainly have different difficulty levels and
distribution shapes. However, between-state differences will be empirically investigated to
ascertain whether all states can be combined for each domain to estimate impacts using the full
sample for the most power analytically. Alternatively, a weighted average impact for each
domain based on the results from the separate analyses of impacts will be calculated, which
enables conclusions about impacts across states.
A multi-site cluster-randomized trial (MSCRT) will be employed, randomly assigning middle
schools to either the EDP intervention or the business-as-usual condition, using their fifth-grade
student test scores and following them longitudinally through eighth grade. Student-level scores
are more sensitive for data analyses, since controls can be incorporated for each student’s prior
achievement (pre-treatment), gender, poverty status, and other sub-group identities.
Accordingly, the longitudinal design begins with sixth grade, using fifth-grade, pre-treatment
assessment scores that would be available for both treatment and control schools in each state,
and follows students to eighth grade over a three-year period. (After eighth grade, the student
sample will change as the eighth graders transition to ninth grade in high school.) Schools will be
assigned randomly to condition prior to the start of the fall, 2015–16 academic year (details

National Institute for School Leadership: Principals on the Path to Excellence 32
about the procedures are described below). In Year 1 of the project (January 2015– December
2015), we will gather baseline testing data (May 2015) of the schools; schools will then be
randomized for the evaluation and comprehensive training will be scheduled. After baseline
testing, the program will be fully implemented in EDP schools with the current sixth graders
during the first school year (July 2015–June 2016); during the second school year following
those students to seventh grade (July 2016–June 2017); and during the third school year
following those same students to eighth grade (July 2017–June 2018). Thus, we will evaluate the
effectiveness of the EDP in changing the outcomes in schools after three full years of
implementation. Evaluation data will be collected as described below across each year, allowing
evaluators to look at the effects of the EDP at various points in time during implementation.
However, our main impact analyses will evaluate the effectiveness of the treatment after three
full years of implementation (in Year 4). We anticipate that the effects of EDP on students will
be strongest after three full years of implementation, with principals having at least three
consecutive years at their schools.
To evaluate the effectiveness of the EDP, we propose to examine its impact across a three-
year period by following sixth graders through seventh and eighth grades using a multi-site
cluster randomized design. Novice principals in treatment schools will receive the initial
intervention training and coaching beginning in Year 1 (fall 2015) and continuing through Year 3
(summer 2017). Evaluation of effects on relevant student, teacher and principal outcomes will be
assessed from spring 2015, prior to random assignment (baseline, Year 1) through spring 2018
(impact, Years 2, 3 and 4). While our main impact analyses will evaluate the effectiveness of the
treatment after three full years of implementation (in Year 4), the longitudinal design will allow
us to examine the impact of continued use of EDP on setting-level outcomes, with four

National Institute for School Leadership: Principals on the Path to Excellence 33
measurement points across four years. Additionally, the evaluation will include case studies of
both higher- and lower-achieving schools to identify “best practices” that EDP novice principals
employ to increase student achievement.
Schools within districts will be matched or blocked on demographic and achievement
variables, and then within each matched pair or block. Schools will be independently randomly
assigned using SPSS Rv.Chisq(df) to either the intervention or comparison condition.
The proposed evaluation will address three confirmatory research questions; four exploratory
research questions; three questions designed to identify components, mediating and moderating
factors critical to the success of the EDP; and one cost-benefits research question, listed in
corresponding order below. Collectively, these questions are critical for validating the theoretical
framework that supports the EDP’s design, for identifying critical EDP components as
instantiated in principal activities and teaching conditions that affect student achievement, and
ascertaining the cost-benefit of the program.
The confirmatory and exploratory questions will be addressed using an experimental design
with multi-level regression and multi-level latent growth modeling (LGM) analytic methods used
to estimate program impact. The same design will be used for exploratory analyses, but pertinent
terms in the statistical models will be allowed to vary freely in order to estimate cross-level
interaction effects. Critical components, mediating and moderating questions will be addressed
through mixed-methods analyses of case studies, questionnaire data collected from multiple
stakeholders, observations and interviews. One significant contribution of the proposed research
is to evaluate fidelity and examine its impact on setting-level outcomes. Our comprehensive
fidelity assessment protocol (see Figure 2 below) evaluates adherence to the program model with
a primary focus on more objective measures of fidelity. A second feature of the protocol includes
National Institute for School Leadership: Principals on the Path to Excellence 34
principal and teacher perceptions of the EDP, including their attitudes and beliefs about the
program. A set of observable indicators were developed that map on to explicit components of
the EDP in order to evaluate fidelity to each component as prescribed in the training program and
accompanying manual and materials. The analyses of qualitative data will be guided by Miles
and Huberman’s (2004) model, consisting of transcribing the responses, deriving codes,
identifying themes, and revision and refinement based on member checking and inter-rater
review. Triangulation across data sources and methods will be used to validate the major
findings. Cross-case analyses, member-checked through an online focus group of key informants
(Miles & Huberman 2004), will be used to identify programmatic, individual and contextual
factors. Each case study will be member-checked with key informants (e.g., novice middle
school principals and teacher leaders). Coding for quality assurance will be applied to the
analyses of qualitative data. Specifically, CRRE analysts will subject the qualitative data sources
to coding using NVivo, a software program that facilitates coding, analysis and reanalysis of
qualitative data in multiple file formats. NVivo is a system created for mixed-methods research
that allows multiple users to collaborate by viewing and accessing qualitative and quantitative
data within an Internet-based system. NVivo enables researchers to upload files for coding, store
and to manage data securely, link qualitative and quantitative data, and identify data patterns for
further analyses. Two principles will be utilized to analyze these data: 1) triangulation and 2)
grounded theory.
In triangulation, the results from each of the data sources will be compared against one
another to give a more comprehensive view. It is “a nonexperimental qualitative sociological
method that employs an exhaustive examination of cases in order to prove universal, causal
generalizations” (Vidich and Lyman 1994:39). Grounded theory is a way in which the

National Institute for School Leadership: Principals on the Path to Excellence 35
relationship between theory and data in this research will be formulated. Grounded theory has
been defined as “theory that was derived from data, systematically gathered and analyzed
through the research process. In this method, data collection, analysis, and eventual theory stand
in close relationship to one another” (Strauss and Corbin 1998:12). A key process in grounded
theory is coding, which entails processes whereby data are broken down into component parts
and given labels (names). Strauss and Corbin (1990) distinguish three types of coding practice,
all of which will be used in this research. They are as follows:
• Open coding: “the process of breaking down, examining, comparing, conceptualizing and
categorizing data” (1990:61); this process yields concepts, which are later to be grouped and
turned into categories;
• Axial coding: “a set of procedures whereby data are put back together in new ways after
open coding, by making connections between categories” (1990:96). This is done by linking
codes to contexts, consequences, patterns of interaction and causes; and
• Selective coding: “the procedure of selecting the core category, systematically relating it to
other categories, validating those relationships, and filling in categories that need further
refinement and development” (1990:116). A core category is the central issue or focus
around which all other categories are integrated. It is what Strauss and Corbin call the
storyline that frames your account (cited in Bryman, 2008:543).
Coding the data in this way typically leads to a number of outcomes (for further discussion see
Bryman, 2008:544), which are as follows: concepts, category, hypotheses (initial hunches about
relationships between concepts); and theory (a set of well-developed categories that form a
theoretical framework).
National Institute for School Leadership: Principals on the Path to Excellence 36
Cost-benefits will be estimated by translating observed standardized impact estimates into
“additional months of instruction” heuristics, multiplying these values by the number of students
served, and dividing by the total project costs. These metrics can then be compared to average
per-pupil instructional expenditures in the schools served to derive a “value-added” indicator of
EDP cost-effectiveness. We will calculate comparable cost-effectiveness indicators using data
from published sources for other principal training and school reform programs in order to also
measure the relative value-added of the EDP.
Confirmatory Research Questions
1. What is the cumulative impact of the EDP over three years on middle school students’
mathematics and reading achievement in schools with EDP-trained novice principals as
compared to students in non-EDP schools led by novice principals?
2. What is the relationship between participation in the EDP and novice middle school
principals’ leadership skills?
3. What is the relationship between participation in the EDP and working conditions for
teachers in the school?
Exploratory Research Questions
4. What are the trajectories of mathematics and reading achievement for students and to what
extent are there intra-individual (within-student) and inter-individual (between-student)
changes in achievement during this developmental period? How do the effects differ by
type of student, including students living in poverty, English language learners and
students with disabilities?
5. How do the effects of the EDP vary for students in higher- and lower-achieving schools?
National Institute for School Leadership: Principals on the Path to Excellence 37
6. Did treatment schools that outperformed the average have commonalities like more
aggressive implementation of EDP best practices or a higher rate of implementing
particular EDP concepts?
Questions to Identify Critical Components, Mediating and Moderating Factors
Measures of Implementation
7. How do principals perceive the effectiveness of the EDP?
8. How do principals perceive the quality of coaching?
9. What changes have been implemented at the school as a result of the intervention? Did
certain best practices get implemented more frequently?
Additional research questions will address Fidelity of Implementation (FOI) in terms of the
delivery of expected inputs by the grantee:
10. What was the principal attendance at in-person training days during the EDP?
11. What percentage of coaching days were delivered?
12. What percent of principals received all of the required NISL instructional materials on a
timely basis?
Cost–Benefit Question
13. What is the cost-effectiveness of the EDP in terms of additional months of instruction
implied by EDP effects relative to instructional expenditures?
The evaluation team (described below) will build upon instruments and data collection
strategies used in smaller-scale studies of the EDP (e.g., Nunnery et al. 2010a) as well as their
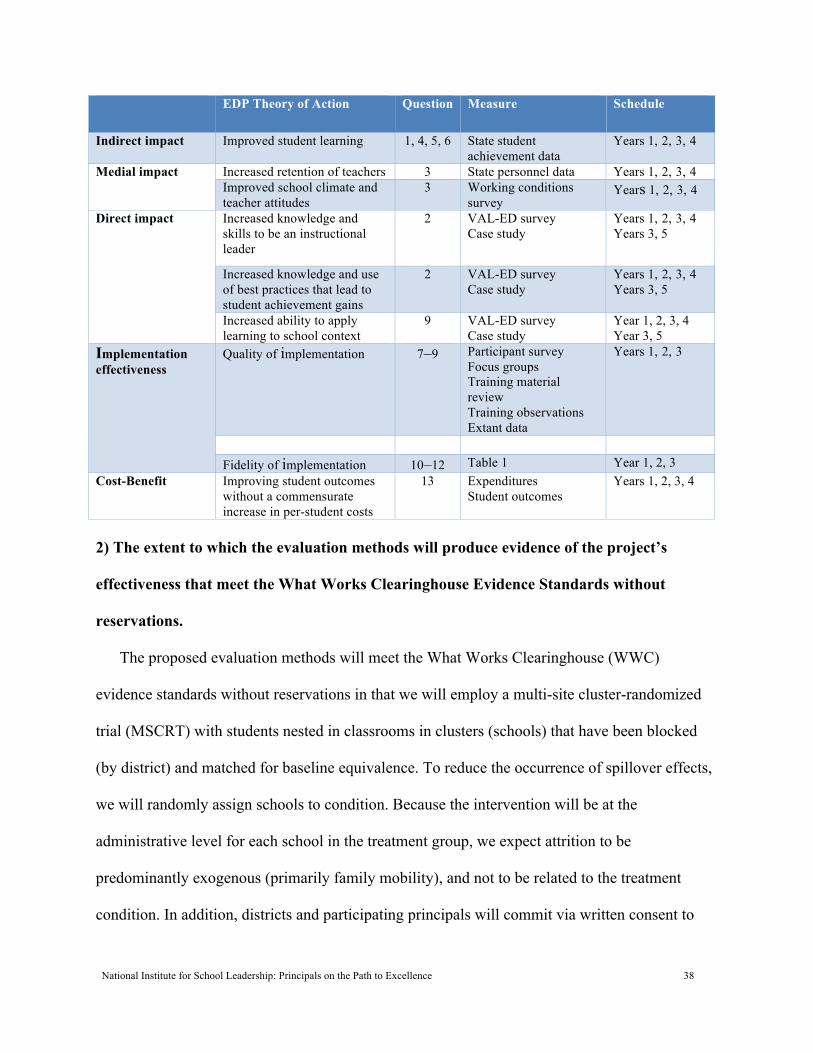
experiences as PIs or co-PIs on several recent i3-funded studies. Table 3 displays the alignment
between the evaluation questions, the EDP logic model (see Figure 1 above) and data collection.
Table 3. Alignment of Program Evaluation with EDP Logic Model
National Institute for School Leadership: Principals on the Path to Excellence 38
EDP Theory of Action Question Measure Schedule
Indirect impact Improved student learning 1, 4, 5, 6 State student achievement data
Years 1, 2, 3, 4
Medial impact Increased retention of teachers 3 State personnel data Years 1, 2, 3, 4 Improved school climate and teacher attitudes
3 Working conditions survey
Years 1, 2, 3, 4
Direct impact Increased knowledge and skills to be an instructional leader
2 VAL-ED survey Case study
Years 1, 2, 3, 4 Years 3, 5
Increased knowledge and use of best practices that lead to student achievement gains
2 VAL-ED survey Case study
Years 1, 2, 3, 4 Years 3, 5
Increased ability to apply learning to school context
9 VAL-ED survey Case study
Year 1, 2, 3, 4 Year 3, 5
Implementation effectiveness
Quality of implementation 7–9 Participant survey Focus groups Training material review Training observations Extant data
Years 1, 2, 3
Fidelity of implementation 10–12 Table 1 Year 1, 2, 3
Cost-Benefit Improving student outcomes without a commensurate increase in per-student costs
13 Expenditures Student outcomes
Years 1, 2, 3, 4
2) The extent to which the evaluation methods will produce evidence of the project’s
effectiveness that meet the What Works Clearinghouse Evidence Standards without
reservations.
The proposed evaluation methods will meet the What Works Clearinghouse (WWC)
evidence standards without reservations in that we will employ a multi-site cluster-randomized
trial (MSCRT) with students nested in classrooms in clusters (schools) that have been blocked
(by district) and matched for baseline equivalence. To reduce the occurrence of spillover effects,
we will randomly assign schools to condition. Because the intervention will be at the
administrative level for each school in the treatment group, we expect attrition to be
predominantly exogenous (primarily family mobility), and not to be related to the treatment
condition. In addition, districts and participating principals will commit via written consent to

National Institute for School Leadership: Principals on the Path to Excellence 39
minimize principal mobility within the district during the period of the study. Therefore, we
anticipate that the attrition rate for this study will be low and within an acceptable level of bias
(WWC 2014). Specifically, in any given year, we would expect less than 10% overall attrition
and a 5% (non-significant) difference between treatment (T = participate in the EDP) and control
(C = business as usual) schools due to random and not treatment-linked factors. The evaluators
will follow the model proposed by WWC (2014) to determine the overall and differential
attrition that may bias the estimated intervention effect. Specifically, we will use an intent-to-
treat model, following all students in all schools randomly assigned at the outset to the extent
possible. Finally, we do not intend to impute missing outcome data in any analyses.
Basic formulae for reporting attrition in each treatment, T1 and T2, will be as follows for
schools:
• BaseschT = number of randomly assigned T schools
• BaseschC = number of randomly assigned C schools
• AssessedschT = number of T schools contributing schools with non-missing outcome data
• AssessedschC = number of C schools contributing schools with non-missing outcome data
• AttritionSch.T = 1 – (AssessedSch.T/ BaseSch.T)
• AttritionSch.C = 1 – (AssessedSch.C/ BaseSch.C)
• Overall Attrition Sch. for T vs. C = 1 – (Assessed Sch. [T+C]/Base Sch. [T+C])
• Differential Attrition Sch. for T vs. C = AttritionSch.T - AttritionSch.C
Overall and differential school attrition will be calculated for each contrast tested. The same
process will be followed at each level (e.g., schools, teachers, students).
Students who are not enrolled in the study sample at the point of random assignment are
considered to be joiners. We do not intend to include joiners in the analysis sample.

National Institute for School Leadership: Principals on the Path to Excellence 40
We will adopt a protocol to match or block the schools within the district by school
characteristic. Within each matched pair or block, half of the schools will be randomly assigned
by SPSS Rv.Chisq (df) to the intervention or business-as-usual condition. Randomizing using
districts as blocks will allow us to reduce or eliminate the influence of potentially confounding
factors attributable to unmeasured district effects. We will follow WWC guidelines for reporting
treatment effect sizes based on results from multi-level analyses with school- (or cluster-) level
assignment of treatment (WWC 2014).
3) The extent to which the evaluation will study the project at the proposed level of scale
and generate information about potential differential effectiveness of the project in diverse
settings and for diverse student population groups.
Recruitment and assignment. The sample for the proposed study includes 100 middle
schools in three states (California, Florida and Mississippi) for a targeted total of 300 schools.
Schools in each state will be blocked by district. We plan to recruit from 30 to 60 districts
(blocks) within each state, with a minimum of two schools per block. Schools in each block will
be matched on key observable variables (e.g., proportions of low socioeconomic students, female
students, minority students, students with disabilities, limited English proficient students,
students achieving proficiency in mathematics and reading). After matching is complete,
participating principals in each block will be randomly assigned to one of two groups. These
groups then will be assigned to either the T or C status, with at least one treatment and one
control school per district.
Principals in the treatment group will receive all aspects of the EDP intervention, which will
be provided by highly experienced NISL Master Faculty and coaches. During the two-year
training and coaching period, principals in the treatment schools are expected to immediately

National Institute for School Leadership: Principals on the Path to Excellence 41
enact changes in schools to improve instruction, working conditions and student achievement.
Control schools will not receive any NISL services or exposure to EDP materials prior to
completion of the study. We will minimize the threat to internal validity posed by potential
diffusion of treatment through the following mechanisms:
• NISL has fully explained the ramifications of engaging in a randomized controlled trial to
the Official Partner districts, and will secure commitments from additional participating
districts that they will adhere to protocols to prevent diffusion of treatment.
• Treatment principals will be asked to sign a letter stating that they understand that
dissemination of EDP materials would be a violation of the terms of the district contract
agreement with NISL.
• An annual survey of control school principals will be administered to monitor possible
diffusion of treatment. If potential problems are indicated on the survey, we will conduct
phone interviews to determine and document the nature and extent of diffusion.
Measurement of treatment effects will use Year 1 spring 2015 (baseline) student and school
performance data as pre-intervention covariates, and continuing with assessments in spring 2016
(Posttest-1), spring 2017 (Posttest-2) and spring 2018 (Posttest-3). During this time, control
principals will not receive any exposure to EDP training or materials. Based on principal and
district administrator feedback in the Nunnery et al. studies (2010a; 2010b), contamination is
expected to be minimal. That is, principals participating in the EDP receive the professional
development by attending classes, completing assignments, and working directly and
individually with coaches. Meetings with non-participating principals are infrequent and
typically occur in situations not conducive to sharing knowledge and skills from the EDP’s
structured and comprehensive curriculum.

National Institute for School Leadership: Principals on the Path to Excellence 42
Examination of project impact in diverse settings and for diverse student populations.
The sample will consist of 100 middle schools in three states (California, Florida and
Mississippi) for a total of 300 schools. The five districts that have already agreed to participate in
the project have 187,000 students and a free- and reduced-price lunch rate of 67%. We expect the
full group of 30–60 districts to have similarly large proportions of high-need students. These
school districts were selected because they: are interested in and committed to carrying out the
intervention and evaluation/research component, serve student populations that are diverse in
terms of ethnic/racial background and socioeconomic status, and have a demonstrated need to
improve academic achievement. Student-level achievement data are more sensitive for data
analyses, since controls can be incorporated for each student’s prior achievement (pre-
intervention), gender, poverty status, etc. Accordingly, the longitudinal design begins with sixth
grade, using fifth-grade pre-program scores as baselines for both treatment and control schools.
Even if the eventual sample of schools are relatively small, schools will average at least two
sixth-grade classrooms. This yields a total of approximately 600 classrooms, with approximately
25 students per classroom, for an estimated 15,000 students in total (7,500 per condition). We
propose to examine intervention effects over three years of implementation (the EDP and
coaching will be two years in duration), following the student sample through eighth grade. The
student sample will then change as the eighth-grade students “graduate” to ninth grade (and
transition to high school).
Additionally, the evaluation includes an analysis plan to examine the EDP’s impact on
student achievement for diverse student populations (e.g., minority students, students living in
poverty, female students, students with disabilities, limited English proficient students). Rigorous
analyses will be conducted at the end of Year 4 to determine if the EDP has differing effects on
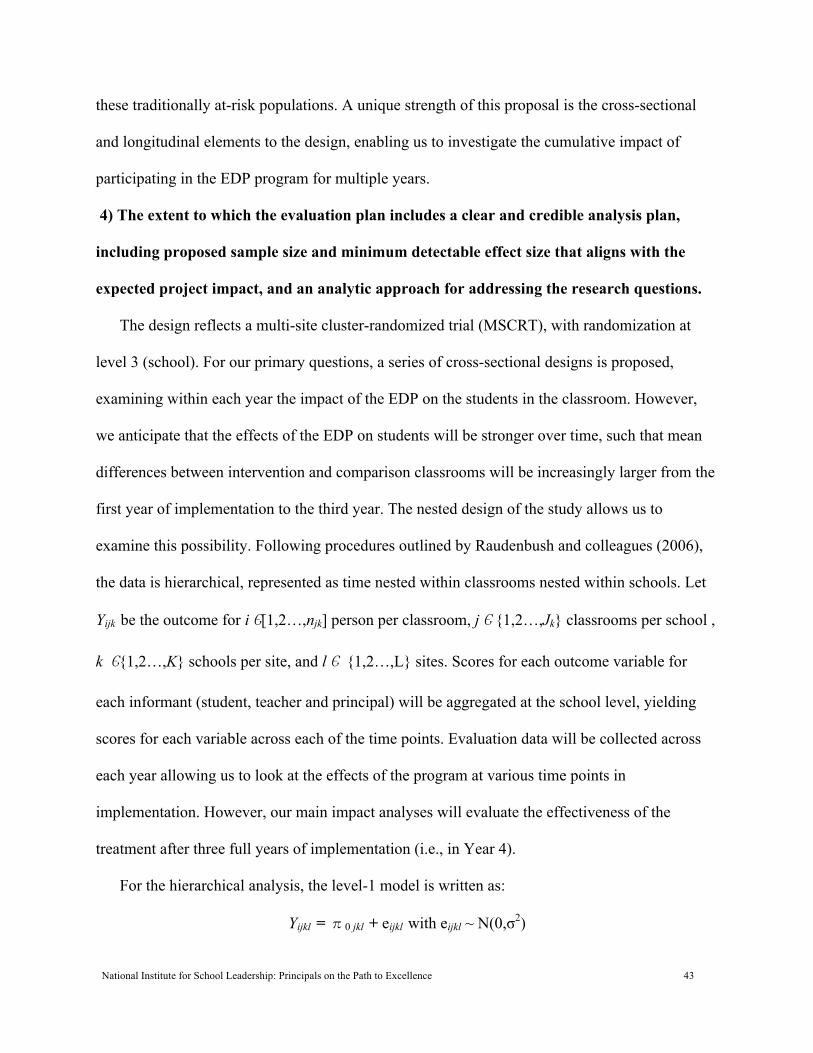
National Institute for School Leadership: Principals on the Path to Excellence 43
these traditionally at-risk populations. A unique strength of this proposal is the cross-sectional
and longitudinal elements to the design, enabling us to investigate the cumulative impact of
participating in the EDP program for multiple years.
4) The extent to which the evaluation plan includes a clear and credible analysis plan,
including proposed sample size and minimum detectable effect size that aligns with the
expected project impact, and an analytic approach for addressing the research questions.
The design reflects a multi-site cluster-randomized trial (MSCRT), with randomization at
level 3 (school). For our primary questions, a series of cross-sectional designs is proposed,
examining within each year the impact of the EDP on the students in the classroom. However,
we anticipate that the effects of the EDP on students will be stronger over time, such that mean
differences between intervention and comparison classrooms will be increasingly larger from the
first year of implementation to the third year. The nested design of the study allows us to
examine this possibility. Following procedures outlined by Raudenbush and colleagues (2006),
the data is hierarchical, represented as time nested within classrooms nested within schools. Let
Yijk be the outcome for i Є[1,2…,njk] person per classroom, j Є {1,2…,Jk} classrooms per school ,
k Є{1,2…,K} schools per site, and l Є {1,2…,L} sites. Scores for each outcome variable for
each informant (student, teacher and principal) will be aggregated at the school level, yielding
scores for each variable across each of the time points. Evaluation data will be collected across
each year allowing us to look at the effects of the program at various time points in
implementation. However, our main impact analyses will evaluate the effectiveness of the
treatment after three full years of implementation (i.e., in Year 4).
For the hierarchical analysis, the level-1 model is written as:
Yijkl = π0 jkl + eijkl with eijkl ~ N(0,σ2)

National Institute for School Leadership: Principals on the Path to Excellence 44
where π0 jk is the mean for classroom j in school k in site l; eijk is the random effect (error)
associated with each person; and σ2 is the within-classroom variance. The level-2 model is:
π0 jkl = β 00k l + r0jk l with r0jkl ~ N(0,τπ)
where β 00kl is the mean for school k in site l; r0jkl is the random effect associated with each
classroom; and τπ is the variance between classrooms within schools. School-level covariates will
be included; thus the level-3 model reflects the inclusion of a covariate. The level-3 (school-
level) model is:
β 00kl = γ000l + γ001l W 00kl + γ002l S00kl + u00kl with u00kl ~ N(0,τβ| S) [Note: τβ| S = (1 – ρ2sβ00k ) τ β]
where γ000ll is the estimated grand mean; γ000l is the main effect of treatment; W 00kl is 0.5 for
treatment and -0.5 for business as usual; S00kl is the level-3 covariate, u00kl is the random effect
associated with each school mean; τβ| S is the residual variance between school means
conditional on the school-level covariate. The level-4 model is:
γ 000l = η0000 + S000l
γ 001l = η0010 + S001l
γ 002l = η0020
where η0000 is the estimated grand mean; η0010 is the average effect of treatment; S001l are fixed
effects associated with each site treatment effect, constrained to have a mean of zero. Fixed-
effects covariates in the model will include predictors such as socioeconomic status (as indicated
by free- and reduced-price lunch status), English language learner status, disability status and
baseline achievement scores.
Following Raudenbush and colleagues (Raudenbush, Martinez, & Spybrook 2006), the main
effect of treatment is estimated as the difference in treatment and business as usual groups,
adjusting for the school-level covariate. Main effects for treatment will be tested using an F-

National Institute for School Leadership: Principals on the Path to Excellence 45
statistic that follows a non-central F distribution. Formulas are described in Spybrook et al. (2006,
9-11, p. 116). Treatment effects will be computed separately for each outcome domain (i.e.,
mathematics and reading) for each of the three states included in the evaluation, resulting in six
total impact estimates. However, between-state differences will be empirically investigated to
ascertain whether all states can be combined for each domain to estimate impacts using the full
sample for the most power analytically. Alternatively, a weighted average impact for each
domain based on the results from the separate analyses of impacts will be calculated, which
enables conclusions about impacts across states. Where necessary, an adjusted p-value, derived
from the Benjamini-Hochberg correction of statistically significant effects with multiple
comparisons, will be used (WWC 2014).
Subgroups: Exploratory question concerning the degree to which school/classroom/student
variables interact with treatments. Grade level/school/classroom/student x treatment interactions
will be included as a source of variance in the HLM analyses. For students, the variables will
include gender and grade level. For schools, the variables will include % English language
learners (ELL), ethnicity, % socioeconomic status and prior achievement. Missing outcome data
will not be imputed in any analyses. The analysis sample will be defined as all cases with non-
missing outcome data.
Similar hierarchical linear models will be used to explore how the effects of the EDP differ
as a function of variation in school settings and student characteristics by incorporating
additional level-3 predictors (composite school setting, FOI and VAL-ED indicators, which are
described in more detail below) and by allowing level-1 coefficients to vary randomly to permit
modeling of cross-level interaction effects.

National Institute for School Leadership: Principals on the Path to Excellence 46
In addition, using a longitudinal design, we will collect outcome data from multiple
“informants,” including students and principals, with four measurement points across four years.
We predict that these outcomes will be higher among informants randomly assigned to the
intervention as opposed to the control group. These hypotheses will be tested using multilevel
latent growth curve modeling, using data accumulated throughout Years 1–4, which provides an
adequate number of time points for modeling growth over time (Singer & Willett 2003). For
example, to analyze the trajectories of mathematics and reading achievement, time (level 1) is
nested in students (level 2) who are nested in classrooms (level 3) in schools (level 4), which is
the level at which randomization is done. The same process will be followed for each principal
informant. As a preliminary step, a series of exploratory analyses will be done to examine the
psychometric and distributional properties of each of the scales at all time points. Variables will
be transformed if needed. Moreover, to ensure the most parsimonious set of variables to include
in the models, data reduction procedures will be employed. As a first step in analyzing individual
change over time, we will analyze growth by examining empirical growth plots for a random
sample of participants and smoothing trajectories using both nonparametric and parametric
approaches. Following Singer and Willett (2003), we will use ordinary least squares (OLS)
regression (which provide unbiased estimates of intercept and slope for individual change) to
obtain fitted trajectories for these exploratory analyses. To explore the extent to which there is
heterogeneity in change between individuals, we will examine magnitude of the sample standard
deviations of the estimated intercepts and slopes. We also will look at the plots for the presence
of within group differences in observed trajectories. We then will model growth using multilevel
latent growth curve modeling or LGM (Bollen & Curran 2006; Corcoran & O’Flaherty 2014,
under review; Duncan, Duncan & Strycker 2006; Little 2013; Preacher, Wichman, MacCallum,
National Institute for School Leadership: Principals on the Path to Excellence 47
& Briggs 2008). LGM is more flexible than traditional approaches because it (a) assesses overall
goodness-of-fit, (b) addresses measurement errors and (c) makes no restrictions regarding errors
because the researcher is completely in charge of specifying their structure. Moreover, this
technique allows for the simultaneous modeling of multiple predictors and multiple outcomes.
In LGM, growth parameters that describe the pattern of change for each construct are the
intercept and slope, which are modeled as latent variables. The intercept represents individual
differences in the level of a particular construct at a particular time (e.g., initial status). The slope
represents the linear trend of an individual’s trajectory across repeated measurements. The
parameters of primary interest are the mean intercept and mean slope, which can be interpreted
as the average level and slope of the trajectory across the sample. We will specify the growth
trajectory for change over time and fit a pair of unconditional growth models to reveal intra- and
inter-individual differences in change over time. Because LGM is an extension of structural
equation modeling (SEM) procedures, the same goodness-of-fit criteria are applicable, and
successively nested models can be evaluated against each other. We will use MPlus 7.2 to fit all
models.
Power analysis. The proposed study will include students in schools in three states
(California, Florida and Mississippi). A minimum of 100 schools will be recruited from each
state, with schools blocked by district. We calculated a minimum detectable effect size (MDES)
of .12, assuming a conservative n per school (two classes per grade, 25 students per class), an
alpha level of .05 and power of .80 using Optimal Design Plus (Raudenbush et al. 2011). We
included an intraclass correlation coefficient of .07 between schools and .04 between classrooms
within schools. These calculations assume a blocking variable that explains 50% of the variance,
and a school-level covariate with two schools (or clusters) per block (or district) and 50 districts

National Institute for School Leadership: Principals on the Path to Excellence 48
per state. Power analyses conducted at all other levels fell within these values (e.g., MDES
calculations for variations in number of blocks/districts and clusters/school within blocks).
5) The extent to which the evaluation plan clearly articulates the key components and
outcomes of the project, as well as a measurable threshold for acceptable implementation.
Key components and outcome measures. The relevant outcome variables to be used in this
evaluation are individual student scores in mathematics and reading on state standardized
assessments. We also will include principal leadership skill outcomes and teaching condition
outcomes from measures described below. Outcome measures will be calculated separately for
each state, with each state constituting its own (separate) analysis. Descriptive statistics will be
calculated for all variables, comprising means, standard deviations, medians, minima and
maxima for continuous variables, while frequencies and percentages will be calculated for all
categorical demographic variables. Distributions of the continuous variables will be examined to
determine if normality assumptions are met and parametric testing is appropriate, or whether
transformed data or non-parametric tests should be used.
Student outcomes (Research Questions 1, 4, 5, 6). Student achievement data will include
assessment scores from the California Standards Test (CST), Florida Comprehensive Assessment
Test (FCAT) and Mississippi Curriculum Test, Second Edition (MCT2). Student-level scores are
more sensitive for data analyses, since controls can be incorporated for each student’s prior
achievement (pre-treatment), gender, poverty status, etc. Accordingly, the design begins with
fifth grade. Individual student raw scores for each test will be converted to standardized scores
(Z-scores) based on the statewide means and standard deviations for each grade level and year.
Z-scores will be computed by subtracting the state-mean from each individual student score, then
dividing the difference by the statewide standard deviation.
National Institute for School Leadership: Principals on the Path to Excellence 49
We will monitor each state’s plans in regards to changes in assessments, particularly given
the likely implementation of Common Core aligned assessments during the project period, and
develop plans to address these changes when necessary.
Leadership skills. To address the direct impacts of the EDP on principals’ leadership skills
(Research Question 2) we will employ the Vanderbilt Assessment of Leadership in Education
(VAL-ED), a 360o assessment of the effectiveness of school leaders’ performance. Parallel ratings
are provided by the principal, his/her supervisor and all teachers in a school (Porter, Murphy,
Goldring & Elliot 2006). VAL-ED scores produce an aggregate principal score, which will be
analyzed. The 72 items measure six “core components of school performance” and six “key
processes of leadership.” The VAL-ED survey will be administered once each year for four years
to the 300 schools involved in the study. Testing of the VAL-ED survey shows comparatively
high construct validity ratings on core components and process intercorrelations (.73 to .90).
Reliability analyses of the VAL-ED for subscales yielded Cronbach’s alphas ranging from .87 to
.97, and evidence supporting the construct validity is extensive (Condon & Clifford 2010).
Teaching conditions. To address the medial effects of the EDP on teaching conditions
(Research Question 3), state teacher retention data will be analyzed longitudinally (from 2015–
18) for all 300 treatment and control schools.
Additionally, we will administer the working conditions survey developed by New Teachers
and validated by Learning Point Associates. This online, 48-item survey measures the safety and
support educators have in a school. High construct validity correlations on core components and
process (.80 to .98) are reported, with an average sub-scale reliability of .91, and significant
predictive validity for student achievement (Ladd 2009).
Principals’ use and impact of EDP strategies. For 24 case study schools, we will conduct
National Institute for School Leadership: Principals on the Path to Excellence 50
principal interviews and teacher focus groups. These measures will focus on principals’ use of
major EDP strategies and school changes and conditions over four years (Research Questions 6
and 9). These measures will involve minor adaptations to fit current state and district policies
(e.g., implementation of Common Core State Standards, principal and teacher evaluation
systems) of protocols already validated and being employed in district EDP evaluations (e.g.,
Ross & Reilly 2012).
Measures of implementation. Questions 7, 8 and 9 deal with principal perceptions about the
quality of the intervention and the changes that the principals chose to implement in their
schools. For these questions, multiple qualitative and quantitative sources of data will be
collected. Survey ratings will be analyzed quantitatively and compared for T vs. C using chi-
square tests of independence. For qualitative data, such as interviews, focus groups and open-
ended survey responses, the constant comparative method will be used to derive and code themes
and patterns. Inter-rater reliability will be determined by having different raters code the same
protocols.
Participation data. Attendance and participation data will be maintained (e.g., completion of
curriculum assignments) and coaching meetings for every participating EDP principal. For
protocols, see Figure 1 above.
Training surveys. Each training session will be evaluated using a brief survey asking
participants to rate clarity, organization and relevance in relation to the logic model’s direct
outcome dimensions of instructional leadership, knowledge of best practices and application of
best practices. These surveys, which include Likert-type ratings items and open-ended questions,
are used routinely by NISL in its EDP training. The surveys will be administered online via
Qualtrics by CRRE.
National Institute for School Leadership: Principals on the Path to Excellence 51
Training observations. A random sample of nine training sessions (three per state) will be
observed and impressions recorded on an “observation guide” that will be designed to capture
thorough field notes and simple rubrics of key dimensions of the EDP training, reflecting the
quality of the potential impact of this training: organization and clarity, time management,
adaptation to diversity (school characteristics, principal experiences) and participant
engagement. This observation guide will be developed in collaboration with NISL. Observations
will be conducted in collaboration with the external evaluators, CRRE.
Principal focus groups. At the completion of training, six focus groups (two per state, each
consisting of six to eight randomly selected principals) will be conducted by webinar to
determine reactions to the EDP implementation (i.e., curriculum content, professional
development activities and coaching), in relation to the logic model outcomes. Focus groups will
be conducted in collaboration with the external evaluators, CRRE.
Coach focus groups. Three focus groups (one per state) of randomly selected coaches will
be conducted by conference call at the completion of training. Questions will focus on
principals’ participation and coaches’ ability to provide the expected support with high fidelity.
Focus groups will be conducted in collaboration with the external evaluators, CRRE.
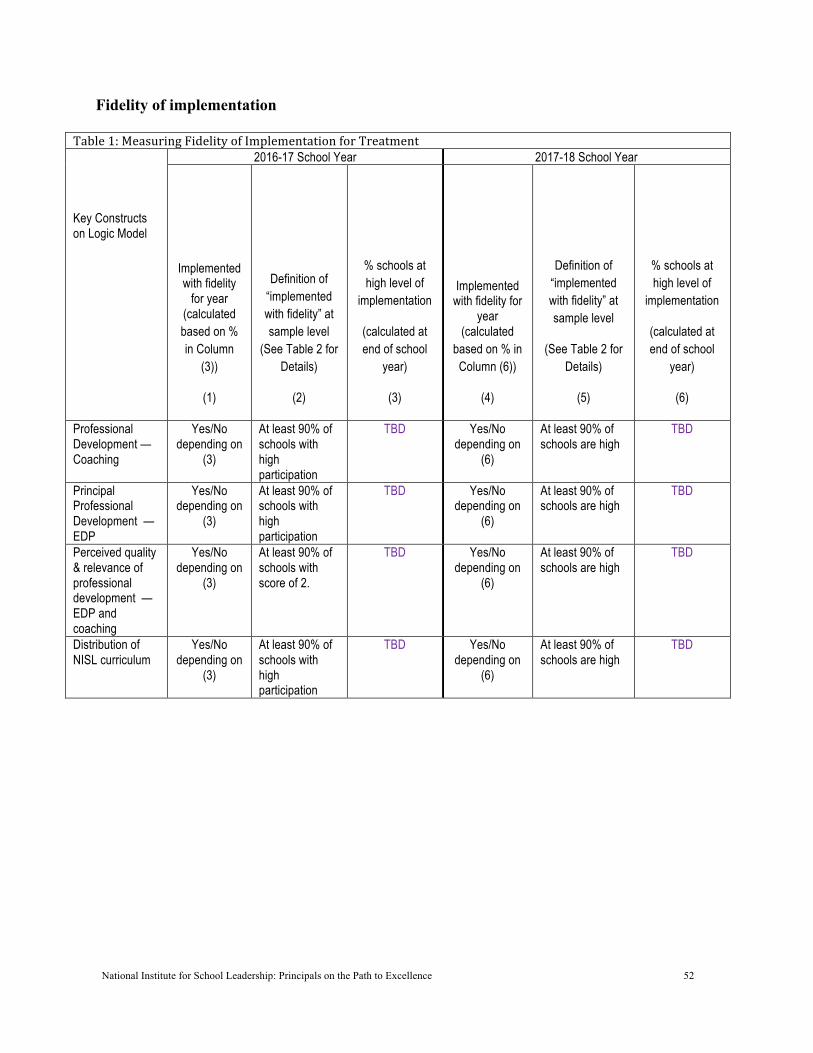
National Institute for School Leadership: Principals on the Path to Excellence 52
Fidelity of implementation
Table 1: Measuring Fidelity of Implementation for Treatment Key Constructs on Logic Model
2016-17 School Year 2017-18 School Year
Implemented with fidelity
for year (calculated based on % in Column
(3))
(1)
Definition of “implemented with fidelity” at sample level
(See Table 2 for Details)
(2)
% schools at high level of
implementation
(calculated at end of school
year)
(3)
Implemented with fidelity for
year (calculated
based on % in Column (6))
(4)
Definition of “implemented with fidelity” at sample level
(See Table 2 for Details)
(5)
% schools at high level of
implementation
(calculated at end of school
year)
(6)
Professional Development —Coaching
Yes/No depending on
(3)
At least 90% of schools with high participation
TBD Yes/No depending on
(6)
At least 90% of schools are high
TBD
Principal Professional Development — EDP
Yes/No depending on
(3)
At least 90% of schools with high participation
TBD Yes/No depending on
(6)
At least 90% of schools are high
TBD
Perceived quality & relevance of professional development —EDP and coaching
Yes/No depending on
(3)
At least 90% of schools with score of 2.
TBD Yes/No depending on
(6)
At least 90% of schools are high
TBD
Distribution of NISL curriculum
Yes/No depending on
(3)
At least 90% of schools with high participation
TBD Yes/No depending on
(6)
At least 90% of schools are high
TBD
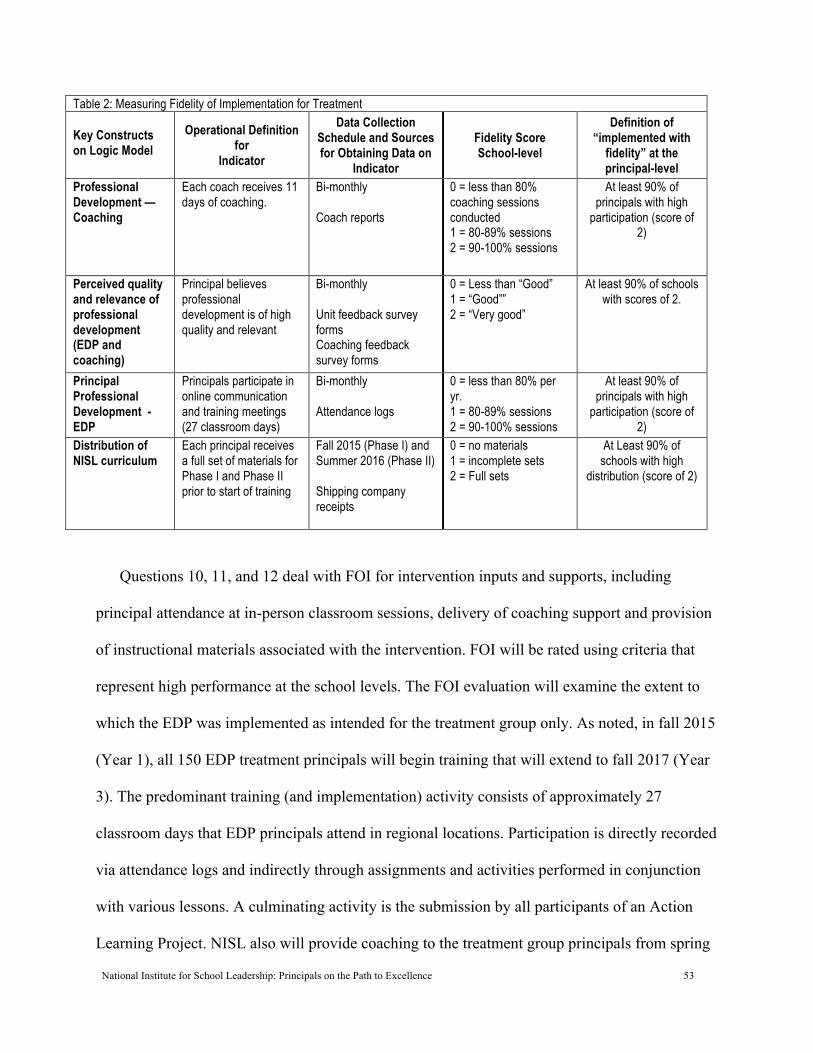
National Institute for School Leadership: Principals on the Path to Excellence 53
Table 2: Measuring Fidelity of Implementation for Treatment
Key Constructs on Logic Model
Operational Definition for
Indicator
Data Collection Schedule and Sources for Obtaining Data on
Indicator
Fidelity Score School-level
Definition of “implemented with
fidelity” at the principal-level
Professional Development —Coaching
Each coach receives 11 days of coaching.
Bi-monthly Coach reports
0 = less than 80% coaching sessions conducted 1 = 80-89% sessions 2 = 90-100% sessions
At least 90% of principals with high
participation (score of 2)
Perceived quality and relevance of professional development (EDP and coaching)
Principal believes professional development is of high quality and relevant
Bi-monthly Unit feedback survey forms Coaching feedback survey forms
0 = Less than “Good” 1 = “Good”” 2 = “Very good”
At least 90% of schools with scores of 2.
Principal Professional Development - EDP
Principals participate in online communication and training meetings (27 classroom days)
Bi-monthly Attendance logs
0 = less than 80% per yr. 1 = 80-89% sessions 2 = 90-100% sessions
At least 90% of principals with high
participation (score of 2)
Distribution of NISL curriculum
Each principal receives a full set of materials for Phase I and Phase II prior to start of training
Fall 2015 (Phase I) and Summer 2016 (Phase II) Shipping company receipts
0 = no materials 1 = incomplete sets 2 = Full sets
At Least 90% of schools with high
distribution (score of 2)
Questions 10, 11, and 12 deal with FOI for intervention inputs and supports, including
principal attendance at in-person classroom sessions, delivery of coaching support and provision
of instructional materials associated with the intervention. FOI will be rated using criteria that
represent high performance at the school levels. The FOI evaluation will examine the extent to
which the EDP was implemented as intended for the treatment group only. As noted, in fall 2015
(Year 1), all 150 EDP treatment principals will begin training that will extend to fall 2017 (Year
3). The predominant training (and implementation) activity consists of approximately 27
classroom days that EDP principals attend in regional locations. Participation is directly recorded
via attendance logs and indirectly through assignments and activities performed in conjunction
with various lessons. A culminating activity is the submission by all participants of an Action
Learning Project. NISL also will provide coaching to the treatment group principals from spring
National Institute for School Leadership: Principals on the Path to Excellence 54
2016 to summer 2017. The FOI design will examine each implementation component. Table 1
(above) describes the process of rolling up fidelity scores to the program level. An aggregate FOI
index for the treatment can be computed by determining the overall percentage of schools for
each state with high implementation.
6) The extent to which the proposed project plan includes sufficient resources to carry out
the project evaluation effectively.
NISL has carefully selected leading research organizations and an expert and experienced
team of researchers to carry out the project evaluation and allocated sufficient resources for the
NISL EDP–V.
The Center for Research and Reform in Education (CRRE) at JHU has evaluated and
supported a wide array of programs addressing teachers’ and school leaders’ professional
development and rigorous randomized controlled trials of multiple educational programs,
including two ongoing i3 projects. Of particular relevance to the proposed project is CRRE’s
central role in:
• Developing a 2012 guidebook, sponsored by the National Association of Elementary
School Principals and National Association of Secondary School Principals, on principal
evaluation research and suggested methods
• Serving as evaluators of the NISL EDP in Pennsylvania, Massachusetts and Milwaukee
The Center for Educational Partnerships (TCEP) of the Darden College of Education at ODU
currently manages a portfolio of approximately $29 million in educational R&D grants and
contracts, with annual R&D expenditures of approximately $3 million. TCEP draws on the
capacity and expertise of more than 100 Ph.D. faculty in the Darden college; the research,
development and dissemination support provided by the ODU Office of Research; and the
National Institute for School Leadership: Principals on the Path to Excellence 55
grants/contracts administration capabilities of the ODU Research Foundation. The National
Science Foundation recently ranked the Darden college o as 16th in the United States in
educational R&D expenditures.
Roisin P. Corcoran, Ph.D., will serve as Principal Investigator (PI) and lead the randomized
control trials of the evaluation. Dr. Corcoran is an assistant professor in the JHU School of
Education (100% research tenure track) and the Director of Data Analysis and Research Scientist
at the CRRE. She is a chartered psychologist and conducted her postdoctoral training in
psychology at the Yale University. She is currently conducting a district-wide, independent,
quasi-experimental study of the EDP’s impact on low-performing, high-poverty schools in
Milwaukee. She is an expert on data analysis and experimental designs and has worked on
evaluations in the United States and Europe. Currently, she serves as the external evaluator for
two multi-million dollar i3 studies (validation and development, including randomized studies of
Success for All). She is expert in the use of Hierarchical Linear Analysis (HLM) and Multilevel
Latent Growth Curve Modeling (LGM), which will be used in the NISL EDP–V. She has
received numerous scholarships, grants and awards for her research, including the American
Psychological Association Early Career Award in Educational Psychology for her work on
Multilevel LGM. Previously, she served on the George W. Bush Presidential Center Task Force
for Evaluating Principal Preparation Programs.
Steven Ross, Ph.D., Co-PI, will lead the fidelity of implementation and case study parts of
the evaluation. He is a professor and educational researcher at CRRE. Previously, he held several
distinguished positions, including Director of the Center for Research in Educational Policy at
the University of Memphis. Dr. Ross co-authored two state-level evaluations of the EDP with
Dr. Nunnery and has partnered with the American Institutes of Research on research and design
National Institute for School Leadership: Principals on the Path to Excellence 56
of effective principal evaluation systems.
Alan Cheung, PhD., will serve as an advisor to the NISL EDP–V. He is an associate
professor and CRRE and a research fellow at the Center for Assessment Research and
Development at the Hong Kong Institute of Education. He has participated in large-scale,
national randomized field experiments and published over 70 journal articles and book chapters
and 30 technical reports. In 2008, he received the Palmer O. Johnson Award for the best journal
article published in an American Educational Research Association journal.
John Nunnery, Ph.D., will assist with the quantitative portion of the evaluation study,
including the randomized control trials. He is the Executive Director and lead research scientist
at TCEP at ODU. He previously served as Director of the Bureau of Educational Research at the
University of Memphis and associate research scientist at JHU. The National Clearinghouse for
Comprehensive School Reform, the Comprehensive School Reform Quality Center and the
Education Commission of the States all have cited his work as meeting the highest standards of
rigor. He recently conducted statewide studies of the impact of the EDP on student achievement
in Massachusetts and Pennsylvania.
We have budgeted $2.2 million for the evaluation organizations and team to conduct the
proposed evaluation, which represents about 17% of the project budget. It includes 20% of Drs.
Corcoran’s, Ross’ and Nunnery’s time to conduct the project evaluation over the five-year grant
period. Together, the evaluation organizations and team and the significant evaluation budget
will provide sufficient resources to carry out the evaluation plan in a highly effective manner.

National Institute for School Leadership: Principals on the Path to Excellence 57
COMPETITIVE PREFERENCE PRIORITIES
Competitive Preference 1—Improving Cost-Effectiveness and Productivity
This project will substantially improve student outcomes without commensurately increasing
per-student costs (Competitive Preference Priority 1a). The EDP is a cost-effective model for
improving principal effectiveness and student achievement. Every principal is trained to cultivate
the conditions for high performance school-wide, as described in more detail below.
1) A clear and coherent budget and student outcomes. Training just one principal
positively impacts hundreds of students every year, over many years. Documented learning gains
averaged one to two additional months of learning per student in both math and English language
arts (ELA) in the EDP’s large-scale study in Massachusetts. Middle school proficiency rates
increased four percentage points faster in ELA and two percentage points faster in mathematics
than comparison schools in the EDP’s large-scale study in Pennsylvania. With improvements
made to the EDP since then and several more years of experience, we expect even greater results
on this project. These substantial learning gains will be obtained for just $35 per student! This is
calculated by taking the total project cost of $13.2 million and dividing it by the 375,000 students
we expect to impact, which is based on several estimates. First, there will be 150 schools in the
treatment group. Second, we will provide districts with four additional “free seats” for each
school in the treatment group. This additional EDP training will be provided to entice an
adequate number of districts to participate in the random control trials. This results in a total of
750 principals who will be trained during the project. Third, we estimate that each school will
have about 500 students. This number is conservative because it does not take into account new
students who will enter schools during the five-year grant period. These estimates result in about
375,000 students receiving potential benefits from this project (150 treatment schools + 600
National Institute for School Leadership: Principals on the Path to Excellence 58
other schools x 500 students for each school ((150 + 600) x 500)).
The per-student cost of $35 results in an additional cost of just one-third of one percent
(based on 2009 national average cost per student of $10,500). Several evaluations of the EDP
have detected increased proficiency rate gains of two to four percentage points in both math and
ELA, for schools with rates that started near 50%. This translates into a 4% to 8% improvement
in outputs. Therefore, the increased proficiency rates are expected to easily outpace the
additional costs incurred (.3% cost gain versus 4% to 8% outputs), significantly improving cost-
effectiveness.
2) More cost-effective than alternative practices. The full cost of the EDP for this project,
including evaluation and overhead, is $17,600 per school ($13.2 million ÷ 750 schools). The
EDP is substantially more affordable than other high-quality principal training programs, such as
the KIPP program for aspiring school leaders, which received a $60 million i3 Scale-up grant in
2010 to train 250 principals, a cost per principal of $240,000, or New Leaders, which received a
$16.5 million i3 Validation grant in 2012 to train 145 principals, a cost of $113,000 per principal.
Likewise, high-quality “pipeline” programs cited as “innovative” by the Rainwater
Leadership Alliance (Cheney, Davis, Garrett & Holleran 2010) cost over $100,000 per
graduate—and more if required internships are factored in. In marked contrast, the average cost
of the EDP is less than $10,000 per school (without the evaluation that is required for this i3
grant competition). Despite costing just 10% to 20% as much as pipeline programs, the EDP has
documented student learning gains as strong as or stronger than these programs.
In addition, the effect sizes of .07 to .14 found in recent rigorous evaluations of the EDP
(Nunnery, Ross, Chappell Moots, Pribesh & Hoag-Carhart 2011) are comparable to the effect
sizes found for comprehensive school reform models and greater than the impact found in class-
National Institute for School Leadership: Principals on the Path to Excellence 59
size reduction initiatives (Borman, Hewes, Overman & Brown 2003). However, these initiatives
typically cost between $250,000 and $500,000 per school—10 to 20 times the cost of the EDP.
3) One-time vs. ongoing costs and a plan for sustainability. Our proven train-the-trainer
model for the EDP makes leadership training at scale much more affordable for states and
districts. We train and certify local facilitators to deliver the EDP with fidelity and efficacy—and
equip principals to achieve strong results. For this project, we plan to certify 60 local educators
(20 in each state) at a cost of $945,000. In addition, the evaluation plan will cost about $2.2
million. The remaining $10.2 million will pay for the ongoing costs to train 750 educators.
Our plan for the expansion of the EDP after the i3 grant ends has three major components.
First, we will create a partnership with a local education organization in each of the three states
where the training will take place. This has proven highly successful in other projects—in
Massachusetts with the state education department, in Pennsylvania with regional education
service agencies and in Minnesota with the University of Minnesota. These organizational
training partners typically host or convene the cohorts. They often subsidize the training with
some of their own funding or use their reputations or authority to persuade school districts to
participate. The three partnerships cited each have been running for more than seven years and
have resulted in close to 5,000 EDP graduates. Second, we will disseminate the findings from the
project to create demand for expansion, including speaking at conferences and reaching out to
individual school districts. Third, we will take advantage of economies of scale to reduce the cost
of additional training to about $5,000 per participant (reducing per-student costs to just $10).
This will make the training affordable even to cash-strapped districts.
4) Substantially increasing cost-effectiveness. EDP training is designed to substantially
increase the cost-effectiveness of leadership training for districts. Few districts have the money,
National Institute for School Leadership: Principals on the Path to Excellence 60
time or staff capacity to research, design or develop a high-quality leadership development
program (or programs) tailored for aspiring, novice and veteran principals. The EDP, which has
proven effective with both current and aspiring principals, eliminates the need for districts to
fund and create their own programs. The EDP itself is structured to be cost-effective. Cohort-
based training using blended (face-to-face and online) learning modules is far more cost-
effective—and pedagogically effective as well—than training single principals in leading
alternative leadership development programs or in graduate schools of education. During this
project we will use our rigorous train-the-trainer model. This reduces the cost per participant
from $12,600 to less than half that. We are also focusing on only three states, which will allow
us to build economies of scale. In Massachusetts, for example, economies of scale have reduced
the program cost from $7,000 per participant to just $4,075.
5) Evaluation of cost-effectiveness. We plan to incorporate cost-effectiveness measures into
the project evaluation to document this strength of the EDP and identify more opportunities for
efficiencies. We have $90,000 budgeted for this portion of the study. One measure we will use is
a comparison of the dollar value of the additional months of learning gains to the program cost to
estimate a return on investment. This can be done by estimating the average learning gain per
student (based on scale scores on state tests, for example) and dividing it by the cost per student
in each school. In addition, we will estimate productivity gains of principals using such measures
as cost per proficient student. For example, an ODU study found student proficiency rates climb
by 20% in Pennsylvania high schools led by principals trained in the EDP (Nunnery, Yen &
Ross 2011). Since spending increased only marginally during the same period, this gain in an
important student outcome represents a large productivity improvement in the number of
proficient students per dollar spent in schools.

National Institute for School Leadership: Principals on the Path to Excellence 61
Competitive Preference 2—Enabling Broad Adoption of Effective Practices
The EDP is the only leadership development program in America that can address the
magnitude of the nation’s leadership challenge at scale. In nine years, more than 8,000 school
leaders in 21 states have completed our rigorous, coherent and comprehensive program,
including state-run implementations in Arizona, Kentucky, Massachusetts, Minnesota, Missouri,
Pennsylvania and Virginia. In comparison, the second most popular principal training model in
the country, New Leaders, has graduated about 900 over 13 years. Therefore, we have a track
record of broad adoption and plan to accelerate it if this proposal is funded.
a) What practices are being prepared for broad adoption? The EDP is very well
documented, with an extensive curriculum that includes a participant manual, a library of
professional books and articles, online curriculum, job-embedded tools, a facilitator guide and
tools, an instructional leadership instrument and participant implementation tools. It is filled with
best practices from this country as well as from benchmarking studies of the top-performing
countries in the world. Although we have impressive evidence that training principals to be
better instructional leaders translates directly to student achievement gains, this study will help
us discern which practices taught in the EDP are most often used by principals to produce these
gains. Also, too many district and state leaders believe that once a principal receives a principal
license or certificate to take on the role, the need for rigorous professional development ends.
The results of this validation study will help us to communicate to the education community the
importance of high-quality professional development for sitting principals, which should lead to
much broader adoption of this practice in states and districts.
b) How will you identify the critical components of the practice that are crucial to its
success? Our logic model posits that leadership effects “ripple” through schools, having a series

National Institute for School Leadership: Principals on the Path to Excellence 62
of direct, medial and indirect impacts. By assessing the mediating effects of the different natural
variants of the model and measuring the relationships among theses variables in three random
control trials (one in each state) and 12 case studies, we will shed important light on how
specifically the EDP changes principal practice and how these changes lead to student
achievement gains. This will be valuable insight for future improvements to the EDP design and
inform the education community which leadership practices are most important to replicate.
c) What is the plan for developing the materials and supports necessary to implement
the program in other entities? The most important support needed for scale-up of the EDP are
local educators who have been certified by NISL to implement the EDP. We propose to certify
60 strong, local educators during this five-year project. This is how our work began in

National Institute for School Leadership: Principals on the Path to Excellence 63
Massachusetts and Pennsylvania; after eight years, about a third of the 4,700 principals in those
two states are EDP graduates. California, Florida and Mississippi have almost 16,000 schools.
Creating these 60 NISL-certified educators, along with the local success stories that accompany
our implementation projects, will allow us to take a big step toward a similar success in these
three states. We also have developed an enhanced coaching model, which uses key EDP
practices as a focusing tool for coach–principal interactions, that we will use for this project.
This entails adapting existing EDP tools for use by coaches to highly leverage their time with
principals. We also will document best practices in coaching, such as timing of coaching visits,
matching of coaches with principals and the most impactful focus areas.
d) How will you assess replicability and adaptability in a variety of settings? The EDP
has demonstrated results in raising student achievement in elementary, middle and high schools;
struggling schools and “good” schools; urban, rural and suburban schools; and in many
geographic regions. For this project, we will recruit between 30 and 60 school districts across
three states and execute randomized control trials with sufficient power in each of the three
states. This will provide our implementation and evaluation teams with a rich array of different
locations and settings to assess implementation effectiveness, including the new coaching
materials and tools.
Accelerating Broad Adoption. We will both enable and accelerate broad adoption using
these three strategies:
1. We will train and certify 60 local educators. This will put in place the capacity to scale up
within the three states. This will also lower costs by allowing local educators to facilitate the
training instead of flying in national trainers. We also will form partnerships with state education

National Institute for School Leadership: Principals on the Path to Excellence 64
departments, universities or regional education service agencies to act as local training partners,
thereby creating local capacity to expand the training to more principals in the future.
2. At the end of the Validation grant period, the results from the randomized control trials
will provide a tremendous incentive for broader adoption of high-quality leadership development
programs nationwide. The quantitative and qualitative evaluations will provide further evidence
that the EDP works—and how it works. Also, through the economies of scale that will develop,
we will be able to reduce the cost of future training to around $5,000 per participant.
3. We chose our focus states very purposefully. Even though the EDP is the most widely
used leadership development program in the country, we have not worked in California and
Florida (two of the largest states in the country) since our initial pilot in 2005. High exposure
from a project like this one will spur other districts in these states to adopt the program. On the
other hand, we chose Mississippi as a partner due to the state’s large challenges relating to its
high poverty rates and highly rural school system. Success in these diverse environments will
convince the skeptics that high-need schools can take a major step forward even when only small
amounts of additional money are available.
Competitive Preference 3—Supporting Novice i3 Applicants
The National Institute for School Leadership has not received a grant under the i3 program so it
qualifies for this competitive preference.
Copyright © 2022 FDOKUMEN

