


Bahasa
Halaman
Hukum


1
Prevalence of Past Year Assault among Inner-City ED Patients
Rebecca M. Cunningham, MD1, Regan Murray, PhD2, Maureen A. Walton, MPH, PhD2, Stephen T.
Chermack, PhD2,3, Marcin Wojnar, MD2, Wozniak, Piotr 1,2,Brenda M. Booth, PhD4, and Frederic C.
Blow, PhD2,3
1 Department of Emergency Medicine Injury Research Center, University of Michigan, Ann Arbor,
MI and Hurley Medical Center, Flint, MI
2 Department of Psychiatry, University of Michigan, Ann Arbor, MI
3 Department of Veterans Affairs, Health Services Research & Development, Ann Arbor, MI
4 Department of Psychiatry and Behavioral Sciences, Division of Health Services Research College of Medicine, University of Arkansas for Medical Sciences, Little Rock, AR, USA; Central Arkansas Veterans Healthcare System (BMB), Little Rock, AR, USA;
Corresponding Author: Dr. Rebecca Cunningham
Email: [email protected]
Role of Funding Source
This work was supported by grants from the National Institute on Alcohol Abuse and
Alcoholism, NIAAA (#AA014665) and the National Institute on Drug Abuse, NIDA (#DA 016591).
Contributors: Drs. Cunningham, Murray, and Walton wrote the initial draft of the manuscript. Drs.
Blow, Booth, Walton, and Chermack conceptualized the study and are investigators on the grant
funding this work. Dr. Wojnar assisted in editing the manuscript. All authors contributed to and
have approved the final manuscript.
Conflict of Interest: All authors declare that they have no conflicts of interest.
Acknowledgments: We would like to thank the medical staff and patients at Hurley Medical Center
for their support of this research, and Pat Bergeron for her assistance with manuscript preparation.

2
Abstract
Objectives: 1) To determine the rates of past year non-partner violent assault (NPV), both
victimization and aggression. 2) To assess variables associated with NPV, particularly with regards
to substance use. Method: A cross sectional computerized standardized survey study was
conducted to assess NPV, physical and mental health, and substance use among patients
presenting to an inner-city ED over two years. Patients (age 19-60) with normal vital signs in an
urban ED from 9am-11pm were eligible; pregnant patients and those with a chief complaint of
psychiatric evaluation were excluded. Logistic regression analyses were conducted to predict any
NPV .Results: 10,744 patients were enrolled (80 % response rate); 14% of the sample reported
any past year NPV (9% perpetration; 11% victimization). Findings from regression analyses found
participants with any past year NPV (victimization or aggression) were more likely than their
counterparts to be younger (OR 1.1), male (2.2), single (1.5), unemployed (1.1), present to the ED
for injury (1.9), report poor physical health (1.32) poor mental health (1.9). They were less likely to
be African-American (0.8). Alcohol use (1.7), marijuana use (2.4), cocaine use (3.1), prescription
drug use (1.4) and past treatment (1.7) were associated with experiencing past year NPV.
Conclusions: Fourteen percent of patients seeking care in this inner-city ED experience violence
with a non-partner. Substance use and cocaine specifically, was the strongest predictor of any
NPV.

3
Background
Each year more than 37 million patients visit emergency departments (EDs) with injuries.1
Of these visits, approximately 17% are related to violence or assault. Research from multiple
disciplines suggests that violent injury is non-random and is best predicted by the past experience
and behavior.2 Among fatal injuries, 20% are related to interpersonal violence.3 Assault-related
injuries have reached epidemic numbers, exceeding 2 million persons annually4 with homicide a
leading cause of death among young adults.5 Often, in non-intimate partner violence, the victim
and assailant know each other, with friends or relatives involved in the majority of gun-related
violence.6-8 Nationally more individuals report victimization by friends or acquaintances, then by
spouses or dating partners.9 Among women in the ED, prior research finds that half of assault-
related injuries were perpetrated by a non-partner,10 underscoring the importance of understanding
violence outside of intimate partner relationships.
A potentially critical factor in violence is alcohol and illicit drug use.11, 12 High rates of alcohol
use and alcohol intoxication at the time of the event were found among individuals incarcerated for
violent offenses.13, 14 Among cocaine users in the ED, Cunningham et al. (2007)15 found non-partner
violence (NPV) was significantly related to greater binge drinking, diagnosis of substance or
dependence, greater legal involvement, and higher rates of seeking medical attention for intentional
injuries. Chermack et al. (2001)16 found significant associations between NPV and demographic
variables (e.g., minority status, years of education), days of substance use (e.g., cocaine), and
overall psychological distress in a substance use treatment sample. To date, no ED-based studies
have evaluated violence in a non-partner context among a general sample of ED patients.
Importance
Although there has been an increase in the number of studies on violent assault (both
aggression and victimization) and substance use among ED patients, most of the violence related
research has focused on intimate partner violence (IPV).17-19 Patients who are admitted to a trauma
service overnight following a violent injury have been found to have a high risk of adverse outcomes

4
in the subsequent year with one study reporting that 13% were incarcerated, 44% experienced a
repeat violent injury, and 20% were victims of homicide.20
Other ED-based studies of violent injury among non partners have focused only on patients
injured severely enough to require a trauma consult or hospital admission, thus missing a huge
section of the injured population who are treated and released. Furthermore, prior research on non-
IPV has focused on the injury (laceration, gun shot wound, or contusion) that brought the patient to
the ED, thereby limiting the ability to understand other recent episodes of violence. Data are lacking
on the involvement of violence among the majority of patients treated in an inner city ED for medical
illness or non life threatening injury, which would inform injury prevention efforts. The ED presents
an opportunity to interface with patients at high risk for violence. This ED visit may be the only
health system interaction prior to interfacing with the criminal justice system; yet, currently little is
known about the prevalence or characteristics of violence among non-partners seeking ED care for
injury or illness.
Although many patients with violent injuries from an assault are victims experiencing an
isolated tragic event, others may be recurrently involved with violence and could benefit from
targeted referral-based interventions appropriate to their history and risk factors. For example,
studies have demonstrated that the psychological and descriptive profiles of both assailants and
victims of intentional injury are quite similar; frequently the victims are the offenders in other
assaults.21, 22 Patients involved in violence in non-partner relationships are also likely to be involved
in aggression or victimization in partner relationships.23, 24 Data regarding the relationship between
violence and substance use in a consecutive sample of patients presenting over a two-year period
to an inner city ED could provide valuable information to determine the need for, and content of,
future violent injury prevention programs.
Goals of This Investigation
The primary aims of this study were: 1) To determine the prevalence of past year non-
partner violent assault (NPV), both victimization and aggression, and, 2) To assess variables
associated with NPV, particularly with regards to substance use.

5
The prevalence of NPV in national surveys appear to be equal to or greater than IPV rates.8,
9 It is critical to understand the experiences with NPV among adult ED patients to better inform the
assessment, treatment, and prevention of violence-related injury. Specifically, based on previous
research, we hypothesized that male gender,16 younger age,25, 26 unemployment,27, 28 fewer years of
education,27, 29 and less income16 would be associated with NPV. We expected that both poorer
mental and physical health would be associated with NPV.30, 31 Finally, given findings from clinical
and laboratory research,32, 33 we hypothesized that participants with a past year history of NPV
would be more likely to have used alcohol, cocaine, cannabis, and/or prescription drugs (opiates/
depressants sedatives), compared to those with no NPV.
Methods
Study Design: An observational cross-sectional survey study was conducted. Patients (ages 19-
60) seeking care for injury or medical complaints were approached by research staff to participate in this
computerized survey study. Bachelor level research staff recruited patients who were in treatment spaces
in the ED from 9am – 11pm, seven days a week over a full two-year period. This does not include patients
treated at study ED on days not covered by research recruiting staff (excluding major holidays, RA vacation
days, RA sick days). During hours when an RA was present, consecutive patients in treatment spaces
were systematically sampled. After obtaining written consent, the 10-15 minute screen was administered
to eligible patients.
Setting
The study site was an inner-city Level 1 trauma center ED in Flint, Michigan, with an annual ED
census of approximately 50,000 adult patients (of which ~50-60 % are African American). Hurley
Medical Center is the only public hospital in the city. Flint is comparable in terms of poverty and
crime to the other urban centers such as Detroit, Hartford, Camden, St Louis, Oakland.34 The
population of Flint is 50% African-American.35 The study protocol was approved by Institutional
Review Boards (IRB) for Research with Human Participants at the University of Michigan and the
Hurley Medical Center; Certificates of Confidentiality were obtained from NIAAA and NIDA.

6
Selection of Participants
All potentially eligible adult patients presenting to the ED for medical illness or injury were
approached to complete a computerized survey as part of a larger randomized controlled trial
linking patients to substance use treatment. Patients who were ambulatory or arrived by ambulance
were eligible, providing they were not triaged to the resuscitation bays. Patients were excluded if
they were pregnant, had abnormal vital signs, or were unable to provide informed consent (e.g.
unconscious, police custody). Patients seeking care solely for psychiatric evaluations (i.e. chief
complaint suicidal ideation, psychosis) were not eligible. In this manner, this study focuses on the
rates of violence and substance use among patients who would not receive further mental health
evaluation or intervention in the ED. Patients who were acutely intoxicated at the initial ED
presentation were approached following clearing of mental status. Patients who declined to
participate provided their gender and race as well as reasons for refusing to participate. (Our IRB
did not allow collection of additional data regarding patients who declined participation without
written consent.) Data for this paper were obtained for two full years of recruitment (April, 2006 -
March, 2008).
Methods of Measurement
Potential NPV risk domains were selected based on theoretical models of violence and prior
findings,33, 36-39 and included demographics (age, minority status, gender), health factors (physical
and mental health history), and substance use history (i.e., alcohol, cocaine, cannabis, past 3-
month treatment) factors (see Appendix A for theoretical model).
Participants completed a computerized survey, with aid from a RA if needed, regarding
demographics (age, gender, race/ethnicity, marital status, income, and years of education
completed),40 health status, substance use, and violence (see Appendix B for survey). The survey
took ~10-15 minutes to complete and was in English only (consistent with the study site population).
Participants completed the survey in a treatment room. The site IRB did not allow surveys to be
completed in the waiting room. RA staff paused the computer when medical staff was present or if

7
participant went to testing, and was available to answer questions. The survey did not impact
patient flow.
Assault: NPV victimization and aggression: NPV victimization was assessed by one item
from the Partner Violence Screen (PVS)41 and adapted for non-partners: “In the past year, have you
been hit, kicked, punched, or otherwise hurt by friends, strangers, neighbors, people in bars,
coworkers, bosses?”. In a similar manner, NPV aggression was assessed by asking: “In the past
year, have you hit, kicked, punched, or otherwise hurt friends, strangers, neighbors, people in bars,
coworkers, bosses?” Although this one item screen has not be validated, the full length PVS has
adequate sensitivity (54.5-71.4) and specificity (80.3-84.4) as compared to more lengthy measures
for use in ED settings.42
Physical and Mental Health Functioning: The SF-12 Health Survey which has been
validated in an ED setting43 was used to assess physical and mental health functioning over the
prior 4 weeks.44-46 For analysis purposes, a cut-off at the 25th percentile on the SF-12 was used to
indicate low/high functioning in each domain.
Alcohol and Drug Use: Frequency of substance use (past 4 weeks) and related symptoms of
abuse/dependence were determined by items from the Substance Abuse Outcomes Module47 The
SAOM was used to measure alcohol and drug use (illicit and prescription use) along with questions
to ascertain separate DSM-IV diagnoses for alcohol, cocaine, and marijuana abuse and
dependence. Prescription drug use included: Opiates (i.e. Morphine, Codeine, Vicodin, ,
OxyContin, Darvocet, Percodan, Fentanyl, etc ) and Sedative/Depressants ( i.e. , Xanax, Librium,
Quaaludes, Halcion, sleeping pills, nerve pills, downers, barbiturates etc). One additional item from
the SAOM investigates the timing of substance use and fighting “I got into physical fights while
using alcohol or drugs”. The SAOM has demonstrated reliability (internal reliability coefficient 0.58-
0.90, test-retest reliability 0.56-0.99) and validity (concurrent validity 0.5-0.8, predictive validity 0.5-
0.9).47
In order to tease apart differential effects of the most commonly used substances (alcohol,
marijuana, and cocaine) in our sample, we constructed the following three variables: alcohol use

8
only (these patients did not use marijuana or cocaine), marijuana use (with or with out alcohol), and
cocaine use (with or without marijuana or alcohol). This 3 category approach was chosen to
represent an increasing severity of substance use (patients with any cocaine use are hypothesized
to be a different patient population then those who report, any marijuana use without other illicit
drugs, or alcohol alone without illicit drug use). Participants also reported if they had been in
treatment for substance use in the past 3 months.
Chief Complaint: Trained research staff recorded the reason for the current ED visit (medical
or injury) at the time of the survey administration as stated by the patient. Patients were not asked
if their visit was the result of violence.
Data Analysis
Data analyses were conducted with SAS version 9.1 for Windows (Cary, NC). Responses
to demographic responses were dichotomized into the following categories for analysis: African
American (yes/no); married/ living together (yes/ no); any college education or more (yes/ no);
income less than $20,000 (yes/no), health insurance (yes/ no), employed (yes /no). Age was
analyzed as a continuous variable. Demographic variables were dichotomized to ease clinical
interpretation, based on the current literature on NPV and substance use.26, 28, 48
First, we present prevalence of past year assault (NPV) in this sample. Second,
characteristics of patients with and without past year NPV victimization, and with and without NPV
aggression are presented. Third, due to the similarity of victimization and aggression results, these
variables were collapsed into any NPV, and bivariate associations evaluating participants with and
without any non-partner violence were conducted. Finally, three separate logistic regression
analyses were conducted to predict: any NPV (presented in main results), non-partner aggression,
and non-partner victimization. See technical Appendix C for details of analysis, handling of missing
values, and regression diagnostics.

9
Results
During a two-year period of recruitment, 13,493 patients were approached, 80% (n=10,744)
consented to participate in screening; 20% (n=2,749) declined. Figure 1 illustrates patient flow. Among
those who declined, 46% were male and 55% were African American.
Characteristics of Study Participants
On average, the study participants were relatively young (mean age=36.4 years, SD=11.5),
female (56%), and 56% African-American (40% Caucasian, 3% other races). Typical of the study
city, only 2% of sample was Hispanic/Latino. The proportion of subjects who declined participation
did not differ by sex or race. Just over a quarter (27%) presented to the ED for an acute injury.
Sixteen percent of the total sample met DSM-IV criteria for either abuse or dependence on alcohol
or illicit drugs.
Main Results
Prevalence of NPV
Overall 14% (n=1475) of patients surveyed seeking ED evaluation reported violence with a
non-partner in the past year (Table 1). Among participants reporting NPV, 42% (n=618)
experienced both victimization and aggression, 21% (n=315) reported only aggression and 37%
(n=542) reported only victimization. The majority of those reporting NPV were men; however, more
than 1/3 of those (38%) experiencing NPV were women. In addition, men accounted for 64%
(738/1160) of the NPV victimization reported and 65% (609/933) of the NPV aggression.
NPV Aggression & Victimization
Results of parallel bivariate analyses of participants, who engaged in NPV aggression
compared to no NPV, and NPV victimization compared to no NPV, were similar (Appendix D).
Therefore, further analysis presented here focus on any NPV (collapsed victimization and
aggression).
Description of Participants with NPV and no NPV
Characteristics of patients with and without NPV are presented in table 2. Participants with
past year NPV presented more often to the ED for an injury than a medical complaint; among

10
participants presenting for injury, 21% (n=622/2936) reported past year NPV. Twenty percent of
participants with past 30 day any prescription drug use note NPV (17 % of those with NPV report
prescription opiate use, 7 % of those with NPV report prescription sedative use). Twenty five
percent (n=365) of those with NPV noted they “got into physical fights while using alcohol or drugs”
within the past year as compared to 2% (n=206) of those without NPV.
Logistic Regression Analysis Predicting NPV
Logistic regression models predicting involvement in past year NPV were conducted with all
variables entered simultaneously. The model was significant (χ2 (15) = 1143.82, p<.0001) (Table
3). Participants who experienced past year NPV had twice the odds of being male or seeking ED
care for an injury. They were younger, less likely to be African American, living with a partner or
employed, and had an increased association with poor physical and mental health. Regarding
substance use, any use of cocaine increased the odds of NPV by 3 times (2.41, 3.98) with NPV. In
addition to that, alcohol, marijuana and prescription drug users were also more likely to increase the
odds of NPV. Having substance use treatment in the past 3 months was associated with (OR 1.7)
with NPV.
Parallel regressions analyses predicting non-partner victimization and aggression separately
were also performed. The pattern of results was consistent across victimization and aggression; all
models were significant and the findings for victimization and aggression did not differ from the
findings of overall NPV (see appendix D).
Limitations
Although this study presents important information on the prevalence of NPV in an ED
sample, there are several limitations that need to be addressed. First, given the cross-sectional
design of this study and the mixed time frames assessed by various instruments, it is impossible to
infer causality or temporal relationships of the associations found between NPV and associated
correlates. Second, findings from this inner-city ED may not be generalizable to EDs outside of this
setting, especially those in areas that substantially differ from where this study occurred (e.g., rural
settings), and implication for screening and intervention may not apply in those settings. Third, the

11
shortened version of the PVS requires validation and may be less sensitive then the full PVS. This
brief measure, along with the exclusion of pregnant patients, those presenting with psychiatric chief
complaints, and those presenting overnight, may potentially underestimate the frequency of NPV in
the sample. Fourth, the analysis does not include an interaction term to address the possible
interaction of substance use and mental health, which may lead to biased estimates. Fifth, data is
self reported; however, recent reviews have concluded that reliability and validity of self-reported
alcohol, tobacco, and other drug use is high,49-53 and patients are more likely to report drug use
using computerized surveys and when privacy/confidentiality is assured.54-56 Fifth, although
assessment of NPV was conducted using brief, self-administrated questions which maximize
feasibility in a study of over 10,000 ED patients, replication of these findings with longer, more
detailed instruments (e.g., Revised Conflict Tactics Scale II;57 Timeline Aggression module29) and
multiple study sites is needed.
Discussion
This study represents one of the first to examine past year assault among a large
consecutive cohort of medical and injured ED patients. This data suggest that a significant
proportion of patients presenting to an inner-city ED have been involved in violence with a non-
partner in the past year: 14% of all patients sampled and 21% of injured patients sampled. The
prevalence of NPV found in this sample is higher than NPV prevalence found in community
samples (e.g., 5.6%)58 and is equal to or higher than studies assessing past year IPV in the ED
setting,59, 60
This data suggests that more patients who are experiencing NPV (42%) are experiencing
both non-partner victimization and aggression than either type of non-partner violence alone (e.g.,
episodes of being the aggressor and being the victim). Of note, however, is that the context in
which the aggressive behaviors occurred was not assessed; it is not clear whether the aggression
and victimization occurred with the same person, as part of the same conflict, or with different
people. Further, there is no way to ascertain if the participant was acting in self-defense. Despite
this, the correlates of victimization and aggression of violence are very similar, supporting the
12
concept of the cycle of violence or bi-directionality (for review see Straus, 200761 or Daday et al.
200821).
Although men reported higher rates of NPV than women, many women also reported
violence (victimization and aggression) in non-partner relationships. Prior work suggests that
patients who are experiencing NPV may also be experiencing violence in their intimate
relationships.23, 62 The elevated prevalence of NPV found in this study suggest that the ED may be
an ideal venue in which to identify and intervene with NPV, as is done routinely for IPV. For
example, identification and intervention with men experiencing NPV may be protective in their
current or future relationships, and advance intimate partner violence prevention efforts as well as
decrease the individual’s future injury-related morbidity.
Although some research suggests that correlates of violence are similar for partner and non-
partner violence (e.g., age, alcohol/drug problems, overall mental health),63 others note subtle
differences in violence depending on relationship type, gender, and psychiatric status.62, 64 For
example, prior research in substance use treatment settings and ED samples find that men report
greater NPV than women.16, 31, 39 As noted by Graham and Wells (2003),65 male violence may be
seen as more normative and acceptable than female violence in certain social settings (e.g., bars)
and may also be related to concepts such as “face saving” and not wanting to “back down” from a
violent confrontation, particularly when in the presence of others.
Although the temporal association of violence and the substance use reported in this study
is not known, substance use and violence often co- occur in individuals, and often neither the
violence nor the substance use are isolated events. Criminal justice data note that 5% of assailants
were reportedly under the influence of drugs at the time of their crime.66 Findings indicated that a
quarter of the participants noted that they have experienced fighting (relationship type not specified;
non- partner, or partner) while using alcohol or drugs. These findings are in keeping with clinical
and laboratory studies, which have generally found a relationship between physical aggression,
alcohol, and cocaine.29, 33, 67, 68

13
More specifically, studies have demonstrated that alcohol and cocaine use are related to the
frequency with which aggression occurs and the severity of the injuries sustained.69-73 There is
evidence to suggest that the acute pharmacological effects of cocaine may increase
aggressiveness.67 Non-ED studies have found evidence for acute cocaine consumption and
aggression.29, 74 Marijuana use is also related to both aggression and victimization (for a review see
Hoaken et al., 200375); this association is likely due to contextual factors and self-selection/self-
medication, as well as to marijuana withdrawal.76
Theories focusing on the relationship between alcohol and other drug use and violence
highlight the role of a variety of risk domains, including acute intoxication effects, social/contextual
factors (relationship type, partner/non-partner), and other individual difference factors (gender,
depression).33, 77 In general, substance users (particularly cocaine users) are frequent victims of
violence71, 78 and are at increased risk for injuries sustained while under the influence. The
relationship of substance use and violence are unlikely to be solely explained by the pharmacology
of the drug. The exacerbated rates of violence experienced by substance users are likely not solely
related to the timing of intoxication, but rather to clustering of high risk behaviors in the individual.
For example, obtaining and/or using illegal substances involve a social/environmental context with
people and places where NPV is likely to occur. Baskin-Sommers (2006)79 have suggested that
aggression may be partially explained by the tendency of drug users to become more exposed to
and desensitized by violence due to interacting with individuals already immersed in a violent drug
culture. Thus, there may be greater opportunities for users of illicit substances to be experience
violence, regardless of whether they were intoxicated at the time of the occurrence of violence.
These assertions require validation with studies using calendar approaches to tease out the
influences of acute consumption and NPV.29, 74
To the best of our knowledge, this is the first ED study to disentangle cocaine and marijuana
use in relation to NPV, as opposed to being combined into one “illicit drug” category, as well as to
show an association of NPV (in both victimization and aggression) and use of prescription drugs.
Future studies evaluating any prescription drug use the role of prescription drug misuse (and

14
specifically opiate dependence), and the relationship of prescription use to other illicit drugs and
NPV are needed to further evaluate this association.
The regression analysis shows that, accounting for other variables in the model, there is a
pattern of increasing association of violence from any prescription drug use, to alcohol only, to
marijuana, to cocaine users. The association of cocaine use in particular to both NPV aggression
and victimization is highlighted in this data. Although this relationship may not be surprising, it
highlights the need to address drug use in general, and cocaine use specifically among patients
presenting with violence.
Finally, patients reporting NPV in this sample also report poor mental health, which was a
strong marker of NPV, even when other demographic and substance use variables were
considered. Studies of participants with substance use disorders found that for both men and
women, psychiatric distress was associated with aggression and victimization with both partners
and non-partners, although findings are stronger for women than men.16, 28, 31, 79-81
In comparison to intimate partner violence, recent NPV (victimization and aggression)
among adults has been relatively unaddressed among ED populations outside of those presenting
for acute assault-related injury. However, NPV has been studied in other health care settings such
as primary care82 and walk-in clinics69 found rates of NPV victimization to be high (45%of young
adult males and 48% overall respectively). One prior retrospective ED study of female-to-female
violence amongst women83 found that approximately 9% of women presenting to the ED for any
reason had been victimized, and of these women, only 5% identified their assailant as being an
intimate partner. This study finds also that a surprisingly high number of women seeking ED care
have recently been involved in NPV.
Identifying and intervening with patients who have experienced recent NPV and are
therefore at increased risk of future violence and injury has significant public health implications.
Although there is a paucity of data on effective treatment interventions targeting violence in ED
samples, there is evidence to support that addressing substance use is related to reductions in
violence, even if the reported substance use and violence were not temporally related initially. For

15
example, studies have found that patients who decrease their substance use (following treatment
engagement) experience substantial reductions in violence over time.28, 48, 84, 85 Interventions based
on cognitive and behavioral strategies can impact both substance use and violence.86-89 Therefore
identifying individuals who report recent substance use and recent violence in the ED may offer an
opportunity for intervention.
EDs often serve primary care functions; in this capacity, the ED may be a setting for
interventions to interrupt the cycle of violence among patients treated routinely for fistfights, bar
fights, and neighborhood disagreements. ED-based substance use interventions may be beneficial
in preventing future injury,90 and other more intensive case management interventions have been
shown to decrease criminal justice outcomes and violence involvement among admitted trauma
inpatients.91 Findings from the regression analysis highlight the impact of substance use beyond
that of traditional demographic risk factors (age, gender, employment status). Future studies are
needed to evaluate the impact of substance use treatment on patient experiences with violence and
associated injury mortality and morbidity.
In Retrospect
Although this study identifies broad domains of possible prevention strategies, data that
elucidates treatment readiness should be assessed in future studies. In addition, future studies
should evaluate the characteristics and type of injury and injury severity in relation to NPV.
Conclusions
Findings from this large, consecutive cohort of ED patients over 2 full calendar years
demonstrates that a substantial number patients (14%) seeking care in an inner-city ED experience
violence with a non-partner. Associated risk factors did not differ by victimization or aggression,
and cocaine use was the strongest predictor of NPV.
16
References
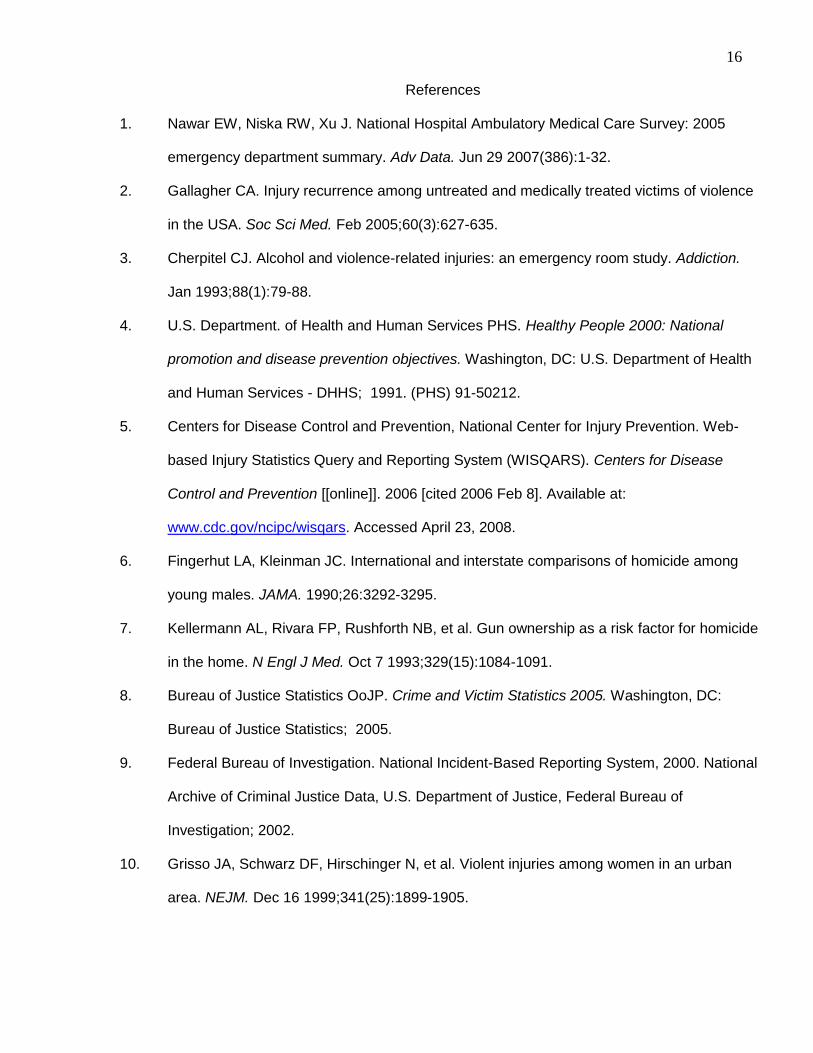
1. Nawar EW, Niska RW, Xu J. National Hospital Ambulatory Medical Care Survey: 2005
emergency department summary. Adv Data. Jun 29 2007(386):1-32.
2. Gallagher CA. Injury recurrence among untreated and medically treated victims of violence
in the USA. Soc Sci Med. Feb 2005;60(3):627-635.
3. Cherpitel CJ. Alcohol and violence-related injuries: an emergency room study. Addiction.
Jan 1993;88(1):79-88.
4. U.S. Department. of Health and Human Services PHS. Healthy People 2000: National
promotion and disease prevention objectives. Washington, DC: U.S. Department of Health
and Human Services - DHHS; 1991. (PHS) 91-50212.
5. Centers for Disease Control and Prevention, National Center for Injury Prevention. Web-
based Injury Statistics Query and Reporting System (WISQARS). Centers for Disease
Control and Prevention [[online]]. 2006 [cited 2006 Feb 8]. Available at:
www.cdc.gov/ncipc/wisqars. Accessed April 23, 2008.
6. Fingerhut LA, Kleinman JC. International and interstate comparisons of homicide among
young males. JAMA. 1990;26:3292-3295.
7. Kellermann AL, Rivara FP, Rushforth NB, et al. Gun ownership as a risk factor for homicide
in the home. N Engl J Med. Oct 7 1993;329(15):1084-1091.
8. Bureau of Justice Statistics OoJP. Crime and Victim Statistics 2005. Washington, DC:
Bureau of Justice Statistics; 2005.
9. Federal Bureau of Investigation. National Incident-Based Reporting System, 2000. National
Archive of Criminal Justice Data, U.S. Department of Justice, Federal Bureau of
Investigation; 2002.
10. Grisso JA, Schwarz DF, Hirschinger N, et al. Violent injuries among women in an urban
area. NEJM. Dec 16 1999;341(25):1899-1905.

17
11. Elliott DS. Serious violent offenders: Onset, developmental course and termination.
Criminology. 1994;32:1-21.
12. White HR, Loeber R, Stouthamer-Loeber M, et al. Developmental associations between
substance use and violence. Dev Psychopathol. Fall 1999;11(4):785-803.
13. Weiczorek WF, Welte JW, Abel EI. Alcohol, drugs, and murder: A study of convicted
homicide offenders. Journal of Criminal Justice. 1990;18(3):217-227.
14. Welte JW, Miller BA. Alcohol use by violent and property offenders. Drug and alcohol
dependence. 1987;19(4):313-324.
15. Cunningham R, Walton MA, Tripathi SP, et al. Past-year violence typologies among patients
with cocaine-related chest pain. Am J Drug Alcohol Abuse. 2007;33(4):571-582.
16. Chermack ST, Walton MA, Fuller BE, et al. Correlates of expressed and received violence
across relationship types among men and women substance abusers. Psychol Addict
Behav. Jun 2001;15(2):140-151.
17. Brown RA, Monti PM, Myers MG, et al. Depression among cocaine abusers in treatment:
relation to cocaine and alcohol use and treatment outcome. The American journal of
psychiatry. Feb 1998;155(2):220-225.
18. Fals-Stewart W, Kashdan TB, O'Farrell TJ, et al. Behavioral couples therapy for drug-
abusing patients: effects on partner violence. Journal of substance abuse treatment. Mar
2002;22(2):87-96.
19. Moore TM, Stuart GL. Illicit substance use and intimate partner violence among men in
batterers' intervention. Psychol Addict Behav. Dec 2004;18(4):385-389.
20. Sims DW, Bivins BA, Obeid FN, et al. Urban trauma: a chronic recurrent disease. J Trauma.
1989;29(7):940-946.
21. Daday JK, Broidy LM, Crandall CS. Emergency department utilization among victims and
offenders involved in non-lethal violence. Soc Sci Med. Mar 2008;66(5):1197-1203.
22. Rivara FP, Shepherd JP, Farrington DP, et al. Drug use in trauma victims. Ann Emerg Med.
Nov 1995;26(5):609-614.

18
23. Chermack ST, Murray R, Winters JJ, et al. Treatment needs of men and women with
violence problems in substance use disorder treatment. Substance Use and Misuse. In
Press.
24. Stalans LJ, Seng M. Identifying subgroups at high risk of dropping out of domestic batterer
treatment: the buffering effects of a high school education. Int J Offender Ther Comp
Criminol. Apr 2007;51(2):151-169.
25. Fonseca CA, Schmaling KB, Stoever C, et al. Variables associated with intimate partner
violence in a deploying military sample. Military medicine. Jul 2006;171(7):627-631.
26. Murray RL, Chermack ST, Walton MA, et al. Psychological aggression, physical aggression,
and injury in nonpartner relationships among men and women in treatment for substance-
use disorders. Journal of studies on alcohol and drugs. Oct 2008;69(6):896-905.
27. Magdol L, Moffitt TE, Caspi A, et al. Gender differences in partner violence in a birth cohort
of 21-year-olds: bridging the gap between clinical and epidemiological approaches. Journal
of consulting and clinical psychology. Feb 1997;65(1):68-78.
28. Walton MA, Chermack ST, Blow FC. Correlates of received and expressed violence
persistence following substance abuse treatment. Drug and alcohol dependence. Jun 1
2002;67(1):1-12.
29. Chermack ST, Blow FC. Violence among individuals in substance abuse treatment: the role
of alcohol and cocaine consumption. Drug and alcohol dependence. Mar 1 2002;66(1):29-
37.
30. Breiding MJ, Black MC, Ryan GW. Chronic disease and health risk behaviors associated
with intimate partner violence-18 U.S. states/territories, 2005. Annals of epidemiology. Jul
2008;18(7):538-544.
31. Walton MA, Cunningham RM, Chermack ST, et al. Correlates of violence history among
injured patients in an urban emergency department: gender, substance use, and
depression. J Addict Dis. 2007;26(3):61-75.

19
32. Boles SM, Miotto K. Substance abuse and violence: A review of the literature. Aggression
and Violent Behavior. 2003;8(2):155-174.
33. Chermack ST, Giancola PR. The relation between alcohol and aggression: an integrated
biopsychosocial conceptualization. Clin Psychol Rev. 1997;17(6):621-649.
34. Federal Bureau of Investigation. Crime in the United States 2006: Uniform Crime Report
2006. U.S. Department of Justice. Available at: http://www.fbi.gov/ucr/cius2006/index.html.
35. Michigan Department of Community Health. Census 2000. 10/31/2002. Available at:
http://www.mdch.state.mi.us/pha/osr/CHI/POP/Fcensus2.ASP, 10/31/2002.
36. Chermack ST, Wyrobeck JM, Walton MA, et al. Distal and Proximal Factors Related to
Aggression Severity among Patients in Substance Abuse Treatment: Family History,
Alcohol Use and Expectancies. Addictive behaviors. May 2006;31(5):845-858.
37. Cogan R, Ballinger BC, 3rd. Alcohol problems and the differentiation of partner, stranger,
and general violence. J Interpers Violence. Jul 2006;21(7):924-935.
38. Cunradi C, Ames G, Moore R. Prevalence and correlates of interpersonal violence
victimization in a junior enlisted Navy cohort. Violence Vict. Dec 2005;20(6):679-694.
39. Cunningham R, Walton MA, Maio RF, et al. Violence and substance use among an injured
emergency department population. Acad Emerg Med. Jul 2003;10(7):764-775.
40. Smith GR, Ross RL, Rost KM. Psychiatric outcomes module: substance Abuse Outcomes
Module (SOAM). In: Sederer LI, Dickey B, eds. Outcomes assessment in clinical practice.
Baltimore, MD: Williams & Wilkins; 1996:85-88.
41. Feldhaus KM, Koziol-McLain J, Amsbury HL, et al. Accuracy of 3 brief screening questions
for detecting partner violence in the emergency department. Jama. May 7
1997;277(17):1357-1361.
42. Morrison LJ, Allan R, Grunfeld A. Improving the emergency department detection rate of
domestic violence using direct questioning. J Emerg Med. Aug 2000;19(2):117-124.
43. Alter HJ, Braun R, Zazzali JL. Health status disparities among public and private emergency
department patients. Acad Emerg Med. Jul 1999;6(7):736-743.

20
44. Ware JE, Kosinski M, Keller SD. SF-12: How to Score the SF-12 Physical and Mental Health
Summary Scales. Second Edition ed. Boston, MA: The Health Institute, New England
Medical Center; 1995.
45. Fleming M, Barry K, Manwell L, et al. A trial of early alcohol treatment (Project TrEAT): A
randomized trial of brief physician advice in community-based primary care practices.
Journal of the American Medical Association. 1997;277:1039-1045.
46. Haywood KL, Garratt AM, Fitzpatrick R. Quality of life in older people: a structured review of
generic self-assessed health instruments. Qual Life Res. Sep 2005;14(7):1651-1668.
47. Smith GR, Burnam MA, Mosley CL, et al. Reliability and validity of the substance abuse
outcomes module. Psychiatr Serv. Oct 2006;57(10):1452-1460.
48. Chermack ST, Murray RL, Walton MA, et al. Partner aggression among men and women in
substance use disorder treatment: correlates of psychological and physical aggression and
injury. Drug and alcohol dependence. Nov 1 2008;98(1-2):35-44.
49. Gray TA, Wish ED. Substance Abuse Need for Treatment among Arrestees (SANTA) in
Maryland. College Park, MD: Center for Substance Abuse Research; 1998.
50. Thornberry TP, Krohn MD. The self-report method of measuring delinquency and crime. In:
Duffee D, ed. Measurement and Analysis of Crime and Justice: Criminal Justice 2000.
Washington, DC: US Department of Justice, Office of Justice Programs; 2000:pp. 33-83.
51. Buchan BJ, M LD, Tims FM, et al. Cannabis use: consistency and validity of self-report, on-
site urine testing and laboratory testing. Addiction. Dec 2002;97 Suppl 1:98-108.
52. Dennis M, Titus JC, Diamond G, et al. The Cannabis Youth Treatment (CYT) experiment:
rationale, study design and analysis plans. Addiction. Dec 2002;97 Suppl 1:16-34.
53. Brener ND, Billy JO, Grady WR. Assessment of factors affecting the validity of self-reported
health-risk behavior among adolescents: evidence from the scientific literature. J Adolesc
Health. Dec 2003;33(6):436-457.
54. Darke S. Self-report among injecting drug users: a review. Drug and alcohol dependence.
Aug 1 1998;51(3):253-263; discussion 267-258.

21
55. O'Farrell TJ, Fals-Stewart W, Murphy M. Concurrent validity of a brief self-report Drug Use
Frequency measure. Addictive behaviors. Mar 2003;28(2):327-337.
56. Chermack ST, Singer K, Beresford TP. Screening for alcoholism among medical inpatients:
how important is corroboration of patient self-report? Alcoholism, clinical and experimental
research. Oct 1998;22(7):1393-1398.
57. Straus MA, Hamby SL, Boney-McCoy S, et al. The Revised Conflict Tactics Scales (CTS2).
J Fam Issues. 1996;17(3):283-316.
58. Forjuoh SN, Kinnane JM, Coben JH, et al. Victimization from physical violence in
Pennsylvania: prevalence and health care use. Acad Emerg Med. Nov 1997;4(11):1052-
1058.
59. Dearwater SR, Coben JH, Campbell JC, et al. Prevalence of intimate partner abuse in
women treated at community hospital emergency departments. Jama. Aug 5
1998;280(5):433-438.
60. McCloskey LA, Lichter E, Ganz ML, et al. Intimate partner violence and patient screening
across medical specialties. Acad Emerg Med. Aug 2005;12(8):712-722.
61. Straus MA. Conflict Tactics Scales. In: Jackson NA, ed. Encyclopedia of Domestic Violence.
New York: Routledge: Taylor & Francis Group; 2007:824
62. Chermack ST, Fuller BE, Blow FC. Predictors of perpetrator of partner violence and non-
partner violence among patients in substance abuse treatment. Drug and alcohol
dependence. 2000;58(1-2):43-54.
63. Fagan JA, Browne A. Violence between partners and intimates. In: Reiss A, Roth J, eds.
Understanding and preventing violence: Vol. 3. Social Influences. Vol 3. Washington, DC:
National Academy Press; 1994:115-292.
64. Chermack ST, Walton MA. The relationship between family aggression history and
expressed aggression among college males. Aggressive Behav. 1999;25:255-267.
65. Wells S, Graham K. Aggression involving alcohol: relationship to drinking patterns and
social context. Addiction. Jan 2003;98(1):33-42.

22
66. Isner JM, Estes NA, 3rd, Thompson PD, et al. Acute cardiac events temporally related to
cocaine abuse. N Engl J Med. Dec 4 1986;315(23):1438-1443.
67. Licata A, Taylor S, Berman M, et al. Effects of cocaine on human aggression. Pharmacol
Biochem Behav. 1993;45(3):549-552.
68. Macdonald S, Anglin-Bodrug K, Mann RE, et al. Injury risk associated with cannabis and
cocaine use. Drug and alcohol dependence. Nov 24 2003;72(2):99-115.
69. Conway T, Hu TC, Kim P, et al. Prevalence of violence victimization among patients seen in
an urban public hospital walk-in clinic. J Gen Intern Med. Aug 1994;9(8):430-435.
70. Eronen M, Hakola P, Tiihonen J. Factors associated with homicide recidivism in a 13-year
sample of homicide offenders in Finland. Psychiatr Serv. Apr 1996;47(4):403-406.
71. Falck RS, Wang J, Carlson RG, et al. The epidemiology of physical attack and rape among
crack-using women. Violence Vict. Feb 2001;16(1):79-89.
72. Harrison LD. Trends in illicit drug use in the United States: conflicting results from national
surveys. Int J Addict. 1992;27(7):817-847.
73. Murdoch D, Pihl RO, Ross D. Alcohol and crimes of violence: present issues. Int J Addict.
Sep 1990;25(9):1065-1081.
74. Fals-Stewart W. The occurrence of partner physical aggression on days of alcohol
consumption: A longitudinal diary study. Journal of consulting and clinical psychology.
2003;71(1):42-52.
75. Hoaken PN, Stewart SH. Drugs of abuse and the elicitation of human aggressive behavior.
Addictive behaviors. Dec 2003;28(9):1533-1554.
76. Moore TM, Stuart GL. A review of the literature on marijuana and interpersonal violence.
Aggression and Violent Behavior. 2005/0 2005;10(2):171-192.
77. Goldstein PJ. The Drugs/Violence Nexus: A Tripartite Conceptual Framework. J Drug
Issues. 1985;15:493-506.
78. Siegal HA, Falck RS, Wang J, et al. Crack-cocaine users as victims of physical attack. J Natl
Med Assoc. 2000;92(2):76-82.

23
79. Baskin-Sommers A, Sommers I. Methamphetamine use and violence among young adults.
Journal of Criminal Justice. 2006;34(6):661-674.
80. Abbott J, Johnson R, Koziol-McLain J, et al. Domestic violence against women. Incidence
and prevalence in an emergency department population. JAMA. Jun 14 1995;273(22):1763-
1767.
81. Thompson MP, Kaslow NJ, Kingree JB, et al. Partner violence, social support, and distress
among inner-city African American women. Am J Community Psychol. Feb 2000;28(1):127-
143.
82. Rich JA, Sullivan LM. Correlates of violent assault among young male primary care patients.
J Health Care Poor Underserved. Feb 2001;12(1):103-112.
83. Mechem CC, Shofer FS, Reinhard SS, et al. Violence between women in an urban
emergency department patient population. Acad Emerg Med. Jan 2001;8(1):30-35.
84. O'Farrell TJ, Fals-Stewart W. Behavioral couples therapy for alcoholism and drug abuse.
Journal of substance abuse treatment. Jan 2000;18(1):51-54.
85. O'Farrell TJ, Murphy CM. Marital violence before and after alcoholism treatment. J Cons
Clin Psych. 1995;63(2):256-262.
86. Fava GA, Rafanelli C, Grandi S, et al. Prevention of recurrent depression with cognitive
behavioral therapy: preliminary findings. Archives of general psychiatry. Sep
1998;55(9):816-820.
87. Swartz MS, Swanson JW, Hiday VA, et al. Taking the wrong drugs: the role of substance
abuse and medication noncompliance in violence among severely mentally ill individuals.
Social psychiatry and psychiatric epidemiology. Dec 1998a;33 Suppl 1:S75-80.
88. Swartz MS, Swanson JW, Hiday VA, et al. Violence and severe mental illness: the effects of
substance abuse and nonadherence to medication. The American journal of psychiatry. Feb
1998b;155(2):226-231.
24
89. Swanson J, Estroff S, Swartz M, et al. Violence and severe mental disorder in clinical and
community populations: the effects of psychotic symptoms, comorbidity, and lack of
treatment. Psychiatry. Spring 1997;60(1):1-22.
90. Havard A, Shakeshaft A, Sanson-Fisher R. Systematic review and meta-analyses of
strategies targeting alcohol problems in emergency departments: interventions reduce
alcohol-related injuries. Addiction. Mar 2008;103(3):368-376.
91. Cooper C, Eslinger DM, Stolley PD. Hospital-based violence intervention programs work. J
Trauma. Sep 2006;61(3):534-540.

25
Figure 1. Recruitment Flow
Many patients had multiple ED visits and were screened more then once ( ~1400). Only the first screen was used in data
analysis. Multiple visits by individual patients are not reflected in the N of the overall sample frame.
*Does not include patients treated at study ED on days not covered by research recruiting staff , or those not in a
treatment room between 9 am and 11pm.(i.e. major holidays, RA vacation days, RA sick days. Missed or partially
covered shifts account for ~ N= 11,416 patients over 2 year time frame)
** Excluded: Tallied for 12 months of study and doubled to estimate second year.
Patients in study sample frame
Age 19-60 years in ED
In 9am – 11pm.*
N= 27,092
Excluded**
N=9828 (36%)
Reasons:
Pregnant (16%)
Person doesn't understand English (1%)
Prisoner/or under house arrest (unable to
consent) (4%)
Level 1 Trauma/Abnormal vitals 1090 (11%)
Psychological Evaluation (29%)
Sexual Assault (7%)
Mental status abnormal/ unable to consent
(25%)
Other/ reason not recorded (11%)
Deaf (2%)
RA approached
N= 13,493
Missed Patients (On days RA staffing)
N= 3498 (20%)
Reasons:
RA occupied with another patient (79%)
Patient occupied by medical care (12 %)
Could not locate patient (4 %)
Other (4% )
Refused N= 2,749 (20%)
Concerned about confidentiality (9%)
Too ill, tired, stressed in too much pain to
participate (62%)
Does not want to be in research study (7%)
Does not want to participate (10%)
Other 12%
Completed Screening
N=10,744
(80% of those approached)
Eligible to approach
N= 16,991

26
Table 1. Past Year Non-Partner Violence
Female
N=6027 (%)
Male
N=4717 (%)
Total
N=10,744(%)
Victimization
“Have you been hit, kicked, punched, or otherwise hurt”
422 (7) 738 (16) 1160 (11)
Aggression
“Have you hit, kicked, punched, or otherwise hurt”
324 (5) 609 (13) 933 (9)
Any Non-Partner Violence 557(9) 918 19) 1475 (14)
Non-Partner Violence is defined as violence among friends, strangers, neighbors, people in bars, co-workers etc; does not include violence against a partner or spouse. Percentages used in the table are column percentages.

27
Table 2. Bivariate Comparisons of Any Non-Partner Violence Based on
Demographics, Health Status, and Substance Use (N=10,744).
Variables
Any Non-Partner Violence
(n=1475)
No Violence
(n=9269)
Demographics Mean (±SD) Mean (±SD)
Age 31.53 (10.5) 37.11 (11.5)
n (%) n (%)
Male 918 (62.2) 3799 (41.0)
African Americana 734 (49.8) 5237 (56.5)
Married or Living Together 337 (22.9) 3109 (33.5)
Some College or College Grad 469 (31.8) 3495 (37.7)
Health Insurance (yes)a 1029 (69.9) 7286 (78.7)
Annual Income < $20,000a 803 (74.4) 4090 (64.2)
Employed a 630 (42.8) 4348 (46.9)
Reason for Current ED Visit
Injury 622 (42.2) 2314 (25.0)
SF-12 Health Status
Physical Health (≤ 25th Percentile) 352 (23.9) 2334 (25.2)
Mental Health (≤ 25th Percentile) 518 (35.1) 2168 (23.4)
Substance Use in the Past 30 Days*
Alcohol Only 472 (32.0) 2732 (29.5)
Marijuana (+/- alcohol) 473 (32.1) 1510 (16.3)
Cocaine (+/- alcohol or marijuana) 126 (8.5) 325 (3.5)
Other illicit drugs * 32 (2.2) 49 (0.5)
Prescription drug use** 299 (20.3) 1252 (13.5)
Substance Abuse and/or Dependence
Alcohol 514 (34.9) 845 (9.1)
Cocaine 137 (9.3) 280 (3.0)
Marijuana 200 (13.6) 412 (4.4)
Substance Use Treatment
In Past 3 Months 129 (8.8) 321 (3.5) Percentages used in the table are column percentages
a Some subjects did not respond or skipped this question
* Reference category = ’No Substance Use’ *Other illicit drugs ( ie club drugs, inhalants, methamphetamine, heroin or hallucinogens) **Prescription drug use:opiates ie morphine, codeine, vicodin, Darvon, OxyContin, Darvocet, Percodan, Fentanyl,Sedative Depressants ie Xanax, Librium, Valium, Quaaludes, Halcion, sleeping pills, nerve pills downers barbiturates etc)

28
Table 3. Logistic Regression Analysis Predicting Any Non-Partner Violence.
Any Non-Partner Violence*
OR 95% CI
Demographics
Age 0.95 0.95 0.96
Male 2.20 1.94 2.50
African American 0.80 0.71 0.91
Married or Living Together 0.64 0.55 0.73
Some College or College Grad 1.07 0.94 1.22
Health Insurance ( yes) 0.97 0.84 1.11
Employed 0.84 0.74 0.95
Chief Complaint
Injury 1.94 1.71 2.19
Mental Health
Physical Health (≤ 25th Percentile) 1.32 1.14 1.54
Mental Health (≤ 25th Percentile) 1.90 1.67 2.17
Substance Use in the Past 30 Days
Alcohol Only ** 1.73 1.49 2.01
Marijuana (+/- alcohol) ** 2.36 2.02 2.76
Cocaine (+/- alcohol or marijuana) ** 3.10 2.41 3.98
Prescription drug use 1.43 1.22 1.68
Substance Use Treatment
In Past 3 Months 1.70 1.34 2.15
Age is a continuous variable *Reference category = No Non- Partner Violence **Reference category = No Substance Use
Prescription drug use:opiates morphine, codeine, vicodin, Demerol, Darvon, OxyContin, Darvocet, Tylenol 2,3,4, Stadol, Percodan, Fentanyl,Sedative Depressants, , Xanax, Librium, Valium, Quaaludes, Halcion, sleeping pills, nerve pills downers barbiturates etc) Model = (χ
2 (15) = 1143.82, p < .0001).
29
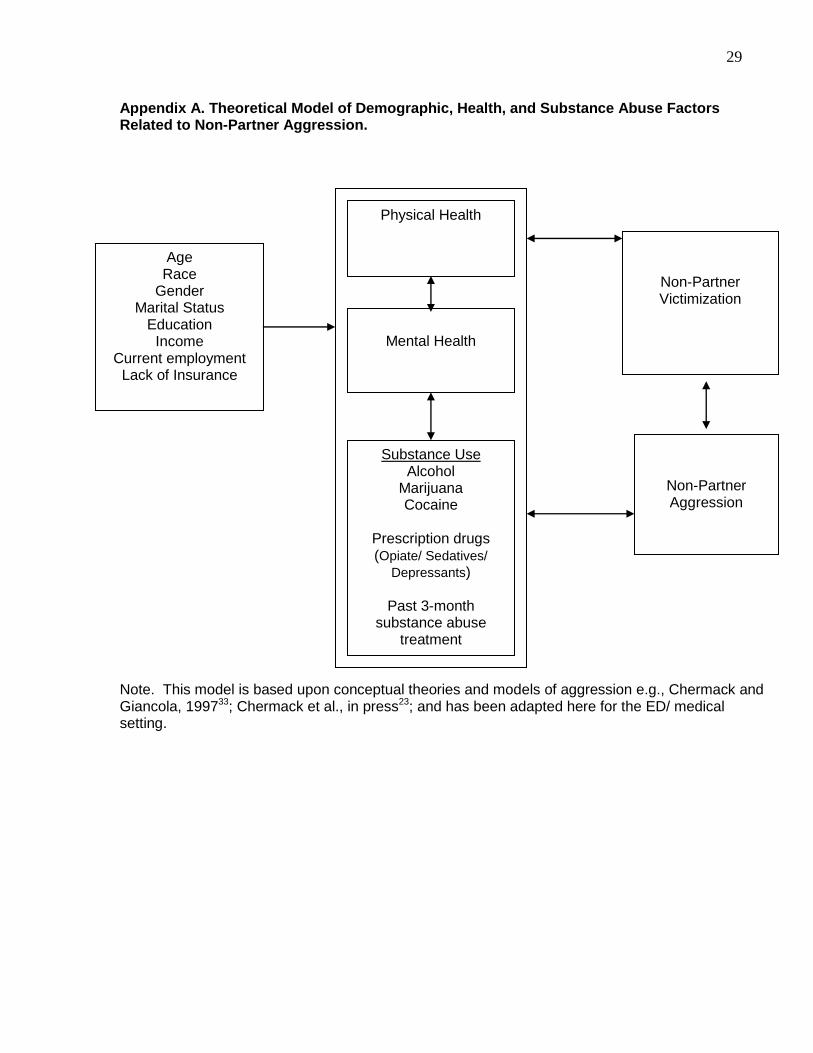
Appendix A. Theoretical Model of Demographic, Health, and Substance Abuse Factors Related to Non-Partner Aggression.
Note. This model is based upon conceptual theories and models of aggression e.g., Chermack and Giancola, 199733; Chermack et al., in press23; and has been adapted here for the ED/ medical setting.
Age Race
Gender Marital Status
Education Income
Current employment Lack of Insurance
Physical Health
Mental Health
Substance Use Alcohol
Marijuana Cocaine
Prescription drugs (Opiate/ Sedatives/
Depressants)
Past 3-month substance abuse
treatment
Non-Partner Victimization
Non-Partner Aggression

30
Appendix B. Study Survey
(Note: this screening survey is part of a larger RCT focusing on Substance Abuse linkage to treatment. The attached
questions include only variables most relevant to the current analysis)
SCREENNUM:________DATEINTERVIEW:___________INTERVIEWERID:____________
LAPTOPID:___________
1. What is your birth date? ______/____/_____
MM DD YYYY
2. What is your sex?
a. Male
b. Female
3. Are you pregnant or do you think you could be pregnant?
a. No
b. Yes
4. Which of the following best describes your racial background?
a. Black/African-American non-Hispanic
b. Hispanic/Latino
c. Asian or Asian-American
d. Alaskan Native or Eskimo or Aleut
e. American Indian
f. India Sub-Continent
g. Middle Eastern
h. Bi-racial or Multi-racial
i. Other
5. Which of these groups describes you? (Mark all that apply)
a. Black/African-American No Yes
b. Asian (Asian, Indian, Chinese, Filipino, Japanese, Korean, Vietnamese) No Yes
c. Pacific Islander No Yes
d. White/Caucasian No Yes
e. Native American Indian or Alaska No Yes
f. Other _____________________ No Yes
6. Which of the following best describes your current marital status?
a. Married
b. Widowed
c. Separated
d. Divorced
e. Never Married
f. Living together, never married
7. What is the highest grade you completed in school?
a. 8th grade or less
b. Some high school

31
c. High school graduate or GED
d. Some college
e. College graduate
f. Any post-graduate work
Now we want to know about your health and your current daily activities.
8. In general, would you say your health is… (SF12A)
a. Excellent
b. Very good
c. Good
d. Fair
e. Poor
9. Here is a list of activities that you might do during a typical day. Please tell me if our health now limits
you in:
a. Moderate activities, such as moving a table, pushing a vacuum cleaner, bowling, or playing golf. Does
your health now… (SF12B)
i. Limit you a lot
ii. Limit you a little
iii. Not limit you at all
b. Climbing several flights of stairs. Does your health now… (SF12C)
i. Limit you a lot
ii. Limit you a little
iii. Not limit you at all
c. During the past 4 weeks, have you accomplished less than you would like as a result of your physical
health? (SF12D)
i. No
ii. Yes
d. During the past 4 weeks, were you limited in the kind of work or other regular daily activities you do as a
result of your physical health? (SF12E)
i. No
ii. Yes
e. During the past 4 weeks, have you accomplished less than you would like as a result of any emotional
problems, such as feeling depressed or anxious? (SF12F)
i. No
ii. Yes
f. During the past 4 weeks, did you not do work or other regular activities as carefully as usual as a result of
any emotional problems, such as feeling depressed or anxious? (SF12G)
i. No
ii. Yes
g. During the past 4 weeks, how much did pain interfere with your normal work, including both work
outside the home and housework? Did it interfere: (SF12H)
i. Not at all
ii. A little bit
iii. Moderately
iv. Quite a bit

32
v. Extremely
h. During the past 4 weeks, how much of the time has your physical health or emotional problems interfered
with your social activities like visiting with friends or relatives? Has it interfered… (SF12I)
i. All of the time
ii. Most of the time
iii. A good bit of the time
iv. A little bit of the time
v. None of the time
i. How much of the time during the past 4 weeks calm and peaceful? (SF12J)
i. All of the time
ii. Most of the time
iii. A good bit of the time
iv. A little bit of the time
v. None of the time
j. How much of the time during the past 4 weeks did you have a lot of energy? (SF12K)
i. All of the time
ii. Most of the time
iii. A good bit of the time
iv. A little bit of the time
v. None of the time
k. How much of the time during the past 4 weeks have you felt downhearted and blue (SF12L)
i. All of the time
ii. Most of the time
iii. A good bit of the time
iv. A little bit of the time
v. None of the time
No matter how well family and friends get along, there are times when they disagree or have fights for some
reason.
10. In the past year, have you been hit, kicked, punched, or otherwise hurt by friends, strangers, neighbors,
people in bars, co-workers, bosses?
a. No
b. Yes
11. In the past year, have you hit, kicked, punched, or otherwise hurt your friends, strangers, neighbors,
people in bars, co-workers, bosses?
a. No
b. Yes
Now, we want to know about alcohol and drug use. Please remember we will not be giving your answers to the
any of the Emergency Room staff or anyone else. This is strictly confidential.
12. Have you had any alcohol to drink in the past year?
a. No
b. Yes
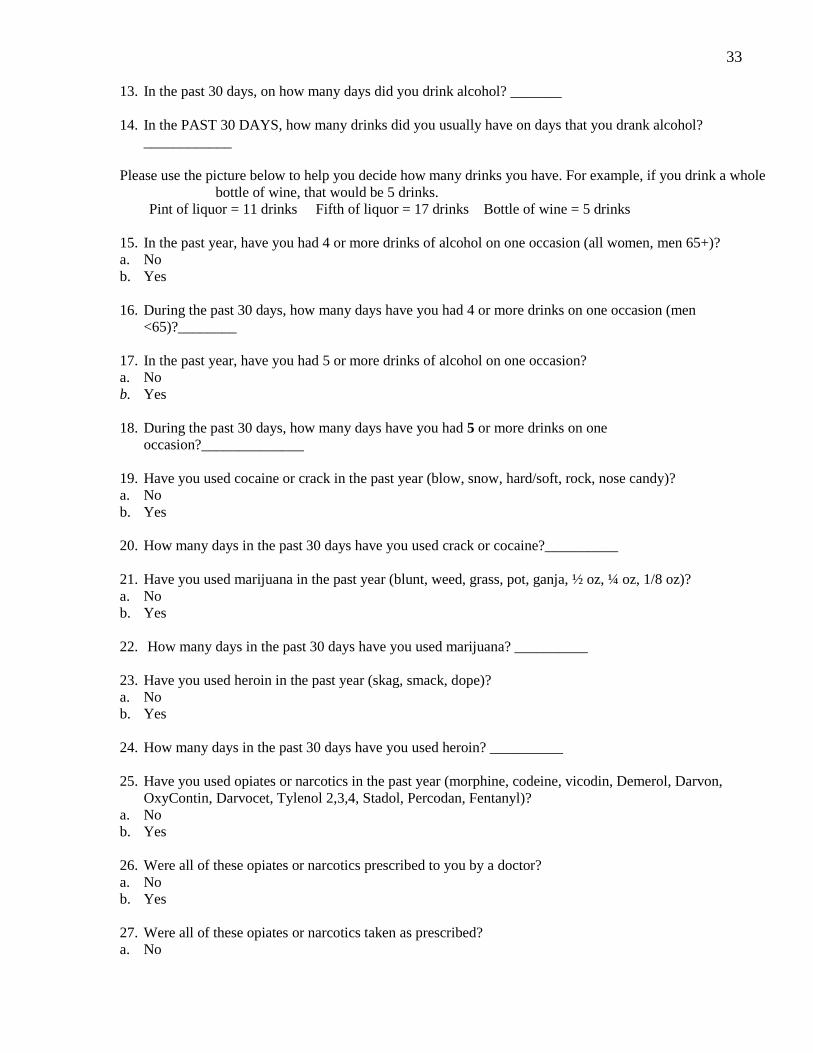
33
13. In the past 30 days, on how many days did you drink alcohol? _______
14. In the PAST 30 DAYS, how many drinks did you usually have on days that you drank alcohol?
____________
Please use the picture below to help you decide how many drinks you have. For example, if you drink a whole
bottle of wine, that would be 5 drinks.
Pint of liquor = 11 drinks Fifth of liquor = 17 drinks Bottle of wine = 5 drinks
15. In the past year, have you had 4 or more drinks of alcohol on one occasion (all women, men 65+)?
a. No
b. Yes
16. During the past 30 days, how many days have you had 4 or more drinks on one occasion (men
<65)?________
17. In the past year, have you had 5 or more drinks of alcohol on one occasion?
a. No
b. Yes
18. During the past 30 days, how many days have you had 5 or more drinks on one
occasion?______________
19. Have you used cocaine or crack in the past year (blow, snow, hard/soft, rock, nose candy)?
a. No
b. Yes
20. How many days in the past 30 days have you used crack or cocaine?__________
21. Have you used marijuana in the past year (blunt, weed, grass, pot, ganja, ½ oz, ¼ oz, 1/8 oz)?
a. No
b. Yes
22. How many days in the past 30 days have you used marijuana? __________
23. Have you used heroin in the past year (skag, smack, dope)?
a. No
b. Yes
24. How many days in the past 30 days have you used heroin? __________
25. Have you used opiates or narcotics in the past year (morphine, codeine, vicodin, Demerol, Darvon,
OxyContin, Darvocet, Tylenol 2,3,4, Stadol, Percodan, Fentanyl)?
a. No
b. Yes
26. Were all of these opiates or narcotics prescribed to you by a doctor?
a. No
b. Yes
27. Were all of these opiates or narcotics taken as prescribed?
a. No
34
b. Yes
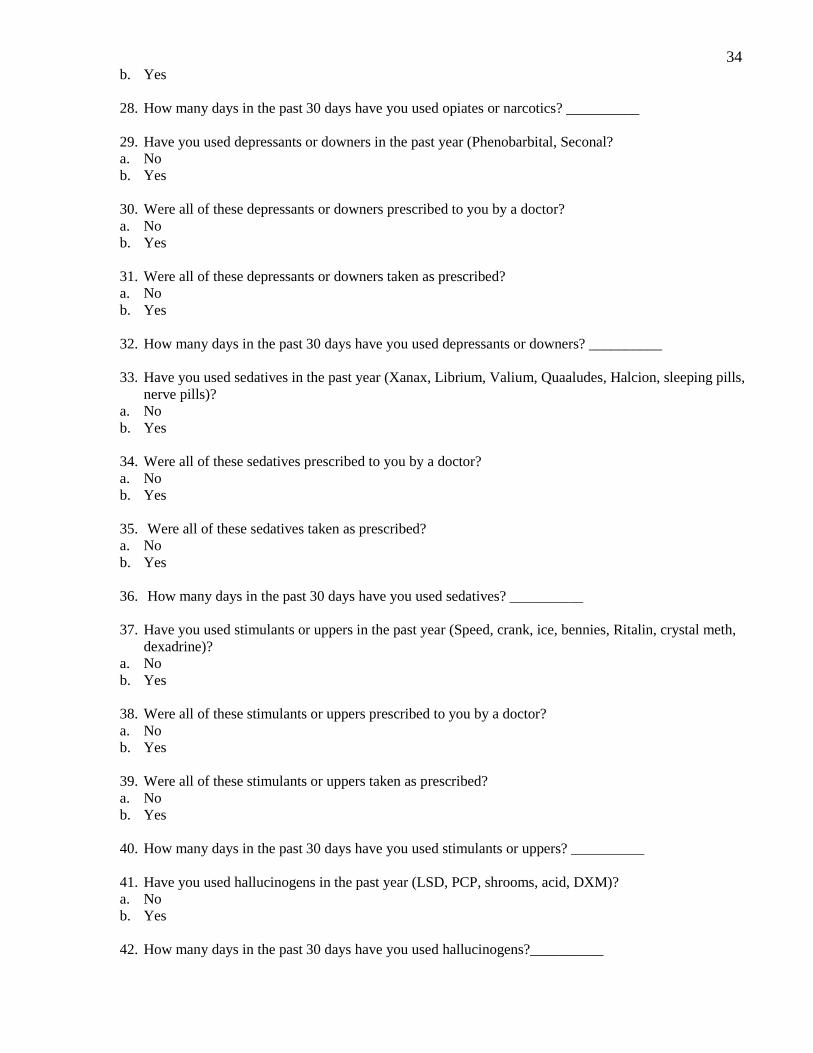
28. How many days in the past 30 days have you used opiates or narcotics? __________
29. Have you used depressants or downers in the past year (Phenobarbital, Seconal?
a. No
b. Yes
30. Were all of these depressants or downers prescribed to you by a doctor?
a. No
b. Yes
31. Were all of these depressants or downers taken as prescribed?
a. No
b. Yes
32. How many days in the past 30 days have you used depressants or downers? __________
33. Have you used sedatives in the past year (Xanax, Librium, Valium, Quaaludes, Halcion, sleeping pills,
nerve pills)?
a. No
b. Yes
34. Were all of these sedatives prescribed to you by a doctor?
a. No
b. Yes
35. Were all of these sedatives taken as prescribed?
a. No
b. Yes
36. How many days in the past 30 days have you used sedatives? __________
37. Have you used stimulants or uppers in the past year (Speed, crank, ice, bennies, Ritalin, crystal meth,
dexadrine)?
a. No
b. Yes
38. Were all of these stimulants or uppers prescribed to you by a doctor?
a. No
b. Yes
39. Were all of these stimulants or uppers taken as prescribed?
a. No
b. Yes
40. How many days in the past 30 days have you used stimulants or uppers? __________
41. Have you used hallucinogens in the past year (LSD, PCP, shrooms, acid, DXM)?
a. No
b. Yes
42. How many days in the past 30 days have you used hallucinogens?__________
35
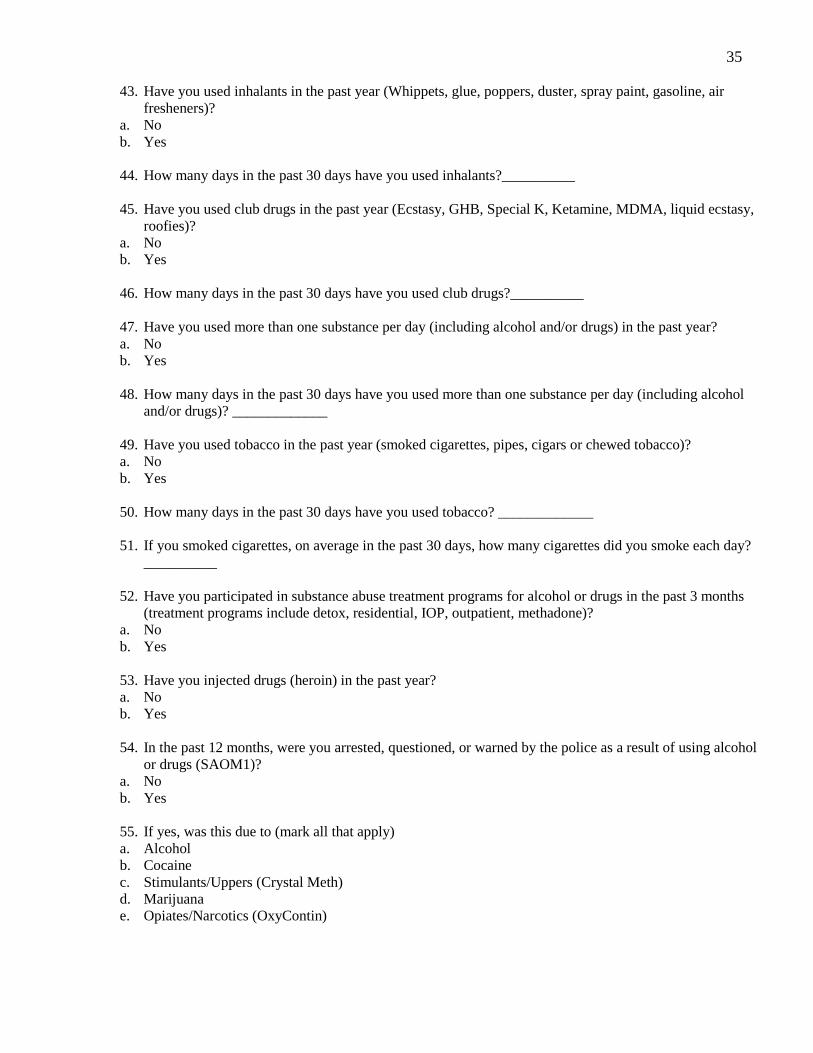
43. Have you used inhalants in the past year (Whippets, glue, poppers, duster, spray paint, gasoline, air
fresheners)?
a. No
b. Yes
44. How many days in the past 30 days have you used inhalants?__________
45. Have you used club drugs in the past year (Ecstasy, GHB, Special K, Ketamine, MDMA, liquid ecstasy,
roofies)?
a. No
b. Yes
46. How many days in the past 30 days have you used club drugs?__________
47. Have you used more than one substance per day (including alcohol and/or drugs) in the past year?
a. No
b. Yes
48. How many days in the past 30 days have you used more than one substance per day (including alcohol
and/or drugs)? _____________
49. Have you used tobacco in the past year (smoked cigarettes, pipes, cigars or chewed tobacco)?
a. No
b. Yes
50. How many days in the past 30 days have you used tobacco? _____________
51. If you smoked cigarettes, on average in the past 30 days, how many cigarettes did you smoke each day?
__________
52. Have you participated in substance abuse treatment programs for alcohol or drugs in the past 3 months
(treatment programs include detox, residential, IOP, outpatient, methadone)?
a. No
b. Yes
53. Have you injected drugs (heroin) in the past year?
a. No
b. Yes
54. In the past 12 months, were you arrested, questioned, or warned by the police as a result of using alcohol
or drugs (SAOM1)?
a. No
b. Yes
55. If yes, was this due to (mark all that apply)
a. Alcohol
b. Cocaine
c. Stimulants/Uppers (Crystal Meth)
d. Marijuana
e. Opiates/Narcotics (OxyContin)
36
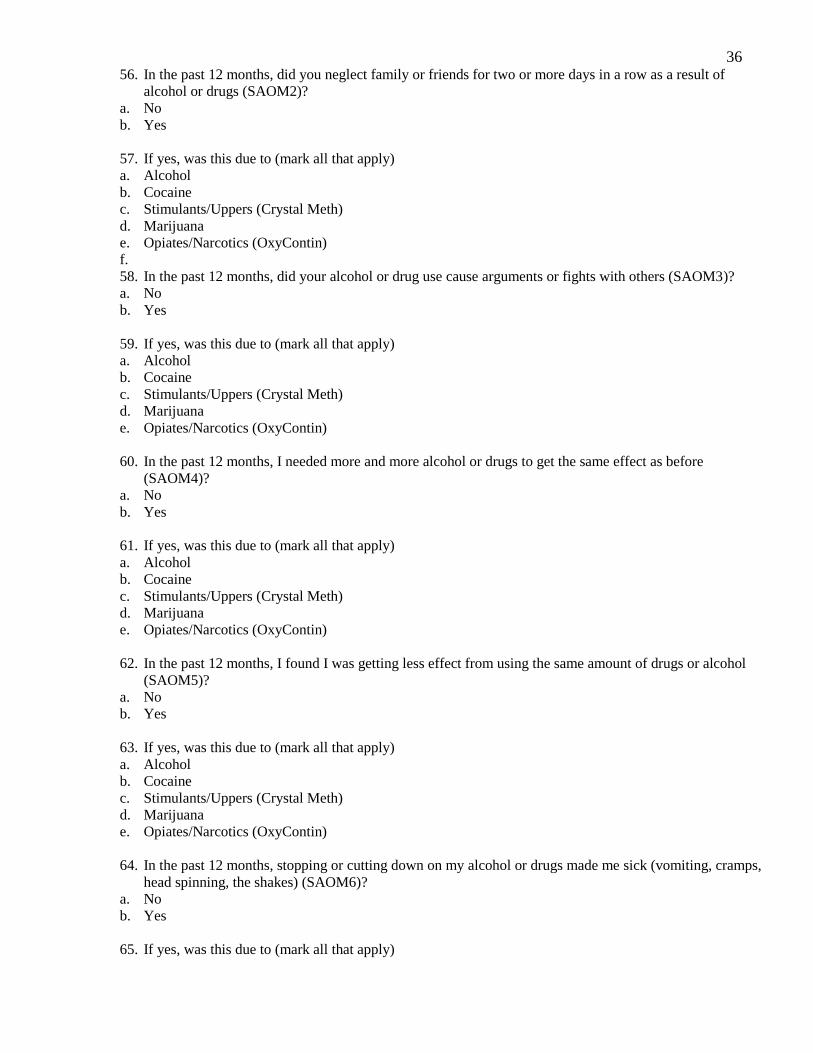
56. In the past 12 months, did you neglect family or friends for two or more days in a row as a result of
alcohol or drugs (SAOM2)?
a. No
b. Yes
57. If yes, was this due to (mark all that apply)
a. Alcohol
b. Cocaine
c. Stimulants/Uppers (Crystal Meth)
d. Marijuana
e. Opiates/Narcotics (OxyContin)
f.
58. In the past 12 months, did your alcohol or drug use cause arguments or fights with others (SAOM3)?
a. No
b. Yes
59. If yes, was this due to (mark all that apply)
a. Alcohol
b. Cocaine
c. Stimulants/Uppers (Crystal Meth)
d. Marijuana
e. Opiates/Narcotics (OxyContin)
60. In the past 12 months, I needed more and more alcohol or drugs to get the same effect as before
(SAOM4)?
a. No
b. Yes
61. If yes, was this due to (mark all that apply)
a. Alcohol
b. Cocaine
c. Stimulants/Uppers (Crystal Meth)
d. Marijuana
e. Opiates/Narcotics (OxyContin)
62. In the past 12 months, I found I was getting less effect from using the same amount of drugs or alcohol
(SAOM5)?
a. No
b. Yes
63. If yes, was this due to (mark all that apply)
a. Alcohol
b. Cocaine
c. Stimulants/Uppers (Crystal Meth)
d. Marijuana
e. Opiates/Narcotics (OxyContin)
64. In the past 12 months, stopping or cutting down on my alcohol or drugs made me sick (vomiting, cramps,
head spinning, the shakes) (SAOM6)?
a. No
b. Yes
65. If yes, was this due to (mark all that apply)

37
a. Alcohol
b. Cocaine
c. Stimulants/Uppers (Crystal Meth)
d. Marijuana
e. Opiates/Narcotics (OxyContin)
66. In the past 12 months, I used alcohol or drugs to keep from having withdrawal symptoms (SAOM7)?
a. No
b. Yes
67. If yes, was this due to (mark all that apply)
a. Alcohol
b. Cocaine
c. Stimulants/Uppers (Crystal Meth)
d. Marijuana
e. Opiates/Narcotics (OxyContin)
68. In the past 12 months, I used alcohol or drugs to get rid of hangover or the shakes (SAOM8)?
a. No
b. Yes
69. If yes, was this due to (mark all that apply)
a. Alcohol
b. Cocaine
c. Stimulants/Uppers (Crystal Meth)
d. Marijuana
e. Opiates/Narcotics (OxyContin)
f.
70. In the past 12 months, without realizing it, I ended up using more alcohol or drugs than I planned
(SAOM9)?
a. No
b. Yes
71. If yes, was this due to (mark all that apply)
a. Alcohol
b. Cocaine
c. Stimulants/Uppers (Crystal Meth)
d. Marijuana
e. Opiates/Narcotics (OxyContin)
72. In the past 12 months, I kept on using alcohol or drugs even after I promised myself not to (SAOM10)?
a. No
b. Yes
73. If yes, was this due to (mark all that apply)
a. Alcohol
b. Cocaine
c. Stimulants/Uppers (Crystal Meth)
d. Marijuana
e. Opiates/Narcotics (OxyContin)
74. In the past 12 months, I tried to cut down on alcohol or drugs but I couldn’t (SAOM11)?
a. No
38
b. Yes
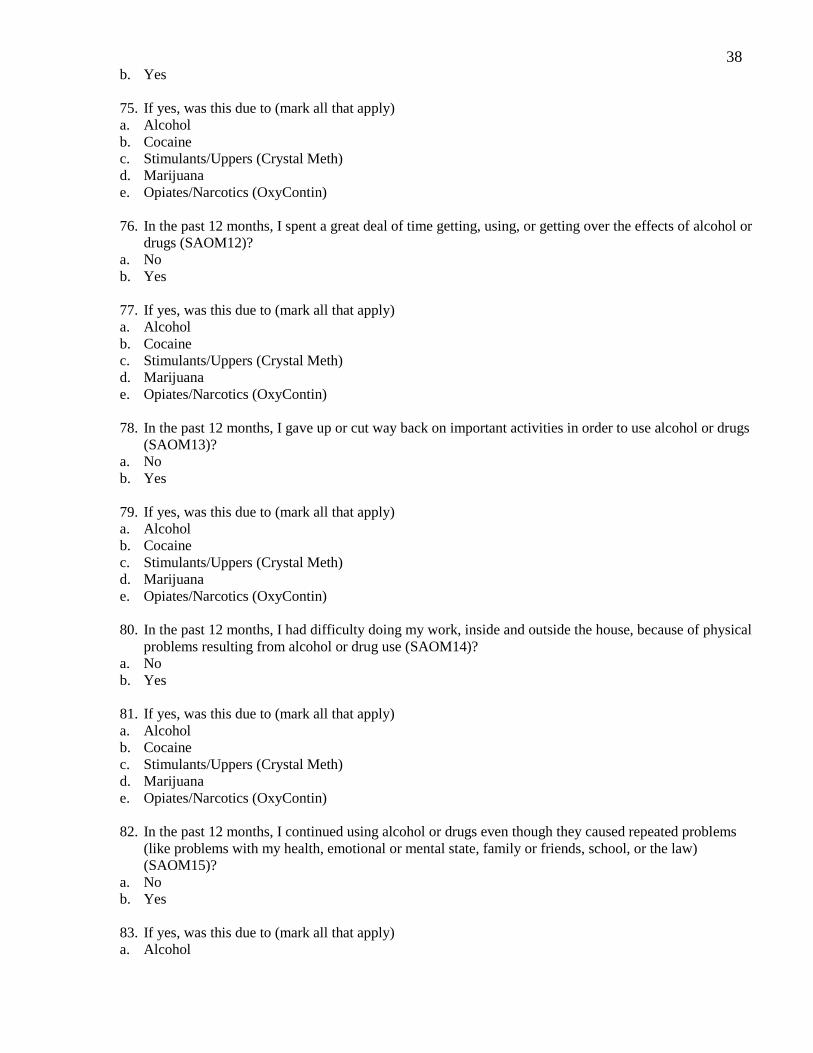
75. If yes, was this due to (mark all that apply)
a. Alcohol
b. Cocaine
c. Stimulants/Uppers (Crystal Meth)
d. Marijuana
e. Opiates/Narcotics (OxyContin)
76. In the past 12 months, I spent a great deal of time getting, using, or getting over the effects of alcohol or
drugs (SAOM12)?
a. No
b. Yes
77. If yes, was this due to (mark all that apply)
a. Alcohol
b. Cocaine
c. Stimulants/Uppers (Crystal Meth)
d. Marijuana
e. Opiates/Narcotics (OxyContin)
78. In the past 12 months, I gave up or cut way back on important activities in order to use alcohol or drugs
(SAOM13)?
a. No
b. Yes
79. If yes, was this due to (mark all that apply)
a. Alcohol
b. Cocaine
c. Stimulants/Uppers (Crystal Meth)
d. Marijuana
e. Opiates/Narcotics (OxyContin)
80. In the past 12 months, I had difficulty doing my work, inside and outside the house, because of physical
problems resulting from alcohol or drug use (SAOM14)?
a. No
b. Yes
81. If yes, was this due to (mark all that apply)
a. Alcohol
b. Cocaine
c. Stimulants/Uppers (Crystal Meth)
d. Marijuana
e. Opiates/Narcotics (OxyContin)
82. In the past 12 months, I continued using alcohol or drugs even though they caused repeated problems
(like problems with my health, emotional or mental state, family or friends, school, or the law)
(SAOM15)?
a. No
b. Yes
83. If yes, was this due to (mark all that apply)
a. Alcohol
39
b. Cocaine
c. Stimulants/Uppers (Crystal Meth)
d. Marijuana
e. Opiates/Narcotics (OxyContin)
84. In the past 12 months, I continued to use alcohol or drugs in dangerous situations, like driving a car or
operating a machine (SAOM16)?
a. No
b. Yes
85. If yes, was this due to (mark all that apply)
a. Alcohol
b. Cocaine
c. Stimulants/Uppers (Crystal Meth)
d. Marijuana
e. Opiates/Narcotics (OxyContin)
86. In the past 12 months, I got into physical fights while using alcohol or drugs (SAOM17)?
a. No
b. Yes
87. If yes, was this due to (mark all that apply)
a. Alcohol
b. Cocaine
c. Stimulants/Uppers (Crystal Meth)
d. Marijuana
e. Opiates/Narcotics (OxyContin)
88. Do you have any health insurance? This includes Medicare, Medicaid, or any public medical assistance?
a. No
b. Private insurance, such as through an employer?
c. Medicare
d. Medicaid
e. Genesee Health Plan or receive other financial help for medical bills, such as through a medical assistance
program
Remember this information is confidential and will not be reported to the IRS or any other person.
89. Which of the following categories best describes your household’s total income before taxes last year?
a. Less than $10,000
b. $10,000-$19,999
c. $20,000-$39,999
d. $40,000-$59,999
e. $60,000-$79,999
f. $80,000 or more
90. Are you currently employed?
a. No
b. Yes, part time
c. Yes, full time

40
Thank you for your help with our study! The researcher will return soon to collect the computer.

41
Appendix C: Technical Appendix
Because substance use and substance abuse/dependence diagnoses were highly
correlated, the latter were not included in the regression analysis.
We ran diagnostics on all variables retained in final regressions and found no evidence for
mulitcollinearity in these analyses.
With the exception of income, all variables had less than 1% missing data; these missing
cases were dropped from the analysis. Income was not reported by 30% (n=3295) of the sample;
thus, this variable was excluded from the regression models. However, demographic measures
correlated with income (i.e., education and employment) were included in the regression models.
Regression Diagnostics: a) Any NPV Model: χ2 (15) = 1143.82, p<.0001 b) Victimization Model: χ2 (15) = 940.08, p<.0001 c) Aggression Model: χ2 (15) = 869.87, p<.0001 Hosmer and Lemeshow Goodness-of-Fit Test a) Any NPV Model: χ2 (8) = 13.39, p=0.0991 b) Victimization Model: χ2 (8) = 13.89, p=0.0846 c) Aggression Model: χ2 (8) = 16.19, p=0.0397

42
Appendix D: Aggression and Victimization Analysis
Table 2a. Bivariate Comparisons of Non-Partner Victimization Based on Demographics, Health Status, and Substance Use (N=10,744).
Variables Non-Partner Victimization
(n=1160)
No Violence
(n=9584)
Demographics Mean (±SD) Mean (±SD)
Age 31.74 (10.5) 36.90 (11.5)
Male 738 (63.6) 3979 (41.5)
African Americana 548 (47.2) 5423 (56.6)
Married or Living Together 264 (22.8) 3182 (33.2)
Some College or College Grad 370 (31.9) 3594 (37.5)
With Health Insurance a 803 (69.3) 7512 (78.5)
Annual Income < $20,000a 618 (73.7) 4275 (64.7)
Employed a 502 (43.4) 4476 (46.7)
Chief Complaint
Injury 515 (44.4) 2421 (25.3)
SF-12 Health Status
Physical Health (≤ 25th Percentile) 289 (24.9) 2397 (25.0)
Mental Health (≤ 25th Percentile) 405 (34.9) 2281 (23.8)
Substance Use in the Past 30 Days
Alcohol Only 370 (31.9) 2834 (29.6)
Marijuana (+/- alcohol) 365 (31.5) 1618 (16.9)
Cocaine (+/- alcohol or marijuana) 111 (9.6) 340 (3.6)
Other illicit drugs* 27 (2.3) 54 (0.6)
Any prescription drug use** 244 (21.0) 1307 (13.6)
Substance Abuse and/or Dependence*
Alcohol 403 (34.7) 956 (10.0)
Cocaine 114 (9.8) 303 (3.2)
Marijuana 154 (13.3) 458 (4.8)
Substance Use Treatment
In Past 3 Months1 100 (8.6) 350 (3.7) Percentages used in the table are column percentages aSome subjects did not respond or skipped this question
*Reference category = ’No Substance Use’ *Other illicit drugs ( ie club drugs, inhalants, methamphetamine, heroin or hallucinogens) **Prescription drug use:opiates morphine, codeine, vicodin, Demerol, Darvon, OxyContin, Darvocet, Tylenol 2,3,4, Stadol, Percodan, Fentanyl,Sedative Depressants, , Xanax, Valium, Quaaludes, Halcion, sleeping pills, nerve pills downers barbiturates etc)
43
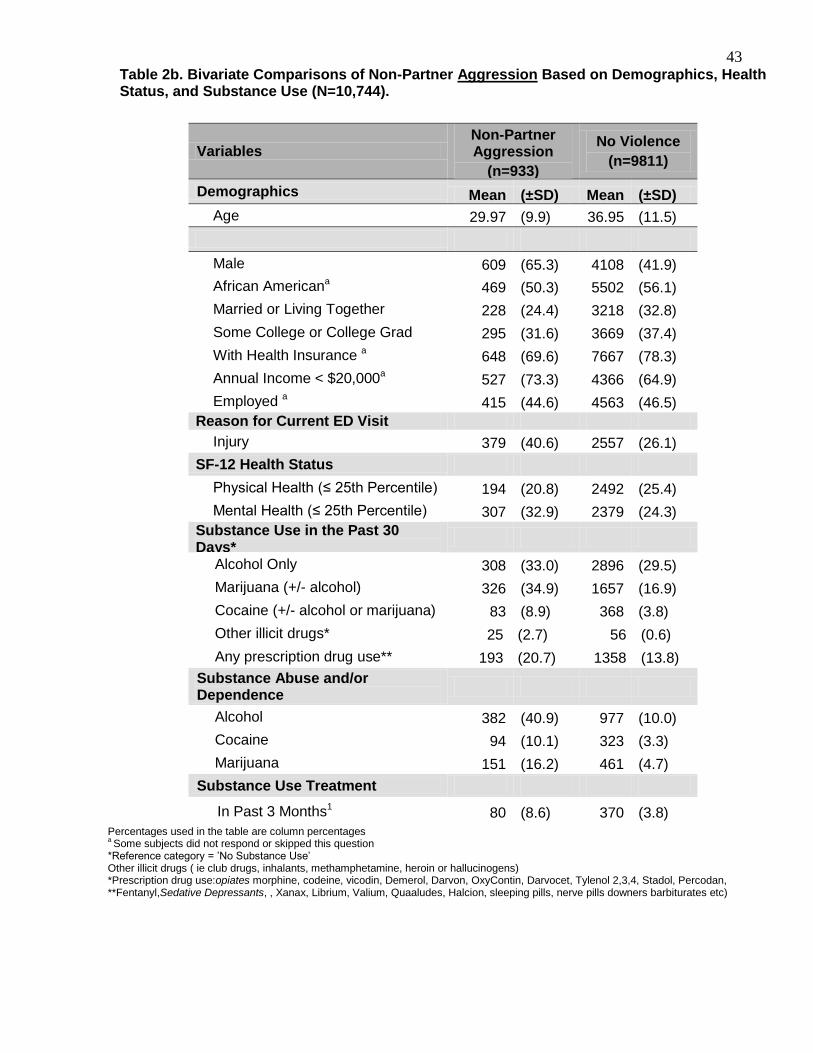
Table 2b. Bivariate Comparisons of Non-Partner Aggression Based on Demographics, Health Status, and Substance Use (N=10,744).
Variables Non-Partner Aggression
(n=933)
No Violence
(n=9811)
Demographics Mean (±SD) Mean (±SD)
Age 29.97 (9.9) 36.95 (11.5)
Male 609 (65.3) 4108 (41.9)
African Americana 469 (50.3) 5502 (56.1)
Married or Living Together 228 (24.4) 3218 (32.8)
Some College or College Grad 295 (31.6) 3669 (37.4)
With Health Insurance a 648 (69.6) 7667 (78.3)
Annual Income < $20,000a 527 (73.3) 4366 (64.9)
Employed a 415 (44.6) 4563 (46.5)
Reason for Current ED Visit
Injury 379 (40.6) 2557 (26.1)
SF-12 Health Status
Physical Health (≤ 25th Percentile) 194 (20.8) 2492 (25.4)
Mental Health (≤ 25th Percentile) 307 (32.9) 2379 (24.3)
Substance Use in the Past 30 Days*
Alcohol Only 308 (33.0) 2896 (29.5)
Marijuana (+/- alcohol) 326 (34.9) 1657 (16.9)
Cocaine (+/- alcohol or marijuana) 83 (8.9) 368 (3.8)
Other illicit drugs* 25 (2.7) 56 (0.6)
Any prescription drug use** 193 (20.7) 1358 (13.8)
Substance Abuse and/or Dependence
Alcohol 382 (40.9) 977 (10.0)
Cocaine 94 (10.1) 323 (3.3)
Marijuana 151 (16.2) 461 (4.7)
Substance Use Treatment
In Past 3 Months1 80 (8.6) 370 (3.8)
Percentages used in the table are column percentages a Some subjects did not respond or skipped this question
*Reference category = ’No Substance Use’ Other illicit drugs ( ie club drugs, inhalants, methamphetamine, heroin or hallucinogens) *Prescription drug use:opiates morphine, codeine, vicodin, Demerol, Darvon, OxyContin, Darvocet, Tylenol 2,3,4, Stadol, Percodan, **Fentanyl,Sedative Depressants, , Xanax, Librium, Valium, Quaaludes, Halcion, sleeping pills, nerve pills downers barbiturates etc)

44
Table 3A Parallel Logistic Regression Analysis for Non-Partner Victimization and Non-Partner Aggression, by Demographics, Health Status, and Recent Substance Use (N=10,744).
Variables* Victimization* Aggression**
OR 95% CI OR 95% CI
Demographics
Age 0.96 0.95 0.96 0.94 0.93 0.95
Male 2.23 1.93 2.56 2.42 2.07 2.83
African American 0.73 0.63 0.83 0.86 0.74 1.00
Married or Living Together 0.63 0.54 0.73 0.76 0.64 0.89
Some College or College Grad 1.07 0.93 1.24 1.09 0.93 1.27
With Health Insurance 0.96 0.83 1.11 1.04 0.89 1.23
Employed 0.87 0.75 1.00 0.88 0.75 1.02
Reason for Current ED Visit
Injury 2.06 1.80 2.36 1.60 1.38 1.86
Mental Health
Physical Health (≤ 25th Percentile) 1.41 1.20 1.66 1.19 0.98 1.43
Mental Health (≤ 25th Percentile) 1.82 1.57 2.10 1.66 1.41 1.95
Substance Use in the Past 30 Days
Alcohol Only*** 1.69 1.43 2.00 2.02 1.67 2.43
Marijuana (+/- alcohol) *** 2.25 1.89 2.67 2.69 2.22 3.26
Cocaine (+/- alcohol or marijuana) *** 3.48 2.67 4.54 3.78 2.80 5.11
Prescription drug use**** 1.42 1.20 1.69 1.49 1.23 1.80
Substance Use Treatment
In Past 3 Months 1.51 1.17 1.96 1.52 1.15 2.01
*Reference category = ’No victimization **Reference category = ’No aggression ***Reference category = ’No Substance Use’ ****Prescription drug use:opiates morphine, codeine, vicodin, Demerol, Darvon, OxyContin, Darvocet, Tylenol 2,3,4, Stadol, Percodan, Fentanyl,Sedative Depressants, , Xanax, Librium, Valium, Quaaludes, Halcion, sleeping pills, nerve pills downers barbiturates etc) Logistic regression models predicting non-partner victimization: (χ2 (15) = 940.08, p<.0001). Logistic regression models predicting non-partner aggression: (χ2 (15) = 869.87, p<.0001).
Top Related
Copyright © 2022 FDOKUMEN

