


Bahasa
Halaman
Hukum


NATIONAL COUNCIL
OF APPLIED ECONOMIC
RESEARCH
Present and Potential
Contribution of Microfinance
to India’s Economy
Supported by
Present and Potential
Contribution of Microfinance
to India’s Economy
Prepared for the
Microfinance Institutions Network
March 2021
National Council of Applied Economic Research
NCAER India Centre, 11 Indraprastha Estate, New Delhi 110 002, India
About NCAER NCAER, the National Council of Applied Economic Research, is India’s oldest and largest independent economic think-tank, set up in 1956 to inform policy choices for both the public and private sectors. For more than six decades, NCAER has served the nation with its rich offering of applied policy research, unique data sets, evaluations and policy inputs to central and state governments, corporate India, the media and informed citizens. It is one of a few think-tanks worldwide that combine rigorous analysis and policy outreach with deep data collection capabilities, especially for large-scale household surveys.
About MFIN Microfinance Institutions Network (MFIN) was established in October 2009 as a Society under the Andhra Pradesh Societies Registration Act 2001. The Reserve Bank of India (RBI) vide its letter dated 16th June 2014 accorded recognition to MFIN as Self-Regulatory Organisation (SRO) of NBFC-MFIs. MFIN currently has 58 NBFC-MFIs as primary members, which on an aggregate basis, constitute around 80% of the microfinance business of NBFC-MFIs in India. MFIN also has 39 associates, which includes Banks and their Corporate BCs, Small Finance Banks, NBFCs, Insurance Companies, and Fintech Companies. MFIN works with a broader financial inclusion ecosystem to ensure that its members and the microfinance industry can optimise their potential to achieve the financial inclusion agenda. MFIN’s primary objective is to work towards the robust development of the microfinance sector, by promoting responsible lending, client protection, good governance, and supportive regulatory environment. In addition to its role as an SRO, MFIN also has an important role as a sector development organisation and in leading advocacy efforts for the members for an enabling regulatory environment. MFIN has been diligently and credibly performing various activities under these work streams: (A) Self-Regulation and (B) Policy Advocacy and Sector development. As part of its policy advocacy efforts, MFIN Board has commissioned this paper to map the present and potential economic impact NBFC-MFIs and the microfinance sector may create in the foreseeable future and therefore, play a vital role in achievement of the financial inclusion in the country. NCAER is grateful to MFIN for the grant support for this research. ©National Council of Applied Economic Research, 2021 All rights are reserved. The material in this publication is copyrighted. NCAER encourages the dissemination of its work and will normally grant permission to reproduce portions of the work promptly. For permission to reprint any part of this work, please send a request with complete information to the publisher below.
Published by Professor Anil K. Sharma Secretary and Operations Director National Council of Applied Economic Research NCAER India Centre 11, Indraprastha Estate, New Delhi–110 002 Tel: +91-11-2345 2657, 6120 2698 Email: [email protected] www.ncaer.org Publications Coordinator Jagbir Singh Punia …………………………………………. The findings, interpretations, and conclusions expressed are those of the authors and do not necessarily reflect the views of the Governing Body of NCAER.
Preface
Financial inclusion, or empowerment of all citizens with access to financial resources through formal financial institutions and systems, has been advocated by many as an effective vehicle for economic development and poverty alleviation. Poverty alleviation mechanism clearly translates through access to affordable credit to smoothen the income stream to meet the consumption requirements, acquire productive assets to support livelihoods and access benefits under poverty alleviation programs of the government. Microfinance has emerged as a major instrument of meeting the needs of lower income households by linking them to the financial resources to meet both productive and critical needs on credit. It also provides a mechanism for empowering women. The microfinance credit and support for micro-enterprises is now extended by various types of institutions all across the country including Banks, NBFC-MFIs, SFBs, NBFCs and non-profit organisations. Microfinance has also benefitted immensely from the application of Information and Communication Technologies to financial services both to improve its operational efficiency and also support better utilisation of credit.
One of the important sets of institutions engaged in the microfinance sector comprises the Non-banking Finance Companies (NBFC-MFIs). Their clientele, the households who borrow from this group of institutions now exceed three crore across the country, while as a whole the sector serves around six crore households. The present study by NCAER has provided an assessment of the impact of microfinance on the macro economy, focusing on the activities of NBFC-MFIs. This focus provides a better understanding of the channels of the impact of microfinance on jobs and income. The impact on GDP and jobs has been extrapolated to the entire microfinance sector to arrive at a broader assessment of the sector as a whole.
Approach taken by the study is innovative and provides an assessment of the impact of a very crucial segment of the financial sector, touching the households at the lower income rung of the development ladder.
The study has highlighted the interdependency of the overall economic growth and the development of microfinance. The three scenarios that have been examined by the study – a baseline, pessimistic and optimistic in terms of overall economic growth reflect the inter-linkages. The study emphasises the important role of MFIs under both alternatives: optimistic and pessimistic. However, the massive impact of the Covid-19 pandemic has certainly been well beyond the expectations of the scenario on the downside, especially the sharp and deep economic shocks that have been inflicted. Going forward, the findings of the study highlight the need to strengthen the financial ecosystem that focuses on providing financial services to the lower income households, who need such support both to overcome the hurdles in their enterprises or who just need credit to smoothen their income stream. Credit to the poor without the requirement of a collateral, with repayments at intervals that are better aligned with income streams, and more importantly, accessible closer to their habitation is a unique service that requires constant efforts both to improve its impact and sustainability.
We hope that the present study has provided insights necessary to draw attention to the role of microfinance at the level of the overall economy and supplements the many studies that have looked at the impact at the enterprise levels so far.
Dr Poonam GuptaNew Delhi Director General December 2021 NCAER

Page | i
Foreword
The microfinance sector in India has achieved impressive growth during the last decade. This has been the result of a sharp expansion in operations by the Non-Banking Financial Companies- Microfinance Institutions (NBFC-MFIs), regulated by the Reserve Bank of India, which have been operating as lenders of credit to the lower-income segment of the population. The reach of MFIs, including the self-help groups (SHGs), has been enormous. In 2018-19, the MFIs lent to over three crore borrowers and the bank-linked SHGs have a membership of 12 crore individuals. Thus, ‘microfinance’, which started as a ‘people’s movement’ in the 1970s, now also has a strong business dimension. An important feature of microfinance lending is the adoption of a ‘group lending’ model, which has replaced ‘physical collateral’ by ‘social collateral’ for loans, thereby opening up formal sector credit to the lower income groups who are unable to provide any physical collateral required for credit from the formal sector. The second major advantage of microfinance for the borrower has been the availability of credit at practically the doorstep of borrowers, making formal sector credit accessible to those who have traditionally been excluded from the ambit of the formal banking sector. The fact that the microfinance sector enjoys a vast reach among crores of borrowers also gives rise to certain corollary questions: What is the scale of the economic impact of microfinance operations at the national level? How are the microfinance sector and overall economic growth related? It is with a view to explore these questions that the Micro Finance Institutions Network (MFIN), an association of NBFC-MFIs, approached NCAER to carry out such a study. The two core dimensions of this study included an assessment of the impact of microfinance operations on GDP, and on employment generation. This NCAER study also reviews the growth of the microfinance sector and assesses its specific position within the broader landscape of credit flows in the economy, particularly to the low-income households and the micro-enterprises. This report examines past research studies and relevant databases to analyse the links between micro-credit and the economy. The study team also held discussions with industry leaders to gather their insights about the performance of the sector, its role in the economy, as well as its impact and future trajectories. The study also explores linkages between microfinance and the economy through data on the use of credit by households and small enterprises. While the study delineates the estimated impact of the microfinance sector as a whole on the economy, the underlying parameters of the microfinance sector were obtained from the NBFC-MFIs. Delivery of credit comes with the responsibility to collect the repayment in a way that does not leave the borrower financially worse off than before availing of the loan. Simultaneously, the borrower too shoulders the responsibility of ensuring timely repayments of the loan. The relatively successful repayment performance of MFI loans points to an effective model of the credit system in which loans meet an important financial need of the borrowers, while enabling them to repay the loan as per the terms of loan. The focus of microfinance operations has largely been women, particularly women-SHGs, which have been consistently successful in paying off the loans. It is not clear if female borrowers are more disciplined than the male borrowers, or if microfinance credit attracts borrowers for whom such credit remains the only source of improving their livelihood options, thereby pushing them to make the best use of available credit. The evolution of microfinance over the decades suggests that the regulatory framework that has emerged during this period has assisted in this growth of the sector. In addition to households, particularly their women members, microfinance credit is also expected to support micro or small enterprises by offering them credit for working capital or equipment.
Page | ii
Further, since microfinance has the potential to meet the credit requirements of poor households whose income streams fail to match their consumption expenditures, it has emerged as a viable mechanism for meeting the genuine credit needs of a large section of consumers who have hitherto been under-served by the formal banking system. For deriving the broader macroeconomy level impact, the study uses the framework of the Input-Output model that captures the production linkages across sectors. This framework allows for an assessment of not only the backward or input linkages through all sectors of the economy, but also the ‘forward linkages’ through which credit impacts the economy. When the borrowers use the credit in productive enterprises, the income and employment impact is realised. The study provides estimates of such ‘multiplier effects’ on Gross Value Added and jobs. The study also analyses future trajectories of the growth of the microfinance sector over the medium term by simulating the alternative combinations of parameters of microfinance operations. The alternative scenarios highlight both the opportunities and risks for the sector. The study points to the critical role of the microfinance sector both when the overall economic growth conditions are buoyant and also when the overall economic conditions are weak. Its importance for the lower-income households and micro-enterprises is equally critical when the overall economic conditions are positive and adverse. We are grateful to MFIN for offering the opportunity to undertake this important assignment. The study team is especially thankful to Dr Alok Misra, CEO and Director, MFIN, and his colleagues, Mr Swetan Sagar, Head Advocacy; and Mr Amit Mathur, VP, Advocacy, and Dr. Vinay Kumar Singh, Consultant/ Economist, MFIN, for their support during different stages of this work, and for sharing data, insights and understanding of the sector. The NCAER team also benefited from interactions with a number of members of the Board of MFIN, leaders of NBFC–MFIs in the country and experts in the sector. At NCAER, the study team was led by Dr Shashanka Bhide, Senior Adviser, and supported by Professor D.B. Gupta, Senior Adviser. The study team included Dr Bornali Bhandari, Mr Devender Pratap, Dr Samarth Gupta, Dr Madhura Dasgupta, Dr Sanjukta Das, Mr Ajaya Sahu, Mr Jaskirat Singh Kohli, and Ms Ruchi Avtar. We believe that the study has made a valuable contribution to understanding the contributions of the microfinance sector to the economy and will underscore the need for sustaining positive links between credit and livelihoods.
Dr Shekhar Shah New Delhi Director General March 2021 NCAER
Page | iii
Study Team Team Lead: Shashanka Bhide Senior Adviser: Devendra B. Gupta Project Team: Bornali Bhandari, Sanjukta Das, Madhura Dasgupta, Samarth Gupta, Devender Pratap, Ajaya Sahu, Jaskirat Singh Kohli, and Ruchi Avtar Editor: Anupma Mehta
All the team members made significant contributions to the work entailed in carrying out this study. Following were the specific focus areas of the work done by the individual team members: Bornali Bhandari along with Ajaya Sahu, was responsible for the findings of the NSSO Survey of Unincorporated Enterprises, Madhura Dasgupta worked on the review of previous research, Samarth Gupta and Madhura Dasgupta analysed the Economic Census data used as background work for the study, Devender Pratap and Ajaya Sahu contributed to the analysis using I-O models, and Sanjukta Das worked on the analysis of district level data and analysis of household panel data used as background work for the study. Ruchi Avtar and Jaskirat Singh Kohli assisted in all aspects of the work. In addition to the contributions mentioned above, Bornali Bhandari and Sanjukta Das assisted in the interviews with the industry leaders. Prof D.B. Gupta guided the study team during all stages of the work and Dr Shashanka Bhide led the team. The Study team wishes to acknowledge the help from Dr. Alok Misra, who shared his insights during the initial stages of this study when he was at the Management Development Institute, Gurugram, and later in the final stages when he joined MFIN as its CEO & Director. The study team also wishes to place on record its gratitude for the opportunity of interacting with each of following industry leaders: Mr Manoj Kumar Nambiar, Chairperson, Board of MFIN and MD, Arohan Financial Services; Mr Vineet Chattree, Vice Chairperson, Board of MFIN and Director, Svatantra Microfin Pvt Ltd; Mr Govind Singh, MD & CEO, Utkarsh Small Finance Bank; and Mr Devesh Sachdev, MD & CEO, Fusion Microfinance Pvt Ltd. Finally, the team would like to acknowledge the data support and insights received from Swetan Sagar, Head, Advocacy and Development; Amit Mathur, Vice President, Advocacy and Development, and Vinay Singh, Consultant/ Economist, MFIN, which was extremely crucial for this study. The study team is indebted to them. The team is also grateful for the support offered by MFIN in the form of a financial grant, which made this study possible.
Page | iv
Contents Foreword .............................................................................................................................................. i Study Team .......................................................................................................................................... ii List of Tables ........................................................................................................................................ v List of Figures ...................................................................................................................................... vi Abbreviations and Acronyms ............................................................................................................ vii Executive Summary .......................................................................................................................... viii
Chapter 1. Microfinance and Inclusive Development ...................................................................... 1 1.1 The Backdrop ................................................................................................................................. 1 1.2 Access to Finance and Development ........................................................................................... 1 1.3 Microfinance as the Key to Inclusive Growth .............................................................................. 3 1.4 About the Study ............................................................................................................................4
Chapter 2. NBFC-MFIs and India’s Financial Inclusion Landscape .................................................. 5 2.1 Microfinance and Financial Inclusion ........................................................................................... 5 2.2 The Microfinance Landscape and NBFC-MFIs ............................................................................. 5 2.3 Income Generation by Microfinance .......................................................................................... 8 2.4 The Unmet Demand for Microfinance ....................................................................................... 14
Chapter 3: Impact of Microfinance ................................................................................................. 16 3.1 The Backdrop ............................................................................................................................... 16 3.2. Insights from the Literature ...................................................................................................... 16 3.3 Insights from Industry Experts................................................................................................... 18 3.4 The Research Gaps and the Focus of the Present Study .......................................................... 20
Chapter 4. Study Objectives and Methodology ............................................................................. 21 4.1 Introduction ................................................................................................................................. 21 4.2 Objectives .................................................................................................................................... 21 4.3 Methodology............................................................................................................................... 21
Chapter 5. Contribution of the Microfinance Sector to the Macroeconomy .............................. 31 5.1 Introduction ................................................................................................................................. 31 5.2 Contribution to the Macroeconomy .......................................................................................... 31 5.3 Contribution to the Macroeconomy over the Medium Term: the Base, Optimistic and the Pessimistic Scenarios ........................................................................................................................ 33 5.4 Features of the Base Case, the Best Case and the Pessimistic Case Scenarios.......................34 5.4 Summing Up ................................................................................................................................ 37
Chapter 6. Summary, Key Findings and Implications .................................................................... 38 6.1 Expanding the Reach of the Microfinance Sector ................................................................... 38 6.2 The Promise of Microfinance for Economic Development and the Need for Its Growth ..... 38 6.3 Impact on the Economy ............................................................................................................ 40 6.4 Successes, Failures and Prospects............................................................................................. 41
Appendix 1. The Output, Value Added and Employment Multipliers ........................................... 44 Appendix 2. Tables Relating to Input–Output Analysis ................................................................ 46 Appendix 3. Details of Calculation of the Contribution of the Microfinance Sector to Gross Value Added and Employment......................................................................................................... 57
Page | v
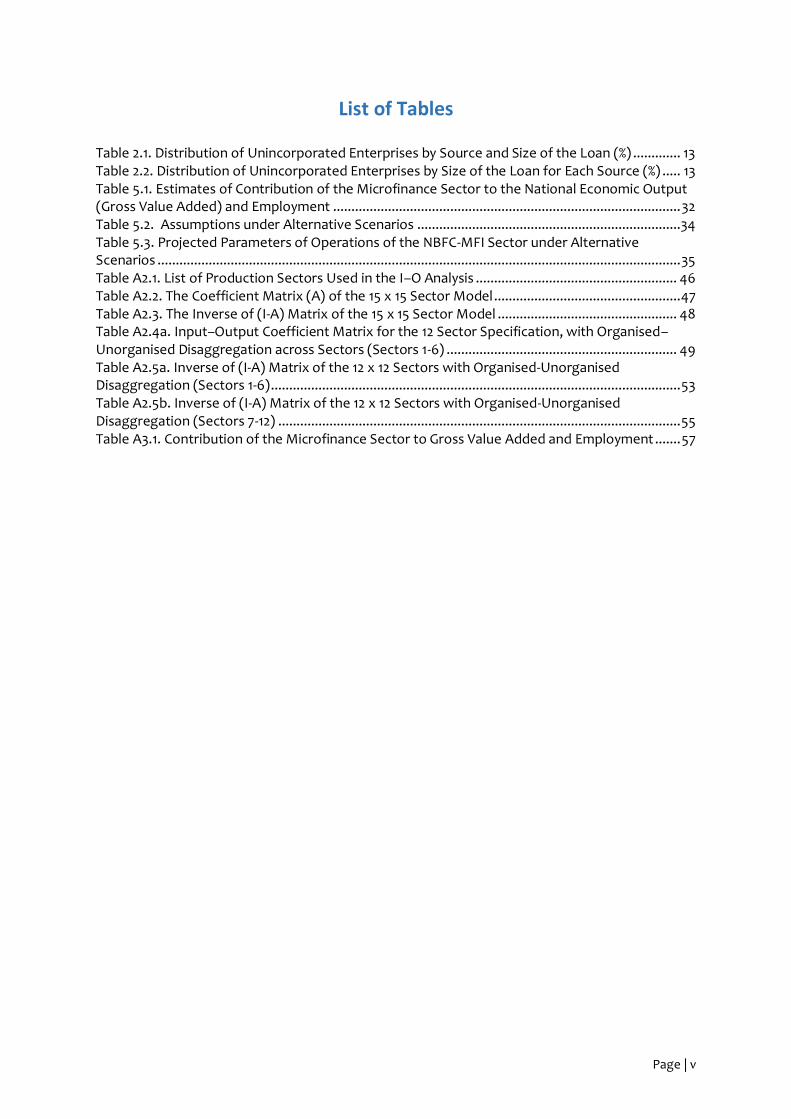
List of Tables Table 2.1. Distribution of Unincorporated Enterprises by Source and Size of the Loan (%) ............. 13 Table 2.2. Distribution of Unincorporated Enterprises by Size of the Loan for Each Source (%) ..... 13 Table 5.1. Estimates of Contribution of the Microfinance Sector to the National Economic Output (Gross Value Added) and Employment ............................................................................................... 32 Table 5.2. Assumptions under Alternative Scenarios ........................................................................34 Table 5.3. Projected Parameters of Operations of the NBFC-MFI Sector under Alternative Scenarios ............................................................................................................................................... 35 Table A2.1. List of Production Sectors Used in the I–O Analysis ....................................................... 46 Table A2.2. The Coefficient Matrix (A) of the 15 x 15 Sector Model ................................................... 47 Table A2.3. The Inverse of (I-A) Matrix of the 15 x 15 Sector Model ................................................. 48 Table A2.4a. Input–Output Coefficient Matrix for the 12 Sector Specification, with Organised–Unorganised Disaggregation across Sectors (Sectors 1-6) ............................................................... 49 Table A2.5a. Inverse of (I-A) Matrix of the 12 x 12 Sectors with Organised-Unorganised Disaggregation (Sectors 1-6) ................................................................................................................ 53 Table A2.5b. Inverse of (I-A) Matrix of the 12 x 12 Sectors with Organised-Unorganised Disaggregation (Sectors 7-12) .............................................................................................................. 55 Table A3.1. Contribution of the Microfinance Sector to Gross Value Added and Employment ....... 57
Page | vi
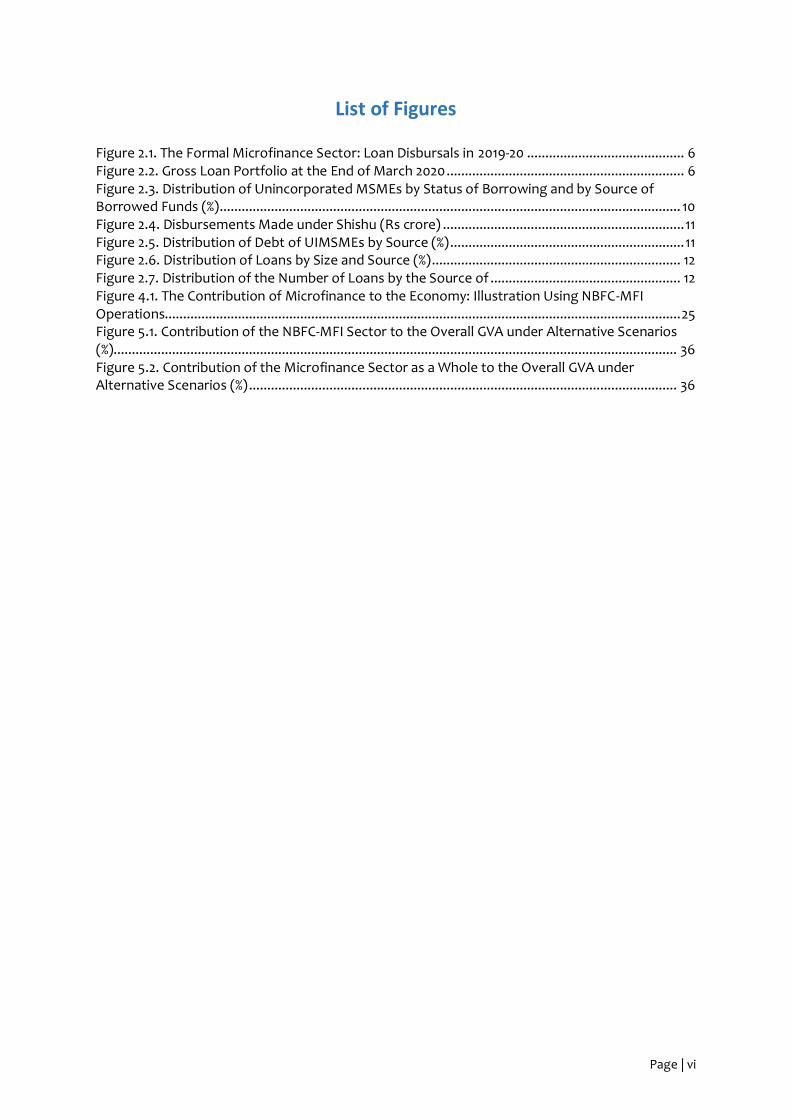
List of Figures Figure 2.1. The Formal Microfinance Sector: Loan Disbursals in 2019-20 ........................................... 6 Figure 2.2. Gross Loan Portfolio at the End of March 2020 ................................................................. 6 Figure 2.3. Distribution of Unincorporated MSMEs by Status of Borrowing and by Source of Borrowed Funds (%) .............................................................................................................................. 10 Figure 2.4. Disbursements Made under Shishu (Rs crore) .................................................................. 11 Figure 2.5. Distribution of Debt of UIMSMEs by Source (%) ................................................................ 11 Figure 2.6. Distribution of Loans by Size and Source (%) .................................................................... 12 Figure 2.7. Distribution of the Number of Loans by the Source of .................................................... 12 Figure 4.1. The Contribution of Microfinance to the Economy: Illustration Using NBFC-MFI Operations............................................................................................................................................. 25 Figure 5.1. Contribution of the NBFC-MFI Sector to the Overall GVA under Alternative Scenarios (%).......................................................................................................................................................... 36 Figure 5.2. Contribution of the Microfinance Sector as a Whole to the Overall GVA under Alternative Scenarios (%) ..................................................................................................................... 36
Page | vii
Abbreviations and Acronyms
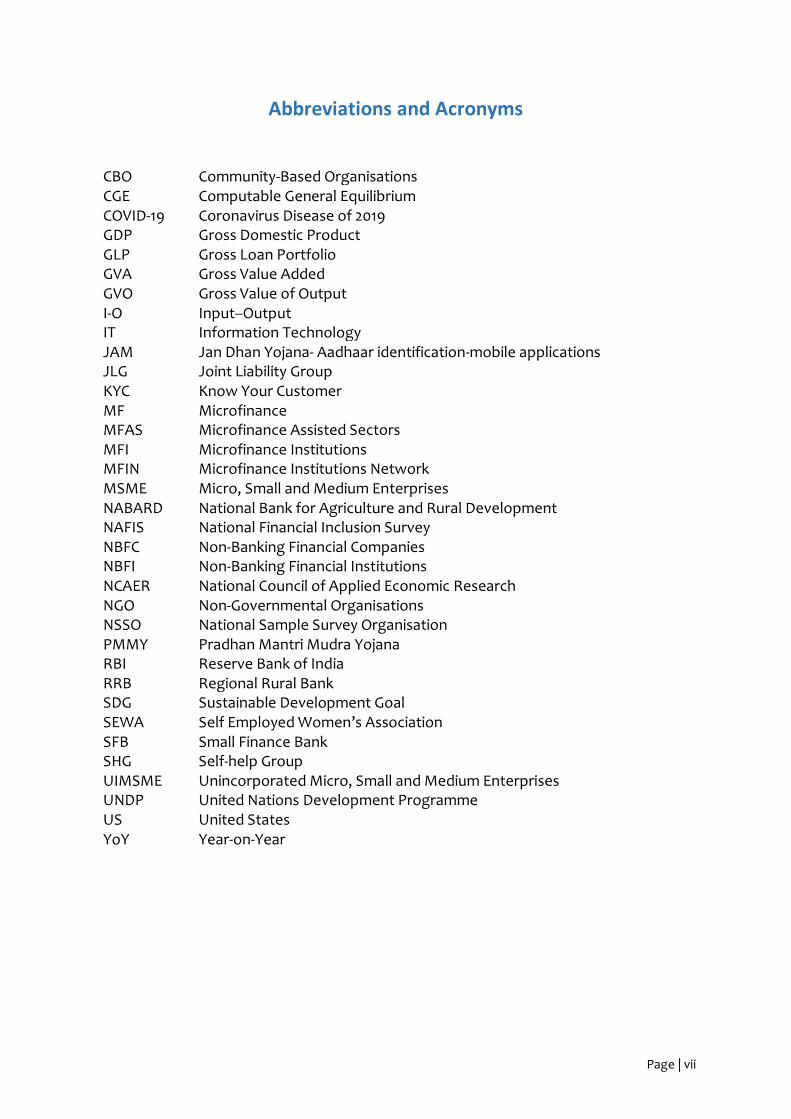
CBO Community-Based Organisations CGE Computable General Equilibrium COVID-19 Coronavirus Disease of 2019 GDP Gross Domestic Product GLP Gross Loan Portfolio GVA Gross Value Added GVO Gross Value of Output I-O Input–Output IT Information Technology JAM Jan Dhan Yojana- Aadhaar identification-mobile applications JLG Joint Liability Group KYC Know Your Customer MF Microfinance MFAS Microfinance Assisted Sectors MFI Microfinance Institutions MFIN Microfinance Institutions Network MSME Micro, Small and Medium Enterprises NABARD National Bank for Agriculture and Rural Development NAFIS National Financial Inclusion Survey NBFC Non-Banking Financial Companies NBFI Non-Banking Financial Institutions NCAER National Council of Applied Economic Research NGO Non-Governmental Organisations NSSO National Sample Survey Organisation PMMY Pradhan Mantri Mudra Yojana RBI Reserve Bank of India RRB Regional Rural Bank SDG Sustainable Development Goal SEWA Self Employed Women’s Association SFB Small Finance Bank SHG Self-help Group UIMSME Unincorporated Micro, Small and Medium Enterprises UNDP United Nations Development Programme US United States YoY Year-on-Year

Page | viii
Executive Summary India’s microfinance sector has seen a sharp rise in operations during the last decade. The sector is large in terms of its lending and reach the size of the sector. This study presents an analysis of the contribution of the microfinance sector to the overall economy in terms of income or ‘Gross Value Added’, a measure of the national economic output and employment. It also provides a review of the profile of borrowers of microfinance, including both households and enterprises. The macro level analysis in the study has been anchored by the detailed data available for the Non-Banking Financial Company–Microfinance Institutions (NBFC–MFIs), which is also projected for the entire microfinance sector comprising all the MFIs including the bank-linked Self Help Groups (SHGs). The study also assesses the impact of microfinance credit on poverty reduction, micro-enterprises, women’s empowerment, and non-economic benefits based on a review of previous research.
The study is supported by a grant from the Micro Finance Institutions Network (MFIN). We present here the key findings from the study.
Expanding the Reach of the Microfinance Sector The microfinance sector has evolved in India over the last three decades since its advent in the late 1980s. In the recent years, from annual disbursal of 1.67 crore loans amounting to Rs 21,000 crore in 2012-13, the scale of operations of NBFC-MFIs in terms of the number of loans disbursed has increased to 2.69 crore and Rs 76,140 crore loan disbursal in 2019-20. The number of loans increased by 59 per cent and of amount of loan disbursals increased by 2.5 times in a period of five years. The rise has not been without underlying structural changes. There has been a churning within the microfinance sector with the entry of new players and transformation of institutions from one type to another. The reach of SHGs, the bank-linked groups of women formed to support savings and livelihoods has also expanded phenomenally to 1 crore in number with 12 crore members in 2019-20. Among these SHGs, around one third borrowed to the tune of Rs 77,660 crore in 2019-20. Besides the NBFC-MFIs, and SHGs, the microfinance sector also includes banks, NBFCs, SFBs and others and in 2019-20, the estimated loan disbursals by all these entities exceeded Rs 313,000 crore and even after excluding the SHG segment, over 5.89 crore unique borrowers. These are large numbers and significant highlighting the expanding reach of microfinance and its potential to touch the lives and livelihoods across the country. The microfinance sector has evolved in India over the last three decades since its advent in the late 1980s. The annual disbursal of microcredit loans by NBFC-MFIs increased from 1.81 crore loans amounting to Rs 23,209 crore in 2012-13 to disbursal of 3.06 crore loans in 2018-19 amounting to Rs 78,818 crore. Thus, the number of loans disbursed nearly doubled and loan amount nearly quadrupled in a period of five years. The reach of Self Help Groups (SHGs), the bank-linked groups of women formed to support savings and livelihoods, has also expanded phenomenally to reach 1 crore in number, with 12 crore households as members in 2018-19. Among these SHGs, around 27 lakh were credit linked with disbursements of Rs 58,317 crore in 2018-19. Besides the NBFC–MFIs, and SHGs, the microfinance sector also includes banks, NBFCs, small finance banks (SFBs), and others, and in 2018-19, all these entities disbursed loans worth Rs 259,766 crore to 6.66 crore borrowers. In 2019-20, the sector-wide disbursals (including SHGs) exceeded Rs 310,000 crore to 7.17 crore accounts. These are large numbers and significant in the context of the reach of microfinance and its potential to touch the lives and livelihoods of people across the country.
Page | ix
The Promise of Microfinance for Economic Development and Need for Its Growth The promise of microfinance in meeting the credit needs of the poor and assisting them to overcome poverty has been at the core of policy interest. It was also clear to the practitioners and policymakers that provision of finance alone would not be sufficient to achieve poverty reduction. The public policy support to the delivery of health care, education, food, agricultural inputs, infrastructure development, shelter, and old age pension has recognised the need for interventions in specific sectors. Microfinance may be seen as complementing these efforts. Evidence from the recent household and enterprise surveys shows that a considerable proportion of households and more so, the small enterprises, still rely on informal sources of credit. In terms of the penetration of formal financial institutions in the supply of credit, there is still a potential base that remains to be reached. The 2016-17 survey of rural credit by the National Bank of Agriculture and Rural Development (NABARD) reveals that credit is needed at all income levels. The need for credit, may arise for numerous reasons, but the composite ‘household needs’ is the most common purpose. Microfinance credit, focusing on the lower income portion of the income spectrum, therefore, has to address these features of the demand for credit. This study also draws attention to the findings of a survey of unincorporated non-agricultural enterprises by the National Sample Survey Organisation (NSSO) that about 50 per cent of the estimated 6.34 crore enterprises engaged in manufacturing, Trade, and other services were in rural areas. The reach of microfinance in this sector appears to be quite limited. If the situation has changed dramatically between 2015-16 and now, it would signify a major transformation in the rural economy, and the impact of credit on the micro-enterprises would be a crucial factor for understanding the changes in the overall rural economy. The available data on household borrowing and enterprise borrowing, therefore, points to the large segment of the population and enterprises, whose diverse needs for credit are met by multiple sources, including the informal sources. However, there is a need to sustain the growth of the sector. The informal sources of credit, though much less prominent now than in the early 1960s and early 1970s, remain significant in the rural areas. The reach of microfinance across different parts of the country is also not even. In the case of micro-enterprises, while the reach of formal sector credit appears limited, the significant contribution of NBFC-MFIs in the category of ‘Shishu loans’ under the Pradhan Mantri Mudra Yojana (PMMY) is noteworthy. The dynamism of the supply side of microfinance is important in the context of the challenges of meeting the large and growing demand. In view of the increasing demand for microfinance credit, on the one hand, as the economy grows, and the shift away from informal sources of credit to formal credit driven by increased access to formal financial infrastructure, on the other hand, the demand for formal sector microfinance is expected to increase. Addressing the needs of this segment of the economy, which necessitates a rise in efficient credit services above their current low-income levels, will be both a challenge and an opportunity for the microfinance sector. Impact on the Economy Keeping in view the role of credit as essentially an input for the economic activities that may flow from there, the study adopted the framework of an Input-Output (I–O) model to assess the direct and indirect effects of microfinance operations on the Gross Domestic Product (GDP) and employment. While the microfinance delivery system is relatively small even within the formal

Page | x
financial sector of the economy, the important effects of microfinance include its forward linkages: the households and enterprises that use credit to add value through their own production processes. The ‘direct and backwards indirect effects’ have been estimated using the standard I-O output multipliers. The ‘forward linkages’ have been captured in the study by assessing the impact of the additional output of the ‘informal sector’ in a few specific sectors such as trade, manufacturing of food products, textiles, leather and leather products, ‘paper and paper products’, and agriculture. The analysis was carried out for 2018-19, for which the details of the NBFC–MFI data were available. The NBFC–MFI data formed the basis for deriving the estimates of output, value added, and employment. These estimates were then extrapolated to the microfinance sector as a whole, using the proportion of loan disbursals by the NBFC–MFIs in the disbursal of loans by all the MFIs and SHGs in 2018-19. The estimated contributions of the microfinance sector to the macroeconomy in 2018-19 are as follows: Contribution to Gross Value Added: 1. Contribution of the direct and indirect backward linkage of the NBFC-MFI sector: 0.08 per cent. 2. The impact due to the ‘forward linkages’: 0.53 per cent of national Gross Value Added (GVA). 3. Total direct, indirect backward and forward linkages: 0.61 per cent of national GVA. 4. The contribution of microfinance sector as a whole, including all MFIs and SHGs: 2.03 per cent
of GVA
Contribution to Employment: 1. Impact through the direct and indirect backward linkage of the NBFC-MFI sector on
employment: 1.2 lakh jobs. 2. The impact due to the ‘forward linkages’: 37.34 lakh jobs. 3. Total direct, indirect backward and forward linkages: 38.54 lakh jobs. 4. The contribution of microfinance sector as a whole, inclusive of direct, indirect backward and
forward linkages and including all MFIs and SHGs: 128.46 lakh jobs. These numbers are significant. The financial sector as a whole, including insurance, of which microfinance is a part, accounted for 5.5 per cent of GVA in 2018-19. When we consider the ‘forward linkages’ of the sector, which in turn, generate value addition and jobs, the significance of the microfinance sector in the economy is more appropriately captured. Successes, Failures, and Prospects Perspectives of the providers of microfinance on the challenges and the way forward emphasise the larger role that the ‘internal factors’ of the industry have played in the rapid growth of the sector in the recent years. The main drivers of growth have been the focus on a specific segment of demand, clear regulatory guidelines, and the emergence of technology that impacts the monitoring and implementation of services and the general professional approach to business operations. The large unmet need for the efficient delivery of credit was indeed an important factor. The high overall economic growth during the last decade was important in terms of creating
Page | xi
opportunities for mainstreaming microfinance and sustaining its growth. For the medium term, diversification of the portfolio of credit, greater engagement with the borrowing enterprises, and the positive environment of credit discipline are important for the growth of the sector. Complementing the efforts of public programmes for poverty reduction would also be important for microfinance, especially where improving awareness about the programmes is concerned. Alternative Scenarios for the Sector over the Medium Term The final section of the study presents three alternative scenarios for microfinance over the next seven-year period. The ‘base case’ or more likely scenario; ‘the best case’, which is one of high expectations; and the ‘pessimistic scenario’ arising from the weak economic growth conditions affecting the demand for loans. The relationship between economic growth conditions and the microfinance sector is captured through assumptions regarding the key parameters of the sector: realisation of a potential client base, size of the loans, and the number of loans per borrower. The underlying key assumption is the rate of growth of the overall economy.
• In the base case scenario, the study places the contribution of NBFC–MFIs to the overall GVA at 0.8 per cent of GVA by 2025-26 from the figure of 0.61 per cent in 2018-19.
• The ‘best case’ scenario sees a rapid expansion in the size of the NBFC–MFIs, thereby
contributing an estimated 1.01 per cent of GVA in 2025-26.
• The ‘pessimistic scenario’ points to the potential for a significant drop in the relative size of the microfinance sector, with NBFC–MFIs contributing only 0.5 per cent of the GVA.
• The contributions of the overall microfinance sector, including the backward and forward linkages, are slated to be 2.7 per cent, 3.52 per cent, and 1.54 per cent of GVA in 2025-26.
The findings point to the risk factors for the sector in the medium-term prospects as a result of lower overall economic growth. There is clearly a need for the sector to enhance its effectiveness in making the loans more productive in the borrower’s hands so that the client base can be sustained or improved, larger loans become possible, and there would be opportunities for diversification of the microfinance portfolio. The role of microfinance, as a support to lower-income households and small enterprises is of greater importance in a growing economy as it is in a scenario of weak growth. Monitoring the impact of lending on the borrowers and learning from it would be essential, as the prospect of households and enterprises moving to unsustainable debt positions would be an unfavourable position for the entire financial system. In this sense, the microfinance sector will need the flexibility to address the changing overall conditions both to contribute to the growth of the economy and also meet the credit needs of the lower-income households and small enterprises.
The challenges posed by the present times cannot be overlooked. The loss of economic output, jobs and lives seen under the COVID-19 pandemic has been unprecedented and far more severe than the ‘pessimistic scenario’ considered in the present analysis. The crisis has highlighted the vulnerabilities of micro-enterprises and migrant workers, in particular. The economic recovery, now unfolding gradually, has to take into consideration the scenarios for these vulnerable groups, and microfinance has a critical role to play in that. In the present conditions, the microfinance sector will need to complement the efforts aimed at providing relief to the borrowers and the recovery efforts of the public policies, especially in supporting micro-enterprises in rural areas. Migrants who have returned to their rural homes can use this opportunity for launching new micro-enterprises in rural areas as they also bring with them different skill sets that may be relevant for such enterprises. Lastly, microfinance can also play a significant role in promoting the sustainable use of natural resources by supporting choices that complement the conservation of natural resources.
Page | 1
Chapter 1. Microfinance and Inclusive Development
1.1 The Backdrop While India’s GDP, a measure of the national economic output in constant prices, doubled over the two decades of the 1960s and 1970s, it doubled again in the next two decades, implying a similar pace of growth over the two periods. Then, it more than tripled during the next twenty years, that is, the first two decades of the twenty-first century. As India’s per capita GDP doubled in current prices from about US$ 1,000 in 2000 to US$ 2,000 in 2019, its GDP rose from slightly less than 0.5 trillion dollars in 2000 to 2.7 trillion dollars in 2018. This fast pace of growth brought with it many benefits but it also highlighted the need for much more to be done to sustain the growth momentum and to do what growth alone cannot do and cannot do quickly enough. For instance, during the period 2004-05 to 2011-12, when economic growth took place at a high pace, the elasticity of poverty reduction with respect to economic growth was not impressive relative to other middle-income countries, though it was steadily improving (Chatterjee et al, 2016).1 The COVID-19 pandemic has brought to the fore the vulnerabilities of a significant proportion of the population with respect to employment and income shocks, and the need for robust safety nets in terms of not only economic support but also basic health care needs. Closing the gap of the unfinished ‘development agenda’ of elimination of poverty, meeting the basic needs of nutrition, health, education and shelter for the entire population remains a significant public policy challenge. India’s population of over 138 crore today is nearly 100 crore more than what it was in 1950. At the global level, India’s status of development, as measured by the UNDP’s Human Development Index, has improved relative to the performance of the other countries, but only marginally, from a rank of 130 in 2013 to 129 in 2018, and slipping again to 131 in 2019.2 In comparison, in 2019, China ranked 85th and Sri Lanka 72nd, with China holding on to its position in 2018 and Sri Lanka dropping by only one rank. The UNDP’s Human Development Report 2019 points to the urgent need for addressing rising ‘inequality’, particularly as it relates to human development indicators. Inclusive economic growth is an important goal which supports the forces that can also weaken the adverse effects of rising inequality. This is especially true for India, where the need to protect the gains already made is as important as the need to achieve further progress.
1.2 Access to Finance and Development The role of access to finance in achieving economic growth and development has long been recognised. Demirgüç-Kunt et al. (2008)3 note that financial inclusion is the absence of price and non-price barriers, like market imperfections, in the use of financial services. Access to credit enables poor households to invest in their education or entrepreneurial initiatives, and climb out of poverty. Thus, financial inclusion, growth, and income mobility are closely interlinked in terms of their evolution. In India, the new initiatives and opportunities that have emerged in the area of financial inclusion have established a widely spread financial infrastructure across the country. Bank accounts and digital payments have become common. The Global Findex 2017 notes that 80 per cent of India’s adults own a bank account, the same proportion as in China, and higher than those in Brazil or
1 Chatterjee, U., R. Murgai, A. Narayan, and M. Rama (2016), Pathways to Reducing Poverty and Sharing Prosperity in India, Lessons from the Last Two Decades, Washington, D.C.: The World Bank Group, 2 The ranking in 2019 refers to the HDR of 2020. 3 Demirgüç-Kunt, Asli, Thorsten Beck, and Patrick Honohan. (2008). “Finance for All? Policies and Pitfalls in Expanding Access”. Washington, D.C.: World Bank.
Page | 2
South Africa. The phenomenal rise in banking account ownership in India has been made possible by the adoption of biometric identification of individuals, zero balance bank accounts (Pradhan Mantri Jan Dhan Yojana), expansion of mobile telephony, and the IT-supported communication network of the banks. A key advantage brought about by the expansion in banking services and adoption of digital payments is the ability of the governments to transfer cash payments, including subsidies, transfers, or salaries through this infrastructure speedily and in a targeted fashion. The banking accounts and other forms of financial services establish an enabling condition for efficient financial transactions. The actual usage of the bank accounts for transactions is the real evidence of financial inclusion. As the mobilisation of household savings to meet the rising demand for investment funds at the national level caught early attention in development strategies, attempts to efficiently meet the financial needs of the ‘underserved’ and ‘unserved’ also followed quickly. This was demonstrated by the push for a cooperative movement to provide credit to agriculture. Credit through the formal financial sector was scarce, expensive, and rationed across sectors, with subsidies provided to many sectors. The rural part of the economy, particularly rural poor, have been historically disadvantaged with respect to access to many of the infrastructure services, including financial services, and this is where the idea of microfinance became a powerful instrument to meet the credit needs of the low-income households. Microfinance refers to a variety of financial services, including savings, credit, and other commercial services provided to the poor and in small amounts. The clients for microfinance are individuals or groups of individuals, and small enterprises, located mainly in the rural areas. Microfinance has also focused on women as clients. Microfinance Institutions (MFIs) essentially serve to fuel micro-businesses and provide loans to the low-income, self-employed, or informally employed individuals, who have limited access to the traditional commercial banking services, such as credit, savings, and insurance products that might lead to increased investment activities. Thus, these institutions play an important part in bridging the gap between the formal financial organisations and the poor. Globally, the spectrum of providers of microfinance services is very wide, comprising the Non-Governmental Organisations (NGOs) such as Grameen Banks, bank-linked Self-Help Groups (SHGs), Non-Banking Financial Institutions (NBFIs), different Government agencies, cooperative banks, and some commercial banks with specialised programmes financing the needs of low-income individuals, such as the Mexican Compartamos (the largest Mexican Microfinance Bank in Latin America). During the first half of the first decade of this century, most of the MFIs in India were non-profit organisations except some, and Non-Banking Financial Companies (NBFCs) in particular, which were for profit, apart from those falling under Section 25 of the Companies Act (Reddy, 2011).4 As of now, most of the 182 such institutions are NBFC-MFIs.5 In a recent speech, M.K. Jain, Deputy Governor, Reserve Bank of India, in his keynote address,6 notes that MFIs constitute an important channel for enhancing financial inclusion in the country and providing support for national policies that target poverty reduction, facilitate empowerment of women and other vulnerable groups, and improve standards of living. In the next phase, India will reap the benefits of the demographic dividend, with a huge and growing working age population, aspiring to move up in the world. MFIs can play a big role in meeting the financial needs of this population and in generating a virtuous cycle of growth.
4 Reddy, Y.V. (2011). “Microfinance Industry in India: Some Thoughts”, Economic and Political Weekly, XLVI(41). October 8. 5 Source: MFIN Micrometer, Issue 36. 6 https://www.rbi.org.in/Scripts/BS_SpeechesView.aspx?Id=1088
Page | 3
1.3 Microfinance as the Key to Inclusive Growth Financial inclusion is a key enabler of various steps to achieve the Sustainable Development Goals (SDGs). While it is not a universal solution for all development problems, it works as a catalyst for inclusive economic growth and empowerment of the vulnerable. Microfinance, in particular, is a driver of financial inclusion and directly addresses SDG 1 (No poverty), SDG 5 (Gender equality), and SDG 8 (Decent work and economic growth). SDG 1 aims to end poverty in all its forms everywhere, with a particular focus on extreme poverty, defined as living on less than $1.25 a day. Extreme poverty often comes in the form of poverty traps, a situation where poverty persists because the initial level of income is too low to generate growth through productive activities. Banerjee et al. (2019)7 explore whether microcredit can enable poor households to escape from such traps and find this to be true for talented but low-wealth entrepreneurs, who were already running a business before the advent of microfinance. In such cases, microfinance can have transformative effects on people living in extreme poverty. One of the aims of SDG 5 is to provide women equal access to financial services to promote women’s empowerment. As per the Microfinance Barometer 2019,8 globally, around 140 million borrowers benefited from the services of MFIs in 2018, out of which around 80 per cent were women, as has been the case over the last decade. The success stories of the female clients of MFIs, point to the channels by which microfinance has made it possible for many women to move past life-altering hardships into entrepreneurship and empowerment. The disbursement of initial loans on faith without a collateral or fixed income source, and the possibility of repeated borrowing, have made it possible for these women to meet their other pressing needs and build on their livelihood sources. These compelling needs range from medical expenses to recovering from livelihood shocks and starting afresh on an opportunity to start or run an enterprise. The loans they needed were generally of small amounts and the possibility of access to credit made a difference to their life choices. SDG 8 seeks to “encourage formalization and growth of micro-, small- and medium-sized enterprises including through access to financial services” in order to promote sustained, inclusive and sustainable economic growth and microfinance clearly has a big role to play here. As per Ahlin and Jiang (2008),9 microfinance removes barriers in access to credit and expands the occupational choices of poor households engaged in unproductive subsistence work to include self-employment. The authors show that if MFIs are committed towards graduating their borrowers toward larger undertakings through a higher savings rate, it can then lead to economic development. It is also worth examining the role of microfinance in promoting SDG 12 (Ensure sustainable consumption and production patterns) and SDG 13 (Take urgent action to combat climate change and its impacts), both of which are related to the protection of the environment. ‘Green
7 Banerjee, A., E. Breza, E. Duflo, and C. Kinnan. (2019). “Can Microfinance Unlock a Poverty Trap for Some Entrepreneurs?” NBER Working Paper No. 26346, Cambridge, Massachusetts: National Bureau of Economic Research. 8 Stephens, B. and M Khemar. (2019). “Key Figures of Financial Inclusion in the World”, 10th Microfinance Barometer. https://www.convergences.org/wp-content/uploads/2019/09/Microfinance-Barometer-2019_web-1.pdf 9 Ahlin, C. and N. Jiang. (2008). “Can Micro-credit Bring Development?”, Journal of Development Economics, 86(1): 1-21.
Page | 4
microfinance’ is possible through the following channels (Allet and Hudon 2013):10 a) having an internal environmental policy and reducing its own ecological footprints through management of its transport, waste, etc.; b) financing green activities/projects like recycling, composting, clean technologies, etc., and monitoring the environmental risks of their clients’ activities; and c) implementing non-financial services such as raising awareness, and providing training or customer support. Microfinance is, therefore, potentially a key component of the strategy for inclusive economic growth. The reliance on the ‘trickle-down’ of growth benefits to the lower income groups may not be adequate without strengthening the capabilities of the lower income groups to benefit from new opportunities of income growth. Mechanisms like microfinance can accelerate the progress of the population that is at the bottom of the income spectrum in a sustained manner and to build the resilience of this population in the face of external shocks. Finally, it needs to be recognised that though microfinance programmes are potentially an important force for alleviating poverty, they can effectively achieve this goal only when other conditions such as the market for the produce of micro-enterprises and opportunities for skill development for the poor are also available.
1.4 About the Study The growing reach of microfinance and its crucial role in enabling inclusive growth have led to a significant body of research in assessing the impact of microfinance in meeting these goals. However, contribution of the sector in the context of India’s macroeconomy and how trajectories of the growth of the macroeconomy and microfinance are inter-related have not been addressed. This study aims to assess the macroeconomic dimensions of the sector in terms of its contribution to the GDP and employment generation through direct and indirect linkages with other sectors of the economy. The study also examines the inter-relationship of macroeconomy and performance of the microfinance sector through alternative medium term scenarios. The study has been commissioned by the Microfinance Institutions Network (MFIN) and uses the NBFC-MFI operations as the anchor for this assessment, based on which, it also projects the contribution of the sector as a whole. The remaining chapters in the study provide a brief profile of the microfinance sector, describe the methodology adopted to assess the contribution of the sector to the macroeconomy, and report the findings of the research.
10 Allet, Marion and Marek Hudon. (2013). “Green Microfinance: Characteristics of Microfinance Institutions Involved in Environmental Management”, Journal of Business Ethics, 126: 396-414.
Page | 5
Chapter 2. NBFC-MFIs and India’s Financial Inclusion Landscape
2.1 Microfinance and Financial Inclusion The range and scale of microfinance can be viewed from both the perspectives of the supply side or the lenders of services and the demand side or the borrowers. While the informal sector lenders are mainly the moneylenders, friends, and relatives or merchants or units at the upper end of supply chains who purchase output or produce from enterprises, who may also be in the informal sector, remain significant, the reforms in the financial sector, including the launching of the Jan Dhan Yojana, Aadhaar Identification and Mobile telephony (JAM) strategy are aimed at moving financial transactions to the formal financial sector. The microfinance sector essentially brings credit to the low-income households and in the process, deepens the impact of financial inclusion by enabling the borrowing households to use the formal banking sector. In this chapter, we examine that aspect of financial inclusion which delineates the extent to which microfinance serves the economy.
2.2 The Microfinance Landscape and NBFC-MFIs Microfinance covers a range of financial services for the poor. A distinguishing feature of these services is that the transactions with clients involving credit or other services, are undertaken in small volumes. In addition, the borrowers of microfinance are mainly women. In March 2020, there were 5.89 crore microfinance borrowers from a wide range of microfinance lenders, including NBFC-MFIs, NBFCs, banks, Small Finance Banks (SFBs), and others, such as non-profit entities. The transformation within the sector is illustrated by the changes: Bandhan Bank and eight SFBs have graduated from their earlier NBFC-MFI status to becoming banks now. The NBFC-MFIs alone accounted for 2.56 crore borrowers. In addition, the total number of bank-linked SHGs was 1 crore in 2019, with 12 crore members. The scale of microfinance in terms of the number of clients served is, therefore, massive. Their success lies not only in providing credit support to a large section of the population at the lower income spectrum, but also its impact in terms of expanding financial inclusion, and financial literacy is also an important gain to the society at large. The NBFC-MFIs have shown a compound annual growth rate of 19.3 per cent between March 31, 2013 and March 31, 2020, in their Gross Loan Portfolio, which grew from Rs 21,511 crore in March 31, 2013, to Rs 73,792 crore in March 31, 2020. On the supply side, the NBFC-MFIs have become the second largest formal source of microfinance credit despite the graduation of nine NBFC-MFIs as banks. The relative position of various MFIs in terms of the loans disbursed in 2019-20 is illustrated in Figure 2.1. Banks constituted the largest micro-lenders in the microfinance segment in 2019-20, followed by NBFC-MFIs among the lenders other than bank-linked SHGs. There has been a churning in this sector as some of the NBFC-MFIs have become banks or SFBs, or merged with the banks in the recent years. For instance, in 2018-19, NBFC-MFIs were the largest lenders among the major institutions in microfinance. Thus, besides their dominant role as suppliers of overall credit to households, they are also an important player in the microfinance segment.

Page | 6
Figure 2.1. The Formal Microfinance Sector: Loan Disbursals in 2019-20 (Rs 1,000 crore)
Source: MFIN and for SHGs—Status of Microfinance in India, 2019-20, Report by NABARD.
By another measure of the size of the sector, NBFC-MFIs account for 22 per cent of the total outstanding loans (Gross Loan Portfolio, GLP) of the microfinance sector (including SHGs) (Figure 2.2). The outstanding loans of NBFC-MFIs amounted to Rs 74,000 crore by the end of March 2020, with a share of 22 per cent in the total GLP, whereas SHGs and banks accounted for 32 per cent and 27 per cent of the total outstanding loan amounts, respectively, by the end of March 2020.
Figure 2.2. Gross Loan Portfolio at the End of March 2020 (Rs 1000 crore, %)
Source: MFIN and for SHG-Status of Microfinance in India, 2019-20, Report by NABARD.
An evaluation study on the microfinance movement in India11 observed that the movement, which originated back in the 1970s, instituted by the combined endeavour of the NGOs, the Community-Based Organisations (CBOs), and the Self Employed Women’s Association (SEWA), aimed at alleviating poverty and enabling the poor and the underprivileged to access financial services, thus
11 NABARD. (2010). “Microfinance Movement of Micro-enterprises: An Impact Evaluation of the Self Help Groups”, Mumbai: Department of Economic Analysis and Research, National Bank for Agriculture and Rural Development.
76103
3717
2
78
314
NBFC_MFIs Banks SFBs NBFCs Others SHGs All segments
NBFC_MFIs, 74, 22%
Banks, 92, 27%
SFBs, 41, 12%
NBFCs, 23, 6%
Others, 2, 1%
SHGs, 108, 32%
Page | 7
facilitating income generation. Over the years, the movement has gained prominence in India and throughout the world. One of the biggest microfinance interventions in the world—the SHG-Bank Linkage Programme, launched at the initiative of the National Bank for Agriculture and Rural Development (NABARD), started in 1992.12 As per the Reserve Bank of India (RBI) guidelines, SHGs comprise a registered or an unregistered group of people, who are mainly micro-entrepreneurs with similar socio-economic backgrounds. Their objective is to reduce poverty and enable the poor to access financial services and assist them in income-generating activities, which is done by making regular savings contributions to a common fund and mobilising it among the group members to meet emergency needs (Karimzadeh, Nimatinia, and Karimzadeh, 2011).13 Parallel to the SHG model of microfinance, many donor funded NGOs started group-based savings and credit activities based on JLG-Grameen model. As the microfinance work was taken up by the existing NGOs working in a range of developmental areas, the microfinance component was an add-on to the existing work. Over a period of time, NGOs either created a separate vertical or adopted microfinance as the main activity. Plus, they also reduced their dependence on donor funds. By middle of the first decade of this century, the transformation to NBFC-MFIs started – guided by having an appropriate legal form, ability to scale and mainstreaming of funding. As of now, the process is complete with NBFC-MFIs being one of the dominant players in the JLG framework. The fact that a low-income household is unable to pledge collateral security to the lenders at the time of borrowing advances the problem of information asymmetries. To overcome this, one of the microcredit lending techniques adopted is ‘group lending’, wherein a group of borrowers shares the liability for the repayment of loans. A Joint Liability Group (JLG) is a credit oriented group formed with the objective of availing of loans from banks or formal credit institutions. A JLG replaces physical collateral with social collateral (Beck, 2015).14 It functions both as an insurance mechanism as well as a screening and monitoring instrument. The significance of the role played by the JLGs is also voiced in Sane and Thomas (2013) 15, where it is pointed out that lending to households in India is based on three approaches—lending based on collateral, on a stable income stream, and on future business prospects. High-income countries use a fourth technique, which is yet to play a part in India. It is the “risk assessment by lenders using credit scoring models backed by credit bureaus which track defaults and give households a strong incentive to repay loans”.16 Low-income households have faced unique challenges to all the techniques mentioned here, and these challenges pose hard constraints on advancing financial inclusion. The changes first took place in the 1980s in India, when the SHG model was used by the banks and the JLG model by NGOs–MFIs, to address the challenges of lending to the poor households without credible collateral.
12 Reddy, Amarender and Dharm Pal Malik. (2011). “A Review of SHG-Bank Linkage Programme in India”, Indian Journal of Industrial Economics and Development, 7(2): 1-10. 13 Karimzadeh, M., G. Nimatinia, and M. Karimzadeh. (2011). “Role of Self Help Groups through Micro-finance for Poverty Alleviation and Micro-Entrepreneurship of Women”, Conference on Inclusive Growth and Microfinance Access, Banaras Hindu University, January. 14 Beck, T. (2015). “Microfinance: A Critical Literature Survey”, IEG Working Paper 2015/4. Washington, D.C.: World Bank Group. 15 Sane, R. and S. Thomas, (2013). “Regulating Microfinance Institutions”, Economic and Political Weekly, XLVIII(5), February 2. 16 We now indeed have credit bureaus such as Equifax and CRIF performing the same services as in other countries.

Page | 8
The rise of the NBFC-MFIs during the period following the crisis the microfinance sector faced in India in 2010 (Mader 2013), has been made possible by a policy framework established by the Reserve Bank of India (RBI) to achieve an orderly development of the sector.17 The framework was recommended by an expert committee, known by its chairperson, Malegam Committee, appointed by the RBI in November 2010, which submitted its report in January 2011. 18 Recognising the need for expanding access to credit for the more vulnerable sections of the society, the committee laid out a number of recommendations that provided both opportunities for growth for the NBFCs engaged in microfinance lending and at the same time protected borrowers from the risks of excessive and unsustainable levels of borrowing. A new category of NBFC-MFIs was created in December 2011 and over a period of time, all the NBFCs active in microfinance became registered as NBFC-MFIs. The NBFC-MFIs have adopted the JLG model. Scalability, lower non-performing assets (NPAs), and joint liability, which reduced default risks appear to have led the adoption of the JLG model by the NBFC-MFIs (PwC and SIDBI, 2019).19 Together these made it commercially viable to service the increasing customer base of NBFC-MFIs.
2.3 Income Generation by Microfinance The requirement of credit for business—in agricultural or non-agricultural enterprises, small or big, rural or urban—has been widely recognised. Whether it is for setting up production capacity or operations, credit becomes essential, given the lags between expenditure and revenues. That is also true for households, when expenses are lumpy in nature, and the income streams and expenses are not aligned with one another, with income lagging behind the expenditure. There is limited information on the distribution of microfinance loans across productive activities. Although there are a few micro level studies20 providing the break-up of the loans availed of by borrowers for the purpose of loans, information on the overall picture is limited. The Annual Report of MFIN for 2019-20 provides a break-up of the Gross Loan Portfolio into agriculture and allied activities (56 per cent), non-agriculture (41 per cent), and household finance (3 per cent). The share of agriculture and allied activities was lower in 2017-18 at 50 per cent, while that of non-agriculture stood at 46 per cent. There is no such break-up of the allocation of credit by purpose for the microfinance sector, as a whole, which also includes SHG finance. The demand for loans is expected to be in activities that provide a relatively continuous stream of income to facilitate the repayment of small loans at shorter intervals. In this sense, even in the agricultural and allied sectors, loans are likely to be in the livestock sector for the purchase of livestock or inputs for production and marketing. But a further break-up of the purpose of loans is not available. We examine other available data at the aggregate level to understand the use of microfinance, particularly for ‘income-generating’ activities.
17 Mader, P. (2013). “Rise and Fall of Microfinance in India”. Strategic Change. 22: 47-63, February. 18 RBI website. https://www.rbi.org.in/Scripts/BS_ViewMasCirculardetails.aspx?id=9827#II. 19 PWC and SIDBI. (2019). Vision of Microfinance in India. https://www.pwc.in/research-insights/2020/vision-of-microfinance-in-india.html. 20 Micro-Credit Ratings International Limited. (2015). “Enterprise Survey 2014, Hand in Hand: India Group’s Contribution to Enterprise Promotion and Supporting Jobs”, Gurgaon.
Page | 9
2.3.1 The NAFIS Survey by NABARD The NAFIS 2017 (NABARD All India Rural Financial Inclusion Survey) conducted in 2015-16, covering rural households, throws some light on the purpose for which the rural households borrowed. The ‘sundry household needs’ were the most commonly cited need (25 per cent) for which the loans were taken; housing purposes account for 16 per cent of the loans, whereas 15 per cent of the loans were for medical purposes and 5 per cent for education. Thus, 61 per cent of the borrowing by the households was for meeting current household needs. The remaining 39 per cent of loans were sought for operational or capital expenditure towards agricultural and non- agricultural enterprises. These estimates relate to borrowing by the rural households from all sources. One indication of the size of the enterprise sector in the rural areas is the share of income derived from such enterprises. The NAFIS 2017 results show that 43 per cent of the rural household income originates from wage earnings, 24 per cent from salaried jobs (government or private), 23 per cent from crop cultivation and livestock rearing, only 8 per cent from enterprises, and the rest 2 per cent from other sources. Thus, the share of rural enterprises in generating household income appears to be small. However, the survey also reveals that that about 10 per cent of rural households are engaged in trading or shop-keeping, whereas the number of households running small and bigger enterprises is less than 2 per cent. The range of micro-enterprises in the rural areas appears to be dominated by the trading enterprises. The survey, however, does not provide estimates for the credit obtained by the households through microfinance by purpose. 2.3.2 The MSME Survey by the NSSO The National Sample Survey Organisation (NSSO) conducted a survey on Unincorporated Non-Agricultural Enterprises (Excluding Construction) in the 73rd Round of NSS during the period July 2015 to June 2016, throughout the country, a year prior to the NABARD survey. The NSS survey includes three sectors, viz., Manufacturing, Trade, and Other Services (excluding construction). A majority (99.5 per cent) of the enterprises in the NSSO Survey 2015-16 are micro-enterprises. Overall, the number of unincorporated non-agricultural enterprises excluding construction (UIMSMEs)21 was estimated to be 6.34 crore at the all-India level. Among these enterprises, 31 per cent were engaged in manufacturing, 36 per cent in trading, and 33 per cent in the services sector. A review of the findings of the survey highlights the relatively weak penetration of formal sector finance in this sector. We discuss the use of microfinance in different income-generating activities of the borrowers in the remaining sections of this chapter. 2.3.3 Agriculture and Allied Activities and Microfinance In the case of NBFC-MFIs, the purpose of credit for agricultural and allied sector activities has been reported to be predominant. Credit to buy livestock animals, small farm implements or machinery or small enterprises would be served more efficiently by microfinance. In the case of crop agriculture being undertaken by farmers with very small holdings, the production and marketing of short-duration crops such as horticulture crops may benefit from microfinance. However, for
21 The unincorporated enterprises were classified in the NSSO report into micro, small, and medium enterprises, or MSMEs. Although the entire sample mainly comprised micro-enterprises, to reflect the general dimension of MSMEs, we are using the acronym UIMSMEs in this discussion.
Page | 10
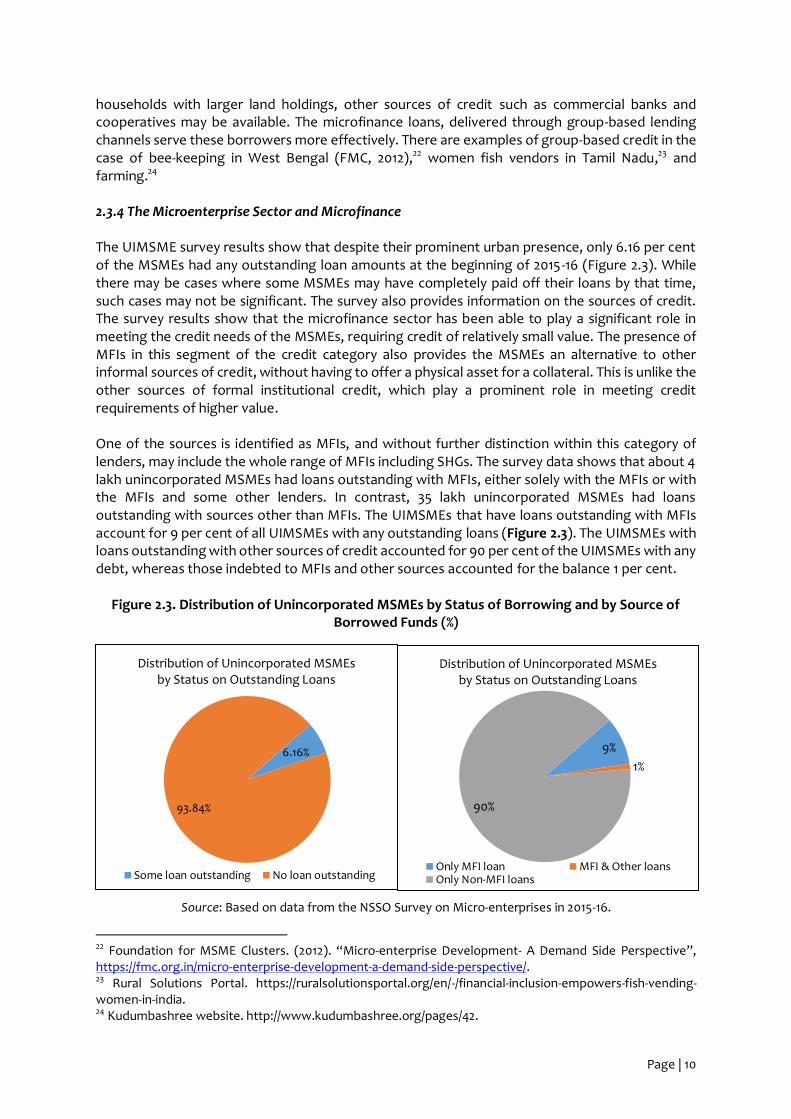
households with larger land holdings, other sources of credit such as commercial banks and cooperatives may be available. The microfinance loans, delivered through group-based lending channels serve these borrowers more effectively. There are examples of group-based credit in the case of bee-keeping in West Bengal (FMC, 2012),22 women fish vendors in Tamil Nadu,23 and farming.24 2.3.4 The Microenterprise Sector and Microfinance The UIMSME survey results show that despite their prominent urban presence, only 6.16 per cent of the MSMEs had any outstanding loan amounts at the beginning of 2015-16 (Figure 2.3). While there may be cases where some MSMEs may have completely paid off their loans by that time, such cases may not be significant. The survey also provides information on the sources of credit. The survey results show that the microfinance sector has been able to play a significant role in meeting the credit needs of the MSMEs, requiring credit of relatively small value. The presence of MFIs in this segment of the credit category also provides the MSMEs an alternative to other informal sources of credit, without having to offer a physical asset for a collateral. This is unlike the other sources of formal institutional credit, which play a prominent role in meeting credit requirements of higher value. One of the sources is identified as MFIs, and without further distinction within this category of lenders, may include the whole range of MFIs including SHGs. The survey data shows that about 4 lakh unincorporated MSMEs had loans outstanding with MFIs, either solely with the MFIs or with the MFIs and some other lenders. In contrast, 35 lakh unincorporated MSMEs had loans outstanding with sources other than MFIs. The UIMSMEs that have loans outstanding with MFIs account for 9 per cent of all UIMSMEs with any outstanding loans (Figure 2.3). The UIMSMEs with loans outstanding with other sources of credit accounted for 90 per cent of the UIMSMEs with any debt, whereas those indebted to MFIs and other sources accounted for the balance 1 per cent.
Figure 2.3. Distribution of Unincorporated MSMEs by Status of Borrowing and by Source of Borrowed Funds (%)
Source: Based on data from the NSSO Survey on Micro-enterprises in 2015-16.
22 Foundation for MSME Clusters. (2012). “Micro-enterprise Development- A Demand Side Perspective”, https://fmc.org.in/micro-enterprise-development-a-demand-side-perspective/. 23 Rural Solutions Portal. https://ruralsolutionsportal.org/en/-/financial-inclusion-empowers-fish-vending-women-in-india. 24 Kudumbashree website. http://www.kudumbashree.org/pages/42.
6.16%
93.84%
Distribution of Unincorporated MSMEs by Status on Outstanding Loans
Some loan outstanding No loan outstanding
9%
1%
90%
Distribution of Unincorporated MSMEs by Status on Outstanding Loans
Only MFI loan MFI & Other loansOnly Non-MFI loans
Page | 11
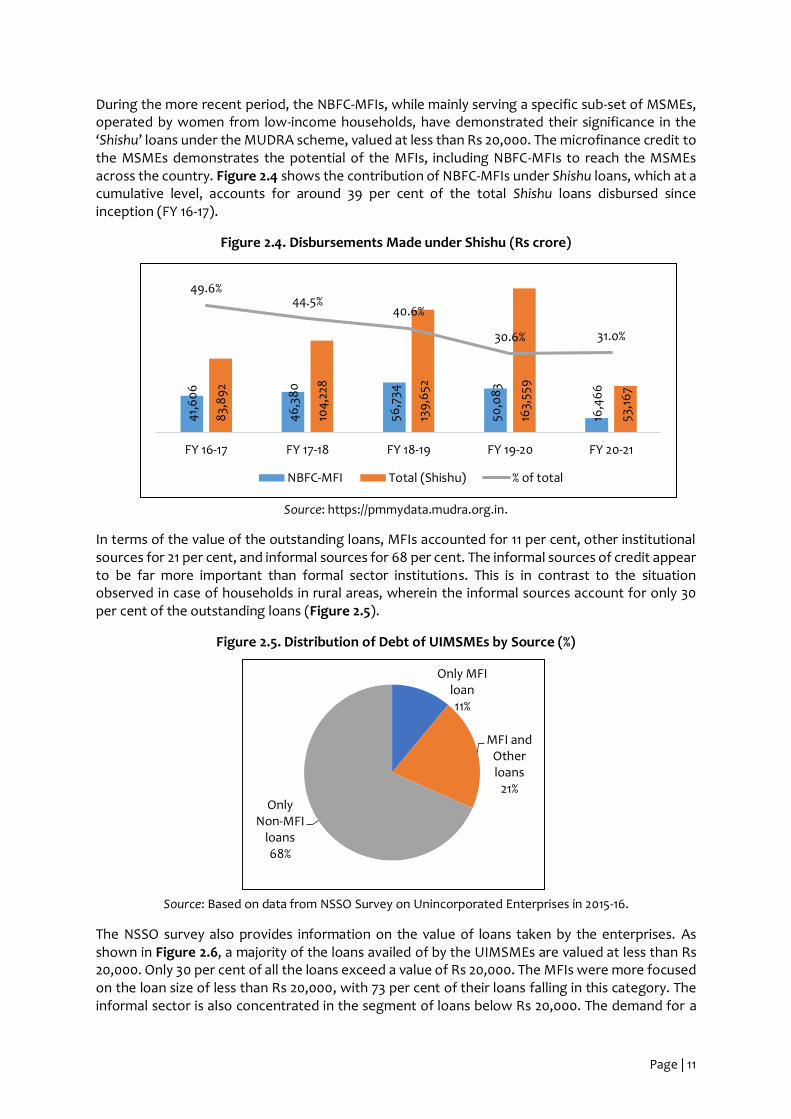
During the more recent period, the NBFC-MFIs, while mainly serving a specific sub-set of MSMEs, operated by women from low-income households, have demonstrated their significance in the ‘Shishu’ loans under the MUDRA scheme, valued at less than Rs 20,000. The microfinance credit to the MSMEs demonstrates the potential of the MFIs, including NBFC-MFIs to reach the MSMEs across the country. Figure 2.4 shows the contribution of NBFC-MFIs under Shishu loans, which at a cumulative level, accounts for around 39 per cent of the total Shishu loans disbursed since inception (FY 16-17).
Figure 2.4. Disbursements Made under Shishu (Rs crore)
Source: https://pmmydata.mudra.org.in.
In terms of the value of the outstanding loans, MFIs accounted for 11 per cent, other institutional sources for 21 per cent, and informal sources for 68 per cent. The informal sources of credit appear to be far more important than formal sector institutions. This is in contrast to the situation observed in case of households in rural areas, wherein the informal sources account for only 30 per cent of the outstanding loans (Figure 2.5).
Figure 2.5. Distribution of Debt of UIMSMEs by Source (%)
Source: Based on data from NSSO Survey on Unincorporated Enterprises in 2015-16.
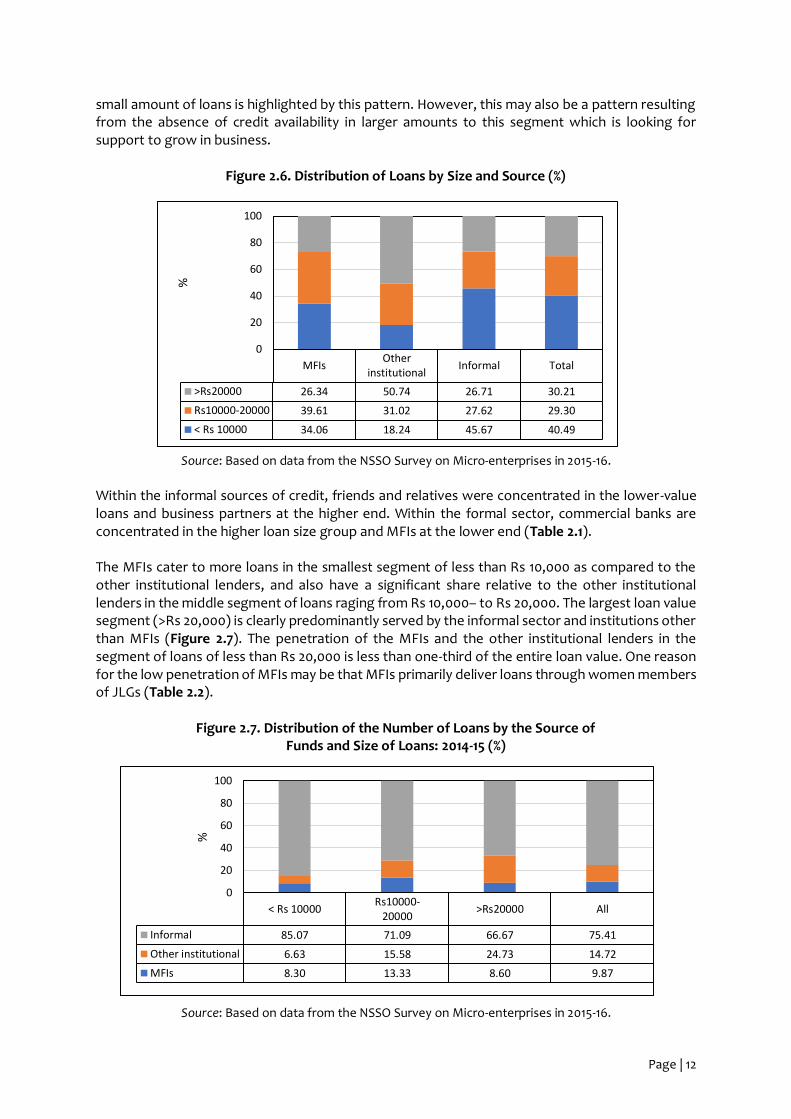
The NSSO survey also provides information on the value of loans taken by the enterprises. As shown in Figure 2.6, a majority of the loans availed of by the UIMSMEs are valued at less than Rs 20,000. Only 30 per cent of all the loans exceed a value of Rs 20,000. The MFIs were more focused on the loan size of less than Rs 20,000, with 73 per cent of their loans falling in this category. The informal sector is also concentrated in the segment of loans below Rs 20,000. The demand for a
41,
60
6
46
,38
0
56,7
34
50,0
83
16,4
66
83,
89
2
104
,228
139
,652
163,
559
53,1
67
49.6%44.5%
40.6%
30.6% 31.0%
FY 16-17 FY 17-18 FY 18-19 FY 19-20 FY 20-21
NBFC-MFI Total (Shishu) % of total
Only MFI loan11%
MFI and Other loans
21%Only
Non-MFI loans68%
Page | 12
small amount of loans is highlighted by this pattern. However, this may also be a pattern resulting from the absence of credit availability in larger amounts to this segment which is looking for support to grow in business.
Figure 2.6. Distribution of Loans by Size and Source (%)
Source: Based on data from the NSSO Survey on Micro-enterprises in 2015-16.
Within the informal sources of credit, friends and relatives were concentrated in the lower-value loans and business partners at the higher end. Within the formal sector, commercial banks are concentrated in the higher loan size group and MFIs at the lower end (Table 2.1). The MFIs cater to more loans in the smallest segment of less than Rs 10,000 as compared to the other institutional lenders, and also have a significant share relative to the other institutional lenders in the middle segment of loans raging from Rs 10,000– to Rs 20,000. The largest loan value segment (>Rs 20,000) is clearly predominantly served by the informal sector and institutions other than MFIs (Figure 2.7). The penetration of the MFIs and the other institutional lenders in the segment of loans of less than Rs 20,000 is less than one-third of the entire loan value. One reason for the low penetration of MFIs may be that MFIs primarily deliver loans through women members of JLGs (Table 2.2).
Figure 2.7. Distribution of the Number of Loans by the Source of Funds and Size of Loans: 2014-15 (%)
Source: Based on data from the NSSO Survey on Micro-enterprises in 2015-16.
MFIsOther
institutionalInformal Total
>Rs20000 26.34 50.74 26.71 30.21
Rs10000-20000 39.61 31.02 27.62 29.30
< Rs 10000 34.06 18.24 45.67 40.49
0
20
40
60
80
100
%
< Rs 10000Rs10000-
20000>Rs20000 All
Informal 85.07 71.09 66.67 75.41
Other institutional 6.63 15.58 24.73 14.72
MFIs 8.30 13.33 8.60 9.87
0
20
40
60
80
100
%
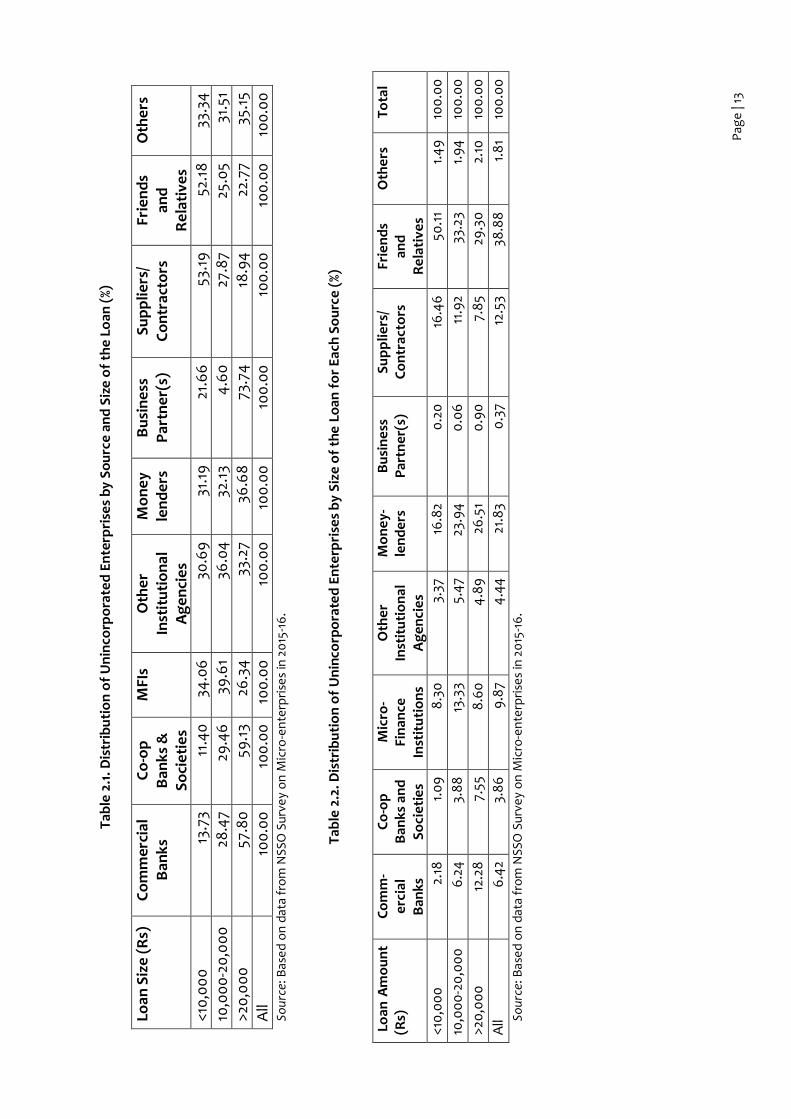
Pag
e |
13
Tab
le 2
.1. D
istr
ibu
tio
n o
f U
nin
corp
ora
ted
En
terp
rise
s b
y S
ou
rce
and
Siz
e o
f th
e Lo
an (
%)
Loan
Siz
e (
Rs)
C
om
me
rcia
l B
ank
s C
o-o
p
Ban
ks
&
So
cie
tie
s
MFI
s O
the
r In
stit
uti
on
al
Ag
en
cie
s
Mo
ne
y le
nd
ers
B
usi
ne
ss
Par
tne
r(s)
S
up
plie
rs/
Co
ntr
acto
rs
Frie
nd
s an
d
Re
lati
ves
Oth
ers
<10
,00
0
13.7
3 11
.40
34
.06
30
.69
31
.19
21
.66
53
.19
52
.18
33
.34
10,0
00
-20
,00
0
28.4
7 29
.46
39
.61
36.0
4
32.1
3
4.6
0
27.8
7 25
.05
31
.51
>20
,00
0
57.8
0
59.1
3 26
.34
33
.27
36
.68
73
.74
18
.94
22
.77
35.1
5
All
100
.00
10
0.0
0
100
.00
10
0.0
0
100
.00
10
0.0
0
100
.00
10
0.0
0
100
.00
So
urc
e: B
ase
d o
n d
ata
fro
m N
SSO
Su
rve
y o
n M
icro
-en
terp
rise
s in
20
15-1
6.
T
able
2.2
. Dis
trib
uti
on
of
Un
inco
rpo
rate
d E
nte
rpri
ses
by
Siz
e o
f th
e L
oan
fo
r E
ach
So
urc
e (%
)
Lo
an A
mo
un
t (R
s)
Co
mm
- e
rcia
l B
anks
Co
-op
B
anks
an
d
So
cie
tie
s
Mic
ro-
Fin
ance
In
stit
uti
on
s
Oth
er
Inst
itu
tio
nal
A
ge
nci
es
Mo
ne
y-
len
de
rs
Bu
sin
ess
P
artn
er(
s)
Su
pp
liers
/ C
on
tra
cto
rs
Frie
nd
s an
d
Re
lati
ve
s
Oth
ers
T
ota
l
<10
,00
0
2.18
1.
09
8
.30
3.
37
16.8
2 0
.20
16
.46
50
.11
1.4
9
100
.00
10,0
00
-20
,00
0
6.2
4
3.8
8
13.3
3
5.4
7 23
.94
0
.06
11
.92
33.2
3
1.9
4
100
.00
>20
,00
0
12.2
8
7.55
8
.60
4
.89
26
.51
0.9
0
7.8
5
29.3
0
2.10
10
0.0
0
All
6.4
2 3.
86
9
.87
4.4
4
21.8
3 0
.37
12.5
3
38.8
8
1.8
1 10
0.0
0
Sou
rce:
Bas
ed
on
dat
a fr
om
NS
SO S
urv
ey
on
Mic
ro-e
nte
rpri
ses
in 2
015
-16
.
Page | 14
2.4 The Unmet Demand for Microfinance The microfinance sector has succeeded in expanding the reach of formal sector credit to the low-income households through women members of SHGs or JLGs. An important policy goal of microfinance in supporting livelihoods and meeting the credit needs of low-income households is improvement in the income and living conditions of the poor to overcome poverty. The supply of credit on transparent and affordable terms is critical to the success of microfinance both for its sustainability and for meeting the policy goals. The role of credit for households in bridging the lag between income flows and routine consumption needs, and meeting expenditures such as education of children or medical emergencies that may require credit for a longer duration has been long recognised. The benefits of targeting of such credit through a ‘group-based approach’ and through ‘groups of women members’ have also been recognised. While empirical studies point to mixed results regarding the performance of microfinance on outcome indicators such as poverty reduction, the need for appropriate credit products to meet the needs of low-income households and micro-enterprises cannot be ignored. The positive benefits in terms of women’s empowerment achieved by microfinance in household decisions have also been documented. Evidence from an analysis of the Economic Census of Enterprises conducted by the NCAER team for the study shows that microfinance-assisted enterprises typically employ a larger workforce and employ a larger number of female workers. The available data on household borrowing and enterprise borrowing, therefore, points to the large segment of the population and enterprises, whose diverse needs for credit are met by multiple sources, including the informal sources. The informal sources of credit, though much less prominent now than in the early 1960s and early 1970s,25 remain significant in the rural areas. The reach of microfinance across different parts of the country is also not even. In the case of micro-enterprises, the reach of formal sector credit appears limited.
Given the large livelihood risks and uncertainties facing the low-income households, whose progress would have to be at a much faster pace than others in achieving standards of living above the poverty line, their needs for reliable and affordable credit can be met only through a financial infrastructure that is accessible to them. The evolution of the microfinance sector over the last three decades fulfils the characteristics of this infrastructure, especially as it adopts the new technologies of information and communication technologies. The present COVID-19 pandemic has again drawn attention to the need for a specific financial infrastructure that can meet the credit needs of the low-income households in times of such crisis. In order to address credit supply-side issues pertaining to the small enterprises, the Government of India introduced the Pradhan Mantri Mudra Yojana (PMMY).26 This was launched on April 8, 2015, for providing loans of up to Rs 10 lakh to the non-corporate, non-farm small/micro enterprises. These loans are classified as MUDRA loans under the PMMY. These loans are given by Commercial Banks, Regional Rural Banks (RRBs), SFBs, MFIs, and NBFCs. Under the aegis of PMMY, MUDRA has created three products, namely ‘Shishu’, 'Kishore', and 'Tarun' to signify the stage of growth/development and funding needs of the beneficiary micro unit/entrepreneur and also to provide a reference point for the next phase of graduation/growth. ‘Shishu’ covers loans
25 Binswanger, H. and S.R. Khandker. (1992). “The Impact of Formal Finance on the Rural Economy of India”, Working Paper Series 949, Washington, D.C.: Agriculture and Rural Development Department, World Bank. 26 The source for this data is Micro Units Development and Refinance Agency Limited, Annual Report 2018-19. https://www.mudra.org.in/.
Page | 15
of up to Rs 50,000, ‘Kishor’ covers loans of above Rs 50,000 and up to Rs 5 lakh, and ‘Tarun’ covers loans of above Rs 5 lakh and up to Rs 10 lakh. The number of loan accounts in 2018-19 was 5,98,70,318. Out of these, 86 per cent fell under the ‘Shishu’ category, followed by ‘Kishor’ (11 per cent), and then ‘Tarun’ (3 per cent). The total sanctioned amount in 2018-19 was Rs 3.2 lakh crore, out which 44 per cent went to ‘Shishu’, 32 per cent to ‘Kishor’, and 23 per cent to ‘Tarun’. The ‘Shishu’ category of sanctioned loans showed an annual growth of 34 per cent in 2018-19, ‘Kishor’ of 20 per cent, and ‘Tarun’ of 23 per cent. The average loan size increased from Rs 52, 739 in 2017-18 to Rs 53,800 in 2018-19. If one divides the total loan amount sanctioned by the number of loan accounts, the average size of loans under ‘Shishu’ comes to Rs 27, 636, under ‘Kishor’, to Rs 1,58, 017.8, and under ‘Tarun’, to Rs 4,26,843.3. Gupta and Chaddha (2016) point out that a majority of the funding under the ‘Shishu’ category has been done by the NBFC-MFIs.27 The outreach of MFIs in India has thus been driven mainly by supply-side considerations of financial inclusion28 like geographical access, pricing, and penetration of products and services.29 The fact that MFIs have reached many of the weaker sections of society, which traditional banks have missed, is due to their innovative approach in terms of lending small amounts, repayment in regular small instalments with no physical collateral, and low transaction costs. However, the depth of outreach is also influenced by demand factors like financial needs, financial literacy, lack of information and users’ socio-economic and demographic characteristics, and it is important to keep this in mind. The Global Findex Database 201730 gives us a rough idea about the demand for credit in the country. While about 42 per cent of the adult population (aged 15 years and above) in India borrowed any money in the previous year, the proportion of adults who borrowed from financial institutions is only around 7 per cent. This implies that about 35 per cent of the adult population has financial needs that are not being met by formal sources, which highlights the huge unmet demand for credit by the formal sources in the country and which can potentially be served by the microfinance sector. For many of these adults, access to affordable credit from the sector could open up diverse livelihood possibilities and help them navigate an increasingly complex and digitised world.
27 Gupta, V. and S. Chaddha. (2016). “Role of Financial Institutions in Microfinancing”. Zenith International Journal of Business Economics and Management Research. 6(12): 12-19. 28 World Bank. 2015. “How to Measure Financial Inclusion”. Brief, February 19. https://www.worldbank.org/en/topic/financialinclusion/brief/how-to-measure-financial-inclusion. 29 https://journals.sagepub.com/doi/abs/10.1177/2319510X19883705#articlePermissionsContainer. 30 Demirgüç-Kunt, Asli, Leora Klapper, Dorothe Singer, Saniya Ansar, and Jake Hess. (2018). The Global Findex Database 2017: Measuring Financial Inclusion and the Fintech Revolution. Washington, D.C.: World Bank.
Page | 16
Chapter 3. Impact of Microfinance
3.1 The Backdrop Microfinance has a long-standing history in India. Today, the scale of microfinance in India in terms of the number of clients served is massive. The global procurement of microcredit is also driven largely by the lenders in Asia and the Pacific region, particularly in India and Bangladesh (Cull and Morduch 2017).31 Hand-in-hand with this growth in microfinance, there has developed a plethora of research on its functioning and impacts on those it serves, that is, the vulnerable communities. In this chapter, we provide a review of some of the key studies in this area with a focus on India, to understand the role of microfinance in the economy and the goals for the present study. We also present viewpoints on the directions for the sector from industry leaders.
3.2 Insights from the Literature The literature on microfinance is vast and encompasses a wide range of topics, mainly centred on the welfare of borrowers who are poor and lack access to formal sector finance. Some key studies in a few thematic areas are summarised below. 3.2.1 Poverty Reduction and Micro-enterprises One of the main themes in the literature is the impact of access to credit from MFIs on enterprise income, growth, and profits or household welfare. Bhandari and Ghosh (2014)32 analysed the role played by the MFIs in promoting micro-entrepreneurs in rural areas. The study, which was conducted on 200 rural micro-entrepreneurs in the Howrah district of West Bengal, examined the difference between the incomes earned by the rural micro-entrepreneurs borrowing from MFIs and those relying on the informal sources of finance. The analysis showed that borrowing from MFIs has greater income-enhancing effects in comparison to relying on the informal sources. Breza and Kinnan (2017)33 exhibit a positive impact of microfinance by evaluating the effect of not having access to it. The study was conducted in October 2010, during the period when an emergency ordinance was issued in Andhra Pradesh to stop the disbursal of microfinance in response to over-lending by the MFIs. The authors explored the impact on entrepreneurship, employment, and consumption of a sudden supply shock caused due to issuance of the ordinance. They found significant cuts in the daily wages of the casual workers, and a drop in the household income and the consumption levels during the period when no microfinance was available.
31 Cull, R. and J. Morduch. (2017). “Microfinance and Economic Development”. Policy Research Working Paper No. 8252, Washington, D.C.: World Bank. 32 Ghosh, S. and A.K. Bhandari. (2014). “Microfinance and Rural Entrepreneurship: An Assessment”, in A. Bhandari and A. Kundu (eds.), Microfinance, Risk-taking Behaviour and Rural Livelihood. New Delhi: Springer, https://doi.org/10.1007/978-81-322-1284-3_4. 33 Breza, Emily and Cynthia Kinnan. (2017). “Measuring the Equilibrium Impacts of Credit: Evidence from the Indian Microfinance Crisis”, Illinois, USA: Northwestern Institute for Policy Research.
Page | 17
Stewart et al. (2010)34 reviewed 13 studies conducted in Sub-Saharan Africa, and reported mixed evidence on the impact of micro-credit there. The authors revealed a positive influence of micro-credit on the clients’ asset holdings, expenditures, health, and housing, but they could not find any significant impact on the educational attainments of children. Banerjee, Karlan, and Zinman (2015)35 asserted that the impact of micro-credit is heterogeneous, with the results being influenced a lot by the characteristics of the borrowers and their differential objectives behind obtaining credit. They state that access to micro-credit might have a positive impact on business development, but that may not necessarily lead towards higher income or higher consumption. Banerjee (2013)36 reasons as to why the impact of micro-credit has been limited and heterogeneous. First, not all micro-entrepreneurs are credit-constrained and/or other binding constraints may exist within the business environment. Second, the returns from investment might take the form of an S-shaped production function, implying that the initial returns are high and increasing but they start diminishing soon after. Also, a majority are subsistence entrepreneurs with similar characteristics to those of wage workers. These entrepreneurs generally have no business expansion plans. Hsie and Klenow (2009)37 report that 90 per cent of the enterprises in India do not grow. 3.2.2 Impact on Women’s Empowerment With the focus of microfinance being mainly on women borrowers, ‘women’s empowerment’ emerges as one of the key gains from this approach, which removes barriers to the entrepreneurial choices of poor women. The evaluation study (NABARD, 2010) of microfinance, also referred to in the previous chapter,38 cites certain reasons as to why the microfinance movement has been motivated to facilitate women’s empowerment. These are as follows: (a) as often argued, since women are more caring towards their families and children, lending to female borrowers, therefore, has a greater direct impact on household welfare as compared to lending credit to the male borrowers; and (b) since women are more conservative as compared to the men in their investment decisions, they are considered to be less of a credit risk. The study further states that while certain microfinance interventions with the objective of increasing savings, are more successful for women in comparison to men, there are interventions which prove to be less of a success for women, given the intra-household constraints and other restraints holding back women. This shows that in order to be successful, the interventions have to take into account the limitations and constraints that the women face within the household.
34 Stewart, Ruth, Carina van Rooyen, Kelly Dickson, Mabolaeng Majoro, and Thea de Wet. (2010). “What Is the Impact of Microfinance on Poor People? A Systematic Review of Evidence from Sub-Saharan Africa”, London: EPPI-Centre, Social Science Research Unit, Institute of Education, University of London. 35 Banerjee, Abhijit V., Dean Karlan, and Jonathan Zinman. (2015). “Six Randomized Evaluations of Microcredit: Introduction and Further Steps”, American Economic Journal: Applied Economics, 7: 1-21. 36 Banerjee, Abhijit. (2013). “Microcredit under the Microscope: What Have We Learned in the Past Two Decades, and What Do We Need to Know?”, Annual Review of Economics, 5: 487-519. 37 Hsie, Chang-Tai and Peter J. Klenow. (2009). “Misallocation and Manufacturing TFP in China and India”, Quarterly Journal of Economics, 124: 1403-1448. 38 NABARD. (2010). “Microfinance Movement of Micro Enterprises: An Impact Evaluation of the Self Help Groups”, Mumbai: Department of Economic Analysis and Research, National Bank for Agriculture and Rural Development.
Page | 18
3.2.3 Other Benefits
Another benefit of microfinance is in enhancing the financial liquidity of the households. Collins et al. (2009)39 noted that microfinance may help households manage fluctuating income levels and financial needs arising throughout the year even if it does not help in launching businesses or increasing incomes. Microfinance may also help in consumption smoothing (Deaton, 1992)40.
The extent of research on the non-economic impact of microfinance conducted so far is less than that of research on its economic impact. Marino (2005)41 reviewed the existing studies and examined the intangible benefits of microfinance by integrating the lessons learned from the conflicts that took place in the nine countries of Asia and the Pacific region. The paper states that microfinance inspires the resolution of conflicts, political and social reconciliation, re-integration into society, and the restoration of trust and confidence.
There are other studies emphasising the non-economic benefits of microfinance, such as Heen (2004),42 which show that having greater access to credit can help in resolving conflicts at three levels, namely, direct mitigation, indirect mitigation, and process mitigation. Doyle (1998)43 states that microfinance can function as a multi-purpose device, in a post-conflict environment. First, it can help in enhancing local economic development by enabling the provision of viable financial services to the borrowers, and second, it can be an essential component towards post-conflict rehabilitation assistance. Both Sirolla (2005)44 and Larson (2001)45 emphasise the role played by microfinance in social and political reconciliation. Lynch (2003)46 emphasised the role of microfinance in reconciliation and trust-building.
3.3 Insights from Industry Experts
NCAER interviewed four industry leaders to obtain their perspectives on the microfinance sector, its role and contributions to the economy, livelihoods, and the development objectives of the country, along with their perspectives on the future trajectories of microfinance. The people who shared their views during the individual interviews included Mr Manoj Kumar Nambiar, Chairperson of the Board of MFIN and MD, Arohan Microfinance; Mr Devesh Sachdev, CEO, Fusion Microfinance Pvt Ltd; Mr Govind Singh, MD and CEO, Utkarsh Small Finance Bank; and Mr Vineet Chattree, Vice Chairperson of Board of MFIN and MD, Svatantra Microfin Pvt Ltd.
According to the industry experts, the rapid growth of the microfinance sector in the recent decade has been due to a combination of the high rates of overall economic growth and more importantly, factors that are internal to the sector. Economic growth creates new jobs while microfinance improves the lives of the economically weaker households over a period of time.
39 Collins, Daryl, Jonathan Morduch, Stuart Rutherford, and Orlanda Ruthven. (2009), Portfolios of the Poor: How the World’s Poor Live on $2 a Day. Princeton, NJ: Princeton University Press. 40 Deaton, Angus. (1992). Understanding Consumption. Oxford: Oxford University Press/Clarendon. 41 Marino, Pascal. (2005). “Beyond Economic Benefits: The Contribution of Microfinance to Post-conflict Recovery in Asia and the Pacific”, Working Paper. 42 Heen, Stacy. (2004), “The Role of Microcredit in Conflict and Displacement Mitigation: A Case Study in Cameroon”, PRAXIS: The Fletcher Journal of International Development. Vol. XIX. 43 Doyle, Karen. (1998), “Microfinance in the Wake of Conflict: Challenges and Opportunities”, Bethesda, Maryland: Microfinance Best Practices, Development Alternatives. 44 Sirolla, Armando. (2005). “Report from and Correspondence with A. Sirolla, Afghanistan Rural Micro-Credit Programme”, New Delhi: Aga Khan Development Network, January. 45 Larson, Dave. (2001). Microfinance Following Conflict, Technical Briefs, Microfinance Best Practices. 46 Lynch, Simon. (2003), “Opportunity International’s Experience in the World’s Newest Nation, Timor Leste (East Timor) Draft. Opportunity International, April.
Page | 19
The factors internal to the microfinance sector that have helped it achieve notable growth can be delineated as follows: a) Factors which improved the efficiency of the sector, like:
• Entry of leaders from the mainstream financial sector,
• Adoption of technology in the form of account-based transactions and the biometric ‘Know Your Customer (KYC) approach, and
• Use of Credit Bureaus as MFIN took the lead in catalysing Credit Bureau for microfinance in 2009;
b) Factors which increased the demand for loans from the sector, like the expansion into small cities and changes in preferences of households; and finally,
c) Factors which led to improvements in the policy environment, like, better regulation. As regards the medium-term prospects for the sector, the experts were of the view that a large base of potential clients still needs to be covered and for this, the sector has to evolve in terms of launching a greater variety of products. In the next phase, the size of loans will need to go up and there will be a need for much more diversification and use of technology. The micro-enterprise loan programme could emerge as an area of expansion for MFIs. In addition, MFIs will have a big role to play in the disbursement of medium-size loans of Rs 3–4 lakh to the ‘missing middle’, which gets overlooked by banks. Group lending may not work for all types of microfinance loans as the demand for larger loan amounts increases and individual/enterprise lending would have to grow. Next, the experts shared their views about the important challenges for growth of the sector, and overcoming these could lead to new opportunities. These challenges include: a) Factors that affect the expansion of the sector into new territories, like lack of awareness
regarding microfinance and the difficulty of monitoring lending to the urban poor; and b) Factors affecting the profitability of MFIs, like the high cost of delivery in remote places even
with the greater use of technology, the limited possibility of diversification of portfolio under the present regulatory framework, and natural disasters or local disturbances affecting livelihoods and disrupting repayments.
Some initiatives that could help MFIs would be flexible and realistic pricing as per regulation; asset class-based regulation (in February 2020 RBI indicated moving towards this), allowing even NBFCs access to Aadhaar-based e-KYC; deepening of the digital ecosystem and policy support for instilling credit discipline among borrowers; and initiatives on skill development for enterprises to increase their viability. Finally, as per the experts, following are the impacts of the sector in terms of its broad contribution to key development goals: a) It has helped in empowering women by providing credit in the hands of women who may
invest in their children and other developmental actions, by enabling women to start banking, and by making women more financially aware and literate;
b) It has supported the growth of MSMEs, by guiding/hand-holding them in two ways—providing information about government schemes for MSMEs that they can avail of, and providing technology and accounting services; and
c) It is possible for MFIs to have a positive impact on the delivery of welfare programmes such as providing insurance to people in remote areas, as they go to the doorstep of these people to provide their services. They can also offer a concierge of other public financial services at the same time. However, providing these services entails a cost.
Page | 20
3.4 The Research Gaps and the Focus of the Present Study As seen in Section 1, the literature on the impacts of microfinance is largely concentrated around microeconomic studies. The studies we have reviewed highlight the impact of microfinance on poverty alleviation, on household income and consumption levels of the poor, on entrepreneurial profits, on women’s empowerment, and other non-economic benefits, namely, conflict resolution and social and political reconciliation, and the results are largely positive. The literature also provides support for the opinions of the industry experts. However, what is not well documented is the macroeconomic effects of microfinance. As Raihan et al. (2017)47 note, while a positive impact on the average poor person is indicative of a positive macroeconomic effect, there may be other direct or indirect impacts on the rest of the economy which negates the effects in the aggregate. Hence, a macroeconomic analysis is required to gauge the overall impacts of microfinance on the economy and this paper addresses this gap in the literature in the context of India. The present study is a pioneering attempt to estimate the contribution of microfinance to the GDP and employment in India, using an I-O model. A few studies have explored the inter-relationship between economic growth and microfinance. For instance, an analysis conducted by Buera, Kaboski, and Shin (2013)48 reveals large distributional effects of microfinance in addition to small cumulative effects on economic growth. This is because, while having increased access to micro-credit can augment total factor productivity, which in turn increases growth, income distribution from the high to the low savers, on the other hand, may result in decreased capital accumulation, thus lowering growth. Sultan and Masih (2016)49 state that there exists a bi-directional relationship between microfinance and domestic economic growth in Bangladesh. Another study in Bangladesh by Raihan et al. (2017) uses a static Computable General Equilibrium (CGE) model to capture the effects of microfinance on GDP via the transmission channels of capital accumulation, productivity improvement, and re-allocation of capital and labour among different sectors, and is closest to the objective of this paper. However, while the I-O and CGE models have much in common, the former model has less restrictive assumptions as compared to the latter (Rose 1995).50 The results in this paper establish that microfinance is a contributor to economic growth in India, which emerges from the forward linkages of the sector. Our findings and expert views imply that MFIs should continue to expand their reach while keeping intact their social and economic goals, and the need for enhancing the multiple positive impacts, such as promoting women’s empowerment, deepening financial literacy, and complementing the various community and government initiatives for providing support to the lower income groups to help improve their economic well-being.
47 Raihan, S., S.R. Osmani, and M.B. Khalily. (2017). “The Macro Impact of Microfinance in Bangladesh: A CGE Analysis”, Economic Modelling, 62: 1-15. 48 Buera, Francisco J., Joseph P. Kaboski, and Yongseok Shin. (2012). “The Macroeconomics of Microfinance”, NBER Working Paper 17905, Cambridge, Massachusetts: National Bureau of Economic Research. 49 Sultan, Yousuf and Mansur Masih. (2016). “Does Microfinance Affect Economic Growth? Evidence from Bangladesh Based on ARDL Approach”, MPRA Paper No. 72123, Germany: University Library of Munich. 50 Rose, Adam. (1995). “Input-Output Economics and Computable General Equilibrium Models”, Structural Change and Economic Dynamics, 6(3): 295-304.

Page | 21
Chapter 4. Study Objectives and Methodology
4.1 Introduction The impact of microfinance credit has both economic and non-economic dimensions. On the economic front, both the borrower and the lender benefit from an increase in income and employment. The economic impact may also include the stability of these gains and distribution of gains. Although not always easy to measure, multiple non-economic benefits are expected from microfinance. One such outcome is the empowerment of that segment of the population which has been deprived of support to utilise the opportunities offered by the society. Improvement in credit discipline with the disbursement of a new loan linked to the timely repayment of the current loan is another outcome. The coincidental gains in financial literacy and potential for support from group members are significant for the first-time users of microfinance. Perhaps the most important gain for the society is the empowerment of women who are members of the joint liability groups. A number of real-life experiences illustrate the positive impact that access to credit can have in the lives of the poor.
4.2 Objectives
This study attempts to quantify the impact achieved by MFIs in the overall context of lending to the poor and small enterprises. The chapter discusses the following aspects:
a. Direct employment and business expansion in the microfinance industry; b. Economic activity generated as a result of the growth of micro and small enterprises due to
micro-lending support; c. Upstream and downstream incremental changes as a result of increased economic activity; d. Scenario building for a best-case/worst-case and most probable scenario for the MFI industry;
and e. Key risks for the industry.
4.3 Methodology
We will first analyse the impact of microfinance in a macroeconomic context, viz. with respect to GDP and employment. This has been done in two steps. First, we calculate the impact of NBFC-MFIs on these two outcomes. Second, we use simple extrapolation to calculate the impact for the complete MFI sector. A more granular exercise is not possible due to conceptual and data limitations.
We describe in detail the assumptions made and the procedure followed to estimate the different quantities for this study. The information on the operations of the NBFC-MFIs has been obtained from MFIN.
The present study utilises the input-output system-based analysis to assess the contribution of microfinance activities to the economy. The two outcomes measured are Gross Value Added (GVA) as a measure of the national economic output and employment (or the number of jobs). In the absence of specifically designed studies of the sector that provide detailed cost structures for the operations of MFIs and linkages to the other sectors of the economy, the study has relied on the available data on microfinance operations and a mapping of microfinance-related activities and the available aggregate data structures.
Page | 22
4.3.1 The Input–Output System
The framework of Input–Output (I-O) analysis is based on a description of flows of inputs and outputs across various sectors of the economy and across different uses. For example, let us consider an economy being composed of just two sectors, that is, agriculture and industry. One can describe the flows of the output of the sectors across sectors and across uses as follows:
X1 = X11 + X12 + CON1 + INV1 + EXP1 – IMP1 + ∆ STK1 ------ (1) X2 = X21 + X22 + CON2 + INV2 + EXP2 – IMP2 + ∆ STK2 ------ (2)
where, X1 = Output of agriculture; X2 – Output of industry X11 and X12 = Output of agriculture flowing to agriculture and industry, respectively, as an input to produce the output X21 and X22 = Output of industry flowing to agriculture and industry, respectively, as an input to produce the output CON1 and CON2 = Consumption of output of agriculture and industry, respectively, by the domestic consumers INV1 and INV2 = Utilisation of output of agriculture and industry, respectively, as investment goods in the domestic economy EXP1 and EXP2 = Exports of output of agriculture and industry, respectively, to the rest of the world IMP1 and IMPP2 = Imports of output of agriculture and industry, respectively, from the rest of the world ∆ STK1 and ∆ STK2 = Change in stock of the output of agriculture and industry, respectively, in the domestic economy.
The output flows described in the above equations also provide a framework for describing the utilisation of the output of a sector in terms of inputs into the production of another sector. The following two equations provide this decomposition:
X1 = X11 + X21 + VA1 - TAX1 + SUB1 -------------------- (3) X2 = X12 + X22 + VA2 – TAX2 + SUB2 ------------------ (4)
where, VA1 and VA2 = Value added, sum of wages and salaries, and profits, in agriculture and industry, respectively, TAX1 and TAX2 = Value of taxes paid in the production of output of agriculture and industry, respectively, and SUB1 and SUB2 = Value of subsidies received in the production of output of agriculture and industry, respectively.
The simple framework of the flows of output and their decomposition in terms of the costs and profits or returns provides a powerful tool to assess the contribution of a sector to the overall output of the economy, in terms of value added, which is a measure of national economic output. This framework has been extended to calculate the contribution of various production sectors to employment, using employment to output ratios.
The I-O framework utilises the concept of a ‘multiplier’. The ‘output multiplier’ of a sector of the economy is the amount of output that is generated in the overall economy as a result of the increase in the output (demand) of the sector by one unit. Thus, an output multiplier for agriculture quantifies the change in the overall national output, if the demand for agriculture increases by one unit because of, say, an increase in the consumption demand. Such ‘multipliers’ incorporate the ‘direct’ and ‘indirect’ effects of the change in the demand for the output of a sector. The other
Page | 23
multipliers commonly used in the I-O analysis are the ‘Gross Value Added (GVA) Multiplier’ and the ‘Employment Multiplier’. The use of the I-O analysis framework to assess the contribution of specific sectors to the overall economy has been described in a number of studies in the past (Miller and Blair (2009), and the methodology for the same in the Indian context has been explained in Pradhan, Saluja and Singh (2006), NCAER (2017), and Singh and Saluja (2018).51 However, the applications of the I-O analysis to the assessment of the contribution of a specific sector to the overall economy may also require the consideration of ‘forward linkage effects’ of the change in output of a sector.52 In the case of microfinance, the ‘forward linkage effects’ are particularly important as the output of the sectors utilising microfinance credit is of more significant value to the economy than the direct and indirect effects of microfinance operations. We describe the application of the I–O analysis to assess the contribution of microfinance sector to the macroeconomy first at a conceptual level and then indicate the derivation of relevant ‘multipliers’. 4.3.2 Contribution of the Microfinance Sector to the Macroeconomy In order to trace the impact of the microfinance sector on the economy, we track the flow of credit supply and utilisation in the following steps. The discussion highlights the operations of the NBFC-MFI sector as follows: 1. The lender provides loans to the individual women in the JLGs. The loans are provided without
any physical or financial collateral but with an implicit group liability. 2. The loans typically have a tenure of 18 months but ranging from 12 to 24 months, with regular
repayments on reducing the balance method of charging interest.
51 Miller, Ronald E. and Peter D. Blair. (2009). Input-Output Analysis: Foundations and Extensions, UK: Cambridge University Press, Second Edition, http://static.gest.unipd.it/~birolo/didattica11/Materiale_2012/_Materiale_2015/Miller_Blait-input-output_analysis.pdf. Pradhan, Basanta K., M.R. Saluja, and Salabh K. Singh. (2006). Social Accounting Matrices for India: Concept, Construction and Application, New Delhi: Sage Publication. NCAER. (2017). “The Economic Impact of the Indira Gandhi International Internal Airport, Delhi”, Report No. 20170301, New Delhi: National Council of Applied Economic Research, http://www.ncaer.org/publication_details.php?pID=281. Singh, Kanhaiya and M. R. Saluja. (2018). “Input–Output Table for India 2013–2014: Based on the New Series of National Accounts Statistics and Supply and the Use Table”, Margin: Journal of Applied Economic Research, 12(2): 197-223. 52 The I-O framework focusses on forward and backward linkages of a sector. The backward linkages reflect the input requirements in the production process of any sector. The input-output analysis traces the input requirements in the economy as a whole capturing the input requirements in each step. For example, if producing leather goods requires leather and chemicals, producing raw leather will require livestock, and livestock will require feed and fodder, producing fodder may require fertiliser, and each of these may, in turn, require many other inputs. These input linkages constitute the backward production linkages. The ‘forward linkages’ refer to the links of the sectors that use the output of a sector as an input. For example, if financial services are used to produce leather goods and textile products, then the ‘backward production linkage effects’ of the ‘leather goods and textile products’ become the ‘forward linkages’ of the financial services. We have used input-output multipliers that capture these backward and forward linkages to estimate the impact of operations of the microfinance sector on the GVA and employment.
Page | 24
3. The individual borrower may use the loan for a specific enterprise or for livelihood support, or for consumption purposes, including for medical emergencies or education. The loans taken for household use accounted for only 5 per cent of the loans during the three-year period, 2016-17 to 2018-19. Nevertheless, monitoring of the use of loans is clearly a difficult process, given the small amounts of loans and the potential for taking supplementary loans from other sources for meeting the overall requirement of funds.
4. On the supply side, therefore, the lender has to meet the expenses of operations such as
personnel expenses; establishment expenses including those for field offices, IT and communication services; and the cost of borrowed funds and other items. Direct value addition by the supplier of microfinance includes wages and salaries for the employees and return on assets to the owners.
5. The indirect effects emanate from the supply of inputs to the microfinance-lending operations.
These backward linkages in production may be captured in an Input–Output framework of analysis.
6. Another set of indirect effects, often termed as ‘forward linkages’, accrue especially as the
borrowers of credit utilise the credit for productive uses. The value addition by the enterprises or activities supported by credit is a gain to the economy. Again, the sum of the direct and indirect effects of producing the output of these enterprises can be estimated in the framework of the I–O analysis. While carrying out this assessment, it is necessary to impute only a part of the output of microfinance-assisted sectors (MFAS) as a gain from microfinance lending.53 In an annual accounting framework, in order to repay the loan and pay the interest on loan, the MFAS will have to produce at least the value of loan to be repaid in a given year. We assume that two-thirds of the loan value is produced by the enterprises in MFAS that are attributed to the loans.
7. Thus, we arrive at value addition of the microfinance sector directly and indirectly through the
‘backward input linkages’ and ‘forward linkages’ described above. The value addition is a measure of national economic output, similar to GDP. We also recognise that even this measure of output does not fully meet the broader concerns on the impact of credit on equity or sustainability of environmental resources, but fulfils one dimension of output of economic activity.
8. The estimates of the output value are also translated into employment generation using the
same input–output framework of interdependence of the production sectors. The ‘employment multipliers’ are generated for the supply of microfinance and for MFAS. These measures of employment are in terms of ‘jobs’ with a significant period of work through the year.
9. The above description of the assessment has been sketched out in Figure 4.1, which indicates the flows of value addition in various stages.
53 Microfinance-assisted sectors are essentially those in which enterprises taking microfinance loans can be grouped. As no specific distribution of microfinance-assisted enterprises across production sectors is available, we have distributed such enterprises across the agriculture, manufacturing, and services sectors. The manufacturing sectors include food products, textiles, leather and leather products, and what is termed as ‘other manufacturing’. Among the service sectors, we consider trade, hotels and restaurants, business services and ‘other services’ to include the MFAS. We consider only the unorganised sub-sectors of the production sectors mentioned here as the MFAS.
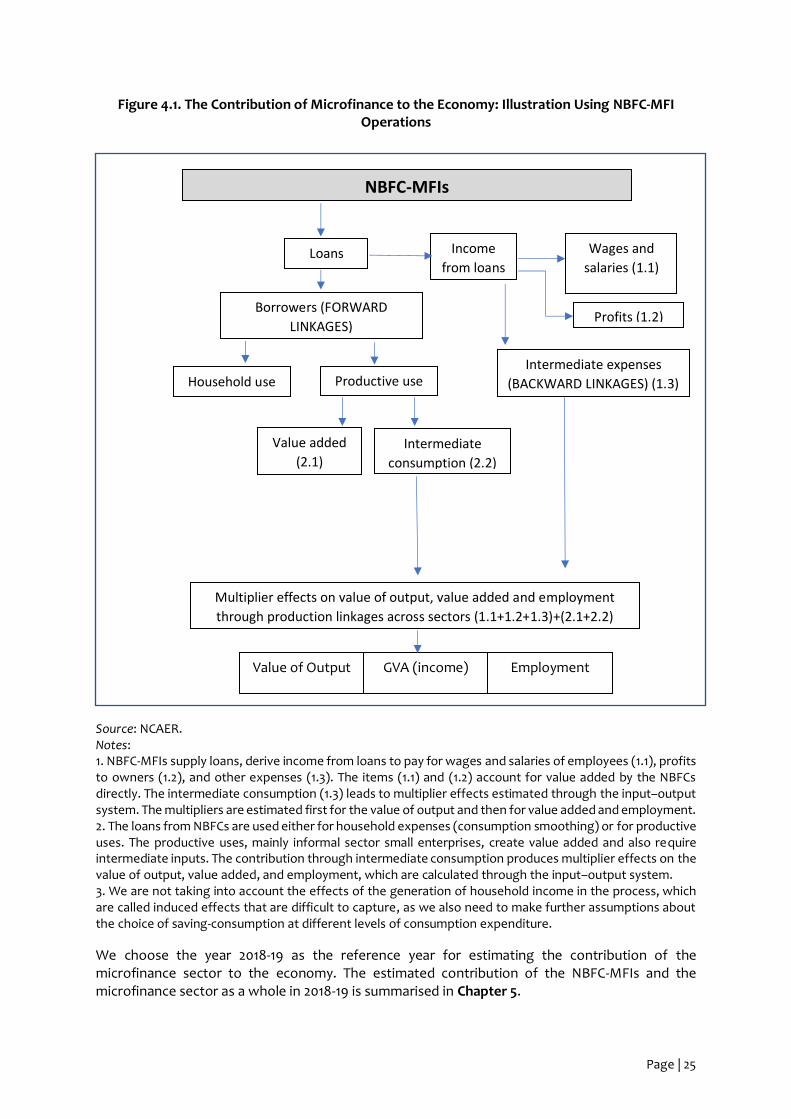
Page | 25
Figure 4.1. The Contribution of Microfinance to the Economy: Illustration Using NBFC-MFI Operations
Source: NCAER. Notes: 1. NBFC-MFIs supply loans, derive income from loans to pay for wages and salaries of employees (1.1), profits to owners (1.2), and other expenses (1.3). The items (1.1) and (1.2) account for value added by the NBFCs directly. The intermediate consumption (1.3) leads to multiplier effects estimated through the input–output system. The multipliers are estimated first for the value of output and then for value added and employment. 2. The loans from NBFCs are used either for household expenses (consumption smoothing) or for productive uses. The productive uses, mainly informal sector small enterprises, create value added and also require intermediate inputs. The contribution through intermediate consumption produces multiplier effects on the value of output, value added, and employment, which are calculated through the input–output system. 3. We are not taking into account the effects of the generation of household income in the process, which are called induced effects that are difficult to capture, as we also need to make further assumptions about the choice of saving-consumption at different levels of consumption expenditure.
We choose the year 2018-19 as the reference year for estimating the contribution of the microfinance sector to the economy. The estimated contribution of the NBFC-MFIs and the microfinance sector as a whole in 2018-19 is summarised in Chapter 5.
NBFC-MFIs
Borrowers (FORWARD
LINKAGES)
Loans Wages and
salaries (1.1)
Profits (1.2)
Intermediate expenses
(BACKWARD LINKAGES) (1.3) Household use Productive use
Multiplier effects on value of output, value added and employment
through production linkages across sectors (1.1+1.2+1.3)+(2.1+2.2)
Value added
(2.1) Intermediate
consumption (2.2)
Income
from loans
Value of Output GVA (income) Employment
Page | 26
To summarise: In the case of NBFC-MFIs, we first estimated their ‘direct contribution to GVA’ by calculating the ‘wage bill’ and ‘profits’, the two components of value added, using the data available from RBI’s Report on Trend and Progress in the Banking Sector, 2018-19. The contribution of the microfinance sector as a whole was estimated on the basis of the share of NBFC-MFIs in the total amount of disbursement of loans by the entire microfinance sector in 2018-19. This simple procedure was adopted in estimating the impact of the total microfinance sector in the absence of detailed data for the sector as a whole. To capture the direct and indirect backward linkages of the NBFC-MFIs in the overall economy, we use the GVA and employment multipliers of the financial services sector comprising banking and insurance. The ‘forward linkage multipliers’ for output, GVA, and employment have been calculated using the multipliers of the MFAS. A brief note on the multipliers of the I–O analysis is provided in Appendix 1.
4.3.3 Developing the I-O Coefficient Tables and Multipliers The I–O Coefficient Tables The IO analysis begins with an input–output coefficients matrix or table derived from an I–O transactions matrix. The development of these tables represents a major research endeavour in itself and generally depends on the information on national accounts and the ‘supply use tables’ generated by the national statistical agencies. We have adapted the I–O matrices available from other available studies to develop the multipliers for the present analysis. We have drawn on the work of Sinha, Siddiqui and Sangita (2001),54 and Chadha, Saluja and Sivamani (2020) for our analysis. The 131x131 sector input–output transactions table prepared by Chadha, Saluja and Sivamani (2020) for 2015-16 has been the starting point for us. This table has been reviewed and adapted using additional official data for other applications by NCAER. The larger I–O table was aggregated to two versions: a 12x12 sectors version and a 15x15 sectors version. The 12x12 version (I-O 12x12) was based on the structure adopted in Sinha, Siddiqui and Sangita (2001). The 15x15 version is an extension of the 12x12 sector system to reflect some of the input sectors that may be critical to the operations of the financial sector, namely, IT services, communication services, and business process operations. The sectoral groupings for the 15x15 and 12x12 I-O versions are indicated in Table A2.1 in Appendix 2. This 15x15 I-O coefficients table is used to calculate the ‘direct and indirect backward linkage multipliers’ for the financial services sector, which is used as a proxy for the NBFC-MFI sector and implicitly for the entire ‘microfinance sector’ in this study.
54 Sinha, A., K.A. Siddiqui, and N. Sangeeta. (2001). “Impact of Alternative Economic Policies on the Informal Sectors: A Multi-Sectoral Study”, New Delhi: National Council of Applied Economic Research (NCAER), September.
Page | 27
The 12x12 grouping is further disaggregated into organised and unorganised sectors using the technical structure available from Sinha, Siddiqui, and Sangita (2001). This I–O system has been used to calculate the ‘forward linkage multipliers’ for the microfinance sector through its input linkage to the MFAS. The I–O coefficient matrices and the output multiplier matrices (I-A)-1 for the 15x15 and 12x12 sector versions of the analysis are provided in Tables A2.1 to A2.5 in Appendix 2. Output–Labour Linkages The distribution of employment in terms of labour inputs55 across sectors is obtained using the Periodic Labour Force Survey (PLFS)56 Round of 2017-18. The labour input is further interpolated for the year 2015-16 by using the latest population projection. This is to make the labour input numbers consistent with the I–O table reference year 2015-16. We further disaggregated the labour input numbers in different sectors across the organised and unorganised sectors by using the methodology laid down by the National Commission for Enterprises in the Unorganised Sector (Arjun Sengupta Committee Report).57 The Gross Value Added (GVA) and Gross Value of Output (GVO) for the sectors and their bifurcation into the organised and unorganised sectors have been taken from disaggregated statements of National Accounts Statistics 2015-16.58 The employment to GVO ratios are used to estimate employment at the sectoral level for the 15x15 sector I–O specification. In the case of 12x12 sector specification, the employment to GVO ratios has been calculated for the organised and unorganised sectors. The Forward Linkages of Microfinance Microfinance assisted sectors (MFAS) have been defined for the purpose of the present analysis as essentially those in which enterprises taking microfinance loans can be grouped. As information on the distribution of microfinance credit to specific sectors is available only at an aggregate level such as ‘agriculture and allied’ or ‘non-agriculture’ and ‘household use’, we have assumed that besides the agricultural and allied sector enterprises, non-agricultural manufacturing enterprises supported by microfinance are distributed across sectors such as: (1) food products, (2) textiles, (3) leather and leather products, and what is termed as (4) ‘other manufacturing’, excluding the manufacturing sectors noted above. Among the service sectors, we consider: (1) trade and hotels and restaurants, (2) business services, and (3) other services among the MFAS. Finally, construction has also been considered among the MFAS. We consider only the unorganised sub-sectors of the production sectors mentioned here as the MFAS. The selection of sectors under MFAS is also limited by the available disaggregation of production sectors in the work reported in Sinha, Siddiqui, and Sangeeta (2001). A final assumption made in the specification of the MFAS in the input–output system is the distribution of MFAS across the industrial sectors specified here. The agricultural and allied sector is assumed to account for utilisation of 10 per cent of microfinance loans by NBFC-MFIs for non-household purposes. The enterprises in the manufacturing sector are assumed to account for 40
55 Labour input is computed by adding ‘multiple workers’ into NSS usual status (usual principal status and usual subsidiary status) workers. Refer Kolli, Sharma, and Sinharoy. (2008) for detailed methodology for estimating labour inputs. 56 Conducted by the Ministry of Statistics and Programme Implementation. 57NCEUS (National Commission for Enterprises in the unorganised Sector). 2007. 58 https://www.mospi.gov.in/web/mospi/reports-publications/-/reports/view/templateFive/901?q=RPCAT
Page | 28
per cent of these loans and enterprises in the services sector, for 40 per cent, and those in construction, for another 10 per cent. This distribution varies from the data on the distribution of the gross loan portfolio by NBFC-MFIs reported in the Annual Report of MFIN for 2019-20. Changes in the distribution of the loans in favour of the agriculture and allied sectors will affect the values of the multipliers for the MFAS, increasing the employment multiplier to some extent but not affecting the GVA multiplier significantly. The estimates of output, GVA, and employment multipliers for the direct, indirect backward linkage, and forward linkage effects of the microfinance sector have been provided in the next chapter, in which we also present the findings of the study. Estimation of the Contribution of the Microfinance Sector The multipliers provide a basis for the estimation of the contribution of the microfinance sector to the macroeconomy. The procedure we have followed is set out below. 1. Gross Value Added A. Direct contribution by NBFC-MFIs to GVA The incremental change in the gross value of output of the economy as a result of the operations of the NBFC-MFIs has been calculated based on the output multiplier and the value of output of the NBFC-MFIs. This requires an estimate of the output of the NBFC-MFIs. The value of output of the NBFC-MFIs has been obtained based on the value added by the NBFC-MFIs, profits realised+ wages and salaries incurred; these values are not directly available but have been estimated using the information available from different sources. (i) Profits of the sector = Value of Assets * Return on assets (Both the components obtained from the RBI’s Report on Trend and Progress of Banking Sector)59. (ii) Wages and salaries in the NBFC-MFI sector have been estimated in two steps: obtaining first,
the ratio of total expenditure of the sector to the value of assets and second, the ratio of share of wages and salaries to the total expenditure.
The ratio of expenditures to assets has been obtained from RBI’s Trends in Banking’ Ratio of wages and salaries to expenditure has also been obtained from RBI’s Report on Banking mentioned above. (iii) Wages and salaries incurred by the NBFC-MFIs = Ratio of expenditures to assets * Value of Assets * 0.7 (iv) GVA of the NBFC-MFIs = Profits + Wages and Salaries of the sector This is the direct contribution of the NBFC-MFIs to the overall GVA.
59 Report on Trend and Progress of Banking in India 2018-10, Reserve Bank of India.
Page | 29
B. Direct and Indirect Contribution to GVA
i. As a first step, the gross value of output generated by the NBFC-MFIs has been estimated using the ratio of value added to the output ratio of the organised ‘financial and insurance services sector’ and the GVA of NBFC-MFI sector, assuming that the ratio available for the broader ‘financial and insurance services’ also holds for the NBFC-MFIs. Gross Value of Output = (GVA of the sector)/ (Ratio of GVA/GVO for the sector) ii. The overall value of output of the economy generated by the direct and indirect input linkages of the NBFC-MFI sector is obtained as: Output multiplier * Gross value of output of the NBFC-MFIs iii. The GVA generated by the direct and indirect backward input linkages of the NBFC-MFI sector is then obtained as: GVA multiplier for NBFC-MFIs * Output multiplier for the sector * Gross value of output of the NBFC-MFIs C. GVA generated by MFAS is estimated as: GVA multiplier for MFAS * Output multiplier for MFAS * Gross value of output of the MFAS due to the loans advanced by the NBFC-MFIs D. Total contribution of the NBFC-MFIs to the overall GVA = Direct + Indirect + MFAS contribution
to GVA due to the NBFC-MFI loans 2. Employment A. Direct and indirect employment generated by the NBFC-MFIs is estimated as: Employment multiplier for NBFC-MFIs * Output multiplier for the sector * Gross value of output of the NBFC-MFIs B. Employment generated by MFAS is estimated as: Employment multiplier for MFAS * Output multiplier for MFAS * Gross value of output of the MFAS due to the loans advanced by the NBFC-MFIs C. Total Employment generated by NBFC-MFIs = Direct + Indirect + MFAS contribution to Employment 3. Estimation of the contribution of the microfinance sector as a whole to GVA and employment The NBFC-MFIs are a part of the overall microfinance sector delivering credit to the low-income households and micro-enterprises. It is one of the largest lending groups in the microfinance sector. Although the microfinance sector as a whole is constituted by a wide range of institutions, given the limited scope of the present work and the absence of more granular data for the other agencies, we have projected the contribution of the microfinance sector as a whole to the

Page | 30
macroeconomy proportional to the share of the NBFC-MFI sector in the total lending by the entire microfinance sector. A. Contribution of the microfinance sector as a whole to the overall GVA = (GVA contributed by NBFC-MFs by direct, indirect and through forward linkage with MFAS) * (Loans disbursed by NBFI- MFIs/ Loans disbursed by the entire microfinance sector) B. Contribution of the microfinance sector as a whole to employment = (Employment contributed by NBFC-MFs by direct, indirect, and through forward linkage with MFAS) * (Loans disbursed by NBFI- MFIs/Loans disbursed by the entire microfinance sector)
Page | 31
Chapter 5. Contribution of the Microfinance Sector to the Macroeconomy
5.1 Introduction The core function of the microfinance sector is delivering much-needed access to formal credit to low-income households. The first three chapters of this report discussed the criticality of access to finance, the current status of microfinance in India, and the impact of microfinance credit in multiple dimensions of the lives of poor households and women, touching both the economic and social aspects. Various aspects including the use of credit to bridge the lags in income earnings and consumption needs, to rebuild livelihoods after the shocks of illness or loss of the main income-earning members of the household, to supplement or build income-earning activities through micro-enterprises or just enhancing the confidence of women in poor households to enable them to manage household finances and participate in social activities, and the range of opportunities opened up by microfinance, were examined through other available studies and the assessment of data on household consumption and credit.
This chapter provides estimates of contribution of the microfinance sector to the macroeconomy in terms of the Gross Value Added and Employment, using the methodology of I–O analysis presented in Chapter 4.
5.2 Contribution to the Macroeconomy We have chosen the year 2018-19 as the reference year for estimating the contribution of the microfinance sector to the economy as the latest year for which many of the parameters for the calculations are available is this particular year. First, the multipliers relating to value added and employment have been applied to derive the contribution of the NBFC-MFIs to the economy, and then the estimated contribution of the NBFC-MFIs has been extrapolated to the entire microfinance sector using the proportion of the NBFC-MFI lending in total microfinance lending. From the perspective of the size of the overall economy, the microfinance sector is expected to be relatively small. For instance, based on the data available from the National Accounts Statistics on the Indian economy, the GVA from the entire financial sector, including real estate and professional services, in which the microfinance sector is a component, accounted for 21 per cent of the overall GVA of the economy in 2018-19. However, financial services alone, of which microfinance is a component, accounted for only 5.5 per cent of the GVA in the entire economy. The microfinance sector itself is, therefore, a much smaller component of the economy. The estimated contribution of the NBFC-MFIs and the microfinance sector as a whole in 2018-19 is summarised in Table 5.1. Details of the calculations have been provided in Table A3.1 in Appendix 3.

Page | 32
Table 5.1. Estimates of Contribution of the Microfinance Sector to the National Economic Output (Gross Value Added) and Employment
Sector/Variable Units Value
I. Gross Value Added
A. NBFC-MFIs: GVA
1. Direct and indirect backward linkages Rs crore 13,470
% of overall GVA 0.08
2. From direct and indirect forward linkages Rs crore 92,090
% of overall GVA 0.53
3. Total Rs crore 1,05,560
% of overall GVA 0.61
B. All Microfinance Sector
Total Rs crore 3,47,910 % of overall GVA 2.03
II. Employment
A. NBFC-MFIs: GVA
1. Direct and indirect backward linkages
Lakh jobs 1.20
2. From direct and indirect forward linkages
Lakh jobs 37.34
3. Total
Lakh jobs 38.54
B. All Microfinance Sector
Total Lakh jobs 128.46 Source: NCAER calculations.
As shown in Table 5.1, the estimated share of the GVA from NBFC-MFIs through its direct and indirect input linkages, calculated using the GVA multiplier, is 0.08 per cent in the GVA of the entire economy. This contribution includes the indirect contribution of the NBFC-MFI sector through the GVA generated by the sectors supplying inputs to the microfinance sector to produce the output of the sector in 2018-19. This number is, therefore, larger than the ‘direct contribution’ or ‘GVA generated by the NBFC-MFI sector by itself’. The share of GVA from the NBFC-MFIs, including direct and indirect backward linkages, in the financial services sector GVA alone is, therefore, 1.4 per cent. However, when we consider the contribution of the microfinance sector to the economy, it is not only the direct and indirect input-linked contribution but also the contribution of microfinance to the sectors which utilise such credit input. When we account for these forward linkage effects, the estimates based on the loans disbursed in 2018-19 by the NBFC-MFIs show that the contribution of the microfinance sector to the overall GVA for the economy as a whole rises to 0.61 per cent, which is well above the direct and input-linked estimate of 0.08 per cent. Extrapolating the operation of the microfinance sector as a whole, given that the share of NBFC-MFIs is 30 per cent and the assumption that the entire microfinance sector’s operations are similar to the NBFC-MFIs with respect to input usage and disbursal of loans, the contribution of the microfinance sector to the overall GVA is estimated at 2.03 per cent.
Page | 33
We note that the actual employment in the NBFC-MFIs in 2018-19 was reported to be about 95,000. The estimates based on the employment multipliers place employment creation at 1.2 lakh, taking into account the backward input linkages of the sector. When we include the employment created by the productive use of credit, the employment created is estimated at about 38.54 lakh jobs. A large part of the impact of NBFC-MFIs delivered microfinance on employment is, therefore, through the forward linkages of microfinance in the utilisation of its loans. For the microfinance sector as a whole, of which the NBFC-MFIs are a part, again based on the share of NBFC-MFIs in the total microfinance credit at 30 per cent and the assumption that the input structure and employment structure in the entire microfinance sector was the same as that in the NBFC-MFI sector, the employment created by the microfinance sector is estimated at about 1.28 crore jobs. Considering that 3.2 crore loans were disbursed in 2018-19 by the NBFC-MFIs alone, the potential for employment creation through the productive use of microfinance credit is clearly significant. Taken together, the contribution of the microfinance sector to GVA, through direct, backward, and forward linkages is placed at 2.03 per cent, and employment creation at 1.28 crore jobs, in 2018-19.
5.3 Contribution to the Macroeconomy over the Medium Term: the Base, Optimistic and the Pessimistic Scenarios The analytical framework for assessing the impact of microfinance on the economy presented in Chapter 4 has pointed to a number of factors influencing household income, employment through its forward linkages, and through these effects on the economy as a whole. This analytical framework allows us to examine the prospects for the sector and its impact over a medium term of the next 5-7 years based on alternative assumptions that determine the trajectories of the factors determining the expansion of the microfinance sector. We provide such an assessment of alternative scenarios in this section. The inter-relationships involved in the projections, on which a direct link is difficult to establish is the one between the prospects of the microfinance sector and the overall economy. The inter-relationships occur at multiple levels. The analysis presented in the previous chapter has pointed to the impact of microfinance on the economy. However, the impact of the performance of the overall economy on microfinance has not been quantified. This impact may come from different channels such as the opportunities that the economy may provide to the growth of the microenterprises sector, which may be in need of microfinance loans. The households experiencing rising income levels, especially among the lower income groups, may be looking for microfinance loans of higher value, the lower income rural households moving to urban areas, may also wish to avail of microfinance loans in the urban areas, based on their experience in rural areas, where microfinance is better established. The dynamics within the financial sector itself, such as the emergence of new institutions like SFBs or the use of banking correspondents by the commercial banks may improve the synergies of microfinance with the other lending formats. The MFIs may also be able to lend higher volumes of credit, as they may be able to raise more funds in a growing economy. While recognising these channels by which the overall economic growth may have an impact on the performance of the microfinance sector, we attempt to incorporate these effects on some of the key operational parameters of microfinance operations based on a set of assumptions. For an analysis of the future prospects, we specify three alternative scenarios, which essentially reflect the overall economic conditions and their impact on the parameters affecting the microfinance sector: the ‘base case’, which represents the likely scenario based on the present
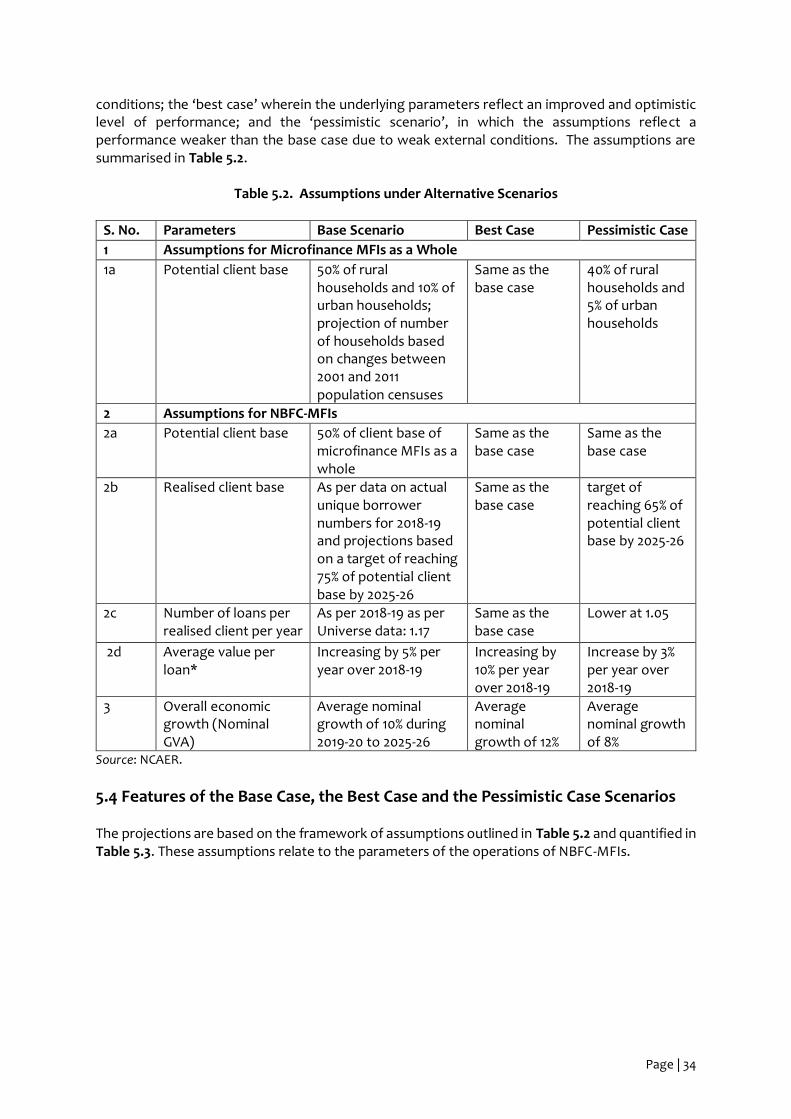
Page | 34
conditions; the ‘best case’ wherein the underlying parameters reflect an improved and optimistic level of performance; and the ‘pessimistic scenario’, in which the assumptions reflect a performance weaker than the base case due to weak external conditions. The assumptions are summarised in Table 5.2.
Table 5.2. Assumptions under Alternative Scenarios
S. No. Parameters Base Scenario Best Case Pessimistic Case
1 Assumptions for Microfinance MFIs as a Whole
1a Potential client base 50% of rural households and 10% of urban households; projection of number of households based on changes between 2001 and 2011 population censuses
Same as the base case
40% of rural households and 5% of urban households
2 Assumptions for NBFC-MFIs
2a Potential client base 50% of client base of microfinance MFIs as a whole
Same as the base case
Same as the base case
2b Realised client base As per data on actual unique borrower numbers for 2018-19 and projections based on a target of reaching 75% of potential client base by 2025-26
Same as the base case
target of reaching 65% of potential client base by 2025-26
2c Number of loans per realised client per year
As per 2018-19 as per Universe data: 1.17
Same as the base case
Lower at 1.05
2d Average value per loan*
Increasing by 5% per year over 2018-19
Increasing by 10% per year over 2018-19
Increase by 3% per year over 2018-19
3 Overall economic growth (Nominal GVA)
Average nominal growth of 10% during 2019-20 to 2025-26
Average nominal growth of 12%
Average nominal growth of 8%
Source: NCAER.
5.4 Features of the Base Case, the Best Case and the Pessimistic Case Scenarios The projections are based on the framework of assumptions outlined in Table 5.2 and quantified in Table 5.3. These assumptions relate to the parameters of the operations of NBFC-MFIs.

Page | 35
Table 5.3. Projected Parameters of Operations of the NBFC-MFI Sector under Alternative Scenarios
Parameters of Microfinance Operations
Units 2018-19 Base Case Best Case Pessimistic Case
2022- 23
2025- 26
2022- 23
2025- 26
2022- 23
2025- 26
Total potential client base
Crore 5.39 5.88 6.28 5.88 6.28 4.52 4.82
% year-on-year (YoY)total potential client base
% 2.23 2.23 2.23 2.23 2.16 2.17
Total realised client base (unique bank accounts)
Crore 2.62 3.66 4.71 3.66 4.71 2.90 3.13
% of actual to potential (total)
Calculated 48.63 62.30 75.00 62.30 75.00 64.18 65.00
No. of loans disbursed Lakh 305.9 428.6 551.3 428.6 551.3 304.7 329.1
No. of loans per borrower
Lakh 1.17 1.17 1.17 1.17 1.17 1.05 1.05
Average value of loans Rs 25760 31312 36247 37715 50199 28993 31682
Loan disbursals Rs 1,000 Crore 78.8 134.2 199.8 161.7 276.7 88.4 104.3
% change in YoY % 14.19 14.19 19.63 19.63 5.68 5.68
Share of NBFC-MFIs in loan disbursal in the total microfinance sector (excluding bank-linked SHGs)
% 39.1 41.3 40.9 41.3 40.9 41.3 40.9
Source: NCAER calculations.
The key parameters which define the alternative scenarios are as follows:
1. Annual growth rates of the overall economy, measured by the GVA. 2. Growth of the potential client base for the microfinance sector as a whole, and the share of
NBFC-MFIs in the microfinance MFI sector. 3. Rate of realisation of the potential client base, over the years reaching a targeted level at the
end of the projection period. 4. Number of loans per borrower in a year. 5. Growth in the average value of the loan over the years, reflecting the rise in credit needs as the
portfolio of loans may change with a larger number of small enterprises and rising income levels of households, in turn, requiring larger credit.
Changes in all the above parameters mean changes in the value of loans disbursed and the resulting impact through the underlying multiplier model on the GVA of the sector. The projections of contributions of NBFC-MFIs and of the microfinance sector as a whole to the overall GVA of the economy are presented in Figures 5.1 and 5.2, respectively. The projected contribution of NBFC-MFIs in the ‘best case’ scenario reaches 1.06 per cent of GVA over the seven-year period from 0.61 per cent in the base year of 2018-19. The pessimistic scenario actually suggests a decline in the contribution, as the potential client base declines besides the reduction in the rate of growth of the average value of the loans. The average number of loans per borrower is also assumed to decline. The ‘pessimistic scenario’ also reflects the risks to the sector, which have here been modelled as being the decline in the overall economic growth conditions,
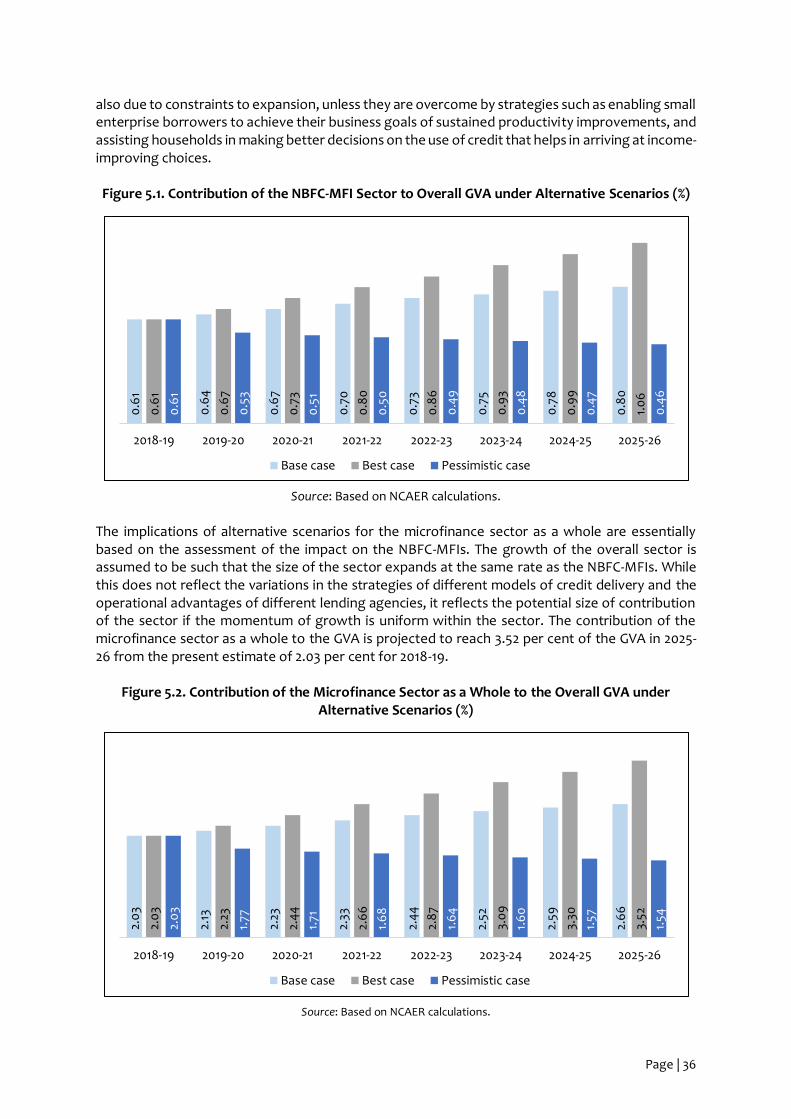
Page | 36
also due to constraints to expansion, unless they are overcome by strategies such as enabling small enterprise borrowers to achieve their business goals of sustained productivity improvements, and assisting households in making better decisions on the use of credit that helps in arriving at income-improving choices. Figure 5.1. Contribution of the NBFC-MFI Sector to Overall GVA under Alternative Scenarios (%)
Source: Based on NCAER calculations.
The implications of alternative scenarios for the microfinance sector as a whole are essentially based on the assessment of the impact on the NBFC-MFIs. The growth of the overall sector is assumed to be such that the size of the sector expands at the same rate as the NBFC-MFIs. While this does not reflect the variations in the strategies of different models of credit delivery and the operational advantages of different lending agencies, it reflects the potential size of contribution of the sector if the momentum of growth is uniform within the sector. The contribution of the microfinance sector as a whole to the GVA is projected to reach 3.52 per cent of the GVA in 2025-26 from the present estimate of 2.03 per cent for 2018-19.
Figure 5.2. Contribution of the Microfinance Sector as a Whole to the Overall GVA under Alternative Scenarios (%)
Source: Based on NCAER calculations.
0.6
1
0.6
4
0.6
7
0.7
0
0.7
3
0.7
5
0.7
8
0.8
0
0.6
1
0.6
7
0.7
3
0.8
0
0.8
6
0.9
3
0.9
9
1.0
6
0.6
1
0.5
3
0.5
1
0.5
0
0.4
9
0.4
8
0.4
7
0.4
6
2018-19 2019-20 2020-21 2021-22 2022-23 2023-24 2024-25 2025-26
Base case Best case Pessimistic case
2.0
3
2.13
2.23
2.33
2.4
4
2.52
2.59
2.6
6
2.0
3
2.23
2.4
4
2.6
6
2.8
7
3.0
9
3.30
3.52
2.0
3
1.77
1.71
1.6
8
1.6
4
1.6
0
1.57
1.54
2018-19 2019-20 2020-21 2021-22 2022-23 2023-24 2024-25 2025-26
Base case Best case Pessimistic case
Page | 37
5.4 Summing Up In summary, it may be pointed out that the impact of microfinance credit on the overall macroeconomy is important. While the microfinance sector accounts for only a small part of the financial sector, the employment created is estimated to be about 1.28 crore jobs by the sector as a whole, and 38.54 lakh jobs by the NBFC-MFIs alone, a significant contribution to the generation of employment. Many MFIs also have a double bottom line approach, combining as they do social and commercial objectives. The positive impact of the use of credit, including microfinance loans, has a multiplier effect when complementary factors like good infrastructure and supportive policy and regulatory framework are available. Finally, the alternative future prospects of the sector highlight the implications that changes in the macroeconomic environment may have on the microfinance sector. The contribution of the sector will nearly double, in a best case scenario, but an unfavourable external environment would imply an adverse outcome, which in turn, will make it incumbent upon the sector and policies affecting the sector to put in place measures to protect the support of credit to the vulnerable borrowers in times of greater economic stress.

Page | 38
Chapter 6. Summary, Key Findings, and Implications
6.1 Expanding the Reach of the Microfinance Sector The microfinance sector has evolved in India over the last three decades since it made its beginnings in the late 1980s. In recent years, from the annual disbursal of 1.67 crore loans amounting to Rs 84,000 crore in 2012-13, the portfolio of NBFC–MFIs has increased to a disbursal of loans worth Rs 3.2 crore in 2018-19 and worth Rs 323, 916 crore overall. There was the quadrupling of loan disbursal in a period of five years and doubling of the loan numbers. There has been a churning within the microfinance sector with new players and transformation of institutions from one type to another. The reach of SHGs, the bank-linked groups of women formed to support savings and livelihoods, has also expanded phenomenally to one crore in number with 12 crore households as members in 2018-19. Among these SHGs, a little more than a quarter borrowed to the tune of Rs 58,000 crore in 2018-19. Besides the NBFC–MFIs, and SHGs, the microfinance sector also includes banks, NBFCs, SFBs, and others and in 2018-19, all these entities disbursed an estimated loan amount of Rs 260,000 crore to over 6 crore borrowers. These are large numbers and significant in the context of the reach of microfinance and its potential to touch the lives and livelihoods of people across the country.
6.2 The Promise of Microfinance for Economic Development and the Need for Its Growth The promise of microfinance in meeting the credit needs of the poor and assisting them to overcome poverty has been at the core of the policy interest. It was also clear to the practitioners and policy makers that finance alone would not be sufficient to achieve poverty reduction. The public policy support to the delivery of health care, education, food, agricultural inputs, infrastructure development, shelter and old age pension has recognised the need for interventions in specific sectors. Microfinance may be seen as complementing these efforts.
The Honourable Prime Minister, in his address to the 75th United Nations General Assembly Session, noted the role of the world’s largest microfinance scheme in benefiting Indian women.60 The benefits clearly include catalysing women’s entrepreneurship and inclusive growth. Besides the economic impact of credit, there have also been social or non-economic benefits in terms of women’s empowerment and conflict resolution arising from the development of cohesive groups of women.
The rapid expansion of microfinance reaching the unserved and under-served in recent years has been aided by a combination of policy initiatives and technology innovations, represented by the now well-known JAM trinity: universalisation of bank accounts, biometric identity, and mobile telephones. Challenges in the full use of this new financial infrastructure remain but present further opportunities for expansion of the reach of microfinance. The lessons in the course of evolution of microfinance have led to improvements in the ecosystem for credit such as the emergence of Credit Bureaus, or different types of financial institutions to address the varying credit needs of the consumers.
60 https://www.hindustantimes.com/india-news/full-text-of-pm-modi-s-address-at-75th-unga-session-2020/story-8sOpyLIDesleUtIhRYdIWJ.html.

Page | 39
A recent survey of rural households by NABARD points to the fact that close to 50 per cent of the households have outstanding loans, a measure of indebtedness and also a measure of recourse to credit. About 40 per cent of the households took loan in the year preceding the survey. About 68 per cent of those who took loans did so from either institutional sources alone (58 per cent) or in combination with the informal sources (10 per cent). Further, 11 per cent of the borrowing households took loans from NBFC-MFIs, next to the bank- linked SHGs that lent to 12 per cent of the borrowers. Thus, a little more than 32 per cent of the loans were supplied by the informal sources alone, including friends and relatives, and local moneylenders. In terms of the penetration of formal financial institutions in the supply of credit, there is still a potential base that remains to be reached.
The NABARD survey also reveals that credit is needed at all levels of income. The need for credit may arise for numerous reasons, but meeting the composite ‘household needs’ is the most common purpose. Microfinance credit, focusing on the lower income portion of the income spectrum, therefore, has to address these features of the demand for credit. Often, the informal sector sources would be the only source of credit for the low-income households, when they need the loans for meeting cash needs in case of a family emergency. The replacement of physical collateral by the social or group liability has expanded access to formal credit sources by the poor but their needs are not always for income generation.
This study also draws attention to the findings of a survey of unincorporated non-agricultural enterprises by the National Sample Survey Organisation (NSSO) that about 50 per cent of the estimated 6.34 crore enterprises engaged in manufacturing, trade, and other services were in rural areas. In terms of the penetration of credit reach, only 6 per cent of the enterprises had any loans outstanding in 2015-16. Small firms relied predominantly on own funds or informal sector loans for funds, which may be due to supply or demand constraints. Only 10 per cent of all the unincorporated enterprises (rural + urban) with loans outstanding, had any dues with MFIs as compared to 90 per cent of the enterprises with dues to other sources. The reach of microfinance in this sector needs to be expanded as access to finance is critical for such micro-enterprises.
Thus, a significant portion of low-income households and micro-enterprises are still reliant on informal sources of credit, especially in rural areas. There are a number of new policy initiatives to remove barriers to access to credit like PMMY. These initiatives can be expected to supplement the performance of the microfinance sector which has made it evident that it is possible to build a financial infrastructure to reach even the most vulnerable. NBFC-MFIs and other microfinance lenders have achieved tremendous growth in a short span of time, reaching their target clients across the country. The prominence of loans to micro-enterprises is also evident from the large share of NBFC-MFI loans reported in the category of ‘Shishu’ loans under the MUDRA scheme. These factors may help in addressing the credit needs of this segment of micro-enterprises more effectively. The focus of the sector also needs to widen from the consideration of just supply-side barriers to demand-side factors, like financial needs and literacy.
Expansion of the MFIs across the country reflects both the dynamism of the industry and the large demand for credit from the low-income households and micro and small enterprises, which remains to be met. Given the population dynamics and rising income levels, it is likely that the percentage of households that borrow would increase over time and the demand for credit from all segments of the population is expected to increase. The findings from the Global Findex Database 2017 are more striking: about 42 per cent of the adult population (aged 15 years and above) in India borrowed any money in the previous year. However, only about 7 per cent of the adult population borrowed from formal sources. Considering the adult population in the country, the potential segment of the population unserved by the formal financial sector is around 35 crore individuals. The situation with respect to micro and small enterprises is of greater concern with respect to both the use of credit and sources of credit.
Page | 40
As the economy grows and there is a shift away from informal sources of credit to formal credit driven by the increased access to the formal financial infrastructure, the demand for formal sector microfinance is expected to increase. Addressing the needs of this under-served segment of the economy will be both a challenge and an opportunity for the microfinance sector. The translation of the potential demand into reality may also be aided by the rising need for digital payments in many formal transactions. For instance, digital payments more than doubled between 2017-18 and 2019-20.61 As these transitions in the economy accelerate, the credit needs of the lower income households and small enterprises would also rise.
6.3 Impact on the Economy The study then takes up the question regarding the impact of the microfinance sector on the economy as a whole. Keeping in view the role of credit as essentially an input to the economic activities that may flow from there, the study adopted the framework of an I–O model to assess the direct and indirect effects of microfinance operations on GDP and employment. The I-O model is typically used to capture the linkages across sectors through the need for various inputs in the production process. The need for different or the same inputs in every link in the production chain is captured in the model, albeit in a linear fashion. While the microfinance delivery system is relatively small even within the formal financial sector of the economy, the important effects of microfinance are its forward linkages: the households and enterprises that use credit to add value through their own production processes.
The ‘direct and backwards indirect effects’ have been estimated using the standard I–O output multipliers.
The ‘forward linkages’ have been captured in the study through an assessment of the impact of additional output of the ‘informal sector’ in a few specific sectors such as trade, manufacturing of food products, textiles, leather and leather products, and other manufacturing and agriculture. The credit disbursed by the microfinance sector is allocated to different sectors and the output multipliers are estimated to assess the impact of microfinance through such ‘forward linkages’.
The analysis was carried out for 2018-19, for which the details of NBFC-MFI data were available. The NBFC-MFI data formed the basis for deriving the estimates of output, value added and employment. These estimates were then extrapolated to the microfinance sector as a whole using the proportion of loan disbursals by the NBFC-MFIs in the loan disbursals of all the MFIs and SHGs in 2018-19. The estimated contributions of the microfinance sector to the macroeconomy in 2018-19 were as follows: Contribution to Gross Value Added: 1. Contribution of the direct and indirect backward linkage of the NBFC-MFI sector: 0.08 per cent. 2. The impact due to the ‘forward linkages’: 0.53 per cent of national GVA. 3. Total direct, indirect and forward linkages: 0.61 per cent of national GVA. 4. The contribution of the microfinance sector as a whole, including all MFIs and SHGs: 2.03 per
cent of GVA
61 https://m.rbi.org.in/Scripts/AnnualReportPublications.aspx?Id=1293
Page | 41
Contribution to employment: 1. Impact through the direct and indirect backward linkage of the NBFC-MFI sector on
employment: 1.2 lakh jobs. 2. The impact due to the ‘forward linkages’: 37.34 lakh jobs. 3. Total direct, indirect and forward linkages: 38.54 lakh jobs. 4. The contribution of microfinance sector as a whole, including all MFIs and SHGs: 1.28 crore jobs. The analysis points to the importance of utilisation of credit whereby the microfinance sector makes a significant contribution to the economy. The analysis does not separately take into account the use of credit for ‘household uses’. The data available for the NBFC–MFIs suggests that only about 3 per cent of the credit is used for such purposes. But we have assumed that only 90 per cent of the credit is used for ‘productive’ purposes, mainly because it may be difficult to track the actual use of credit at the household level. The microfinance credit may also be used for meeting consumption needs and would have a consumption effect as well. Credit may also be used for education of the child or to overcome ill health. However, modelling this will require further assessment of the consumption patterns of the borrowers and allocation of expenditure to this basket. In addition, the use of such credit is essentially a re-allocation of expenditure by the households as they need to repay the loans quickly. In view of these qualifications, we have not estimated the impact on consumption expenditure of borrowers, and in turn, the impact on the economy.
6.4 Successes, Failures and Prospects The potential impact of credit, when delivered in times of crises faced by individual households, is huge and would affect the course of livelihood for such individual households. The numerous MFIs operating in the sector have experienced successes in the course of their operations. It is this potential that needs to be kept in view when crores of borrowers access the credit supplied by MFIs and many of them may be affected by this critical support that microfinance provides. The perspectives of providers of microfinance on the challenges and way forward emphasise the larger role that the ‘internal factors’ of the industry have played in the rapid growth of the sector in recent years. Focus on a specific segment of demand, clear regulatory guidelines, emergence of technology that allows for efficient monitoring and implementation of services and the general professional approach to the business operations have been drivers of growth. The large unmet need for efficient delivery of credit was indeed an important factor. The high overall economic growth in the last decade was important in creating opportunities for mainstreaming microfinance and sustaining its growth. For the medium term, diversification of the portfolio of credit, greater engagement with the borrowing enterprises, and the positive environment of credit discipline are important for the growth of the sector. Complementing the efforts of public programmes for poverty reduction would also be important for microfinance, especially where improving awareness of the programmes is concerned. Alternative Scenarios for the Sector over the Medium Term The study has also attempted an assessment of the medium-term prospects for the sector linked to the course of the overall economy. Three alternative scenarios were analysed for microfinance over the next seven-year period—the ‘base case’ or more likely scenario, ‘the best case’ or one of high expectations, and the ‘pessimistic scenario’, arising from the weak economic growth conditions affecting the demand for loans.

Page | 42
In the base case scenario, the study places the contribution of NBFC-MFIs to overall GVA at 0.8 per cent of GVA by 2025-26 from the 0.61 per cent in 2018-19.
The ‘best case’ sees a rapid expansion in the NBFC-MFI size, contributing 1.01 per cent of GVA in 2025-26.
The ‘pessimistic scenario’ points to the potential for a significant drop in the relative size of the microfinance sector, with NBFC-MFIs contributing 0.5 per cent of the GVA.
The overall microfinance sector is slated to contribute, including the backward and forward linkages, 2.7 per cent, 3.52 per cent, and 1.54 per cent of GVA in 2025-26 under the base, the best, and the pessimistic scenarios, respectively.
The findings point to the risk factors for the sector in the medium-term prospects as a result of lower overall economic growth. The implication for the sector is clearly to enhance its effectiveness in making the loans more productive in the borrower’s hands so that the client base can be sustained or improved, larger loans would be possible, and opportunities for diversification of its portfolio can be exploited. The role of microfinance, as a support to lower-income households and small enterprises, is of greater importance in a growing economy as it is in a scenario of weak growth. Monitoring the impact of lending on the borrowers and learning from it would be essential as household and enterprises moving to unsustainable debt positions would be an unfavourable position for the entire financial system. In this sense the microfinance sector will need flexibility to address the changing overall conditions both to contribute to the growth of the economy and also meet the credit needs of the lower income households and small enterprises.
There are two additional critical concerns that need to be highlighted in the context of a medium-term scenario for the microfinance sector and in which the microfinance sector will have significant role to play. One is an obvious crisis of the COVID-19 pandemic facing the world. The second is the climate change scenarios wherein the benefits of responsible actions on the part of the households and enterprises can make a difference to the impact of the crisis. This analysis comes at a time when the entire global economic life has been overwhelmed by the COVID-19 pandemic. While the scenarios considered in this study are shaped by the momentum of economic growth and financial conditions, the parallels with the ongoing economic turmoil remain, with the important difference being the severe health impact of the pandemic. The income and job losses seen now are far more severe than considered under the ‘pessimistic scenario’ of the present analysis. Indeed, the loss of economic output, jobs, and lives has been enormous.
In India, while the national output measured by GDP or GVA is expected to show an unprecedented decline in 2020-21, the impact has been deeper and more widespread for the small enterprises. The pandemic has also shown the extreme vulnerability of the migrants who moved from rural to urban areas and from small towns to larger towns in search of better income earnings across the country and formed the essential factor of production across productive sectors, as they suddenly lost their jobs and incomes.
Agriculture is seen to be the only sector that was relatively insulated as a production activity from the shock caused by the pandemic. The onset of the pandemic also necessitated lockdowns of economic activity to contain the spread of infections. The economic recovery, now unfolding, has to take into consideration the scenarios for micro, small, and medium scale enterprises. As pointed out earlier, microfinance has a critical role to play both when the economic conditions follow a buoyant phase, to help the low-income households benefit from the economic growth, and when
Page | 43
there is a decline in growth as a coping mechanism for the low-income households. In the present conditions, the microfinance sector will need to complement the efforts geared to provide relief to the borrowers and recovery efforts of the public policies, especially in supporting micro enterprises in rural areas. Without a robust recovery of the economy, the market for the produce of micro-enterprises would also be weak. Migrants who have returned to their rural homes present an opportunity for beginning a new phase of micro-enterprises in rural areas as they also bring with them different skill sets that may be relevant for such enterprises.
In the case of the second set of concerns, many of the SDGs are related to the sustainable use of natural resources. The choices relating to consumption and production would have implications for environmental resource use. Microfinance offers the opportunity to complement the awareness-building efforts in this area and also to support choices that complement the conservation of natural resources. The potential areas that could be highlighted in microfinance operations include clean energy, water conservation and efficient use of water, transportation choices and technology choices. The operational model of microfinance also has the advantage of using women-led initiatives that may have a greater social impact than otherwise.
Page | 44
Appendix 1. The Output, Value Added and Employment Multipliers Generalising the two equation specification provided in Section 4.3.1, the output of the various sectors of the economy can be presented in the following form: x = Ax + f --- (1) x= Inverse (I-A)f or Bf --- (2) where x= nx1 vector of output of n sectors of the economy A = Input-output coefficient matrix with aij element = amount of sector j’s output required to produce one unit of output of sector i. f = nx1 vector of final demand for output of various sectors, comprising of consumption, investment, net exports with change in stock included in investment demand. At the sector level, the output value may be expressed as
xi = Σj aij xj + fi
where aij coefficients are elements of matrix A and each coefficient is the amount of output of
sector j required to produce one unit of output of the sector i.
Or, xi = Σj bijfi
where bij coefficients are elements of matrix B and each coefficient is the amount of output of
sector j required to meet one unit of demand for the sector’s output. These coefficients reflect the combined input requirements at successive intermediate stages of production of the inputs required to produce the output of sector i. The Output Multipliers
The direct impact output multipliers = Σj aji
The direct and indirect backward linkage output multipliers = Σj bji
The forward linkage output multiplier for microfinance = Σi wj Σj bji with i referring to the specific
microfinance assisted sectors (MFAS) and wi being the proportion of the output of all the
microfinance assisted sectors produced in sector i. The GVA Multipliers The GVA or income multiplier is calculated using the ratio of GVA to the value of output for the various sectors of the economy represented in the I–O matrix. The multipliers are given by v = V . Inverse (I-A) where v = 1xn row vector of GVA multipliers of various production sectors V = 1xn row vector of value added to output ratio of different sectors Thus, the GVA multiplier for ith sector = ∑j Vj. bji where Vj is the value added to output ratio of the jth sector and bji is the element of (I-A)-1 matrix from jth row and ith column. The ‘forward linkage GVA multiplier is calculated using the B matrix as:
Σi wj . Σj vi . bji
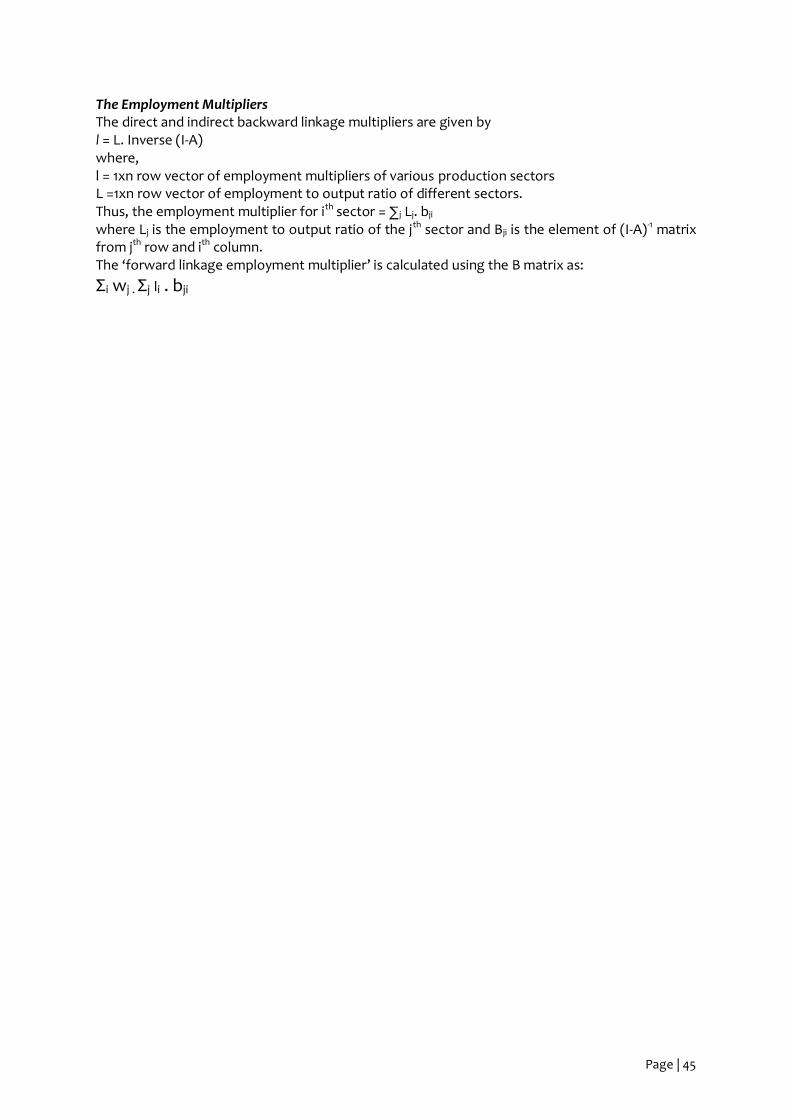
Page | 45
The Employment Multipliers The direct and indirect backward linkage multipliers are given by l = L. Inverse (I-A) where, l = 1xn row vector of employment multipliers of various production sectors L =1xn row vector of employment to output ratio of different sectors. Thus, the employment multiplier for ith sector = ∑j Lj. bji where Lj is the employment to output ratio of the jth sector and Bji is the element of (I-A)-1 matrix from jth row and ith column. The ‘forward linkage employment multiplier’ is calculated using the B matrix as:
Σi wj . Σj li . bji
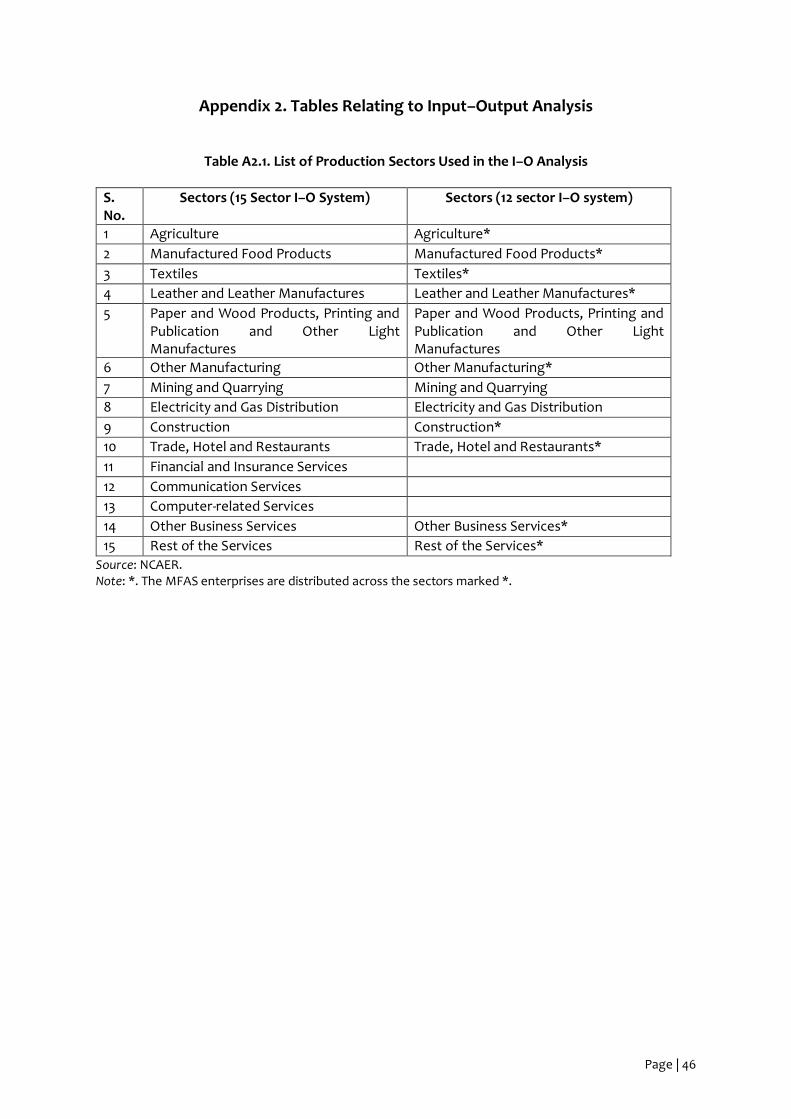
Page | 46
Appendix 2. Tables Relating to Input–Output Analysis
Table A2.1. List of Production Sectors Used in the I–O Analysis
S. No.
Sectors (15 Sector I–O System) Sectors (12 sector I–O system)
1 Agriculture Agriculture*
2 Manufactured Food Products Manufactured Food Products*
3 Textiles Textiles*
4 Leather and Leather Manufactures Leather and Leather Manufactures*
5 Paper and Wood Products, Printing and Publication and Other Light Manufactures
Paper and Wood Products, Printing and Publication and Other Light Manufactures
6 Other Manufacturing Other Manufacturing*
7 Mining and Quarrying Mining and Quarrying
8 Electricity and Gas Distribution Electricity and Gas Distribution
9 Construction Construction*
10 Trade, Hotel and Restaurants Trade, Hotel and Restaurants*
11 Financial and Insurance Services
12 Communication Services
13 Computer-related Services
14 Other Business Services Other Business Services*
15 Rest of the Services Rest of the Services*
Source: NCAER. Note: *. The MFAS enterprises are distributed across the sectors marked *.
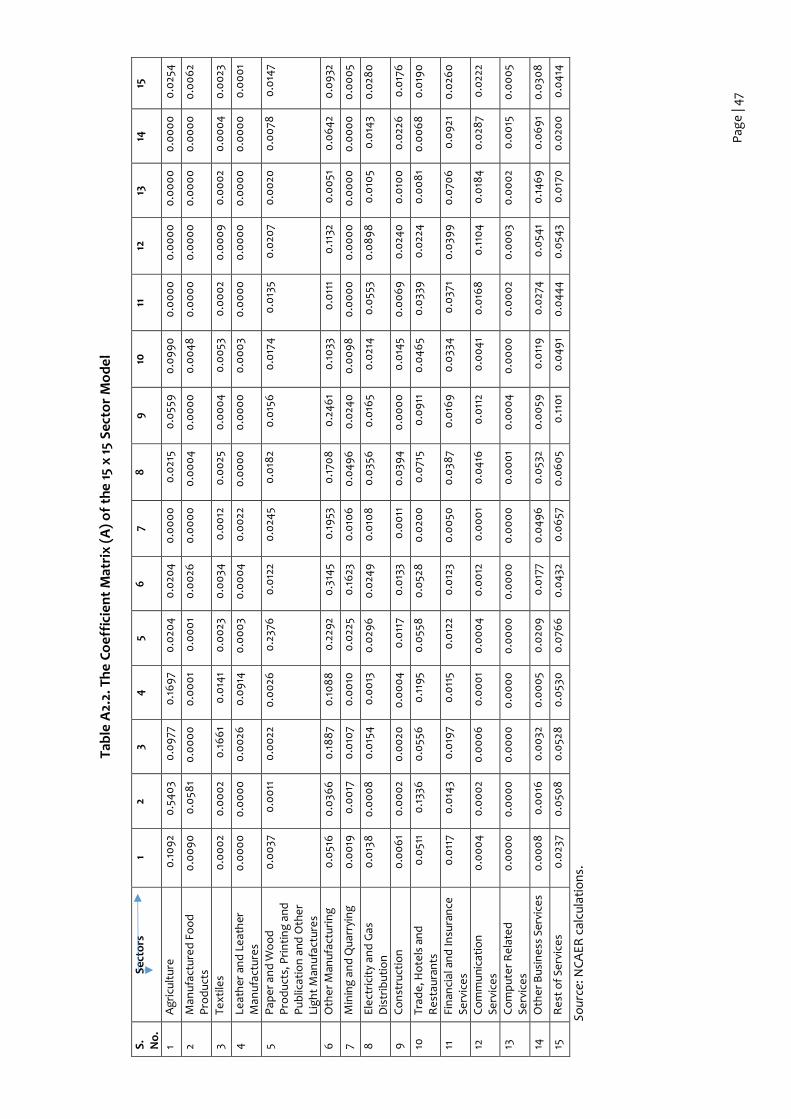
Pag
e |
47
Tab
le A
2.2.
Th
e C
oe
ffic
ien
t M
atri
x (
A)
of
the
15
x 15
Sec
tor
Mo
de
l
S.
No
. S
ecto
rs
1 2
3 4
5
6
7 8
9
10
11
12
13
14
15
1 A
gri
cult
ure
0
.10
92
0.5
40
3 0
.09
77
0.1
69
7 0
.020
4
0.0
204
0
.00
00
0
.021
5 0
.055
9
0.0
99
0
0.0
00
0
0.0
00
0
0.0
00
0
0.0
00
0
0.0
254
2 M
anu
fact
ure
d F
oo
d
Pro
du
cts
0.0
09
0
0.0
581
0.0
00
0
0.0
00
1 0
.00
01
0.0
026
0
.00
00
0
.00
04
0
.00
00
0
.00
48
0
.00
00
0
.00
00
0
.00
00
0
.00
00
0
.00
62
3 Te
xtile
s 0
.00
02
0.0
00
2 0
.16
61
0.0
141
0.0
023
0
.00
34
0.0
012
0
.00
25
0.0
00
4
0.0
053
0
.00
02
0.0
00
9
0.0
00
2 0
.00
04
0
.00
23
4
Leat
her
an
d L
eat
her
M
anu
fact
ure
s 0
.00
00
0
.00
00
0
.00
26
0.0
914
0
.00
03
0.0
00
4
0.0
022
0
.00
00
0
.00
00
0
.00
03
0.0
00
0
0.0
00
0
0.0
00
0
0.0
00
0
0.0
00
1
5 P
ap
er
and
Wo
od
P
rod
uct
s, P
rin
tin
g a
nd
P
ub
licat
ion
an
d O
the
r Li
gh
t M
anu
fact
ure
s
0.0
037
0
.00
11
0.0
022
0
.00
26
0.2
376
0
.012
2 0
.024
5 0
.018
2 0
.015
6
0.0
174
0
.013
5 0
.020
7 0
.00
20
0.0
078
0
.014
7
6
Oth
er
Man
ufa
ctu
rin
g
0.0
516
0
.036
6
0.1
88
7 0
.10
88
0
.229
2 0
.314
5 0
.19
53
0.1
708
0
.24
61
0.1
033
0
.011
1 0
.113
2 0
.00
51
0.0
64
2 0
.09
32
7 M
inin
g a
nd
Qu
arry
ing
0
.00
19
0.0
017
0
.010
7 0
.00
10
0.0
225
0.1
623
0
.010
6
0.0
49
6
0.0
240
0
.00
98
0
.00
00
0
.00
00
0
.00
00
0
.00
00
0
.00
05
8
Ele
ctri
city
an
d G
as
Dis
trib
uti
on
0
.013
8
0.0
00
8
0.0
154
0
.00
13
0.0
296
0
.024
9
0.0
108
0
.035
6
0.0
165
0.0
214
0
.055
3 0
.08
98
0
.010
5 0
.014
3 0
.028
0
9
Co
nst
ruct
ion
0
.00
61
0.0
00
2 0
.00
20
0.0
00
4
0.0
117
0.0
133
0.0
011
0
.039
4
0.0
00
0
0.0
145
0.0
06
9
0.0
240
0
.010
0
0.0
226
0
.017
6
10
Trad
e, H
ote
ls a
nd
R
est
aura
nts
0
.051
1 0
.133
6
0.0
556
0
.119
5 0
.055
8
0.0
528
0
.020
0
0.0
715
0.0
911
0
.04
65
0.0
339
0
.022
4
0.0
08
1 0
.00
68
0
.019
0
11
Fin
anci
al a
nd
Insu
ran
ce
Serv
ice
s 0
.011
7 0
.014
3 0
.019
7 0
.011
5 0
.012
2 0
.012
3 0
.00
50
0.0
387
0.0
169
0
.033
4
0.0
371
0.0
399
0
.070
6
0.0
921
0
.026
0
12
Co
mm
un
icat
ion
Se
rvic
es
0.0
00
4
0.0
00
2 0
.00
06
0
.00
01
0.0
00
4
0.0
012
0
.00
01
0.0
416
0
.011
2 0
.00
41
0.0
168
0
.110
4
0.0
184
0
.028
7 0
.022
2
13
Co
mp
ute
r R
ela
ted
Se
rvic
es
0.0
00
0
0.0
00
0
0.0
00
0
0.0
00
0
0.0
00
0
0.0
00
0
0.0
00
0
0.0
00
1 0
.00
04
0
.00
00
0
.00
02
0.0
00
3 0
.00
02
0.0
015
0
.00
05
14
Oth
er
Bu
sin
ess
Ser
vice
s 0
.00
08
0
.00
16
0.0
032
0
.00
05
0.0
209
0
.017
7 0
.04
96
0
.053
2 0
.00
59
0.0
119
0
.027
4
0.0
541
0.1
46
9
0.0
69
1 0
.030
8
15
Re
st o
f Se
rvic
es
0.0
237
0.0
508
0
.052
8
0.0
530
0
.076
6
0.0
432
0
.06
57
0.0
60
5 0
.110
1 0
.04
91
0.0
44
4
0.0
543
0.0
170
0
.020
0
0.0
414
Sou
rce:
NC
AE
R c
alcu
lati
on
s.
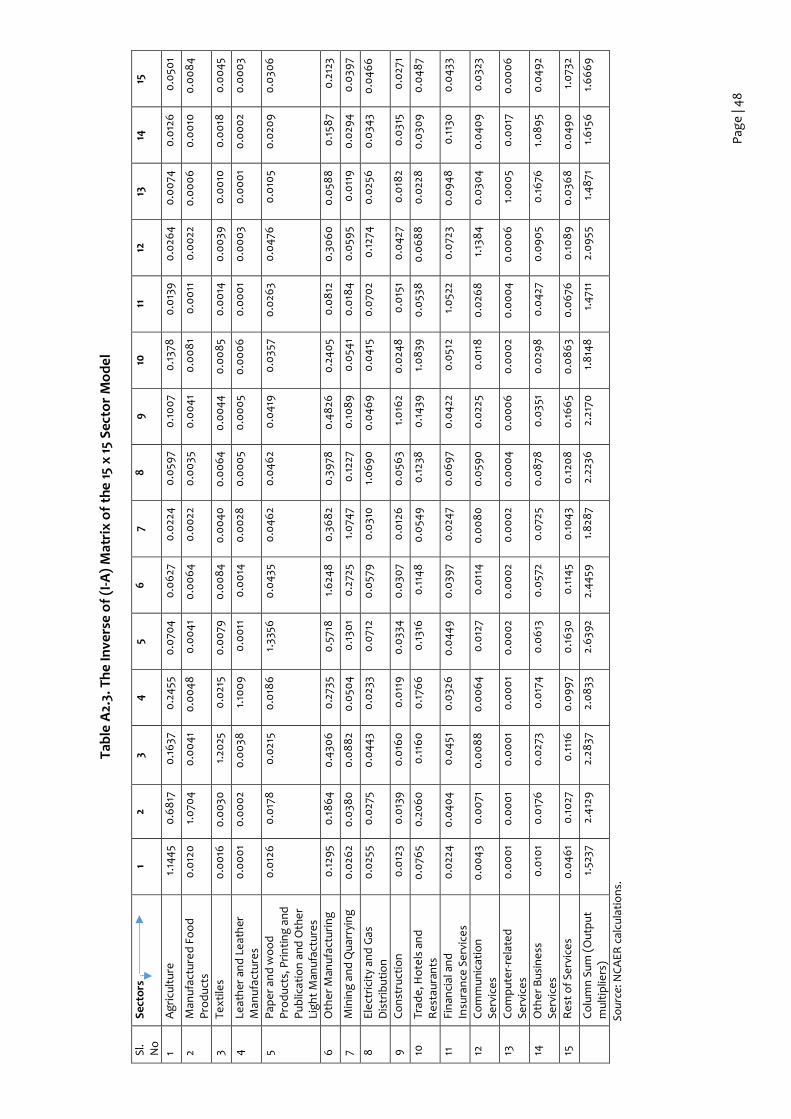
Pag
e |
48
Tab
le A
2.3.
Th
e In
vers
e o
f (I
-A)
Mat
rix
of
the
15
x 15
Sec
tor
Mo
de
l
Sl.
No
S
ecto
rs
1 2
3 4
5
6
7 8
9
10
11
12
13
14
15
1 A
gri
cult
ure
1.
144
5 0
.68
17
0.1
637
0
.24
55
0.0
704
0
.06
27
0.0
224
0
.059
7 0
.10
07
0.1
378
0
.013
9
0.0
264
0
.00
74
0.0
126
0
.050
1
2 M
anu
fact
ure
d F
oo
d
Pro
du
cts
0.0
120
1.
070
4
0.0
04
1 0
.00
48
0
.00
41
0.0
06
4
0.0
022
0
.00
35
0.0
04
1 0
.00
81
0.0
011
0
.00
22
0.0
00
6
0.0
010
0
.00
84
3 Te
xtile
s 0
.00
16
0.0
030
1.
2025
0
.021
5 0
.00
79
0.0
08
4
0.0
04
0
0.0
06
4
0.0
04
4
0.0
08
5 0
.00
14
0.0
039
0
.00
10
0.0
018
0
.00
45
4
Leat
her
an
d L
eat
her
M
anu
fact
ure
s 0
.00
01
0.0
00
2 0
.00
38
1.10
09
0
.00
11
0.0
014
0
.00
28
0.0
00
5 0
.00
05
0.0
00
6
0.0
00
1 0
.00
03
0.0
00
1 0
.00
02
0.0
00
3
5 P
ap
er
and
wo
od
P
rod
uct
s, P
rin
tin
g a
nd
P
ub
licat
ion
an
d O
the
r Li
gh
t M
anu
fact
ure
s
0.0
126
0
.017
8
0.0
215
0.0
186
1.
3356
0
.04
35
0.0
46
2 0
.04
62
0.0
419
0
.035
7 0
.026
3 0
.04
76
0.0
105
0.0
209
0
.030
6
6
Oth
er
Man
ufa
ctu
rin
g
0.1
295
0.1
86
4
0.4
306
0
.273
5 0
.571
8
1.6
248
0
.36
82
0.3
978
0
.48
26
0.2
40
5 0
.08
12
0.3
06
0
0.0
588
0
.158
7 0
.212
3
7 M
inin
g a
nd
Qu
arry
ing
0
.026
2 0
.038
0
0.0
88
2 0
.050
4
0.1
301
0.2
725
1.0
747
0.1
227
0.1
08
9
0.0
541
0.0
184
0
.059
5 0
.011
9
0.0
294
0
.039
7
8
Ele
ctri
city
an
d G
as
Dis
trib
uti
on
0
.025
5 0
.027
5 0
.04
43
0
.023
3 0
.071
2 0
.057
9
0.0
310
1.
06
90
0
.04
69
0
.04
15
0.0
702
0.1
274
0
.025
6
0.0
343
0.0
46
6
9
Co
nst
ruct
ion
0
.012
3 0
.013
9
0.0
160
0
.011
9
0.0
334
0
.030
7 0
.012
6
0.0
563
1.0
162
0.0
248
0
.015
1 0
.04
27
0.0
182
0.0
315
0.0
271
10
Trad
e, H
ote
ls a
nd
R
est
aura
nts
0
.076
5 0
.20
60
0
.116
0
0.1
766
0
.131
6
0.1
148
0
.054
9
0.1
238
0
.14
39
1.0
839
0
.053
8
0.0
68
8
0.0
228
0
.030
9
0.0
48
7
11
Fin
anci
al a
nd
In
sura
nce
Se
rvic
es
0.0
224
0
.04
04
0
.04
51
0.0
326
0
.04
49
0
.039
7 0
.024
7 0
.06
97
0.0
422
0
.051
2 1.
052
2 0
.072
3 0
.09
48
0
.113
0
0.0
433
12
Co
mm
un
icat
ion
Se
rvic
es
0.0
04
3 0
.00
71
0.0
08
8
0.0
06
4
0.0
127
0.0
114
0
.00
80
0
.059
0
0.0
225
0.0
118
0
.026
8
1.13
84
0
.030
4
0.0
40
9
0.0
323
13
Co
mp
ute
r-re
late
d
Serv
ice
s 0
.00
01
0.0
00
1 0
.00
01
0.0
00
1 0
.00
02
0.0
00
2 0
.00
02
0.0
00
4
0.0
00
6
0.0
00
2 0
.00
04
0
.00
06
1.
00
05
0.0
017
0
.00
06
14
Oth
er
Bu
sin
ess
Se
rvic
es
0.0
101
0.0
176
0
.027
3 0
.017
4
0.0
613
0
.057
2 0
.072
5 0
.08
78
0.0
351
0.0
298
0
.04
27
0.0
90
5 0
.16
76
1.0
89
5 0
.04
92
15
Re
st o
f Se
rvic
es
0.0
46
1 0
.10
27
0.1
116
0
.09
97
0.1
630
0
.114
5 0
.10
43
0.1
208
0
.16
65
0.0
86
3 0
.06
76
0.1
08
9
0.0
368
0
.04
90
1.
073
2
C
olu
mn
Su
m (
Ou
tpu
t m
ult
iplie
rs)
1.52
37
2.4
129
2.
2837
2.
08
33
2.6
39
2 2.
44
59
1.8
287
2.22
36
2.21
70
1.8
148
1.
471
1 2.
09
55
1.4
871
1.
615
6
1.6
66
9
Sou
rce:
NC
AE
R c
alcu
lati
on
s.
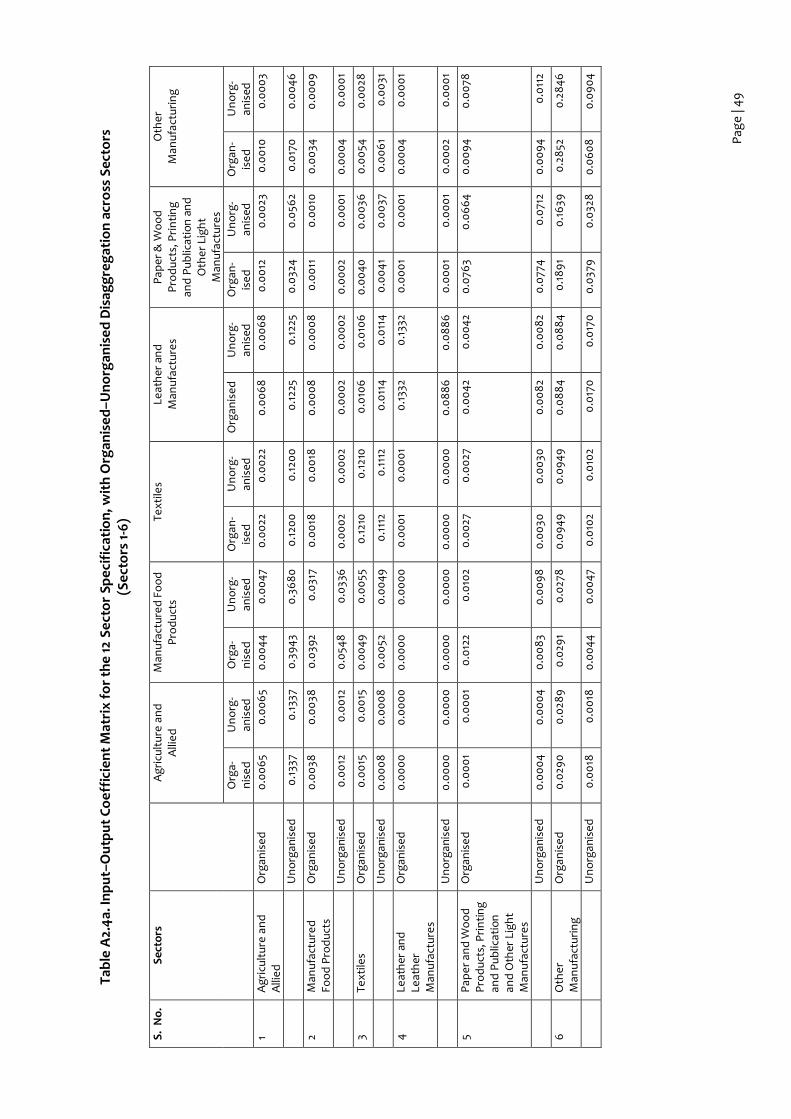
Pag
e |
49
Tab
le A
2.4
a. I
np
ut–
Ou
tpu
t C
oe
ffic
ien
t M
atri
x f
or
the
12 S
ect
or
Spe
cifi
cati
on
, wit
h O
rgan
ise
d–U
no
rgan
ise
d D
isag
gre
gat
ion
acr
oss
Sec
tors
(S
ect
ors
1-6
)
S.
No
. S
ecto
rs
A
gri
cult
ure
an
d
Alli
ed
M
anu
fact
ure
d F
oo
d
Pro
du
cts
Text
iles
Leat
her
an
d
Man
ufa
ctu
res
Pa
pe
r &
Wo
od
P
rod
uct
s, P
rin
tin
g
and
Pu
blic
atio
n a
nd
O
the
r Li
gh
t M
anu
fact
ure
s
Oth
er
Man
ufa
ctu
rin
g
Org
a-
nis
ed
U
no
rg-
anis
ed
Org
a-
nis
ed
U
no
rg-
anis
ed
Org
an-
ise
d
Un
org
-an
ised
O
rgan
ise
d
Un
org
-an
ised
O
rgan
-is
ed
U
no
rg-
anis
ed
Org
an-
ise
d
Un
org
-an
ised
1 A
gri
cult
ure
an
d
Alli
ed
O
rgan
ise
d
0.0
06
5 0
.00
65
0.0
04
4
0.0
04
7 0
.00
22
0.0
022
0
.00
68
0
.00
68
0
.00
12
0.0
023
0
.00
10
0.0
00
3
Un
org
anis
ed
0
.133
7 0
.133
7 0
.39
43
0.3
68
0
0.1
200
0
.120
0
0.1
225
0.1
225
0.0
324
0
.056
2 0
.017
0
0.0
04
6
2 M
anu
fact
ure
d
Foo
d P
rod
uct
s O
rgan
ise
d
0.0
038
0
.00
38
0.0
392
0.0
317
0.0
018
0
.00
18
0.0
00
8
0.0
00
8
0.0
011
0
.00
10
0.0
034
0
.00
09
Un
org
anis
ed
0
.00
12
0.0
012
0
.054
8
0.0
336
0
.00
02
0.0
00
2 0
.00
02
0.0
00
2 0
.00
02
0.0
00
1 0
.00
04
0
.00
01
3 Te
xtile
s O
rgan
ise
d
0.0
015
0
.00
15
0.0
04
9
0.0
055
0
.121
0
0.1
210
0
.010
6
0.0
106
0
.00
40
0
.00
36
0.0
054
0
.00
28
Un
org
anis
ed
0
.00
08
0
.00
08
0
.00
52
0.0
04
9
0.1
112
0.1
112
0.0
114
0
.011
4
0.0
04
1 0
.00
37
0.0
06
1 0
.00
31
4
Leat
her
an
d
Leat
her
M
anu
fact
ure
s
Org
anis
ed
0
.00
00
0
.00
00
0
.00
00
0
.00
00
0
.00
01
0.0
00
1 0
.133
2 0
.133
2 0
.00
01
0.0
00
1 0
.00
04
0
.00
01
Un
org
anis
ed
0
.00
00
0
.00
00
0
.00
00
0
.00
00
0
.00
00
0
.00
00
0
.08
86
0
.08
86
0
.00
01
0.0
00
1 0
.00
02
0.0
00
1
5 P
ap
er
and
Wo
od
P
rod
uct
s, P
rin
tin
g
and
Pu
blic
atio
n
and
Oth
er L
igh
t M
anu
fact
ure
s
Org
anis
ed
0
.00
01
0.0
00
1 0
.012
2 0
.010
2 0
.00
27
0.0
027
0
.00
42
0.0
04
2 0
.076
3 0
.06
64
0
.00
94
0
.00
78
Un
org
anis
ed
0
.00
04
0
.00
04
0
.00
83
0.0
09
8
0.0
030
0
.00
30
0.0
08
2 0
.00
82
0.0
774
0
.071
2 0
.00
94
0
.011
2
6
Oth
er
M
anu
fact
uri
ng
O
rgan
ise
d
0.0
290
0
.028
9
0.0
291
0.0
278
0
.09
49
0
.09
49
0
.08
84
0
.08
84
0
.18
91
0.1
639
0
.28
52
0.2
84
6
Un
org
anis
ed
0
.00
18
0.0
018
0
.00
44
0
.00
47
0.0
102
0.0
102
0.0
170
0
.017
0
0.0
379
0
.032
8
0.0
60
8
0.0
90
4

Pag
e |
50
Tab
le A
2.4
a. I
np
ut–
Ou
tpu
t C
oe
ffic
ien
t M
atri
x f
or
the
12 S
ect
or
Spe
cifi
cati
on
, wit
h O
rgan
ise
d-U
no
rgan
ise
d D
isag
gre
gat
ion
acr
oss
Sec
tors
(S
ect
ors
1-6
), C
on
tin
ue
d
S
. N
o.
Sec
tors
Ag
ricu
ltu
re a
nd
Alli
ed
M
anu
fact
ure
d
Foo
d P
rod
uct
s Te
xtile
s Le
ath
er a
nd
M
anu
fact
ure
s P
ap
er
and
Wo
od
P
rod
., P
rin
tin
g a
nd
P
ub
licat
ion
an
d
Oth
er
Lig
ht
Man
ufa
ctu
res
Oth
er
Man
ufa
ctu
rin
g
O
rga-
nis
ed
U
no
rg-
anis
ed
Org
a-
nis
ed
U
no
rg-
anis
ed
Org
an-
ise
d
Un
org
-an
ised
O
rgan
ise
d
Un
org
-an
ised
O
rgan
-is
ed
U
no
rg-
anis
ed
Org
an-
ise
d
Un
org
-an
ised
7 M
inin
g a
nd
Q
uar
ryin
g
Org
anis
ed
0
.00
52
0.0
052
0
.00
62
0.0
059
0
.00
53
0.0
053
0
.00
64
0
.00
64
0
.010
8
0.0
09
8
0.0
308
0
.029
3
Un
org
anis
ed
0
.00
04
0
.00
04
0
.00
05
0.0
00
5 0
.00
04
0
.00
04
0
.00
04
0
.00
04
0
.00
09
0
.00
08
0
.00
24
0.0
024
8
Ele
ctri
city
an
d G
as
Dis
trib
uti
on
Org
anis
ed
0
.00
42
0.0
04
2 0
.010
1 0
.00
91
0.0
49
0
0.0
49
0
0.0
139
0
.013
9
0.0
382
0.0
333
0.0
430
0
.038
6
Un
org
anis
ed
0
.00
03
0.0
00
3 0
.00
05
0.0
00
5 0
.00
23
0.0
023
0
.00
08
0
.00
08
0
.00
17
0.0
015
0
.00
26
0.0
027
9
Co
nst
ruct
ion
O
rgan
ise
d
0.0
04
0
0.0
04
0
0.0
00
4
0.0
00
4
0.0
00
4
0.0
00
4
0.0
00
4
0.0
00
4
0.0
00
1 0
.00
01
0.0
00
5 0
.00
09
Un
org
anis
ed
0
.00
45
0.0
04
5 0
.00
04
0
.00
04
0
.00
03
0.0
00
3 0
.00
05
0.0
00
5 0
.00
01
0.0
00
1 0
.00
04
0
.00
06
10
Trad
e, H
ote
l an
d
Re
stau
ran
ts
Org
anis
ed
0
.00
18
0.0
018
0
.024
4
0.0
168
0
.00
97
0.0
09
7 0
.011
7 0
.011
7 0
.00
56
0.0
051
0
.00
63
0.0
056
Un
org
anis
ed
0
.015
3 0
.015
3 0
.08
21
0.0
824
0
.08
02
0.0
80
2 0
.137
0
0.1
370
0
.052
2 0
.04
93
0.0
578
0
.052
0
11
Oth
er
Bu
sin
ess
Se
rvic
es
Org
anis
ed
0
.00
35
0.0
04
5 0
.012
3 0
.015
5 0
.052
1 0
.052
1 0
.025
3 0
.025
3 0
.034
8
0.0
313
0.0
263
0.0
309
Un
org
anis
ed
0
.00
48
0
.00
48
0
.018
3 0
.023
1 0
.04
79
0.0
479
0
.037
8
0.0
378
0
.052
1 0
.04
67
0.0
388
0
.04
56
12
Re
st o
f th
e
Serv
ice
s O
rgan
ise
d
0.0
034
0
.00
34
0.0
09
5 0
.012
7 0
.015
5 0
.015
5 0
.013
7 0
.013
7 0
.029
4
0.0
265
0.0
264
0
.025
3
Un
org
anis
ed
0
.00
26
0.0
026
0
.00
49
0
.00
70
0.0
079
0
.00
79
0.0
06
7 0
.00
67
0.0
108
0
.010
0
0.0
115
0.0
105
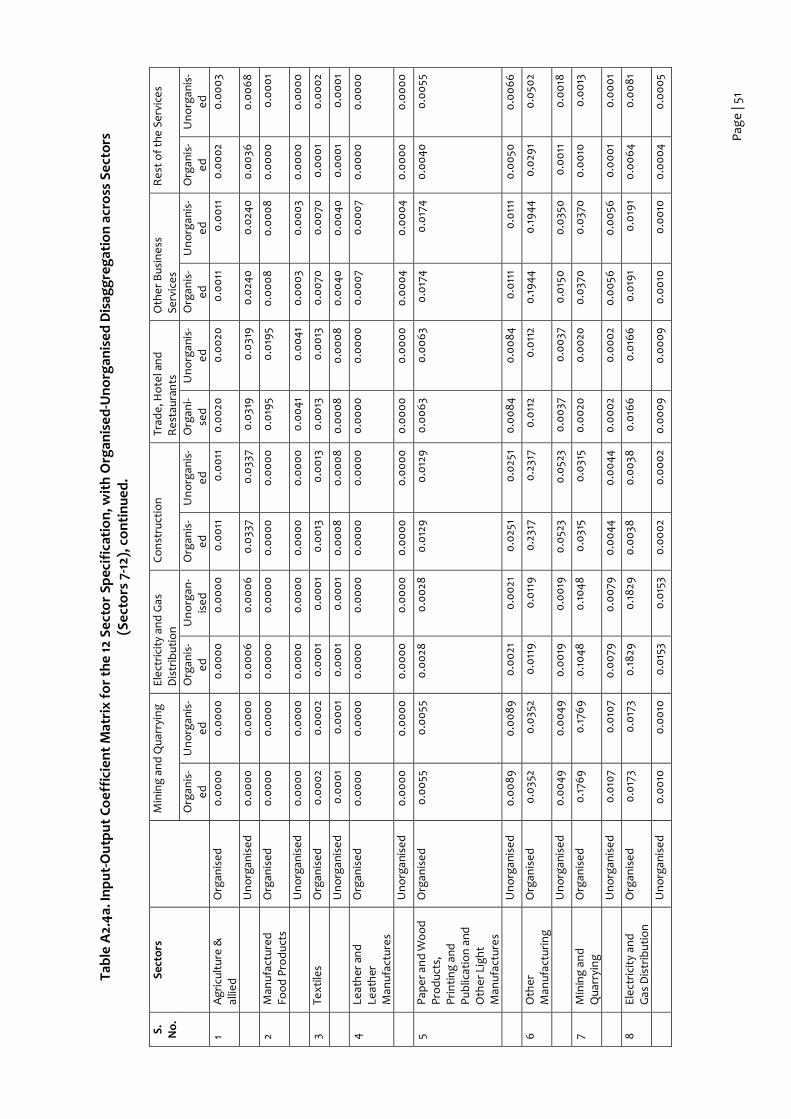
Pag
e |
51
Tab
le A
2.4
a. I
np
ut-
Ou
tpu
t C
oe
ffic
ien
t M
atri
x f
or
the
12 S
ect
or
Spec
ific
atio
n, w
ith
Org
anis
ed
-Un
org
anis
ed
Dis
agg
reg
atio
n a
cro
ss S
ect
ors
(S
ect
ors
7-1
2), c
on
tin
ue
d.
S
. N
o.
Sec
tors
Min
ing
an
d Q
uar
ryin
g
Ele
ctri
city
an
d G
as
Dis
trib
uti
on
C
on
stru
ctio
n
Trad
e, H
ote
l an
d
Re
stau
ran
ts
Oth
er
Bu
sin
ess
Se
rvic
es
Re
st o
f th
e S
erv
ice
s
Org
anis
- e
d
Un
org
anis
-e
d
Org
anis
-e
d
Un
org
an-
ise
d
Org
anis
-e
d
Un
org
anis
-e
d
Org
ani-
sed
U
no
rgan
is-
ed
O
rgan
is-
ed
U
no
rgan
is-
ed
O
rgan
is-
ed
U
no
rgan
is-
ed
1 A
gri
cult
ure
&
allie
d
Org
anis
ed
0
.00
00
0
.00
00
0
.00
00
0
.00
00
0
.00
11
0.0
011
0
.00
20
0.0
020
0
.00
11
0.0
011
0
.00
02
0.0
00
3
Un
org
anis
ed
0
.00
00
0
.00
00
0
.00
06
0
.00
06
0
.033
7 0
.033
7 0
.031
9
0.0
319
0
.024
0
0.0
240
0
.00
36
0.0
06
8
2 M
anu
fact
ure
d
Foo
d P
rod
uct
s O
rgan
ise
d
0.0
00
0
0.0
00
0
0.0
00
0
0.0
00
0
0.0
00
0
0.0
00
0
0.0
195
0.0
195
0.0
00
8
0.0
00
8
0.0
00
0
0.0
00
1
Un
org
anis
ed
0
.00
00
0
.00
00
0
.00
00
0
.00
00
0
.00
00
0
.00
00
0
.00
41
0.0
04
1 0
.00
03
0.0
00
3 0
.00
00
0
.00
00
3 Te
xtile
s O
rgan
ise
d
0.0
00
2 0
.00
02
0.0
00
1 0
.00
01
0.0
013
0
.00
13
0.0
013
0
.00
13
0.0
070
0
.00
70
0.0
00
1 0
.00
02
Un
org
anis
ed
0
.00
01
0.0
00
1 0
.00
01
0.0
00
1 0
.00
08
0
.00
08
0
.00
08
0
.00
08
0
.00
40
0
.00
40
0
.00
01
0.0
00
1
4
Leat
her
an
d
Leat
her
M
anu
fact
ure
s
Org
anis
ed
0
.00
00
0
.00
00
0
.00
00
0
.00
00
0
.00
00
0
.00
00
0
.00
00
0
.00
00
0
.00
07
0.0
00
7 0
.00
00
0
.00
00
Un
org
anis
ed
0
.00
00
0
.00
00
0
.00
00
0
.00
00
0
.00
00
0
.00
00
0
.00
00
0
.00
00
0
.00
04
0
.00
04
0
.00
00
0
.00
00
5 P
ap
er
and
Wo
od
P
rod
uct
s,
Pri
nti
ng
an
d
Pu
blic
atio
n a
nd
O
the
r Li
gh
t M
anu
fact
ure
s
Org
anis
ed
0
.00
55
0.0
055
0
.00
28
0.0
028
0
.012
9
0.0
129
0
.00
63
0.0
06
3 0
.017
4
0.0
174
0
.00
40
0
.00
55
Un
org
anis
ed
0
.00
89
0
.00
89
0
.00
21
0.0
021
0
.025
1 0
.025
1 0
.00
84
0
.00
84
0
.011
1 0
.011
1 0
.00
50
0.0
06
6
6
Oth
er
Man
ufa
ctu
rin
g
Org
anis
ed
0
.035
2 0
.035
2 0
.011
9
0.0
119
0
.231
7 0
.231
7 0
.011
2 0
.011
2 0
.19
44
0
.19
44
0
.029
1 0
.050
2
Un
org
anis
ed
0
.00
49
0
.00
49
0
.00
19
0.0
019
0
.052
3 0
.052
3 0
.00
37
0.0
037
0
.015
0
0.0
350
0
.00
11
0.0
018
7 M
inin
g a
nd
Q
uar
ryin
g
Org
anis
ed
0
.176
9
0.1
769
0
.10
48
0
.10
48
0
.031
5 0
.031
5 0
.00
20
0.0
020
0
.037
0
0.0
370
0
.00
10
0.0
013
Un
org
anis
ed
0
.010
7 0
.010
7 0
.00
79
0.0
079
0
.00
44
0
.00
44
0
.00
02
0.0
00
2 0
.00
56
0.0
056
0
.00
01
0.0
00
1
8
Ele
ctri
city
an
d
Gas
Dis
trib
uti
on
O
rgan
ise
d
0.0
173
0.0
173
0.1
829
0
.18
29
0.0
038
0
.00
38
0.0
166
0
.016
6
0.0
191
0.0
191
0.0
06
4
0.0
08
1
Un
org
anis
ed
0
.00
10
0.0
010
0
.015
3 0
.015
3 0
.00
02
0.0
00
2 0
.00
09
0
.00
09
0
.00
10
0.0
010
0
.00
04
0
.00
05

Pag
e |
52
Tab
le A
2.4
a. I
np
ut–
Ou
tpu
t C
oe
ffic
ien
t M
atri
x f
or
the
12 S
ect
or
Spe
cifi
cati
on
, wit
h O
rgan
ise
d-U
no
rgan
ise
d D
isag
gre
gat
ion
acr
oss
Sec
tors
(S
ect
ors
7-1
2), C
on
clu
de
d.
S
. N
o.
Sec
tors
Min
ing
an
d Q
uar
ryin
g
Ele
ctri
city
an
d G
as
Dis
trib
uti
on
C
on
stru
ctio
n
Trad
e, H
ote
l an
d
Re
stau
ran
ts
Oth
er
Bu
sin
ess
Se
rvic
es
Re
st o
f th
e S
erv
ice
s
O
rga
-n
ise
d
Un
org
-an
ised
O
rga
-n
ise
d
Un
org
-an
ised
O
rgan
-is
ed
U
no
rg-
anis
ed
Org
anis
ed
U
no
rg-
anis
ed
Org
an-
ise
d
Un
org
-an
ised
O
rgan
-is
ed
U
no
rg-
anis
ed
9
Co
nst
ruct
ion
O
rgan
ise
d
0.0
00
8
0.0
00
8
0.0
028
0
.00
28
0.0
012
0
.00
12
0.0
018
0
.00
18
0.0
04
4
0.0
04
4
0.0
156
0
.021
8
Un
org
anis
ed
0
.00
09
0
.00
09
0
.00
29
0.0
029
0
.00
12
0.0
012
0
.00
22
0.0
022
0
.00
30
0.0
030
0
.013
5 0
.018
7
10
Trad
e, H
ote
l an
d
Re
stau
ran
ts
Org
anis
ed
0
.00
23
0.0
023
0
.00
28
0.0
028
0
.00
75
0.0
075
0
.00
61
0.0
06
1 0
.00
56
0.0
056
0
.00
31
0.0
04
7
Un
org
anis
ed
0
.032
8
0.0
328
0
.039
0
0.0
390
0
.06
37
0.0
637
0
.016
0
0.0
160
0
.037
1 0
.037
1 0
.011
1 0
.018
3
11
Oth
er
Bu
sin
ess
Se
rvic
es
Org
anis
ed
0
.013
1 0
.013
1 0
.028
8
0.0
288
0
.019
1 0
.019
1 0
.06
17
0.0
617
0
.027
1 0
.027
1 0
.00
82
0.0
112
Un
org
anis
ed
0
.019
5 0
.019
5 0
.04
30
0.0
430
0
.028
5 0
.028
5 0
.09
22
0.0
922
0
.04
05
0.0
40
5 0
.012
2 0
.016
8
12
Re
st o
f th
e S
erv
ice
s O
rgan
ise
d
0.0
09
1 0
.00
91
0.0
226
0
.022
6
0.0
255
0.0
255
0.0
238
0
.023
8
0.0
40
1 0
.04
01
0.0
154
0
.021
5
Un
org
anis
ed
0
.00
52
0.0
052
0
.00
93
0.0
09
3 0
.00
84
0
.00
84
0
.00
83
0.0
08
3 0
.019
7 0
.019
7 0
.00
80
0
.011
3
Sou
rce:
NC
AE
R c
alcu
lati
on
s.
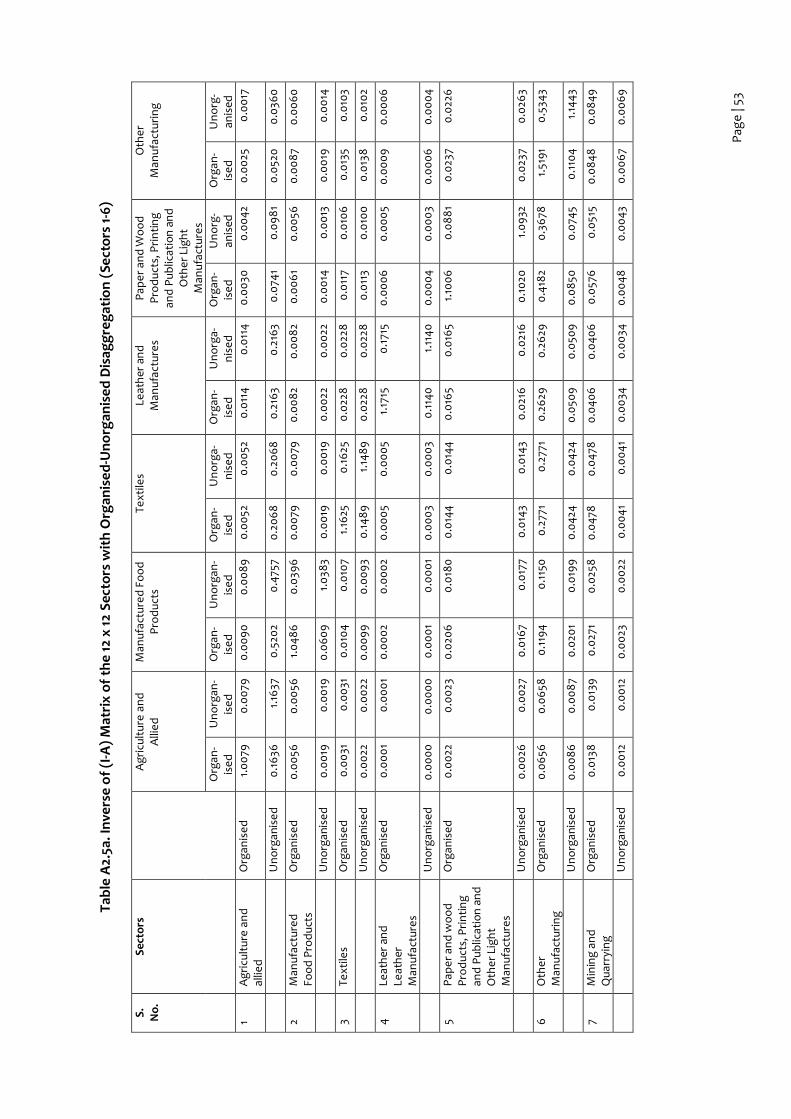
Pag
e |
53
Tab
le A
2.5a
. In
vers
e o
f (I
-A)
Mat
rix
of
the
12 x
12
Sec
tors
wit
h O
rgan
ise
d-U
no
rgan
ise
d D
isag
gre
gat
ion
(Se
cto
rs 1
-6)
S.
No
. S
ecto
rs
A
gri
cult
ure
an
d
Alli
ed
M
anu
fact
ure
d F
oo
d
Pro
du
cts
Text
iles
Leat
her
an
d
Man
ufa
ctu
res
Pa
pe
r an
d W
oo
d
Pro
du
cts,
Pri
nti
ng
an
d P
ub
licat
ion
an
d
Oth
er
Lig
ht
Man
ufa
ctu
res
Oth
er
Man
ufa
ctu
rin
g
Org
an-
ise
d
Un
org
an-
ise
d
Org
an-
ise
d
Un
org
an-
ise
d
Org
an-
ise
d
Un
org
a-
nis
ed
O
rgan
-is
ed
U
no
rga
-n
ise
d
Org
an-
ise
d
Un
org
-an
ised
O
rgan
-is
ed
U
no
rg-
anis
ed
1 A
gri
cult
ure
an
d
allie
d
Org
anis
ed
1.
00
79
0.0
079
0
.00
90
0
.00
89
0
.00
52
0.0
052
0
.011
4
0.0
114
0
.00
30
0.0
04
2 0
.00
25
0.0
017
Un
org
anis
ed
0
.16
36
1.16
37
0.5
202
0.4
757
0.2
06
8
0.2
06
8
0.2
163
0.2
163
0.0
741
0.0
98
1 0
.052
0
0.0
360
2 M
anu
fact
ure
d
Foo
d P
rod
uct
s O
rgan
ise
d
0.0
056
0
.00
56
1.0
48
6
0.0
396
0
.00
79
0.0
079
0
.00
82
0.0
08
2 0
.00
61
0.0
056
0
.00
87
0.0
06
0
Un
org
anis
ed
0
.00
19
0.0
019
0
.06
09
1.
038
3 0
.00
19
0.0
019
0
.00
22
0.0
022
0
.00
14
0.0
013
0
.00
19
0.0
014
3 Te
xtile
s O
rgan
ise
d
0.0
031
0
.00
31
0.0
104
0
.010
7 1.
1625
0
.16
25
0.0
228
0
.022
8
0.0
117
0.0
106
0
.013
5 0
.010
3
Un
org
anis
ed
0
.00
22
0.0
022
0
.00
99
0
.00
93
0.1
48
9
1.14
89
0
.022
8
0.0
228
0
.011
3 0
.010
0
0.0
138
0
.010
2
4
Leat
her
an
d
Leat
her
M
anu
fact
ure
s
Org
anis
ed
0
.00
01
0.0
00
1 0
.00
02
0.0
00
2 0
.00
05
0.0
00
5 1.
1715
0
.171
5 0
.00
06
0
.00
05
0.0
00
9
0.0
00
6
Un
org
anis
ed
0
.00
00
0
.00
00
0
.00
01
0.0
00
1 0
.00
03
0.0
00
3 0
.114
0
1.11
40
0
.00
04
0
.00
03
0.0
00
6
0.0
00
4
5 P
ap
er
and
wo
od
P
rod
uct
s, P
rin
tin
g
and
Pu
blic
atio
n a
nd
O
the
r Li
gh
t M
anu
fact
ure
s
Org
anis
ed
0
.00
22
0.0
023
0
.020
6
0.0
180
0
.014
4
0.0
144
0
.016
5 0
.016
5 1.
100
6
0.0
88
1 0
.023
7 0
.022
6
Un
org
anis
ed
0
.00
26
0.0
027
0
.016
7 0
.017
7 0
.014
3 0
.014
3 0
.021
6
0.0
216
0
.10
20
1.0
932
0
.023
7 0
.026
3
6
Oth
er
Man
ufa
ctu
rin
g
Org
anis
ed
0
.06
56
0.0
658
0
.119
4
0.1
150
0
.277
1 0
.277
1 0
.26
29
0.2
629
0
.418
2 0
.36
78
1.51
91
0.5
343
Un
org
anis
ed
0
.00
86
0
.00
87
0.0
201
0.0
199
0
.04
24
0.0
424
0
.050
9
0.0
509
0
.08
50
0.0
745
0
.110
4
1.14
43
7 M
inin
g a
nd
Q
uar
ryin
g
Org
anis
ed
0
.013
8
0.0
139
0
.027
1 0
.025
8
0.0
478
0
.04
78
0.0
40
6
0.0
40
6
0.0
576
0
.051
5 0
.08
48
0
.08
49
Un
org
anis
ed
0
.00
12
0.0
012
0
.00
23
0.0
022
0
.00
41
0.0
04
1 0
.00
34
0.0
034
0
.00
48
0
.00
43
0.0
06
7 0
.00
69

Pag
e |
54
Tab
le A
2.5a
. In
vers
e o
f (I
-A)
Mat
rix
of
the
12 x
12
Sec
tors
wit
h F
orm
al–
Info
rmal
Dis
agg
reg
atio
n (
Sect
ors
1-6
), C
on
clu
de
d.
S.
No
. S
ecto
rs
A
gri
cult
ure
an
d a
llie
d
Man
ufa
ctu
red
Fo
od
P
rod
uct
s Te
xtile
s Le
ath
er a
nd
M
anu
fact
ure
s P
ap
er
& w
oo
d
Pro
du
cts,
Pri
nti
ng
an
d P
ub
licat
ion
an
d
Oth
er
Lig
ht
Man
ufa
ctu
res
Oth
er
Man
ufa
ctu
rin
g
O
rgan
-is
ed
U
no
rgan
-is
ed
O
rgan
-is
ed
U
no
rgan
-is
ed
O
rgan
-is
ed
U
no
rga
-n
ise
d
Org
an-
ise
d
Un
org
a-
nis
ed
O
rgan
-is
ed
U
no
rg-
anis
ed
Org
an-
ise
d
Un
org
-an
ised
8
Ele
ctri
city
an
d G
as
Dis
trib
uti
on
O
rgan
ise
d
0.0
124
0
.012
4
0.0
330
0
.030
7 0
.10
90
0
.10
90
0
.054
9
0.0
549
0
.09
36
0.0
825
0
.09
98
0
.09
67
Un
org
anis
ed
0
.00
08
0
.00
08
0
.00
20
0.0
019
0
.00
61
0.0
06
1 0
.00
34
0.0
034
0
.00
53
0.0
04
7 0
.00
64
0
.00
66
9
Co
nst
ruct
ion
O
rgan
ise
d
0.0
052
0
.00
52
0.0
04
1 0
.00
40
0
.00
43
0.0
04
3 0
.00
42
0.0
04
2 0
.00
36
0.0
034
0
.00
39
0.0
04
3
Un
org
anis
ed
0
.00
58
0.0
058
0
.00
43
0.0
04
1 0
.00
40
0
.00
40
0
.00
40
0
.00
40
0
.00
32
0.0
031
0
.00
34
0.0
035
10
Trad
e, H
ote
l an
d
Re
stau
ran
ts
Org
anis
ed
0
.00
33
0.0
033
0
.030
6
0.0
222
0.0
184
0
.018
4
0.0
212
0.0
212
0.0
129
0
.011
7 0
.013
6
0.0
131
Un
org
anis
ed
0
.026
8
0.0
269
0
.119
8
0.1
163
0.1
471
0
.14
71
0.2
190
0
.219
0
0.1
112
0.1
021
0
.116
7 0
.112
9
11
Oth
er
Bu
sin
ess
Se
rvic
es
Org
anis
ed
0
.010
3 0
.011
3 0
.035
8
0.0
375
0.0
99
6
0.0
99
6
0.0
68
2 0
.06
82
0.0
741
0.0
66
4
0.0
64
2 0
.06
99
Un
org
anis
ed
0
.014
3 0
.014
4
0.0
518
0
.054
5 0
.10
91
0.1
09
1 0
.10
00
0
.10
00
0
.10
96
0
.09
83
0.0
94
3 0
.10
29
12
Re
st o
f th
e
Serv
ice
s O
rgan
ise
d
0.0
08
9
0.0
09
0
0.0
266
0
.029
0
0.0
471
0
.04
71
0.0
44
0
0.0
44
0
0.0
638
0
.057
3 0
.059
3 0
.059
7
Un
org
anis
ed
0
.00
52
0.0
052
0
.012
9
0.0
147
0.0
225
0.0
225
0.0
203
0.0
203
0.0
258
0
.023
4
0.0
261
0.0
257
Sou
rce:
NC
AE
R c
alcu
lati
on
s.

Pag
e |
55
Tab
le A
2.6
b. I
nve
rse
of
(I-A
) M
atri
x o
f th
e 12
x 1
2 S
ect
ors
wit
h O
rgan
ise
d-U
no
rgan
ise
d D
isag
gre
gat
ion
(S
ect
ors
7-1
2)
S
. N
o.
Sec
tors
Min
ing
an
d
Qu
arry
ing
E
lect
rici
ty a
nd
Gas
D
istr
ibu
tio
n
Co
nst
ruct
ion
Tr
ade
, Ho
tel a
nd
R
est
aura
nts
O
the
r B
usi
ne
ss
Serv
ice
s R
est
of
the
Se
rvic
es
Org
an-
ise
d
Un
org
an-
ise
d
Org
an-
ise
d
Un
org
an-
ise
d
Org
an-
ise
d
Un
org
a-
nis
ed
O
rgan
-is
ed
U
no
rga
-n
ise
d
Org
an-
ise
d
Un
org
-an
ised
O
rgan
-is
ed
U
no
rg-
anis
ed
1 A
gri
cult
ure
an
d
Alli
ed
O
rgan
ise
d
0.0
00
5 0
.00
05
0.0
00
6
0.0
00
6
0.0
026
0
.00
26
0.0
031
0
.00
31
0.0
024
0
.00
25
0.0
00
5 0
.00
08
Un
org
anis
ed
0
.00
97
0.0
09
7 0
.012
7 0
.012
7 0
.06
51
0.0
651
0
.06
24
0.0
624
0
.052
5 0
.053
2 0
.010
9
0.0
179
2 M
anu
fact
ure
d F
oo
d
Pro
du
cts
Org
anis
ed
0
.00
18
0.0
018
0
.00
21
0.0
021
0
.00
47
0.0
04
7 0
.022
4
0.0
224
0
.00
46
0
.00
47
0.0
010
0
.00
16
Un
org
anis
ed
0
.00
04
0
.00
04
0
.00
05
0.0
00
5 0
.00
11
0.0
011
0
.00
59
0.0
059
0
.00
12
0.0
013
0
.00
02
0.0
00
4
3 Te
xtile
s O
rgan
ise
d
0.0
021
0
.00
21
0.0
024
0
.00
24
0.0
070
0
.00
70
0.0
04
7 0
.00
47
0.0
134
0
.013
6
0.0
012
0
.00
19
Un
org
anis
ed
0
.00
17
0.0
017
0
.00
19
0.0
019
0
.00
61
0.0
06
1 0
.00
34
0.0
034
0
.00
99
0
.010
1 0
.00
11
0.0
017
4
Leat
her
an
d L
eat
her
M
anu
fact
ure
s O
rgan
ise
d
0.0
00
1 0
.00
01
0.0
00
2 0
.00
02
0.0
00
3 0
.00
03
0.0
00
3 0
.00
03
0.0
012
0
.00
12
0.0
00
1 0
.00
01
Un
org
anis
ed
0
.00
01
0.0
00
1 0
.00
01
0.0
00
1 0
.00
02
0.0
00
2 0
.00
02
0.0
00
2 0
.00
08
0
.00
08
0
.00
00
0
.00
01
5 P
ap
er
and
wo
od
P
rod
uct
s, P
rin
tin
g
and
Pu
blic
atio
n a
nd
O
the
r Li
gh
t M
anu
fact
ure
s
Org
anis
ed
0
.011
8
0.0
118
0
.010
0
0.0
100
0
.026
3 0
.026
3 0
.014
1 0
.014
1 0
.029
3 0
.029
8
0.0
074
0
.010
5
Un
org
anis
ed
0
.015
9
0.0
159
0
.00
94
0
.00
94
0
.039
0
0.0
390
0
.015
3 0
.015
3 0
.023
2 0
.023
7 0
.00
87
0.0
121
6
Oth
er
Man
ufa
ctu
rin
g
Org
anis
ed
0
.09
94
0
.09
94
0
.08
48
0
.08
48
0
.429
5 0
.429
5 0
.09
55
0.0
955
0
.36
32
0.3
739
0
.072
8
0.1
161
Un
org
anis
ed
0
.017
2 0
.017
2 0
.015
0
0.0
150
0
.09
43
0.0
94
3 0
.018
6
0.0
186
0
.04
92
0.0
720
0
.00
99
0
.015
2
7 M
inin
g a
nd
Q
uar
ryin
g
Org
anis
ed
1.
2313
0
.231
3 0
.174
2 0
.174
2 0
.073
1 0
.073
1 0
.022
1 0
.022
1 0
.078
2 0
.079
9
0.0
09
9
0.0
143
Un
org
anis
ed
0
.014
3 1.
014
3 0
.013
0
0.0
130
0
.00
77
0.0
077
0
.00
22
0.0
022
0
.00
89
0
.00
90
0
.00
09
0
.00
13
8
Ele
ctri
city
an
d G
as
Dis
trib
uti
on
O
rgan
ise
d
0.0
376
0
.037
6
1.24
37
0.2
437
0
.04
43
0
.04
43
0
.035
7 0
.035
7 0
.057
4
0.0
593
0.0
153
0.0
215
Un
org
anis
ed
0
.00
24
0.0
024
0
.020
0
1.0
200
0
.00
28
0.0
028
0
.00
22
0.0
022
0
.00
35
0.0
036
0
.00
10
0.0
014
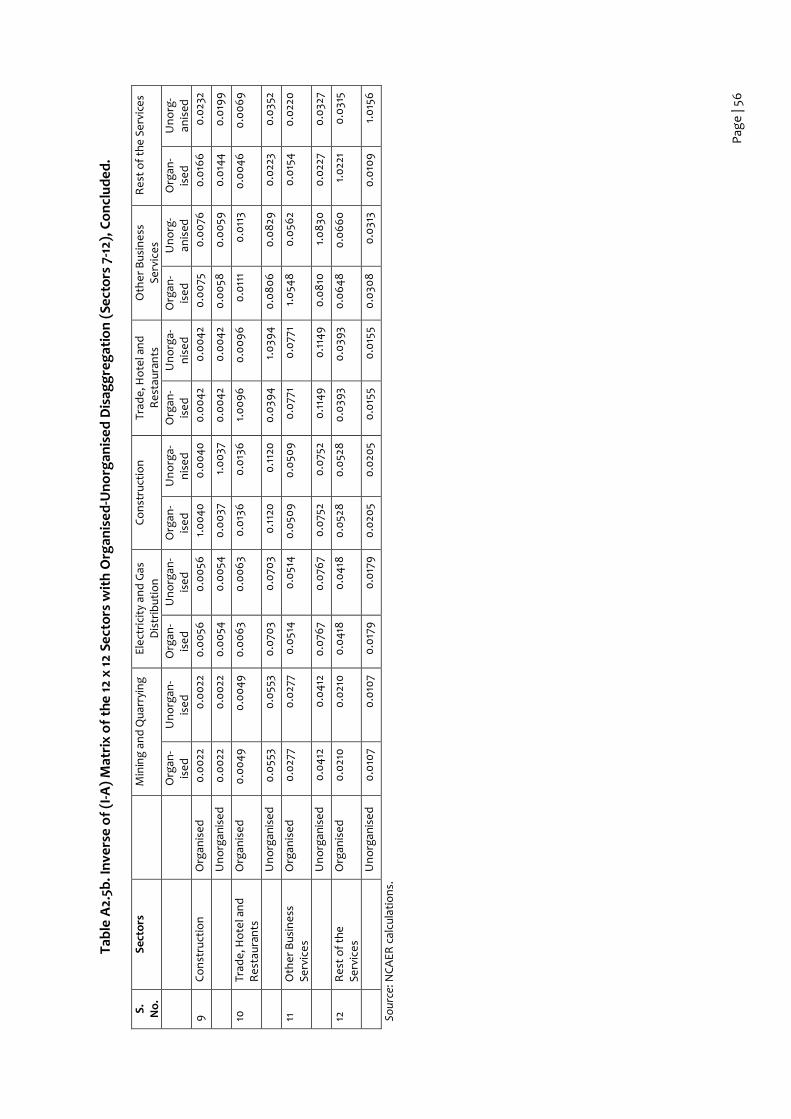
Pag
e |
56
Tab
le A
2.5b
. In
vers
e o
f (I
-A)
Mat
rix
of
the
12
x 1
2 Se
cto
rs w
ith
Org
anis
ed
-Un
org
anis
ed
Dis
agg
reg
atio
n (
Se
cto
rs 7
-12)
, Co
ncl
ud
ed
.
S.
No
. S
ecto
rs
M
inin
g a
nd
Qu
arry
ing
E
lect
rici
ty a
nd
Gas
D
istr
ibu
tio
n
Co
nst
ruct
ion
Tr
ade
, Ho
tel a
nd
R
est
aura
nts
O
the
r B
usi
ne
ss
Serv
ice
s R
est
of
the
Se
rvic
es
O
rgan
-is
ed
U
no
rgan
-is
ed
O
rgan
-is
ed
U
no
rgan
-is
ed
O
rgan
-is
ed
U
no
rga
-n
ise
d
Org
an-
ise
d
Un
org
a-
nis
ed
O
rgan
-is
ed
U
no
rg-
anis
ed
Org
an-
ise
d
Un
org
-an
ised
9
Co
nst
ruct
ion
O
rgan
ise
d
0.0
022
0
.00
22
0.0
056
0
.00
56
1.0
04
0
0.0
04
0
0.0
04
2 0
.00
42
0.0
075
0
.00
76
0.0
166
0
.023
2
Un
org
anis
ed
0
.00
22
0.0
022
0
.00
54
0.0
054
0
.00
37
1.0
037
0
.00
42
0.0
04
2 0
.00
58
0.0
059
0
.014
4
0.0
199
10
Trad
e, H
ote
l an
d
Re
stau
ran
ts
Org
anis
ed
0
.00
49
0
.00
49
0
.00
63
0.0
06
3 0
.013
6
0.0
136
1.
00
96
0
.00
96
0
.011
1 0
.011
3 0
.00
46
0
.00
69
Un
org
anis
ed
0
.055
3 0
.055
3 0
.070
3 0
.070
3 0
.112
0
0.1
120
0
.039
4
1.0
394
0
.08
06
0
.08
29
0.0
223
0.0
352
11
Oth
er
Bu
sin
ess
Se
rvic
es
Org
anis
ed
0
.027
7 0
.027
7 0
.051
4
0.0
514
0
.050
9
0.0
509
0
.077
1 0
.077
1 1.
054
8
0.0
562
0.0
154
0
.022
0
Un
org
anis
ed
0
.04
12
0.0
412
0
.076
7 0
.076
7 0
.075
2 0
.075
2 0
.114
9
0.1
149
0
.08
10
1.0
830
0
.022
7 0
.032
7
12
Re
st o
f th
e
Serv
ice
s O
rgan
ise
d
0.0
210
0
.021
0
0.0
418
0
.04
18
0.0
528
0
.052
8
0.0
393
0.0
393
0.0
64
8
0.0
66
0
1.0
221
0.0
315
Un
org
anis
ed
0
.010
7 0
.010
7 0
.017
9
0.0
179
0
.020
5 0
.020
5 0
.015
5 0
.015
5 0
.030
8
0.0
313
0.0
109
1.
015
6
Sou
rce:
NC
AE
R c
alcu
lati
on
s.
Page | 57
Appendix 3. Details of Calculation of the Contribution of the Microfinance Sector to Gross Value Added and Employment
Table A3.1. Contribution of the Microfinance Sector to Gross Value Added and Employment
S. No. Parameter Units Value
Part I. NBFC-MFIs
1 Output multiplier for the financial sector (Based on the I–O Table for 15x15 sectors)
Parameter 1.4711
2 GVA/GVO ratio for the financial sector (Based on the data from National Accounts Statistics)62
Ratio 0.7459
3 GVA of NBFC-MFIs (2018-19) (Calculated based on data available from MFIN and RBI’s Report on Trend and Progress of Banking in India, 2018-19)
Rs crore 6,830
4 GVO of NBFC-MFIs (GVO/GVA) * GVA of NBFC-MFIs
Rs crore 9,160
5 Estimated output of the economy due to the direct and indirect effect of NBFC-MFI Operations (Output multiplier in Sl. No. 1* GVO)
Rs crore 13,475
Forward linkages of Microfinance
6 Loans disbursed by NBFC-MFIs (Data from Annual Reports of MFIN)
Rs crore 78,818
7 Loans disbursed for productive purposes (90% Sl. No. 6)
Rs crore 70,936
8 Output of MFAS attributable to loans from NBFC-MFIs (73% of S. No. 7, assuming that the value equals two-third of the loans towards repayment and 6% of the total loan amount as interest cost for the period)
Rs crore 51,783
9 Output multiplier for the MFAS (Based on 12x12 sector organised-unorganised I–O system)
1.9705
10 Output due to the forward linkages of microfinance NBFC-MFI to MFAS (Multiplier in S. No. 9 * Output in S. No. 8)
Rs crore 102,039
11 Output of the economy as a result of Microfinance operations NBFC-MFIs (S. No. 5 + S. No. 10)
Rs crore 115,510
Contribution to Value Added
12 GVA multiplier for the financial sector (Based on the 15x15 sector I–O System and the ratio of GVA/GVO in the organised sector)
0.9258
62 https://www.mospi.gov.in/web/mospi/reports-publications/-/reports/view/templateFive/901?q=RPCAT
Page | 58
S. No. Parameter Units Value
13 GVA multiplier for MFAS (Based on the 12x12 sector organised- unorganised I–O system) (From 12 x 12 sector organised–unorganised I-O system)
0.9025
Total contribution of NBFC-MFIs to GVA
14 Direct and indirect backward linkages S. No. 5 * S. No. 12
12,471
15 Through forward linkages (using contribution by MFAS) (S. 10 * S. No. 13)
92,090
16 Total contribution of NBFC-MFIs to GVA (S. No. 14 + S. No. 15)
Rs crore 104,561
17 As % of overall GVA of the economy (100*(S. No. 16/GVA of the economy))
% 0.61
Employment
18 Direct and indirect backward linkages (Employment Multiplier for Financial Sector * Output multiplier for the NBFC-MFIs * GVO of NBFC-MFIs (Based on 15x15 sector IO System))
Lakh jobs 1.20
19 From direct and indirect forward linkages (Employment Multiplier for MFAS from 12x12 sector * Output multiplier for MFAS * GVO of MFAS due to NBFC-MFI loans)
Lakh jobs 37.34
20 Total (S. No. 18 + S. No. 19)
Lakh jobs 38.54
Part II: Total Contribution of the Total Microfinance Sector to GVA
21 Overall loans disbursed by the microfinance sector (Data from Annual Reports of MFIN and NABARD)
Rs crore 259,767
22 Ratio of loans by NBFC-MFIs to overall loans by the sector (Calculated using overall loans including SHG loans)
Ratio 0.30
23 Contribution to GVA by the entire microfinance sector (S. No. 16/S. No. 22)
% 2.03
Employment
24 Total (direct, indirect and forward linkages) (S. No. 20/S. No. 22)
Lakh jobs 128.46
Source: NCAER analysis.


NATIONAL COUNCIL OF APPLIED ECONOMIC RESEARCH
NCAER India Centre, 11 Indraprastha Estate, New Delhi 110 002, India Tel: +91-11-2345-2657, 6120-2698 [email protected] www.ncaer.org
NCAER | Quality . Relevance . Impact
Copyright © 2022 FDOKUMEN

