![Intrinsically Conductive Organo-Silver Linear Chain Polymers [– S–Ag–S–biphenyl–]n assembled on Roughened Elemental Silver](https://static.fdokumen.com/doc/165x107/632805dd6989153a060bbeb3/intrinsically-conductive-organo-silver-linear-chain-polymers-sagsbiphenyln.jpg)


Bahasa
Halaman
Hukum


To appear in:
Turbulence, Heat and Mass Transfer 6
Proc. 6th Int. Symp. On Turbulence, Heat and Mass Transfer, ‘THMT’09’
Rome, Italy, 14-18 September 2009 (www.THMT-09.org)
* The electronic version of this paper can be found on www.CFDtm.org.
1
Preprint*: Thermal-Hydraulic Analysis of Flow in Rib-
Roughened Passages with application to Gas-cooled
Nuclear Reactors
A. Keshmiri1, M.A. Cotton
2, Y. Addad
3 and D. Laurence
4
School of Mechanical, Aerospace and Civil Engineering, The University of Manchester,
Manchester M60 1QD, UK. [email protected]
Abstract – The present paper reports RANS simulations of the flow and heat transfer in a 2-dimensional rib-
roughened passage. Rib pitch-to-height ratios of 6, 9, and 12 are examined. The blockage ratio of the
transversely-mounted rectangular ribs is 10%, making the case ‘very rough’. The Reynolds number, based on the
channel bulk velocity and hydraulic diameter, is 30,000. Three low-Reynolds-number linear EVMs, namely the
Lien-Chen-Leschziner k-ε model, the Menter k-ω-SST model, and a variant of Durbin’s v2-f formulation are
examined. Results for a square rib profile are compared to those for the rib profile used in the fuel pins of
Advanced Gas-cooled Reactors. All computations are undertaken using the commercial CFD code ‘STAR-CD’.
In comparison with experimental data, it emerges that the v2-f model generally returns more accurate results than
the k-ε or k-ω-SST closures.
1. Introduction Rough surfaces are widely used to enhance convective heat transfer by the promotion of
higher turbulence levels. The penalty associated with such roughening is an increase in drag
and consequently much effort has been devoted to the optimization of roughness designs.
The principal application of the present work is to the rib-roughened fuel pins of the UK
fleet of Advanced Gas-cooled Reactors (AGRs). Results presented below are for a 2D-plane
passage, this study forming a precursor to the simulation of the more complex reactor
geometry.
Laboratory studies of flow over repeated-rib surfaces date back at least as far as 1950s;
see, for example, the discussion of Webb, Eckert and Goldstein [1]. In their own experimental
programme Webb et al. investigated pipe flow with repeated rectangular ribs, focusing upon
the effects of geometrical factors on flow resistance and heat transfer (Reynolds and Prandtl
number effects were also studied). In line with established findings for sand-roughened
surfaces (see Schlichting [2] for example), it was found that flow resistance and heat transfer
levels increased with relative roughness (i.e. the ratio of rib height to pipe diameter, k/D).
Pitch-to-height ratios of 10 ≤ P/k ≤ 40 were examined and it was established that flow
resistance and heat transfer decreased monotonically as P/k was increased over this range.
The maximum value of relative roughness studied by Webb et al. was k/D = 0.04. Han,
Glicksman and Rohsenow [3] later conducted experiments on a rectangular channel with rib-
roughened upper and lower walls. k/De was extended up to 0.102 (the equivalent diameter is
defined as De = 4x[flow area]/[wetted perimeter]). The work of Han et al. encompassed an
examination of the effect of rib cross-section on the flow thermal-hydraulics: it was
established that rib profile had a significant effect on the flow resistance, but only a very
limited effect on heat transfer. The years from the late-1970s to the present day have
witnessed a continuing high level of experimental activity related to flow over ribbed (and
other roughened) surfaces. A recent review is given by Jiménez [4] who pays particular
attention to very rough surfaces (discussed further below).

THMT6 Preprint 20/06/2009
2
In the CFD simulations reported in Section 3 below, we focus on the data of Rau et al. [5]
who employed two geometrically (and dynamically) similar square cross-section test sections:
a smaller one for heat transfer measurements and a larger version designed to give good
resolution of the flow field. Air was the working fluid, and the Reynolds number based on the
bulk velocity and equivalent diameter was fixed at Re = 30,000. In both cross-sections square
ribs could be mounted on the lower surface only (‘1s’; Figure 1), or on both the lower and
upper surfaces (‘2s’). In all cases, a large blockage ratio was imposed (k/H = 0.1) and the
surfaces may be considered to have a high degree of roughness. Rau et al. reported 1s channel
results for P/k = 6, 9, and 12, while P/k was set to 9 in the 2s section. For comparison, the
helical ribs of AGR fuel pins have a pitch-to-height ratio P/k ≈ 5.5 – 6.5, the exact value
depending upon whether pitch is measured normal to the ribs or in the axial direction
(Fairbairn [6]).
Complementing experimental research in the area, the CFD/RANS community has been
active in the computation of flow over ribbed surfaces. Acharya et al. [7] used linear and non-
linear (quadratic) k-ε EVMs to make comparison with their own experimental data for flow in
a channel with a rib-roughened, and heated, lower wall. The high-Reynolds-number
turbulence models were coupled with ‘wall functions’. The two models returned similar
results; in particular both yielded values of Nusselt number that were significantly lower than
the data. This failing is due, at least in part, to the adoption of the wall function approach, it
having been established for some time that the strategy performs poorly in separated flows
(Rodi [8]).
Low-Reynolds-number forms of the k-ε model were examined by Iacovides and Raisee
[9]. Despite the inclusion of length scale correction terms in the ε-equation, it was found that
the models returned too high levels of heat transfer for flow over ribbed surfaces, cf. Acharya
et al. [7], above. These apparently conflicting findings are discussed further below in the
context of the present results.
Ooi et al. [10] employed a form of the v2-f model that is very similar to the one described
in Section 2. A full 3D solution was undertaken in [10]; comparison with the symmetry plane
heat transfer data of Rau et al. [5] showed good agreement between the v2-f model and the
measurements. However, model response to secondary flows resulted in poorer results at the
channel side-walls.
As noted above, the flow channels studied experimentally by Rau et al. [5], and simulated
here, are very rough, with k/H = 0.1. Jiménez [4] uses an approximate analysis to show that
roughness effects might be expected to extend well into the logarithmic region for flows in
which δ/k ≤ 40 (or k/δ ≥ 0.025; δ is a boundary layer thickness or channel half-width). The
extent to which a log layer survives in the present case is examined in Section 3, below.
In relation to AGR fuel channels, the present authors estimate on the basis of design data
provided by Fairbairn [6] that k/De is an order of magnitude less than the k/H value in the
experiments of [5]. Nevertheless, the ratio of k to De in AGRs is still sufficiently high to raise
the possibility that there will be significant restructuring of the logarithmic layer. (Also, the
distance between adjacent fuel pins is somewhat less than De; consequently normalization of k
by inter-pin distance will indicate a greater degree of relative roughness.)
Figure 1 – Schematic diagram of a rib-roughened surface.

A. Keshmiri et al.
3
2. Physical and Numerical Formulations 2.1 Mean Flow Equations
The mean flow equations for steady and incompressible forced convection flow are written as
follows:
Continuity
0=∂
∂
j
j
x
U (1)
Momentum
∂
∂+
∂
∂+
∂
∂−=
j
it
ji
i
x
U
xx
p
Dt
DU)(
1νν
ρ (2)
Energy
∂
∂
+
∂
∂=
jt
t
j x
T
rPxDt
DT
σ
νν (3)
The turbulent Prandtl number is set to a constant value, tσ = 0.9.
2.2 Numerical Procedures
The commercial code ‘STAR-CD’ [11] is used to generate results using the low-Reynolds-
number k-ε model of Lien, Chen and Leschziner [12] (‘LRN k-ε model’, below), the k-ω-SST
model of Menter [13] (‘LRN k-ω-SST model’), and a variant of Durbin’s v2-f model due to
Iaccarino [14] (‘v2-f model’). In earlier works by the authors and their colleagues, the
turbulence models in STAR-CD have been validated against in-house and industrial codes
with the same turbulence models [15, 16].
All fluid properties are assumed to be constant. The momentum and turbulence transport
equations are discretized using second-order central differencing and first-order upwind
differencing schemes, respectively. The energy equation is discretized using the ‘Monotone
Advection and Reconstruction Scheme’ (MARS) [11]. The SIMPLE algorithm is adopted for
pressure-velocity correction.
A number of carefully-conducted sensitivity tests have been applied to ensure the
numerical reliability of the computations.
2.3 Geometry and Grid
The configurations considered here consist of 2-dimensional channels, the lower walls of
which are roughened by square ribs of height k. The computational domain is of length 2P,
i.e. it includes 2 ribs. Streamwise periodicity is assumed and cyclic boundary conditions are
applied at the inlet and outlet planes. In the 1s case the domain is of height H (Figure 2 (a)),
whereas for the 2s channel symmetry permits the use of a domain of height H/2 (Figure 2 (b)).
The thermal boundary condition at both the lower and upper walls of the 1s case is one of the
same uniform wall heat flux. As noted above, the upper boundary of the 2s domain is a
symmetry plane.
The rib height to channel hydraulic diameter ratio in the present simulations is k/De = 0.05,
and the blockage ratio (k/H) is 10%. The Reynolds number based on hydraulic diameter is
fixed at Re = 30,000. Prandtl number is set to 0.71.
There is an unavoidable discrepancy between the square cross-sectioned experimental
channel and the present two-dimensional simulations, namely that the equivalent diameter of
the square channel is equal to H, whereas De = 2H in the 2D case. In order to overcome this
difficulty, at least partially, the bulk velocity is set to one-half of the experimental value (and
hence the Reynolds numbers based on equivalent diameter are equal). The rib height, k is
maintained at the experimental value and therefore the blockage ratio, k/H, rather than k/De, is

THMT6 Preprint 20/06/2009
4
matched. There remains, however, a lack of geometric similarity, this being due to the
differing ratios of ribbed-to-smooth surfaces in the experimental and computational cases (1:3
vs. 1:1 in the 1s case; 1:1 vs. 1:0 for the 2s channel). Finally, as a general observation, it is
noted that Rau et al. report significant 3D features in the flow.
(a)
(b)
Figure 2 – The computational domains used in the present work: (a) 1s configuration, (b) 2s
configuration. The results presented below were generated using structured Cartesian grids with cell
counts of 133,000 (P/k = 6), 161,000 (P/k = 9), 189,000 (P/k = 12), and 111,000 (P/k = 9; 2s).
Since low-Reynolds-number turbulence models are employed, the grids were generated so as
to be very fine near the wall (the wall-adjacent cell typically extends only to y+ ≤ 0.5).
The effects of changing the rib profile have also been studied by comparing the ‘Square
Rib Profile’ (SRP) above to the rib profile used in the fuel pins of current AGRs. This latter
design is known as a ‘Multi-Start Rib Profile’ (MSRP). The mesh used for this case is a
structured Cartesian grid with 112,000 cells.
2.4 Turbulence Models
Three turbulence models of the Eddy Viscosity class are examined in the present study. While
all three closures eventually trace their roots to the ‘standard’, or ‘parent’, EVM of Launder
and Spalding [17], they embody quite distinct modifications to that scheme. The models do,
however, share common features in that they are all linear and of the ‘low-Reynolds-number’
type (in common with the widely-adopted extension of the Launder-Spalding scheme
proposed by Launder and Sharma [18]). It follows that the systems of governing equations are
integrated over the entire flow domain, there being no need to employ wall functions in wall-
adjacent regions.
The models as coded into STAR-CD conform to the original published versions (di Mare
[19]).
‘Baseline’ k-ε model
The low-Reynolds-number linear version of the k-ε model of Lien, Chen and Leschziner [12]
is adopted as a ‘baseline’ formulation against which two more complex EVMs are compared.
It is noted that Lien et al. evaluated the effects of including quadratic and cubic elements in
the stress/strain relation. Pertinent to the current investigation, the latter form was shown to
yield an improved performance in the computation of a separated hill flow. (As part of the
wider remit of this work, the present authors intend to examine non-linear EVMs in a
subsequent stage of the study.)
The closure of [12] carries two turbulence transport equations, i.e. the k- and ε-transport
equations, the latter being somewhat modified from the standard form of [17, 18].
As with the other schemes, the full equations of the Lien et al. model will not be quoted
here, and the interested reader is referred to the original work and the STAR-CD manual. It is,
however, of importance to highlight the eddy viscosity expression of the model; νt is
prescribed as

A. Keshmiri et al.
5
εν µµ /2kfCt = (4)
where the ‘damping function’, fµ reads
( ) ( )( )yy eReRf /29.51)0198.0exp(1 +−−=µ (5)
and
ν
kyeR y = (6)
where y is the normal distance to the closest wall. The use of y in a turbulence model
implicitly assumes that the flow possesses features of ‘universality’. It is of particular
significance that y is adopted in Eqns. (4)-(6) because the constitutive equation provides the
only input from the turbulence field to the mean flow.
k-ω-SST model
The k-ω-SST model is the second two-equation EVM to be considered in the present work. ω,
the large-scale turbulence frequency, is broadly equivalent to ε/k. In its essential features the
ω-transport equation may be obtained by formally manipulating the k- and ε-equations,
although in so doing a cross-diffusion term arises in the ω-equation. That term is omitted in
the standard k-ω model (Wilcox [20]), and therefore there is not a strict equivalence between
the k-ε and k-ω formulations.
Menter [13] developed a combined k-ω/k-ε model in which a blending function, F1 is
included in the ω-equation. A term (1-F1) multiplies the ‘exact’ cross-diffusion term
discussed above. Thus, when F1 ≈ 1 (in the viscous sublayer and logarithmic region of a
smooth wall boundary layer) the original ω-transport equation of [20] is recovered. On the
other hand, as F1 → 0 in the outer flow the model reverts to standard k-ε format. Linear
blending as a function of F1 is also applied to the model constants (these differing in the k-ω
and k-ε schemes).
In the same paper Menter proceeded to develop a k-ω-SST (or Shear Stress Transport)
model; it is this second formulation that is adopted in the present work. The SST scheme
departs from the initial k-ω/k-ε formulation of [13] in terms of the values assigned to the
model constants and by virtue of the introduction of a new expression for νt which includes a
dependence on a second blending function, F2. It is noted that both F1 and F2 are dependent
on wall distance, y (cf. the Lien et al. model [12], above)
v2-f model
The final model to be considered here is the ‘v2-f model’ which was first proposed by Durbin
[21] (v is the wall-normal fluctuating velocity). Damping in the v2-f scheme is related to the
diminution of the 2v /k that occurs as a wall is approached (see Launder [22], for example):
Tkk
vCt
2
µν = (7)
The large-scale turbulence timescale is truncated on the Kolmogorov scale,
=
5.0
,maxεε
vC
kT kT (8)
In terms of the number of differential equations carried, the v2-f model is the most complex
of the schemes to be examined here. Equations for k- and ε-transport are complemented by an

THMT6 Preprint 20/06/2009
6
equation for 2v -transport and an elliptic relaxation equation for f22, a re-distribution term that
appears in the 2v -equation.
The form of the v2-f model implemented in STAR-CD is that given by Iaccarino [14]. The
v2-f formulation is the only one of those to be examined here not to include any direct
dependence on wall distance. (In fact, in an earlier version of the general form of [14], Durbin
[23] included a y-dependent function in the production term of the ε-equation, but that was
subsequently modified by Iaccarino to eliminate wall distance dependence.)
3. Results and Discussion 3.1 Performance of the Turbulence Models
Local Nusselt number is defined here as
)( bw
e
TT
DqNu
−=
λ
& (9)
As in Rau et al. [5], all Nusselt number distributions for the ribbed duct calculations are
normalized by the value associated with a smooth passage (the Dittus-Boelter equation):
4.08.00 023.0 rPeRNu = (10)
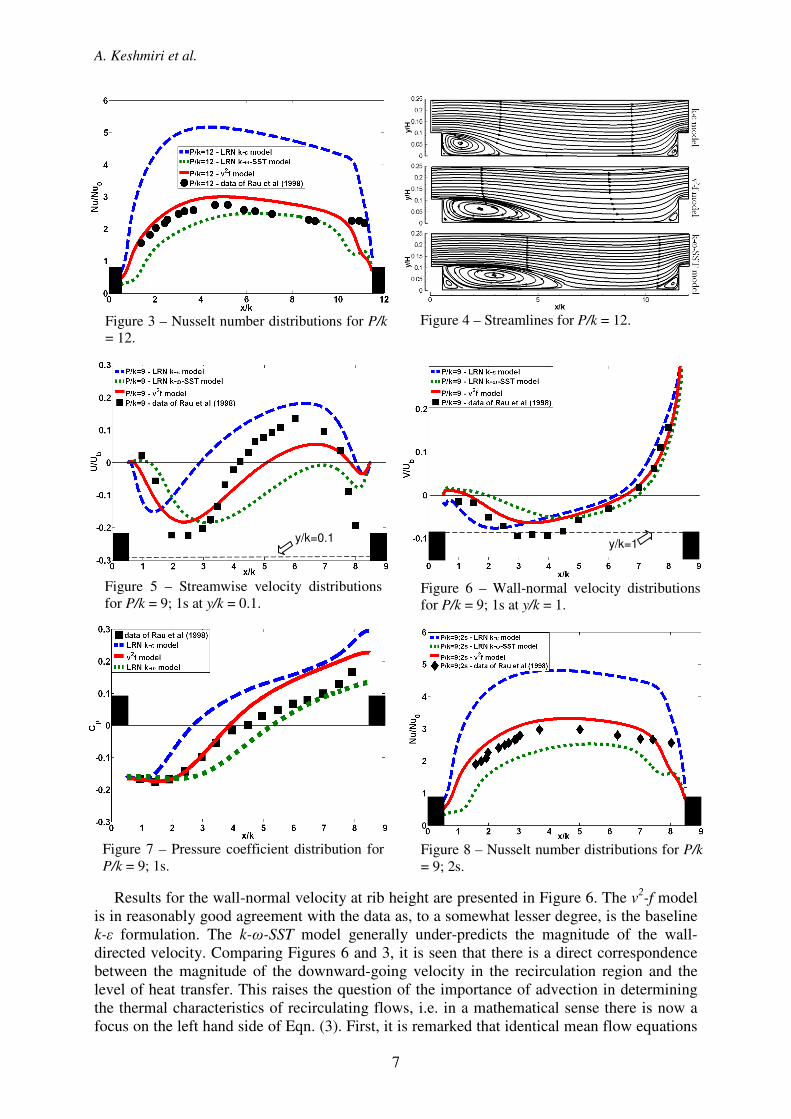
Figure 3 compares the heat transfer results of the k-ε, k-ω-SST, and v2-f models with the
experimental data of [5] for the 1s channel with P/k = 12. The region of maximum heat
transfer corresponds to the location of the re-attachment point (compare Figures 3 and 4). The
k-ε model clearly returns levels of heat transfer that are far too high. Such a result might be
anticipated from the findings of Iacovides and Raisee [9]: the length scale correction they
employed in combination with a low-Reynolds-number k-ε model acts to increase ε and thus
reduce νt (however Nu was still over-predicted, albeit by a smaller margin than that seen
here).
The turbulence length scale plays a critical role in the computation of separated flows. It
was remarked in the Introduction that the use of a high-Reynolds-number k-ε model coupled
with wall functions (Acharya et al. [7]) gave rise to an under-prediction of heat transfer levels.
The same result was found when a k-ε model was blended with a near-wall k-l form (l being a
prescribed length scale; Iacovides [24] and Ooi et al. [10]). In fact, there are two related
mechanisms at work – one alluded to already that concerns the diffusivity of the thermal field,
and the other is an ‘indirect’ effect related to the mean dynamic field and hence the advective
terms of the Energy Equation, Eqn. (3). This point is expanded below in connection with
Figure 6.
The k-ω-SST model is closer than the k-ε model to the data in Figure 3, but it is the v2-f
formulation that is in the closest, although still not excellent, accord with the measurements.
Ooi et al. [10] made comparison with the data of [5] using a v2-f formulation that differs only
slightly from the present form (Section 1, above). The 3D computations of [10] for P/k = 12
returned a Nusselt number distribution on the line of symmetry of the channel floor that was
around 15% lower than the data, cf. Figure 3. (However, the results of [10] for P/k = 9
showed only a slight under-prediction of the data.) The discrepancy between the findings of
Ooi et al. and Figure 3 gives some measure of the errors incurred by the present adoption of a
2D computational framework.
Figure 5 shows the normalized streamwise velocity for P/k = 9 at one-tenth of the rib
height. The recirculation region and re-attachment point are evident in the data and the v2-f
and k-ε model results, while the k-ω-SST model indicates that the flow remains reversed at
this elevation. The k-ω-SST model therefore fails to predict flow renewal in the inter-rib
cavity and consequently its relatively good agreement with the heat transfer data of Figure 3
must be viewed as being largely fortuitous.
A. Keshmiri et al.
7
Figure 3 – Nusselt number distributions for P/k
= 12.
Figure 4 – Streamlines for P/k = 12.
Figure 5 – Streamwise velocity distributions
for P/k = 9; 1s at y/k = 0.1.
Figure 6 – Wall-normal velocity distributions
for P/k = 9; 1s at y/k = 1.
Figure 7 – Pressure coefficient distribution for
P/k = 9; 1s.
Figure 8 – Nusselt number distributions for P/k
= 9; 2s.
Results for the wall-normal velocity at rib height are presented in Figure 6. The v2-f model
is in reasonably good agreement with the data as, to a somewhat lesser degree, is the baseline
k-ε formulation. The k-ω-SST model generally under-predicts the magnitude of the wall-
directed velocity. Comparing Figures 6 and 3, it is seen that there is a direct correspondence
between the magnitude of the downward-going velocity in the recirculation region and the
level of heat transfer. This raises the question of the importance of advection in determining
the thermal characteristics of recirculating flows, i.e. in a mathematical sense there is now a
focus on the left hand side of Eqn. (3). First, it is remarked that identical mean flow equations
y/k=0.1 y/k=1

THMT6 Preprint 20/06/2009
8
are employed in conjunction with the three turbulence models considered here, and that the
only input of a turbulence model to Eqns. (2) and (3) is the turbulent viscosity, νt. The
discussion above has identified the importance of the turbulence length scale as a determinant
of model performance. It is clear though that the length scale exerts an influence on the
thermal field via its role in the dynamic field (the right hand side of Eqn. (2)). Thus, in
relation to the Energy Equation, length scale effects are manifest indirectly via the advective
terms and directly via turbulence diffusion.
Attention is turned next to the inter-rib pressure distribution. Impingement on the upstream
face of the rib leads to high static pressure, while there is a low pressure zone downstream of
the rib. These effects can be seen in Figure 7, where the pressure coefficient distribution
between the two ribs is plotted against x/k for P/k = 9. The pressure coefficient is defined as
25.0 b
ref
pU
ppC
ρ
−= (11)
where p is the static pressure on the wall and pref is a reference pressure. (Note that Cp for all
three models is offset to the experimental value at x/k = 0.5.) Figure 7 shows that the k-ε
model overestimates Cp, whereas the k-ω-SST model returns values that are too low. Within
the recirculation zone, at least, the v2-f model is in good agreement with the data.
Heat transfer results for the k-ε, k-ω-SST, and v2-f models for the 2s channel with P/k = 9
are shown in Figure 8. The findings are similar to those of Figure 3, and it can be seen that,
while the v2-f model is in quite close agreement with the data, the k-ε and k-ω-SST models
over-predict and under-predict the results, respectively.
0
0.1
0.2
0.3
0.4
0.5
-0.2 0 0.2 0.4 0.6 0.8 1 1.2U/Ub
y/H
Plane 1Plane 2Plane 3Plane 4Plane 5Plane 6Plane 7Plane 8
Figure 9 – Velocity profiles plotted on linear
axes (P/k = 9; v2-f model).
1
10
100
1000
-10 0 10 20 30 40 50 60 70 80 90 100
U+
y+
Figure 10 – Velocity profiles plotted on semi-
logarithmic axes (P/k = 9; v2-f model).
Figure 9 shows velocity profiles at a number of monitoring planes on, and between, two
ribs. Here P/k = 9 and the v2-f model is employed. The recirculation region (Planes 2-5) may
be identified and the profiles in the recovery region (Planes 6-8) are characteristic of a
laminar, rather than a turbulent boundary layer.
An alternative presentation of the velocity profiles is given in Figure 10 which shows
τUUU /=+ vs. ντ /Uyy =+
plotted on semi-logarithmic axes. (The local friction velocity is
defined as ρττ /wU = .) As would be expected, the flow is highly ‘non-universal’ within
the separation bubble (for comparison, the inset to Figure 10 shows the conventional ‘law of
the wall’). It is now seen more clearly that the recovery region takes the form of a developing
laminar boundary layer (here large U+ is associated primarily with low values of Uτ).
10
100
1000
0 10 20 30
U+
y+

A. Keshmiri et al.
9
3.2 Effects of varying the Rib Pitch-to-Height Ratio
The remaining results to be presented are for 1s channels and all computations are undertaken
using the v2-f model.
Figure 11 compares heat transfer levels for various P/k ratios. In general, it is seen that the
v2-f model tends to overestimate levels of heat transfer. The model returns the least accurate
results for P/k = 6, where it over-predicts heat transfer levels by approximately 50%. The
most accurate results are for P/k = 9.
Streamlines for all three P/k ratios are shown in Figure 12. This figure indicates that there
is no re-attachment point for P/k = 6, a result that is in agreement with the data (Figure 13
below). The recirculation lengths for P/k = 9 and 12, are nearly the same; however, the model
over-predicts the measurements of Rau et al. [5].
Figure 13 shows normalized streamwise velocity distributions at y/k = 0.1. The v2-f model
underestimates the velocity magnitude in the separation region before the downstream rib.
Consistent with Figure 12, there is no re-attachment of the flow for P/k = 6.
Results for the wall-normal velocity at rib-height are presented in Figure 14. Except for
P/k = 12, the v2-f model is in close agreement with the data.
Figure 11 - Nusselt number distributions for
P/k = 6, 9 and12 using the v2-f model.
Figure 12 - Streamlines for P/k = 6, 9 and 12
using the v2-f model.
Figure 13 – Streamwise velocity distributions
for P/k = 6, 9 and 12 at y/k = 0.1.
Figure 14 – Wall-normal velocity distributions
for P/k = 6, 9 and 12 at y/k = 1.
3.3 Effects of alternative Rib Profiles
Figure 15 examines the effect of rib profile on heat transfer performance. A Square Rib
Profile (SRP, as in Figure 3) and AGR-type Multi-Start Rib Profile (MSRP) are considered.
There is little effect on the Nusselt number distribution, and indeed it was noted in Section 1
above that Han et al. [3] found that changes to the rib cross-section had only a strictly limited
effect on heat transfer levels.
y/k=1
y/k=0.1

THMT6 Preprint 20/06/2009
10
Figure 16 shows broadly similar streamlines for both rib profiles, although the
recirculation length for the SRP is slightly larger than that for the MSRP.
Figures 17 and 18 compare normalized streamwise and wall-normal velocity distributions,
and again it is seen that the v2-f model returns similar results for the SRP and MSRP cases.
Figure 15 – Nusselt number distributions for
P/k = 9 and different rib profiles using the v2-f
model.
Figure 16 – Streamlines for P/k = 9 and
different rib profiles using the v2-f model.
Figure 17 – Streamwise velocity distributions
for P/k = 9 at y/k = 0.1 for different rib profiles.
Figure 18 – Wall-normal velocity distributions
for P/k = 9 at y/k = 1 for different rib profiles.
4. Concluding Remarks Numerical simulations of the flow and heat transfer in 2-dimensional rib-roughened ducts
have been performed using the Lien-Chen-Leschziner k-ε model, the Menter k-ω-SST model,
and a variant of Durbin’s v2-f formulation. All simulations were undertaken using a
commercial CFD package, ‘STAR-CD’. Configurations with rib pitch-to-height ratios of 6, 9,
and 12 were studied. Of the three models, the v2-f model was found to be in the best
agreement with the dynamic and thermal field data of Rau et al. [5].
The preceding remarks must be qualified by noting that the present study adopts a 2D
framework, whereas the importance of 3D effects is noted in [5]. Furthermore, there is an
unavoidable disparity in terms of geometric similarity (this being related to the ratios of
ribbed-to-smooth wall areas in the experiments and computations). It is also recorded that
there has been no evaluation of Reynolds number effects, although it is known that turbulence
models applied to recirculating flows display Reynolds number sensitivity (Iacovides and
Raisee [9]).
The wide variation in turbulence model performance is attributed primarily to model
determination of the turbulence length scale, and the role of the length scale in affecting both
y/k=0.1 y/k=1

A. Keshmiri et al.
11
the advective and diffusive terms of the Energy Equation is discussed in the main text. It is
pertinent to consider the reliance a turbulence model places on wall distance, y to represent
the turbulence scale (since the use of y carries with it implicit assumptions of universality). It
is noted that the k-ε model of [12] has a strong dependence on y since the wall distance
appears in the constitutive equation and hence feeds directly into the mean field; y also plays a
role in the k-ω-SST model [13] by virtue of its use in blending functions employed in the ω-
equation and expression for νt. The v2-f model [14] is unique amongst those considered here in
having no dependence on wall distance.
v2-f computations indicate that there is little difference between the thermal performance of
channels with square ribs and those with AGR rib profiles.
It is evident that the ‘very rough’ rib-roughened surface considered here gives rise to
highly non-universal flow features. This has implications both for the use of wall functions in
turbulence model computations and, more fundamentally, for the representation of the surface
as a distributed ‘sand grain’ type of boundary.
In a subsequent stage of the study, the present authors intend to examine other turbulence
models including non-linear EVMs, and also plan to use Large Eddy Simulation techniques to
simulate the 3D test case of [5]. Finally, the conclusions which have emerged from the present
‘parametric’ study will inform the simulation of flow over accurately represented AGR fuel
elements.
Acknowledgements The authors are grateful to the UK Engineering and Physical Sciences Research Council for
providing funding under grant EP/C549465/1, 'Keeping the Nuclear Option Open' (KNOO).
Mr. J. Gotts and Dr. S.A. Fairbairn of British Energy kindly supplied information concerning
AGR design and operating conditions. Dr. F. di Mare of CD-adapco shared her detailed
knowledge of the turbulence models implemented in STAR-CD. Finally, we are pleased to
acknowledge the value of discussions with our colleagues Professor H. Iacovides and Dr. T.J.
Craft.
References
[1] R.L. Webb, E.R.G. Eckert and R.J. Goldstein. Heat transfer and friction in tubes with
repeated-rib roughness. Int. J. Heat Mass Transfer, 14: 601-617, 1971.
[2] H. Schlichting. Boundary-layer Theory. 7th ed. McGraw Hill, New York, 1979.
[3] J.C. Han, L.R. Glicksman and W.M. Rohsenow. An investigation of heat transfer and
friction for rib-roughened surfaces. Int. J. Heat Mass Transfer, 21: 1143–1156, 1978.
[4] J. Jiménez. Turbulent flows over rough walls. Annual Review of Fluid Mechanics, 36:
173–196, 2004.
[5] G. Rau, M. Çakan, D. Moeller and T. Arts. The effect of periodic ribs on the local
aerodynamic and heat transfer performance of a straight cooling channel. ASME J.
Turbomach., 120: 368–375, 1998.
[6] S.A. Fairbairn. Personal communication, 2009.
[7] S. Acharya, S. Dutta, T.A. Myrum and R.S. Baker. Periodically developed flow and
heat transfer in a ribbed duct. Int. J. Heat Mass Transfer, 36: 2069-2082, 1993.
[8] W. Rodi. Experience with two-layer models combining the k-ε model with a one-
equation model near the wall. AIAA Paper 91-0216, 1991.
[9] H. Iacovides and M. Raisee. Computation of flow and heat transfer in two-
dimensional rib-roughened passages, using low-Reynolds-number turbulence models.
Int. J. Numerical Methods for Heat and Fluid Flow, 11: 138-155, 2001.
[10] A. Ooi, G. Iaccarino, P.A. Durbin and M. Behnia. Reynolds averaged simulation of
flow and heat transfer in ribbed ducts. Int. J. Heat Fluid Flow, 23: 750–757, 2002.
[11] CD-adapco. STAR-CD Methodology, Version 4.02, 2006.

THMT6 Preprint 20/06/2009
12
[12] F.S. Lien, W.L. Chen and M.A. Leschziner. Low-Reynolds-number eddy-viscosity
modelling based on non-linear stress-strain/vorticity relations. In: Proc. 3rd Int. Symp.
on Engineering Turbulence Modelling and Experiments (Eds. W. Rodi and G.
Bergeles), Crete, Greece, pp. 91–100, 1996.
[13] F.R. Menter. Two-equation eddy-viscosity turbulence models for engineering
applications. AIAA J., 32: 1598–1605, 1994.
[14] G. Iaccarino. Predictions of a turbulent separated flow using commercial CFD codes.
J. Fluids Eng., 123: 819-828, 2001.
[15] A. Keshmiri, M.A. Cotton, Y. Addad, S. Rolfo and F. Billard. RANS and LES
investigations of vertical flows in the fuel passages of gas-cooled nuclear reactors. In:
Proc. 16th ASME Int. Conf. on Nuclear Engineering, ‘ICONE16’, Paper ICONE16-
48372, Orlando, Florida, USA, 2008.
[16] A. Keshmiri, Y. Addad, M.A. Cotton, D.R. Laurence and F. Billard. Refined eddy
viscosity schemes and large eddy simulations for ascending mixed convection flows.
In: Proc. 4th Int. Symp. on Advances in Computational Heat Transfer, 'CHT08', Paper
CHT-08-407, Marrakech, Morocco, 2008.
[17] B.E. Launder and D.B. Spalding. The numerical computation of turbulent flows.
Comp. Meth. in Appl. Mech. and Eng., 3: 269–289, 1974.
[18] B.E. Launder and B.I. Sharma. Application of the energy dissipation model of
turbulence to the calculation of flow near a spinning disc. Lett. Heat Mass Transfer, 1:
131-138, 1974.
[19] F. di Mare. Personal communication 2008.
[20] D.C. Wilcox. Turbulence Modeling for CFD. DCW Industries Inc., La Cañada,
California, 1993.
[21] P.A. Durbin. Near-wall turbulence closure modeling without damping functions.
Theoret. Comput. Fluid Dynamics, 3: 1-13, 1991.
[22] B.E. Launder. Low-Reynolds-Number Turbulence Near Walls. Dept. of Mechanical
Engineering, UMIST (now School of MACE, The University of Manchester) Report
TFD/86/4, 1986.
[23] P.A. Durbin. Separated flow computations with the k-ε-v2 model. AIAA J., 33: 659-
664, 1995.
[24] H. Iacovides. Computation of flow and heat transfer through rotating ribbed passages.
Int. J. Heat Fluid Flow, 19: 393-400, 1998.
Top Related
Copyright © 2022 FDOKUMEN

