


Bahasa
Halaman
Hukum


General rights Copyright and moral rights for the publications made accessible in the public portal are retained by the authors and/or other copyright owners and it is a condition of accessing publications that users recognise and abide by the legal requirements associated with these rights.
Users may download and print one copy of any publication from the public portal for the purpose of private study or research.
You may not further distribute the material or use it for any profit-making activity or commercial gain
You may freely distribute the URL identifying the publication in the public portal If you believe that this document breaches copyright please contact us providing details, and we will remove access to the work immediately and investigate your claim.
Downloaded from orbit.dtu.dk on: Jun 03, 2022
Prediction of acid dissociation constants of organic compounds using groupcontribution methods
Zhou, Teng; Jhamb, Spardha; Liang, Xiaodong; Sundmacher, Kai; Gani, Rafiqul
Published in:Chemical Engineering Science
Link to article, DOI:10.1016/j.ces.2018.03.005
Publication date:2018
Document VersionPeer reviewed version
Link back to DTU Orbit
Citation (APA):Zhou, T., Jhamb, S., Liang, X., Sundmacher, K., & Gani, R. (2018). Prediction of acid dissociation constants oforganic compounds using group contribution methods. Chemical Engineering Science, 183, 95-105.https://doi.org/10.1016/j.ces.2018.03.005
Accepted Manuscript
Prediction of Acid Dissociation Constants of Organic Compounds Using GroupContribution Methods
Teng Zhou, Spardha Jhamb, Xiaodong Liang, Kai Sundmacher, Rafiqul Gani
PII: S0009-2509(18)30123-4DOI: https://doi.org/10.1016/j.ces.2018.03.005Reference: CES 14079
To appear in: Chemical Engineering Science
Received Date: 27 October 2017Revised Date: 6 February 2018Accepted Date: 2 March 2018
Please cite this article as: T. Zhou, S. Jhamb, X. Liang, K. Sundmacher, R. Gani, Prediction of Acid DissociationConstants of Organic Compounds Using Group Contribution Methods, Chemical Engineering Science (2018), doi:https://doi.org/10.1016/j.ces.2018.03.005
This is a PDF file of an unedited manuscript that has been accepted for publication. As a service to our customerswe are providing this early version of the manuscript. The manuscript will undergo copyediting, typesetting, andreview of the resulting proof before it is published in its final form. Please note that during the production processerrors may be discovered which could affect the content, and all legal disclaimers that apply to the journal pertain.
Prediction of Acid Dissociation Constants of Organic Compounds Using
Group Contribution Methods
Teng Zhoua,b
, Spardha Jhambb, Xiaodong Liang
b, Kai Sundmacher
a, Rafiqul Gani
b,c*
a Max Planck Institute for Dynamics of Complex Technical Systems, Sandtorstr. 1, D-39106
Magdeburg, Germany
b KT Consortium, Department of Chemical and Biochemical Engineering, Technical
University of Denmark, DK-2800 Lyngby, Denmark
c PSE for SPEED, Skyttemosen 6, DK-3450 Allerod, Denmark (current address)
Corresponding Author: [email protected] (Rafiqul Gani)
Abstract
In this paper, group contribution (GC) property models for the estimation of acid dissociation
constants (Ka) of organic compounds are presented. Three GC models are developed to
predict the negative logarithm of the acid dissociation constant pKa: a) a linear GC model for
amino acids using 180 data-points with average absolute error of 0.23; b) a non-linear GC
model for organic compounds using 1622 data-points with average absolute error of 1.18; c)
an artificial neural network (ANN) based GC model for the organic compounds with average
absolute error of 0.17. For each of the developed model, uncertainty estimates for the
predicted pKa values are also provided. The model details, regressed parameters and
application examples are highlighted.
Keywords: Acid Dissociation Constant, pKa, Group Contribution Method, Artificial Neural
Network, Amino Acids, Organic Compounds
2
1. Introduction
The acid dissociation constant (Ka) of a compound, which expresses the extent to which the
compound in its aqueous solution is dissociated into its ionic form, is sought after by many
chemists, biochemists and product formulators. Although experimental measurements would
yield the most satisfactory results, it is not always convenient to setup and conduct
experiments for Ka determination. This is because the organic compounds that weakly
dissociate lack adequate spectral differences in the dissociated and undissociated forms.
Besides, in the cases where a compound is unstable or is insufficiently soluble in water,
experimental Ka determination is impossible (Tong and Wen, 2008).
The currently available pKa (negative logarithm of Ka) compilations provide values for only a
small fraction of known or possible acids and bases (Perrin, Dempsey and Serjeant, 1981).
This motivates the development of advanced pKa prediction models.
This paper is organized as follows. First, we give a definition on pKa and highlight its
significance in several research areas (Section 1.1). After a brief introduction of the main
existing methods for pKa prediction (Section 1.2), we focus on the powerful group
contribution (GC) methods and present more details about these methods in Section 2. Three
different GC models are then developed to predict pKa for amino acids and other classes of
organic compounds. The performances of these models are evaluated and compared in
Section 3.1. Finally, in Section 3.2, several examples are shown to help the reader in
understanding how to apply the developed models for predicting pKa.
1.1 Definition and Significance of pKa
In aqueous solution, acids (generically represented by HA) undergo a protolytic reaction with
water. This equilibrium reaction is given as:
(1)
3
The equilibrium constant (in this case, the acid dissociation constant Ka) for the reaction
given in Eq. (1) is expressed as Eq. (2), which relates the activity of the dissociated form of
the acid ( ) to the activity of its undissociated form ( )
(2)
As the Ka measurements are generally made in dilute aqueous solutions, the concentration of
water remains nearly constant and therefore, its activity can be taken as unity. The general
expression of Ka is then derived from Eq. (2), as
(3)
By taking negative logarithm on both sides of Eq. (3) and rearranging the terms, the relation
between the pH of the solution and the pKa of HA can be obtained, given as Eq. (5).
(4)
(5)
In the special case, when the activity of HA equals that of A–, pKa is identical to pH.
pKa is very significant in many different areas. For example, during liquid-liquid extraction,
when an organic compound is to be separated from an aqueous solution, the undissociated
form of the compound usually is more soluble in the organic phase. Hence, the pH of the
aqueous phase can be adjusted to its optimum value if the pKa of the organic compound is
known (Green and Perry, 2008). In preparative chemistry, considering the effects of pH on
the properties of reactants as well as the possible intermediates and products, conditions for
synthesis are selected by making use of pKa (Perrin, Dempsey and Serjeant, 1981).

4
1.2 Existing Methods for pKa Prediction
Nowadays a large number of experimental pKa data are available, thus one can predict pKa of
new compounds by extrapolating or interpolating the pKa of database compounds of the same
type. Besides this, theoretical calculations and semi-empirical correlations based on
thermodynamics and quantum chemical foundations have also been used for pKa prediction
in various works (e.g., Jensen, Swain and Olsen, 2017 use isodemic reactions, where the pKa
is estimated relative to a chemically related reference compound, to make COSMO-based and
SMD-based predictions. The pKa values of 53 amine groups in 48 druglike compounds are
computed.)
1.2.1 Linear Free Energy Relationships (LFER)
The Hammett-Taft equation quantifies the electronic effect of organic functional groups (or
substituents) on other groups to which they are attached. This equation is a linear free energy
relationship (LFER). It is widely used for pKa prediction (Metzler, 2012) and is as shown in
Eq. (6).
(6)
where indicates the pKa value for unsubstituted reference compounds; σi is the
substituent constant for the substituent i; and ρ is the proportionality constant for the
particular equilibrium dissociation reaction i.e. it is the measure of the sensitivity of the
reaction to the presence of electron-withdrawing or electron-donating substituents, for
example the ρ for phenylacetic acids is 0.49, while that for phenols is 2.23. It should be noted
that, currently only a limited number of substituent constants are available, which limits the
applicability of the LFER method for pKa prediction.
5
1.2.2 Theoretical calculations
There are several first-principle theory based methods for pKa prediction. The Kirkwood-
Westheimer equation (Kirkwood and Westheimer, 1938) quantifies ΔpKa for a charged or a
dipolar substituent as follows,
(7)
In Eq. (7), ϕ is the angle between the line joining the centre of the ionizing group to the centre
of the dipole and the axis of the dipole, e is the electronic charge, k is the Boltzmann
constant, T is the temperature in K, μ is the dipole moment, R is the distance between two
charges, Deff is the effective dielectric constant. The largest limitation of the Kirkwood-
Westheimer method is that it is applicable only to ellipsoidal molecules with point charges at
their foci only.
pKa can also be estimated based on thermodynamic cycles that relate the gas phase to the
solution phase, where state-of-the-art quantum chemical techniques coupled with an
appropriate solvation model are used (Shields and Seybold, 2013). Jang et al. (2001)
predicted the pKa values for a series of 5-substituted uracil derivatives using density
functional theory (DFT) calculations in combination with the Poisson-Boltzmann continuum-
solvation model (Im, Beglov and Roux, 1998).
Even though theoretical calculations can yield good results in predicting pKa, these methods
are not very attractive for some applications due to their high computational cost. For
instance, in drug formulation design, the pKa of active ingredients (AIs) is a very important
property for selecting AIs because the pKa value indicates the aqueous solubility of the AI
and the ability of the AI to permeate through the gastro-intestinal membrane. In order to
6
perform a fast AI pre-screening, a quick and reliable pKa prediction method is more
preferable than an accurate but very computationally expensive one.
1.2.3 Group contribution based methods
The compounds of the same class usually have small differences in their pKa values. For
example, the pKa of 1-aminoheptane is 10.67 at 25 °C, which is just slightly lower than the
pKa value of 10.70 for ethylamine. In general, the pKa of primary amines falls into the range
of 10.6 ± 0.2. Also, if the alkyl-chain-substituted amines are compared with cyclic amines,
the pKa is raised by 0.2 units for one ring and 0.3 units for two rings (Perrin, Dempsey and
Serjeant, 1981). By employing analogical methods, one can perform pKa estimations.
However, in order to accurately predict pKa for a certain compound, one needs quite a lot of
information about other compounds with similar molecular structures.
As indicated in the three types of prediction methods (see Sections 1.2.1 – 1.2.3), all have
certain limitations, which motivates the development of new methods for fast and reliable
pKa predictions. It is also clear that the pKa value or the degree to which a compound
dissociates in its aqueous solution depends mostly on the molecular structure of the
compound. This inspires us to develop group contribution (GC) based models that are
applicable to all different classes of organic compounds.
1.3 pKa of Amino acids
Amino acid molecules have at least one acidic group and one basic group. This allows
intramolecular acid-base equilibrium reaction resulting in the formation of a dipolar
tautomeric ion known as the zwitterion or internal salt (Cheung, 1995). The dissociation of
amino acids in aqueous solutions is represented as follows.

7
where
(8)
and
where
(9)
From above, we know that an amino acid typically has at least two dissociation constants
with the first one corresponding to the case when the COOH group is deprotonated and the
second one corresponding to the case when the H3N+ group gets deprotonated in aqueous
solution. Considering this unique behaviour, amino acids have been considered separately
from other organic compounds in this work in the same way as in our previous GC-based
property estimation models for amino acids (Jhamb et al. 2018).
2. Methods and Tools used for pKa Model Development
2.1 Experimental Dataset
In the present study, the first dataset (dataset – 1) comprises experimental pKa values of 180
amino acids while the second dataset (dataset – 2) contains pKa values of 1622 organic
compounds that are not amino acids. The experimentally measured pKa values in both
datasets are collected from the KT-Consortium database and handbooks containing the
dissociation constants of organic compounds ( , Vogel and Andrussow, 1961; Perrin,
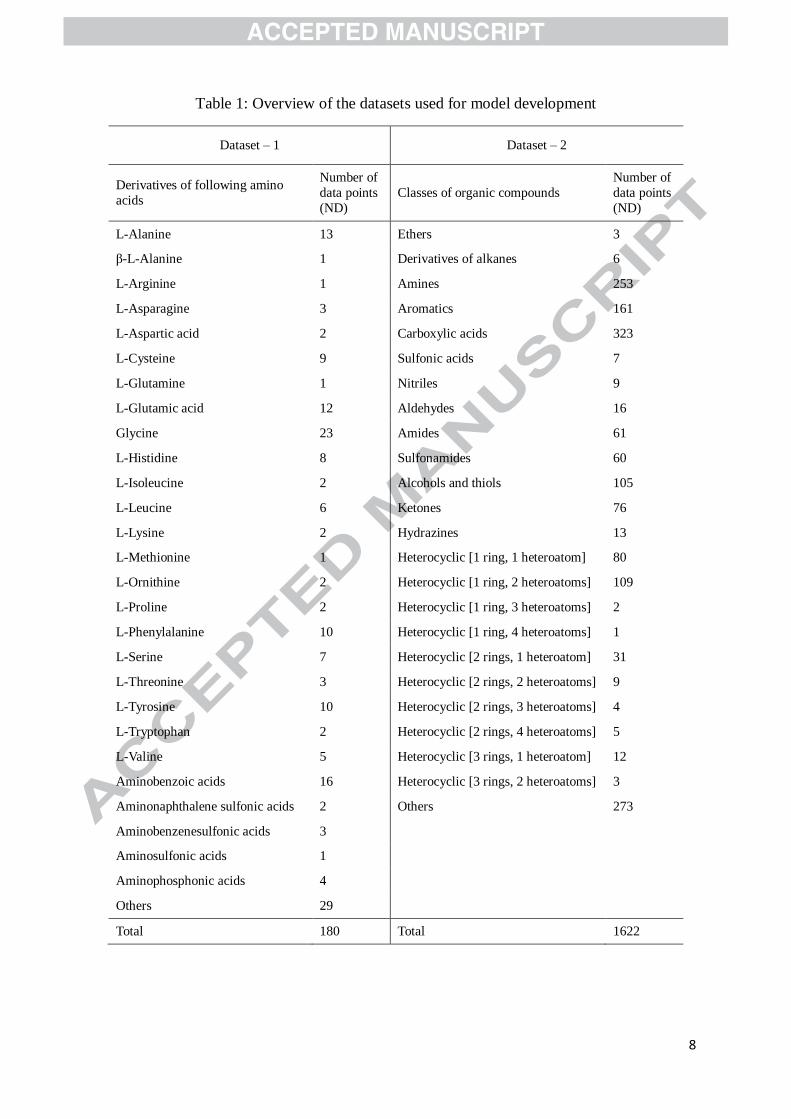
1965). Table 1 provides an overview of the datasets used for developing GC-based pKa
prediction models. The 180 amino acids in dataset – 1 are grouped according to the amino
acid type. For instance, totally 13 amino acids including L-Alanine, N-acetyl-L-Alanine, and
N-ethyl-L-Alanine are classified into the ‘L-Alanine’ group. Similarly, the 1622 organic
compounds are also classified into several groups.
8
Table 1: Overview of the datasets used for model development
Dataset – 1 Dataset – 2
Derivatives of following amino
acids
Number of
data points
(ND)
Classes of organic compounds
Number of
data points
(ND)
L-Alanine 13 Ethers 3
β-L-Alanine 1 Derivatives of alkanes 6
L-Arginine 1 Amines 253
L-Asparagine 3 Aromatics 161
L-Aspartic acid 2 Carboxylic acids 323
L-Cysteine 9 Sulfonic acids 7
L-Glutamine 1 Nitriles 9
L-Glutamic acid 12 Aldehydes 16
Glycine 23 Amides 61
L-Histidine 8 Sulfonamides 60
L-Isoleucine 2 Alcohols and thiols 105
L-Leucine 6 Ketones 76
L-Lysine 2 Hydrazines 13
L-Methionine 1 Heterocyclic [1 ring, 1 heteroatom] 80
L-Ornithine 2 Heterocyclic [1 ring, 2 heteroatoms] 109
L-Proline 2 Heterocyclic [1 ring, 3 heteroatoms] 2
L-Phenylalanine 10 Heterocyclic [1 ring, 4 heteroatoms] 1
L-Serine 7 Heterocyclic [2 rings, 1 heteroatom] 31
L-Threonine 3 Heterocyclic [2 rings, 2 heteroatoms] 9
L-Tyrosine 10 Heterocyclic [2 rings, 3 heteroatoms] 4
L-Tryptophan 2 Heterocyclic [2 rings, 4 heteroatoms] 5
L-Valine 5 Heterocyclic [3 rings, 1 heteroatom] 12
Aminobenzoic acids 16 Heterocyclic [3 rings, 2 heteroatoms] 3
Aminonaphthalene sulfonic acids 2 Others 273
Aminobenzenesulfonic acids 3
Aminosulfonic acids 1
Aminophosphonic acids 4
Others 29
Total 180 Total 1622

9
From Section 1.3, it is known that amino acids generally have at least two groups which can
dissociate and hence possess at least two pKa values correspondingly. Notably, for amino
acids with a polar or an electrically charged side chain, there is even a third dissociation
constant as well. For example, L-Cysteine has a thiol group (–SH) in its side chain which can
also get deprotonated besides the –COOH and –NH3+ groups.
For the amino acids included in dataset – 1, only the first dissociation constant has been
chosen, i.e., the pKa value corresponding to the deprotonation of the –COOH, –SO3H, or –
PO3H2 group, depending on whether the amino acid is carboxylic, sulphonic, or phosphonic.
For amino acid esters where these three groups do not exist, the pKa associated with the
deprotonation of the –NH3+ group has been chosen.
When developing property models, the experimental dataset is often divided into a training
set and a validation set. This approach should not be employed for GC models since the
validation set is usually formed by randomly selecting the experimental data points. When
some data points (or compounds) are selected for validation, some of the functional groups
and model parameters may be excluded for model training, which will thereby limit the
application domain of the resulting model. On the other hand, when only a proportion of the
experimental data are used for parameter regression, large uncertainties of predicted property
values could be resulted (Hukkerikar et al., 2012).
2.2 Group Contribution Methods
Several group contribution (GC) methods have been developed for pure-component property
predictions, for instance, Joback and Reid (1987), Lyman et al. (1990), Marrero and Gani
(2001), Hukkerikar et al. (2012) etc. In this work, the Marrero and Gani (MG) GC method,
also used previously for amino acids (Jhamb et al. 2018) and other organic compounds
(Hukkerikar et al. 2012), has been used.

10
In the MG GC method, a multilevel scheme is adopted where the property estimation is
performed at three levels. The first level has a large number of simple groups that allow for
the representation of a wide variety of organic molecules. The second level of estimation
involves groups that can capture the proximity effects and can differentiate among isomers.
The third level estimation includes groups that provide a further more detailed description of
the molecular structures; hence, this level allows estimation of complex heterocyclic and
poly-functional acyclic molecules. The MG GC-model has the form (Marrero and Gani,
2001),
(10)
Here, the function f(X) is a function of property X. This may contain additional adjustable
model parameters (universal constants) depending on the property involved. In Eq. (10), Ci is
the contribution of the first-order group of type-i that occurs Ni times. Dj is the contribution of
the second-order group of type-j that occurs Mj times. Ek is the contribution of the third-order
group of type-k that has Ok occurrences in a component. w and z are weighting factors set to 1
or 0 depending on whether the second and third order groups are used for property prediction
or not. Therefore, Eq. (10) is a general model for all the properties and the definition of f(X)
is specific for each property X.
In this work, the set of groups proposed for the prediction of physical properties of amino
acids by Jhamb et al. (2018) to account for zwitterionic structures and the amphoteric nature
of amino acids has been used. That is, the pKa prediction for amino acids in this work makes
use of the traditional MG-GC groups along with these newly introduced groups.
2.2.1 Linear GC model
As described by Constantinou and Gani (1994) and later by Marrero and Gani (2001), the
selection of an appropriate function f(X) has to achieve additivity in the contributions ,

11
and in order to demonstrate the best possible fit of the experimental data. In addition, the
expressions should be able to provide sufficient extrapolating ability and therefore ensure a
wide range of applicability.
In this work, a linear property model function was first selected for the prediction of pKa of
amino acids in dataset – 1 and all the other organic compounds in dataset – 2.
(11)
In Eq. (11), pKa is the negative logarithm of the acid dissociation constant and pKa0 is an
adjustable model parameter. , and are group contributions to be regressed. Note that
both w and z are set to 1, which means the second- and third-order groups are also considered
in model development.
2.2.2 Nonlinear GC model
Besides the above linear GC model, a 4th-order polynomial GC model was also tested for pKa
prediction, as shown below.
(12)
pKa is the negative logarithm of the acid dissociation constant; a, b, c and pKa0 are adjustable
model parameters; , and are group contributions to be regressed. w and z are set to 1.
2.2.3 Artificial Neural Network GC model
Artificial Neural Network (ANN)-GC method has been widely used to predict physical,
thermodynamic, and transport properties, such as vapor-liquid equilibrium data (Petersen,
Fredenslund and Rasmussen, 1994), solubility data (Gharagheizi et al., 2011a), flash point
(Gharagheizi, Alamdari and Angaji, 2008) and surface tension (Gharagheizi et al., 2011b). In
this work, a very popular ANN architecture (Bishop 1995) comprising of a three-layer feed
12
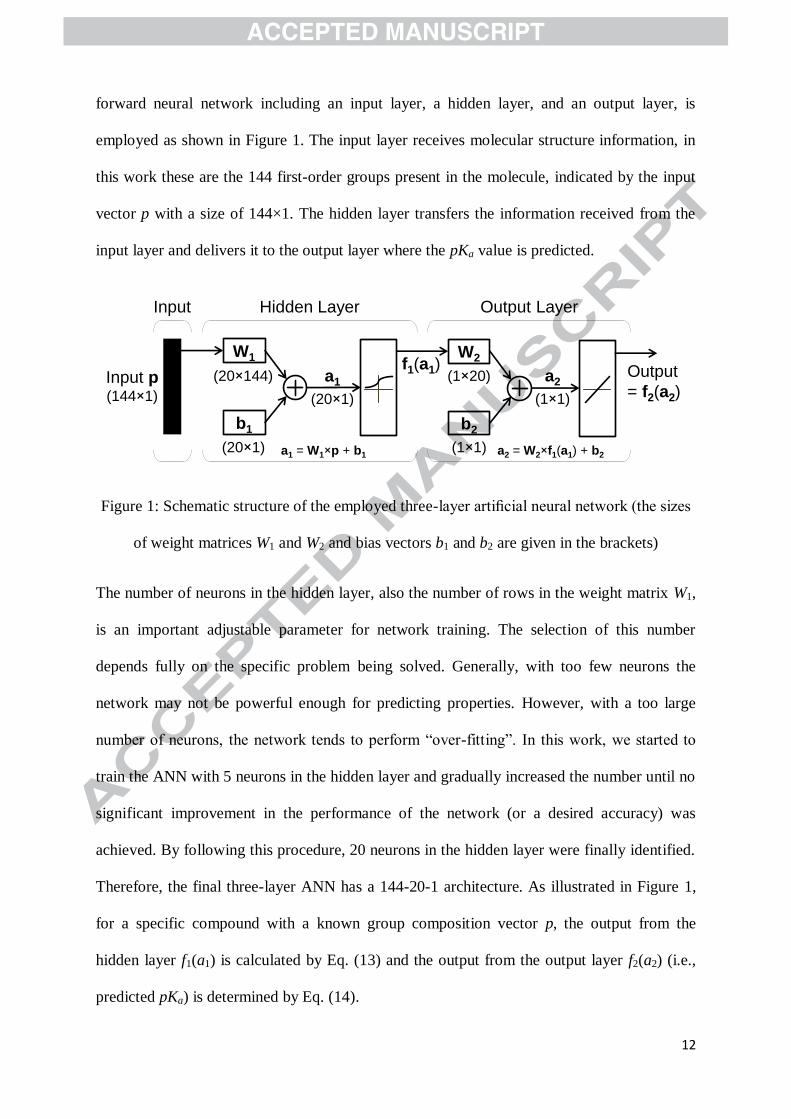
forward neural network including an input layer, a hidden layer, and an output layer, is
employed as shown in Figure 1. The input layer receives molecular structure information, in
this work these are the 144 first-order groups present in the molecule, indicated by the input
vector p with a size of 144×1. The hidden layer transfers the information received from the
input layer and delivers it to the output layer where the pKa value is predicted.
Figure 1: Schematic structure of the employed three-laye a ificial neu al ne w k ( he sizes
of weight matrices W1 and W2 and bias vectors b1 and b2 are given in the brackets)
The number of neurons in the hidden layer, also the number of rows in the weight matrix W1,
is an important adjustable parameter for network training. The selection of this number
depends fully on the specific problem being solved. Generally, with too few neurons the
network may not be powerful enough for predicting properties. However, with a too large
nu be f neu ns, he ne w k ends pe f “ ve -fi ing”. In his w k, we s a ed
train the ANN with 5 neurons in the hidden layer and gradually increased the number until no
significant improvement in the performance of the network (or a desired accuracy) was
achieved. By following this procedure, 20 neurons in the hidden layer were finally identified.
Therefore, the final three-layer ANN has a 144-20-1 architecture. As illustrated in Figure 1,
for a specific compound with a known group composition vector p, the output from the
hidden layer f1(a1) is calculated by Eq. (13) and the output from the output layer f2(a2) (i.e.,
predicted pKa) is determined by Eq. (14).
W1
b1
W2
b2
Input Hidden Layer Output Layer
Input p(144 1)
Output
= f2(a2)(20 144)
(20 1)
a1
(20 1)
a1 = W1 p + b1
f1(a1)(1 20)
(1 1)
a2
(1 1)
a2 = W2 f1(a1) + b2
13
f1(a1) = f1(W1 × p + b1) (13)
f2(a2) = f2(W2 × f1(a1) + b2) (14)
A sigmoid transfer function and a linear transfer function were employed in the hidden layer
and in the output layer, respectively. The combination of a sigmoid and a linear transfer
function has been shown to be very powerful for building three-layer feed forward neural
networks. The mathematical formulations of the employed transfer functions are given as
follows.
xe
xf
1
11 (15)
xxf 2 (16)
2.3 Parameter Regression and Uncertainty Analysis
The Levenberg–Marquardt optimization algorithm (Levenberg, 1944; Marquardt, 1963)
implemented in MATLAB was employed to regress the parameters in the linear and
nonlinear GC models. The minimization of the objective function S(P), defined as the sum of
squares of the difference between the experimental
and model predicted
,
provides the values of unknown parameters P*.
(17)
The subscript j indicates the compound and N is the total number of compounds in the
dataset.
In the ANN-GC model, there are four fitting parameters, two weight matrices (W1 and W2)
and two bias vectors (b1 and b2). They were obtained by minimizing an objective function,
which in this work is the Mean Square Error (MSE) between the output (predicted pKa) and
14
the experimental pKa for all the compounds in the dataset. This optimization process was also
performed by using the Levenberg-Marquardt algorithm, which is available in the neural
network toolbox of MATLAB.
(18)
After the estimation of model parameters, uncertainty analysis can be performed to quantify
the uncertainties in the predicted property values. The methodology discussed in Hukkerikar
et al. (2012) is employed to estimate confidence interval of the predicted pKa at the αt
significance level.
(19)
where the Jacobian matrix J(P*) calculated using ∂f/∂P
* represents the local sensitivity of the
property model f to variations in the estimated parameter values P*. is the
covariance matrix of the estimated model parameters. is the degrees of freedom (the total
number of data points minus the number of unknown parameters).
is the t-
distribution value corresponding to the degrees of freedom and αt/2 percentile (αt is 0.05 for
95% confidence interval). The property prediction method can be considered as reliable if the
experimental value falls into the calculated confidence interval.
2.4 Statistical Performance Indicators
The evaluation of performance of the developed models is based on the determination of
statistical indicators listed in Table 2.

15
Table 2: Statistical performance indicators used in this work
Indicator Abbreviation Formula
Average
Absolute Error AAE
Coefficient of
determination R
2
μ is the average of the experimental pKa in the dataset
3. Results and Discussions
Three GC (linear, nonlinear, and ANN-based) models are developed to predict pKa for amino
acids and other classes of organic compounds. The performances of these models in
predicting pKa are evaluated in Section 3.1. Several examples are shown in Section 3.2 to
help the reader in understanding how to apply the developed models for pKa prediction.
3.1 Model Performances
3.1.1 Linear GC model
The regressed model parameters pKa0, , and are provided in the Supporting
Information. The performance statistics of the developed linear GC model for predicting the
pKa of amino acids in dataset – 1 and the organic compounds in dataset – 2 are given in Table
3.
16
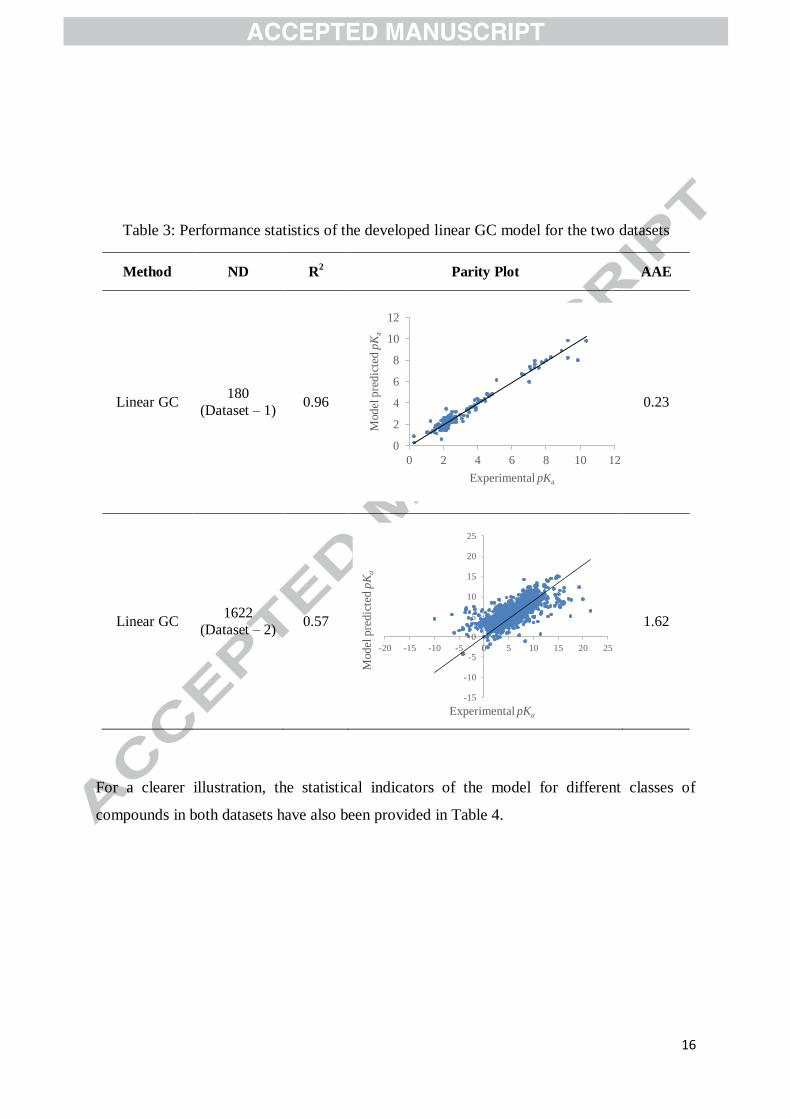
Table 3: Performance statistics of the developed linear GC model for the two datasets
Method ND R2 Parity Plot AAE
Linear GC 180
(Dataset – 1) 0.96
0.23
Linear GC 1622
(Dataset – 2) 0.57
1.62
For a clearer illustration, the statistical indicators of the model for different classes of
compounds in both datasets have also been provided in Table 4.
0
2
4
6
8
10
12
0 2 4 6 8 10 12
Model
pre
dic
ted p
Ka
Experimental pKa
-15
-10
-5
0
5
10
15
20
25
-20 -15 -10 -5 0 5 10 15 20 25
Model
pre
dic
ted p
Ka
Experimental pKa

17
Table 4: Statistical indicators of the linear GC model for different classes of amino acids
(dataset – 1) and other organic compounds (dataset – 2)
Derivatives of following amino
acids AAE R2 Classes of organic compounds AAE R2
L-Alanine 0.20 0.96 Ethers 7.02 -757.92
β-L-Alanine 0.03 -- Derivatives of alkanes 1.18 -3.23
L-Arginine 0.00 -- Amines 1.65 0.61
L-Asparagine 0.15 0.99 Aromatics 1.80 0.91
L-Aspartic acid 0.22 0.98 Carboxylic acids 1.03 0.31
L-Cysteine 0.17 0.99 Sulfonic acids 3.16 -0.16
L-Glutamine 0.74 -- Nitriles 3.45 -0.06
L-Glutamic acid 0.24 0.96 Aldehydes 1.26 0.50
Glycine 0.23 0.95 Amides 2.04 0.37
L-Histidine 0.20 0.99 Sulfonamides 1.46 -0.33
L-Isoleucine 0.12 0.56 Alcohols and thiols 2.29 0.22
L-Leucine 0.31 0.97 Ketones 2.19 0.40
L-Lysine 0.64 0.67 Hydrazines 1.38 0.60
L-Methionine 0.06 -- Heterocyclic [1 ring, 1 heteroatom] 1.74 0.43
L-Ornithine 0.40 0.89 Heterocyclic [1 ring, 2 heteroatoms] 1.50 0.57
L-Proline 0.00 1.00 Heterocyclic [1 ring, 3 heteroatoms] 2.14 0.45
L-Phenylalanine 0.37 0.88 Heterocyclic [1 ring, 4 heteroatoms] 0.09 --
L-Serine 0.11 0.99 Heterocyclic [2 rings, 1 heteroatom] 1.66 -0.05
L-Threonine 0.12 0.48 Heterocyclic [2 rings, 2 heteroatoms] 2.67 -0.32
L-Tyrosine 0.29 0.98 Heterocyclic [2 rings, 3 heteroatoms] 1.31 -1.38
L-Tryptophan 0.00 1.00 Heterocyclic [2 rings, 4 heteroatoms] 1.50 0.46
L-Valine 0.28 0.13 Heterocyclic [3 rings, 1 heteroatom] 1.54 0.42
Aminobenzoic acids 0.21 0.80 Heterocyclic [3 rings, 2 heteroatoms] 2.43 0.97
Aminonaphthalene sulfonic acids 0.32 0.88 Others 1.54 0.57
Aminobenzenesulfonic acids 0.37 0.98
Aminosulfonic acids 0.00 --
Aminophosphonic acids 0.09 1.00
Others 0.26 0.91
Figure 2 shows the absolute error between the linear-GC-model predicted pKa and
experimental pKa for the 180 amino acids in dataset – 1. The compounds in dataset – 1 are
first sorted according to the ascending order of the absolute error and the error is then plotted
as the Y-axis value against the X-axis of 1 to 180. As illustrated, the absolute error in
prediction for 158 amino acids is less than 0.5, while for 15 amino acids is between 0.5 and

18
1.0. Typically, N-substituted amino acids have absolute errors greater than 1.0. The
maximum observed absolute error is 1.86 for 3-(dimethylamino) propanoic acid.
Figure 2: Absolute error between the linear-GC-model predicted pKa and experimental pKa
for the 180 amino acids in dataset – 1
It can be concluded that the linear GC model shows a high performance in predicting the pKa
for amino acids. However, for the other organic compounds in dataset – 2, a satisfactory
prediction cannot be achieved by employing linear GC correlations. In the next section,
nonlinear GC models are developed for both datasets.
3.1.2 Nonlinear GC model
The regressed model parameters a, b, c, pKa0, , , and (see Eq. 12) are provided in the
Supporting Information. The performance statistics of the developed nonlinear GC model for
both datasets are given in Table 5. As can be seen, compared to the linear GC model, a
significant improvement in the accuracy of pKa prediction has been obtained for both
datasets.
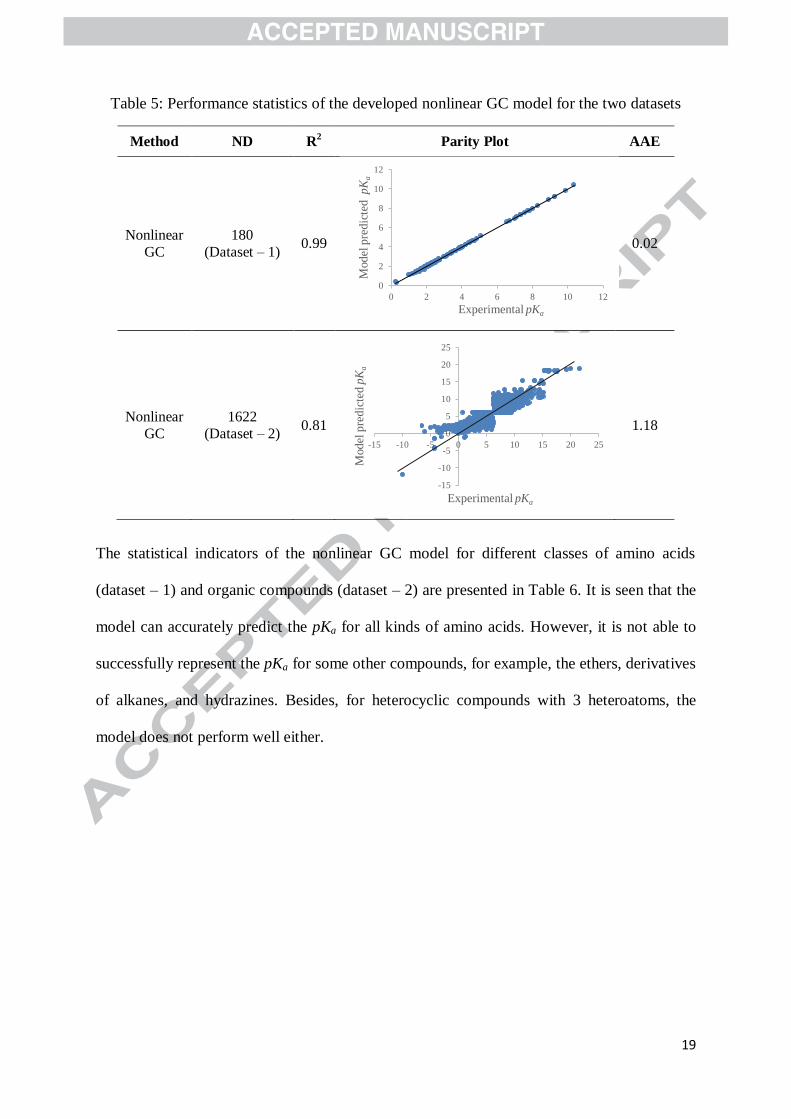
19
Table 5: Performance statistics of the developed nonlinear GC model for the two datasets
Method ND R2 Parity Plot AAE
Nonlinear
GC
180
(Dataset – 1) 0.99
0.02
Nonlinear
GC
1622
(Dataset – 2) 0.81
1.18
The statistical indicators of the nonlinear GC model for different classes of amino acids
(dataset – 1) and organic compounds (dataset – 2) are presented in Table 6. It is seen that the
model can accurately predict the pKa for all kinds of amino acids. However, it is not able to
successfully represent the pKa for some other compounds, for example, the ethers, derivatives
of alkanes, and hydrazines. Besides, for heterocyclic compounds with 3 heteroatoms, the
model does not perform well either.
0
2
4
6
8
10
12
0 2 4 6 8 10 12
Model
pre
dic
ted pK
a
Experimental pKa
-15
-10
-5
0
5
10
15
20
25
-15 -10 -5 0 5 10 15 20 25
Model
pre
dic
ted p
Ka
Experimental pKa
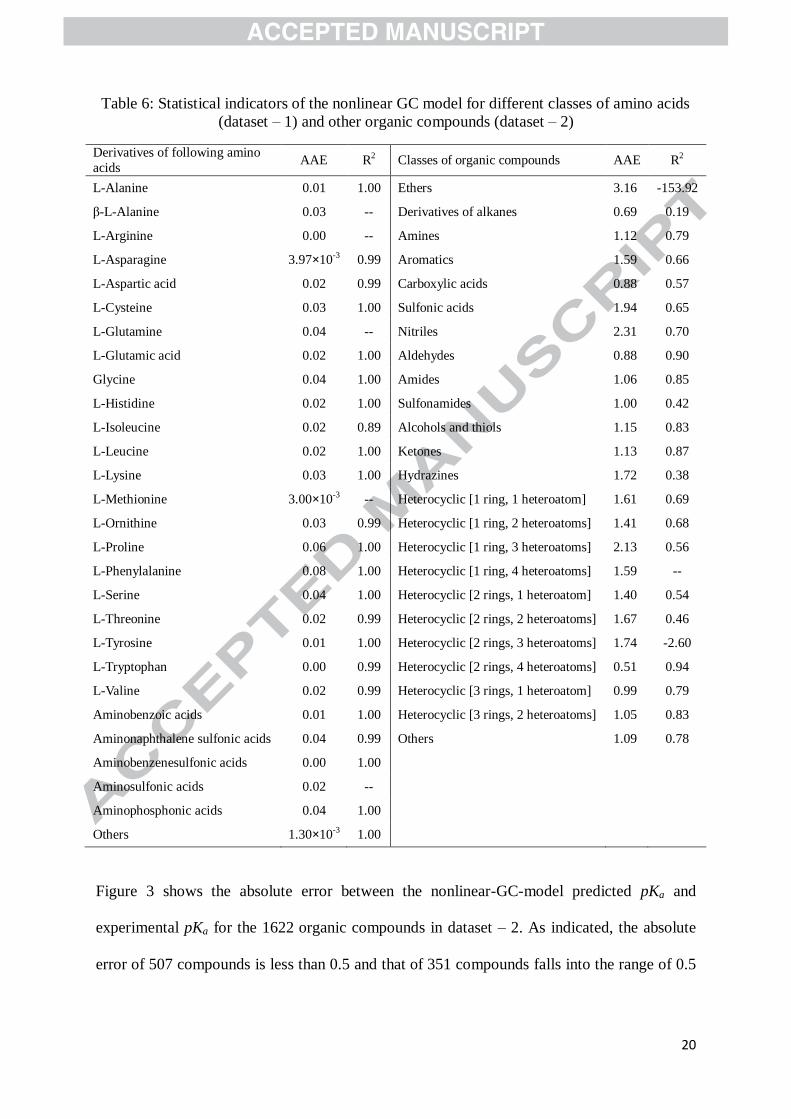
20
Table 6: Statistical indicators of the nonlinear GC model for different classes of amino acids
(dataset – 1) and other organic compounds (dataset – 2)
Derivatives of following amino
acids AAE R2 Classes of organic compounds AAE R2
L-Alanine 0.01 1.00 Ethers 3.16 -153.92
β-L-Alanine 0.03 -- Derivatives of alkanes 0.69 0.19
L-Arginine 0.00 -- Amines 1.12 0.79
L-Asparagine 3.97×10⁻³ 0.99 Aromatics 1.59 0.66
L-Aspartic acid 0.02 0.99 Carboxylic acids 0.88 0.57
L-Cysteine 0.03 1.00 Sulfonic acids 1.94 0.65
L-Glutamine 0.04 -- Nitriles 2.31 0.70
L-Glutamic acid 0.02 1.00 Aldehydes 0.88 0.90
Glycine 0.04 1.00 Amides 1.06 0.85
L-Histidine 0.02 1.00 Sulfonamides 1.00 0.42
L-Isoleucine 0.02 0.89 Alcohols and thiols 1.15 0.83
L-Leucine 0.02 1.00 Ketones 1.13 0.87
L-Lysine 0.03 1.00 Hydrazines 1.72 0.38
L-Methionine 3.00×10⁻³ -- Heterocyclic [1 ring, 1 heteroatom] 1.61 0.69
L-Ornithine 0.03 0.99 Heterocyclic [1 ring, 2 heteroatoms] 1.41 0.68
L-Proline 0.06 1.00 Heterocyclic [1 ring, 3 heteroatoms] 2.13 0.56
L-Phenylalanine 0.08 1.00 Heterocyclic [1 ring, 4 heteroatoms] 1.59 --
L-Serine 0.04 1.00 Heterocyclic [2 rings, 1 heteroatom] 1.40 0.54
L-Threonine 0.02 0.99 Heterocyclic [2 rings, 2 heteroatoms] 1.67 0.46
L-Tyrosine 0.01 1.00 Heterocyclic [2 rings, 3 heteroatoms] 1.74 -2.60
L-Tryptophan 0.00 0.99 Heterocyclic [2 rings, 4 heteroatoms] 0.51 0.94
L-Valine 0.02 0.99 Heterocyclic [3 rings, 1 heteroatom] 0.99 0.79
Aminobenzoic acids 0.01 1.00 Heterocyclic [3 rings, 2 heteroatoms] 1.05 0.83
Aminonaphthalene sulfonic acids 0.04 0.99 Others 1.09 0.78
Aminobenzenesulfonic acids 0.00 1.00
Aminosulfonic acids 0.02 --
Aminophosphonic acids 0.04 1.00
Others 1.30×10⁻³ 1.00
Figure 3 shows the absolute error between the nonlinear-GC-model predicted pKa and
experimental pKa for the 1622 organic compounds in dataset – 2. As indicated, the absolute
error of 507 compounds is less than 0.5 and that of 351 compounds falls into the range of 0.5
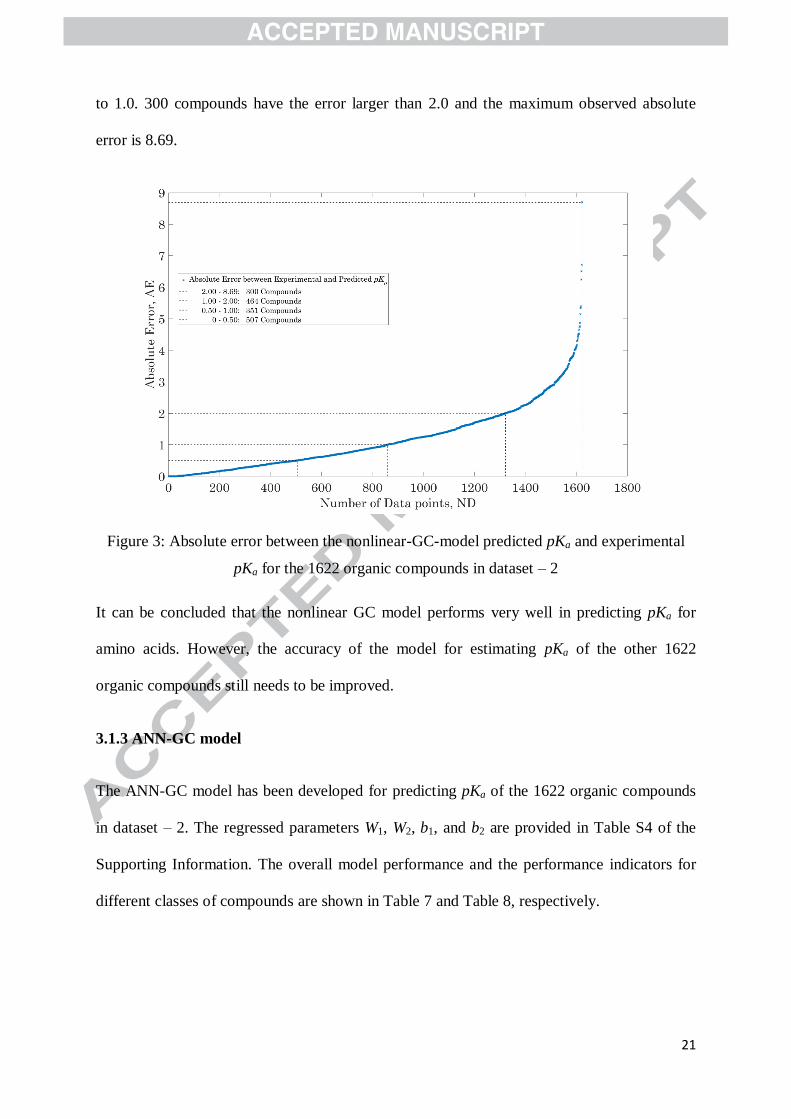
21
to 1.0. 300 compounds have the error larger than 2.0 and the maximum observed absolute
error is 8.69.
Figure 3: Absolute error between the nonlinear-GC-model predicted pKa and experimental
pKa for the 1622 organic compounds in dataset – 2
It can be concluded that the nonlinear GC model performs very well in predicting pKa for
amino acids. However, the accuracy of the model for estimating pKa of the other 1622
organic compounds still needs to be improved.
3.1.3 ANN-GC model
The ANN-GC model has been developed for predicting pKa of the 1622 organic compounds
in dataset – 2. The regressed parameters W1, W2, b1, and b2 are provided in Table S4 of the
Supporting Information. The overall model performance and the performance indicators for
different classes of compounds are shown in Table 7 and Table 8, respectively.
22
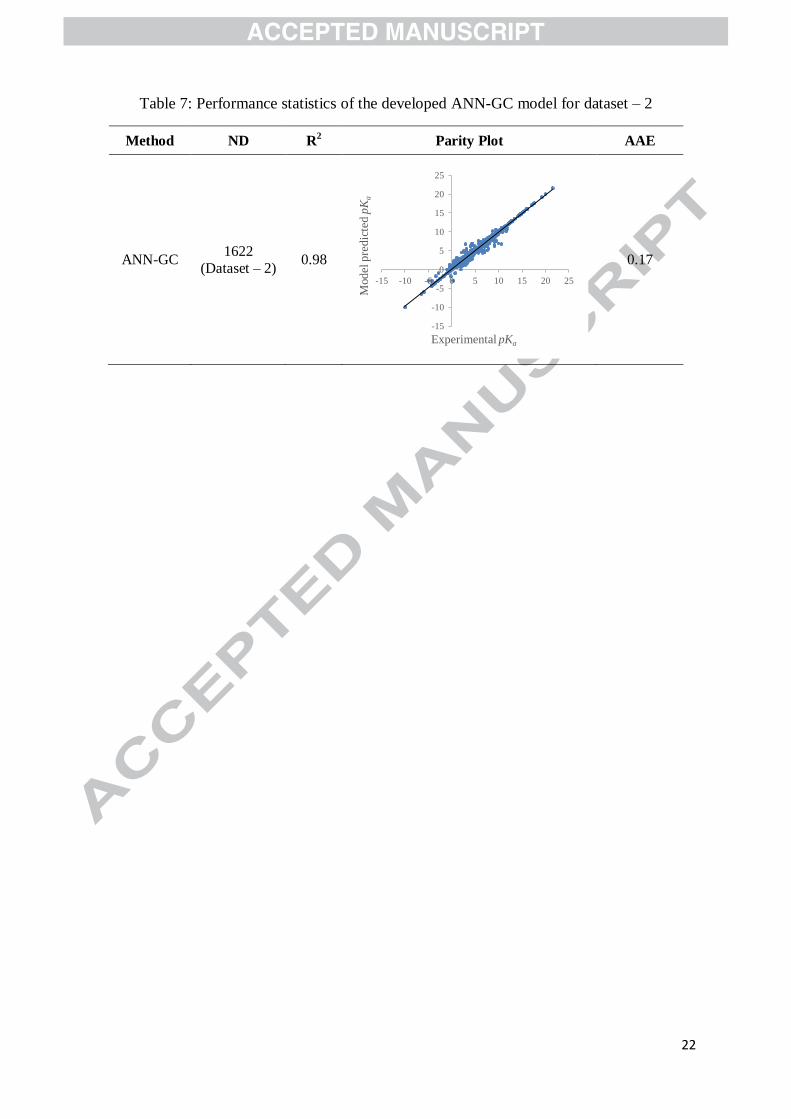
Table 7: Performance statistics of the developed ANN-GC model for dataset – 2
Method ND R2 Parity Plot AAE
ANN-GC 1622
(Dataset – 2) 0.98
0.17
-15
-10
-5
0
5
10
15
20
25
-15 -10 -5 0 5 10 15 20 25
Model
pre
dic
ted p
Ka
Experimental pKa

23
Table 8: Statistical indicators of the ANN-GC model for different classes of organic
compounds in dataset – 2
Classes of organic compounds AAE R2
Ethers 1.12×10⁻⁶ 1.00
Derivatives of alkanes 2.57×10⁻⁶ 1.00
Amines 0.24 0.98
Aromatics 0.28 0.98
Carboxylic acids 0.13 0.96
Sulfonic acids 1.62×10⁻⁶ 1.00
Nitriles 0.28 0.99
Aldehydes 0.27 0.98
Amides 0.13 0.99
Sulfonamides 0.14 0.79
Alcohols and thiols 0.07 0.99
Ketones 0.12 0.99
Hydrazines 5.68×10⁻⁶ 1.00
Heterocyclic [1 ring, 1 heteroatom] 0.31 0.97
Heterocyclic [1 ring, 2 heteroatoms] 0.27 0.96
Heterocyclic [1 ring, 3 heteroatoms] 1.57×10⁻⁶ 1.00
Heterocyclic [1 ring, 4 heteroatoms] 1.15×10⁻⁸ --
Heterocyclic [2 rings, 1 heteroatom] 0.44 0.90
Heterocyclic [2 rings, 2 heteroatoms] 0.46 0.93
Heterocyclic [2 rings, 3 heteroatoms] 1.83×10⁻⁶ 1.00
Heterocyclic [2 rings, 4 heteroatoms] 1.57×10⁻⁶
1.00
Heterocyclic [3 rings, 1 heteroatom] 0.99 0.76
Heterocyclic [3 rings, 2 heteroatoms] 0.51 0.92
Others 0.01 0.99
Figure 4 shows the absolute error between the ANN-GC-model predicted pKa and
experimental pKa for the 1622 organic compounds in dataset – 2. As seen, 89% of the 1622
compounds have absolute errors less than 0.5 and about 95% have absolute errors less than
1.0. The absolute error plot together with the estimated performance statistics indicates that
the developed ANN-GC model can well represent the pKa of the organic compounds.

24
Figure 4: Absolute error between the ANN-GC-model predicted pKa and experimental pKa
for the 1622 organic compounds in dataset – 2
3.2. Application Examples
In this section, three examples are provided where the linear GC model, nonlinear GC model,
and ANN-GC model are employed to predict pKa. The non-linear model for amino acids and
the ANN-GC model for organic compounds will be available in ProPred (a property
prediction tool within ICAS (Gani et al., 1997). The examples given below are from a
prototype of ProPred.
3.2.1 Prediction of pKa using the linear and non-linear GC models (amino acids)
Since the linear and non-linear GC model performs well for amino acids only, an example for
the prediction of pKa of N-Acetyl L-Alanine is shown in Table 9.
25
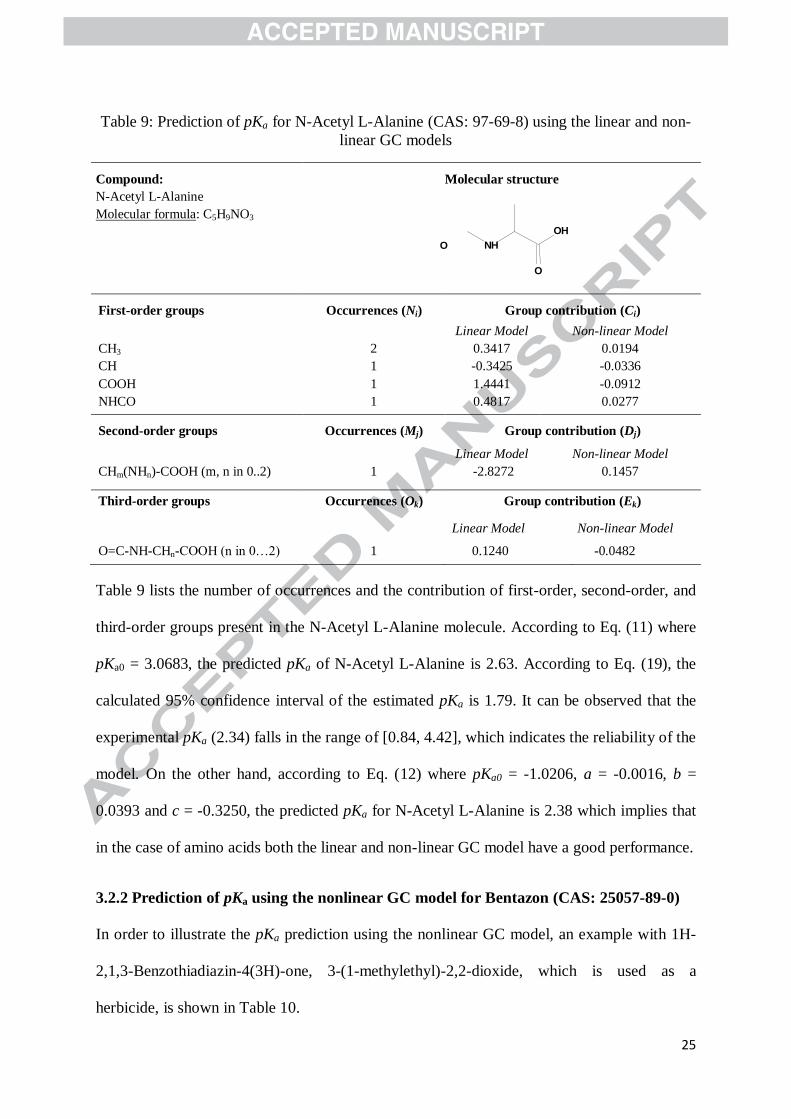
Table 9: Prediction of pKa for N-Acetyl L-Alanine (CAS: 97-69-8) using the linear and non-
linear GC models
Compound:
N-Acetyl L-Alanine
Molecular formula: C5H9NO3
Molecular structure
First-order groups Occurrences (Ni) Group contribution (Ci)
CH3
CH
COOH
NHCO
2
1
1
1
Linear Model
0.3417
-0.3425
1.4441
0.4817
Non-linear Model
0.0194
-0.0336
-0.0912
0.0277
Second-order groups Occurrences (Mj) Group contribution (Dj)
CHm(NHn)-COOH (m, n in 0..2)
1
Linear Model
-2.8272
Non-linear Model
0.1457
Third-order groups
Occurrences (Ok)
Group contribution (Ek)
O=C-NH-CHn-COOH (n in 0…2)
1
Linear Model
0.1240
Non-linear Model
-0.0482
Table 9 lists the number of occurrences and the contribution of first-order, second-order, and
third-order groups present in the N-Acetyl L-Alanine molecule. According to Eq. (11) where
pKa0 = 3.0683, the predicted pKa of N-Acetyl L-Alanine is 2.63. According to Eq. (19), the
calculated 95% confidence interval of the estimated pKa is 1.79. It can be observed that the
experimental pKa (2.34) falls in the range of [0.84, 4.42], which indicates the reliability of the
model. On the other hand, according to Eq. (12) where pKa0 = -1.0206, a = -0.0016, b =
0.0393 and c = -0.3250, the predicted pKa for N-Acetyl L-Alanine is 2.38 which implies that
in the case of amino acids both the linear and non-linear GC model have a good performance.
3.2.2 Prediction of pKa using the nonlinear GC model for Bentazon (CAS: 25057-89-0)
In order to illustrate the pKa prediction using the nonlinear GC model, an example with 1H-
2,1,3-Benzothiadiazin-4(3H)-one, 3-(1-methylethyl)-2,2-dioxide, which is used as a
herbicide, is shown in Table 10.
O NH
OH
O

26
Table 10: Prediction of pKa for 1H-2,1,3-Benzothiadiazin-4(3H)-one, 3-(1-methylethyl)-2,2-
dioxide (CAS: 25057-89-0) using the nonlinear GC model
Compound:
1H-2,1,3-Benzothiadiazin-4(3H)-one, 3-
(1-methylethyl)-2,2-dioxide
Molecular formula: C10H12N2O3S
Molecular structure
First-order groups Occurrences (Ni) Group contribution (Ci)
CH3
CH
aCH
aC fused with non-aromatic ring
NH (cyc)
N (cyc)
CO (cyc)
SO2 (cyc)
2
1
4
2
1
1
1
1
0.1322
-0.0182
0.0869
-0.6176
0.4334
0.1982
0.2178
0.4380
Second-order groups
(CH3)2CH
Occurrences (Mj)
1
Group contribution (Dj)
-0.0544
Third-order groups
aC-COcyc (fused rings)
aC-NHncyc (fused rings) (n in 0..1)
AROM.FUSED[2]
Occurrences (Ok)
1
1
1
Group contribution (Ek)
0.1754
0.2404
-0.2189
According to Eq. (12), the predicted pKa is 2.47
(where, a = 3.759×10⁻⁴, b = −0.0072, c = −0.0431, pKa0 = −1.3231)
The experimental pKa is 2.92. Hence, the absolute deviation is 0.45.
3.2.3 Prediction of pKa using the ANN-GC model for Bentazon (CAS: 25057-89-0)
To compare the ANN-GC model with the nonlinear GC model, the pKa prediction for the
same compound, 1H-2,1,3-Benzothiadiazin-4(3H)-one, 3-(1-methylethyl)-2,2-dioxide is
shown in Table 11.
O
S
N
NH
O
O

27
Table 11: Prediction of pKa for 1H-2,1,3-Benzothiadiazin-4(3H)-one, 3-(1-methylethyl)-2,2-
dioxide (CAS: 25057-89-0) using the ANN-GC model
Compound:
1H-2,1,3-Benzothiadiazin-4(3H)-one, 3-(1-
methylethyl)-2,2-dioxide
Molecular formula: C10H12N2O3S
Molecular structure
First-order
groups CH3 CH aCH aC NH(cyc) N(cyc) CO(cyc)
SO2 (cyc)
Occurrences 2 1 4 2 1 1 1 1
W1
[-1.6829 6.4756 1.7533 0.7377 0.443 0.9212 2.6333 -0.1755
1.0509 -0.2184 -2.1471 -1.2136 1.4681 0.8396 -1.0455 7.3758
3.619 -2.4328 1.6553 2.1358 -0.222 -1.2836 -6.3658 1.3176
4.7908 -4.4383 0.8453 1.6746 -0.3299 -2.5009 3.159 -0.1221
0.8226 1.2565 0.5366 -0.1923 0.1443 -6.606 -0.5895 0.6971
2.7329 6.3506 2.4439 5.4217 -4.8977 1.3109 -5.2433 0.7122
-8.9644 -19.3123 11.4152 2.9152 -17.5028 5.2274 10.238 -8.6289
0.8619 0.5316 -3.2969 3.7527 11.7938 -1.2256 -5.6679 -5.3864
1.1437 -2.4476 0.1281 1.5644 1.1092 10.2064 0.2857 0.1515
-0.6423 0.226 -1.544 0.1394 5.3677 -0.5433 -2.6248 4.8043
1.1433 -2.3074 1.388 2.2463 2.8746 1.9733 -0.0806 3.7311
4.6161 2.011 -3.8926 4.5683 -6.1653 -13.1146 -1.5625 7.5796
2.7842 -1.8139 -1.0137 -0.2305 -5.2968 -1.779 2.0042 0.471
2.9091 -3.0596 0.6423 -1.0794 -0.5082 1.0108 1.4972 6.0197
-5.2623 6.3213 -4.5124 -0.5687 -2.2154 11.0957 0.5727 9.6914
-0.0379 2.157 1.4917 -0.9739 2.458 5.8252 0.2285 5.0562
6.3547 6.897 0.7735 -2.2172 -3.7028 1.37 10.668 1.3711
-3.5484 20.4593 2.7547 9.418 6.3029 3.7152 8.6495 3.7617
3.0958 -13.0759 3.5244 -5.4662 13.0565 -12.2072 2.812 3.5092
5.4879 -5.8329 -0.0789 2.5132 -8.8739 5.0805 -4.625 -0.7204]
b1 Transformation
of W2 b2 Input variable p = [2 1 4 2 1 1 1 1]’ ( he ze ele en s a e
removed). By following Eqs. (13-16), pKapred = 2.9211. The
experimental value of pKa is 2.92. Hence, the absolute deviation
is 0.0011.
-15.6497 11.2478 -2.3479 1.5128 -15.9438
-15.1206 -6.0101 -3.8606 -14.6460 -8.8757 -12.7365 -24.9630 8.3284 9.1079 -9.0066
13.3214 9.7666 6.9750 -15.2921 -1.2177 -12.5122
-3.5163 17.6801 11.6018 5.2121 -1.5351 18.8958 1.6159 13.7597 9.8148 5.9600 -4.6202 -18.6921 4.1303 17.3304 0.1458 6.0333
-18.9379 6.0589 27.8468 -5.7745
O
S
N
NH
O
O

28
Two more examples for pKa prediction using the nonlinear GC model and the ANN-GC
model can be found in the supporting information (Tables S6 – S7).
4. Conclusion
The prediction of acid dissociation constant (Ka) is very significant in many areas. In this
work, three GC property models have been developed and tested for the estimation of the pKa
of organic compounds including amino acids. The linear GC model has a good performance
(R2 = 0.96, AAE = 0.23) only for amino acids. For the other classes of compounds, a
nonlinear GC model and an ANN-GC model have been developed. The nonlinear GC model
has a moderate prediction quality (R2 = 0.81, AAE = 1.18) whereas the ANN-GC model
gives a much better estimation (R2 = 0.98, AAE = 0.17).
The developed models enable fast and preliminary pKa estimations in the cases where the
experimental measurements are difficult or not feasible. Currently, these models are being
incorporated into a computer-aided molecular design framework to identify and analyse
promising molecules with desirable properties.

29
References
1. Bettelheim, F., Brown, W., Campbell, M., Farrell, S., 2007. Introduction to Organic and
Biochemistry. Belmont CA: Thomson Brooks/Cole.
2. Bishop, C.M., 1995. Neural Networks for Pattern Recognition. Oxford University Press.
3. Cheung, E., 1995. Substituent Effects on the Tautomerization of Amino Acids. Master of
Science. Texas Tech University.
4. Gani R., Hytoft G., Jaksland C., Jensen A.K., 1997. An integrated computer aided system
for integrated design of chemical processes. Computers Chemical Engineering 21(10),
1135–1146
5. Gharagheizi, F., Eslamimanesh, A., Mohammadi, A.H., Richon, D., 2011a.
Representation/prediction of solubilities of pure compounds in water using artificial
neu al ne w k− g up c n ibu i n e h d. Journal of Chemical & Engineering Data
56(4), 720-726.
6. Gharagheizi, F., Alamdari, R.F., Angaji, M.T., 2008. A new neural network − group
contribution method for estimation of flash point temperature of pure components.
Energy & Fuels 22(3), 1628-1635.
7. Gharagheizi, F., Eslamimanesh, A., Mohammadi, A.H., Richon, D., 2011b. Use of
artificial neural network-group contribution method to determine surface tension of pure
compounds. Journal of Chemical & Engineering Data 56(5), 2587-2601.
8. Green, D., Perry, R., 2008. Perrys's Chemical Engineers' Handbook. 8th ed. New York:
McGraw-Hill.
9. Hukkerikar, A.S., Sarup, B., Kante, T.A., Abildkov, J., Sin, G., Gani, R., 2012. Group-
contribution+ (GC+) based estimation of properties of pure components: Improved
property estimation and uncertainty analysis, Fluid Phase Equilibria 321, 25–43
30
10. Hukkerikar, A.S., Kalakul, S., Sarup, B., Young, D.Y., Sin, G., Gani, R., 2012.
Estimation of environment-related properties of chemicals for design of sustainable
processes: development of group-contribution+ (GC+) property models and uncertainty
analysis. Journal of Chemical Information and Modeling 52(11), 2823-2839
11. Hukkerikar, A.S., Meier, R.J., Gani, R., 2013. A method to estimate the enthalpy of
formation of organic compounds with chemical accuracy. Fluid Phase Equilibria 348,
23-32.
12. Im, W., Beglov, D. and Roux, B., 1998. Continuum solvation model: Computation of
electrostatic forces from numerical solutions to the Poisson-Boltzmann
equation. Computer Physics Communications, 111, 59-75.
13. Jang, Y., Sowers, L., Çaǧin, T., Goddard, W., 2001. First Principles Calculation of pKa
Values for 5-Substituted Uracils. The Journal of Physical Chemistry A 105(1), 274-280.
14. Jensen, J., Swain, C., Olsen, L., 2017. Prediction of pKa Values for Druglike Molecules
Using Semiempirical Quantum Chemical Methods. The Journal of Physical Chemistry A
121(3), 699-707.
15. Jhamb, S., Liang, X., Gani, R., Hukkerikar, A., 2018. Estimation of physical properties of
amino acids by group-contribution method. Chemical Engineering Science 175, 148-161.
16. Kirkwood, J. and Westheimer, F., 1938. The electrostatic influence of substituents on the
dissociation constants of organic acids. I. The Journal of Chemical Physics 6(9), 506-512.
17. , G., Vogel, W., Andrussow, K., 1961. Dissociation Constants of Organic Acids
in Aqueous Solution. London: Butterworths.
18. Levenberg, K., 1944. A method for the solution of certain non-linear problems in least
squares. Quarterly of Applied Mathematics 2(2), 164-168.

31
19. Marquardt, D., 1963. An algorithm for least-squares estimation of nonlinear
parameters. Journal of the Society for Industrial and Applied Mathematics 11(2), 431-
441.
20. Marrero, J., Gani, R., 2001. Group-contribution based estimation of pure component
properties. Fluid Phase Equilibria 183-184, 183-208.
21. Marrero, J., Gani, R., 2002. Group-contribution-based estimation of octanol/water
partition coefficient and aqueous solubility. Industrial & Engineering Chemistry
Research 41(25), 6623-6633.
22. Metzler, D., 2012. Chapter 3: Energetics of Biochemical Reactions. In: Biochemistry: The
Chemical Reactions of Living Cells, Volume 1. New York, USA: Academic Press Inc.,
176 - 178.
23. Peck, T., Hill, S., 2014. Pharmacology for Anaesthesia and Intensive Care. Cambridge
University Press.
24. Perrin, D., 1965. Dissociation Constants of Organic Bases in Aqueous Solution. London:
Butterworth.
25. Perrin, D., Dempsey, B., Serjeant, E., 1981. pKa Prediction for Organic Acids and Bases.
London: Chapman & Hall.
26. Petersen, R., Fredenslund, A., Rasmussen, P., 1994. Artificial neural networks as a
predictive tool for vapor-liquid equilibrium. Computers & Chemical Engineering 18,
S63-S67.
27. Shields, G.C., Seybold, P.G., 2013. Computational Approaches for the Prediction of pKa
Values. Boca, Raton, Florida: CRC Press.
28. Tong, W., Wen, H., 2008. Preformulation Aspects of Insoluble Compounds. In: R. Liu,
ed., Water-Insoluble Drug Formulation, 2nd ed. Boca, Raton, Florida: CRC Press, 62-87.
32
Highlights
Prediction of acid dissociation constants (Ka) for a large set of organic compounds
The Marrero and Gani - Group Contribution (MG-GC) method to develop the property
models
Linear and nonlinear GC models for amino acids and other classes of compounds
An Artificial Neural Network (ANN) based GC model for organic compounds
Modeling details and model parameters provided
Accuracy of the models demonstrated through application examples

33
Graphical abstract
Top Related
Copyright © 2022 FDOKUMEN

