


Bahasa
Halaman
Hukum

Agricultural and Forest Meteorology 116 (2003) 181–196
Possible change in Irish climate and its impact onbarley and potato yields
N.M. Holdena,∗, A.J. Breretona, R. Fealyb, J. Sweeneyb,c
a Department of Agricultural and Food Engineering (Bioresources Modelling Group), University College Dublin,Earlsfort Terrace, Dublin 2, Ireland
b Department of Geography, National University of Ireland Maynooth, Maynooth, County Kildare, Irelandc National Institute of Regional and Spatial Analysis, National University of Ireland Maynooth,
Maynooth, County Kildare, Ireland
Received 20 August 2002; received in revised form 19 November 2002; accepted 20 December 2002
Abstract
Climate change scenarios can be used with crop simulation models to predict the impact of climate change on agriculturalproduction. Focusing on two specific arable crops: (i) barley, a currently successful cereal crop, well adapted to the Irishclimate and a staple of the tillage production sector; and (ii) potato, a traditional root crop in Ireland, sensitive to water stressand also a staple of the tillage production sector, the impact of climate change on yield was determined using simulationmodels (in the DSSAT package) and downscaled output from a general climate model. Daily weather data stochasticallygenerated from mean monthly values for baseline (1961–1990), 2055 (2041–2060) and 2075 (2061–2090) climate periodswere derived for over 500 locations in Ireland (derived from HADCM3Ga1). Important points with respect to the expectedchange in climate were that rainfall becomes more seasonally extreme, and a relatively uniform increase in temperature ofabout 1.6◦C over the country can be expected by the 2075 climate period. This change in climate is predicted to cause littlechange in the geographical distribution of barley yield, but grain yield in all areas is expected to increase with possibly agreater increase to the west. Potato yield in 2055 and 2075 is expected to fall for non-irrigated tubers. The impact is likely tobe a severe loss of yield over most of the country by 2055. The implications of these findings are that barley will remain aviable cereal crop, and might find a greater role in livestock supplement feed supply (due to predicted drought losses effectinggrass yield), but the irrigation demand for potato will be very significant, possibly making the crop non-viable for farmers,particularly in the east of Ireland where there will be competition for water in summer.© 2003 Elsevier Science B.V. All rights reserved.
Keywords: Climate change; Ireland; Barley; Potato
1. Introduction
The impact of climate change on agricultural pro-duction in Ireland is related to three specific factors:atmospheric carbon dioxide concentration, precipita-
∗ Corresponding author. Tel.:+353-1-7167460;fax: +353-1-4752119.E-mail address: [email protected] (N.M. Holden).
tion and temperature. Temperature will be related tothe incident radiation, the influence of air masses andthe cloud cover, while precipitation will be relatedto the stability and temperature of air masses. Theinfluence of carbon dioxide concentration depends onspecific plant biology; C3 species will tend to benefitfrom elevated CO2 more than C4 species. There havebeen mixed experimental responses to elevated CO2in potato. Gourdrain and de Ruiter (1983)found a
0168-1923/03/$ – see front matter © 2003 Elsevier Science B.V. All rights reserved.doi:10.1016/S0168-1923(03)00002-9

182 N.M. Holden et al. / Agricultural and Forest Meteorology 116 (2003) 181–196
slight negative response,Wheeler and Tibbitts (1997)found no response in tuber growth (only in aboveground biomass), whileFinnan et al. (2002)found asignificant increase in fresh tuber weight. Simulationmodelling suggests that potato should have a positivetuber yield response to elevated CO2. Fangmeier et al.(2000) found that elevated CO2 caused an elevatedgrain yield in barley as didSœbø and Mortensen(1996). In agricultural systems, the balance of croptype and competing weeds, and relative ability toutilise increased carbon dioxide in the atmospherewill have a significant impact on specific productionsystems. It is likely that weeds will adapt to climatechange more rapidly than crops due to their geneticadvantage (Bunce and Ziska, 2000).
Increased temperatures and changing seasonality ofprecipitation may have significant impacts on the op-erations of farms, the crops that can be grown and thenecessary infrastructure to ensure successful farm en-terprises. In Ireland rainfall is currently sufficient toensure that very little irrigation is required for crops.However, for potato, drought stress is important andfarmers in the east of Ireland already have to flood ir-rigate potato fields to ensure adequate yields. Giventhat an increased seasonality of water supply is pre-dicted (Sweeney and Fealy, 2001), this may becomeproblematic without the introduction of the necessaryinfrastructure. Competing demands for water in thesummer may make irrigation uneconomical for tillagefarmers.
In this paper, the impact of climate change will beviewed in terms of how precipitation, temperature, andradiation are predicted to change for Ireland over thecoming century, and how that change will impact uponcrop yields. The approach taken is to use mathemati-cal simulations of crop growth to predict yield, drivenby downscaled climate data derived from the output ofa general climate model. This paper will focus on twospecific crops: (i) barley because it is a currently suc-cessful cereal crop, well adapted to the Irish climateand a staple of the tillage production sector; and (ii)potato because it is a traditional root crop in Ireland, itis sensitive to water stress and it is also a staple of thetillage production sector. Currently in Ireland, barleyaccounts for about 70% of the area under cereal pro-duction, and 50% of the area under arable crop produc-tion (derived fromAnon., 2001), therefore, it is a vitalcrop for Irish farmers and its future sustainability is of
great importance. Potatoes account for about 5% of theland area under crop production (Anon., 2001), but areimportant because of the demand for potatoes by theIrish consumer. Culturally the potato is integrated withIrish society in a way that other arable crops are not,and therefore any potential change in its potential as aprofitable crop is of great interest. It is the aim of thiswork to evaluate the change in climate that may occurin Ireland over the next century, and to assess the po-tential impact of this climate change in terms of yieldsfor two very important crops: barley and potato. Theprimary impact will be assessed in terms of changesin yields, but the secondary impacts on farm systemsand production will also be considered.
2. Methods
2.1. Regional climate scenarios for Ireland
There are a number of options for deriving cli-mate scenario data to drive agricultural models atsuitable resolutions as undertaken in this research. Di-rect output from General Circulation Model (GCM)simulations are largely inadequate for regional scaleimpact analysis due to the coarse spatial resolutionemployed by most GCMs filtering out importantsub-grid, regional scale differences in climate. Inorder to overcome these difficulties and to provideuseful local/regional scale climate scenarios for im-pacts modelling, a number of techniques have beendeveloped which utilise direct output from a GCM,but also take account of the observed regional varia-tions in climate. One such method is “pattern scaling”(Santer et al., 1990), whereby the difference betweencurrent and future GCM simulations are added to anobserved climate baseline or time series. The output isthe existing regional spatial pattern of climate largelyreplicated for future time slices, while the mean is‘phase’ shifted up or down depending on the variableof interest. Another method for increasing the spatialresolution from a GCM requires running a nested“regional climate model” (RCM) whose boundaryconditions are forced by a parent GCM. Currently,the output resolution of RCMs are typically of theorder of 25–50 km2. Although the level of detail froman RCM is far greater than the original GCM, thismethod is computationally very intensive. A third
N.M. Holden et al. / Agricultural and Forest Meteorology 116 (2003) 181–196 183
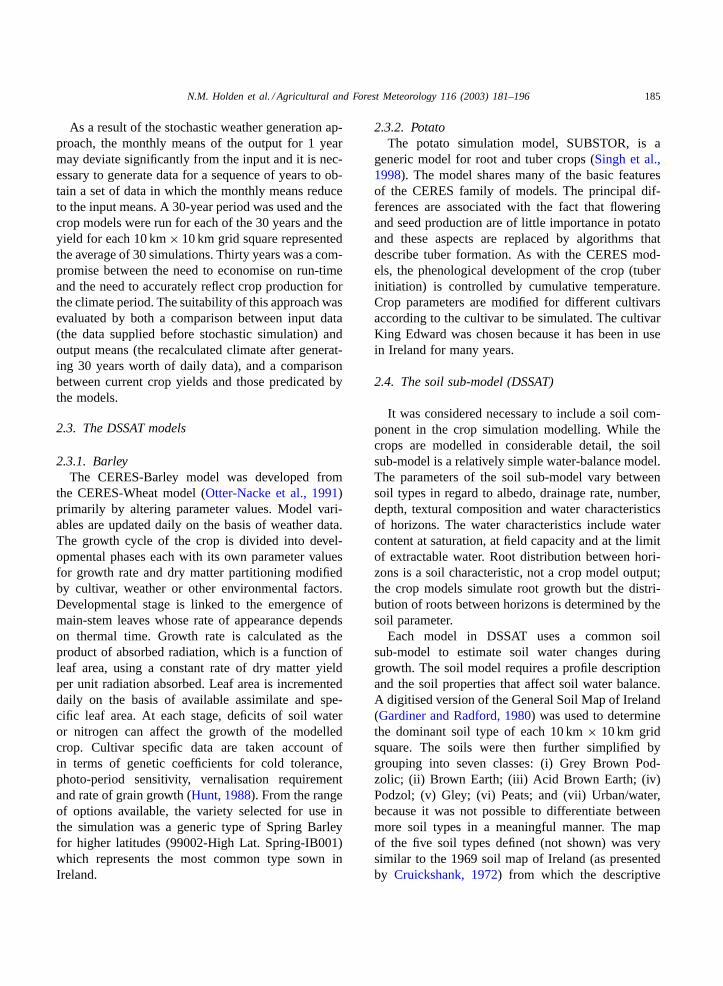
method, “statistical downscaling”, requires fewer sim-plifying assumptions than pattern scaling and is lesscomputationally intensive than an RCM. Statisticaldownscaling was the technique adopted for this study.
Statistical downscaling seeks to establish empiricalrelationships between observed mesoscale variables,such as, pressure, vorticity, geopotential heights, andan observed climate time series, such as temperature,precipitation or radiation. The use of upper air vari-ables is advantageous for two reasons: upper air vari-ables account for a large proportion of the variance inlocal climate (Cavazos and Hewitsone, 2002), and it isassumed that GCMs simulate upper air variables moreaccurately than surface variables (such as precipita-tion) which are dependent on processes that are notresolved by large GCM grid sizes (Wilby and Wigley,2000). As a consequence, the relationships betweenupper air and surface variables provide transfer func-tions which can then be applied to output data fromGCMs for future time periods (Karl et al., 1990). Usingthis method, future climate scenarios can be generatedat a regional scale. Implicit in statistical downscalingis the assumption that the derived relationships willremain stable under climate change conditions.
Data were compiled from a number of sourcesfor generating and testing climate scenarios. For theperiod 1961–1990 (designated by the IPCC as thebaseline against which climate change is measured)surface observations of precipitation, temperature andradiation were compiled from Met Éireann (Irish Me-teorological Service) and British Atmospheric DataCentre (BADC) databases for the whole of Ireland(570 precipitation, 70 maximum/minimum tempera-ture, and 35 incident radiation/sunshine hours obser-vation locations). Upper air data for the 1961–1990period were obtained from the National Centre forEnvironmental Prediction/National Centre for Atmo-spheric Research (NCAR/NCEP) reanalysis projectfor the spatial domain around Ireland. The choice ofupper air variables was dependent on similar variablesbeing produced by the GCM (Table 1). The reanalysisdata was regrided from the NCEP grid (2.5◦ latitudeby 2.5◦ longitude) to the GCM output grid resolution(2.5◦ latitude by 3.75◦ longitude).
The GCM utilised was the Hadley Climate ModelHadCM3, which is a coupled ocean-atmosphere GCMdeveloped by the UK Meteorological Office as a ver-sion of their unified forecast and climate model. The
Table 1Variables used to derive the transfer functions
Predictor variables Level (mb)
Mean sea level pressure Surface2 m temperatures SurfaceSpecific humidity SurfaceGeopotential heights 500, 700, 850Relative humidity 500, 700, 850Geopotential thickness 500–700Geopotential thickness 700–850Geopotential thickness 500–850
PredictandsPrecipitation SurfaceMaximum temperature SurfaceMinimum temperature SurfaceRadiation Surface
model has a grid size of about 240 km× 278 km inthe vicinity of Ireland with 19 vertical levels in theatmosphere and a time-step of 0.5 h. The 20-leveloceanic model employed in tandem with the atmo-spheric model operates at a resolution of 1.25×1.25◦meaning each atmospheric grid cell has six oceanicgrid cells associated with it, therefore the oceaniccomponent of the model can simulate currents in afairly realistic manner which is important for sce-nario modelling in the maritime climate found inIreland.
Daily output for nine grid cells in the vicinity ofIreland was extracted from a HadCM3 run. Onceisolated, only the grid specific to Ireland was utilisedfurther. The particular run concerned (HadCM3Ga1)was based on historical increases in individual green-house gases from 1860 to 1990 and then partly on theemission scenario IS95a. This involved a 1% per an-num rise in radiative forcing but no consideration oftropospheric ozone. The end product was a ‘middle ofthe road’ scenario which produces global temperatureincreases of approximately+3.0◦C by 2100 (IPCC,2001) which was considered to be suitable for pre-diction of climate change impact on Irish agriculture.The resulting datasets were then used to generate cli-mate scenarios for three different periods: 1961–1990(baseline), 2041–2070 (2055) and 2061–2090 (2075).The difference between the modelled-future andmodelled-current scenarios was calculated and addedto the baseline observations to estimate a future cli-mate scenario. It is important to note that using only

184 N.M. Holden et al. / Agricultural and Forest Meteorology 116 (2003) 181–196
Table 2Validation summary using independent dataset for the period 1991–1997
Downscaled variables Range of monthly values of Pearson’s ‘r’ Mean average error Root mean square error
Maximum temperature 0.2–0.9 0.04◦C 0.9◦CMinimum temperature 0.5–0.9 0.03◦C 0.8◦CPrecipitation 0.4–0.9 0.3–30.0 mm 24.0–48.7 mmRadiation −0.1–0.6 0.4 MJ per day 1.1 MJ per day
one scenario and one GCM (HadCM3Ga1) meansthat the effect of deviations from the IS95a emis-sions scenario or factors specific to the HadCM3model cannot be accounted for by measures of uncer-tainty. This is being addressed by current research inIreland.
Statistical downscaling was carried out using ap-proximately 250 precipitation, 65 maximum/minimumtemperature, and approximately 35 radiation/sunshinehours observation locations. Due to the limited num-ber of locations measuring radiation in Ireland, datafrom sunshine hours observations were converted toradiation (McEntee, 1980) in order to augment the ra-diation network (Sweeney and Fealy, 2001).
Testing of the downscaling was performed usingan independent dataset of monthly data for the period1991–1997 (Table 2). In general, temperature resultswere good, particularly for summer maxima. Mini-mum temperatures were predicted well for all sea-sons. Downscaling precipitation was less accurate atall times of the year due to the influence of local factorsthat could not be included in the downscaling method-ology. Radiation gave acceptable results overall. Hav-ing tested the statistical models, the climate scenariodata were used to derive a 10 km× 10 km grid overthe whole of Ireland using a regression model similarto that ofGoodale et al. (1998).
The CO2 concentration for each scenario was esti-mated based on the assumption that levels would dou-ble from the 1990 level (365 ppm) by 2100. On thisbasis, the level for 2055 was estimated to be 581 ppm,and 647 ppm by 2075. This is compatible with an esti-mated value of 550 ppm by the middle of this century(Houghton et al., 1992). The simulation models used(seeSection 2.3) use CO2 concentration as a givenvalue for a particular climate situation based on thesevalues.
In order to simulate crop growth for the baselineand future climate periods it was necessary to generate
daily weather data for driving the specific simulationmodels. The crop simulation models used in this workwere part of a suite of models assembled under USGovernment sponsorship since 1980 as the DecisionSupport System for Agricultural Technology Transfer(DSSAT, version 3.5) (http://icasanet.org/dssat; Tsujiet al., 1994). All of the models are well known fromthe scientific literature or are more recent adaptationsbased on established models to extend their use toalternative crops, and all have been thoroughly testedand incorporate the most recent information on eachof the crops (Tsuji et al., 1994).
2.2. Daily weather data generation
The barley and potato models both required dailyvalues of solar radiation, maximum temperature, min-imum temperature and rainfall. To derive daily datafrom the monthly mean data available, a stochas-tic weather generator Simmeteo (supplied with theWeatherman module of DSSAT) was used (Genget al., 1986). The main problem encountered with thismethod was the requirement to use monthly meannumber of raindays to create the daily weather data.The number of raindays per month was not availablefor each 10 km× 10 km grid square. Raindays datawere available for some Met Éireann weather stationsand an analysis of the relationship between the av-erage total monthly rainfall and average number ofraindays per month (Holden and Brereton, 2003) sug-gested that a general extrapolation could be achievedusing the equations:
N = 0.26× P (whereP < 100 mm) (1)
N =24.0 + 0.0189×P (whereP > 100 mm) (2)
to estimate number of raindays (N) from total rainfall(P) for each month for each of the 10 km×10 km gridsquares.
N.M. Holden et al. / Agricultural and Forest Meteorology 116 (2003) 181–196 185
As a result of the stochastic weather generation ap-proach, the monthly means of the output for 1 yearmay deviate significantly from the input and it is nec-essary to generate data for a sequence of years to ob-tain a set of data in which the monthly means reduceto the input means. A 30-year period was used and thecrop models were run for each of the 30 years and theyield for each 10 km× 10 km grid square representedthe average of 30 simulations. Thirty years was a com-promise between the need to economise on run-timeand the need to accurately reflect crop production forthe climate period. The suitability of this approach wasevaluated by both a comparison between input data(the data supplied before stochastic simulation) andoutput means (the recalculated climate after generat-ing 30 years worth of daily data), and a comparisonbetween current crop yields and those predicated bythe models.
2.3. The DSSAT models
2.3.1. BarleyThe CERES-Barley model was developed from
the CERES-Wheat model (Otter-Nacke et al., 1991)primarily by altering parameter values. Model vari-ables are updated daily on the basis of weather data.The growth cycle of the crop is divided into devel-opmental phases each with its own parameter valuesfor growth rate and dry matter partitioning modifiedby cultivar, weather or other environmental factors.Developmental stage is linked to the emergence ofmain-stem leaves whose rate of appearance dependson thermal time. Growth rate is calculated as theproduct of absorbed radiation, which is a function ofleaf area, using a constant rate of dry matter yieldper unit radiation absorbed. Leaf area is incrementeddaily on the basis of available assimilate and spe-cific leaf area. At each stage, deficits of soil wateror nitrogen can affect the growth of the modelledcrop. Cultivar specific data are taken account ofin terms of genetic coefficients for cold tolerance,photo-period sensitivity, vernalisation requirementand rate of grain growth (Hunt, 1988). From the rangeof options available, the variety selected for use inthe simulation was a generic type of Spring Barleyfor higher latitudes (99002-High Lat. Spring-IB001)which represents the most common type sown inIreland.
2.3.2. PotatoThe potato simulation model, SUBSTOR, is a
generic model for root and tuber crops (Singh et al.,1998). The model shares many of the basic featuresof the CERES family of models. The principal dif-ferences are associated with the fact that floweringand seed production are of little importance in potatoand these aspects are replaced by algorithms thatdescribe tuber formation. As with the CERES mod-els, the phenological development of the crop (tuberinitiation) is controlled by cumulative temperature.Crop parameters are modified for different cultivarsaccording to the cultivar to be simulated. The cultivarKing Edward was chosen because it has been in usein Ireland for many years.
2.4. The soil sub-model (DSSAT)
It was considered necessary to include a soil com-ponent in the crop simulation modelling. While thecrops are modelled in considerable detail, the soilsub-model is a relatively simple water-balance model.The parameters of the soil sub-model vary betweensoil types in regard to albedo, drainage rate, number,depth, textural composition and water characteristicsof horizons. The water characteristics include watercontent at saturation, at field capacity and at the limitof extractable water. Root distribution between hori-zons is a soil characteristic, not a crop model output;the crop models simulate root growth but the distri-bution of roots between horizons is determined by thesoil parameter.
Each model in DSSAT uses a common soilsub-model to estimate soil water changes duringgrowth. The soil model requires a profile descriptionand the soil properties that affect soil water balance.A digitised version of the General Soil Map of Ireland(Gardiner and Radford, 1980) was used to determinethe dominant soil type of each 10 km× 10 km gridsquare. The soils were then further simplified bygrouping into seven classes: (i) Grey Brown Pod-zolic; (ii) Brown Earth; (iii) Acid Brown Earth; (iv)Podzol; (v) Gley; (vi) Peats; and (vii) Urban/water,because it was not possible to differentiate betweenmore soil types in a meaningful manner. The mapof the five soil types defined (not shown) was verysimilar to the 1969 soil map of Ireland (as presentedby Cruickshank, 1972) from which the descriptive
186 N.M. Holden et al. / Agricultural and Forest Meteorology 116 (2003) 181–196
Table 3FILEX control values for simulation control during model operation
Spring Barley Potato
Cultivar High latitude Spring King Edward
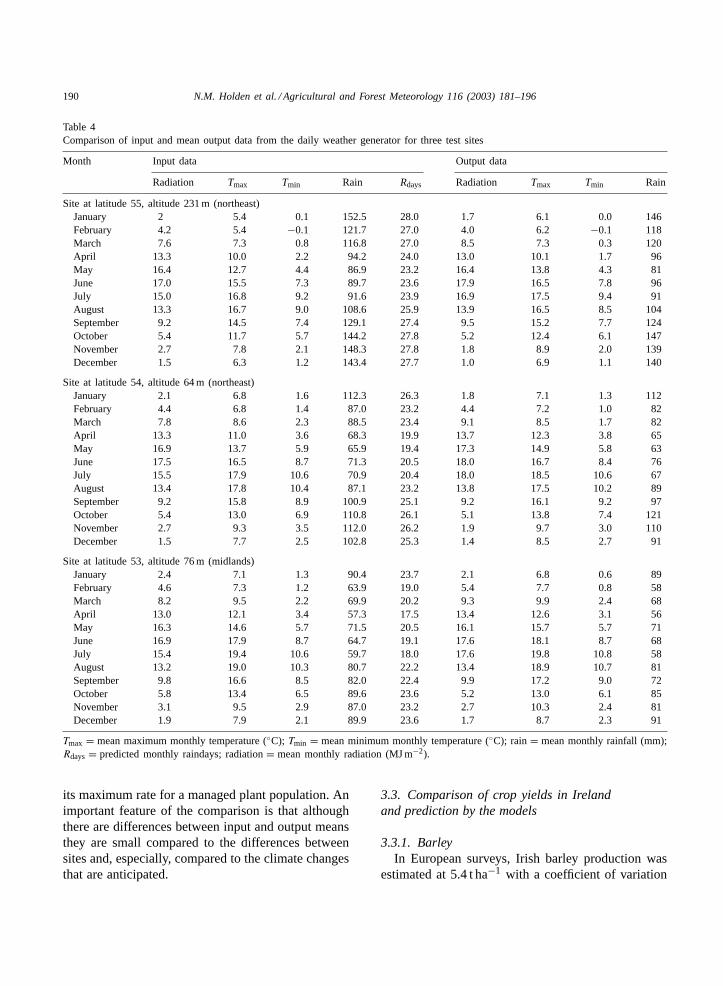
Planting On 16 March On 16 March225 seeds m2, 0.15 m rows 5.1 seeds m2, 0.86 m rows0.02 m depth 0.2 m depth
Fertiliser 50 kg N ha−1, two equal applications 200 kg N ha−1, two equal applications6 March and 15 April 6 March and 15 April
Harvest date At maturity (simulated) 11 November
For all model runs:Number of replicates 30 years (variable weather in site climate)Soil Site variableClimate Site variableInitial soil conditions Profile at field capacity
terminology was derived. Grid squares dominated byPeats and Urban/water were excluded from the cropyield calculations, as were any grid squares with anaverage altitude over 150 m.
2.5. Model operation: starting conditionsand crop management
Using the DSSAT package, events are controlledby an experimental protocol entered in a control filecalled the FILEX. The generation of 30 years dailydata for each climate period and each site was ef-fected from the FILEX. For each of the 30 years ofdaily weather data, for each grid square the growth ofcrop was run for a single season and the results for 30runs were averaged to produce a yield per grid squareper climate period. There were 845 10 km× 10 kmgrid squares but with the elimination of sites over150 m and those dominated by Peats and Urban/water,the number of grid squares processed was 560. TheFILEX also controls the treatments (date and methodof planting, the date and rate of fertiliser applicationand of harvest—the data were obtained from Teagasc(the national agricultural advisory service) advisoryguidelines (Teagasc, 2000)—and cultivar attributes tobe used for the simulation (Table 3). Control of initialsoil water status, number of replicates, the simulationstart date, the detail of the method for weather gener-ation and the form of output were also specified in theFILEX.
Prior to assessing the impact of climate change onthe yield of barley and potato that may be expectedin the future, the model output was compared withdata from published Irish crop trials to ensure thatthe results for the baseline period were in line withyields obtained in the field (results are presented inSection 3.3).
3. Results and discussion
3.1. Predicted climate change
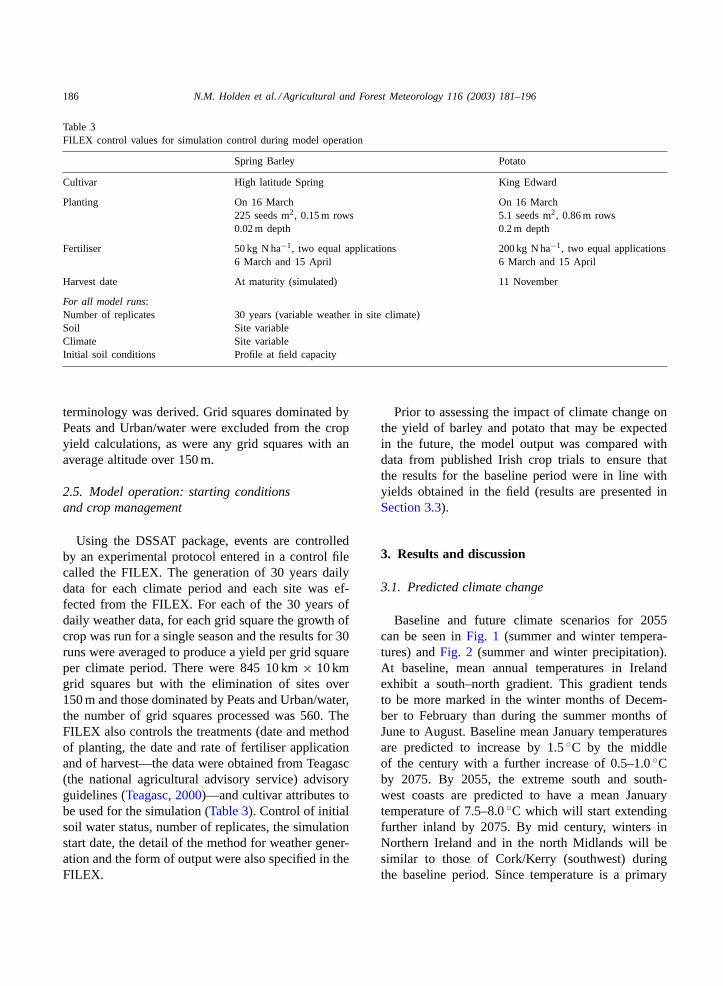
Baseline and future climate scenarios for 2055can be seen inFig. 1 (summer and winter tempera-tures) andFig. 2 (summer and winter precipitation).At baseline, mean annual temperatures in Irelandexhibit a south–north gradient. This gradient tendsto be more marked in the winter months of Decem-ber to February than during the summer months ofJune to August. Baseline mean January temperaturesare predicted to increase by 1.5◦C by the middleof the century with a further increase of 0.5–1.0◦Cby 2075. By 2055, the extreme south and south-west coasts are predicted to have a mean Januarytemperature of 7.5–8.0◦C which will start extendingfurther inland by 2075. By mid century, winters inNorthern Ireland and in the north Midlands will besimilar to those of Cork/Kerry (southwest) duringthe baseline period. Since temperature is a primary
N.M. Holden et al. / Agricultural and Forest Meteorology 116 (2003) 181–196 187
Fig. 1. Change in January and July temperature for baseline (1961–1990) and 2041–2070 climates.
188 N.M. Holden et al. / Agricultural and Forest Meteorology 116 (2003) 181–196
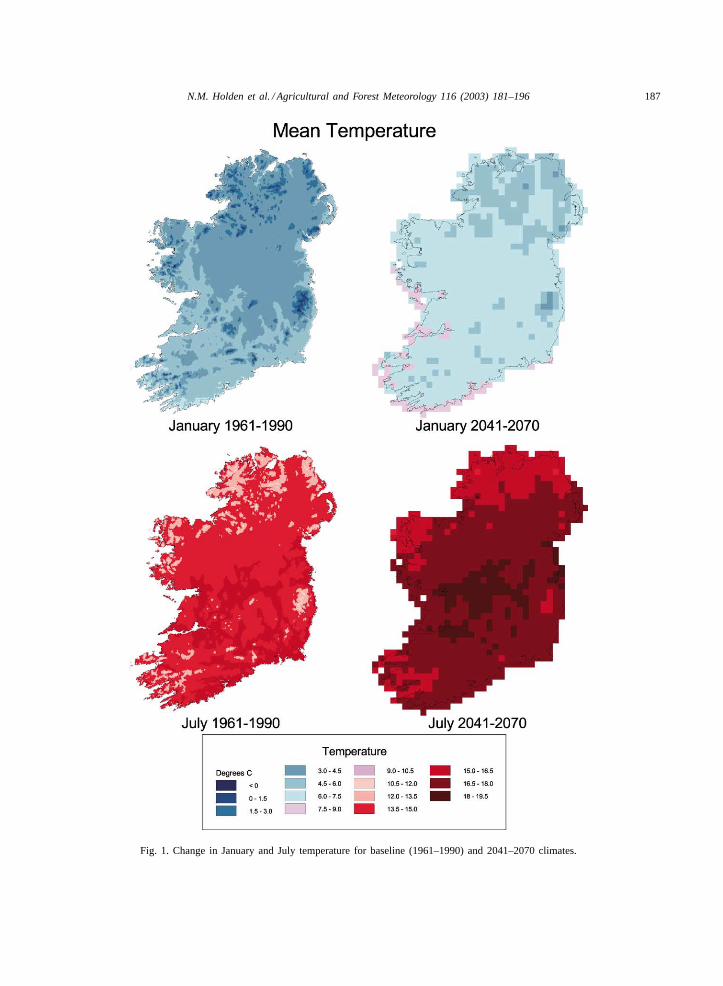
Fig. 2. Change in January and July rainfall for baseline (1961–1990) and 2041–2070 climates.

N.M. Holden et al. / Agricultural and Forest Meteorology 116 (2003) 181–196 189
meteorological characteristic, secondary factors suchas frost frequency and growing season length can alsobe expected to undergo considerable changes. Signs ofearlier springs and lengthening of the growing seasonover the past three decades have been detected both inthe Irish instrumental record and in ecological eventssuch as leaf unfolding and bird migration (Donnellyet al., 2001) which supports the suggested trend of thefuture scenarios.
Seasonally, spring temperatures are predicted torise by 1.5◦C between the baseline period and 2055and further again by 2075. Summer temperaturesdemonstrate a similar pattern with slightly largerincreases of 2.0–2.5◦C. Prediction of mean Julytemperatures indicates an overall increase of 2.5◦Cby 2055 and a further increase of 1.0◦C by 2075.Maximum July temperatures in the order of 24.5◦Ccould be expected in the central Midlands. Autumntemperatures tend to show less dramatic increasesand are approximately 1.0◦C higher than baseline by2055 with a further increase of 1.0◦C by 2075, bywhich time the extreme south and southwest coastscould be experiencing mean autumn temperatures of12.5◦C.
Precipitation scenarios are inherently less reliablethan temperature, given the inherent uncertaintiesof GCMs with respect to this spatially variable fea-ture of climate (Burger, 1996; Wilby et al., 1998).However, an average monthlyR2 value of 0.51 wasobtained for the training functions with baseline cli-mate which suggests that some confidence couldbe placed in the future scenarios. The baseline ge-ographical distribution of precipitation is largelydominated by orography with a marked west–eastgradient (Fig. 2). This pattern is still visible in the2055 and 2075 scenarios. Overall increases in pre-cipitation, averaging 11%, are predicted for the win-ter months of December to February. The greatestwinter increases are suggested for the northwest (ap-proximately 20% by mid century), but little winterchange is predicted for the east coast and in the east-ern part of the Central Plain. Decreases in rainfallof the order of 25% with decreases of over 40% insome parts of the southeast suggested for the summermonths. Such decreases, if realised, would clearlyhave profound implications for agriculture and waterresource management. Reductions on the southeastcoast of similar magnitudes are also seen in the re-
cently released UKCIPS02 scenarios generated froman RCM for the 2050 and 2080 periods with theMedium–High and High emissions scenarios (Hulmeet al., 2002).
The baseline geographical distribution of radiationremains fairly similar to the current distribution infuture scenarios, decreasing on a southeast to north-west axis. There are slight decreases predicted in au-tumn, winter and spring for 2055 and 2075. Thesemay relate to changes in cloud cover during thoseseasons.
Important points with respect to the expectedchange in climate can be summarised as:
• a relatively uniform increase in temperature of about1.6◦C over the country will occur;
• little difference in temperature between 2055 and2075 (only a slight increase);
• high rainfall sites get more seasonally extreme by adecrease in precipitation in spring and summer withlittle change in winter and a slightly wetter autumn;
• low rainfall sites become more seasonally ex-treme, with winters similar to the present but withmarkedly drier summers (the effect is seen by 2055but does not get more extreme by 2075);
• average rainfall sites get more seasonally extremeby a decrease in precipitation in spring and summerwith little change in autumn and winter (a slightincrease in winter occurs);
• little difference in precipitation between 2055 and2075 (only a slight increase).
3.2. Daily weather data evaluation
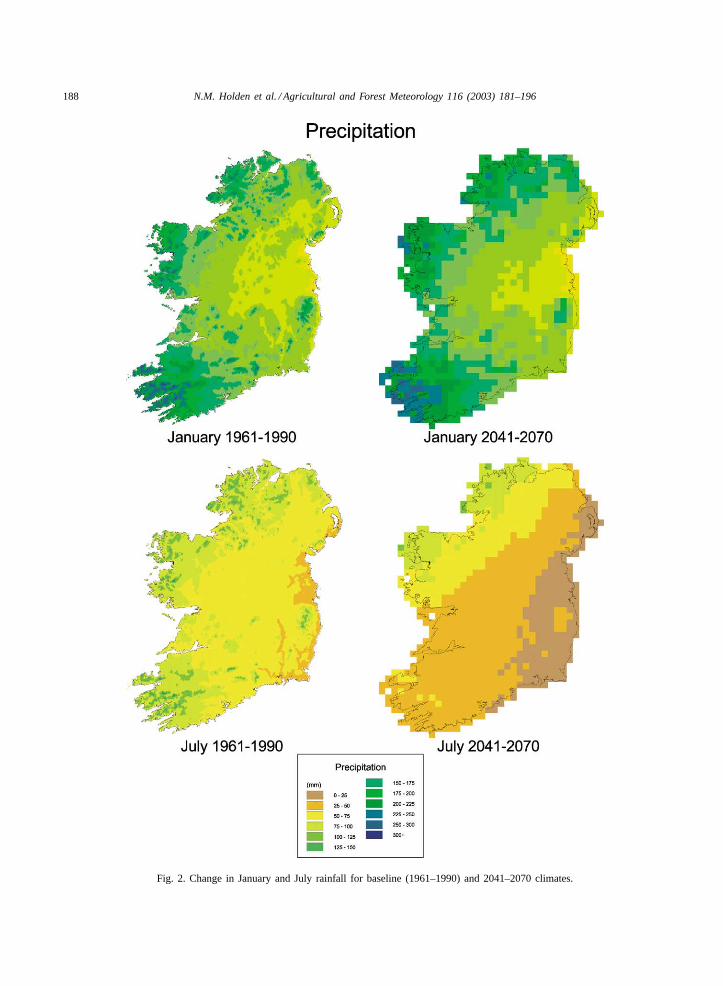
Comparisons between the original mean monthlyclimate data and those recalculated from the simu-lated daily weather data (three examples are shown inTable 4) show that the 30-year replicates provide anadequate weather dataset and that the use of an em-pirical relationship to estimate raindays from totalmonthly rainfall gives a very good rain dataset. A re-curring feature of the generated data was an overesti-mate of July radiation. Little could be done about thisproblem. However, the relationship between photo-synthesis and radiation takes the form of a rectangularhyperbola therefore by midsummer, photosyntheticactivity would be occurring mainly at the upper endof the relationship where photosynthesis is close to
190 N.M. Holden et al. / Agricultural and Forest Meteorology 116 (2003) 181–196
Table 4Comparison of input and mean output data from the daily weather generator for three test sites
Month Input data Output data
Radiation Tmax Tmin Rain Rdays Radiation Tmax Tmin Rain
Site at latitude 55, altitude 231 m (northeast)January 2 5.4 0.1 152.5 28.0 1.7 6.1 0.0 146February 4.2 5.4 −0.1 121.7 27.0 4.0 6.2 −0.1 118March 7.6 7.3 0.8 116.8 27.0 8.5 7.3 0.3 120April 13.3 10.0 2.2 94.2 24.0 13.0 10.1 1.7 96May 16.4 12.7 4.4 86.9 23.2 16.4 13.8 4.3 81June 17.0 15.5 7.3 89.7 23.6 17.9 16.5 7.8 96July 15.0 16.8 9.2 91.6 23.9 16.9 17.5 9.4 91August 13.3 16.7 9.0 108.6 25.9 13.9 16.5 8.5 104September 9.2 14.5 7.4 129.1 27.4 9.5 15.2 7.7 124October 5.4 11.7 5.7 144.2 27.8 5.2 12.4 6.1 147November 2.7 7.8 2.1 148.3 27.8 1.8 8.9 2.0 139December 1.5 6.3 1.2 143.4 27.7 1.0 6.9 1.1 140
Site at latitude 54, altitude 64 m (northeast)January 2.1 6.8 1.6 112.3 26.3 1.8 7.1 1.3 112February 4.4 6.8 1.4 87.0 23.2 4.4 7.2 1.0 82March 7.8 8.6 2.3 88.5 23.4 9.1 8.5 1.7 82April 13.3 11.0 3.6 68.3 19.9 13.7 12.3 3.8 65May 16.9 13.7 5.9 65.9 19.4 17.3 14.9 5.8 63June 17.5 16.5 8.7 71.3 20.5 18.0 16.7 8.4 76July 15.5 17.9 10.6 70.9 20.4 18.0 18.5 10.6 67August 13.4 17.8 10.4 87.1 23.2 13.8 17.5 10.2 89September 9.2 15.8 8.9 100.9 25.1 9.2 16.1 9.2 97October 5.4 13.0 6.9 110.8 26.1 5.1 13.8 7.4 121November 2.7 9.3 3.5 112.0 26.2 1.9 9.7 3.0 110December 1.5 7.7 2.5 102.8 25.3 1.4 8.5 2.7 91
Site at latitude 53, altitude 76 m (midlands)January 2.4 7.1 1.3 90.4 23.7 2.1 6.8 0.6 89February 4.6 7.3 1.2 63.9 19.0 5.4 7.7 0.8 58March 8.2 9.5 2.2 69.9 20.2 9.3 9.9 2.4 68April 13.0 12.1 3.4 57.3 17.5 13.4 12.6 3.1 56May 16.3 14.6 5.7 71.5 20.5 16.1 15.7 5.7 71June 16.9 17.9 8.7 64.7 19.1 17.6 18.1 8.7 68July 15.4 19.4 10.6 59.7 18.0 17.6 19.8 10.8 58August 13.2 19.0 10.3 80.7 22.2 13.4 18.9 10.7 81September 9.8 16.6 8.5 82.0 22.4 9.9 17.2 9.0 72October 5.8 13.4 6.5 89.6 23.6 5.2 13.0 6.1 85November 3.1 9.5 2.9 87.0 23.2 2.7 10.3 2.4 81December 1.9 7.9 2.1 89.9 23.6 1.7 8.7 2.3 91
Tmax = mean maximum monthly temperature (◦C); Tmin = mean minimum monthly temperature (◦C); rain= mean monthly rainfall (mm);Rdays= predicted monthly raindays; radiation= mean monthly radiation (MJ m−2).
its maximum rate for a managed plant population. Animportant feature of the comparison is that althoughthere are differences between input and output meansthey are small compared to the differences betweensites and, especially, compared to the climate changesthat are anticipated.
3.3. Comparison of crop yields in Irelandand prediction by the models
3.3.1. BarleyIn European surveys, Irish barley production was
estimated at 5.4 t ha−1 with a coefficient of variation
N.M. Holden et al. / Agricultural and Forest Meteorology 116 (2003) 181–196 191
of 11.4% (Russell, 1990; Hough, 1990). The trendsin barley yields during the period from 1955 to 1985indicate that yields may be increasing by 0.7 t ha−1
per decade so that current yields should now ex-ceed 6 t ha−1. In current practice, 6.1 t ha−1 is re-garded as normal but may vary from a moderateyield of 4.9 t ha−1 to a “good” yield of 7.3 t ha−1
(O’Sullivan, 1999). In experimental trials by Teagascin 1980–1981, barley (cv. Idri) yields ranged from 5.1to 8.5 t ha−1 between different location (Conry, 1985).(Note that Spring Barley yields are normally reportedat 18% water content in Ireland and the DSSAT outputdiscussed is dry matter.) National mean yield predictedfor the baseline climate was 6.3 t ha−1 (dry matter,which equates to∼7.4 t ha−1 at 18% water content),ranging from 2.4 to 8.6 t ha−1. It was, therefore, con-cluded that the model was predicting Spring Barleyyields that were realistic for the baseline climate pe-riod. For baseline climate, harvest date ranged fromday 204 to 222 with a mean of day 212 (end of July).
3.3.2. PotatoIn a European survey of crop production (Hough,
1990), main crop potato yield for the late 1980s inIreland was given as between 30 and 35 t ha−1. Incurrent farm practice, 29.4 t ha−1 is regarded as a nor-mal yield (saleable yield) for main crop with yieldsranging from moderate yields of 25.5 t ha−1 to goodyields of 34.3 t ha−1 (O’Sullivan, 1999). In potato va-riety comparisons by The Department of Agriculture,Food and Rural Development carried out between1996 and 1999, average yield of marketable potatoes(40–80 mm in size) varied between varieties from43.6 to 55.8 t ha−1 (Anon., 2000). In the year 2000,total yield varied from 60.26 to 69.55 and 73.49 t ha−1
between Midleton Co., Cork; Oldtown Co., Dublin;and Raphoe Co., Donegal. Model output values re-ported are dry matter and thus a factor of 5 allowscomparison with reported values to account for watercontent. National mean yield predicted for the base-line climate was 36 t ha−1 tuber yield, ranging from27 to 48 t ha−1 when calculated for sites with adequaterainfall. This is necessary to account for that fact thatirrigation is common in potato production but has notbeen assumed in the model simulation. Including allsites, the mean potato yield was 15.6 t ha−1. The yieldestimation from the potato model was considered tobe acceptable for the baseline climate period.
3.4. Changes in crop yield with climate change
3.4.1. BarleyAccording to the simulation modelling, there was
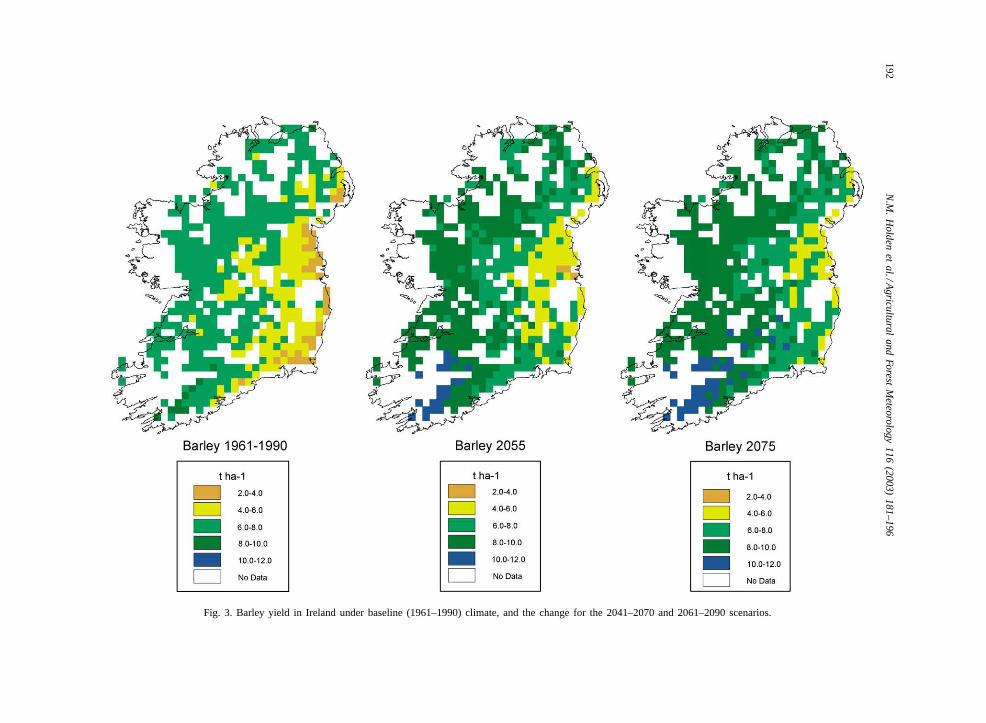
no limit to the establishment of barley either underthe baseline or future (2055, 2075) climates. Thebaseline grain yields of barley varied between 4and 6 DM t ha−1 in the areas of the midlands, eastand south coast where cereals are currently located.Elsewhere, in the north, west and southwest the esti-mated potential yield was between 6 and 8 DM t ha−1
(Fig. 3). These yields were similar to reported val-ues. In 2055 and 2075, the geographical distributionof yield potential is not predicted to change but thegrain yield in all areas is predicted to increase, withpossibly greater increases to the west. Along theeast and south coasts, where baseline yields are rel-atively low, an increase to baseline mean levels ispredicted. In the north, west, and southwest potentialyields may increase markedly by 2055 and more soby 2075. The impact of climate change is to increasethe barley biomass and to increase grain yield so thegrain:biomass ratio remains similar.
The baseline date of harvest of barley varies by 3weeks between the north coast (10 August) and thesouth coast (23 July) (assuming planting on 16 March).In 2055 harvest date is expected to be earlier with afurther advance in 2075 when harvest date, generally,will by earlier by about 3 weeks (still assuming thesame sowing date). The change in barley grain yieldappears to be related to precipitation rather than tem-perature, but harvest date is earlier at warm sites. Thismeans that as sites get (overall) wetter, yields increaseand harvest can occur earlier in the year due to the gen-eral warming as part of climate change. An examina-tion of the relationship between final yield and rainfallduring crop growth revealed that under the baselineclimate, yield is not quite at the maximum possible,but with climate change, the straight-line relationshipstarts to curve off to a maximum grain yield with nofurther response to rainfall.
The data suggest that the effects of water deficit by2055 are going to be significant for grain production inbarley. Water deficit effects are perceptible where pre-cipitation was less than 400 mm, and the majority ofsites were affected to some extent. At the most affectedsites, grain yield was reduced to about 4.5 t ha−1 (at150 mm precipitation) which represents a reduction of
192N
.M.
Holden
etal./A
griculturaland
ForestM
eteorology116
(2003)181–196
Fig. 3. Barley yield in Ireland under baseline (1961–1990) climate, and the change for the 2041–2070 and 2061–2090 scenarios.
N.M. Holden et al. / Agricultural and Forest Meteorology 116 (2003) 181–196 193
about 4.5 t ha−1 compared to the general level of yieldat 400 mm precipitation during growth. The irrigationrequired to recover the loss would be about 250 mm.The timing of harvest is important when consideringthe impact of the relatively sudden onset of winter rainwith change in climate; when harvest is earlier relativeto the onset of winter rain there will be less risk to thefarmer of not being able to harvest crops.
In terms of the impact of climate change on cropproductivity some fundamental impacts can be ex-pected. The increase in temperatures will raise the po-tential for cereal production but the achievement of thispotential will probably be limited by reduced summerrainfall. The increased predicted yield between 2055and 2075 is probably attributable to the elevated CO2because there is relatively little change in temperatureand precipitation in that time period compared to thechange between baseline and 2055.
A potentially significant impact of the change inclimate will be an alteration of the pest and diseaseprevalence and balance compared to the crop. Thenature and type of spray requirement will evolve withclimate, but it is quite likely that chemical interven-tion will increase with climate change. A northwardmigration of European weeds (that are not currentlya problem in Ireland) may also be of significance,but this will very much depend on the exact na-ture of climate change and its balance with cropprotection strategies. As barley can benefit from en-hanced CO2, it may compete favourably with weedpopulations.
Livestock production is the main farming enterprisein Ireland at present. While livestock production isclosely related to the seasonal pattern of grass pro-duction, the expectation of summer drought over amuch greater area then at present may be expected tointroduce the need for significant supplementation ofgrazed grass (Holden and Brereton, 2003). Barley isa potentially important source of energy for supple-mental feeding of livestock. Any increases in cerealgrain production may be expected to reduce the cost offeed barley. However, the extra costs associated withirrigation may offset any financial gain bringing itseconomic viability as a supplemental feed into ques-tion. Barley may also be in competition with maizeas a forage crop by 2055, thus the impact of climatechange on maize production in Ireland also needs tobe reviewed.
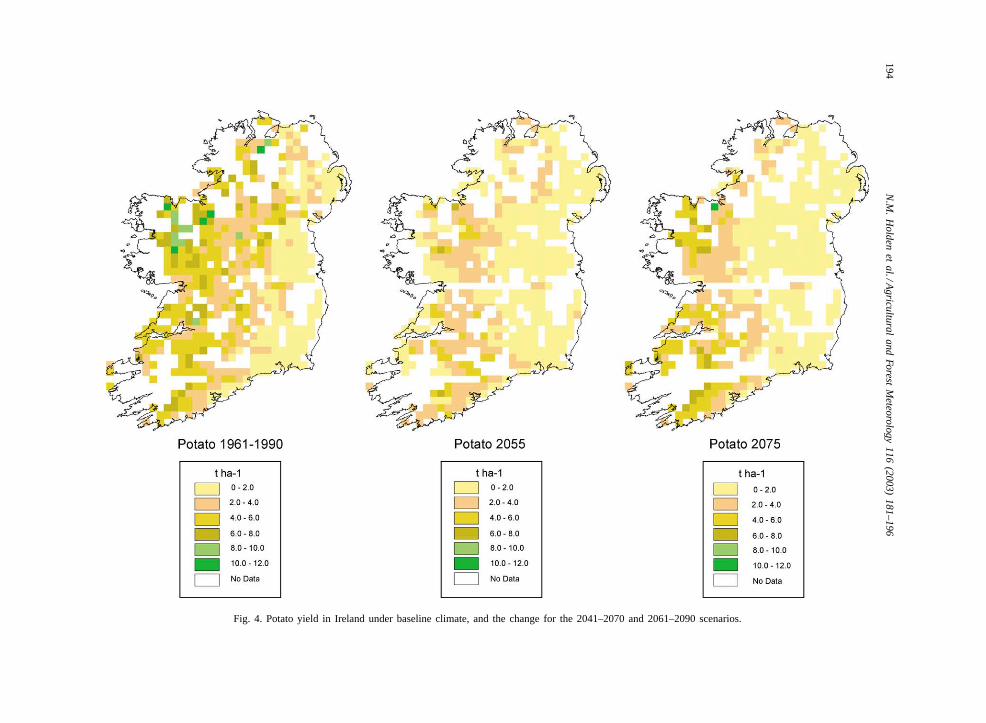
3.4.2. PotatoThe geographical distribution of baseline tuber
yield of non-irrigated maincrop potato reflects thehigh sensitivity of the crop to water deficiency(Fig. 4), but the estimated national average yield isstill very close to that expected based on the findingsof Hough (1990). In the humid western areas theestimated non-irrigated tuber yields vary between 25and 50 t ha−1 (fresh weight @ 23% DM). Biomassyields are currently highest in the west, and are likelyto remain that way. In the lower rainfall areas of theeast, non-irrigated yields are estimated at less than15 t ha−1 (fresh weight). Tuber production closely fol-lows total biomass, being about 86% of total biomassand this ratio stays fairly constant even with climatechange. In 2055 and 2075, with the expected fall insummer and autumn rainfall yields of non-irrigatedtubers are expected to decrease further. The impactcan only be regarded as a significant, almost catas-trophic, loss of yield over most of the country by2055 with a slight yield recovery by 2075. In thewest, in 2075, baseline production levels are expectedto be maintained. This impact is seen because thesimulation was for non-irrigated potato.
The impact of rainfall during the growing seasonis that low rainfall sites have markedly lower yieldsthan those with high rainfall (for the baseline climate).Potato tuber yield is particularly sensitive to waterdeficit and this appears to be reflected in the data. Allsites were affected in 2055 but it is not possible toestimate the full scale of the effect. With irrigation,12 t ha−1 (tuber dry weight) would be a normal yieldfor the baseline climate. The data for 2055 suggest thatwith 800 mm precipitation during growth, tuber yieldsof 6 t ha−1 were only 50% of potential yield. At theextreme, 300 mm of rainfall during growth resulted innegligible tuber yields. The data indicate that the irri-gation requirement of the potato crop in 2055 would besubstantial. By 2075 only the very wettest areas appearto be able to support a reliable non-irrigated potatocrop which indicates that the impact of increased sea-sonality in precipitation will be very important in thefuture.
Miglietta et al. (2000)suggested that there has beentoo little research into root/tuber crop biology to besure of the impact of climate change other than tosuggest that increased water stress may reduce yieldsand that elevated CO2 may increase yields. These
194N
.M.
Holden
etal./A
griculturaland
ForestM
eteorology116
(2003)181–196
Fig. 4. Potato yield in Ireland under baseline climate, and the change for the 2041–2070 and 2061–2090 scenarios.
N.M. Holden et al. / Agricultural and Forest Meteorology 116 (2003) 181–196 195
general statements clearly apply to the predicted fu-ture climate of Ireland and its impact on potato yield.Peet and Wolfe (2000)suggested that increased atmo-spheric CO2 will enhance photosynthesis and improvewater-use efficiency in vegetable crops provided thereis no water or nutrient stress. This should be the casefor potato which has a good transport capacity andlarge sinks (as argued byFinnan et al., 2002), but in thepredicted future climate of Ireland, there is very likelyto be water stress which will undermine the elevatedCO2 advantage. The change in weed balance and itscontrol discussed for barley also applies to potato.
As it is unlikely that the climate of Ireland willchange sufficiently to cause temperature stress forpotato crops the limiting factor in production will bethe cost and availability of irrigation water. In the highwater demand crop, potato, potential yields did notappear to be increased, but the effect of water deficitwas very significant. The effects might be describedas catastrophic but for the fact that the crop is nor-mally irrigated in the present climate. With the pro-jected scenarios, a much greater area of agriculturalland will be affected by drought, and the quantitiesof water involved to compensate by irrigation will belarge. Given that agriculture may have to compete forscarce summer water extraction with other users, theconsequent economic effects may make crops withgood potential uneconomical. The data have provideda reasonable estimate of expected irrigation needand clearly highlight the need for further investiga-tion for medium- to long-term rural environmentalplanning.
4. Conclusions
The main conclusions that can be drawn from thiswork are that, as a result of climate change, thereis likely to be no severe impact on barley, but theeffect for potato will be very much dependent on theavailability of irrigation water. It will be necessaryto introduce systems for planning irrigation needs toensure that water costs are acceptable and summersurface and ground water resources are not over used.For barley it can be concluded that:
(i) it remains a viable crop in yield terms with thepredicted climate change;
(ii) the impact of the change in winter and autumnprecipitation on harvesting will not be a majorproblem due to the harvest becoming earlier inthe year;
(iii) yield is closely linked to precipitation; and(iv) it will remain an option as a forage crop.
For potato it can be concluded that:
(i) there will be water stress in the summer due toclimate change;
(ii) a large irrigation requirement will develop if thecrop is to continue to be grown;
(iii) viability as a commercial crop may be maintainedonly with irrigation;
(iv) irrigation systems will possibly require invest-ment in infrastructure to store winter rain becauseof competing demands from ground and surfacewaters; and
(v) it is very likely that potato will cease to be a com-mercially productive crop in Ireland because ofthe reduced yield due to drought stress, difficul-ties with harvest due to the onset of winter rainin October, difficulties with tillage and plantingdue to very wet soils in spring and a possible in-crease in pest and disease problems.
Acknowledgements
This work was funded by the Environmental Protec-tion Agency as part of the Research, Technological De-velopment and Innovation Programme (RTDI) fundedunder the National Development Plan (2000–2006).
References
Anon., 2000. Potato Variety Evaluation 2000 Ireland. Departmentof Agriculture, Food and Rural Development, Dublin, Ireland.
Anon., 2001. Compendium of Irish Agricultural Statistics, 2001(Euro Version). Department of Agriculture, Food and RuralDevelopment, Dublin, Ireland.
Bunce, J.A., Ziska, L.H., 2000. Crop ecosystem responses toclimatic change: crop/weed interactions. In: Reddy, K.R.,Hodges, H.F. (Eds.), Climate Change and Global CropProduction. CAB International, Wallingford.
Burger, G., 1996. Expanded downscaling for generating localweather scenarios. Climate Res. 7, 111–128.
Cavazos, T., Hewitson, B., 2002. Relative performance ofempirical predictors of daily precipitation. In: Proceedingsof the International Modelling and Software Society 2002,
196 N.M. Holden et al. / Agricultural and Forest Meteorology 116 (2003) 181–196
Lugano, Switzerland, 24–27 June 2002, pp. 349–354(http://www.iemss.org/iemss2002).
Conry, M.J., 1985. Comparison of the grain yield and quality ofwinter and Spring Barleys grown on four contrasting soils inIreland. Ir. J. Agric. Res. 24, 201–212.
Cruickshank, J.G., 1972. Soil Geography. David and Charles,Newton Abbot.
Donnelly, A., Jones, M., McElwaine, L., Sweeney, J., Byrne, C.,2001. The use of biological indicators to detect climate changein Ireland. Poster presented at the ‘Detecting Environmentalchange: Science and Society,’ University College, London,16–20th July 2001.
Fangmeier, A., Chrost, B., Hogy, P., Krupinska, K., 2000. CO2
enrichment enhances flag leaf senescence in barley due togreater grain nitrogen sink capacity. Environ. Exp. Bot. 44,151–164.
Finnan, J.M., Burke, J.I., Jones, M.B., 2002. The effect of elevatedconcentrations of carbon dioxide and ozone on potato (Solanumtuberosum L.) yield. Agric., Ecosys. Environ. 88, 11–22.
Gardiner, M.J., Radford, T., 1980. General Soil Map of Ireland.An Foras Talúntais (now Teagasc), Dublin.
Geng, S., Penning de Vries, F.W.T., Supit, I., 1986. A simplemethod for generating daily rainfall data. Agric. For. Meteorol.36, 363–376.
Goodale, C., Aber, J., Ollinger, S., 1998. Mapping monthlyprecipitation, temperature and solar radiation for Ireland withpolynomial regression and a digital elevation model. ClimateRes. 10, 35–48.
Gourdrain, J., de Ruiter, H.E., 1983. Plant growth in responseto CO2 enrichment at two levels of nitrogen and phosphorussupply. 1. Dry matter, leaf area and development. Neth. J. Agric.Sci. 31, 157–169.
Holden, N.M., Brereton, A.J., 2003. An assessment of the potentialimpact of climate change on grass yield in Ireland over thenext 100 years. Ir. J. Agric. Food Res. (in press).
Hough, M.N., 1990. Agrometeorological aspects of crops in theUK and Ireland. A Review for Sugar Beet, Oilseed Rape, Peas,Wheat, Barley, Oats, Potatoes, Apples and Pears. EuropeanUnion, Luxembourg.
Houghton, J.T., Callander, B.A., Varney, S.K., 1992. InternationalPanel on Climate Change, the Supplementary Report tothe IPCC Scientific Assessment. Cambridge University Press,Cambridge.
Hulme, M., Jenkins, G.J., Lu, X., Turnpenny, J.R., Mitchell, T.D.,Jones, R.G., Lowe, J., Murphy, J.M., Hassell, D., Boorman, P.,McDonald, R., Hill, S., 2002. Climate Change Scenarios forthe United Kingdom: The UKCIP02 Scientific Report. TyndallCentre for Climate Change Research, School of EnvironmentalSciences, University of East Anglia, Norwich, UK.
Hunt, L.A., 1988. IBSNAT’s genetic coefficients: coping withgermplasm diversity. Agrotechnol. Transfer 7, 1–5.
IPCC (Intergovernmental Panel on Climate Change) 2001. ClimateChange 2001: The Scientific Basis. IPCC Third AssessmentReport. Geneva.
Karl, T.R., Wang, W.-C., Schlesinger, M.E., Knight, R.W.,Portman, D., 1990. A method of relating general circulation
model simulated climate to the observed local climate. Part I.Seasonal statistics. J. Climate 3, 1053–1079.
McEntee, M., 1980. A revision of the equation relating sunshinehours to radiation income for Ireland. Ir. J. Agric. Res. 19,119–125.
Miglietta, F., Bindi, M., Vaccari, F.P., Schapendonk, A.H.C.M.,Wolf, J., Butterfield, R.E., 2000. Crop ecosystem responsesto climatic change: root and tuberous crops. In: Reddy,K.R., Hodges, H.F. (Eds.), Climate Change and Global CropProduction. CAB International, Wallingford.
O’Sullivan, M., 1999. The Irish Farmer’s Handbook. Middlethird,Carrick-on-Suir, Ireland.
Otter-Nacke, S.J., Ritchie, J.T., Godwin, D., Singh, U., 1991. AUser’s Guide to CERES Barley-V2.10. International FertilizerDevelopment Centre, Muscle Shoals, AL, USA.
Peet, M.M., Wolfe, D.W., 2000. Crop ecosystem responses toclimatic change: vegetable crops. In: Reddy, K.R., Hodges,H.F. (Eds.), Climate Change and Global Crop Production. CABInternational, Wallingford.
Russell, G., 1990. Barley Knowledge Base. EU, Luxembourg.Sœbø, A., Mortensen, L.M., 1996. Growth, morphology and
yield of wheat, barley and oats grown at elevated atmosphericCO2 concentration in a cool maritime climate. Agric., Ecosys.Environ. 57, 9–15.
Santer, B., Wigley, T., Schlesinger, M., Mitchell, J., 1990.Developing climate scenarios from equilibrium GCM results.Hamburg. Report No. 47, Max Planck Institute fürMeteorologie.
Singh, V., Matthews, R.B., Griffin, T.S., Ritchie, J.T., Hand, L.A.,Goenage, R., 1998. Modelling growth and development ofroot and tuber crops, pages. In: Tsuji, G., Hoogenboom, G.T.,Thornton, P.K. (Eds.), Understanding Options for AgriculturalProduction. Systems Approaches for Sustainable AgriculturalDevelopment. Kluwer Academic Publishers, Dordrecht, TheNetherlands, pp. 129–156.
Sweeney, J., Fealy, R., 2001. Future climate scenarios forIreland using high resolution statistical downscaling techniques.In: Paper Presented at Achievement and Challenge: Rio+10and Ireland Conference, University College, Dublin, 10–14September 2001.
Teagasc, 2000. Management Data for Farm Planning 2000.Teagasc, Dublin.
Tsuji, G.Y., Uehara, G., Balas, S. (Eds.), 1994. DSSAT version3. International Benchmark Sites Network for AgrotechnologyTransfer. University of Hawaii, Honolulu.
Wheeler, R.M., Tibbitts, T.W., 1997. Influence of changes indaylength and carbon dioxide on the growth of potato. Ann.Bot. 79, 529–533.
Wilby, R.L., Wigley, T.M.L., 2000. Precipitation predictorsfor downscaling: observed and general circulation modelrelationships. Int. J. Climatol. 20, 641–661.
Wilby, R.L., Hassan, H., Hanaki, K., 1998. Statistical downscalingof hydrometeorological variables using general circulationmodel output. J. Hydrol. 205, 1–19.
Top Related
Copyright © 2022 FDOKUMEN

