


Bahasa
Halaman
Hukum


International Journal of Engineering & Scientific Research (IJMRA Publication)
Vol. 6 Issue 3, March 2018, ISSN: 2347-6532 Impact Factor: 6.660 Journal Homepage: http://esrjournal.com, Email: [email protected] Double-Blind Peer Reviewed Refereed Open Access International Journal - Included in the International Serial Directories Indexed & Listed at: Ulrich's Periodicals Directory ©, U.S.A., Open J-Gage as well as in Cabell’s Directories of Publishing Opportunities, U.S.A
230 International Journal of Engineering and Scientific Research http://esrjournal.com, Email: [email protected]
PONTENTIAL OF RICE HUSK AND LUFFA SPOUNGE ON NKPOLOGU CLAY
DEPOSITE FOR INDUSTRIAL APPLICATIONS
Ameh E.M., Agbo A.O. and Nwogbu C.C.
Department of Metallurgical & Materials Engineering,
Enugu State University of Science and Technology (ESUT)
Abstract
The effect of the addition of luffa sponge and Adani rice husk to Nkpologu clay has been
investigated. The three samples were first sourced and characterized using XRD and XRF
which showed that Nkpologu clay has about 20% Al2O3, 79% of SiO2 and little of FeO and
CaO making it very good refractory clay. The rice husk and luffa sponge contains almost
the same mineral contents. The samples were prepared and mixed in different ratios with
clay being constant and the additives varied which led to the production of five different
insulating bricks with which its micrographs were obtained after being fired in a heat
treatment furnace. There was no colour change in the clay before and after the
experiment.
Keywords: Pontential, Rice Husk, Luffa Spounge, Nkpologu Clay Deposite
Introduction
Most metallurgical processes are heat generating systems. Such systems require materials
that can withstand not only the high temperature generated but equally must be able to
withstand both physical and chemical action of molten metals, slag and gases without
crumbling. Engineering materials that possess these attributes are referred to as refractory
materials. Refractories are those materials that can withstand high temperatures and still
retain their strength. They are usually made from inorganic, non-metallic and
heterogeneous materials composed of thermally stable mineral aggregates. They have
physical and chemical properties that enhance resistance to their physical wear, high
temperatures and corrosion. [1, 2, 3]. Refractory materials include ceramic materials like
clay, oxides of silicon, aluminum and zirconium. The base material for refractory
production is clay. Clays are naturally occurring sediments produced by chemical actions
resulting from weathering of rocks [4]. An earthly fine-grained material, which develops
plasticity when mixed with water, Clay has silica (SiO2), alumina (Al2O3) and water as
primary constituents. Other constituents are iron, alkaline, and alkaline earth metals [4].
ISSN: 2347-6532 Impact Factor: 6.660
231 Vol. 6 Issue 3, March 2018
Clay as an important material in modern technology finds applications in ceramics,
refractories, paper, foundry, rubber, paints, plastics, insecticides, pharmaceutical,
textile and adhesives industries [5]. In response to the challenges that may be posed by the
demand for clay materials in Nigeria, indigenous clays with industrial potentials need to be
investigated. It has been discovered that clay from different areas differs in their mineral
contents and thus possess different properties. It was reported that the alumina content of
some Nigerian clays are low, for their use alone without blending and that clay alone
cannot produce enough pores needed for thermal insulating properties [6]. Therefore,
there becomes a need for inclusion of materials that will create pores in the clay. Materials
usually used include rice husk, saw dust and diatomite. Clays are complex alumino-silicate
compounds containing attached water molecules. Clays and soils have their origin in the
mechanical and chemical disintegration of rocks.
AIM
The aim of this work is to study and develop an insulating brick from locally sourced
materials (Nkpologu clay, Adani rice husk and luffa sponge sourced from any part of
Nigeria).
Problem Statement
Nigeria has appreciable distribution of metal and process industries where high
temperatures are generated and as such have considerable needs for Refractories. Present
economic realities dictate the need for internal sourcing of raw materials to be used in the
production of engineering materials. Refractories, being a class of materials largely used in
metallurgical plants and cement industries, are presently largely sourced by importation
(about 38,000 to 120,000 tons annually) with enormous financial implications to the
country.
Objective
To produce refractory bricks using Nkpologu clay and a blend of Adani rice husk and
luffa sponge.
To evaluate the effect of Adani rice husk and luffa sponge on the thermal insulating
properties of Nkpologu clay.
To determine the best blending ratio.

ISSN: 2347-6532 Impact Factor: 6.660
232 Vol. 6 Issue 3, March 2018
To ascertain the efficiency of using rice husk and luffa sponge as additives in clay to
produce insulating bricks.
Potential Benefits
To bridge the importation of refractories into Nigeria.
To convert luffa sponge and rice husk (agro waste) into useful materials.
Materials and Methods
The materials used are Nkanu area luffa sponge, Adani rice husk and Nkpologue clay.
The machines and equipment used are the following:
Hydraulic pressing machine, Heat treatment furnace, Electric oven, Metal mould,
weighing balance, Meter rule, Water bath, Sieves, Crushing tool, Rammer and other minor
tools like meter rule, scissors, bowl, measuring cylinder, polythene, etc
Materials Preparation
The clay was sun dried, crushed and sieved using 0.2mm aperture sieve. The rice husk was
also sieved using 0.8mm aperture sieve. The luffa sponge was cut into very tiny pieces
using scissors. A metal mold of dimensions 180mm x 80mm x 40mm was also produced.
Bricks Preparation
The comminuted and sieved materials were weighed and mixed in different ration as
indicated in table.1. The blend was thoroughly mixed to enhance homogeneity. Then the
sample was then poured into the mould and pressed at a pressure of 500kPa using a
hydraulic pressing machine. The green weight and dimension was measured and recorded
TABLE 1 Percentage Compositions of Sample Bricks
Clay (gram) Rice Husk (gram) Luffa sponge
(gram)
Sample A 1000 90 10
Sample B 1000 130 20
Sample C 1000 170 30
Sample D 1000 _ 50
Sample E 1000 150 _
Molding of sample
The produced samples were dried at room temperature for one week before they were then
oven dried at 110oC for one hour and the oven dried weights and dimensions recorded.

ISSN: 2347-6532 Impact Factor: 6.660
233 Vol. 6 Issue 3, March 2018
The oven dried samples were fired in the heat treatment furnace (model: KOHAZATI
GYRAEPITO VALLALAT BUDAPEST) at intervals of 200oC and 10 minutes from
600oC to 1000
oC and then held at 1000
oC for four hours. They were left in the furnace to
cool to room temperature to avoid thermal shock. The fired weights and dimensions were
also recorded.
Testing of Samples
After cooling of the fired bricks, the physical, thermo-physical, mechanical and chemical
test were run on them. The tests carried out included linear shrinkage, apparent porosity,
bulk density, thermal conductivity and cold crushing strength.
Shrinkage Test: The test pieces of the refractory materials were made into rectangular
shapes in a mould and compacted. A slanted line was inserted diagonally on each piece
and recorded as (L1). The test pieces were then placed inside the furnace and fired up to
1000oC and the line drawn across the diagonal axis of the pieces were measured to
determine their final length (L2) after firing. The drying shrinkage indicates to some degree
the plasticity of the mixture. A large drying shrinkage means that mixture could absorb
much water, which in turn indicates fine mixture particles. The firing shrinkage indicates
how fusible the mixture is. A high shrinkage normally means a lower melting point. The
total shrinkage of refractory bodies tells how much bigger we should make our molds. The
linear shrinkage, Fired Length Shrinkage and Total shrinkage percentage of the materials
were determined with equation (1, 2 and 3) respectively. [36,]
Drying Shrinkage (%) = 𝐿2−𝐿1
𝐿1 -------------------------------------------------------- (1)
Fired Shrinkage length = 𝐿 – 𝐿
𝐿 x
- ----------------------------------------------- (2)
Total shrinkage percentage = 𝐿− 𝐿− 𝐿
𝐿 x
----------------------------------------- (3)
Where: 𝐿 = Initial length of sample before firing, 𝐿2 = Final length of sample after firing
Apparent porosity, water absorption and Bulk density: The dried specimens were
suspended in a beaker containing water and kept for two hours. After two hours the
suspended weights were determined (WS). The specimen were removed from water and
weighed in air to obtain (WW).

ISSN: 2347-6532 Impact Factor: 6.660
234 Vol. 6 Issue 3, March 2018
Apparent Porosity (P), water absorbed (WA) and bulk density were determined using
equation (4), (5) and (6) respectively:
Porosity = 𝑊− 𝐷
𝑤− 𝑠 X 100 -------------------------------------------------------------- (4)
% Water Absorbed (WA) = 𝑊 − 𝐷
𝐷 ----------------------------------------------------- (5)
Bulk density = 𝐷
𝐷 − 𝑆 --------------------------------------------------------------------- (6)
Where 𝑊 = Weight of fired specimen, 𝑊𝑆 = Weight of fired specimen in water,
𝑊 = Weight of soaked specimen suspended in air.
The loss on ignition: The loss on ignition (LOI) is the weight reduction on the total
weight of the prepared samples, in percentage. Hence, the loss in weight by each sample
were determined to be the difference in their weights before and after firing and
consequently, the loss on ignition at that temperature was determined as shown in equation
(7). [43]
Loss on ignition = 1 − 2
1 X 100 ------------------------------------------------------ (7)
𝑊 is the weight before firing
𝑊2 is the weight after firing
Cold crushing strength (CCS): Cold crushing strength is the amount of load that the
refractory material could withstand after they have been fired. In determining the cold
crushing strength of the refractory samples, specimens were made from the refractory
samples. The dimensions of the test pieces were taken after they are fired to 1000oC
temperature. Load was applied on the test piece with the aid of Hounsfield Tensometer
until the test piece failed to support the load. The maximum recorded load was taken as the
crushing load. The CCS was calculated using equation (8).
CCS = 𝐿𝑜𝑎𝑑
𝐴𝑟𝑒𝑎 ----------------------------------------------------- (8)
Thermal conductivity test: Thermal conductivity test was carried out on the fired
bricks using thermal conductivity meter (fox 600 GHP). Thermal conductivity indicates
the rate of heat flow through a material. Poor conduction of heat is desired in insulating
refractory bricks.
Slag Attack Resistance Test: The fired bricks produced were used for this test with a hole
of about 20mm drilled into them. The hole were packed with the sample of slag that it will
likely encounter when put to service. The refractory brick were heated to a temperature of
about 1200oC and maintained at this temperature for a period of one hour. The brick were

ISSN: 2347-6532 Impact Factor: 6.660
235 Vol. 6 Issue 3, March 2018
then cooled in the furnace, sectioned and examined to observe the degree of attack and
penetration of the slag.
Visual Test: The brick samples were observed to determine the colour changes after firing
if any.
Materials and sample characterization: The clay sample was characterized via X-Ray
diffraction while the rice husk and luffa sponge samples were characterized via X-Ray
fluorescence. The produced samples were characterized using Scanning electron
microscope machine (using back scattered secondary imaging)
Results and Discussion
XRD Spectrum of Clay

ISSN: 2347-6532 Impact Factor: 6.660
236 Vol. 6 Issue 3, March 2018
Table 2: XRD Analysis Data of Clay
Name & Formula Crystallographic Parameters
Mineral
Name
Index
Name
Empirica
l
Formula
Chemical
Formula
Crystal
System
Space
Grou
p
Space
Grou
p No
a (Å) b (Å) c (Å) Alpha
(o)
Beta (o) Gamma
(o)
%
Comp
osition
Quartz low Silicon
Oxide
O2Si SiO2 Hexago
nal
P3221 154 4.912
4
4.912
4
5.403
9
90.0000 90.0000 120.000
0 0.192
Kaolinite-
1A
Alumi
nium
Silicat
e
Hydro
xide
Al2H4O9S
i2
Al2Si2O5
(OH)4
Anorthi
c
C1 1 5.155
6
8.939
7
7.407
3
91.7133 104.826
5
89.8343
20.346
Halloysite Alumi
nium
Silicat
e
Hydro
xide
Al2H4O9S
i2
Al2Si2O5
(OH)4
Orthorh
ombic
P237 2 5.160
0
8.940
0
7.400
0
90.0000 90.0000 90.0000
79.462
Calcite Calciu
m
carbon
ate
CaCO3 CaCO3 Trigona
l
R3
2/C
180 4.902
0
8.742
1
5.581
0
90.6190 90.0000 120.483
8 0.038
Magnetite Iron
(III)
Oxide
Fe3O4 Fe3O4 Hexago
nal
R3C 3 5.223
0
8.927
5
7.094
0
90.9439 90.0000 90.5647 1.126
The wet chemical analysis of clay shows that Nkpology clay contains about 20% Al2O3, 79% SiO2, and little of Fe3O4 and CaO

ISSN: 2347-6532 Impact Factor: 6.660
237 Vol. 6 Issue 3, March 2018
Fig.2: XRF Spectrum of rice husk
From XRF, Adani rice husk contains iron, zinc, calcium, nickel, copper, bromine,
chromium, titanium. Arsenium, Argon, potassium, molybdenium and yttrium
Fig.3 XRF Spectrum of luffa sponge
From XRF conducted on luffa sponge, it shows that it contains copper, zinc, iron,
potassium, argon, calcium, chromium, chlorine and strontium.

ISSN: 2347-6532 Impact Factor: 6.660
238 Vol. 6 Issue 3, March 2018
Micrographs of brick samples
FIG 4.SEM Micrographs of brick samples
The micrographs of the brick samples showed that the burning of the rice husk and luffa
sponge in the clay creates some pore spaces in the clay. It was observed that the pores
increased with increase in rice husk and luffa sponge percentage.
Visual Inspection
The brick samples maintained a milky colour even after firing. As observed, there was no
colour change in the samples before and after diring.
Sample C Sample D
Sample A Sample B
Sample E
ISSN: 2347-6532 Impact Factor: 6.660
239 Vol. 6 Issue 3, March 2018
PHYSICAL TESTS
Shrinkage Analysis
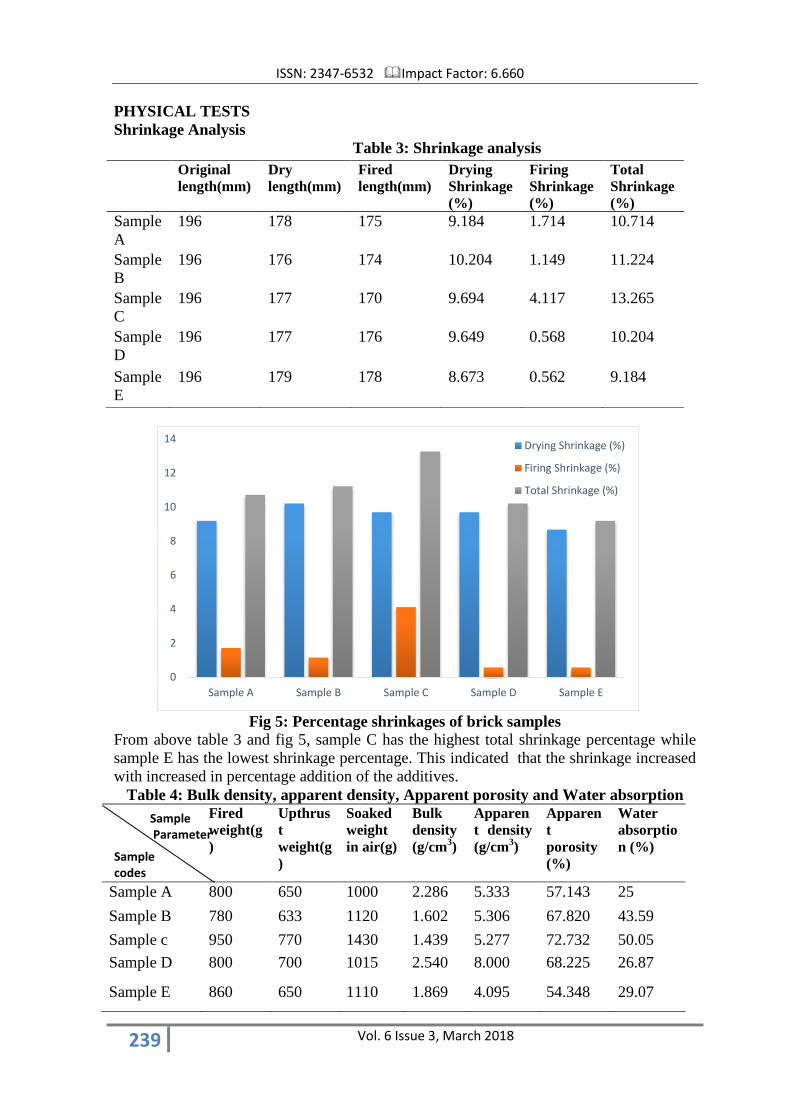
Table 3: Shrinkage analysis
Fig 5: Percentage shrinkages of brick samples
From above table 3 and fig 5, sample C has the highest total shrinkage percentage while
sample E has the lowest shrinkage percentage. This indicated that the shrinkage increased
with increased in percentage addition of the additives.
Table 4: Bulk density, apparent density, Apparent porosity and Water absorption
Fired
weight(g
)
Upthrus
t
weight(g
)
Soaked
weight
in air(g)
Bulk
density
(g/cm3)
Apparen
t density
(g/cm3)
Apparen
t
porosity
(%)
Water
absorptio
n (%)
Sample A 800 650 1000 2.286 5.333 57.143 25
Sample B 780 633 1120 1.602 5.306 67.820 43.59
Sample c 950 770 1430 1.439 5.277 72.732 50.05
Sample D 800 700 1015 2.540 8.000 68.225 26.87
Sample E 860 650 1110 1.869 4.095 54.348 29.07
0
2
4
6
8
10
12
14
Sample A Sample B Sample C Sample D Sample E
Drying Shrinkage (%)
Firing Shrinkage (%)
Total Shrinkage (%)
Original
length(mm)
Dry
length(mm)
Fired
length(mm)
Drying
Shrinkage
(%)
Firing
Shrinkage
(%)
Total
Shrinkage
(%)
Sample
A
196 178 175 9.184 1.714 10.714
Sample
B
196 176 174 10.204 1.149 11.224
Sample
C
196 177 170 9.694 4.117 13.265
Sample
D
196 177 176 9.649 0.568 10.204
Sample
E
196 179 178 8.673 0.562 9.184
Sample Parameter
Sample codes

ISSN: 2347-6532 Impact Factor: 6.660
240 Vol. 6 Issue 3, March 2018
Fig 6: Gragh of Bulk density, apparent density, Apparent porosity and Water
absorption for brick samples
From the bulk density result obtained, it was observed that sample D had the highest value
followed by sample A, sample E, sample B and then sample C which has the lowest value.
It can then be said that increase in additives content lowers the bulk densities of the bricks.
Bricks with higher bulk densities exhibit higher volume stabilities and strength.
0
10
20
30
40
50
60
70
80
Sample A Sample B Sample C Sample D Sample E
Bulk density (%)
Apparent density (%)
Apparent porosity (%)
Water absorption (%)
2.286
1.602 1.439
2.54
1.869
0
0.5
1
1.5
2
2.5
3
Sample A Sample B Sample C Sample D Sample E
Bu
lk d
ensi
ty
Fig7: Bulk densities for the brick samples

ISSN: 2347-6532 Impact Factor: 6.660
241 Vol. 6 Issue 3, March 2018
Fig 8: Graph of Apparent density of brick samples
It is observed from the apparent density table that sample D has the highest value followed
by sample A, sample B, and sample C and then sample E which has the lowest value. This
implies that the higher the percentage additives, the lower the apparent densities of the
bricks. Sample D which contains five percent of luffa sponge only has the highest apparent
density. It can then be said that luffa sponge has a higher tendency of increasing the
apparent density of the bricks more than rice husk.
Fig 9: Graph of Apparent porosity of brick samples
From the table of apparent porosity, it is observed that the sample with the highest value is
sample C followed by sample D, sample B, sample A and then sample E. This indicates
that the higher the percentage of additives in a sample the higher porosity of that sample.
This is as a result of the rice husk and luffa sponge burning out during firing and leaving
plenty of pores in the brick. These pores make the brick porous.
5.333 5.306 5.277
8
4.095
0
1
2
3
4
5
6
7
8
9
Sample A Sample B Sample C Sample D Sample E
Ap
par
ent
den
sity
57.143
67.82 72.732
68.225
54.348
0
10
20
30
40
50
60
70
80
Sample A Sample B Sample c Sample D Sample E

ISSN: 2347-6532 Impact Factor: 6.660
242 Vol. 6 Issue 3, March 2018
Fig .10: Percentage water absorption of brick samples
The water absorption table reveals that sample C is with the highest value followed by
sample B, sample E, sample D and finally sample A. This indicates that the higher the
additives the higher the percentage water absorption. This is because the burnt rice husk
and luffa sponge leaved pore spaces
Table 5: Loss on Ignition
Sample A Sample B Sample C Sample D Sample E
0.091 0.637 9.564 2.439 11.795
From the table of loss on ignition, it is observed that the values decreased from sample E
which has the highest value followed by sample C, sample D, sample B and finally sample
A.
Table 6: Cold crushing strength
25
43.59
50.05
26.87 29.07
0
10
20
30
40
50
60
Sample A Sample B Sample C Sample D Sample E
Load (N) Area (cm
2 ) C C S (N/cm
2)
Sample A 1600 16 100.000
Sample B 1500 16 93.750
Sample C 1100 16 68.75
Sample D 1350 16 84.375
Sample E
1750 16 109.375
Sample parameters
Sample Codes

ISSN: 2347-6532 Impact Factor: 6.660
243 Vol. 6 Issue 3, March 2018
Fig .11: Graph of C C S of brick samples
From table 6 above, it can be observed that the cold crushing strength decreased in the
following order, sample E with the highest value, followed by sample A, sample B, sample
D and sample C. sample E which has the highest value of cold crushing stenght contains
rice husk only and is higher in percentage than luffa sponge added to sample D. This can
imply that burning of luffa songe within the clay has a tendency of reducing the cold
crushing strength of the clay.
Table 7: Thermal conductivities of the brick samples
Sample A
(W/mk)
Sample B
(W/mk)
Sample C
(W/mk)
Sample D
(W/mk)
Sample E
(W/mk)
0.0131 0.0129 0.0098 0.0125 0.01359
Fig 12: Graph of Thermal conductivity of brick samples
Table 7: shows that the thermal conductivities of the samples decreased in the following
order: sample E > Sample A> Sample sample B> Sample D> Sample C. It is observed that
100 93.75
68.75
84.375
109.375
0
20
40
60
80
100
120
Sample A Sample B Sample C Sample D Sample E
0.1318 0.1293
0.0981
0.125 0.13597
0
0.02
0.04
0.06
0.08
0.1
0.12
0.14
0.16
Sample A Sample B Sample C Sample D Sample E

ISSN: 2347-6532 Impact Factor: 6.660
244 Vol. 6 Issue 3, March 2018
the thermal conductivities decreased with increased in the porosities of the samples. This
is because the pores contain some quantities of air which are very poor conductor of heat.
Slag Attack Resistance
The brick samples were packed with slag gotten from gray cast iron melted in a cupola
furnace. They were heated until the slag melted and then soaked for one hour. They were
furnace cooled and sectioned. The observation showed that the five brick samples have
good slag resistance because the melted slag did not penetrate inside any of them.
Conclusion
It was observed that:
1. There was no colour change in the bricks before and after firing up to 1000oC
2. All the bricks can withstand a temperature of 1000oC since none of them crumbled
during firing
3. Increase in rice husk and luffa sponge increases porosity of the bricks and increase in
porosity decreases thermal conductivity.
4. Luffa sponge has a higher tendency to increase the density of the bricks as observed
from the density analysis.
5. All the bricks have good slag attack resistance
The results showed that the five bricks have good refractory properties. Therefore, the
bricks are suitable for insulating refractories. They can be used in making linings of ovens,
kilns, heating furnaces and ladles. More research should be done to improve the properties
of the bricks and to find the best mixing ratio.
Since Nigeria is blessed with a lot of clay deposits and refractory materials, efforts should
be made to exploit them. This will discourage the importation of refractories and enhance
a rapid industrial and economic development in the country.

ISSN: 2347-6532 Impact Factor: 6.660
245 Vol. 6 Issue 3, March 2018
References
1. www.refractoriesinstitute.org/(ND)
2. Borode, J. O.; Onyemaobi, O. O. & Omotoyinbo, J. A. (2000). Suitability of some
Nigerian clay as refractory raw materials. Nigerian Journal of Engineering
Management 1: 14-18
3. Irabor, P. S. A. (2002). Physical and Chemical Investigation on some Nigerian
Kaolinite Clays for use in the Ceramics and Allied Industries. Nigerian Journal of
Engineering Research and Development 1 (1): 54-59
4. Giddel M.R and. Jivan A.P, (2007): Waste to Wealth, Potential of Rice Husk in India a
Literature Review. International Conference on Cleaner Technologies and
Environmental Management PEC, Pondicherry, India.
5. Mohd kamal N.L and Nuruddin M.F, (ND): Interfacial bond strength: influence of
microwave incinerated rice husk ash
6. Adeyemi, G. O. (1994). Major elements geochemistry and strength characteristic of
three highway sub-grade soils in South Western Nigeria. Clay Mineralogy. Bulletin of
the International Association of Engineering Geology (5): 5-8
7. Abdul J.M. (2005). Effects of some selected chemical additives on shrinkage and
compressive strength of ball clay in Ikotun, Ado-Ekiti. Journal of Mechanical
Engineering, University of Ekiti Offa. Vol. 3 No.1,pp 7-15
8. www.PDHcenter.com(ND
9. Ugheoke B. I., Onche E. O., Namessan N. O., Asikpo G. A., Property Optimization of
Kaolin - Rice Husk Insulating Fire -Bricks , LEJPT, 2006, 9, p. 167-178.
10. Okeugo Christian, O et al (2012): Production of Insulating Bricks Using Unwana Clay,
Edda Clay, Kaolin and Wood Soft Dust. The International Journal of Engineering and
Science (IJES).vol 1. Page 184-187.
11. Nguyen H.T. et al (2014): Evaluating Thermal Properties of Geopolymer Produced
from Red Mud, Rice Husk Ash And Diatomaceous Earth.
12. www.lejpt.academicfirect.org/A09/167-178.htm
13. Murray H.H., Applied clay mineralogy today and tomorrow, Clay minerals, 1999, 34,
p. 39-49
14. Adeyemi, G. O. (1994). Major elements geochemistry and strength characteristic of
three highway sub-grade soils in South Western Nigeria. Clay Mineralogy. Bulletin of
the International Association of Engineering Geology (5): 5-8.
15. Chester J.H (2003). “Refractoriness – Production and properties”. The iron steel
institute, London.
Top Related
Copyright © 2022 FDOKUMEN

