


Bahasa
Halaman
Hukum

PLEASE SCROLL DOWN FOR ARTICLE
This article was downloaded by: [informa internal users]On: 2 December 2009Access details: Access Details: [subscription number 755239602]Publisher Taylor & FrancisInforma Ltd Registered in England and Wales Registered Number: 1072954 Registered office: Mortimer House, 37-41 Mortimer Street, London W1T 3JH, UK
International Journal of ElectronicsPublication details, including instructions for authors and subscription information:http://www.informaworld.com/smpp/title~content=t713599654
Determination of error in nonlinearity estimation in an A/D converterwith triangular wave inputR. S. Gamad a; D. K. Mishra a
a Department of Electronics and Instrumentation Engineering, S. G. S. Institute of Technology andScience, Indore, Madhya Pradesh, India
Online publication date: 01 December 2009
To cite this Article Gamad, R. S. and Mishra, D. K.(2009) 'Determination of error in nonlinearity estimation in an A/Dconverter with triangular wave input', International Journal of Electronics, 96: 12, 1237 — 1247To link to this Article: DOI: 10.1080/00207210903168314URL: http://dx.doi.org/10.1080/00207210903168314
Full terms and conditions of use: http://www.informaworld.com/terms-and-conditions-of-access.pdf
This article may be used for research, teaching and private study purposes. Any substantial orsystematic reproduction, re-distribution, re-selling, loan or sub-licensing, systematic supply ordistribution in any form to anyone is expressly forbidden.
The publisher does not give any warranty express or implied or make any representation that the contentswill be complete or accurate or up to date. The accuracy of any instructions, formulae and drug dosesshould be independently verified with primary sources. The publisher shall not be liable for any loss,actions, claims, proceedings, demand or costs or damages whatsoever or howsoever caused arising directlyor indirectly in connection with or arising out of the use of this material.
Determination of error in nonlinearity estimation in an A/D converter
with triangular wave input
R.S. Gamad* and D.K. Mishra
Department of Electronics and Instrumentation Engineering, S. G. S. Institute of Technology andScience, 23 Park Road, Indore, Madhya Pradesh, India
(Received 4 October 2008; final version received 23 May 2009)
This article reports the dynamic testing of an A/D converter (ADC) when theinput test signal is a triangular wave. Computation of code transition levels isdone using the histogram method. Further normalised differential nonlinearityand normalised integral nonlinearity are determined based on the normalisedcode transition levels. Errors in both the type of nonlinearity and their varianceare computed. This work is carried out by simulating an ideal 5 and 8 bit ADCand introducing arbitrary nonlinearity errors in ADC transfer characteristics. Thesimulated triangular wave is digitised by the test ADC and a large number ofsamples is collected. Simulation results are reported for the 5 and 8 bit ADCwhich shows the effectiveness of the proposed method.
Keywords: normalised differential non-linearity; normalised integral non-linearity;error estimation; triangular wave; precision; histogram
1. Introduction
When the input to an A/D converter (ADC) in an application is not a sine wave thentesting using an actual signal is essential to find out functional parameters. Dynamictesting using a triangular wave input based on the histogram method is an importantactivity for characterisation of an ADC. First of all, ADC code transition levels arecomputed and different nonlinearities are determined by collecting a large number ofsamples of a triangular wave using the test ADC.
The histogram test is extensively used in the area of high speed ADC testing toobtain its transfer function and consequently several parameters of interest, namelyintegral nonlinearity (INL), differential nonlinearity (DNL), effective number of bits(ENOB), gain error and offset error, among others (Blair 1994; IEEE std-1057-1994;IEEE std-1241-2000). These parameters attest to the capacity of the ADC to performits intended function. ADCs are rarely used alone, but are often included in moreelaborate systems. The performance of the ADC will affect the performance of thesystem where it is included and the precision with which the ADC parameters areknown is necessary to compute the precision of the final result of the system using it.The standard histogram technique is a popular method which estimates DNL andINL related to each transition voltage of an ADC. Earlier work on ADC testingusing the histogram technique has been reported for determination of DNL, INL,
*Corresponding author. Email: [email protected]
International Journal of Electronics
Vol. 96, No. 12, December 2009, 1237–1247
ISSN 0020-7217 print/ISSN 1362-3060 online
� 2009 Taylor & Francis
DOI: 10.1080/00207210903168314
http://www.informaworld.com
Downloaded By: [informa internal users] At: 09:52 2 December 2009
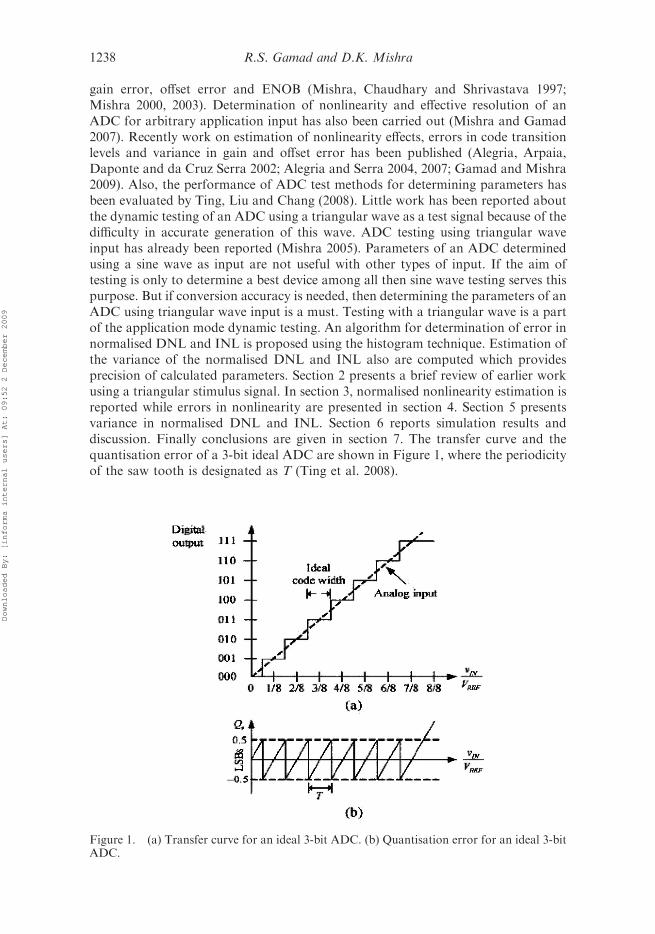
gain error, offset error and ENOB (Mishra, Chaudhary and Shrivastava 1997;Mishra 2000, 2003). Determination of nonlinearity and effective resolution of anADC for arbitrary application input has also been carried out (Mishra and Gamad2007). Recently work on estimation of nonlinearity effects, errors in code transitionlevels and variance in gain and offset error has been published (Alegria, Arpaia,Daponte and da Cruz Serra 2002; Alegria and Serra 2004, 2007; Gamad and Mishra2009). Also, the performance of ADC test methods for determining parameters hasbeen evaluated by Ting, Liu and Chang (2008). Little work has been reported aboutthe dynamic testing of an ADC using a triangular wave as a test signal because of thedifficulty in accurate generation of this wave. ADC testing using triangular waveinput has already been reported (Mishra 2005). Parameters of an ADC determinedusing a sine wave as input are not useful with other types of input. If the aim oftesting is only to determine a best device among all then sine wave testing serves thispurpose. But if conversion accuracy is needed, then determining the parameters of anADC using triangular wave input is a must. Testing with a triangular wave is a partof the application mode dynamic testing. An algorithm for determination of error innormalised DNL and INL is proposed using the histogram technique. Estimation ofthe variance of the normalised DNL and INL also are computed which providesprecision of calculated parameters. Section 2 presents a brief review of earlier workusing a triangular stimulus signal. In section 3, normalised nonlinearity estimation isreported while errors in nonlinearity are presented in section 4. Section 5 presentsvariance in normalised DNL and INL. Section 6 reports simulation results anddiscussion. Finally conclusions are given in section 7. The transfer curve and thequantisation error of a 3-bit ideal ADC are shown in Figure 1, where the periodicityof the saw tooth is designated as T (Ting et al. 2008).
Figure 1. (a) Transfer curve for an ideal 3-bit ADC. (b) Quantisation error for an ideal 3-bitADC.
1238 R.S. Gamad and D.K. Mishra
Downloaded By: [informa internal users] At: 09:52 2 December 2009
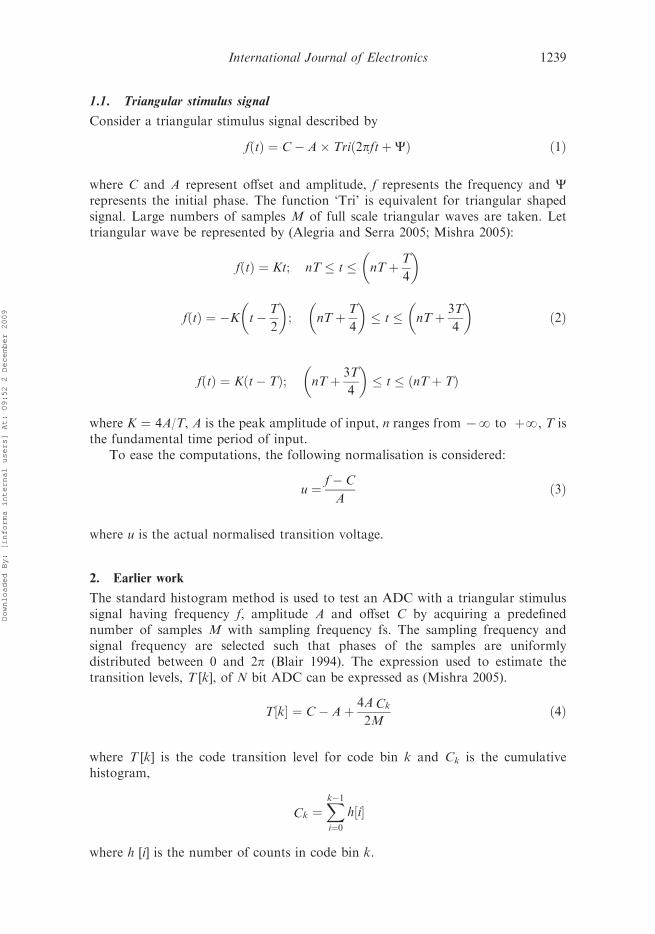
1.1. Triangular stimulus signal
Consider a triangular stimulus signal described by
fðtÞ ¼ C� A� Trið2pftþCÞ ð1Þ
where C and A represent offset and amplitude, f represents the frequency and Crepresents the initial phase. The function ‘Tri’ is equivalent for triangular shapedsignal. Large numbers of samples M of full scale triangular waves are taken. Lettriangular wave be represented by (Alegria and Serra 2005; Mishra 2005):
f tð Þ ¼ Kt; nT � t � nTþ T
4
� �
f tð Þ ¼ �K t� T
2
� �; nTþ T
4
� �� t � nTþ 3T
4
� �ð2Þ
f tð Þ ¼ K t� Tð Þ; nTþ 3T
4
� �� t � ðnTþ TÞ
where K ¼ 4A/T, A is the peak amplitude of input, n ranges from 7? to þ?, T isthe fundamental time period of input.
To ease the computations, the following normalisation is considered:
u ¼ f� C
Að3Þ
where u is the actual normalised transition voltage.
2. Earlier work
The standard histogram method is used to test an ADC with a triangular stimulussignal having frequency f, amplitude A and offset C by acquiring a predefinednumber of samples M with sampling frequency fs. The sampling frequency andsignal frequency are selected such that phases of the samples are uniformlydistributed between 0 and 2p (Blair 1994). The expression used to estimate thetransition levels, T [k], of N bit ADC can be expressed as (Mishra 2005).
T½k� ¼ C� Aþ 4ACk
2Mð4Þ
where T [k] is the code transition level for code bin k and Ck is the cumulativehistogram,
Ck ¼Xk�1i¼0
h½i�
where h [i] is the number of counts in code bin k.
International Journal of Electronics 1239
Downloaded By: [informa internal users] At: 09:52 2 December 2009
The estimate of normalised transition voltage U (i) can be expressed using (4) as:
UðiÞ ¼ TðkÞ � C
A¼ 4Ck � 1
2Mð5Þ
For values of C and A, Equations (3) and (5) can be used. Where the symbol (^)over the parameter shows the estimated value. DNL computation is carried outbased on code transition levels T [k] in a similar way as that of sine wave based ADCtesting. The only difference is in computation of code transition levels. For anyparticular values of the gain and the offset, the DNL and INL can be estimated asfollows:
DNL ¼ G�W K½ � �Q
Qð6Þ
INL ¼ ½K� 1�Qþ T½1� � T½K�Q
ð7Þ
where G ¼ gain of an ADC, W [k] ¼ Kth code bin width of an ADC and Q ¼ idealcode bin width.
3. Estimation of normalised nonlinearity
Normalised values of DNL and INL can be computed in terms of the normalisedcode transition level as given in (3).
3.1. Normalised DNL and INL determination
DNLnor ¼GW½k�nor �Q
Qð8Þ
where W[k]nor ¼ A[U[k þ 1] –U[k]
DNLnor ¼ A U½kþ 1� �U½k�½ � ð9Þ
INLnor ¼½k� 1�QþU½1�A�U½k�A
Qð10Þ
INLnor ¼ ½k� 1� þ A½U½1� �U½k� ð11Þ
Here, Q is the ideal normalised code bin width nominally unity.
3.2. Estimate of DNLnor and INLnor
An estimate of normalised DNL and INL can be expressed in terms of the estimateof normalised code transition levels as:
1240 R.S. Gamad and D.K. Mishra
Downloaded By: [informa internal users] At: 09:52 2 December 2009
DNLnor ¼GA U½kþ 1� � U½k�� �
Q� 1 ð12Þ
INLnor ¼ðGUAþ OÞ �U½k�
Qð13Þ
where Q ¼ A½U½2N�1��U½1��2N�2 ; G ¼ U½2N�1��U½1�
U½2N�1��U½1� ; O ¼A½U½2N�1��U½1��
ð2N�2Þ
4. Error in estimate of DNLnor and INLnor
The estimate of error in normalised DNL and INL is determined by taking thedeviation of the estimated value from the actual values.
From (9) and (12)
eDNLnor
¼ DNLnor �DNLnor ð14Þ
eDNLnor
¼ GA½U½kþ 1� � U½k��Q
� 1
( )� A½U½kþ 1� �U½k�� ð15Þ
From (11) and (13)
eINLnor
¼ INLnor � INLnor ð16Þ
eINLnor
¼GUAþ O� �
�U½k�Q
� ½k� 1� þ A½U½1� �U½k� ð17Þ
5. Variance in DNLnor and INLnor
The variance in the estimate of differential nonlinearity (DNLnor) error can beapproximated by (Papoulis 1991):
s2DNLnor
� @DNLnor
@F
!F¼mF
s2Fþ @DNLnor
@L
!L¼mL
s2L
ð18Þ
which in this case leads to
s2DNLnor
�G� W K½ �nor� 2N � 2ð Þ� �2
mL � mF� �4 s2
Fþ
G� W K½ �nor� 2N � 2ð Þ� �2
mL � mF� �4 s2
Lð19Þ
International Journal of Electronics 1241
Downloaded By: [informa internal users] At: 09:52 2 December 2009
where W[k]nor ¼ A[U[k þ 1]7U[k]]
s2DNLnor
�G� W K½ �nor� 2N � 2ð Þ� �2
mL � mF� �4 s2
Fþ s2
L
� ð20Þ
Approximating the mean of the estimated values of F and L by their ideal valueleads to:
s2DNLnor
�G� W K½ �nor� 2N � 2ð Þ� �2
4 FS�Qð Þ4s2Fþ s2
L
� ð21Þ
The variance in the estimate of normalised integral non-linearity error, INLnor,can be approximated by (Papoulis 1991):
s2INLnor
¼ @INLnor
@F
!F¼mF
s2Fþ @INLnor
@L
!L¼mL
s2L
ð22Þ
where F ¼ U[1] ¼ First transition level, L ¼ U[2N 7 1] ¼ Last transition level.Which in this case leads to
s2INLnor
�GU½K� þ O �
�U½k�� �2
2N � 2ð Þ2
mL � mF� �4 s2
Fþ
GU½K� þ O �
�U½k�� �2
2N � 2ð Þ2
mL � mF� �4 s2
L
ð23Þ
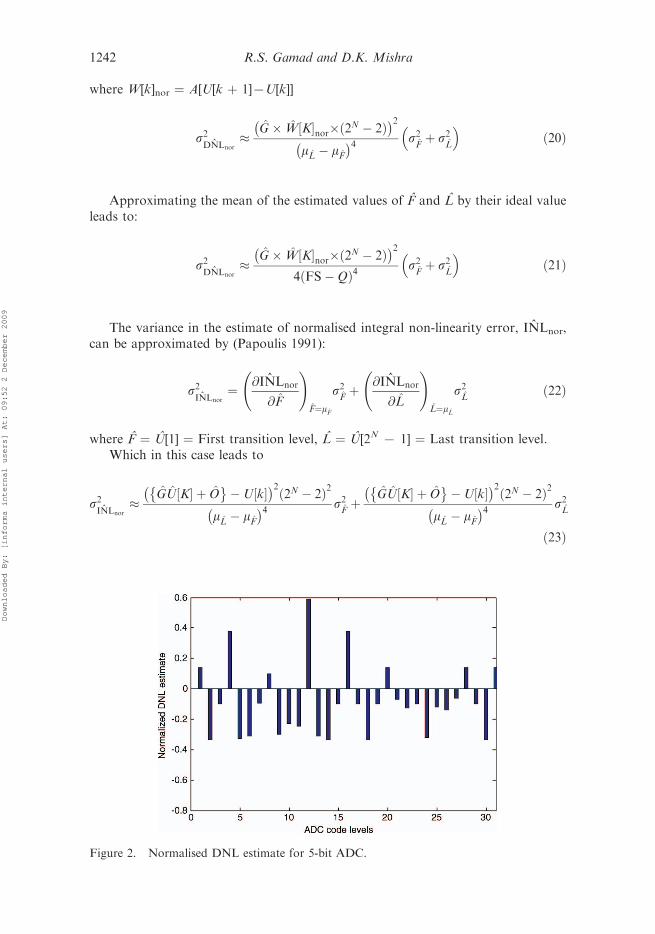
Figure 2. Normalised DNL estimate for 5-bit ADC.
1242 R.S. Gamad and D.K. Mishra
Downloaded By: [informa internal users] At: 09:52 2 December 2009
Approximating the mean of the estimated values of F and L by their ideal valuesleads to:
s2INLnor
�GU½K� þ O �
�U½k�� �2
2N � 2ð Þ2
4 FS�Qð Þ4s2Fþ s2
L
� ð24Þ
6. Results and discussion
To estimate the correct values of transition levels and different nonlinearities thesignal frequency is kept low so that dynamic errors are negligible. The record mustcontain the exact integer number of cycles. In addition to this, the number of cycles
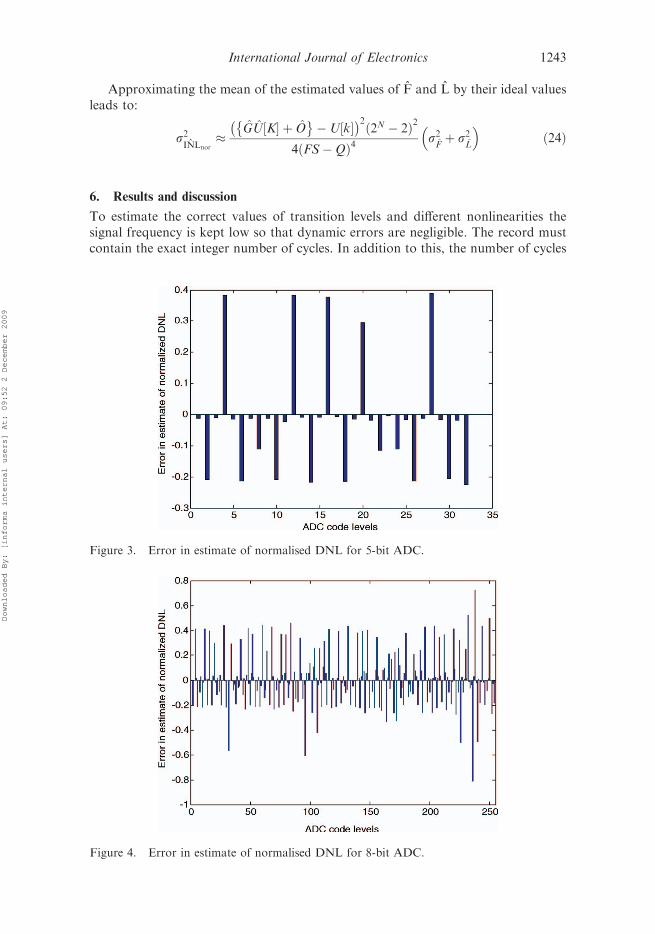
Figure 3. Error in estimate of normalised DNL for 5-bit ADC.
Figure 4. Error in estimate of normalised DNL for 8-bit ADC.
International Journal of Electronics 1243
Downloaded By: [informa internal users] At: 09:52 2 December 2009
in a record must be relatively prime to the number of samples in the record. Atriangular wave with frequency 0.98 MHz is simulated and applied to 5 bit and 8 bitADC and a large number of samples are collected. With the help of computerprogram, the ADC was simulated with an arbitrary number of bits and arbitrary bitfailure patterns (Wagdy and Awad 1991). Arbitrary DNL error is introduced in idealsimulated ADC transfer characteristics. Estimation of normalised DNL is carriedout for 5 and 8 bit ADC. Estimated normalised DNL is computed and is shown inFigure 2 while Figures 3 and 4 show error in normalised DNL estimation for 5 bitand 8 bit ADC, respectively. The error in normalised DNL is observed to have amaximum value of 0.4 and minimum value of 0.2. Figure 5 shows the plot of
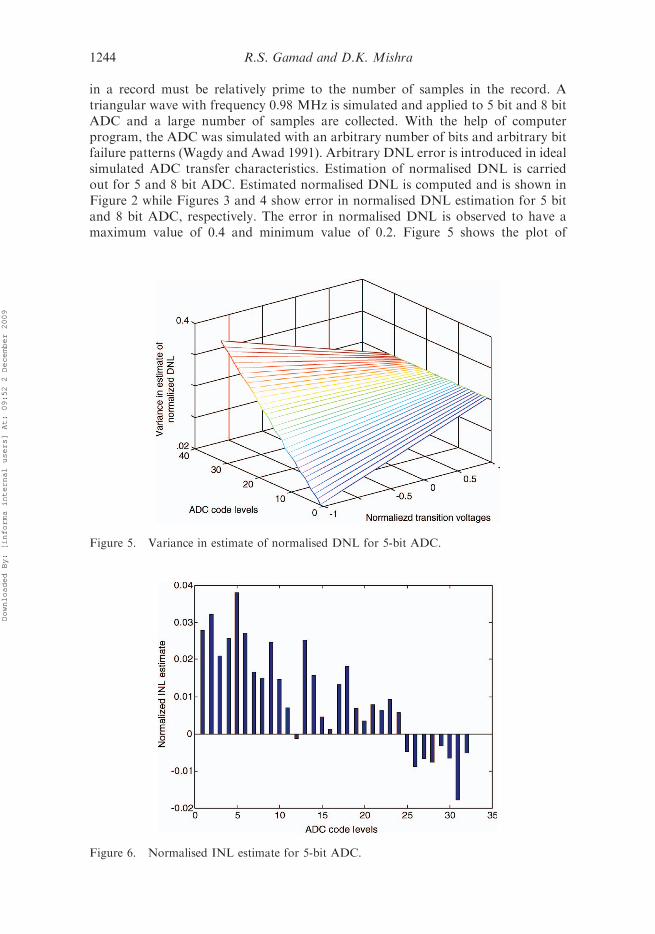
Figure 5. Variance in estimate of normalised DNL for 5-bit ADC.
Figure 6. Normalised INL estimate for 5-bit ADC.
1244 R.S. Gamad and D.K. Mishra
Downloaded By: [informa internal users] At: 09:52 2 December 2009
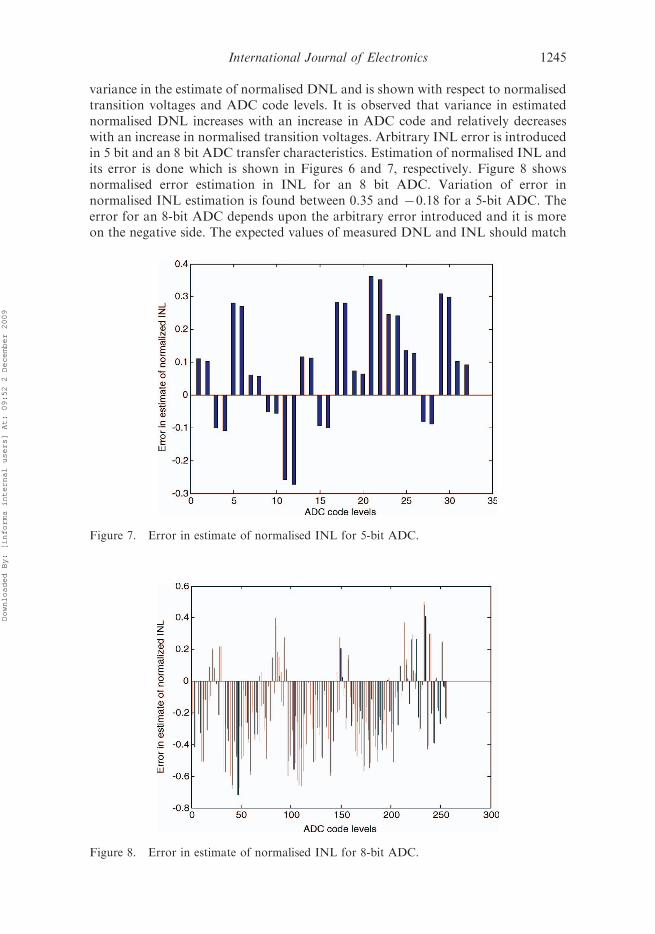
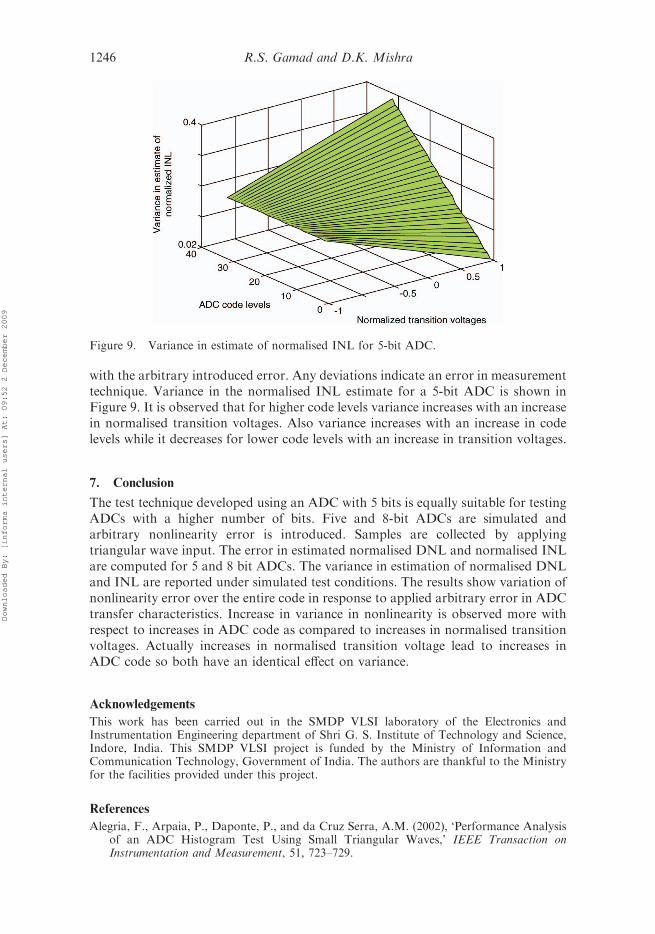
variance in the estimate of normalised DNL and is shown with respect to normalisedtransition voltages and ADC code levels. It is observed that variance in estimatednormalised DNL increases with an increase in ADC code and relatively decreaseswith an increase in normalised transition voltages. Arbitrary INL error is introducedin 5 bit and an 8 bit ADC transfer characteristics. Estimation of normalised INL andits error is done which is shown in Figures 6 and 7, respectively. Figure 8 showsnormalised error estimation in INL for an 8 bit ADC. Variation of error innormalised INL estimation is found between 0.35 and 70.18 for a 5-bit ADC. Theerror for an 8-bit ADC depends upon the arbitrary error introduced and it is moreon the negative side. The expected values of measured DNL and INL should match
Figure 7. Error in estimate of normalised INL for 5-bit ADC.
Figure 8. Error in estimate of normalised INL for 8-bit ADC.
International Journal of Electronics 1245
Downloaded By: [informa internal users] At: 09:52 2 December 2009
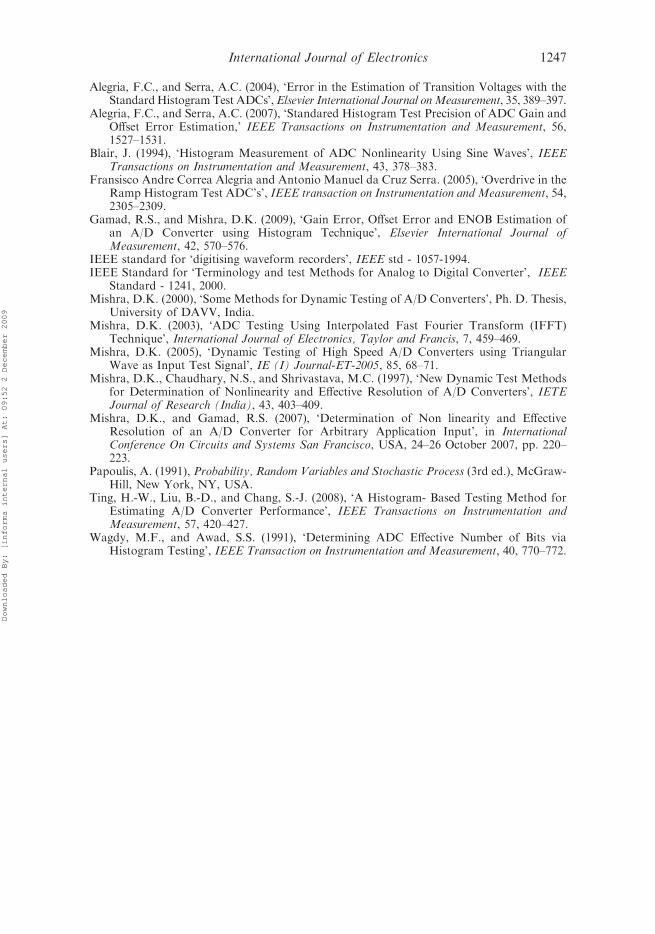
with the arbitrary introduced error. Any deviations indicate an error in measurementtechnique. Variance in the normalised INL estimate for a 5-bit ADC is shown inFigure 9. It is observed that for higher code levels variance increases with an increasein normalised transition voltages. Also variance increases with an increase in codelevels while it decreases for lower code levels with an increase in transition voltages.
7. Conclusion
The test technique developed using an ADC with 5 bits is equally suitable for testingADCs with a higher number of bits. Five and 8-bit ADCs are simulated andarbitrary nonlinearity error is introduced. Samples are collected by applyingtriangular wave input. The error in estimated normalised DNL and normalised INLare computed for 5 and 8 bit ADCs. The variance in estimation of normalised DNLand INL are reported under simulated test conditions. The results show variation ofnonlinearity error over the entire code in response to applied arbitrary error in ADCtransfer characteristics. Increase in variance in nonlinearity is observed more withrespect to increases in ADC code as compared to increases in normalised transitionvoltages. Actually increases in normalised transition voltage lead to increases inADC code so both have an identical effect on variance.
Acknowledgements
This work has been carried out in the SMDP VLSI laboratory of the Electronics andInstrumentation Engineering department of Shri G. S. Institute of Technology and Science,Indore, India. This SMDP VLSI project is funded by the Ministry of Information andCommunication Technology, Government of India. The authors are thankful to the Ministryfor the facilities provided under this project.
References
Alegria, F., Arpaia, P., Daponte, P., and da Cruz Serra, A.M. (2002), ‘Performance Analysisof an ADC Histogram Test Using Small Triangular Waves,’ IEEE Transaction onInstrumentation and Measurement, 51, 723–729.
Figure 9. Variance in estimate of normalised INL for 5-bit ADC.
1246 R.S. Gamad and D.K. Mishra
Downloaded By: [informa internal users] At: 09:52 2 December 2009
Alegria, F.C., and Serra, A.C. (2004), ‘Error in the Estimation of Transition Voltages with theStandardHistogramTest ADCs’,Elsevier International Journal onMeasurement, 35, 389–397.
Alegria, F.C., and Serra, A.C. (2007), ‘Standared Histogram Test Precision of ADC Gain andOffset Error Estimation,’ IEEE Transactions on Instrumentation and Measurement, 56,1527–1531.
Blair, J. (1994), ‘Histogram Measurement of ADC Nonlinearity Using Sine Waves’, IEEETransactions on Instrumentation and Measurement, 43, 378–383.
Fransisco Andre Correa Alegria and Antonio Manuel da Cruz Serra. (2005), ‘Overdrive in theRamp Histogram Test ADC’s’, IEEE transaction on Instrumentation and Measurement, 54,2305–2309.
Gamad, R.S., and Mishra, D.K. (2009), ‘Gain Error, Offset Error and ENOB Estimation ofan A/D Converter using Histogram Technique’, Elsevier International Journal ofMeasurement, 42, 570–576.
IEEE standard for ‘digitising waveform recorders’, IEEE std - 1057-1994.IEEE Standard for ‘Terminology and test Methods for Analog to Digital Converter’, IEEE
Standard - 1241, 2000.Mishra, D.K. (2000), ‘Some Methods for Dynamic Testing of A/D Converters’, Ph. D. Thesis,
University of DAVV, India.Mishra, D.K. (2003), ‘ADC Testing Using Interpolated Fast Fourier Transform (IFFT)
Technique’, International Journal of Electronics, Taylor and Francis, 7, 459–469.Mishra, D.K. (2005), ‘Dynamic Testing of High Speed A/D Converters using Triangular
Wave as Input Test Signal’, IE (I) Journal-ET-2005, 85, 68–71.Mishra, D.K., Chaudhary, N.S., and Shrivastava, M.C. (1997), ‘New Dynamic Test Methods
for Determination of Nonlinearity and Effective Resolution of A/D Converters’, IETEJournal of Research (India), 43, 403–409.
Mishra, D.K., and Gamad, R.S. (2007), ‘Determination of Non linearity and EffectiveResolution of an A/D Converter for Arbitrary Application Input’, in InternationalConference On Circuits and Systems San Francisco, USA, 24–26 October 2007, pp. 220–223.
Papoulis, A. (1991), Probability, Random Variables and Stochastic Process (3rd ed.), McGraw-Hill, New York, NY, USA.
Ting, H.-W., Liu, B.-D., and Chang, S.-J. (2008), ‘A Histogram- Based Testing Method forEstimating A/D Converter Performance’, IEEE Transactions on Instrumentation andMeasurement, 57, 420–427.
Wagdy, M.F., and Awad, S.S. (1991), ‘Determining ADC Effective Number of Bits viaHistogram Testing’, IEEE Transaction on Instrumentation and Measurement, 40, 770–772.
International Journal of Electronics 1247
Downloaded By: [informa internal users] At: 09:52 2 December 2009
Top Related

Copyright © 2022 FDOKUMEN

