


Bahasa
Halaman
Hukum

Permeability coefficients and vapour pressure determination for
fragrance materials
Rafael N. Almeida* , Joao G.M. Hartz*, Patrıcia F. Costa†, Alırio E. Rodrigues‡, Rubem M.F. Vargas* and Eduardo Cassel*
*Unit Operations Lab, Polytechnic School, Pontifical Catholic University of Rio Grande do Sul, Porto Alegre, Brazil, †CBQF - Centro de Biotecnologia e
Quımica Fina - Laboratorio Associado, Escola Superior de Biotecnologia, Universidade Catolica Portuguesa/Porto, Porto, Portugal and ‡LSRE-
Laboratory of Separation and Reaction Engineering, Associate Laboratory LSRE/LCM, Faculdade de Engenharia, Universidade do Porto, Porto,
Portugal
Received 29 July 2020, Revised 11 January 2021, Accepted 12 January 2021
Keywords: evaporation, penetration, perfume, Franz diffusion cell, computer modelling, statistics
AbstractOBJECTIVE: This study aims to correlate new experimental data
relevant to the description of the combined evaporation/permeation
process of a perfume applied onto the skin.
METHODS: The vapour pressure data were measured by thermo-
gravimetric analysis (TG-DTA). The Antoine constants and the Cla-
rke and Glew parameters were determined for the same set of
fragrance molecules to describe its low vapour pressures at new
temperature ranges. The permeability coefficient of a set of 14 fra-
grance molecules in ethanolic solution was determined by Franz
diffusion cell experiments, using porcine skin. The samples were
analysed by gas chromatography with a flame ionization detector
(GC/FID) and high-performance liquid chromatography with UV
visible detector (HPLC/UV). A QSAR model was proposed to corre-
late the experimental data.
RESULTS: The Antoine constants were determined and presented
low standard deviations. The Clarke and Glew physically significant
parameters were obtained along with its statistical analysis. The fit-
ting is good since the magnitude order is in accordance with the
literature, associated with the low correlation between the esti-
mated parameters and low standard deviations. The presented
correlation, based on a mixture using only ethanol as solvent, sho-
wed better results than previous QSAR models with a standard
relative deviation (σrÞ of 0.190, a standard error (SE) of 0.397 and
a determination coefficient (R2) of 0.7786.
CONCLUSION: The dataset is still small compared to larger and
more general QSAR models; however, it is much more specific as
to the type of solvent and class of materials studied. This work
represents an advance for the modelling of the perfume diffusion
process since it specifies important properties that until then had
been treated in a more general way.
ResumeOBJECTIF: Cette etude vise a correler de nouvelles donnees experi-
mentales pertinentes a la description du processus combine d’eva-
poration/permeation d’un parfum applique sur la peau.
METHODES: Les donnees de pression de vapeur ont ete mesurees
par analyse thermogravimetrique (TG-DTA). Les constantes
d’Antoine et les parametres de Clarke & Glew ont ete determines
pour le meme ensemble de molecules de parfum afin de decrire ses
faibles pressions de vapeur a de nouvelles plages de temperature.
Le coefficient de permeabilite d’un ensemble de 14 molecules de
parfum en solution ethanolique a ete determine par des experiences
de cellules de diffusion de Franz, en utilisant de la peau de porc.
Les echantillons ont ete analyses par chromatographie en phase
gazeuse avec un detecteur a ionisation de flamme (GC / FID) et
chromatographie liquide haute performance avec detecteur UV visi-
ble (HPLC / UV). Un modele QSAR a ete propose pour correler les
donnees experimentales.
RESULTATS: Les constantes d’Antoine ont ete determinees et ont
presente de faibles ecarts types. Les parametres physiquement signi-
ficatifs de Clarke & Glew ont ete obtenus avec son analyse statis-
tique. L’ajustement est bon car l’ordre de grandeur est conforme a
la litterature, associe a la faible correlation entre les parametres
estimes et les faibles ecarts types. La correlation presentee, basee
sur un melange utilisant uniquement de l’ethanol comme solvant,
a montre de meilleurs resultats que les modeles QSAR precedents
avec un ecart relatif standard (σr) de 0,190, une erreur standard
(SE) de 0,397 et un coefficient de determination (R2) de 0,7786.
CONCLUSION: L’ensemble de donnees est encore petit par rapport
aux modeles QSAR plus grands et plus generaux ; cependant, il est
beaucoup plus specifique quant au type de solvant et a la classe de
materiaux etudies. Ce travail represente une avancee pour la
modelisation du processus de diffusion des parfums car il precise
des proprietes importantes jusque-la traitees de maniere plus
generale.
Introduction
The description of the combined phenomena of fragrance evapora-
tion/permeation is complex due to its chemical nature, the interac-
tion with other formulation ingredients, subtracts (e.g. clothing)
and external factors (e.g. temperature) [1, 2]. Regarding the use of
a perfume, two main processes describe the phenomena: evapora-
tion and absorption. The evaporation process is clearly dependent
on the fragrance concentration in the liquid phase, as well as
external factors such as temperature, wind and other surface prop-
erties. On the other hand, the absorption of any chemical through
Correspondence: Rafael N. Almeida, Unit Operations Lab, Polytechnic
School, Pontifical Catholic University of Rio Grande do Sul, Porto Ale-
gre, Brazil. Tel.: +55 51 3353 4585; fax: +55 (51) 3320.3823; e-mail:
© 2021 Society of Cosmetic Scientists and the Societe Francaise de Cosmetologie 225
International Journal of Cosmetic Science, 2021, 43, 225–234 doi: 10.1111/ics.12686

the skin depends upon multiple factors (skin hydration, transepider-
mal water loss, temperature), and it determines the amount of fra-
grance substances available for human perception, since it also
impacts the liquid phase concentration.
Most of the perfume raw materials (PRMs) used in cosmetic
products have a lipophilic character and, therefore, the potential to
be absorbed through the skin. Due to this feature, terpenes – some
of the main perfume constituents – are even used as skin perme-
ation enhancers in transdermal drug delivery [3]. The literature
vastly explores this property by measuring the permeability coeffi-
cient of drugs enhanced by the terpene lipophilic property [4–6].Due to the lipophilic nature of skin, the optimal permeant has rela-
tively low molecular weight and reasonable solubility in both
hydrophilic and lipophilic media [7]. The permeability coefficient of
a substance is also strongly dependent on the vehicle it is dissolved
in, due to the solvent or solid–matrix interactions and the perme-
ation enhancement/decreasing factor [8]. The permeation and
safety of various PRMs have been investigated [9–11]. The process
controlling parameters are also well determined: physicochemical
properties (including size, lipophilicity, and solubility in oil and in
water), the vehicle in which it is dissolved in, the “skin environ-
ment,” and the extent of exposure [12].
Several predictive permeation models have been proposed on
cutaneous drug delivery and toxicology [13–15]. However, such
models are more reliable when confined within well-defined chemi-
cal classes, and their applicability is often limited by the narrow
property space of the set of permeants under study [16, 17]. Math-
ematical models describing the absorption of chemicals through the
skin have been also reported in the literature [15, 18–20], but justa few kinetic models describe the combined fragrance evaporation/
permeation phenomena [2, 21].
The evaporation process of volatiles at atmospheric pressure
relies on the interface vapour–liquid equilibrium. Such systems are
easily represented by the modified Raoult’s law, which requires the
pure component vapour pressure and the mixture activity coeffi-
cients [22]. Group contribution methods (UNIFAC) or predictive
models (COSMO-SAC) are used to predict the mixture property
[23]. However, few data are available for the terpenes vapour pres-
sure, and the corresponding states/group contribution methods
frequently demand other unspecified properties [24]. The thermo-
gravimetric analysis (TG–DTA) has been proved to be a useful tool
for determining low vapour pressure, because it is a fast test and
requires small samples [25, 26]. There are studies applying the
TG–DTA technique through a modified Langmuir equation, to eval-
uate the vapour pressure of terpenes and essential oils [27, 28].
Recently, a mathematical model based on a differential mass bal-
ance for predicting the evaporation and permeation profiles of fra-
grance systems applied to skin was reported [29]. In this previous
study, three fragrance systems were studied: ethanol/limonene,
ethanol/linalool and ethanol/α-pinene. This method requires the
terpene permeability coefficient (Kp) to estimate the whole diffusion
system. As far as we know, this is the only study regarding the
specific evaluation of permeability coefficients for terpenes in
ethanolic solutions. The correlations for its estimation available in
the literature are poorly accurate for lipophilic compounds, once
they were developed for aqueous systems, mostly for pharmaceuti-
cals and hydrophilic substances. The International Fragrance Asso-
ciation (IFRA) uses the correlation developed based on the findings
of the Research Institute of Fragrance Materials (RIFM) [30], which
gathers data regarding the safety of fragrance materials, along with
the EDETOX [31] database (containing in vitro and in vivo
percutaneous penetration data). In addition, the enhancer effect
attributed to terpenes in pharmaceutical formulations is also
observed for perfumes, proving that Kp values are also related to
the vehicle [7, 32]. For this reason, a correlation for Kp values
specific for terpenes in ethanolic solutions would represent a break-
through.
Therefore, this investigation aims to evaluate the two main prop-
erties, vapour pressure and permeability coefficient, related to the
evaporation/permeation process concerning ethanolic solutions of
PRMs applied to the skin. A quantitative structure–activity rela-
tionship (QSAR) based on the two main current models [30, 33] is
proposed in order to correlate the experimental data, only when
ethanol is used as the vehicle. Antoine constants and Clarke and
Glew parameters [34] are fitted to the experimental low vapour
pressure data. The determination of these two properties aims to
aid in the design and evaluation of fragrance materials [35].
Materials and methods
Chemicals
Camphor (96%), carvacrol (99%), (L)-carvone (99%), E-caryophyl-
lene (≥98%), citronellol (≥95%), eucalyptol (99%), eugenol
(≥98%), geraniol (≥97%), R-(+)-limonene (≥98%), (�)-linalool
(>97%), (�)-menthol (≥98%), (−)-menthone (96%), α-pinene(98%), tonalide (≥98%), vanillin (99%) and Tween® 20 were all
obtained from Sigma-Aldrich. Ethanol (P.A. 99.8%), 1-propanol
(67-63-0 ≥ 99.5%), methanol (67-56-1 P.A. 99.9%), phosphate
buffer solution (pH 7.4) and glacial acetic acid (64-19-7) were
obtained from Merck. The perfume raw materials are listed in
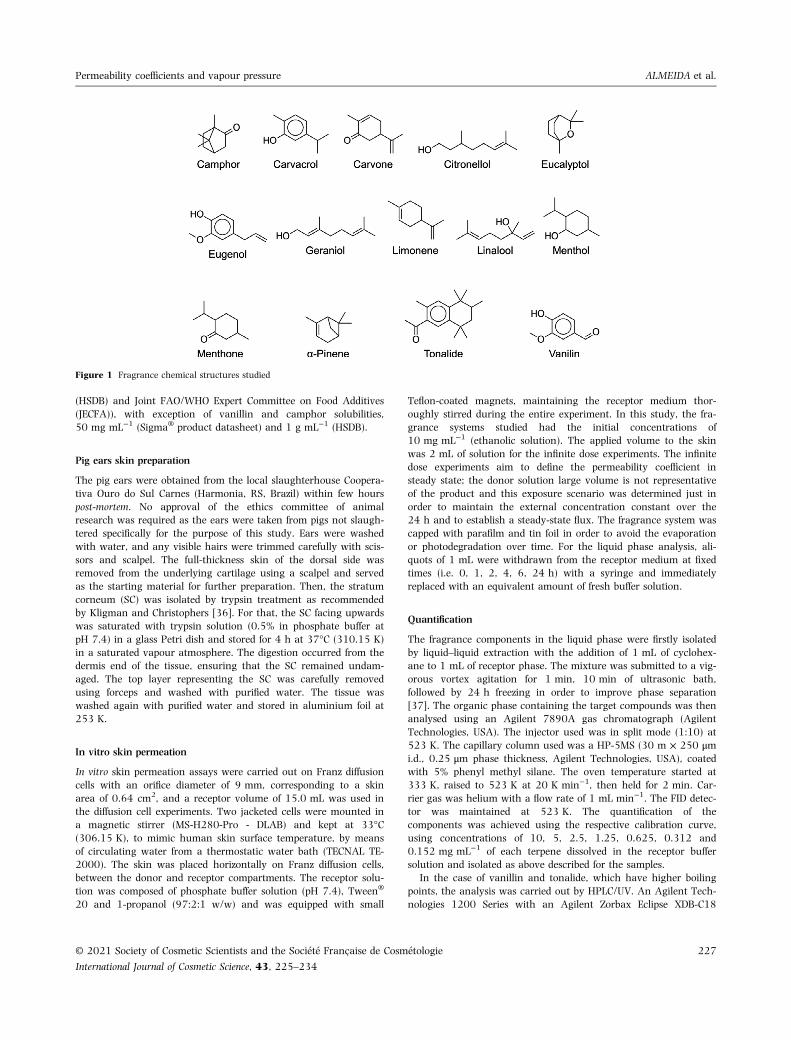
Table 1 with their chemical structure presented in Fig. 1. All the
PRMs are miscible with ethanol (Hazardous Substances Data Bank
Table 1 Properties of the fragrance materials
Compound CAS#
Molecular
formulaaMW (g
mol−1)a Psati (Pa)b
log
Kowc
Camphor 76-22-2 C10H16O 152.23 9.60 2.38
Carvacrol 499-75-2 C10H14O 150.22 3.09 3.49
Carvone 99-49-0 C10H14O 154.22 13.70 2.71
Citronellol 106-22-9 C10H20O 156.27 5.88 3.91
Eucalyptol 470-82-6 C10H18O 154.25 253.0 2.74
Eugenol 97-53-0 C10H18O2 164.2 3.01 2.27
Geraniol 106-24-1 C10H18O 154.25 4.0 3.56
Limonene 5989-27-
5
C10H16 136.23 192.0 4.57
Linalool 78-70-6 C10H18O 154.25 21.3 2.97
Menthol 89-78-1 C10H20O 156.27 8.49 3.2
Menthone 14073-
97-3
C10H18O 154.25 0.37 3.05
Tonalide 21145-
77-7
C18H26O 258.41 0.0471 5.70
Vanillin 121-33-5 C8H8O3 152.15 0.057 1.21
α-Pinene 80-56-8 C10H16 136.23 633.0 4.83
Ethanol 64-17-5 C2H6O 46.1 7910 -0.31
Molecular Weight (MW), Vapour Pressure (Psati ) at 25°C and Octanol–Water
Partition Coefficient (Kow).aFrom EPI Suite Database.bExperimental values from EPI Suite Database, at 25°C.cExperimental values of log Kow from EPI Suite Database.
226 © 2021 Society of Cosmetic Scientists and the Societe Francaise de Cosmetologie
International Journal of Cosmetic Science, 43, 225–234
Permeability coefficients and vapour pressure ALMEIDA et al.
(HSDB) and Joint FAO/WHO Expert Committee on Food Additives
(JECFA)), with exception of vanillin and camphor solubilities,
50 mg mL−1 (Sigma® product datasheet) and 1 g mL−1 (HSDB).
Pig ears skin preparation
The pig ears were obtained from the local slaughterhouse Coopera-
tiva Ouro do Sul Carnes (Harmonia, RS, Brazil) within few hours
post-mortem. No approval of the ethics committee of animal
research was required as the ears were taken from pigs not slaugh-
tered specifically for the purpose of this study. Ears were washed
with water, and any visible hairs were trimmed carefully with scis-
sors and scalpel. The full-thickness skin of the dorsal side was
removed from the underlying cartilage using a scalpel and served
as the starting material for further preparation. Then, the stratum
corneum (SC) was isolated by trypsin treatment as recommended
by Kligman and Christophers [36]. For that, the SC facing upwards
was saturated with trypsin solution (0.5% in phosphate buffer at
pH 7.4) in a glass Petri dish and stored for 4 h at 37°C (310.15 K)
in a saturated vapour atmosphere. The digestion occurred from the
dermis end of the tissue, ensuring that the SC remained undam-
aged. The top layer representing the SC was carefully removed
using forceps and washed with purified water. The tissue was
washed again with purified water and stored in aluminium foil at
253 K.
In vitro skin permeation
In vitro skin permeation assays were carried out on Franz diffusion
cells with an orifice diameter of 9 mm, corresponding to a skin
area of 0.64 cm2, and a receptor volume of 15.0 mL was used in
the diffusion cell experiments. Two jacketed cells were mounted in
a magnetic stirrer (MS-H280-Pro - DLAB) and kept at 33°C(306.15 K), to mimic human skin surface temperature, by means
of circulating water from a thermostatic water bath (TECNAL TE-
2000). The skin was placed horizontally on Franz diffusion cells,
between the donor and receptor compartments. The receptor solu-
tion was composed of phosphate buffer solution (pH 7.4), Tween®
20 and 1-propanol (97:2:1 w/w) and was equipped with small
Teflon-coated magnets, maintaining the receptor medium thor-
oughly stirred during the entire experiment. In this study, the fra-
grance systems studied had the initial concentrations of
10 mg mL−1 (ethanolic solution). The applied volume to the skin
was 2 mL of solution for the infinite dose experiments. The infinite
dose experiments aim to define the permeability coefficient in
steady state; the donor solution large volume is not representative
of the product and this exposure scenario was determined just in
order to maintain the external concentration constant over the
24 h and to establish a steady-state flux. The fragrance system was
capped with parafilm and tin foil in order to avoid the evaporation
or photodegradation over time. For the liquid phase analysis, ali-
quots of 1 mL were withdrawn from the receptor medium at fixed
times (i.e. 0, 1, 2, 4, 6, 24 h) with a syringe and immediately
replaced with an equivalent amount of fresh buffer solution.
Quantification
The fragrance components in the liquid phase were firstly isolated
by liquid–liquid extraction with the addition of 1 mL of cyclohex-
ane to 1 mL of receptor phase. The mixture was submitted to a vig-
orous vortex agitation for 1 min, 10 min of ultrasonic bath,
followed by 24 h freezing in order to improve phase separation
[37]. The organic phase containing the target compounds was then
analysed using an Agilent 7890A gas chromatograph (Agilent
Technologies, USA). The injector used was in split mode (1:10) at
523 K. The capillary column used was a HP-5MS (30 m × 250 μmi.d., 0.25 μm phase thickness, Agilent Technologies, USA), coated
with 5% phenyl methyl silane. The oven temperature started at
333 K, raised to 523 K at 20 K min−1, then held for 2 min. Car-
rier gas was helium with a flow rate of 1 mL min−1. The FID detec-
tor was maintained at 523 K. The quantification of the
components was achieved using the respective calibration curve,
using concentrations of 10, 5, 2.5, 1.25, 0.625, 0.312 and
0.152 mg mL−1 of each terpene dissolved in the receptor buffer
solution and isolated as above described for the samples.
In the case of vanillin and tonalide, which have higher boiling
points, the analysis was carried out by HPLC/UV. An Agilent Tech-
nologies 1200 Series with an Agilent Zorbax Eclipse XDB-C18
Figure 1 Fragrance chemical structures studied
© 2021 Society of Cosmetic Scientists and the Societe Francaise de Cosmetologie 227
International Journal of Cosmetic Science, 43, 225–234
Permeability coefficients and vapour pressure ALMEIDA et al.

(5 μm, 150 × 4,6 mm) column was used. The analysis methodol-
ogy was the same as used by [38]. The UV wavelengths used were
231 and 252 nm, for the vanillin and tonalide, respectively. The
mobile phase consisted of two solvents with a flow rate of
1 mL min−1: (A) water: acetic acid (98: 2), (B) methanol: acetic
acid (98: 2). The flow starts at 40% of solvent A and decreases
constantly to 0% in 5 min when it increases until 40% in the next
5 min. The ratio 40% of Solvent A and 60% of Solvent B is then
kept constant for 5 min. Each run lasted 15 min [38]. To quantify
the samples, calibration curves were made using the ≥98% stan-
dards.
Vapour pressure
The vapour pressure of each compound was experimentally deter-
mined by thermogravimetry with differential thermal analysis (TG-
DTA) using the TA Instruments STD Q600 equipment. For that,
10 mg of samples were placed in an alumina crucible with a cross-
sectional area of 0.28 cm2, with a heating rate of 10 K min−1, in
an atmosphere of nitrogen with a 50 mL min−1 flow and tempera-
ture ranging from 293 to 573 K. The Langmuir equation (Eq. 1)
relates the vapour pressure, at a given temperature, to the mass
loss rate [26]. The constant k was determined per calibration with
a well-known compound (E-caryophyllene) following the same
methodology.
Pexpsat ¼ k
T
MW
� �12 dm
dt
� �" #(1)
where, Pexpsat is the experimental TG-DTA vapour pressure (Pa), T
is the temperature (K), MW is the molar weight (g mol-1) and dmdt is
the mass loss rate (g s−1).
The Antoine equation (Eq. 2) was used to model the obtained
vapour pressure curve.
ln Psat� �¼A� B
TþC(2)
where Psat is the vapour pressure (Pa), T is the temperature (K), A,
B and C are adjustable parameters. These three parameters are
highly correlated, and they are not physically significant, despite
the good model adherence. In this way, several different models
were proposed for a better property description. Clarke and Glew
[34] have proposed a model based on the evaluation of thermody-
namic functions from equilibrium constants, initially presented for
chemical reactions but lately expanded for pure compounds [39]
describing the equilibrium between the two phases. The most sig-
nificant model improvement is the parameters physical representa-
tion; dG0θ is the Gibbs free energy of the phase change process, dH0
θ
is the enthalpy involved in the process and dC0p,θ is the specific heat
of the gas formed in the process, all at the reference temperature θwhich corresponds to a reference pressure P0, as presented by Eq.
3.
lnPsat
P0
� �¼�dG0
θ
θþdH0
θ
1
θ�1
T
� �þdC0
p,θ
θ
T�1þ ln
T
θ
� �� �(3)
Due to the nonlinearity of the models used to describe this prop-
erty, there are few works that assess the statistical significance of
the estimated parameters, which could be performed using a hybrid
estimation method. The particle swarm optimization method [40] is
used first to provide a set of initial guesses, which is used for fine-
tuning of model parameters with the help of a Gauss–Newton pro-
cedure [41].
Permeability coefficient and QSAR model
The diffusion process involving the skin – considered as a simple
membrane – occurs in accordance with Fick’s first law, which can
be described in terms of permeability (related to diffusivity) as
shown by Eq. 4.
J tð Þ¼Kp,i Ci,d tð Þ�Ci,r tð Þð Þ (4)
where Kp,i is the skin permeability coefficient (cm h−1) and Ci,d
and Ci,r are the component i concentrations in the donor and
receptor chambers (mg cm−3), respectively. The maximum flux at
which a material diffuses across the skin is theoretically achieved
when it is maintained as a saturated solution on the surface
(Ci,d≫Ci,r). The infinite dose condition leads to a constant mass flux
trough the membrane after a diffusion lag time [42].
The flux J (mg cm−2 h−1) is then calculated from the slope of
cumulative uptake of a substance through a unit of skin surface
area (Q in mg cm−2) as a function of time, once the maximum flux
is established (constant mass transfer rate) and a linear behaviour
is recorded. The permeability coefficient is then obtained from Eq.
5, which gives:
Kp,i ¼ J
Ci,d¼ Q
ΔtCi,d(5)
A finite dose model, which accounts quantitatively for depletion
of chemical due to skin uptake and its evaporation from the skin
surface was presented by and, among other properties, it requires
permeability coefficient data [29]. The experimental flux for each
substance is obtained from the in vitro skin permeation experiments
(Franz diffusion cell). From these experimental data, a quantitative
structure–activity relationship (QSAR) is proposed based on the sig-
nificant properties related to the absorption of fragrance com-
pounds into the skin. Guy [33] proposed a correlation in order to
predict the rate and extent of fragrance absorption, in which it is
also pointed out that chemicals with the highest values of steady-
state flux have the highest values of vapour pressure. Based on the
previous assumptions proposed by the RIFM [30] and Guy [33],
the molecular weight (MW) and the octanol–water partition coeffi-
cient were considered for this new proposal.
Results and discussion
Vapour pressure
The experimental vapour pressure of all the studied perfume raw
materials was determined by the TG-DTA technique. All the com-
pounds presented a zero-order kinetics, which can be attributed to
the evaporation. An example of nonzero-order kinetics is a thermal
dissociation process. Since sublimation and evaporation are zero-
order processes, the rate of mass loss of a sample due to vaporiza-
tion should be constant, providing that the free surface area does
not change. In this way, the absence of chemical decomposition
was evaluated in terms of its kinetics, as stated by different papers
before [25, 27, 43, 44]. The Langmuir equation (Eq. 1) relates the
vapour pressure at a given temperature to the rate of mass loss
from the thermogravimetric tests. The percentage mass loss and its
derivative (% K-1) are presented in Fig. 2. A calibration constant
228 © 2021 Society of Cosmetic Scientists and the Societe Francaise de Cosmetologie
International Journal of Cosmetic Science, 43, 225–234
Permeability coefficients and vapour pressure ALMEIDA et al.

was used for the specific method and equipment (k= 4.971 × 10⁴
Pa g−0.5 mol−0.5 s−1 K−0.5).
The Antoine vapour pressure curve for all the compounds were
built based on Eq. 2. Although the vapour pressure of several
PRMs is available in literature, most of the existing data belongs to
that of room temperatures (298.15 K) and the atmospheric pres-
sure. Eugenol and carvone were selected in order to compare the
obtained results with those reported in the literature (Fig. 3). The
Antoine constants were estimated (Table 2), along with its stan-
dard relative deviations.
The experimental and estimated values obtained from public
sources such as PubChem, ChemSpider and EpiSuite were all inves-
tigated. For these compounds, the experimental values presented
are mostly at room temperature (293.15 or 298.15 K). Estimated
values from correlations and predictive models are also available at
these sources, but as discussed by Almeida et al. [45], at low tem-
peratures the error of such models increases and should only be
used when no experimental data is available. At the NIST database,
a few Antoine constants are available at higher temperature ranges
(camphor, carvone, carvacrol, eugenol, menthol) and only α-pinenepresents Antoine constants for the same temperature range.
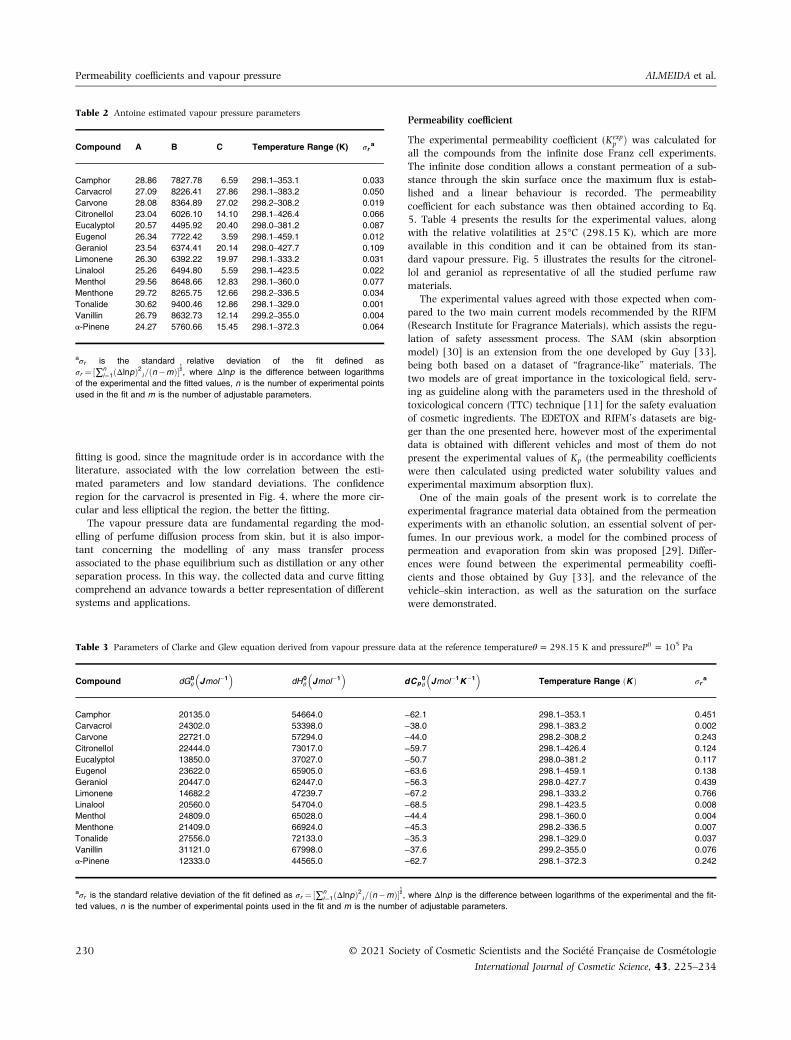
The resulting parameters of the Clarke and Glew equation (Eq.
3) along with the standard deviation of the fit, σr , are presented in
Table 3. Some of the compounds used in this study have similar
data reported in the literature [46–49]; however, the vapour pres-
sure experimental data ware obtained by different methods, or at
different temperature ranges. The most relevant estimated parame-
ter, the enthalpy of vaporization, of ten of the studied molecules is
available at the NIST database, although the reference temperature
is not the same (all of them are determined at higher tempera-
tures). This property is mostly used in the thermodynamic mod-
elling of separation processes, such as distillation, along with the
vapour pressure. In case of a more complex model for the diffusion
of perfume from the skin, including heat and mass transfer, the
enthalpy of vaporization is required.
The correlation coefficient obtained from the covariation matrix
for each pair of parameters results in 42 correlation coefficients in
the range of −0.7396 to 0.8751, for the set of 14 compounds. The
-2
-1
0
1
2
3
4
5
6
2 2.5 3 3.5 4
ln(P
Pa-
1 )
1000/(T K-1)
Eugenol
-2
-1
0
1
2
3
4
3 3.5 4
ln(P
Pa-
1 )
1000/(T K-1)
Carvone
Figure 3 Comparison between experimental and literature vapour pressures of eugenol and Carvone. Experimental data from this work (○); literature data for
eugenol (×) [43] and carvone (□) [44]
0
0.5
1
1.5
2
2.5
3
0
10
20
30
40
50
60
70
80
90
100
300 320 340 360 380 400 420 440
Deriv
a�ve
Wei
ght (
% K
-1)
Wei
ght (
%)
Temperature (K)
Mass loss
Deriva�ve
Figure 2 Geraniol TG-DTA analysis
© 2021 Society of Cosmetic Scientists and the Societe Francaise de Cosmetologie 229
International Journal of Cosmetic Science, 43, 225–234
Permeability coefficients and vapour pressure ALMEIDA et al.
fitting is good, since the magnitude order is in accordance with the
literature, associated with the low correlation between the esti-
mated parameters and low standard deviations. The confidence
region for the carvacrol is presented in Fig. 4, where the more cir-
cular and less elliptical the region, the better the fitting.
The vapour pressure data are fundamental regarding the mod-
elling of perfume diffusion process from skin, but it is also impor-
tant concerning the modelling of any mass transfer process
associated to the phase equilibrium such as distillation or any other
separation process. In this way, the collected data and curve fitting
comprehend an advance towards a better representation of different
systems and applications.
Permeability coefficient
The experimental permeability coefficient (Kexpp Þ was calculated for
all the compounds from the infinite dose Franz cell experiments.
The infinite dose condition allows a constant permeation of a sub-
stance through the skin surface once the maximum flux is estab-
lished and a linear behaviour is recorded. The permeability
coefficient for each substance was then obtained according to Eq.
5. Table 4 presents the results for the experimental values, along
with the relative volatilities at 25°C (298.15 K), which are more
available in this condition and it can be obtained from its stan-
dard vapour pressure. Fig. 5 illustrates the results for the citronel-
lol and geraniol as representative of all the studied perfume raw
materials.
The experimental values agreed with those expected when com-
pared to the two main current models recommended by the RIFM
(Research Institute for Fragrance Materials), which assists the regu-
lation of safety assessment process. The SAM (skin absorption
model) [30] is an extension from the one developed by Guy [33],
being both based on a dataset of “fragrance-like” materials. The
two models are of great importance in the toxicological field, serv-
ing as guideline along with the parameters used in the threshold of
toxicological concern (TTC) technique [11] for the safety evaluation
of cosmetic ingredients. The EDETOX and RIFM’s datasets are big-
ger than the one presented here, however most of the experimental
data is obtained with different vehicles and most of them do not
present the experimental values of Kp (the permeability coefficients
were then calculated using predicted water solubility values and
experimental maximum absorption flux).
One of the main goals of the present work is to correlate the
experimental fragrance material data obtained from the permeation
experiments with an ethanolic solution, an essential solvent of per-
fumes. In our previous work, a model for the combined process of
permeation and evaporation from skin was proposed [29]. Differ-
ences were found between the experimental permeability coeffi-
cients and those obtained by Guy [33], and the relevance of the
vehicle–skin interaction, as well as the saturation on the surface
were demonstrated.
Table 3 Parameters of Clarke and Glew equation derived from vapour pressure data at the reference temperatureθ = 298.15 K and pressureP0 = 105 Pa
Compound dG0θ Jmol�1� �
dH0θ Jmol�1� �
dCp0θ Jmol�1K�1� �
Temperature Range Kð Þ σra
Camphor 20135.0 54664.0 −62.1 298.1–353.1 0.451
Carvacrol 24302.0 53398.0 −38.0 298.1–383.2 0.002
Carvone 22721.0 57294.0 −44.0 298.2–308.2 0.243
Citronellol 22444.0 73017.0 −59.7 298.1–426.4 0.124
Eucalyptol 13850.0 37027.0 −50.7 298.0–381.2 0.117
Eugenol 23622.0 65905.0 −63.6 298.1–459.1 0.138
Geraniol 20447.0 62447.0 −56.3 298.0–427.7 0.439
Limonene 14682.2 47239.7 −67.2 298.1–333.2 0.766
Linalool 20560.0 54704.0 −68.5 298.1–423.5 0.008
Menthol 24809.0 65028.0 −44.4 298.1–360.0 0.004
Menthone 21409.0 66924.0 −45.3 298.2–336.5 0.007
Tonalide 27556.0 72133.0 −35.3 298.1–329.0 0.037
Vanillin 31121.0 67998.0 −37.6 299.2–355.0 0.076
α-Pinene 12333.0 44565.0 −62.7 298.1–372.3 0.242
aσr is the standard relative deviation of the fit defined as σr ¼ ½∑ni¼1ðΔlnpÞ2 i=ðn�mÞ�
12, where Δlnp is the difference between logarithms of the experimental and the fit-
ted values, n is the number of experimental points used in the fit and m is the number of adjustable parameters.
Table 2 Antoine estimated vapour pressure parameters
Compound A B C Temperature Range (K) σra
Camphor 28.86 7827.78 6.59 298.1–353.1 0.033
Carvacrol 27.09 8226.41 27.86 298.1–383.2 0.050
Carvone 28.08 8364.89 27.02 298.2–308.2 0.019
Citronellol 23.04 6026.10 14.10 298.1–426.4 0.066
Eucalyptol 20.57 4495.92 20.40 298.0–381.2 0.087
Eugenol 26.34 7722.42 3.59 298.1–459.1 0.012
Geraniol 23.54 6374.41 20.14 298.0–427.7 0.109
Limonene 26.30 6392.22 19.97 298.1–333.2 0.031
Linalool 25.26 6494.80 5.59 298.1–423.5 0.022
Menthol 29.56 8648.66 12.83 298.1–360.0 0.077
Menthone 29.72 8265.75 12.66 298.2–336.5 0.034
Tonalide 30.62 9400.46 12.86 298.1–329.0 0.001
Vanillin 26.79 8632.73 12.14 299.2–355.0 0.004
α-Pinene 24.27 5760.66 15.45 298.1–372.3 0.064
aσr is the standard relative deviation of the fit defined as
σr ¼ ½∑ni¼1ðΔlnpÞ2 i=ðn�mÞ�
12, where Δlnp is the difference between logarithms
of the experimental and the fitted values, n is the number of experimental points
used in the fit and m is the number of adjustable parameters.
230 © 2021 Society of Cosmetic Scientists and the Societe Francaise de Cosmetologie
International Journal of Cosmetic Science, 43, 225–234
Permeability coefficients and vapour pressure ALMEIDA et al.

Figure 4 Confidence regions for the Clarke and Glew fitted parameters for the carvacrol vapour pressure data at the reference temperature θ = 298.15 K and
pressure P0 = 105 Pa
Table 4 Experimental and correlated skin permeability coefficients of the studied fragrance materials
Compound MW (g mol−1)a α. 10a logKowc K expp .102 (cm h−1) logK exp
p logK calcp
d
Camphor 152.23 12.14 2.38 1.0027 −1.999 −1.827Carvacrol 150.22 3.91 3.49 5.3023 −1.276 −1.504Carvone 154.22 17.32 2.71 1.6062 −1.794 −1.733Citronellol 156.27 7.43 3.91 2.3467 −1.630 −1.387Eucalyptol 154.25 319.85 2.74 1.9617 −1.707 −1.715Eugenol 164.2 3.80 2.27 2.5244 −1.598 −1.869Geraniol 154.25 5.06 3.56 4.4223 −1.354 −1.487d-Limonene 136.23 242.73 4.57 8.0363 −1.095 −1.172Linalool 154.25 26.93 2.97 0.9671 −2.015 −1.657Menthol 156.27 10.73 3.2 3.7304 −1.428 −1.592Menthone 154.25 0.467 3.05 2.1702 −1.664 −1.635Tonalide 258.41 0.059 5.7 11.0262 −0.958 −0.950Vanillin 152.15 0.072 1.21 0.6866 −2.163 −2.167α-Pinene 136.23 800.20 4.83 8.0641 −1.093 −1.080
aFrom EPI Suite Database.bRelative volatility determined from vapour pressure values from EPI Suite Database, at 25°C.cExperimental values of log Kow from EPI Suite Database.dFrom the correlation proposed in this work.
© 2021 Society of Cosmetic Scientists and the Societe Francaise de Cosmetologie 231
International Journal of Cosmetic Science, 43, 225–234
Permeability coefficients and vapour pressure ALMEIDA et al.

In this way, a new correlation (Eq. 6), for the use only when
ethanol is present as vehicle and inside the specific ranges of logkow(1.21–5.70) and MWi (136.2–258.4 g mol−1), is proposed based
on the experimental permeability coefficients obtained in this work:
logKp ¼�2:383þ0:294logkow�0:00094MWi (6)
The presented correlation has a standard relative deviation (σrÞof 0.190, a standard error (SE) of 0.397 and a determination coeffi-
cient (R2) of 0.7786 (Fig. 6). The two previous models, Guy (SE =0.712, R2 = 0.578) and SAM (SE = 0.594, R2 = 0.703), pre-
sented slightly worse results although based on a larger dataset.
In order to validate the proposed correlation, three compounds
from the RIFM and EDETOX database were selected (coumarin, iso-
eugenol and musk ketone). Comparing the values obtained through
SAM and the correlation proposed in this work, the permeability
coefficient differences vary from 2% to 11%. It is important to note
that for the same compound under different experimental condi-
tions, different values are found in the literature. For this reason,
the application of experimental values (whenever possible) or the
use of a correlation that best suits the studied system is highly rec-
ommended [30]. The reader is cautioned that the experimental Kp
values in this report or those predicted by Eq. 6 must not be used
as a substitute for aqueous Kp values when conducting risk assess-
ments according to the method of Guy [32] or Shen et al. [33].
They will not yield comparable results.
The results suggest that the proposed correlation is a comple-
mentary tool in the assessment of permeability coefficients specifi-
cally for the design of fragrance systems. The present work does
not intend to replace the SAM model, which is mainly developed
for toxicological purposes, instead it was designed to assist during
pre-formulation stages of scented products using ethanol as vehicle.
The QSAR model meets the principles for validation (according to
the OECD) and has a defined endpoint, an unambiguous algorithm,
and a well-defined domain of applicability (perfumes). It has also
appropriate measures of goodness-of-fit and a mechanistic interpre-
tation. The dataset used for the SAM correlation has 131 com-
pounds (54 fragrance materials and 72 “fragrance-like” materials),
27 of which had an experimentally determined Kp on different sol-
vents (ethanol/water solution, PEG, acetone). Most of the RIFM
database consists of toxicological experiments in which the main
goal is to determine the amount absorbed from the applied dose
(permeability coefficient is not determined). The experimental data
and the correlation presented in this work are a first step towards
achieving a more specific range of applicability and thus becoming
Figure 5 Citronellol and geraniol cumulative amount absorbed at the receptor compartment for the infinite dose experiment. Experimental data (○) and con-
tinuous line representing the constant mass rate (maximum flux)
Figure 6 The correlation of experimental values vs estimated values of log Kp
232 © 2021 Society of Cosmetic Scientists and the Societe Francaise de Cosmetologie
International Journal of Cosmetic Science, 43, 225–234
Permeability coefficients and vapour pressure ALMEIDA et al.

available for predictions of perfume raw materials when in ethanol
solution.
Conclusions
In this work, a range of fragrance chemicals had its vapour pres-
sure and permeability coefficients determined. The permeability
coefficients were assessed by Franz diffusion cell experiments, mea-
suring the steady-state flux through the skin and using a simple
mathematical model based upon Fick’s first law of diffusion. Low
vapour pressures were evaluated by thermogravimetric analysis
and a modified Langmuir equation. The dataset is still small com-
pared to larger and more general QSAR models; however, it is
much more specific as to the type of solvent and class of materials
studied. The QSAR model proposed presented good fitting to the
experimental data and lower errors (SE = 0.397 and R2 = 0.7786)
than more general models (Guy correlation and Skin Absorption
Model).
Acknowledgements
The present work was carried out with the support of CNPq,
National Council of Scientific and Technological Development and
CAPES, Coordination of Superior Level Staff Improvement. The
authors contributed equally to the manuscript and report no Con-
flicts of Interest.
References
1. Costa P, Velasco CV, Loureiro JM, Rodrigues
AE. Effect of cosmetic matrices on the
release and odour profiles of the supercritical
CO2 extract of Origanum majorana L. Int. J.
Cosmet. Sci. 2015;38:364–74.2. Kasting GB, Miller MA. Kinetics of finite
dose absorption through skin 2: Volatile
compounds. J. Pharm. Sci. 2006;95:268–80.3. Chen J, Jiang QD, Chai YP, et al. Natural
terpenes as penetration enhancers for trans-
dermal drug delivery. Molecules.
2016;21:1709–20.4. Pandit J, Aqil M, Sultana Y. Terpenes and
essential oils as skin penetration enhancers.
In: (Dragicevic N, Maibach HI editor). Percu-
taneous penetration enhancers chemical meth-
ods in penetration enhancement. Berlin,
Heidelberg: Springer-Verlag; 2015. p.
173–93.5. Schmitt S, Schaefer U, Doebler L, Reichling
J. Cooperative Interaction of Monoterpenes
and Phenylpropanoids on the in vitro
human skin permeation of complex com-
posed essential oils. Planta Med.
2009;75:1381–5.6. Vaddi HK, Ho PC, Chan SY. Terpenes in
propylene glycol as skin-penetration enhan-
cers: Permeation and partition of haloperi-
dol, fourier transform infrared spectroscopy,
and differential scanning calorimetry. J.
Pharm. Sci. 2002;91:1639–51.7. Lalko J, Brain K, Green D, Api AM. In vitro
human skin penetration of the fragrance
material linalool in vitro human skin pene-
tration of the fragrance material linalool.
Toxicologist. 2008;102:309–12.8. Cal K, Janicki S, Sznitowska M. In vitro stud-
ies on penetration of terpenes from matrix-
type transdermal systems through human
skin. Int. J. Pharm. 2001;224:81–8.9. Bickers DR, Calow P, Greim HA, et al. The
safety assessment of fragrance materials.
Regul. Toxicol. Pharmacol. 2003;37:218–73.
10. Frasch HF. Dermal absorption of finite doses
of volatile compounds. J. Pharm. Sci.
2012;101:2616–9.11. Kroes R, Renwick AG, Feron V, et al. Appli-
cation of the threshold of toxicological con-
cern (TTC) to the safety evaluation of
cosmetic ingredients. Food Chem. Toxicol.
2007;45:2533–62.12. Potts RO, Guy RH. Predicting skin perme-
ability. Pharm. Res. 1992;9:663–9.13. Russell LM, Guy RH. Measurement and pre-
diction of the rate and extent of drug deliv-
ery into and through the skin. Expert Opin.
Drug Deliv. 2009;6:355–69.14. Gregoire S, Ribaud C, Benech F, et al. Pre-
diction of chemical absorption into and
through the skin from cosmetic and derma-
tological formulations. Br. J. Dermatol.
2009;160:80–91.15. Lian G, Chen L, Han L. An evaluation of
mathematical models for predicting skin
permeability. J. Pharm. Sci.
2008;97:584–98.16. Geinoz S, Guy RH, Testa B, Carrupt PA.
Quantitative structure-permeation relation-
ships (QSPeRs) to predict skin permeation: a
critical evaluation. Pharm. Res.
2004;21:83–92.17. Riviere JE, Brooks JD. Predicting skin perme-
ability from complex chemical mixtures:
dependency of quantitative structure perme-
ation relationships on biology of skin model
used. Toxicol. Sci. 2011;119:224–32.18. Bartosova L, Bajgar J. Transdermal drug
delivery in vitro using diffusion cells. Curr.
Med. Chem. 2012;19:4671–7.19. Chen L, Lian G, Han L. Modeling transder-
mal permeation. Part I. Predicting skin per-
meability of both hydrophobic and
hydrophilic solutes. AIChE J.
2009;56:1136–46.20. Mitragotri S, Anissimov YG, Bunge AL,
et al. Mathematical models of skin
permeability: An overview. Int. J. Pharm.
2011;418:115–29.21. Saiyasombati P, Kasting GB. Two-stage
kinetic analysis of fragrance evaporation
and absorption from skin. Int. J. Cosmet. Sci.
2003;25:235–43.22. Poling BE, Prausnitz JM, Oconnell JP. The
properties of gases and liquids, 5th edn. New
York: McGraw-Hill; 2001.
23. Gerber RP, Soares RP. Prediction of infinite-
dilution activity coefficients using UNIFAC
and COSMO-SAC variants. Ind. Eng. Chem.
Res. 2010;49:7488–96.24. Li P, Ma PS, Yi SZ, et al. A new Correspond-
ing-States Group-Contribution method
(CSGC) for estimating vapor pressures of
pure compounds. Fluid Phase Equilib.
1994;101:101–19.25. Phang P, Dollimore D, Evans SJ. A compar-
ative method for developing vapor pressure
curves based on evaporation data obtained
from a simultaneous TG–DTA unit. Ther-
mochim. Acta. 2002;392:119–25.26. Price DM. Vapor pressure determination by
thermogravimetry. Thermochim. Acta.
2001;367:253–62.27. Hazra A, Dollimore D, Alexander K. Ther-
mal analysis of the evaporation of com-
pounds used in aromatherapy using
thermogravimetry. Thermochim. Acta.
2002;392:221–9.28. de Oliveira CEL, Cremasco MA. Determina-
tion of the vapor pressure of Lippia gracilis
Schum essential oil by thermogravimetric
analysis. Thermochim. Acta. 2014;577:1–4.29. Almeida RN, Costa P, Pereira J, et al. Evapo-
ration and permeation of fragrance applied
to the skin. Ind. Eng. Chem. Res.
2019;58:9644–50.30. Shen J, Kromidas L, Schultz T, Bhatia S. An
in silico skin absorption model for fragrance
materials. Food. Chem. Toxicol.
2014;74:164–76.
© 2021 Society of Cosmetic Scientists and the Societe Francaise de Cosmetologie 233
International Journal of Cosmetic Science, 43, 225–234
Permeability coefficients and vapour pressure ALMEIDA et al.
31. EDETOX. Available at: https://research.nc
l.ac.uk/edetox/
32. Brain KR, Walters KA, Green DM, et al. Per-
cutaneous penetration of diethanolamine
through human skin in vitro: application
from cosmetic vehicles. Food Chem. Toxicol.
2005;43:681–90.33. Guy RH. Predicting the rate and extent of
fragrance chemical absorption into and
through the skin. Chem. Res. Toxicol.
2010;23:864–70.34. Clarke ECW, Glew DN. Evaluation of ther-
modynamic functions from equilibrium con-
stants. Trans. Faraday Soc.
1966;62:539–47.35. Frasch HF, Bunge AL. The transient dermal
exposure II: post-exposure absorption and
evaporation of volatile compounds. J.
Pharm. Sci. 2015;104:1499–507.36. Kligman AM, Christophers E. Preparation of
isolated sheets of human stratum corneum.
Arch. Dermatol. 1963;88:702–5.37. Zhang K, Abraham MH, Liu X. An equa-
tion for the prediction of human skin per-
meability of neutral molecules, ions and
ionic species. Int. J. Pharm.
2017;521:259–66.38. Waliszewski KN, Pardio VT, Ovando SL. A
simple and rapid HPLC technique for vanil-
lin determination in alcohol extract. Food
Chem. 2007;101:1059–62.39. de Kruif CG, Blok JG. The vapour pressure
of benzoic acid. J. Chem. Thermodyn.
1982;14:201–6.40. Kennedy J, Eberhart R.Particle swarm opti-
mization. In: Proceedings of ICNN’95-Inter-
national Conference on Neural Networks.
IEEE 1942–1948 1995.
41. Prata DM, Pinto JC, Lima EL. Comparative
analysis of robust estimators on nonlinear
dynamic data reconciliation. Comput. Aided
Chem. Eng. 2008;25:501–6.42. Hansen S, Lehr CM, Schaefer UF. Improved
input parameters for diffusion models of skin
absorption. Adv. Drug. Deliv. Rev.
2013;65:251–64.43. Chatterjee K, Hazra A, Dollimore D, Alexan-
der KS. Estimating vapor pressure curves by
thermogravimetry: a rapid and convenient
method for characterization of
pharmaceuticals. Eur. J. Pharm. Biopharm.
2002;54:171–80.44. Phang P, Dollimore D. The calculation of
the vapor pressures of antioxidants over a
range of temperatures using thermo-
gravimetry. Thermochim. Acta.
2001;367–368:263–71.45. Almeida RN, Soares RDP, Cassel E. Fraction-
ation process of essential oils by batch distil-
lation. Brazilian J. Chem. Eng.
2018;35:1129–40.46. Stejfa V, Fulem M, Ruzicka K, Cervinka C.
Thermodynamic study of selected monoter-
penes III. J. Chem. Thermodyn.
2014;79:280–9.47. Stejfa V, Fulem M, Ruzicka K. Thermody-
namic study of selected monoterpenes IV. J.
Chem. Thermodyn. 2020;144:106013.
48. Stejfa V, Dergal F, Mokbel I, et al. Vapor
pressures and thermophysical properties of
selected monoterpenoids. Fluid Phase Equilib.
2015;406:124–33.49. Stejfa V, Fulem M, Ruzicka K, et al. Ther-
modynamic study of selected monoterpenes.
J. Chem. Thermodyn. 2013;60:117–25.
234 © 2021 Society of Cosmetic Scientists and the Societe Francaise de Cosmetologie
International Journal of Cosmetic Science, 43, 225–234
Permeability coefficients and vapour pressure ALMEIDA et al.
Top Related
Copyright © 2022 FDOKUMEN

