


Bahasa
Halaman
Hukum

Page 1 of 8
Pearland Economic Development Corporation Retail Analysis and Recruitment Plan Request for Proposals
December 19, 2019
I. General Description of Project
The Pearland Economic Development Corporation (PEDC) is issuing this Request for Proposals (RFP) to identify qualified consulting teams specializing in community retail analysis and retailer recruitment strategies for the preparation of an in-depth Retail Analysis and Recruitment Plan for the City of Pearland. PEDC seeks a consultant firm that has specific experience in the preparation and implementation of community-centric Retail Analysis, measuring the retail market and its sales, competition, leakage, gaps, and consumer preferences. It is expected that the selected consultant will prepare an original report detailing specific retail recruitment and relevant community development goals, strategies and implementation measures based on the analysis performed. PEDC desires the Retail Analysis to also contain a Recruitment Plan, outlining top priority projects, their timing, and anticipated cost and funding source of each Implementation Action. The selected consultant firm will be one that has demonstrated experience in preparing city-wide retail market analysis and recruitment plans. Land development knowledge and experience is a plus. This RFP was prepared to solicit responses from consulting firms that desire to be considered for this detail-oriented project.
II. Background
PEDC is a non-profit Type B Corporation under the Texas Development Corporation Act and is primarily funded by a half-cent sales tax in the City of Pearland. Established in 1995 by the voters of the city, PEDC is the lead economic development group for the City of Pearland, focusing on business attraction, retention and marketing, along with transportation, mobility and infrastructure and corridors and beautification. Following is a snapshot summary of information about the City. Additional information can be found on the City’s website, the PEDC website, and the community’s overall 20/20 Strategic Plan website.
A. Geography: The City is approximately 48 square miles in size serving an additional ETJ of 26 miles. The City is immediately south of Houston, approximately 20 minutes from downtown Houston, 40 minutes north of Galveston Island, and 30 minutes west of the tourist spots of NASA’s Johnson Space Center and the Kemah Boardwalk.
B. Population: The City of Pearland's most current population estimate, as of January 2019 is 127,500 residents, and represents a 34% increase from the 2010 Census. Pearland is the third most populous city in the 10-county region.
C. Build‐out: The city and its ETJ are expected to have a 225,000 build‐out population with 81,818 residential units by 2042i. The current City limits will reach a build-out population in a range from 185,000 to 195,000 persons by 2030.
Page 2 of 8
D. Demographics: The City has an educated, affluent, diverse and fairly young citizenry. Fifty-twopercent of the residents 25 years and older have obtained a bachelor’s degreeii. According to the2016 U.S. Census estimates, Pearland's median income is $105,806, making it one of the highestincome communities in the Houston region and over 75% higher than the national average. Theaverage home sale price is approximately $270,000 as of November 2019iii. See Appendix A –Select Demographics and Economic Indicators for more detailed information.
E. Labor Force and Economic Base: Since 2005, Pearland’s estimated labor force grew from justover 31,302 to 62,401 in 2018. The job growth that occurred in Pearland from 2005-2018primarily occurred in sectors that follow population growth such as retail, food service,education, and health careiv. Overall retail occupancy in Pearland has topped 90% every yearsince 2007. See Appendix A for more detailed information.
F. Commercial Corridors: The City is fortunate to have several major transportation corridorstraversing the City where significant economic activity takes place. Pearland has strategicpriorities focused on the following key corridors:
i. S.H. 288: State Highway 288 is an existing 6‐lane, median‐separated highway traversing theCity from the north to the south on the western side of Pearland. S.H. 288 is the primarytransportation corridor connecting the Houston region to the Port of Freeport. Majorbeautification improvements are being carried out in tandem with TxDOT's road wideningand toll lane development. Much of this activity is summarized in PEDC's 2018 AnnualReport.
ii. Broadway Street: Broadway Street, a portion of F.M. 518, is currently a 5‐lane roadwaywith some areas of median and turn lanes along a portion of its length. This roadwaytraverses the City from east to west and is currently the primary retail corridor in the City.TxDOT is currently conducting an environmental assessment of the road for widening toseven lanes with construction expected to begin in 2023 on the segment of road from S.H.288 to Cullen Parkway. TxDOT is also designing for widening east of Cullen Parkway toS.H. 35; however, the eastern segment has not yet received funding.
iii. Main Street: Main Street, a portion of S.H. 35, traverses the City from north to southalong the mid-eastern portion of the City. This roadway connects Beltway 8 in Houstondown to S.H. 6 in Alvin, and continues further south along the coastline to Port Aransas.PEDC has invested significant resources in this corridor as part of the City’s overallbeautification strategy, the S.H. 35 Redevelopment Strategy, and the Pearland 20/20strategy. PEDC has planted decorative trees, bushes and vines, improved intersections,developed community monuments, improved commercial roadways - developing areas forpotential business park usage. Main Street is adjacent to the City’s Old Townsite, thehistoric core of the City.
G. Planning Documents: The City has a history of closely following adopted planning documentsand references plan priorities in all project updates to the City Council and PEDC Board. TheCity and PEDC are in the process of updating Pearland’s Strategic Plan, as well as implementingthe S.H. 35 Redevelopment Strategy and the Beautification Strategy: 288 Corridor MasterImprovements Plan. A Broadway Corridor Development Plan for the City’s major retailthoroughfare is currently under development.
H. Beautification: The City and PEDC are committed to enhancing the look and feel of thecommunity, investing significant resources into multiple projects across the City. Most majorentryways have been constructed with Pearland monuments, landscaping and hardscaping. Moreimprovements are planned over the next two to three years.
Page 3 of 8
III. Proposed Project Schedule
Activity Anticipated Date RFP issued: Thursday, December 19, 2019 Deadline for Proposal submission: Friday, January 31, 2020 Consultants Selected for in person or phone interviews: Thursday, February 6, 2020 Interviews conducted: February 11 – 14, 2020 Consultant agreement considered by Corporation: February 27, 2020
IV. Scope of Services
The Consultant’s overall responsibility and scope of work is to prepare an original Retail Analysis and Recruitment Plan containing useful community data, actionable goals, reasonable objectives and implementation measures. The Consultant will also provide meeting facilitation services during the data gathering process as necessary. The Consultant shall provide professional services to support the following tasks: 1. Review and analyze Pearland’s existing overall retail market and its primary submarkets.
Pearland has approximately four sub-areas within it that are very different from one another, with each having their own assets and challenges. They will require different strategies, and attract varying types of retailers. Identify their competitive position, sales tax revenue and other key retail data, such as retail square footage and revenue by square foot by category. Prepare key retail trends and forecasts, social factors, economic factors and financial indicators for inclusion into retail recruitment materials. The four submarkets are: a. Broadway and S.H. 288 Submarket (including Pearland Town Center) - Broadway and
State Highway 288 is a regional shopping destination for the southern Houston metropolitan area. (Google Aerial) In the last 20 years the corridor has transformed from a rural area to the commercial center of our growing community, including over 2.3M square-feet of retail space, office buildings, two hospitals and high quality residential development. The anchor of the regional mall destination area is the “lifestyle center” Pearland Town Center at the southwest corner of the interchange. In addition, the other three corners of the interchange include: Academy, Hobby Lobby, JCPenney, Best Buy, Home Depot, Wal-Mart, Kohl’s, Super Target, Sam’s and Costco. Pearland Town Center opened in 2008 and was developed, owned and is managed by CBL & Associates. The center provides retail, residential, office and hotel space within the 937,000 sq. ft. open-air location. Office space totals 50,000 square feet on the second floor above the retail shops. A 110-room, four-story Courtyard by Marriott hotel is located above the center’s retail shops near Macy’s. Retail tenants include anchor stores Macy’s, Dillards, Barnes and Noble and Dick’s Sporting Goods, along with other nationally-known retailers. For a complete store directory, visit http://www.pearlandtowncenter.com/directory. Pearland Town Center also includes multi-family residential space above the stores, a 25-acre lake and adjacent walking paths and parks.
b. Entertainment District at Lower Kirby at Beltway 8 and S.H. 288 - The Lower Kirby
District is a 1,200-acre mixed-use development in northwest Pearland, fronting South Beltway 8 and State Highway 288. The master plan for the District includes urban residential, office, retail, technology/research campus and light manufacturing all linked by landscaped boulevards with walking trails and parks. At the southeast corner of the beltway and State Highway 288 is a site that is a 150,000 square foot Bass Pro Shops (Google Aerial) that the community is interested in better understanding the feasibility and possible tenant
Page 4 of 8
mix for it to serve as an anchor for a mixed use entertainment district with a full service hotel and conference center.
c. Old Town area at Broadway and Main – From Rice Drier to Walnut (Google Aerial)The City and PEDC want to position key parcels for investment and explore what retailersmight have an interest in investing in the area. Old Town needs a different niche as it is hardfor it to compete with nearby Pearland Parkway and the strong retail area around S.H. 288.The S.H. 35 Redevelopment Strategy Catalysts 3 and 4 outlined goals to establish adestination with commercial venues unique to the area and its “gritty character” that providean environment to incubate local businesses and grow Old Town’s dining and shoppingofferings. Pearland is also working towards introducing pedestrian and streetscapeimprovements, balancing vehicular and non-vehicular movement, connecting existing andfuture centers of activity, and catalyzing property investment and reinvestment. Majorretailers include Wal-Mart Supercenter, Office Depot, Ace Hardware, and Big Lots. The areaalso has a Holiday Inn Express and Best Western.
d. Pearland Parkway and Broadway – Pearland Parkway from Barry Rose to Broadway(Google Aerial) This submarket is the newest to develop, and it has a few large parcels ofundeveloped land that would likely be a good fit for retail establishments, as it is near largeconcentrations of high-value residential developments, new housing developments on theeastern side of Barry Rose, and several multi-family housing units. City Hall and Universityof Houston Clear Lake Pearland Campus are also a few short minutes from this location.The City is currently adding and connecting major hike and bike trails and infrastructure tothe area, and Barry Rose is on schedule for widening. Major retailers include Lowe’s, H-E-B,Academy, Palais Royal, Hobby Lobby, as well as a large variety of commercial striprestaurants, including Pokeworks, IHOP, Chick-fil-A, Pei Wei, Salata, and more.
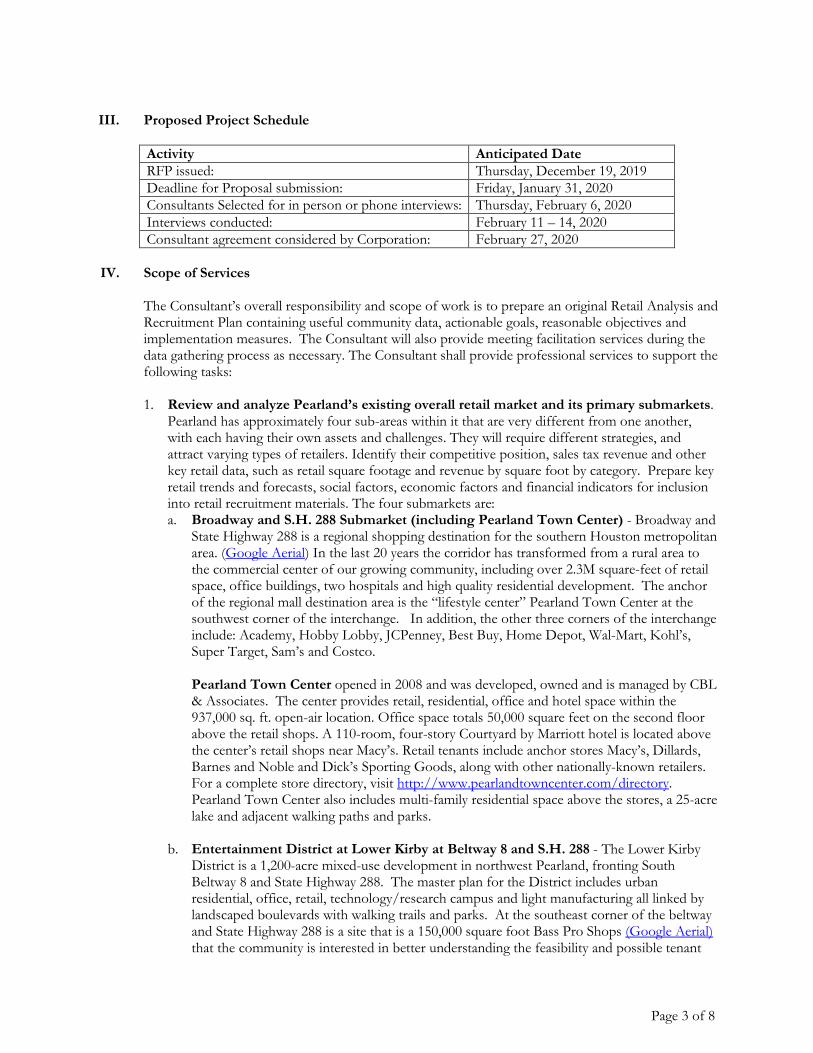
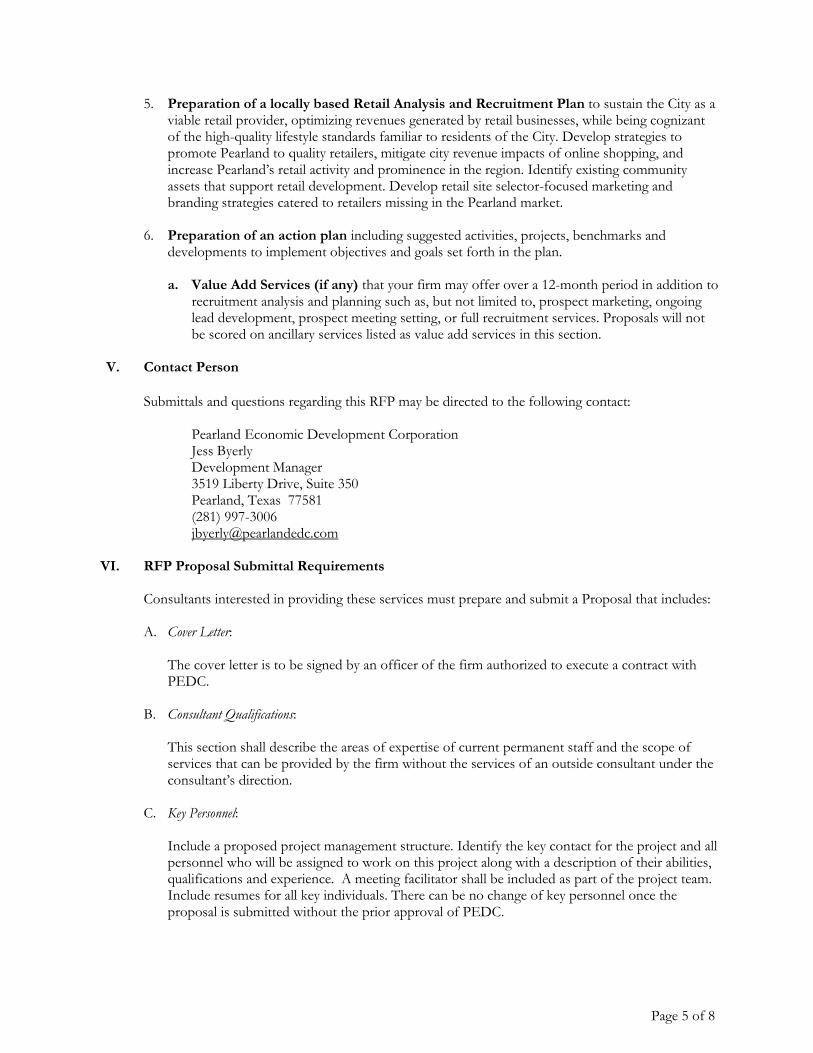
2. Identify appropriate and specific retailers that are viable long term and should beexpanded or attracted in the market/submarkets (target retail). Prepare material, maps andgraphs showing where and how Pearland retail is underserving the community (gaps), causingpotential consumers to leave thecommunity to shop (leakage), andwhere they are going instead (competing markets, including online).
3. Define a reasonable amount of retailthe City and its larger trade area cansupport by types, given future market,build out and demographic trends,consumer behavior and expectations aswell as competition. Estimate thepotential sales volume/tax revenue bysub-area and overall.
4. Conduct meetings with PEDC staff,retailers, developers, retail center owners and key community leaders to identify and prioritize projects and goals. In your proposal, please note the number of meetings included as part of the overall planning process.
Market Analysis
Sub-market
AnalysisGap
Analysis
Leakage Analysis
Competing Market Analysis
Trends & Metrics
Consumer Behavior
Recruiting Data & Tools
Page 5 of 8
5. Preparation of a locally based Retail Analysis and Recruitment Plan to sustain the City as a viable retail provider, optimizing revenues generated by retail businesses, while being cognizant of the high-quality lifestyle standards familiar to residents of the City. Develop strategies to promote Pearland to quality retailers, mitigate city revenue impacts of online shopping, and increase Pearland’s retail activity and prominence in the region. Identify existing community assets that support retail development. Develop retail site selector-focused marketing and branding strategies catered to retailers missing in the Pearland market.
6. Preparation of an action plan including suggested activities, projects, benchmarks and developments to implement objectives and goals set forth in the plan.
a. Value Add Services (if any) that your firm may offer over a 12-month period in addition to
recruitment analysis and planning such as, but not limited to, prospect marketing, ongoing lead development, prospect meeting setting, or full recruitment services. Proposals will not be scored on ancillary services listed as value add services in this section.
V. Contact Person
Submittals and questions regarding this RFP may be directed to the following contact:
Pearland Economic Development Corporation Jess Byerly Development Manager 3519 Liberty Drive, Suite 350 Pearland, Texas 77581 (281) 997-3006 [email protected]
VI. RFP Proposal Submittal Requirements
Consultants interested in providing these services must prepare and submit a Proposal that includes: A. Cover Letter:
The cover letter is to be signed by an officer of the firm authorized to execute a contract with PEDC.
B. Consultant Qualifications: This section shall describe the areas of expertise of current permanent staff and the scope of services that can be provided by the firm without the services of an outside consultant under the consultant’s direction.
C. Key Personnel: Include a proposed project management structure. Identify the key contact for the project and all personnel who will be assigned to work on this project along with a description of their abilities, qualifications and experience. A meeting facilitator shall be included as part of the project team. Include resumes for all key individuals. There can be no change of key personnel once the proposal is submitted without the prior approval of PEDC.
Page 6 of 8
D. Subcontractors: Identify any portion of the scope of work that will be subcontracted. Include firm qualifications (brief) and key personnel, telephone number and contact person for all subcontractors. PEDC reserves the right to approve or reject all consultants or internal staff performing consulting services, proposed by the consultant during or after the consultant review and selection process.
E. Project Workplan: A description of project understanding (brief), detailed work approach and methodology. The workplan should list specific tasks and any specific considerations, options or alternatives.
F. Project Schedule: Propose a timeline for completion of the Retail Analysis and Recruitment Plan including start date, milestones and target completion date. Any assumptions regarding turnaround time for City or PEDC staff review should be clearly noted.
G. Fee Information: Provide a detailed fee proposal by task for the services identified in the scope of services section IV of this RFP. Identify sub-tasks and the respective cost in your fee proposal as necessary. This section of your proposal shall include a professional fee schedule (hourly fee chart) for the consultant’s personnel and the subcontractor’s key personnel indentified above who would be working on this project. Hourly fees for additional or optional services that may be required shall also be included. Identify and itemize any reimbursable expenses for travel or other expenses associated with this project in your fee proposal. Unless specified in the submittals, the professional fee schedule shall include any costs associated with complying with the Corporation’s insurance requirements. Identify the fee that will be charged for additional public or Corporation meetings not identified in the scope of services provided here.
H. References: A list of projects completed by the proposer under which services similar to those required by this RFP were performed shall be listed in your proposal. An emphasis should be placed on projects undertaken within the past three years and those projects undertaken for public agencies located in similar sized communities. Include a brief description of the project, dates the services were provided, and contact information of references familiar with the services provided. The format below is preferred: Project Title: Date of Service: Client Scope of Work Deliverables Name Title City of … PH: EM:
Page 7 of 8
I. Work Samples: Provide brief descriptions of two projects dealing with retail recruitment, redevelopment, analysis or similar topics prepared by or under the direction of your firm. Include in your description the techniques utilized in the analysis process and the outcome of the planning process.
J. Interview: Proposers may be requested to be available for an interview with PEDC staff either via phone or in-person in Pearland as part of the Corporation’s final selection process. The lead members of the consulting team will be expected to attend any interviews scheduled with PEDC.
K. Deadline and Delivery: Proposals are due on January 31, 2020 at 5:00 pm CST. Interested parties must submit three (3) bound copies of their submittals that include all information in the format outlined in this RFP. In addition, an electronic copy of the statements of interest and qualifications saved in PDF format should also be provided on a flash drive. Hard copy submittals must be submitted in a sealed package/envelope labeled “Request for Proposals: Pearland Retail Analysis and Recruitment Plan”. Telefaxed or electronic versions not accompanied by hard copies of the submittals will not be accepted. Proposal submittals shall be delivered to the PEDC on or before: Date: January 31, 2020 Time: 5:00 pm CST To: Jess Byerly Development Director Pearland Economic Development Corporation 3519 Liberty Drive, Suite 350 Pearland, Texas 77581 Submittals should follow all instruction requirements listed in the documents. The PEDC assumes no responsibility for the delivery of mail or courier services and is not responsible for the failure of bids to be received by 5:00 pm CST on January 31, 2020. The receipt date and time are absolute. Failure to comply will automatically render any submission non-responsive. Submittals received after the deadline will not be accepted. It is neither the PEDC’s responsibility nor practice to acknowledge receipt of any submittal as a result of the Request for Qualifications process. It is the responder’s responsibility to assure that a submittal is received in a timely manner.
VII. Review Process and Evaluation Factors PEDC will review all proposals to determine compliance with the requirements as specified in the RFP. Consultant selection will be based upon a qualitative review of the Proposals submitted. PEDC staff may request additional clarifying information from any or all consultants that submit a Proposal during the review process. PEDC staff will evaluate the responses to this RFP, may interview the top rated consultants, and will make a recommendation to the Corporation’s Board of Directors on the selection of the consultant determined to be the most qualified for the project.
Only proposals which, in the opinion of PEDC, meet the requirements of the RFP will be further evaluated. Proposals that pass the preliminary review will be evaluated on how well the
Page 8 of 8
proposal meets the needs of PEDC as described in the Firm’s response to each requirement listed in the RFP. PEDC will review all written proposals that meet the minimum requirements and will select what it deems to be the top two to four proposals for further review. It is important that the responses be clear and complete so that PEDC can adequately understand all aspects of the proposals. After receipt of proposals, PEDC will use the following criteria in the selection process:
• Qualifications, key personnel and experience (20%)
• Fee Proposal (20%)
• Project work plan and schedule (20%)
• References and work samples (10%)
• Ability to meet requirements set forth in the RFP, as demonstrated by proposal response
(30%)
VIII. Award of the Contract
It is anticipated that the PEDC and the selected firm will enter into a professional services contractfor the time period beginning in April 2020 through project completion. Award of the contract shallbe made to the responsible offer or whose proposal is determined to be the best offer, taking intoconsideration the relative importance of price and other factors set forth in this request forproposals.
The contents of the proposal of the successful bidder will become, at our option, a contractualobligation if a contract ensues. Failure of the successful bidder to accept this obligation may result incancellation of the award.
Proposals submitted are offers only and the decision to accept or reject is a function of quality,reliability, capability, reputation, and expertise of the proposing consultant. PEDC reserves the rightto terminate the selection process at any time and to reject any or all proposals.
PEDC reserves the right to accept the Proposal that is, in its judgment, the best and most favorableto the interests of the PEDC; to reject the low price Proposal; to accept any item of any Proposal; toreject any and all Proposals; and to waive irregularities and informalities in any Proposal submitted orin the Request for Proposal process, provided; however, the waiver of any prior defect or informalityshall not be considered a waiver of any future or similar defect or informality. Proposing consultantshould not rely upon or anticipate such waivers in submitting their Proposal.
IX. Clarification of Proposal
We reserve the right to obtain clarification of any point in a vendor’s proposal or to obtain additionalinformation necessary to properly evaluate a particular proposal.
Endnotes
i Pearland Comprehensive Plan (2015) https://www.pearlandtx.gov/home/showdocument?id=8987 ii PEDC Website (2019) http://www.pearlandedc.com/Information-Center/Education.aspx iii Redfin (July 2019). Pearland Housing Market: House Prices and Trends https://www.redfin.com › city › Pearland › housing-market iv PEDC Website (2019) http://www.pearlandedc.com/Information-Center/Workforce-Data.aspx
For more information, contact the Pearland Economic Development Corporation • (281) 997-3000 • www.pearlandedc.com
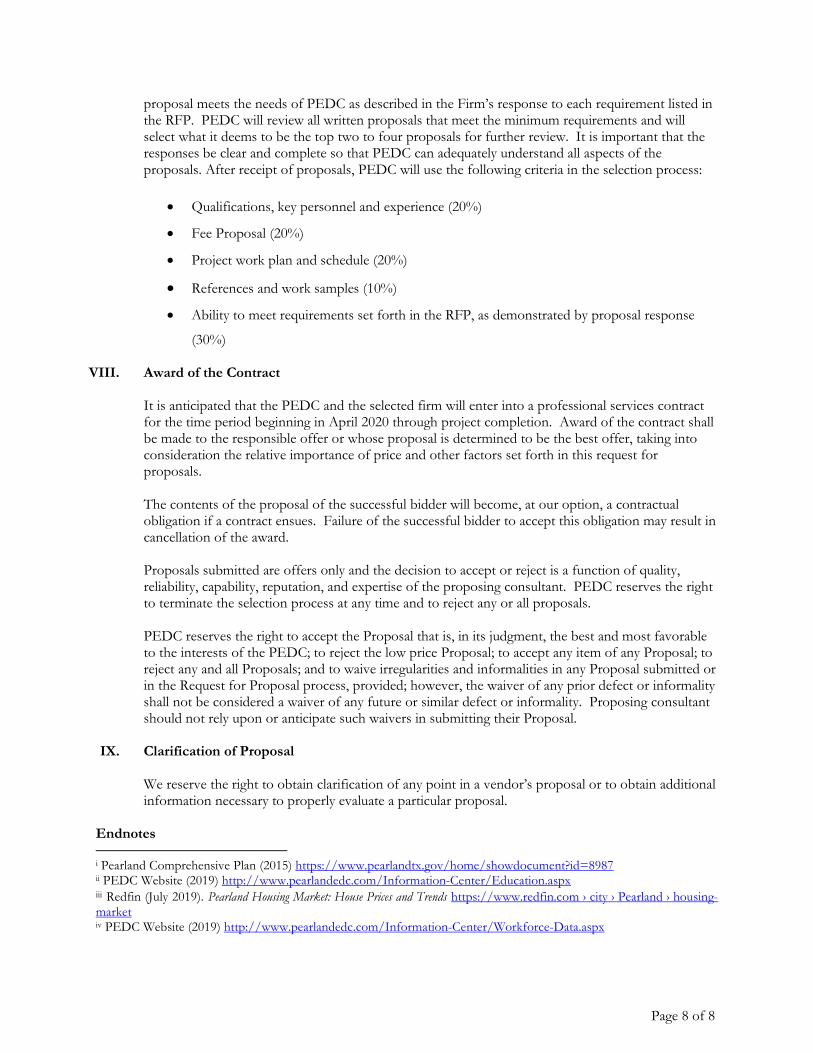
Retail Development Trends
96.1%
87.3%
92.8% 93.4%91.2% 90.5% 90.4%
92.9% 93.4%95.9% 97.1%
94.3% 95.1% 94.9%
$20.40
$21.24
$23.40 $23.28$22.92
$21.48 $21.36 $21.36$21.12 $21.24
$21.48
$22.08
$22.68$22.20
$16.00
$17.00
$18.00
$19.00
$20.00
$21.00
$22.00
$23.00
$24.00
2005 2006 2007 2008 2009 2010 2011 2012 2013 2014 2015 2016 2017 2018
Retail Occupancy and Rental Rates
Occupancy, % Annual Rent/SF, $
1.3 1.62.0
2.9 3.03.4 3.6 3.9
5.0
5.9 5.9 5.9 5.9 5.9 5.96.3 6.4 6.5 6.6 6.6
Pearland Retail Space Trend, Square Feet millions
First class shopping
can be found in the
6,641,643 square
feet of retail space in
Pearland (93 retail
buildings).
Overall retail
occupancy in
Pearland has topped 90% every year
since 2007. Rents have not totally
recovered since the 2008 recession;
however, they have increased steadily
since.
Sources: Enriched Data 1
APPENDIX A - SELECT DEMOGRAPHICS & ECONOMIC INDICATORS
For more information, contact the Pearland Economic Development Corporation • (281) 997-3000 • www.pearlandedc.com
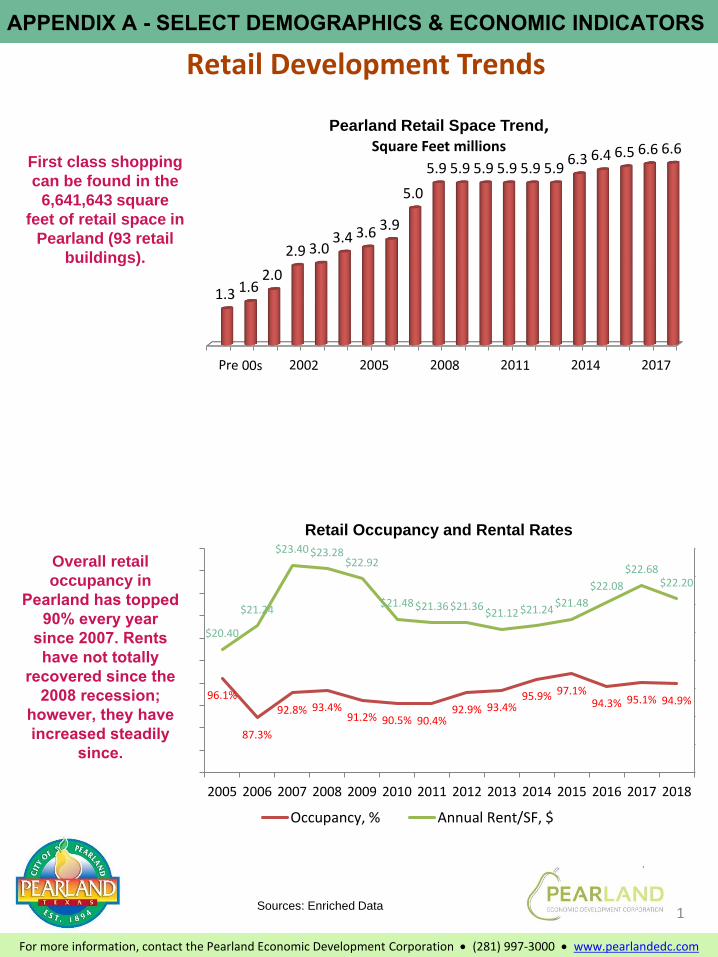
Retail Sales Tax Trends
Pearland’s taxable retail
sales have increased
considerably since 2002,
though growth slipped in
2010 and 2011.
From 2010 to 2017,
Pearland’s annual
taxable retail sales
increased by more than
$368 million. That
increase equates to an
annual average
compound growth rate of
6.4%.
200
2
200
3
200
4
200
5
200
6
200
7
200
8
200
9
201
0
201
1
201
2
201
3
201
4
201
5
201
6
201
7
$241$279
$305
$371
$465
$536
$667$699
$674$697
$764
$830$872
$962$999
$1,042
Pearland Taxable Retail Sales Trend
2002 to 2017, in $ millions
Pearland Retail Sales Trend – 2010 and 2018 in ($ 000s)
Sources: Texas Comptroller; Estimates Claritas 2018
CAGR is compound annual growth rate over the period 2010 to 2018
2
2010 2018 Change % Change CAGR
Motor Vehicle and Parts Dealers $49,430 $106,930 $57,500 116.33% 10.13%
Furniture and Home Furnishings Stores $26,103 $56,147 $30,044 115.10% 10.47%
Electronics and Appliance Stores $49,978 $77,131 $27,153 54.33% 5.57%
Building Material and Garden Equipment and Supplies Dealers $97,710 $300,626 $202,916 207.67% 15.07%
Food and Beverage Stores $246,758 $425,899 $179,141 72.60% 7.06%
Health and Personal Care Stores $78,323 $159,782 $81,459 104.00% 9.32%
Gasoline Stations $82,400 $124,533 $42,133 51.13% 5.30%
Clothing and Clothing Accessories Stores $67,086 $107,675 $40,589 60.50% 6.09%
Sporting Goods, Hobby, Book, and Music Stores $60,717 $108,475 $47,758 78.66% 7.52%
General Merchandise Stores $375,993 $433,138 $57,145 15.20% 1.78%
Miscellaneous Store Retailers $54,517 $110,977 $56,460 103.56% 9.29%
Nonstore Retailers $5,199 $5,916 $717 13.79% 1.63%
Food Services and Drinking Places $161,286 283358 $122,072 75.69% 7.30%
For more information, contact the Pearland Economic Development Corporation • (281) 997-3000 • www.pearlandedc.com
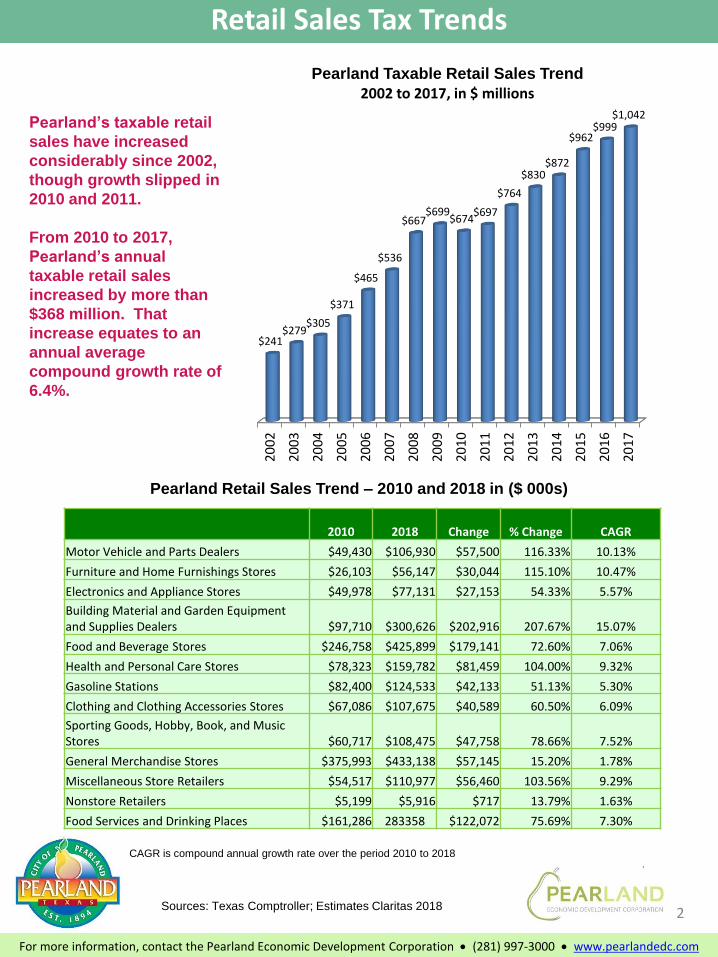
Retail Sales ComparisonTexas' 50 Largest City Retail Markets
Ranked By Average Annual Retail Sales Growth Rate 2012-2017
Pearland ranked 29th
in the state of Texas
among the top 50
retail markets in
average annual retail
sales growth from
2012 through 2017,
well in the top half of
all large markets.
Pearland increased
retail sales over $625
million from 2012
through 2017.
Average annual retail
sales growth for the
entire state of Texas
during this period was
1.0%.
Pearland is one of ten
cities (League City,
Missouri City, Katy,
Baytown, Houston,
Sugar Land, Baytown,
Conroe and
Pasadena) in the
Houston MSA that are
among the state’s top
50 retail markets.
Sources: Texas Comptroller3
Rank City
Avg. Annual Growth Rank City
Avg. Annual Growth
1 League City 21.08% 26 San Angelo 4.26%
2 Temple 20.37% 27 Arlington 4.21%
3 McKinney 18.50% 28 Sherman 4.11%
4 San Marcos 16.40% 29 Pearland 4.10%
5 Frisco 15.33% 30 Tyler 3.94%
6 Plano 12.41% 31 College Station 3.92%
7 Carrollton 12.27% 32 Lubbock 2.84%
8 Missouri City 10.24% 33 Odessa 2.83%
9 Irving 9.28% 34 Midland 1.96%
10 Grand Prairie 9.02% 35 Hurst 1.73%
11 Katy 7.88% 36 McAllen 1.52%
12 Austin 7.49% 37 El Paso 1.29%
13 Grapevine 6.97% 38 Amarillo 1.13%
14 Georgetown 6.81% 39 Harlingen 1.03%
15 Mesquite 6.71% 40 Waco 0.46%
16 Baytown 6.64% 41 Dallas 0.34%
17 Denton 6.56% 42 Wichita Falls -0.13%
18 Lewisville 6.36% 43 Brownsville -0.30%
19 Pasadena 6.14% 44 Richardson -0.69%
20 New Braunfels 5.64% 45 Killeen -1.01%
21 Fort Worth 5.56% 46 Longview -1.02%
22 Sugar Land 5.51% 47 San Antonio -1.04%
23 Conroe 4.80% 48 Laredo -1.75%
24 Abilene 4.72% 49 Houston -2.09%
25 Round Rock 4.43% 50 Victoria -2.39%
For more information, contact the Pearland Economic Development Corporation • (281) 997-3000 • www.pearlandedc.com
Retail Comparisons
-20.0%
-10.0%
0.0%
10.0%
20.0%
30.0%
04 05 06 07 08 09 10 11 12 13 14 15 16 17
Change in Retail Sales vs Prior Year
Pearland Houston MSA
$0
$50
$100
$150
$200
$250
$300
$350
2006 2007 2008 2009 2010 2011 2012 2013 2014 2015 2018
Average Retail Property Sales Price (per SF)
Pearland Houston MSA
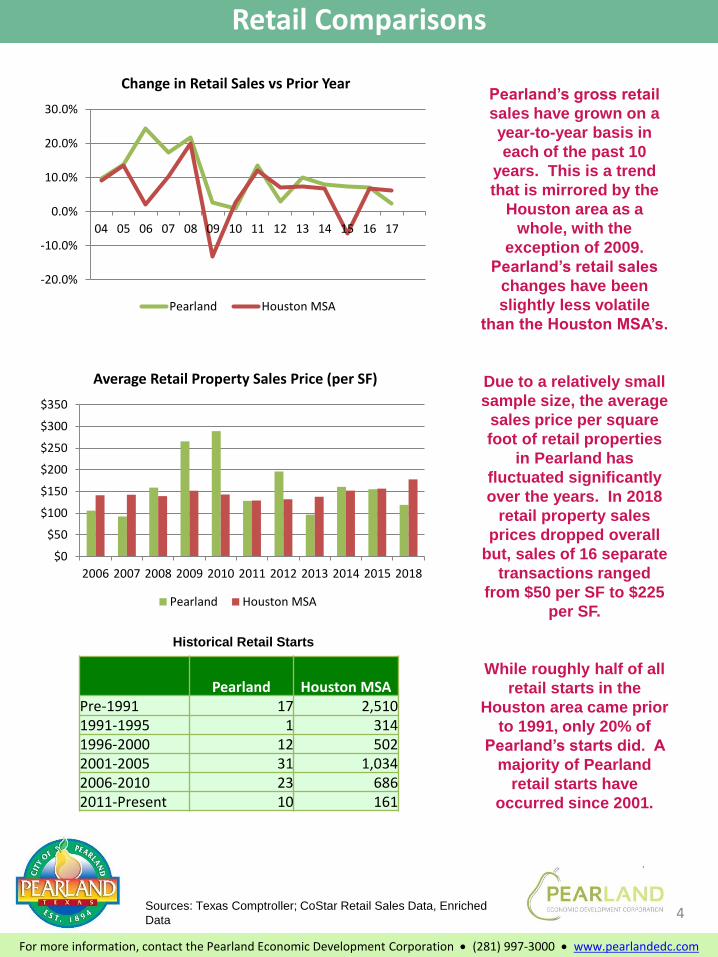
Pearland’s gross retail
sales have grown on a
year-to-year basis in
each of the past 10
years. This is a trend
that is mirrored by the
Houston area as a
whole, with the
exception of 2009.
Pearland’s retail sales
changes have been
slightly less volatile
than the Houston MSA’s.
Due to a relatively small
sample size, the average
sales price per square
foot of retail properties
in Pearland has
fluctuated significantly
over the years. In 2018
retail property sales
prices dropped overall
but, sales of 16 separate
transactions ranged
from $50 per SF to $225
per SF.
While roughly half of all
retail starts in the
Houston area came prior
to 1991, only 20% of
Pearland’s starts did. A
majority of Pearland
retail starts have
occurred since 2001.
Sources: Texas Comptroller; CoStar Retail Sales Data, Enriched
Data
Pearland Houston MSAPre-1991 17 2,5101991-1995 1 3141996-2000 12 5022001-2005 31 1,0342006-2010 23 6862011-Present 10 161
Historical Retail Starts
4
For more information, contact the Pearland Economic Development Corporation • (281) 997-3000 • www.pearlandedc.com
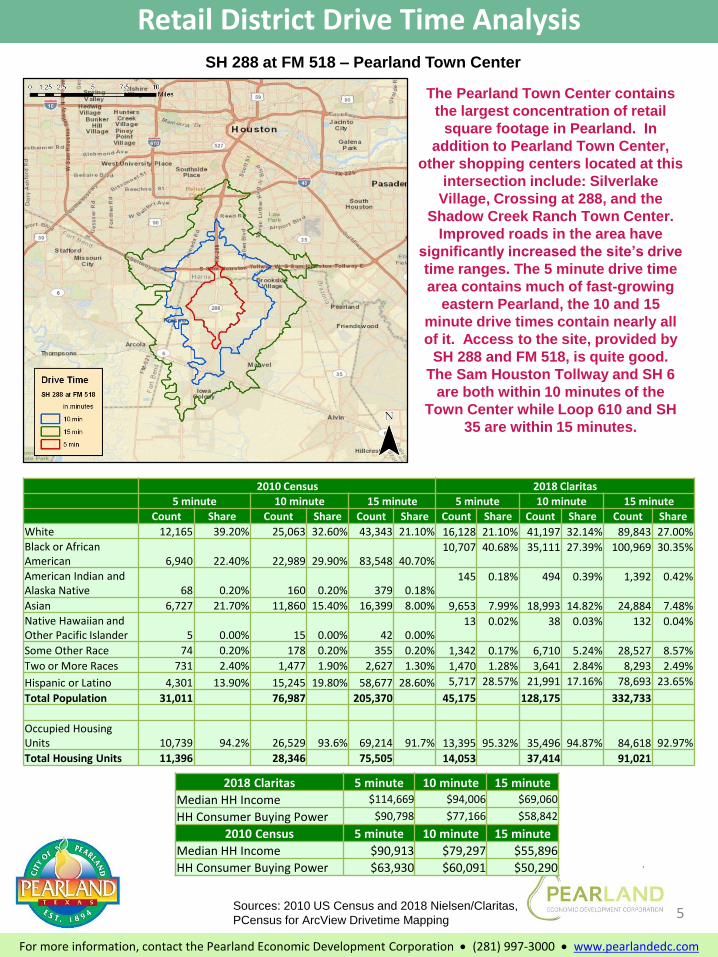
Retail District Drive Time AnalysisSH 288 at FM 518 – Pearland Town Center
The Pearland Town Center contains
the largest concentration of retail
square footage in Pearland. In
addition to Pearland Town Center,
other shopping centers located at this
intersection include: Silverlake
Village, Crossing at 288, and the
Shadow Creek Ranch Town Center.
Improved roads in the area have
significantly increased the site’s drive
time ranges. The 5 minute drive time
area contains much of fast-growing
eastern Pearland, the 10 and 15
minute drive times contain nearly all
of it. Access to the site, provided by
SH 288 and FM 518, is quite good.
The Sam Houston Tollway and SH 6
are both within 10 minutes of the
Town Center while Loop 610 and SH
35 are within 15 minutes.
Sources: 2010 US Census and 2018 Nielsen/Claritas,
PCensus for ArcView Drivetime Mapping
2018 Claritas 5 minute 10 minute 15 minute
Median HH Income $114,669 $94,006 $69,060
HH Consumer Buying Power $90,798 $77,166 $58,842
2010 Census 5 minute 10 minute 15 minute
Median HH Income $90,913 $79,297 $55,896
HH Consumer Buying Power $63,930 $60,091 $50,290
2010 Census 2018 Claritas5 minute 10 minute 15 minute 5 minute 10 minute 15 minute
Count Share Count Share Count Share Count Share Count Share Count Share
White 12,165 39.20% 25,063 32.60% 43,343 21.10% 16,128 21.10% 41,197 32.14% 89,843 27.00%Black or African American 6,940 22.40% 22,989 29.90% 83,548 40.70%
10,707 40.68% 35,111 27.39% 100,969 30.35%
American Indian and Alaska Native 68 0.20% 160 0.20% 379 0.18%
145 0.18% 494 0.39% 1,392 0.42%
Asian 6,727 21.70% 11,860 15.40% 16,399 8.00% 9,653 7.99% 18,993 14.82% 24,884 7.48%Native Hawaiian and Other Pacific Islander 5 0.00% 15 0.00% 42 0.00%
13 0.02% 38 0.03% 132 0.04%
Some Other Race 74 0.20% 178 0.20% 355 0.20% 1,342 0.17% 6,710 5.24% 28,527 8.57%
Two or More Races 731 2.40% 1,477 1.90% 2,627 1.30% 1,470 1.28% 3,641 2.84% 8,293 2.49%
Hispanic or Latino 4,301 13.90% 15,245 19.80% 58,677 28.60% 5,717 28.57% 21,991 17.16% 78,693 23.65%
Total Population 31,011 76,987 205,370 45,175 128,175 332,733
Occupied Housing Units 10,739 94.2% 26,529 93.6% 69,214 91.7% 13,395 95.32% 35,496 94.87% 84,618 92.97%
Total Housing Units 11,396 28,346 75,505 14,053 37,414 91,021
5
For more information, contact the Pearland Economic Development Corporation • (281) 997-3000 • www.pearlandedc.com
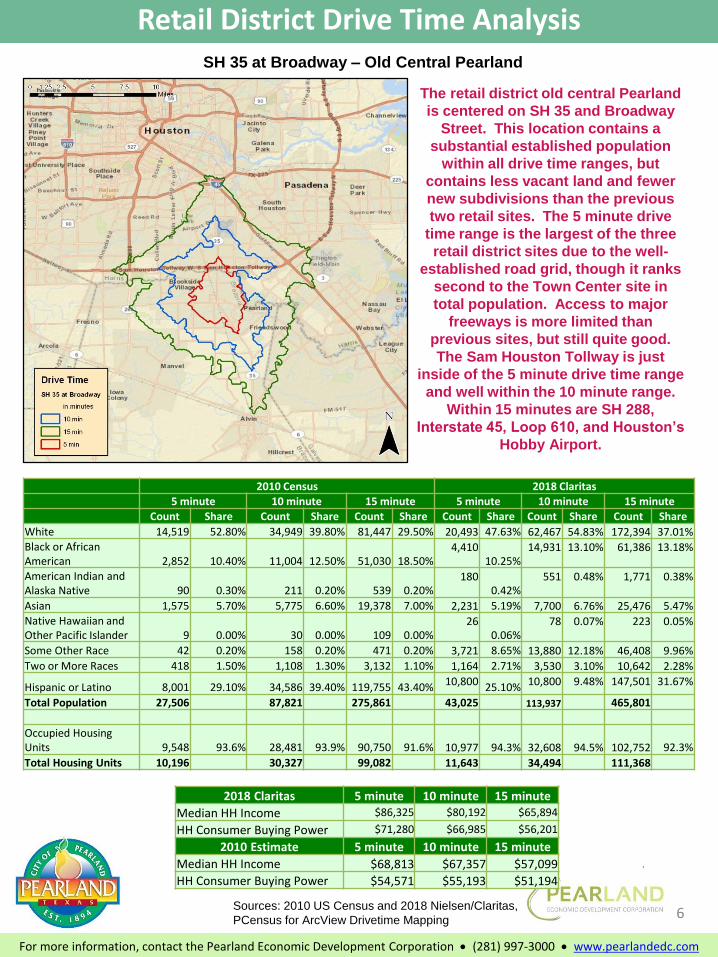
Retail District Drive Time AnalysisSH 35 at Broadway – Old Central Pearland
The retail district old central Pearland
is centered on SH 35 and Broadway
Street. This location contains a
substantial established population
within all drive time ranges, but
contains less vacant land and fewer
new subdivisions than the previous
two retail sites. The 5 minute drive
time range is the largest of the three
retail district sites due to the well-
established road grid, though it ranks
second to the Town Center site in
total population. Access to major
freeways is more limited than
previous sites, but still quite good.
The Sam Houston Tollway is just
inside of the 5 minute drive time range
and well within the 10 minute range.
Within 15 minutes are SH 288,
Interstate 45, Loop 610, and Houston’s
Hobby Airport.
Sources: 2010 US Census and 2018 Nielsen/Claritas,
PCensus for ArcView Drivetime Mapping
2010 Census 2018 Claritas
5 minute 10 minute 15 minute 5 minute 10 minute 15 minute Count Share Count Share Count Share Count Share Count Share Count Share
White 14,519 52.80% 34,949 39.80% 81,447 29.50% 20,493 47.63% 62,467 54.83% 172,394 37.01%Black or African American 2,852 10.40% 11,004 12.50% 51,030 18.50%
4,41010.25%
14,931 13.10% 61,386 13.18%
American Indian and Alaska Native 90 0.30% 211 0.20% 539 0.20%
1800.42%
551 0.48% 1,771 0.38%
Asian 1,575 5.70% 5,775 6.60% 19,378 7.00% 2,231 5.19% 7,700 6.76% 25,476 5.47%Native Hawaiian and Other Pacific Islander 9 0.00% 30 0.00% 109 0.00%
260.06%
78 0.07% 223 0.05%
Some Other Race 42 0.20% 158 0.20% 471 0.20% 3,721 8.65% 13,880 12.18% 46,408 9.96%
Two or More Races 418 1.50% 1,108 1.30% 3,132 1.10% 1,164 2.71% 3,530 3.10% 10,642 2.28%
Hispanic or Latino 8,001 29.10% 34,586 39.40% 119,755 43.40% 10,800 25.10% 10,800 9.48% 147,501 31.67%
Total Population 27,506 87,821 275,861 43,025 113,937 465,801
Occupied Housing Units 9,548 93.6% 28,481 93.9% 90,750 91.6% 10,977 94.3% 32,608 94.5% 102,752 92.3%
Total Housing Units 10,196 30,327 99,082 11,643 34,494 111,368
2018 Claritas 5 minute 10 minute 15 minute
Median HH Income $86,325 $80,192 $65,894
HH Consumer Buying Power $71,280 $66,985 $56,201
2010 Estimate 5 minute 10 minute 15 minute
Median HH Income $68,813 $67,357 $57,099
HH Consumer Buying Power $54,571 $55,193 $51,194
6
For more information, contact the Pearland Economic Development Corporation • (281) 997-3000 • www.pearlandedc.com
Pearland Population has Grown Rapidly
19
60
19
70
19
80
19
90
20
00
20
01
20
02
20
03
20
04
20
05
20
06
20
07
20
08
20
09
20
10
20
11
20
12
20
13
20
14
20
15
20
17
1,4976,444
13,24818,927
37,640
48,19851,54054,94959,594
64,17571,320
77,58882,903
87,07791,252
95,64496,665102,491104,759
111,665113,636
Pearland Historical Population
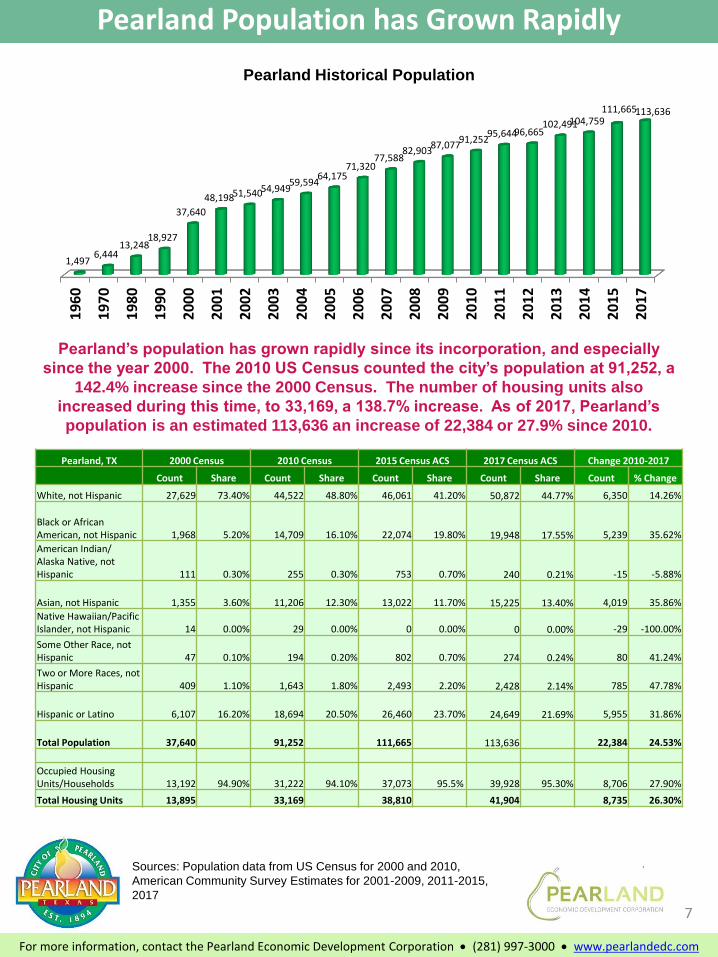
Pearland’s population has grown rapidly since its incorporation, and especially
since the year 2000. The 2010 US Census counted the city’s population at 91,252, a
142.4% increase since the 2000 Census. The number of housing units also
increased during this time, to 33,169, a 138.7% increase. As of 2017, Pearland’s
population is an estimated 113,636 an increase of 22,384 or 27.9% since 2010.
Pearland Census Demographics
2000, 2010, 2015, 2018
Sources: Population data from US Census for 2000 and 2010,
American Community Survey Estimates for 2001-2009, 2011-2015,
2017
7
Pearland, TX 2000 Census 2010 Census 2015 Census ACS 2017 Census ACS Change 2010-2017
Count Share Count Share Count Share Count Share Count % Change
White, not Hispanic 27,629 73.40% 44,522 48.80% 46,061 41.20% 50,872 44.77% 6,350 14.26%
Black or African American, not Hispanic 1,968 5.20% 14,709 16.10% 22,074 19.80% 19,948 17.55% 5,239 35.62%
American Indian/ Alaska Native, not Hispanic 111 0.30% 255 0.30% 753 0.70% 240 0.21% -15 -5.88%
Asian, not Hispanic 1,355 3.60% 11,206 12.30% 13,022 11.70% 15,225 13.40% 4,019 35.86%
Native Hawaiian/Pacific Islander, not Hispanic 14 0.00% 29 0.00% 0 0.00% 0 0.00% -29 -100.00%
Some Other Race, not Hispanic 47 0.10% 194 0.20% 802 0.70% 274 0.24% 80 41.24%
Two or More Races, not Hispanic 409 1.10% 1,643 1.80% 2,493 2.20% 2,428 2.14% 785 47.78%
Hispanic or Latino 6,107 16.20% 18,694 20.50% 26,460 23.70% 24,649 21.69% 5,955 31.86%
Total Population 37,640 91,252 111,665 113,636 22,384 24.53%
Occupied Housing Units/Households 13,192 94.90% 31,222 94.10% 37,073 95.5% 39,928 95.30% 8,706 27.90%
Total Housing Units 13,895 33,169 38,810 41,904 8,735 26.30%
For more information, contact the Pearland Economic Development Corporation • (281) 997-3000 • www.pearlandedc.com
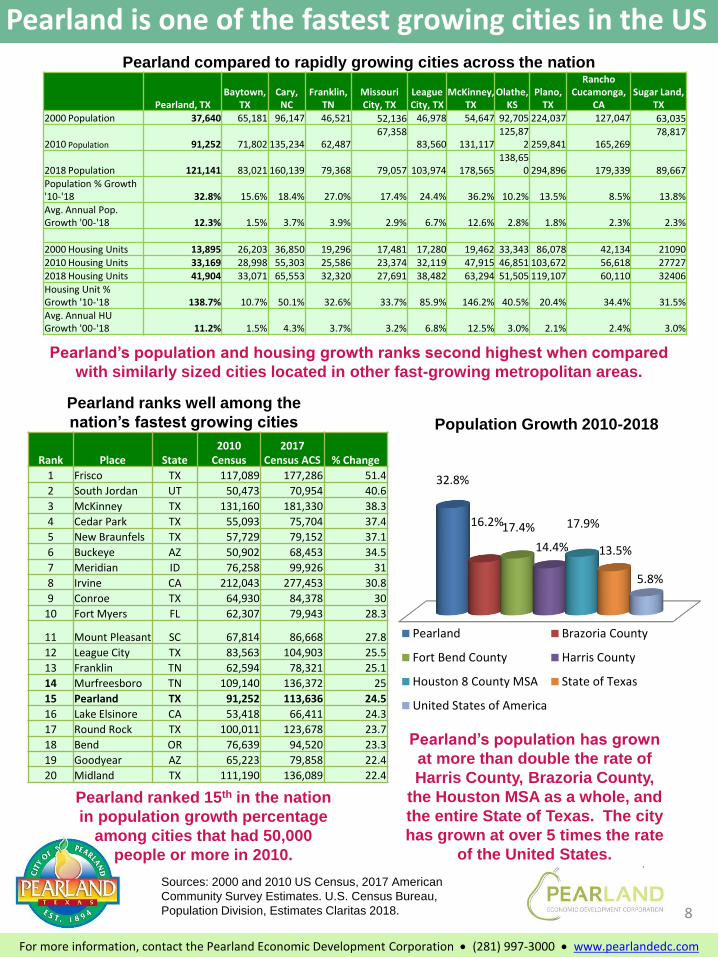
Pearland is one of the fastest growing cities in the US
Pearland’s population and housing growth ranks second highest when compared
with similarly sized cities located in other fast-growing metropolitan areas.
32.8%
16.2%17.4%
14.4%
17.9%
13.5%
5.8%
Population Growth 2010-2018
Pearland Brazoria County
Fort Bend County Harris County
Houston 8 County MSA State of Texas
United States of America
Pearland’s population has grown
at more than double the rate of
Harris County, Brazoria County,
the Houston MSA as a whole, and
the entire State of Texas. The city
has grown at over 5 times the rate
of the United States.
Pearland compared to rapidly growing cities across the nation
Sources: 2000 and 2010 US Census, 2017 American
Community Survey Estimates. U.S. Census Bureau,
Population Division, Estimates Claritas 2018.
Pearland ranks well among the
nation’s fastest growing cities
Pearland ranked 15th in the nation
in population growth percentage
among cities that had 50,000
people or more in 2010.
8
Pearland, TXBaytown,
TXCary,
NCFranklin,
TNMissouri City, TX
League City, TX
McKinney, TX
Olathe, KS
Plano, TX
Rancho Cucamonga,
CASugar Land,
TX2000 Population 37,640 65,181 96,147 46,521 52,136 46,978 54,647 92,705 224,037 127,047 63,035
2010 Population 91,252 71,802 135,234 62,48767,358
83,560 131,117125,87
2 259,841 165,26978,817
2018 Population 121,141 83,021 160,139 79,368 79,057 103,974 178,565138,65
0 294,896 179,339 89,667Population % Growth '10-'18 32.8% 15.6% 18.4% 27.0% 17.4% 24.4% 36.2% 10.2% 13.5% 8.5% 13.8%Avg. Annual Pop. Growth '00-'18 12.3% 1.5% 3.7% 3.9% 2.9% 6.7% 12.6% 2.8% 1.8% 2.3% 2.3%
2000 Housing Units 13,895 26,203 36,850 19,296 17,481 17,280 19,462 33,343 86,078 42,134 210902010 Housing Units 33,169 28,998 55,303 25,586 23,374 32,119 47,915 46,851 103,672 56,618 277272018 Housing Units 41,904 33,071 65,553 32,320 27,691 38,482 63,294 51,505 119,107 60,110 32406Housing Unit % Growth '10-'18 138.7% 10.7% 50.1% 32.6% 33.7% 85.9% 146.2% 40.5% 20.4% 34.4% 31.5%Avg. Annual HU Growth '00-'18 11.2% 1.5% 4.3% 3.7% 3.2% 6.8% 12.5% 3.0% 2.1% 2.4% 3.0%
Rank Place State2010
Census2017
Census ACS % Change
1 Frisco TX 117,089 177,286 51.4
2 South Jordan UT 50,473 70,954 40.6
3 McKinney TX 131,160 181,330 38.3
4 Cedar Park TX 55,093 75,704 37.4
5 New Braunfels TX 57,729 79,152 37.1
6 Buckeye AZ 50,902 68,453 34.5
7 Meridian ID 76,258 99,926 31
8 Irvine CA 212,043 277,453 30.8
9 Conroe TX 64,930 84,378 30
10 Fort Myers FL 62,307 79,943 28.3
11 Mount Pleasant SC 67,814 86,668 27.8
12 League City TX 83,563 104,903 25.5
13 Franklin TN 62,594 78,321 25.1
14 Murfreesboro TN 109,140 136,372 25
15 Pearland TX 91,252 113,636 24.5
16 Lake Elsinore CA 53,418 66,411 24.3
17 Round Rock TX 100,011 123,678 23.7
18 Bend OR 76,639 94,520 23.3
19 Goodyear AZ 65,223 79,858 22.4
20 Midland TX 111,190 136,089 22.4
For more information, contact the Pearland Economic Development Corporation • (281) 997-3000 • www.pearlandedc.com
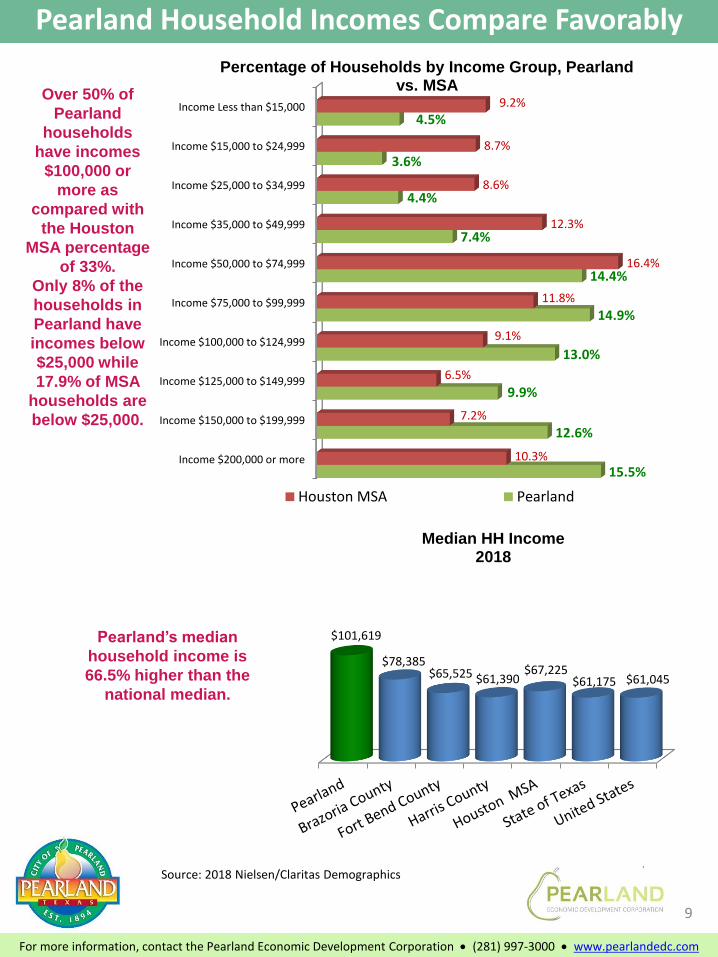
Pearland Household Incomes Compare Favorably
Income Less than $15,000
Income $15,000 to $24,999
Income $25,000 to $34,999
Income $35,000 to $49,999
Income $50,000 to $74,999
Income $75,000 to $99,999
Income $100,000 to $124,999
Income $125,000 to $149,999
Income $150,000 to $199,999
Income $200,000 or more
9.2%
8.7%
8.6%
12.3%
16.4%
11.8%
9.1%
6.5%
7.2%
10.3%
4.5%
3.6%
4.4%
7.4%
14.4%
14.9%
13.0%
9.9%
12.6%
15.5%
Percentage of Households by Income Group, Pearland vs. MSA
Houston MSA Pearland
$101,619
$78,385 $65,525 $61,390
$67,225 $61,175 $61,045
Median HH Income2018
Pearland’s median
household income is
66.5% higher than the
national median.
Source: 2018 Nielsen/Claritas Demographics
Over 50% of
Pearland
households
have incomes
$100,000 or
more as
compared with
the Houston
MSA percentage
of 33%.
Only 8% of the
households in
Pearland have
incomes below
$25,000 while
17.9% of MSA
households are
below $25,000.
9
For more information, contact the Pearland Economic Development Corporation • (281) 997-3000 • www.pearlandedc.com
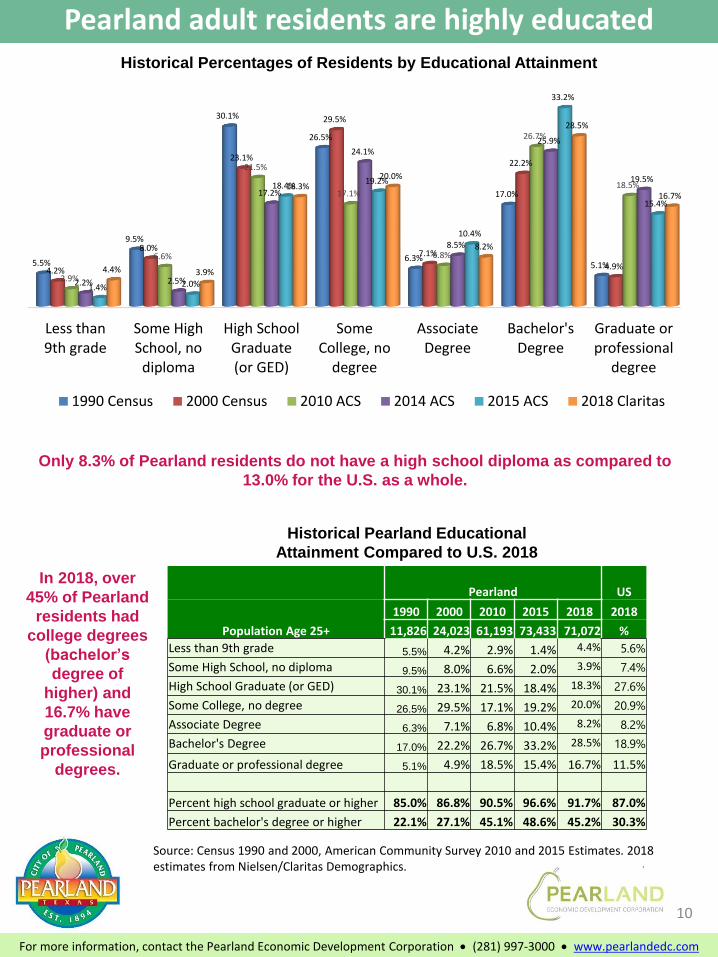
Pearland adult residents are highly educated
In 2018, over
45% of Pearland
residents had
college degrees
(bachelor’s
degree of
higher) and
16.7% have
graduate or
professional
degrees.
Source: Census 1990 and 2000, American Community Survey 2010 and 2015 Estimates. 2018 estimates from Nielsen/Claritas Demographics.
Only 8.3% of Pearland residents do not have a high school diploma as compared to
13.0% for the U.S. as a whole.
Historical Pearland Educational
Attainment Compared to U.S. 2018
10
Less than9th grade
Some HighSchool, no
diploma
High SchoolGraduate(or GED)
SomeCollege, no
degree
AssociateDegree
Bachelor'sDegree
Graduate orprofessional
degree
5.5%
9.5%
30.1%
26.5%
6.3%
17.0%
5.1%4.2%
8.0%
23.1%
29.5%
7.1%
22.2%
4.9%
2.9%
6.6%
21.5%
17.1%
6.8%
26.7%
18.5%
2.2% 2.5%
17.2%
24.1%
8.5%
25.9%
19.5%
1.4% 2.0%
18.4%19.2%
10.4%
33.2%
15.4%
4.4% 3.9%
18.3%20.0%
8.2%
28.5%
16.7%
Historical Percentages of Residents by Educational Attainment
1990 Census 2000 Census 2010 ACS 2014 ACS 2015 ACS 2018 Claritas
Pearland US
Population Age 25+
1990 2000 2010 2015 2018 2018
11,826 24,023 61,193 73,433 71,072 %
Less than 9th grade 5.5% 4.2% 2.9% 1.4% 4.4% 5.6%
Some High School, no diploma 9.5% 8.0% 6.6% 2.0% 3.9% 7.4%
High School Graduate (or GED) 30.1% 23.1% 21.5% 18.4% 18.3% 27.6%
Some College, no degree 26.5% 29.5% 17.1% 19.2% 20.0% 20.9%
Associate Degree 6.3% 7.1% 6.8% 10.4% 8.2% 8.2%
Bachelor's Degree 17.0% 22.2% 26.7% 33.2% 28.5% 18.9%
Graduate or professional degree 5.1% 4.9% 18.5% 15.4% 16.7% 11.5%
Percent high school graduate or higher 85.0% 86.8% 90.5% 96.6% 91.7% 87.0%
Percent bachelor's degree or higher 22.1% 27.1% 45.1% 48.6% 45.2% 30.3%
For more information, contact the Pearland Economic Development Corporation • (281) 997-3000 • www.pearlandedc.com
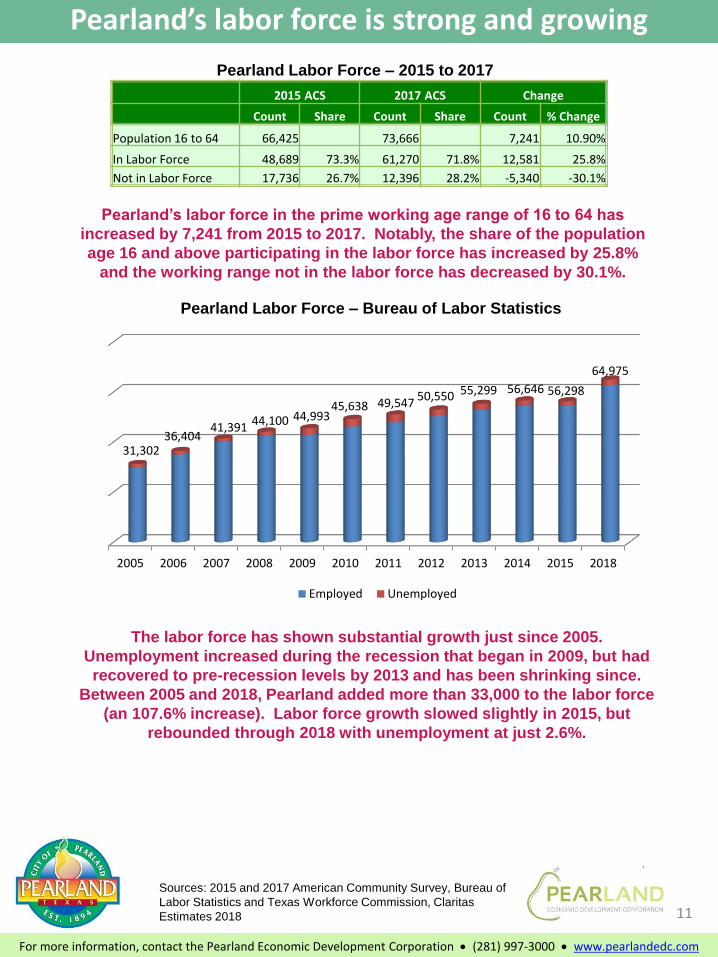
Pearland’s labor force is strong and growing
Pearland Labor Force – 2015 to 2017
Pearland’s labor force in the prime working age range of 16 to 64 has
increased by 7,241 from 2015 to 2017. Notably, the share of the population
age 16 and above participating in the labor force has increased by 25.8%
and the working range not in the labor force has decreased by 30.1%.
Sources: 2015 and 2017 American Community Survey, Bureau of
Labor Statistics and Texas Workforce Commission, Claritas
Estimates 2018
2005 2006 2007 2008 2009 2010 2011 2012 2013 2014 2015 2018
31,30236,404
41,39144,100 44,993
45,638 49,54750,550 55,299 56,646 56,298
64,975
Employed Unemployed
The labor force has shown substantial growth just since 2005.
Unemployment increased during the recession that began in 2009, but had
recovered to pre-recession levels by 2013 and has been shrinking since.
Between 2005 and 2018, Pearland added more than 33,000 to the labor force
(an 107.6% increase). Labor force growth slowed slightly in 2015, but
rebounded through 2018 with unemployment at just 2.6%.
2015 ACS 2017 ACS Change
Count Share Count Share Count % Change
Population 16 to 64 66,425 73,666 7,241 10.90%
In Labor Force 48,689 73.3% 61,270 71.8% 12,581 25.8%
Not in Labor Force 17,736 26.7% 12,396 28.2% -5,340 -30.1%
11
Pearland Labor Force – Bureau of Labor Statistics
For more information, contact the Pearland Economic Development Corporation • (281) 997-3000 • www.pearlandedc.com
Pearland job base is expanding rapidly
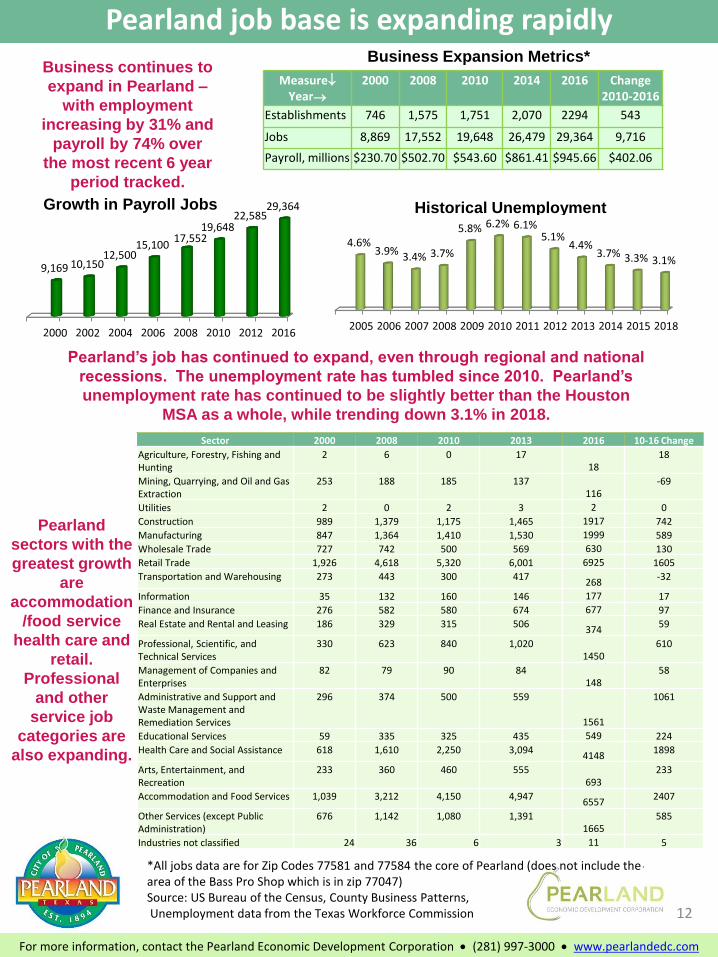
*All jobs data are for Zip Codes 77581 and 77584 the core of Pearland (does not include thearea of the Bass Pro Shop which is in zip 77047)Source: US Bureau of the Census, County Business Patterns,Unemployment data from the Texas Workforce Commission
Business Expansion Metrics*Business continues to
expand in Pearland –
with employment
increasing by 31% and
payroll by 74% over
the most recent 6 year
period tracked.
9,169 10,15012,500
15,10017,552
19,64822,585
29,364Growth in Payroll Jobs
Pearland’s job has continued to expand, even through regional and national
recessions. The unemployment rate has tumbled since 2010. Pearland’s
unemployment rate has continued to be slightly better than the Houston
MSA as a whole, while trending down 3.1% in 2018.
Estimated Pearland Jobs by Sector*
Pearland
sectors with the
greatest growth
are
accommodation
/food service
health care and
retail.
Professional
and other
service job
categories are
also expanding.
4.6%3.9% 3.4% 3.7%
5.8% 6.2% 6.1%5.1%
4.4%3.7% 3.3% 3.1%
Historical Unemployment
MeasureYear→
2000 2008 2010 2014 2016 Change 2010-2016
Establishments 746 1,575 1,751 2,070 2294 543
Jobs 8,869 17,552 19,648 26,479 29,364 9,716
Payroll, millions $230.70 $502.70 $543.60 $861.41 $945.66 $402.06
12
Sector 2000 2008 2010 2013 2016 10-16 Change
Agriculture, Forestry, Fishing and Hunting
2 6 0 1718
18
Mining, Quarrying, and Oil and Gas Extraction
253 188 185 137116
-69
Utilities 2 0 2 3 2 0
Construction 989 1,379 1,175 1,465 1917 742
Manufacturing 847 1,364 1,410 1,530 1999 589
Wholesale Trade 727 742 500 569 630 130
Retail Trade 1,926 4,618 5,320 6,001 6925 1605
Transportation and Warehousing 273 443 300 417268
-32
Information 35 132 160 146 177 17
Finance and Insurance 276 582 580 674 677 97
Real Estate and Rental and Leasing 186 329 315 506374
59
Professional, Scientific, and Technical Services
330 623 840 1,0201450
610
Management of Companies and Enterprises
82 79 90 84148
58
Administrative and Support and Waste Management and Remediation Services
296 374 500 559
1561
1061
Educational Services 59 335 325 435 549 224
Health Care and Social Assistance 618 1,610 2,250 3,0944148
1898
Arts, Entertainment, and Recreation
233 360 460 555693
233
Accommodation and Food Services 1,039 3,212 4,150 4,9476557
2407
Other Services (except Public Administration)
676 1,142 1,080 1,3911665
585
Industries not classified 24 36 6 3 11 5
For more information, contact the Pearland Economic Development Corporation • (281) 997-3000 • www.pearlandedc.com
Single Family Housing2
00
0
20
01
20
02
20
03
20
04
20
05
20
06
20
07
20
08
20
09
20
10
20
11
20
12
20
13
20
14
20
15
20
16
20
17
20
18
8181,210
1,4301,683
2,102
2,610
2,0721,639
1,207776 722 691
947 956 1,068 9531,201
949 818
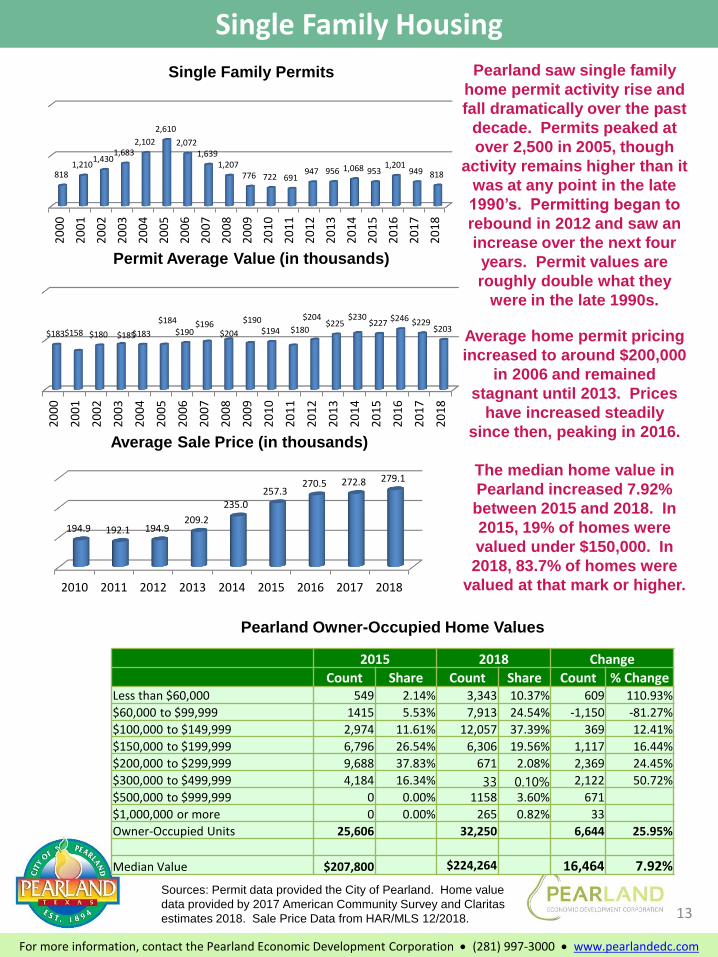
Single Family Permits
2015 2018 Change
Count Share Count Share Count % ChangeLess than $60,000 549 2.14% 3,343 10.37% 609 110.93%
$60,000 to $99,999 1415 5.53% 7,913 24.54% -1,150 -81.27%
$100,000 to $149,999 2,974 11.61% 12,057 37.39% 369 12.41%
$150,000 to $199,999 6,796 26.54% 6,306 19.56% 1,117 16.44%
$200,000 to $299,999 9,688 37.83% 671 2.08% 2,369 24.45%
$300,000 to $499,999 4,184 16.34% 33 0.10% 2,122 50.72%
$500,000 to $999,999 0 0.00% 1158 3.60% 671
$1,000,000 or more 0 0.00% 265 0.82% 33
Owner-Occupied Units 25,606 32,250 6,644 25.95%
Median Value $207,800 $224,264 16,464 7.92%
Pearland Owner-Occupied Home Values
Pearland saw single family
home permit activity rise and
fall dramatically over the past
decade. Permits peaked at
over 2,500 in 2005, though
activity remains higher than it
was at any point in the late
1990’s. Permitting began to
rebound in 2012 and saw an
increase over the next four
years. Permit values are
roughly double what they
were in the late 1990s.
Average home permit pricing
increased to around $200,000
in 2006 and remained
stagnant until 2013. Prices
have increased steadily
since then, peaking in 2016.
The median home value in
Pearland increased 7.92%
between 2015 and 2018. In
2015, 19% of homes were
valued under $150,000. In
2018, 83.7% of homes were
valued at that mark or higher.
Sources: Permit data provided the City of Pearland. Home value
data provided by 2017 American Community Survey and Claritas
estimates 2018. Sale Price Data from HAR/MLS 12/2018. 13
2010 2011 2012 2013 2014 2015 2016 2017 2018
194.9 192.1 194.9209.2
235.0257.3
270.5 272.8 279.1
Average Sale Price (in thousands)
20
00
20
01
20
02
20
03
20
04
20
05
20
06
20
07
20
08
20
09
20
10
20
11
20
12
20
13
20
14
20
15
20
16
20
17
20
18
$183$158 $180 $185$183
$184
$190$196
$204
$190$194 $180
$204$225
$230$227
$246 $229$203
Permit Average Value (in thousands)
For more information, contact the Pearland Economic Development Corporation • (281) 997-3000 • www.pearlandedc.com
Multi-family Trends
357
508
359
41
355 316
602
485
48
154
16
-6
20
144
22
Historical Absorption2
00
0
20
05
20
06
20
07
20
08
20
09
20
10
20
11
20
12
20
13
20
14
20
15
20
16
20
17
20
18
87.6%
85.4%
87.9%
92.1%
89.8%
85.1% 85.1%
91.0%
93.5%94.0%95.0%94.8%94.6%
93.0%93.7%
Historical Occupancy
$0.81
$0.89 $0.92 $0.95
$0.96
$0.99
$1.00
$1.00 $1.03
$1.06 $1.07
$1.09 $1.10$1.18
$1.22
Historical Rent/SF
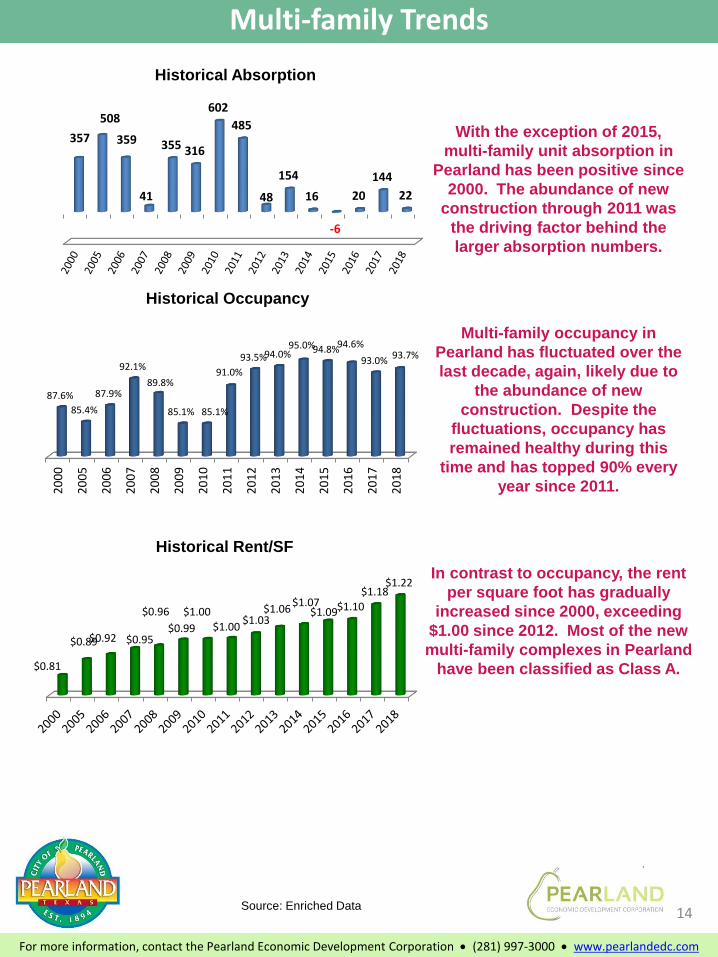
With the exception of 2015,
multi-family unit absorption in
Pearland has been positive since
2000. The abundance of new
construction through 2011 was
the driving factor behind the
larger absorption numbers.
Multi-family occupancy in
Pearland has fluctuated over the
last decade, again, likely due to
the abundance of new
construction. Despite the
fluctuations, occupancy has
remained healthy during this
time and has topped 90% every
year since 2011.
In contrast to occupancy, the rent
per square foot has gradually
increased since 2000, exceeding
$1.00 since 2012. Most of the new
multi-family complexes in Pearland
have been classified as Class A.
Source: Enriched Data 14
For more information, contact the Pearland Economic Development Corporation • (281) 997-3000 • www.pearlandedc.com
Hotel Trends
20
05
20
10
20
12
20
14
20
15
20
16
20
17
3
10 10 10 10 10 10
Hotels/Motels2
00
5
20
10
20
12
20
14
20
15
20
16
20
17
164
743 769 769 769 769 769Rooms
2005 2010 2012 2014 2015 2016 2017
$3.44
$9.94
$14.52 $12.86
$21.20 $19.60$23.32
Revenue, Millions
2005 2010 2012 2014 2015 2016 2017
72.7%
47.5%64.8%
72.5% 67.9% 65.8% 72.5%
Occupancy
$57.45
$38.60 $51.72 $46.07
$75.54 $69.82
$82.87 REVPAR
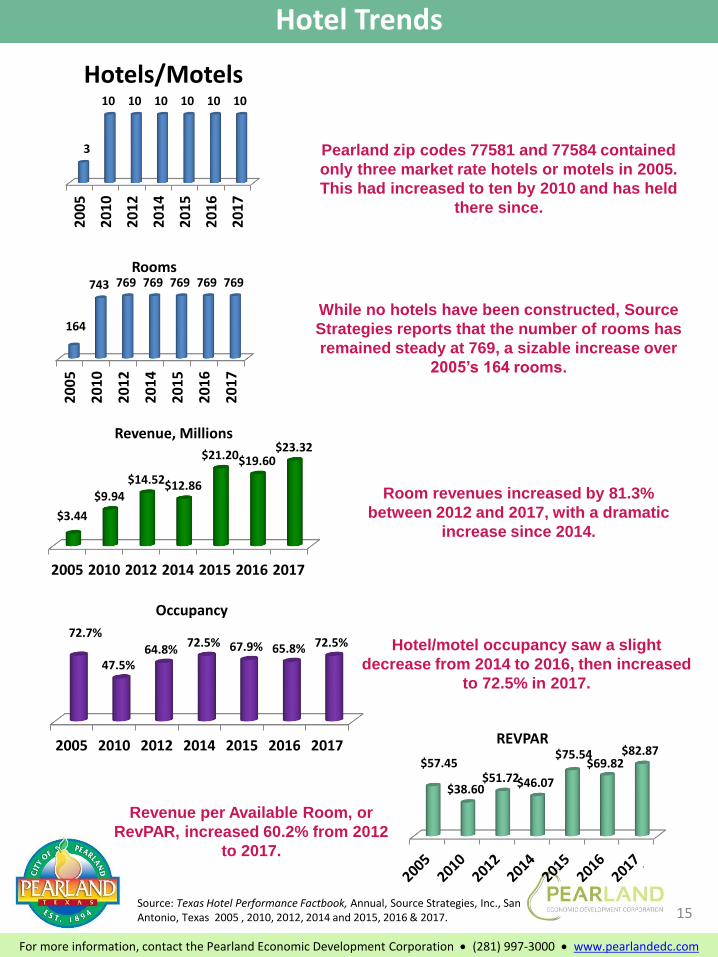
Pearland zip codes 77581 and 77584 contained
only three market rate hotels or motels in 2005.
This had increased to ten by 2010 and has held
there since.
While no hotels have been constructed, Source
Strategies reports that the number of rooms has
remained steady at 769, a sizable increase over
2005’s 164 rooms.
Room revenues increased by 81.3%
between 2012 and 2017, with a dramatic
increase since 2014.
Hotel/motel occupancy saw a slight
decrease from 2014 to 2016, then increased
to 72.5% in 2017.
Revenue per Available Room, or
RevPAR, increased 60.2% from 2012
to 2017.
Source: Texas Hotel Performance Factbook, Annual, Source Strategies, Inc., San Antonio, Texas 2005 , 2010, 2012, 2014 and 2015, 2016 & 2017. 15
For more information, contact the Pearland Economic Development Corporation • (281) 997-3000 • www.pearlandedc.com
Office Trends
84.9%
65.0%
50.7% 53.5%61.1%
75.4%
61.8% 64.1%
81.5%
66.4% 68.0%
80.5%72.4%
$23.00
$20.13
$20.84$20.47
$20.92$21.01
$19.35
$20.54$20.07$20.16
$19.71
$20.51
$21.11
$15.00
$16.00
$17.00
$18.00
$19.00
$20.00
$21.00
$22.00
$23.00
0.25
0.45
0.65
0.85
1.05
1.25
1.45
1.65
2006 2007 2008 2009 2010 2011 2012 2013 2014 2015 2016 2017 2018
Office Occupancy and Rental Rates
Occupancy, % Rent/SF, $
62.799.1 99.1
139.8
237.8290.9
381.4 381.4
451.4
642.3
722.3 722.3 722.3 742.3 742.3
946.3
1,046.3 1,046.31,046.31,046.3
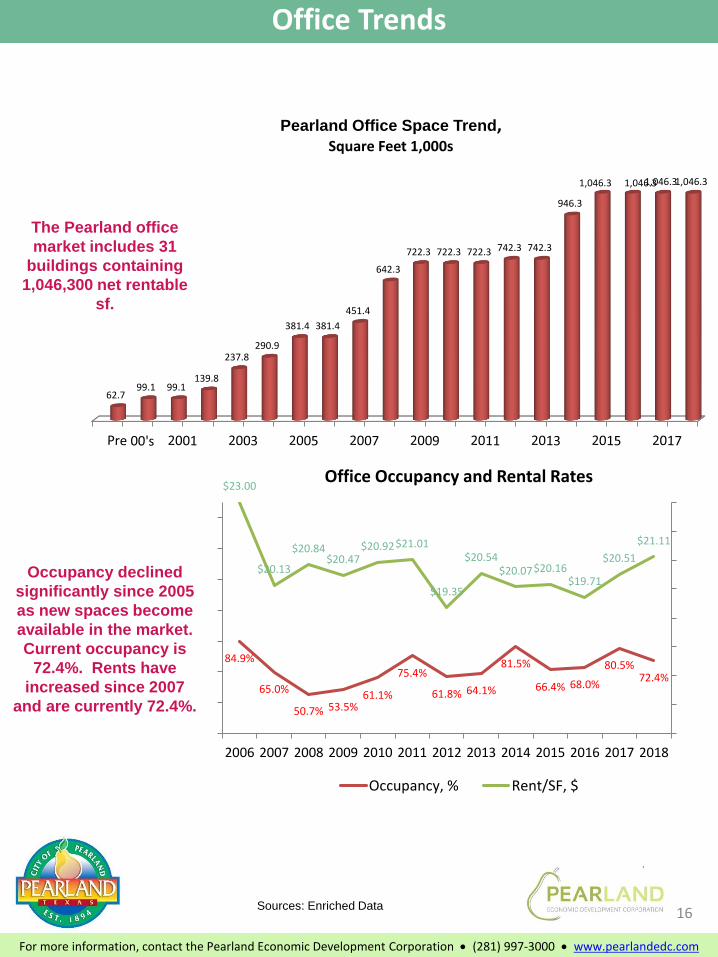
Pearland Office Space Trend, Square Feet 1,000s
The Pearland office
market includes 31
buildings containing
1,046,300 net rentable
sf.
Occupancy declined
significantly since 2005
as new spaces become
available in the market.
Current occupancy is
72.4%. Rents have
increased since 2007
and are currently 72.4%.
Sources: Enriched Data 16
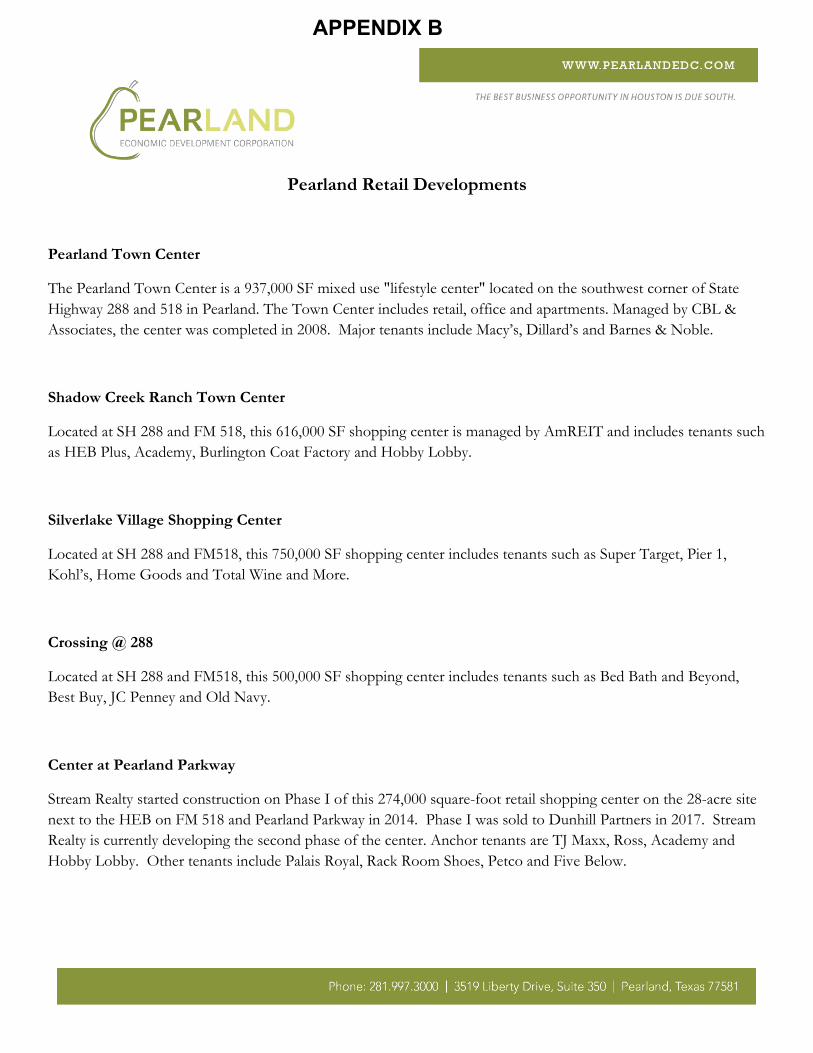
Pearland Retail Developments
Pearland Town Center
The Pearland Town Center is a 937,000 SF mixed use "lifestyle center" located on the southwest corner of State Highway 288 and 518 in Pearland. The Town Center includes retail, office and apartments. Managed by CBL & Associates, the center was completed in 2008. Major tenants include Macy’s, Dillard’s and Barnes & Noble.
Shadow Creek Ranch Town Center
Located at SH 288 and FM 518, this 616,000 SF shopping center is managed by AmREIT and includes tenants such as HEB Plus, Academy, Burlington Coat Factory and Hobby Lobby.
Silverlake Village Shopping Center
Located at SH 288 and FM518, this 750,000 SF shopping center includes tenants such as Super Target, Pier 1, Kohl’s, Home Goods and Total Wine and More.
Crossing @ 288
Located at SH 288 and FM518, this 500,000 SF shopping center includes tenants such as Bed Bath and Beyond, Best Buy, JC Penney and Old Navy.
Center at Pearland Parkway
Stream Realty started construction on Phase I of this 274,000 square-foot retail shopping center on the 28-acre site next to the HEB on FM 518 and Pearland Parkway in 2014. Phase I was sold to Dunhill Partners in 2017. Stream Realty is currently developing the second phase of the center. Anchor tenants are TJ Maxx, Ross, Academy and Hobby Lobby. Other tenants include Palais Royal, Rack Room Shoes, Petco and Five Below.
APPENDIX B
Top Related
Copyright © 2022 FDOKUMEN

