

Bahasa
Halaman
Hukum

The GerontologistCite journal as: The Gerontologist doi:10.1093/geront/gnt166
Page 1 of 11
© The Author 2013. Published by Oxford University Press on behalf of The Gerontological Society of America. All rights reserved. For permissions, please e-mail: [email protected].
Patterns of Technology Use Among Older Adults With and Without Disabilities
Nancy M. Gell, PhD, MPH,*,1 Dori E. Rosenberg, PhD, MPH,1,2 George Demiris, PhD,3,4 Andrea Z. LaCroix, PhD,1,5 and Kushang V. Patel, PhD, MPH6
1Group Health Research Institute, Seattle, Washington.2Department of Health Services, University of Washington School of Public Health, Seattle.
3Biomedical Informatics and Medical Education, School of Medicine, University of Washington, Seattle.4Biobehavioral Nursing and Health Systems, School of Nursing, University of Washington, Seattle.5Division of Public Health Sciences, Fred Hutchinson Cancer Research Center, Seattle, Washington.
6Center for Pain Research on Impact, Measurement and Effectiveness, Department of Anesthesiology and Pain Medicine, University of Washington, Seattle.
*Address correspondence to Nancy M. Gell, PhD, MPH, Group Health Research Institute, 1730 Minor Ave Suite 1600, Seattle, WA 98101. E-mail: [email protected]
Received July 29, 2013; Accepted November 26, 2013Decision Editor: Rachel Pruchno, PhD
Purpose of the Study: The purpose of this study was to describe prevalence of technology use among adults ages 65 and older, particularly for those with disability and activity-limiting symptoms and impairments. Design and Methods: Data from the 2011 National Health and Aging Trends Study, a nationally representative sample of commu-nity-dwelling Medicare beneficiaries (N = 7,609), were analyzed. Analysis consisted of technology use (use of e-mail/text messages and the internet) by sociodemographic and health characteristics and prevalence ratios for technology usage by dis-ability status. Results: Forty percent of older adults used e-mail or text messaging and 42.7% used the internet. Higher prevalence of technol-ogy use was associated with younger age, male sex, white race, higher education level, and being married (all p values <.001). After adjustment for sociodemographic and health characteristics, tech-nology use decreased significantly with greater limi-tations in physical capacity and greater disability. Vision impairment and memory limitations were also associated with lower likelihood of technology use. Implications: Technology usage in U.S. older adults varied significantly by sociodemographic and health status. Prevalence of technology use dif-fered by the type of disability and activity-limiting
impairments. The internet, e-mail, and text messag-ing might be viable mediums for health promotion and communication, particularly for younger cohorts of older adults and those with certain types of impair-ment and less severe disability.
Key Words: Internet, Impairment, E-mail, Text messag-ing, Health status
Advancements in communication technologies through the internet and mobile phones are rec-ognized for their potential high impact and broad reach in health education, health monitoring, and support of health behaviors worldwide (World Health Organization, 2011). A notable aspect of mobile phones, in particular, is that older adults and marginalized segments of the population have better access and uptake of mobile technology compared with previous technologies (Gerber, Olazabal, Brown, & Pablos-Mendez, 2010). Recent data estimate that 79% of all Americans have computer access and 85% have a cell phone (Fox & Duggan, 2012; Internet World Statistics, 2012). The Pew Internet Project, which tracks internet use in the United States, reports stead-ily increasing numbers of older adults using the internet, with more than 50% reportedly going
The Gerontologist Advance Access published December 30, 2013 by guest on Septem
ber 13, 2016http://gerontologist.oxfordjournals.org/
Dow
nloaded from
Page 2 of 11 The Gerontologist
online in 2012 (Zickuhr & Madden, 2012). As reported by the U.S. Department of Commerce (2011), using data from the U.S. Census Bureau, Current Population Survey School Enrollment and Internet Use Supplement of 2010, 41.6% of adults 65 years and older reported using the inter-net and 61.0% reported some type of computer use. A key benefit of technology is the opportu-nity to reach and engage older adults, including those at risk of isolation or reduced access to health care.
In 2010, 37% of older persons in the United States reported some type of physical or cognitive disability (U.S. Department of Health and Human Services, 2011). Given the predicted growth of the older adult population, from the current 13%–19% in 2030, the number of older adults living with disability will also increase (Christensen, Doblhammer, Rau, & Vaupel, 2009). Disability in older adults has been associated with increased risk for adverse health outcomes such as func-tional decline, recurrent hospitalizations, social isolation, and higher health care needs and costs (Giuliani et al., 2008; Guralnik, Fried, Simonsick, Kasper, & Lafferty, 1995; Nosek, Hughes, Swedlund, Taylor, & Swank, 2003). Preliminary evidence shows potential for improvements in health outcomes and social isolation for older adults through internet (ehealth) and mobile phone (mhealth) interventions (Cotten, Anderson, & McCullough, 2013; Lim et al., 2011; Nimrod, 2009; Scherr et al., 2009). However, wider appli-cation and dissemination of such interventions are dependent on older adults’ access to and use of these technologies.
Early studies on technology use in older adults showed lower rates of computer and internet use compared with other age groups. In a study of adults in the United Kingdom ages 60 and older, Selwyn, Gorard, Furlong, and Madden (2003) found computer use to vary sub-stantially by demographic characteristics, with greater use associated with male sex, younger age, being married, and higher education level. Subsequent studies in the United States, Israel, and Australia show similar findings of computer use among older adults (Carpenter & Buday, 2007; Boulton-Lewis, Buys, Lovie-Kitchin, Barnett, & David, 2007; Heart & Kalderon, 2011). A consistent finding across multiple stud-ies of computer or internet use in older adults is the role of perceived relevance to daily life. Both cross-sectional and intervention studies report
the adoption and use of technology among older adults depends on perceived need, interest, and relevance (Carpenter & Buday, 2007; Selwyn et al., 2003; Sourbati, 2009). Other studies have tied lower rates of technology use to design and interface issues (Czaja & Lee, 2007), lack of training and support (Heart & Kalderon, 2011), and cost in relation to income (Wright & Hill, 2009). Through a web survey, Beach and col-leagues (2009) explored acceptability of shar-ing personal information (e.g., toileting, taking medications, home mobility, cognition, driving behavior, and vital signs) through technologi-cal means among older adults and among adults with disabilities. The finding of significant vari-ance by age and disability status for what was deemed acceptable indicates a need to balance potential for improved health with privacy con-siderations for use of technology in health and personal care.
To date, few studies have assessed inter-net use in more detail such as differentiating between communication, social networking, or information seeking. According to data from the Pew Research Center, among the 53% of adults ages 65 and older who go online, 86% use e-mail, 27% look online for information about health or medical issues, and 34% use social networking sites (Zickuhr & Madden, 2012). Using nationally representative data from the 2009 U.S. National Health Interview Survey, Choi (2011) found 32.2% of adults ages 65–74 used the internet for health-related activities in the past 12 months compared with 14.5% of those between ages 75 and 84. Furthermore, few studies on technology use in older adults have examined whether use patterns vary by health and functional status. In one study looking at computer access and internet use among older adults, Wright and Hill (2009), using data from the 2003 Current Population survey, found sig-nificantly lower usage rates among older adults with disabilities, based on vision, hearing, physi-cal mobility, hand/finger dexterity, and home-bound status, compared with those without (17% vs. 37%). More recent data on technology usage data among older adults with disabilities have not been described.
Multiple theoretical frameworks have been proposed for technology adoption. Originally developed in the context of technology adoption in the workplace, the Unified Theory of Acceptance and Use of Technology (UTAUT) by Venkatesh,
by guest on September 13, 2016
http://gerontologist.oxfordjournals.org/D
ownloaded from
Page 3 of 11
Morris, Davis, and Davis (2003) incorporated eight previous models used to understand tech-nology acceptance and has recently been applied in the context of older adult adoption of tech-nology (Mallenius, Rossi, & Tuunainen, 2007; Nägle & Schmidt, 2012; Or et al., 2011). The UTAUT model consists of four determinants of behavioral intention leading to use behavior: performance expectancy (defined by perceived usefulness and relative advantage over previous technology), effort expectancy (encompassing perceived ease of use, complexity, and ease of use), social influence (social norms), and facilitat-ing conditions with four moderators (gender, age, experience, voluntariness of use). Though multi-ple models exist to explain technology adoption, the constructs from the UTAUT provide a tested theoretical framework for technology adoption by older adults.
A better understanding of technology usage among older adults may help direct future inter-ventions aimed at improving the health and qual-ity of life of this rapidly growing segment of the population. As major public health agencies, such as the U.S. Department of Health and Human Services and the Centers for Disease Control, pro-ceed with the development of health promotion and education programs based on new technolo-gies, there is a clear need to characterize variation in technology use in the older adult population. Accordingly, the aims of the current study were to (a) examine technology use patterns among older adults by demographic and health characteristics; (b) determine internet usage patterns for personal tasks and health-related tasks; and (c) determine technology usage patterns in older adults with and without disabilities. We hypothesized that the majority of older adults use these technolo-gies. Given the relevance of technology to com-mon activities (e.g., communication, banking) and evidence for improvements in social isolation and health outcomes, we expected that the perceived usefulness and relative advantage over previ-ous technologies, as encompassed by the UTAUT determinant of performance expectancy, would result in more older adults using technology. We also hypothesized that the older age groups and those with disability or impairment would have lower usage than younger age groups and those without impairment. Based on the UTAUT, we anticipate effort expectancy, as characterized by complexity and ease of use, to be congruent with previous reports of interface issues and lack of
training and support resulting in decreased tech-nology adoption.
Design and Methods
Study Population
The data analyzed were from the 2011 National Health and Aging Trends Study (NHATS). The NHATS is sponsored by the U.S. National Institute on Aging (grant number NIA U01AG032947) and was conducted by the Johns Hopkins University. A nationally representative sample of Medicare beneficiaries was recruited to examine late-life disa-bility trends and advance understanding of late-life functional changes in U.S. adults ages 65 and older (Kasper & Freedman, 2012). The Medicare enroll-ment database served as the sampling frame. Using an age-stratified, three-stage sample design, 8,245 participants were enrolled in the study with par-ticipants selected from 5-year age groups between the ages of 65 and 90 and from persons ages 90 and older. The response rate was 71%. Proxy respondents were used in instances where partici-pants could not respond (e.g., in cases of dementia, cognitive impairment, severe illness, speech imped-iment). All participants, or their proxy respond-ents, provided written informed consent. Analytic weights were assigned to all participants to adjust for nonresponse and oversampling of the oldest-old and black non-Hispanic persons.
Participants or their proxies, living in the com-munity or residential care facilities except nursing homes were interviewed by trained research staff in their homes. Interviews were standardized with primarily closed-ended questions. Facility audits but not in-person interviews were conducted for the 468 (5.7%) nursing home residents who were not expected to return to their previous residence. These participants were excluded from the analy-sis. Additionally, 168 (2.0%) nonnursing home residential care participants did not complete the in-person interview and were also excluded from analysis. The analytical weights for the remaining respondents were adjusted to account for those without interviews. The final sample size consisted of 7,609 community-dwelling older adults.
Measures
Demographic variables collected during the interview included age, sex, race and ethnicity, education level, and marital status. Age was col-lapsed to categorical levels in 5-year increments,
by guest on September 13, 2016
http://gerontologist.oxfordjournals.org/D
ownloaded from
Page 4 of 11 The Gerontologist
and race/ethnicity information was condensed to four categories (white-non-Hispanic, black-non-Hispanic, Hispanic, and Other).
Health-related variables collected during the interview included self-rated health status (“Would you say that in general your health is excellent, very good, good, fair, or poor?”) and medical diag-noses by a physician. To capture level of multi-morbidity, a total count was calculated from the number of diagnoses reported (scale: 0, 1, 2, 3, 4, ≥5). Additional items inquired if vision, hear-ing, pain, breathing difficulties, or altered balance and co-ordination limited participation in usual activities during the last month. A measure of cog-nitive status was constructed from two variables: (a) reported memory problems interfering with daily activities two or more days per week or (b) a reported diagnosis of dementia. Participants with proxy respondents but no diagnosis of dementia were not included, as memory was not measured in a comparable way to the other participants.
An index of physical capacity was constructed from six variables (ability to walk three blocks inde-pendently, ability to climb 10 stairs independently, and ability to carry 10 pounds independently, abil-ity to bend over, ability to reach overhead, and abil-ity to grasp or handle small objects). The original index by Freedman and colleagues (2011) assessed six pairs of less and more challenging tasks to capture a wide range of functional ability. For the current study, the six less challenging tasks were collapsed to indicate a range in ability on a 4-point scale (0 = able to do all six tasks; 1 = unable to do 1–2 tasks; 2 = unable to do 3–4 tasks; 3 = unable to do 5–6 tasks).
Disability status was assessed based on difficulty and/or assistance needed to complete basic activi-ties of daily living (ADLs) and for mobility out-side the home. In the interview, participants were asked how much difficulty they had with self-care ADL tasks (eating, bathing, dressing, getting out of bed, and toileting) and whether they received help to complete each ADL. These responses were combined to indicate if a participant (a) had dif-ficulty with any of the five ADLs (yes/no), and (b) required help to complete any of the five ADLs. The responses from these two derived variables were then combined as a single, hierarchical measure of ability to complete ADLs spanning from “No dif-ficulty completing or help needed for any ADLs” (0) to “Difficulty completing but no help needed for any ADLs” (1) to “Help needed for any ADLs” (2). The same procedure was used to construct an
index for mobility outside the home based on par-ticipant responses to the sequential questions: “No difficulty or help needed with mobility outside the home” (0), “Difficulty completing but no help needed with mobility outside the home” (1), and “Help needed for mobility outside the home” (2).
Participants were asked up to 13 questions related to use of technology for communications. Participants were asked in the last month whether they had sent messages by e-mail or text, gone on the internet or online for any reason, gone on the internet or online to shop for groceries or personal items, to pay bills or do banking, or to order or refill prescriptions (response options: yes/no). They were also asked whether in the last year they used the internet or went online to contact medical providers, handle Medicare or other health insur-ance matters, or to get information about health conditions (response options, yes/no). Responses to reasons for use of the internet were combined to create two unique, dichotomous variables: (a) internet usage for personal tasks such as banking or shopping for groceries or personal items, and (b) internet usage for health-related tasks such as communication with insurance or a health care provider, prescriptions, or health-related informa-tion seeking. Participants were also asked about frequency of sending messages by e-mail or text (response options: most days, some days, rarely), if they had access to computers both inside and outside the home, and about cell phone ownership (yes/no).
Data Analysis
Statistical analyses were conducted in Stata (Version 12.1 Stata Corp., College Station, TX). Analytic sample weights were used to adjust for nonresponse and oversampling of subgroups. Taylor series linearization was used to calcu-late 95% confidence intervals (CI). Prevalence of e-mail or text messaging for communication, use of the internet in general, and use of the internet for personal tasks and health-related tasks were estimated for the population as a whole and by demographic characteristics and disability status. Differences in technology use by demographic and health-related characteristics were evaluated using the adjusted Wald statistic. Poisson regres-sion was used to estimate prevalence ratios (PR) and 95% CI for technology usage by disability sta-tus. Sociodemographic characteristics such as age, race/ethnicity, education, and marital status were
by guest on September 13, 2016
http://gerontologist.oxfordjournals.org/D
ownloaded from
Page 5 of 11
included in the models as covariates as well as self-rated health and multimorbidity.
Results
Based on the analysis of nationally representa-tive data from the NHATS, in 2011, 63.2% of older adults in the United States had access to a com-puter and 75.9% reported owning a cell phone. Of those with a cell phone, 11.3% did not have a
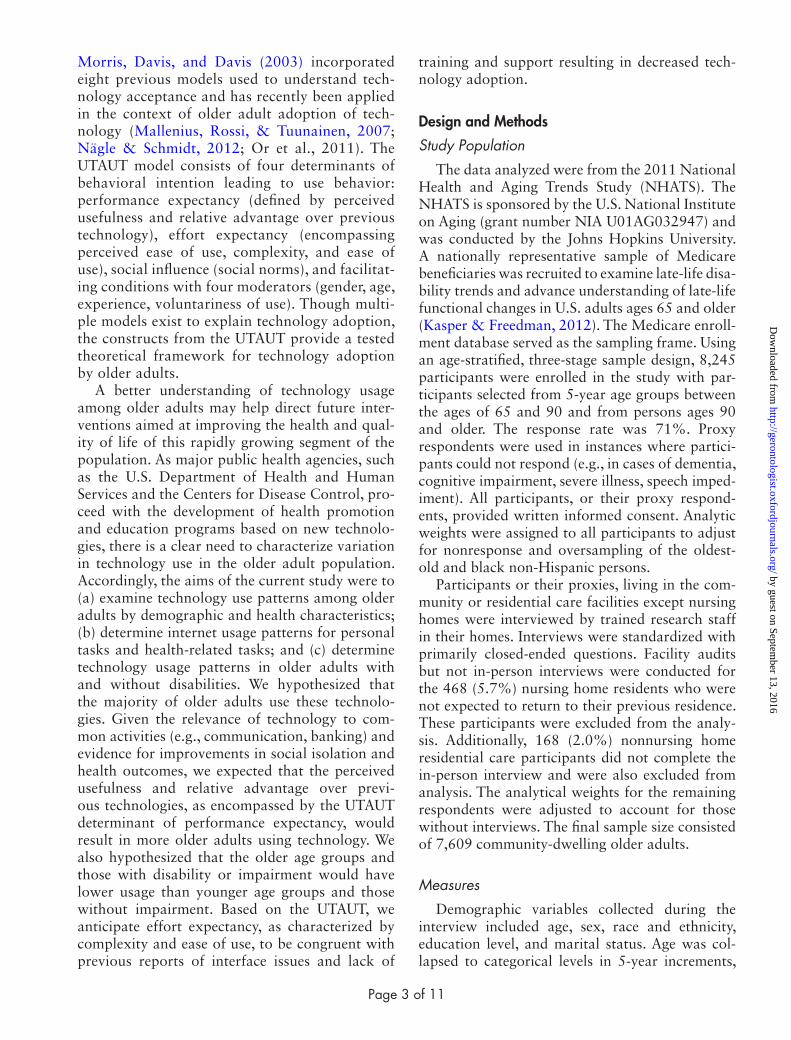
landline in the home. Overall, 47% reported using e-mail, text messaging, or the internet in the last month. The prevalence of using e-mail or text mes-saging for communication in the last month was 40.2% and 42.7% reported accessing the internet for reasons other than e-mail. As shown in Table 1, both internet use and e-mail/text messaging were associated with younger age, male sex, white race, higher education level, and being married (all p values < .001). Higher self-rated health status
Table 1. Sociodemographic and Health Characteristics and Prevalence of Technology Use in the Past Month
Total population, % (CI) E-mail/text, % (CI) Use internet % (CI)
Total population (n = 7,609) 40.2 (38.3–42.1) 42.7 (40.8–44.7)Age 65–69 27.9 (26.9–29.0) 58.7 (55.2–62.0) 63.3 (60.0–66.5) 70–74 25.0 (24.1–25.8) 47.5 (44.3–50.8) 50.3 (46.5–54.1) 75–79 19.1 (8.2–19.9) 32.3 (30.1–34.7) 35.5 (32.9–38.1) 80–84 14.7 (14.0–15.4) 26.0 (23.2–29.1) 26.4 (23.5–29.6) 85–89 9.1 (8.5–9.8) 16.7 (14.2–19.5) 15.7 (13.2–18.6) ≥90 4.3 (3.8–4.7) 10.3 (7.9–13.2)* 9.4 (7.3–12.1)*Sex Male 43.4 (42.0–44.8) 42.8 (40.0–45.5) 47.0 (44.6–49.4) Female 56.6 (55.2–58.0) 38.2 (36.0–40.5)** 39.4 (37.1–41.8)*Race/ethnicity White 80.5 (78.8–82.2) 44.7 (42.5–46.9) 47.4 (45.0–49.7) Black 8.1 (7.3–9.0) 19.9 (16.8–23.3) 22.3 (19.4–25.6) Hispanic 6.7 (5.8–7.9) 18.8 (13.4–23.6) 20.0 (14.9–26.3) Other 4.6 (3.7–5.8) 29.9 (23.6–37.0)* 30.9 (23.8–39.0)*Education level <9 years 10.4 (9.2–11.7) 4.9 (3.1–7.7) 5.5 (3.88.0) 9–11 years 11.4 (10.4–12.4) 13.0 (10.3–16.3) 14.6 (11.5–18.4) High school graduate 27.6 (26.3–28.9) 27.3 (24.9–29.9) 30.5 (27.4–33.7) Some college/vocational 26.2 (25.0–27.5) 51.8 (48.5–55.1) 55.3 (52.2–58.3) College graduate 13.0 (11.8–14.4) 66.7 (63.6–69.8) 68.1 (65.3–70.8) Advanced degree 11.3 (10.0–12.8) 75.0 (71.4–78.2)* 77.8 (74.8–80.4)*Marital status Married/living together 57.0 (55.5–58.4) 48.5 (46.0–50.9) 51.9 (49.5–54.3) Separated/divorced 12.2 (11.4–13.2) 40.2 (36.3–44.2) 41.4 (36.8–46.2) Widowed 27.1 (25.8–28.3) 24.8 (22.6–27.2) 25.8 (23.1–28.7) Never married 3.7 (3.2- 4.4) 25.7 (19.6–32.9)* 30.4 (24.2–37.4)*Multimorbidity 0 9.6 (8.9–10.3) 49.2 (45.3–53.1) 51.5 (46.6–56.4) 1 19.4 (18.4–20.4) 49.9 (46.7–53.1) 51.5 (48.1–54.9) 2 24.8 (23.7–26.0) 42.2 (39.2–45.4) 44.7 (41.6–47.8) 3 21.6 (20.6–22.7) 38.4 (35.0–41.9) 41.4 (38.5–44.4) 4 13.0 (12.1–14.0) 31.0 (27.1–35.2) 33.4 (30.1–36.9) 5 or more 11.5 (10.7–12.4) 25.8 (22.8–28.9)* 29.3 (26.1–32.8)*Self-rated health status Excellent 14.8 (13.7–15.9) 61.4 (58.0–64.8) 63.4 (60.3–66.5) Very good 29.5 (28.3–30.8) 52.5 (49.8–55.2) 54.6 (51.6–57.5) Good 30.7 (29.4–32.0) 34.8 (32.8–36.9) 37.7 (35.4–40.1) Fair 18.4 (17.3–19.5) 21.0 (18.2–24.1) 24.6 (21.9–27.5) Poor 6.7 (6.0–7.5) 16.4 (13.1–20.4)* 17.7 (14.5–21.6)*
Note: CI = confidence interval.*p < .001. **p < .01.
by guest on September 13, 2016
http://gerontologist.oxfordjournals.org/D
ownloaded from
Page 6 of 11 The Gerontologist
was significantly associated with higher technology usage, (p < .001) with 63% of those rating their health as “Excellent” using e-mail or text messag-ing compared with 16% of those rating themselves as having “poor” health status. Similarly, a higher level of multimorbidity was associated with less use of the internet and e-mail or text messaging in the last month. After adjusting for age, the technol-ogy use patterns shown in Table 1 held for all vari-ables except that the difference between men and women in e-mail and text messaging was no longer statistically significant.
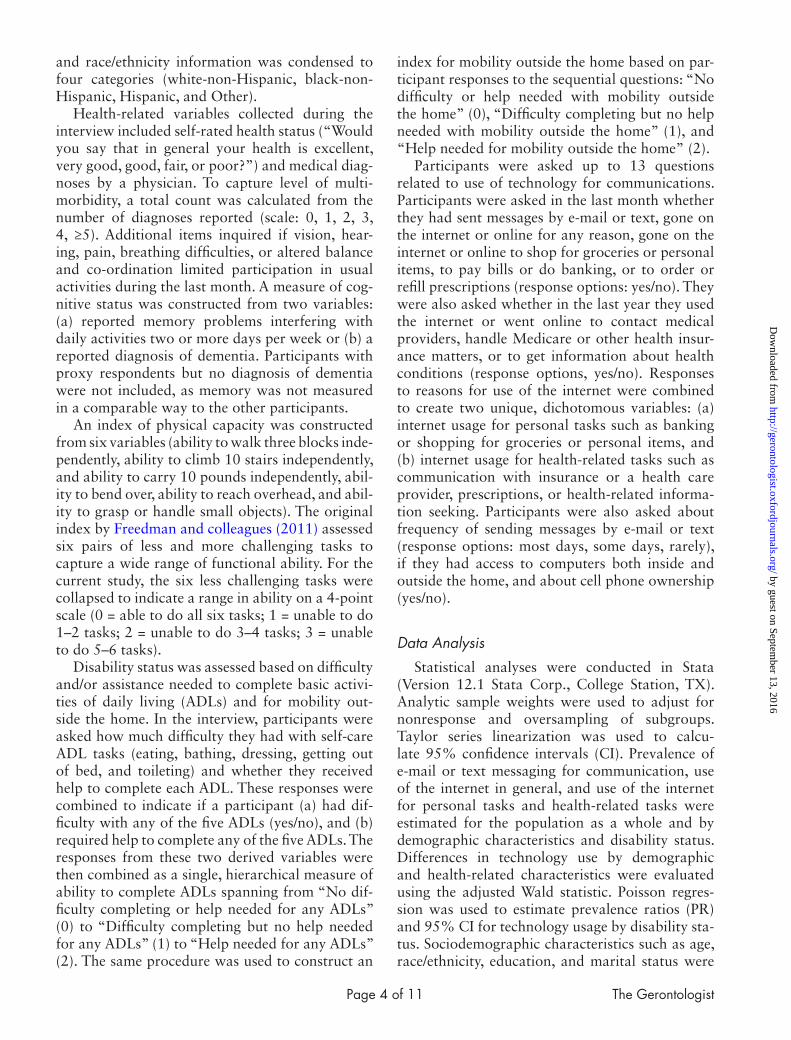
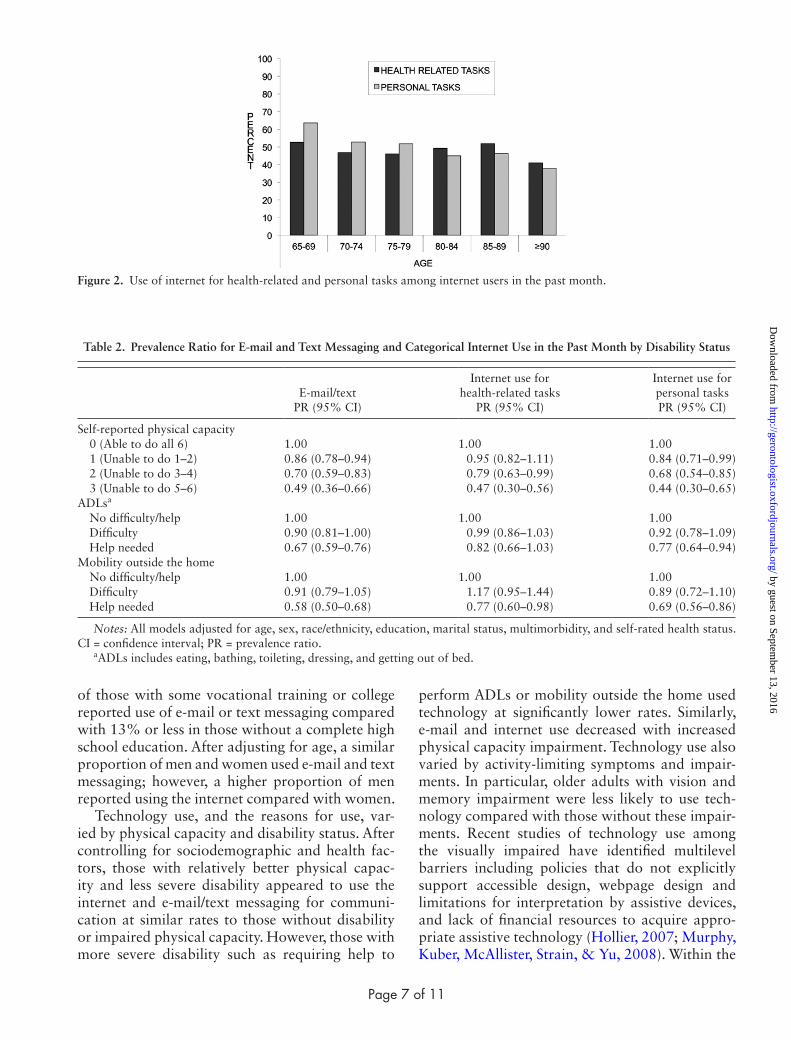
Frequency of e-mail or text messaging and fre-quency of using the internet for health-related and personal tasks generally decreased with advanc-ing age. Among those who used e-mail or text messaging for communication, 59.6% of those ages 65–69 used these technologies on most days compared with less than 45% of those 85 years and older (Figure 1). Among those who access the internet, the prevalence of internet use for personal tasks such as shopping or banking was 56%, whereas 49.4% reported using the internet for health-related tasks. As shown in Figure 2, younger cohorts use the internet for personal tasks more than older cohorts, but older cohorts use the internet for health-related tasks more than personal tasks.
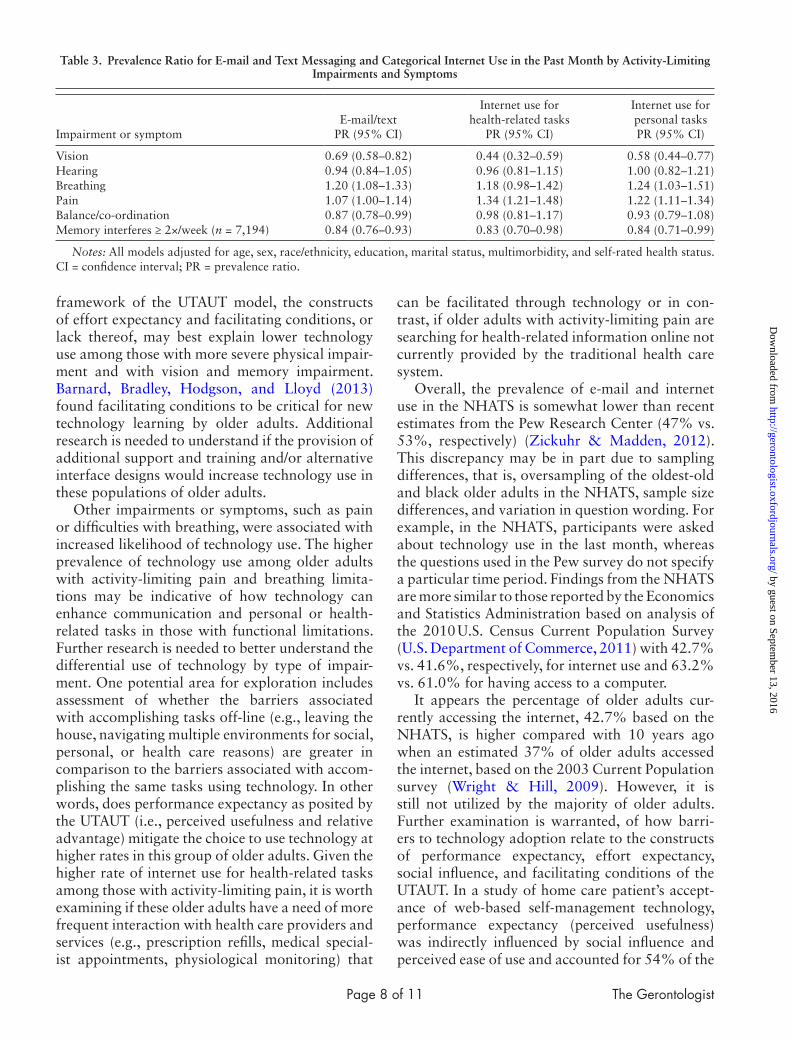
Results from the multivariate analysis of tech-nology usage by level of physical capacity and dis-ability status are presented in Table 2. All models were adjusted for sociodemographic factors, self-rated health status, and multimorbidity. Generally, those with more impairment were less likely to use e-mail/text messaging or use the internet for personal tasks across the three different measures (physical capacity, ADLs, mobility). However,
there was no difference in internet use for health-related information by level of ADL dependence; whereas those needing help with outdoor mobil-ity or with less physical capacity were less likely to use the internet for health-related information. Those with lower scores on the physical capacity index had lower usage of the internet for personal (PR = 0.44, 95% CI: 0.30–0.65) and health-related tasks (PR = 0.47, 95% CI: 0.30–0.56) after adjust-ing for sociodemographic and health factors.
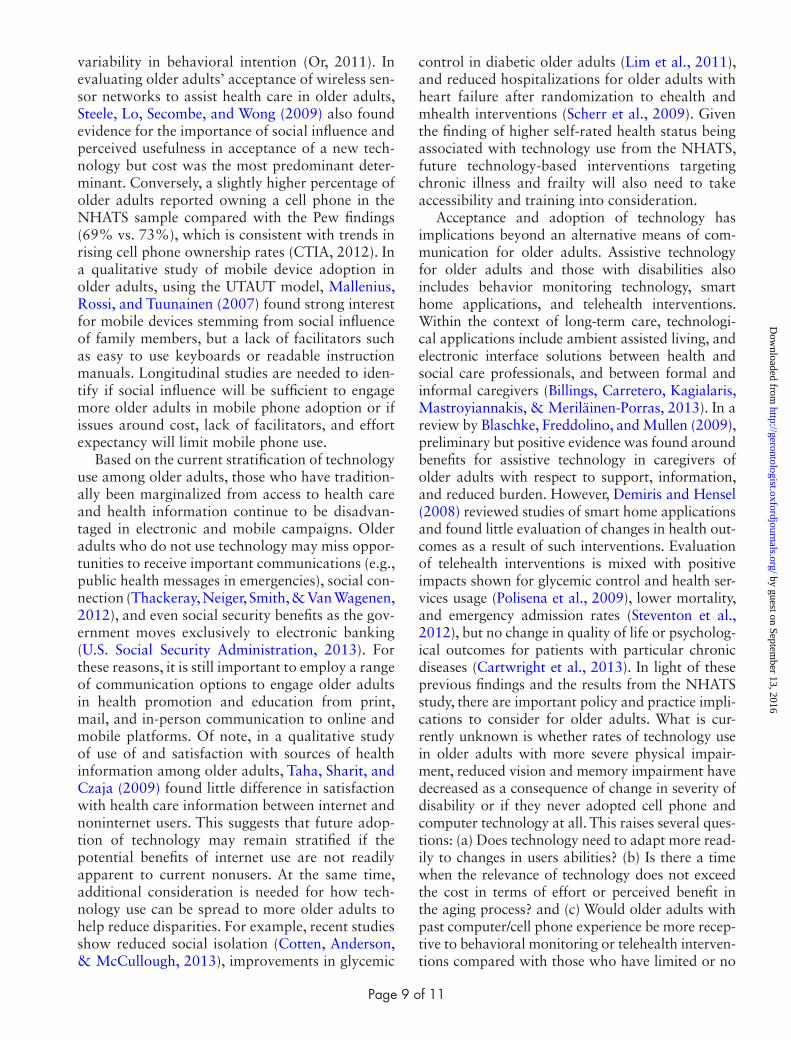
Comparisons of technology use by different health impairments and symptoms are presented in Table 3. All models were adjusted for age, sex, race/ethnicity, education, marital status, multimorbid-ity, and self-rated health status. Technology use did not vary by the presence of hearing impairment or balance or co-ordination impairments. Technology use was 20%–34% higher in those with breathing difficulties (e.g., use of e-mail/text; PR = 1.20, 95% CI: 1.08–1.33) and pain that limits function (e.g., use of internet for health-related tasks; PR = 1.34, 95% CI: 1.21–1.48). Impairments in vision and memory were associated with decreased usage of e-mail and text messaging and the internet.
Discussion
In this large, nationally representative study of older adults in 2011, the use of technology for com-munication and access to the internet among older adults was highly stratified by age, sex, education level, race/ethnicity, and marital status as well as by physical capacity and disability status. Use of the internet was highest in the younger age groups, with more than 50% of those ages 65–74 using the internet compared with less than 10% of those ages 90 and older. Additionally, more than 50%
Figure 1. Frequency of e-mail or text messaging in the past month among those who e-mail or text.
by guest on September 13, 2016
http://gerontologist.oxfordjournals.org/D
ownloaded from
Page 7 of 11
of those with some vocational training or college reported use of e-mail or text messaging compared with 13% or less in those without a complete high school education. After adjusting for age, a similar proportion of men and women used e-mail and text messaging; however, a higher proportion of men reported using the internet compared with women.
Technology use, and the reasons for use, var-ied by physical capacity and disability status. After controlling for sociodemographic and health fac-tors, those with relatively better physical capac-ity and less severe disability appeared to use the internet and e-mail/text messaging for communi-cation at similar rates to those without disability or impaired physical capacity. However, those with more severe disability such as requiring help to
perform ADLs or mobility outside the home used technology at significantly lower rates. Similarly, e-mail and internet use decreased with increased physical capacity impairment. Technology use also varied by activity-limiting symptoms and impair-ments. In particular, older adults with vision and memory impairment were less likely to use tech-nology compared with those without these impair-ments. Recent studies of technology use among the visually impaired have identified multilevel barriers including policies that do not explicitly support accessible design, webpage design and limitations for interpretation by assistive devices, and lack of financial resources to acquire appro-priate assistive technology (Hollier, 2007; Murphy, Kuber, McAllister, Strain, & Yu, 2008). Within the
Figure 2. Use of internet for health-related and personal tasks among internet users in the past month.
Table 2. Prevalence Ratio for E-mail and Text Messaging and Categorical Internet Use in the Past Month by Disability Status
E-mail/text PR (95% CI)
Internet use for health-related tasks
PR (95% CI)
Internet use for personal tasks PR (95% CI)
Self-reported physical capacity 0 (Able to do all 6) 1.00 1.00 1.00 1 (Unable to do 1–2) 0.86 (0.78–0.94) 0.95 (0.82–1.11) 0.84 (0.71–0.99) 2 (Unable to do 3–4) 0.70 (0.59–0.83) 0.79 (0.63–0.99) 0.68 (0.54–0.85) 3 (Unable to do 5–6) 0.49 (0.36–0.66) 0.47 (0.30–0.56) 0.44 (0.30–0.65)ADLsa
No difficulty/help 1.00 1.00 1.00 Difficulty 0.90 (0.81–1.00) 0.99 (0.86–1.03) 0.92 (0.78–1.09) Help needed 0.67 (0.59–0.76) 0.82 (0.66–1.03) 0.77 (0.64–0.94)Mobility outside the home No difficulty/help 1.00 1.00 1.00 Difficulty 0.91 (0.79–1.05) 1.17 (0.95–1.44) 0.89 (0.72–1.10) Help needed 0.58 (0.50–0.68) 0.77 (0.60–0.98) 0.69 (0.56–0.86)
Notes: All models adjusted for age, sex, race/ethnicity, education, marital status, multimorbidity, and self-rated health status. CI = confidence interval; PR = prevalence ratio.
aADLs includes eating, bathing, toileting, dressing, and getting out of bed.
by guest on September 13, 2016
http://gerontologist.oxfordjournals.org/D
ownloaded from
Page 8 of 11 The Gerontologist
framework of the UTAUT model, the constructs of effort expectancy and facilitating conditions, or lack thereof, may best explain lower technology use among those with more severe physical impair-ment and with vision and memory impairment. Barnard, Bradley, Hodgson, and Lloyd (2013) found facilitating conditions to be critical for new technology learning by older adults. Additional research is needed to understand if the provision of additional support and training and/or alternative interface designs would increase technology use in these populations of older adults.
Other impairments or symptoms, such as pain or difficulties with breathing, were associated with increased likelihood of technology use. The higher prevalence of technology use among older adults with activity-limiting pain and breathing limita-tions may be indicative of how technology can enhance communication and personal or health-related tasks in those with functional limitations. Further research is needed to better understand the differential use of technology by type of impair-ment. One potential area for exploration includes assessment of whether the barriers associated with accomplishing tasks off-line (e.g., leaving the house, navigating multiple environments for social, personal, or health care reasons) are greater in comparison to the barriers associated with accom-plishing the same tasks using technology. In other words, does performance expectancy as posited by the UTAUT (i.e., perceived usefulness and relative advantage) mitigate the choice to use technology at higher rates in this group of older adults. Given the higher rate of internet use for health-related tasks among those with activity-limiting pain, it is worth examining if these older adults have a need of more frequent interaction with health care providers and services (e.g., prescription refills, medical special-ist appointments, physiological monitoring) that
can be facilitated through technology or in con-trast, if older adults with activity-limiting pain are searching for health-related information online not currently provided by the traditional health care system.
Overall, the prevalence of e-mail and internet use in the NHATS is somewhat lower than recent estimates from the Pew Research Center (47% vs. 53%, respectively) (Zickuhr & Madden, 2012). This discrepancy may be in part due to sampling differences, that is, oversampling of the oldest-old and black older adults in the NHATS, sample size differences, and variation in question wording. For example, in the NHATS, participants were asked about technology use in the last month, whereas the questions used in the Pew survey do not specify a particular time period. Findings from the NHATS are more similar to those reported by the Economics and Statistics Administration based on analysis of the 2010 U.S. Census Current Population Survey (U.S. Department of Commerce, 2011) with 42.7% vs. 41.6%, respectively, for internet use and 63.2% vs. 61.0% for having access to a computer.
It appears the percentage of older adults cur-rently accessing the internet, 42.7% based on the NHATS, is higher compared with 10 years ago when an estimated 37% of older adults accessed the internet, based on the 2003 Current Population survey (Wright & Hill, 2009). However, it is still not utilized by the majority of older adults. Further examination is warranted, of how barri-ers to technology adoption relate to the constructs of performance expectancy, effort expectancy, social influence, and facilitating conditions of the UTAUT. In a study of home care patient’s accept-ance of web-based self-management technology, performance expectancy (perceived usefulness) was indirectly influenced by social influence and perceived ease of use and accounted for 54% of the
Table 3. Prevalence Ratio for E-mail and Text Messaging and Categorical Internet Use in the Past Month by Activity-Limiting Impairments and Symptoms
Impairment or symptomE-mail/text
PR (95% CI)
Internet use for health-related tasks
PR (95% CI)
Internet use for personal tasks PR (95% CI)
Vision 0.69 (0.58–0.82) 0.44 (0.32–0.59) 0.58 (0.44–0.77)Hearing 0.94 (0.84–1.05) 0.96 (0.81–1.15) 1.00 (0.82–1.21)Breathing 1.20 (1.08–1.33) 1.18 (0.98–1.42) 1.24 (1.03–1.51)Pain 1.07 (1.00–1.14) 1.34 (1.21–1.48) 1.22 (1.11–1.34)Balance/co-ordination 0.87 (0.78–0.99) 0.98 (0.81–1.17) 0.93 (0.79–1.08)Memory interferes ≥ 2×/week (n = 7,194) 0.84 (0.76–0.93) 0.83 (0.70–0.98) 0.84 (0.71–0.99)
Notes: All models adjusted for age, sex, race/ethnicity, education, marital status, multimorbidity, and self-rated health status. CI = confidence interval; PR = prevalence ratio.
by guest on September 13, 2016
http://gerontologist.oxfordjournals.org/D
ownloaded from
Page 9 of 11
variability in behavioral intention (Or, 2011). In evaluating older adults’ acceptance of wireless sen-sor networks to assist health care in older adults, Steele, Lo, Secombe, and Wong (2009) also found evidence for the importance of social influence and perceived usefulness in acceptance of a new tech-nology but cost was the most predominant deter-minant. Conversely, a slightly higher percentage of older adults reported owning a cell phone in the NHATS sample compared with the Pew findings (69% vs. 73%), which is consistent with trends in rising cell phone ownership rates (CTIA, 2012). In a qualitative study of mobile device adoption in older adults, using the UTAUT model, Mallenius, Rossi, and Tuunainen (2007) found strong interest for mobile devices stemming from social influence of family members, but a lack of facilitators such as easy to use keyboards or readable instruction manuals. Longitudinal studies are needed to iden-tify if social influence will be sufficient to engage more older adults in mobile phone adoption or if issues around cost, lack of facilitators, and effort expectancy will limit mobile phone use.
Based on the current stratification of technology use among older adults, those who have tradition-ally been marginalized from access to health care and health information continue to be disadvan-taged in electronic and mobile campaigns. Older adults who do not use technology may miss oppor-tunities to receive important communications (e.g., public health messages in emergencies), social con-nection (Thackeray, Neiger, Smith, & Van Wagenen, 2012), and even social security benefits as the gov-ernment moves exclusively to electronic banking (U.S. Social Security Administration, 2013). For these reasons, it is still important to employ a range of communication options to engage older adults in health promotion and education from print, mail, and in-person communication to online and mobile platforms. Of note, in a qualitative study of use of and satisfaction with sources of health information among older adults, Taha, Sharit, and Czaja (2009) found little difference in satisfaction with health care information between internet and noninternet users. This suggests that future adop-tion of technology may remain stratified if the potential benefits of internet use are not readily apparent to current nonusers. At the same time, additional consideration is needed for how tech-nology use can be spread to more older adults to help reduce disparities. For example, recent studies show reduced social isolation (Cotten, Anderson, & McCullough, 2013), improvements in glycemic
control in diabetic older adults (Lim et al., 2011), and reduced hospitalizations for older adults with heart failure after randomization to ehealth and mhealth interventions (Scherr et al., 2009). Given the finding of higher self-rated health status being associated with technology use from the NHATS, future technology-based interventions targeting chronic illness and frailty will also need to take accessibility and training into consideration.
Acceptance and adoption of technology has implications beyond an alternative means of com-munication for older adults. Assistive technology for older adults and those with disabilities also includes behavior monitoring technology, smart home applications, and telehealth interventions. Within the context of long-term care, technologi-cal applications include ambient assisted living, and electronic interface solutions between health and social care professionals, and between formal and informal caregivers (Billings, Carretero, Kagialaris, Mastroyiannakis, & Meriläinen-Porras, 2013). In a review by Blaschke, Freddolino, and Mullen (2009), preliminary but positive evidence was found around benefits for assistive technology in caregivers of older adults with respect to support, information, and reduced burden. However, Demiris and Hensel (2008) reviewed studies of smart home applications and found little evaluation of changes in health out-comes as a result of such interventions. Evaluation of telehealth interventions is mixed with positive impacts shown for glycemic control and health ser-vices usage (Polisena et al., 2009), lower mortality, and emergency admission rates (Steventon et al., 2012), but no change in quality of life or psycholog-ical outcomes for patients with particular chronic diseases (Cartwright et al., 2013). In light of these previous findings and the results from the NHATS study, there are important policy and practice impli-cations to consider for older adults. What is cur-rently unknown is whether rates of technology use in older adults with more severe physical impair-ment, reduced vision and memory impairment have decreased as a consequence of change in severity of disability or if they never adopted cell phone and computer technology at all. This raises several ques-tions: (a) Does technology need to adapt more read-ily to changes in users abilities? (b) Is there a time when the relevance of technology does not exceed the cost in terms of effort or perceived benefit in the aging process? and (c) Would older adults with past computer/cell phone experience be more recep-tive to behavioral monitoring or telehealth interven-tions compared with those who have limited or no
by guest on September 13, 2016
http://gerontologist.oxfordjournals.org/D
ownloaded from
Page 10 of 11 The Gerontologist
experience with newer technologies. The plan to reassess and interview participants in the NHATS longitudinally should provide more insight in this area in the coming years. In the meantime, it will be necessary for health practitioners and policy makers to weigh the benefits of communication through computers and cell phones with the cost of lower reach to a significant portion of the older adult population (i.e., the oldest-old and those with disability).
The current study had several strengths and lim-itations. The use of multiple measures for impair-ment and disability is a strength of the NHATS data collection instrument and provides more nuanced detail to describe older adult technology users. The selection of a representative sample of Medicare beneficiaries age 65 and older, including use of proxy respondents in cases where partici-pants could not respond, allows for generalizability of the results. The study was limited by the design of the questions related to technology use. There is some evidence to show differentiation between use of mobile technology versus traditional computers, with increasing numbers of people having access to the internet and e-mail through mobile phones. The 2011 NHATS survey did not differentiate between modes of access to the internet. Further, the survey questions did not ask participants to dif-ferentiate by the type of cell phone owned. More in-depth questions and research are needed to bet-ter describe the specific types of technology used by older adults and specific reasons for their use.
Despite increasing ownership rates of cell phones and computers among older adults, a large segment of this population does not cur-rently use e-mail or text messaging or access the internet. Although mhealth and ehealth programs hold promise for closing the health care access and information gap, the results from the current study show there is limited technology use among those who may be able to benefit the most from such programs. Continued tracking of technology use among older adults is needed to assess how newer technologies are incorporated and to better under-stand financial and health outcomes from lack of technology use among the majority of older adults.
Funding
This project was supported by the National Institute on Aging (T32 AG027677). The National Health and Aging Trends Study (NHATS) is sponsored by the National Institute on Aging (grant number NIA U01AG32947) and was conducted by the Johns Hopkins University.
ReferencesBarnard, Y., Bradley, M. D., Hodgson, F., & Lloyd, A. D. (2013). Learning
to use new technologies by older adults: Perceived difficulties, experi-mentation behaviour and usability. Computers in Human Behavior, 29, 1715–1724. doi:10.1016/j.chb.2013.02.006
Beach, S.R., Schulz, R., Downs, J., Matthews, J., Barron, B., & Seelman, K. (2009). Disability, age, and informational privacy attitudes in quality of life technology applications: Results from a national web survey. ACM Transactions on Accessible Computing (TACCESS), 2, 1–21. doi:10.1145/1525840.1525846
Billings, J., Carretero, S., Kagialaris, G., Mastroyiannakis, T., & Meriläinen-Porras, S. (2013). The role of information technology in LTC for older people. In K. Leichsenring, J. Billings, & H. Nies (Eds.), Long-Term Care in Europe – Improving Policy and Practice (pp. 252–277). Basingstoke: Palgrave Macmillan.
Blaschke, C. M., Freddolino, P. P., & Mullen, E. E. (2009). Ageing and tech-nology: A review of the research literature. British Journal of Social Work, 39, 641–656. doi:10.1093/bjsw/bcp025
Boulton-Lewis, G. M., Buys, L., Lovie-Kitchin, J., Barnett, K., & David, L. N. (2007). Ageing, learning, and computer tech-nology in Australia. Educational Gerontology, 33, 253–270. doi:10.1080/03601270601161249
Carpenter, B. D., & Buday, S. (2007). Computer use among older adults in a naturally occurring retirement community. Computers in Human Behavior, 2, 3012–3024. doi:10.1016/j.chb.2006.08.015
Cartwright, M., Hirani, S. P., Rixon, L., Beynon, M., Doll, H., Bower, P., …Newman, S. P. Whole Systems Demonstrator Evaluation Team. (2013). Effect of telehealth on quality of life and psychological out-comes over 12 months (Whole Systems Demonstrator telehealth questionnaire study): Nested study of patient reported outcomes in a pragmatic, cluster randomised controlled trial. BMJ (Clinical research ed.), 346, f653. doi:10.1136/bmj.f653
Choi, N. (2011). Relationship between health service use and health information technology use among older adults: Analysis of the U.S. National Health Interview Survey. Journal of Medical Internet Research, 13, e33. doi: 10.2196/jmir.1753
Christensen, K., Doblhammer, G., Rau, R., & Vaupel, J. W. (2009). Ageing populations: The challenges ahead. Lancet, 374, 1196–1208. doi:10.1016/S0140-6736(09)61460–4
Cotten, S. R., Anderson, W. A., & McCullough, B. M. (2013). Impact of internet use on loneliness and contact with others among older adults: cross-sectional analysis. Journal of Medical Internet Research, 15, e39. doi:10.2196/jmir.2306
CTIA—The Wireless Association. (2012). Retrieved December 14, 2012, from http://www.ctia.org/.
Czaja, S. J., & Lee, C. C. (2007). The impact of aging on access to tech-nology. Universal Access in the Information Society, 5, 341–349. doi:10.1007/s10209-006-0060-x
Demiris, G., & Hensel, B. K. (2008). Technologies for an aging society: A systematic review of “smart home” applications. Yearbook of medi-cal informatics, 47(Suppl. 1), 33–40.
Fox, S., & Duggan, M. (2012). Mobile Health 2012. Pew Research Center. Retrieved December 12, 2012, from http://www.pewinternet.org/Reports/2012/Mobile-Health/Main-Findings/Mobile-Health.aspx.
Freedman, V. A., Kasper, J. D., Cornman, J. C., Agree, E. M., Bandeen-Roche, K., …Wolf, D. A., (2011). Validation of new measures of dis-ability and functioning in the Naional Health and Aging Trends Study. The Journals of Gerontology Series A: Biological Sciences and Medical Sciences, 66, 1013–1021. doi:10.1093/gerona/glr087
Gerber, T., Olazabal, V., Brown, K., & Pablos-Mendez, A. (2010). An agenda for action on global e-health. Health Affairs, 29, 233–236. doi:10.1377/hlthaff.2009.0934
Giuliani, C. A., Gruber-Baldini, A. L., Park, N. S., Schrodt, L. A., Rokoske, F., Sloane, P. D., & Zimmerman, S. (2008). Physical perfor-mance characteristics of assisted living residents and risk for adverse health outcomes. The Gerontologist, 48, 203–212. doi:10.1093/geront/48.2.203
Guralnik, J. M., Fried, L. P., Simonsick, E. M., Kasper, J. D., & Lafferty, M. E.. (1995). The Women’s Health and Aging Study: Health and Social Characteristics of Older Women With Disability. Bethesda, MD: National Institute on Aging. NIH publication 95–4009, appen-dix E.
Heart, T., & Kalderon, E. (2011). Older adults: Are they ready to adopt health-related ICT? International Journal of Medical Informatics, 82, e209–e231. doi:10.1016/j.ijmedinf.2011.03.002
by guest on September 13, 2016
http://gerontologist.oxfordjournals.org/D
ownloaded from
Page 11 of 11
Hollier, S. E. (2007). The disability divide: A study into the impact of com-puting and internet-related technologies on people who are blind or vision impaired. (pp.230–240) GLADNET Collection.
Internet World Statistics (n.d.). Retrieved December 14, 2012, from http://www.internetworldstats.com/stats.htm.
Kasper, J. D., & Freedman, V. A. (2012). National Health and Aging Trends Study Round 1 User Guide. Baltimore: Johns Hopkins University School of Public Health.
Lim, S., Kang, S. M., Shin, H., Lee, H. J., Yoon, J. W., Yu, S. H., …Jang, H. C. (2011). Improved glycemic control without hypoglycemia in elderly diabetic patients using the ubiquitous healthcare service, a new medical information system. Diabetes Care, 34, 308–313. doi:10.2337/dc10-1447
Mallenius, S., Rossi, M., & Tuunainen, V. K. (2007). Factors affecting the adoption and use of mobile devices and services by elderly people–results from a pilot study. 6th Annual Global Mobility Roundtable.
Murphy, E., Kuber, R., McAllister, G., Strain, P., & Yu, W. (2008). An empirical investigation into the difficulties experienced by visually impaired Internet users. Universal Access in the Information Society, 7, 79–91. doi:10.1007/s10209-007-0098-4
Nägle, S., & Schmidt, L. (2012). Computer acceptance of older adults. Work: A Journal of Prevention, Assessment and Rehabilitation, 41(Suppl. 1), 3541–3548. doi:10.3233/WOR-2012-0633-3541
Nimrod, G. (2009). Senior’s online communities: A quantitative content analysis. The Gerontologist, 50, 382–392. doi:10.1093/geront/gnp141
Nosek, M. A., Hughes, R. B., Swedlund, N., Taylor, H. B., & Swank, P. (2003). Self-esteem and women with disabilities. Social Science & Medicine, 56, 1737–1747. doi: 10.1016/S0277-9536(02)00169-7
Or, C. K., Karsh, B. T., Severtson, D. J., Burke, L. J., Brown, R. L., & Brennan, P. F. (2011). Factors affecting home care patients’ acceptance of a web-based interactive self-management technology. Journal of the American Medical Informatics Association, 18, 51–59. doi:10.1136/jamia.2010.007336
Polisena, J., Tran, K., Cimon, K., Hutton, B., McGill, S., & Palmer, K. (2009). Home telehealth for diabetes management: A systematic review and meta-analysis. Diabetes, Obesity and Metabolism, 11, 913–930. doi:10.1111/j.1463-1326.2009.01057.x
Scherr, D., Kastner, P., Kollmann, A., Hallas, A., Auer, J., Krappinger, H., …Fruhwald, F. M. MOBITEL Investigators. (2009). Effect of home-based telemonitoring using mobile phone technology on the outcome of heart failure patients after an episode of acute decompensation: Randomized controlled trial. Journal of medical Internet research, 11, e34. doi:10.2196/jmir.1252
Selwyn, N., Gorard, S., Furlong, J., & Madden, L. (2003). Older adults’ use of information and communication technology in everyday life. Ageing and Society, 23, 561–582. doi:10.1017/S0144686X03001302
Sourbati, M. (2009). ‘It could be useful, but not for me at the moment’: Older people, internet access and e-public service provision. New Media & Society, 11, 1083–1100. doi:10.1177/1461444809340786
Steele, R., Lo, A., Secombe, C., & Wong, Y. K. (2009). Elderly persons’ perception and acceptance of using wireless sensor networks to assist healthcare. International Journal of Medical Informatics, 78, 788–801. doi:/10.1016/j.ijmedinf.2009.08.001
Steventon, A., Bardsley, M., Billings, J., Dixon, J., Doll, H., Hirani, S., …Newman, S. Whole System Demonstrator Evaluation Team. (2012). Effect of telehealth on use of secondary care and mortality: Findings from the Whole System Demonstrator cluster randomised trial. BMJ (Clinical research ed.), 344, e3874. doi:10.1136/bmj.e3874
Taha, J., Sharit, J., & Czaja, S. (2009). Use of and satisfaction with sources of health information among older internet users and nonusers. The Gerontologist, 49, 663–673. doi:10.1093/geront/gnp058
Thackeray, R., Neiger, B. L., Smith, A. K., & Van Wagenen, S. B. (2012). Adoption and use of social media among public health departments. BMC public health, 12, 242. doi:10.1186/1471-2458-12-242
U.S. Department of Commerce. (2011). Retrieved September 18, 2013, from http://www.ntia.doc.gov/files/ntia/publications/exploring_the_digital_nation_computer_and_internet_use_at_home_11092011.pdf.
U.S. Department of Health and Human Services. (2011). Retrieved December 10, 2012, from http://www.aoa.gov/AoARoot/Aging_Statistics/Profile/2011/16.aspx.
U.S. Social Security Administration. (2013) . Retrieved April 2, 2013, from http://www.ssa.gov/deposit/
Venkatesh, V., Morris, M. G., Davis, G. B., & Davis, F. D. (2003). User acceptance of information technology: Toward a unified view. MIS quarterly, 27, 425–478.
World Health Organization. (2011). mHealth: New horizons for health through mobile technologies. Retrieved March 27, 2013, from http://www.who.int/goe/publications/goe_mhealth_web.pdf
Wright, D. W., & Hill, T. J. (2009). Prescription for trouble: Medicare Part D and patterns of computer and internet access among the elderly. Journal of Aging & SocialPolicy, 21, 172–186. doi:10.1080/08959420902732514
Zickuhr, K., & Madden, M. (2012). Older adults and internet use. Pew Internet & American Life Project. Retrieved March 22, 2013, from http://pewinternet.org/Reports/2012/Older-adults-and-internet-use.aspx
by guest on September 13, 2016
http://gerontologist.oxfordjournals.org/D
ownloaded from
Top Related
Copyright © 2022 FDOKUMEN

