


Bahasa
Halaman
Hukum


The Sun
2 of 39 http://www.open.edu/openlearn/science-maths-technology/science/physics-and-astronomy/the-sun/content-section-0?utm_source=openlearnutm_campaign=olutm_medium=ebook Wednesday 29 May 2019

About this free course
This free course provides a sample of level 1 study in Sciencehttp://www.open.ac.uk/courses/find/science
This version of the content may include video, images and interactive content that may not be optimisedfor your device.
You can experience this free course as it was originally designed on OpenLearn, the home of freelearning from The Open University:http://www.open.edu/openlearn/science-maths-technology/science/physics-and-astronomy/the-sun/con-tent-section-0.
There you'll also be able to track your progress via your activity record, which you can use todemonstrate your learning.
The Open University, Walton Hall, Milton Keynes, MK7 6AA
Copyright © 2016 The Open University
Intellectual property
Unless otherwise stated, this resource is released under the terms of the Creative Commons Licencev4.0 http://creativecommons.org/licenses/by-nc-sa/4.0/deed.en_GB. Within that The Open Universityinterprets this licence in the following way:www.open.edu/openlearn/about-openlearn/frequently-asked-questions-on-openlearn. Copyright andrights falling outside the terms of the Creative Commons Licence are retained or controlled by The OpenUniversity. Please read the full text before using any of the content.
We believe the primary barrier to accessing high-quality educational experiences is cost, which is whywe aim to publish as much free content as possible under an open licence. If it proves difficult to releasecontent under our preferred Creative Commons licence (e.g. because we can't afford or gain theclearances or find suitable alternatives), we will still release the materials for free under a personal end-user licence.
This is because the learning experience will always be the same high quality offering and that shouldalways be seen as positive - even if at times the licensing is different to Creative Commons.
When using the content you must attribute us (The Open University) (the OU) and any identified author inaccordance with the terms of the Creative Commons Licence.
The Acknowledgements section is used to list, amongst other things, third party (Proprietary), licensedcontent which is not subject to Creative Commons licensing. Proprietary content must be used (retained)intact and in context to the content at all times.
The Acknowledgements section is also used to bring to your attention any other Special Restrictionswhich may apply to the content. For example there may be times when the Creative Commons Non-Commercial Sharealike licence does not apply to any of the content even if owned by us (The OpenUniversity). In these instances, unless stated otherwise, the content may be used for personal and non-commercial use.
We have also identified as Proprietary other material included in the content which is not subject toCreative Commons Licence. These are OU logos, trading names and may extend to certainphotographic and video images and sound recordings and any other material as may be brought to yourattention.
Unauthorised use of any of the content may constitute a breach of the terms and conditions and/orintellectual property laws.
We reserve the right to alter, amend or bring to an end any terms and conditions provided here withoutnotice.
All rights falling outside the terms of the Creative Commons licence are retained or controlled by TheOpen University.
3 of 39 http://www.open.edu/openlearn/science-maths-technology/science/physics-and-astronomy/the-sun/content-section-0?utm_source=openlearnutm_campaign=olutm_medium=ebook Wednesday 29 May 2019

Head of Intellectual Property, The Open University
The Open University
United Kingdom at the University Press, Cambridge
ContentsIntroduction 5Learning Outcomes 61 Observing the Sun 7
1.1 The Sun at visible wavelengths 71.3 Beyond visible light 121.4 The invisible Sun 14
2 Inside the Sun 223 Measuring the Sun 28
3.1 Angular size 283.2 Angular size, actual size and distance 29
4 course summary 342.6 End-of-course questions 35Conclusion 37Keep on learning 38Acknowledgements 38
4 of 39 http://www.open.edu/openlearn/science-maths-technology/science/physics-and-astronomy/the-sun/content-section-0?utm_source=openlearnutm_campaign=olutm_medium=ebook Wednesday 29 May 2019
IntroductionFor astronomers, the Sun is fascinating because it is our nearest star. By studying theSun, they can gain an insight into the workings of the other millions of stars that are visiblein the night sky. Learning that the Sun is a star can be a little surprising. After all, the Sunis a brightly glowing, yellow object - so bright that it is dangerous to look at it directly, andso hot that we can feel its radiation warming the whole Earth. Stars, on the other hand, aremere silvery pinpoints of light that are visible only against the darkness of the night skyand with no discernible heating effect on Earth. How can they possibly be the same sort ofobject? The key to the answer lies in their distances.In astronomical terms, the Sun is relatively close, being only about 150 million kilometres(93 million miles) from Earth. The stars that are visible at night are much further away: thenearest is about 40 million million kilometres from Earth, and most are much more distantthan that. Imagine looking at a glowing light bulb first from very close up and then from amuch greater distance. Close up, you would see the shape of the bulb but, from far away,it would be just a point of light.This OpenLearn course provides a sample of level 1 study in Science
Introduction
5 of 39 http://www.open.edu/openlearn/science-maths-technology/science/physics-and-astronomy/the-sun/content-section-0?utm_source=openlearnutm_campaign=olutm_medium=ebook Wednesday 29 May 2019

Learning OutcomesAfter studying this course, you should be able to:● demonstrate knowledge of the electromagnetic spectrum and how it is used to infer properties of sources of
radiation● demonstrate knowledge of the range of sizes, distances and motions of objects in the Universe and how they can
be measured● demonstrate knowledge of the structure of, and the main processes operating in, the Sun● comprehend concepts lying well outside everyday experience, including those that involve very large and very
small distances, times, temperatures and energies, and those that are non-intuitive.
1 Observing the Sun
Safety warningNever look directly at the Sun, either with the unaided eye or through spectacles,binoculars or a telescope. You risk permanently damaging your eyes if you do so.
1.1 The Sun at visible wavelengthsThe Sun is seen as a blindingly bright, yellow object in the sky. The part of the Sun thatyou normally see is called the photosphere (meaning 'sphere of light'); this is bestthought of as the 'surface' of the Sun, although it is very different from the surface of aplanet such as Earth. Its diameter is about 1.4 million kilometres, making the Sun'svolume roughly one million times that of the Earth. The photosphere is not solid. Rather, itis a thin layer of hot gaseous material, about 500 kilometres deep, with an averagetemperature of about 5500 °C (degrees Celsius).Detailed studies of the body of the Sun usually require special equipment. However, thenatural phenomenon known as a total eclipse of the Sun provides an opportunity to gainfurther insight into the nature of the Sun (see Figure 1 below). A total eclipse happenswhen the Moon passes in front of the Sun and blocks out the bright light from thephotosphere.When the Moon just eclipses the bright photosphere, it is often possible to see part of anarrow, pink-coloured ring that encircles the Sun. This is the chromosphere (meaning'sphere of colour'), the lower or 'inner' part of the Sun's atmosphere. It is actually anotherlayer of gaseous material, a few thousand kilometres thick, that sits on top of thephotosphere. The lower parts of the chromosphere are cooler than the photosphere, whilethe higher parts are considerably hotter, but the chromospheric material is so thin that itemits relatively little light, and is therefore unseen under normal conditions.
1 Observing the Sun
7 of 39 http://www.open.edu/openlearn/science-maths-technology/science/physics-and-astronomy/the-sun/content-section-0?utm_source=openlearnutm_campaign=olutm_medium=ebook Wednesday 29 May 2019
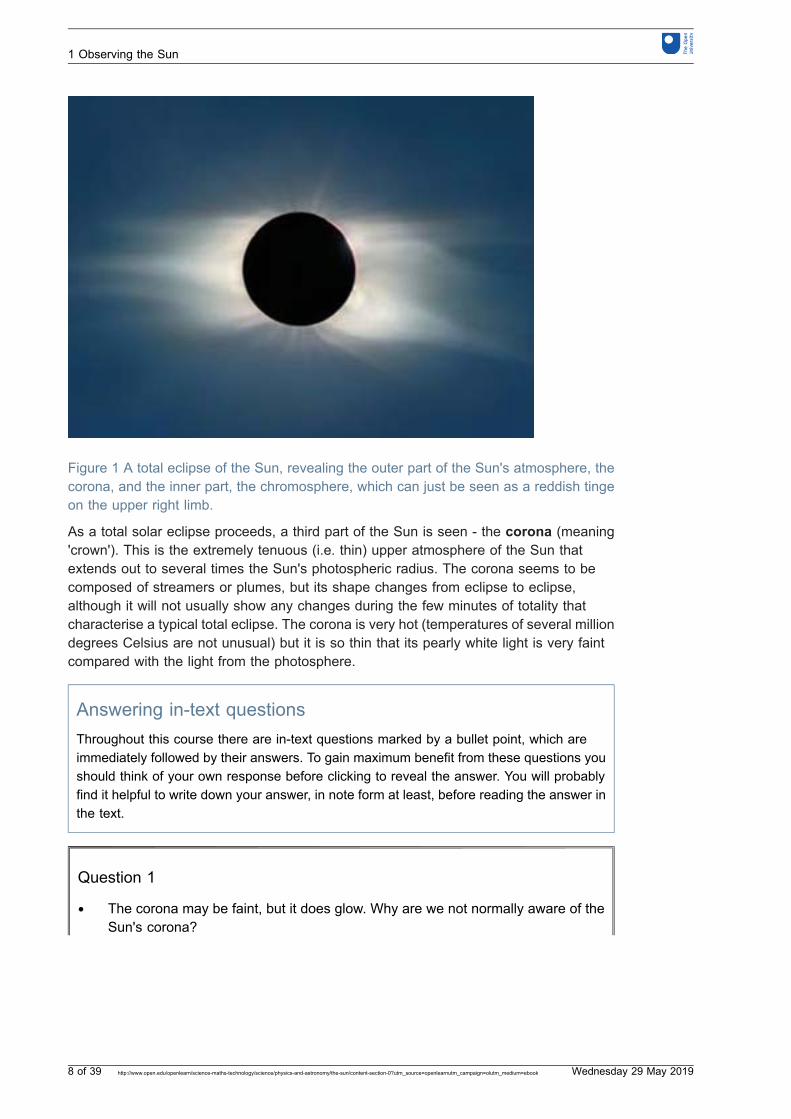
Figure 1 A total eclipse of the Sun, revealing the outer part of the Sun's atmosphere, thecorona, and the inner part, the chromosphere, which can just be seen as a reddish tingeon the upper right limb.
As a total solar eclipse proceeds, a third part of the Sun is seen - the corona (meaning'crown'). This is the extremely tenuous (i.e. thin) upper atmosphere of the Sun thatextends out to several times the Sun's photospheric radius. The corona seems to becomposed of streamers or plumes, but its shape changes from eclipse to eclipse,although it will not usually show any changes during the few minutes of totality thatcharacterise a typical total eclipse. The corona is very hot (temperatures of several milliondegrees Celsius are not unusual) but it is so thin that its pearly white light is very faintcompared with the light from the photosphere.
Answering in-text questionsThroughout this course there are in-text questions marked by a bullet point, which areimmediately followed by their answers. To gain maximum benefit from these questions youshould think of your own response before clicking to reveal the answer. You will probablyfind it helpful to write down your answer, in note form at least, before reading the answer inthe text.
Question 1
● The corona may be faint, but it does glow. Why are we not normally aware of theSun's corona?
1 Observing the Sun
8 of 39 http://www.open.edu/openlearn/science-maths-technology/science/physics-and-astronomy/the-sun/content-section-0?utm_source=openlearnutm_campaign=olutm_medium=ebook Wednesday 29 May 2019
AnswerThe bright light from the Sun's photosphere is scattered by the Earth's atmosphere.This makes the sky blue and generally rather bright. As a result, we cannot observethe much fainter light from the corona (rather as the light from a dim torch isunnoticeable on a bright sunny day).
Sometimes in eclipses observers also see prominences - great spurts of hot material atthe edge of the Sun, extending outwards from the solar surface for many thousands ofkilometres. Prominences and the changing shape of the corona indicate that the Sun is anactive body, not just a quietly glowing source of light. There is further evidence of this inthe images that you will look at shortly. This will introduce you to other features of thevisible Sun, including the seething pattern of granules seen all across the photosphere,and the relatively cool sunspots that appear as small dark patches on the photosphere.Individual granules come and go in a few minutes, often to be replaced by other granules.Sunspots are larger and longer-lived, typically surviving for a week or so, and sometimesfor many weeks. The longer-lasting sunspots can be photographed repeatedly as theycross the face of the Sun. They can even be used to investigate the rate at which the Sunrotates.
Activity 1 Viewing images0 hour(s) 15 minutes(s)
Briefly examine the images below. They are accompanied by a paragraph beneath theimage, which provides further detail on the image. Read the descriptions carefully,paying particular attention to any reference to sunspots.
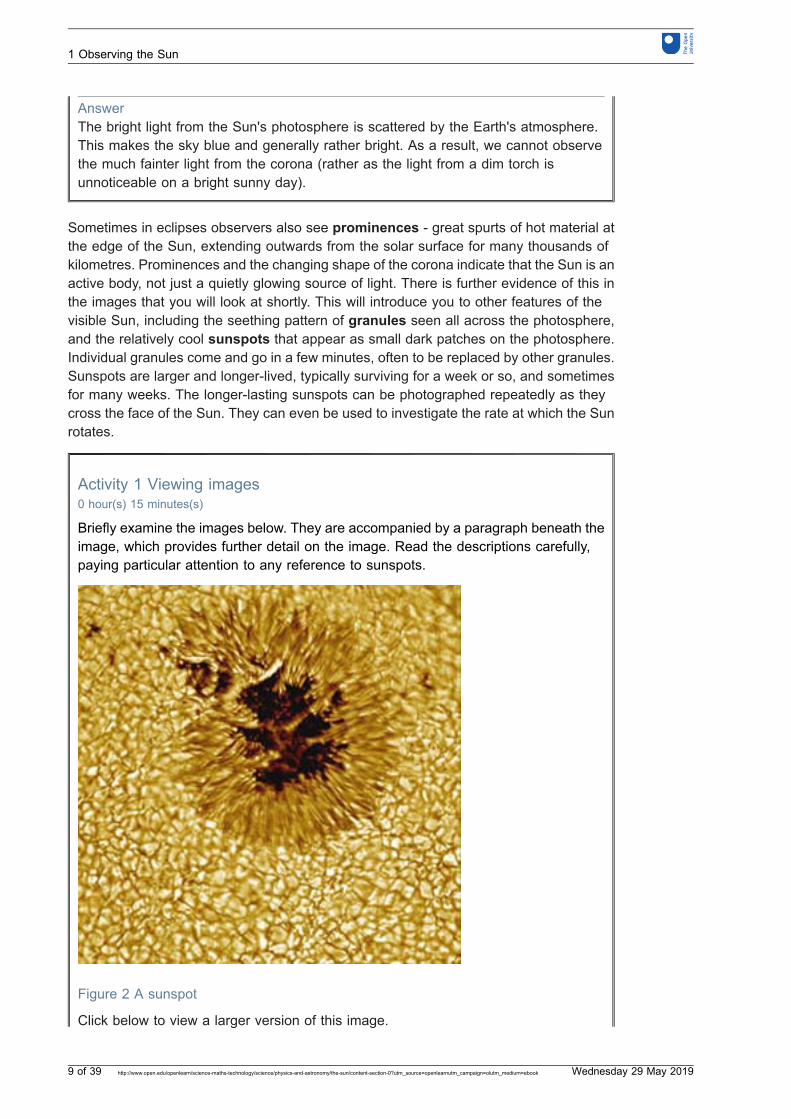
Figure 2 A sunspot
Click below to view a larger version of this image.
1 Observing the Sun
9 of 39 http://www.open.edu/openlearn/science-maths-technology/science/physics-and-astronomy/the-sun/content-section-0?utm_source=openlearnutm_campaign=olutm_medium=ebook Wednesday 29 May 2019
https://www.open.edu/openlearn/ocw/mod/resource/view.php?id=26564A false colour picture of a sunspot, taken with the National Solar Observatory'sVacuum Tower Telescope at the Sacramento Peak Observatory. The central dark areaof the spot is called the umbra and the surrounding lighter region is called thepenumbra. Solar granulation is clearly visible around the spot. The spot is about 25000 kilometres in diameter; the smallest features seen in the picture are on a scale ofabout 100 kilometres. The umbra represents a depression in the solar surface, wherethe temperature is about 1600 degrees less than in the photosphere; in the penumbrathe temperature is about 500 degrees below that of the surrounding photosphere. Welldeveloped sunspots of the kind shown in the picture live for a few weeks, though some(particularly the larger ones) can persist for many weeks, or even a few months.
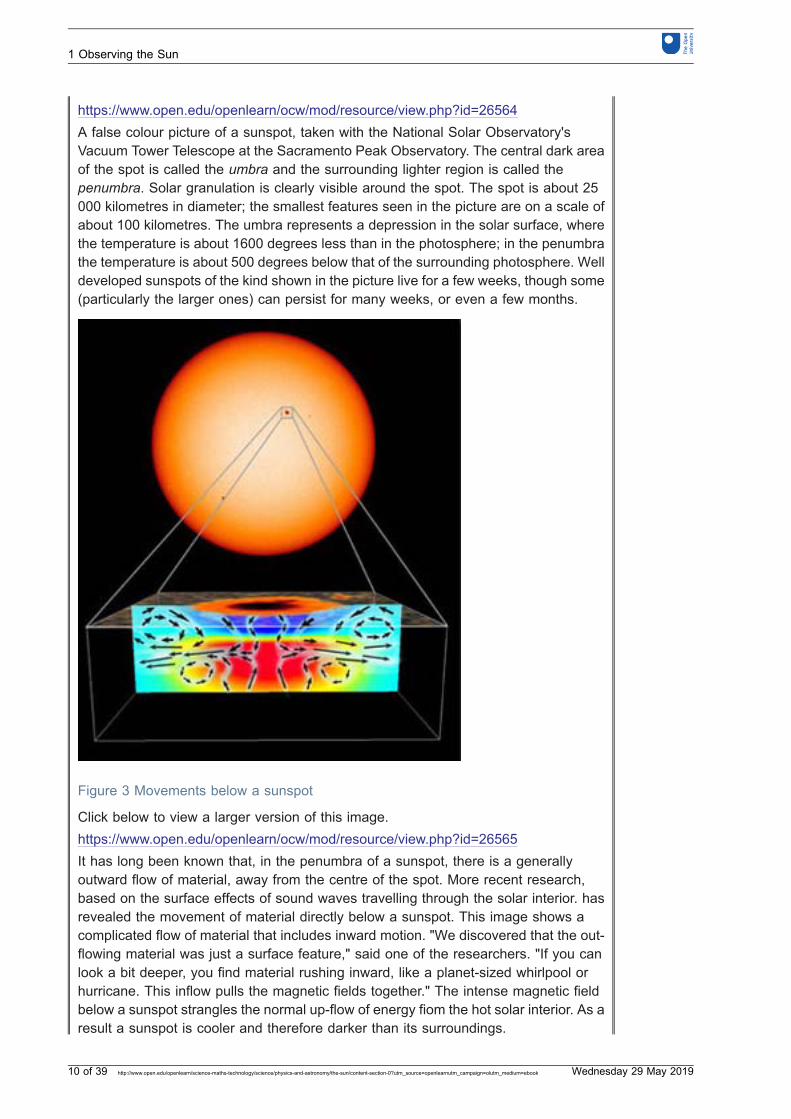
Figure 3 Movements below a sunspot
Click below to view a larger version of this image.https://www.open.edu/openlearn/ocw/mod/resource/view.php?id=26565It has long been known that, in the penumbra of a sunspot, there is a generallyoutward flow of material, away from the centre of the spot. More recent research,based on the surface effects of sound waves travelling through the solar interior. hasrevealed the movement of material directly below a sunspot. This image shows acomplicated flow of material that includes inward motion. "We discovered that the out-flowing material was just a surface feature," said one of the researchers. "If you canlook a bit deeper, you find material rushing inward, like a planet-sized whirlpool orhurricane. This inflow pulls the magnetic fields together." The intense magnetic fieldbelow a sunspot strangles the normal up-flow of energy fiom the hot solar interior. As aresult a sunspot is cooler and therefore darker than its surroundings.
1 Observing the Sun
10 of 39 http://www.open.edu/openlearn/science-maths-technology/science/physics-and-astronomy/the-sun/content-section-0?utm_source=openlearnutm_campaign=olutm_medium=ebook Wednesday 29 May 2019
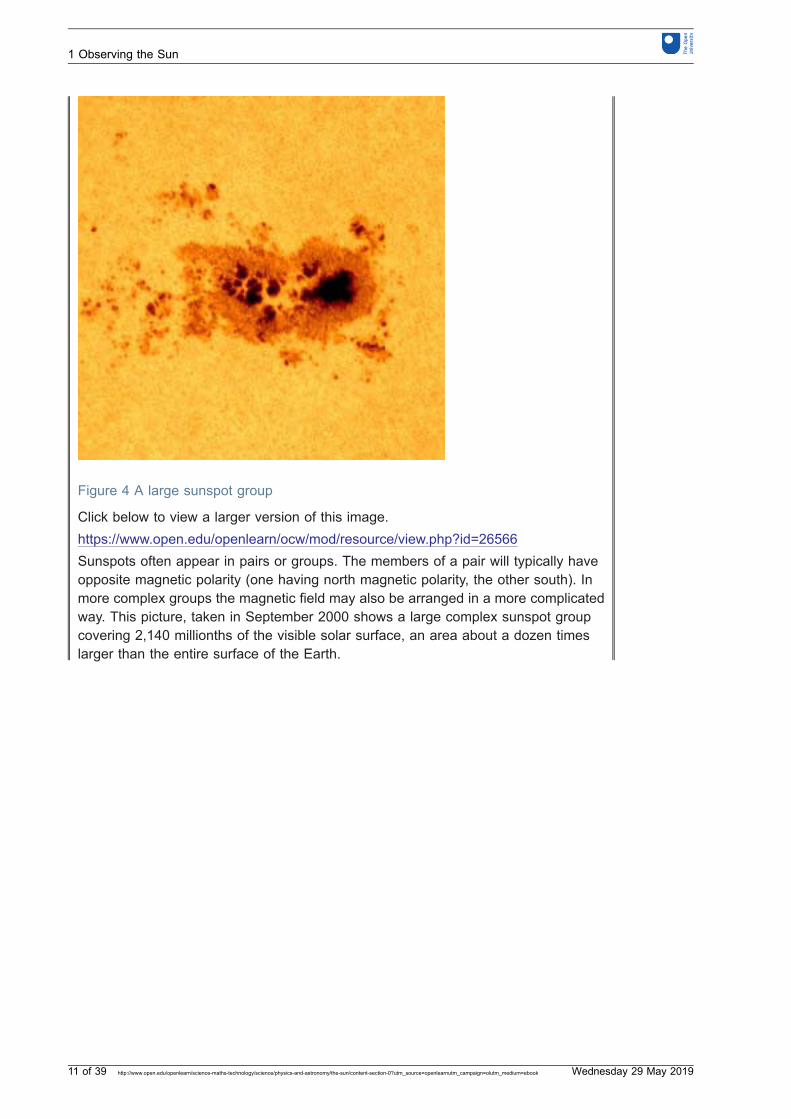
Figure 4 A large sunspot group
Click below to view a larger version of this image.https://www.open.edu/openlearn/ocw/mod/resource/view.php?id=26566Sunspots often appear in pairs or groups. The members of a pair will typically haveopposite magnetic polarity (one having north magnetic polarity, the other south). Inmore complex groups the magnetic field may also be arranged in a more complicatedway. This picture, taken in September 2000 shows a large complex sunspot groupcovering 2,140 millionths of the visible solar surface, an area about a dozen timeslarger than the entire surface of the Earth.
1 Observing the Sun
11 of 39 http://www.open.edu/openlearn/science-maths-technology/science/physics-and-astronomy/the-sun/content-section-0?utm_source=openlearnutm_campaign=olutm_medium=ebook Wednesday 29 May 2019
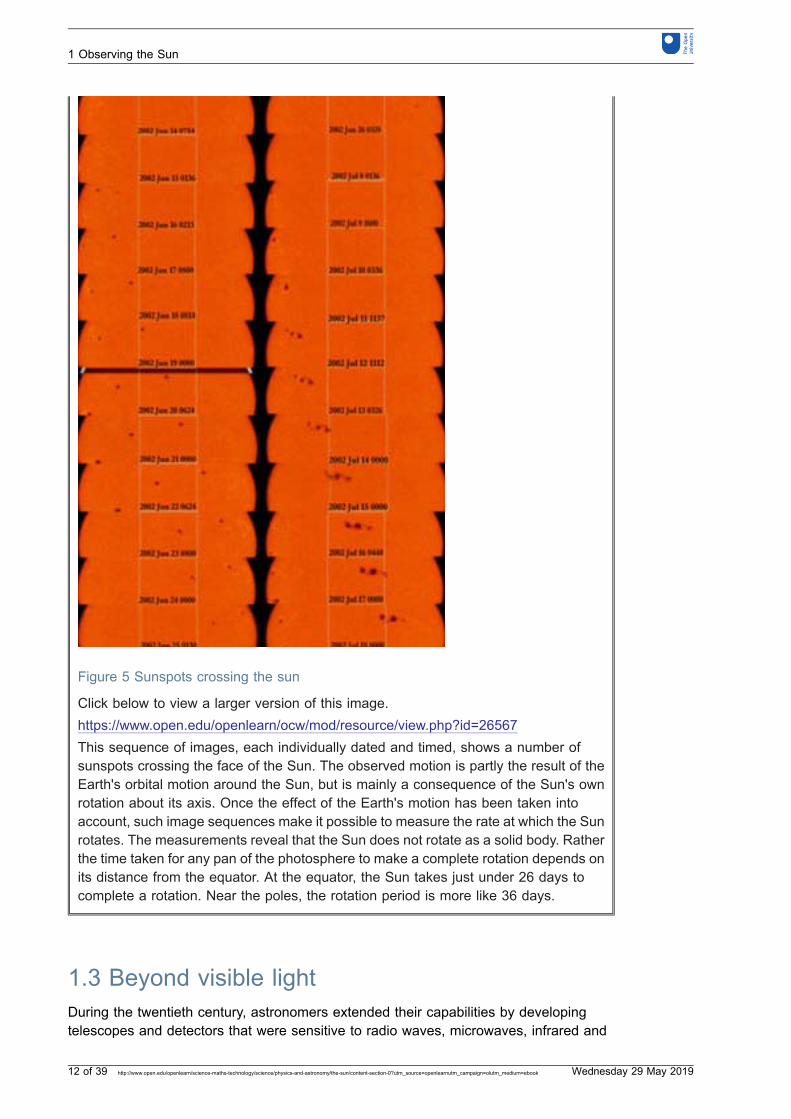
Figure 5 Sunspots crossing the sun
Click below to view a larger version of this image.https://www.open.edu/openlearn/ocw/mod/resource/view.php?id=26567This sequence of images, each individually dated and timed, shows a number ofsunspots crossing the face of the Sun. The observed motion is partly the result of theEarth's orbital motion around the Sun, but is mainly a consequence of the Sun's ownrotation about its axis. Once the effect of the Earth's motion has been taken intoaccount, such image sequences make it possible to measure the rate at which the Sunrotates. The measurements reveal that the Sun does not rotate as a solid body. Ratherthe time taken for any pan of the photosphere to make a complete rotation depends onits distance from the equator. At the equator, the Sun takes just under 26 days tocomplete a rotation. Near the poles, the rotation period is more like 36 days.
1.3 Beyond visible lightDuring the twentieth century, astronomers extended their capabilities by developingtelescopes and detectors that were sensitive to radio waves, microwaves, infrared and
1 Observing the Sun
12 of 39 http://www.open.edu/openlearn/science-maths-technology/science/physics-and-astronomy/the-sun/content-section-0?utm_source=openlearnutm_campaign=olutm_medium=ebook Wednesday 29 May 2019
ultraviolet radiation, X-rays and gamma rays. All these forms of electromagnetic radiation,along with visible light, are emitted by the Sun.
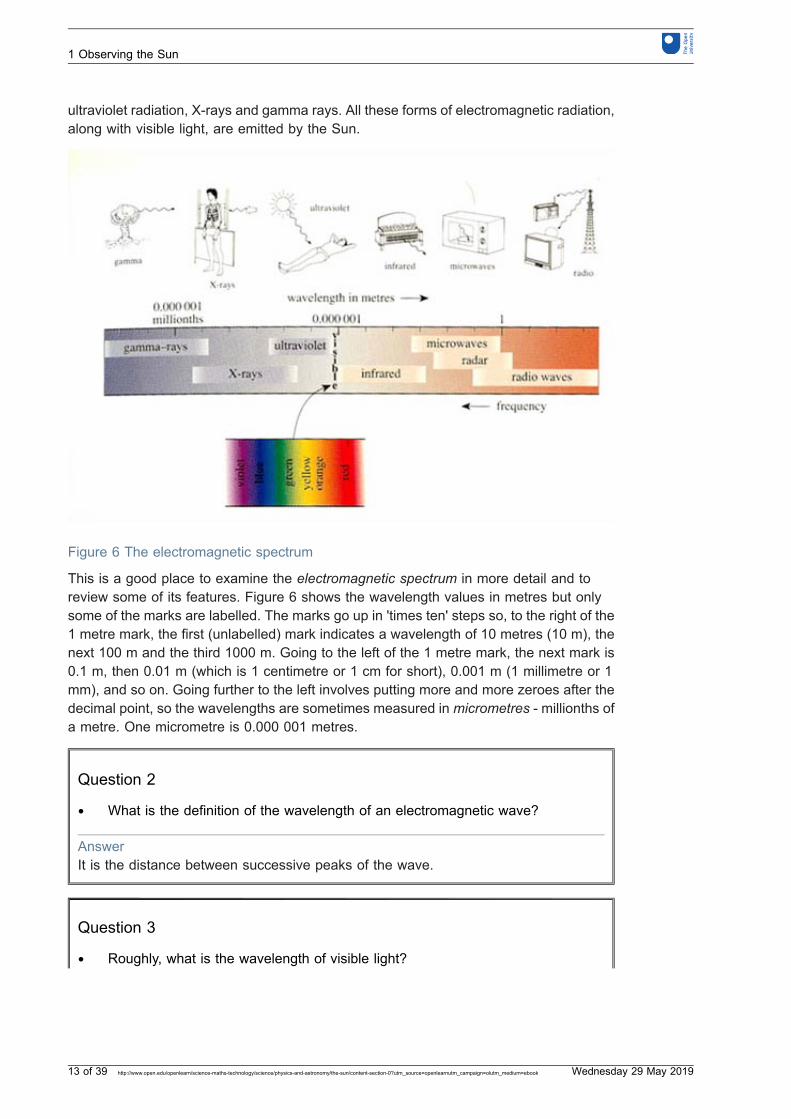
Figure 6 The electromagnetic spectrum
This is a good place to examine the electromagnetic spectrum in more detail and toreview some of its features. Figure 6 shows the wavelength values in metres but onlysome of the marks are labelled. The marks go up in 'times ten' steps so, to the right of the1 metre mark, the first (unlabelled) mark indicates a wavelength of 10 metres (10 m), thenext 100 m and the third 1000 m. Going to the left of the 1 metre mark, the next mark is0.1 m, then 0.01 m (which is 1 centimetre or 1 cm for short), 0.001 m (1 millimetre or 1mm), and so on. Going further to the left involves putting more and more zeroes after thedecimal point, so the wavelengths are sometimes measured in micrometres - millionths ofa metre. One micrometre is 0.000 001 metres.
Question 2
● What is the definition of the wavelength of an electromagnetic wave?
AnswerIt is the distance between successive peaks of the wave.
Question 3
● Roughly, what is the wavelength of visible light?
1 Observing the Sun
13 of 39 http://www.open.edu/openlearn/science-maths-technology/science/physics-and-astronomy/the-sun/content-section-0?utm_source=openlearnutm_campaign=olutm_medium=ebook Wednesday 29 May 2019
AnswerIt is about 0.000 001 metres (actually, 0.000 000 4 to 0.000 000 7 metres).
Question 4
● What type of electromagnetic radiation has the longest wavelength? What,approximately, is its wavelength range?
AnswerRadio waves are the longest: in Figure 6, the shortest radio waves lie about one stepto the left of the 1 m mark, which denotes a wavelength of 0.1 m. The bandrepresenting radio waves extends to the far right of the chart. The furthest mark on theright represents a wavelength of 1000 m (three steps to the right of the 1 m mark), sothe figure shows that radio waves can have wavelengths of over 1 kilometre. (Suchwavelengths are typical of radio stations still broadcasting in the 'long wave' band.)
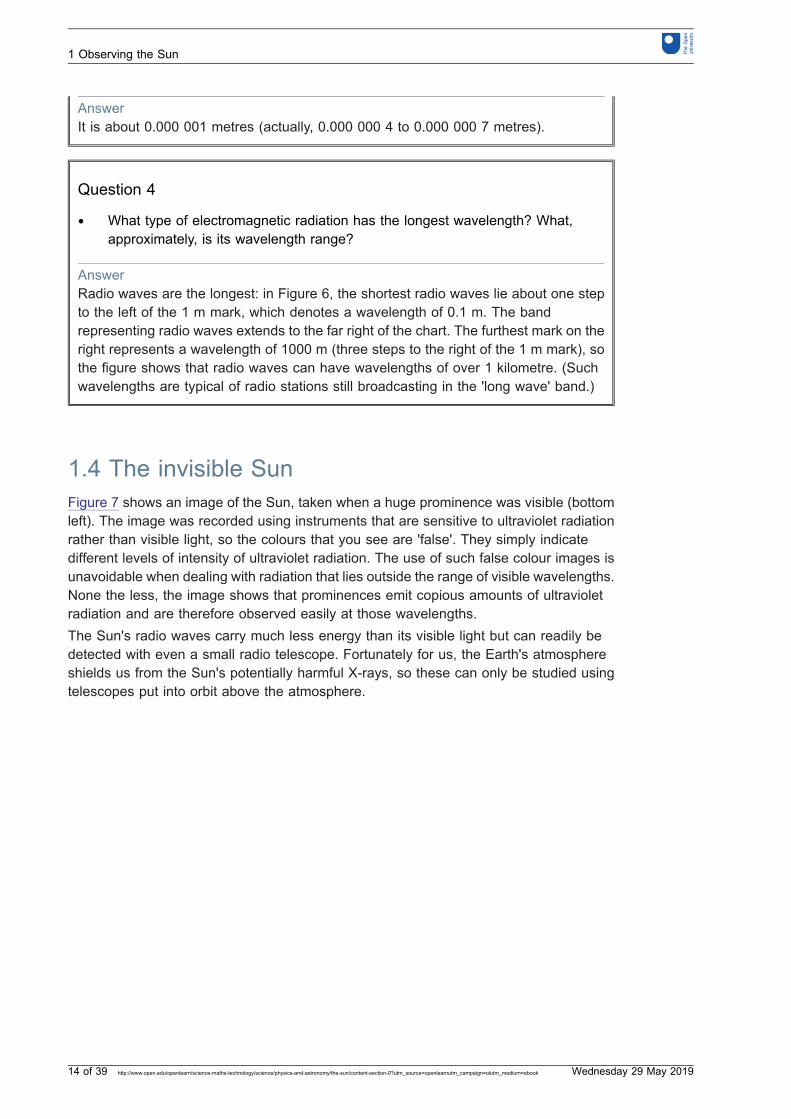
1.4 The invisible SunFigure 7 shows an image of the Sun, taken when a huge prominence was visible (bottomleft). The image was recorded using instruments that are sensitive to ultraviolet radiationrather than visible light, so the colours that you see are 'false'. They simply indicatedifferent levels of intensity of ultraviolet radiation. The use of such false colour images isunavoidable when dealing with radiation that lies outside the range of visible wavelengths.None the less, the image shows that prominences emit copious amounts of ultravioletradiation and are therefore observed easily at those wavelengths.The Sun's radio waves carry much less energy than its visible light but can readily bedetected with even a small radio telescope. Fortunately for us, the Earth's atmosphereshields us from the Sun's potentially harmful X-rays, so these can only be studied usingtelescopes put into orbit above the atmosphere.
1 Observing the Sun
14 of 39 http://www.open.edu/openlearn/science-maths-technology/science/physics-and-astronomy/the-sun/content-section-0?utm_source=openlearnutm_campaign=olutm_medium=ebook Wednesday 29 May 2019
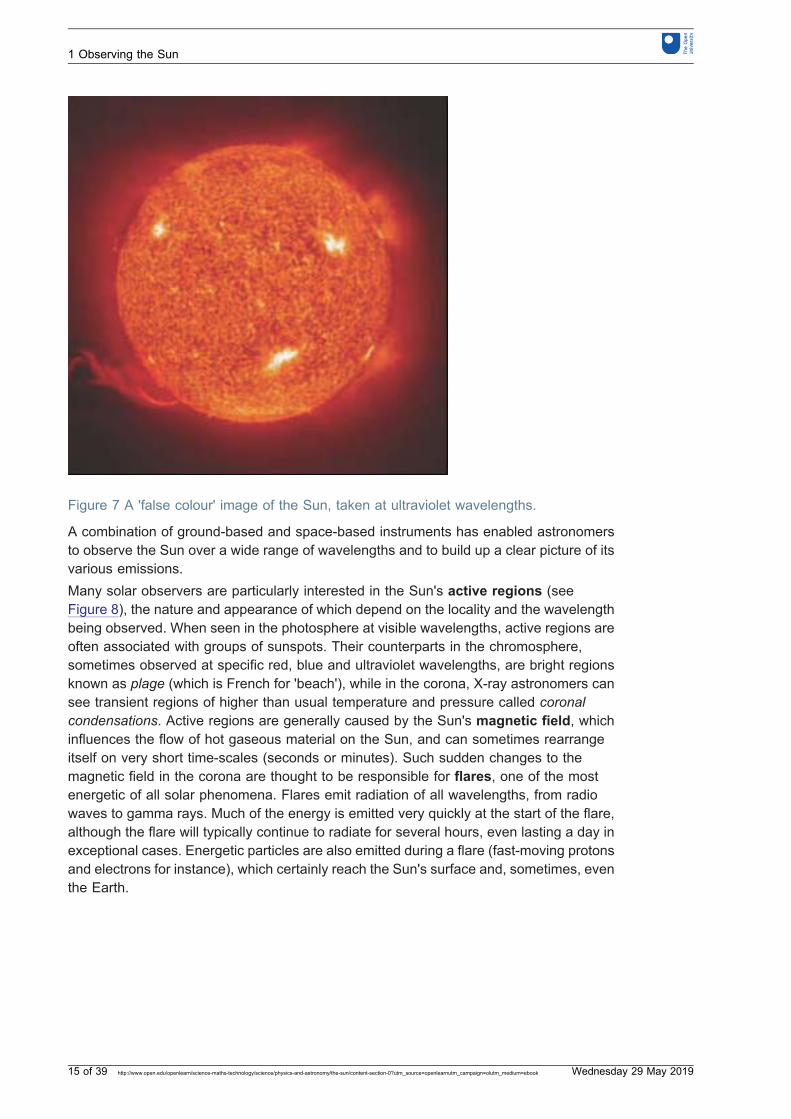
Figure 7 A 'false colour' image of the Sun, taken at ultraviolet wavelengths.
A combination of ground-based and space-based instruments has enabled astronomersto observe the Sun over a wide range of wavelengths and to build up a clear picture of itsvarious emissions.Many solar observers are particularly interested in the Sun's active regions (seeFigure 8), the nature and appearance of which depend on the locality and the wavelengthbeing observed. When seen in the photosphere at visible wavelengths, active regions areoften associated with groups of sunspots. Their counterparts in the chromosphere,sometimes observed at specific red, blue and ultraviolet wavelengths, are bright regionsknown as plage (which is French for 'beach'), while in the corona, X-ray astronomers cansee transient regions of higher than usual temperature and pressure called coronalcondensations. Active regions are generally caused by the Sun's magnetic field, whichinfluences the flow of hot gaseous material on the Sun, and can sometimes rearrangeitself on very short time-scales (seconds or minutes). Such sudden changes to themagnetic field in the corona are thought to be responsible for flares, one of the mostenergetic of all solar phenomena. Flares emit radiation of all wavelengths, from radiowaves to gamma rays. Much of the energy is emitted very quickly at the start of the flare,although the flare will typically continue to radiate for several hours, even lasting a day inexceptional cases. Energetic particles are also emitted during a flare (fast-moving protonsand electrons for instance), which certainly reach the Sun's surface and, sometimes, eventhe Earth.
1 Observing the Sun
15 of 39 http://www.open.edu/openlearn/science-maths-technology/science/physics-and-astronomy/the-sun/content-section-0?utm_source=openlearnutm_campaign=olutm_medium=ebook Wednesday 29 May 2019
Figure 8 An active region of the Sun, represented by a powerful flare (seen here as X-rays) associated with a large sunspot group.
Activity 2 Examining images of the invisible Sun0 hour(s) 20 minutes(s)
Images from a variety of telescopes, representing various wavelengths of 'invisible'radiation, are included below. Some of these images enhance astronomers' knowl-edge of particular solar features (such as prominences or sunspot groups), whileothers help them to observe particular regions (such as X-ray images of the corona orultraviolet images of the chromosphere). You should examine those images now,taking care not to be misled by their use of false colours.
1 Observing the Sun
16 of 39 http://www.open.edu/openlearn/science-maths-technology/science/physics-and-astronomy/the-sun/content-section-0?utm_source=openlearnutm_campaign=olutm_medium=ebook Wednesday 29 May 2019
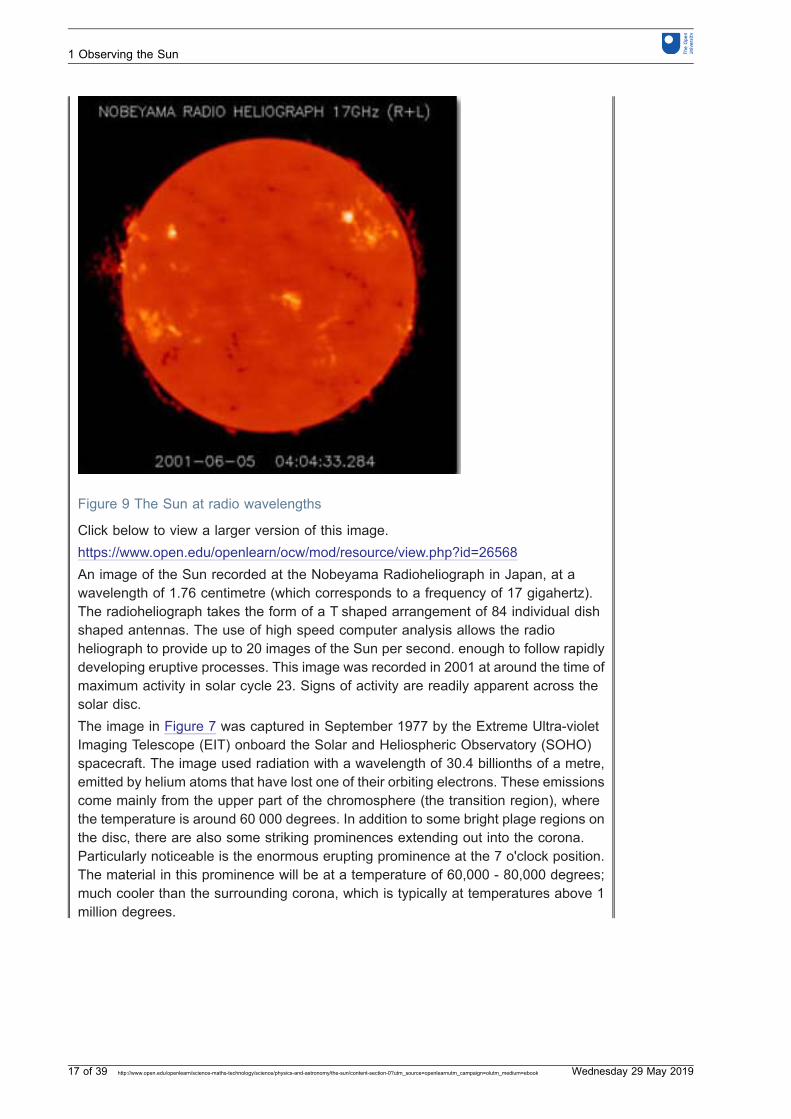
Figure 9 The Sun at radio wavelengths
Click below to view a larger version of this image.https://www.open.edu/openlearn/ocw/mod/resource/view.php?id=26568An image of the Sun recorded at the Nobeyama Radioheliograph in Japan, at awavelength of 1.76 centimetre (which corresponds to a frequency of 17 gigahertz).The radioheliograph takes the form of a T shaped arrangement of 84 individual dishshaped antennas. The use of high speed computer analysis allows the radioheliograph to provide up to 20 images of the Sun per second. enough to follow rapidlydeveloping eruptive processes. This image was recorded in 2001 at around the time ofmaximum activity in solar cycle 23. Signs of activity are readily apparent across thesolar disc.The image in Figure 7 was captured in September 1977 by the Extreme Ultra-violetImaging Telescope (EIT) onboard the Solar and Heliospheric Observatory (SOHO)spacecraft. The image used radiation with a wavelength of 30.4 billionths of a metre,emitted by helium atoms that have lost one of their orbiting electrons. These emissionscome mainly from the upper part of the chromosphere (the transition region), wherethe temperature is around 60 000 degrees. In addition to some bright plage regions onthe disc, there are also some striking prominences extending out into the corona.Particularly noticeable is the enormous erupting prominence at the 7 o'clock position.The material in this prominence will be at a temperature of 60,000 - 80,000 degrees;much cooler than the surrounding corona, which is typically at temperatures above 1million degrees.
1 Observing the Sun
17 of 39 http://www.open.edu/openlearn/science-maths-technology/science/physics-and-astronomy/the-sun/content-section-0?utm_source=openlearnutm_campaign=olutm_medium=ebook Wednesday 29 May 2019
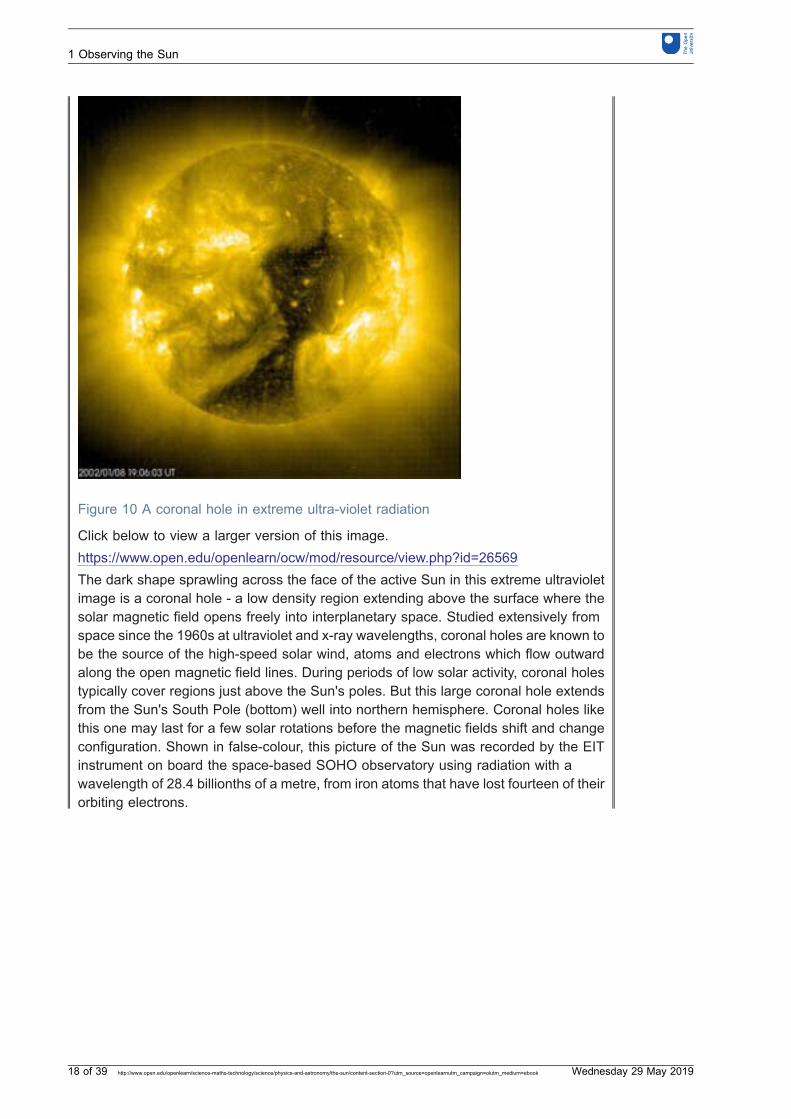
Figure 10 A coronal hole in extreme ultra-violet radiation
Click below to view a larger version of this image.https://www.open.edu/openlearn/ocw/mod/resource/view.php?id=26569The dark shape sprawling across the face of the active Sun in this extreme ultravioletimage is a coronal hole - a low density region extending above the surface where thesolar magnetic field opens freely into interplanetary space. Studied extensively fromspace since the 1960s at ultraviolet and x-ray wavelengths, coronal holes are known tobe the source of the high-speed solar wind, atoms and electrons which flow outwardalong the open magnetic field lines. During periods of low solar activity, coronal holestypically cover regions just above the Sun's poles. But this large coronal hole extendsfrom the Sun's South Pole (bottom) well into northern hemisphere. Coronal holes likethis one may last for a few solar rotations before the magnetic fields shift and changeconfiguration. Shown in false-colour, this picture of the Sun was recorded by the EITinstrument on board the space-based SOHO observatory using radiation with awavelength of 28.4 billionths of a metre, from iron atoms that have lost fourteen of theirorbiting electrons.
1 Observing the Sun
18 of 39 http://www.open.edu/openlearn/science-maths-technology/science/physics-and-astronomy/the-sun/content-section-0?utm_source=openlearnutm_campaign=olutm_medium=ebook Wednesday 29 May 2019
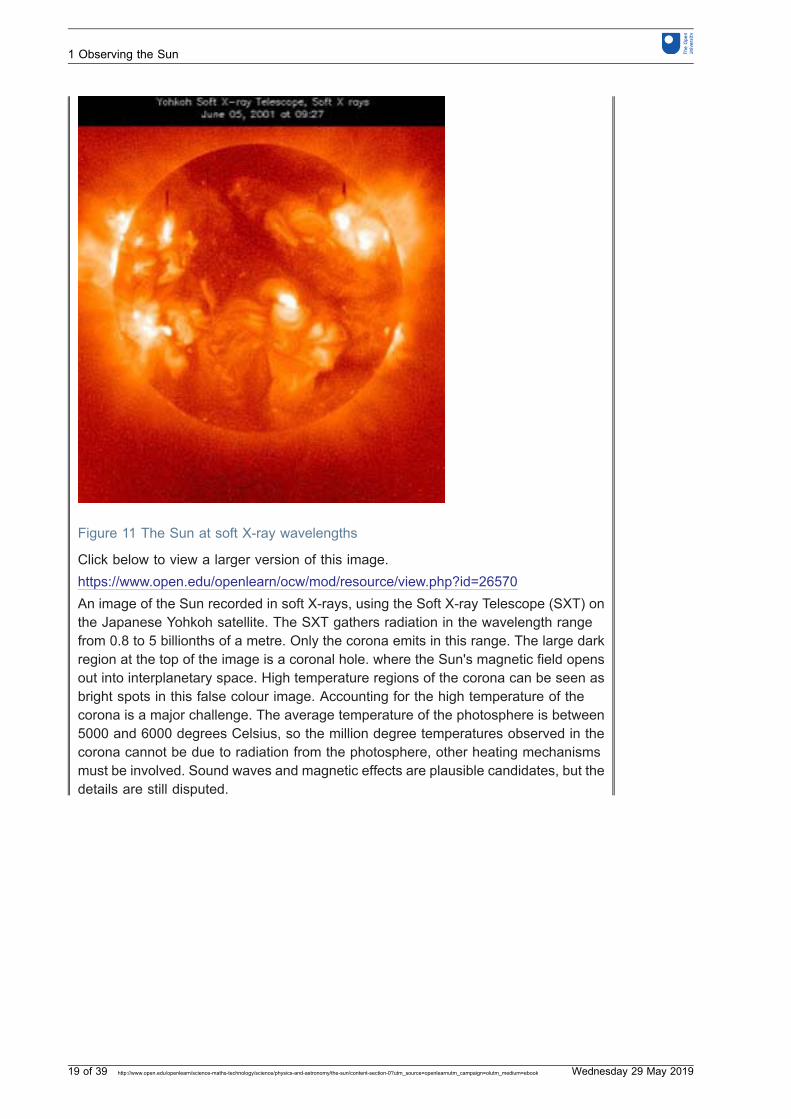
Figure 11 The Sun at soft X-ray wavelengths
Click below to view a larger version of this image.https://www.open.edu/openlearn/ocw/mod/resource/view.php?id=26570An image of the Sun recorded in soft X-rays, using the Soft X-ray Telescope (SXT) onthe Japanese Yohkoh satellite. The SXT gathers radiation in the wavelength rangefrom 0.8 to 5 billionths of a metre. Only the corona emits in this range. The large darkregion at the top of the image is a coronal hole. where the Sun's magnetic field opensout into interplanetary space. High temperature regions of the corona can be seen asbright spots in this false colour image. Accounting for the high temperature of thecorona is a major challenge. The average temperature of the photosphere is between5000 and 6000 degrees Celsius, so the million degree temperatures observed in thecorona cannot be due to radiation from the photosphere, other heating mechanismsmust be involved. Sound waves and magnetic effects are plausible candidates, but thedetails are still disputed.
1 Observing the Sun
19 of 39 http://www.open.edu/openlearn/science-maths-technology/science/physics-and-astronomy/the-sun/content-section-0?utm_source=openlearnutm_campaign=olutm_medium=ebook Wednesday 29 May 2019
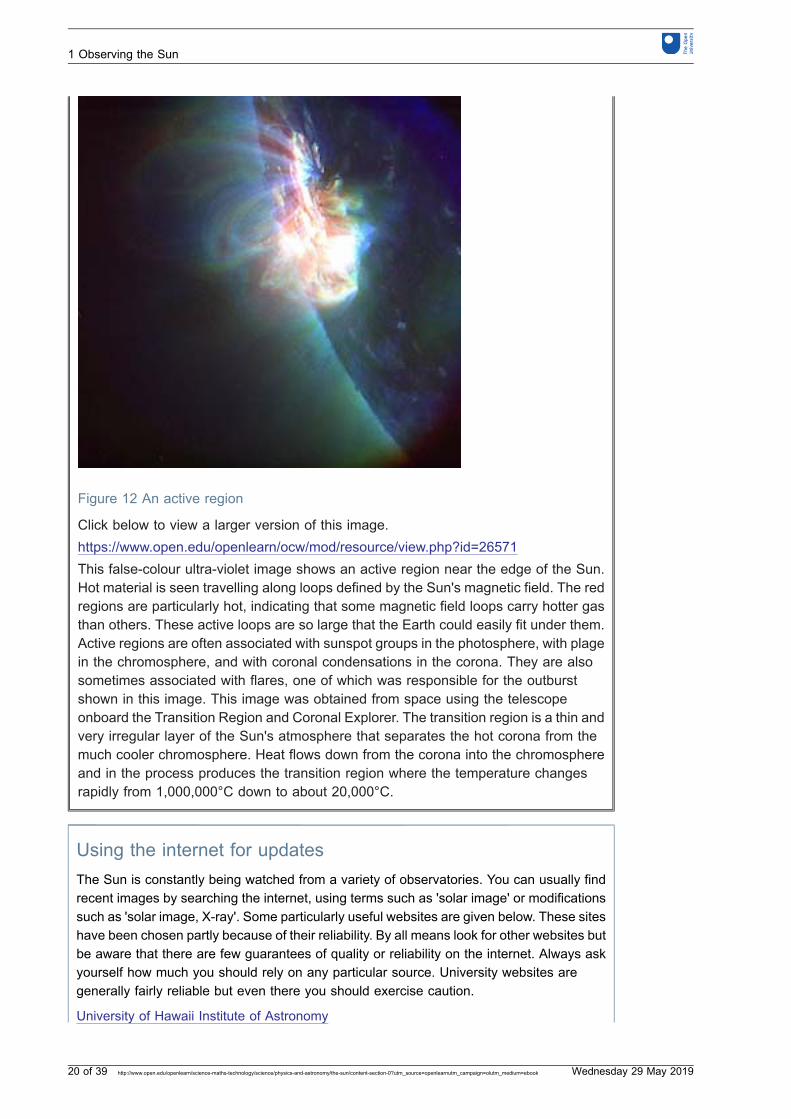
Figure 12 An active region
Click below to view a larger version of this image.https://www.open.edu/openlearn/ocw/mod/resource/view.php?id=26571This false-colour ultra-violet image shows an active region near the edge of the Sun.Hot material is seen travelling along loops defined by the Sun's magnetic field. The redregions are particularly hot, indicating that some magnetic field loops carry hotter gasthan others. These active loops are so large that the Earth could easily fit under them.Active regions are often associated with sunspot groups in the photosphere, with plagein the chromosphere, and with coronal condensations in the corona. They are alsosometimes associated with flares, one of which was responsible for the outburstshown in this image. This image was obtained from space using the telescopeonboard the Transition Region and Coronal Explorer. The transition region is a thin andvery irregular layer of the Sun's atmosphere that separates the hot corona from themuch cooler chromosphere. Heat flows down from the corona into the chromosphereand in the process produces the transition region where the temperature changesrapidly from 1,000,000°C down to about 20,000°C.
Using the internet for updatesThe Sun is constantly being watched from a variety of observatories. You can usually findrecent images by searching the internet, using terms such as 'solar image' or modificationssuch as 'solar image, X-ray'. Some particularly useful websites are given below. These siteshave been chosen partly because of their reliability. By all means look for other websites butbe aware that there are few guarantees of quality or reliability on the internet. Always askyourself how much you should rely on any particular source. University websites aregenerally fairly reliable but even there you should exercise caution.
University of Hawaii Institute of Astronomy
1 Observing the Sun
20 of 39 http://www.open.edu/openlearn/science-maths-technology/science/physics-and-astronomy/the-sun/content-section-0?utm_source=openlearnutm_campaign=olutm_medium=ebook Wednesday 29 May 2019

Solar and Heliospheric Observatory
The European Space Agency
1 Observing the Sun
21 of 39 http://www.open.edu/openlearn/science-maths-technology/science/physics-and-astronomy/the-sun/content-section-0?utm_source=openlearnutm_campaign=olutm_medium=ebook Wednesday 29 May 2019
2 Inside the SunTo account for its brightness and activity, the Sun must contain a power source. However,the nature of that power source was a great puzzle in the nineteenth and early twentiethcenturies. Fossil records and ideas about evolution were beginning to provide firmevidence that the Earth must be at least hundreds of millions of years old, rather thanthousands of years as was previously thought, and the Sun must be at least as old as theEarth. The only fuels known at the time were coal, wood, oil, gas, and so on. It was fairlyeasy to calculate that, even if the Sun were made entirely of one of these fuels, and couldget the necessary oxygen from its surroundings, it could burn for only a few thousandyears at most while producing its current output of heat and light - not nearly long enoughto sustain life on Earth over millions of years.The problem of the Sun's fuel baffled many of the world's best scientists until nuclearreactions were discovered in the early twentieth century. Such reactions provided atotally new type of energy source. Rather than burning like coal or gas, nuclear reactionsneed no oxygen and produce vastly more heat and light for a given amount of fuel.Nuclear reactions give 'atomic' weapons their great destructive power but are harnessedmore productively in electricity generation. The type of reactions that power the Sun - so-called fusion reactions involving hydrogen - are similar to those that occur in a hydrogenbomb, but in the Sun they proceed steadily rather than as an explosion.
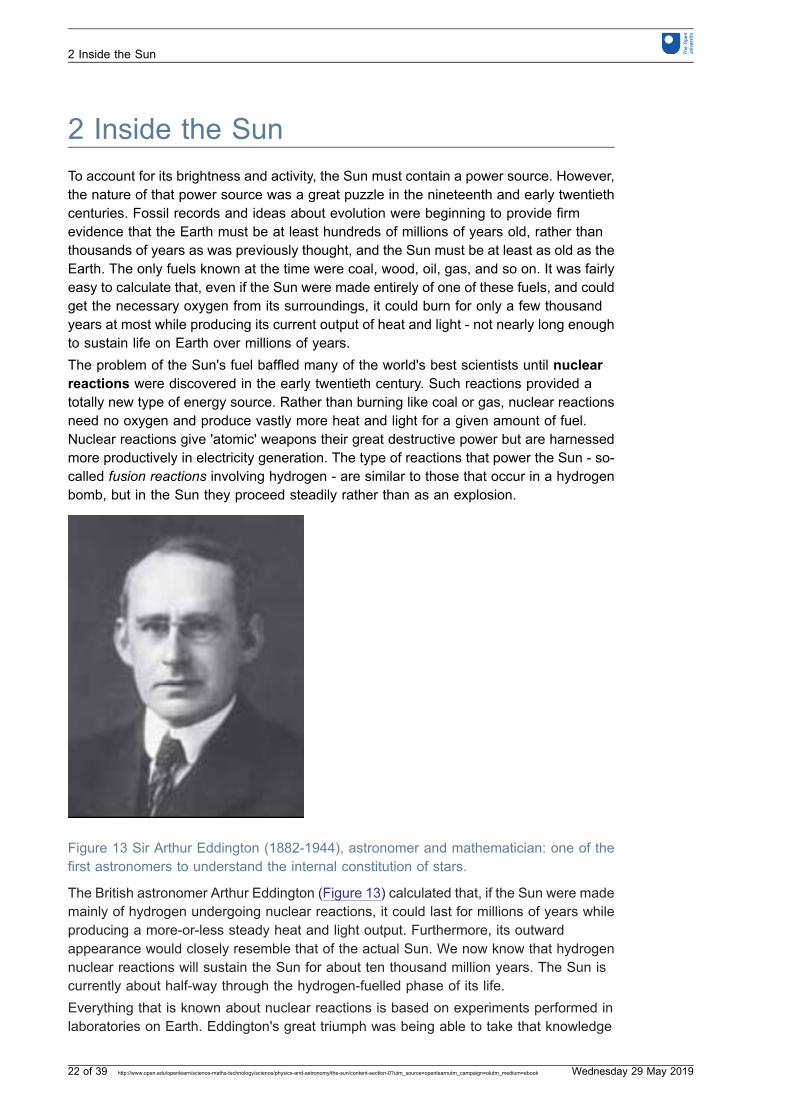
Figure 13 Sir Arthur Eddington (1882-1944), astronomer and mathematician: one of thefirst astronomers to understand the internal constitution of stars.
The British astronomer Arthur Eddington (Figure 13) calculated that, if the Sun were mademainly of hydrogen undergoing nuclear reactions, it could last for millions of years whileproducing a more-or-less steady heat and light output. Furthermore, its outwardappearance would closely resemble that of the actual Sun. We now know that hydrogennuclear reactions will sustain the Sun for about ten thousand million years. The Sun iscurrently about half-way through the hydrogen-fuelled phase of its life.Everything that is known about nuclear reactions is based on experiments performed inlaboratories on Earth. Eddington's great triumph was being able to take that knowledge
2 Inside the Sun
22 of 39 http://www.open.edu/openlearn/science-maths-technology/science/physics-and-astronomy/the-sun/content-section-0?utm_source=openlearnutm_campaign=olutm_medium=ebook Wednesday 29 May 2019
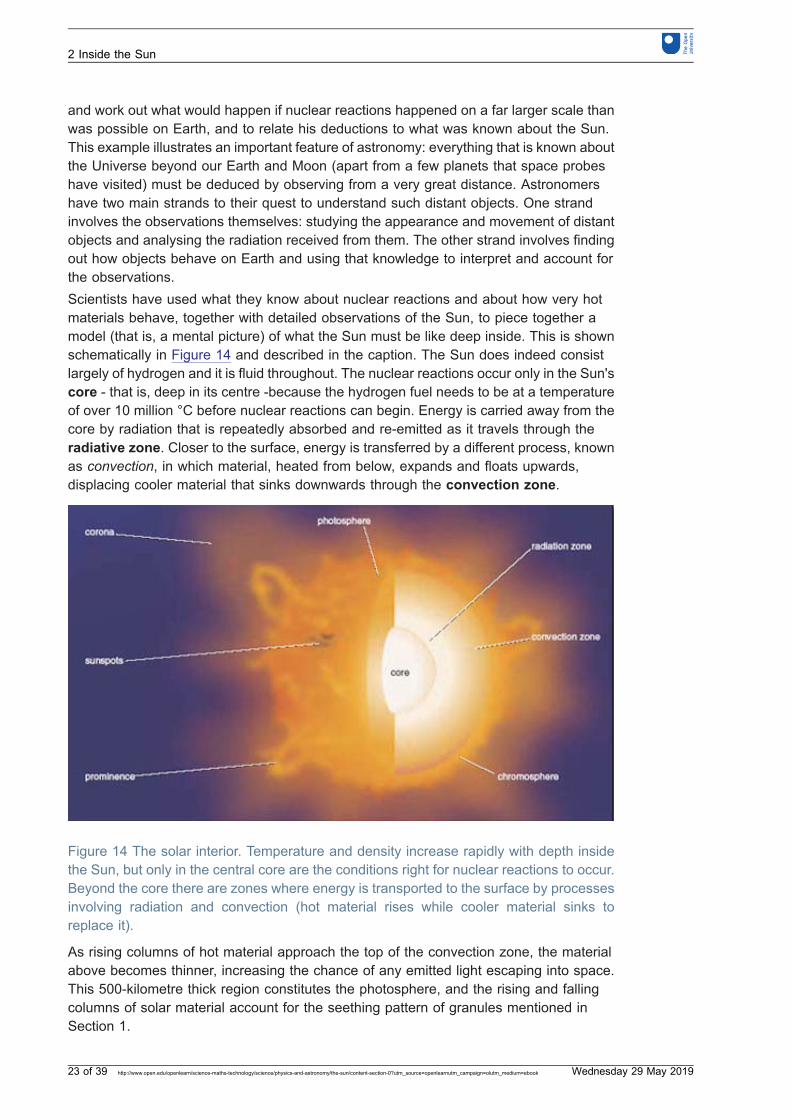
and work out what would happen if nuclear reactions happened on a far larger scale thanwas possible on Earth, and to relate his deductions to what was known about the Sun.This example illustrates an important feature of astronomy: everything that is known aboutthe Universe beyond our Earth and Moon (apart from a few planets that space probeshave visited) must be deduced by observing from a very great distance. Astronomershave two main strands to their quest to understand such distant objects. One strandinvolves the observations themselves: studying the appearance and movement of distantobjects and analysing the radiation received from them. The other strand involves findingout how objects behave on Earth and using that knowledge to interpret and account forthe observations.Scientists have used what they know about nuclear reactions and about how very hotmaterials behave, together with detailed observations of the Sun, to piece together amodel (that is, a mental picture) of what the Sun must be like deep inside. This is shownschematically in Figure 14 and described in the caption. The Sun does indeed consistlargely of hydrogen and it is fluid throughout. The nuclear reactions occur only in the Sun'score - that is, deep in its centre -because the hydrogen fuel needs to be at a temperatureof over 10 million °C before nuclear reactions can begin. Energy is carried away from thecore by radiation that is repeatedly absorbed and re-emitted as it travels through theradiative zone. Closer to the surface, energy is transferred by a different process, knownas convection, in which material, heated from below, expands and floats upwards,displacing cooler material that sinks downwards through the convection zone.
Figure 14 The solar interior. Temperature and density increase rapidly with depth insidethe Sun, but only in the central core are the conditions right for nuclear reactions to occur.Beyond the core there are zones where energy is transported to the surface by processesinvolving radiation and convection (hot material rises while cooler material sinks toreplace it).
As rising columns of hot material approach the top of the convection zone, the materialabove becomes thinner, increasing the chance of any emitted light escaping into space.This 500-kilometre thick region constitutes the photosphere, and the rising and fallingcolumns of solar material account for the seething pattern of granules mentioned inSection 1.
2 Inside the Sun
23 of 39 http://www.open.edu/openlearn/science-maths-technology/science/physics-and-astronomy/the-sun/content-section-0?utm_source=openlearnutm_campaign=olutm_medium=ebook Wednesday 29 May 2019

Our understanding of the solar interior depends very much on our ability to understand thelaws of physics that govern its behaviour. However, there are observations, basedparticularly on solar neutrinos and solar oscillations, that support and guide ourtheories. These are explored in the section of images below devoted to 'the solar interior',which you should look at in the next activity.
Activity 3 Describing the Sun0 hour(s) 30 minutes(s)
At the start of this course, the Sun was referred to as a 'blindingly bright, yellow object'.From what you have read and studied so far, you now know rather more about the Sunthan that simple description. Spend a few minutes looking through the text and therelevant pictures and captions below, including those concerning 'the solar interior'.Summarise what you have learned about the Sun's appearance and about its interior.Your summary should be in the form of a labelled sketch (maybe based on Figure 14).Try to make your summary as precise as possible: for example, include sizes andtemperatures of the various parts of the Sun where you can.
Figure 15 A view of the solar interior
Click below to view a larger version of this image.https://www.open.edu/openlearn/ocw/mod/resource/view.php?id=26574This diagram shows the major features of the solar interior; the core, the radiative zoneand the convective zone; along with external features such as the photosphere, thechromosphere and the corona. Also indicated are some of the waves that make itpossible to learn about the interior by studying the motion of the solar surface.
2 Inside the Sun
24 of 39 http://www.open.edu/openlearn/science-maths-technology/science/physics-and-astronomy/the-sun/content-section-0?utm_source=openlearnutm_campaign=olutm_medium=ebook Wednesday 29 May 2019
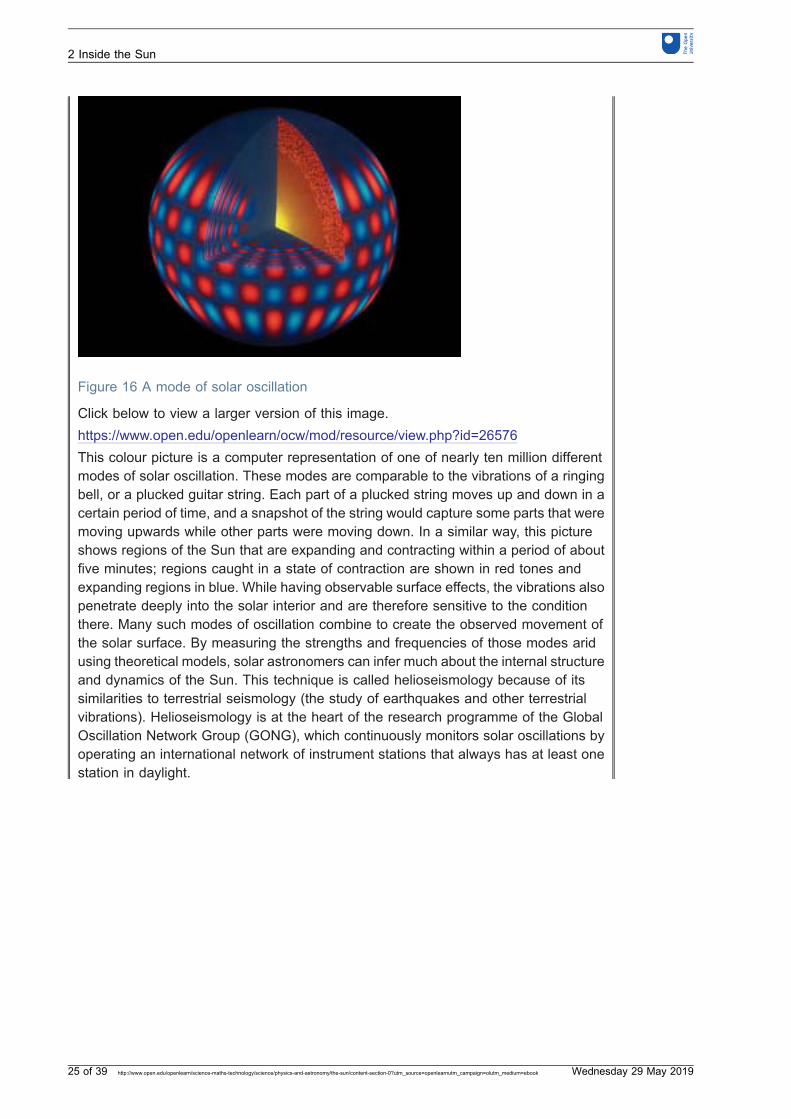
Figure 16 A mode of solar oscillation
Click below to view a larger version of this image.https://www.open.edu/openlearn/ocw/mod/resource/view.php?id=26576This colour picture is a computer representation of one of nearly ten million differentmodes of solar oscillation. These modes are comparable to the vibrations of a ringingbell, or a plucked guitar string. Each part of a plucked string moves up and down in acertain period of time, and a snapshot of the string would capture some parts that weremoving upwards while other parts were moving down. In a similar way, this pictureshows regions of the Sun that are expanding and contracting within a period of aboutfive minutes; regions caught in a state of contraction are shown in red tones andexpanding regions in blue. While having observable surface effects, the vibrations alsopenetrate deeply into the solar interior and are therefore sensitive to the conditionthere. Many such modes of oscillation combine to create the observed movement ofthe solar surface. By measuring the strengths and frequencies of those modes aridusing theoretical models, solar astronomers can infer much about the internal structureand dynamics of the Sun. This technique is called helioseismology because of itssimilarities to terrestrial seismology (the study of earthquakes and other terrestrialvibrations). Helioseismology is at the heart of the research programme of the GlobalOscillation Network Group (GONG), which continuously monitors solar oscillations byoperating an international network of instrument stations that always has at least onestation in daylight.
2 Inside the Sun
25 of 39 http://www.open.edu/openlearn/science-maths-technology/science/physics-and-astronomy/the-sun/content-section-0?utm_source=openlearnutm_campaign=olutm_medium=ebook Wednesday 29 May 2019
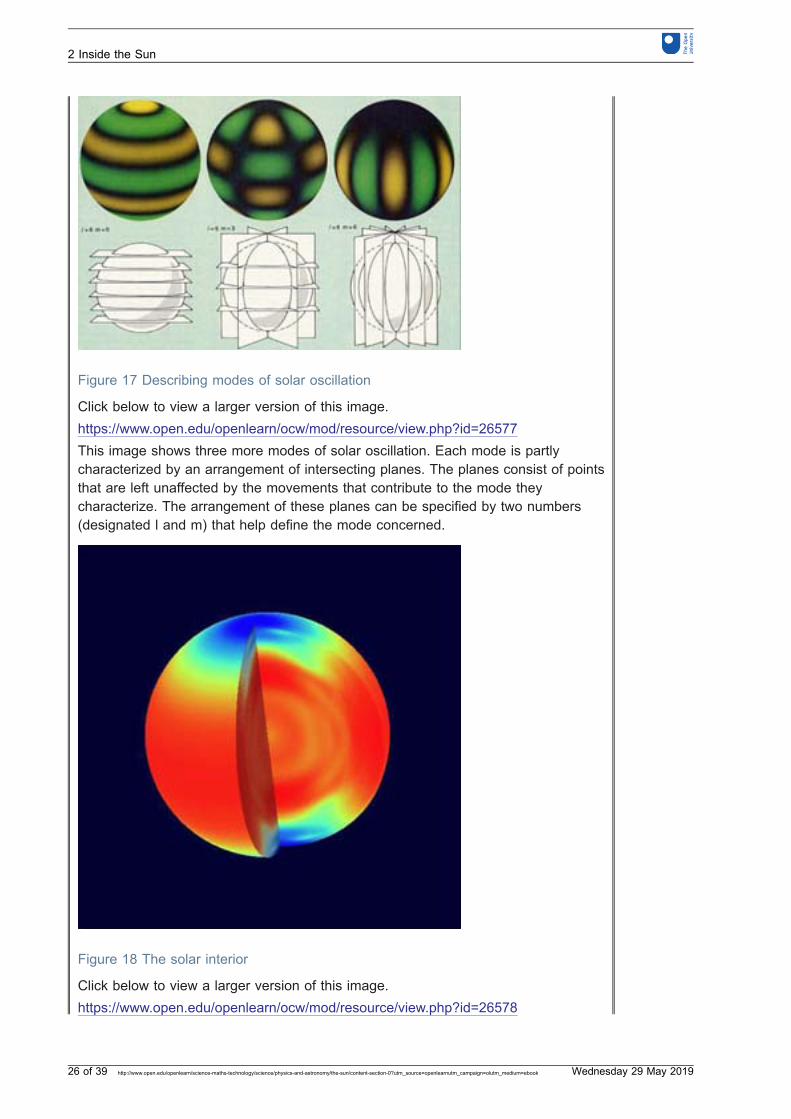
Figure 17 Describing modes of solar oscillation
Click below to view a larger version of this image.https://www.open.edu/openlearn/ocw/mod/resource/view.php?id=26577This image shows three more modes of solar oscillation. Each mode is partlycharacterized by an arrangement of intersecting planes. The planes consist of pointsthat are left unaffected by the movements that contribute to the mode theycharacterize. The arrangement of these planes can be specified by two numbers(designated l and m) that help define the mode concerned.
Figure 18 The solar interior
Click below to view a larger version of this image.https://www.open.edu/openlearn/ocw/mod/resource/view.php?id=26578
2 Inside the Sun
26 of 39 http://www.open.edu/openlearn/science-maths-technology/science/physics-and-astronomy/the-sun/content-section-0?utm_source=openlearnutm_campaign=olutm_medium=ebook Wednesday 29 May 2019
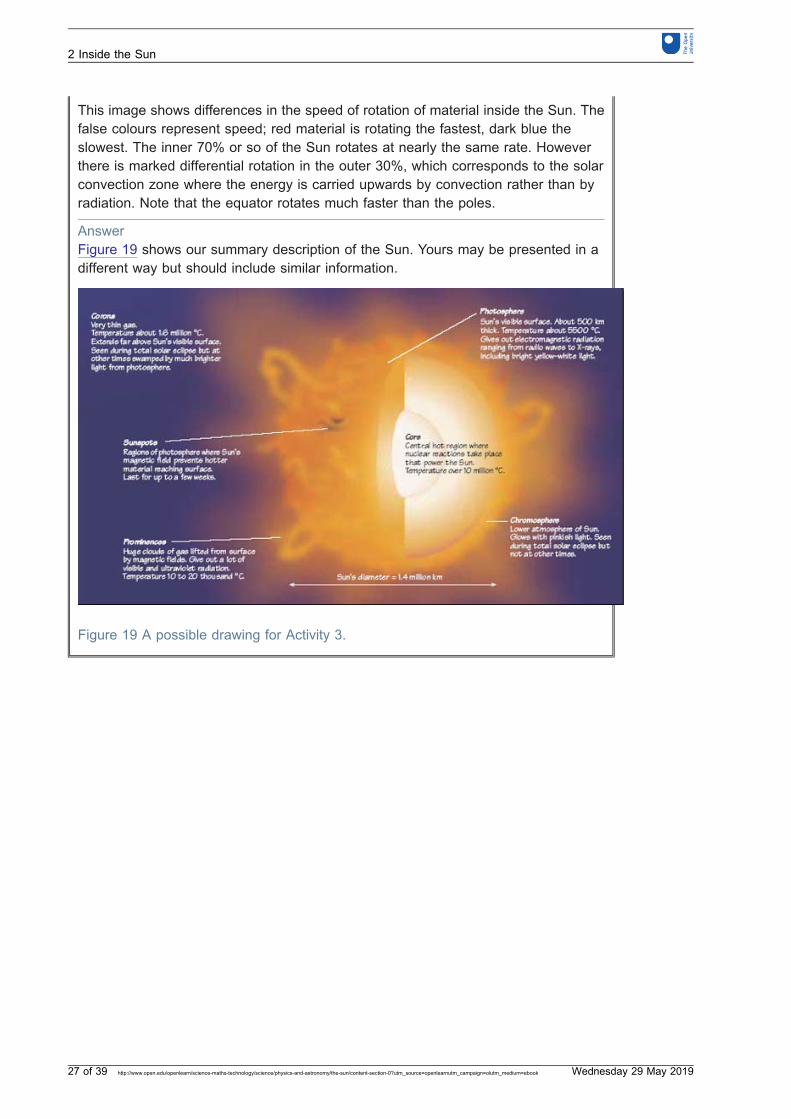
This image shows differences in the speed of rotation of material inside the Sun. Thefalse colours represent speed; red material is rotating the fastest, dark blue theslowest. The inner 70% or so of the Sun rotates at nearly the same rate. Howeverthere is marked differential rotation in the outer 30%, which corresponds to the solarconvection zone where the energy is carried upwards by convection rather than byradiation. Note that the equator rotates much faster than the poles.
AnswerFigure 19 shows our summary description of the Sun. Yours may be presented in adifferent way but should include similar information.
Figure 19 A possible drawing for Activity 3.
2 Inside the Sun
27 of 39 http://www.open.edu/openlearn/science-maths-technology/science/physics-and-astronomy/the-sun/content-section-0?utm_source=openlearnutm_campaign=olutm_medium=ebook Wednesday 29 May 2019
3 Measuring the SunSection 2 referred to observations that can only be made using sophisticated telescopes,but this section turns to an observation you can do yourself. There are two reasons forthis: one is to give you experience in scientific measuring and the other is to introducesome terminology that astronomers use frequently.
3.1 Angular size
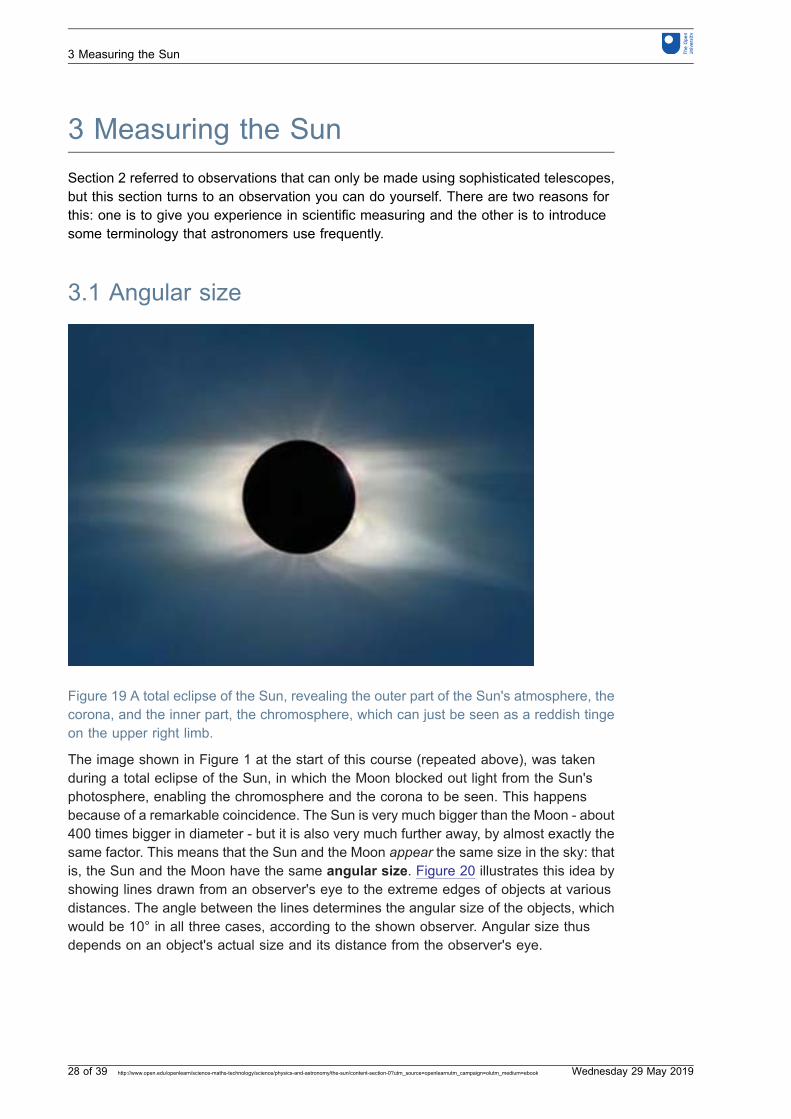
Figure 19 A total eclipse of the Sun, revealing the outer part of the Sun's atmosphere, thecorona, and the inner part, the chromosphere, which can just be seen as a reddish tingeon the upper right limb.
The image shown in Figure 1 at the start of this course (repeated above), was takenduring a total eclipse of the Sun, in which the Moon blocked out light from the Sun'sphotosphere, enabling the chromosphere and the corona to be seen. This happensbecause of a remarkable coincidence. The Sun is very much bigger than the Moon - about400 times bigger in diameter - but it is also very much further away, by almost exactly thesame factor. This means that the Sun and the Moon appear the same size in the sky: thatis, the Sun and the Moon have the same angular size. Figure 20 illustrates this idea byshowing lines drawn from an observer's eye to the extreme edges of objects at variousdistances. The angle between the lines determines the angular size of the objects, whichwould be 10° in all three cases, according to the shown observer. Angular size thusdepends on an object's actual size and its distance from the observer's eye.
3 Measuring the Sun
28 of 39 http://www.open.edu/openlearn/science-maths-technology/science/physics-and-astronomy/the-sun/content-section-0?utm_source=openlearnutm_campaign=olutm_medium=ebook Wednesday 29 May 2019
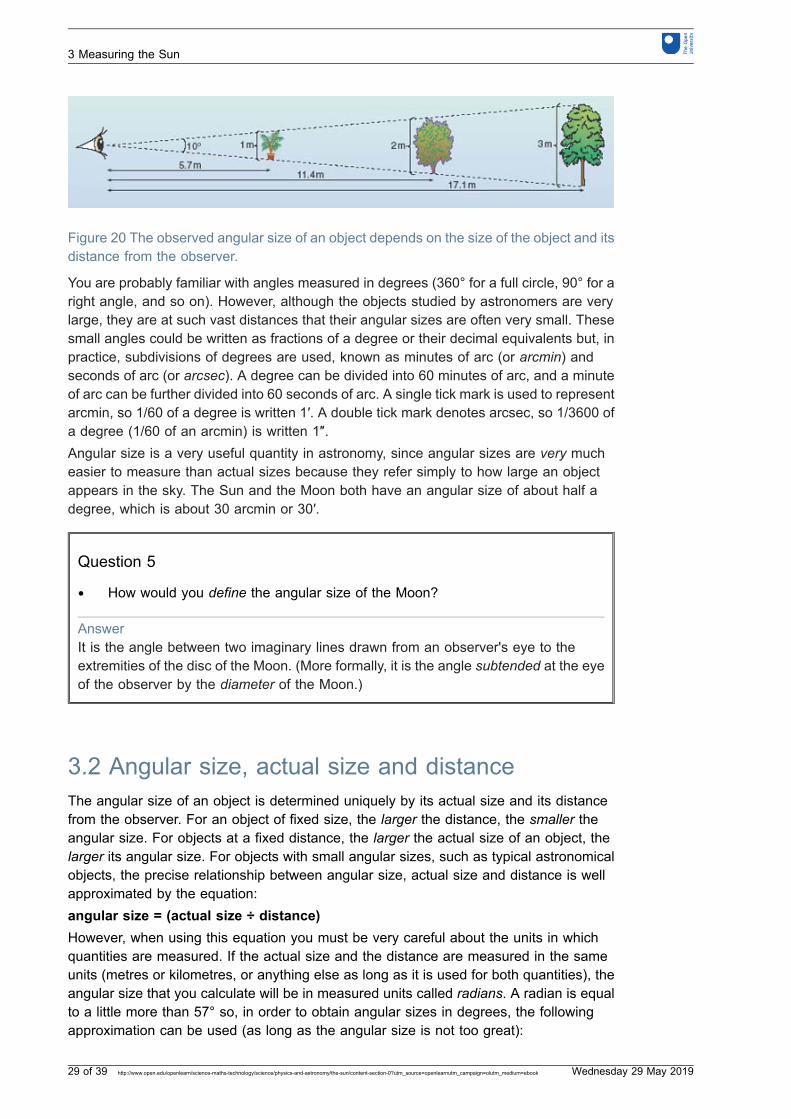
Figure 20 The observed angular size of an object depends on the size of the object and itsdistance from the observer.
You are probably familiar with angles measured in degrees (360° for a full circle, 90° for aright angle, and so on). However, although the objects studied by astronomers are verylarge, they are at such vast distances that their angular sizes are often very small. Thesesmall angles could be written as fractions of a degree or their decimal equivalents but, inpractice, subdivisions of degrees are used, known as minutes of arc (or arcmin) andseconds of arc (or arcsec). A degree can be divided into 60 minutes of arc, and a minuteof arc can be further divided into 60 seconds of arc. A single tick mark is used to representarcmin, so 1/60 of a degree is written 1′. A double tick mark denotes arcsec, so 1/3600 ofa degree (1/60 of an arcmin) is written 1″.Angular size is a very useful quantity in astronomy, since angular sizes are very mucheasier to measure than actual sizes because they refer simply to how large an objectappears in the sky. The Sun and the Moon both have an angular size of about half adegree, which is about 30 arcmin or 30′.
Question 5
● How would you define the angular size of the Moon?
AnswerIt is the angle between two imaginary lines drawn from an observer's eye to theextremities of the disc of the Moon. (More formally, it is the angle subtended at the eyeof the observer by the diameter of the Moon.)
3.2 Angular size, actual size and distanceThe angular size of an object is determined uniquely by its actual size and its distancefrom the observer. For an object of fixed size, the larger the distance, the smaller theangular size. For objects at a fixed distance, the larger the actual size of an object, thelarger its angular size. For objects with small angular sizes, such as typical astronomicalobjects, the precise relationship between angular size, actual size and distance is wellapproximated by the equation:angular size = (actual size ÷ distance)However, when using this equation you must be very careful about the units in whichquantities are measured. If the actual size and the distance are measured in the sameunits (metres or kilometres, or anything else as long as it is used for both quantities), theangular size that you calculate will be in measured units called radians. A radian is equalto a little more than 57° so, in order to obtain angular sizes in degrees, the followingapproximation can be used (as long as the angular size is not too great):
3 Measuring the Sun
29 of 39 http://www.open.edu/openlearn/science-maths-technology/science/physics-and-astronomy/the-sun/content-section-0?utm_source=openlearnutm_campaign=olutm_medium=ebook Wednesday 29 May 2019
angular size = 57 × (actual size ÷ distance)The next question asks you to apply this expression to Figure 20.
Question 6
● Calculate 57 × (actual size ÷ distance) for each of the objects in Figure 20.
AnswerThe values are 57 × (1 m ÷ 5.7 m), 57 × (2 m ÷ 11.4 m), 57 × (3 m ÷ 17.1 m), which is10° in each case (as expected).
Units, numbers and physical quantitiesMuch of astronomy concerns quantities such as temperatures, distances, diameters andangular sizes. In all of these cases, units of measurement are important. Physical quantitiesare generally the result of multiplying together a number and a unit of measurement. Thus adistance such as 5.2 kilometres is really the result of multiplying the number 5.2 by the unitof distance known as the kilometre. There are many units of measurement in common use,so, whenever you quote the value of a physical quantity, you should always take care toinclude the unit as well as the number multiplying that unit. It is no use being told that adistance is 5.2 if you don't know whether that means 5.2 centimetres or 5.2 kilometres. Theunit is at least as important as the number.
In scientific work there are several internationally agreed conventions for the definition ofunits and the way in which units should be used and represented when writing down thevalues of physical quantities. The most widely adopted system of units is known as SI,which stands for Systeme International. This is based on seven carefully defined units thatinclude the metre (for length), the second (for time) and the kilogram (for mass). The otherfour base units relate to luminous intensity (i.e. brightness), quantity of matter, electriccurrent and temperature, the unit of which is the same size as the degree Celsius but startsfrom a different zero value and is called the kelvin.
The recognised abbreviations for the metre, the second and the kilogram are m, s and kg,respectively. In all cases, units should be written in the singular form, so it should really be5.2 kilometre or 5.2 km, rather than 5.2 kilometres, and certainly never 5.2 kms, since thatmight be misinterpreted as 5.2 × 1 km × 1 s.
In calculations, units should be treated in the same way as numbers, so the result ofdividing 6.0 km by 3.0 s is 2.0 km/s, which can be read as 2.0 kilometre per second.
Units, such as km/s, that result from combining the base units are called derived units. Themost common derived units are sometimes given their own names and symbols. Theangular unit known as a radian is an example, since angular size can be equated to theresult of dividing one length (a diameter) by another length (a distance). The more familiarunit of angle - the degree - is said to be a supplementary unit since it is defined as a specificfraction (a little less than 1/57) of a radian.
To do the next activity, you need to know that the Moon's diameter is 3476 km. You maywonder how this can be measured from the Earth. In principle, it is a surprisingly easymeasurement to make. First, you have to find the diameter of the Earth, which can beworked out by measuring how much its surface curves. You may be surprised to learn that
3 Measuring the Sun
30 of 39 http://www.open.edu/openlearn/science-maths-technology/science/physics-and-astronomy/the-sun/content-section-0?utm_source=openlearnutm_campaign=olutm_medium=ebook Wednesday 29 May 2019
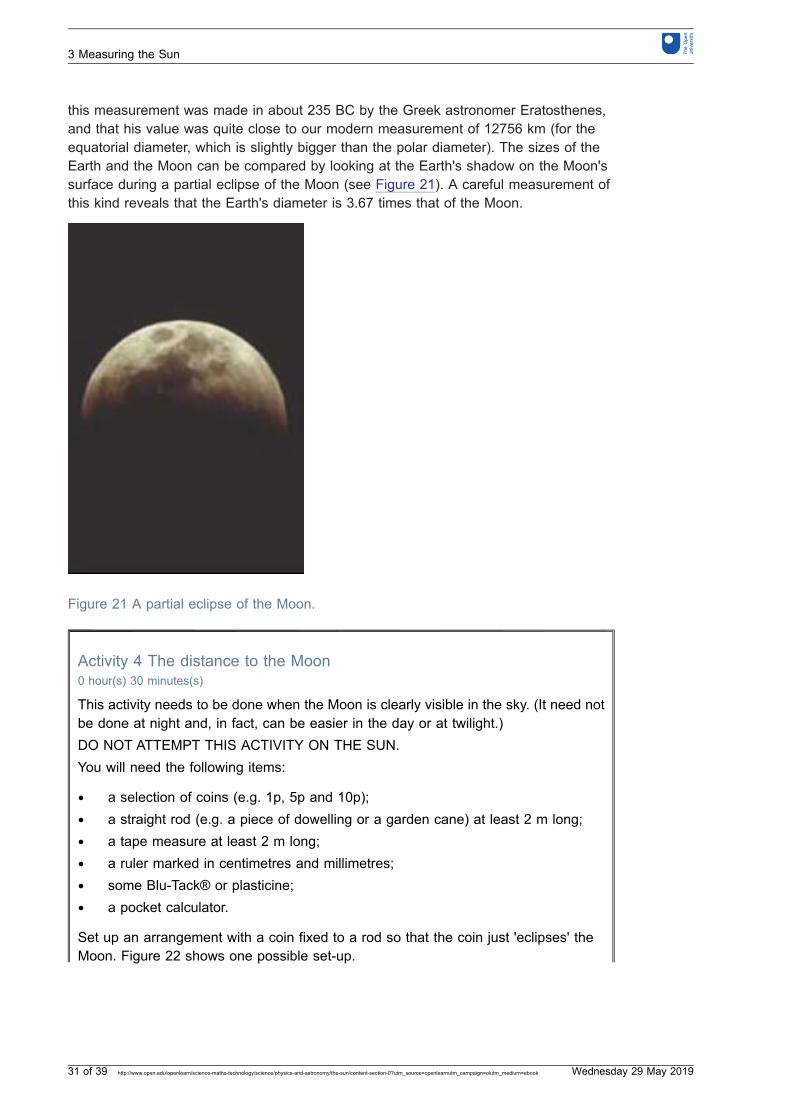
this measurement was made in about 235 BC by the Greek astronomer Eratosthenes,and that his value was quite close to our modern measurement of 12756 km (for theequatorial diameter, which is slightly bigger than the polar diameter). The sizes of theEarth and the Moon can be compared by looking at the Earth's shadow on the Moon'ssurface during a partial eclipse of the Moon (see Figure 21). A careful measurement ofthis kind reveals that the Earth's diameter is 3.67 times that of the Moon.
Figure 21 A partial eclipse of the Moon.
Activity 4 The distance to the Moon0 hour(s) 30 minutes(s)
This activity needs to be done when the Moon is clearly visible in the sky. (It need notbe done at night and, in fact, can be easier in the day or at twilight.)DO NOT ATTEMPT THIS ACTIVITY ON THE SUN.You will need the following items:
● a selection of coins (e.g. 1p, 5p and 10p);● a straight rod (e.g. a piece of dowelling or a garden cane) at least 2 m long;● a tape measure at least 2 m long;● a ruler marked in centimetres and millimetres;● some Blu-Tack® or plasticine;● a pocket calculator.
Set up an arrangement with a coin fixed to a rod so that the coin just 'eclipses' theMoon. Figure 22 shows one possible set-up.
3 Measuring the Sun
31 of 39 http://www.open.edu/openlearn/science-maths-technology/science/physics-and-astronomy/the-sun/content-section-0?utm_source=openlearnutm_campaign=olutm_medium=ebook Wednesday 29 May 2019

Figure 22 One possible arrangement for eclipsing the Moon.
Observing from one end of the rod, try different coins until you find one that is the rightsize to eclipse the Moon when fixed somewhere on the rod. Then adjust the position ofthe coin until it just blocks your view of the Moon. (This is less easy than it sounds, asthere will always be some haze visible around the edge of the coin - try to get the bestmatch.)Measure the distance from the coin to the end of the rod where you have placed youreye, and measure the coin's diameter. Record your values like this:Diameter of coin = .................... mmDistance of coin = .................... mmYou now have the measurements that will enable you to calculate the angular size of acoin that has the same angular size as the Moon.Use your two measurements on the coin to calculate its angular size in degrees, usingthe formula introduced earlier, adapted to the current case, i.e.:angular size of coin = 57° × (diameter of coin ÷ distance of coin) = ....................Your answer should be about half a degree (0.5°). Any value between 0.4° and 0.6° isfine. This is also your measurement of the angular size of the Moon. So, write down:angular size of Moon in degrees = ....................The next step is to calculate the distance to the Moon. Just as for the coin:angular size of Moon = 57° × (diameter of coin ÷ distance of Moon) = ....................This equation can be rearranged to give:distance of Moon = 57° × (diameter of Moon ÷ angular size of Moon in degrees).(Take this on trust if you cannot see it.) Now calculate the distance to the Moon, usingyour value for its angular size and 3476 km for its diameter.Distance of Moon = 57° × (.................... ÷ ....................) = ....................km..You might like to compare your result with the accurately measured value of theMoon's distance: 384 500 km. It is unlikely that you would have got very close to thisanswer, but even with such a quick and fairly rough measurement, your answer shouldshow that the Moon's distance is a few hundred thousand km.
3 Measuring the Sun
32 of 39 http://www.open.edu/openlearn/science-maths-technology/science/physics-and-astronomy/the-sun/content-section-0?utm_source=openlearnutm_campaign=olutm_medium=ebook Wednesday 29 May 2019
AnswerHere are some typical results from this activity:
● diameter of coin = 1.7 cm (UK 5 pence coin)● distance of coin = 182 cm● distance ÷ diameter = 107.058 82 on a calculator (near enough 107).
So, for something whose angular size is that of the Moon (half a degree):
● distance = 107 × diameter● diameter of Moon = 3476 km.
Therefore, distance of Moon = 107 × 3476 km, i.e. distance of Moon = 371 932 km(near enough 372 000 km).To eclipse the Moon, the distance of the coin needs to be roughly one hundred timesits diameter. If you tried using a coin larger than 2 cm diameter, it would need to bemore than 2 m from your eye and would not fit on a 2 m rod.Our result is quite close to the accurately measured value of 384 500 km; yours maybe closer, or not quite so close. Provided you got a value of a few hundred thousandkilometres, that is reasonable. If your value was very different, check back throughyour calculations to see whether you have made a mistake, and look again at yourmeasurements.
The technique used in Activity 4 could also be used to work out the Sun's distance if youknew its size. However, under no circumstances should you try Activity 4 on the Sunbecause it would seriously damage your eyes.
3 Measuring the Sun
33 of 39 http://www.open.edu/openlearn/science-maths-technology/science/physics-and-astronomy/the-sun/content-section-0?utm_source=openlearnutm_campaign=olutm_medium=ebook Wednesday 29 May 2019
4 course summaryThe essential points of this course are as follows.
1. The Sun is a star, emitting all types of electromagnetic radiation. The light thatreaches Earth from the Sun comes mainly from the photosphere, although on its wayto Earth it must pass through the chromosphere and the corona. Each of these partsof the Sun shows signs of magnetically driven activity.
2. Electromagnetic radiation consists of waves that can travel through empty space andcover a huge range of wavelengths.
3. The Sun is powered by nuclear reactions in its hot core which enable it to releaseenergy steadily over thousands of millions of years. The energy released in the coreis transported to the surface by radiation and then convection, passing throughradiative and convection zones on the way.
4. The Sun and the Moon have approximately the same angular size when viewed fromthe Earth.
5. The angular size of an object depends on its actual size and its distance from theobserver.
4 course summary
34 of 39 http://www.open.edu/openlearn/science-maths-technology/science/physics-and-astronomy/the-sun/content-section-0?utm_source=openlearnutm_campaign=olutm_medium=ebook Wednesday 29 May 2019
2.6 End-of-course questions
Question 1What is the approximate wavelength range (in metres) of microwaves?
AnswerThe range is from about 1 m down to a little less than 0.001 m (see Figure 6).
Question 2What are the main modes of energy transfer that participate in the transport of energyfrom the Sun's core to the Earth's surface?
AnswerEnergy released by nuclear reactions in the Sun's core is initially carried away byradiation. Although repeatedly absorbed and re-emitted, it is radiation that carries theenergy through the radiative zone. It is absorbed at the bottom of the convective zone,where it causes the convective flows that are largely responsible for transportingenergy up to the photosphere. Radiation takes over again in the photosphere; theradiation emitted there escapes from the Sun and may transport energy to the Earth'ssurface where it can be absorbed.
Question 3In a sentence or two, explain why the problem of the Sun's fuel puzzled scientists, andsay how the discovery of nuclear reactions solved the puzzle.
AnswerConventional fuels could maintain the Sun's output of light and heat for only a fewthousand years, which is not nearly long enough to sustain the evolution of life onEarth over the millions of years deduced from fossil records. Nuclear reactionsproduce much more energy output for a given amount of fuel, enabling the Sun to emita steady output over thousands of millions of years.
Question 4The Sun is about 150 million km from the Earth. Use information from Section 4 aboutthe angular diameters of the Sun and the Moon to calculate the Sun's approximatediameter. You should note the approximate relationship:actual size = (angular size in degrees × distance) ÷ 57°.(Do not spend more than a few minutes trying to answer this. There is a second way oftackling this question - see whether you can find it.)
2.6 End-of-course questions
35 of 39 http://www.open.edu/openlearn/science-maths-technology/science/physics-and-astronomy/the-sun/content-section-0?utm_source=openlearnutm_campaign=olutm_medium=ebook Wednesday 29 May 2019
AnswerThere are two methods for answering this question.Method 1The expression given is:actual size = (angular size in degrees × distance) ÷ 57.This can be rewritten as:diameter of Sun = (angular size of Sun in degrees × distance of Sun) ÷ 57.The angular size of the Sun is about the same as that of the Moon, i.e. 0.5°, so:diameter of Sun = (0.5 × 150 million km) ÷ 57 = 1.32 million km.Method 2The Sun's diameter is about 400 times the diameter of the Moon. Therefore, if theMoon is 3476 km in diameter, the Sun must have a diameter of about 400 × 3476 km =1.39 million km. {This is not as accurate as in Method 1, because the diameter of theSun is about 400 times the diameter of the Moon.}
Question 5A large sunspot is observed to have an angular size one-twentieth that of the Sun.Taking the Sun's angular size to be 0.5°, what is the angular size of the sunspot?Express your answer in (a) arcmin and (b) arcsec.
Answer(a) There are 60 arcmin in one degree (1°), so the Sun's angular size is 30 arcmin. Theangular size of the sunspot is:30 arcmin ÷ 20 = 1.5 arcmin(b) 1.5 arcmin = 90 arcsec
2.6 End-of-course questions
36 of 39 http://www.open.edu/openlearn/science-maths-technology/science/physics-and-astronomy/the-sun/content-section-0?utm_source=openlearnutm_campaign=olutm_medium=ebook Wednesday 29 May 2019

ConclusionThis free course provided an introduction to studying Science. It took you through a seriesof exercises designed to develop your approach to study and learning at a distance, andhelped to improve your confidence as an independent learner.
Conclusion
37 of 39 http://www.open.edu/openlearn/science-maths-technology/science/physics-and-astronomy/the-sun/content-section-0?utm_source=openlearnutm_campaign=olutm_medium=ebook Wednesday 29 May 2019

Keep on learning
Study another free courseThere are more than 800 courses on OpenLearn for you to choose from on a range ofsubjects.Find out more about all our free courses.
Take your studies furtherFind out more about studying with The Open University by visiting our online prospectus.If you are new to university study, you may be interested in our Access Courses orCertificates.
What's new from OpenLearn?Sign up to our newsletter or view a sample.
For reference, full URLs to pages listed above:
OpenLearn - www.open.edu/openlearn/free-courses
Visiting our online prospectus - www.open.ac.uk/courses
Access Courses - www.open.ac.uk/courses/do-it/access
Certificates - www.open.ac.uk/courses/certificates-he
Newsletter -www.open.edu/openlearn/about-openlearn/subscribe-the-openlearn-newsletter
AcknowledgementsThe content acknowledged below is Proprietary (see terms and conditions) and is usedunder licence.Course image: Charles Roffey in Flickr made available underCreative Commons Attribution-NonCommercial-ShareAlike 2.0 Licence.Grateful acknowledgement is made to the following sources for permission to reproducematerial in this course:
Keep on learning
38 of 39 http://www.open.edu/openlearn/science-maths-technology/science/physics-and-astronomy/the-sun/content-section-0?utm_source=openlearnutm_campaign=olutm_medium=ebook Wednesday 29 May 2019

Figure 1 Dr J Durst, Schonenberg, Switzerland;Figure 7 Courtesy of SOHO. SOHO is aproject of international cooperation between ESAand NASA;Figure 8 US National Oceanic and Atmospheric Administration;Figure 13 © The Royal Astronomical Society;Figure 21 Dennis di cicco/Sky Publishing.TheorrisDon't miss out:If reading this text has inspired you to learn more, you may be interested in joining themillions of people who discover our free learning resources and qualifications by visitingThe Open University - www.open.edu/openlearn/free-courses
Acknowledgements
39 of 39 http://www.open.edu/openlearn/science-maths-technology/science/physics-and-astronomy/the-sun/content-section-0?utm_source=openlearnutm_campaign=olutm_medium=ebook Wednesday 29 May 2019
Top Related
Copyright © 2022 FDOKUMEN

