


Bahasa
Halaman
Hukum

On Supervised Human Activity Analysis forStructured Environments
Banafshe Arbab-Zavar, Imed Bouchrika, John N. Carter and Mark S. Nixon
School of Electronics and Computer Science, University of Southampton,Southampton, SO17 1BJ, UK
Abstract. We consider the problem of developing an automated visualsolution for detecting human activities within industrial environments.This has been performed using an overhead view. This view was chosenover more conventional oblique views as it does not suffer from occlusion,but still retains powerful cues about the activity of individuals. A simpleblob tracker has been used to track the most significant moving parts i.e.human beings. The output of the tracking stage was manually labelledinto 4 distinct categories: walking; carrying; handling and standing stillwhich are taken together from the basic building blocks of a higher workflow description. These were used to train a decision tree using one subsetof the data. A separate training set is used to learn the patterns in theactivity sequences by Hidden Markov Models (HMM). On independenttesting, the HMM models are applied to analyse and modify the sequenceof activities predicted by the decision tree.
1 Introduction
Automated detection and tracking human activities within video sequences isa challenging problem which finds application in monitoring and surveillancesystems as well as human-machine interactions. Recently, parallel to advances invideo camera technologies as well as storage and computation capabilities, therehas been an increase of research interest in the area of human action recognitionin the computer vision community.
Various types of features have been proposed for this task. Parameswaranet al. [1] detects a number of body joints and analyses their trajectories in 2Dinvariance space. Detecting and tracking body parts have also been used to inferthe higher level activities [2, 3]. In this, state space methods have been employedto analyse a sequence of lower level events. Rather than tracking various bodyparts or joints, other methods have used holistic features [4], and local spatio-temporal interest points [5, 6]. Sun et al. [7] experimented with both holisticfeatures and local interest points and showed that the effectiveness of thesefeatures depends on the characteristics of the dataset. Apart from the approachto recognize the actions, various proposed methods differ significantly in terms of:the activities which they aim to recognize; camera angle; background propertiesand image quality.
2 Banafshe Arbab-Zavar, Imed Bouchrika, John N. Carter and Mark S. Nixon
Despite various approaches to human action recognition, the datasets whichare used are mainly well-constrained and occlusion-free, which are far from whatmay be observed by a surveillance camera. The side and frontal views appear tobe the dominant view angles for these analyses. In this paper, we will considerthe problem of human action recognition from a continuous feed of video captur-ing from a top view panoramic camera monitoring an industrial plant. In this,the conventional view angles are subject to unworkable levels of occlusion. Mul-tiple subjects may appear on each frame while the background is also changing.We analyse four action categories: walking; carrying; handling and standing stillwhich are taken together from the basic building blocks of a higher level workflow analysis. We use a simple blob tracker to detect the main moving partsi.e. human beings. Various shape-based and motion-based features are then ex-tracted for the action recognition. These features are extracted from a 10 frameslong window. A binary decision tree which uses the features selected via theASFFS feature selection algorithm provides initial prediction for the activitywhich is being performed. Exploiting our continuous video data, we can thenanalyse the validity of the predicted sequence of activities and their stabilityover time. Note that given the nature of the data, which captures a stage in anindustrial work flow, there are patterns in the sequences of activities, and theseactivities are also spatially constrained. The sequence of predicted activities isanalysed by HMM models which have been trained on a separate training data.
2 Human Activity Analysis
2.1 On Viewpoint Selection
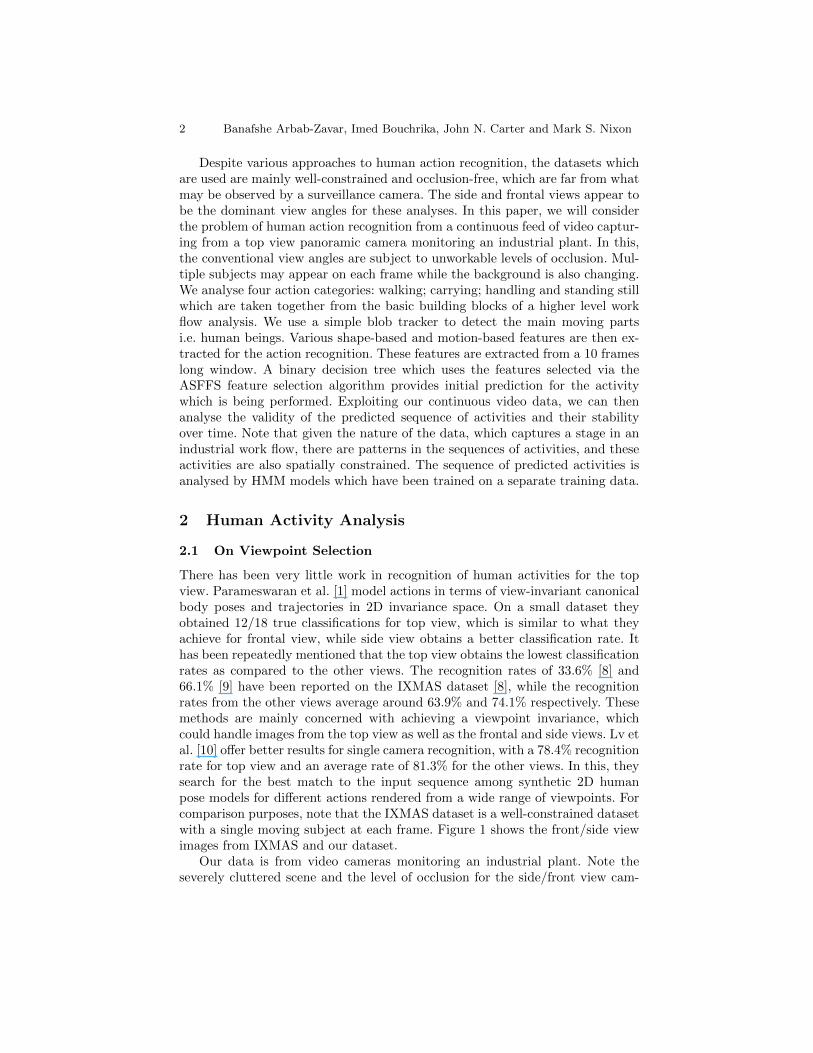
There has been very little work in recognition of human activities for the topview. Parameswaran et al. [1] model actions in terms of view-invariant canonicalbody poses and trajectories in 2D invariance space. On a small dataset theyobtained 12/18 true classifications for top view, which is similar to what theyachieve for frontal view, while side view obtains a better classification rate. Ithas been repeatedly mentioned that the top view obtains the lowest classificationrates as compared to the other views. The recognition rates of 33.6% [8] and66.1% [9] have been reported on the IXMAS dataset [8], while the recognitionrates from the other views average around 63.9% and 74.1% respectively. Thesemethods are mainly concerned with achieving a viewpoint invariance, whichcould handle images from the top view as well as the frontal and side views. Lv etal. [10] offer better results for single camera recognition, with a 78.4% recognitionrate for top view and an average rate of 81.3% for the other views. In this, theysearch for the best match to the input sequence among synthetic 2D humanpose models for different actions rendered from a wide range of viewpoints. Forcomparison purposes, note that the IXMAS dataset is a well-constrained datasetwith a single moving subject at each frame. Figure 1 shows the front/side viewimages from IXMAS and our dataset.
Our data is from video cameras monitoring an industrial plant. Note theseverely cluttered scene and the level of occlusion for the side/front view cam-
Lecture Notes in Computer Science 3
Fig. 1. Compare the frontal view from the IXMAS data with a side/front view of ourdata.
era. In fact, our dataset is characterized by the severe levels of occlusion whichaffects all the camera views except for the overhead camera (see Figure 2(a)). Wepropose that this scenario is likely to arise in many surveillance systems speciallywithin similar industrial environments. Thus, for detecting human activities, wehave chosen to use the overhead view, which is not affected by occlusion. Unlikethe methods mentioned above, we propose to design methods which primarilycapture the information from the top view.
2.2 Human Detection and Tracking
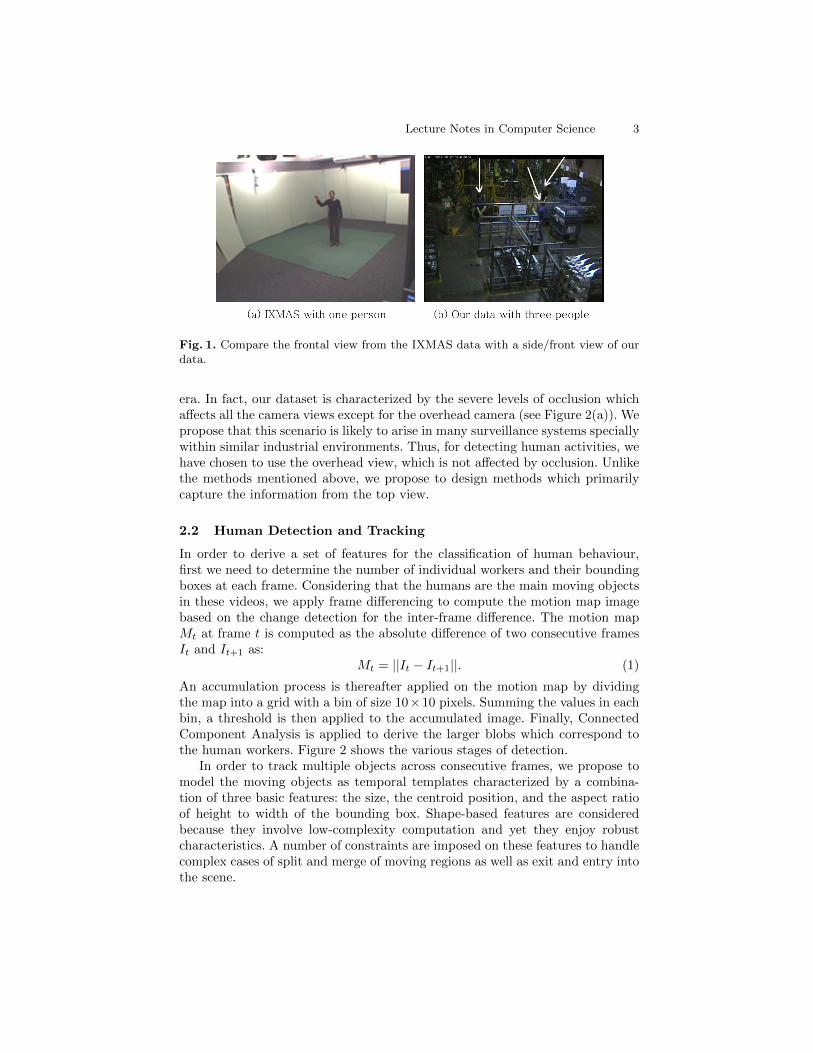
In order to derive a set of features for the classification of human behaviour,first we need to determine the number of individual workers and their boundingboxes at each frame. Considering that the humans are the main moving objectsin these videos, we apply frame differencing to compute the motion map imagebased on the change detection for the inter-frame difference. The motion mapMt at frame t is computed as the absolute difference of two consecutive framesIt and It+1 as:
Mt = ||It − It+1||. (1)
An accumulation process is thereafter applied on the motion map by dividingthe map into a grid with a bin of size 10×10 pixels. Summing the values in eachbin, a threshold is then applied to the accumulated image. Finally, ConnectedComponent Analysis is applied to derive the larger blobs which correspond tothe human workers. Figure 2 shows the various stages of detection.
In order to track multiple objects across consecutive frames, we propose tomodel the moving objects as temporal templates characterized by a combina-tion of three basic features: the size, the centroid position, and the aspect ratioof height to width of the bounding box. Shape-based features are consideredbecause they involve low-complexity computation and yet they enjoy robustcharacteristics. A number of constraints are imposed on these features to handlecomplex cases of split and merge of moving regions as well as exit and entry intothe scene.
4 Banafshe Arbab-Zavar, Imed Bouchrika, John N. Carter and Mark S. Nixon
Fig. 2. Four stages of the human detection.
2.3 Feature Extraction
A label — walking; carrying; handling and standing — will be assigned to eachdetected blob at each frame determining its activity. However, to arrive at thislabel, we consider a period of ten consecutive frames in which the individual isdetected. Schindler et al. [11] have also asked the question: how many frames isrequired for human action recognition? They showed that for the set of actionswhich they were aiming to recognize a short sequence of 5-7 frames can obtain aperformance similar to the analysis of the entire sequence. However, an analysisof recognition from top view has not been considered in this work.
Since both the temporal features and the shape of the moving blob includecues as to the activity which is being performed, we extract both shape-basedand motion-based features for the detected blobs. These features are:
– Hu Invariant Moments [12], which are seven moments providing a globaldescription of the shape. These are translation, scale and rotation invariant.
– Region-based properties: area, diameter, etc.– Motion-based: speed and the direction of speed.
The mean value, within the 10-frame window, for each of these features is consid-ered. However, as well as the mean, the changes in the value of these parameterscan provide discriminant cues. Therefore, the sequence of values for each feature
Lecture Notes in Computer Science 5
is analysed for the frequency of changes via discrete Fourier transform. Mag-nitude and phase in different frequencies are then added to the feature vector.Let φ be the set of all shape and motion based features which have been listedabove. Let fi(n) be the feature fi, where fi ∈ φ, detected on the nth frame ofthe 10-frame period analysed for each sample. Fi is the set of features fi acrossthe 10 frames interval;
Fi = {fi(n)} , n = 1..10 . (2)
Let F denote discrete Fourier transform.
Xi = F(Fi)
Ai(n) = |Xi(n)| , ϕi(n) = arg(Xi(n)) (3)
whereAi and ϕi denote the magnitude and phase in different frequencies. Therebythe feature vector V is generated for each sample as:
V = {Ai(n), ϕi(n), µi, σi } , i = 1..|φ| , n = 1..10 (4)
where µ and σ denote the mean and the standard deviation of the featurevalues. Thereby, a large and variant feature vector with 345 features is created.
As discussed in section 2.1, our industrial framework introduces extra compli-cations in terms of limitations in quality and control over the acquired samples.The occlusion in the conventional oblique views have been discussed and a so-lution was offered through the use of the top view. However, other difficultiesinclude poor image quality, noisy environment, camera shakes, changes in light-ing and, in the case of our dataset, a practical issue with random phases oftemporal inconsistency resulted from dropped frames. Thereby robustness tonoise and outliers appears a desirable feature. Due to the composite nature ofour 345-dimensional feature space and that various feature types are susceptibleto different levels of corruption in noise, a feature subset selection method isemployed to derive the discriminative cues whilst removing the corrupted andirrelevant features. This is explained in more detail in the next section.
2.4 Supervised Binary Tree Classification
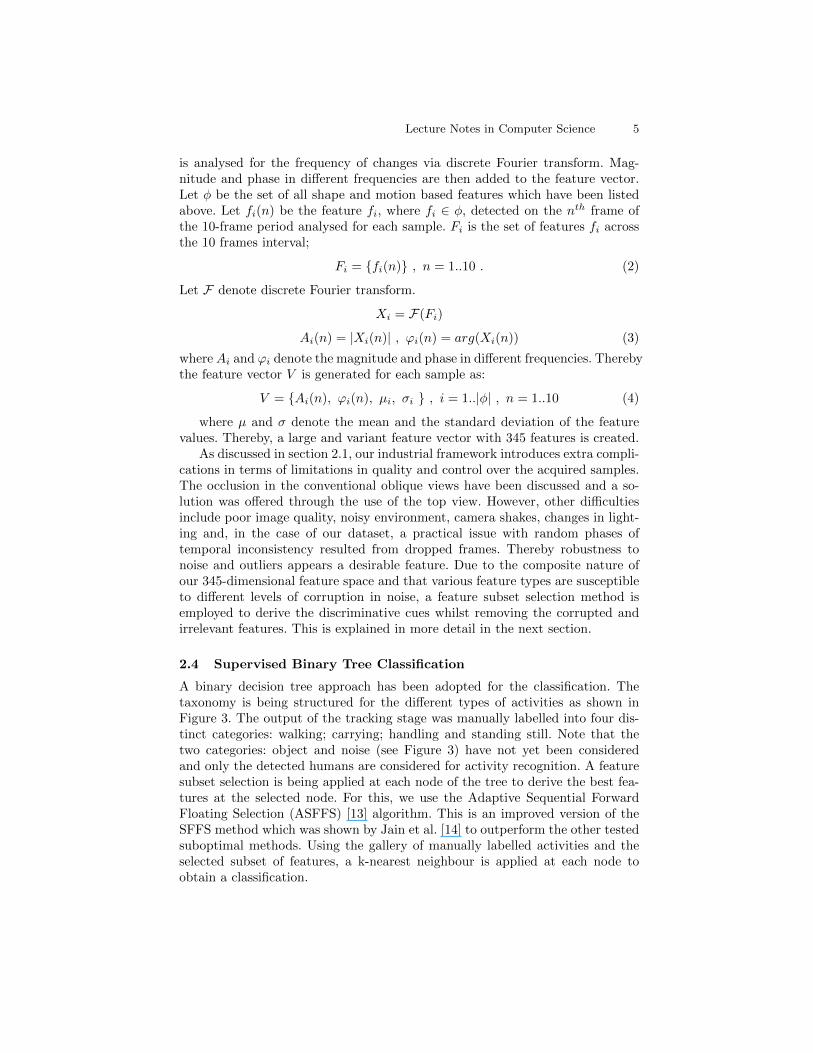
A binary decision tree approach has been adopted for the classification. Thetaxonomy is being structured for the different types of activities as shown inFigure 3. The output of the tracking stage was manually labelled into four dis-tinct categories: walking; carrying; handling and standing still. Note that thetwo categories: object and noise (see Figure 3) have not yet been consideredand only the detected humans are considered for activity recognition. A featuresubset selection is being applied at each node of the tree to derive the best fea-tures at the selected node. For this, we use the Adaptive Sequential ForwardFloating Selection (ASFFS) [13] algorithm. This is an improved version of theSFFS method which was shown by Jain et al. [14] to outperform the other testedsuboptimal methods. Using the gallery of manually labelled activities and theselected subset of features, a k-nearest neighbour is applied at each node toobtain a classification.
6 Banafshe Arbab-Zavar, Imed Bouchrika, John N. Carter and Mark S. Nixon
Fig. 3. The binary tree structure for initial classification of activities.
2.5 Spatially specific HMMs for Sequence Analysis
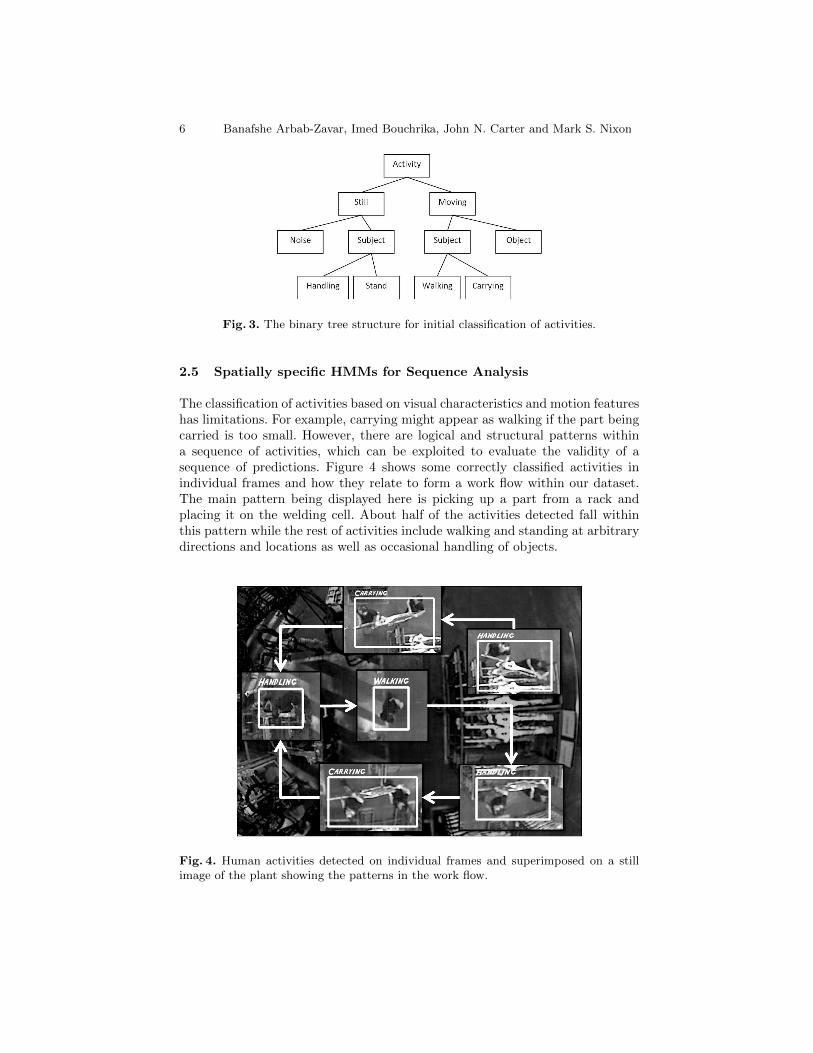
The classification of activities based on visual characteristics and motion featureshas limitations. For example, carrying might appear as walking if the part beingcarried is too small. However, there are logical and structural patterns withina sequence of activities, which can be exploited to evaluate the validity of asequence of predictions. Figure 4 shows some correctly classified activities inindividual frames and how they relate to form a work flow within our dataset.The main pattern being displayed here is picking up a part from a rack andplacing it on the welding cell. About half of the activities detected fall withinthis pattern while the rest of activities include walking and standing at arbitrarydirections and locations as well as occasional handling of objects.
Fig. 4. Human activities detected on individual frames and superimposed on a stillimage of the plant showing the patterns in the work flow.
Lecture Notes in Computer Science 7
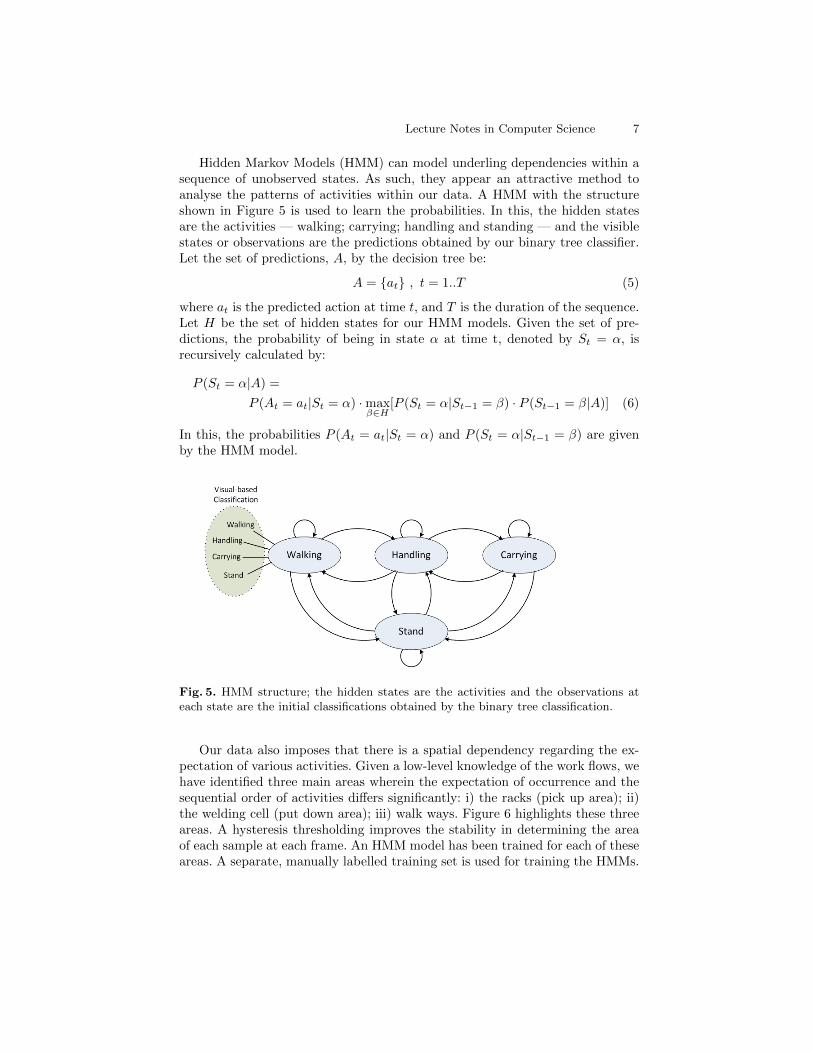
Hidden Markov Models (HMM) can model underling dependencies within asequence of unobserved states. As such, they appear an attractive method toanalyse the patterns of activities within our data. A HMM with the structureshown in Figure 5 is used to learn the probabilities. In this, the hidden statesare the activities — walking; carrying; handling and standing — and the visiblestates or observations are the predictions obtained by our binary tree classifier.Let the set of predictions, A, by the decision tree be:
A = {at} , t = 1..T (5)
where at is the predicted action at time t, and T is the duration of the sequence.Let H be the set of hidden states for our HMM models. Given the set of pre-dictions, the probability of being in state α at time t, denoted by St = α, isrecursively calculated by:
P (St = α|A) =
P (At = at|St = α) ·maxβ∈H
[P (St = α|St−1 = β) · P (St−1 = β|A)] (6)
In this, the probabilities P (At = at|St = α) and P (St = α|St−1 = β) are givenby the HMM model.
Fig. 5. HMM structure; the hidden states are the activities and the observations ateach state are the initial classifications obtained by the binary tree classification.
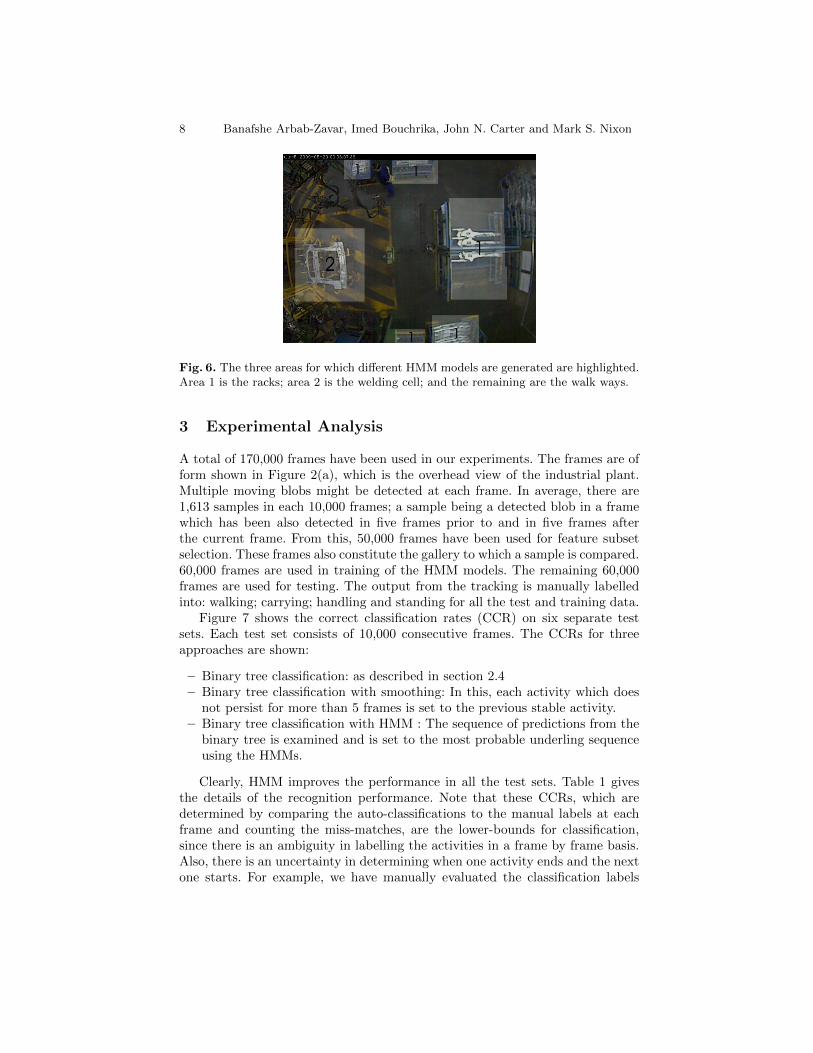
Our data also imposes that there is a spatial dependency regarding the ex-pectation of various activities. Given a low-level knowledge of the work flows, wehave identified three main areas wherein the expectation of occurrence and thesequential order of activities differs significantly: i) the racks (pick up area); ii)the welding cell (put down area); iii) walk ways. Figure 6 highlights these threeareas. A hysteresis thresholding improves the stability in determining the areaof each sample at each frame. An HMM model has been trained for each of theseareas. A separate, manually labelled training set is used for training the HMMs.
8 Banafshe Arbab-Zavar, Imed Bouchrika, John N. Carter and Mark S. Nixon
Fig. 6. The three areas for which different HMM models are generated are highlighted.Area 1 is the racks; area 2 is the welding cell; and the remaining are the walk ways.
3 Experimental Analysis
A total of 170,000 frames have been used in our experiments. The frames are ofform shown in Figure 2(a), which is the overhead view of the industrial plant.Multiple moving blobs might be detected at each frame. In average, there are1,613 samples in each 10,000 frames; a sample being a detected blob in a framewhich has been also detected in five frames prior to and in five frames afterthe current frame. From this, 50,000 frames have been used for feature subsetselection. These frames also constitute the gallery to which a sample is compared.60,000 frames are used in training of the HMM models. The remaining 60,000frames are used for testing. The output from the tracking is manually labelledinto: walking; carrying; handling and standing for all the test and training data.
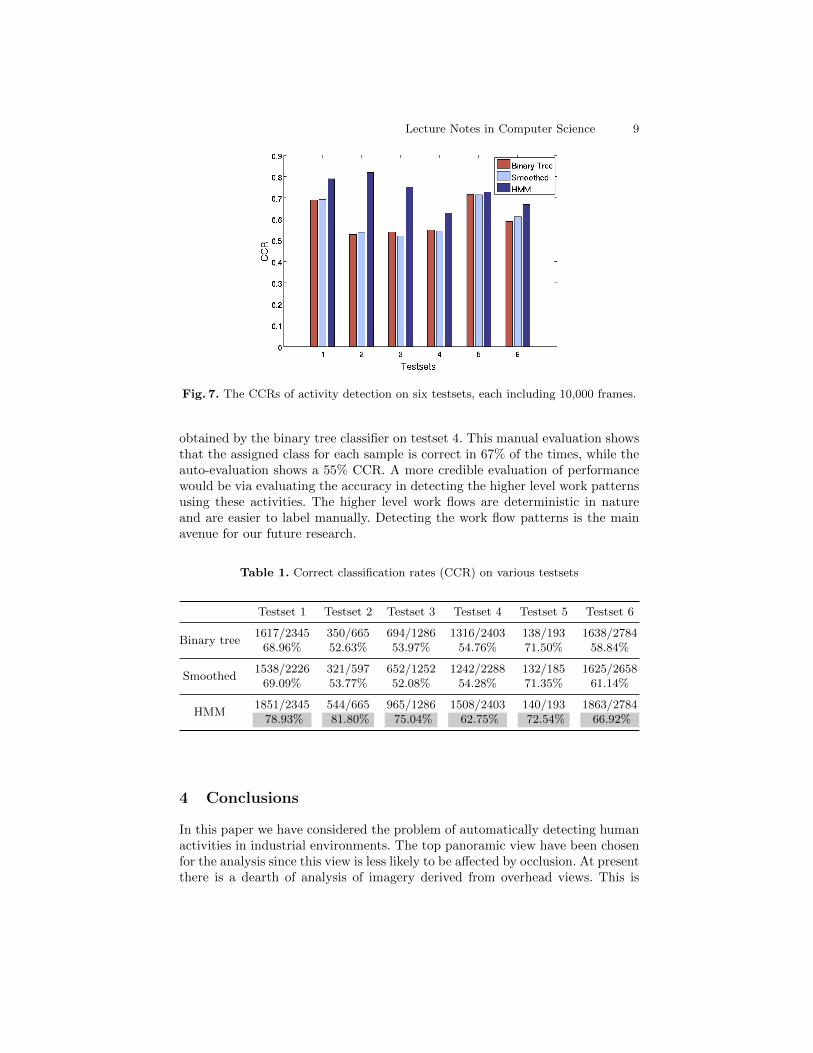
Figure 7 shows the correct classification rates (CCR) on six separate testsets. Each test set consists of 10,000 consecutive frames. The CCRs for threeapproaches are shown:
– Binary tree classification: as described in section 2.4– Binary tree classification with smoothing: In this, each activity which does
not persist for more than 5 frames is set to the previous stable activity.– Binary tree classification with HMM : The sequence of predictions from the
binary tree is examined and is set to the most probable underling sequenceusing the HMMs.
Clearly, HMM improves the performance in all the test sets. Table 1 givesthe details of the recognition performance. Note that these CCRs, which aredetermined by comparing the auto-classifications to the manual labels at eachframe and counting the miss-matches, are the lower-bounds for classification,since there is an ambiguity in labelling the activities in a frame by frame basis.Also, there is an uncertainty in determining when one activity ends and the nextone starts. For example, we have manually evaluated the classification labels
Lecture Notes in Computer Science 9
Fig. 7. The CCRs of activity detection on six testsets, each including 10,000 frames.
obtained by the binary tree classifier on testset 4. This manual evaluation showsthat the assigned class for each sample is correct in 67% of the times, while theauto-evaluation shows a 55% CCR. A more credible evaluation of performancewould be via evaluating the accuracy in detecting the higher level work patternsusing these activities. The higher level work flows are deterministic in natureand are easier to label manually. Detecting the work flow patterns is the mainavenue for our future research.
Table 1. Correct classification rates (CCR) on various testsets
Testset 1 Testset 2 Testset 3 Testset 4 Testset 5 Testset 6
Binary tree1617/2345 350/665 694/1286 1316/2403 138/193 1638/2784
68.96% 52.63% 53.97% 54.76% 71.50% 58.84%
Smoothed1538/2226 321/597 652/1252 1242/2288 132/185 1625/2658
69.09% 53.77% 52.08% 54.28% 71.35% 61.14%
HMM1851/2345 544/665 965/1286 1508/2403 140/193 1863/2784
78.93% 81.80% 75.04% 62.75% 72.54% 66.92%
4 Conclusions
In this paper we have considered the problem of automatically detecting humanactivities in industrial environments. The top panoramic view have been chosenfor the analysis since this view is less likely to be affected by occlusion. At presentthere is a dearth of analysis of imagery derived from overhead views. This is

10 Banafshe Arbab-Zavar, Imed Bouchrika, John N. Carter and Mark S. Nixon
well suited to industrial environments, and might extend to indoor surveillancescenarios. Shape-based and motion-based features have been used to derive aclassification based on a binary-tree structure of activities which are taken froma higher level work flow. Classifying the activities based on the visual cues haslimitations were the activities appear similar. A large improvement is observedwhen we employ Hidden Markov Models to analyse the sequence of detectedactivities. Having learned the patterns in activity sequences, these models offera more viable and stable sequence of predictions based on the initial classificationand their spatial properties. Considering the origin of our data which shows aperiod in a manufacturing cycle, the main avenue for our future research isdetecting these higher level work flows.
References
1. Parameswaran, V., Chellappa, R.: View invariance for human action recognition.IJCV 66 (2006) 83–101
2. Ryoo, M.S., Aggarwal, J.K.: Semantic representation and recognition of continuedand recursive human activities. IJCV 82 (2009) 1–24
3. Ikizler, N., Forsyth, D.A.: Searching for complex human activities with no visualexamples. IJCV 80 (2008) 337–357
4. Bobick, A.F., Davis, J.W.: The recognition of human movement using temporaltemplates. TPAMI 23 (2001) 257–267
5. Niebles, J.C., Wang, H., Fei-Fei, L.: Unsupervised learning of human action cate-gories using spatial-temporal words. IJCV 79 (2008) 299–318
6. Laptev, I., Caputo, B., Schuldt, C., Lindeberg, T.: Local velocity-adapted motionevents for spatio-temporal recognition. CVIU 108 (2007) 207–229
7. Sun, X., Chen, M., Hauptmann, A.: Action recognition via local descriptors andholistic features. In: CVPR, Miami, USA (2009)
8. Weinland, D., Boyer, E., Ronfard, R.: Action recognition from arbitrary viewsusing 3d exemplars. In: ICCV, Rio de Janeiro, Brazil (2007)
9. Junejo, I.N., Dexter, E., Laptev, I., Perez, P.: Cross-view action recognition fromtemporal self-similarities. In: ECCV, Marseille, France (2008)
10. Lv, F., Nevatia, R.: Single view human action recognition using key pose matchingand viterbi path searching. In: CVPR, Minneapolis, MN, USA (2007)
11. Schindler, K., van Gool, L.: Action snippets: How many frames does human actionrecognition require? In: CVPR, Anchorage, AK (2008)
12. Hu, M.: Visual pattern recognition by moment invariants. IEEE Transactions onInformation Theory 8 (1962) 179–187
13. Somol, P., Pudil, P., Novovicova, J., Paclık, P.: Adaptive floating search methodsin feature selection. Pattern Recognition Letters 20 (1999) 1157–1163
14. Jain, A., Zongker, D.: Feature selection: Evaluation, application, and small sampleperformance. TPAMI 19 (1997) 153–158
Top Related
Copyright © 2022 FDOKUMEN

