


Bahasa
Halaman
Hukum

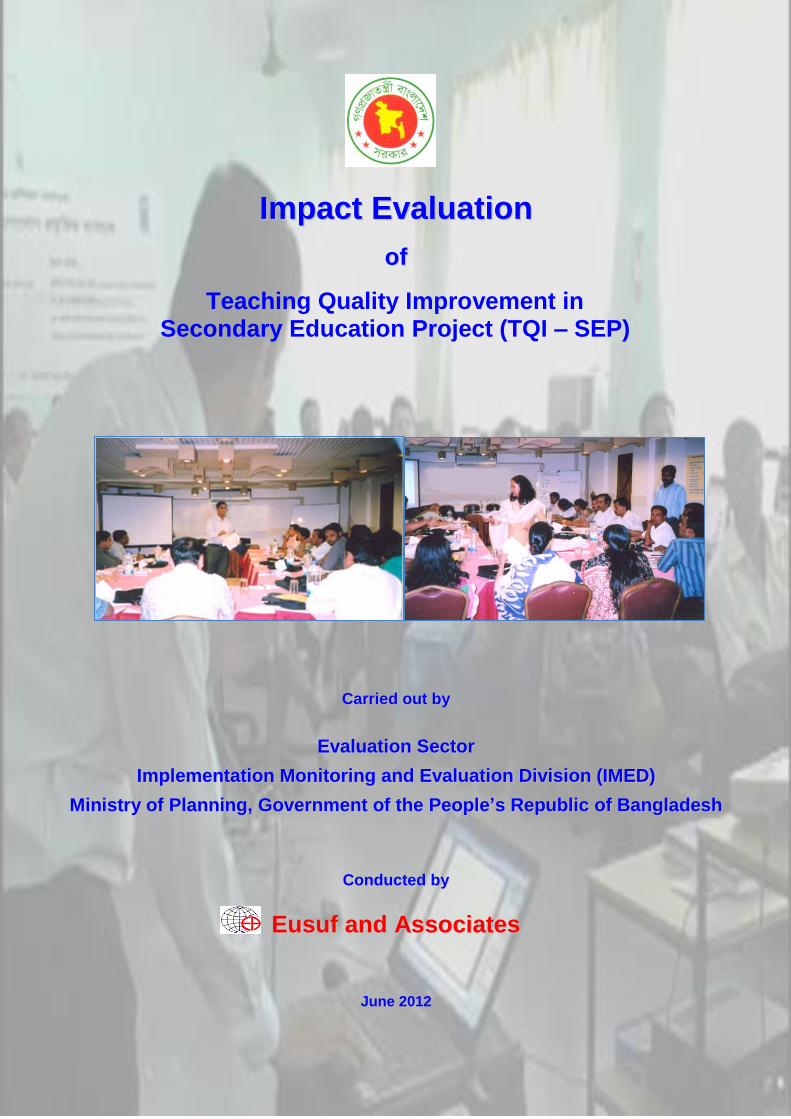
IImmppaacctt EEvvaalluuaattiioonn
ooff
Teaching Quality Improvement in Secondary Education Project (TQI – SEP)
CCaarrrriieedd oouutt bbyy
EEvvaalluuaattiioonn SSeeccttoorr
IImmpplleemmeennttaattiioonn MMoonniittoorriinngg aanndd EEvvaalluuaattiioonn DDiivviissiioonn ((IIMMEEDD))
MMiinniissttrryy ooff PPllaannnniinngg,, GGoovveerrnnmmeenntt ooff tthhee PPeeooppllee’’ss RReeppuubblliicc ooff BBaannggllaaddeesshh
CCoonndduucctteedd bbyy
EEuussuuff aanndd AAssssoocciiaatteess
June 2012

Impact Evaluation
of
Teaching Quality Improvement in Secondary Education
Eusuf and Associates Professionals IMED Officials
Prof. Dr. M. Nurul Islam Syed Md. Haider Ali Evaluation Specialist/Team Leader Director General, Evaluation Sector
Prof.Dr.Md.Delwar Hossain Shaikh Mr. Md. Abdul Quiyum Educationist Director, Evaluation Sector
Mr. Md.Abdul Khaleque Ms. Sufia Zakariah Statistician Director, Evaluation Sector
Dr. Mohammed Eusuf Ali Md. Mahmudul Hasan
Study Coordinator Assistant Director, Evaluation Sector
Carried out by
Evaluation Sector
Implementation Monitoring and Evaluation Division (IMED)
Ministry of Planning, Government of the People’s Republic of Bangladesh
Conducted by
Eusuf and Associates
June 2012


Evaluation of the Teaching Quality Improvement in Secondary Education Project
Eusuf and Associates Page i
List of Abbreviations
ADB Asian Development Bank
ADEO Assistant District Education Officer
AI Assistant Inspector
ARO Assistant Research Officer
AS Academic Supervisor
AUSEO Assistant Upazila Secondary Education Officer
BANBEIS Bangladesh Bureau of Educational Information and Statistics
B.Ed. Bachelor of Education
BIAM Bangladesh Institute of Administration and Management
BMTTI Bangladesh Madrasha Teachers’ Training Institute
BOU Bangladesh Open University
B.P.Ed. Bachelor of Physical Education
CIDA Canadian International Development Agency
CHT Chittagong Hill Tracts
CPD Continuous Professional Development
DA Daily Allowance
DEO District Education Officer
DPP Development Project Proposal
DSHE Directorate of Secondary and Higher Education
DU Dhaka University
EA Education Administrator
EC European Commission
EMIS Education Management Information System
EO Education Officer
FEC Foreign Exchange Component
FGD Focus Group Discussions
GIS Geographic Information System
GOB Government of the People’s Republic of Bangladesh
HSC Higher Secondary Certificate
HSTTI Higher Secondary Teachers’ Training Institute
HT Head Teacher
HTT Head Teacher Training
IDF Innovation and Development Fund
IE Inclusive Education
IER Institute of Education and Research
IMED Implementation Monitoring and Evaluation Division
JSC Junior School Certificate
LAN Local Area Network
M.Ed. Master of Education
MOE Ministry of Education
MPO Monthly Payment Order
NAEM National Academy for Educational Management
NGO Non-governmental Organization
NU National University
NTEARA National Teacher Education Accreditation and Registration Authority
NTEC National Teacher Education Council

Evaluation of the Teaching Quality Improvement in Secondary Education Project
Eusuf and Associates Page ii
NTRCA Non-government Teacher Registration and Certification Authority
OHP Overhead Projector
ORC Outreach Resource Center
Ph.D. Doctor of Philosophy
PMU Project Management Unit
PROMOTE Program to Motivate, Train and Employ Female Teachers in Rural Secondary Schools
PP Project Proposal
PSPU Policy and Strategy Planning Unit
PSC Project Steering Committee
RO Research Officer
RPATC Regional Public Administration Training Center
SBA School Based Assessment
SESDC Secondary Education Science Development Center
SESDP Secondary Education Sector Development Project
SESIP Secondary Education Sector Improvement Project
SMC School Management Committee
SSC Secondary School Certificate
STC Secondary Teaching Certificate
STIS Secondary Teacher Information System
TA Traveling Allowance
TE Teachers’ Education
TOT Training of Trainers
TQI-SEP Teaching Quality Improvement in Secondary Education Project
TTC Teachers’ Training College
UPS Uninterrupted Power Supply
USEO Upazila Secondary Education Officer
Evaluation of the Teaching Quality Improvement in Secondary Education Project
Eusuf and Associates Page iii
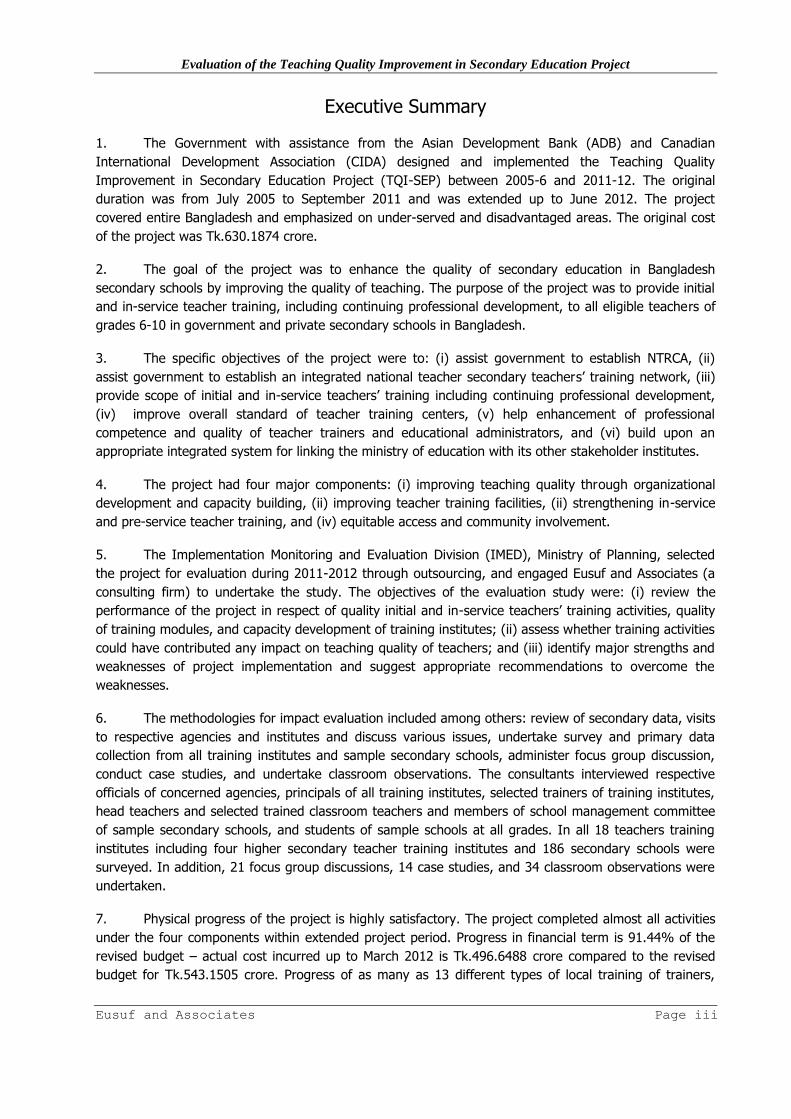
Executive Summary
1. The Government with assistance from the Asian Development Bank (ADB) and Canadian
International Development Association (CIDA) designed and implemented the Teaching Quality
Improvement in Secondary Education Project (TQI-SEP) between 2005-6 and 2011-12. The original
duration was from July 2005 to September 2011 and was extended up to June 2012. The project
covered entire Bangladesh and emphasized on under-served and disadvantaged areas. The original cost
of the project was Tk.630.1874 crore.
2. The goal of the project was to enhance the quality of secondary education in Bangladesh
secondary schools by improving the quality of teaching. The purpose of the project was to provide initial
and in-service teacher training, including continuing professional development, to all eligible teachers of
grades 6-10 in government and private secondary schools in Bangladesh.
3. The specific objectives of the project were to: (i) assist government to establish NTRCA, (ii)
assist government to establish an integrated national teacher secondary teachers’ training network, (iii)
provide scope of initial and in-service teachers’ training including continuing professional development,
(iv) improve overall standard of teacher training centers, (v) help enhancement of professional
competence and quality of teacher trainers and educational administrators, and (vi) build upon an
appropriate integrated system for linking the ministry of education with its other stakeholder institutes.
4. The project had four major components: (i) improving teaching quality through organizational
development and capacity building, (ii) improving teacher training facilities, (ii) strengthening in-service
and pre-service teacher training, and (iv) equitable access and community involvement.
5. The Implementation Monitoring and Evaluation Division (IMED), Ministry of Planning, selected
the project for evaluation during 2011-2012 through outsourcing, and engaged Eusuf and Associates (a
consulting firm) to undertake the study. The objectives of the evaluation study were: (i) review the
performance of the project in respect of quality initial and in-service teachers’ training activities, quality
of training modules, and capacity development of training institutes; (ii) assess whether training activities
could have contributed any impact on teaching quality of teachers; and (iii) identify major strengths and
weaknesses of project implementation and suggest appropriate recommendations to overcome the
weaknesses.
6. The methodologies for impact evaluation included among others: review of secondary data, visits
to respective agencies and institutes and discuss various issues, undertake survey and primary data
collection from all training institutes and sample secondary schools, administer focus group discussion,
conduct case studies, and undertake classroom observations. The consultants interviewed respective
officials of concerned agencies, principals of all training institutes, selected trainers of training institutes,
head teachers and selected trained classroom teachers and members of school management committee
of sample secondary schools, and students of sample schools at all grades. In all 18 teachers training
institutes including four higher secondary teacher training institutes and 186 secondary schools were
surveyed. In addition, 21 focus group discussions, 14 case studies, and 34 classroom observations were
undertaken.
7. Physical progress of the project is highly satisfactory. The project completed almost all activities
under the four components within extended project period. Progress in financial term is 91.44% of the
revised budget – actual cost incurred up to March 2012 is Tk.496.6488 crore compared to the revised
budget for Tk.543.1505 crore. Progress of as many as 13 different types of local training of trainers,
Evaluation of the Teaching Quality Improvement in Secondary Education Project
Eusuf and Associates Page iv
head teachers, members of school management committee, education administrators, and secondary
school teachers is 98.17% - a total of 511,995 persons could be trained compared to a target of 521,547
persons. Except slow progress at the initial stage, the project implementation was smooth and quite fast
at the later stage. Besides, appreciation from the government for satisfactory progress of project
implementation, the Asian Development Bank (ADB) ranked the project as the best performed project
three times during its implementation.
8. Average number of teachers per surveyed TTCs reduced compared to baseline data and
percentage of vacant posts against sanctioned posts increased to 27.0% from 18.4% during baseline
survey. All surveyed TTCs received various facilities like infrastructure, furniture, equipment, and
teaching-learning materials.
9. The training rooms and other teaching facilities in teacher training institutes improved and
expanded compared to baseline period including the facilities for the trainees such as dormitory, library,
canteen, toilets, utensils, etc. Almost all (88%) teachers of TTCs and HSTTIs, received training on
computer application at the classroom and the evaluation study noted that 8.5% actually use computers
in classroom for training.
10. Evaluation study noted that the trainers of the TTC and HSTTI consider less than 30 participants
is best per batch for training class. They also suggested that up to 40 participants is some how
manageable. Seven out of every ten trainers (70%) reported that the contents of all training courses
were relevant to the purpose and objectives of training focusing improved quality of teaching in
secondary schools. The study noted rooms for further improvement of relevance of the content to ensure
quality and effectiveness of training.
11. It is noted that in terms of subject based teacher training, subjects like social science, computer,
education science, Bengali, religion, mathematics, agriculture got higher priority or the number of
teachers in these subjects were higher than other subjects. Training in English in particular should have
got high priority.
12. The trainers appreciated high of the use of modern methods of training such as participatory,
pair work, question-answer, and group works. The trainers also supported increased use of modern
training appliances such projector, OHP, manual, hand out, chart and model, The quality of training
modules and other materials were rated by the trainers – manual was rated as good by 88.2%, hand out
was rated as good by 76.9%, and chart and model good by 74.1%. Here again, there exists rooms for
improvements. Quality of training greatly relies on the quality of training materials. Further, the trainers
assessed the quality of training materials as excellent and good, partially good, and not good. It is noted
that 88.2% trainers rated manual as excellent and good, 76.9% trainers rated hand outs as excellent
and good, and 25.9% trainers rated chart and models excellent and good. The feedback indicated that
almost one out of every four trainers considered that quality of manuals, hand out, and chart and models
need improvements.
13. The project introduced a unique program for monitoring of classroom observation to monitor
performance of trained teachers in the classrooms. The monitoring is proved useful for the classroom
teachers as well as the trainers could obtain feedback and making adjustments of training. The
monitoring is faced with number of barriers such as lack of skills of teachers, non cooperation of school
authority in implementing the suggestions, and resource constraints (lack of electricity, scarcity of
materials) and lack of time that often clash with programs in institutes and time for the monitoring). The
useful monitoring program is faced with its sustainability due to fund constraints. The program could not
Evaluation of the Teaching Quality Improvement in Secondary Education Project
Eusuf and Associates Page v
run even during the period of evaluation study due to lack of fund for cost of fuel for the vehicle and per
diem of the trainers.
14. The evaluation study surveyed 186 schools including 150 schools surveyed during baseline
survey. The 186 schools comprised of 34 public secondary schools and 152 private secondary schools.
Among the head teachers 13% are female and 87% male. Interestingly, 61% male head teachers are
simply graduates compared to 66% female teachers have masters. On the other hand, 94.4% male head
teachers have degree in education while 100% female head teachers have degree is education. In terms
of age most of the head teachers irrespective of gender are within the range of 40-60 years. Both male
and female head teachers have experience as head of institution for 5-20 years.
15. In average, each school has about 12 teachers under MPO and 2 non-MPO teachers. Growth of
the number of total teachers and female teachers in surveyed schools increased by respectively 10.9%
and 24.5% during the project indicating increase of access of the female teachers in secondary
education. Number of teachers with degree in education increased during the project period only at an
annual rate of 2.2%. Turn over of teachers is not high and teachers leave the profession mainly for
employments with better opportunities compared to less attractive teaching profession.
16. Frequency of class supervision by head teacher and purpose and activities involved in the
supervision has positively changed. In average, a head teacher conduct 11.8 staff meetings per year,
evaluates 14.0 teachers per year, and supervises 15.8 classes every month. This supervisory work load
has increased partly due to the project compared to the pre-project situation. The academic supervision
has dramatically improved teaching and learning and school management altogether. Performance of
teachers and students has significantly improved.
17. Evaluation study found that the surveyed schools increasingly involved the community in the
affairs of the school. Besides, SMC members having received training changed their attitudes towards
responsible and active participation in the school management. Study found that 55% schools hold
monthly meetings with SMC members, 29% schools hold meetings quarterly, and 3% half yearly, and
the rest hold meetings irregularly as and when needed. Role of the SMC after receiving training is found
effective for motivating students and guardians, enhancing attendance of students and teachers, fund
raising for the development of the school, proper management of school property, and helping head
teacher in protecting school environment.
18. Enrollment of students increased annually by 4.32% during the project – 4.57% boys and
12.48% girls. Ratio of boys and girls in surveyed schools in 2004 was 55:45 and 56:44 in 2011 with little
change. Average attendance of students increased across all five grades generally by 4-5 percent
indicating a major contribution of the project irrespective of boys and girls. Likewise dropout rate per
school per year has reduced across all grades irrespective of gender during the project.
19. The evaluation study noted that 87.9% teachers received training in subjects they teach and the
remaining 12.1% teachers teach in one subject but received training in a different subject. Evaluation
study noted that work load per teacher per week 21-30 theoretical and 10 practical classes. The load is
on high side and to some teachers it is too high for quality teaching. It is also noted that 87.9% teachers
use lesson plans and two out of every three teachers (68.7%) use lesson plans in 40-80 percent classes.
It is also noted that 94.1% teachers break down lesson time, and 88.6% teachers keep record of student
achievement and progress. It is found that one out of every two teachers give home tasks every day,
10.8% give home task once a week, and 24.5% thrice a week.

Evaluation of the Teaching Quality Improvement in Secondary Education Project
Eusuf and Associates Page vi
20. The project introduced provision of using special methods of teaching techniques for
disadvantaged and ethnic minority students and found that two out of every three teachers use suitable
special techniques as needed and specified during training. It is found that four out of every five
teachers use gender sensitive teaching materials.
21. It is noted that 60.5% teachers who received training under the project consider the training
effective, 23.7% think that it is effective in some cases, 15.0% consider it less effective, and only 0.8%
consider not effective at all. The students benefited from improved classroom performance of the
teachers especially for classroom group working technique and the students noted the benefits as,
participation of students in class increased, turn around to participate in group work, leadership
development through presentation of work, and speak out the ideas openly and confidently.
22. In classroom observation it was noted that most of the teachers (91%) attend classes on time
and teachers obtained home tasks in 62% classes. Most of the teachers except fewer exceptions are well
dressed. Presentation of about one third of the teachers is attractive while half are good, and the rest
are average. Further, 75% teachers highlight the objectives of the session relating to the previous lesson
in each class.
23. In classroom observation it was also noted that most of the teachers use black board, use
teaching materials and use combination of methods (lecture, discussion, individual work, group work,
and demonstration). It is also observed that participation of students in question answer is as high as
76% but participation in group activity is 44% and participation in writing assignment is 36%. The
process of wrapping up class session is 85.3% through oral presentation of summary, 79.4% writing
main sections in board, and 94.1% giving home tasks. In overall, classroom observation noted that class
was interesting, participatory, students understand and become encouraged, students help each other,
work in groups, and the class are productive.
24. The evaluation study noted strengths of the trained teachers in speaking, behavior with students,
skill and proficiency in class management, answering questions smoothly, mode of speaking, writing on
board as much, and keeping students interested in participation. The weaknesses of the teachers include
less use of teaching materials, weak in oral English, hurry in class, lesson plans less emphasized, weak in
time management, some students remain unattended.
25. The evaluation study based on classroom observation assessed teaching quality of teachers in
terms of teaching quality index and compared with the baseline index. The overall teaching index is
assessed as 4.04 for male teachers and 3.56 for female teachers. This favorably compares with the base
line index of 2.36 for male teachers and 1.91 for female teachers indicating significant improvement of
the trained teachers through the project training.
26. The existence 14 TTCs and five HSTTIs provided strong supports to project implementation and
making the training successful. The institutes, its existing infrastructure, and trained teaching and non-
teaching staff contributed towards faster and efficient implementation of the training. Support from the
Institute of Education and Research of the Dhaka University in providing Training of Trainers (TOT) was
an advantage to ensure efficient and effective TOT.
27. The project used as many as 30 international and local consultants that contributed to among
others in designing various implementation schedules, preparing training curriculum and materials,
monitoring tools, etc. The consultant support served project implementation as a driving force and
professional base.

Evaluation of the Teaching Quality Improvement in Secondary Education Project
Eusuf and Associates Page vii
28. The project provided sufficient provisions for fund resources for different trainings that served as
strength for designing and implementing and monitoring of training of 511,000 persons. However, it is
noted that soon after exhaustion of the training funds, the monitoring stopped indicating the importance
of training funds for the type of training projects.
29. Continued Professional Development (CPD) trainings helped project implementation and
supporting professional development of the teachers and achieving good training results. The provision
of cluster training served as a strong strength too for the project. Cluster training served as a tool for low
cost highly effective training technique.
30. Although rousing interest of large number of teachers of about 20,000 private secondary schools
was supportive to implement the project but this was a huge training load as ever before. Nevertheless,
the project has made significant contributions to improving the teaching quality of teaching in secondary
schools by training the large number of teachers. These teachers though form the majority of secondary
school teachers yet some teachers remained untrained. All the teachers need repeated trainings. NTRCA
should continue to locate good candidates aspiring for the position of secondary school teachers as an
effort to contribute towards improvement of secondary education.
31. Existence of coaching business in numerous coaching centers run and taught by untrained non-
professional teachers though help the students in the short tern but work as an impediment to
establishing improved teaching learning in secondary schools. The students, parents, and teachers are
highly reliant and dependent on coaching centers where student are not educated but prepared for
answering questions to secure high grades without gaining knowledge. The trained teachers of the
secondary schools are also involved in coaching who do not follow and use the teaching skills in coaching
centers as the teaching in coaching centers is question answer based.
32. Traditional attitudes of some experienced teachers of private secondary schools serve to some
extent as weakness of the project as they might take time to change. This may deter effectives of the
training in applying to the classroom situation. The younger teachers may however be more effective.
33. Not all but some members of SMC might not co-operate with the project especially in sending
teachers for training. This issue may be linked to the provision of MPO so that SMC send teachers for
training and for upgrading and pursuing degree in education.
34. Lack of sufficient number of effective head teachers is another weakness of the project. In many
schools the head teacher is not effective enough to take lead and make the school as a centre of
excellence. Some head teachers are professionally less competent to form a good team of teachers with
rich teaching learning facility and environment. Government should recruit and administer head teachers.
35. The implementation performance of the project is satisfactory as the physical progress with the
major components such as training is over achieved within the project period. The financial progress of
implementation is also high. The project utilized 92% of the revised budget and 95.5% of the funds
released and became available. The progress of first three years was only 14.86% and that of the last
year (2011-2012) is only 2.72%. The remaining 82.42% was utilized in four years (FY208, 2009, 2010,
and 2011).
36. The success rate (pass rates) of sample surveyed schools and compared to combined results of
all boards between 2004 and 2012 indicated an upward trend of improved student performance in public
examination like SSC. The increased pass rates are primarily due to project interventions that provided
Evaluation of the Teaching Quality Improvement in Secondary Education Project
Eusuf and Associates Page viii
improved teaching quality. Example, pass rate of boys and girls combined in 2005 was only 52.57% that
positively compares with the pass rate of 86.37% in 2012.
37. Relevant agencies (DSHE, NAEM, NTRCA, and BANBESIS) are yet to be institutionally
strengthened enough with specific role and responsibility to play in improving the teaching quality in
secondary schools and quality of secondary education. The follow-up project may emphasize on the
mater beyond training and logistic facilities.
38. Continued Professional Development (CPD) course demand repeated application to cover as
many teachers to sharpen the skills of the teachers with provision for updating and upgrading of the CPD
course per se.
39. Strong follow-up monitoring of performance of trained teachers in classrooms by the trainers of
TTC and HSTTI in association with local education administrators is needed under future similar
programs. Monitoring by the teachers of TTC and HSTTI should not clash with the training classes in the
respective institutes affecting normal training programs. In all TTCs and HSTTIs there should be only
trained teachers having degrees in education for making these institutions more effective centers of
excellence in teaching.
40. Considering needs of the monitoring, government may develop cost effective monitoring through
existing system of monitoring by local education administrators and selected teachers in a team ensuring
the purpose. However, there should be oversight of the effectiveness of the monitoring. There should be
evaluation of each and every monitoring trip to a school by the principal and local education
administrators.
41. Local resource center may be established like the primary education for sustainable and low cost
and highly effective continued professional development of teachers with the help of the skills of highly
proficient local teachers and benefit the new and weak teachers.
42. There is need for either stopping coaching centers or providing registration and accreditation and
control on that with enforcement of teaching by trained teachers having degrees in education. There is a
need for policy decision on the matter as it deters the effective learning. Quality of education may
decline if ineffective teaching-learning continues.
43. Training materials should be updated and upgraded continuously with the pace of time and
curriculum changes. Efforts to making and using local level low cost training materials made little
progress. However, the efforts need be continued.
44. Progress of innovative Development Fund (IDF) is low due to number of reasons – new concept,
initial to budget and conditions, and limited among TTCs. Given increasing interests from teachers and
students and enhanced budget, provision of IDF should continue and be promoted especially for
developing low cost teaching learning materials locally by the teachers and students.
45. The project started training of teachers of madrasha under the project and later discontinued.
The training needs of madrasha teachers demands a critical assessment based on their competencies,
courses, and current improvements of the madrasha education. The teachers of madrasha need
extensive training under a separate major program or project or together with the program for teacher
training. The matter needs a policy decision.

Evaluation of the Teaching Quality Improvement in Secondary Education Project
Eusuf and Associates Page ix
Table of Contents
Abbreviations i
Executive Summary iii - viii Table of Contents ix
Section I Project Background and Design of Evaluation Study 1 - 5
A. The Project 1
B. Design of the Evaluation Study 2
Section II Project Implementation Performance 6 - 12
Section III Creating Enabling Environment for Improved Teacher 13 - 16 Education and Training in Teacher Training Colleges and
Higher Secondary Teacher Training Institutes and Secondary Education Development Centers
Section IV Performance of Teacher Training Colleges and Higher Secondary 17 - 24 Teacher Training Institutes in respect of Training of
Secondary School Teachers under TQI Project
Section V Improvement of Teaching Learning Environment in 25 - 39
Secondary Schools and School Performance
Section VI Performance of Classroom Teachers 40 - 58
Section VII Perceptions of the Students about Improvement of the 59 - 65
Teaching-Learning in School
Section VIII Qualitative Feedback of Operation and Impact of the Project 66 - 72
A. Feedback of Focus Group Discussion 66 B. Feedback of Selected Case Studies 68
C. Feedback of Local Level Stakeholders’ Workshop 69
Section IX Findings and Conclusions and Recommendations 73 - 85
A. Overall Performance of the Project 73 B. Strengths and Weaknesses of the Project 74
C. Findings and Conclusions and Recommendations 76
APPENDIXES
Appendix 1 Project Component Description 78 Appendix 2 Survey and Data Collection Tools – Questionnaire and Checklists and 84
Sample Frame
Appendix 3 125 3.1 Detail of Cost of Civil Works 125
3.2 Detailed List of Learning Materials 129 3.3 Summary Cost of the Items 130
3.4 Details of Oversea Training 131 3.5 Detailed Input of National and International Consultants 132
3.6 Details of Research Activities 133
Appendix 4 Details of Material Dissemination Workshop 134

Evaluation of the Teaching Quality Improvement in Secondary Education Project
Eusuf and Associates Page x
List of Tables
Section I
Table 1.1: Project Cost and Funding Arrangement 1
Table 1.2: Revised Project Cost (Million Taka) 1
Table 1.3: Summary of Sample Frame 5
Section II
Table 2.1: Cost of Civil Works 9
Table 2.2: Procurement of Furniture, Equipment, Vehicles, and Training Materials 10
Table 2.3: Achievement of Local Training by Items (March 2012) 10 Table 2.4: Summary of Overseas Studies and Training and Study Tours 11
Table 2.5: Breakdown of Cost of Training 11
Table 2.6: Summary of Inputs of National and International Consultants 11
Table 2.7: Commencement of Research Studies by Year 12
Table 2.8: Overall Financial Achievement 12
Section III
Table 3.1: Total Teaching Experience of the Principals/Directors as Teacher by Gender 13
Table 3.2: Total Experience as Principal of Present TTC/ Institute 14
Table 3.3: Number and Educational Qualification of Trainers of the Surveyed Institutes 14
Table 3.4: Sanctioned and Vacant Post of Training Staff in TTC/Institute 14
Table 3.5: Courses of TQI Conducted from 2005-2012 15
Table 3.6: Training Institutes having Training Facilities for School Teachers from Tribal/Deprived Area 15
Table 3.7: Infrastructure, Furniture, Equipment, Manpower & Research Supports from TQI Project 16
Section IV
Table 4.1: Age of the Teachers of Teacher’s Training Institutes by Gender 17
Table 4.2: Educational Qualification of Respondents Teachers of Teacher’s Training Institute 17
Table 4.3: Teaching Subjects of the Teachers of Teacher’s Training Institute 18
Table 4.4: Experience of the Teachers of Teacher’s Training Institute as Trainer 18
Table 4.5: Number of Sessions Conducted per Week by the TTC and HSTTI 19
Table 4.6: Opinion of the Teachers about Time Allocations for different Teaching Activities 19
Table 4.7: Opinion of the Teachers of TTC and HSTTI on new B.Ed Curriculum 19 Table 4.8: Use of Computer at the Classroom by the Teacher of TTC/HSTTI 20
Table 4.9: Facilities of the Training Room of Teacher Training Institute 20
Table 4.10: Suggested Size of Participant per Batch by the Teacher of Teacher’s Training Institute 20
Table 4.11: Relevancy of the Contents with Duration at the Time of Receiving and Providing Training 21
Table 4.12: Training Given on the Subjects by the Teachers of Training Institute 22
Table 4.13: Use of Modern Methods at the time of Receiving and Providing Training 22
Table 4.14: Use of Teaching Materials at the time of Receiving and Providing Training 23
Table 4.15: Quality of the Materials Given at the Time of Providing Training 23
Table 4.16: Suggestions of the Teachers of TTC for Improvement of Quality of Training 24
Table 4.17: Opinion of the Teachers of TTC for Intensive Monitoring of Training 24

Evaluation of the Teaching Quality Improvement in Secondary Education Project
Eusuf and Associates Page xi
Section V
Table 5.1: Distribution of Surveyed School by Category 25 Table 5.2: Year of Establishment of the Sample Schools 25
Table 5.3: Age of the Head Teachers on 1 January 2012 by Gender 26
Table 5.4: Experience of the Head Teachers as Head of the Institute by Gender [n-186] 26
Table 5.5: Educational and Professional Qualification of Head Teachers by Gender 27
Table 5.6: Effectiveness of Training in Skill Development of the Head Teacher 27 Table 5.7: Number of Monthly Payment Order (MPO) and Non-MPO Teachers since 2004 28
Table 5.8: Number of Assistant Teachers by Education Qualification and Gender 28
Table 5.9: Strength of Staff other than Teaching of the Schools 29
Table 5.10: Status of Training of Teachers Joining after Launching of the TQI Project 29
Table 5.11: Reasons for Leaving the School by the Teachers 29
Table 5.12: Administrative and Supervisory Activities of the Head Teacher 30
Table 5.14: Effectiveness the Role of SMC in Implementing TQI project 30
Table 5.15: Average Number of Students Enrolled per Class 31
Table 5.16: Success Rate of Students in SSC Examination by Gender and Year 31
Table 5.17: Average of Students Passed in the Annual Examination of School 32
Table 5.18: Percentage of Dropout Students 32 Table 5.19: Reasons for Dropout the Students from the School 32
Table 5.20: Percentage of Student Repeated in the Same Grade 33
Table 5.21: Average of Attendance of the Students 33
Table 5.22: Acceptance of the Different Opinion about TQI Project 33
Table 5.23: Suggestions for Making the TQI Project more effective 34 Table 5.24: Educational Qualification of the Members of the SMC by Gender 35
Table 5.25: Number of Meetings of SMC Hold in last one Year 35
Table 5.26: Role of Head Teachers for Pursuing Participation of Guardian and Community 36
Table 5.27: Opinion of SMC Members about Activities of Head Teachers 36
Table 5.28: Role Played by the Members of SMC 36 Table 5.29: Improvement of the Facilities of the Student due to TQI Project 37
Table 5.30: Reasons for Achieving Fully or Partially the Objectives of the TQI Projects 37
Table 5.31: Reasons for Playing Better Role by the Student in Implementing the TQI Project 38
Table 5.32: Suggestions for Removing Drawback of Activities of Student 38
Table 5.33: Suggestions of the SMC Members for Sustaining Effectiveness of TQI Activities 39
Section VI
Table 6.1: Total Teaching Experience as Teachers of Secondary School 40
Table 6.2: Teaching Experience in the Surveyed School as Teachers 41
Table 6.3: Number of Theoretical and Practical Classes Taken by the School Teachers per Week 42
Table 6.4: Percentage of Classes Use Lesson Plan by the School Teachers 42
Table 6.5: Benefit of Lesson Plan in Presentation in the Class 43
Table 6.6: Ways of Helping the Effective Lesson Due to Broken down of Lesson Time 43
Table 6.7: Use of the Record of Achievements and Progress of the Student 44
Table 6.8: Frequency of Giving Students Home Tasks 44
Table 6.9: Use of the Materials and Equipment in the Class 45
Table 6.10: Benefit of Using the Teaching Materials and Equipment 45
Table 6.11: Contribution of Knowledge Sharing in Professional Development of Colleagues on Teaching 46
Table 6.12: Influence of the Evaluation of the Head Teacher on Teaching Learning 46
Table 6.13: Teaching Subjects before TQI Project and Presently 47
Table 6.14: Training Received by the School Teachers from TQI Project inside the Country 47
Table 6.15: Degree of Effectiveness of the Training Received by the School Teachers 48

Evaluation of the Teaching Quality Improvement in Secondary Education Project
Eusuf and Associates Page xii
Table 6.16: Helping the Lesson Areas of Effective Training 49
Table 6.17: Reasons for ineffectiveness of the Training 49
Table 6.18: Areas of Quality Improved of the Student after Receiving Training by the Teachers 50
Table 6.19: Methods of Assessing the Improvement of the Student by the Teachers 51
Table 6.20: Reasons for Not Using the Skill and Knowledge Received from the Training 21
Table 6.21: Remarkable Changes in the Classroom as the Effect of TQI Project 52
Table 6.22: Learning Process of the Student through Group Work 52
Table 6.23: Recommendations of the Teachers to Improve Teaching Quality of the School 53
Table 6.24: Quality of Using the Black Board in the Classroom 54
Table 6.25: Methods Used by the Teacher for Presenting the Lesson 54
Table 6.26: Type of Participation of the Student in the Lesson 55
Table 6.27: Process of Wrapping up the Session by the Teacher 56
Table 6.28: Process of End the Session by the Teacher 56
Table 6.29: At the End of the Session Remarkable Reaction Observed by the Observer of the Session 57
Table 6.30: Comments of the Observers about Strengths of Teaching of the Teacher 57
Table 6.31: Comments of the Observers about Weakness of Teaching of the Teacher 58
Section VII
Table 7.1: Lesson Techniques Used by the Teachers 59
Table 7.2: Help in Learning Process by the Methods Used in the Classroom 60
Table 7.3: Ranking of Opinion of Student on Attraction in Different Subjects 60
Table 7.4: Areas of Development of Teaching of the Teachers through TQI Training 61
Table 7.5: Steps taken to Increase Attendance in the Class 62
Table 7.6: Use of Different Steps of School Based Assessment 62
Table 7.7: Number of Individual and Group Assignment Undertaken in the Last Year 62
Table 7.8: Steps Taken by the Teachers In Case of Bad Result of Class Test 63
Table 7.9: Teaching Quality at the Classroom 63
Table 7.10: Distribution of Opinion of Student about Participation in Co-Curriculum Activities 64
Table 7.11: Benefits as Identified by the Student in Participating Group Work 65

Evaluation of the Teaching Quality Improvement in Secondary Education Project
Eusuf and Associates SECTION I Page 1
Section I Project Background and Design of Evaluation Study
A. The Project
1. Backgrond
1. The Government of Bangladesh in order to ensure quality secondary education designed and
implemented the Teaching Quality Improvement in Secondary Education Project. The Project was financed
by the Government of Bangladesh, the Asian Development Bank (ADB), and the Canadian International
Development Agency (CIDA). The Project covered entire Bangladesh. The duration of the Project was
originally from Apri1 2005 to September 2011 but the duration was extended by nine months up to June
2012. The cost of the Project was originally estimated at Tk.63,018.74 lakh and finally revised down to
Tk.54,315.06 lakh. Cost of project and funding arrangements are at table 1.1 and table 1.2.
Table 1.1: Project Cost and Funding Arrangement
(Million US$)
Donor(s) Contributions (million $)
Foreign Local Total %
Asian Development Bank (ADB) 15.69 42.01 57.70 61
Canadian International Development Agency (CIDA) 3.27 14.73 18.00 19
Bangladesh Government (GoB) 0 19.10 19.10 20
Total 18.96 75.84 94.80 100
Table 1.2: Revised Project Cost (Million Taka)
(Lakh Taka)
Cost Level(s) GoB (FE) Project Aid Total
Special Account DPA
Original Cost 12,609.78 28,845.14 21,563.82 63,018.74
Cost after 1st Revision 12,991.96 38,589.58 12,888.73 64,470.27
Cost after 2nd Revision 5,562.29 36,853.33 11,899.44 54,315.06
2. Goal and Purpose
2. The goal of the Project is to enhance the quality of secondary education in Bangladesh
secondary schools by improving the quality of teaching. The purpose is to provide quality initial and in-
service teacher training, including continuing professional development, to all eligible teachers of grades
6 - 10 in government and private secondary schools in Bangladesh.
3. Objectives of the Project
3. The main objectives of the Project were to provide quality through initial and in-service teachers’
training including continuing professional development to all eligible teachers of grades 6-10 in government
and private secondary schools in Bangladesh. However, the specific objectives of the project were:
To help the Government to establish a Non-government Teacher Registration and Certification
Authority for the registration, certification and deployment of qualified and competent teachers
in non-government secondary schools and thereby enhance the quality of secondary education;
To help to establish an integrated national secondary teachers' training network and improve the
teachers' training system and thereby contribute to the quality of teaching learning at secondary
level;
Evaluation of the Teaching Quality Improvement in Secondary Education Project
Eusuf and Associates SECTION I Page 2
To provide the scope of quality initial and in-service teachers' training including continuing
professional development for the teachers serving in government and non-government
secondary schools and thereby enhance their professional competency;
To improve the overall standard of management of teacher training centers and increase
significantly training access to under-served and disadvantaged areas and thereby ensure quality
teachers for all;
To help enhancement of professional competence and quality of teacher trainer and concerned
officials;
To build upon an appropriate integrated system for linking the ministry of Education with its
other stakeholder institutes, making the stakeholder institutes aware about their roles and
responsibilities and thereby contribute towards educational quality;
4. The most important premise underlying the Project was that poor teaching quality was
significantly linked to declining student achievement. Pass rates at national examinations declined and
dropout rates were high. It was anticipated that improved teaching quality might enhance both the
internal and external efficiency of the education system, and lead to higher student achievement.
5. The Project was designed to improve teacher training, its planning, management, and quality of
delivery through organizational development, capacity building, and human resources development, and
revitalizing the existing, underutilized network of teacher training colleges and institutions. Primary focus
of the Project was on improving training of teachers for grades 6-10 through a training network
consisting of government TTCs, MTTI, SESDCs and HSTTIs. HSTTIs included in the training network,
since HSTTIs were then much underutilized for their original purpose as training institutions for higher
secondary education, and they have potential physical and human resources which could be utilized also
more broadly in secondary education sector for in-service training of teachers.
4. Components and Outcomes
9. The Project had four components: (i) improving teaching quality through organizational
development and capacity building, (ii) improving teacher training facilities, (iii) strengthening in-service
and pre-service teacher training, and (iv) improving and supporting equitable access for the underserved.
Implementation encompassed development activities at central government level, as well as at teacher
training colleges and institutes, and on pilot basis also at community levels. Detailed of the project
component are at Appendix 1.
B. Design of the Evaluation Study
7. The Implementation Monitoring and Evaluation Division (IMED), Ministry of Planning, selected
the Teaching Quality Improvement (TQI) in Secondary Education Project for evaluation during 2011-
2012. The evaluation study was outsourced to Eusuf and Associates, a local consulting firm.
1. Objectives of the Evaluation Study
8. The main objectives of the evaluation are to: (i) review the performance of project in respect of
quality initial and in-service teachers’ training activities, quality of training module, and capacity
development of training institutes; (ii) assess whether training activities could have contributed any

Evaluation of the Teaching Quality Improvement in Secondary Education Project
Eusuf and Associates SECTION I Page 3
impact on teaching quality of teachers; and (iii) identify the major strengths and weaknesses of project
implementation and suggest appropriate recommendations to overcome those.
2. Methodology and Tools
9. The methodologies for the impact evaluation study included: in-depth review of secondary
documents related to the project design, implementation, and changes overtime. The consultants
reviewed progress of implementation of all activities of the Project in terms of physical and financial
achievements and compared with project targets and milestones. The physical progress included an
account of implementation of construction works and renovation of TTCs, SESDCs, HSTTIs, BMTTI,
NAEM, new teaching resource centers, cluster-based resource centers, procurement of required furniture
for NAEM, PMU, TTCs class rooms, cluster-based resource centers. The project activities included
procurement of various office equipment for NAEM, PMU, TTCs, BMTTI and BANBEIS, accessories and
software for workstations and computer network for these institutions, all kinds of material i.e. texts,
curriculum and supplementary teaching materials.
10. The training activities covered overseas training to teacher trainers, special needs teachers,
M.Ed. fellows, initial and in-service training for all head teachers and government officials, workshops
and research studies for NAEM, NTRCA, DSHE, and BANBEIS, baseline studies. The Project supported
implementation of reforms and innovative schemes for improving quality of teaching, particularly those
initiated at the local level through schools, TTCs, BMTTI, SESDCs, HSTTIs and resource centers,
management system and capacity and quality support system expertise of consultants, Project Director,
Deputy Project Director, PMU officers in charge of training procurement, monitoring and evaluation and
support staff and all the operational activities. The consultants highlighted comparative analysis of all
relevant indicators obtained from the secondary source.
11. The consultants used different approaches and methodologies and tools for collecting data such
as: review of secondary documents, key informant interview, visits to project area by experts and discuss
with stakeholders, survey and data collection from sample schools and related institutions, conducting
classroom observation and case studies, administration of focus group discussion, holding a field level
stakeholder workshop, getting approval of technical committee and steering committee on study design
and study findings, and sharing draft final report in a national workshop. The methodologies and tools
were developed following the objectives of impact evaluation and key output and outcome indicators as
needed.
12. In all, nine sets of data collection instruments were prepared (Appendix 1) for collecting
necessary quantitative and qualitative information. Considering the nature of the components and
activities, the impact evaluation placed higher importance to qualitative information as needed.
Qualitative information was gathered primarily from key informant interviews, classroom observation,
discussions with teachers, and focus group discussion. The questionnaires sets were used to interview
head teachers, subject teachers and interview of SMC members.
Evaluation of the Teaching Quality Improvement in Secondary Education Project
Eusuf and Associates SECTION I Page 4
3. Sampling Techniques
13. The consultants undertook survey of randomly selected training institutes, secondary schools
(government boys’ high school, government girls’ high school, government coeducation high school,
private boys’ high school, private girls’ high school, private coeducation high school). Required numbers
of the training institutes were selected randomly and the same baseline secondary schools were selected
(150) and the additional numbers of schools were selected from Rangpur Division as no school was
selected from Rangpur division at the time of conducting baseline survey. The consultants have covered
all divisions including three remote areas. The consultants have interviewed all the randomly selected
teachers, students and SMC members of the selected schools and principal and teachers of teacher of
sampled training institutions, concern officials of DSHE, NAEM, NTRCA. The total numbers of
respondents for interview was estimated using the statistical method.
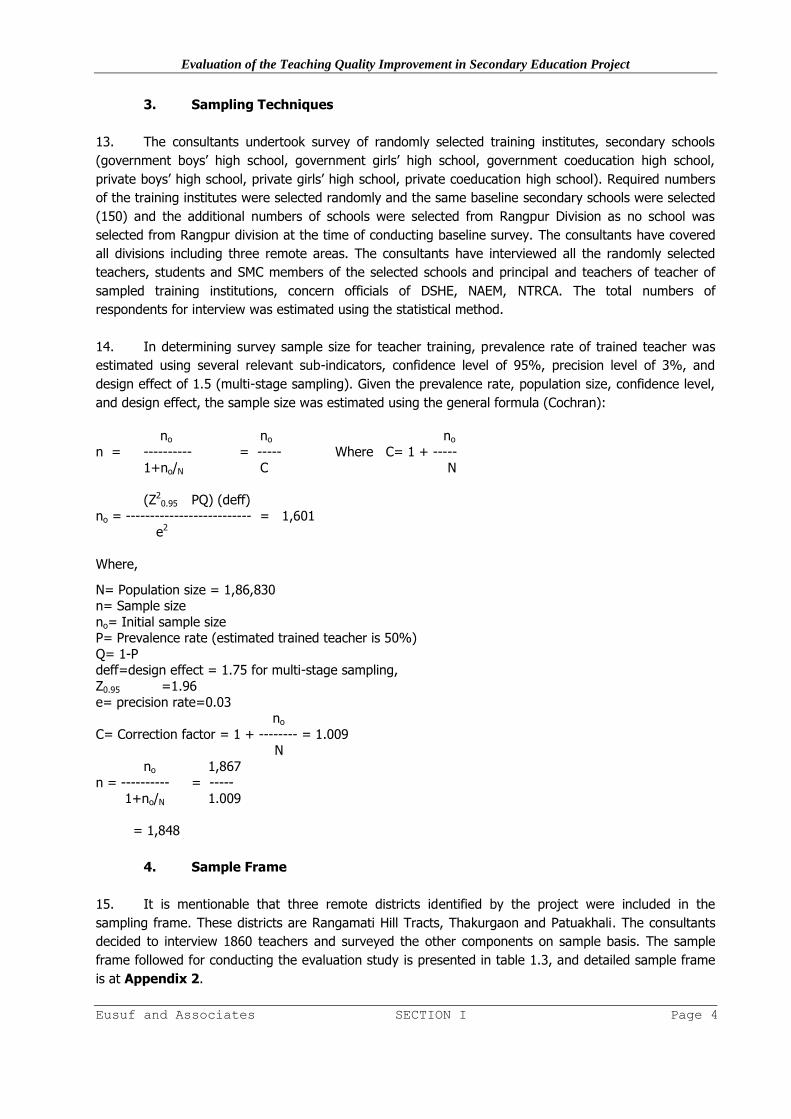
14. In determining survey sample size for teacher training, prevalence rate of trained teacher was
estimated using several relevant sub-indicators, confidence level of 95%, precision level of 3%, and
design effect of 1.5 (multi-stage sampling). Given the prevalence rate, population size, confidence level,
and design effect, the sample size was estimated using the general formula (Cochran):
no no no
n = ---------- = ----- Where C= 1 + ----- 1+no/N C N
(Z2
0.95 PQ) (deff)
no = -------------------------- = 1,601 e2
Where,
N= Population size = 1,86,830 n= Sample size
no= Initial sample size P= Prevalence rate (estimated trained teacher is 50%)
Q= 1-P deff=design effect = 1.75 for multi-stage sampling,
Z0.95 =1.96
e= precision rate=0.03 no
C= Correction factor = 1 + -------- = 1.009 N
no 1,867
n = ---------- = ----- 1+no/N 1.009
= 1,848
4. Sample Frame
15. It is mentionable that three remote districts identified by the project were included in the
sampling frame. These districts are Rangamati Hill Tracts, Thakurgaon and Patuakhali. The consultants
decided to interview 1860 teachers and surveyed the other components on sample basis. The sample
frame followed for conducting the evaluation study is presented in table 1.3, and detailed sample frame
is at Appendix 2.

Evaluation of the Teaching Quality Improvement in Secondary Education Project
Eusuf and Associates SECTION I Page 5
Table 1.3: Summary of Sample Frame
Project components Sample Units Number of
Respondents
1 Secondary schools/teachers 186 1,860
2 Government Teacher Training College -private TTC are not
included in TQI (SEP)
14 140
3 MTTI 1 10
4 HSTTI 5 50
5 NAEM 1 10
6 BANBEIS 1 1
7 BOU 1 1
8 DSHE 1 1
9 SMC Members of private high schools (assuming 30 Govt.
schools – two schools in each selected district)
312
10 Students (10 students from a class of each sample school) 1,860
Total Respondents 4,245
5. Interview of Respondents
16. The impact evaluation team carried out interviews of principals/teachers of training institutes,
head teachers/teachers of secondary schools, SMC members and students. The field investigators
conducted interviews using survey instruments as at Appendix 1. The trained field investigators
conducted interviews and collected information of quality of teaching, training methods and materials,
goals and objectives of project, role played by TTCs, HSTTIs, MTTI, NAEM, NTRC, schools and
community for quality improvement, supports from project, strengths and weaknesses of project,
suggestions for improvement of the implementation and sustainability, etc.
6. Focus Group Discussion (FGD)
17. Further, the impact evaluation team carried out 21 focus group discussions (FGD) sessions. Each
FGD session was conducted with homogenous groups of participants consisting of 10-15. Three
categories of FGDs were conducted. These groups were teachers, guardians, SMC member and local
elite one each from every division. The experts, supervisors and field investigators conducted the focus
group discussions using a checklist as at Appendix 1 and captured useful qualitative informants and
feedback of participants on school level planning, quality of training, school management, teaching
process, participation of community, participation of parents/guardians, strengths and weaknesses of
project, suggestions for improvement of implementation of similar projects in future and participation of
communities, etc. Details of the feedback of focus group discussion are at feedback of focus group
discussion.
7. Case Study
18. In addition to above, the consultants undertook 14 selected case studies of better performing
secondary school and less performing secondary schools. Case studies highlighted the benefits of the
TQI Project intervention, how, to what extent and in what aspects the schools have benefited. Details of
the case studies are at feedback of case studies. In addition, 34 classroom observation were taken in the
sample secondary schools.

Evaluation of the Teaching Quality Improvement in Secondary Education Project
Eusuf and Associates SECTION II Page 6
Section II Project Implementation Performance
19. The Project was planned to implement from April 2005 to September 2011 but time of
implemention was revised twice - from October 2011 to May 2012 and again up to June 2012. The
components of the Project were a combination of hardware and software. The consultants analyzed the
Project implementation by components in the following paragraphs.
Component 1: Organizational Development and Capacity Building
20. Establish an Integrated Secondary Teachers’ Training System: An Integrated Secondary
Teachers’ Training System has been established and systems of coordination and collaboration with
related organizations have been developed. The related stakeholders were TQI, NU, BOU and SESDP.
Major activities were development of digital content as well as training of trainers and teachers; English
in Action on materials and trainers; SEQAEP on training materials and approaches and the British Council
supported “Connecting Classrooms” program. Various stakeholder meetings and workshops were
arranged related to capacity building of DSHE. Visits were made to TICs, HSTTIs, ORC5 and different
Cluster Centre Schools.
21. Establish an Apex Body for Secondary teacher Education: A National Teacher Education
Council (NTEC) is set up under the chairmanship of the honorable Minister of Education.
22. Support NTRCA: NTRCA is established and become operational. The role of NTRCA is selecting
teachers for ensuring quality teaching in Secondary Schools. NTRCA has been conducting regular
examination to ensure quality of teachers to be recruited by the secondary schools. It is reported that
the examinations conducted by NTRCA have been playing an effective role in selection of quality
teachers by non-government secondary schools.
23. Strengthening Monitoring and Evaluation capacity of DSHE: The capacity building of
DSHE has taken place through training of relevant staff in various fields. A self assessment based
Monitoring and Evaluation System developed under the Project is currently operational for continuous
improvement of school performance. The Initial Impact Assessment was completed in early 2011. It
sought responses about project impact from respondents including students, teachers, head teachers
and SMC members who have been targeted in CPD, HT and TE training.
24. Strengthening the capacity of BANBEIS: Hardware support was provided to BANBEIS to set
up Secondary Teacher Information System (STIS). Over 2010/2011 STIS database administrators have
been working with representatives of DSHE EMIS section and the Director, Training in DSHE to support
an SESDP initiative that will reinvent the decentralized STIS as an online data entry program based on
Oracle. Software development is complete and beta testing has commenced. TQI is taking responsibility
for the production of the operating manual. TQI will also fund a pilot training program. Further support
will need to come from future projects. Post project sustainability of the STIS is a major issue.
25. BANBEIS completed collection of GPS data by late 2010. They prepared a list of thematic maps
of use to DSHE management with help of TA team in early 2011 and a contract for development of the
GIS interface was let in early 2011. BANBEIS now reports that the software has been developed and the
system is in a testing phase. In 2011, BANBEIS commenced a program to conduct office productivity
training for El and ARO from all 64 districts.
Evaluation of the Teaching Quality Improvement in Secondary Education Project
Eusuf and Associates SECTION II Page 7
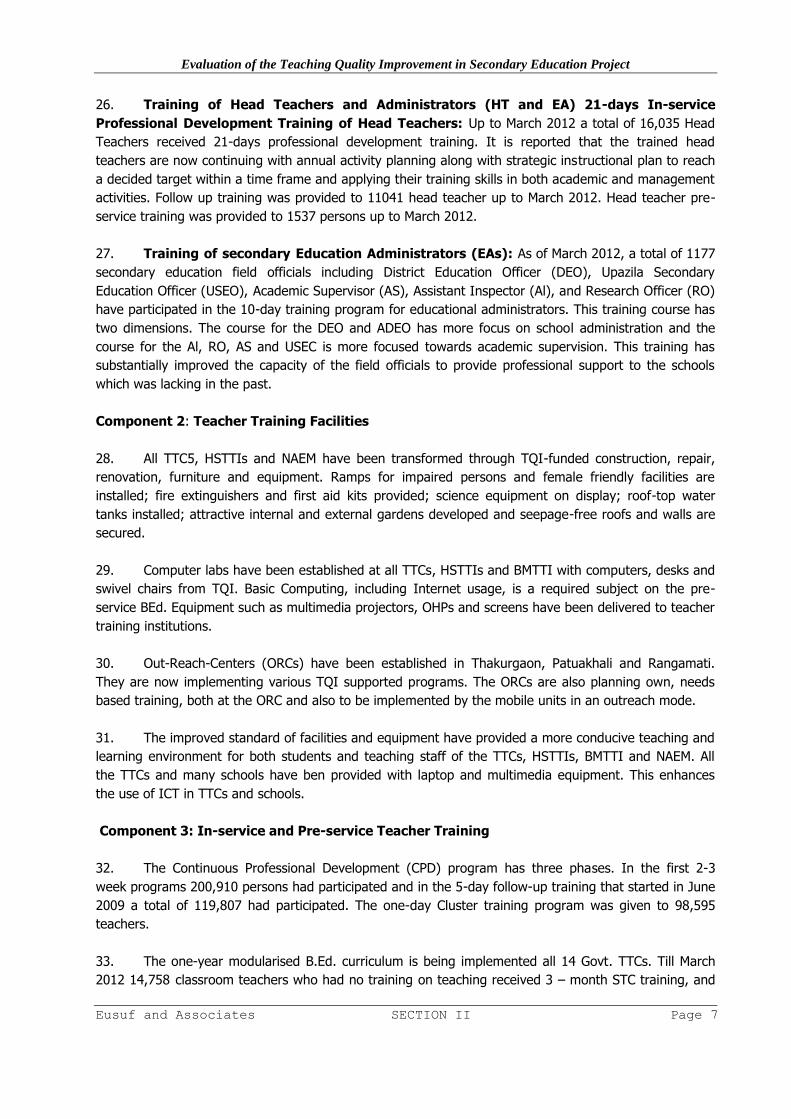
26. Training of Head Teachers and Administrators (HT and EA) 21-days In-service
Professional Development Training of Head Teachers: Up to March 2012 a total of 16,035 Head
Teachers received 21-days professional development training. It is reported that the trained head
teachers are now continuing with annual activity planning along with strategic instructional plan to reach
a decided target within a time frame and applying their training skills in both academic and management
activities. Follow up training was provided to 11041 head teacher up to March 2012. Head teacher pre-
service training was provided to 1537 persons up to March 2012.
27. Training of secondary Education Administrators (EAs): As of March 2012, a total of 1177
secondary education field officials including District Education Officer (DEO), Upazila Secondary
Education Officer (USEO), Academic Supervisor (AS), Assistant Inspector (Al), and Research Officer (RO)
have participated in the 10-day training program for educational administrators. This training course has
two dimensions. The course for the DEO and ADEO has more focus on school administration and the
course for the Al, RO, AS and USEC is more focused towards academic supervision. This training has
substantially improved the capacity of the field officials to provide professional support to the schools
which was lacking in the past.
Component 2: Teacher Training Facilities
28. All TTC5, HSTTIs and NAEM have been transformed through TQI-funded construction, repair,
renovation, furniture and equipment. Ramps for impaired persons and female friendly facilities are
installed; fire extinguishers and first aid kits provided; science equipment on display; roof-top water
tanks installed; attractive internal and external gardens developed and seepage-free roofs and walls are
secured.
29. Computer labs have been established at all TTCs, HSTTIs and BMTTI with computers, desks and
swivel chairs from TQI. Basic Computing, including Internet usage, is a required subject on the pre-
service BEd. Equipment such as multimedia projectors, OHPs and screens have been delivered to teacher
training institutions.
30. Out-Reach-Centers (ORCs) have been established in Thakurgaon, Patuakhali and Rangamati.
They are now implementing various TQI supported programs. The ORCs are also planning own, needs
based training, both at the ORC and also to be implemented by the mobile units in an outreach mode.
31. The improved standard of facilities and equipment have provided a more conducive teaching and
learning environment for both students and teaching staff of the TTCs, HSTTIs, BMTTI and NAEM. All
the TTCs and many schools have ben provided with laptop and multimedia equipment. This enhances
the use of ICT in TTCs and schools.
Component 3: In-service and Pre-service Teacher Training
32. The Continuous Professional Development (CPD) program has three phases. In the first 2-3
week programs 200,910 persons had participated and in the 5-day follow-up training that started in June
2009 a total of 119,807 had participated. The one-day Cluster training program was given to 98,595
teachers.
33. The one-year modularised B.Ed. curriculum is being implemented all 14 Govt. TTCs. Till March
2012 14,758 classroom teachers who had no training on teaching received 3 – month STC training, and

Evaluation of the Teaching Quality Improvement in Secondary Education Project
Eusuf and Associates SECTION II Page 8
out of them 1,228 teachers completed 9 – month B.Ed. course from different public TTCs. TQI
continued to provide a 3-month Secondary Teaching Certificate (STC) course for in-service, untrained
teachers with an optional 9-month follow-up BEd. conversion course. The courses are conducted by TTCs
under the auspices of the National University (NU). Completion rates up to June 2011 are as follows: (a)
14,700 participants completed the STC 3-month and (b) 1,228 participants completed the STC 9-month
program leading to award of a B.Ed qualification.
34. B.Ed. Distance Education: B.Ed. Distance Education course, which is being conducted under the
auspices of the Bangladesh Open University (BOU). This initiative has involved: (a) building distance
education capacity in the TTCs, and (b) supporting BOU to monitor program. Currently, large numbers of
registered students are attending tutorials in 17 tutorial centres around the country.
35. Innovation and Development Fund (IDF): Up to June 2011, 138 IDE applications have been
received and 129 were approved for support. Out of these, 118 projects are already completed.
Approximately 20% of approved IDF proposals focused on school monitoring and mentoring. Teacher
Educators from TTCs monitored about 200 schools. Initial assessment of these projects found that IDF
interventions have improved TTC capacity to support outreach activities including school level monitoring
and mentoring of teachers. Several IDF projects focused on use of Internet for teaching-learning
processes which helped the teachers and students to become more computer literate.
Component 4: Equitable Access and Community Involvement
36. The target for recruitment of 30% female teacher was revised by the government to 40% for
urban areas and 20% for rural areas. According to BANBEIS report 2009, female teachers in rural
schools account for 19.36% and in urban schools account for 40.14%. Overall, the national level target
of 40% female teachers in urban schools and 20% female teachers in rural schools has been achieved
Project Management
37. Directorate of Secondary and Higher Education (DSHE) was the executing agency. Ministry of
Education (MOE) established a project steering committee (PSC) to oversee the work of DSHE and
Project Management Unit (PMU). The PMU was in place and fully operational within two months of loan
effectiveness. The PMU is headed by a Project Director supported by a Deputy Project Director and
support officers and staffs. At the time of full swing operation of the project total staff strengths were 55
persons including 34 drivers. The PMU is responsible for the day-to-day operational management of the
project implementation, monitoring and evaluation of progress. The PMU is also supported by
international and local consultants.
1. Civil Works
38. The Project undertook various types of civil works. The major types of civil works accomplished
under the project are vertical and/or horizontal extensions, repairs and renovations at 11 Government
TTCs (Dhaka, Mymensigh (Male), Mymensingh (Female), Comilla, Feni, Chittagong, Jessore, Rangpur,
Rajshahi, Khulna and Barisal. Repair, renovation and/or construction at nine SESDCs (Chittagong, Feni,
Comilla, Dhaka, Jessore, Khulna, Memensingh, Rajshahi and Rangpur). Repair, renovation and/ or
construction of five HSTTIs (Barisal, Khulna, Mymensingh, Rajshahi and Comilla). Repair, renovation
and/or construction at NAEM. Repair, renovation and/ or construction at BMTTI, Gazipur. Establish
teaching resource centres at the three new TTCs (Faridpur, Pabna and Sylhet) and three Outreach

Evaluation of the Teaching Quality Improvement in Secondary Education Project
Eusuf and Associates SECTION II Page 9
Resource Centres (Patuakhali, Rangamati and Thakurgaon). An amount of Tk.4095.48 lakh was allocated
for civil works and amount of Tk.4021.13 lakh is spent. Achievement against allocation is 98%. Summary
of estimated cost of civil works is at table 2.1 and the detail of cost of civil works is at Appendix 3.1.
Table 2.1: Cost of Civil Works
(Lakh Taka)
Civil Work(s) Revised
Budget Actual
1 Vertical and/or horizontal extensions repairs and renovations of 11 TTCs 1,413.97 1,413.97
2 Repair, renovation and/or construction at nine SESDCs 485.81 485.81
3 Repair, renovation and/ or construction at five HSTTIs 209.06 209.06
4 Repair, renovation and/or construction at NAEM 1,337.28 1,337.28
5 Repair, renovation and/ or construction at BMTTI, Gazipur 186.98 186.98
6 Establishing teaching resource center in 3 new TTCs & 3 Outreach
Resource Centers
462.38 462.38
Total 4,095.48 4,095.48
2. Procurement of Goods
39. The Project procured many goods including vehicles and equipments and training materails. The
major items included furniture, office equipment, vehicles, computers and peripherals, and learning
materials and resources. Procurement of furniture for office of PMU and DSHE; office, hostel, classroom
of 14 TTCs; office, hostel, classroom of five HSTTIs; office, classroom of BMTTI; office, classroom, hostel
of NAEM; office and classroom of cluster based resource centers in 3 new TTCs; and office,
hostel/dormitory of three out reach resource centers.
40. Office equipment was procured for PMU, DSHE, DEOs, Regional DDs, HSTTIs, TTCs and BMTTI,
ORCs, RCs, NAEM, BOU and Other stakeholders and major items were included photocopier, OHP,
multimedia projector, fax machine, scanner, intercom system, air Cooler, TV, video camera, digital
camera, pen drive, CD, memory stick, calculator, cupboards (large, metal and lockable), electrical back-
up system (IPS), spiral binder, generator, etc.
41. Computer peripherals were procured for MOE, DSHE, PMU, BANBEIS, NTRCA, Regional DDS,
HSTTIs, TTCs and BMTTI, ORCs, RCs, NAEM, BOU and other stakeholders. The major items were
desktop computer and accessories, laptop, printer, UPS, LAN and accessories, anti virus, WAN setup
between MOE-BANBEIS, and DSHE, website development, scanner, computer software (general and
subject based), multimedia projector, hardware (OMR scanner, server, PC etc), internet, software
development, licenses, etc.
42. Learning materials of several types were procured by the Project. The items were procured for
training institutes, training centers and Bangladesh Open University. The major items were learning
materials, BOU training and learning materials and digital learning materials for training institutes.
Detailed list of learning materials is at Appendix 3.2.
43. There was a provision of procuring 34 vehicles for facilitating project activities. Out of these 17
vehicles were allocated to PMU, NAEM, NTRCA for conducting pre-service training and in-service training
and rest 17 vehicles were allocated to Mobile Education Resource Units for mentoring. Summary cost of
the items is at table 2.2 and the details are at Appendix 3.3.
Evaluation of the Teaching Quality Improvement in Secondary Education Project
Eusuf and Associates SECTION II Page 10
Table 2.2: Procurement of Furniture, Equipment, Vehicles, and Training Materials
Items procured Budget Actual Expenditure % Achievement
1 Furniture 400.00 394.98 98.75
2 Equipment 285.00 283.23 99.38
3 Computer and peripherals 470.00 467.43 99.45
4 Leaning materials 956.34 926.34 96.86
5 Vehicles 565.37 565.37 100.00
Total 2676.71 2637.35 98.53
3. Human Resources Development
44. Human resource development component includes professional development of teachers,
teacher educators, stakeholder staff (including National University, School of Education of Bangladesh
Open University, NAEM, IER, BANBEIS, etc.), educational administrators and community monitors. Both
local training and overseas training were under this component. There were seven different types of local
training. These were Training of Trainers (TOT), Training of Head Teacher and Teachers acting as Head
Teachers (HTT – 21 days in-service training, HTT – 6 days follow up training, and HH – 35 days pre-
service training), Continuous Professional Development (CPD) of serving teachers (CPD-1:14 days and 24
days for English, CPD-2: 5 days including English, and CPD-3: one day), Training on Inclusive Education
(awareness creation training for SMCs – three days, training for class teachers 4+4 days), Secondary
Teaching Certificate (STC)/B.Ed. (three month STC, nine month STC upgrading to B.Ed. and twelve
month B.Ed.), Training of Educational Administrators (DEO, ADEOs, USEOs, AUSEOs, UASs, ALs, ROs,
etc.), Training of other teacher trainers and tutors (B.Ed. implementation face to face and distance
mode). Local training courses were conducted in TTC, HTTIs, NAEM, IER of Dhaka University and district
level venues under the guidance and supervision of trained trainers.
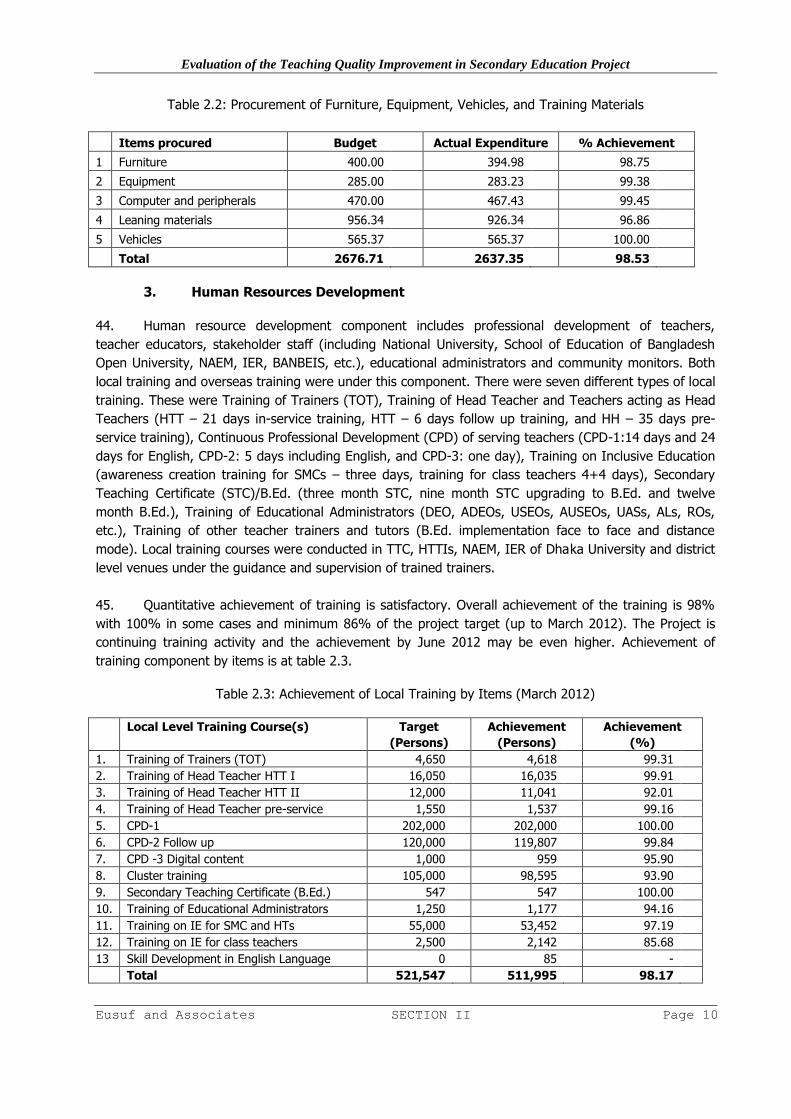
45. Quantitative achievement of training is satisfactory. Overall achievement of the training is 98%
with 100% in some cases and minimum 86% of the project target (up to March 2012). The Project is
continuing training activity and the achievement by June 2012 may be even higher. Achievement of
training component by items is at table 2.3.
Table 2.3: Achievement of Local Training by Items (March 2012)
Local Level Training Course(s) Target
(Persons)
Achievement
(Persons)
Achievement
(%)
1. Training of Trainers (TOT) 4,650 4,618 99.31
2. Training of Head Teacher HTT I 16,050 16,035 99.91
3. Training of Head Teacher HTT II 12,000 11,041 92.01
4. Training of Head Teacher pre-service 1,550 1,537 99.16
5. CPD-1 202,000 202,000 100.00
6. CPD-2 Follow up 120,000 119,807 99.84
7. CPD -3 Digital content 1,000 959 95.90
8. Cluster training 105,000 98,595 93.90
9. Secondary Teaching Certificate (B.Ed.) 547 547 100.00
10. Training of Educational Administrators 1,250 1,177 94.16
11. Training on IE for SMC and HTs 55,000 53,452 97.19
12. Training on IE for class teachers 2,500 2,142 85.68
13 Skill Development in English Language 0 85 -
Total 521,547 511,995 98.17
Evaluation of the Teaching Quality Improvement in Secondary Education Project
Eusuf and Associates SECTION II Page 11
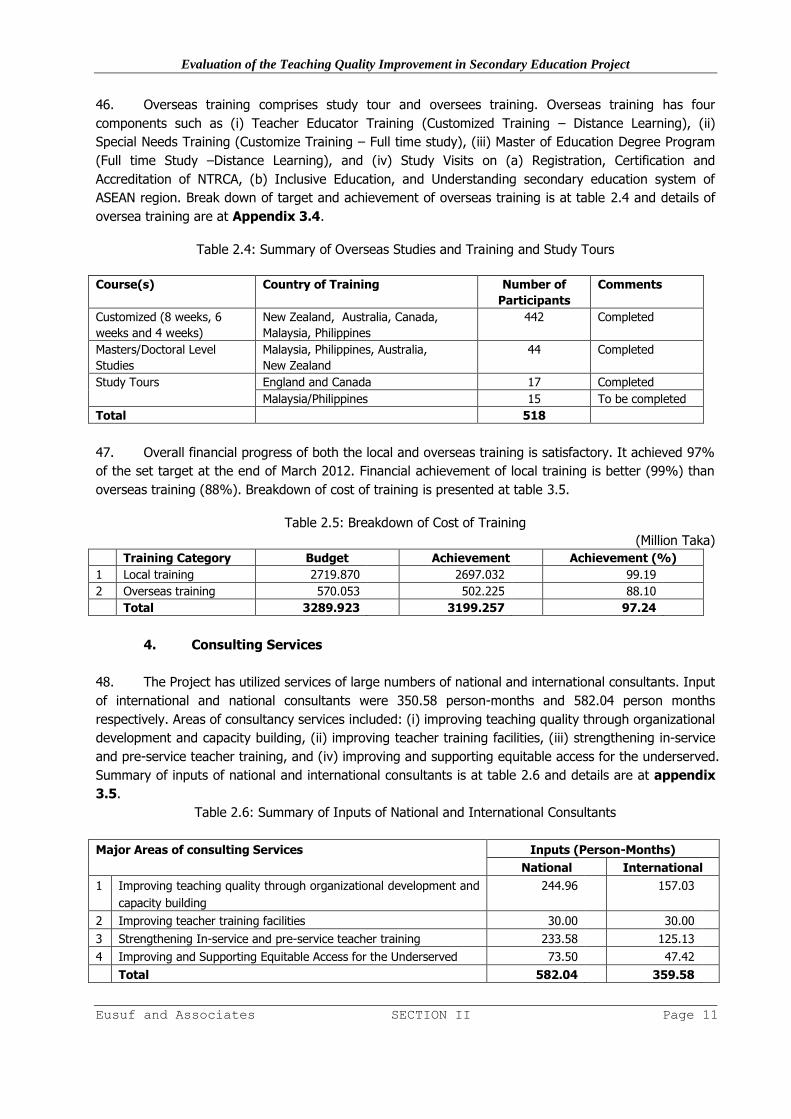
46. Overseas training comprises study tour and oversees training. Overseas training has four
components such as (i) Teacher Educator Training (Customized Training – Distance Learning), (ii)
Special Needs Training (Customize Training – Full time study), (iii) Master of Education Degree Program
(Full time Study –Distance Learning), and (iv) Study Visits on (a) Registration, Certification and
Accreditation of NTRCA, (b) Inclusive Education, and Understanding secondary education system of
ASEAN region. Break down of target and achievement of overseas training is at table 2.4 and details of
oversea training are at Appendix 3.4.
Table 2.4: Summary of Overseas Studies and Training and Study Tours
Course(s) Country of Training Number of
Participants
Comments
Customized (8 weeks, 6
weeks and 4 weeks)
New Zealand, Australia, Canada,
Malaysia, Philippines
442 Completed
Masters/Doctoral Level
Studies
Malaysia, Philippines, Australia,
New Zealand
44 Completed
Study Tours England and Canada 17 Completed
Malaysia/Philippines 15 To be completed
Total 518
47. Overall financial progress of both the local and overseas training is satisfactory. It achieved 97%
of the set target at the end of March 2012. Financial achievement of local training is better (99%) than
overseas training (88%). Breakdown of cost of training is presented at table 3.5.
Table 2.5: Breakdown of Cost of Training
(Million Taka)
Training Category Budget Achievement Achievement (%)
1 Local training 2719.870 2697.032 99.19
2 Overseas training 570.053 502.225 88.10
Total 3289.923 3199.257 97.24
4. Consulting Services
48. The Project has utilized services of large numbers of national and international consultants. Input
of international and national consultants were 350.58 person-months and 582.04 person months
respectively. Areas of consultancy services included: (i) improving teaching quality through organizational
development and capacity building, (ii) improving teacher training facilities, (iii) strengthening in-service
and pre-service teacher training, and (iv) improving and supporting equitable access for the underserved.
Summary of inputs of national and international consultants is at table 2.6 and details are at appendix
3.5.
Table 2.6: Summary of Inputs of National and International Consultants
Major Areas of consulting Services Inputs (Person-Months)
National International
1 Improving teaching quality through organizational development and
capacity building
244.96 157.03
2 Improving teacher training facilities 30.00 30.00
3 Strengthening In-service and pre-service teacher training 233.58 125.13
4 Improving and Supporting Equitable Access for the Underserved 73.50 47.42
Total 582.04 359.58
Evaluation of the Teaching Quality Improvement in Secondary Education Project
Eusuf and Associates SECTION II Page 12
5. Training Grants, Innovation and Development Fund
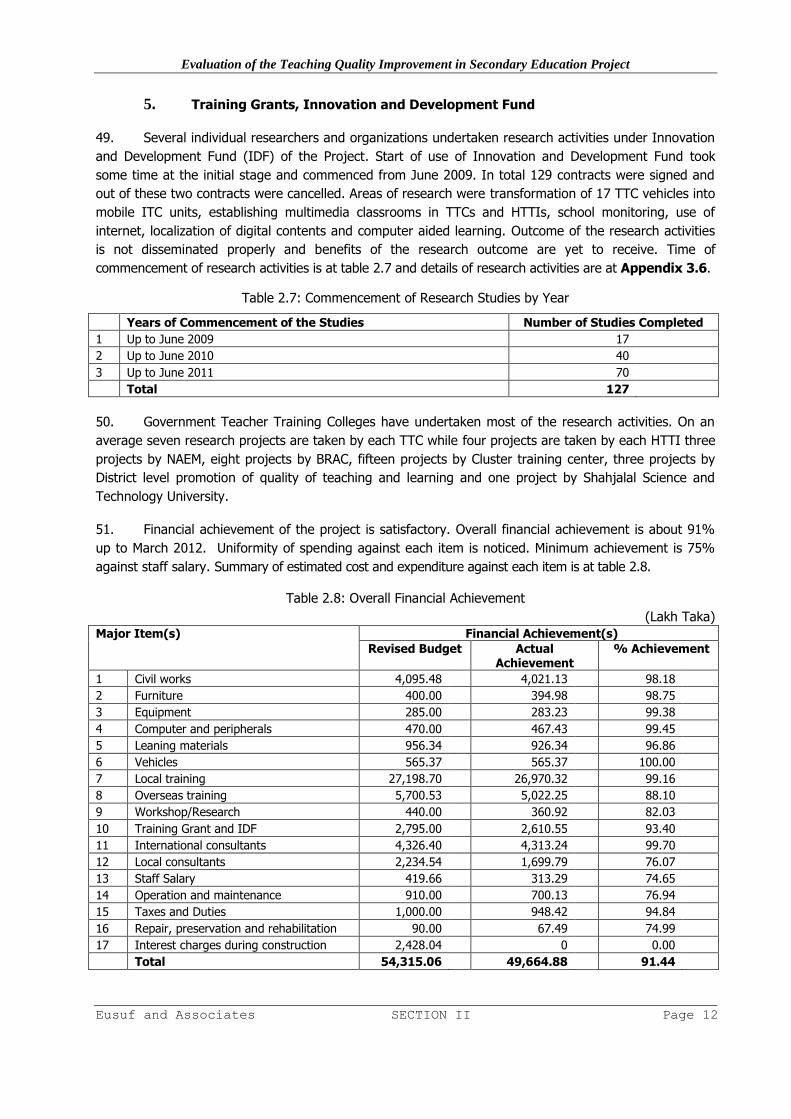
49. Several individual researchers and organizations undertaken research activities under Innovation
and Development Fund (IDF) of the Project. Start of use of Innovation and Development Fund took
some time at the initial stage and commenced from June 2009. In total 129 contracts were signed and
out of these two contracts were cancelled. Areas of research were transformation of 17 TTC vehicles into
mobile ITC units, establishing multimedia classrooms in TTCs and HTTIs, school monitoring, use of
internet, localization of digital contents and computer aided learning. Outcome of the research activities
is not disseminated properly and benefits of the research outcome are yet to receive. Time of
commencement of research activities is at table 2.7 and details of research activities are at Appendix 3.6.
Table 2.7: Commencement of Research Studies by Year
Years of Commencement of the Studies Number of Studies Completed
1 Up to June 2009 17
2 Up to June 2010 40
3 Up to June 2011 70
Total 127
50. Government Teacher Training Colleges have undertaken most of the research activities. On an
average seven research projects are taken by each TTC while four projects are taken by each HTTI three
projects by NAEM, eight projects by BRAC, fifteen projects by Cluster training center, three projects by
District level promotion of quality of teaching and learning and one project by Shahjalal Science and
Technology University.
51. Financial achievement of the project is satisfactory. Overall financial achievement is about 91%
up to March 2012. Uniformity of spending against each item is noticed. Minimum achievement is 75%
against staff salary. Summary of estimated cost and expenditure against each item is at table 2.8.
Table 2.8: Overall Financial Achievement
(Lakh Taka)
Major Item(s) Financial Achievement(s)
Revised Budget Actual Achievement
% Achievement
1 Civil works 4,095.48 4,021.13 98.18
2 Furniture 400.00 394.98 98.75
3 Equipment 285.00 283.23 99.38
4 Computer and peripherals 470.00 467.43 99.45
5 Leaning materials 956.34 926.34 96.86
6 Vehicles 565.37 565.37 100.00
7 Local training 27,198.70 26,970.32 99.16
8 Overseas training 5,700.53 5,022.25 88.10
9 Workshop/Research 440.00 360.92 82.03
10 Training Grant and IDF 2,795.00 2,610.55 93.40
11 International consultants 4,326.40 4,313.24 99.70
12 Local consultants 2,234.54 1,699.79 76.07
13 Staff Salary 419.66 313.29 74.65
14 Operation and maintenance 910.00 700.13 76.94
15 Taxes and Duties 1,000.00 948.42 94.84
16 Repair, preservation and rehabilitation 90.00 67.49 74.99
17 Interest charges during construction 2,428.04 0 0.00
Total 54,315.06 49,664.88 91.44
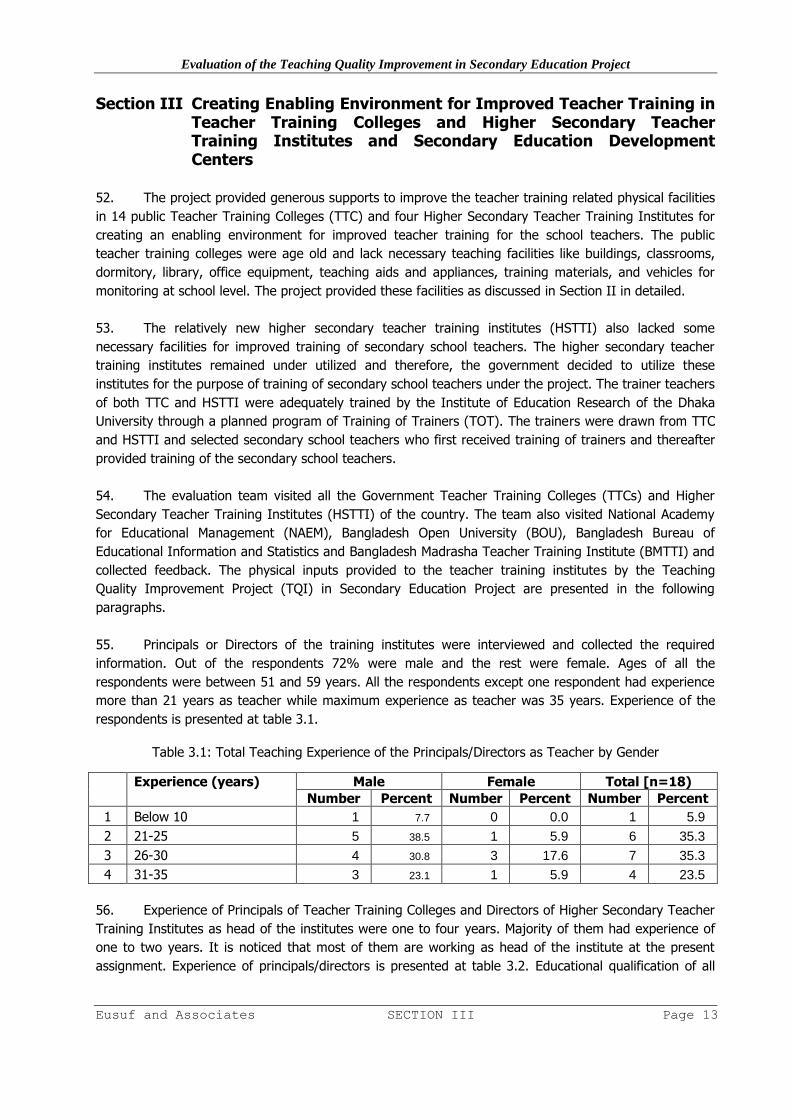
Evaluation of the Teaching Quality Improvement in Secondary Education Project
Eusuf and Associates SECTION III Page 13
Section III Creating Enabling Environment for Improved Teacher Training in Teacher Training Colleges and Higher Secondary Teacher Training Institutes and Secondary Education Development Centers
52. The project provided generous supports to improve the teacher training related physical facilities
in 14 public Teacher Training Colleges (TTC) and four Higher Secondary Teacher Training Institutes for
creating an enabling environment for improved teacher training for the school teachers. The public
teacher training colleges were age old and lack necessary teaching facilities like buildings, classrooms,
dormitory, library, office equipment, teaching aids and appliances, training materials, and vehicles for
monitoring at school level. The project provided these facilities as discussed in Section II in detailed.
53. The relatively new higher secondary teacher training institutes (HSTTI) also lacked some
necessary facilities for improved training of secondary school teachers. The higher secondary teacher
training institutes remained under utilized and therefore, the government decided to utilize these
institutes for the purpose of training of secondary school teachers under the project. The trainer teachers
of both TTC and HSTTI were adequately trained by the Institute of Education Research of the Dhaka
University through a planned program of Training of Trainers (TOT). The trainers were drawn from TTC
and HSTTI and selected secondary school teachers who first received training of trainers and thereafter
provided training of the secondary school teachers.
54. The evaluation team visited all the Government Teacher Training Colleges (TTCs) and Higher
Secondary Teacher Training Institutes (HSTTI) of the country. The team also visited National Academy
for Educational Management (NAEM), Bangladesh Open University (BOU), Bangladesh Bureau of
Educational Information and Statistics and Bangladesh Madrasha Teacher Training Institute (BMTTI) and
collected feedback. The physical inputs provided to the teacher training institutes by the Teaching
Quality Improvement Project (TQI) in Secondary Education Project are presented in the following
paragraphs.
55. Principals or Directors of the training institutes were interviewed and collected the required
information. Out of the respondents 72% were male and the rest were female. Ages of all the
respondents were between 51 and 59 years. All the respondents except one respondent had experience
more than 21 years as teacher while maximum experience as teacher was 35 years. Experience of the
respondents is presented at table 3.1.
Table 3.1: Total Teaching Experience of the Principals/Directors as Teacher by Gender
Experience (years) Male Female Total [n=18)
Number Percent Number Percent Number Percent
1 Below 10 1 7.7 0 0.0 1 5.9
2 21-25 5 38.5 1 5.9 6 35.3
3 26-30 4 30.8 3 17.6 7 35.3
4 31-35 3 23.1 1 5.9 4 23.5
56. Experience of Principals of Teacher Training Colleges and Directors of Higher Secondary Teacher
Training Institutes as head of the institutes were one to four years. Majority of them had experience of
one to two years. It is noticed that most of them are working as head of the institute at the present
assignment. Experience of principals/directors is presented at table 3.2. Educational qualification of all

Evaluation of the Teaching Quality Improvement in Secondary Education Project
Eusuf and Associates SECTION III Page 14
the head of the institutions was master degree and some of them had M.Ed. and B.Ed. professional
qualification.
Table 3.2: Total Experience as Principal of Present TTC/ Institute
Experience as head teacher (months)
Male Female Total [n=18)
Number Percent Number Percent Number Percent
1 5 or below 3 23.1 2 40.0 5 27.8
2 6-10 5 38.4 0 0.0 5 27.8
3 11-15 1 7.7 1 20.0 2 11.1
4 16-20 1 7.7 0 0.0 1 5.6
5 21-25 1 7.7 1 20.0 2 11.1
6 25 + 2 15.4 1 20.0 3 16.7
Total 13 100 5 100 18 100.0
57. Average number of teachers in the surveyed institutions was 24.4 persons while average number
of teacher was 27.1 persons during baseline survey time (page 26 of Baseline Report). Number of
available teachers per institute is reduced. Among the teachers all of them have master’s degree and
some of them have other professional education like Ph.D., M.Phil, M.Ed., and B.Ed. Majority of them
received training at both home and abroad. Number and educational qualification of trainers of the
surveyed institutes is presented at table 3.3.
Table 3.3: Number and Educational Qualification of Trainers of the Surveyed Institutes
Particulars of teachers of training institutes Number [n=18) Average/Institute
1 Total number of teachers 440 24.4
2 Number of teachers having Masters degree 427 23.7
3 Number of teachers having B.Ed. 292 16.2
4 Number of teachers having M.Ed. 147 8.2
5 Number of teachers having Ph.D./M.Phil 27 1.5
6 Number of teachers having training abroad 291 16.2
7 Number of teachers having training in the country 416 23.1
58. It is found that about 27.0% posts were vacant during the survey period but during baseline
survey time vacant position was 18.4% (page 26 of Baseline Report). Vacant position of teacher training
institutes is increased during the project implementation period. In all the levels right from professor to
lecturer positions were vacant. Vacant post of professor was the highest (35%) followed by lecturer
(34%). Sanction and vacant position of teacher training institutes is at table 3.4.
Table 3.4: Sanctioned and Vacant Post of Training Staff in TTC/Institute
Name of the post Number
sanctioned post
Vacant post
Number Percent
1 Professor including Principal 20 7 35.0
2 Associate Professor 31 1 3.2
3 Assistant Professor 174 37 21.3
4 Lecturer 213 72 33.8
5 Other 102 29 28.4
Total 540 146 27.0

Evaluation of the Teaching Quality Improvement in Secondary Education Project
Eusuf and Associates SECTION III Page 15
59. The training institutes conducted various types of training courses during last two years and the
major courses were B. Ed., B. Ed (Hons), M. Ed. CPD-1, CPD-2 and Cluster. They conducted both the
pre-service and in-service training. The training institutes conducted more than ten courses of Teaching
Quality Improvement Project. The courses were training of trainers (TOT), training of head teachers
(HTT-1), follow up training of head teacher (HTT-2), initial training of head teachers, training of
education administrators (DEO, ADEO, USEO, EO), continuous professional development CPD-1 (all
subject 14 days and English 24 days), CPD-2 (five days), cluster Training CPD-3 (one day), STC (three
months), STC (nine months) and B.Ed (one year). Courses of TQI conducted from 2005-2012 are at
table 3.5.
Table 3.5: Courses of TQI Conducted from 2005-2012
Type of Courses Course Participants
Total Average/ Institute
Average/ Institute/ Year
Total Average/ Institute
Average/ Course
1 Training of Trainers (TOT) 19 1.12 0.07 292 17.18 1.01
2 Training of head teachers (HTT-1) 161 9.47 0.56 6597 388.06 22.83
3 Follow up training of head teacher
(HTT-2) 102 6.00 0.35 4330 254.71 14.98
4 Initial training of head teachers 29 1.71 0.10 754 44.35 2.61
5 Training of education administrators
(DEO, ADEO, USEO, EO) 6 0.35 0.02 284 16.71 0.98
6 Continuous Professional Development (CPD-1) (All subject 14 days and English 24 days)
995 58.53 3.44 70867 4168.65 245.21
7 CPD-2 (five days) 624 36.71 2.16 41454 2438.47 143.44
8 Cluster training (CPD-3) (one day) 17 1.00 0.06 497 29.24 1.72
9 STC (three months) 114 6.71 0.39 9364 550.82 32.40
10 STC (nine months) 26 1.53 0.09 733 43.12 2.54
11 B. Ed (one year) 59 3.47 0.20 6195 364.41 21.44
60. Out of the surveyed training institutes six training institutes have facilities of providing training of
teachers of schools teaching students of tribal/deprived groups but only three institutes have teachers
for providing such training while during baseline survey there was no training institute having such
facilities. It was informed that they have provided training to 485 teachers for teaching of
tribal/disadvantaged children. Teachers having respective skills may be posted to the training institutes
having such facilities. Details are at table 3.6.
Table 3.6: Training Institutes having Training Facilities for School Teachers from Tribal/Deprived Area
Particulars of training of teachers of school having students
of tribal/deprived groups
Number
[n = 18] Percent
1 Training institutes having facilities of providing training of teachers
of schools teaching students of tribal/deprived groups 6 33.3
2 Number of teachers completed such training 485 -
3 Training institutes having teachers for providing such training 3 16.7

Evaluation of the Teaching Quality Improvement in Secondary Education Project
Eusuf and Associates SECTION III Page 16
61. The project has provided assistance to the teacher training colleges for development of physical
facilities to equip the institutes properly for providing training to teachers of the secondary schools. The
major assistances were infrastructure, furniture, equipment, office equipment, computer and accessories,
vehicles, training equipment, manpower, local training, overseas training and research activities. Details
of the physical facilities are at table 3.7.
Table 3.7: Infrastructure, Furniture, Equipment, Manpower & Research Supports from TQI Project
Areas of Development Number Average/Institute
1 Infrastructure 224 17.2
2 Furniture 3020 232.3
3 Office equipment 118 9.1
4 Computer and accessories 574 44.2
5 Vehicles 17 1.3
6 Training equipment 111 8.5
7 Manpower 340 26.2
8 Local training 178 13.7
9 Overseas training 145 11.2
10 Research 19 1.5
62. Practice teaching conducted in about 28 schools by each training institute at the time of impact
evaluation survey while this figure was 4 to 12 during baseline survey time. Teaching cycle days is
reduced from 45 (baseline) to 27 days during study time. Almost all the trainers arranged subject-wise
demonstration classes for the participants and also arranged micro-teaching/ simulation class for the participants for
their skill development.

Evaluation of the Teaching Quality Improvement in Secondary Education Project
Eusuf and Associates SECTION IV Page 17
Section IV Performance of Teacher Training Colleges and Higher Secondary
Teacher Training Institutes in Training of Secondary School Teachers
63. The consultants conducted interview of the teachers of the Government Teacher Training
Colleges (TTC), Higher Secondary Teacher Training Institutes (HSTTI) and Bangladesh Madrasha
Teacher Training Institute (BMTTI) in addition to the Principal of the TTCs and Directors of the HSTTIs
and BMTTI. In total 143 teachers of these institutes were interviewed. The respondents were both male
and female. Male respondents were 105 and female respondents were 38.
64. The respondents were within the age range of 27 to 58 years. Ages of majority of the
respondents were between 41 and 50 years. All the respondents are of potential age group and it
appears that the TTCs and TTIs are properly staffed. Age distribution of respondents by gender is at
table 4.1.
Table 4.1: Age of the Teachers of Teacher’s Training Institutes by Gender
Age (Years) Male Female Total
Number Percent Number Percent Number Percent
1 Below 35 10 7.0 3 2.1 13 9.1
2 36-40 23 16.1 3 2.1 26 18.2
3 41-45 28 19.6 16 11.2 44 30.8
4 46-50 27 18.9 5 3.5 32 22.4
5 51-55 13 9.1 4 2.8 17 11.9
6 56-58 4 2.8 7 4.9 11 7.7
Total 105 73.4 38 26.6 143 100.0
65. Educational qualifications of more than 90% respondents were master degree and most of them
have professional degree in education. About 5% respondents have Ph.D. degree and rest of them have
M.Phil and Bachelor with professional degree in education. Status of educational qualification of
respondents is at table 4.2.
Table 4.2: Educational Qualification of Respondents Teachers of Teacher’s Training Institute
Level of education Male Female Total
Number Percent Number Percent Number Percent
1 Ph. D 3 2.1 4 2.8 7 4.9
2 M. Phi 1 0.7 2 1.4 3 2.1
3 Master 19 13.3 6 4.2 25 17.5
4 Bachelor 2 1.4 0 0.0 2 1.4
5 Bachelor with B. Ed 1 0.7 0 0.0 1 0.7
6 Master with B. Ed 39 27.3 15 10.5 54 37.8
7 Master with M. Ed 40 28.0 11 7.7 51 35.7
Total 105 73.4 38 26.6 143 100.0
66. Positions of respondents were Principal, Vice Principal, Professor, Associate Professor, Assistant
Professor, Lecturer and Subject Specialist. Majority of the respondents were Associate Professor,
Assistant Professor and Lecturer. Subject taught by the respondents were Bangla, Mathematics, English,
Agriculture, Home Economics, Religion, Social Science, Geography, Economics, Business Education,
Computer, Accounting, Physics, Chemistry, Biology, Higher Mathematics. Education Science (Pedagogy),
Special Education and Library Science. More respondents were of Bangla, Mathematics, English, Religion,
Social Science, Geography, Computer, Physics, Biology and Education Science (Pedagogy). Distribution
respondents by subject taught is at table 4.3.

Evaluation of the Teaching Quality Improvement in Secondary Education Project
Eusuf and Associates SECTION IV Page 18
Table 4.3: Teaching Subjects of the Teachers of Teacher’s Training Institute
Subject Number Percent
1 Bengali 21 14.7
2 Mathematics 9 6.3
3 English 7 4.9
4 Agriculture 6 4.2
5 Home Economics 3 2.1
6 Religion 8 5.6
7 Social Science 22 15.4
8 Geography 9 6.3
9 Economics 4 2.8
10 Business Education 3 2.1
11 Computer 11 7.7
12 Accounting 4 2.8
13 Physics 11 7.7
14 Chemistry 3 2.1
15 Biology 16 11.2
16 Higher Mathematics 2 1.4
17 Education Science (Pedagogy) 21 14.7
18 Special Education 2 1.4
19 Library Science 1 0.7
67. Most of the teachers taught subjects in which they have specialization. In addition to their
specialization some of them taught other related subjects. Subjects of specializations were Bangla,
Mathematics, English, Agriculture, Geography, Chemistry, Physics, Biology, Economics, Social Science,
Home Economics, Religious studies, Accounting, Computer, Business Education, History, Philosophy,
Education, General Science, Political Science, LSBE, Thesis, Psychology, Unified Education, Population
Education, Pedagogy, Cultural Function Operation, Islamic Ideology, Botany, Library Science and
Guidance and Counseling.
68. Experience of respondents as trainer were collected and range of their experiences were from 1
to 28 years and about 48% having experience less than 10 years and the rest of them have experience
of ten and more years. Experience of the Teachers of Teacher’s Training Institute is at table 4.4.
Table 4.4: Experience of the Teachers of Teacher’s Training Institute as Trainer
Years of experience Male Female Total
Number Percent Number Percent Number Percent
1 Below 10 53 50.5 15 39.5 68 47.5
2 11-15 23 21.9 9 23.7 32 22.4
3 16-20 18 17.1 11 28.9 29 20.3
4 21-25 9 8.6 2 5.3 11 7.7
5 26-28 2 1.9 1 1.6 3 2.1
69. Number of sessions conducted by teacher of teacher training institutes per week varied
significantly from 2 to 28. About two-third teachers conducted 6 to 20 sessions. Majority of teachers
conducted 6 to 10 sessions per week. At the time of Baseline Survey it was found that majority teachers
conducted 11 to 15 sessions (page 29 of Baseline Report). Work load during the evaluation survey is
reduced. Session conducted per week by the teachers is at table 4.5.
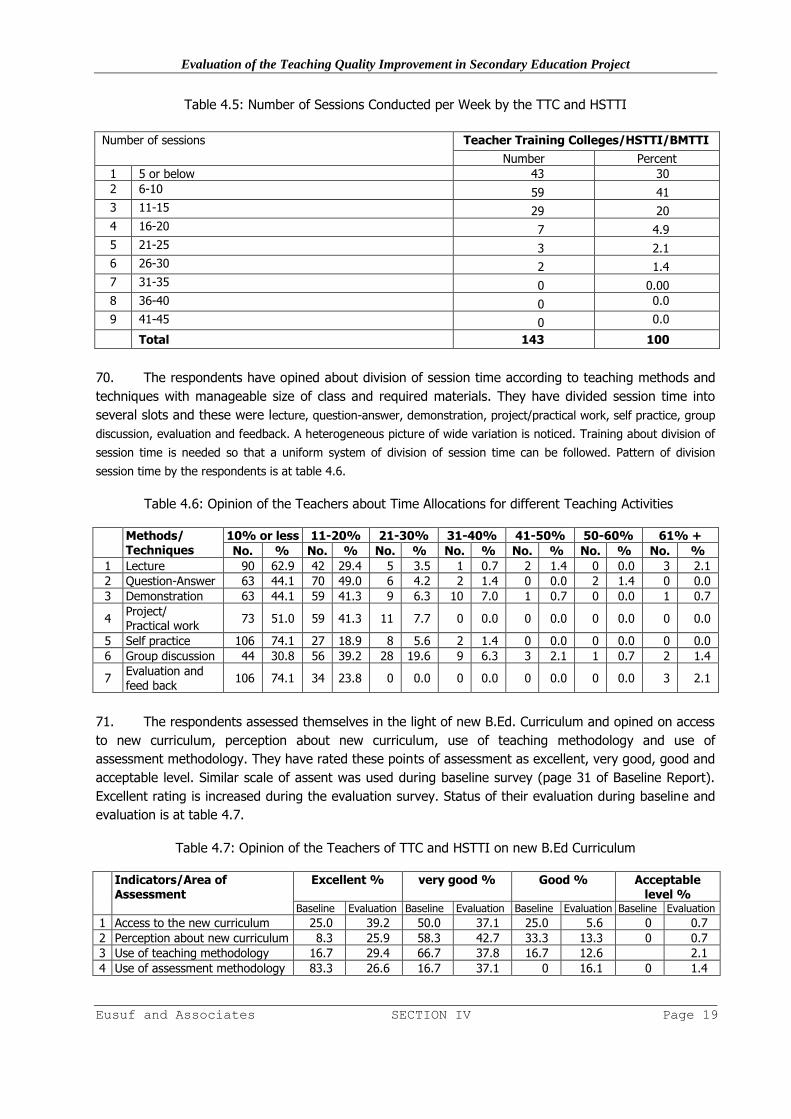
Evaluation of the Teaching Quality Improvement in Secondary Education Project
Eusuf and Associates SECTION IV Page 19
Table 4.5: Number of Sessions Conducted per Week by the TTC and HSTTI
Number of sessions Teacher Training Colleges/HSTTI/BMTTI
Number Percent
1 5 or below 43 30
2 6-10 59 41
3 11-15 29 20
4 16-20 7 4.9
5 21-25 3 2.1
6 26-30 2 1.4
7 31-35 0 0.00
8 36-40 0 0.0
9 41-45 0 0.0
Total 143 100
70. The respondents have opined about division of session time according to teaching methods and
techniques with manageable size of class and required materials. They have divided session time into
several slots and these were lecture, question-answer, demonstration, project/practical work, self practice, group
discussion, evaluation and feedback. A heterogeneous picture of wide variation is noticed. Training about division of
session time is needed so that a uniform system of division of session time can be followed. Pattern of division
session time by the respondents is at table 4.6.
Table 4.6: Opinion of the Teachers about Time Allocations for different Teaching Activities
Methods/ Techniques
10% or less 11-20% 21-30% 31-40% 41-50% 50-60% 61% +
No. % No. % No. % No. % No. % No. % No. %
1 Lecture 90 62.9 42 29.4 5 3.5 1 0.7 2 1.4 0 0.0 3 2.1
2 Question-Answer 63 44.1 70 49.0 6 4.2 2 1.4 0 0.0 2 1.4 0 0.0
3 Demonstration 63 44.1 59 41.3 9 6.3 10 7.0 1 0.7 0 0.0 1 0.7
4 Project/ Practical work
73 51.0 59 41.3 11 7.7 0 0.0 0 0.0 0 0.0 0 0.0
5 Self practice 106 74.1 27 18.9 8 5.6 2 1.4 0 0.0 0 0.0 0 0.0
6 Group discussion 44 30.8 56 39.2 28 19.6 9 6.3 3 2.1 1 0.7 2 1.4
7 Evaluation and feed back
106 74.1 34 23.8 0 0.0 0 0.0 0 0.0 0 0.0 3 2.1
71. The respondents assessed themselves in the light of new B.Ed. Curriculum and opined on access
to new curriculum, perception about new curriculum, use of teaching methodology and use of
assessment methodology. They have rated these points of assessment as excellent, very good, good and
acceptable level. Similar scale of assent was used during baseline survey (page 31 of Baseline Report).
Excellent rating is increased during the evaluation survey. Status of their evaluation during baseline and
evaluation is at table 4.7.
Table 4.7: Opinion of the Teachers of TTC and HSTTI on new B.Ed Curriculum Indicators/Area of
Assessment Excellent % very good % Good % Acceptable
level % Baseline Evaluation Baseline Evaluation Baseline Evaluation Baseline Evaluation
1 Access to the new curriculum 25.0 39.2 50.0 37.1 25.0 5.6 0 0.7
2 Perception about new curriculum 8.3 25.9 58.3 42.7 33.3 13.3 0 0.7
3 Use of teaching methodology 16.7 29.4 66.7 37.8 16.7 12.6 2.1
4 Use of assessment methodology 83.3 26.6 16.7 37.1 0 16.1 0 1.4
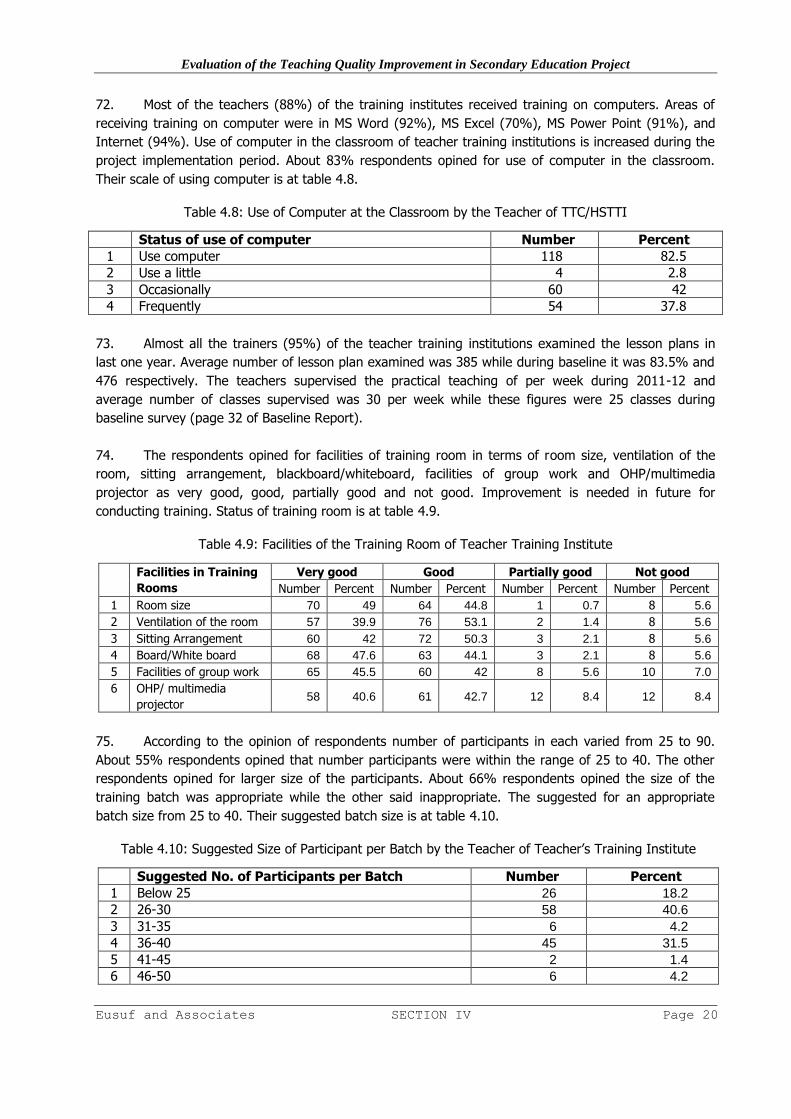
Evaluation of the Teaching Quality Improvement in Secondary Education Project
Eusuf and Associates SECTION IV Page 20
72. Most of the teachers (88%) of the training institutes received training on computers. Areas of
receiving training on computer were in MS Word (92%), MS Excel (70%), MS Power Point (91%), and
Internet (94%). Use of computer in the classroom of teacher training institutions is increased during the
project implementation period. About 83% respondents opined for use of computer in the classroom.
Their scale of using computer is at table 4.8.
Table 4.8: Use of Computer at the Classroom by the Teacher of TTC/HSTTI
Status of use of computer Number Percent
1 Use computer 118 82.5
2 Use a little 4 2.8
3 Occasionally 60 42
4 Frequently 54 37.8
73. Almost all the trainers (95%) of the teacher training institutions examined the lesson plans in
last one year. Average number of lesson plan examined was 385 while during baseline it was 83.5% and
476 respectively. The teachers supervised the practical teaching of per week during 2011-12 and
average number of classes supervised was 30 per week while these figures were 25 classes during
baseline survey (page 32 of Baseline Report).
74. The respondents opined for facilities of training room in terms of room size, ventilation of the
room, sitting arrangement, blackboard/whiteboard, facilities of group work and OHP/multimedia
projector as very good, good, partially good and not good. Improvement is needed in future for
conducting training. Status of training room is at table 4.9.
Table 4.9: Facilities of the Training Room of Teacher Training Institute
Facilities in Training
Rooms
Very good Good Partially good Not good
Number Percent Number Percent Number Percent Number Percent
1 Room size 70 49 64 44.8 1 0.7 8 5.6
2 Ventilation of the room 57 39.9 76 53.1 2 1.4 8 5.6
3 Sitting Arrangement 60 42 72 50.3 3 2.1 8 5.6
4 Board/White board 68 47.6 63 44.1 3 2.1 8 5.6
5 Facilities of group work 65 45.5 60 42 8 5.6 10 7.0
6 OHP/ multimedia
projector 58 40.6 61 42.7 12 8.4 12 8.4
75. According to the opinion of respondents number of participants in each varied from 25 to 90.
About 55% respondents opined that number participants were within the range of 25 to 40. The other
respondents opined for larger size of the participants. About 66% respondents opined the size of the
training batch was appropriate while the other said inappropriate. The suggested for an appropriate
batch size from 25 to 40. Their suggested batch size is at table 4.10.
Table 4.10: Suggested Size of Participant per Batch by the Teacher of Teacher’s Training Institute
Suggested No. of Participants per Batch Number Percent
1 Below 25 26 18.2
2 26-30 58 40.6
3 31-35 6 4.2
4 36-40 45 31.5
5 41-45 2 1.4
6 46-50 6 4.2
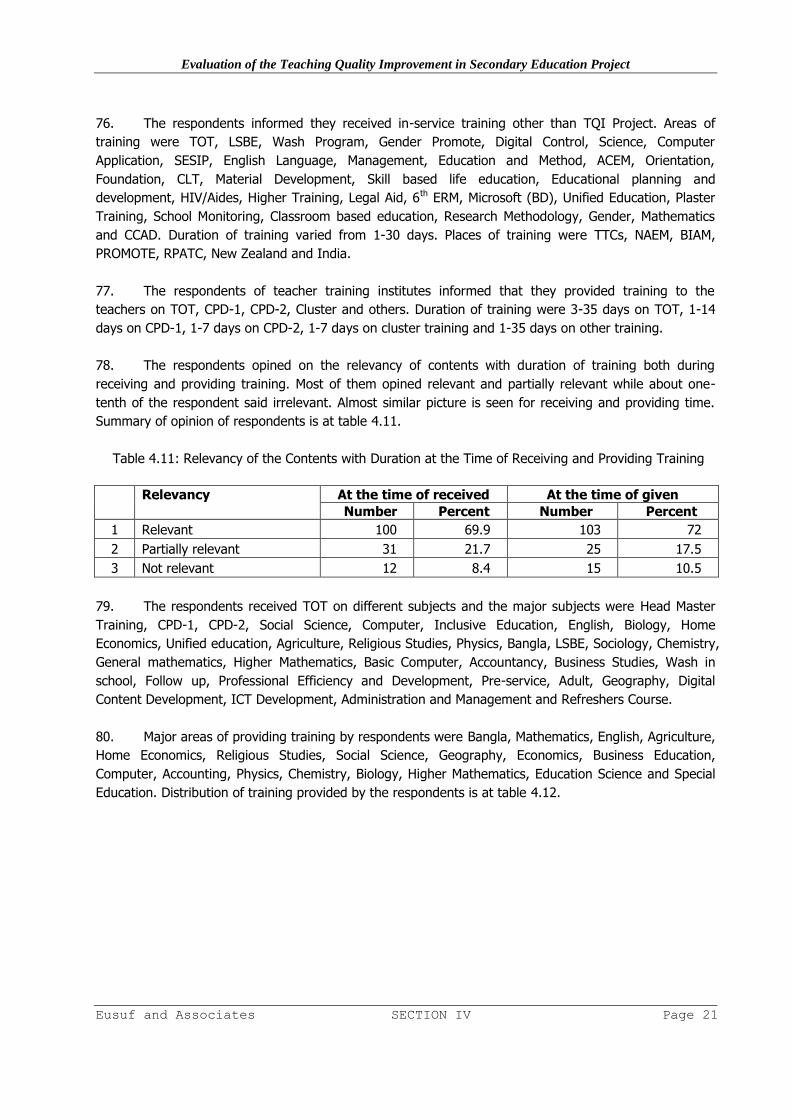
Evaluation of the Teaching Quality Improvement in Secondary Education Project
Eusuf and Associates SECTION IV Page 21
76. The respondents informed they received in-service training other than TQI Project. Areas of
training were TOT, LSBE, Wash Program, Gender Promote, Digital Control, Science, Computer
Application, SESIP, English Language, Management, Education and Method, ACEM, Orientation,
Foundation, CLT, Material Development, Skill based life education, Educational planning and
development, HIV/Aides, Higher Training, Legal Aid, 6th ERM, Microsoft (BD), Unified Education, Plaster
Training, School Monitoring, Classroom based education, Research Methodology, Gender, Mathematics
and CCAD. Duration of training varied from 1-30 days. Places of training were TTCs, NAEM, BIAM,
PROMOTE, RPATC, New Zealand and India.
77. The respondents of teacher training institutes informed that they provided training to the
teachers on TOT, CPD-1, CPD-2, Cluster and others. Duration of training were 3-35 days on TOT, 1-14
days on CPD-1, 1-7 days on CPD-2, 1-7 days on cluster training and 1-35 days on other training.
78. The respondents opined on the relevancy of contents with duration of training both during
receiving and providing training. Most of them opined relevant and partially relevant while about one-
tenth of the respondent said irrelevant. Almost similar picture is seen for receiving and providing time.
Summary of opinion of respondents is at table 4.11.
Table 4.11: Relevancy of the Contents with Duration at the Time of Receiving and Providing Training
Relevancy At the time of received At the time of given
Number Percent Number Percent
1 Relevant 100 69.9 103 72
2 Partially relevant 31 21.7 25 17.5
3 Not relevant 12 8.4 15 10.5
79. The respondents received TOT on different subjects and the major subjects were Head Master
Training, CPD-1, CPD-2, Social Science, Computer, Inclusive Education, English, Biology, Home
Economics, Unified education, Agriculture, Religious Studies, Physics, Bangla, LSBE, Sociology, Chemistry,
General mathematics, Higher Mathematics, Basic Computer, Accountancy, Business Studies, Wash in
school, Follow up, Professional Efficiency and Development, Pre-service, Adult, Geography, Digital
Content Development, ICT Development, Administration and Management and Refreshers Course.
80. Major areas of providing training by respondents were Bangla, Mathematics, English, Agriculture,
Home Economics, Religious Studies, Social Science, Geography, Economics, Business Education,
Computer, Accounting, Physics, Chemistry, Biology, Higher Mathematics, Education Science and Special
Education. Distribution of training provided by the respondents is at table 4.12.
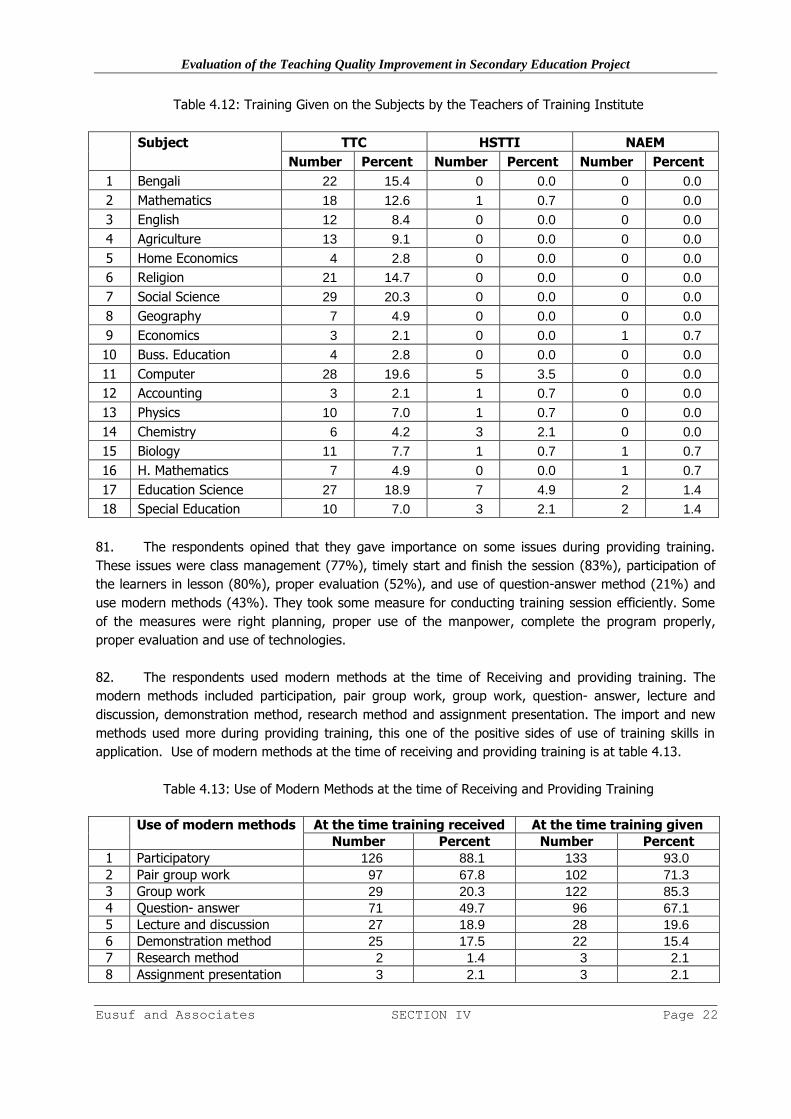
Evaluation of the Teaching Quality Improvement in Secondary Education Project
Eusuf and Associates SECTION IV Page 22
Table 4.12: Training Given on the Subjects by the Teachers of Training Institute
Subject TTC HSTTI NAEM
Number Percent Number Percent Number Percent
1 Bengali 22 15.4 0 0.0 0 0.0
2 Mathematics 18 12.6 1 0.7 0 0.0
3 English 12 8.4 0 0.0 0 0.0
4 Agriculture 13 9.1 0 0.0 0 0.0
5 Home Economics 4 2.8 0 0.0 0 0.0
6 Religion 21 14.7 0 0.0 0 0.0
7 Social Science 29 20.3 0 0.0 0 0.0
8 Geography 7 4.9 0 0.0 0 0.0
9 Economics 3 2.1 0 0.0 1 0.7
10 Buss. Education 4 2.8 0 0.0 0 0.0
11 Computer 28 19.6 5 3.5 0 0.0
12 Accounting 3 2.1 1 0.7 0 0.0
13 Physics 10 7.0 1 0.7 0 0.0
14 Chemistry 6 4.2 3 2.1 0 0.0
15 Biology 11 7.7 1 0.7 1 0.7
16 H. Mathematics 7 4.9 0 0.0 1 0.7
17 Education Science 27 18.9 7 4.9 2 1.4
18 Special Education 10 7.0 3 2.1 2 1.4
81. The respondents opined that they gave importance on some issues during providing training.
These issues were class management (77%), timely start and finish the session (83%), participation of
the learners in lesson (80%), proper evaluation (52%), and use of question-answer method (21%) and
use modern methods (43%). They took some measure for conducting training session efficiently. Some
of the measures were right planning, proper use of the manpower, complete the program properly,
proper evaluation and use of technologies.
82. The respondents used modern methods at the time of Receiving and providing training. The
modern methods included participation, pair group work, group work, question- answer, lecture and
discussion, demonstration method, research method and assignment presentation. The import and new
methods used more during providing training, this one of the positive sides of use of training skills in
application. Use of modern methods at the time of receiving and providing training is at table 4.13.
Table 4.13: Use of Modern Methods at the time of Receiving and Providing Training
Use of modern methods At the time training received At the time training given
Number Percent Number Percent
1 Participatory 126 88.1 133 93.0
2 Pair group work 97 67.8 102 71.3
3 Group work 29 20.3 122 85.3
4 Question- answer 71 49.7 96 67.1
5 Lecture and discussion 27 18.9 28 19.6
6 Demonstration method 25 17.5 22 15.4
7 Research method 2 1.4 3 2.1
8 Assignment presentation 3 2.1 3 2.1

Evaluation of the Teaching Quality Improvement in Secondary Education Project
Eusuf and Associates SECTION IV Page 23
83. The respondents undertook some practical work
at the time of receiving training. These works were completing the given assignment (81%), preparing the
teaching materials (86%), preparing report (76%) and presentation of report (70%). The trainers motivated the
trainees during providing for undertaking practical work.
Major practical work were participation in discussion, preparing report by pair groups, preparing innovative
teaching materials, presentation of question by individual and groups. Use of teaching materials was more in most
of the sessions during receiving training than providing training. Using pattern of teaching materials at the time
of receiving and providing training is at table 4.14.
Table 4.14: Use of Teaching Materials at the time of Receiving and Providing Training
Use of modern
methods
At the time training received At the time training given
Number Percent Number Percent
1 Manual 120 83.9 121 84.6
2 Handout 107 74.8 99 69.2
3 OHP 110 76.9 105 73.4
4 Chart and model 82 57.3 99 69.2
5 Projector 65 45.5 61 42.7
6 Other 9 6.3 12 8.4
84. The respondents assessed the relevancy of handouts used during receiving training as relevant
(62%) and more or less relevant (38%) and quality of the training materials as very good (24%), good
(64%) and partially good (12%). Quality of training material used at the time of providing training as
very good, good, partially good and not good for manual, handout and chart and model. Scale of their
assessment is at table 4.15.
Table 4.15: Quality of the Materials Given at the Time of Providing Training
Quality of Materials
Manual Handout Chart and model
Number Percent Number Percent Number Percent
1 Very good 59 41.3 35 24.5 31 21.7
2 Good 67 46.9 75 52.4 75 52.4
3 Partially good 17 11.8 7 4.9 10 7.0
4 Not good 0 0 26 18.2 27 18.9
Total 143 100 143 100 143 100
85. The respondents opined that the TQI project undertook several steps for improvement of overall
efficiency and skills of the teacher training institutes and these steps were infrastructure development of
the institutes (67%), skill development of the manpower (70%), preparation and development of
teaching materials (83%), improvement of management (68%) and improvement of environment 29%).
They undertook a number of responsibilities for monitoring of TQI activities. The major responsibilities
undertaken were developing the program (31%), collecting data (14%), preparing the report (5%),
preparing the monitoring guideline (21%) and taking the decisions (9%).
86. The respondents opined that the training program would be more effective if providing
necessary supervision (84%), supplying of the materials timely (66%), strengthening coordination
between management and administration (76%), evaluating the participants properly (59%) and making
residential system mandatory (15%).

Evaluation of the Teaching Quality Improvement in Secondary Education Project
Eusuf and Associates SECTION IV Page 24
87. The respondents opined that the TQI Project provided importance on a number of areas for
providing local training. Major areas of importance were skill manpower (81%), role of authority (71%),
decision making (66%) and implementation of the decisions (64%). They also mentioned some barriers
for monitoring of the activities properly and these were scarcity of skill manpower, non-cooperation of
authority, not implementing the taken decisions, electricity failure, lack of sincerity of teacher, scarcity of
material and scarcity of time.
88. The respondents assessed the contribution of this training to improve quality of education. They
assessed as very good (50%), good (42%), not good (7%) and not good (1%). They recommended
some points for improvement of quality of training. Their recommendations were proper management,
cooperation of all concerned persons/organization, skill trainer, good quality manual, proper teaching
materials, proper use of the teaching materials, improvement of quality of TOT and monitoring of
teachers. Distribution of their recommendations is at table 4.16.
Table 4.16: Suggestions of the Teachers of TTC for Improvement of Quality of Training
Recommendations Number Percent
1 Proper management 114 79.7
2 Cooperation of all concerned persons/organization 100 69.9
3 Skilled trainer 107 74.8
4 Good quality manual 69 48.3
5 Proper teaching materials 64 44.8
6 Proper use of the teaching materials 46 32.2
7 Improvement of quality of TOT, monitoring of teachers 2 1.4
89. They provided outlines for making arrangement for intensive monitoring of TQI training activities.
Their suggested outlines were proper management, cooperation of relevant persons/organization, skill
trainer, good quality manual, proper teaching materials, proper use of the teaching materials,
arrangement for monitoring and accountability and refresher training. However monitoring of training in
the secondary schools in found highly valuable for ensuring proper practice training of the classroom
teachers and also the trainers as useful feedback and improvements of their skills. Nevertheless, the
useful monitoring of training has not sustainable even at the time of evaluation study when the project in
yet to close. The monitoring program could not continue due to lack money needed for cost of fuel of
the vehicle and per diem of the trainers, and adjustment of time between training classes in TTC/HSTTI
and monitoring in the schools. Details at table 4.17.
Table 4.17: Opinion of the Teachers of TTC for Intensive Monitoring of Training
Opinion to make intensive monitoring Number Percent
1 Proper management 115 80.4
2 Cooperation of relevant persons/organization 110 76.9
3 Skilled trainer 107 74.8
4 Good quality manual 69 48.3
5 Proper teaching materials 45 31.5
6 Proper use of the teaching materials 43 30.1
7 Arrangement for monitoring and accountability, refresher training 4 2.8

Evaluation of the Teaching Quality Improvement in Secondary Education Project
Eusuf and Associates SECTION V Page 25
Section V Improvement of Teaching Learning Environment in Secondary Schools and School Performance
90. All the school level information collected from school record and interviewing head teachers
(164) and assistant head teachers (22). The consultant team collected information from 186 secondary
schools including all the 149 schools covered during baseline survey. Categories of schools surveyed
were Government Boys High School, Government Girls High School, Government Coeducation High
School, Private Boys High School, Private Girls High School and Private Coeducation High School.
Sampled schools by category are at table 5.1.
Table 5.1: Distribution of Surveyed School by Category
Category of Schools Number (N=186) Percent
1 Government Boys High School 16 8.6
2 Government Girls High School 16 8.6
3 Government Coeducation High School 2 1.1
4 Private Boys High School 6 3.2
5 Private Girls High School 29 15.6
6 Private Coeducation High School 117 62.9
Total 186 100
91. Time of establishment of the sample schools was between 1828 and 1998. Ages of the
Government schools are more than the private schools. Year of establishment of Government schools
was from 1828 to 1997 while year of establishment of private schools was 1891 to 1998. Rate of
establishment of private sampled high schools was highest (19.9%) during 1961-1970 followed by
19.4% during 1981-1990. Years of establishment of schools are at table 5.2.
Table 5.2: Year of Establishment of the Sample Schools
Year of establishment of sample schools
Government Private
Number Percent Number Percent
1991-1998 1 0.5 21 11.3
1981-1990 0 0.0 36 19.4
1971-1980 0 0.0 23 12.4
1961-1970 4 2.2 37 19.9
1951-1960 2 1.1 6 3.2
1941-1950 3 1.6 7 3.8
1931-1940 3 1.6 6 3.2
1828-1931 21 11.3 16 8.6
92. Personal information of head teachers was collected and analyzed. Among the head teacher 162
were male and 24 were female. Minimum age of head teachers was 33 years and maximum age was 65
years. Ages of about 69% head teachers were between 41 and 55 years. Most of the head teachers
having ages more than 59 years were deputed on contract basis. Age distribution of head teachers is at
table 5.3.

Evaluation of the Teaching Quality Improvement in Secondary Education Project
Eusuf and Associates SECTION V Page 26
Table 5.3: Age of the Head Teachers on 1 January 2012 by Gender
Age (years) Male Female Total
Number Percent Number Percent Number Percent
1 31-35 4 2.2 0 0.0 4 2.2
2 36-40 14 7.5 1 0.5 15 8.1
3 41-45 53 28.5 4 2.2 57 30.6
4 46-50 29 15.6 12 6.5 41 22.0
5 51-55 27 14.5 3 1.6 30 16.1
6 56-60 31 16.7 4 2.2 35 18.8
7 60+ 4 2.2 0 0.0 4 2.2
Total 162 87.1 24 12.9 186 100.0
Min=33 Max=65
Average 48.34
Min=37 Max=59
Average 48.42
93. The evaluation survey collected information on teaching experience of head teachers of the
sampled schools. Minimum teaching experience of them was eight years while maximum was 42 years
while in the baseline survey minimum teaching experience of head teachers was six years (table 7
baseline survey reports). Experience of about 71% head teachers was between 16 and 30 years. Pattern
of experience of both the male and female teachers was similar. Minimum experience as head of the
institute of male head teachers was one year and maximum 28 years while minimum experience as head
of the institute of female head teachers was one year and maximum 30 years. Experience of head
teachers as head teacher was similar to evaluation survey (table 7 baseline survey reports). Distribution
of length of experience as head of the institution is at table 5.4.
Table 5.4: Experience of the Head Teachers as Head of the Institute by Gender [n-186]
Experience as head
teacher (years)
Male Female Total
Number Percent Number Percent Number Percent
1 5 or below 74 39.8 9 4.8 83 44.6
2 6-10 27 14.5 2 1.1 29 15.6
3 11-15 13 7.0 9 4.8 22 11.8
4 16-20 25 13.4 3 1.6 28 15.1
5 21-25 15 8.1 0 0.0 15 8.1
6 25 + 8 4.3 1 0.5 9 4.8
Total 162 87.1 24 12.9 186 100.0
94. Educational qualification of head teachers was collected and analyzed. Educational qualification
of about 5% of head teachers was Ph.D. followed by master degree (38%) and bachelor degree (57%)
while 17% head teachers have M.Ed., 79% have B.Ed. professional qualification and M.Ed. Number of
female head teachers having Ph.D. is higher than male head teachers having Ph.D. while the picture is
reverse in case of master and bachelor degrees. Educational and professional qualification of head
teachers is at table 5.5.

Evaluation of the Teaching Quality Improvement in Secondary Education Project
Eusuf and Associates SECTION V Page 27
Table 5.5: Educational and Professional Qualification of Head Teachers by Gender
Level of education Male Female Total [n-186]
Number Percent Number Percent Number Percent
General
1 Ph. D 4 2.2 5 2.7 9 4.8
2 Masters 59 31.7 11 5.9 70 37.6
3 Bachelors 99 53.2 8 4.3 107 57.5
Professional
1 M. Ed 27 14.5 4 2.2 31 16.7
2 B. Ed 126 67.7 20 10.8 146 78.5
3 BPEd. 8 4.3 0 0.0 8 4.3
95. It is appeared from the surveyed information that about 6% head teachers received TOT from
the TQI Project. In addition to TOT 60% received CPD-1 and 32% received CPD-2 training and 44%
received training on TQI-SEP, Cluster, Administrative Training, Life skills, SBI, TQI follow up, School
Leadership, PBM/SBA, Certificate Course, Management and Administration, Training management and
development, Questionnaire for innovative ideas. Pre-Science, ISB, SFSDP, Module 1,2 mathematics,
Wash, LTP and Inclusive education. Places of receiving training were TTCs, NAEM, BIAM, HSTTIs, and
Schools in district level and Abroad. The sampled head masters received training between 2005 and
2011. Duration of TOT courses varied from 5 to 21 days while duration of CPD-1 course was varied from
21 to 28 days, duration of CPD-2 course was five days, and duration of other training varied from 1 to 35
days.
96. The head teachers opined about effectiveness of in-service training on leadership and personal
management as excellent (43%), very good (42%) and good (15%), problem solving and decision
making as excellent (26%), very good (56%) and good (17%) and acceptable (1%), communication
skills as excellent (20%), very good (52%) and good (24%) and acceptable (4%) and planning and
management as excellent (28%), very good (46%) and good (22%), acceptable (3%) and bad (1%).
Self assessment of effectiveness of the in-service skill development training is at table 5.6.
Table 5.6: Effectiveness of Training in Skill Development of the Head Teacher
Areas of Skill
Development Level of achievement
Excellent Very Good Good Acceptable Bad
No. % No. % No. % No. % No. %
1 Leadership and personal
management (n = 166) 71 42.8 69 41.6 26 15.6 0 0 0 0
2 Problem solving and
decision making (n =167) 44 26.3 93 55.7 28 16.8 2 1.2 0 0
3 Communication skill
(n=166) 33 19.8 87 52.4 40 24.1 6 3.6 0 0
4 Planning and time
management (n = 166) 47 28.3 77 46.4 37 22.3 4 2.4 1 0.6
97. The head teachers opined that teaching materials of the schools is improved during the period of
implementation of TQI. Areas of improvement were: improvement of book (95%), blackboard (92%),
computer (73%), chart/model (84%), laboratory equipment (63%) and multimedia (28%). They also
opined about adequacy of the teaching materials and rated adequacy of book (57%), blackboard (67%),
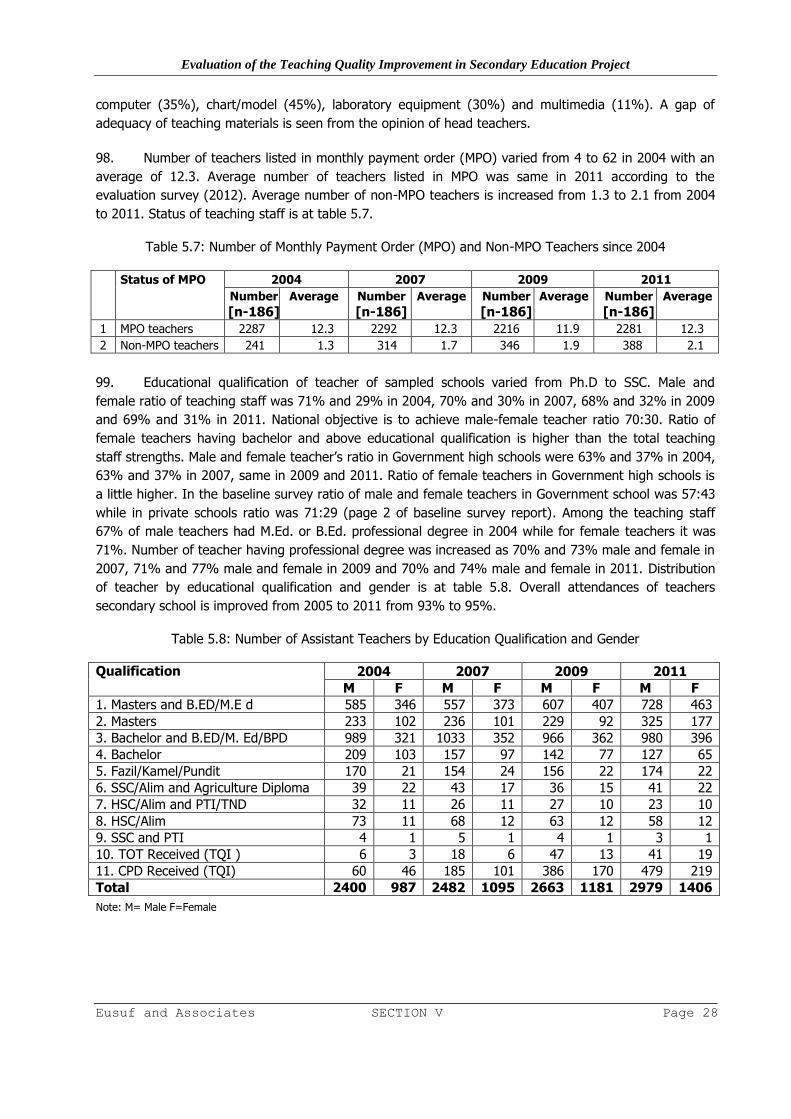
Evaluation of the Teaching Quality Improvement in Secondary Education Project
Eusuf and Associates SECTION V Page 28
computer (35%), chart/model (45%), laboratory equipment (30%) and multimedia (11%). A gap of
adequacy of teaching materials is seen from the opinion of head teachers.
98. Number of teachers listed in monthly payment order (MPO) varied from 4 to 62 in 2004 with an
average of 12.3. Average number of teachers listed in MPO was same in 2011 according to the
evaluation survey (2012). Average number of non-MPO teachers is increased from 1.3 to 2.1 from 2004
to 2011. Status of teaching staff is at table 5.7.
Table 5.7: Number of Monthly Payment Order (MPO) and Non-MPO Teachers since 2004
Status of MPO 2004 2007 2009 2011
Number
[n-186]
Average Number
[n-186]
Average Number
[n-186]
Average Number
[n-186]
Average
1 MPO teachers 2287 12.3 2292 12.3 2216 11.9 2281 12.3
2 Non-MPO teachers 241 1.3 314 1.7 346 1.9 388 2.1
99. Educational qualification of teacher of sampled schools varied from Ph.D to SSC. Male and
female ratio of teaching staff was 71% and 29% in 2004, 70% and 30% in 2007, 68% and 32% in 2009
and 69% and 31% in 2011. National objective is to achieve male-female teacher ratio 70:30. Ratio of
female teachers having bachelor and above educational qualification is higher than the total teaching
staff strengths. Male and female teacher’s ratio in Government high schools were 63% and 37% in 2004,
63% and 37% in 2007, same in 2009 and 2011. Ratio of female teachers in Government high schools is
a little higher. In the baseline survey ratio of male and female teachers in Government school was 57:43
while in private schools ratio was 71:29 (page 2 of baseline survey report). Among the teaching staff
67% of male teachers had M.Ed. or B.Ed. professional degree in 2004 while for female teachers it was
71%. Number of teacher having professional degree was increased as 70% and 73% male and female in
2007, 71% and 77% male and female in 2009 and 70% and 74% male and female in 2011. Distribution
of teacher by educational qualification and gender is at table 5.8. Overall attendances of teachers
secondary school is improved from 2005 to 2011 from 93% to 95%.
Table 5.8: Number of Assistant Teachers by Education Qualification and Gender
Qualification 2004 2007 2009 2011
M F M F M F M F
1. Masters and B.ED/M.E d 585 346 557 373 607 407 728 463
2. Masters 233 102 236 101 229 92 325 177
3. Bachelor and B.ED/M. Ed/BPD 989 321 1033 352 966 362 980 396
4. Bachelor 209 103 157 97 142 77 127 65
5. Fazil/Kamel/Pundit 170 21 154 24 156 22 174 22
6. SSC/Alim and Agriculture Diploma 39 22 43 17 36 15 41 22
7. HSC/Alim and PTI/TND 32 11 26 11 27 10 23 10
8. HSC/Alim 73 11 68 12 63 12 58 12
9. SSC and PTI 4 1 5 1 4 1 3 1
10. TOT Received (TQI ) 6 3 18 6 47 13 41 19
11. CPD Received (TQI) 60 46 185 101 386 170 479 219
Total 2400 987 2482 1095 2663 1181 2979 1406
Note: M= Male F=Female

Evaluation of the Teaching Quality Improvement in Secondary Education Project
Eusuf and Associates SECTION V Page 29
100. Manpower strength other than teaching staff of the schools is decreased from 5 to 4 during 2004
and 2011. Position cleaner/gardener is decreased. Strengths of staff other than teacher are at 5.9.
Table 5.9: Strength of Staff other than Teaching of the Schools
Category of staff 2004 2007 2009 2011
No. Average No. Average No. Average No. Average
1 Clerk 212 1.1 219 1.2 208 1.1 207 1.1
2 Peon/Maid 418 2.2 403 2.2 386 2.1 381 2.0
3 Cleaner/ Gardener 143 0.8 150 0.8 148 0.8 5 0.0
4 Night guard 151 0.8 149 0.8 147 0.8 148 0.8
Total 924 5.0 921 5.0 889 4.8 741 4.0
101. None of the teacher got benefit after receiving training from TQI. On an average 4.8 teachers
joined after commencement of TQI. Male female ratio of new teachers was 65% and 35%. A little
increasing trend of female teachers is observed. About 55% of the new teachers had pre-service training
and 42% teachers received in-service training. Position of pre-service and in-service training is at table
5.10.
Table 5.10: Status of Training of Teachers Joining after Launching of the TQI Project
Joined and receiving training Male Female
Number Average Number Average
1 Total teachers Join 571 3.1 308 1.7
2 Having pre-service training 345 1.9 138 0.7
3 Received in-service training 166 0.9 205 1.1
102. On an average two teachers left the schools after receiving training from TQI project. More male
teachers (1.5) left the schools than female teachers. They mentioned the reasons of leaving the schools
as low salary (6%), got good job elsewhere (32%), transportation problem (7%) and decision of family
(9%). Reasons of leaving school are at table 5.11.
Table 5.11: Reasons for Leaving the School by the Teachers
Reasons for leaving school [n-186] Number Percent
1 Low pay 11 5.9
2 Got good job elsewhere 60 32.3
3 Transportation problem 12 6.5
4 Decision of family 17 9.1
103. The head teachers involve in administrative and supervisory activities. A picture of administrative
and supervisory activities performed by the head teachers were conducting of staff meeting, evaluation
of teachers and supervision of class. The administrative and supervisory activities performed in the
recent past are at table 5.12.
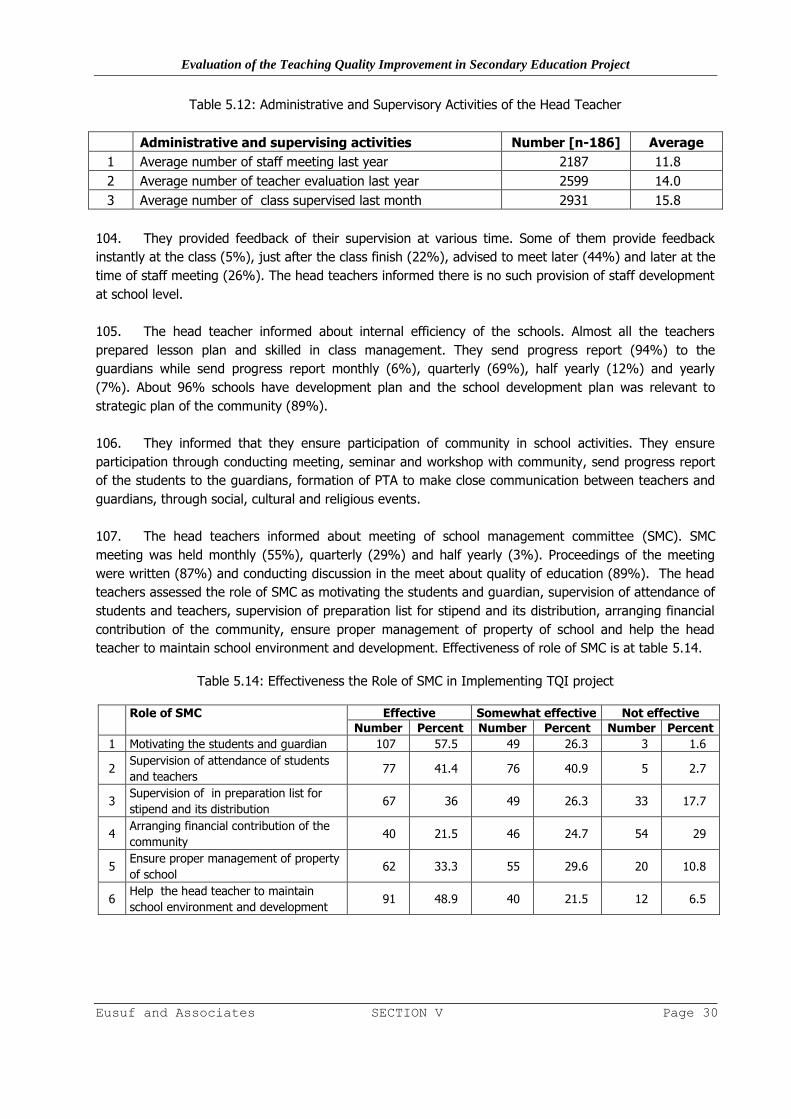
Evaluation of the Teaching Quality Improvement in Secondary Education Project
Eusuf and Associates SECTION V Page 30
Table 5.12: Administrative and Supervisory Activities of the Head Teacher
Administrative and supervising activities Number [n-186] Average
1 Average number of staff meeting last year 2187 11.8
2 Average number of teacher evaluation last year 2599 14.0
3 Average number of class supervised last month 2931 15.8
104. They provided feedback of their supervision at various time. Some of them provide feedback
instantly at the class (5%), just after the class finish (22%), advised to meet later (44%) and later at the
time of staff meeting (26%). The head teachers informed there is no such provision of staff development
at school level.
105. The head teacher informed about internal efficiency of the schools. Almost all the teachers
prepared lesson plan and skilled in class management. They send progress report (94%) to the
guardians while send progress report monthly (6%), quarterly (69%), half yearly (12%) and yearly
(7%). About 96% schools have development plan and the school development plan was relevant to
strategic plan of the community (89%).
106. They informed that they ensure participation of community in school activities. They ensure
participation through conducting meeting, seminar and workshop with community, send progress report
of the students to the guardians, formation of PTA to make close communication between teachers and
guardians, through social, cultural and religious events.
107. The head teachers informed about meeting of school management committee (SMC). SMC
meeting was held monthly (55%), quarterly (29%) and half yearly (3%). Proceedings of the meeting
were written (87%) and conducting discussion in the meet about quality of education (89%). The head
teachers assessed the role of SMC as motivating the students and guardian, supervision of attendance of
students and teachers, supervision of preparation list for stipend and its distribution, arranging financial
contribution of the community, ensure proper management of property of school and help the head
teacher to maintain school environment and development. Effectiveness of role of SMC is at table 5.14.
Table 5.14: Effectiveness the Role of SMC in Implementing TQI project
Role of SMC Effective Somewhat effective Not effective
Number Percent Number Percent Number Percent
1 Motivating the students and guardian 107 57.5 49 26.3 3 1.6
2 Supervision of attendance of students
and teachers 77 41.4 76 40.9 5 2.7
3 Supervision of in preparation list for
stipend and its distribution 67 36 49 26.3 33 17.7
4 Arranging financial contribution of the
community 40 21.5 46 24.7 54 29
5 Ensure proper management of property
of school 62 33.3 55 29.6 20 10.8
6 Help the head teacher to maintain
school environment and development 91 48.9 40 21.5 12 6.5

Evaluation of the Teaching Quality Improvement in Secondary Education Project
Eusuf and Associates SECTION V Page 31
108. Enrolment of students per school is increased gradually from 2004 to 2011. Enrolment of
student per school was 676.9 in 2004 with boy girl ratio of 55% and 45%. It is observed that the same
ratio throughout the project period although enrolment is increased to 882.1 per school. During baseline
survey boy and girl ratio was 49% and 51%. Average enrolment of students by gender in several years
is at table 5.15.
Table 5.15: Average Number of Students Enrolled per Class
Year VI VII VIII IX X Total
Boy Girl Boy Girl Boy Girl Boy Girl Boy Girl Boy Girl
2004 86.9 71.2 77.6 61.9 73.7 61.5 73.2 54.5 62.7 53.6 374.2 302.7
2005 102.7 67.5 80.4 59.7 71.8 55.5 71.3 63.5 65.9 49.9 392.0 296.1
2006 91.4 85.3 80.4 62.3 74.2 55.0 69.8 54.5 66.9 48.7 382.6 305.7
2007 87.4 64.0 82.3 65.5 76.0 58.7 72.1 55.1 64.5 55.8 382.4 299.1
2008 85.2 73.3 79.7 61.6 79.1 59.8 71.7 56.7 66.3 52.1 382.0 303.4
2009 101.6 71.2 81.2 61.4 76.8 65.3 76.6 58.4 68.4 62.2 404.7 318.5
2010 96.4 76.7 90.1 70.3 76.8 59.1 75.9 57.3 72.4 60.0 411.5 323.5
2011 115.6 92.1 108.1 84.4 92.2 70.9 91.0 68.8 86.8 72.0 493.9 388.2
109. Success rate of students in SSC Examination is increased gradually from 2004 to 2011. Rate of
success for both the boys and girls is increased. Success rate of boys is a little higher than that of girls.
Rate of success by year and gender is at table 5.16.
Table 5.16: Success Rate of Students in SSC Examination by Gender and Year
Year(s) Pass Rate (%)
Boy Girls Combined
1 2004 72.7 69.9 71.5
2 2005 76.0 72.7 74.6
3 2006 79.6 74.8 77.5
4 2007 77.3 74.2 75.9
5 2008 82.7 80.3 81.6
6 2009 83.5 80.6 82.2
7 2010 88.7 85.2 87.1
8 2011 90.2 88.3 89.3
110. Success rates of students in JSC Examination are very good. Success rate of boys were 87% and
girls were 84% in 2010 which increased to 91% and 90% respectively in 2011. Overall success rate was
85% and 91% respectively in 2010 and 2011.
111. Success rate of students in annual examination of schools is almost same throughout
implementation of the project. Success rate was 81% for boys and 85% for girls in class six in 2004 and
in 2011 these figures were 73% and 84% respectively. Similarly the success rate of boys and girls
remained almost static in all classes. The success rate of students is at table 5.17.
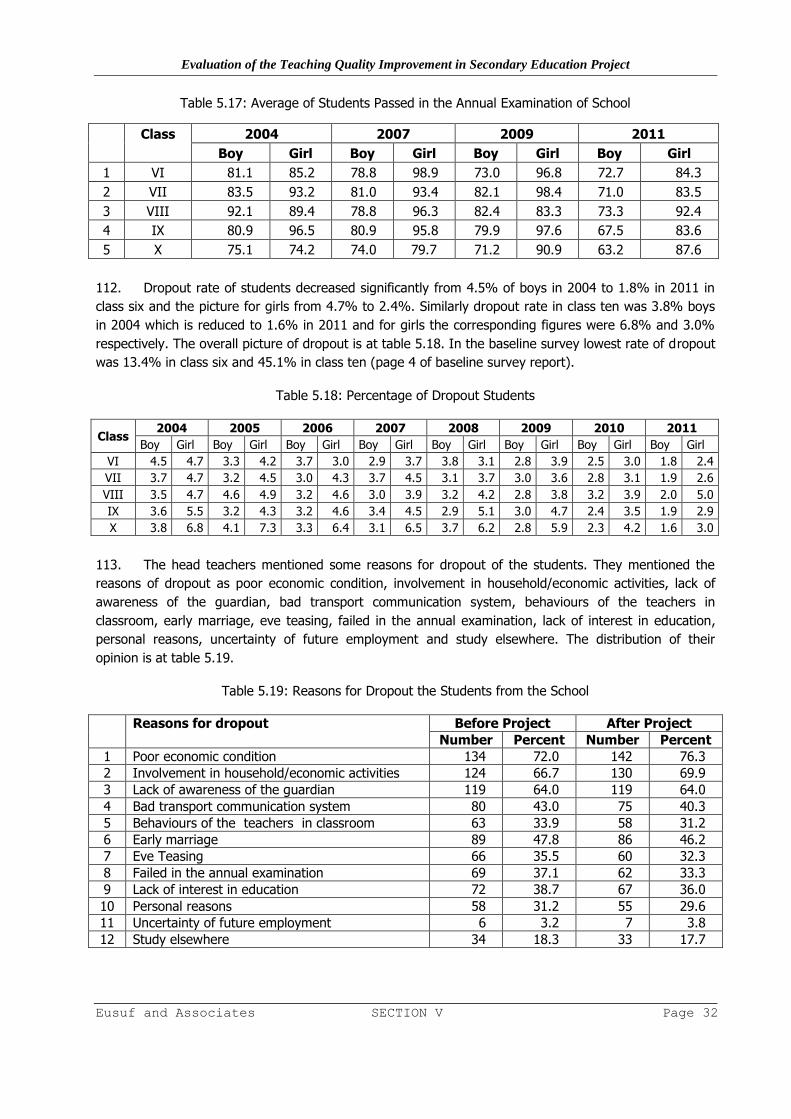
Evaluation of the Teaching Quality Improvement in Secondary Education Project
Eusuf and Associates SECTION V Page 32
Table 5.17: Average of Students Passed in the Annual Examination of School
Class 2004 2007 2009 2011
Boy Girl Boy Girl Boy Girl Boy Girl
1 VI 81.1 85.2 78.8 98.9 73.0 96.8 72.7 84.3
2 VII 83.5 93.2 81.0 93.4 82.1 98.4 71.0 83.5
3 VIII 92.1 89.4 78.8 96.3 82.4 83.3 73.3 92.4
4 IX 80.9 96.5 80.9 95.8 79.9 97.6 67.5 83.6
5 X 75.1 74.2 74.0 79.7 71.2 90.9 63.2 87.6
112. Dropout rate of students decreased significantly from 4.5% of boys in 2004 to 1.8% in 2011 in
class six and the picture for girls from 4.7% to 2.4%. Similarly dropout rate in class ten was 3.8% boys
in 2004 which is reduced to 1.6% in 2011 and for girls the corresponding figures were 6.8% and 3.0%
respectively. The overall picture of dropout is at table 5.18. In the baseline survey lowest rate of dropout
was 13.4% in class six and 45.1% in class ten (page 4 of baseline survey report).
Table 5.18: Percentage of Dropout Students
Class 2004 2005 2006 2007 2008 2009 2010 2011
Boy Girl Boy Girl Boy Girl Boy Girl Boy Girl Boy Girl Boy Girl Boy Girl
VI 4.5 4.7 3.3 4.2 3.7 3.0 2.9 3.7 3.8 3.1 2.8 3.9 2.5 3.0 1.8 2.4
VII 3.7 4.7 3.2 4.5 3.0 4.3 3.7 4.5 3.1 3.7 3.0 3.6 2.8 3.1 1.9 2.6
VIII 3.5 4.7 4.6 4.9 3.2 4.6 3.0 3.9 3.2 4.2 2.8 3.8 3.2 3.9 2.0 5.0
IX 3.6 5.5 3.2 4.3 3.2 4.6 3.4 4.5 2.9 5.1 3.0 4.7 2.4 3.5 1.9 2.9
X 3.8 6.8 4.1 7.3 3.3 6.4 3.1 6.5 3.7 6.2 2.8 5.9 2.3 4.2 1.6 3.0
113. The head teachers mentioned some reasons for dropout of the students. They mentioned the
reasons of dropout as poor economic condition, involvement in household/economic activities, lack of
awareness of the guardian, bad transport communication system, behaviours of the teachers in
classroom, early marriage, eve teasing, failed in the annual examination, lack of interest in education,
personal reasons, uncertainty of future employment and study elsewhere. The distribution of their
opinion is at table 5.19.
Table 5.19: Reasons for Dropout the Students from the School
Reasons for dropout Before Project After Project
Number Percent Number Percent
1 Poor economic condition 134 72.0 142 76.3
2 Involvement in household/economic activities 124 66.7 130 69.9
3 Lack of awareness of the guardian 119 64.0 119 64.0
4 Bad transport communication system 80 43.0 75 40.3
5 Behaviours of the teachers in classroom 63 33.9 58 31.2
6 Early marriage 89 47.8 86 46.2
7 Eve Teasing 66 35.5 60 32.3
8 Failed in the annual examination 69 37.1 62 33.3
9 Lack of interest in education 72 38.7 67 36.0
10 Personal reasons 58 31.2 55 29.6
11 Uncertainty of future employment 6 3.2 7 3.8
12 Study elsewhere 34 18.3 33 17.7

Evaluation of the Teaching Quality Improvement in Secondary Education Project
Eusuf and Associates SECTION V Page 33
114. Repetition rate of students per class is also decreased during the period of project
implementation. It varied from 3.3% to 9.3% in 2004 and from 2.4 to 5.5 in 2011 for different classes
and genders. Repetition rate for boys and girls follow almost the similar pattern and trend however,
repetition rate of girls was a little higher than the boys. The repetition rate is at table 5.20.
Table 5.20: Percentage of Student Repeated in the Same Grade
Class 2004 2005 2006 2007 2008 2009 2010 2011
Boy Girl Boy Girl Boy Girl Boy Girl Boy Girl Boy Girl Boy Girl Boy Girl
VI 4.9 4.4 3.5 3.9 3.5 2.9 4.0 4.1 3.2 3.0 3.0 3.9 3.7 3.0 2.5 2.4
VII 3.8 5.1 3.6 4.1 3.5 4.1 3.1 3.7 3.3 3.8 2.8 3.6 2.9 3.2 2.4 2.7
VIII 3.9 5.0 3.6 4.7 3.2 4.2 3.8 3.5 3.2 3.9 2.8 3.8 3.6 4.6 3.9 4.9
IX 3.4 3.8 3.3 3.4 3.2 3.5 4.0 4.0 3.5 3.5 2.9 3.7 3.3 3.5 2.8 3.4
X 7.3 9.3 6.1 9.0 5.5 8.3 6.8 7.8 5.4 8.8 5.5 7.2 4.3 7.0 3.8 5.5
115. Attendance of students is increased from 2004 to 2011. Average attendance rate of boys in 2004
was around 74% and girls 75% while these rates were found around 80% for both boys and girls in
2011. The rate of attendance of students is at table 5.21.
Table 5.21: Average of Attendance of the Students
Class 2004 2005 2006 2007 2008 2009 2010 2011
Boy Girl Boy Girl Boy Girl Boy Girl Boy Girl Boy Girl Boy Girl Boy Girl
VI 73.9 76.1 75.3 85.0 75.8 77.6 75.9 76.7 89.5 77.8 77.6 78.0 78.7 79.2 80.0 80.7
VII 74.1 74.7 75.5 74.2 81.1 76.1 76.6 76.6 75.7 76.3 77.6 77.1 79.6 78.9 78.7 79.1
VIII 74.3 74.5 74.4 80.4 79.5 76.4 78.7 77.0 77.2 76.7 76.1 77.9 77.9 77.8 80.1 80.9
IX 73.2 74.0 84.1 75.2 75.2 76.6 76.1 76.6 76.3 77.4 77.1 77.8 77.0 78.2 78.3 79.1
X 74.5 74.3 74.5 75.0 77.7 76.2 75.9 77.0 76.2 76.9 76.5 77.5 78.0 78.0 78.5 79.7
116. The head teachers assessed the TQI-SEP from different aspects and rated TQI as motivating
poor girl for education, motivating for science education, help to increase quality of education, ensuring
community participation, encouraging for self employment and encouraging the learners to bring their
talent. Their assessment is at table 5.22.
Table 5.22: Acceptance of the Different Opinion about TQI Project
Particulars of assessment Agree No comment Disagree
Number Percent Number Percent Number Percent
1 Motivated poor girl for education 148 79.6 17 9.1 11 5.9
2 Motivated for science education 126 67.7 14 7.5 31 16.7
3 Help to increase quality of education 154 82.8 3 1.6 17 9.1
4 Ensured community participation 98 52.7 44 23.7 25 13.4
5 Encouraged for self employment 75 40.3 45 24.2 45 24.2
6 Encouraged the learners to bring
their talent 160 86 4 2.2 3 1.6

Evaluation of the Teaching Quality Improvement in Secondary Education Project
Eusuf and Associates SECTION V Page 34
117. The head teachers suggested for making the TQI-SEP more effective in future. Their suggestions
are: more responsibility taking by the head teacher for school management, educational system to be
changed, measure to be taken to improve educational quality and increase number of teachers, ensuring
availability of teaching materials, more close communication with the guardian and school, improving the
student-teachers relationship, accountability and transparency of relevant personnel to be ensure,
providing poor and talent students scholarship if needed, providing stipend to all the secondary school,
bring student-teacher ratio at 1:40, encouraging participatory learning among the student, arrange to
take feedback from direct inspection by the trainers of TQI Project. Distribution of their suggestion is at
table 5.23.
Table 5.23: Suggestions for Making the TQI Project more effective
Suggestions Number Percent
1 More responsibility taking by the head teacher for school management 80 43.0
2 Educational system to be changed 30 16.1
3 Measure to be taken to improve educational quality and increase
number of teachers 94 50.5
4 Ensuring availability of teaching materials 35 18.8
5 More close communication with the guardian and school 57 30.6
6 Improving the student-teachers relationship 37 19.9
7 Accountability and transparency of relevant personnel to be ensure 43 23.1
8 Providing poor and talent students scholarship if needed 39 21.0
9 Providing stipend to all the secondary school 18 9.7
10 Bring student-teacher ratio at 1:40 82 44.1
11 Encouraging participatory learning among the student 17 9.1
12 Arrange to take feedback from direct inspection by the trainers of TQI
Project 3 1.6
118. The consultants collected feedback about the impact of teaching Quality Improvement in
Secondary Education Project (TQI-SEP). The team interviewed 300 school management committee
(SMC) members. Among the respondents 264 were male and the rest 36 were female. The ratio of male
female is 7.3:1. The feedback of the SMC members about TQI-SEP is presented in the following
paragraphs.
119. SMC is consists of people of wide range of age group from 26 years to 92 years. Although age
range is wide but 84% of them are within the age range of 36-60 years. Occupations of the SMC are
different but occupation of majority (51%) respondents is business followed by private service (17%),
agriculture (14%), Government service (7%) and house wife, social worker, journalist and physician
(10%). Level of their education is varied widely from primary to tertiary levels. Level of higher education
of female members is better than male members. Level of education of about 73% SMC members are
SSC or higher. In the baseline survey educational qualification of SME members of rural schools were 4%
Maters degree, 32.3% bachelor degree, and 14.1 percent hold educational qualification below SSC
(reference: baseline survey report page 16). Distribution of level of education of SMC members by
gender in the present study is at table 5.24.
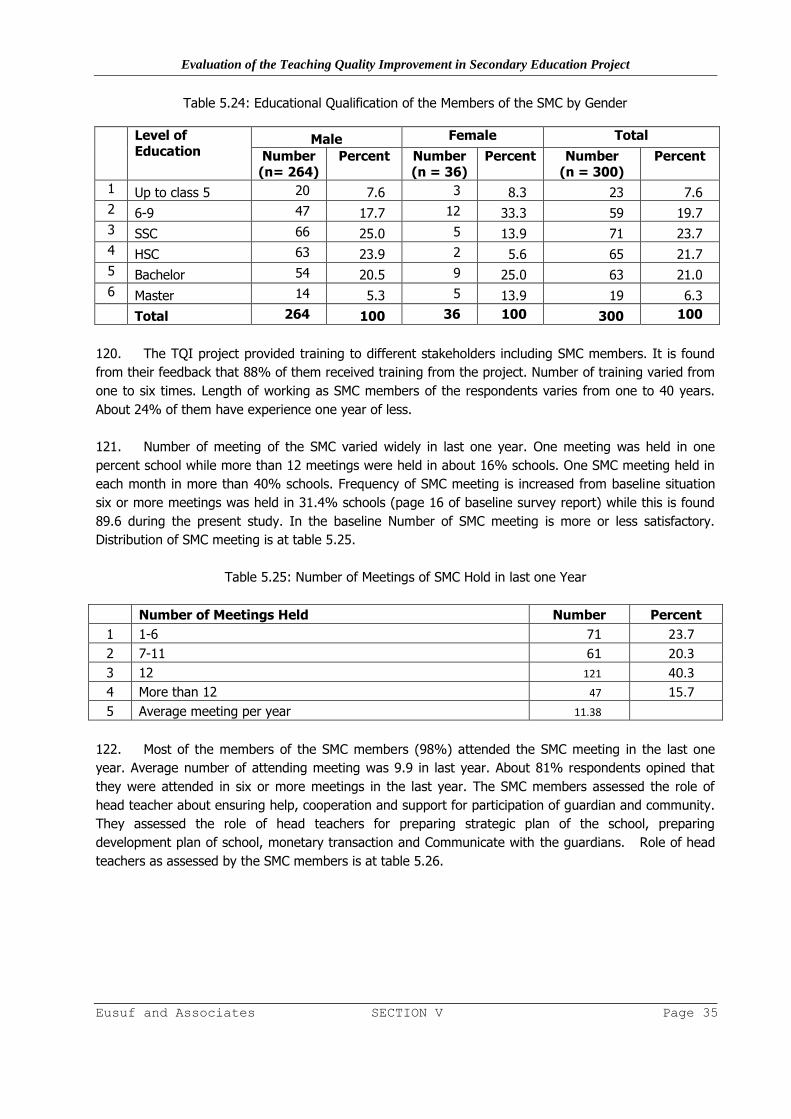
Evaluation of the Teaching Quality Improvement in Secondary Education Project
Eusuf and Associates SECTION V Page 35
Table 5.24: Educational Qualification of the Members of the SMC by Gender
Level of Education
Male Female Total
Number (n= 264)
Percent Number (n = 36)
Percent Number (n = 300)
Percent
1 Up to class 5 20 7.6 3 8.3 23 7.6
2 6-9 47 17.7 12 33.3 59 19.7
3 SSC 66 25.0 5 13.9 71 23.7
4 HSC 63 23.9 2 5.6 65 21.7
5 Bachelor 54 20.5 9 25.0 63 21.0
6 Master 14 5.3 5 13.9 19 6.3
Total 264 100 36 100 300 100
120. The TQI project provided training to different stakeholders including SMC members. It is found
from their feedback that 88% of them received training from the project. Number of training varied from
one to six times. Length of working as SMC members of the respondents varies from one to 40 years.
About 24% of them have experience one year of less.
121. Number of meeting of the SMC varied widely in last one year. One meeting was held in one
percent school while more than 12 meetings were held in about 16% schools. One SMC meeting held in
each month in more than 40% schools. Frequency of SMC meeting is increased from baseline situation
six or more meetings was held in 31.4% schools (page 16 of baseline survey report) while this is found
89.6 during the present study. In the baseline Number of SMC meeting is more or less satisfactory.
Distribution of SMC meeting is at table 5.25.
Table 5.25: Number of Meetings of SMC Hold in last one Year
Number of Meetings Held Number Percent
1 1-6 71 23.7
2 7-11 61 20.3
3 12 121 40.3
4 More than 12 47 15.7
5 Average meeting per year 11.38
122. Most of the members of the SMC members (98%) attended the SMC meeting in the last one
year. Average number of attending meeting was 9.9 in last year. About 81% respondents opined that
they were attended in six or more meetings in the last year. The SMC members assessed the role of
head teacher about ensuring help, cooperation and support for participation of guardian and community.
They assessed the role of head teachers for preparing strategic plan of the school, preparing
development plan of school, monetary transaction and Communicate with the guardians. Role of head
teachers as assessed by the SMC members is at table 5.26.
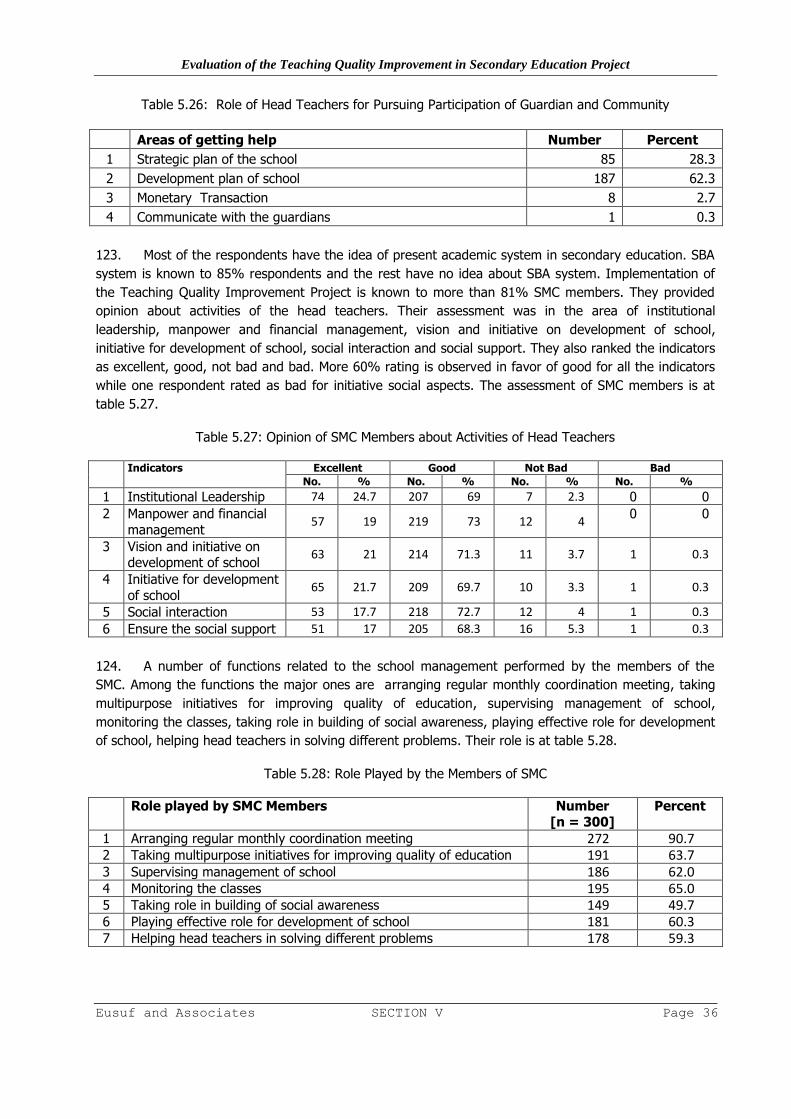
Evaluation of the Teaching Quality Improvement in Secondary Education Project
Eusuf and Associates SECTION V Page 36
Table 5.26: Role of Head Teachers for Pursuing Participation of Guardian and Community
Areas of getting help Number Percent
1 Strategic plan of the school 85 28.3
2 Development plan of school 187 62.3
3 Monetary Transaction 8 2.7
4 Communicate with the guardians 1 0.3
123. Most of the respondents have the idea of present academic system in secondary education. SBA
system is known to 85% respondents and the rest have no idea about SBA system. Implementation of
the Teaching Quality Improvement Project is known to more than 81% SMC members. They provided
opinion about activities of the head teachers. Their assessment was in the area of institutional
leadership, manpower and financial management, vision and initiative on development of school,
initiative for development of school, social interaction and social support. They also ranked the indicators
as excellent, good, not bad and bad. More 60% rating is observed in favor of good for all the indicators
while one respondent rated as bad for initiative social aspects. The assessment of SMC members is at
table 5.27.
Table 5.27: Opinion of SMC Members about Activities of Head Teachers
Indicators Excellent Good Not Bad Bad
No. % No. % No. % No. %
1 Institutional Leadership 74 24.7 207 69 7 2.3 0 0
2 Manpower and financial
management 57 19 219 73 12 4
0 0
3 Vision and initiative on development of school
63 21 214 71.3 11 3.7 1 0.3
4 Initiative for development
of school 65 21.7 209 69.7 10 3.3 1 0.3
5 Social interaction 53 17.7 218 72.7 12 4 1 0.3
6 Ensure the social support 51 17 205 68.3 16 5.3 1 0.3
124. A number of functions related to the school management performed by the members of the
SMC. Among the functions the major ones are arranging regular monthly coordination meeting, taking
multipurpose initiatives for improving quality of education, supervising management of school,
monitoring the classes, taking role in building of social awareness, playing effective role for development
of school, helping head teachers in solving different problems. Their role is at table 5.28.
Table 5.28: Role Played by the Members of SMC
Role played by SMC Members Number [n = 300]
Percent
1 Arranging regular monthly coordination meeting 272 90.7 2 Taking multipurpose initiatives for improving quality of education 191 63.7 3 Supervising management of school 186 62.0 4 Monitoring the classes 195 65.0 5 Taking role in building of social awareness 149 49.7 6 Playing effective role for development of school 181 60.3 7 Helping head teachers in solving different problems 178 59.3

Evaluation of the Teaching Quality Improvement in Secondary Education Project
Eusuf and Associates SECTION V Page 37
125. The respondents opined that facilities and opportunities of the students are improved due to
implementation of TQI. They identified areas and opportunities of education of the students as increased
scope of science education, use of improved quality of textbook, better furniture in the class, book in the
library, facilities of laboratory, better quality teachers, trained teacher, more scope of education and
more scope of education for girls. They also ranked the opportunities and the ranking is at table 5.29.
Table 5.29: Improvement of the Facilities of the Student due to TQI Project
Improvement of the Facilities of the Student due to TQI Project
Number Percent
1 Increased scope of science education 212 70.7 2 Use of improved quality of textbook 140 46.7 3 Better furniture in the class 103 34.3 4 Book in the library 96 32.0 5 Facilities of laboratory 61 20.3 6 Better quality teachers 154 51.3 7 Good quality trained teacher 189 63.0 8 More scope of education 115 38.3 9 More scope of education for girls 126 42.0
126. The SMC members assessed the success of achievement of the objective of the TQI Project as
fully achieved the objectives (30%), partially achieved the objectives (59%) and failed to achieve the
objectives (11%). They identified the reasons for fully and partially achievement of the objectives of the
TQI as financial support and free tuition fees, improvement of school environment, increasing number of
trained teachers, arrangement of science education, developing curriculum and textbooks and imposing
different conditions and using teaching materials and aids. The reasons of achievement are at table 5.30.
Table 5.30: Reasons for Achieving Fully or Partially the Objectives of the TQI Projects
Reasons for achieving fully or partially objectives of
TQI projects Number Percent
1 Financial support and free tuition fees 167 55.7
2 Improvement of school environment 213 71.0
3 Increasing number of trained teachers 239 79.7
4 Arranging science education 139 46.3
5 Developing curriculum and textbooks 97 32.3
6 Imposing different conditions 28 9.3
127. The respondents evaluated the activities and role of students under the TQI project. They
assessed role of students as good (48%), more or less good (41%) and bad (11%). The reasons they
identified for playing better role by the students for increasing scope of science education, use of
improved quality of textbook, better furniture in the class, book in the library, facilities of laboratory,
better quality trained teachers, more scope of education and more scope of education for girls. Reasons
for playing better role by the student in implementing the TQI Project are at table 5.31.
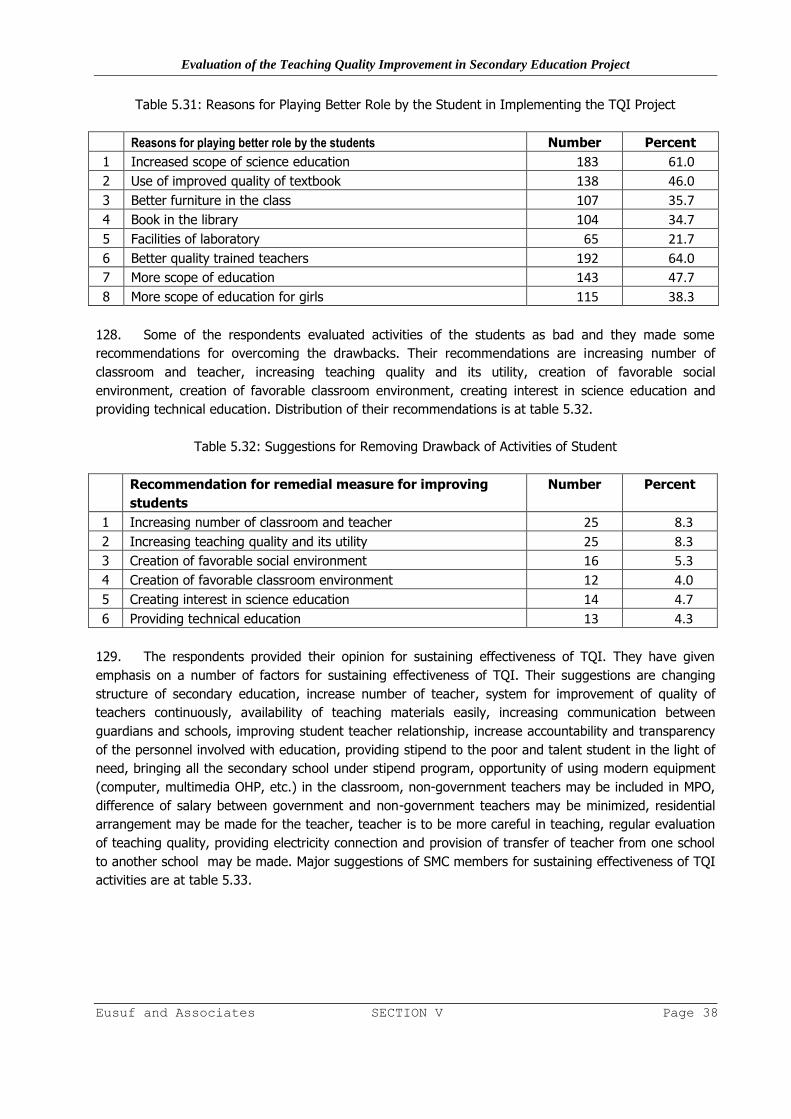
Evaluation of the Teaching Quality Improvement in Secondary Education Project
Eusuf and Associates SECTION V Page 38
Table 5.31: Reasons for Playing Better Role by the Student in Implementing the TQI Project
Reasons for playing better role by the students Number Percent
1 Increased scope of science education 183 61.0
2 Use of improved quality of textbook 138 46.0
3 Better furniture in the class 107 35.7
4 Book in the library 104 34.7
5 Facilities of laboratory 65 21.7
6 Better quality trained teachers 192 64.0
7 More scope of education 143 47.7
8 More scope of education for girls 115 38.3
128. Some of the respondents evaluated activities of the students as bad and they made some
recommendations for overcoming the drawbacks. Their recommendations are increasing number of
classroom and teacher, increasing teaching quality and its utility, creation of favorable social
environment, creation of favorable classroom environment, creating interest in science education and
providing technical education. Distribution of their recommendations is at table 5.32.
Table 5.32: Suggestions for Removing Drawback of Activities of Student
Recommendation for remedial measure for improving
students
Number Percent
1 Increasing number of classroom and teacher 25 8.3
2 Increasing teaching quality and its utility 25 8.3
3 Creation of favorable social environment 16 5.3
4 Creation of favorable classroom environment 12 4.0
5 Creating interest in science education 14 4.7
6 Providing technical education 13 4.3
129. The respondents provided their opinion for sustaining effectiveness of TQI. They have given
emphasis on a number of factors for sustaining effectiveness of TQI. Their suggestions are changing
structure of secondary education, increase number of teacher, system for improvement of quality of
teachers continuously, availability of teaching materials easily, increasing communication between
guardians and schools, improving student teacher relationship, increase accountability and transparency
of the personnel involved with education, providing stipend to the poor and talent student in the light of
need, bringing all the secondary school under stipend program, opportunity of using modern equipment
(computer, multimedia OHP, etc.) in the classroom, non-government teachers may be included in MPO,
difference of salary between government and non-government teachers may be minimized, residential
arrangement may be made for the teacher, teacher is to be more careful in teaching, regular evaluation
of teaching quality, providing electricity connection and provision of transfer of teacher from one school
to another school may be made. Major suggestions of SMC members for sustaining effectiveness of TQI
activities are at table 5.33.

Evaluation of the Teaching Quality Improvement in Secondary Education Project
Eusuf and Associates SECTION V Page 39
Table 5.33: Suggestions of the SMC Members for Sustaining Effectiveness of TQI Activities
Recommendation for making TQI activities sustainable Number Percent
1 Changing structure of secondary education 170 56.7
2 Increase number of teacher 212 70.7
3 Continuous system for improve quality of teacher 194 64.7
4 Easy availability teaching materials 166 55.3
5 Communication Increase communication of the guardian with school
of the guardian with school
153 51.0
6 Improve student teacher relationship 121 40.3
7 Increase accountability and transparency 103 34.3
8 Giving stipend to the poor and talent student 157 52.3
9 Bring all the school in stipend program 112 37.3
10 Modern equipment in classroom (Computer, Multimedia OHP, etc), 125 41.7

Evaluation of the Teaching Quality Improvement in Secondary Education Project
Eusuf and Associates SECTION VI Page 40
Section VI Performance of Classroom Teachers
130. The section is devoted to assess the educational and professional background of the teachers of
the secondary schools, trainings received for their professional developments and methods and
techniques used by them in their class. Contribution of the TQI project in professional development of
the teachers that improved the efforts in the teaching quality has been analysis.
1. Educational and Professional Background of the Teachers
131. Number of school surveyed for the study was 186 and total number of respondent’s teachers of
the surveyed school was 1854. Target to take interview from 10 teachers from each school, but actual
respondents was slightly less than the target. Out of 1,854 teachers 71.57% were male and rest 28.43%
were female. Maximum number of surveyed schools (60.5%) was Private Co-education high schools.
132. It was found that 38.1% of the teachers had master degree in different subjects of arts, science
and commerce and rest 61.9% have bachelor degree. However, master degree among the female
(44.2%) was slightly higher than the male (35.7%) teachers.
133. All of the teachers have M. Ed or B. Ed/ Honours degree. Among them 7.6% female and 7.5%
male received M. Ed degree. So there is no difference in professional degree of the male and female
teachers. In total 1243 (67.0%) teachers received either certificate course or B. Ed degree from the TQI
project. Of them 95.2% received training on certificate courses and rest 4.8% did B. Ed degree. Among
the female teachers 3.4% and male 3.2% got their B. Ed degree through TQI project.
2. Experience of the Teachers
134. An attempt was taken to get an idea about the experience of the teacher of secondary school.
The findings showed that majority (32.65) of the teachers had less than 10 years experience and 2.5%
had more than 35 years experience. Among the female teachers 44.2% had experience less than 10
years compared to 28.0% among the male (Table 6.1). Reason for less experience of the female
teachers might be that female of the country as a whole came to the job in the recent past.
Table 6.1: Total Teaching Experience as Teachers of Secondary School
Years of Experience Male Female Total
Number Percent Number Percent Number Percent
1 Below 10 372 28.0 233 44.2 605 32.6
2 11-15 233 17.6 96 18.2 329 17.7
3 16-20 320 24.1 93 17.6 413 22.3
4 21-25 170 12.8 64 12.1 234 12.6
5 26-30 115 8.7 20 3.8 135 7.4
6 31-35 75 5.7 16 3.0 91 4.9
7 35+ 42 3.2 5 0.9 47 2.5
Total 1327 100.00 527 100.00 1854 100.00
135. Again experience of the teachers in the surveyed school also tired assessed and it was found
that 44% of the teachers had less than 10 years experience in the surveyed school. Among the female

Evaluation of the Teaching Quality Improvement in Secondary Education Project
Eusuf and Associates SECTION VI Page 41
teachers more than half (53.5%) had less than 10 years of experience compared to 40.2% male had
same experience Length of experiences of other teachers in different durations (Table 6.2)
Table 6.2: Teaching Experience in the Surveyed School as Teachers
Years of experience Male Female Total
Number Percent Number Percent Number Percent
1 Below 10 534 40.2 282 53.5 816 44.0
2 11-15 204 15.4 91 17.3 295 15.9
3 16-20 282 21.3 77 14.6 359 19.4
4 21-25 123 9.3 46 8.7 169 9.1
5 26-30 99 7.5 12 2.3 111 6.0
6 31-35 58 4.4 15 2.8 73 3.9
7 35+ 27 2.0 5 0.9 32 1.7
Total 1327 100.0 528 100.0 1855 100.0
3. Training Received from TQI Project
136. The respondents (teachers) mentioned that they received several training from the TQI Project.
The major types training were TOT, CPD-1, CPD-2, digital contents, creative, cluster training, inclusive
education, computer, communication, administration, SBA, CPD (Mathematics), STC, unified education,
preparation of questionnaire, management, LTP, English Language, pre-service, follow up, increase skills,
Lab. Maintenance, etc. The teachers received the training in different venues. The major venues were
TTCs, HSTTIs, NAEM, Out Reach Centers (ORCs), district level hired venues and abroad.
137. It was found that 87.9% of the teachers received the training in the same subject which they
teach in the class. It is 88.4 and 86.7% among the male and female teachers respectively. The findings
indicate that most of the cases the trainings were given to the proper persons.
4. Use of Lesson Plan, Record Keeping and Home Task
138. In this section use of lesson plan and its benefit will be discussed. Before discussing the matters
assessment was done about number of classes was taken by the teachers per week. Because use of
modern techniques depends on the number of classes take by the teachers. It was found that highest
number (around 42%) of both the male and female teachers took 26-30 classes per week. Second
highest number 21 to 25 classes took by 31.5% male and 34.2% female teachers. Around 2% teachers
took 36-40 classes per week (Table 6.3). The above findings show that the teachers of secondary school
take around 5 classes per day which seems to be quit high.
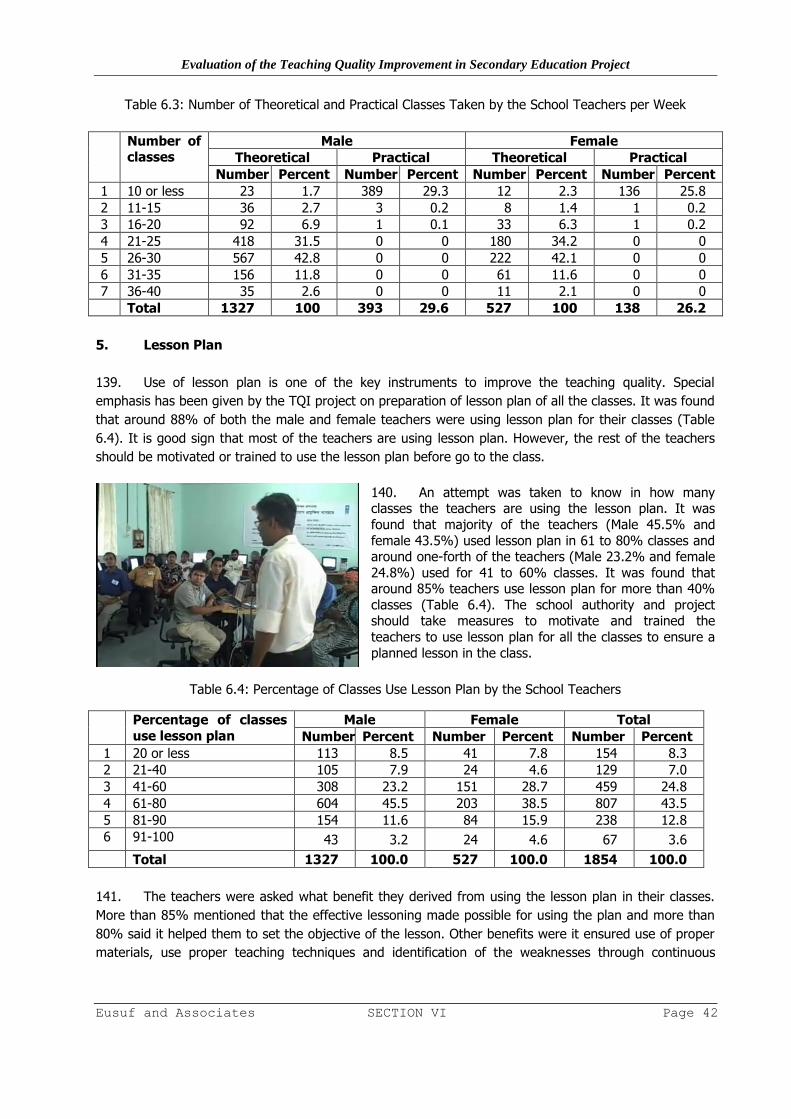
Evaluation of the Teaching Quality Improvement in Secondary Education Project
Eusuf and Associates SECTION VI Page 42
Table 6.3: Number of Theoretical and Practical Classes Taken by the School Teachers per Week
Number of classes
Male Female
Theoretical Practical Theoretical Practical
Number Percent Number Percent Number Percent Number Percent
1 10 or less 23 1.7 389 29.3 12 2.3 136 25.8
2 11-15 36 2.7 3 0.2 8 1.4 1 0.2
3 16-20 92 6.9 1 0.1 33 6.3 1 0.2
4 21-25 418 31.5 0 0 180 34.2 0 0
5 26-30 567 42.8 0 0 222 42.1 0 0
6 31-35 156 11.8 0 0 61 11.6 0 0
7 36-40 35 2.6 0 0 11 2.1 0 0
Total 1327 100 393 29.6 527 100 138 26.2
5. Lesson Plan
139. Use of lesson plan is one of the key instruments to improve the teaching quality. Special
emphasis has been given by the TQI project on preparation of lesson plan of all the classes. It was found
that around 88% of both the male and female teachers were using lesson plan for their classes (Table
6.4). It is good sign that most of the teachers are using lesson plan. However, the rest of the teachers
should be motivated or trained to use the lesson plan before go to the class.
140. An attempt was taken to know in how many classes the teachers are using the lesson plan. It was
found that majority of the teachers (Male 45.5% and
female 43.5%) used lesson plan in 61 to 80% classes and around one-forth of the teachers (Male 23.2% and female
24.8%) used for 41 to 60% classes. It was found that around 85% teachers use lesson plan for more than 40%
classes (Table 6.4). The school authority and project should take measures to motivate and trained the
teachers to use lesson plan for all the classes to ensure a
planned lesson in the class.
Table 6.4: Percentage of Classes Use Lesson Plan by the School Teachers
Percentage of classes
use lesson plan
Male Female Total
Number Percent Number Percent Number Percent
1 20 or less 113 8.5 41 7.8 154 8.3
2 21-40 105 7.9 24 4.6 129 7.0
3 41-60 308 23.2 151 28.7 459 24.8
4 61-80 604 45.5 203 38.5 807 43.5
5 81-90 154 11.6 84 15.9 238 12.8
6 91-100 43 3.2 24 4.6 67 3.6
Total 1327 100.0 527 100.0 1854 100.0
141. The teachers were asked what benefit they derived from using the lesson plan in their classes.
More than 85% mentioned that the effective lessoning made possible for using the plan and more than
80% said it helped them to set the objective of the lesson. Other benefits were it ensured use of proper
materials, use proper teaching techniques and identification of the weaknesses through continuous

Evaluation of the Teaching Quality Improvement in Secondary Education Project
Eusuf and Associates SECTION VI Page 43
evaluation. More than 60% of the respondents made the comments of the benefit of the lesson plan
(Table 6.5).
Table 6.5: Benefit of Lesson Plan in Presentation in the Class
Benefits of use of lesson plan
Male Female
Number % Number %
1 Setting the lesson objective before lesson 959 82.5 386 82.7
2 Effective lessoning made possible 1008 86.7 400 85.7
3 Ensuring use of the materials 846 72.8 320 68.5
4 Identifying weakness through continuous evaluation and
removes weakness 725 62.4 299 64.0
5 Effective lessoning by using proper teaching technique 640 55.1 281 60.2
6 Giving relevant homework for innovative development
of the student 626 53.9 267 57.2
142. Broken down the lesson time is one of the important
steps of preparing the lesson plan. More than 91% of the
teachers of both the sex mentioned that in the lesson plan
they broke down the lesson time.
143. It was tried to find out the benefit got by the
teachers for breaking the lesson time. More than 72% of both the male and female teachers mentioned it helped
them to practice all the steps and use effective methods and
techniques. More than 65% said that it facilitated for using proper materials and giving feedback to the students by
making proper evaluation. More than 50% mentioned that it benefited to complete all the steps of the lesson in time and help this to motivate the students and
developed leadership among them through group work (Table 6.6).
Table 6.6: Ways of Helping the Effective Lesson Due to Broken down of Lesson Time
Ways of helping Male [n=1327] Female [n=527]
Number Percent Number Percent
1 Practicing all the steps 972 73.2 379 71.9
2 Using effective methods and techniques 999 75.3 400 75.9
3 Using proper teaching materials 875 65.9 343 65.1
4 Making proper evaluation and giving feed back 828 62.4 355 67.4
5 Motivating the student and developing leadership
through group presentation 781 58.9 328 62.2
6 Completing all the steps of lesson in time 681 51.3 279 52.9
6. Record Keeping
144. Record keeping of the student’s performance is very much instrumental to help the students for
improving their performance. So it was tried to get an idea how far the teachers are using the techniques
and in what extent they are getting benefit from this exercise. Around 88% of the teachers of both the
sex mentioned that they were using records of their students’ achievement and progress (Table 6.7).

Evaluation of the Teaching Quality Improvement in Secondary Education Project
Eusuf and Associates SECTION VI Page 44
145. The teachers were asked what types benefits they got from keeping record of their students.
Among the female teachers 46.5% and male 39.1% mentioned that record helped them to improve the
quality of their students by giving feedback them from the records. Among male teacher’s 26.4% and
female 24.3% used the records to give the progress to the guardians to take care of their children.
Around 20% male and 17% female teachers used the record for improving their lessons (Table 6.7).
Table 6.7: Use of the Record of Achievements and Progress of the Student
Use of records Male [n=1327] Female [n=527]
Number Percent Number Percent
1 Helping to improve educational quality of
the student through feed back 519 39.1 245 46.5
2 Improving the lesson of the teacher by
evaluating own teaching techniques 267 20.1 88 16.7
3 Awarding the guardian to teach their
children by getting progress report 350 26.4 128 24.3
4 Use in quality development of the students 14 1.1 3 0.6
7. Home Work
146. Giving homework to the students is a widely used and effective method to get feedback about
the understanding of the students of the subjects. About half of the teachers gave homework every day
and around one-fourth gave weekly thrice. Among male 6.9% and female 4.2% give the homework
occasionally. Other gave it once in a week, or weekly four times (Table 6.8).
Table 6.8: Frequency of Giving Students Home Tasks
Frequency of giving home tasks Male Female
Number Percent Number Percent
1 Every day 656 49.4 258 49.0
2 Weekly once 143 10.8 58 11.0
3 Weekly thrice 310 23.4 129 24.5
4 Weekly four time 127 9.5 60 11.3
5 Sometime 91 6.9 22 4.2
Total 1327 100.0 527 100.0
8. Use of Techniques for Ethnic Students and Gender Sensitive
147. In some of the survey schools ethnic students are available. Around 42% of the respondents
teachers informed that ethnic students were available in there class. Students of the ethnic communities
need special methods and techniques to teach them. Among the male teachers 67.9% and female
teachers 64.3% said that they used special methods and techniques for the students of the ethnic
community.
148. Now a day’s use of gender sensitive materials is given special attention to minimize the gender
disparity from the society. It was found that 38.4% of the male teachers and 33.6 female teachers used

Evaluation of the Teaching Quality Improvement in Secondary Education Project
Eusuf and Associates SECTION VI Page 45
gender sensitive materials (Table 6.19). Findings indicate that male teachers are using more gender
sensitive materials than the female. However, the different is not at significant level. This area should be
given more attention.
9. Use of Teaching-Learning Materials
149. Use of teaching materials in the classroom makes the class more attractive and effective to learn.
It was found that Most of the teachers (male 97.6%
and female 95.1%) were using the materials like map, chart and diagram. Model also used by more than 70%
of the teachers. Use of computer was around 12% which is very much encouraging. Slide also used by
13.5% male and 9.3% female teachers. Other materials like slide projector, overhead projector, etc were also
used by a very insignificant number of teachers (Table
6.9).
Table 6.9: Use of the Materials and Equipment in the Class
Name of materials and equipment Male Female
Number Percent Number Percent
1 Map/Chart/Diagram 1295 97.6 501 95.1
2 Model 967 72.9 370 70.2
3 Slide 179 13.5 49 9.3
4 Slide Projector 53 4.0 15 2.8
5 Overhead Projector 31 2.3 10 1.9
6 Computer 157 11.8 65 12.3
7 Use no materials or equipment 23 1.7 7 1.3
150. Benefit of using the teaching materials was also assessed. Around 92% of the teacher of both
sex said that by using teaching materials the lesson became effective and easier to understand by the
students. More than 83% mentioned that the teaching materials helped the students to get the clear
concept of the subjects. Around 60% said that it facilitates to present more contents in short time and it
help to enter in the depth of the subjects (Table 6.10).
Table 6.10: Benefit of Using the Teaching Materials and Equipment
Benefits of using teaching materials and equipment
Male Female
Number Percent Number Percent
1 Lessoning became easier and effective 1224 92.2 484 91.8
2 Getting clear concept about the subject 1112 83.8 450 85.4
3 Making the unclear concept to clear 827 62.3 351 66.6
4 Present more things in short with deep concept 783 59.0 307 58.3
5 It is long lasting, can understand well 24 1.8 10 1.9
10. Sharing Knowledge of TQI among the Teachers
151. Sharing of knowledge of the TQI training is one of the most important aspects to update the
knowledge of the teachers. It is a continuous process to help each other and update knowledge and skill
of the teachers. More than 91% of both the male and female teachers said that they shared their
training knowledge with other colleagues.

Evaluation of the Teaching Quality Improvement in Secondary Education Project
Eusuf and Associates SECTION VI Page 46
152. It was tried to assess the benefits of sharing the knowledge. Opinion of majority of the teachers
(male 88.2% and female 86.3%) that it helped them to develop their skill within the institute. Second
highest majority (77.4% male and 75.6% female) mentioned that it contributed in developing their class
teaching. A good number of the teachers (Around and more than 70%) said that it helped to develop
helping attitude among each other and increase confidence of own knowledge and skill. The above
findings indicate that sharing of training knowledge is very import for the teachers to build up
themselves as a team and improve their individual skill and knowledge (Table 6.11).
Table 6.11: Contribution of Knowledge Sharing in Professional Development of
Colleagues on Teaching
Contribution in knowledge sharing Male Female
Number Percent Number Percent
1 Developing professional skill within the institute 1076 88.2 417 86.3
2 Developing the class teaching 944 77.4 365 75.6
3 Increasing confidence in own knowledge and skill 840 68.9 337 69.8
4 Developing helping attitude among the colleague 871 71.4 357 73.9
5 Others 12 1.0 6 1.2
11. Evaluation of Teachers Performance
153. Teacher’s performance evaluation is one of the important mechanisms to help them in
developing their skill and knowledge by identifying the strong and week areas. More than 96% of the
respondents said that their Head Teacher do the performance evaluation of the teacher’s regular basis.
154. The teachers who mentioned that their performance was evaluated, among them views of
around 70%, 20% and 10% said that it encouraged them by getting positive comments and
suggestions, comments of Head Teacher’s helped them to corrects the mistakes and help to improve the
future lesson respectively (Table 6.12).
Table 6.12: Influence of the Evaluation of the Head Teacher on Teaching Learning
Influence of Evaluation Male Female
Number Percent Number Percent
1 Encouraging the positive comments and suggestion 867 67.9 359 70.0
2 Helping to correct my mistakes 276 21.6 102 19.9
3 Helping to improve the future lesson 130 10.2 49 9.6
4 Other 4 0.3 3 0.6
12. Teaching subjects and Use of Training before and after TQI Training
155. It was tried to find out in the survey whether any changes in teaching subjects of the teachers
after getting subject-wise training through TQI project. No significant changes were found in teaching
subjects of the teachers after getting training from TQI except economics and social sciences (Table
6.13). A big change of teaching subjects in economics and social sciences were found. This might be due
to changes in syllabus of these two subjects.

Evaluation of the Teaching Quality Improvement in Secondary Education Project
Eusuf and Associates SECTION VI Page 47
Table 6.13: Teaching Subjects before TQI Project and Presently
Subject Male Female
Before Project Presently Before Project Presently
Number Percent Number Percent Number Percent Number Percent
1 Bengali 501 37.8 501 37.8 285 54.1 309 58.6
2 Mathematics 484 36.5 484 36.5 89 16.9 87 16.5
3 English 413 31.1 426 32.1 158 30.0 161 30.6
4 Agriculture 193 14.5 190 14.3 41 7.8 47 8.9
5 Geography 119 9.0 126 9.5 54 10.2 47 8.9
6 Chemistry 170 12.8 171 12.9 24 4.6 25 4.7
7 Physics 164 12.4 166 12.5 22 4.2 21 4.0
8 Biology 136 10.2 135 10.2 42 8 44 8.3
9 Higher Mathematic 94 7.1 93 7.0 12 2.3 10 1.9
10 Economics 43 3.2 275 20.7 27 5.1 200 38.0
11 Social Science 58 4.4 282 21.3 33 6.3 205 38.9
12 Home Economics 19 1.4 22 1.7 102 19.4 102 19.4
13 Religion 230 17.3 239 18.0 79 15.0 78 14.8
14 Management 33 2.5 31 2.3 13 2.5 12 2.3
15 Accounting 80 6.0 82 6.2 20 3.8 20 3.8
16 Computer 61 4.6 63 4.7 34 6.5 37 7.0
17 Business Education 70 5.3 74 5.6 27 5.1 27 5.1
18 History 115 8.7 118 8.9 69 13.1 64 12.1
156. Training received by the teachers in their own subject is very much important for their
professional development. It was found that around 18% of the teachers got training on specific
subjects before the TQI project and it had been sharply increased to more 86.1% of the male and 83.7%
to female (Table 6.14). It is a very good achievement of the TQI project to provide specific training for
the teachers to improve their knowledge and skill in their own subject.
157. It was found that more than 82% of the teacher received training on Continuous Professional
Development (CPD) which indicates the trust of the TQI project on the teaching quality improvement of
the teachers. Cluster training also received by around 24% of the teachers. This training is sharing of
knowledge and skill among the teachers at local level who received training from the training institute.
However, around 7% of the teachers received TOT who will work as trainer in their areas (Table 6.14).
Table 6.14: Training Received by the School Teachers from TQI Project inside the Country
Type of training
received
Male Female Total
Number Percent Number Percent Number Percent
1 Certificate Course 232 17.5 101 19.2 333 18.0
2 TOT 101 7.6 34 6.5 135 7.3
3 CPD 1096 82.6 432 82.0 1528 82.4
4 Clustered 441 33.2 191 36.2 632 34.1
Evaluation of the Teaching Quality Improvement in Secondary Education Project
Eusuf and Associates SECTION VI Page 48
158. There is a provision of foreign training as incentive for those teachers who showed excellent
performance. The findings showed that 14 male and 9 female teachers received foreign training of the
surveyed schools. Among them 4 male and 1 female did mater degree and rest 10 and 8 participated in
certificate courses respectively. Findings showed that 1.1% male and 1.7% female teachers received
foreign training from TQI project.
159. Among the teacher who received training 89.5% and 87.9% female stated the training of TQI as
effective. However, 19.1% male and 21.6% female teachers among those who received training before
TQI project said the trainings were effective and rest of them stated the trainings as not effective one.
This indicates that the effectiveness of the TQI training is much higher than the training providing before
(Table 6.15).
160. The teachers were asked how far the trainings of TQI and previous training were effective.
Among the male teachers who received TQI and those who received training before TQI project graded
the trainings as very much effective by 36.4 and 17.0% respectively. Same comment was given by
33.9% and 13.2% female teacher respectively. Majority of the both the male (56.4%) and female
(53.8%) teachers teacher said the TQI trainings were effective and 43.5% and 40.4% of the teachers
mentioned training before the TQI project also effective (Table 6.15). The findings indicate the training
of TQI was more effective than before.
Table 6.15: Degree of Effectiveness of the Training Received by the School Teachers
Effectiveness
Male Female
Before Project Presently Before Project Presently
No. % No. % No. % No. %
1 Very much effective 43 17.0 433 36.4 15 13.2 157 33.9
2 Effective 110 43.5 670 56.4 46 40.4 249 53.8
3 Less effective 38 15.0 16 1.3 14 12.3 13 2.8
4 Effective in some cases 60 23.7 69 5.8 39 34.2 43 9.3
5 Not effective at all 2 0.8 0 0 0 0 1 0.2
161. It was tried to identify the helping areas of the training. More than 65% of the teachers of both
the sex mentioned that TQI training helped them in using modern methods, preparing lesson plan,
developing teaching materials and use them, increasing knowledge in the subject. More than 60% made
the statement that they learned the participatory learning process of the student through group work. A
good number (More than 40%) also learned innovative methods, assessment techniques, assessing
student’s competence and techniques to build good relationship with the students. However, less than
10% of the teachers mentioned about development of the mentioned areas from training received before
the TQI projects. This indicates a great achievement of TQI project in improving teaching techniques and
methods and learning process in the secondary education (Table 6.16).

Evaluation of the Teaching Quality Improvement in Secondary Education Project
Eusuf and Associates SECTION VI Page 49
Table 6.16: Helping the Lesson Areas of Effective Training
Helping Areas Male Female
Before TQI Presently Before TQI Presently
No. % No. % No. % No. %
1 Teaching in modern method 78 5.9 1033 77.8 31 5.9 404 76.7
2 Preparing lesson plan 107 8.1 1012 76.3 38 7.2 370 70.2
3 Preparing and using the
teaching materials 72 5.4 896 67.5 37 7.0 344 65.3
4 Developing subject-wise
knowledge 107 8.1 901 67.9 33 6.3 342 64.9
5 Learning innovative methods 56 4.2 534 40.2 25 4.7 201 38.1
6 Assessing the methods
students competency 57 4.3 668 50.3 25 4.7 259 49.1
7 Participating the student in
learning process 92 6.9 794 59.8 63 12.0 337 63.9
8 Using different assessment
methods 32 2.4 529 39.9 11 2.1 233 44.2
9 Making good relationship with
the students 78 5.9 611 46.0 59 11.2 289 54.8
10 Others 3 0.2 21 1.6 3 0.6 8 1.5
162. Those who did not thought the training were not effective they were asked to mention the
reason behind it. A few of them ( Around 1% ) said there is no scope of use the methods in the school,
school does have fund to effort the cost of the materials, head teacher/SMC/ guardian do not interested
to use the methods, the methods can not use for the irregular attendance of the students, etc. (Table
6.17). The reasons mentioned above seem to be lame excuse to not use the methods.
Table 6.17: Reasons for ineffectiveness of the Training
Reasons for
ineffectiveness
Male Female
Before TQI Presently Before TQI Presently
No. % No. % No. % No. %
1 No Scope in the school to
use the training skill 26 2.0 16 1.2 2 0.4 12 2.3
2 School does not have fund
for effort the cost of
training materials
10 0.8 13 1.0 2 0.4 7 1.3
3 Head Teacher/SMC/
Guardian do not interested
to use the new methods
3 0.2 8 0.6 0 0.0 1 0.2
4 Irregular presence of the
student in the class 6 0.5 13 1.0 1 0.2 6 1.1
5 Very difficult to use the
methods 19 1.4 4 0.3 1 0.2 3 0.6
6 Other 0 0.0 6 0.5 0 0.0 3 0.6
Evaluation of the Teaching Quality Improvement in Secondary Education Project
Eusuf and Associates SECTION VI Page 50
163. It was tried to assess the improvement of the quality and performance of the students after
receiving training by the teachers. More than 88% of teachers of both the sex stated that quality and
performance of the students improved after they got training from TQI project. However, same
statement also given about the training received before TQI project by 25.9% male and 29.8% female
teachers. That means all the trainings have a benefit, but the benefit came from TQI project much
higher than before. Areas of improvement are getting more concepts about the subject, can speak and
write more about the subject, can give right answer of the question, can participate in discussion, and
can help the classmate in group work. Distribution of opinion about quality of education of students is at
table 6.18.
Table 6.18: Areas of Quality Improved of the Student after Receiving Training by the Teachers
Areas of quality improved of
student
Male Female
Before Project Presently Before Project Presently
No. % No. % No. % No. %
1 Getting more concept about the
subject 109 31.7 505 43.2 47 29.9 259 55.7
2 Can speak more about the
subject 122 35.5 443 37.9 53 33.8 232 49.9
3 Can write more about the subject 70 20.3 285 24.4 37 23.6 175 37.6
4 Can give right answer of the
question 99 28.8 300 25.6 44 28.0 117 25.2
5 Can participate in discussion 93 27.0 219 18.7 59 37.6 129 27.7
6 Can help the classmate in group
work 31 9.0 164 14.0 15 9.6 94 20.2
7 Other
164. Some of them provided opinion about not improving quality of the students after the teachers
receiving training from TQI. The mentioned some reasons in favor of their opinion. These reasons are
students are not interested in new method of teaching, irregular presence of most of the students in the
class, no scope of interaction due to large size of class and students are more interested in private tutor
rather than classroom teaching.
165. The teachers were asked to mention the indicators to assess the improvement of the students.
More than 75% of both the male and female teachers mentioned that after TQI training the had able to
make then spontaneous participation in group work, doing the home work properly, result of tutorial
examination and solving the problems in the class. Other indicators are result of school and public
examinations. However, before the TQI project the participation of the student was below 10% and
other ranges from 7.6% to 25.2% (Table 6.19). That means the TQI project has given a thrust in
educational system and improvement of result in the public and school examinations.
Evaluation of the Teaching Quality Improvement in Secondary Education Project
Eusuf and Associates SECTION VI Page 51
Table 6.19: Methods of Assessing the Improvement of the Student by the Teachers
Methods of assessing Male Female
Before TQI Presently Before TQI Presently
No. % No. % No. % No. %
1 Participating spontaneous in
discussion 93 7.0 1004 75.7 51 9.7 436 82.7
2 Doing the home work 303 22.8 1033 77.8 133 25.2 434 82.4
3 Conducting tutorial
examination 206 15.5 1035 78.0 76 14.4 437 82.9
4 Solving problems in the class 181 13.6 997 75.1 108 20.5 405 76.9
5 Assessing through school
examination 187 14.1 728 54.9 68 12.9 284 53.9
6 Assessing through the public
examination 101 7.6 381 28.7 41 7.8 154 29.2
7 Others 12 0.9 48 3.6 5 0.9 18 3.4
166. The teachers were asked about the use of skill and knowledge thy received fro the training.
Among the male 86.7% and female 63.9% said that they are using all the skill and knowledge they are
using which learned from TQI training. In the other hand, only 11.2% male and 11.8% female could use
the skill and knowledge which they gathered from the training before TQI project.
167. Around 10% of the teachers gave the reasons for not using the skill of TQI project were scarcity
of teaching materials, insufficient classroom facilities and large class size. A few of them stated the
reasons like no facilities of group work, lack of supports from the authority and low attendance of the
students. However, as very limited number of the teacher used the skill of knowledge received before
TQI project, so their statement is not so important (Table 6.20).
Table 6.20: Reasons for Not Using the Skill and Knowledge Received from the Training
Reasons for not using skill
and knowledge
Male Female
Before TQI Presently Before TQI Presently
No. % No. % No. % No. %
1 Scarcity of teaching materials 42 3.2 145 10.9 18 3.4 54 10.2
2 Insufficient facilities in the
classroom 47 3.5 157 11.8 20 3.8 62 11.8
3 Large number of students in the
class 27 2.0 144 10.9 12 2.3 52 9.9
4 No facilities for group work 34 2.6 87 6.6 16 3.0 28 5.3
5 Lack of support form the
authority 10 0.8 38 2.9 2 0.4 10 1.9
6 Low attendance in the class 7 0.5 26 2.0 1 0.2 8 1.5
168. Remarkable changes in the classroom found by the teachers are participation in group work
(male 89.7% and female 88.4%); participate in group work by turn around (male 75.1% and female
72.5%), leadership development through presentation (male 56.9% and female 58.6%) (Table 6.21).

Evaluation of the Teaching Quality Improvement in Secondary Education Project
Eusuf and Associates SECTION VI Page 52
Table 6.21: Remarkable Changes in the Classroom as the Effect of TQI Project
Changes in the Classroom Male Female
No. % No. %
1 Participation of the student in group work 1190 89.7 466 88.4
2 Turn around to participate in group work 997 75.1 382 72.5
3 Leadership development through presentation of work 755 56.9 309 58.6
4 Other (Please specify) 24 1.8 13 2.5
Note: Percentage of all the teachers.
169. Group work is a very strong method of learning and sharing knowledge, so the teacher was
asked to get their observation and experiences of group work. More than 86% mentioned that it
encourage the learning. More than 61% stated that group work develop the confidence among the
student, innovate the new things, leadership develop through work each other, create helping attitudes
and the week student learn from their talented classmates (Table 6.22).
Table 6.22: Learning Process of the Student through Group Work
Learning Process Male Female
No. % No. %
1 Encouraging in Learning 1142 86.1 454 86.1
2 Developing the confidence 880 66.3 347 65.8
3 Innovating the new things 812 61.2 331 62.8
4 Developing the leadership 816 61.5 324 61.5
5 Developing the helping attitude 860 64.8 366 69.4
6 Less talented students learn from talented students 861 64.9 360 68.3
170. At the end the teacher were asked to give their recommendation to improve the teaching quality
of the school. They made a number of recommendations. Majority of them (Around 60%) emphasized on
the development of the teacher through continuous training. An important recommendation made by
around 45% of the teacher that the difference treatment between the urban and rural school should be
minimized. They also gave importance to provide training materials (More than 40%) and prepare
training materials by the teachers and students. A good number of teachers also had given emphasis to
prepare themselves for the class. Other recommendations are improve facilities of TTCs, provide
incentive package for the good teachers by assessing the performance through public examinations, etc
(Table 6.23).

Evaluation of the Teaching Quality Improvement in Secondary Education Project
Eusuf and Associates SECTION VI Page 53
Table 6.23: Recommendations of the Teachers to Improve Teaching Quality of the School
Recommendations Male Female
No. % No. %
1 Improving the practical teaching 349 26.3 117 22.2
2 Improving the capacity of TTC and providing continuous support 195 14.7 79 15.0
3 Providing training on teaching materials development to the
teacher 577 43.5 215 40.8
4 Developing skill of the teacher through continuous training 764 57.6 320 60.7
5 Providing package of incentive for the good teachers by
assessing the result of public examination 211 15.9 86 16.3
6 Participating both the teachers and students in Development of
teaching materials 293 22.1 129 24.5
7 Minimizing the difference of teaching facilities between the
rural and urban areas 613 46.2 237 45.0
8 Increasing the school libraries and collection of books 141 10.6 59 11.2
9 Taking care by the teachers for preparing themselves 506 38.1 189 35.9
10 Other 128 9.6 78 14.8
13. Performance of Trained Classroom Teachers - Feedback on Classroom Observation
171. The team of consultants observed class during teaching by the teachers of the respective
schools. During the classroom observation a number of items were noticed in light with the objectives of
the Teaching Quality Improvement in the Secondary Education Project. In total 34 classes were observed
during the study period. Out of these observation two classes of Government boys high schools, six
classes of government girls high school, one of government coeducation high school, one class of private
boys high school, nine classes of private girls high schools and 15 classes of private coeducation high
schools. The observed feedback is presented in the following paragraphs.
14. Conduction of Class
172. Most of the teachers (91%) attended in the class timely. About 62% classes the students
submitted the previous home tasks in the class. All the teachers with a few exceptions were well
dressed. Presentation of about one third of the teachers was very attractive while presentation of half of
the observed teachers was good and that of rest of the teachers was more or less good and not good.
More than three quarters of the teachers highlighted the objectives of the session relating the previous
lesson nicely.
Presentation
173. Quality of delivery of the majority teachers in the classroom was good while delivery of some
teachers (35%) was very good. Delivery of about 9% teachers was more or less good and that of 3%
teachers was not good. Picture of movement of the teachers in the classrooms was followed almost the
same pattern of delivery in the classroom. Good attraction of students in about 91% classes was created
due to movement of teacher in the classroom.

Evaluation of the Teaching Quality Improvement in Secondary Education Project
Eusuf and Associates SECTION VI Page 54
174. All teachers except a few used black board in the classroom. The observers noticed the quality of
using blackboard. They noticed clearness of writing, margin, space, size of writing words, correctness of
writing, sufficiency of writing and pictures use in board. In most of the classes the teachers used the
board properly. Quality of use the black board in the classroom is at table 6.24.
Table 6.24: Quality of Using the Black Board in the Classroom
Quality Clearness of
writing [n=33]
Margin/space/
size of writing
words [n=33]
Correctness of
writing [n=33]
Sufficiency of
writing and pictures
use in board [n=33]
Number Percent Number Percent Number Percent Number Percent
1 Very good 10 30.3 13 39.4 25 75.8 5 15.2
2 Good 20 60.6 15 45.5 7 21.2 24 72.7
3 More or less good 2 6.1 4 12.1 1 3.0 4 12.1
4 Not good 1 3.0 1 3.0 0 0 0 0
Use of Teaching Materials
175. Use of teaching materials in the classroom is one of the objectives of the project. About two-
thirds of the teachers used teaching materials in the classroom. The used teaching materials included
chart, poster, model, leaflet, picture and practical materials but in most cases chart and posters were
used. The observers assessed the relevancy of the used materials in terms of the topics taught in the
class and found that (87%) teaching materials were relevant and the rest was more or less relevant.
They also assessed the level of attraction of the students in the classroom towards the used teaching
materials. About one-fourth classes, level of attraction was very good and half of the classes were good
and in the rest of the classes it was more or less good.
Method used
176. The teachers used multiple methods of presenting the lesson in the classroom. The used
methods were lecture, discussion, individual work, group work and demonstration. Among the methods
lecture and discussion were common. Group work was more than individual work. This is one of the new
styles of teaching introduced during the project implementation period. Methods used by the teacher for
presenting the lesson in the class are at table 6.25. All the methods were very good and good as
assessed by the observers.
Table 6.25: Methods Used by the Teacher for Presenting the Lesson
177. Use of modern equipment (overhead projector) was found only in two classes and effect of using
modern equipment was very good in one class and good in another class. Quality of demonstration in
the class was good and more or less good in most of the classes while demonstration in one class was
not good.
Methods used Number) [n=34] Percent
1 Lecture 23 67.6
2 Discussion 27 79.4
3 Individual work 15 44.1
4 Group work 24 70.6
5 Demonstration 5 14.7

Evaluation of the Teaching Quality Improvement in Secondary Education Project
Eusuf and Associates SECTION VI Page 55
Participation
178. About two-third teachers provided scope to the students for participation while in the rest of the
teachers did not provide scope to the students for participation. Techniques of participation was question
and answer session, individual assignment, group activities, providing writing assignment, thorough
discussion, presentation by students, role play, giving exercise on Mathematics in exercise book, giving
exercise on Mathematics on black board warming or refreshing sessions. Pattern of participation is at
table 6.26.
Table 6.26: Type of Participation of the Student in the Lesson
Type of participation Number [n=25] Percent
1 Question and answer session 19 76.0
2 Individual assignment 7 28.0
3 Group activities 11 44.0
4 Giving writing assignment 9 36.0
5 Thorough discussion 1 4.0
6 Presentation by students 1 4.0
7 Role play 1 4.0
8 Giving exercise on Math in exercise book 3 12.0
9 Giving exercise on Math on black board 2 8.0
10 Warming or refreshing sessions 1 4.0
179. In about one third classes most of the students
asked questions to the teacher and another one-third
classes a good numbers of students asked questions while about one-tenth classes students did not ask
questions at all. The teachers provided instruction for performing group work to the students and the
observers assessed the instruction in terms of clearness and simplicity. The instruction was clear and
simple for about 50% of the concerned teachers.
During group work teachers supervised the work and provided instruction as needed and provided scope for
presentation of group work in about 50% cases. All the group works were presented in the class in front of all the students in the class. The remarkable areas of group work were presentation of written output,
participation of other students and comments given by the students. Presentation was good in most of
the cases. In all the observed classes the participation was very good.
180. Level of participation and interaction of the student in the lesson was generally good in most of
the classes. Teachers were attentive to listen to the question and answers of the students in 85%
classes. The answers of the questions were appropriate in about 80% classes. Relationship between
teachers and students in the class was found very good and good in about 82% classes. The teachers in
most (77%) of the classes could make the students attentive to their lessons and completed the lesson
timely in 85% classes. It was noticed during observation that 88% teachers could make the students
interested to know more at the end of the class. Their level of interest made was very good and good. In
some classes the teachers could not make the students interested to know more at the end of the class.
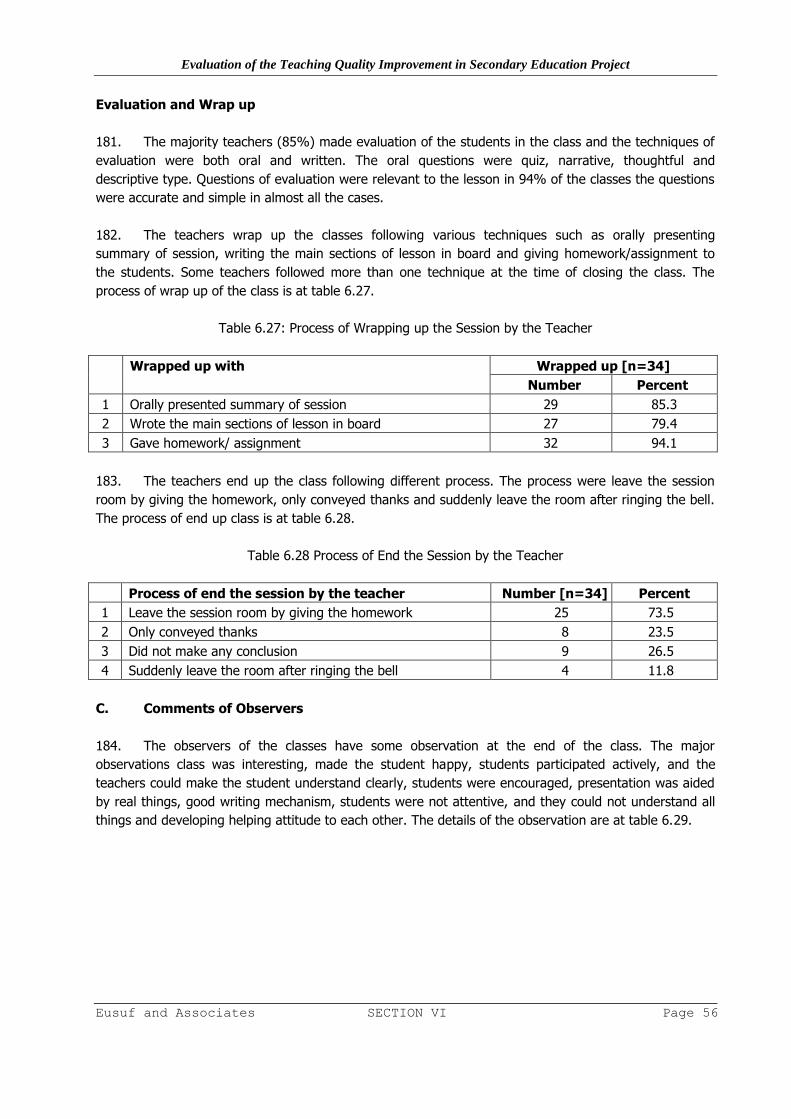
Evaluation of the Teaching Quality Improvement in Secondary Education Project
Eusuf and Associates SECTION VI Page 56
Evaluation and Wrap up
181. The majority teachers (85%) made evaluation of the students in the class and the techniques of
evaluation were both oral and written. The oral questions were quiz, narrative, thoughtful and
descriptive type. Questions of evaluation were relevant to the lesson in 94% of the classes the questions
were accurate and simple in almost all the cases.
182. The teachers wrap up the classes following various techniques such as orally presenting
summary of session, writing the main sections of lesson in board and giving homework/assignment to
the students. Some teachers followed more than one technique at the time of closing the class. The
process of wrap up of the class is at table 6.27.
Table 6.27: Process of Wrapping up the Session by the Teacher
Wrapped up with Wrapped up [n=34]
Number Percent
1 Orally presented summary of session 29 85.3
2 Wrote the main sections of lesson in board 27 79.4
3 Gave homework/ assignment 32 94.1
183. The teachers end up the class following different process. The process were leave the session
room by giving the homework, only conveyed thanks and suddenly leave the room after ringing the bell.
The process of end up class is at table 6.28.
Table 6.28 Process of End the Session by the Teacher
Process of end the session by the teacher Number [n=34] Percent
1 Leave the session room by giving the homework 25 73.5
2 Only conveyed thanks 8 23.5
3 Did not make any conclusion 9 26.5
4 Suddenly leave the room after ringing the bell 4 11.8
C. Comments of Observers
184. The observers of the classes have some observation at the end of the class. The major
observations class was interesting, made the student happy, students participated actively, and the
teachers could make the student understand clearly, students were encouraged, presentation was aided
by real things, good writing mechanism, students were not attentive, and they could not understand all
things and developing helping attitude to each other. The details of the observation are at table 6.29.

Evaluation of the Teaching Quality Improvement in Secondary Education Project
Eusuf and Associates SECTION VI Page 57
Table 6.29: At the End of the Session Remarkable Reaction Observed by the Observer of the Session
Observation Number [n=34] Percent
1 Class was interesting, made the student happy 19 55.9
2 Active participation 9 26.5
3 The teacher could make the student understand clearly 6 17.6
4 Students were encouraged 8 23.5
5 Presentation was aided by real things 2 5.9
6 Good writing mechanism 1 2.9
7 Students not attentive could not understand all things 2 5.9
8 Development of helping attitude to each other 1 2.9
1. Teaching Quality Index
185. Education quality is the ultimate result of significant contribution by each stakeholder in an
education system. Teachers’ quality has direct bearing on improving and sustaining quality in education.
There are several quality attributes that influence the efficiency of a potential teacher while guiding
his/her students towards a positive and value added academic outcome. Different attributes may have
different weightage according to their priority of significance while evaluating quality of a teacher. In the
present study multi-criteria-decision making is used in order to evaluate performance of a teacher. The
teaching quality index is measured using five point scale. Overall teaching quality index is found 3.86
while this is 4.04 for male teachers and 3.56 for female teachers. During baseline survey the teaching
quality index was 2.36 for male and 1.91 for female teachers (page 38 of baseline report). Remarkable
improvement in teaching quality index is noticed during the evaluation survey.
2. Strengths and Weaknesses
186. The observers have assessed the strengths of the observed classes. The strengths included
teachers were good in English, behavior with the students was excellent, teacher was good and skilled,
performed question-answer session smoothly, presentation systems were introduced, mode of speaking
was good, discussed in details and writing on the board. The strengths are at table 6.30.
Table 6.30: Comments of the Observers about Strengths of Teaching of the Teacher
Observers Comments Number [n=34] Percent
1 Good in English 2 5.9
2 Behavior with the students were excellent 3 8.8
3 Teacher was good and skilled 11 32.4
4 Performed question-answer session smoothly 2 5.9
5 Presentation systems were introduced 10 29.4
6 Mode of speaking was good 5 14.7
7 Discussions ere in details 2 5.9
8 Writing on the board 6 17.6
9 Students were not attentive 2 5.9

Evaluation of the Teaching Quality Improvement in Secondary Education Project
Eusuf and Associates SECTION VI Page 58
187. The observers have assessed the weaknesses of the observed classes. The weaknesses included
less materials were used, weak in English speaking, made hurry to teach in the class, lesson plan was
not prepared, weak in time management, students were not attentive, teacher himself wrote on the
board, he did not give scope of discussion, teacher did not attend the class in time and many students
could not understand the lesson. During baseline survey there was little evidence of lesson planning and
additional teaching and learning resources were scarce (page 38 of Baseline Survey Report, 2007). The
details of the weakness are at table 6.31.
Table 6.31: Comments of the Observers about Weakness of Teaching of the Teacher
Observers Comments Number [n=34] Percent
1 Less materials were used 8 23.5
2 Weak in English speaking 2 5.9
3 Made hurry to teach the class 2 5.9
4 Lesson plan was not prepared 3 8.8
5 Weak in time management 4 11.8
6 Students were not attentive 2 5.9
7 Teacher wrote on board, did not give scope of discussion 2 5.9
8 Teacher did not attend the class in time 4 11.8
9 Many student could not understand the lesson 2 5.9

Evaluation of the Teaching Quality Improvement in Secondary Education Project
Eusuf and Associates SECTION VII Page 59
Section VII Perceptions of the Students about Improvement of the Teaching-Learning in School
188. The team of consultants desired to assess the impact of TQI on students of the secondary
schools and accordingly interviewed 1855 students of class six to ten. Out of theses students 327 were
of class six, 390 were of class seven, 385 were of class eight, 372 were of class nine and 381 were of
class ten. Group of students are not applicable for class six to eight. Among the students of class nine
and ten 342 were of science group, 229 were of arts group and 182 were of commerce group.
189. The students opined that the teachers followed various techniques of teaching. These techniques
are lecture, question-answer, discussion, story telling, role play, pair learning, participation in lesson,
learning by doing, lesson by using materials, observation on participation in work and observation on
participation in group work. More than three-fourth (76%) students opined in favor of discussion
followed by question and answer (68%), lecture (55%). Role play, participation in lesson and use of
materials are inadequate. These methods and techniques lead the students towards self leaning. The
details of techniques used by teachers are at table 7.1.
Table 7.1: Lesson Techniques Used by the Teachers
Techniques used Number [N=1855] Percent
1 Lecture 1026 55.3
2 Question-answer 1262 68.0
3 Discussion 1418 76.4
4 Story 606 32.7
5 Role play 169 9.1
6 Pair learning 698 37.6
7 Scope of participation in lesson 436 23.5
8 Learning by doing 855 46.1
9 Lesson by using materials 587 31.6
10 Observation on participation I work 417 22.5
11 Observation on participation in group work 571 30.8
190. The students opined that the methods used by the teachers in the classroom help them in
learning. The ways of help are active participation in lesson, help in understanding the lesson easily,
good relationship and helping attitude with the classmates, scope of exposing the weakness in group
work and increasing self confidence. About 93% students opined that they are benefited in
understanding the lesson easily followed by active participation in lesson. Working environment in the
class and creating interest in undertaking practical job outside the class. In these ways they are learning
by doing and with the help of teacher they can develop a clear understanding of the lesson. Ways of
help are at table 7.2.
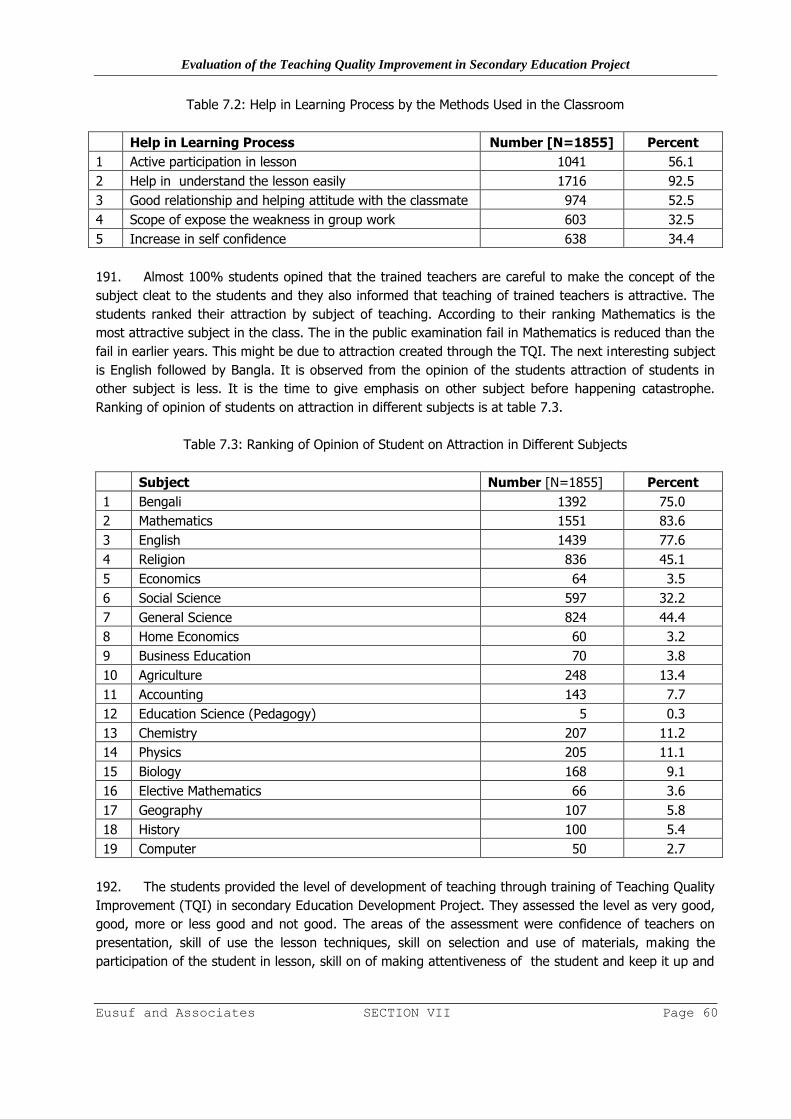
Evaluation of the Teaching Quality Improvement in Secondary Education Project
Eusuf and Associates SECTION VII Page 60
Table 7.2: Help in Learning Process by the Methods Used in the Classroom
Help in Learning Process Number [N=1855] Percent
1 Active participation in lesson 1041 56.1
2 Help in understand the lesson easily 1716 92.5
3 Good relationship and helping attitude with the classmate 974 52.5
4 Scope of expose the weakness in group work 603 32.5
5 Increase in self confidence 638 34.4
191. Almost 100% students opined that the trained teachers are careful to make the concept of the
subject cleat to the students and they also informed that teaching of trained teachers is attractive. The
students ranked their attraction by subject of teaching. According to their ranking Mathematics is the
most attractive subject in the class. The in the public examination fail in Mathematics is reduced than the
fail in earlier years. This might be due to attraction created through the TQI. The next interesting subject
is English followed by Bangla. It is observed from the opinion of the students attraction of students in
other subject is less. It is the time to give emphasis on other subject before happening catastrophe.
Ranking of opinion of students on attraction in different subjects is at table 7.3.
Table 7.3: Ranking of Opinion of Student on Attraction in Different Subjects
Subject Number [N=1855] Percent
1 Bengali 1392 75.0
2 Mathematics 1551 83.6
3 English 1439 77.6
4 Religion 836 45.1
5 Economics 64 3.5
6 Social Science 597 32.2
7 General Science 824 44.4
8 Home Economics 60 3.2
9 Business Education 70 3.8
10 Agriculture 248 13.4
11 Accounting 143 7.7
12 Education Science (Pedagogy) 5 0.3
13 Chemistry 207 11.2
14 Physics 205 11.1
15 Biology 168 9.1
16 Elective Mathematics 66 3.6
17 Geography 107 5.8
18 History 100 5.4
19 Computer 50 2.7
192. The students provided the level of development of teaching through training of Teaching Quality
Improvement (TQI) in secondary Education Development Project. They assessed the level as very good,
good, more or less good and not good. The areas of the assessment were confidence of teachers on
presentation, skill of use the lesson techniques, skill on selection and use of materials, making the
participation of the student in lesson, skill on of making attentiveness of the student and keep it up and

Evaluation of the Teaching Quality Improvement in Secondary Education Project
Eusuf and Associates SECTION VII Page 61
conclude the session with following the steps properly. Level of assessment of majority areas were good
followed by very good, more or less good and not good. Areas of development of teaching of the
teachers through TQI training according to the opinion of students are at table 7.4.
Table 7.4: Areas of Development of Teaching of the Teachers through TQI Training
Area of Development Very good
[N=1855] Good [N=1855]
More or less
good [N=1855]
Not good
[N=1855]
No. % No. % No. % No. %
1 Skill of use the lesson
techniques 967 52.1 745 40.2 140 7.5 3 0.2
2 Skill on selection and use
of materials 690 37.2 1010 54.4 153 8.2 2 0.1
3 Making the participation
of the student in lesson 624 33.6 1010 54.4 206 11.1 15 0.8
4 Skill on of making
attentiveness of the
student and keep it up
670 36.1 959 51.7 219 11.8 7 0.4
5 Conclude the session with
following the steps
properly
657 35.4 969 52.2 219 11.8 10 0.5
193. Study noted that about 15% students are not aware enough on introduction of School Based
Assessment (SBA) system. Students of all the classes replied that SBA was not introduced although they
are doing learning following SBA. The majority students (81%) replied that the teacher provide advice to
the students based on the results of SBA.
194. The students opined about of use of SBA. They opined about component and use of components
as more marks shall be allotted for SBA, happy with the use of SBA, more SBA shall be done, attraction
in study increases due to SBA, inspired in class test due to SBA, quality improves using the SBA
components, imitations of using SBA components, increases creativity, good, attractive, help in learning,
debating, question and answer session, demonstration of teaching materials, rearrangement of class
seating, quiz, apply different methods of teaching, problems due to shortage of time, easy to understand
and know, teachers need to be more active attendance of school and attendance increased due to SBA.
195. The students opined that some steps are taken to increase the attendance of students in class.
These steps are introducing prize on attendance, giving marks on percentage of the attendance,
encouraging by giving certificate, realizing fine for the absence, making the classroom work attractive,
giving punishment or warning, advising for attending, taking care, informing guardians, causes of
absence are to be explained, taking prior permission for leave and object in giving admit card, class
routine and examination. Steps taken to increase attendance in the class are at table 7.5.

Evaluation of the Teaching Quality Improvement in Secondary Education Project
Eusuf and Associates SECTION VII Page 62
Table 7.5: Steps taken to Increase Attendance in the Class
Steps taken Number [N=1855] Percent
1 Introducing prize on attendance 1108 59.7
2 Giving number on percentage of the attendance 871 47.0
3 Encouraging by giving certificate 371 20.0
4 Fine for the absence 856 46.1
5 Making the classroom work attractive 711 38.3
6 Provision for punitive measures 241 13.0
196. Majority of the students opined the steps very good (59%), well (39%) and not needed (2%).
The student expressed their opinion about implementation of activities of SBA. The important activities of
SBA are introduction of class examination, addition of marks of class examination in annual examination,
individual assignment given by the teacher and providing group assignment in the class/homework. Use
of different steps of School Based Assessment is at table 7.6.
Table 7.6: Use of Different Steps of School Based Assessment
Use of different components of SBA Yes No
Number Percent Number Percent
1 Introduction of Class Examination 1722 92.8 133 7.2
2 Addition of marks of class examination in annual examination 877 47.3 978 52.7
3 Individual assignment given by the teacher 1259 67.9 596 32.1
4 Group assignment in the class/ homework given 1605 86.5 250 13.5
197. The students informed that they undertook group assignment in last year and average number
of assignment was 18.7. A mixture of good and bad picture is seen in case of performing group
assignment. Some students informed that they completed 163 assignments in last one year while about
22% students reported that no group assignment undertaken in last one year. This is one threat of
implementation of SBA in schools. Picture of undertaking individual assignment is almost similar to the
group assignment. The picture of undertaking individual and group assignment is at table 7.7.
Table 7.7: Number of Individual and Group Assignment Undertaken in the Last Year
Number of assignment Individual assignment Group assignment
Number Percentage Number Percentage
1 0 688 37.1 402 21.7
2 1 43 2.3 31 1.7
3 2 72 3.9 72 3.9
4 3 102 5.5 76 4.1
5 4 98 5.3 117 6.3
6 5 106 5.7 138 7.4
7 6 47 2.5 116 6.3
8 7 25 1.3 33 1.8
9 8-10 249 13.4 304 16.4
10 11 + 425 22.9 566 30.5
Average 10.6 18.7

Evaluation of the Teaching Quality Improvement in Secondary Education Project
Eusuf and Associates SECTION VII Page 63
198. In case of bad result of the students the teachers undertake various steps for improvement. The
common steps are informing the guardian, arranging special classes, monitoring the works and giving
extra home work. Distribution of opinion is table 7.8.
Table 7.8: Steps Taken by the Teachers In Case of Bad Result of Class Test
Steps Taken Number Percent
1 Informing the guardian 1729 93.2
2 Arranging special classes 1164 62.7
3 Monitoring the works 1272 68.6
4 Giving extra home work 1119 60.3
5 Other (please specify) 241 13
199. Practical class in science subject is inadequate and about 38% students informed that practical
class on science is taken and availability of equipment in about 34% classes. Most of the teachers (98%)
take initiative for leadership development in the class. Several types of initiatives are taken for
leadership development. The major initiatives are selection of class caption (98%), formation of BNCC
(14%), formation of scout (54%), arrangement of drama (15%), group-wise debate competition (43%)
and Girl’s Guide (3%).
200. The students identified some areas on which teacher give importance in the class. The students
also ranked the areas according to importance. Their rankings are initiatives for making the concept clear
(76%), help in learning (53%), practical work (50%), and active participation in group learning (48%)
and memorizing the subject (38%).
201. The students provided opinion about attendance of teachers and understanding the lesson. Most
of the teacher are regular (88%), some teacher are slightly irregular (11%) and the rest are irregular.
Majority teacher (76%) understand subject fully while some teachers understand partially (24%). The
students assessed the quality of teaching in terms of spent all the class time on the lesson, use of proper
teaching materials and enjoy the class of the teacher. Students’ assessment is positive but there is scope
of improvement. Teaching Quality at the Classroom is at table 7.9.
Table 7.9: Teaching Quality at the Classroom
Number of
teacher
Spent all the class
time on the lesson
Use of proper
teaching materials
Enjoy the class of the
teacher
Number
[n=1855] Percent
Number
[n=1855] Percent
Number
[n=1855] Percent
1 Mostly 1483 79.9 1086 58.5 1351 72.8
2 Some teachers 372 19.8 751 40.5 487 26.3
3 None 5 0.3 18 1.0 17 0.9
202. More than half of the teachers give home task always (55%); some teacher give home tasks
sometimes (44%) and the rest never give home tasks. Pattern of providing feedback on home task is
similar to the home work. Most of the students (98%) informed that the feedback on home tasks is
helpful for their improvement.

Evaluation of the Teaching Quality Improvement in Secondary Education Project
Eusuf and Associates SECTION VII Page 64
203. Head teachers inspect the classroom frequently (44%), sometimes (54%) and never (2%).
Through close supervision of class the head teachers can identify the teaching learning problems and
through feedback s/he can help the colleague to overcome the problems of delivery lesson. TQI-SEP’s
method of supervision and feedback of lesson are very effective for teachers’ skill development.
Sufficient books are available (70%) in the school library and books are issued to the students. Students
of the school participate in co-curricular activities (97%) and types of co-curricular activities are games,
debate, singing and dance and drama. Participation in co-curricular activities develops teachers’ creativity
and improving relations among them. Distribution of opinion of students is at table 7.10.
Table 7.10: Distribution of Opinion of Student about Participation in Co-Curriculum Activities
Type of activities Number [n = 1855] Percent
1 Games 1733 93.4
2 Debate 1127 60.8
3 Singing and dance 890 48.0
4 Drama 628 33.9
204. The students identified some constraints for getting quality education. Major constraints are
scarcity of quality teachers (39%), scarcity of quality of classroom (58%), inadequate book in the school
library (47%), inadequate modern equipment (64%), scarcity of facilities for getting information (63%)
and lack of playground and canteen (9%).
205. The students opined the teachers take several methods for measuring knowledge, skills and
outlook. The important measures are : discussion, presentation, teach attentively, repeated to make the
subject clear, undertake practical classes, use materials and teaching aids, projectors, multimedia and
computers, role play, dances, songs, dramas, set examples, story telling, question and answer sessions,
exercises, individual works, assignments, commit to memory, home tasks, examinations, quiz ( annual,
quarterly, monthly, weekly and daily), awareness raising, encourage, advice, inspire, award giving,
attendance, regularity, sincerity, responsibility, neat and clean, good environment, attitude, behavior,
activity, manner, and relation with students and popularity.
206. Other important measures include: keep contact with students, inform over mobile phone,
arrange free extra classes for the weak students, lesson plan, group activities, identify the trained
teacher, advise to participate in sports, inform the guardians, take part in the creative activities, discuss
the recent activities and occurrences, advise to read newspapers, check the lesson from the student
regularly, everyday checking the complete the work of the day, fair and correct writing, try to develop
the quality, participate in debate, using SBA components, instruct the student to show the guardians
after completing the homework, review the previous class lesson, involve in social activities, involve in
cultural activities, provide up-to-date information and report, encourage for correction of misinformation,
giving solution of problem, perform proper evaluation through different methodology, ask for writing on
board, presentation by a good student, prefer reading text books, arrangement for teaching of strong
and week students together, discuss displaying writings on a large poster, help in understanding,
competition on general knowledge, well prepared before teaching and take care of the students.
207. The students identified the difference of teaching between trained and untrained teachers.
According to them the differences are trained teacher follow certain methodology, good presentation,
make the subject clear in understanding, easy to understand, excellent in teaching, use teaching aids,
Top Related
Copyright © 2022 FDOKUMEN

