


Bahasa
Halaman
Hukum

ORIGINAL ARTICLE
Obesity and mental disorders in the generalpopulation: results from the world mental healthsurveys
KM Scott1, R Bruffaerts2, GE Simon3, J Alonso4, M Angermeyer5, G de Girolamo6, K Demyttenaere2,I Gasquet7, JM Haro8, E Karam9, RC Kessler10, D Levinson11, ME Medina Mora12,MA Oakley Browne13, J Ormel14, JP Villa15, H Uda16 and M Von Korff3
1Wellington School of Medicine and Health Sciences, Otago University, Wellington, New Zealand; 2University HospitalGasthuisberg, Leuven, Belgium; 3Center for Health Studies, Group Health Cooperative, Seattle, WA, USA; 4InstitutMunicipal d’Investigacio Medica (IMIM), Barcelona, Spain; 5University of Leipzig, Leipzig, Germany; 6Department of MentalHealth, AUSL di Bologna, Italy; 7Inserm, Paris, France; 8Sant Joan de Deu-SSM, Barcelona, Spain; 9Institute forDevelopment, Research, Advocacy, and Applied Care (IDRAAC), Beirut, Lebanon; 10Harvard Medical School, Boston, MA,USA; 11Ministry of Health, Mental Health Services, Jerusalem, Israel; 12National Institute of Psychiatry, Mexico City, Mexico;13Centre for Multi-Disciplinary Studies in Rural Health, Faculty of Medicine, Nursing and Health Sciences, MonashUniversity, Victoria, Australia; 14Netherlands Institute of Mental Health and Addiction, Utrecht, The Netherlands ;15Colegio Mayor de Cundinamarca University; Saldarriaga Concha Foundation, Bogota, Colombia and 16Sensatsu PublicHealth Center, Kagoshima Prefecture, Japan
Objectives: (1) To investigate whether there is an association between obesity and mental disorders in the general populationsof diverse countries, and (2) to establish whether demographic variables (sex, age, education) moderate any associationsobserved.Design: Thirteen cross-sectional, general population surveys conducted as part of the World Mental Health Surveys initiative.Subjects: Household residing adults, 18 years and over (n¼62 277).Measurements: DSM-IV mental disorders (anxiety disorders, depressive disorders, alcohol use disorders) were assessed with theComposite International Diagnostic Interview (CIDI 3.0), a fully structured diagnostic interview. Obesity was defined as a bodymass index (BMI) of 30 kg/m2 or greater; severe obesity as BMI 35þ . Persons with BMI less than 18.5 were excluded fromanalysis. Height and weight were self-reported.Results: Statistically significant, albeit modest associations (odds ratios generally in the range of 1.2–1.5) were observedbetween obesity and depressive disorders, and between obesity and anxiety disorders, in pooled data across countries. Theseassociations were concentrated among those with severe obesity, and among females. Age and education had variable effectsacross depressive and anxiety disorders.Conclusions: The findings are suggestive of a modest relationship between obesity (particularly severe obesity) and emotionaldisorders among women in the general population. The study is limited by the self-report of BMI and cannot clarify the directionor nature of the relationship observed, but it may indicate a need for a research and clinical focus on the psychologicalheterogeneity of the obese population.
International Journal of Obesity (2008) 32, 192–200; doi:10.1038/sj.ijo.0803701; published online 21 August 2007
Keywords: cross-sectional surveys; general population; mental disorders; sex
Introduction
While the physical health costs of obesity have become
increasingly clear,1–3 the existence and nature of a relation-
ship between obesity and mental health in the general
population has been less clear. Early research on the
relationship between obesity and mental disorder (depres-
sion in particular) has provided conflicting answers, in partReceived 13 November 2006; revised 1 May 2007; accepted 8 May 2007;
published online 21 August 2007
Correspondence: Dr KM Scott, Department of Psychological Medicine,
Wellington School of Medicine and Health Sciences, PO Box 7343, Wellington
South, New Zealand.
E-mail: [email protected]
International Journal of Obesity (2008) 32, 192–200& 2008 Nature Publishing Group All rights reserved 0307-0565/08 $30.00
www.nature.com/ijo
due to methodological differences across studies.4,5 In a
major critique of what they termed the first generation of
studies investigating this issue, Friedman and Brownell cite
the great variety in measures of psychopathology used, with
few studies using diagnostic measures of mental disorder.4
They also cite the failure to consider demographic and
socioeconomic variables that may moderate the relationship
between obesity and mental disorders, and so may render
some subgroups more vulnerable to accompanying mental
disorders than others.5,6 The point here is that, given the
large proportion of some populations that obesity affects, it
is most unlikely to be a homogeneous disorder either in
aetiology or sequelae.
Sex, age and socioeconomic status have been hypothesized
as potential moderators of the obesity–depression relation-
ship.4,7 Only a handful of studies have investigated demo-
graphic variation in the relationship between depressive
disorder and obesity in the general adult population.
Carpenter et al.8 and Oynike et al.5 in US surveys both found
obesity was associated with depression in women but not in
men. Recently, two countries from the World Mental Health
(WMH) Surveys initiative have published findings with
regard to obesity and mental disorders.9,10 The WMH surveys
have been conducted in both developed and developing
countries using the latest structured psychiatric interviews
generating DSM-IV diagnoses for a range of mental disorders.
In the US survey from the WMH group (the National
Comorbidity Survey-Replication: NCS-R), Simon et al.9 found
significant associations between obesity and a number of
mental disorders, and that some of these associations were
modified by ethnicity and education, but they did not find
a difference in strength of association between men and
women. By contrast, the New Zealand Mental Health Survey
found that overweight/obesity was associated with mental
disorder only among women.10
Most investigations of this issue have taken place in
developed countries. Given the large cross-national variation
in obesity prevalence,11,12 mental disorder prevalence,13
preference for slimness14,15 and relationship between obesity
and socioeconomic status,14 there is a need to research the
relationship between obesity and mental disorders in a range
of countries. The current study is the first cross-national
investigation of the obesity–mental disorder relationship
and aims to (1) investigate whether there is an association
between obesity and mental disorder (any anxiety disorder,
any depressive disorder, any alcohol use disorder) in data
from 13 countries from the WMH consortium; and (2)
establish whether demographic variables (sex, age, years of
education) moderate any associations observed.
Methods
Samples
Thirteen surveys were carried out in the Americas (Colombia,
Mexico, United States), Europe (Belgium, France, Germany,
Italy, The Netherlands, Spain), the Middle East (Israel,
Lebanon) and Asia/Pacific (Japan, New Zealand). All surveys
were based on multi-stage, clustered area probability house-
hold samples. All interviews were carried out face-to-face by
trained lay interviewers. Sample sizes (of those providing
valid BMI data) range from 2326 (Japan) to 12 782 (New
Zealand) with a total of 62 277 respondents. Response rates
range from 45.9 (France) to 87.7% (Colombia), with a
weighted average response rate of 70.8%.
Interview
Internal sub-sampling was used to reduce respondent burden
by dividing the interview into two parts. Part 1 included the
core diagnostic assessment of mood disorders, alcohol use
disorders, most of the anxiety disorders and height and
weight for the calculation of obesity. Part 2 included the
remainder of mental disorders and additional information
relevant to a wide range of survey aims, including assessment
of chronic physical conditions. All respondents completed
part 1. All part-1 respondents who met criteria for any
mental disorder and a probability sample of other respon-
dents were administered part 2. Part-2 respondents were
weighted by the inverse of their probability of selection to
adjust for differential sampling. Additional weights were
used to adjust for differential probabilities of selection
within households and to match the samples to population
sociodemographic distributions.
Training and field procedures
The central WMH staff trained bilingual supervisors in each
country. Consistent interviewer training documents and
procedures were used across surveys. The WHO translation
protocol was used to translate instruments and training
materials. The Dutch survey was carried out in bilingual
form. Other surveys were carried out in the country’s official
language. Persons who could not speak these languages were
excluded. Standardized descriptions of the goals and proce-
dures of the study, data uses and protection and the rights of
respondents were provided in both written and verbal form
to all potentially eligible respondents before obtaining verbal
informed consent for participation in the survey. Quality
control protocols, described in more detail elsewhere,16 were
standardized across countries to check on interviewer
accuracy and to specify data cleaning and coding procedures.
The institutional review board of the organization that
coordinated the survey in each country approved and
monitored compliance with procedures for obtaining in-
formed consent and protecting human subjects.
Mental disorder status
All surveys used the WMH Survey version of the WHO
Composite International Diagnostic Interview (now CIDI
3.0),17 a fully structured diagnostic interview, to assess
Obesity and mental disordersKM Scott et al
193
International Journal of Obesity
disorders and treatment. Mental disorders considered in
this paper were present in the past 12 months, and include
anxiety disorders (generalized anxiety disorder, panic dis-
order and/or agoraphobia, post-traumatic stress disorder and
social phobia), depressive disorders (dysthymia and major
depressive disorder) and alcohol use disorders (abuse and
dependence). Disorders were assessed using the definitions
and criteria of the DSM-IV: Diagnostic and Statistical Manual of
Mental Disorders, Fourth Edition,18 without hierarchy. CIDI
organic exclusion rules were imposed in making all diag-
noses. Field Trials and later clinical calibration studies have
showed that all the mental disorders considered here were
assessed with acceptable reliability and validity in the
original version of the CIDI 3.0 used in these surveys.19
Obesity status
Obesity (‘total obesity’) was defined as a body mass index
(BMI) of 30 kg/m2 or greater. For some analyses, obesity was
further subdivided into class I obesity (BMI 30–34.9) and
severe obesity (BMI 35þ ). Persons with BMI less than 18.5
were excluded from analysis as other research shows a
u-shaped relationship between BMI and the prevalence of
mood disorder.8 Height and weight were self-reported by
all respondents. Previous research indicates that self-reported
height and weight correlate highly with objective mea-
sures20,21 but some individuals, particularly, those who are
overweight or obese, underestimate weight22 so the pre-
valences of obesity reported here may be underestimated. It
is noteworthy though that the New Zealand survey, the
largest included in this study, obtained obesity estimates
among males (19.6%) and females (21.2%) which were
highly consistent with estimates for males (19.2%) and
females (21.0%) from the 2002/2003 New Zealand Health
Survey which calculated BMI from objectively measured
weights and heights.23
Analytic methods
Part 1 weights were used for the ‘any depressive disorder’
analyses and Part 2 weights for the ‘any anxiety’ and ‘any
alcohol use’ analyses. Age, sex and education adjusted odds
ratios for the association of obesity with mental disorders
were calculated for each country in logistic regression
equations. For these analyses, obesity was classified in three
ways: total obesity (BMI 30þ ), class I obesity (BMI 30–34.9)
and severe obesity (BMI 35þ ). These three groups are not,
therefore, mutually exclusive: the total obesity group is a
composite of class I and severe obesity. The three obesity
groups were compared with the reference group of non-
obese persons (BMI 18.5–29.9).
Odds ratios for mental disorder among the total obesity
group in subgroups defined by age, sex and education were
also estimated for each survey, with the exception that the
French survey did not provide data on education. Further
subdivision of the total obesity group into class I and severe
obesity was not possible for this set of analyses due to the
smaller sample size of many of the surveys. Tests of the
interaction between the total obesity group and each
demographic covariate (age, sex, education) in predicting
the odds of mental disorder were undertaken for each
country. Education was categorized into two groups: those
with less than completed secondary education and those
with completed secondary education or more. Age groups
were 18–34 years, 35–49 years, 50–64 years and 65 years and
over. Ninety-five percent confidence intervals for the odds
ratios were estimated using the Taylor Series method24 with
SUDAAN software25 to adjust for clustering and weighting.
Using meta-analytic methods to summarize results across
surveys, pooled estimates of the odds ratios were developed
describing the association of mental disorders with obesity
across surveys.26 The pooled estimate of the odds ratio was
weighted by the inverse of the variance of the estimate for
each survey.26 We also assessed whether the heterogeneity
of the odds ratio estimates across surveys was greater than
expected by chance.25 These tests were undertaken for the
odds calculated between total obesity and each mental
disorder group, and for each age/education/sex stratum
within each mental disorder group. None of the results of
these tests indicated greater than chance variability in
pooled odds ratios using a more conservative a level
o0.01, though a small number were significant at Po0.05;
the test results for each mental disorder group are cited
below (the others are available on request).
Results
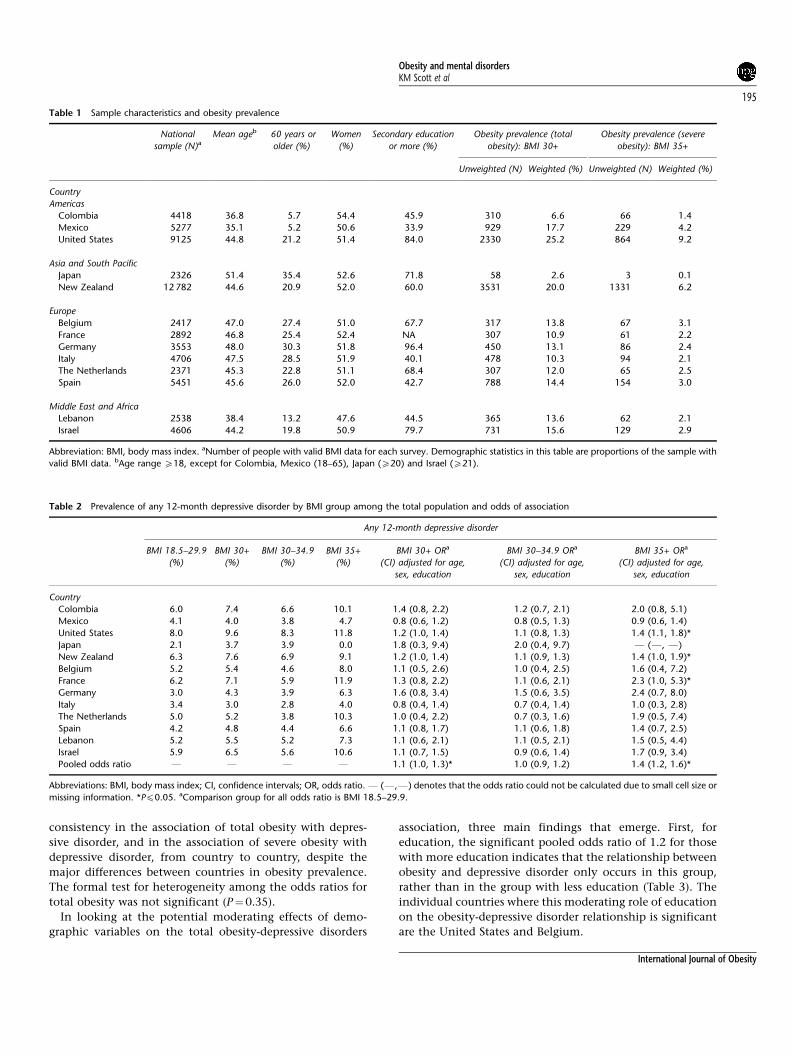
Sample characteristics
The sample size numbers provided in Table 1 are the number
of respondents providing valid BMI data. As noted above,
some analyses used information on mental disorders only
provided in Part 2 of the interview, resulting in smaller
sample sizes for those analyses. As the table makes clear,
there was marked cross-national variability in the prevalence
of obesity, ranging from 2.6% for BMI 30þ in Japan to
25.2% in the United States.
Obesity and depressive disorders
Table 2 shows the prevalence of depressive disorder in the
BMI groups, and the age, sex and education-adjusted odds of
depressive disorder among people in the three obesity groups
relative to the normal/overweight group. The pooled odds
ratio of 1.1 for the total obesity group is statistically
significant, but it is clear from the table that the association
with depressive disorder is concentrated among those with
more severe (BMI 35þ ) obesity, where the pooled odds ratio
is 1.4. The results for the total obesity group should also be
interpreted in the light of findings for population subgroups
(below). Although the country-specific odds ratios are only
significant in a minority of countries, there is a fair degree of
Obesity and mental disordersKM Scott et al
194
International Journal of Obesity
consistency in the association of total obesity with depres-
sive disorder, and in the association of severe obesity with
depressive disorder, from country to country, despite the
major differences between countries in obesity prevalence.
The formal test for heterogeneity among the odds ratios for
total obesity was not significant (P¼0.35).
In looking at the potential moderating effects of demo-
graphic variables on the total obesity-depressive disorders
association, three main findings that emerge. First, for
education, the significant pooled odds ratio of 1.2 for those
with more education indicates that the relationship between
obesity and depressive disorder only occurs in this group,
rather than in the group with less education (Table 3). The
individual countries where this moderating role of education
on the obesity-depressive disorder relationship is significant
are the United States and Belgium.
Table 1 Sample characteristics and obesity prevalence
National
sample (N)a
Mean ageb 60 years or
older (%)
Women
(%)
Secondary education
or more (%)
Obesity prevalence (total
obesity): BMI 30+
Obesity prevalence (severe
obesity): BMI 35+
Unweighted (N) Weighted (%) Unweighted (N) Weighted (%)
Country
Americas
Colombia 4418 36.8 5.7 54.4 45.9 310 6.6 66 1.4
Mexico 5277 35.1 5.2 50.6 33.9 929 17.7 229 4.2
United States 9125 44.8 21.2 51.4 84.0 2330 25.2 864 9.2
Asia and South Pacific
Japan 2326 51.4 35.4 52.6 71.8 58 2.6 3 0.1
New Zealand 12 782 44.6 20.9 52.0 60.0 3531 20.0 1331 6.2
Europe
Belgium 2417 47.0 27.4 51.0 67.7 317 13.8 67 3.1
France 2892 46.8 25.4 52.4 NA 307 10.9 61 2.2
Germany 3553 48.0 30.3 51.8 96.4 450 13.1 86 2.4
Italy 4706 47.5 28.5 51.9 40.1 478 10.3 94 2.1
The Netherlands 2371 45.3 22.8 51.1 68.4 307 12.0 65 2.5
Spain 5451 45.6 26.0 52.0 42.7 788 14.4 154 3.0
Middle East and Africa
Lebanon 2538 38.4 13.2 47.6 44.5 365 13.6 62 2.1
Israel 4606 44.2 19.8 50.9 79.7 731 15.6 129 2.9
Abbreviation: BMI, body mass index. aNumber of people with valid BMI data for each survey. Demographic statistics in this table are proportions of the sample with
valid BMI data. bAge range X18, except for Colombia, Mexico (18–65), Japan (X20) and Israel (X21).
Table 2 Prevalence of any 12-month depressive disorder by BMI group among the total population and odds of association
Any 12-month depressive disorder
BMI 18.5–29.9
(%)
BMI 30+
(%)
BMI 30–34.9
(%)
BMI 35+
(%)
BMI 30+ ORa
(CI) adjusted for age,
sex, education
BMI 30–34.9 ORa
(CI) adjusted for age,
sex, education
BMI 35+ ORa
(CI) adjusted for age,
sex, education
Country
Colombia 6.0 7.4 6.6 10.1 1.4 (0.8, 2.2) 1.2 (0.7, 2.1) 2.0 (0.8, 5.1)
Mexico 4.1 4.0 3.8 4.7 0.8 (0.6, 1.2) 0.8 (0.5, 1.3) 0.9 (0.6, 1.4)
United States 8.0 9.6 8.3 11.8 1.2 (1.0, 1.4) 1.1 (0.8, 1.3) 1.4 (1.1, 1.8)*
Japan 2.1 3.7 3.9 0.0 1.8 (0.3, 9.4) 2.0 (0.4, 9.7) F (F, F)
New Zealand 6.3 7.6 6.9 9.1 1.2 (1.0, 1.4) 1.1 (0.9, 1.3) 1.4 (1.0, 1.9)*
Belgium 5.2 5.4 4.6 8.0 1.1 (0.5, 2.6) 1.0 (0.4, 2.5) 1.6 (0.4, 7.2)
France 6.2 7.1 5.9 11.9 1.3 (0.8, 2.2) 1.1 (0.6, 2.1) 2.3 (1.0, 5.3)*
Germany 3.0 4.3 3.9 6.3 1.6 (0.8, 3.4) 1.5 (0.6, 3.5) 2.4 (0.7, 8.0)
Italy 3.4 3.0 2.8 4.0 0.8 (0.4, 1.4) 0.7 (0.4, 1.4) 1.0 (0.3, 2.8)
The Netherlands 5.0 5.2 3.8 10.3 1.0 (0.4, 2.2) 0.7 (0.3, 1.6) 1.9 (0.5, 7.4)
Spain 4.2 4.8 4.4 6.6 1.1 (0.8, 1.7) 1.1 (0.6, 1.8) 1.4 (0.7, 2.5)
Lebanon 5.2 5.5 5.2 7.3 1.1 (0.6, 2.1) 1.1 (0.5, 2.1) 1.5 (0.5, 4.4)
Israel 5.9 6.5 5.6 10.6 1.1 (0.7, 1.5) 0.9 (0.6, 1.4) 1.7 (0.9, 3.4)
Pooled odds ratio F F F F 1.1 (1.0, 1.3)* 1.0 (0.9, 1.2) 1.4 (1.2, 1.6)*
Abbreviations: BMI, body mass index; CI, confidence intervals; OR, odds ratio. F (F,F) denotes that the odds ratio could not be calculated due to small cell size or
missing information. *Pp0.05. aComparison group for all odds ratio is BMI 18.5–29.9.
Obesity and mental disordersKM Scott et al
195
International Journal of Obesity
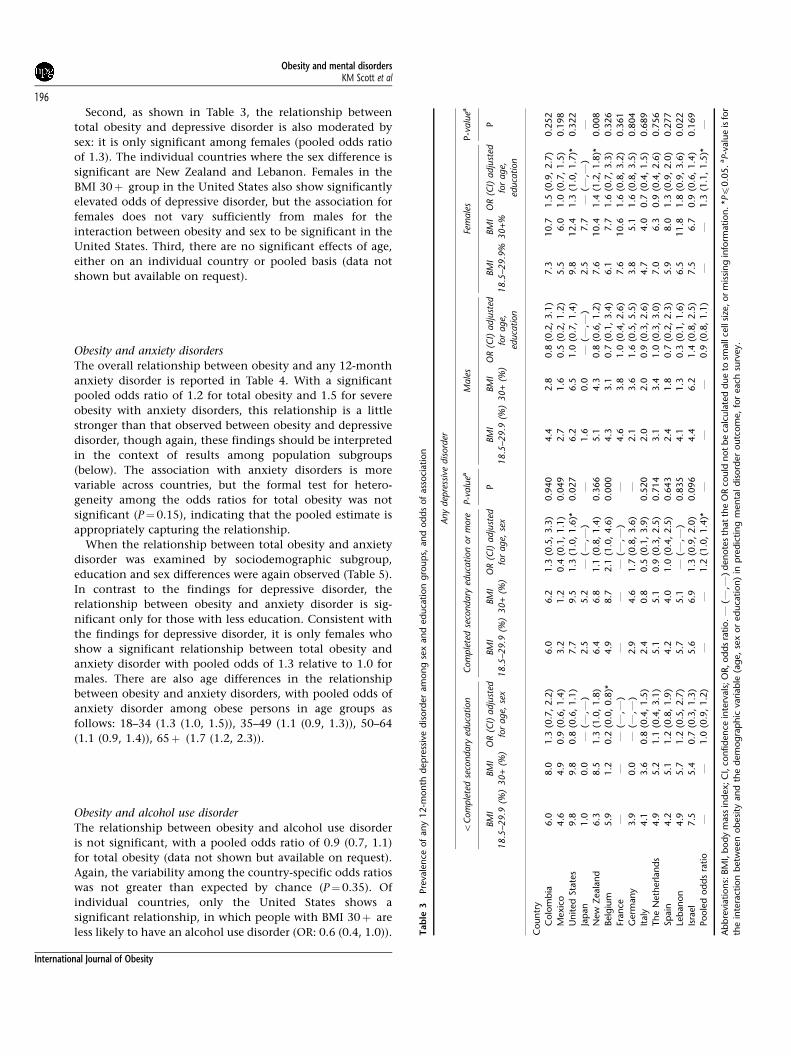
Second, as shown in Table 3, the relationship between
total obesity and depressive disorder is also moderated by
sex: it is only significant among females (pooled odds ratio
of 1.3). The individual countries where the sex difference is
significant are New Zealand and Lebanon. Females in the
BMI 30þ group in the United States also show significantly
elevated odds of depressive disorder, but the association for
females does not vary sufficiently from males for the
interaction between obesity and sex to be significant in the
United States. Third, there are no significant effects of age,
either on an individual country or pooled basis (data not
shown but available on request).
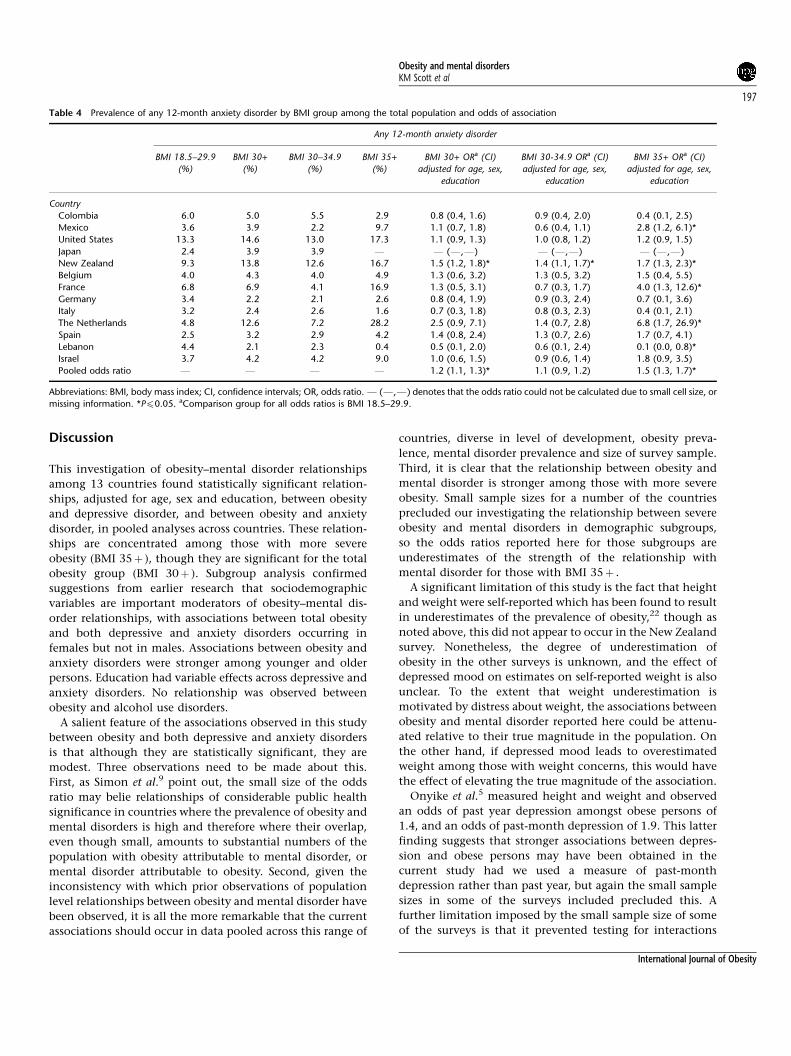
Obesity and anxiety disorders
The overall relationship between obesity and any 12-month
anxiety disorder is reported in Table 4. With a significant
pooled odds ratio of 1.2 for total obesity and 1.5 for severe
obesity with anxiety disorders, this relationship is a little
stronger than that observed between obesity and depressive
disorder, though again, these findings should be interpreted
in the context of results among population subgroups
(below). The association with anxiety disorders is more
variable across countries, but the formal test for hetero-
geneity among the odds ratios for total obesity was not
significant (P¼ 0.15), indicating that the pooled estimate is
appropriately capturing the relationship.
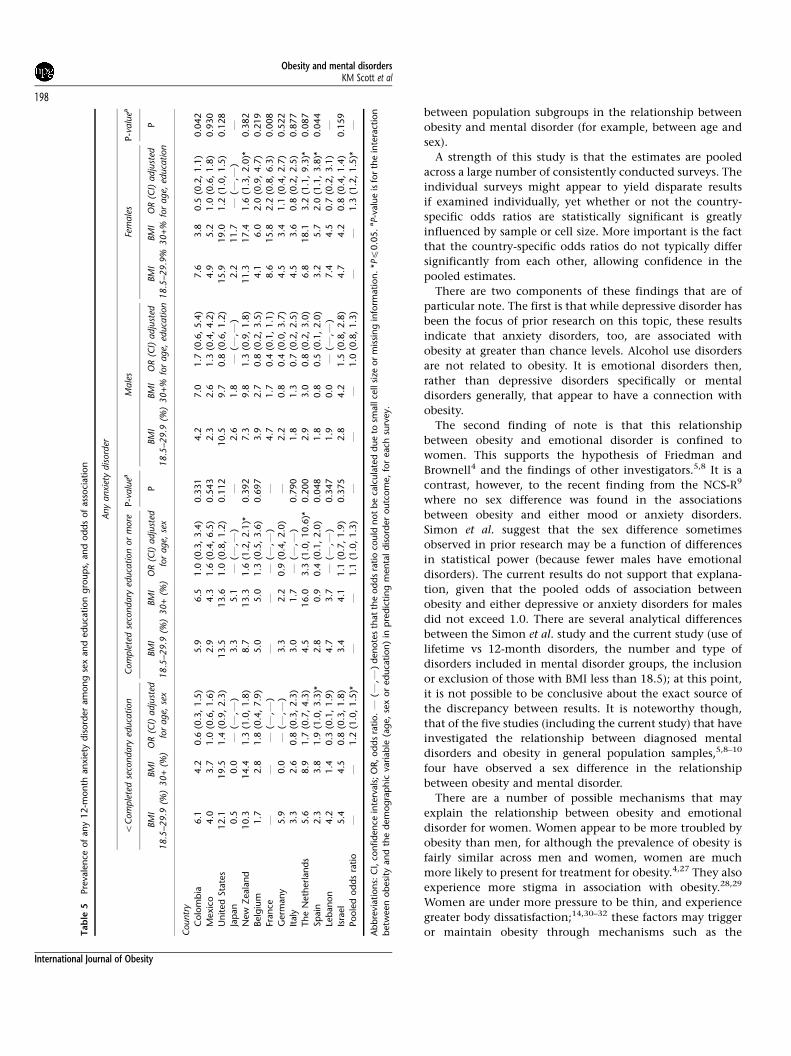
When the relationship between total obesity and anxiety
disorder was examined by sociodemographic subgroup,
education and sex differences were again observed (Table 5).
In contrast to the findings for depressive disorder, the
relationship between obesity and anxiety disorder is sig-
nificant only for those with less education. Consistent with
the findings for depressive disorder, it is only females who
show a significant relationship between total obesity and
anxiety disorder with pooled odds of 1.3 relative to 1.0 for
males. There are also age differences in the relationship
between obesity and anxiety disorders, with pooled odds of
anxiety disorder among obese persons in age groups as
follows: 18–34 (1.3 (1.0, 1.5)), 35–49 (1.1 (0.9, 1.3)), 50–64
(1.1 (0.9, 1.4)), 65þ (1.7 (1.2, 2.3)).
Obesity and alcohol use disorder
The relationship between obesity and alcohol use disorder
is not significant, with a pooled odds ratio of 0.9 (0.7, 1.1)
for total obesity (data not shown but available on request).
Again, the variability among the country-specific odds ratios
was not greater than expected by chance (P¼0.35). Of
individual countries, only the United States shows a
significant relationship, in which people with BMI 30þ are
less likely to have an alcohol use disorder (OR: 0.6 (0.4, 1.0)). Tab
le3
Pre
vale
nce
of
an
y12-m
on
thd
ep
ress
ive
dis
ord
er
am
on
gse
xan
ded
uca
tion
gro
up
s,an
dod
ds
of
ass
oci
ati
on
Any
dep
ress
ive
dis
ord
er
oC
om
ple
ted
seco
ndary
educa
tion
Com
ple
ted
seco
ndary
educa
tion
or
more
P-v
alu
eaM
ale
sFe
male
sP-v
alu
ea
BM
I
18
.5–2
9.9
(%)
BM
I
30
+(%
)
OR
(CI)
adju
sted
for
age,
sex
BM
I
18
.5–2
9.9
(%)
BM
I
30
+(%
)
OR
(CI)
adju
sted
for
age,
sex
PBM
I
18
.5–2
9.9
(%)
BM
I
30
+(%
)
OR
(CI)
adju
sted
for
age,
educa
tion
BM
I
18
.5–2
9.9
%
BM
I
30
+%
OR
(CI)
adju
sted
for
age,
educa
tion
P
Coun
try
Colo
mb
ia6.0
8.0
1.3
(0.7
,2.2
)6.0
6.2
1.3
(0.5
,3.3
)0.9
40
4.4
2.8
0.8
(0.2
,3.1
)7.3
10.7
1.5
(0.9
,2.7
)0.2
52
Mexic
o4.6
4.9
0.9
(0.6
,1.4
)3.2
1.2
0.4
(0.1
,1.1
)0.0
49
2.7
1.6
0.5
(0.2
,1.2
)5.5
6.0
1.0
(0.7
,1.5
)0.1
98
Un
ited
Sta
tes
9.8
9.8
0.8
(0.6
,1.1
)7.7
9.5
1.3
(1.0
,1.6
)*0.0
27
6.2
6.5
1.0
(0.7
,1.4
)9.8
12.4
1.3
(1.0
,1.7
)*0.3
22
Jap
an
1.0
0.0
F(F
,F)
2.5
5.2
F(F
,F)
F1.6
0.0
F(F
,F)
2.5
7.7
F(F
,F)
FN
ew
Zeala
nd
6.3
8.5
1.3
(1.0
,1.8
)6.4
6.8
1.1
(0.8
,1.4
)0.3
66
5.1
4.3
0.8
(0.6
,1.2
)7.6
10.4
1.4
(1.2
,1.8
)*0.0
08
Belg
ium
5.9
1.2
0.2
(0.0
,0.8
)*4.9
8.7
2.1
(1.0
,4.6
)0.0
00
4.3
3.1
0.7
(0.1
,3.4
)6.1
7.7
1.6
(0.7
,3.3
)0.3
26
Fran
ceF
FF
(F,F
)F
FF
(F,F
)F
4.6
3.8
1.0
(0.4
,2.6
)7.6
10.6
1.6
(0.8
,3.2
)0.3
61
Germ
an
y3.9
0.0
F(F
,F)
2.9
4.6
1.7
(0.8
,3.6
)F
2.1
3.6
1.6
(0.5
,5.5
)3.8
5.1
1.6
(0.8
,3.5
)0.8
04
Italy
4.1
3.6
0.8
(0.4
,1.5
)2.4
0.8
0.5
(0.1
,3.9
)0.5
20
2.0
2.0
0.9
(0.3
,2.6
)4.7
4.0
0.7
(0.4
,1.5
)0.6
89
Th
eN
eth
erl
an
ds
4.9
5.2
1.1
(0.4
,3.1
)5.1
5.1
0.9
(0.3
,2.5
)0.7
14
3.1
3.4
1.0
(0.3
,3.0
)7.0
6.3
0.9
(0.4
,2.6
)0.7
56
Sp
ain
4.2
5.1
1.2
(0.8
,1.9
)4.2
4.0
1.0
(0.4
,2.5
)0.6
43
2.4
1.8
0.7
(0.2
,2.3
)5.9
8.0
1.3
(0.9
,2.0
)0.2
77
Leb
an
on
4.9
5.7
1.2
(0.5
,2.7
)5.7
5.1
F(F
,F)
0.8
35
4.1
1.3
0.3
(0.1
,1.6
)6.5
11.8
1.8
(0.9
,3.6
)0.0
22
Isra
el
7.5
5.4
0.7
(0.3
,1.3
)5.6
6.9
1.3
(0.9
,2.0
)0.0
96
4.4
6.2
1.4
(0.8
,2.5
)7.5
6.7
0.9
(0.6
,1.4
)0.1
69
Poole
dod
ds
rati
oF
F1.0
(0.9
,1.2
)F
F1.2
(1.0
,1.4
)*F
FF
0.9
(0.8
,1.1
)F
F1.3
(1.1
,1.5
)*F
Ab
bre
viati
on
s:BM
I,b
od
ym
ass
ind
ex;C
I,co
nfid
en
cein
terv
als
;O
R,od
ds
rati
o.F
(F,F
)d
en
ote
sth
at
the
OR
could
not
be
calc
ula
ted
due
tosm
all
cell
size
,or
mis
sin
gin
form
ation
.*Pp
0.0
5.
aP-v
alu
eis
for
the
inte
ract
ion
betw
een
ob
esi
tyan
dth
ed
em
og
rap
hic
vari
ab
le(a
ge,
sex
or
ed
uca
tion
)in
pre
dic
tin
gm
en
tald
isord
er
outc
om
e,
for
each
surv
ey.
Obesity and mental disordersKM Scott et al
196
International Journal of Obesity
Discussion
This investigation of obesity–mental disorder relationships
among 13 countries found statistically significant relation-
ships, adjusted for age, sex and education, between obesity
and depressive disorder, and between obesity and anxiety
disorder, in pooled analyses across countries. These relation-
ships are concentrated among those with more severe
obesity (BMI 35þ ), though they are significant for the total
obesity group (BMI 30þ ). Subgroup analysis confirmed
suggestions from earlier research that sociodemographic
variables are important moderators of obesity–mental dis-
order relationships, with associations between total obesity
and both depressive and anxiety disorders occurring in
females but not in males. Associations between obesity and
anxiety disorders were stronger among younger and older
persons. Education had variable effects across depressive and
anxiety disorders. No relationship was observed between
obesity and alcohol use disorders.
A salient feature of the associations observed in this study
between obesity and both depressive and anxiety disorders
is that although they are statistically significant, they are
modest. Three observations need to be made about this.
First, as Simon et al.9 point out, the small size of the odds
ratio may belie relationships of considerable public health
significance in countries where the prevalence of obesity and
mental disorders is high and therefore where their overlap,
even though small, amounts to substantial numbers of the
population with obesity attributable to mental disorder, or
mental disorder attributable to obesity. Second, given the
inconsistency with which prior observations of population
level relationships between obesity and mental disorder have
been observed, it is all the more remarkable that the current
associations should occur in data pooled across this range of
countries, diverse in level of development, obesity preva-
lence, mental disorder prevalence and size of survey sample.
Third, it is clear that the relationship between obesity and
mental disorder is stronger among those with more severe
obesity. Small sample sizes for a number of the countries
precluded our investigating the relationship between severe
obesity and mental disorders in demographic subgroups,
so the odds ratios reported here for those subgroups are
underestimates of the strength of the relationship with
mental disorder for those with BMI 35þ .
A significant limitation of this study is the fact that height
and weight were self-reported which has been found to result
in underestimates of the prevalence of obesity,22 though as
noted above, this did not appear to occur in the New Zealand
survey. Nonetheless, the degree of underestimation of
obesity in the other surveys is unknown, and the effect of
depressed mood on estimates on self-reported weight is also
unclear. To the extent that weight underestimation is
motivated by distress about weight, the associations between
obesity and mental disorder reported here could be attenu-
ated relative to their true magnitude in the population. On
the other hand, if depressed mood leads to overestimated
weight among those with weight concerns, this would have
the effect of elevating the true magnitude of the association.
Onyike et al.5 measured height and weight and observed
an odds of past year depression amongst obese persons of
1.4, and an odds of past-month depression of 1.9. This latter
finding suggests that stronger associations between depres-
sion and obese persons may have been obtained in the
current study had we used a measure of past-month
depression rather than past year, but again the small sample
sizes in some of the surveys included precluded this. A
further limitation imposed by the small sample size of some
of the surveys is that it prevented testing for interactions
Table 4 Prevalence of any 12-month anxiety disorder by BMI group among the total population and odds of association
Any 12-month anxiety disorder
BMI 18.5–29.9
(%)
BMI 30+
(%)
BMI 30–34.9
(%)
BMI 35+
(%)
BMI 30+ ORa (CI)
adjusted for age, sex,
education
BMI 30-34.9 ORa (CI)
adjusted for age, sex,
education
BMI 35+ ORa (CI)
adjusted for age, sex,
education
Country
Colombia 6.0 5.0 5.5 2.9 0.8 (0.4, 1.6) 0.9 (0.4, 2.0) 0.4 (0.1, 2.5)
Mexico 3.6 3.9 2.2 9.7 1.1 (0.7, 1.8) 0.6 (0.4, 1.1) 2.8 (1.2, 6.1)*
United States 13.3 14.6 13.0 17.3 1.1 (0.9, 1.3) 1.0 (0.8, 1.2) 1.2 (0.9, 1.5)
Japan 2.4 3.9 3.9 F F (F,F) F (F,F) F (F,F)
New Zealand 9.3 13.8 12.6 16.7 1.5 (1.2, 1.8)* 1.4 (1.1, 1.7)* 1.7 (1.3, 2.3)*
Belgium 4.0 4.3 4.0 4.9 1.3 (0.6, 3.2) 1.3 (0.5, 3.2) 1.5 (0.4, 5.5)
France 6.8 6.9 4.1 16.9 1.3 (0.5, 3.1) 0.7 (0.3, 1.7) 4.0 (1.3, 12.6)*
Germany 3.4 2.2 2.1 2.6 0.8 (0.4, 1.9) 0.9 (0.3, 2.4) 0.7 (0.1, 3.6)
Italy 3.2 2.4 2.6 1.6 0.7 (0.3, 1.8) 0.8 (0.3, 2.3) 0.4 (0.1, 2.1)
The Netherlands 4.8 12.6 7.2 28.2 2.5 (0.9, 7.1) 1.4 (0.7, 2.8) 6.8 (1.7, 26.9)*
Spain 2.5 3.2 2.9 4.2 1.4 (0.8, 2.4) 1.3 (0.7, 2.6) 1.7 (0.7, 4.1)
Lebanon 4.4 2.1 2.3 0.4 0.5 (0.1, 2.0) 0.6 (0.1, 2.4) 0.1 (0.0, 0.8)*
Israel 3.7 4.2 4.2 9.0 1.0 (0.6, 1.5) 0.9 (0.6, 1.4) 1.8 (0.9, 3.5)
Pooled odds ratio F F F F 1.2 (1.1, 1.3)* 1.1 (0.9, 1.2) 1.5 (1.3, 1.7)*
Abbreviations: BMI, body mass index; CI, confidence intervals; OR, odds ratio. F (F,F) denotes that the odds ratio could not be calculated due to small cell size, or
missing information. *Pp0.05. aComparison group for all odds ratios is BMI 18.5–29.9.
Obesity and mental disordersKM Scott et al
197
International Journal of Obesity
between population subgroups in the relationship between
obesity and mental disorder (for example, between age and
sex).
A strength of this study is that the estimates are pooled
across a large number of consistently conducted surveys. The
individual surveys might appear to yield disparate results
if examined individually, yet whether or not the country-
specific odds ratios are statistically significant is greatly
influenced by sample or cell size. More important is the fact
that the country-specific odds ratios do not typically differ
significantly from each other, allowing confidence in the
pooled estimates.
There are two components of these findings that are of
particular note. The first is that while depressive disorder has
been the focus of prior research on this topic, these results
indicate that anxiety disorders, too, are associated with
obesity at greater than chance levels. Alcohol use disorders
are not related to obesity. It is emotional disorders then,
rather than depressive disorders specifically or mental
disorders generally, that appear to have a connection with
obesity.
The second finding of note is that this relationship
between obesity and emotional disorder is confined to
women. This supports the hypothesis of Friedman and
Brownell4 and the findings of other investigators.5,8 It is a
contrast, however, to the recent finding from the NCS-R9
where no sex difference was found in the associations
between obesity and either mood or anxiety disorders.
Simon et al. suggest that the sex difference sometimes
observed in prior research may be a function of differences
in statistical power (because fewer males have emotional
disorders). The current results do not support that explana-
tion, given that the pooled odds of association between
obesity and either depressive or anxiety disorders for males
did not exceed 1.0. There are several analytical differences
between the Simon et al. study and the current study (use of
lifetime vs 12-month disorders, the number and type of
disorders included in mental disorder groups, the inclusion
or exclusion of those with BMI less than 18.5); at this point,
it is not possible to be conclusive about the exact source of
the discrepancy between results. It is noteworthy though,
that of the five studies (including the current study) that have
investigated the relationship between diagnosed mental
disorders and obesity in general population samples,5,8–10
four have observed a sex difference in the relationship
between obesity and mental disorder.
There are a number of possible mechanisms that may
explain the relationship between obesity and emotional
disorder for women. Women appear to be more troubled by
obesity than men, for although the prevalence of obesity is
fairly similar across men and women, women are much
more likely to present for treatment for obesity.4,27 They also
experience more stigma in association with obesity.28,29
Women are under more pressure to be thin, and experience
greater body dissatisfaction;14,30–32 these factors may trigger
or maintain obesity through mechanisms such as theTab
le5
Pre
vale
nce
of
an
y12-m
on
than
xie
tyd
isord
er
am
on
gse
xan
ded
uca
tion
gro
up
s,an
dod
ds
of
ass
oci
ati
on
Any
anxi
ety
dis
ord
er
oC
om
ple
ted
seco
ndary
educa
tion
Com
ple
ted
seco
ndary
educa
tion
or
more
P-v
alu
eaM
ale
sFe
male
sP-v
alu
ea
BM
I
18
.5–2
9.9
(%)
BM
I
30
+(%
)
OR
(CI)
adju
sted
for
age,
sex
BM
I
18
.5–2
9.9
(%)
BM
I
30
+(%
)
OR
(CI)
adju
sted
for
age,
sex
PBM
I
18
.5–2
9.9
(%)
BM
I
30
+%
OR
(CI)
adju
sted
for
age,
educa
tion
BM
I
18
.5–2
9.9
%
BM
I
30
+%
OR
(CI)
adju
sted
for
age,
educa
tion
P
Countr
y
Colo
mb
ia6.1
4.2
0.6
(0.3
,1.5
)5.9
6.5
1.0
(0.3
,3.4
)0.3
31
4.2
7.0
1.7
(0.6
,5.4
)7.6
3.8
0.5
(0.2
,1.1
)0.0
42
Mexic
o4.0
3.7
1.0
(0.6
,1.6
)2.9
4.3
1.6
(0.4
,6.5
)0.5
43
2.3
2.6
1.3
(0.4
,4.2
)4.9
5.2
1.0
(0.6
,1.8
)0.9
30
Un
ited
Sta
tes
12.1
19.5
1.4
(0.9
,2.3
)13.5
13.6
1.0
(0.8
,1.2
)0.1
12
10.5
9.7
0.8
(0.6
,1.2
)15.9
19.0
1.2
(1.0
,1.5
)0.1
28
Jap
an
0.5
0.0
F(F
,F)
3.3
5.1
F(F
,F)
F2.6
1.8
F(F
,F)
2.2
11.7
F(F
,F)
FN
ew
Zeala
nd
10.3
14.4
1.3
(1.0
,1.8
)8.7
13.3
1.6
(1.2
,2.1
)*0.3
92
7.3
9.8
1.3
(0.9
,1.8
)11.3
17.4
1.6
(1.3
,2.0
)*0.3
82
Belg
ium
1.7
2.8
1.8
(0.4
,7.9
)5.0
5.0
1.3
(0.5
,3.6
)0.6
97
3.9
2.7
0.8
(0.2
,3.5
)4.1
6.0
2.0
(0.9
,4.7
)0.2
19
Fran
ceF
FF
(F,F
)F
FF
(F,F
)F
4.7
1.7
0.4
(0.1
,1.1
)8.6
15.8
2.2
(0.8
,6.3
)0.0
08
Germ
an
y5.9
0.0
F(F
,F)
3.3
2.2
0.9
(0.4
,2.0
)F
2.2
0.8
0.4
(0.0
,3.7
)4.5
3.4
1.1
(0.4
,2.7
)0.5
22
Italy
3.3
2.6
0.8
(0.3
,2.3
)3.0
1.7
F(F
,F)
0.7
90
1.8
1.3
0.7
(0.2
,2.5
)4.5
3.6
0.8
(0.2
,2.5
)0.8
77
Th
eN
eth
erl
an
ds
5.6
8.9
1.7
(0.7
,4.3
)4.5
16.0
3.3
(1.0
,10.6
)*0.2
00
2.9
3.0
0.8
(0.2
,3.0
)6.8
18.1
3.2
(1.1
,9.3
)*0.0
87
Sp
ain
2.3
3.8
1.9
(1.0
,3.3
)*2.8
0.9
0.4
(0.1
,2.0
)0.0
48
1.8
0.8
0.5
(0.1
,2.0
)3.2
5.7
2.0
(1.1
,3.8
)*0.0
44
Leb
an
on
4.2
1.4
0.3
(0.1
,1.9
)4.7
3.7
F(F
,F)
0.3
47
1.9
0.0
F(F
,F)
7.4
4.5
0.7
(0.2
,3.1
)F
Isra
el
5.4
4.5
0.8
(0.3
,1.8
)3.4
4.1
1.1
(0.7
,1.9
)0.3
75
2.8
4.2
1.5
(0.8
,2.8
)4.7
4.2
0.8
(0.4
,1.4
)0.1
59
Poole
dod
ds
rati
oF
F1.2
(1.0
,1.5
)*F
F1.1
(1.0
,1.3
)F
FF
1.0
(0.8
,1.3
)F
F1.3
(1.2
,1.5
)*F
Ab
bre
viation
s:C
I,co
nfid
en
cein
terv
als
;O
R,od
ds
ratio.F
(F,F
)d
en
ote
sth
at
the
od
ds
ratio
could
not
be
calc
ula
ted
due
tosm
all
cell
size
or
mis
sin
gin
form
ation
.*Pp
0.0
5.
aP-v
alu
eis
for
the
inte
ract
ion
betw
een
ob
esi
tyan
dth
ed
em
og
rap
hic
vari
ab
le(a
ge,
sex
or
ed
uca
tion
)in
pre
dic
tin
gm
en
tal
dis
ord
er
outc
om
e,
for
each
surv
ey.
Obesity and mental disordersKM Scott et al
198
International Journal of Obesity
paradoxically disinhibiting effects of dietary restraint33 or
emotional eating.34 Women are known to be more likely to
engage in binge eating unaccompanied by compensatory
behaviour.31,35 The relationship between obesity and emo-
tional disorders may represent a particularly uncomfortable
juncture for some women between the pressures of the ‘toxic
environment’36 that fuel the global rise in obesity on the one
hand, and the sociocultural pressures that encourage body
dissatisfaction and a drive for thinness among women, on
the other.
This does not presuppose any particular direction in the
relationship between obesity and mental disorder. This study
cannot inform on that issue, and the mechanisms cited here
can be viewed as pathways from both obesity to emotional
disorder (for example, through the effects of stigma,37 or
obesity-related disability38,39) and from emotional disorder
to obesity (for example, through psychologically-mediated
disordered eating,27,34,40 the effects of psychotropic medica-
tion41 or reduced physical activity6). It seems plausible that
given the heterogeneous population of the obese, both
pathways occur. Moreover, for some individuals the associa-
tion of obesity and emotional disorder may be a function of
other factors altogether, either biological,42 genetic7 or
environmental.6
The effects of age were less consistent in this study than
the effect of sex. The only other population study investigat-
ing age in the association between obesity and DSM mental
disorders9 found no significant interaction between age and
obesity in the odds of either mood or anxiety disorders.
However, that study did find that the one age group to show
a significantly higher odds of anxiety disorder among the
obese was the 60 years and over group with an odds ratio of
1.64 (1.02, 2.64). This is similar to the pooled odds observed
in the current study of anxiety disorder among the obese
aged 65 years and over of 1.7 (1.2, 2.3). This finding may
warrant further research, but it needs to be interpreted in the
context of insignificant overall effects of age in the relation-
ship between obesity and anxiety disorders in both the
NCS-R study, and for individual countries in the current
study where the odds of anxiety disorder among the oldest
obese were relatively high (New Zealand, France, United
States: data not shown but available on request).
This first cross-national study of the relationship between
obesity and mental disorders is suggestive of a modest
relationship between obesity (particularly severe obesity)
and emotional disorders for women, in the general popula-
tion, in diverse nations. The study cannot clarify the
direction or nature of that relationship, but it may indicate
a need for a research and clinical focus on the psychological
heterogeneity of the obese population.43,44
Acknowledgements
The surveys included in this report were carried out in
conjunction with the World Health Organization World
Mental Health (WMH) Survey Initiative. We thank the WMH
staff for assistance with instrumentation, fieldwork and data
analysis. These activities were supported by the United States
National Institute of Mental Health (R01-MH070884), the
John D and Catherine T MacArthur Foundation, the Pfizer
Foundation, the US Public Health Service (R13-MH066849,
R01-MH069864 and R01-DA016558), the Fogarty Inter-
national Center (FIRCA R01-TW006481), the Pan American
Health Organization, Eli Lilly and Company, Ortho-McNeil
Pharmaceutical, Inc., GlaxoSmithKline and Bristol-Myers
Squibb. A complete list of WMH publications can be found
at http://www.hcp.med.harvard.edu/wmh/. The Mexican
National Comorbidity Survey (MNCS) is supported by The
National Institute of Psychiatry Ramon de la Fuente
(INPRFMDIES 4280) and by the National Council on Science
and Technology (CONACyT-G30544-H), with supplemental
support from the PanAmerican Health Organization (PAHO).
The Lebanese survey is supported by the Lebanese Ministry
of Public Health, the WHO (Lebanon) and unrestricted
grants from Janssen Cilag, Eli Lilly, GlaxoSmithKline, Roche,
Novartis and anonymous donations. The ESEMeD project
was funded by the European Commission (Contracts QLG5-
1999-01042; SANCO 2004123), the Piedmont Region (Italy),
Fondo de Investigacion Sanitaria, Instituto de Salud Carlos
III, Spain (FIS 00/0028), Ministerio de Ciencia y Tecnologıa,
Spain (SAF 2000-158-CE), Departament de Salut, Generalitat
de Catalunya, Spain and other local agencies and by an
unrestricted educational grant from GlaxoSmithKline. The
Colombian National Study of Mental Health (NSMH) is
supported by the Ministry of Social Protection, with supple-
mental support from the Saldarriaga Concha Foundation.
The Israel National Health Survey is funded by the Ministry
of Health with support from the Israel National Institute for
Health Policy and Health Services Research and the National
Insurance Institute of Israel. The World Mental Health Japan
(WMHJ) Survey is supported by the Grant for Research on
Psychiatric and Neurological Diseases and Mental Health
(H13-SHOGAI-023, H14-TOKUBETSU-026, H16-KOKORO-013)
from the Japan Ministry of Health, Labour and Welfare. The
New Zealand Mental Health Survey (NZMHS) is supported by
the New Zealand Ministry of Health, Alcohol Advisory
Council and the Health Research Council. The US National
Comorbidity Survey Replication (NCS-R) is supported by the
National Institute of Mental Health (NIMH; U01-MH60220)
with supplemental support from the National Institute of
Drug Abuse (NIDA), the Substance Abuse and Mental Health
Services Administration (SAMHSA), the Robert Wood John-
son Foundation (RWJF; Grant 044708) and the John W.
Alden Trust.
References
1 Kim S, Popkin BM. Commentary: understanding the epidemio-logy of overweight and obesity–a real global public healthconcern. Int J Epidemiol 2006; 35: 60–67.
Obesity and mental disordersKM Scott et al
199
International Journal of Obesity
2 Kopelman PG. Obesity as a medical problem. Nature 2000; 404:635–643.
3 Olshansky SJ, Passaro DJ, Hershow MD, Layden J, Carnes BA,Brody J et al. A potential decline in life expectancy in theUnited States in the 21st century. N Engl J Med 2005; 352:1138–1144.
4 Friedman MA, Brownell KD. Psychological correlates of obesity:moving to the next research generation. Psychol Bull 1995; 117:3–20.
5 Onyike CU, Crum RM, Lee HB, Lyketsos CG, Eaton WW. Isobesity associated with major depression? Results from the ThirdNational Health and Nutrition Examination Survey. Am JEpidemiol 2003; 158: 1139–1147.
6 Stunkard A, Faith MS, Allison KC. Depression and obesity. BiolPsychiatry 2003; 54: 330–337.
7 Faith MS, Matz PE, Jorge MA. Obesity–depression associations inthe population. J Psychosom Res 2002; 53: 935–942.
8 Carpenter KM, Hasin DS, Allison DB, Faith MS. Relationshipsbetween obesity and DSM-IV major depressive disorder, suicideideation, and suicide attempts: results from a general populationstudy. Am J Public Health 2000; 90: 251–257.
9 Simon GE, Von Korff M, Saunders K, Miglioretti DL, Crane PK,van Belle G et al. Association between obesity and psychiatricdisorders in the US adult population. Arch Gen Psychiatry 2006;63: 1–7.
10 Scott KM, Oakley Browne MA, McGee MA, Wells JE. Mental-physical comorbidity in Te Rau Hinengaro: the New ZealandMental Health Survey (NZMHS). Aust N Z J Psychiatry 2006; 40:882–888.
11 Popkin BM. The nutrition transition and its health implicationsin lower-income countries. Public Health Nutr 1998; 1: 5–21.
12 WHO. Obesity: Preventing and Managing the Global Epidemic, inWorld Health Organisation Technical Report Series: 894 2000.
13 Demyttenaere K, Bruffaerts R, Posada-Villa J, Gasquet I, Kovess V,Lepine JP et al. Prevalence, severity, and unmet need fortreatment of mental disorders in the World Health OrganizationWorld Mental Health Surveys. JAMA 2004; 291: 2581–2590.
14 Sobal J, Stunkard A. Socioeconomic status and obesity: a review ofthe literature. Psychol Bull 1989; 105: 260–275.
15 Orbach S. Commentary: there is a public health crisisFits not faton the body but fat in the mind and the fat of profits. Int JEpidemiol 2006; 35: 67–69.
16 Kessler RC, Bergland P, Chiu WT, Demler O, Heeringa S, Hiripi Eet al. The US National Comorbidity Survey Replication (NCS-R):design and field procedures. Int J Methods Psychiatr Res 2004; 13:69–92.
17 Kessler RC, Ustun TB. The World Mental Health (WMH) SurveyInitiative Version of the World Health Organisation (WHO)Composite International Diagnostic Interview (CIDI). Int JMethods Psychiatr Res 2004; 13: 93–121.
18 APA. DSM-IV: Diagnostic and Statistical Manual of Mental Disorders,4th edn. American Psychiatric Association: Washington, DC,1994.
19 Haro JM, Arbabzadeh-Bouchez S, Brugha TS, de Girolamo G,Guyer ME, Jin R et al. Concordance of the Composite Inter-national Diagnostic Interview Version 3.0 (CIDI 3.0) withstandardized clinical assessments in the WHO World MentalHealth Surveys. Int J Methods Psychiatr Res 2006; 15: 167–180.
20 Niedhammer I, Bugel I, Bonenfant S, Goldberg M, Leclerc A.Validity of self-reported weight and height in the French GAZELcohort. Int J Obes Relat Metab Disord 2000; 24: 1111–1118.
21 Weaver TW, Kushi LH, McGovern PG, Potter JD, Rich SS, King RA.Validation of self-reported measures of fat distribution. Int J ObesRelat Metab Disord 1996; 20: 644–650.
22 Yun S, Zhu BP, Black W, Brownson RC. A comparison of nationalestimates of obesity prevalence from the behavioural risk factorsurveillance system and the National Health and NutritionExamination Survey. Int J Obes 2006; 30: 164–170.
23 Ministry of Health: A Portrait of Health. Key results of the 2002/03New Zealand Health Survey. Ministry of Health: Wellington, 2004.
24 Wolter KM. Introduction to Variance Estimation. Springer-Verlag:New York, 1985.
25 SUDAAN. Version 8.0.1. Research Triangle Institute: ResearchTriangle Park: NC, 2002.
26 DerSimonian R, Laird N. Meta-analysis in clinical trials. ControlClin Trials 1986; 7: 177–188.
27 Linde JA, Jeffery RW, Levy RL, Sherwood NE, Utter J, Pronk NP.Binge eating disorder, weight control self-efficacy, and depressionin overweight men and women. Int J Obes 2004; 28: 418–425.
28 Brownell KD. Dieting and the search for the perfect body: wherephysiology and culture collide. Behav Ther 1991; 22: 1–12.
29 Chen EY, Brown M. Obesity stigma in sexual relationships. ObesRes 2005; 13: 1393–1397.
30 Striegel-Moore RH, Silberstein LR, Rodin J. Toward anunderstanding of risk factors for bulimia. Am Psychol 1986; 41:246–263.
31 Striegel-Moore RH. Etiology of binge eating: a developmentalperspective. In: Fairburn CG, Wilson GT (eds). Binge Eating:Nature, Assessment and Treatment. Guilford Press: New York, 1993.pp 144–172.
32 Smolak L, Striegel Moore RH. Gender and eating problems. In:Striegel-Moore RH, Smolak L (eds). Eating Disorders: InnovativeDirections in Research and Practice. American PsychologicalAssociation: Washington, DC, 2002.
33 Polivy J, Herman CP. Dieting and binging: a causal analysis.Am Psychol 1985; 40: 193–201.
34 Blair AJ, Lewis VJ, Booth DA. Does emotional eating interferewith success in attempts at weight control? Appetite 1990; 15:151–157.
35 Marcus M. Binge eating and obesity. In: Brownell KD, FairburnCG (eds). Eating Disorders and Obesity: A Comprehensive Handbook.Guilford Press: New York, 1995. pp 441–444.
36 Wadden TA, Brownell KD, Foster GD. Obesity: responding to theglobal epidemic. J Consult Clin Psychol 2002; 70: 510–525.
37 Puhl RM, Brownell KD. Psychosocial origins of obesity stigma:toward changing a powerful and pervasive bias. Obes Rev 2003; 4:213–227.
38 Lidstone JS, Ells LJ, Finn P, Whittaker VJ, Wilkinson JR, Summer-bell CD. Independent associations between weight status anddisability in adults: results from the Health Survey for England.Public Health 2006; 120: 412–417.
39 Houston DK, Stevens J, Cai J. Abdominal fat distribution andfunctional limitations and disability in a biracial cohort: theAtherosclerosis Risk in Communities Study. Int J Obes 2005; 29:1457–1463.
40 McGuire MT, Wing RR, Klem ML, Lang W. What predicts weightregain in a group of successful weight losers? J Consult Clin Psychol1999; 67: 177–185.
41 Schwartz TL, Nihalani N, Jindal S, Virk S, Jones N. Psychiatricmedication-induced obesity: a review. Obes Rev 2004; 5: 115–121.
42 Hasler G, Lissek S, Ajdacic V, Milos G, Gamma A, Eich D et al.Major depression predicts an increase in long-term body weightvariability in young adults. Obes Res 2005; 13: 1991–1998.
43 Brownell KD, Wadden TA. Etiology and treatment of obesity:understanding a serious, prevalent and refractory disorder.J Consult Clin Psychol 1992; 4: 505–517.
44 Foster GD, Kendall PC. The realistic treatment of obesity:changing the scales of success. Clin Psychol Rev 1994; 14: 701–736.
Obesity and mental disordersKM Scott et al
200
International Journal of Obesity

Copyright © 2022 FDOKUMEN

