


Bahasa
Halaman
Hukum

GT-129
THREE DIMENSIONAL NUMERICAL ANALYSIS OF COMPENSATION GROUTING IN COHESIONLESS SOIL
A. A. ALI AND A. L. FAYED Faculty of Engineering, Ain Shams University, Cairo, Egypt [email protected] AND [email protected]
A.A. El-ASHAAL Construction Research Institute
National Water Research Center,[email protected] M.F. YOUNES
Dar Al-Handassah Company Cairo-Egypt., [email protected]
ABSTRACT: Grouting is a non-traditional technique used for soil improvement. One of its advanced applications is compensating the excavation induced settlement and jacking up the affected structures. Different approaches are used to simulate the grouting process by numerical modeling. In this paper, a case study of laboratory testing of grouting in cohesion-less soil is modeled utilizing the three dimensional Finite Difference technique using the FLAC3D software. The numerical model is presented showing how the complex behavior of the grouting process is modeled and the shortcomings of the adopted model. The results of the numerical model and the laboratory model are compared showing the significant capability of the adopted three dimensional finite difference model in simulating the grouting process. Parametric study was conducted to investigate the main parameters affecting the grouting process in which the results are presented. The analysis showed that, the heave resulting from the compensation grouting process is usually preceded by settlement due to soil densification. However, the resultant heave or settlement is highly dependent on the properties of both the injected soil and the grout material.
Keywords: Three dimensional; Compensation grouting; Fracture; Surface deformations.
INTRODUCTION
Grouting is one of the promising soil improvement techniques. Besides the traditional purposes of grouting in sealing or strengthening soft soils, grouting is widely used as a remedial technique for the structures suffering from excessive settlement, to active control the verticality of the structures. There are two main grouting applications, namely compensation grouting used for continuous compensation of excavation induced settlements, and corrective grouting used for re-leveling when excessive settlements have already occurred, Schweiger 1. Both applications lead to an improvement of the soil stiffness and strength in a confined area within the ground. These applications of grouting can be denoted as displacement grouting, Mair 2.
Ground surface deformations are one of the major phenomena associated with the grouting process, hence they are the main monitored parameter through this study. Numerical simulation of the grouting process in great details is impractical due to the complexity of the problem and the unlimited scenarios of the grout travelling through the soil media. Therefore, the global approach is the appropriate way to capture these characteristics of grouting, Soga et al.3.
GT-130
Generally, two basic numerical techniques are used in numerical simulation of grouting process. Prescribed strain approach (direct method) and prescribed stress approach (indirect method) as explained by Wisser4.
This paper presents the prescribed stress approach as a good tool for modeling the grouting
process in cohesion-less soil. Three dimensional finite difference numerical model was established for the grouting simulation and analysis using the FLAC3D software. Numerical results are verified with the grouting experimental results performed by Younes5. Parametric study was conducted to investigate the most effective parameters on the grouting process. NUMERICAL MODELLING OF FRACTURE GROUTING Previous Work
Grouting numerical modeling has been explored in a bulk of recent researches. The global effect of grouting was usually considered in the analysis represented by the volume changes of the grouted elements. The grouted elements are selected from the finite element mesh and then applying either a volumetric strain directly (direct method) or applying internal pressure resulting in volumetric strain (indirect Method). Literatures have considered different approaches of grouting modeling as summarized hereunder;
Kovacevicet et.al 6 used a zero thickness interface element for representing a horizontal grouting sheet for a field trial in London clay. Due to the over-consolidation of the studied clay, only horizontal fractures were occurred. An extension of this approach was introduced by Wisser et al.7 for a three dimensional simulation. This approach has a main shortcoming as it assumes that fractures have a horizontal direction only, which is somewhat invalid.
Schweiger and Falk8 reported on the use of “thermal” expansion for numerical studies on compensation grouting for the Lisbon underground.
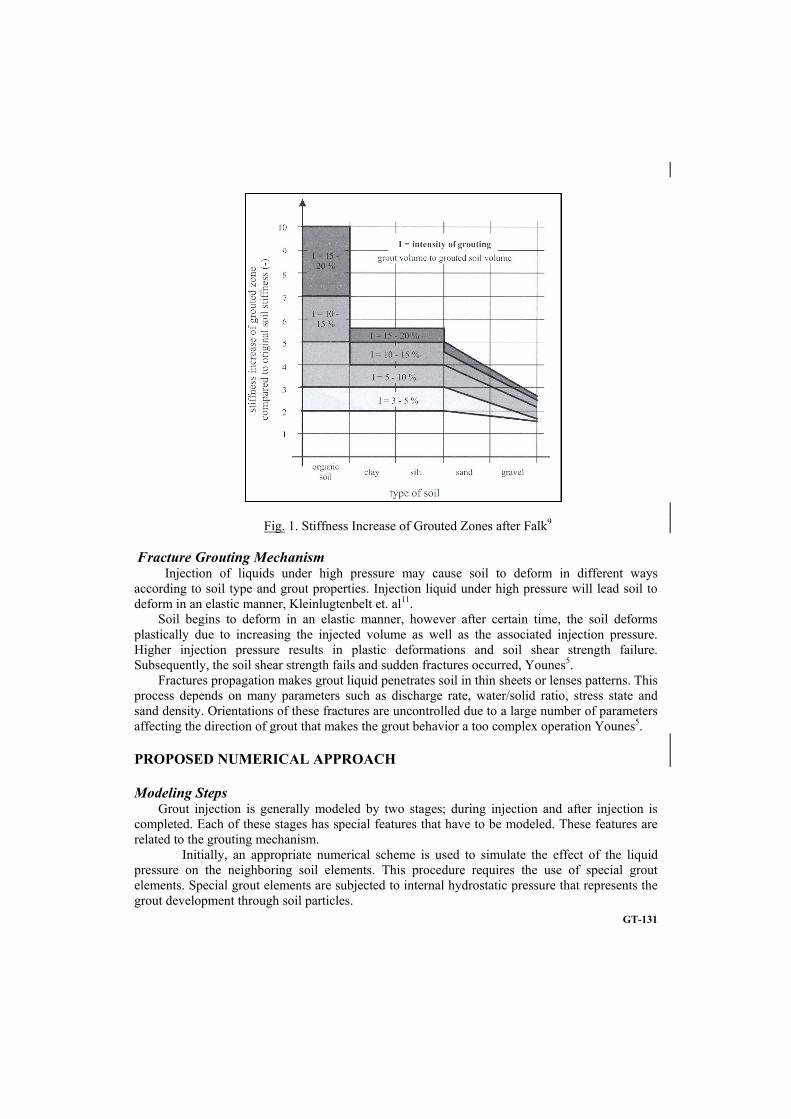
A three dimensional model employing a prescribed pressure approach is described by Soga et al.3. In this research, 3D models, based on the finite difference program FLAC3D were used to simulate the injection process by the application of internal pressure to the relevant solid elements. After the injection completion, an internal pressure was released and the soil stiffness of these elements was increased to an appropriate value according to the soil type. Falk9 proposed stiffness values for the injected soil according to the soil type and grout intensity. Fig (1) shows the curve proposed by Falk9.
Nicolini and Nova10 proposed a numerical model of grouting in granular soils based on the finite difference method. The grouting process was simulated by means of inelastic strains. Depending on the subsoil conditions, both uniform expansion of the bulb and the formations of the grout lenses can be modeled.
GT-131
Fig. 1. Stiffness Increase of Grouted Zones after Falk9
Fracture Grouting Mechanism Injection of liquids under high pressure may cause soil to deform in different ways
according to soil type and grout properties. Injection liquid under high pressure will lead soil to deform in an elastic manner, Kleinlugtenbelt et. al11.
Soil begins to deform in an elastic manner, however after certain time, the soil deforms plastically due to increasing the injected volume as well as the associated injection pressure. Higher injection pressure results in plastic deformations and soil shear strength failure. Subsequently, the soil shear strength fails and sudden fractures occurred, Younes5.
Fractures propagation makes grout liquid penetrates soil in thin sheets or lenses patterns. This process depends on many parameters such as discharge rate, water/solid ratio, stress state and sand density. Orientations of these fractures are uncontrolled due to a large number of parameters affecting the direction of grout that makes the grout behavior a too complex operation Younes5.
PROPOSED NUMERICAL APPROACH
Modeling Steps Grout injection is generally modeled by two stages; during injection and after injection is
completed. Each of these stages has special features that have to be modeled. These features are related to the grouting mechanism.
Initially, an appropriate numerical scheme is used to simulate the effect of the liquid pressure on the neighboring soil elements. This procedure requires the use of special grout elements. Special grout elements are subjected to internal hydrostatic pressure that represents the grout development through soil particles.
GT-132
Finally, once injection process is completed, the grout properties are changed. Grout pressure is released, while the grout stiffness is increased by a factor ranges from two to five times the original soil stiffness value. The percentage of stiffness increases in case of sand was investigated by Falk9. Soil stiffness was improved by factor ranging from two to five times the original soil stiffness value. For conservative analysis, the stiffness of the grout elements was increased by three times the original soil stiffness after injection process is completed. Fig (1) shows the stiffness increase of the grouted zones as proposed by Falk9 for different soil types.
Three dimensional modeling employing this approach is described by Soga et al.3. In these models, based on the finite difference program FLAC3D, the injection process is modeled by application of internal pressure to the relevant solid elements. After injection is completed, the stiffness of these elements is increased to an appropriate value. The present research studies the initial grouting stage only during the application of the internal pressure.
In numerical models based on prescribed stress approach (Indirect Method), the grout injection is controlled by the application of pressure not volume. However, the possibility for imposing a specified volume still exists by terminating the grouting process when the volumetric strain value is equal to the real volumetric strain, Wisser4. The resulted volumetric strain of the grouted elements is directly related to the grout injected volume. The volumetric strain of an element can be calculated using the following equation
v
viv
Where vi: The increase in the element volume due to applying stresses or strains. v0: The initial element volume of the treated soil.
: The assumed grouting efficiency. The volumetric strains are calculated automatically by the finite difference program after
applying pressure to the grouted elements. The resultant volumetric strains are compared to the real volumetric strains for analysis verification. Trials were made to ensure that the grout volume injected into the mesh reached the real value in the lab.
The main difference between numerical modeling of compaction grouting and fracture grouting is the artificial expansion of the pressure. For compaction grouting, isotropic condition (equal vertical and horizontal pressures) is used to simulate the Bulb Expansion or Cavity Expansion, however for fracture grouting process, anisotropic condition (vertical pressure differs from the horizontal pressure) is used, Younes5.
Modeling Approach Indirect method or prescribed stress approach by Soga et al.3, depends on applying a
factitious pressure to the injection elements resulting in volumetric strain. The value of this factitious pressure is unknown as it is a mere imaginary value that results in the predetermined strain.
Comparing the real volumetric strains with the resultant volumetric strains values helps in determining the correct value of the factitious pressure to be used in the numerical modeling. Many trails have to be carried out to determine the proper pressure value leading to the real volumetric strain.
In the present study, the factitious pressure values used in the numerical modeling are proposed values that are not related to the real injected pressure values. The resultant volumetric strain is the sole parameter in the grouting simulation that can be controlled.
GT-133
FLAC3D 3.00
Itasca Consulting Group, Inc.Minneapolis, MN USA
Step 3300 Model Perspective07:39:41 Thu May 22 2008
Center: X: 1.000e+000 Y: 4.998e-001 Z: 1.000e+000
Rotation: X: 300.000 Y: 40.000 Z: 0.000
Dist: 6.030e+000 Mag.: 0.8Ang.: 22.500
View Title: Proposed Finite Difference Mesh
Surface Magfac = 1.000e+000
MODEL DESCRIPTION
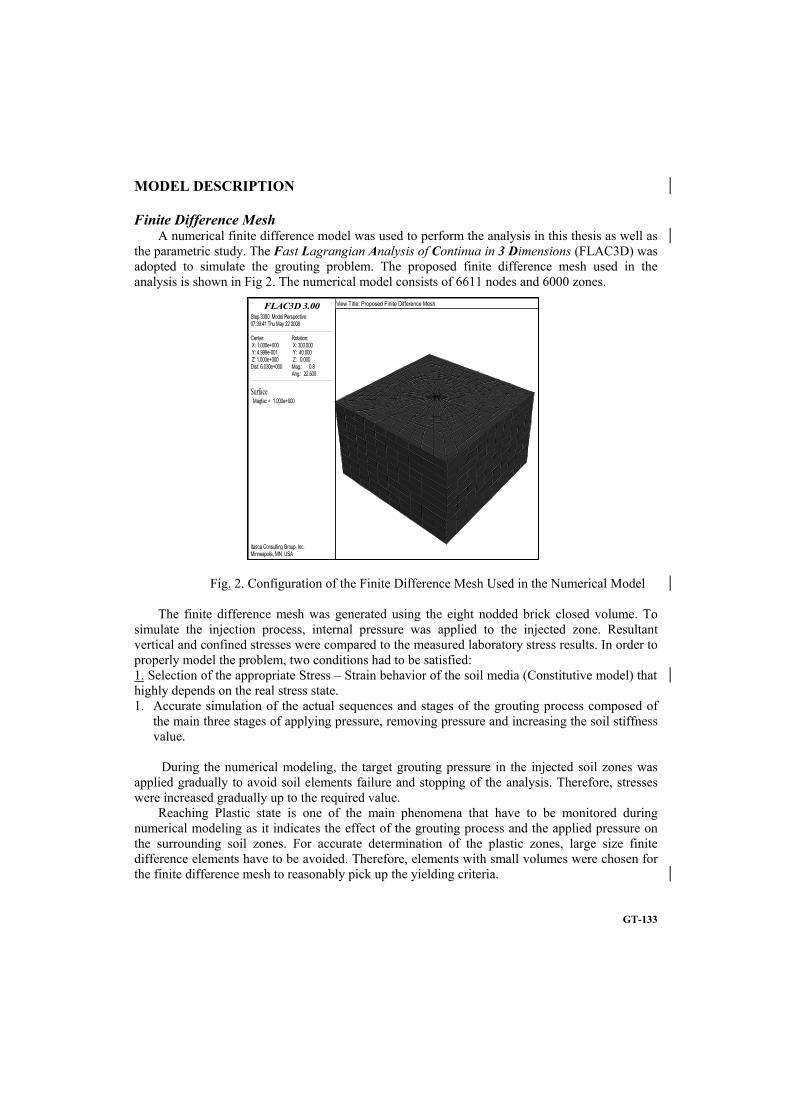
Finite Difference Mesh A numerical finite difference model was used to perform the analysis in this thesis as well as
the parametric study. The Fast Lagrangian Analysis of Continua in 3 Dimensions (FLAC3D) was adopted to simulate the grouting problem. The proposed finite difference mesh used in the analysis is shown in Fig 2. The numerical model consists of 6611 nodes and 6000 zones.
Fig. 2. Configuration of the Finite Difference Mesh Used in the Numerical Model
The finite difference mesh was generated using the eight nodded brick closed volume. To simulate the injection process, internal pressure was applied to the injected zone. Resultant vertical and confined stresses were compared to the measured laboratory stress results. In order to properly model the problem, two conditions had to be satisfied: 1. Selection of the appropriate Stress – Strain behavior of the soil media (Constitutive model) thathighly depends on the real stress state. 1. Accurate simulation of the actual sequences and stages of the grouting process composed of
the main three stages of applying pressure, removing pressure and increasing the soil stiffness value.
During the numerical modeling, the target grouting pressure in the injected soil zones was applied gradually to avoid soil elements failure and stopping of the analysis. Therefore, stresses were increased gradually up to the required value.
Reaching Plastic state is one of the main phenomena that have to be monitored during numerical modeling as it indicates the effect of the grouting process and the applied pressure on the surrounding soil zones. For accurate determination of the plastic zones, large size finite difference elements have to be avoided. Therefore, elements with small volumes were chosen for the finite difference mesh to reasonably pick up the yielding criteria.
GT-134
Constitutive Model In order to keep the complexity of the problem within reasonable limits, the Mohr-Coulomb
Elasto-Plastic constitutive model was used to model both the natural and improved soil behaviors. The elastic stiffness is assumed to be stress dependent.
The Elasto-Plastic Mohr-Coulomb model is characterized by five parameters; Young’s Modulus (E), Poisson’s Ratio (υ), Soil Cohesion (C), Soil friction angle (φ) and the soil dilatancy angle (ψ). Table (1) shows the Constitutive soil model parameters used through the analysis.
Table 1 Soil Parameters Used in the Numerical Analysis Verification
Young’s Modulus (E) (kN/m2) Poisson’s Ratio (υ)
Friction angle (φ) (Degrees)
Dilation angle (ψ) (Degrees)
20000 0.30 28.00 8.00
FLAC3D have two main inputs in the Mohr-Coulomb model; Bulk modulus (K) and shear modulus (G) that are related to Young’s Modulus (E) and Poissons Ratio (υ) by the following equations:
)21(3
EK ( 2 )
)1(2
EG ( 3 )
FLAC3D program uses the bulk and shear moduli instead of Young’s modulus and Poisson’s ratio.
VERIFICATION OF THE NUMERICAL MODEL RESULTS
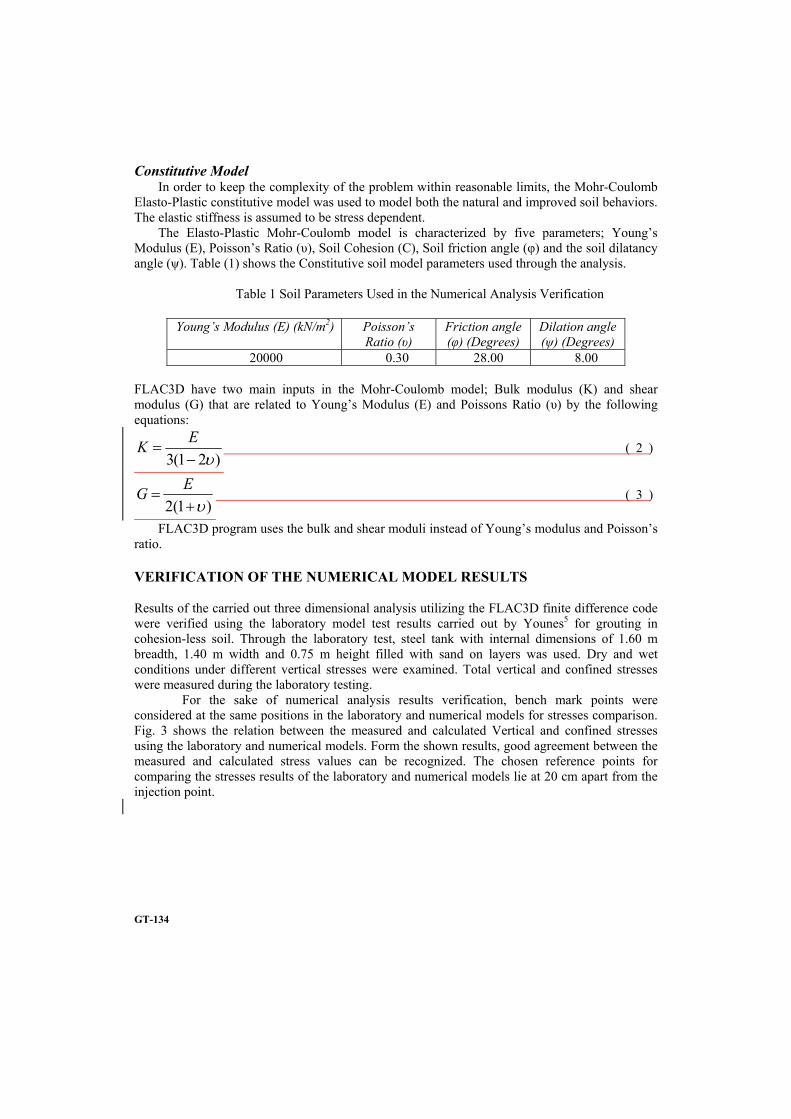
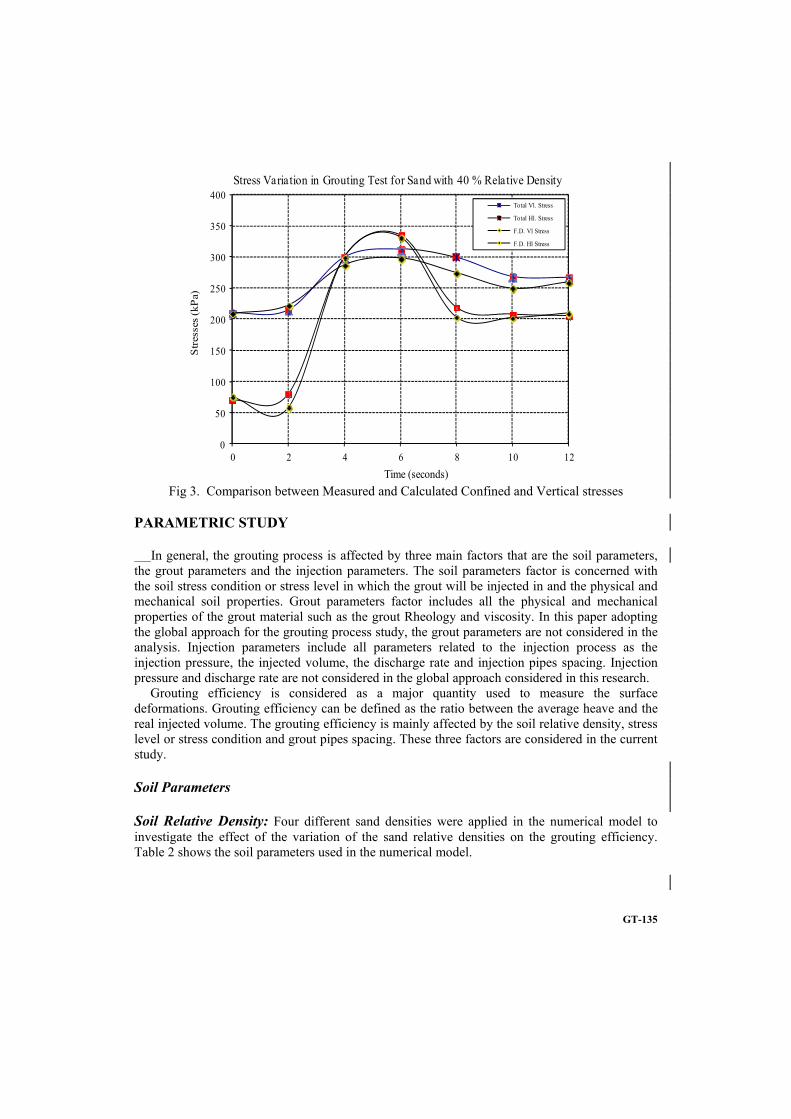
Results of the carried out three dimensional analysis utilizing the FLAC3D finite difference code were verified using the laboratory model test results carried out by Younes5 for grouting in cohesion-less soil. Through the laboratory test, steel tank with internal dimensions of 1.60 m breadth, 1.40 m width and 0.75 m height filled with sand on layers was used. Dry and wet conditions under different vertical stresses were examined. Total vertical and confined stresses were measured during the laboratory testing.
For the sake of numerical analysis results verification, bench mark points were considered at the same positions in the laboratory and numerical models for stresses comparison. Fig. 3 shows the relation between the measured and calculated Vertical and confined stresses using the laboratory and numerical models. Form the shown results, good agreement between the measured and calculated stress values can be recognized. The chosen reference points for comparing the stresses results of the laboratory and numerical models lie at 20 cm apart from the injection point.
GT-135
Fig 3. Comparison between Measured and Calculated Confined and Vertical stresses
PARAMETRIC STUDY
In general, the grouting process is affected by three main factors that are the soil parameters, the grout parameters and the injection parameters. The soil parameters factor is concerned with the soil stress condition or stress level in which the grout will be injected in and the physical and mechanical soil properties. Grout parameters factor includes all the physical and mechanical properties of the grout material such as the grout Rheology and viscosity. In this paper adopting the global approach for the grouting process study, the grout parameters are not considered in the analysis. Injection parameters include all parameters related to the injection process as the injection pressure, the injected volume, the discharge rate and injection pipes spacing. Injection pressure and discharge rate are not considered in the global approach considered in this research.
Grouting efficiency is considered as a major quantity used to measure the surface deformations. Grouting efficiency can be defined as the ratio between the average heave and the real injected volume. The grouting efficiency is mainly affected by the soil relative density, stress level or stress condition and grout pipes spacing. These three factors are considered in the current study.
Soil Parameters
Soil Relative Density: Four different sand densities were applied in the numerical model to investigate the effect of the variation of the sand relative densities on the grouting efficiency. Table 2 shows the soil parameters used in the numerical model.
0
50
100
150
200
250
300
350
400
0 2 4 6 8 10 12
Str
esse
s (k
Pa)
Time (seconds)
Stress Variation in Grouting Test for Sand with 40 % Relative Density
Total Vl. Stress
Total Hl. Stress
F.D. Vl Stress
F.D. Hl Stress
GT-136
Table 2. Soil Parameters Used in the Analysis
Soil Elasticity Soil Plasticity Sand Relative Density (%) Bulk Modulus
(K) (kPa)
Shear Modulus (G) (kPa)
Friction Angle (degrees)
Dilation Angle (degrees)
40 5556 1853 28 7
60 8889 2963 30 10
80 13333 4444 32 12
90 17778 5926 36 15
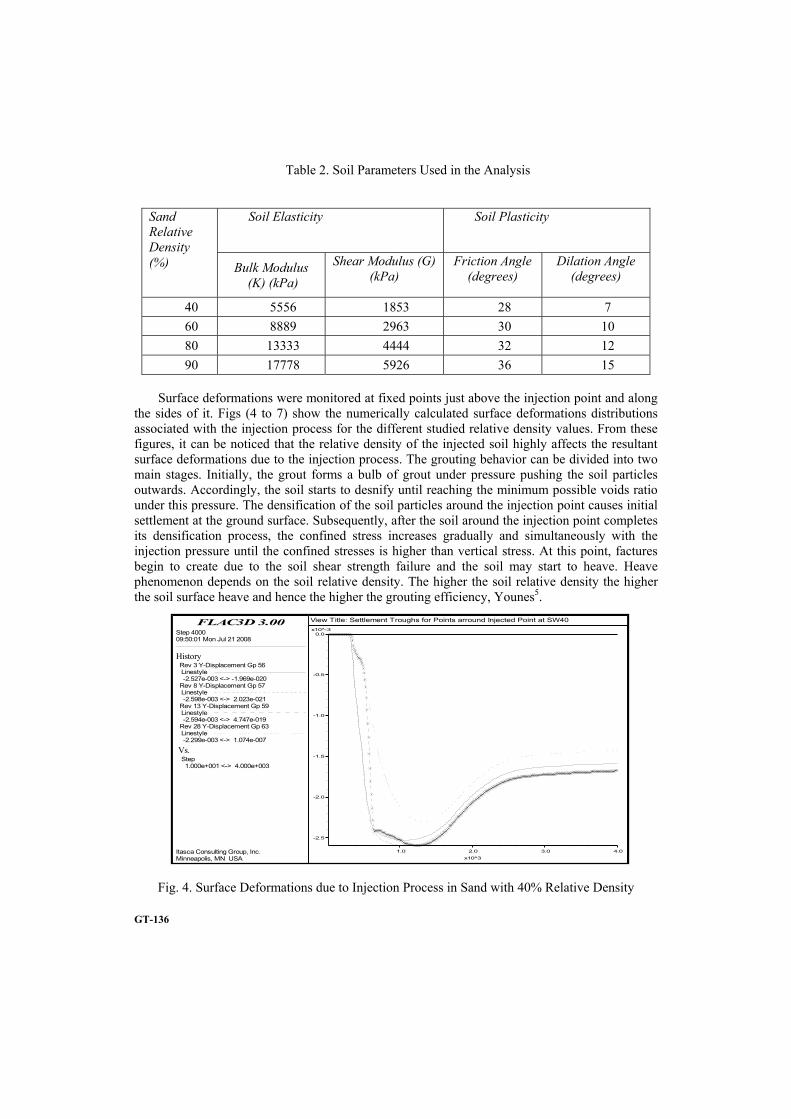
Surface deformations were monitored at fixed points just above the injection point and along the sides of it. Figs (4 to 7) show the numerically calculated surface deformations distributions associated with the injection process for the different studied relative density values. From these figures, it can be noticed that the relative density of the injected soil highly affects the resultant surface deformations due to the injection process. The grouting behavior can be divided into two main stages. Initially, the grout forms a bulb of grout under pressure pushing the soil particles outwards. Accordingly, the soil starts to desnify until reaching the minimum possible voids ratio under this pressure. The densification of the soil particles around the injection point causes initial settlement at the ground surface. Subsequently, after the soil around the injection point completes its densification process, the confined stress increases gradually and simultaneously with the injection pressure until the confined stresses is higher than vertical stress. At this point, factures begin to create due to the soil shear strength failure and the soil may start to heave. Heave phenomenon depends on the soil relative density. The higher the soil relative density the higher the soil surface heave and hence the higher the grouting efficiency, Younes5.
Fig. 4. Surface Deformations due to Injection Process in Sand with 40% Relative Density
FLAC3D 3.00
Itasca Consulting Group, Inc.Minneapolis, MN USA
Step 400009:50:01 Mon Jul 21 2008
View Title: Settlement Troughs for Points arround Injected Point at SW40
History
1.0 2.0 3.0 4.0
x10^3
-2.5
-2.0
-1.5
-1.0
-0.5
0.0x10^-3
Rev 3 Y-Displacement Gp 56 Linestyle -2.527e-003 <-> -1.969e-020 Rev 8 Y-Displacement Gp 57 Linestyle -2.598e-003 <-> 2.023e-021 Rev 13 Y-Displacement Gp 59 Linestyle -2.594e-003 <-> 4.747e-019 Rev 28 Y-Displacement Gp 63 Linestyle -2.299e-003 <-> 1.074e-007
Vs. Step 1.000e+001 <-> 4.000e+003
GT-137
FLAC3D 3.00
Itasca Consulting Group, Inc.Minneapolis, MN USA
Step 400016:22:14 Tue Jul 15 2008
View Title: Settlement Troughs for the Points Around the Injected Point at SW80
History
1.0 2.0 3.0 4.0
x10^3
-2.0
-1.5
-1.0
-0.5
0.0
0.5
1.0
1.5
x10^-3
Rev 3 Y-Displacement Gp 56 Linestyle -2.051e-003 <-> -8.206e-021
Rev 8 Y-Displacement Gp 57 Linestyle -1.993e-003 <-> 2.311e-020
Rev 13 Y-Displacement Gp 59 Linestyle -2.574e-004 <-> 1.636e-003
Rev 28 Y-Displacement Gp 63 Linestyle -8.656e-004 <-> 3.802e-004
Vs. Step 1.000e+001 <-> 4.000e+003
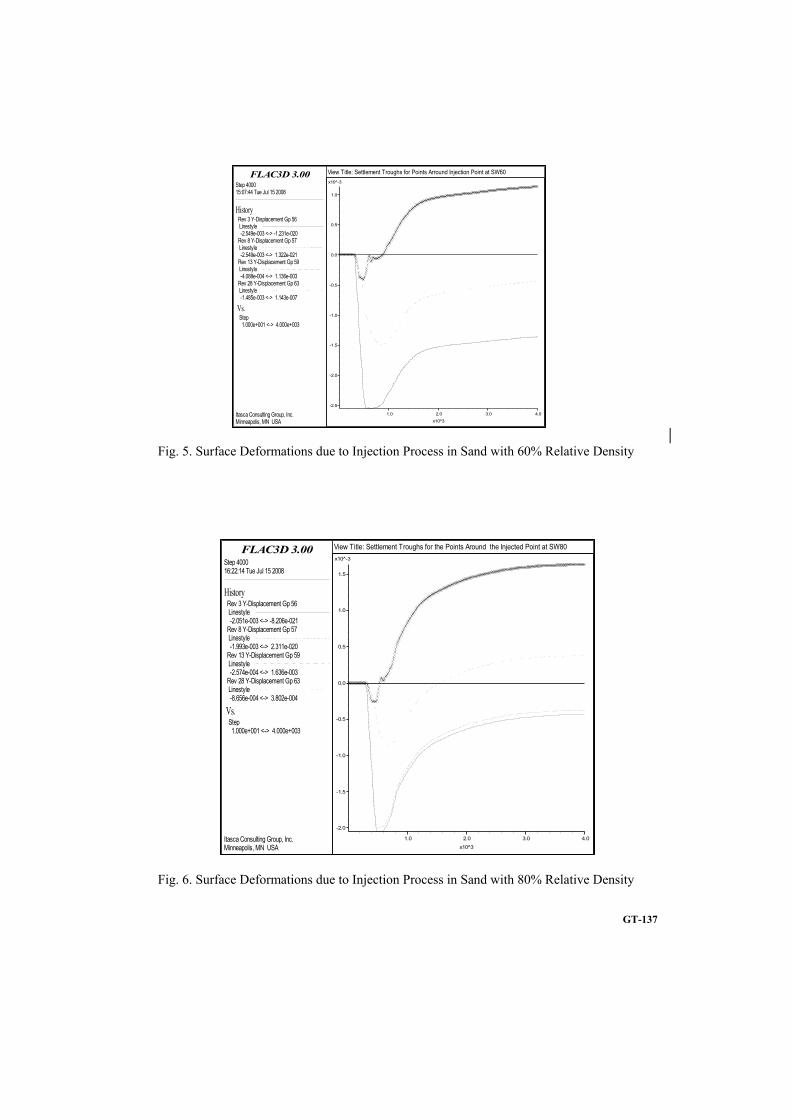
Fig. 5. Surface Deformations due to Injection Process in Sand with 60% Relative Density
Fig. 6. Surface Deformations due to Injection Process in Sand with 80% Relative Density
FLAC3D 3.00
Itasca Consulting Group, Inc.Minneapolis, MN USA
Step 400015:07:44 Tue Jul 15 2008
View Title: Settlement Troughs for Points Arround Injection Point at SW60
History
1.0 2.0 3.0 4.0
x10^3
-2.5
-2.0
-1.5
-1.0
-0.5
0.0
0.5
1.0
x10^-3
Rev 3 Y-Displacement Gp 56 Linestyle -2.549e-003 <-> -1.231e-020 Rev 8 Y-Displacement Gp 57 Linestyle -2.549e-003 <-> 1.322e-021 Rev 13 Y-Displacement Gp 59 Linestyle -4.088e-004 <-> 1.136e-003 Rev 28 Y-Displacement Gp 63 Linestyle -1.485e-003 <-> 1.143e-007
Vs. Step 1.000e+001 <-> 4.000e+003
GT-138
FLAC3D 3.00
Itasca Consulting Group, Inc.Minneapolis, MN USA
Step 400010:34:45 Wed Jul 16 2008
View Title: Settlement Troughs for the Points Arround the Injected point at SW90
History
1.0 2.0 3.0 4.0
x10^3
-1.0
-0.5
0.0
0.5
1.0
1.5
2.0
2.5
x10^-3
Rev 3 Y-Displacement Gp 56 Linestyle
-1.284e-003 <-> 7.593e-004 Rev 8 Y-Displacement Gp 57 Linestyle
-1.209e-003 <-> 8.215e-004 Rev 13 Y-Displacement Gp 59 Linestyle
-3.409e-005 <-> 2.564e-003 Rev 28 Y-Displacement Gp 63 Linestyle
-1.833e-004 <-> 1.292e-003
Vs. Step
1.000e+001 <-> 4.000e+003
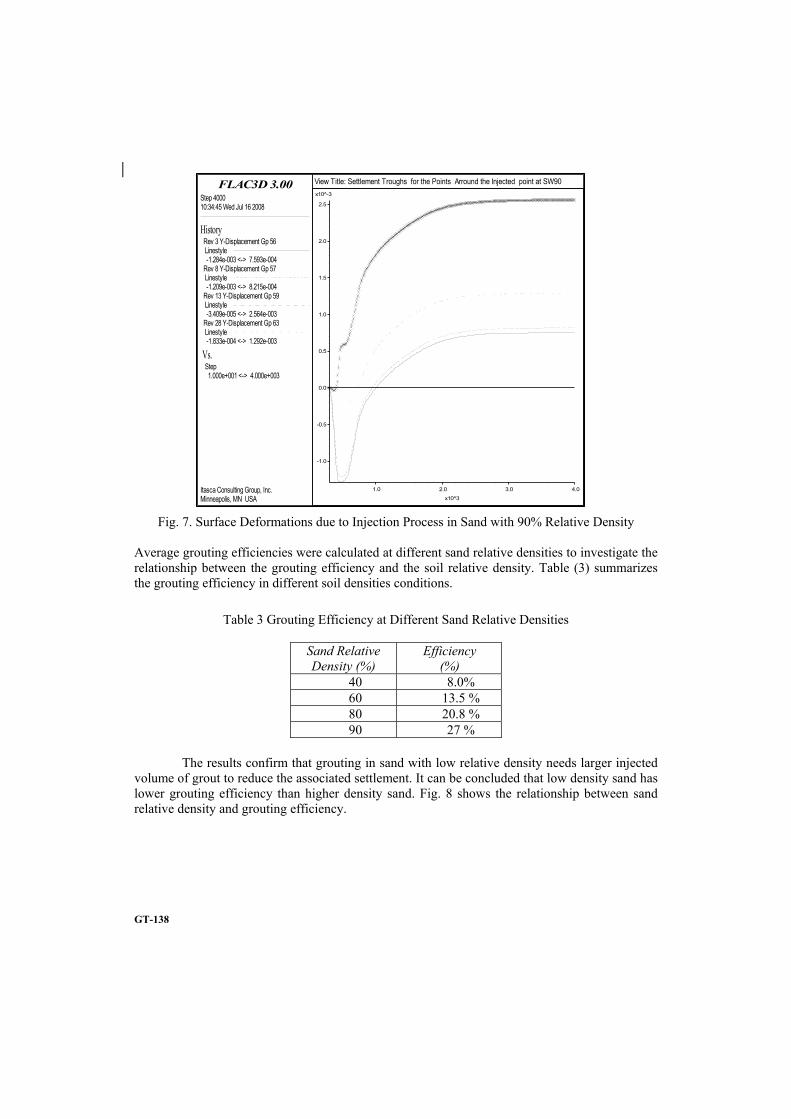
Fig. 7. Surface Deformations due to Injection Process in Sand with 90% Relative Density
Average grouting efficiencies were calculated at different sand relative densities to investigate the relationship between the grouting efficiency and the soil relative density. Table (3) summarizes the grouting efficiency in different soil densities conditions.
Table 3 Grouting Efficiency at Different Sand Relative Densities
Sand Relative Density (%)
Efficiency (%)
40 8.0%60 13.5 %80 20.8 %90 27 %
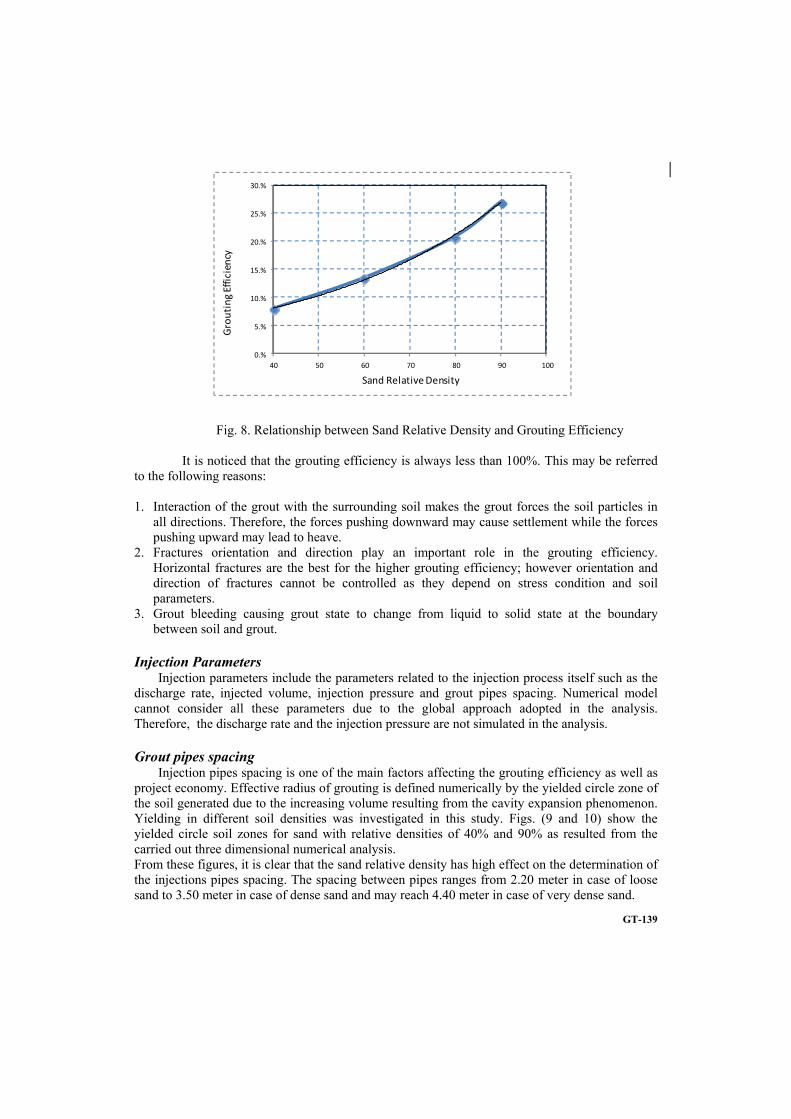
The results confirm that grouting in sand with low relative density needs larger injected volume of grout to reduce the associated settlement. It can be concluded that low density sand has lower grouting efficiency than higher density sand. Fig. 8 shows the relationship between sand relative density and grouting efficiency.
GT-139
0.%
5.%
10.%
15.%
20.%
25.%
30.%
40 50 60 70 80 90 100
Grouting Efficiency
Sand Relative Density
Fig. 8. Relationship between Sand Relative Density and Grouting Efficiency
It is noticed that the grouting efficiency is always less than 100%. This may be referred to the following reasons:
1. Interaction of the grout with the surrounding soil makes the grout forces the soil particles inall directions. Therefore, the forces pushing downward may cause settlement while the forces pushing upward may lead to heave.
2. Fractures orientation and direction play an important role in the grouting efficiency.Horizontal fractures are the best for the higher grouting efficiency; however orientation and direction of fractures cannot be controlled as they depend on stress condition and soil parameters.
3. Grout bleeding causing grout state to change from liquid to solid state at the boundarybetween soil and grout.
Injection Parameters Injection parameters include the parameters related to the injection process itself such as the
discharge rate, injected volume, injection pressure and grout pipes spacing. Numerical model cannot consider all these parameters due to the global approach adopted in the analysis. Therefore, the discharge rate and the injection pressure are not simulated in the analysis.
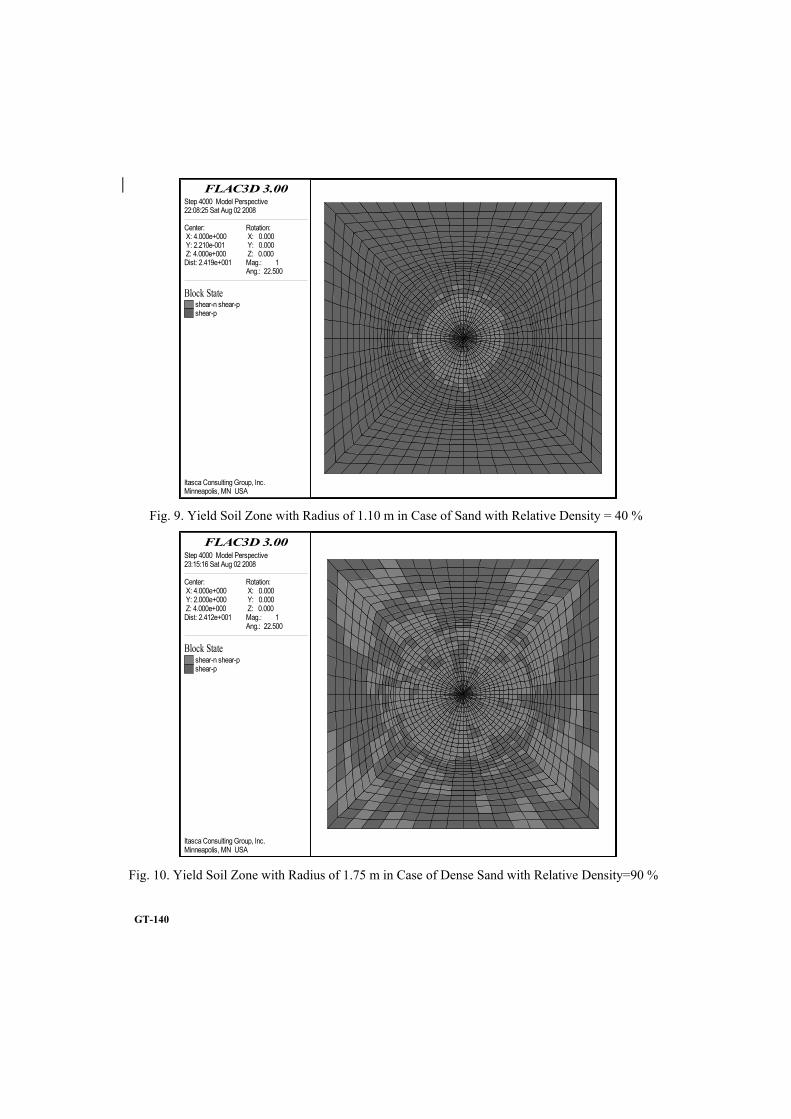
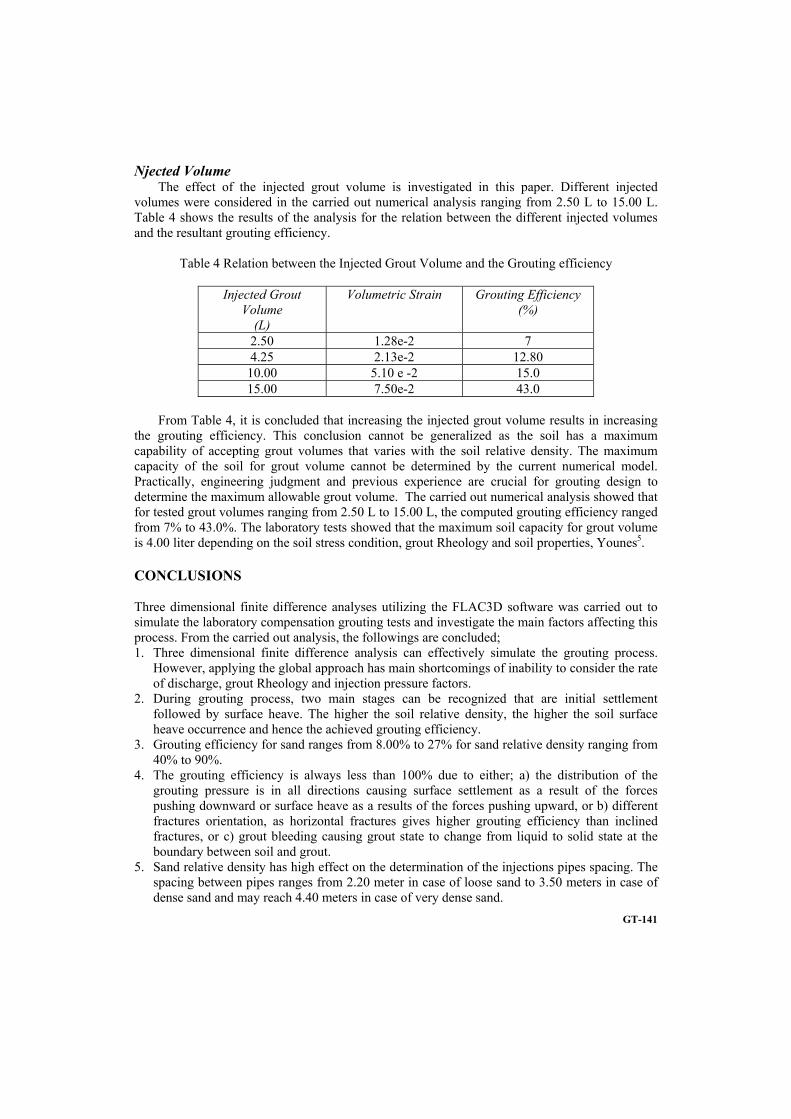
Grout pipes spacing Injection pipes spacing is one of the main factors affecting the grouting efficiency as well as
project economy. Effective radius of grouting is defined numerically by the yielded circle zone of the soil generated due to the increasing volume resulting from the cavity expansion phenomenon. Yielding in different soil densities was investigated in this study. Figs. (9 and 10) show the yielded circle soil zones for sand with relative densities of 40% and 90% as resulted from the carried out three dimensional numerical analysis. From these figures, it is clear that the sand relative density has high effect on the determination of the injections pipes spacing. The spacing between pipes ranges from 2.20 meter in case of loose sand to 3.50 meter in case of dense sand and may reach 4.40 meter in case of very dense sand.
GT-140
FLAC3D 3.00
Itasca Consulting Group, Inc.Minneapolis, MN USA
Step 4000 Model Perspective22:08:25 Sat Aug 02 2008
Center: X: 4.000e+000 Y: 2.210e-001 Z: 4.000e+000
Rotation: X: 0.000 Y: 0.000 Z: 0.000
Dist: 2.419e+001 Mag.: 1Ang.: 22.500
Block Stateshear-n shear-pshear-p
Fig. 9. Yield Soil Zone with Radius of 1.10 m in Case of Sand with Relative Density = 40 %
Fig. 10. Yield Soil Zone with Radius of 1.75 m in Case of Dense Sand with Relative Density=90 %
FLAC3D 3.00
Itasca Consulting Group, Inc.Minneapolis, MN USA
Step 4000 Model Perspective23:15:16 Sat Aug 02 2008
Center: X: 4.000e+000 Y: 2.000e+000 Z: 4.000e+000
Rotation: X: 0.000 Y: 0.000 Z: 0.000
Dist: 2.412e+001 Mag.: 1Ang.: 22.500
Block Stateshear-n shear-pshear-p
GT-141
Njected Volume The effect of the injected grout volume is investigated in this paper. Different injected
volumes were considered in the carried out numerical analysis ranging from 2.50 L to 15.00 L. Table 4 shows the results of the analysis for the relation between the different injected volumes and the resultant grouting efficiency.
Table 4 Relation between the Injected Grout Volume and the Grouting efficiency
Injected Grout Volume
(L)
Volumetric Strain Grouting Efficiency (%)
2.50 1.28e-2 74.25 2.13e-2 12.8010.00 5.10 e -2 15.015.00 7.50e-2 43.0
From Table 4, it is concluded that increasing the injected grout volume results in increasing the grouting efficiency. This conclusion cannot be generalized as the soil has a maximum capability of accepting grout volumes that varies with the soil relative density. The maximum capacity of the soil for grout volume cannot be determined by the current numerical model. Practically, engineering judgment and previous experience are crucial for grouting design to determine the maximum allowable grout volume. The carried out numerical analysis showed that for tested grout volumes ranging from 2.50 L to 15.00 L, the computed grouting efficiency ranged from 7% to 43.0%. The laboratory tests showed that the maximum soil capacity for grout volume is 4.00 liter depending on the soil stress condition, grout Rheology and soil properties, Younes5.
CONCLUSIONS
Three dimensional finite difference analyses utilizing the FLAC3D software was carried out to simulate the laboratory compensation grouting tests and investigate the main factors affecting this process. From the carried out analysis, the followings are concluded; 1. Three dimensional finite difference analysis can effectively simulate the grouting process.
However, applying the global approach has main shortcomings of inability to consider the rate of discharge, grout Rheology and injection pressure factors.
2. During grouting process, two main stages can be recognized that are initial settlementfollowed by surface heave. The higher the soil relative density, the higher the soil surface heave occurrence and hence the achieved grouting efficiency.
3. Grouting efficiency for sand ranges from 8.00% to 27% for sand relative density ranging from40% to 90%.
4. The grouting efficiency is always less than 100% due to either; a) the distribution of thegrouting pressure is in all directions causing surface settlement as a result of the forces pushing downward or surface heave as a results of the forces pushing upward, or b) different fractures orientation, as horizontal fractures gives higher grouting efficiency than inclined fractures, or c) grout bleeding causing grout state to change from liquid to solid state at the boundary between soil and grout.
5. Sand relative density has high effect on the determination of the injections pipes spacing. Thespacing between pipes ranges from 2.20 meter in case of loose sand to 3.50 meters in case of dense sand and may reach 4.40 meters in case of very dense sand.
GT-142
6. Increasing the injected grout volume results in increasing the grouting efficiency provided thatthe maximum soil capacity for receiving grout is not achieved (Refusal).
REFERENCES
[1] Schweiger, H. F., Kummer, C. Otterbein, R. and Flak, E. (2004) “Numerical Modeling of Settlement Compensation by Means of Fracture Grouting.” Japanese Geotechnical Society Vol. (44), No. (1), P.P 71-86.
[2] Mair, R.(1994): Report on session 4:Displacement grouting. Proc. Int. Conf. Grouting in the Ground. (ed. By Bell), T. Telford London 375-384.
[3] Soga, K., Bolton, M.D., AU, S.K.A., Komiya, K., Hamelin ,J.P., Van Cotthem, A., Buchet, G., Michel, J.P., (2000) “Development of Compensation Grouting Modeling and Control System.” Proc. Int. Symp. On Geotechnical Aspect of Underground Construction in soft Ground (ed. By Kusakabe et al.) Tokyo, Balkema, Rotterdam, P.P. 425-430.
[4] Wisser, C., Augarde, C.E., and Burd H.J., (2005) “Numerical Modeling of Compensation Grouting above Shallow Tunnels.” International Journal for numerical and analytical methods in Geomechanics, vol. 29 p.p 443-471.
[5] Younes, M. F., (2009), PhD. Thesis, “Effect of Grouting Process on Ground Surface Deformations in Non-Cohesive Soil.” Ain Shams University, Cairo-Egypt.
[6] Kovacevio, N., Edmonds, H.E., Mair, R.J., Higgings, K.G. and Potts, D. (1996) “ Numerical Modeling of NATM and Compensation Grouting Trails at Red-cross Way.” Proc. Int. Symp. On Geotech. Aspects of Underground Construction in soft Ground, (eds. By Mair and Taylor), London 553 – 559 (quoted from Schweiger (2004)).
[7] Wisser, C., Augrade, C.E. and Burd, H.J., (2001): “Three Dimensional Finite Element Modeling of Compensation Grouting.” Proc. 10th int. conference on computer methods and advances in Geomechanics. (eds. By Desai et al.), 2001, Tuscon, Balkema, Rotterdam, 1731-1736.
[8] Schweiger, H. F., and Flak, E. (1998): “Reduction of Settlement by Compensation Grouting- Numerical Studies and experience from Lisbon underground.” Proc. World Tunnel Congress. (eds by Negro and Ferreira), Sao Paolo, 1998.
[9] Falk, E. (1998), “Soil Improvement by Injection of Solid Material with Hydraulic Energy” PhD. Thesis (German) “quoted from SCHWEIGER Feb (2004).
[10] Nicolini E., Nova R., (2000) “Modeling of a Tunnel Excavation in a non Cohesive Soil Improved with Cement Mix Injections.” Computer and Geotechnics (27). Elsevier Science Ltd: London 2000; 249-272.
[11] Kleinlugtenbelt R., Bezuijen A., Tol F. V., (2006), “Model Tests on Compensation Grouting.” Tunneling and Under Ground Space Technology Vol. (21) issue 3-4, Elsevier Science Ltd: London 2000.
Top Related
Copyright © 2022 FDOKUMEN

