

Bahasa
Halaman
Hukum

Computers and the Humanities 37: 293–315, 2003.© 2003 Kluwer Academic Publishers. Printed in the Netherlands.
293
Norwegian Dialects Examined Perceptually andAcoustically
WILBERT HEERINGA and CHARLOTTE GOOSKENSFaculty of Arts, Humanities Computing and Scandinavian Languages, University of Groningen, theNetherlands
Abstract. Gooskens (2003) described an experiment which determined linguistic distances between15 Norwegian dialects as perceived by Norwegian listeners. The results are compared to Levenshteindistances, calculated on the basis of transcriptions (of the words) of the same recordings as usedin the perception experiment. The Levenshtein distance is equal to the sum of the weights of theinsertions, deletions and substitutions needed to change one pronunciation into another. The successof the method depends on the reliability of the transcriber. The aim of this paper is to find an acousticdistance measure between dialects which approximates perceptual distance measure. We use andcompare different representations of the acoustic signal: Barkfilter spectrograms, cochleagrams andformant tracks. We now apply the Levenshtein algorithm to spectra or formant value bundles insteadof transcription segments. From these acoustic representations we got the best results using theformant track representation. However the transcription-based Levenshtein distances correlate stillmore closely. In the acoustic signal the speaker-dependent influence is kept to some extent, while atranscriber abstracts from voice quality. Using more samples per dialect word (instead of only one asin our research) should improve the accuracy of the measurements.
Key words: Barkfilter, cochleagram, dialect, dialectology, dialectometry, phonetic (dis)similarity,spectrogram
1. Introduction
Kessler (1995) introduced the use of the Levenshtein distance as a tool formeasuring dialect distances. The Levenshtein distance is a string edit distancemeasure, and Kessler applied this algorithm to the comparison of Irish dialects.Later on, this approach was taken up by Nerbonne et al. (1996) and applied toDutch dialects. The technique was also applied to Sardinian dialects by Bolognesiand Heeringa (2002). In all cases the use of the Levenshtein distance was basedon phonetic transcriptions, where transcription segments were aligned by thealgorithm. A detailed description of the basic algorithm is given by Kruskal (1999).
Gooskens and Heeringa (2003) calculated Levenshtein distances between 15Norwegian dialects and compared them to the distances as perceived by Norwegianlisteners. This comparison showed a high correlation between the Levenshteindistances and the perceptual distances. This investigation was based on existingrecordings and corresponding phonetic transcriptions of the same text read aloud
294 WILBERT HEERINGA AND CHARLOTTE GOOSKENS
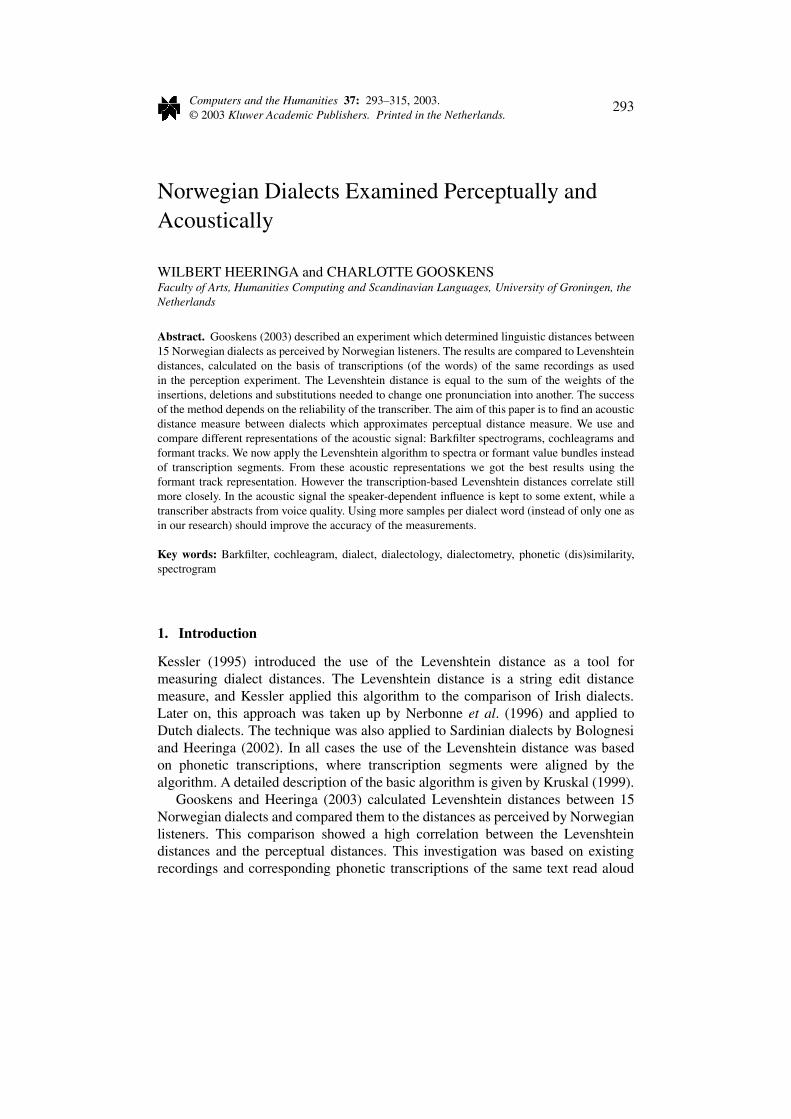
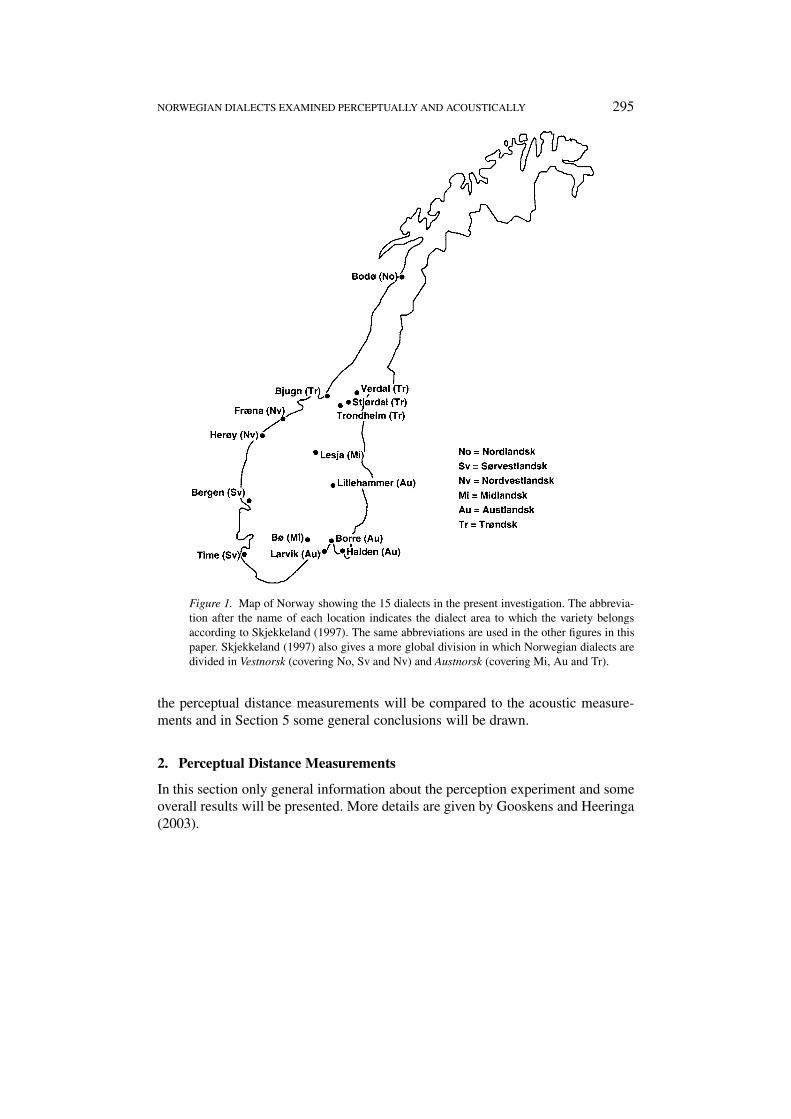
in 15 Norwegian dialects.1 The recordings were made in a soundproof studio in theautumn of 1999 and the spring of 2000. The microphone used for the recordingswas a MILAB LSR-1000 and the recordings were made in DAT format usinga FOSTEX D-10 Digital Master Recorder. They were edited by means of CoolEdit 96 and made available at the world wide web. There were 4 male and 11female speakers. The average age of these speakers was 30.5 years. The speakersall read aloud the same text, namely the Norwegian version of the fable “The NorthWind and the Sun”. Further details about the material are given by Gooskensand Heeringa (2003). The same material is used for the present investigation. InFigure 1 the geographical distribution of the dialects is shown. The dialects arespread over a large part of the Norwegian language area, and cover most majordialect areas as found on the traditional map of Skjekkeland (1997, p. 276). On thismap the Norwegian language area is divided in nine dialect areas. In our set of 15varieties six areas are represented.
The Levenshtein distance measurements used in previous studies are based onphonetic transcriptions. However it is time-consuming to make phonetic transcrip-tions and furthermore the quality of the transcriptions varies sometimes greatly,depending on the skills of the transcriber. Hunt et al. (1999) and Ten Bosch (2000)present methods with which pronunciations are compared on the basis of theacoustic signal, without intervention of a transcriber.
Hunt et al. (1999) present a syllable-based speech recognition system in whichunknown syllables are acoustically recognized by matching them against storedsyllable templates. Syllables are represented as a sequence of acoustic-parametervectors, each vector corresponding to one time-frame. A Levenshtein algorithmfinds the optimum frame-to-frame correspondence between the template syllableand the unknown syllable and calculates the distances between them over thatoptimum frame correspondence.
Ten Bosch (2000) describes research in which an Automatic Speech Recogni-tion (ASR) based distance measure is used to find the acoustic distances betweendialects. Words are represented as a series of frames where each frame containsacoustic features. Words are compared by aligning the frames by a Viterbi align-ment procedure, a technique roughly comparable to how phonetic segments arealigned when using transcriptions. Alignment is done by matching the frames withtrained ASR Hidden Markov Models (HMMs).
In this paper a related acoustic measure is presented. The aim is to find anacoustically-based distance measure which approximates the perceptual distanceswell, i.e. one that does (almost) not rely on the phonetic transcriptions ofsegments for measuring the distances between dialects. We will experiment withdifferent representations of the acoustic signal to investigate which representationapproximates the perceptual distances the most.
In Section 2 we will show how the perceptual distance measurements weremade and some overall results will be presented. The methods for measuringdistances on the basis of acoustic data will be presented in Section 3. In Section 4
NORWEGIAN DIALECTS EXAMINED PERCEPTUALLY AND ACOUSTICALLY 295
Figure 1. Map of Norway showing the 15 dialects in the present investigation. The abbrevia-tion after the name of each location indicates the dialect area to which the variety belongsaccording to Skjekkeland (1997). The same abbreviations are used in the other figures in thispaper. Skjekkeland (1997) also gives a more global division in which Norwegian dialects aredivided in Vestnorsk (covering No, Sv and Nv) and Austnorsk (covering Mi, Au and Tr).
the perceptual distance measurements will be compared to the acoustic measure-ments and in Section 5 some general conclusions will be drawn.
2. Perceptual Distance Measurements
In this section only general information about the perception experiment and someoverall results will be presented. More details are given by Gooskens and Heeringa(2003).
296 WILBERT HEERINGA AND CHARLOTTE GOOSKENS
2.1. EXPERIMENT
In order to be able to investigate the dialect distances between the 15 Norwe-gian dialects as perceived by Norwegian listeners, for each of the 15 varieties arecording of a translation of the fable “The North Wind and the Sun” was presentedto Norwegian listeners in a listening experiment.
The listeners were 15 groups of high school pupils, one from each of the placeswhere the 15 dialects are spoken. All pupils were familiar with their own dialectand had lived most of their lives in the place in question (on average 16.7 years).Each group consisted of 16 to 27 listeners. The mean age of the listeners was 17.8years, 52 percent were female and 48 percent male.
The texts of the 15 dialects were presented in a randomized order. A session waspreceded by a practice recording. While listening to the dialects the listeners wereasked to judge each of the 15 dialects on a scale from 1 (similar to native dialect) to10 (not similar to native dialect). This means that each group of listeners judged thelinguistic distances between their own dialect and the 15 dialects, including theirown dialect. In this way we get a matrix with 15 × 15 distances. There are twomean distances between each pair of dialects. For example the distance which thelisteners from Bergen perceived between their own dialect and the dialect of Trond-heim is different from the distance as perceived by the listeners from Trondheim.The mean of these two distances is used when presenting the results below.
2.2. RESULTS
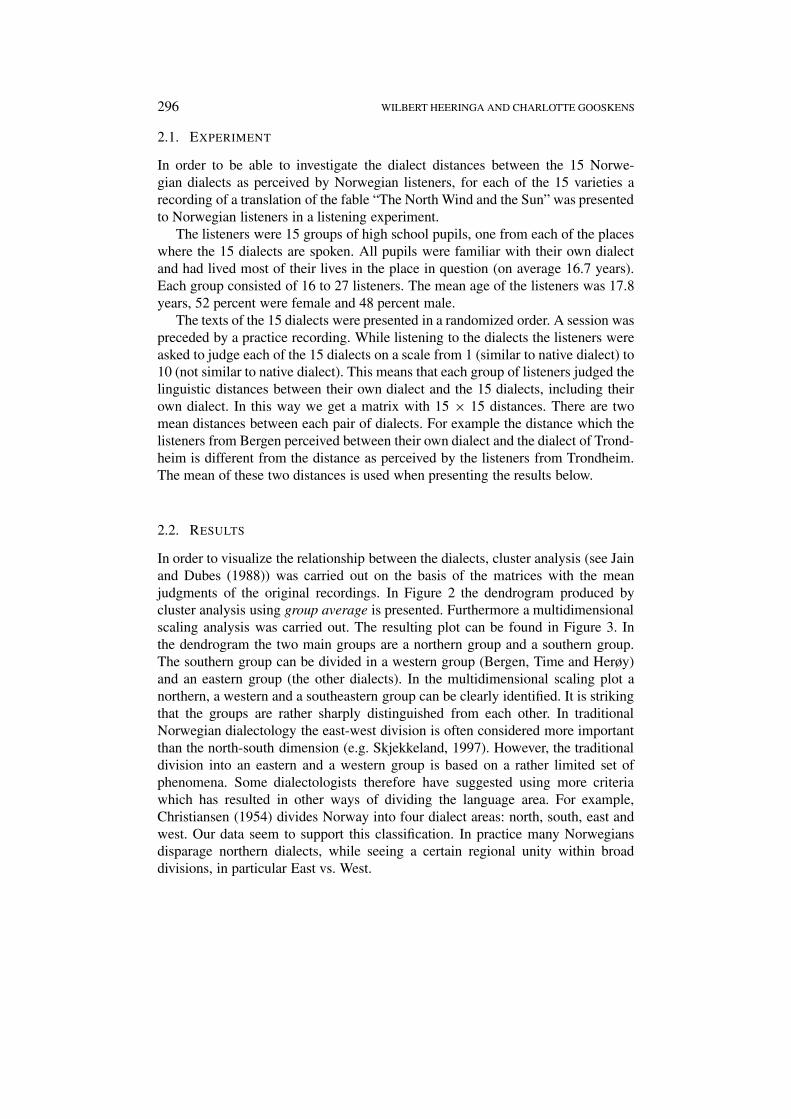
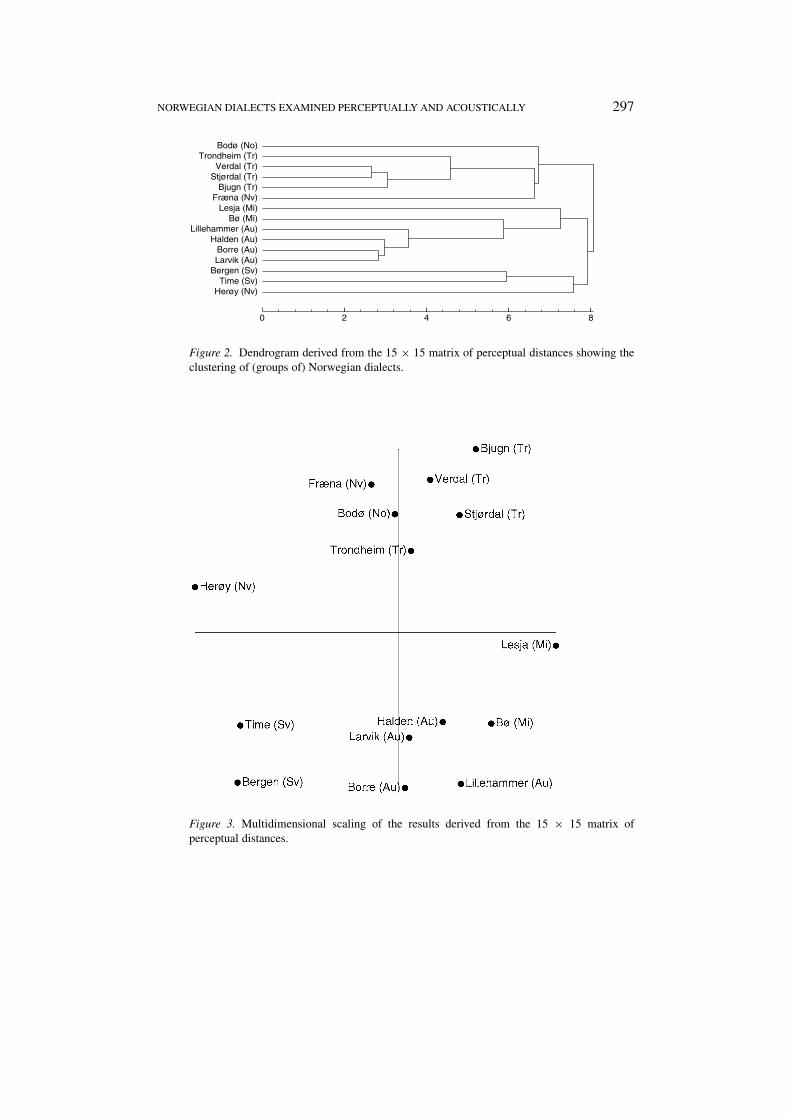
In order to visualize the relationship between the dialects, cluster analysis (see Jainand Dubes (1988)) was carried out on the basis of the matrices with the meanjudgments of the original recordings. In Figure 2 the dendrogram produced bycluster analysis using group average is presented. Furthermore a multidimensionalscaling analysis was carried out. The resulting plot can be found in Figure 3. Inthe dendrogram the two main groups are a northern group and a southern group.The southern group can be divided in a western group (Bergen, Time and Herøy)and an eastern group (the other dialects). In the multidimensional scaling plot anorthern, a western and a southeastern group can be clearly identified. It is strikingthat the groups are rather sharply distinguished from each other. In traditionalNorwegian dialectology the east-west division is often considered more importantthan the north-south dimension (e.g. Skjekkeland, 1997). However, the traditionaldivision into an eastern and a western group is based on a rather limited set ofphenomena. Some dialectologists therefore have suggested using more criteriawhich has resulted in other ways of dividing the language area. For example,Christiansen (1954) divides Norway into four dialect areas: north, south, east andwest. Our data seem to support this classification. In practice many Norwegiansdisparage northern dialects, while seeing a certain regional unity within broaddivisions, in particular East vs. West.
NORWEGIAN DIALECTS EXAMINED PERCEPTUALLY AND ACOUSTICALLY 297
Bodø (No)Trondheim (Tr)
Verdal (Tr)Stjørdal (Tr)
Bjugn (Tr)Fræna (Nv)
Lesja (Mi)Bø (Mi)
Lillehammer (Au)Halden (Au)
Borre (Au)Larvik (Au)
Bergen (Sv)Time (Sv)
Herøy (Nv)
0 2 4 6 8
Figure 2. Dendrogram derived from the 15 × 15 matrix of perceptual distances showing theclustering of (groups of) Norwegian dialects.
Figure 3. Multidimensional scaling of the results derived from the 15 × 15 matrix ofperceptual distances.
298 WILBERT HEERINGA AND CHARLOTTE GOOSKENS
3. Acoustic Distance Measurements
In this section we describe how acoustic measurements are made. In Section 3.1 weexplain some manipulations of the samples. For the representation of the acousticsamples there are several possibilities. In Section 3.2 we account for our choiceof representations. In Section 3.3 we explain how we normalize different speechrates. In Section 3.4 the application of the Levenshtein distance in the comparisonof acoustic representations is explained. On the basis of the Levenshtein distancesthe dialects are classified. In Section 3.5 results are given for the different represen-tations of the acoustic signal. In Section 3.6 the classification results are furtherexamined.
3.1. SAMPLES
The Norwegian translation of the fable “The North Wind and the Sun” consists of58 different words. Due to the free translation of some phrases for certain varietiesa few of the expected words were missing. For all 15 dialects each of the 58 wordswere cut from the text, so we usually get 58 word samples per dialect. If the sameword appears more than once in a text, we select only the first occurrence.
The voices of different speakers will have different pitches. Most obvious is thedifference in pitch between male and female voices. Furthermore the intonationper speaker may vary. When two speakers read the same text aloud, the one maystress different words than the other. To make samples of different speakers ascomparable as possible, all word samples were monotonized. The mean pitch ofthe 4 men was 134 Hz, and of the 11 women 224 Hz. The mean of the means is179 Hz. So all word samples were monotonized on the mean of 179 Hz with theprogram PRAAT.2
We are aware of the fact that this choice removes all prosodic information aboutpitch and intonation contours which are known to be significant dialect markers inNorwegian. However, we found no way to exclude speaker-dependent intonationand simultaneously retain dialect-dependent intonation. Furthermore, we note thatmonotonizing does not remove all gender-dependent information. We have alsoexperimented with normalizing other gender-specific properties, such as adaptingthe frequency scale, but found no improvement in the results yet.
The volume was not normalized because volume contains a good deal of soundspecific information. For example it is specific for the [v] that its volume is greaterthan that of the [f].
3.2. ACOUSTIC SIGNAL
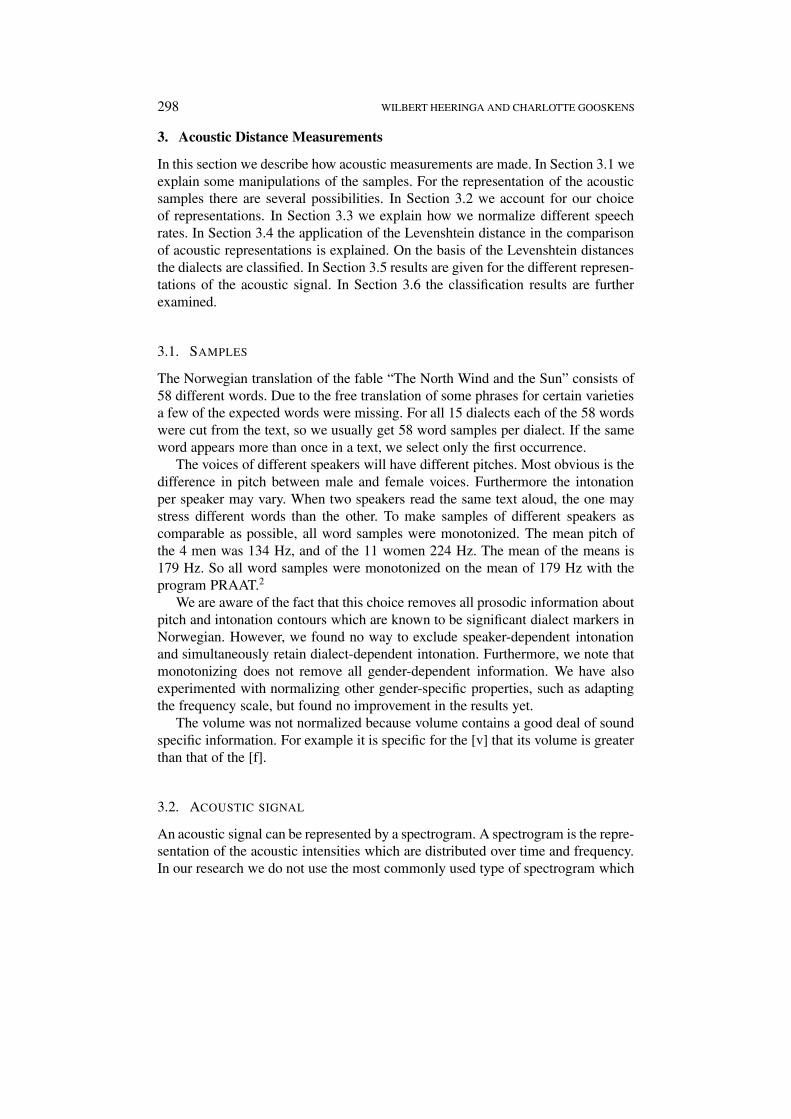
An acoustic signal can be represented by a spectrogram. A spectrogram is the repre-sentation of the acoustic intensities which are distributed over time and frequency.In our research we do not use the most commonly used type of spectrogram which
NORWEGIAN DIALECTS EXAMINED PERCEPTUALLY AND ACOUSTICALLY 299
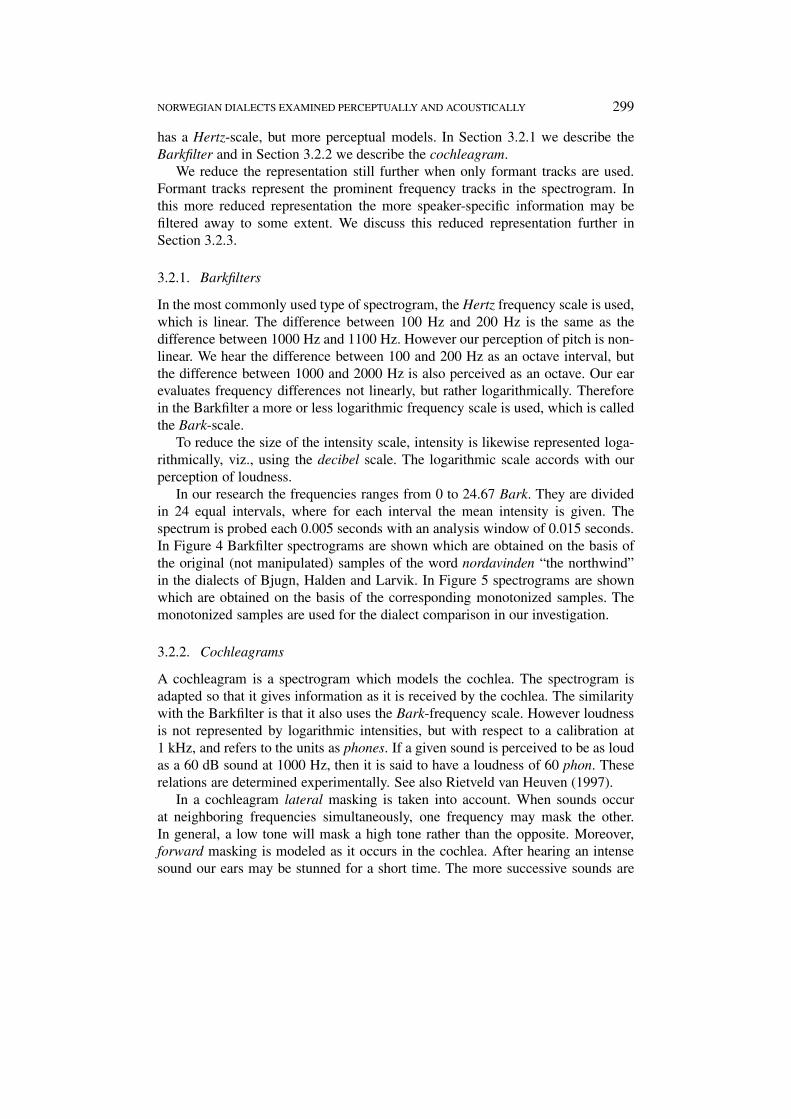
has a Hertz-scale, but more perceptual models. In Section 3.2.1 we describe theBarkfilter and in Section 3.2.2 we describe the cochleagram.
We reduce the representation still further when only formant tracks are used.Formant tracks represent the prominent frequency tracks in the spectrogram. Inthis more reduced representation the more speaker-specific information may befiltered away to some extent. We discuss this reduced representation further inSection 3.2.3.
3.2.1. Barkfilters
In the most commonly used type of spectrogram, the Hertz frequency scale is used,which is linear. The difference between 100 Hz and 200 Hz is the same as thedifference between 1000 Hz and 1100 Hz. However our perception of pitch is non-linear. We hear the difference between 100 and 200 Hz as an octave interval, butthe difference between 1000 and 2000 Hz is also perceived as an octave. Our earevaluates frequency differences not linearly, but rather logarithmically. Thereforein the Barkfilter a more or less logarithmic frequency scale is used, which is calledthe Bark-scale.
To reduce the size of the intensity scale, intensity is likewise represented loga-rithmically, viz., using the decibel scale. The logarithmic scale accords with ourperception of loudness.
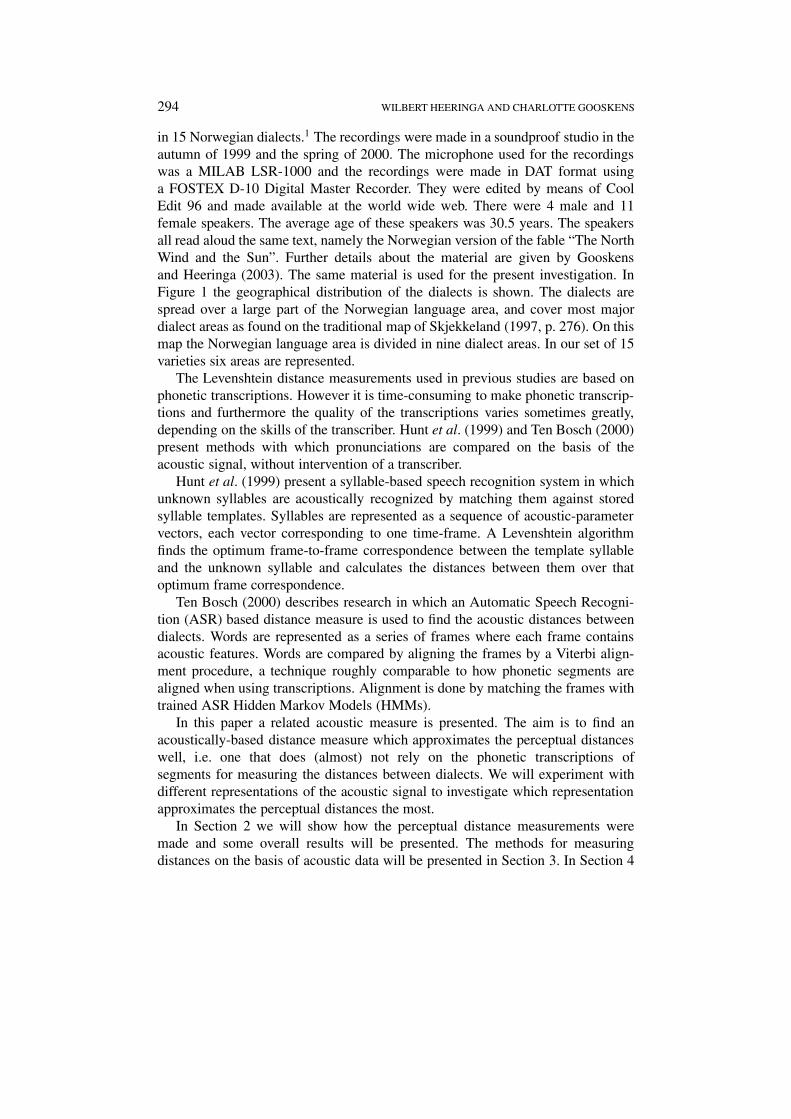
In our research the frequencies ranges from 0 to 24.67 Bark. They are dividedin 24 equal intervals, where for each interval the mean intensity is given. Thespectrum is probed each 0.005 seconds with an analysis window of 0.015 seconds.In Figure 4 Barkfilter spectrograms are shown which are obtained on the basis ofthe original (not manipulated) samples of the word nordavinden “the northwind”in the dialects of Bjugn, Halden and Larvik. In Figure 5 spectrograms are shownwhich are obtained on the basis of the corresponding monotonized samples. Themonotonized samples are used for the dialect comparison in our investigation.
3.2.2. Cochleagrams
A cochleagram is a spectrogram which models the cochlea. The spectrogram isadapted so that it gives information as it is received by the cochlea. The similaritywith the Barkfilter is that it also uses the Bark-frequency scale. However loudnessis not represented by logarithmic intensities, but with respect to a calibration at1 kHz, and refers to the units as phones. If a given sound is perceived to be as loudas a 60 dB sound at 1000 Hz, then it is said to have a loudness of 60 phon. Theserelations are determined experimentally. See also Rietveld van Heuven (1997).
In a cochleagram lateral masking is taken into account. When sounds occurat neighboring frequencies simultaneously, one frequency may mask the other.In general, a low tone will mask a high tone rather than the opposite. Moreover,forward masking is modeled as it occurs in the cochlea. After hearing an intensesound our ears may be stunned for a short time. The more successive sounds are
300 WILBERT HEERINGA AND CHARLOTTE GOOSKENS
0
5.904
11.81
17.71
23.62
29.52
0 0.666281P
lace
(B
ark)
Time (s)
0
5.904
11.81
17.71
23.62
29.52
0 0.599342
Pla
ce (
Bar
k)
Time (s)
0
5.904
11.81
17.71
23.62
29.52
0 0.750771
Pla
ce (
Bar
k)
Time (s)
Bjugn Halden Larvik
[2nu a�vi �] [2nu a
�vin ] [2nu a
�vin�n
�]
Time (s)0 0.666281
Pla
ce (
Bar
k)
0
5
10
15
20
25
Time (s)0 0.599342
Pla
ce (
Bar
k)
0
5
10
15
20
25
Time (s)0 0.750771
Pla
ce (
Bar
k)
0
5
10
15
20
25
Bjugn Halden Larvik
[2nu a�vi �] [2nu a
�vin ] [2nu a
�vin�n
�]
Time (s)
For
man
t fre
quen
cy (
Hz)
0 0.6662810
1000
2000
3000
4000
5000
Time (s)
For
man
t fre
quen
cy (
Hz)
0 0.5993420
1000
2000
3000
4000
5000
Time (s)
For
man
t fre
quen
cy (
Hz)
0 0.7507710
1000
2000
3000
4000
5000
Bjugn Halden Larvik
[2nu a�vi �] [2nu a
�vin ] [2nu a
�vin�n
�]
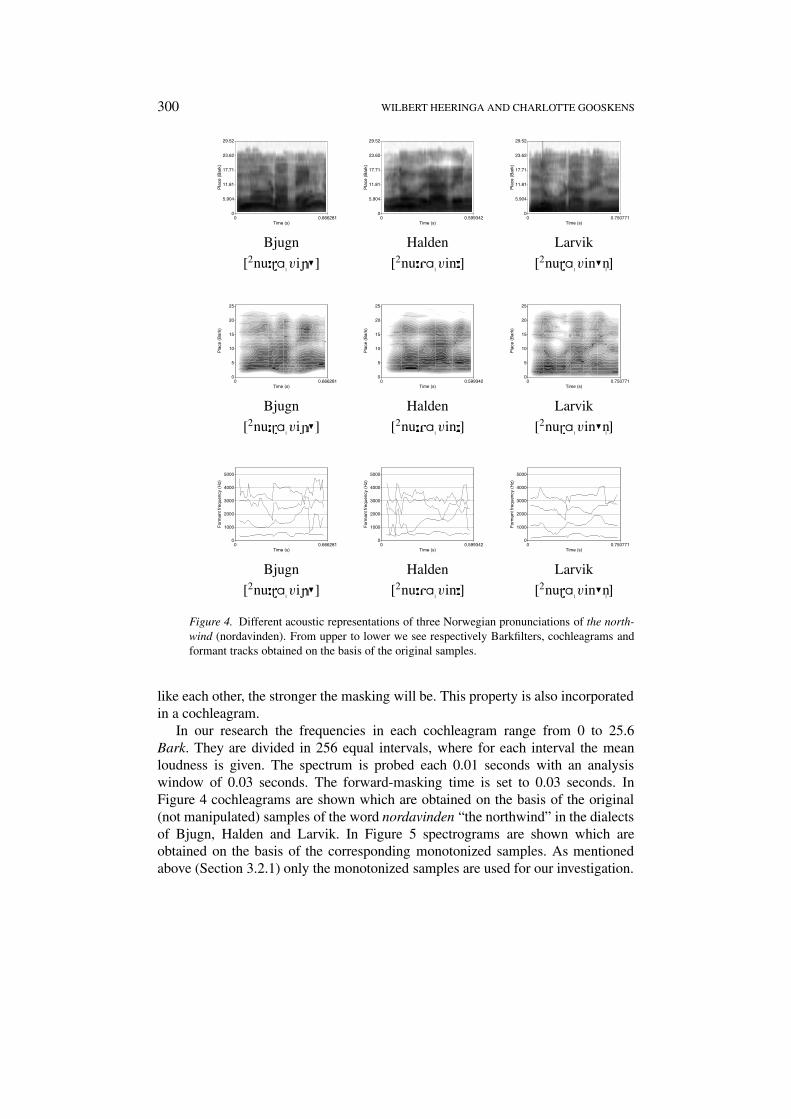
Figure 4. Different acoustic representations of three Norwegian pronunciations of the north-wind (nordavinden). From upper to lower we see respectively Barkfilters, cochleagrams andformant tracks obtained on the basis of the original samples.
like each other, the stronger the masking will be. This property is also incorporatedin a cochleagram.
In our research the frequencies in each cochleagram range from 0 to 25.6Bark. They are divided in 256 equal intervals, where for each interval the meanloudness is given. The spectrum is probed each 0.01 seconds with an analysiswindow of 0.03 seconds. The forward-masking time is set to 0.03 seconds. InFigure 4 cochleagrams are shown which are obtained on the basis of the original(not manipulated) samples of the word nordavinden “the northwind” in the dialectsof Bjugn, Halden and Larvik. In Figure 5 spectrograms are shown which areobtained on the basis of the corresponding monotonized samples. As mentionedabove (Section 3.2.1) only the monotonized samples are used for our investigation.
NORWEGIAN DIALECTS EXAMINED PERCEPTUALLY AND ACOUSTICALLY 301
Pla
ce (
Bar
k)Time (s)
0
5.904
11.81
17.71
23.62
29.52
0 0.6662810
5.904
11.81
17.71
23.62
29.52
0 0.599342
Pla
ce (
Bar
k)
Time (s)
Pla
ce (
Bar
k)
Time (s)
0
5.904
11.81
17.71
23.62
29.52
0 0.750771
Bjugn Halden Larvik
[2nu a�vi �] [2nu a
�vin ] [2nu a
�vin�n
�]
Time (s)0 0.666281
Pla
ce (
Bar
k)
0
5
10
15
20
25
Time (s)0 0.599342
Pla
ce (
Bar
k)
0
5
10
15
20
25
Time (s)0 0.750771
Pla
ce (
Bar
k)
0
5
10
15
20
25
Bjugn Halden Larvik
[2nu a�vi �] [2nu a
�vin ] [2nu a
�vin�n
�]
Time (s)
For
man
t fre
quen
cy (
Hz)
0 0.6662810
1000
2000
3000
4000
5000
Time (s)
For
man
t fre
quen
cy (
Hz)
0 0.5993420
1000
2000
3000
4000
5000
Time (s)
For
man
t fre
quen
cy (
Hz)
0 0.7507710
1000
2000
3000
4000
5000
Bjugn Halden Larvik
[2nu a�vi �] [2nu a
�vin ] [2nu a
�vin�n
�]
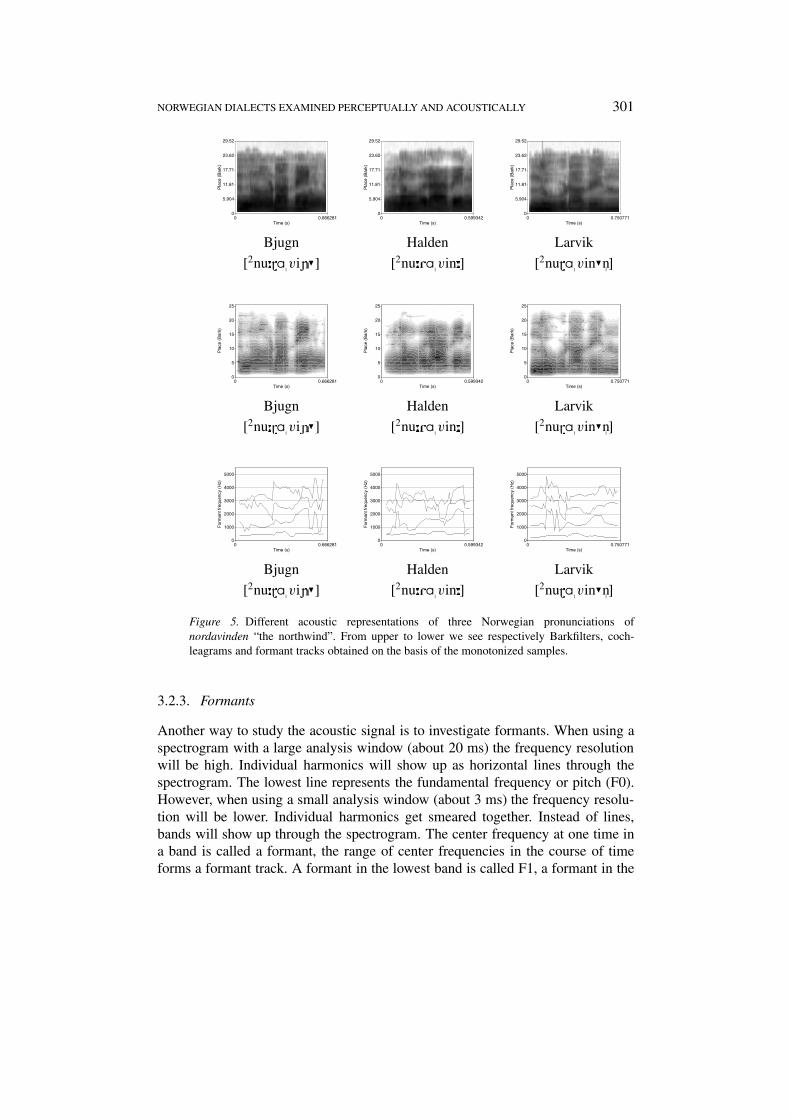
Figure 5. Different acoustic representations of three Norwegian pronunciations ofnordavinden “the northwind”. From upper to lower we see respectively Barkfilters, coch-leagrams and formant tracks obtained on the basis of the monotonized samples.
3.2.3. Formants
Another way to study the acoustic signal is to investigate formants. When using aspectrogram with a large analysis window (about 20 ms) the frequency resolutionwill be high. Individual harmonics will show up as horizontal lines through thespectrogram. The lowest line represents the fundamental frequency or pitch (F0).However, when using a small analysis window (about 3 ms) the frequency resolu-tion will be lower. Individual harmonics get smeared together. Instead of lines,bands will show up through the spectrogram. The center frequency at one time ina band is called a formant, the range of center frequencies in the course of timeforms a formant track. A formant in the lowest band is called F1, a formant in the
302 WILBERT HEERINGA AND CHARLOTTE GOOSKENS
next band F2, etc. Formants represent a frequency region that is enhanced by theresonances of the vocal tract.3
Having one word sample, the number of formants may vary over time. It appearsthat for each word sample at each time sample at least three formants can be found.Therefore the comparison of word samples is based on (the first) three formanttracks. When finding formants in PRAAT, the time step was set to 10 ms withan analysis window of 25 ms. The ceiling of the formant search range should beset to 5000 Hz for males, and to 5500 Hz for females. Because the samples onthe basis of which the formants are determined are monotonized to the average ofthe mean pitch of the males and the females, we set this ceiling to 5250 Hz. Pre-emphasis starts at 50 Hz. In the manual which can be found in the PRAAT programpre-emphasis is explained as follows: “This means that frequencies below 50 Hzare not enhanced, frequencies around 100 Hz are amplified by 6 dB, frequenciesaround 200 Hz are amplified by 12 dB, and so forth. The point of this is that vowelspectra tend to fall by 6 dB per octave; the pre-emphasis creates a flatter spectrum,which is better for formant analysis because we want our formants to match thelocal peaks, not the global spectral slope.” In PRAAT several algorithms can bechosen for finding the Linear Predictive Coding (LPC) coefficients. We chose thealgorithm of Burg, which seems to be the most common one.
Before comparing formant frequencies in the comparison of words the frequen-cies in Hertz are converted to Bark, which is, as mentioned above, a moreperceptual scale. In Figure 4 formant tracks are shown which are obtained onthe basis of the original samples of the word nordavinden “the northwind” in thedialects of Bjugn, Halden and Larvik. In Figure 5 formant tracks are shown whichare obtained on the basis of the corresponding monotonized samples.
3.3. SPEECH RATE
When we compare word samples, we have to allow for the fact that different speechrates give different sample sizes. To perform a rough normalization, first we findthe number of segments per word according to the phonetic transcription and callthis n. Now we regard the word spectogram as a concatenation of n equally-sizedintervals. We have to arrange that each interval gets a fixed number of spectra. Wecall this m. When there are fewer spectra, they are expanded to m, and when thereare more spectra they are reduced to m. In our research we select m = 20. A highervalue gives no clearly different results while the computing time increases greatly.As a result each word sample is represented as a reduced spectrogram with n ×m spectra. When using formants, we have formant frequency bundles instead ofspectra.
We are aware of the fact that this is a rough approach, but it should be refinedenough to capture significant variation.
NORWEGIAN DIALECTS EXAMINED PERCEPTUALLY AND ACOUSTICALLY 303
3.4. LEVENSHTEIN DISTANCE
The Levenshtein distances calculates the cost of changing one string into another.It determines how the one string can be changed into the other in the easiest way byinserting, deleting or substituting elements. A detailed description of the algorithmis given by Kruskal (1999). Finding the distance between different pronuncia-tions on the basis of their transcriptions, the elements are the phonetic segments.However using the acoustic signal, the elements are spectra or formant bundles.
Now a substitution is calculated as follows. Assume a spectrum or formantbundle e1 and e2 with respectively t frequencies or formants, then:
d(e1, e2) =√√√√
t∑i=1
(e1i − e2i )2
For the calculation of insertions and deletions we used definitions of “silence”.We defined a “silence spectrum” as a spectrum for which the intensities of allfrequencies are equal to 0. A “silence formant bundle” is defined as a bundle forwhich all frequencies are equal to 0. This means that in absolute silence there areno vibrations.
If we used the Levenshtein distances directly, then longer words wouldcontribute disproportionately to the estimation of distances between varieties,which does not accord with the idea that words are linguistic units. Thereforewe normalize each Levenshtein distance by dividing it by the length of the align-ment. Sometimes the same Levenshtein distance may correspond with differentalignments having different lengths. We will illustrate this by two transcriptions,although in this paper Levenshtein is applied to spectrograms and formant tracksrather than to transcriptions. E.g the word bee is pronounced as [bin�] “Biene” inGerman and as [bεi] “bij” in Dutch. Two possible alignments are:
b i n � b i n �b ε i b ε i
0 1 1 1 0 1 0 1 1
In the example, equal sounds have a cost of 0 and different ones a cost of 1.However in our research we used the gradual weights found by the formula whichis given in the beginning of this section. This example shows that the longer align-ment is the more reasonable one. Therefore we divide the Levenshtein distance bythe length of the longest alignment.
Using 58 words the distance between two dialects is equal to the average of 58Levenshtein distances. When comparing two words between two dialects for whichno translation is given for one or both dialects, than the distance for that word pairis taken to be the average of the distances of all word pairs for which translationsin both dialects were available.
All distances between the 15 dialects were arranged in a 15 × 15 matrix.
304 WILBERT HEERINGA AND CHARLOTTE GOOSKENS
Bø (Mi)Borre (Au)
Trondheim (Tr)Lillehammer (Au)
Bergen (Sv)Halden (Au)
Time (Sv)Bodø (No)Larvik (Au)Herøy (Nv)Verdal (Tr)Bjugn (Tr)
Stjørdal (Tr)Lesja (Mi)
Fræna (Nv)
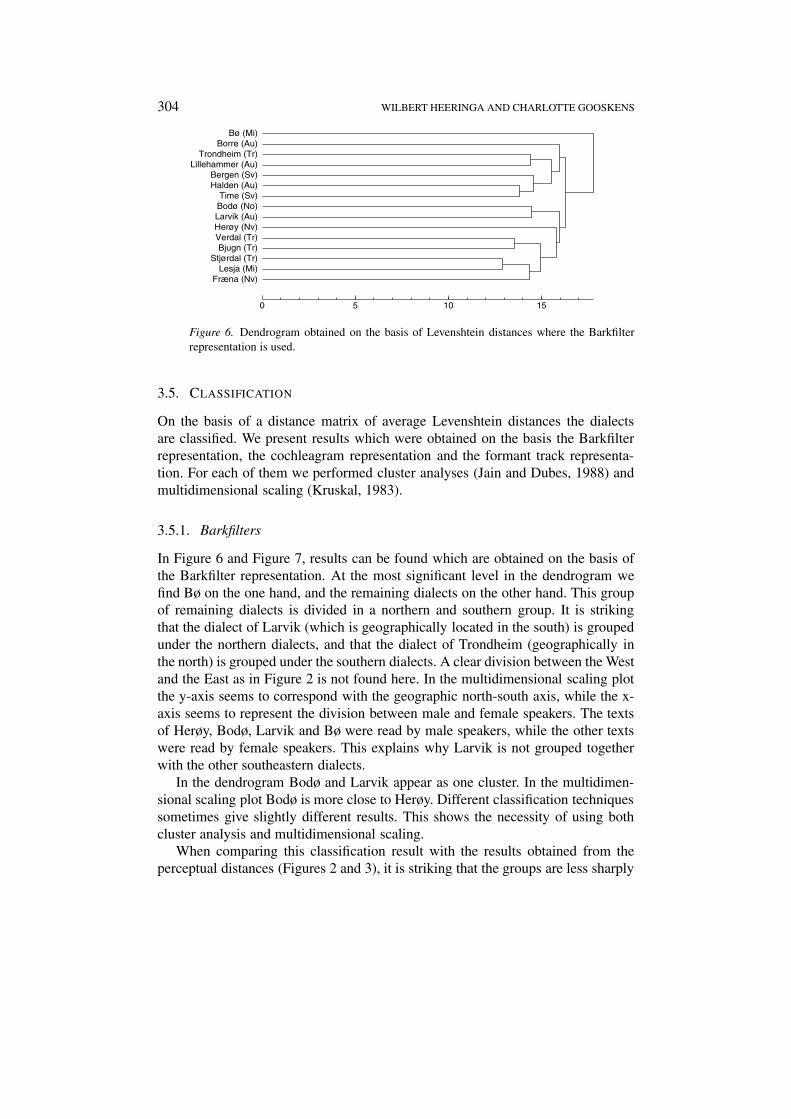
0 5 10 15
Figure 6. Dendrogram obtained on the basis of Levenshtein distances where the Barkfilterrepresentation is used.
3.5. CLASSIFICATION
On the basis of a distance matrix of average Levenshtein distances the dialectsare classified. We present results which were obtained on the basis the Barkfilterrepresentation, the cochleagram representation and the formant track representa-tion. For each of them we performed cluster analyses (Jain and Dubes, 1988) andmultidimensional scaling (Kruskal, 1983).
3.5.1. Barkfilters
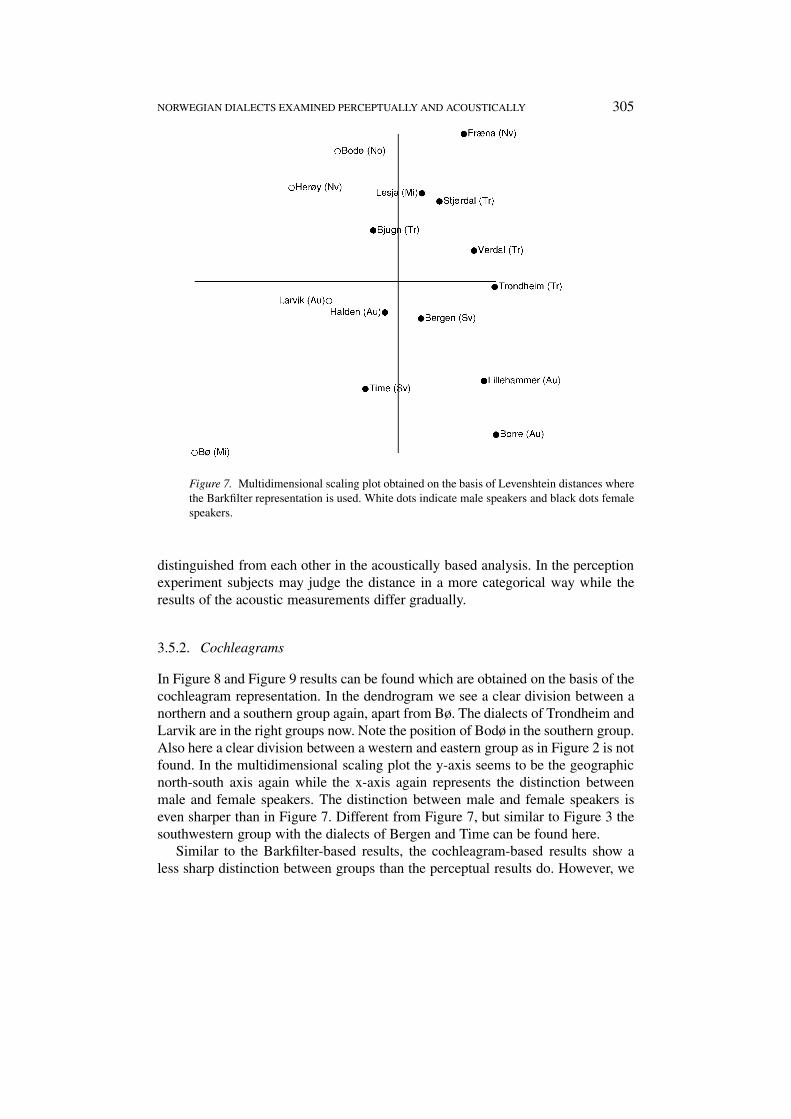
In Figure 6 and Figure 7, results can be found which are obtained on the basis ofthe Barkfilter representation. At the most significant level in the dendrogram wefind Bø on the one hand, and the remaining dialects on the other hand. This groupof remaining dialects is divided in a northern and southern group. It is strikingthat the dialect of Larvik (which is geographically located in the south) is groupedunder the northern dialects, and that the dialect of Trondheim (geographically inthe north) is grouped under the southern dialects. A clear division between the Westand the East as in Figure 2 is not found here. In the multidimensional scaling plotthe y-axis seems to correspond with the geographic north-south axis, while the x-axis seems to represent the division between male and female speakers. The textsof Herøy, Bodø, Larvik and Bø were read by male speakers, while the other textswere read by female speakers. This explains why Larvik is not grouped togetherwith the other southeastern dialects.
In the dendrogram Bodø and Larvik appear as one cluster. In the multidimen-sional scaling plot Bodø is more close to Herøy. Different classification techniquessometimes give slightly different results. This shows the necessity of using bothcluster analysis and multidimensional scaling.
When comparing this classification result with the results obtained from theperceptual distances (Figures 2 and 3), it is striking that the groups are less sharply
NORWEGIAN DIALECTS EXAMINED PERCEPTUALLY AND ACOUSTICALLY 305
Figure 7. Multidimensional scaling plot obtained on the basis of Levenshtein distances wherethe Barkfilter representation is used. White dots indicate male speakers and black dots femalespeakers.
distinguished from each other in the acoustically based analysis. In the perceptionexperiment subjects may judge the distance in a more categorical way while theresults of the acoustic measurements differ gradually.
3.5.2. Cochleagrams
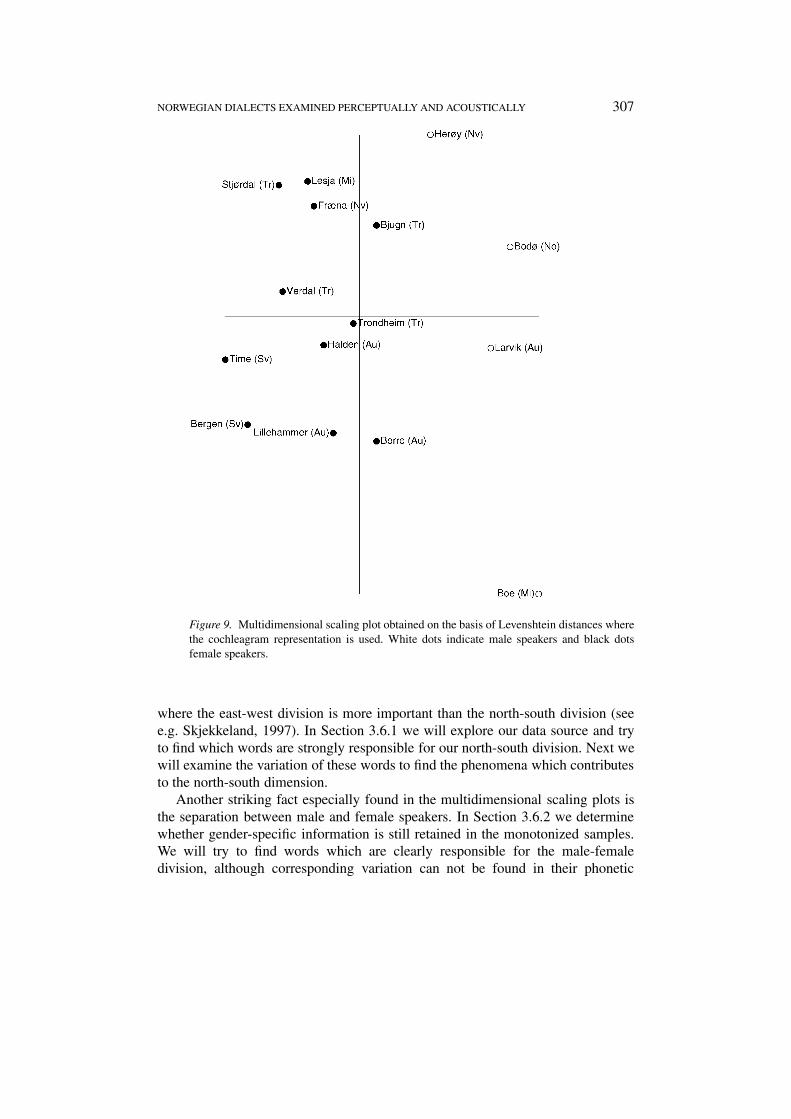
In Figure 8 and Figure 9 results can be found which are obtained on the basis of thecochleagram representation. In the dendrogram we see a clear division between anorthern and a southern group again, apart from Bø. The dialects of Trondheim andLarvik are in the right groups now. Note the position of Bodø in the southern group.Also here a clear division between a western and eastern group as in Figure 2 is notfound. In the multidimensional scaling plot the y-axis seems to be the geographicnorth-south axis again while the x-axis again represents the distinction betweenmale and female speakers. The distinction between male and female speakers iseven sharper than in Figure 7. Different from Figure 7, but similar to Figure 3 thesouthwestern group with the dialects of Bergen and Time can be found here.
Similar to the Barkfilter-based results, the cochleagram-based results show aless sharp distinction between groups than the perceptual results do. However, we
306 WILBERT HEERINGA AND CHARLOTTE GOOSKENS
Bø (Mi)Bodø (No)Larvik (Au)Borre (Au)
Lillehammer (Au)Bergen (Sv)Halden (Au)
Time (Sv)Lesja (Mi)
Stjørdal (Tr)Fræna (Nv)
Bjugn (Tr)Verdal (Tr)
Trondheim (Tr)Herøy (Nv)
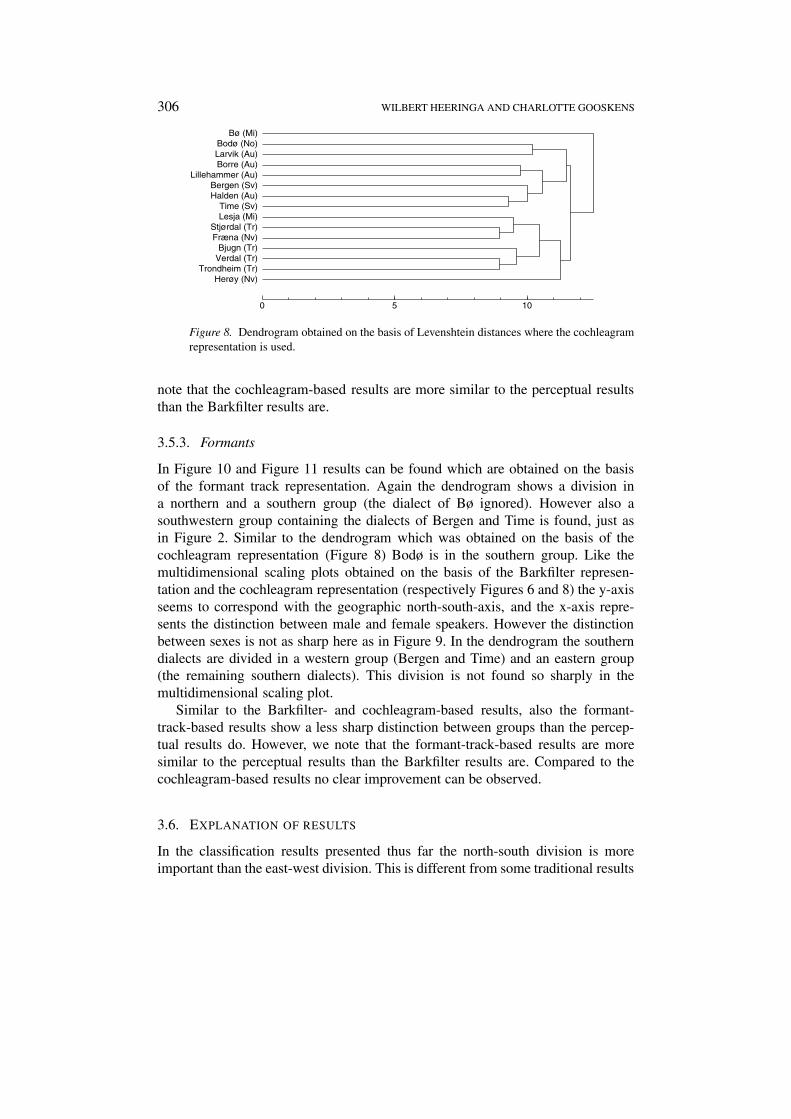
0 5 10
Figure 8. Dendrogram obtained on the basis of Levenshtein distances where the cochleagramrepresentation is used.
note that the cochleagram-based results are more similar to the perceptual resultsthan the Barkfilter results are.
3.5.3. Formants
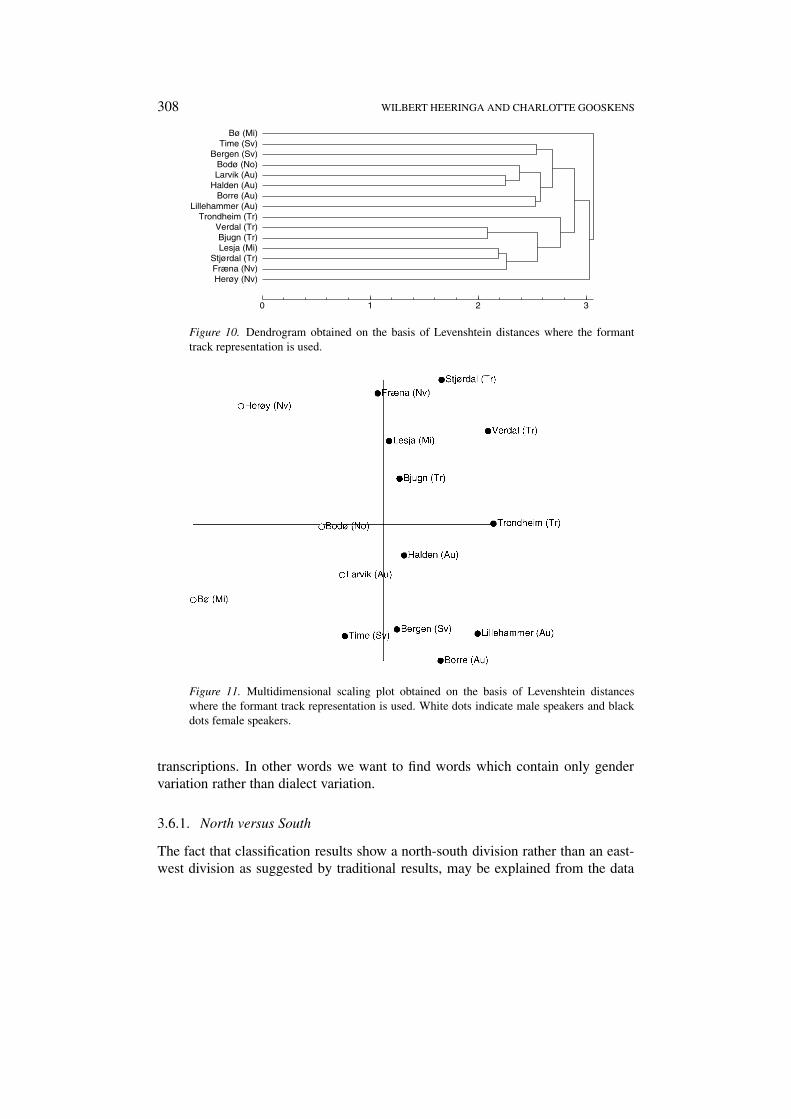
In Figure 10 and Figure 11 results can be found which are obtained on the basisof the formant track representation. Again the dendrogram shows a division ina northern and a southern group (the dialect of Bø ignored). However also asouthwestern group containing the dialects of Bergen and Time is found, just asin Figure 2. Similar to the dendrogram which was obtained on the basis of thecochleagram representation (Figure 8) Bodø is in the southern group. Like themultidimensional scaling plots obtained on the basis of the Barkfilter represen-tation and the cochleagram representation (respectively Figures 6 and 8) the y-axisseems to correspond with the geographic north-south-axis, and the x-axis repre-sents the distinction between male and female speakers. However the distinctionbetween sexes is not as sharp here as in Figure 9. In the dendrogram the southerndialects are divided in a western group (Bergen and Time) and an eastern group(the remaining southern dialects). This division is not found so sharply in themultidimensional scaling plot.
Similar to the Barkfilter- and cochleagram-based results, also the formant-track-based results show a less sharp distinction between groups than the percep-tual results do. However, we note that the formant-track-based results are moresimilar to the perceptual results than the Barkfilter results are. Compared to thecochleagram-based results no clear improvement can be observed.
3.6. EXPLANATION OF RESULTS
In the classification results presented thus far the north-south division is moreimportant than the east-west division. This is different from some traditional results
NORWEGIAN DIALECTS EXAMINED PERCEPTUALLY AND ACOUSTICALLY 307
Figure 9. Multidimensional scaling plot obtained on the basis of Levenshtein distances wherethe cochleagram representation is used. White dots indicate male speakers and black dotsfemale speakers.
where the east-west division is more important than the north-south division (seee.g. Skjekkeland, 1997). In Section 3.6.1 we will explore our data source and tryto find which words are strongly responsible for our north-south division. Next wewill examine the variation of these words to find the phenomena which contributesto the north-south dimension.
Another striking fact especially found in the multidimensional scaling plots isthe separation between male and female speakers. In Section 3.6.2 we determinewhether gender-specific information is still retained in the monotonized samples.We will try to find words which are clearly responsible for the male-femaledivision, although corresponding variation can not be found in their phonetic
308 WILBERT HEERINGA AND CHARLOTTE GOOSKENS
Bø (Mi)Time (Sv)
Bergen (Sv)Bodø (No)Larvik (Au)
Halden (Au)Borre (Au)
Lillehammer (Au)Trondheim (Tr)
Verdal (Tr)Bjugn (Tr)Lesja (Mi)
Stjørdal (Tr)Fræna (Nv)Herøy (Nv)
0 1 2 3
Figure 10. Dendrogram obtained on the basis of Levenshtein distances where the formanttrack representation is used.
Figure 11. Multidimensional scaling plot obtained on the basis of Levenshtein distanceswhere the formant track representation is used. White dots indicate male speakers and blackdots female speakers.
transcriptions. In other words we want to find words which contain only gendervariation rather than dialect variation.
3.6.1. North versus South
The fact that classification results show a north-south division rather than an east-west division as suggested by traditional results, may be explained from the data
NORWEGIAN DIALECTS EXAMINED PERCEPTUALLY AND ACOUSTICALLY 309
source on the one hand, and the comparison method on the other hand. Thereforewe want to investigate whether some particular phenomena are responsible for thisnorth-south division.
Using the multidimensional scaling plots, we investigated the north-southdimension (the vertical dimension in the plots which is the second dimension)further. From the plot per dimension, distances between varieties can be derived.When examining the north-south dimension the distance between two varietiesis equal to the absolute difference between the corresponding y-coordinates. Inthis way, for each pair of varieties the “north-south”-distance is found. Having 15varieties, we get 15 × 15 distances. Since the distance begween e.g. Bjugn andBjugn is always 0, we want to exclude the distances of varieties with respect tothemselves, so we get 15 × 14 distances. Since the distance between e.g. Bjugnand Halden is equal to the distance between Halden and Bjugn, only the half of thedistances are needed. So finally we only use (15 × 14)/2 distances.
In Section 3.4 we described how to calculate the Levenshtein distance betweentwo words. Using the Levenshtein distance a distance matrix can be obtained,containing Levenshtein distances between the different pronunciations of oneparticular word. Also this matrix contains (15 × 14)/2 distances.
Having Levenshtein distances for one word on the one hand, and north-south-distances as found in the multidimensional scaling plot on the other hand, thetwo sorts of distances can be correlated. The stronger the word distances correlatewith the north-south distances, the more the variation of the corresponding wordcontributed to the north-south dimension in the multidimensional scaling plot.
For finding the correlation coefficient, we used the Pearson’s correlation coeffi-cient (Sneath and Sokal, 1973, pp. 137–140). When having 15 varieties, a distancematrix will have 15 rows and 15 columns. The correlation coefficient between iscalculated as:
r(X, Y ) =∑n
i=2
∑i−1j=1(Xij − �X)(Yij − �Y )
∑ni=2
∑i−1j=1(Xij − �X)2
∑ni=2
∑i−1j=1(Yij − �X)2
where n = 15. Correlation coefficients range from −1 (perfect inverse correlation)to +1 (perfect correlation). There is no correlation if r = 0.
For each of the 58 words we calculated the Levenshtein distances betweenthe 15 varieties. This gives 58 matrices. Subsequently each of the matrices wascorrelated with the distances derived from the vertical dimension of the multidi-mensional scaling plot which corresponds with north-south. We did this for themultidimensional scaling plots obtained on the basis of respectively the Barkfilter,the cochleagram and the formant tracks representation.
When using the Barkfilter representation the word the “den” correlates strongest(r = 0.78), followed by the word finally “til sist”(r = 0.67). In the north, the ispronounced as [ðe ] and in the south as [ ] (or similar forms). The word finallyis pronounced like [te
�lu–c ] in the north and like [tilsist] in the south. Using coch-
leagrams the word of “av”4 correlates strongest (r = 0.72), and next the word the
310 WILBERT HEERINGA AND CHARLOTTE GOOSKENS
“den” (r = 0.71). In the north for the word of pronunciations are found like [t�], inthe south like [a]. Using formant tracks the words blew “blaaste” (r = 0.56) andoff “av”5 (r = 0.55) correlate the strongest. For the word blew in the north formslike [b �st] are common. In the south similar forms are used; however, they arefollowed by a schwa, e.g. [b �st�]. Examining the transcriptions of off we foundno systematic variation which could be explained as a contribution to a north-southdivision.
Examining the strongly-correlating words just mentioned, we find that a widerange of phenomena contributes to the north-south division. Therefore it becomesclear that this division is not the result of a biased weighting of phenomena. Inour method no choice of phenomena is made beforehand. However the map ofSkjekkeland (1997) is based on a restricted set of phenomena. This may explainthe difference between our results and the division as given by Skjekkeland.
3.6.2. Male versus Female
In the multidimensional scaling plots obtained on the basis of the acoustic Leven-shtein distances a separation between male and female speakers can be found.We suspect this is caused by the fact that after monotonizing the samples stillgender-specific information is retained. Therefore we will search for words whichobviously contribute to the male-female division due to the fact that gender varia-tion is retained in the acoustic samples while no dialect variation can be found inthe phonetic transcriptions.
Just as we derived north-south distances from the multidimensional scalingcoordinates on the basis of the vertical dimension in Section 3.6.1 we can derivemale-female distances from the horizontal dimension, resulting in (15 × 14)/2distances again. As explained in Section 3.6.1 for each of the 58 words wecalculated the Levenshtein distances between the 15 varieties resulting in 58matrices.
We correlate each of the 58 matrices with the male-female distances as derivedfrom the horizontal dimension in the multidimensional scaling plot. Examiningthe words corresponding with the matrices which correlates strongest with themale-female distances, it appears that for some of them a corresponding variationcould be found in the phonetic transcriptions. However, we also found words whichstrongly correlate, but for which the variation as found in the phonetic transcrip-tions gives no satisfying explanation for this high correlation. Examples are man“mann” (r = 0.53) and get “faa” (r = 0.48) when using cochleagrams, around“rundt” (r = 0.54) and get “faa” (r = 0.46) when using Barkfilters, and around “pa”(r = 0.74) and took “tok” (r = 0.59) when using formant tracks. Since the dialect-specific variation in these words as noted in the transcriptions cannot explain theirrelatively strong correlation with the horizontal dimension, it is obvious that thesewords reflect gender variation to some extent. Therefore it is clear that gendervariation is retained in the samples after monotonizing, which has influenced ourresults.
NORWEGIAN DIALECTS EXAMINED PERCEPTUALLY AND ACOUSTICALLY 311
When generating multidimensional scaling plots on the basis of the elevenfemale speakers only, for all acoustic representations, the vertical dimension stillcorresponds with the north-south axis. The horizontal dimension corresponds moreor less with the east-west axis. Examining the multidimensional scaling plots onthe basis of all 15 speakers, the horizontal dimension may be interpreted as an east-west dimension to some extent as well, but the interpretation as male-female axisis much more obvious as may be concluded by the readers’ eye.
4. Perceptual versus Acoustic Distances
In order to compare the different distance measurements the matrices resultingfrom the perceptual and acoustic measurements were compared by calculatingthe Pearson’s correlation coefficient between them. In Section 3.6 correlationsare calculated on the basis of (15 × 14)/2 distances. Using (average) Leven-shtein distances, distances of varieties with respect to itself are always equal to 0.Therefore they can be excluded. These distances are found on the diagonal in thedistance matrix, containing the cells (1, 1), (2, 2), . . . (n, n). Furthermore distancesare symmetric: the distance between e.g. Bjugn and Halden is equal to the distancebetween Halden and Bjugn. However in the 15 × 15 matrix of perceptual distances,the distance of Bjugn and Bjugn is not equal to 0. Furthermore the distance betweenBjugn and Halden is different from the distance between Halden and Bjugn. Sothis may suggest that we need to use all 15 × 15 distances when correlating theacoustic Levenshtein distances with the perceptual distances. However it appearsthat the distances of varieties with respect to themselves are outliers when usingthe acoustic distances (they are always 0), but they are not outliers when usingperceptual distances. Therefore two correlation coefficients are given for each pairof matrices, one based on the full matrices (15 × 15 = 225 distances), and onebased on a matrix excluding the diagonal (15 × 14 = 210 distances).
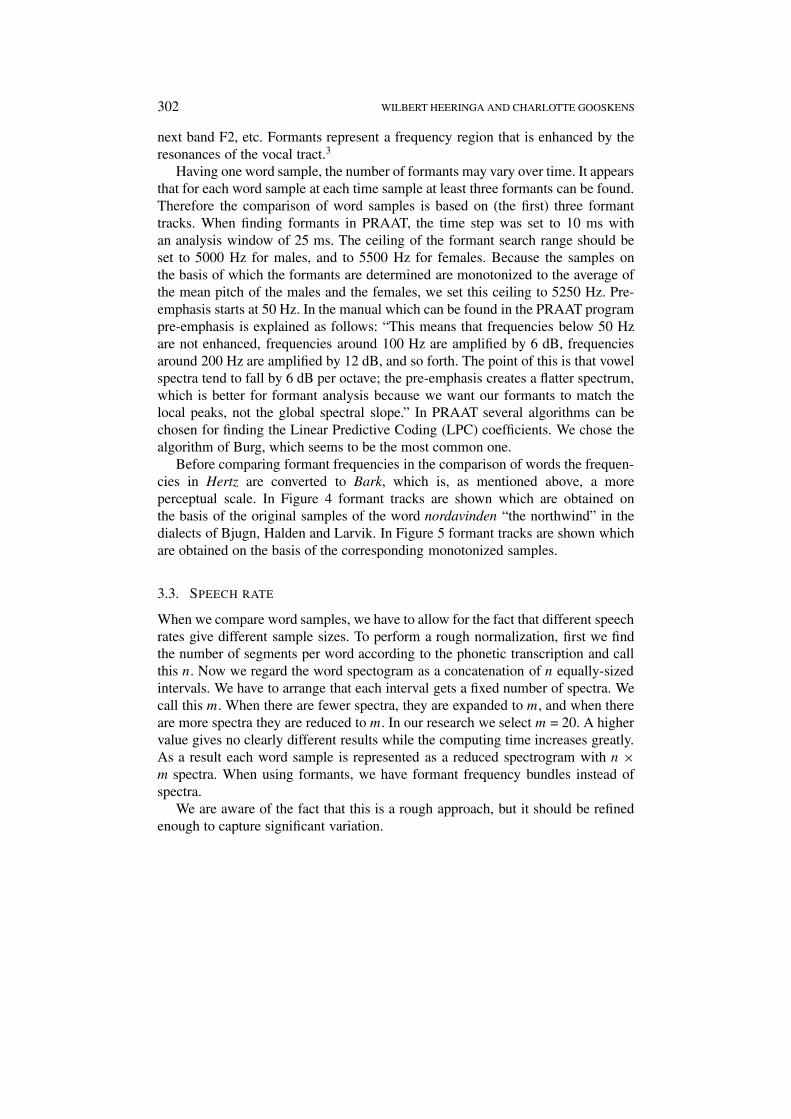
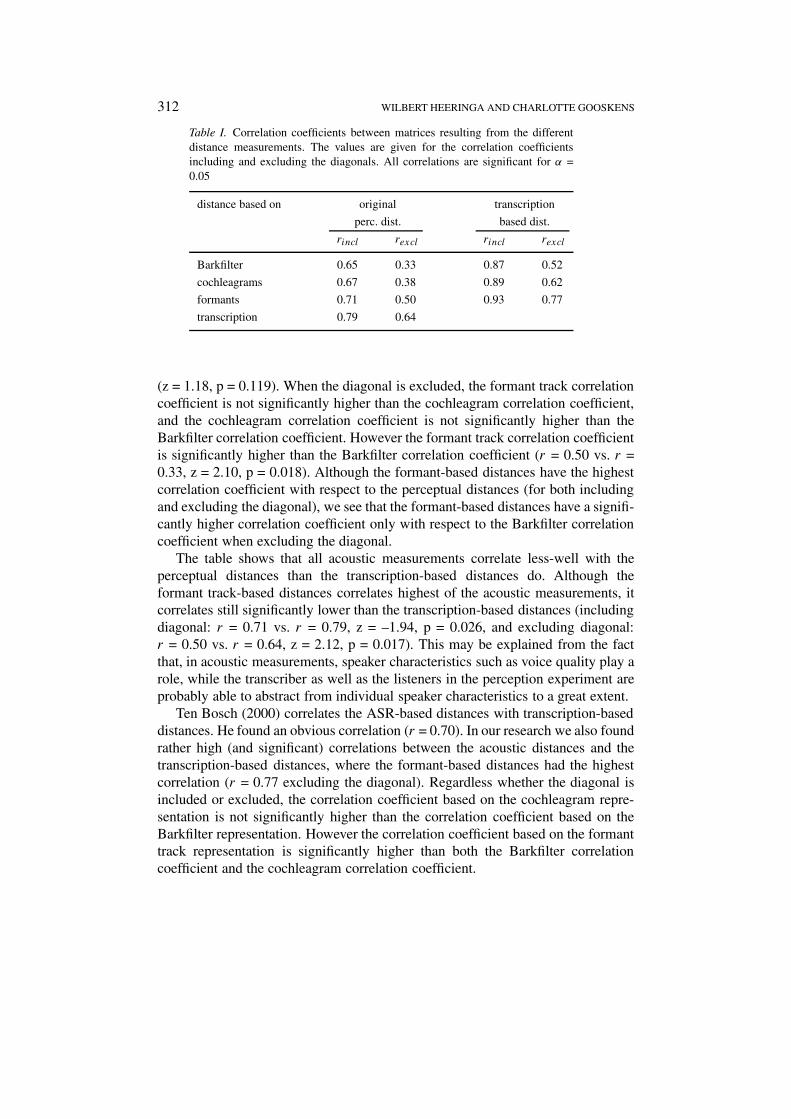
Table I shows the correlation coefficients between the different acoustic Leven-shtein distances and the perceptual distances. It may also be interesting to takethe transcription-based Levenshtein distance into account. In this approach, thedistance between two words is found by calculating the Levenshtein distance on thebasis of the corresponding phonetic transcriptions. Insertions, deletions and substi-tutions are applied to phonetic segments instead of to spectra or formant bundles.For more details see Gooskens and Heeringa (2003). Correlations with respect tothis distance are also given in Table I. All correlations in the table are significant(when α = 0.05, the same significance level is used in the rest of the paper). Allcases including the diagonal give a significantly higher correlation coefficient thanthose excluding the diagonal.6
The correlation coefficients of the different acoustic measurements with respectto the perceptual distances do not differ significantly when the diagonal is included.The greatest difference was found between the Barkfilter and the formant tracks(r = 0.65 vs. r = 0.71), but the one is still not significantly higher than the other
312 WILBERT HEERINGA AND CHARLOTTE GOOSKENS
Table I. Correlation coefficients between matrices resulting from the differentdistance measurements. The values are given for the correlation coefficientsincluding and excluding the diagonals. All correlations are significant for α =0.05
distance based on original transcription
perc. dist. based dist.
rincl rexcl rincl rexcl
Barkfilter 0.65 0.33 0.87 0.52
cochleagrams 0.67 0.38 0.89 0.62
formants 0.71 0.50 0.93 0.77
transcription 0.79 0.64
(z = 1.18, p = 0.119). When the diagonal is excluded, the formant track correlationcoefficient is not significantly higher than the cochleagram correlation coefficient,and the cochleagram correlation coefficient is not significantly higher than theBarkfilter correlation coefficient. However the formant track correlation coefficientis significantly higher than the Barkfilter correlation coefficient (r = 0.50 vs. r =0.33, z = 2.10, p = 0.018). Although the formant-based distances have the highestcorrelation coefficient with respect to the perceptual distances (for both includingand excluding the diagonal), we see that the formant-based distances have a signifi-cantly higher correlation coefficient only with respect to the Barkfilter correlationcoefficient when excluding the diagonal.
The table shows that all acoustic measurements correlate less-well with theperceptual distances than the transcription-based distances do. Although theformant track-based distances correlates highest of the acoustic measurements, itcorrelates still significantly lower than the transcription-based distances (includingdiagonal: r = 0.71 vs. r = 0.79, z = –1.94, p = 0.026, and excluding diagonal:r = 0.50 vs. r = 0.64, z = 2.12, p = 0.017). This may be explained from the factthat, in acoustic measurements, speaker characteristics such as voice quality play arole, while the transcriber as well as the listeners in the perception experiment areprobably able to abstract from individual speaker characteristics to a great extent.
Ten Bosch (2000) correlates the ASR-based distances with transcription-baseddistances. He found an obvious correlation (r = 0.70). In our research we also foundrather high (and significant) correlations between the acoustic distances and thetranscription-based distances, where the formant-based distances had the highestcorrelation (r = 0.77 excluding the diagonal). Regardless whether the diagonal isincluded or excluded, the correlation coefficient based on the cochleagram repre-sentation is not significantly higher than the correlation coefficient based on theBarkfilter representation. However the correlation coefficient based on the formanttrack representation is significantly higher than both the Barkfilter correlationcoefficient and the cochleagram correlation coefficient.
NORWEGIAN DIALECTS EXAMINED PERCEPTUALLY AND ACOUSTICALLY 313
The fact that of the acoustic measurements the formant-based distances havethe (in one case significantly) higher correlation with the perceptual distances andalso have the significantly higher correlation with the transcription-based distancesmay indicate that the influence of voice characteristics is less strong when distancesare measured on the basis of formants, rather than on the basis of the Barkfilter orcochleagrams. This seems to be confirmed by the classification results (Section 3.5)where the distinction between male and female speaker is stronger in the Barkfilterand cochleagram-based results than in the formant-based results.
5. Conclusion
The aim of this explorative investigation was to find an acoustic distance measurebetween dialects which approximates a perceptual distance measure. The resultsshow that of the different acoustic measurements the formant-based distanceshave not only the highest correlation with the perceptual distances, but with thetranscription-based distances as well. The formant-based correlation coefficientwith respect to the transcription-based results is significantly higher than thoseof the other acoustic measurements. Since transcription based results may also beregarded as perceptual to some extent, this outcome may indicate that the influenceof voice characteristics is less strong when distances are measured on the basis offormants, rather than on the basis of the Barkfilter or cochleagrams. This seems tobe confirmed by the classification results where the distinction between male andfemale speaker is stronger in the Barkfilter and cochleagram-based results than inthe formant-based results.
The correlation with the perceptual distances is higher for the transcription-based distances than for the formant-based distances (without diagonal signifi-cantly higher). Thus it is still necessary to search for a more refined method of usingacoustic data for distance measurements. A disadvantage of the use of acoustic datais that it is not clear how great the influence of varying recording circumstances andthe individual voice characteristics of the speakers are. To neutralize the influenceof the speaker specific information, much more than one sample per dialect (asin our research) should, therefore, be used. Furthermore, it would be worthwhileto find a way in which differences in speech rates might be normalized in a morerefined way than is done in our research (see Section 3.3).
We also compared both the perceptually-based results and acoustically-basedresults to the traditional map of Skjekkeland (1997) on which the east-west divisionis most important. In our results we found the north-south division to be moresignificant than the east-west division. In our results there was no biased weightingof phenomena. On the other hand, the traditional map of Skjekkeland is based onlyon a limited number of phenomena.
314 WILBERT HEERINGA AND CHARLOTTE GOOSKENS
Acknowledgements
The present article reports on part of a study supported by a grant for the coopera-tion between the Departments of Linguistics in Groningen and Oslo from NWO,the Netherlands Organization for Scientific Research. We wish to thank Vincentvan Heuven and John Nerbonne for advice and comments on this paper, PaulBoersma and David Weenink for help with PRAAT, Sabine Rosenhart for help withcutting the word samples, Jørn Almberg for his permission to use the recordingsand transcriptions of ‘The North Wind and the Sun’ and for his help during thewhole investigation and Saakje van Dellen for help with entering data. We thankArnold Dalen for his help in finding a reliable dialect map and for classifying eachof the 15 varieties in the right dialect group in accordance with this traditionaldialect map. We thank Peter Kleiweg for his graphic programs, which we used forthe visualization of the map, the dendrograms and the multidimensional scalingplots. We thank the anonymous reviewers for their valuable comments.
Notes
1 The recordings were made by Jørn Almberg in co-operation with Kristian Skarbø at the Depart-ment of Linguistics, University of Trondheim and made available at http://www.ling.hf.ntnu.no.nos.At the time, the perception experiment was carried out, recordings of only 15 varieties were available.Today more than 50 recordings are available, giving much better possibilities to pick a representativeselection of varieties.2 The program PRAAT is a free program and available via http://www.fon.hum. uva.nl/praat/.3 See also http://www.bsos.umd.edu/hesp/newman/Newman_classes/Newman604/604.html.4 In the context: “kven av dei’, which means: “which of them”.5 In the context: “ta av frakken”, which means: “take the coat off”.6 For determining whether two correlation coefficients are significantly different or not we used thewebsite of VassarStats which can be found at: http://faculty.vassar.edu/lowry/VasserStats.html.
References
Bolognesi R., Heeringa W. (2002) De invloed van dominante talen op het lexicon en de fonologievan Sardische dialecten. Gramma/TTT: tijdschrift voor taalwetenschap, 9(1), pp. 45–84.
Christiansen H. (1954) Hovedinndelingen av norske dialekter. Maal og Minne, pp. 30–41.Gooskens C., Heeringa W. (2003) Perceptive Evaluation of Levenshtein Dialect Distance Measure-
ments Using Norwegian Dialect Data. Language Variation and Change, Submitted.Hunt M. J., Lennig M., Mermelstein P. (1999) Use of Dynamic Programming in a Syllable-based
Continuous Speech Recognition System. In Sankoff, D. and Kruskal, J. (eds.), Time Warps, StringEdits, and Macro Molecules; The Theory and Practice of Sequence Comparison, CSLI, Stanford,2nd edition, pp. 1–44. 1st edition appeared in 1983.
Jain A. K., Dubes R. C. (1988) Algorithms for Clustering Data. Englewood Cliffs, Prentice Hall,New Yersey.
Kessler B. (1995) Computational Dialectology in Irish Gaelic. In Proceedings of the 7th Confer-ence of the European Chapter of the Association for Computational Linguistics, EACL, Dublin,pp. 60–67.
NORWEGIAN DIALECTS EXAMINED PERCEPTUALLY AND ACOUSTICALLY 315
Kruskal J. B. (1964) An Overview of Sequence Comparison. In Sankoff, D. and Kruskal, J.(eds.), Time Warps, String Edits, and Macro Molecules; The Theory and Practice of SequenceComparison, Addison-Wesley, Massachusetts, pp. 1–40.
Kruskal J. B. (1999) An Overview of Sequence Comparison. In Sankoff, D. and Kruskal, J.(eds.), Time Warps, String Edits, and Macro Molecules; The Theory and Practice of SequenceComparison, CSLI, Stanford, 2nd edition, pp. 1–44. 1st edition appeared in 1983.
Nerbonne J., Heeringa W., van den Hout E., van der Kooi P., Otten S., van de Vis W. (1996) PhoneticDistance between Dutch Dialects. In Durieux, G., Daelemans, W., and Gillis, S. (eds.), CLIN VI,Papers from the Sixth CLIN Meeting, University of Antwerp, Center for Dutch Language andSpeech (UIA), Antwerp, pp. 185–202.
Rietveld A. C. M., van Heuven V. J. (1997) Algemene Fonetiek. Coutinho, Bussum.Skjekkeland M. (1997) Dei norske Dialektane: tradisjonelle sædrag i jamføring med skriftmåla.
HøskoleForlaget, Kristiansand.Sneath P. H. A., Sokal R. R. (1973) Numerical Taxonomy, A Series of Books in Biology. W. H.
Freeman and Company, San Francisco.Ten Bosch L. (2000) ASR, Dialects, and Acoustic/Phonological Distances. In ICSLP2000, Beiging.

Top Related
Copyright © 2022 FDOKUMEN

