


Bahasa
Halaman
Hukum

National Mass Drug Administration Costs for LymphaticFilariasis EliminationAnn S. Goldman1*, Victoria H. Guisinger2, Moses Aikins3, Maria Lourdes E. Amarillo4, Vicente Y.
Belizario5, Bertha Garshong3, John Gyapong3, Conrad Kabali6, Hussein A. Kamal7, Sanjat Kanjilal2,
Dominique Kyelem8, Jefrey Lizardo9, Mwele Malecela6, Godfrey Mubyazi6, P. Abdoulaye Nitiema10,
Reda M. R. Ramzy11, Thomas G. Streit12, Aaron Wallace2, Molly A. Brady2, Richard Rheingans2,
Eric A. Ottesen2, Anne C. Haddix2
1 Department of Epidemiology and Biostatistics, The George Washington School of Public Health and Health Services, Washington, DC, United States of America,
2 Lymphatic Filariasis Support Center, Emory University, Atlanta, Georgia, United States of America, 3 Health Research Unit, Ghana Health Service, Accra, Ghana,
4 Department of Clinical Epidemiology, College of Medicine, University of the Philippines, Manila, The Philippines, 5 Department of Parasitology, College of Public Health,
University of the Philippines, Manila, The Philippines, 6 National Institute of Medical Research, Dar es Salaam, Tanzania, 7 Ministry of Health & Population, Cairo, Egypt,
8 Lymphatic Filariasis Program, Ministry of Health, Ouagadougou, Burkina Faso, 9 Center for Social Management, Technological Institute of Santo Domingo, Santo
Domingo, Dominican Republic, 10 Department of Evaluation, Ministry of Health, Ouagadougou, Burkina Faso, 11 Research & Training Center on Vectors of Diseases, Ain
Shams University, Cairo, Egypt, 12 Department of Biological Sciences, University of Notre Dame, Notre Dame, Indiana, United States of America
Abstract
Background: Because lymphatic filariasis (LF) elimination efforts are hampered by a dearth of economic information aboutthe cost of mass drug administration (MDA) programs (using either albendazole with diethylcarbamazine [DEC] oralbendazole with ivermectin), a multicenter study was undertaken to determine the costs of MDA programs to interrupttransmission of infection with LF. Such results are particularly important because LF programs have the necessary diagnosticand treatment tools to eliminate the disease as a public health problem globally, and already by 2006, the GlobalProgramme to Eliminate LF had initiated treatment programs covering over 400 million of the 1.3 billion people at risk.
Methodology/Principal Findings: To obtain annual costs to carry out the MDA strategy, researchers from seven countriesdeveloped and followed a common cost analysis protocol designed to estimate 1) the total annual cost of the LF program,2) the average cost per person treated, and 3) the relative contributions of the endemic countries and the external partners.Costs per person treated ranged from $0.06 to $2.23. Principal reasons for the variation were 1) the age (newness) of theMDA program, 2) the use of volunteers, and 3) the size of the population treated. Substantial contributions by governmentswere documented – generally 60%–90% of program operation costs, excluding costs of donated medications.
Conclusions/Significance: MDA for LF elimination is comparatively inexpensive in relation to most other public healthprograms. Governments and communities make the predominant financial contributions to actual MDA implementation,not counting the cost of the drugs themselves. The results highlight the impact of the use of volunteers on program costsand provide specific cost data for 7 different countries that can be used as a basis both for modifying current programs andfor developing new ones.
Citation: Goldman AS, Guisinger VH, Aikins M, Amarillo MLE, Belizario VY, et al. (2007) National Mass Drug Administration Costs for Lymphatic FilariasisElimination. PLoS Negl Trop Dis 1(1): e67. doi:10.1371/journal.pntd.0000067
Editor: Charles King, Case Western Reserve University School of Medicine, United States of America
Received March 5, 2007; Accepted July 16, 2007; Published October 31, 2007
Copyright: � 2007 Goldman et al. This is an open-access article distributed under the terms of the Creative Commons Attribution License, which permitsunrestricted use, distribution, and reproduction in any medium, provided the original author and source are credited.
Funding: The study was supported by a sub-contract of a grant from the Bill & Melinda Gates Foundation to the Emory Lymphatic Filariasis Support Centerwhich was responsible for facilitating the development of the costing protocol. The funders had no role in study design, data collection and analysis, decision topublish, or preparation of the manuscript.
Competing Interests: The authors have declared that no competing interests exist.
*E-mail: [email protected]
Introduction
Lymphatic filariasis (LF), commonly known as elephantiasis, is
a profoundly disfiguring parasitic disease caused by thread-like
nematode worms. The World Health Organization (WHO) places
the number of people at risk in 83 countries at 1.307 billion.[1]
Globally, the reduced productivity as a consequence of LF
disability has been well recognized. The chronic and debilitating
burden of LF maintains the cycle of poverty not only in infected
individuals but also in entire endemic communities. [2,3] Indeed,
as a disease of poverty, LF is endemic in 43 of the 50 countries
classified as least developed nations. [4–6]
The 1997 World Health Assembly resolved to eliminate LF as
a public health problem after LF had been identified as one of only
a small number of diseases classified as potentially eradicable. [7]
The principal strategy for elimination relies on once-yearly
concurrent administration of two drugs, albendazole with di-
ethylcarbamazine (DEC) or albendazole with ivermectin – both
regimens shown to be highly effective in removing microfilariae
from the blood for a full year after treatment. [8] Administration of
PLoS Neglected Tropical Diseases | www.plosntds.org 1 October 2007 | Volume 1 | Issue 1 | e67

these once-yearly, single-dose regimens to people in at-risk
communities for 4–6 years makes feasible the prospect of
interrupting transmission and thereby eliminating LF, [9] largely
because the reproductive life span of the adult worm is estimated
to be 4–6 years. While the delivery of DEC fortified salt is another
strategy that has been applied in some regions of the world to
eliminate LF, this strategy was not in the purview of the current
studies.
Demonstrating that LF elimination is a cost-effective and
affordable investment is essential for both Ministries of Health and
potential donors as they choose among competing health needs.
While several cost-effectiveness analyses have been conducted and
one estimate for MDA in high prevalence areas gives a range of
$4–8 per disability adjusted life year (DALY) averted, [2,10–13]
more cost and cost-effectiveness data are lacking. The persistent
need for detailed costing of mass drug administration (MDA)
programs led to the present initiative to develop and implement
a common cost-analysis protocol. Countries participating in this
multi-country study were selected to represent the different stages
and scope of national LF elimination efforts, different economic
conditions of endemic countries, and different geographic regions
affected by the disease. Health expenditures per capita in the
participating countries for 2001–2002 ranged from $12 in
Tanzania and Ghana, to $22 in Haiti, $27 in Burkina Faso, $30
in the Philippines, $46 in Egypt and $153 in the Dominican
Republic.[14,15] The cost analysis objectives were to 1) estimate
total annual costs of the LF program for a specific year or more
(depending on the availability of information), 2) calculate the
average cost per person treated, 3) identify the relative contribu-
tions of the endemic country and external partners, 4) provide data
that could be used for program evaluation and analysis, 5)
understand how the results differed among countries, and 6) build
a framework for the development and implementation of cost
studies elsewhere.
Cost analyses aggregated in this report are based on studies
in Burkina Faso, the Dominican Republic, Egypt, Ghana,
Haiti, the Philippines, and Tanzania. Detailed analyses from
two of these countries have already been published elsewhere.
[12,16]
MethodsStudy Teams
Data collection and analysis were carried out by research teams
in each of the participating countries. The cost analysis teams in
Burkina Faso, Tanzania, and Ghana were part of the Ministry of
Health. In Egypt the study was a joint effort between the Ministry
of Health and Population and the Ain Shams University Research
and Training Center on Vectors of Diseases. The Philippines’
research team was based at the National Institutes of Health-
Philippines. The Dominican Republic researchers at the Centro
de Gerencia Social, Instituto Tecnologico de Santo Domingo
worked with the Ministry of Health LF program. External
consultants in Haiti worked with Ministry of Health LF program
staff to collect and analyze cost study data.
Study ProtocolResearchers from the participating countries collaborated with
the Emory University LF Support Center in the development of
a protocol (http://www.taskforce.org/lfsc/professionals.html)
which served as the tool to identify, organize, analyze, summarize
and present the cost data. The protocol and accompanying data
collection instrument created a systematic process for data
collection and analysis so that the cost estimates would be
comparable across a variety of country settings, programmatic
approaches and program sizes.
The cost analysis identified both economic costs (i.e., the value of all
resources used in the program, including donated items, such as
medications for the MDA) and financial costs (i.e., the actual cash
disbursements for a program including resources provided by the
national government and local communities). Economic costs are
useful to evaluate the allocation of program resources and their
opportunity costs, e.g., whether these resources could be used
more productively elsewhere. Financial costs are helpful to
program managers to measure actual program expenditures and
assess affordability.[17] (See Table 1 for the classification of costs.)
Financial costs include all costs with the exception of donated
materials. Capital items were annualized to reflect costs incurred
in one year for the project. They do not include bicycles because
these were the property of the volunteer drug distributors, and
thus considered a donation. Volunteer training per diems are
classified as Financial and Economic costs, but the value of
volunteer unpaid time is not included in either Financial or
Economic costs. Because the capital costs were annualized, the
cash expenditures described reflect those incurred in one year for
the project.
The protocol adopted a national program perspective because
most resources dedicated to the LF MDAs were channeled
through Ministry of Health (MOH) programs. Participants agreed
to gather MDA costs, beginning with the year 2000, the first year
of the LF global elimination effort. Costs were calculated in local
currencies and converted to US dollars for the final analysis, based
on average exchange values for the years being analyzed (base year
2002).
Most of the countries were still in the early stages of
expanding their MDAs when the cost analysis studies began.
The exception was Egypt where the MDA targeted almost 90% of
the population at risk the first year and 100% the second year
studied.
Project inputs defined in the protocol were: personnel, supplies
and drugs (medications for the MDA and for treatment of adverse
reactions), as well as capital and recurrent costs for equipment,
transportation, and facilities. Each input was allocated to one or
more categories of activities involved in accomplishing the MDA:
training, mapping, mobilization and education, drug distribution,
Author Summary
Lymphatic filariasis (LF), commonly known as elephantiasis,is a profoundly disfiguring parasitic disease caused bythread-like nematode worms. This disease can often bedisabling, thus reducing the potential productivity of theaffected individuals. The WHO places the number ofpeople at risk in 83 countries at 1.307 billion. This studywas undertaken in seven countries—Burkina Faso, Ghana,Egypt, Tanzania, the Philippines, the Dominican Republic,and Haiti—using a common protocol to determine thecosts of mass drug administration (MDA) programs tointerrupt transmission of infection with LF, because thereis lack of sufficient information about the costs of theseprograms. The results demonstrate that LF MDA isaffordable and relatively inexpensive when compared toother public health programs. In the context of initiativesfor integrating programs for the control and elimination ofneglected tropical diseases, this study adds specifically tothe relatively scarce body of information about the costs ofMDA programs for LF. It also adds to the generalknowledge about the application of methods that canbe used to estimate the costs and cost-effectiveness of anintegrated approach.
Cost Analysis: LF MDA Programs
PLoS Neglected Tropical Diseases | www.plosntds.org 2 October 2007 | Volume 1 | Issue 1 | e67

adverse reaction monitoring, surveillance/laboratory, and admin-
istration (Table 2). Capital costs were defined as one-time
investments in physical goods that have a life longer than one
year and generally cost more than $1000. These costs were
annualized, using a formula that accounted for years of useful life,
scrap value, and a discount rate set at 3%. Recurrent costs
included those items that were consumed on a regular basis; i.e.,
personnel time, office and laboratory supplies, fuel, and drugs.
Recurrent costs for maintenance of donated capital items such as
bicycles were also included. In cases where facilities or equipment
costs were not available, costs of similar facilities or rentals were
used as a proxy. For the purpose of Economic costs, the value
of the donated drugs was set as $0.19 plus $0.0019 for shipping
per 400mg tablet of albendazole (Personal Communication:
GlaxoSmithKline. February 17, 2004) and $1.50 plus $.0018 per
3 mg tablet of Mectizan (Personal Communication: Merck & Co.,
Inc. March 1, 2004) DEC, used in four of the seven countries
studied, was not donated by the private sector and had to be
purchased for the national programs.
Study SitesStudy sites were chosen purposively to be representative of the
LF- endemic regions in the countries (Table 3). National estimates
were developed using the data from these representative study
sites.
Tanzanian investigators studied four districts located on the
eastern coast, Kilwa, Mafia, Mkuranga and Masasi for the years
2000–2003. Data collection for the first three years was
retrospective.
Data collected retrospectively in Burkina Faso documented the
first two years of the MDA in the region of Gaoua in the first year
and expansion into Tenkodogo in the second year.
The Philippines team chose to study seven municipalities and
one city in the province of Sorsogon. These were selected based on
filariasis endemicity using microfilaria rates, accessibility and
population size. Half had high microfilaria rates (MF), half were
easily accessible, while one quarter had large populations. In each
municipality, one sentinel barangay or village was selected based
on high MF rates and one to three adjacent barangays were also
studied.
Cost data collection in Haiti was conducted in Leogane, where
the first MDAs took place. Located 30 km west of Port-au-Prince
in the south, Leogane is one of the highest risk areas in the
country. Except for lower coverage in year-2 (2001) of the MDA
program (because of side reactions that occurred after the first
MDA) the program expanded not only in Leogane in 2002 but
also to Milot, another high risk area just south of Cap Hatien in
the north.
Researchers in the Dominican Republic collected cost data for
the first two MDA campaigns. These were launched in Barahona
on the southwest coast of the country.
The Ghana study costed three districts from the two epidemio-
logical zones in the country, north and south. The districts were
selected to reflect differing levels of program assistance. Builsa in
the upper eastern region of the country received government
support only, while Lawra in the upper west and Ahanta West on
the west coast also received NGO support.
Table 2. MDA Activities and Other Cost Categories.
Activity Definition
Training Instruction of MOH personnel to carry out the administrative and functional activities of the MDA and instruction of volunteers todevelop skills required for the MDA.
Mapping Testing to establish microfilaria and/or antigenaemia prevalence in communities.
Mobilization and Education Media campaigns and community activities to increase MDA participation.
Drug Distribution Logistic aspects of management of the drugs as well as administration of the drugs to the population.
Adverse Reaction Monitoring Observation and treatment of persons suffering adverse reactions due to the MDA.
Surveillance and Laboratory Tracking of community members in MDA area, laboratory work for testing, case identification, etc.
Administration Supervisory work and paperwork to support the MDA.
LF Non-MDA Costs Costs related to LF, but not the MDA (excluded from cost calculations).
Other Non-LF, Non-MDA Costs MOH costs not at all related to the MDA or to LF (excluded from cost calculations).
doi:10.1371/journal.pntd.0000067.t002
Table 1. Classification of Costs.
Inputs Economic Costs Financial Costs
Albendazole yes no
Bicycles yes no
Clinic space yes yes
Computers yes yes
DEC yes yes
Donated materials yes no
Existing vehicle yes yes
Food and refreshments yes yes
Fuel and maintenance yes yes
MectizanH yes no
Office Space -MOH yes yes
Office Space -rented yes yes
Office Supplies yes yes
Other drugs yes yes
Printing yes yes
Purchased vehicle yes yes
Staff time yes yes
Utilities yes yes
Volunteer training per diem yes yes
Volunteer time no no
doi:10.1371/journal.pntd.0000067.t001
Cost Analysis: LF MDA Programs
PLoS Neglected Tropical Diseases | www.plosntds.org 3 October 2007 | Volume 1 | Issue 1 | e67

The cost analysis in Egypt covered the eight governorates along
the Nile affected by LF. Costs were obtained for one district in
each governorate and applied to the rest of the affected areas in
the governorate based upon information about numbers of persons
at risk, participating government personnel and quantities of
medication distributed.[16]
Data CollectionData collection was both retrospective and prospective. The
number of rounds of MDA costed per country ranged from one to
four, with most countries costing two rounds. Countries developed
national estimates for the program using data collected from
a sampling of sites representative of the program (Table 3).
Coverage rates are defined as the number of individuals reported
to have ingested the antifilarial drugs divided by the total at-risk
population in the program area. Those excluded from treatment
included pregnant women, lactating women in the 1st week
post-partum, the very sick, children under two years of age in
countries where DEC plus albendazole is the MDA regimen, and
children under 90 cm in height (generally under 5 years of age)
where albendazole is administered with Mectizan.
The data were collected from national, regional and district
levels of the health care system via pre-tested questionnaires and
spreadsheets, sometimes with the assistance of other agencies such
as Ministries of Agriculture and Information. As LF is but one of
many population-based health programs, most inputs (including
personnel time, facilities, equipment, supplies, vehicles and fuel)
were often shared by more than one program, and costs were
apportioned accordingly. To capture the actual costs and
percentage of the resources dedicated to LF, the teams reviewed
program records and interviewed LF program administrators and
personnel about allocations of personnel and resource time per
year. Government tax fees such as customs tax on the drugs and
the road tax were excluded.
Table 3. Country Background Information.
CountryTotal Population(millions)a
EstimatedPopulationAt-Risk for LF(millions) Drugs Used
Areas Included in CostAnalysis Drug Distribution Strategy
Burkina Faso 12.62 12.62 Mectizan albendazole 2001: Gaoua Region NPELF is integrated in the healthsystem. House-to-house byvolunteers
2002: Gaoua, Tenkodogo,Koudougou (2 of 5 districts)and Manga Regions
Dominican Republic 8.62 1.5 DEC albendazole 2002–2003: Southwest area Year 1: community distribution(house to house)
Year 2: partial integration withprimary health care system(house to house)
Egypt 70.51 2.57 DEC albendazole 2000: Qalyubia, Menofia, Sharkia,K. El Sheikh, Dakahlia, Gharbia,Giza, Governorates
House-to-house by teams ofdoctors and nurses
2001: same plus AssiutGovernorate
Ghana 20.47 6.02 Mectizan 2003: Ahanta West, Builsa andLawra Districts
Distribution posts, house-to-house or combination of two byvolunteers
albendazole
Haiti 8.22 6 DEC 2000–2003: Leogane Distribution posts by programstaff
albendazole 2002: Milot
Philippines 78.58 23.5 DEC 2003: Sorsogon Province Distribution posts, house-to-house by volunteers
albendazole
Tanzania 35.23 31.17 Mectizan 2000: Mafia District First at distribution posts, thenhouse-to-house follow-up byhealth care workers andvolunteers
albendazole 2001: Mafia and MkurangaDistricts
2002: Mafia, Mkuranga, MasasiDistricts
2003: Mafia, Mkuranga, Masasiand Kilwa Districts
a(World Health Organization 2002, World Health Organization 2003, World Health Organization 2004a).doi:10.1371/journal.pntd.0000067.t003
Cost Analysis: LF MDA Programs
PLoS Neglected Tropical Diseases | www.plosntds.org 4 October 2007 | Volume 1 | Issue 1 | e67

Results
Country MDA CostsAs indicated in Table 4, the Financial costs per person treated
ranged from $0.06 to $2.23 while Economic costs varied between
$0.40 and $5.87. MDA coverage rates in the study populations
ranged from 53% to 91%. While cost per person at risk can be
easily calculated, cost per person treated is the more useful
summary of costs for the purposes of planning and operations.
Of the several trends that can be seen in Table 4, the most
notable is that for those countries for which there is more than one
year of data, cost per person treated decreased after the first year
of the program, especially as the number of persons treated
increased (see Figure 1). In addition, the Financial costs per person
treated for Burkina Faso, Ghana, Tanzania and the Philippines, all
of which used volunteers, were the lowest among the seven
countries participating in the study.
Activities and InputsIdentification of resource allocation by activity and input is
a useful and informative outcome of this study.
The use of resources for different activities varied among
countries, and Table 5 identifies the proportion of the average
national Financial costs expended for each activity in a ‘non-start-up’
MDA round (since yearly costs tend to stabilize after the ‘start-up’
year). Drug distribution generally represented the largest proportion
of financial expenditures (average of 46%), with social mobilization/
education and administration being next most prominent.
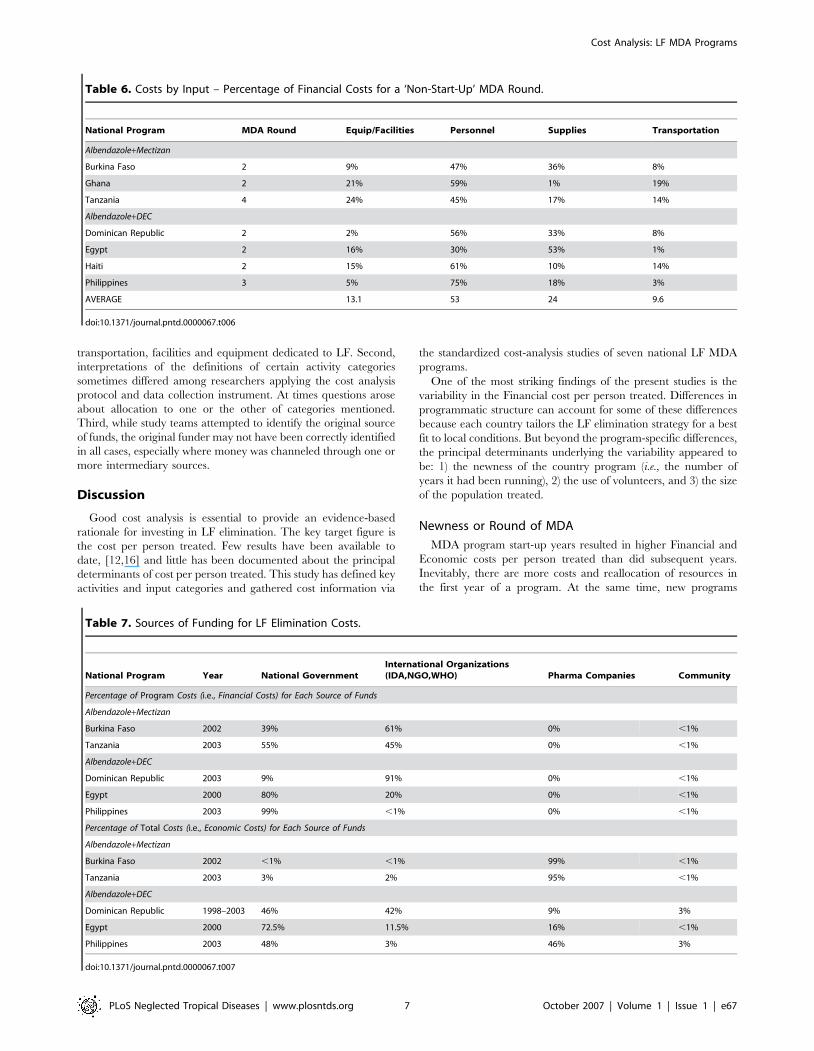
Analysis of financial costs by input, particularly useful for
projecting budgets and for gauging the need for additional
program support, again gave results varying appreciatively by
country (Table 6). In all but one country, Egypt, the input that
consumed the largest proportion of financial resources was
personnel, averaging 53%, followed by supplies, equipment/
facilities and transportation.
Funding SourcesThese cost analyses not only identified how program resources
were allocated, but data also were used to identify sources and
amounts of funding for 5 of the 7 study countries. Funding was
categorized as coming from national governments (excluding
external donations for LF), international organizations (IDAs,
NGOs, WHO), pharmaceutical companies and local communities
(Table 7). As expected, the drug donations represent a large
proportion of contributions to MDA programs, so that when MOH
and partner contributions are examined from the perspective of
Economic costs, the drug donations can make up over 90% (range 9%–
99%) of the costs. This was particularly true in countries like Burkina
Faso and Tanzania where both drugs used in the MDA (albendazole
and Mectizan) were donated. When Financial costs are analyzed,
however, it is clear that contributions from national governments
represent a significant portion of the resources used to implement the
MDAs (average = 56%, range 9%–99%). These relationships can be
seen graphically in Figure 2 which presents the combined average of
Financial and Economic funding sources for the Burkina Faso, the
Dominican Republic, Egypt, the Philippines and Tanzania
programs detailed in Table 7.
Sensitivity AnalysesSensitivity analyses were conducted on the personnel input (data
not shown) to gauge how much an increase in personnel costs
would impact overall costs. Personnel was selected for sensitivity
analysis because, with the exception of Egypt, this input
represented the largest source of costs in the participating
countries. Sensitivity analyses conducted on personnel input for
Table 4. Financial and Economic per Person Treated.
Country YearMDAround
Population atRisk in CurrentMDA Areas
PopulationTreated
FinancialCost ($US)
Financialper PersonTreated ($US)
Economic Costper PersonTreated ($US)
MDACoverageRate (%)
Albendazole+Mectizan
Burkina Faso 2001 1 559,000 431,399 $46,000 0.11 4.55 77%
Burkina Faso 2002 2 2,613,000 1,801,125 $110,000 0.06 4.82 69%
Ghana 2002 2 1,650,000 1,223,122 $1,358,000 0.17 4.88 69%
Tanzania 2000 1 40,800 37,000 $20,000 0.54 5.16 91%
Tanzania 2001 2 182,000 118,220 $50,000 0.42 5.82 65%
Tanzania 2002 3 537,000 437,698 $118,000 0.27 4.56 82%
Tanzania 2003 4 687,000 511,671 $133,000 0.26 4.53 75%
Albendazole+DEC
Dominican Republic 2002 1 142,000 115,411 $216,000 1.87 3.10 83%
Dominican Republic 2003 2 333,000 250,059 $217,000* 0.87* 1.56* 75%
Egypt 2000 1 2,088,000 1,795,553 $2,412,000 1.37 1.80 86%
Egypt 2001 2 2,638,000 2,320,602 $3,109,000 1.00 1.34 87%
Haiti (Leogane) 2000 1 150,000 105,750 $236,000 2.23 n/a 71%
Haiti (Leogane) 2001 2 150,000 79,713 $156,000 1.96 n/a 53%
Haiti (Leogane) 2002 3 150,000 121,139 $158,000 1.30 n/a 81%
Haiti (Milot) 2002 1 126,000 100,376 $110,000 1.10 n/a 79%
Philippines 2003 3 691,000 556,912 $105,842 0.19 0.40 81%
*Adjusted for peso devaluation.doi:10.1371/journal.pntd.0000067.t004
Cost Analysis: LF MDA Programs
PLoS Neglected Tropical Diseases | www.plosntds.org 5 October 2007 | Volume 1 | Issue 1 | e67

Ghana and Burkina Faso demonstrated that increasing the
proportion of personnel time dedicated to the LF MDA did not
raise financial costs beyond the currently-calculated ranges, even
under conditions where personnel time was doubled (Ghana -
US$0.25 and Burkina - US$0.08) or tripled (Ghana - US$0.34 and
Burkina - US$0.11). Additionally, a sensitivity analysis of
personnel costs in the Philippines showed that personnel costs
would remain well within the range of the current Financial costs
(US$ 0.69) even if personnel time were doubled.
Study LimitationsThere were three principal study limitations. First, investigators
frequently encountered problems in estimating the proportion of
time and money allocated specifically to the LF MDA programs.
Staff had not previously tracked time apportioned to LF-specific
activities, and since LF programs are small in relation to other
MOH initiatives (consuming anywhere from 1% to 5% a year in
most countries), recall was problematic at times. Similar situations
were encountered with respect to other resources such as
Table 5. Costs by Activity – Percentage of Financial Costs for a ‘Non-Start-Up’ MDA Round.
National ProgramMDARound Training Mapping1
Mobilization/Education
DrugDistribution
Adverse ReactionMonitoring
Surveillance/Lab Admin.
Albendazole+Mectizan
Burkina Faso 2 9% 0% 7% 45% 1% 5% 33%
Ghana 2 11% 2% 30% 13% 1% 27 16%
Tanzania2 4 20% ,1% 28% 40% 0% 3% 8%
Albendazole+DEC
Dominican3 Republic 2 0% 5% 89% 2% 4%
Egypt4 2 4% 11% 2% 47% 5% 12% 19%
Haiti3 2 5% 25% 49% 4% 12% 4%
Philippines 3 10% 10% 15% 38% 6% 3% 18%
AVERAGE 10.8 4.1 16.0 45.9 2.4 9.1 14.6
1Major expenditures for mapping activities predated the years covered by the cost studies.2Average of district and central levels.3Haiti and the Dominican Republic distributed training costs across the activities.4Governorate level.doi:10.1371/journal.pntd.0000067.t005
Figure 1. Financial Costs and Population Treated by Country and MDA Year.doi:10.1371/journal.pntd.0000067.g001
Cost Analysis: LF MDA Programs
PLoS Neglected Tropical Diseases | www.plosntds.org 6 October 2007 | Volume 1 | Issue 1 | e67
transportation, facilities and equipment dedicated to LF. Second,
interpretations of the definitions of certain activity categories
sometimes differed among researchers applying the cost analysis
protocol and data collection instrument. At times questions arose
about allocation to one or the other of categories mentioned.
Third, while study teams attempted to identify the original source
of funds, the original funder may not have been correctly identified
in all cases, especially where money was channeled through one or
more intermediary sources.
Discussion
Good cost analysis is essential to provide an evidence-based
rationale for investing in LF elimination. The key target figure is
the cost per person treated. Few results have been available to
date, [12,16] and little has been documented about the principal
determinants of cost per person treated. This study has defined key
activities and input categories and gathered cost information via
the standardized cost-analysis studies of seven national LF MDA
programs.
One of the most striking findings of the present studies is the
variability in the Financial cost per person treated. Differences in
programmatic structure can account for some of these differences
because each country tailors the LF elimination strategy for a best
fit to local conditions. But beyond the program-specific differences,
the principal determinants underlying the variability appeared to
be: 1) the newness of the country program (i.e., the number of
years it had been running), 2) the use of volunteers, and 3) the size
of the population treated.
Newness or Round of MDA
MDA program start-up years resulted in higher Financial and
Economic costs per person treated than did subsequent years.
Inevitably, there are more costs and reallocation of resources in
the first year of a program. At the same time, new programs
Table 6. Costs by Input – Percentage of Financial Costs for a ‘Non-Start-Up’ MDA Round.
National Program MDA Round Equip/Facilities Personnel Supplies Transportation
Albendazole+Mectizan
Burkina Faso 2 9% 47% 36% 8%
Ghana 2 21% 59% 1% 19%
Tanzania 4 24% 45% 17% 14%
Albendazole+DEC
Dominican Republic 2 2% 56% 33% 8%
Egypt 2 16% 30% 53% 1%
Haiti 2 15% 61% 10% 14%
Philippines 3 5% 75% 18% 3%
AVERAGE 13.1 53 24 9.6
doi:10.1371/journal.pntd.0000067.t006
Table 7. Sources of Funding for LF Elimination Costs.
National Program Year National GovernmentInternational Organizations(IDA,NGO,WHO) Pharma Companies Community
Percentage of Program Costs (i.e., Financial Costs) for Each Source of Funds
Albendazole+Mectizan
Burkina Faso 2002 39% 61% 0% ,1%
Tanzania 2003 55% 45% 0% ,1%
Albendazole+DEC
Dominican Republic 2003 9% 91% 0% ,1%
Egypt 2000 80% 20% 0% ,1%
Philippines 2003 99% ,1% 0% ,1%
Percentage of Total Costs (i.e., Economic Costs) for Each Source of Funds
Albendazole+Mectizan
Burkina Faso 2002 ,1% ,1% 99% ,1%
Tanzania 2003 3% 2% 95% ,1%
Albendazole+DEC
Dominican Republic 1998–2003 46% 42% 9% 3%
Egypt 2000 72.5% 11.5% 16% ,1%
Philippines 2003 48% 3% 46% 3%
doi:10.1371/journal.pntd.0000067.t007
Cost Analysis: LF MDA Programs
PLoS Neglected Tropical Diseases | www.plosntds.org 7 October 2007 | Volume 1 | Issue 1 | e67

typically cover a limited geographic area and a relatively small
population in their first year. As the population covered expands
after the first year, the cost per person treated tends to drop.
In addition to extra expenditures in a start-up year as compared
to other years, costs can also decrease over time because new cost-
savings strategies are identified and implemented. For example, in
the first MDA year in the Dominican Republic, health workers
from non-governmental organizations participated in the MDA;
these individuals were paid per diem for all of the time they
participated, in some cases higher than the wages of workers in the
health system. MDA integration into the health system contributed
to the 50% decrease in the second year Program cost per person
treated. Similarly in Haiti, after the first year cost analysis revealed
that 22% of resources were dedicated to adverse reactions, the
adverse reaction protocol was revised to an equally effective but
less costly strategy. In the second year only 4% of resources were
used for adverse reactions.
Use of VolunteersThe use of volunteers had the greatest impact on costs. In
Burkina Faso, Tanzania, Ghana, and the Philippines - where
Program costs are lowest - health workers are employed down to
the sub-district level, and volunteers, who are compensated very
little in the LF program, work at the village level. Volunteers in
these countries contribute a large proportion of the time dedicated
to the MDA (frequently receiving per diem only for days in
training) and at times provide their own transportation (e.g.,
Burkina Faso). However, while there is a strong relationship
between the use of volunteers and lower cost per person treated,
this does not suggest that any country choosing to use volunteers
would see savings of 85%. Country-specific conditions that lead to
the use of volunteers may also determine lower costs overall.
The use of volunteers leads to the question of how to accurately
value the time volunteers ‘donated’ to each program. One
traditional approach to valuing volunteer time is to apply the
wage from the volunteer’s normal paid employment and value
their volunteer time accordingly. The problem with this, as
pointed out by McFarland et al.[18] in a report on the costs of
onchocerciasis MDA, is that many volunteers are subsistence
farmers who do not participate in the formal labor market. One
alternative is to decide the fair market value of the time, i.e. the
amount the volunteer would be paid if the program had to hire
individuals for the work,[19] or another, by using an estimate from
prior studies in a similar setting.[18]
In the country programs included in this study, a diverse group
of individuals, comprising students, teachers, farm laborers, and
elderly retirees, served as volunteers. Owing to this fact and the
economic conditions in the participating countries, applying
traditional methodologies for costing volunteer time may not be
appropriate. After several countries explored volunteer participa-
tion in MDAs and the earning capacity of volunteers in their
regular pursuits, a decision was made by the investigators in all
participating countries not to include these costs. Therefore, while
the study included the per diem paid to volunteers during training,
it did not account for the opportunity cost of the volunteer’s time
dedicated to the MDA itself. The evaluation of the community
contribution from countries which used volunteers is very
definitely underestimated.
Program managers can control, to some extent, the use of
volunteers and might explore this strategy in resource-constrained
environments. Beyond the monetary savings, there is a benefit
from connecting the program with volunteers who are opinion
leaders from different community sectors. So while initially
decisions to utilize volunteers might be financially based, countries
ultimately can benefit not only from volunteers’ labor but also
from their connections to the communities in which they serve.
However, program managers must bear in mind the competition
for volunteers from other health programs which sometimes pay
volunteers more for their efforts. The sensitivity analyses on
personnel time devoted to the MDA point to the possibility that it
may be worthwhile exploring opportunities to increase remuner-
ation for volunteers. Indeed, both valuing and best utilizing
volunteer time merit continued examination.
Figure 2. Sources of Funding for the MDAs Conducted byNational LF Elimination Programs in Burkina Faso, DominicanRepublic, Egypt, the Philippines and Tanzania (Financial Costsand Economic Costs).doi:10.1371/journal.pntd.0000067.g002
Cost Analysis: LF MDA Programs
PLoS Neglected Tropical Diseases | www.plosntds.org 8 October 2007 | Volume 1 | Issue 1 | e67

Size of Population TreatedThe third principal source of variation in cost per person treated
was the size of the population treated, an element that can be
controlled by program managers during program expansion.
When programs scale-up, the cost per person treated drops,
primarily because most of the overhead costs are associated with
start-up costs at the national and district levels. Once the system
has been established, the majority of the new costs are in the new
area (district or governorate) that is being covered. In Burkina
Faso and Tanzania the Financial costs per person were halved as
the MDA covered larger populations. Between 2001 and 2002
Program costs in Burkina declined 45% while the population
treated increased by over 400%. The progression in Tanzania
between 2000 and 2003 was similar, with the Financial cost per
person treated decreasing by 47% while the treated population
increased over 13-fold. Between 2000 and 2001, the number of
persons treated in Egypt increased 29%, while the Financial cost
per person treated decreased 27%.
Such findings emphasize the need to keep current programs
adequately funded so that these programs can expand and
increase the number of persons treated and thereby capture the
savings resulting from the economies of scale.
Once the principal determinants of the cost per person treated
are identified, they can be used to manage program costs either by
making internal changes within a program, such as scaling-up and
increasing efficiency, or by taking advantage of existing external
resources, as through integration. LF elimination programs can be
integrated into the existing health system, as in the Dominican
Republic, or with other preventive chemotherapy programs. For
the LF elimination program, costs per person treated are within
the range of those estimated for other similar disease control and
elimination programs; namely soil-transmitted helminths ($0.25
per treatment[20]), trachoma ($0.50 per treatment[21]) and
onchocerciasis ($0.58 per treatment[18]). The potential pro-
grammatic overlap of activities among these and other public
health initiatives includes administration, drug distribution,
monitoring, surveillance, and social mobilization, so attractive
cost-saving opportunities can be envisioned through integration.
While estimates place the cost savings from integrated delivery
between 25% and 47%,[22,23] the LF cost analysis protocol
utilized in the present cost study can provide a useful tool by which
to document the potential savings from integrating some or all
programmatic activities of these initiatives. Indeed, countries that
have already completed the LF cost analysis are well placed to
estimate costs of integrated programs, given that many of the costs
common to all programs have already been identified.
Also of particular interest from this study was the documenta-
tion of the substantial contributions (i.e., program ownership) by
national governments (Figure 2). On average 56% of Financial
costs of the LF elimination programs were financed by govern-
ments. The Egyptian government contributed 80% of Program
costs, including participation of the Ministries of Health and
Population, of Agriculture, and of Information. This is consistent
with similar programs for TB and malaria which estimate that
70% of Financial costs are paid for by national governments.
[24,25] Furthermore, LF MDA programs do not require new or
additional funding for all inputs. For example, the portion of the
salary of a District Medical Officer (DMO) spent on the project
would be included in the analysis as a program cost, but the
DMO’s salary would have been funded regardless of whether the
time was spent on LF MDA activities or other programs and may
not require additional financial outlays. Governments have
a choice as to where they use their resources, and the percentages
noted in this study emphasize the commitment these national
governments have made to LF elimination.
Resource allocation choicesSurveillance and mapping activities represented a significantly
higher proportion of resource requirements in Egypt than in other
countries (between 10% and 12% at both the national and
governorate levels), since Egypt has selected small MDA
implementation units, i.e. the village level, and hence focused on
monitoring potential ‘at-risk’ areas closely in a large number of
implementation units.
Tanzania’s national program chose to invest heavily in social
mobilization and education to assist the districts in raising
awareness in the general population for current and future MDAs.
The districts placed more emphasis on funding drug distribution
and personnel training.
ConclusionThe principal aim of this study was to provide critical
information regarding the cost of implementing MDA for the
prevention of lymphatic filariasis. The study demonstrates that the
costs of MDA programs for LF elimination are comparable to
those estimated for other similar disease control and elimination
programs. While some programs had costs per person treated of
over a dollar, it was quite straightforward to identify those factors
most affecting program costs.
Such findings can be used on a national scale for program
planning, development and fundraising, and on a global scale for
calculating current global costs, predicting scale-up costs and
calculating savings from integration with other programs. These
results also will form the basis for guiding cost-effectiveness and
cost-benefit analyses, as more information on the effectiveness of
MDAs in the study countries becomes available. Additionally, the
analytic tool used in this study will be valuable for further studies
of the LF elimination program including costing of LF disability
alleviation activities and the process certifying LF elimination.
A further finding of particular importance was documentation
of the impact that the use of volunteers has on program costs.
Further research on how best to utilize volunteerism for such
public health programs could contribute appreciably to ensuring
success of the MDA-based programs and to anchoring them in the
communities they seek to protect.
Finally, implementation of this study produced a number of
ancillary program benefits. The process of defining and reviewing
costs allowed for a review of operations at all levels (inputs,
processes and outputs) that was also frequently used to assess
efficiency. The findings provide the opportunity for the de-
velopment of cost-effective implementation models built on best
practices from each country; hopefully, these can be adopted and
adapted by new programs from the start, particularly in Africa
where almost 30 more endemic countries still need to initiate LF
elimination programs.
Acknowledgments
Our gratitude to Marco Del Negro for review of the methods section.
Author Contributions
Conceived and designed the experiments: BG. Performed the experiments:
BG. Analyzed the data: BG. Wrote the paper: EO VG MB. Participated in
the study design and its coordination, data collection and analysis: ASG
VHG MA MLEA VYB BG JG CK HAK SK DK JL MM GM AN
RMRR TGS AW MAB RR EAO ACH.
Cost Analysis: LF MDA Programs
PLoS Neglected Tropical Diseases | www.plosntds.org 9 October 2007 | Volume 1 | Issue 1 | e67

References
1. World Health Organization (2006) Global Programme to Eliminate LymphaticFilariasis. WER 81(22): 221–232.
2. Ramaiah K, Das P, Michael E, Guyatt H (2000) The economic burden oflymphatic filariasis in India. Parasitology Today 16(6): 251–253.
3. Gyapong J, Gyapong M, Evans D, Aikins M, Adjei S (1996) The economicburden of lymphatic filariasis in northern Ghana. Annals of Tropical Medicine
& Parasitology 90(1): 39–48.
4. UN Office of the High Representative for the Least Developed Countries. List ofLeast Developed Countries. Available at: http://www.un.org/special-rep/
ohrlls/ldc/list.htm. Accessed November 15, 2005.5. Galvez Tan J (2003) The elimination of lymphatic filariasis: A strategy for
poverty alleviation and sustainable development - Perspectives from the
Philippines. Filaria J 2(12).6. Durrheim D, Wynd S, Liese B, Gyapong J (2004) Editorial: Lymphatic filariasis
endemicity–an indicator of poverty? Tropical Medicine & International Health9(8): 843–845.
7. CDC (1993) Recommendations of the International Task Force for Disease
Eradication. Morbidity & Mortality Weekly Report.Recommendations &Reports 42(RR-16): 1–38.
8. Ismail M, Jayakody R, Weil GJ, Nirmalan N, Jayasinghe K, Abeyewickrema W,et al. (1998) Efficacy of single dose combinations of albendazole, ivermectin and
diethylcarbamazine for the treatment of bancroftian filariasis. Transactions ofthe Royal Society of Tropical Medicine & Hygiene 92(1): 94–97.
9. Ottesen E (2000) The global programme to eliminate lymphatic filariasis.
Tropical Medicine & International Health 5(9): 591–594.10. Ramaiah K, Guyatt H, Ramu K, Vanamail P, Pani S, Das P (1999) Treatment
costs and loss of work time to individuals with chronic lymphatic filariasis in ruralcommunities in south India. Tropical Medicine & International Health 4(1):
19–25.
11. Krishnamoorthy K, Rajendran R, Sunish I, Reuben R (2002) Cost-effectivenessof the use of vector control and mass drug administration, separately or in
combination, against lymphatic filariasis. Annals of Tropical Medicine &Parasitology 96(Suppl 2): S77–90.
12. de Rochars M, Kanjilal S, Direny A, Radday J, Lafontant J, Mathieu E, et al.(2005) The Leogane, Haiti demonstration project: decreased microfilaremia and
program costs after three years of mass drug administration. American Journal
of Tropical Medicine & Hygiene 73(5): 888–894.
13. Laxminarayan R, Mills AJ, Breman J, Measham A, Alleyne G, Claeson M, et al.
(2006) Advancement of global health: key messages from the Disease Control
Priorities Project. Lancet 367(9517): 1193–1208.
14. World Bank Group. World Development Indicators Database. Available at:
http://www.worldbank.org/data/countrydata/countrydata.html. Accessed
November 15, 2004.
15. United Nations Development Programme (2004) Human Development Reports.
Accessed November 15, 2004.
16. Ramzy R, Goldman A, Kamal H (2005) Defining the cost of the Egyptian
lymphatic filariasis eliminination program. Filaria J 4.
17. Haddix A, Teutsch SM, Corso PS (2003) Prevention Effectiveness: A guide to
decision analysis and economic evaluation. Second ed. New York: Oxford
University Press.
18. McFarland D, Menzies N, Njoumemi Z, Onwujekwe O (August 2005) Study of
cost per treatment with ivermectin using the CDTI strategy. African Programme
for Onchocerciasis Control (APOC).
19. Onwujekwe O, Chima R, Shu E, Okonkwo P (2002) Community-directed
treatment with ivermectin in two Nigerian communities: an analysis of first year
start-up processes, costs and consequences. Health Policy 62(1): 31–51.
20. World Health Organization (2005) Deworming for health and development:
Report of the third annual meeting of the Partners for Parasite Control. WHO/
CDS/CPE/PVC/2005.14. Geneva: WHO.
21. Kumaresan J, Mecaskey J (2003) The global elimination of blinding trachoma:
progress and promise. American Journal of Tropical Medicine & Hygiene 69(5
Suppl): 24–28.
22. Fenwick A, Molyneux D, Nantulya V (2005) Achieving the Millennium
Development Goals.see commentcomment. Lancet 365(9464): 1029–1030.
23. Brady M, Hooper P, Ottesen E (2006) Projected benefits from integrating NTD
programs in sub-Saharan Africa. Trends Parasitol 22(7): 285–291.
24. World Health Organization (2005) World Malaria Report. Geneva: WHO.
25. World Health Organization (2004) Progress Report on the Global Plan to Stop
Tuberculosis. Geneva: WHO.
Cost Analysis: LF MDA Programs
PLoS Neglected Tropical Diseases | www.plosntds.org 10 October 2007 | Volume 1 | Issue 1 | e67
Top Related
Copyright © 2022 FDOKUMEN

