


Bahasa
Halaman
Hukum

National censusof local authority councillorsin England 2006
National censusof local authority councillors in England 2006
Published in March 2007by the National Foundation for Educational Research,The Mere, Upton Park, Slough, Berkshire SL1 2DQwww.nfer.ac.uk
© National Foundation for Educational Research 2007Registered Charity No. 313392ISBN 978 1 905314 39 3
National census of local authority councillors in England 2006 iii
Foreword v
Introduction 1
The scope 2
Executive summary 3
The findings 7
SECTION A: personal background of councillors 7
Gender 7
Age 7
Ethnicity 7
Disability/long-term illness 8
Caring responsibilities 8
Main employment status 9
Current occupation 9
Main sector of employment 10
Employer support of work as a councillor 10
Additional work activities 11
Education and qualifications 11
SECTION B: work as a councillor 12
Length of service 12
Leading council responsibilities 13
Membership of council committees 13
Special responsibility allowance 13
Average number of hours per week spent on council and political business 13
How councillors spend their time 14
Party representation 14
Membership of other councils 15
Training and development opportunities received 15
Formal qualification 15
Level of qualification 16
Resources and learning that would be beneficial and most important 16
Contents
SECTION C: issues and views of councillors 16
Reasons for becoming a councillor 16
Approach to role of councillor 17
Most important things that councillors do 17
Views on influence as a councillor 17
Effectiveness as a councillor 18
Approaches to becoming more effective community advocates 18
When councillors would talk about their work 18
Would councillors recommend the role to others 19
Intention to stand for re-election 19
How committed councillors think their authorities are to priorities in Closer to People 19
Councils and their constitutions in England 20
Frequency of local elections 21
annex A 22
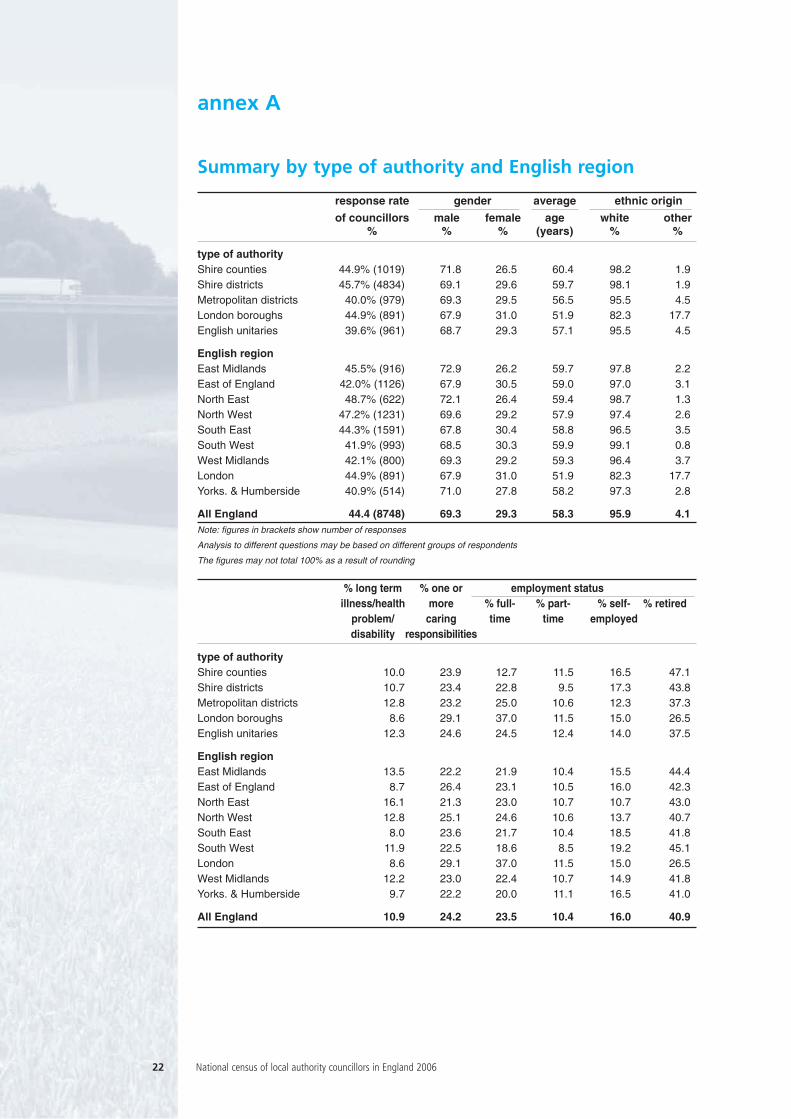
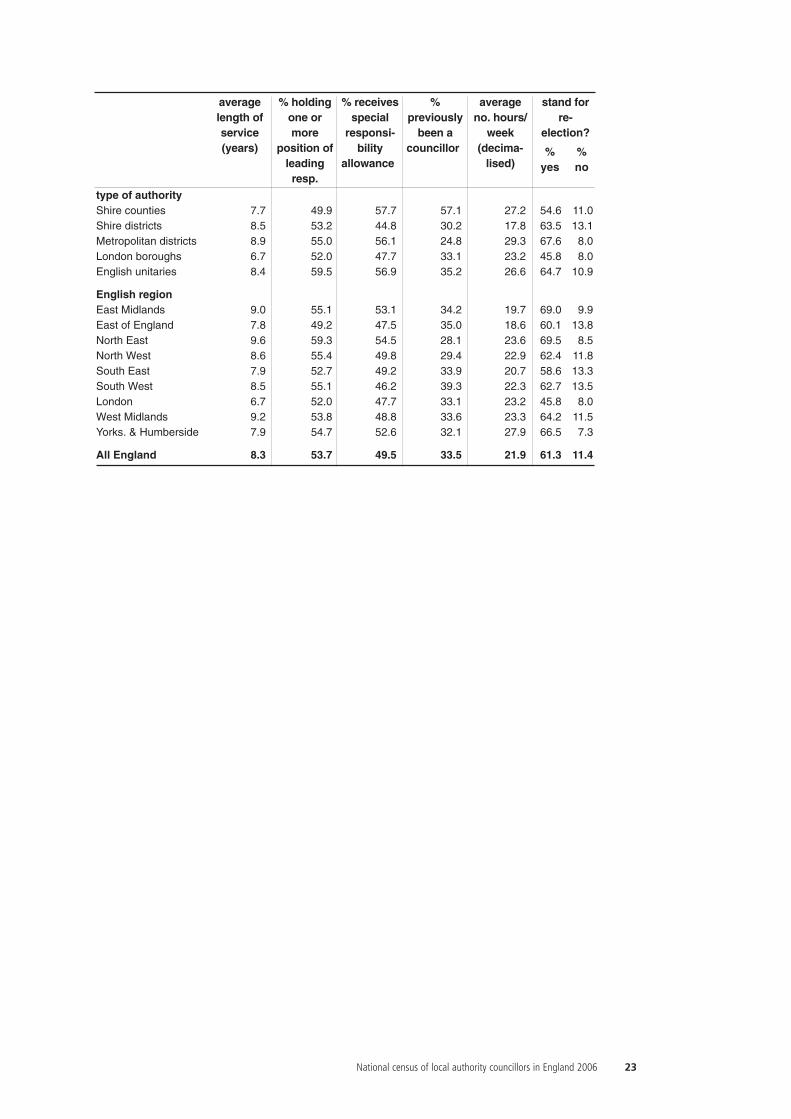
Summary by type of authority and English region 22
annex B 24
Breakdown of survey data, England 1997–2006 24
annex C 34
Comparative data 34
annex D 36
National census of local authority councillors 2006 – survey form 36
acknowledgements 42
iv National census of local authority councillors in England 2006
Foreword
Councillors are increasingly on the front line as community advocates and leaders. It is thereforeessential that all councillors receive the support they need to help them to serve their communitieseffectively.
We in the Local Government Association and Improvement and Development Agency for localgovernment (IDeA) want to play our part in empowering councillors to achieve these objectives.That is why it is crucial that we know who councillors are and understand the challenges they facein managing an increasingly busy and complex role.
The biennial LGA/IDeA Councillors Census explored these questions. The headline findings showthat councillors as individuals are dedicated people, who devote a great deal of their own time toserving their communities. But unfortunately as a group, they do not always reflect the communitiesthey serve in terms of gender, age and ethnic origin.
Local government as a sector must take the issue of diversity of councillors seriously, and wewelcome the creation of the Commission on Local Councillors chaired by Dame Jane Roberts toaddress the problem. Councils can take some steps to reduce the barriers to people from all partsof the community becoming councillors, but the political parties – who sponsor the majority ofcouncillors – also have to address how they select candidates.
The Councillor Census is commissioned to ensure the sector, including the political parties, hasaccurate information on councillors’ age, gender and background, and how they carry out theirwork. If councils are to continue to develop their community leadership role, we need to see actionon recruiting candidates from more varied backgrounds while improving the support anddevelopment they receive while in office.
Paul Coen and Lucy de Groot
Paul Coen is Chief Executive of the Local Government Association; Lucy de Groot is ExecutiveDirector of the Improvement and Development Agency for local government (IDeA).
National census of local authority councillors in England 2006 v
National census of local authority councillors in England 2006 1
Introduction
The Local Government Association (LGA) and the Improvement and Development Agency (IDeA)have carried out the fourth Census of local authority councillors in England and intend to carry outa Census of councillors every two years to provide ‘snapshots’ of local government representationand analysis of trends over time.
Councillors are increasingly in the front line as community advocates and leaders. It is thereforeessential that they receive the right support to enable them to serve their community effectively andget the best from councils. The survey will allow the LGA and IDeA to play our part in empoweringCouncillors to achieve these objectives.
Given the scale of support from councillors, this survey provides the most comprehensive, timelyoverview of local government representation and how that has changed over time. The results willboth inform central and local government and political parties in the development of strategies andpolicies for local government.
The 2006 Census collected data in the autumn of 2006 and updates the previous Censuses in 1997,2001 and 2004 and new questions seeking councillors’ views on a number of issues have beenadded.
Thanks to the support from member support officers and councillors, replies were received from 357(92.0%) of the 388 local authorities in England and from 8,748 (44.4%) councillors in office; therewere a small number (34) of vacant seats at the time of the survey.
The survey results show grossed estimates (by type of authority and region) for all 19,689councillors/seats in England.
This report covers England. A summary of key findings by type of authority and English region isshown in annex A.
More detailed information mapping the results of the Census by type of authority, region, gender,age, ethnicity, disability and party representation is available from the following website:www.lgar.local.gov.uk
The report also includes comparative data for the wider population from the Labour Force Surveywhich is included in annex C. This is intended to provide an insight into the representativeness oflocal councillors and will form the basis of more detailed work in the future.
March 2007
The scope
The survey was in three sections:
Section A covered the personal background of councillors:
• gender
• age
• ethnicity
• disability
• caring responsibilities
• employment status
• education and qualifications.
Section B covered their work as councillors:
• length of service
• leading positions held
• committee membership
• party representation
• membership of other councils
• responsibility allowance
• hours spent on council business
• political party
• training and development
• views on qualifications and resources.
Section C covered a range of issues and views on:
• roles that best describe how councillors approach being a councillor
• why people wanted to become councillors
• important things that councillors do
• how much influence councillors considered themselves to have
• whether councillors view themselves as effective
• the LGA’s report Closer to People and which approaches to becoming effective communityadvocates could be adopted
• how committed authorities are about implementing arrangements for devolving power tocommunities.
2 National census of local authority councillors in England 2006
Executive summary (see also the ‘key facts’ table)
The following are key findings from the 2006 Councillor Census which was conducted in theautumn of 2006:
• 69.3% of councillors were male, 29.3% were female, an increase in the proportion of femalecouncillors from 27.8% in 1997 although the proportion is still considerably lower than the adultpopulation (52.0%)
• the average age of councillors has increased from 55.4 years in 1997 to 58.3 years in 2006. In2006, 86.5% of councillors were aged 45 and over, compared to 55.1% of the adult population
• 95.9% of councillors were white and 4.1% came from an ethnic minority background. Significantlyhigher proportions of the adult population were from an ethnic minority background (9.5%)
• the proportion of councillors who were retired increased from 34.1% in 1997 to 40.9% in 2006,compared to 22.3% of the adult population
• 49.8% held a qualification equivalent to NVQ level 4 and above, compared to 30.1% of theadult population
• the average length of service for a councillor was 8.3 years, the same as in 2004
• 53.7% of councillors held a position of leading responsibility within the council and 49.5% of allcouncillors received a special responsibility allowance in addition to their basic allowance
• 92.1% considered themselves to be effective or very effective in their role as councillors
• 86.9% of councillors cited wanting to serve the community as their reason for wanting tobecome a councillor and 93.5% thought that listening to local views was the most importantthing for them to do
• councillors spent, on average, 21.9 hours per week on council/political business. Councillorsholding a position of leading responsibility spent on average 25.1 hours per week, compared to18.1 hours for those not holding a senior position
• 88.2% of councillors had been in receipt of one or more training and development opportunitiesin the last 12 months but less than half (41.7%) would welcome the opportunity to gain a moreformal qualification or recognition of their work as a councillor
• from a list of eight resources or learning opportunities, councillors ranked media training(34.1%), IT support (30.1%) and administrative support (27.3%) as those that would be mostbeneficial to their role
• the majority (74.5%) of councillors indicated that the role of local community representative bestdescribed their approach to being a ward councillor, half (49.6%) identified the role ofcommunity engager and two-fifths (39.1%) the role of community advocate
• when asked which of four initiatives from the LGA’s report Closer to People they would like tosee adopted by their authority, 58.5% of councillors indicated that they would like to see theirauthority introduce a mechanism to provide fast-track responses to issues raised by councillorsand 52.2% reported that they would like to see their authority introduce a mechanism to allowcouncillors to call for action on local problems
• Of the five priority actions identified in the LGA’s report Closer to People, councillors believedtheir authorities were most committed to ‘allowing people to have their say on services throughconsultation and feedback’ (84.1% either fully or partially committed) and ‘knowing and
National census of local authority councillors in England 2006 3
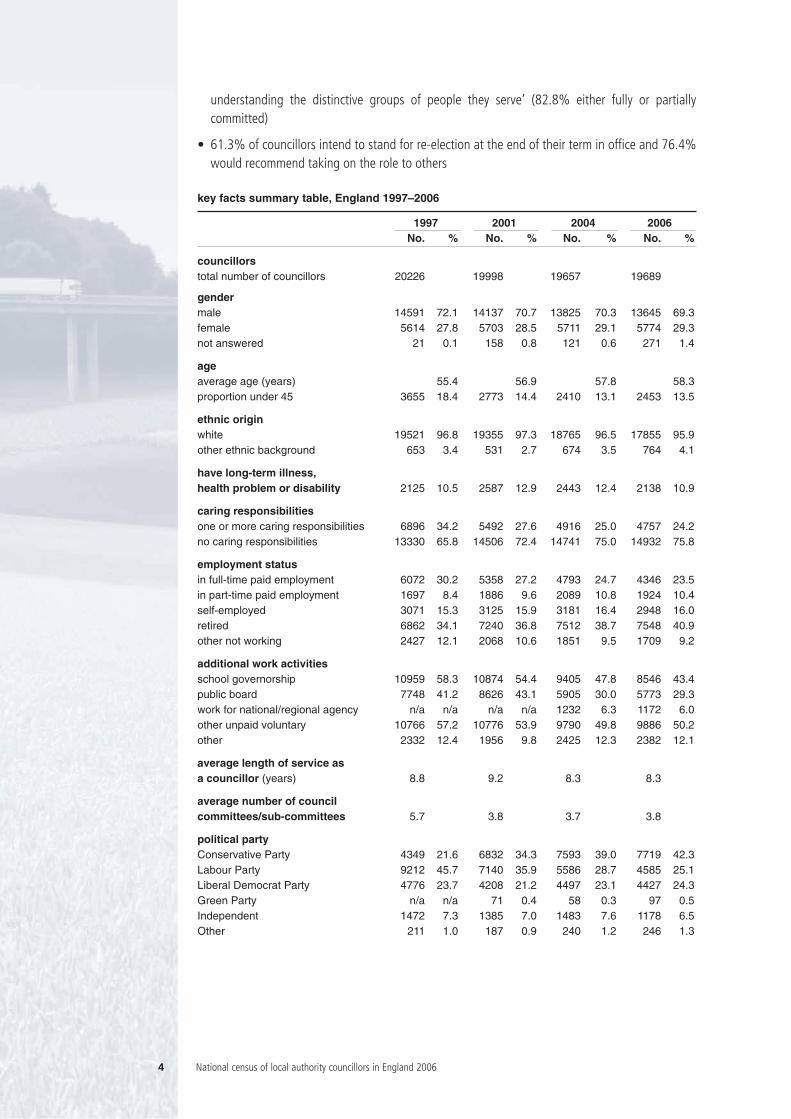
understanding the distinctive groups of people they serve’ (82.8% either fully or partiallycommitted)
• 61.3% of councillors intend to stand for re-election at the end of their term in office and 76.4%would recommend taking on the role to others
key facts summary table, England 1997–2006
1997 2001 2004 2006No. % No. % No. % No. %
councillorstotal number of councillors �20226 19998 19657 19689
gendermale 14591 72.1 14137 70.7 13825 70.3 13645 69.3female 5614 27.8 5703 28.5 5711 29.1 5774 29.3not answered 21 0.1 158 0.8 121 0.6 271 1.4
ageaverage age (years) 55.4 56.9 57.8 58.3proportion under 45 3655 18.4 2773 14.4 2410 13.1 2453 13.5
ethnic originwhite 19521 96.8 19355 97.3 18765 96.5 17855 95.9other ethnic background 653 3.4 531 2.7 674 3.5 764 4.1
have long-term illness,health problem or disability 2125 10.5 2587 12.9 2443 12.4 2138 10.9
caring responsibilitiesone or more caring responsibilities 6896 34.2 5492 27.6 4916 25.0 4757 24.2no caring responsibilities 13330 65.8 14506 72.4 14741 75.0 14932 75.8
employment statusin full-time paid employment 6072 30.2 5358 27.2 4793 24.7 4346 23.5in part-time paid employment 1697 8.4 1886 9.6 2089 10.8 1924 10.4self-employed 3071 15.3 3125 15.9 3181 16.4 2948 16.0retired 6862 34.1 7240 36.8 7512 38.7 7548 40.9other not working 2427 12.1 2068 10.6 1851 9.5 1709 9.2
additional work activitiesschool governorship 10959 58.3 10874 54.4 9405 47.8 8546 43.4public board 7748 41.2 8626 43.1 5905 30.0 5773 29.3work for national/regional agency n/a n/a n/a n/a 1232 6.3 1172 6.0other unpaid voluntary 10766 57.2 10776 53.9 9790 49.8 9886 50.2other 2332 12.4 1956 9.8 2425 12.3 2382 12.1
average length of service as a councillor (years) 8.8 9.2 8.3 8.3
average number of council committees/sub-committees 5.7 3.8 3.7 3.8
political partyConservative Party 4349 21.6 6832 34.3 7593 39.0 7719 42.3Labour Party 9212 45.7 7140 35.9 5586 28.7 4585 25.1Liberal Democrat Party 4776 23.7 4208 21.2 4497 23.1 4427 24.3Green Party n/a n/a 71 0.4 58 0.3 97 0.5Independent 1472 7.3 1385 7.0 1483 7.6 1178 6.5Other 211 1.0 187 0.9 240 1.2 246 1.3
4 National census of local authority councillors in England 2006
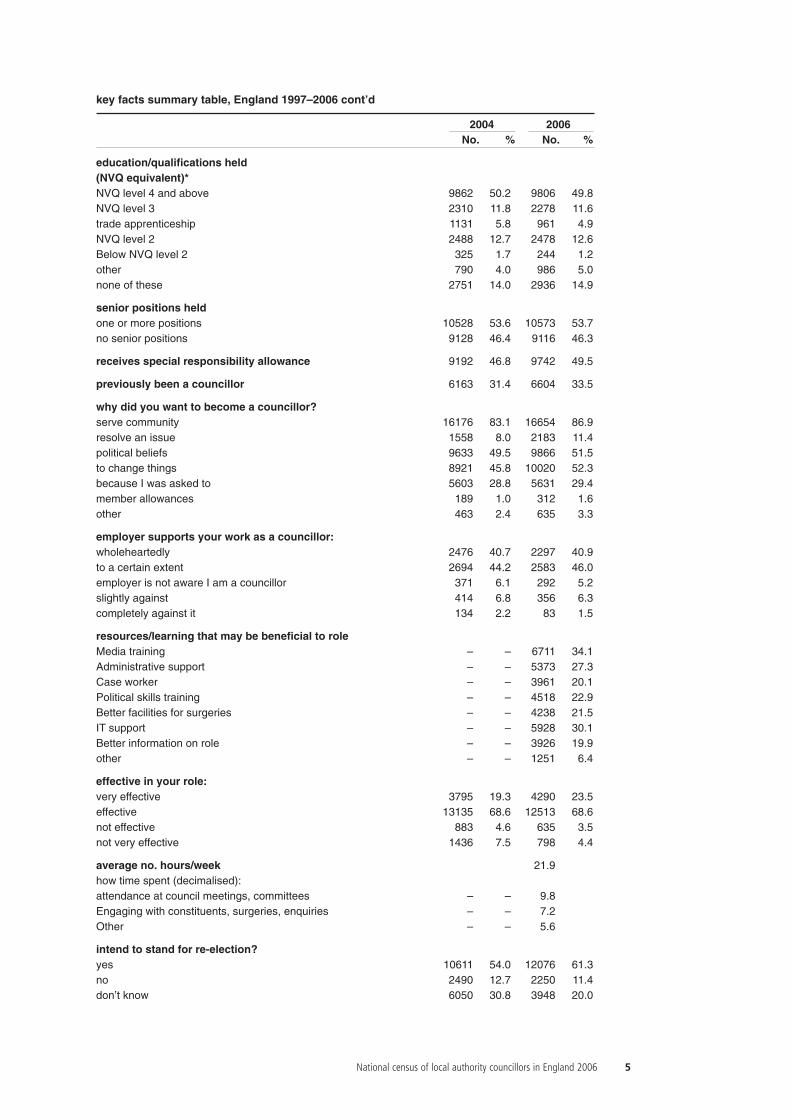
key facts summary table, England 1997–2006 cont’d
2004 2006No. % No. %
education/qualifications held(NVQ equivalent)*NVQ level 4 and above 9862 50.2 9806 49.8NVQ level 3 2310 11.8 2278 11.6trade apprenticeship 1131 5.8 961 4.9NVQ level 2 2488 12.7 2478 12.6Below NVQ level 2 325 1.7 244 1.2other 790 4.0 986 5.0none of these 2751 14.0 2936 14.9
senior positions heldone or more positions 10528 53.6 10573 53.7no senior positions 9128 46.4 9116 46.3
receives special responsibility allowance 9192 46.8 9742 49.5
previously been a councillor 6163 31.4 6604 33.5
why did you want to become a councillor? serve community 16176 83.1 16654 86.9resolve an issue 1558 8.0 2183 11.4political beliefs 9633 49.5 9866 51.5to change things 8921 45.8 10020 52.3because I was asked to 5603 28.8 5631 29.4member allowances 189 1.0 312 1.6other 463 2.4 635 3.3
employer supports your work as a councillor:wholeheartedly 2476 40.7 2297 40.9to a certain extent 2694 44.2 2583 46.0employer is not aware I am a councillor 371 6.1 292 5.2slightly against 414 6.8 356 6.3completely against it 134 2.2 83 1.5
resources/learning that may be beneficial to roleMedia training – – 6711 34.1Administrative support – – 5373 27.3Case worker – – 3961 20.1Political skills training – – 4518 22.9Better facilities for surgeries – – 4238 21.5IT support – – 5928 30.1Better information on role – – 3926 19.9other – – 1251 6.4
effective in your role:very effective 3795 19.3 4290 23.5effective 13135 68.6 12513 68.6not effective 883 4.6 635 3.5not very effective 1436 7.5 798 4.4
average no. hours/week 21.9how time spent (decimalised):attendance at council meetings, committees – – 9.8Engaging with constituents, surgeries, enquiries – – 7.2Other – – 5.6
intend to stand for re-election?yes 10611 54.0 12076 61.3no 2490 12.7 2250 11.4don’t know 6050 30.8 3948 20.0
National census of local authority councillors in England 2006 5
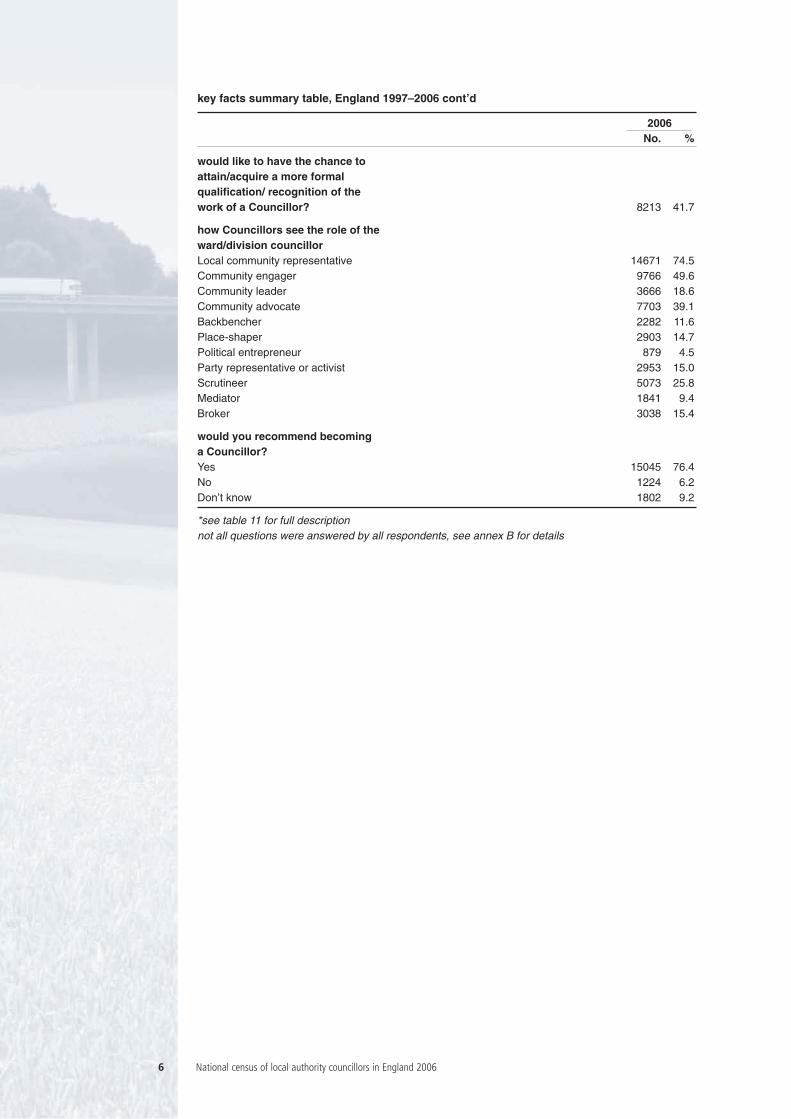
key facts summary table, England 1997–2006 cont’d
2006No. %
would like to have the chance toattain/acquire a more formalqualification/ recognition of thework of a Councillor? 8213 41.7
how Councillors see the role of theward/division councillorLocal community representative 14671 74.5Community engager 9766 49.6Community leader 3666 18.6Community advocate 7703 39.1Backbencher 2282 11.6Place-shaper 2903 14.7Political entrepreneur 879 4.5Party representative or activist 2953 15.0Scrutineer 5073 25.8Mediator 1841 9.4Broker 3038 15.4
would you recommend becominga Councillor?Yes 15045 76.4No 1224 6.2Don’t know 1802 9.2
*see table 11 for full descriptionnot all questions were answered by all respondents, see annex B for details
6 National census of local authority councillors in England 2006
The findings
SECTION A: PERSONAL BACKGROUND OF COUNCILLORS
Tables 1–36 can be found in annex B on page 24.
gender (table 1)
At the time of the survey in 2006, 69.3% of councillors were male and 29.3% female, while a smallproportion did not give their gender (1.4%). The proportion of female councillors in 2006represents a slight increase on the 1997, 2001 and 2004 Councillors’ Censuses, where theproportion of female councillors was 27.8%, 28.5% and 29.1% respectively. The proportion offemale councillors was highest in London boroughs (31.0%) and lowest in shire counties (26.5%).Proportions of female councillors across shire districts, metropolitan districts and English unitaryauthorities were very similar (29.6%, 29.5% and 29.3% respectively).
Regionally, there were slightly higher proportions of female councillors in London (31.0%), the Eastof England (30.5%), the South East (30.4%) and the South West (30.3%). Representation offemale councillors was highest in the Green Party (41.8%) and lowest amongst Independents(24.2%). The former represents a change from the 2004 Councillors’ Survey where representationof female councillors was highest in the Liberal Democrat Party.
In the autumn of 2006, the Labour Force Survey (LFS) reported that 48.0% of the population inEngland over the age of 21 were male and 52.0% were female, compared to 69.3% and 29.3% ofcouncillors; this pattern was true at regional level.
age (table 2)
The average age of councillors in England has increased from 55.4 years in 1997, 56.9 years in2001, 57.8 years in 2004 to 58.3 years in 2006. Generally, councillors were older in shire counties(average 60.4 years) and in shire districts (average 59.7 years) and were younger in Londonboroughs (average 51.9 years). On average, councillors from ethnic minority backgrounds wereyounger (52.9 years) than other councillors.
Comparison with the autumn 2006 LFS showed that the age of the adult population wassignificantly younger than that of councillors. For example, 45.0% of the population were under theage of 45 compared with 13.5% of councillors. The proportion of councillors in each of the olderage groups (i.e. over the age of 50) was noticeably greater than the general population. There wasalso a slight increase in the proportion of councillors over the age of 70 compared with the adultpopulation. The age profile of councillors is youngest in London where 40.9% of councillors wereunder 50, compared with 64% of the overall adult London population.
ethnicity (table 3)
In 2006, 95.9% of councillors were white and 4.1% came from an ethnic minority background,compared with 3.5% and 2.7% respectively in the 2004 and 2001 Councillors’ Censuses. Theproportion of ethnic minority councillors was higher amongst males (4.5%) than females (3.1%),amongst Labour Party representatives (8.8%) than representatives of other parties and in Londonboroughs (17.7%) compared to other regions.
National census of local authority councillors in England 2006 7
the proportion offemale councillorswas highest inLondon boroughsand lowest in shirecounties
The autumn 2006 LFS reported that 90.5% of the adult population were white and 9.5% camefrom an ethnic minority background, the latter more than double the proportion of councillors fromsuch backgrounds.
The proportion of white councillors is higher in all regions than in the adult population. The ethnicprofile that most closely matches the adult population is in the Asian population of councillors inthe South East and in London.
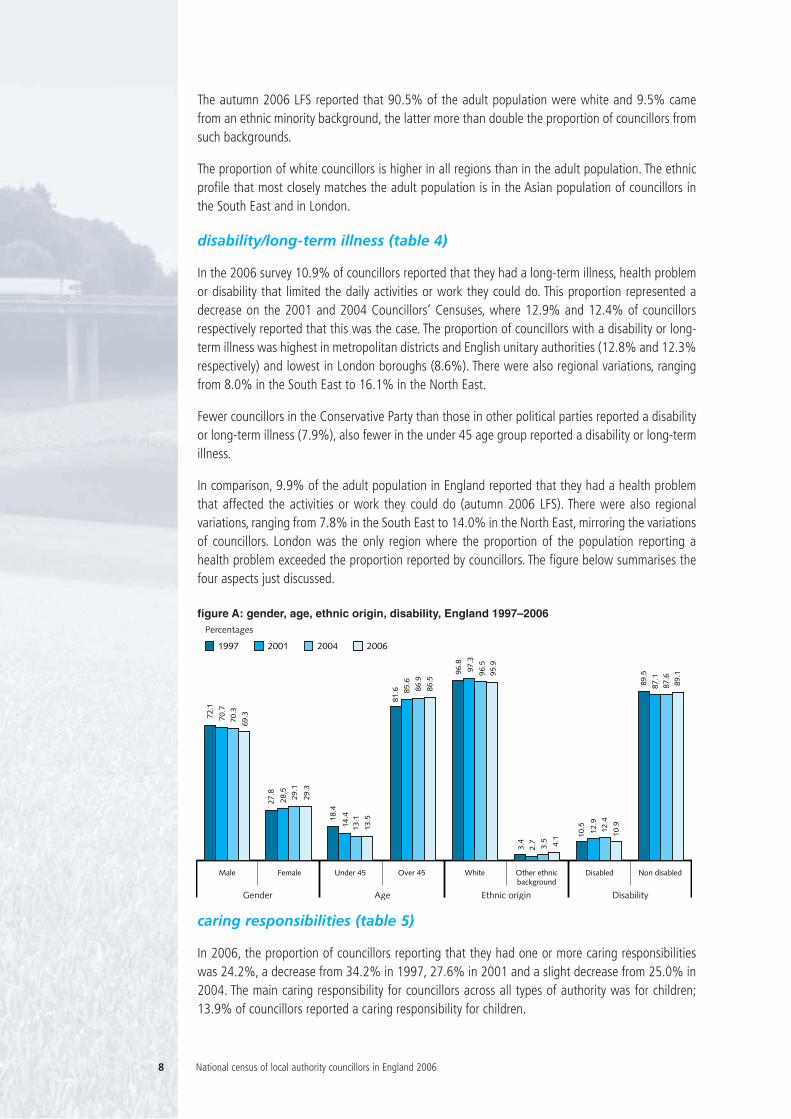
disability/long-term illness (table 4)
In the 2006 survey 10.9% of councillors reported that they had a long-term illness, health problemor disability that limited the daily activities or work they could do. This proportion represented adecrease on the 2001 and 2004 Councillors’ Censuses, where 12.9% and 12.4% of councillorsrespectively reported that this was the case. The proportion of councillors with a disability or long-term illness was highest in metropolitan districts and English unitary authorities (12.8% and 12.3%respectively) and lowest in London boroughs (8.6%). There were also regional variations, rangingfrom 8.0% in the South East to 16.1% in the North East.
Fewer councillors in the Conservative Party than those in other political parties reported a disabilityor long-term illness (7.9%), also fewer in the under 45 age group reported a disability or long-termillness.
In comparison, 9.9% of the adult population in England reported that they had a health problemthat affected the activities or work they could do (autumn 2006 LFS). There were also regionalvariations, ranging from 7.8% in the South East to 14.0% in the North East, mirroring the variationsof councillors. London was the only region where the proportion of the population reporting ahealth problem exceeded the proportion reported by councillors. The figure below summarises thefour aspects just discussed.
figure A: gender, age, ethnic origin, disability, England 1997–2006
caring responsibilities (table 5)
In 2006, the proportion of councillors reporting that they had one or more caring responsibilitieswas 24.2%, a decrease from 34.2% in 1997, 27.6% in 2001 and a slight decrease from 25.0% in2004. The main caring responsibility for councillors across all types of authority was for children;13.9% of councillors reported a caring responsibility for children.
8 National census of local authority councillors in England 2006
Percentages
1997 2001 2004 2006
Male Female Under 45 Over 45 White Other ethnicbackground
Disabled Non disabled
Gender Age Ethnic origin Disability
72.1
70.7
70
.3
69.3
27.8
28.5
29
.1
29.3
18.4
14.4
13
.1
13.5
81.6
85
.6
86.9
86.5
96.8
97.3
96.5
95
.9
3.4
2.7
3.5 4.1 10
.5
12.9
12.4
10.9
89.5
87.1
87
.6
89.1
Councillors in London boroughs (29.1%) reported more caring responsibilities than othercouncillors in England, as did female councillors (28.9%), those in the age group 40–44 (54.0%)and those from an ethnic minority background (38.7%).
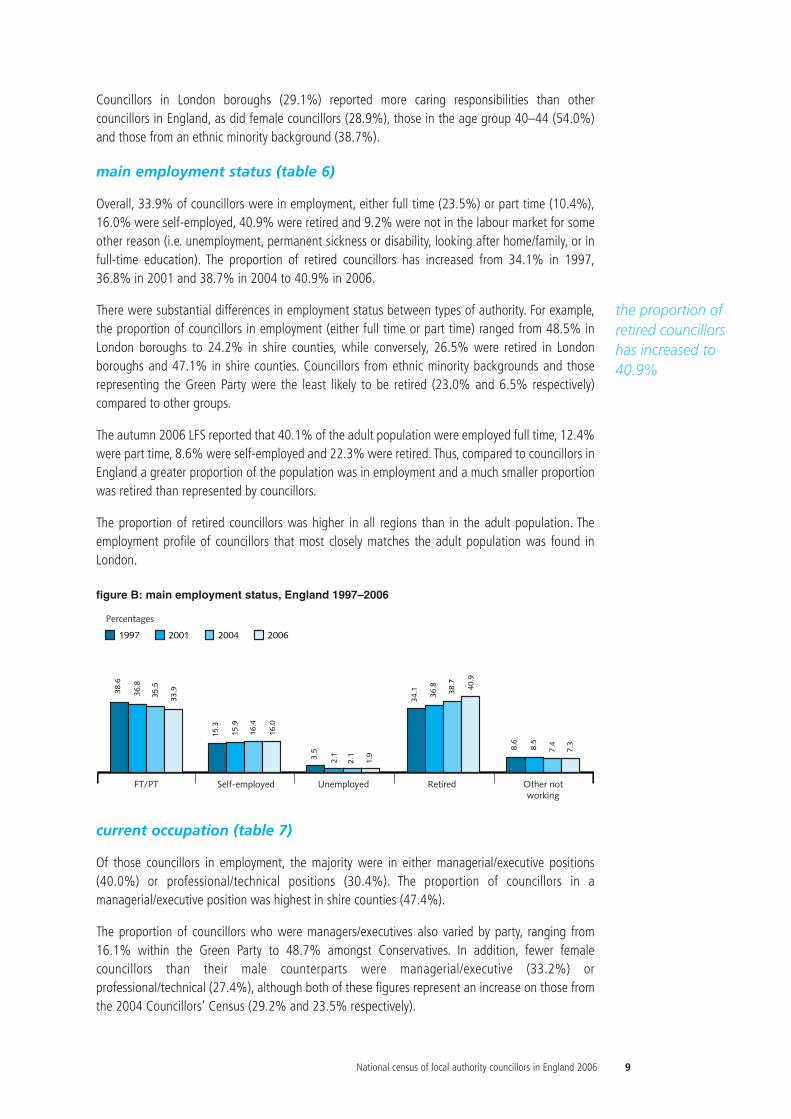
main employment status (table 6)
Overall, 33.9% of councillors were in employment, either full time (23.5%) or part time (10.4%),16.0% were self-employed, 40.9% were retired and 9.2% were not in the labour market for someother reason (i.e. unemployment, permanent sickness or disability, looking after home/family, or infull-time education). The proportion of retired councillors has increased from 34.1% in 1997,36.8% in 2001 and 38.7% in 2004 to 40.9% in 2006.
There were substantial differences in employment status between types of authority. For example,the proportion of councillors in employment (either full time or part time) ranged from 48.5% inLondon boroughs to 24.2% in shire counties, while conversely, 26.5% were retired in Londonboroughs and 47.1% in shire counties. Councillors from ethnic minority backgrounds and thoserepresenting the Green Party were the least likely to be retired (23.0% and 6.5% respectively)compared to other groups.
The autumn 2006 LFS reported that 40.1% of the adult population were employed full time, 12.4%were part time, 8.6% were self-employed and 22.3% were retired. Thus, compared to councillors inEngland a greater proportion of the population was in employment and a much smaller proportionwas retired than represented by councillors.
The proportion of retired councillors was higher in all regions than in the adult population. Theemployment profile of councillors that most closely matches the adult population was found inLondon.
figure B: main employment status, England 1997–2006
current occupation (table 7)
Of those councillors in employment, the majority were in either managerial/executive positions(40.0%) or professional/technical positions (30.4%). The proportion of councillors in amanagerial/executive position was highest in shire counties (47.4%).
The proportion of councillors who were managers/executives also varied by party, ranging from16.1% within the Green Party to 48.7% amongst Conservatives. In addition, fewer femalecouncillors than their male counterparts were managerial/executive (33.2%) orprofessional/technical (27.4%), although both of these figures represent an increase on those fromthe 2004 Councillors’ Census (29.2% and 23.5% respectively).
National census of local authority councillors in England 2006 9
Percentages
1997 2001 2004 2006
FT/PT Self-employed Unemployed Retired Other notworking
38.6
36.8
35.5
33.9
15.3
15.9
16.4
16.0
3.5
2.1
2.1
1.9
34.1 36
.8
38.7 40.9
8.6
8.5
7.4
7.3
the proportion ofretired councillorshas increased to40.9%
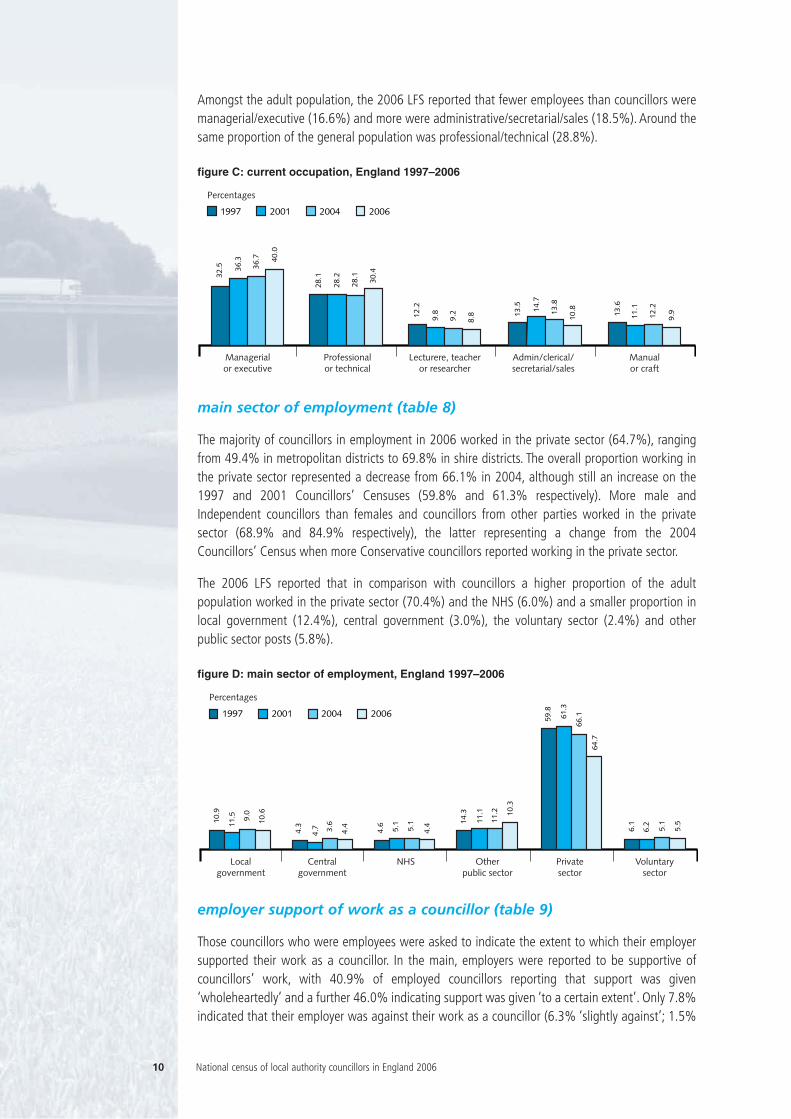
Amongst the adult population, the 2006 LFS reported that fewer employees than councillors weremanagerial/executive (16.6%) and more were administrative/secretarial/sales (18.5%). Around thesame proportion of the general population was professional/technical (28.8%).
figure C: current occupation, England 1997–2006
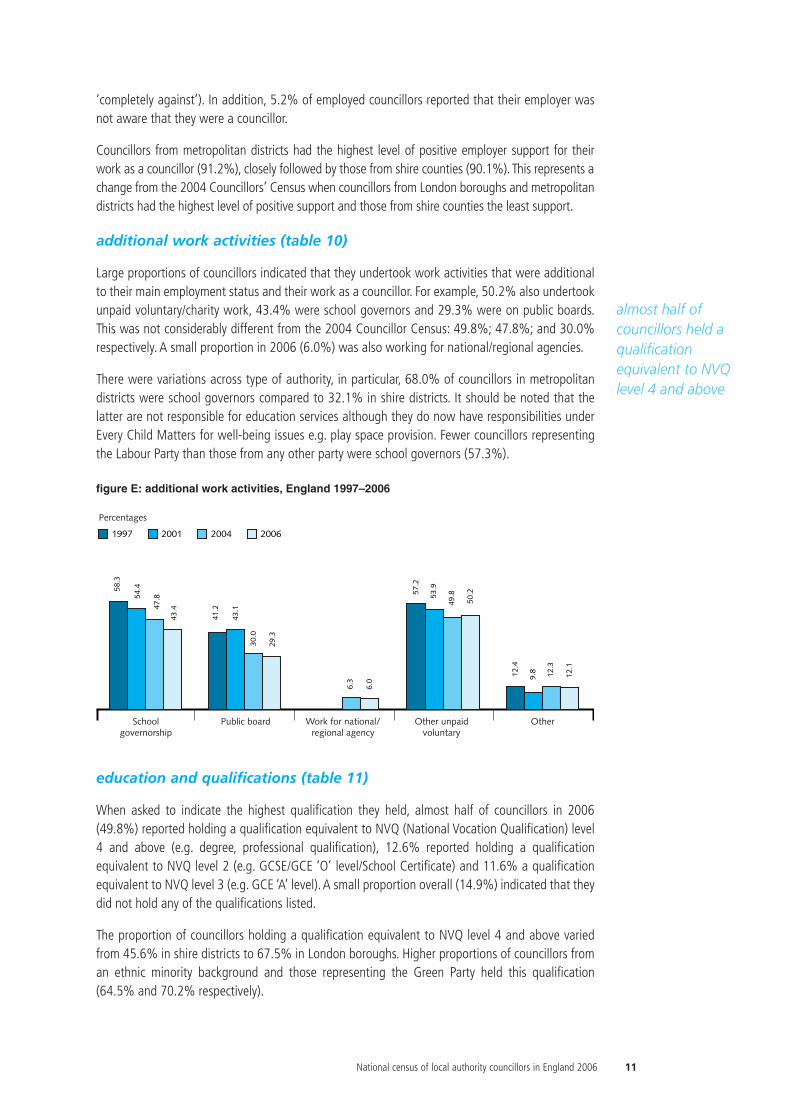
main sector of employment (table 8)
The majority of councillors in employment in 2006 worked in the private sector (64.7%), rangingfrom 49.4% in metropolitan districts to 69.8% in shire districts. The overall proportion working inthe private sector represented a decrease from 66.1% in 2004, although still an increase on the1997 and 2001 Councillors’ Censuses (59.8% and 61.3% respectively). More male andIndependent councillors than females and councillors from other parties worked in the privatesector (68.9% and 84.9% respectively), the latter representing a change from the 2004Councillors’ Census when more Conservative councillors reported working in the private sector.
The 2006 LFS reported that in comparison with councillors a higher proportion of the adultpopulation worked in the private sector (70.4%) and the NHS (6.0%) and a smaller proportion inlocal government (12.4%), central government (3.0%), the voluntary sector (2.4%) and otherpublic sector posts (5.8%).
figure D: main sector of employment, England 1997–2006
employer support of work as a councillor (table 9)
Those councillors who were employees were asked to indicate the extent to which their employersupported their work as a councillor. In the main, employers were reported to be supportive ofcouncillors’ work, with 40.9% of employed councillors reporting that support was given‘wholeheartedly’ and a further 46.0% indicating support was given ‘to a certain extent’. Only 7.8%indicated that their employer was against their work as a councillor (6.3% ‘slightly against’; 1.5%
10 National census of local authority councillors in England 2006
Percentages
1997 2001 2004 2006
Managerialor executive
Professionalor technical
Lecturere, teacheror researcher
Admin/clerical/secretarial/sales
Manualor craft
32.5 36
.3
36.7 40
.0
28.1
28.2
28.1 30.4
12.2
9.8
9.2
8.8 13
.5 14.7
13.8
10.8 13.6
11.1
12.2
9.9
Percentages
1997 2001 2004 2006
Centralgovernment
NHS Otherpublic sector
Privatesector
Voluntarysector
Localgovernment
4.6
5.1
5.1
4.410
.6
9.0
11.5
10.9
4.43.6
4.74.3 14
.3
11.1
11.2 10
.3
59.8
61.3
66.1
64.7
6.1
6.2
5.1
5.5
‘completely against’). In addition, 5.2% of employed councillors reported that their employer wasnot aware that they were a councillor.
Councillors from metropolitan districts had the highest level of positive employer support for theirwork as a councillor (91.2%), closely followed by those from shire counties (90.1%). This represents achange from the 2004 Councillors’ Census when councillors from London boroughs and metropolitandistricts had the highest level of positive support and those from shire counties the least support.
additional work activities (table 10)
Large proportions of councillors indicated that they undertook work activities that were additionalto their main employment status and their work as a councillor. For example, 50.2% also undertookunpaid voluntary/charity work, 43.4% were school governors and 29.3% were on public boards.This was not considerably different from the 2004 Councillor Census: 49.8%; 47.8%; and 30.0%respectively. A small proportion in 2006 (6.0%) was also working for national/regional agencies.
There were variations across type of authority, in particular, 68.0% of councillors in metropolitandistricts were school governors compared to 32.1% in shire districts. It should be noted that thelatter are not responsible for education services although they do now have responsibilities underEvery Child Matters for well-being issues e.g. play space provision. Fewer councillors representingthe Labour Party than those from any other party were school governors (57.3%).
figure E: additional work activities, England 1997–2006
education and qualifications (table 11)
When asked to indicate the highest qualification they held, almost half of councillors in 2006(49.8%) reported holding a qualification equivalent to NVQ (National Vocation Qualification) level4 and above (e.g. degree, professional qualification), 12.6% reported holding a qualificationequivalent to NVQ level 2 (e.g. GCSE/GCE ‘O’ level/School Certificate) and 11.6% a qualificationequivalent to NVQ level 3 (e.g. GCE ‘A’ level).A small proportion overall (14.9%) indicated that theydid not hold any of the qualifications listed.
The proportion of councillors holding a qualification equivalent to NVQ level 4 and above variedfrom 45.6% in shire districts to 67.5% in London boroughs. Higher proportions of councillors froman ethnic minority background and those representing the Green Party held this qualification(64.5% and 70.2% respectively).
National census of local authority councillors in England 2006 11
Percentages
1997 2001 2004 2006
Schoolgovernorship
Public board Work for national/regional agency
Other unpaidvoluntary
Other
58.3
54.4
47.8
43.4
41.2
43.1
30.0
29.3
6.3
6.0
57.2
53.9
49.8
50.2
12.4
9.8 12
.3
12.1
almost half ofcouncillors held aqualificationequivalent to NVQlevel 4 and above
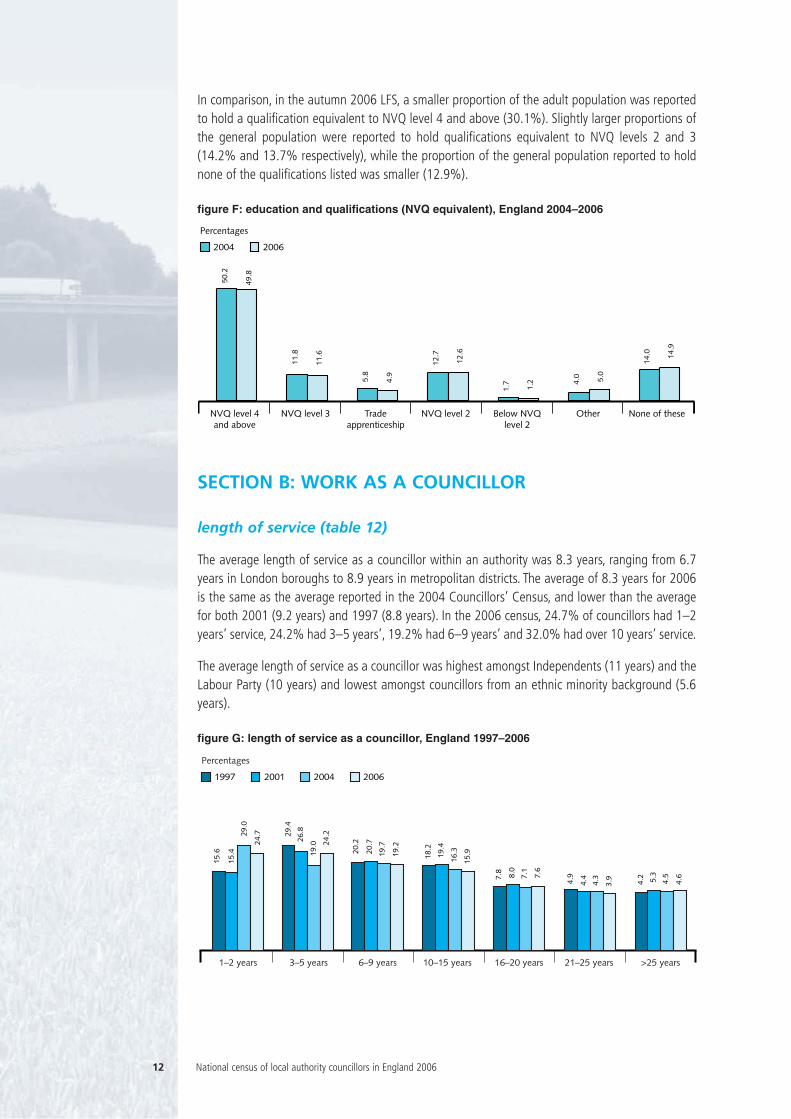
In comparison, in the autumn 2006 LFS, a smaller proportion of the adult population was reportedto hold a qualification equivalent to NVQ level 4 and above (30.1%). Slightly larger proportions ofthe general population were reported to hold qualifications equivalent to NVQ levels 2 and 3(14.2% and 13.7% respectively), while the proportion of the general population reported to holdnone of the qualifications listed was smaller (12.9%).
figure F: education and qualifications (NVQ equivalent), England 2004–2006
SECTION B: WORK AS A COUNCILLOR
length of service (table 12)
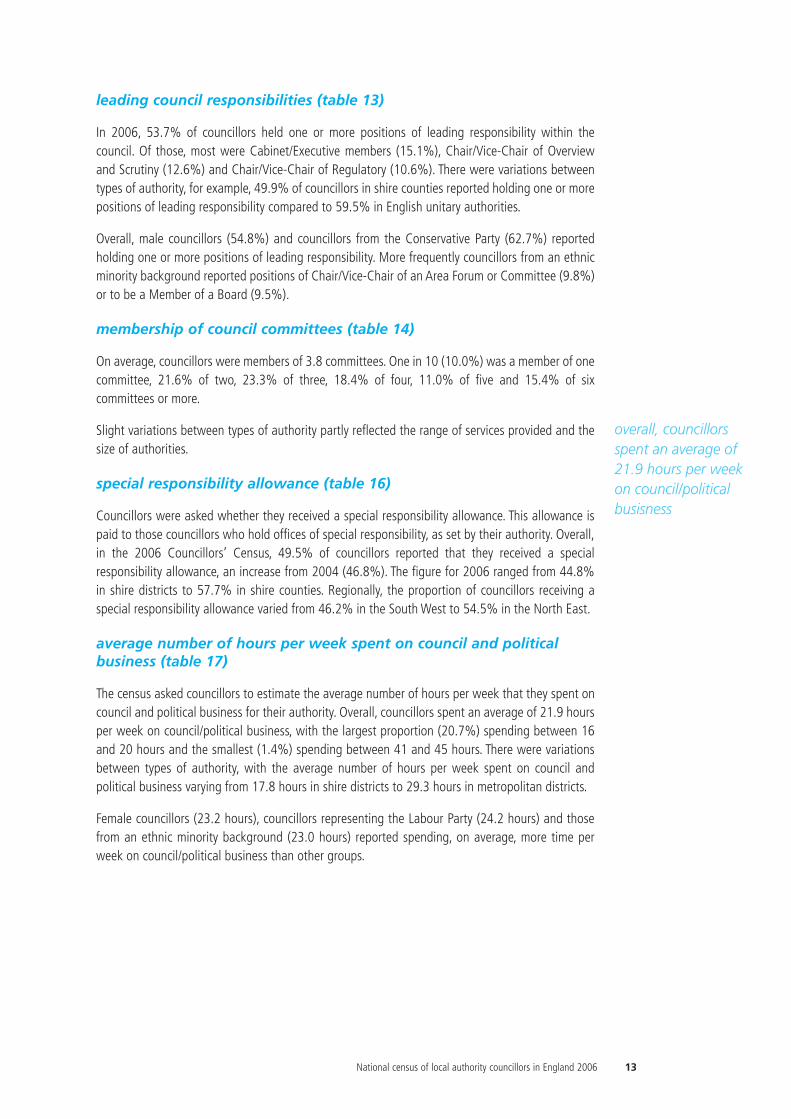
The average length of service as a councillor within an authority was 8.3 years, ranging from 6.7years in London boroughs to 8.9 years in metropolitan districts. The average of 8.3 years for 2006is the same as the average reported in the 2004 Councillors’ Census, and lower than the averagefor both 2001 (9.2 years) and 1997 (8.8 years). In the 2006 census, 24.7% of councillors had 1–2years’ service, 24.2% had 3–5 years’, 19.2% had 6–9 years’ and 32.0% had over 10 years’ service.
The average length of service as a councillor was highest amongst Independents (11 years) and theLabour Party (10 years) and lowest amongst councillors from an ethnic minority background (5.6years).
figure G: length of service as a councillor, England 1997–2006
12 National census of local authority councillors in England 2006
Percentages
2004 2006
NVQ level 4and above
NVQ level 3 Tradeapprenticeship
NVQ level 2 Below NVQlevel 2
Other None of these
50.2
49.8
11.8
11.6
5.8
4.9
12.7
12.6
1.7
1.2 4.
0 5.0
14.0 14
.9
Percentages
1997 2001 2004 2006
1–2 years 3–5 years 6–9 years 10–15 years 16–20 years
15.6
15.4
29.0
24.7 29
.4
26.8
19.0 24
.2
19.7
19.2
20.2
20.7
18.2
19.4
16.3
15.9
7.8
8.0
7.1
7.6
21–25 years >25 years
4.9
4.4
4.3
3.9
4.2 5.3
4.5
4.6
leading council responsibilities (table 13)
In 2006, 53.7% of councillors held one or more positions of leading responsibility within thecouncil. Of those, most were Cabinet/Executive members (15.1%), Chair/Vice-Chair of Overviewand Scrutiny (12.6%) and Chair/Vice-Chair of Regulatory (10.6%). There were variations betweentypes of authority, for example, 49.9% of councillors in shire counties reported holding one or morepositions of leading responsibility compared to 59.5% in English unitary authorities.
Overall, male councillors (54.8%) and councillors from the Conservative Party (62.7%) reportedholding one or more positions of leading responsibility. More frequently councillors from an ethnicminority background reported positions of Chair/Vice-Chair of an Area Forum or Committee (9.8%)or to be a Member of a Board (9.5%).
membership of council committees (table 14)
On average, councillors were members of 3.8 committees. One in 10 (10.0%) was a member of onecommittee, 21.6% of two, 23.3% of three, 18.4% of four, 11.0% of five and 15.4% of sixcommittees or more.
Slight variations between types of authority partly reflected the range of services provided and thesize of authorities.
special responsibility allowance (table 16)
Councillors were asked whether they received a special responsibility allowance. This allowance ispaid to those councillors who hold offices of special responsibility, as set by their authority. Overall,in the 2006 Councillors’ Census, 49.5% of councillors reported that they received a specialresponsibility allowance, an increase from 2004 (46.8%). The figure for 2006 ranged from 44.8%in shire districts to 57.7% in shire counties. Regionally, the proportion of councillors receiving aspecial responsibility allowance varied from 46.2% in the South West to 54.5% in the North East.
average number of hours per week spent on council and politicalbusiness (table 17)
The census asked councillors to estimate the average number of hours per week that they spent oncouncil and political business for their authority. Overall, councillors spent an average of 21.9 hoursper week on council/political business, with the largest proportion (20.7%) spending between 16and 20 hours and the smallest (1.4%) spending between 41 and 45 hours. There were variationsbetween types of authority, with the average number of hours per week spent on council andpolitical business varying from 17.8 hours in shire districts to 29.3 hours in metropolitan districts.
Female councillors (23.2 hours), councillors representing the Labour Party (24.2 hours) and thosefrom an ethnic minority background (23.0 hours) reported spending, on average, more time perweek on council/political business than other groups.
National census of local authority councillors in England 2006 13
overall, councillorsspent an average of21.9 hours per weekon council/politicalbusisness
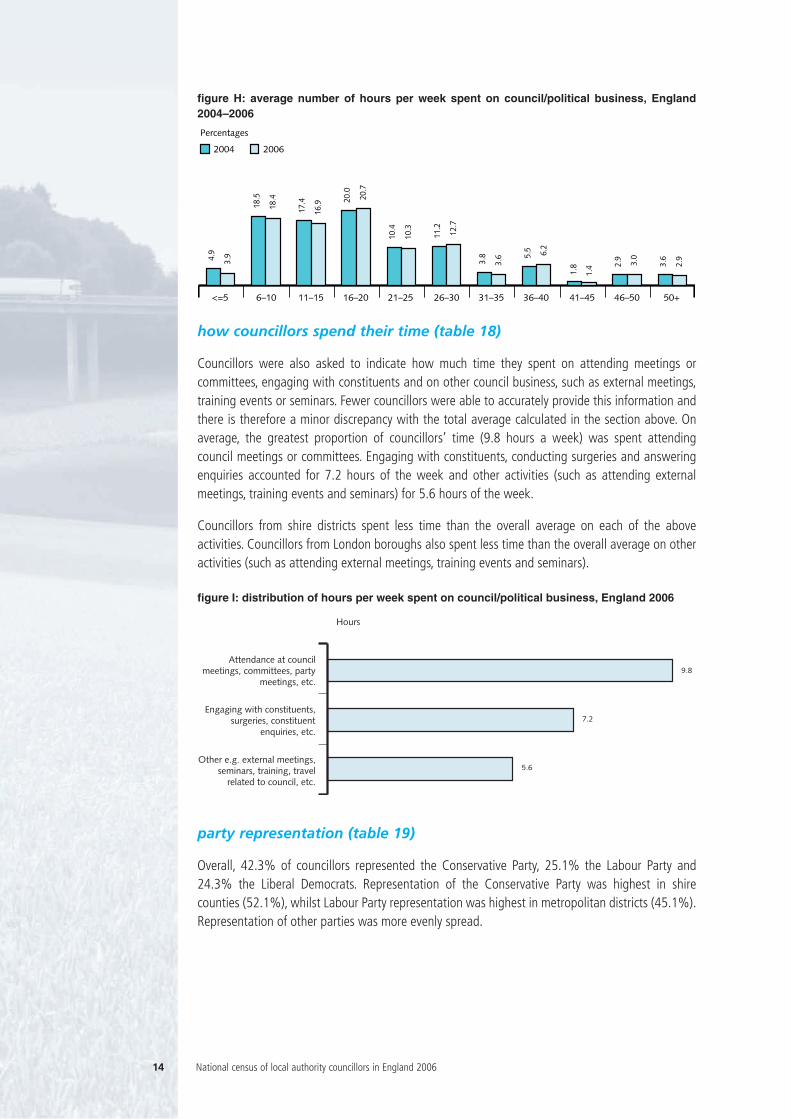
figure H: average number of hours per week spent on council/political business, England2004–2006
how councillors spend their time (table 18)
Councillors were also asked to indicate how much time they spent on attending meetings orcommittees, engaging with constituents and on other council business, such as external meetings,training events or seminars. Fewer councillors were able to accurately provide this information andthere is therefore a minor discrepancy with the total average calculated in the section above. Onaverage, the greatest proportion of councillors’ time (9.8 hours a week) was spent attendingcouncil meetings or committees. Engaging with constituents, conducting surgeries and answeringenquiries accounted for 7.2 hours of the week and other activities (such as attending externalmeetings, training events and seminars) for 5.6 hours of the week.
Councillors from shire districts spent less time than the overall average on each of the aboveactivities. Councillors from London boroughs also spent less time than the overall average on otheractivities (such as attending external meetings, training events and seminars).
figure I: distribution of hours per week spent on council/political business, England 2006
party representation (table 19)
Overall, 42.3% of councillors represented the Conservative Party, 25.1% the Labour Party and24.3% the Liberal Democrats. Representation of the Conservative Party was highest in shirecounties (52.1%), whilst Labour Party representation was highest in metropolitan districts (45.1%).Representation of other parties was more evenly spread.
14 National census of local authority councillors in England 2006
Percentages
2004 2006
<=5 6–10 11–15 16–20 21–25 26–30 31–35 36–40 41–45 46–50 50+
4.9
3.9
18.5
18.4
17.4
16.9 20
.0
20.7
10.4
10.3
11.2
12.7
3.8
3.6 5.
5 6.2
1.8
1.4 2.
9
3.0
3.6
2.9
Hours
Attendance at councilmeetings, committees, party
meetings, etc.
Engaging with constituents,surgeries, constituent
enquiries, etc.
Other e.g. external meetings,seminars, training, travel
related to council, etc.
9.8
7.2
5.6
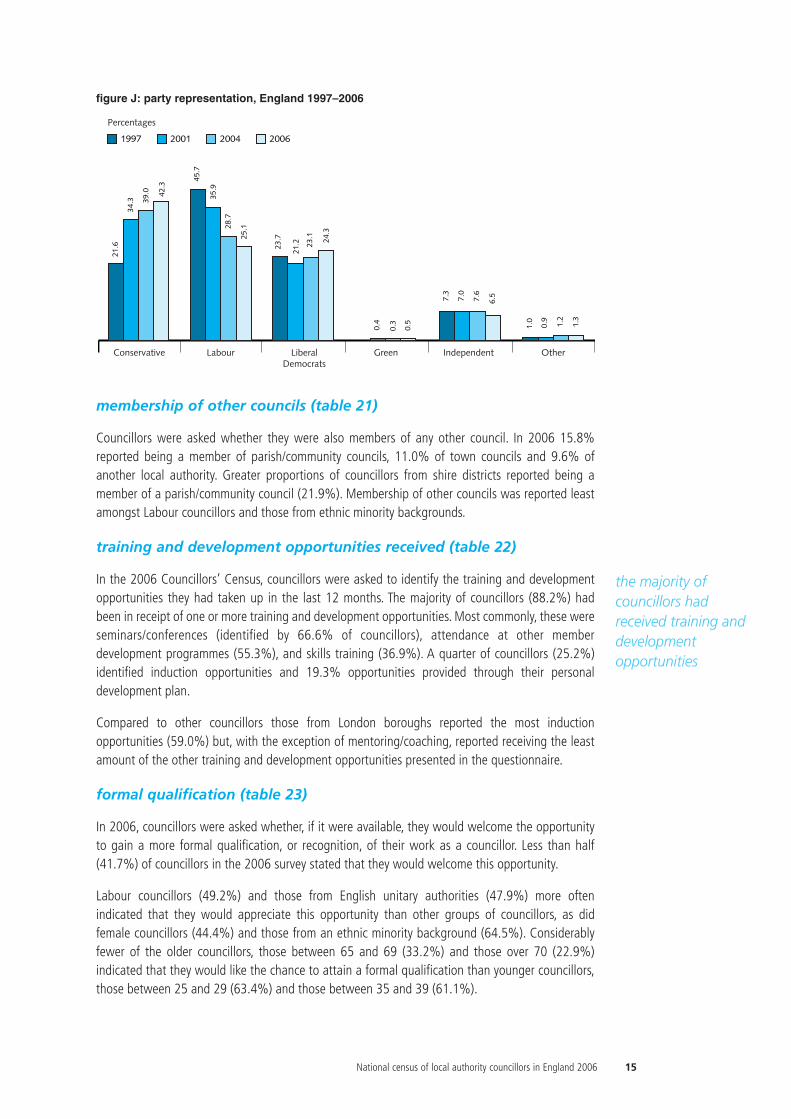
figure J: party representation, England 1997–2006
membership of other councils (table 21)
Councillors were asked whether they were also members of any other council. In 2006 15.8%reported being a member of parish/community councils, 11.0% of town councils and 9.6% ofanother local authority. Greater proportions of councillors from shire districts reported being amember of a parish/community council (21.9%). Membership of other councils was reported leastamongst Labour councillors and those from ethnic minority backgrounds.
training and development opportunities received (table 22)
In the 2006 Councillors’ Census, councillors were asked to identify the training and developmentopportunities they had taken up in the last 12 months. The majority of councillors (88.2%) hadbeen in receipt of one or more training and development opportunities. Most commonly, these wereseminars/conferences (identified by 66.6% of councillors), attendance at other memberdevelopment programmes (55.3%), and skills training (36.9%). A quarter of councillors (25.2%)identified induction opportunities and 19.3% opportunities provided through their personaldevelopment plan.
Compared to other councillors those from London boroughs reported the most inductionopportunities (59.0%) but, with the exception of mentoring/coaching, reported receiving the leastamount of the other training and development opportunities presented in the questionnaire.
formal qualification (table 23)
In 2006, councillors were asked whether, if it were available, they would welcome the opportunityto gain a more formal qualification, or recognition, of their work as a councillor. Less than half(41.7%) of councillors in the 2006 survey stated that they would welcome this opportunity.
Labour councillors (49.2%) and those from English unitary authorities (47.9%) more oftenindicated that they would appreciate this opportunity than other groups of councillors, as didfemale councillors (44.4%) and those from an ethnic minority background (64.5%). Considerablyfewer of the older councillors, those between 65 and 69 (33.2%) and those over 70 (22.9%)indicated that they would like the chance to attain a formal qualification than younger councillors,those between 25 and 29 (63.4%) and those between 35 and 39 (61.1%).
National census of local authority councillors in England 2006 15
Percentages
1997 2001 2004 2006
Labour LiberalDemocrats
Green Independent OtherConservative
23.7
21.2 23
.1 24.3
21.6
34.3 39
.0 42.3
45.7
35.9
28.7
25.1
0.4
0.3
0.5
7.3
7.0
7.6
6.5
1.0
0.9
1.2
1.3
the majority ofcouncillors hadreceived training anddevelopmentopportunities
level of qualification (table 24)
For those councillors who indicated that they would appreciate the chance to gain a more formalqualification related to their work as a councillor, more than half (61.5%) indicated that the mostappropriate form for this would be a ‘stand alone independent qualification’. About a fifth (18.1%)of councillors indicated that it should take the form of credit towards a postgraduate degree/NVQlevel 5, 14.6% credit towards an undergraduate degree/NVQ level 4 and 14.5% credit towards Alevel/NVQ level 3 equivalent.
Amongst those councillors opting for a ‘stand alone independent qualification’, higher proportionswere female (63.6%), Independent councillors (71.1%) and from shire districts (65.9%).
resources and learning that would be beneficial (table 25(i)) and mostimportant (table 25(ii))
When asked which resources or learning opportunities councillors would find useful in their work asa councillor, the highest ranking response related to further training as opposed to an additionalresource, in particular media training (34.1%). In addition, 30.1% of councillors identified ITsupport, 27.3% administrative support, 22.9% political skills training, 21.5% better facilities tohold surgeries, 20.1% a case worker and 19.9% better information on the role of a councillor asareas that they would like more opportunities for.
Councillors from ethnic minority backgrounds most often identified each of the resources or learningas something that they would find useful in their work as a councillor. Female councillors also morefrequently identified these areas, although did not identify better facilities to hold surgeries.
Those that identified resources or learning opportunities as being useful to them in their work as acouncillor were also asked to state which of the list of eight presented they would consider to bethe most important. Interestingly, the highest ranking responses to this question related toresources, in the form of additional support, as opposed to further training opportunities. Almost aquarter (24.7%) of councillors indicated that administrative support was the most importantresource for their work as a councillor. A further 18.7% stated that IT support was the mostimportant. Responses were very similar as to the importance of better information on the role of acouncillor, a case worker and media training (11.8%, 11.3% and 11.1% respectively), whilepolitical skills training and better facilities to hold surgeries featured to a lesser extent (10.1% and6.8% respectively).
Councillors in shire counties were more likely to indicate that administrative support was the mostimportant resource, while councillors in shire districts and male councillors were more likely toidentify IT support as the most important resource. Perhaps unsurprisingly, older councillors (i.e.over the age of 55) were more likely to identify IT support as the most important resource for them.
SECTION C: ISSUES AND VIEWS OF COUNCILLORS
reasons for becoming a councillor (table 26)
When respondents were asked to identify their reasons for becoming a councillor, the main reasonreported was ‘to serve the community’ (86.9%), followed by ‘to change things’ (52.3%) and‘political beliefs’ (51.5%). More than a quarter (29.4%) identified the reason ‘because I was askedto’. Overall, the proportions of councillors identifying reasons for wanting to become a councillorwere similar across all types of authority, although a slightly higher proportion of those inmetropolitan districts identified ‘political beliefs’.
16 National census of local authority councillors in England 2006
approach to role of councillor (table 27)
In the 2006 Councillors’ Census, respondents were asked to identify (from a choice of 11) up tothree roles that best described their approach to being a ward councillor. The majority (74.5%)indicated that the role of local community representative best described their approach, while half(49.6%) identified the role of community engager and two-fifths (39.1%) the role of communityadvocate. Other roles, identified by fewer councillors, were that of scrutineer (25.8%), communityleader (18.6%), broker (15.4%), party representative or activist (15.0%), place-shaper (14.7%),backbencher (11.6%), mediator (9.4%) and political entrepreneur (4.5%).
Of the three top-ranking roles, that of community representative was the most identified bycouncillors in shire districts (78.1%), male councillors (76.8%) and those standing as anIndependent (84.5%). The role of community engager was identified the most by councillors inmetropolitan districts (54.7%), female councillors (55.9%) and those from an ethnic minoritybackground (60.0%). The role of community advocate was frequently identified by councillors inmetropolitan districts (45.2%), female councillors (44.7%) and those representing the Green Party(56.7%).
most important things that councillors do (table 28)
The 2006 census also asked councillors to identify, from a range of statements, the most importantthings for them to do. Overall, 93.5% of councillors believed that listening to the views of localpeople was the most important thing for them to do, 85.2% believed it was supporting their localcommunity, 73.7% that it was addressing issues raised and 72.7% that it was dealing withcomplaints. In addition, 69.9% felt that attending council meetings was the most important thingfor them to do, while 57.2% felt it was keeping the public informed, 46.0% that it was holdingsurgeries, 45.4% that it was planning local services, and 43.4% that it was representing localresidents’ views to Government.
The proportions of councillors identifying the four highest-ranking statements (listening to localviews, supporting the local community, addressing issues raised and dealing with complaints) werehighest in metropolitan districts and, with the exception of dealing with complaints, amongstfemale councillors.
views on influence as a councillor (table 29)
Councillors responding to the 2006 census were invited to identify, from a choice of three, thestatement that best described their view of their influence as a councillor. Responses were generallypositive, with 35.6% of councillors indicating that they believed they had more influence to changethings than they had expected and 35.1% indicating that they felt they had as much influence asthey had expected. A further 29.3% reported that they felt they had less influence to change thingsthan they had expected.
The proportions of councillors responding that they believed they had more influence to changethings than they had expected were highest in metropolitan districts (39.7%), amongst Labourcouncillors (40.5%), female councillors (38.5%) and those from an ethnic minority background(56.7%). By way of contrast, the proportions of councillors indicating that they had less influenceto change things than they had expected were highest in English unitary authorities (31.1%) andamongst Liberal Democrat councillors (35.1%).
National census of local authority councillors in England 2006 17
councillors believedthat listening to theviews of local peoplewas the mostimportant thing forthem to do
effectiveness as a councillor (table 30)
Councillors were asked to rate how effective they thought they had been in their role as a councillorwithin their particular authority. Overall, councillors believed they had been ‘effective’ in their role(68.6%), with a further 23.5% stating that they believed they had been ‘very effective’. Only 4.4%of councillors believed they had been ‘not very effective’ and 3.5% ‘not effective’.
There was a slightly higher incidence of councillors in shire counties and shire districts who thoughtthat they had been ‘not effective’ (4.1% and 4.0% respectively) and a higher incidence in shiredistricts who thought that they had been ‘not very effective’ (4.9%). In comparison, 2.2% ofcouncillors in metropolitan districts thought they had been ‘not effective’ and 2.9% ‘not veryeffective’.
approaches to becoming more effective community advocates (table 31)
The LGA’s report Closer to People identified a number of ways in which authorities can assistcouncillors to become more effective community advocates and encourage communities to exercisedirect power. The 2006 Councillors’ Census invited councillors to indicate which of these (from a listof four) they would like to see adopted by their authority. Of those councillors who responded:
• 58.5% indicated that they would like to see their authority introduce a mechanism to providefast-track responses to issues raised by councillors
• 52.2% reported that they would like to see their authority introduce a mechanism to allowcouncillors to call for action on local problems
• 49.1% indicated that they would like their authority to introduce a discretionary budget forcouncillors to spend on local initiatives
• 32.9% stated that they would like to see their authority introduce a mechanism to organiseinquiries about contentious issues.
when councillors would talk about their work (table 32)
Councillors in 2006 were asked about the situations in which they would talk about their work ascouncillors. They were offered a list of seven different situations and asked to indicate for eachwhether this was a situation in which they would ‘never’, ‘sometimes’ or ‘often’ talk about theirwork as a councillor. The key findings were:
The situation in which most councillors reported that they would ‘never’ talk about their work as acouncillor was at work with external colleagues (e.g. clients, business contacts) (36.7%).Councillors in shire districts, London boroughs, those who were Liberal Democrats, femalecouncillors and those from an ethnic minority were more likely than other groups to indicate thatthis was the case.
The situation in which most councillors indicated that they would ‘sometimes’ talk about their workas a councillor was at social gatherings with friends (66.3%), followed by community socialising(e.g. in the local pub) (61.3%) and community events such as street parties or school fetes (59.8%).
The situation in which most councillors reported that they would ‘often’ talk about their work as acouncillor was within community groups such as tenants’ associations (56.3%). Councillors frommetropolitan districts, those representing the Green Party and councillors from an ethnic minoritybackground were more likely than other groups to indicate that this was the case.
18 National census of local authority councillors in England 2006
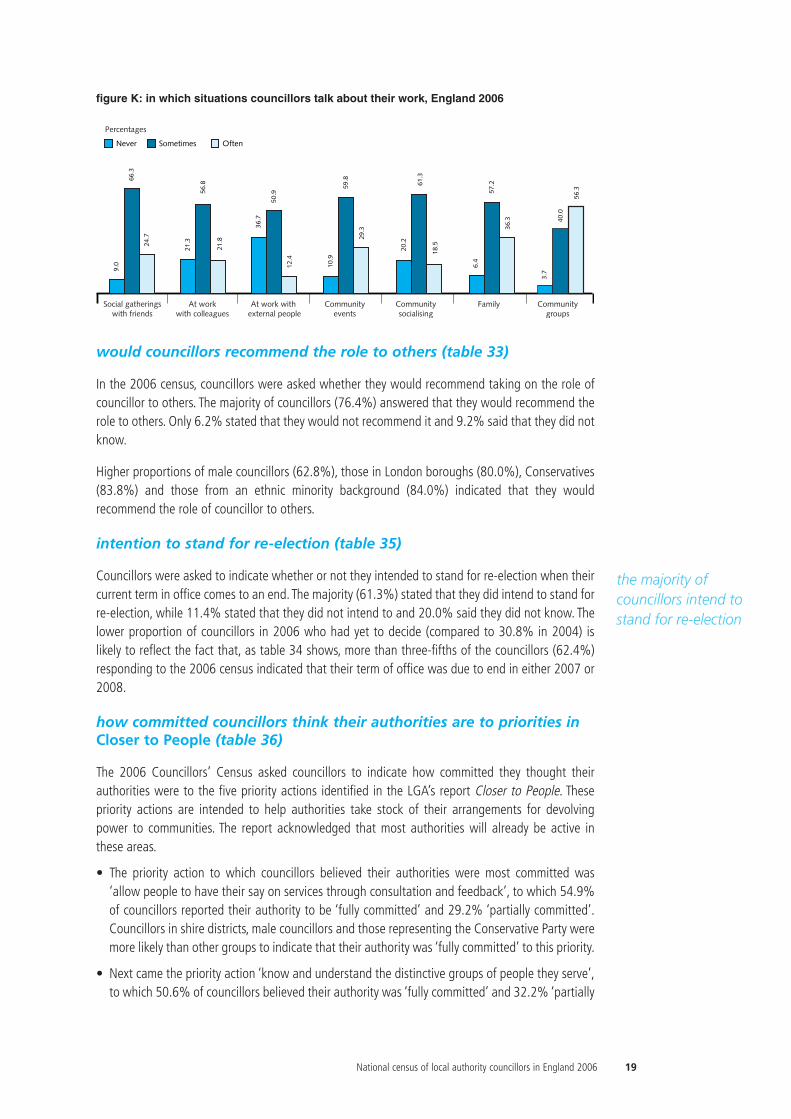
figure K: in which situations councillors talk about their work, England 2006
would councillors recommend the role to others (table 33)
In the 2006 census, councillors were asked whether they would recommend taking on the role ofcouncillor to others. The majority of councillors (76.4%) answered that they would recommend therole to others. Only 6.2% stated that they would not recommend it and 9.2% said that they did notknow.
Higher proportions of male councillors (62.8%), those in London boroughs (80.0%), Conservatives(83.8%) and those from an ethnic minority background (84.0%) indicated that they wouldrecommend the role of councillor to others.
intention to stand for re-election (table 35)
Councillors were asked to indicate whether or not they intended to stand for re-election when theircurrent term in office comes to an end. The majority (61.3%) stated that they did intend to stand forre-election, while 11.4% stated that they did not intend to and 20.0% said they did not know. Thelower proportion of councillors in 2006 who had yet to decide (compared to 30.8% in 2004) islikely to reflect the fact that, as table 34 shows, more than three-fifths of the councillors (62.4%)responding to the 2006 census indicated that their term of office was due to end in either 2007 or2008.
how committed councillors think their authorities are to priorities inCloser to People (table 36)
The 2006 Councillors’ Census asked councillors to indicate how committed they thought theirauthorities were to the five priority actions identified in the LGA’s report Closer to People. Thesepriority actions are intended to help authorities take stock of their arrangements for devolvingpower to communities. The report acknowledged that most authorities will already be active inthese areas.
• The priority action to which councillors believed their authorities were most committed was‘allow people to have their say on services through consultation and feedback’, to which 54.9%of councillors reported their authority to be ‘fully committed’ and 29.2% ‘partially committed’.Councillors in shire districts, male councillors and those representing the Conservative Party weremore likely than other groups to indicate that their authority was ‘fully committed’ to this priority.
• Next came the priority action ‘know and understand the distinctive groups of people they serve’,to which 50.6% of councillors believed their authority was ‘fully committed’ and 32.2% ‘partially
National census of local authority councillors in England 2006 19
Percentages
Never Sometimes Often
At workwith colleagues
At work with external people
Communityevents
Communitysocialising
FamilySocial gatheringswith friends
36.7
50.9
12.4
9.0
66.3
24.7
21.3
56.8
21.8
10.9
59.8
29.3
20.2
61.3
18.5
6.4
57.2
36.3
Communitygroups
3.7
40.0
56.3
the majority ofcouncillors intend tostand for re-election
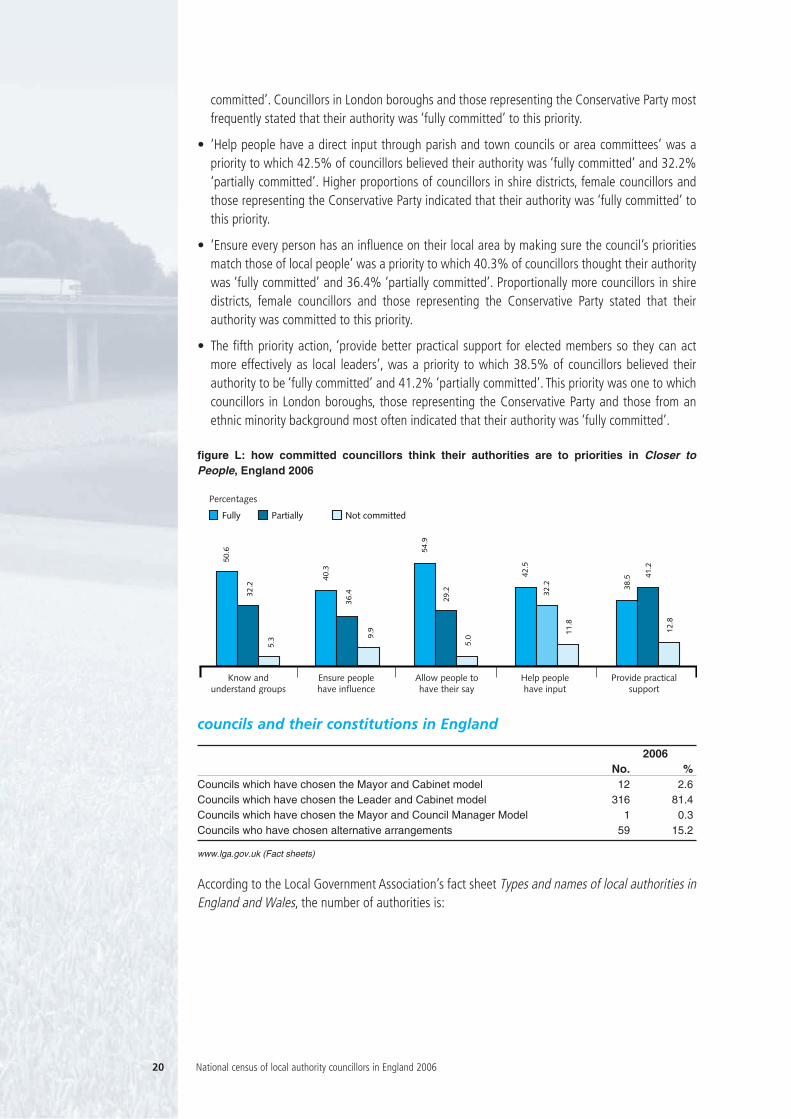
committed’. Councillors in London boroughs and those representing the Conservative Party mostfrequently stated that their authority was ‘fully committed’ to this priority.
• ‘Help people have a direct input through parish and town councils or area committees’ was apriority to which 42.5% of councillors believed their authority was ‘fully committed’ and 32.2%‘partially committed’. Higher proportions of councillors in shire districts, female councillors andthose representing the Conservative Party indicated that their authority was ‘fully committed’ tothis priority.
• ‘Ensure every person has an influence on their local area by making sure the council’s prioritiesmatch those of local people’ was a priority to which 40.3% of councillors thought their authoritywas ‘fully committed’ and 36.4% ‘partially committed’. Proportionally more councillors in shiredistricts, female councillors and those representing the Conservative Party stated that theirauthority was committed to this priority.
• The fifth priority action, ‘provide better practical support for elected members so they can actmore effectively as local leaders’, was a priority to which 38.5% of councillors believed theirauthority to be ‘fully committed’ and 41.2% ‘partially committed’. This priority was one to whichcouncillors in London boroughs, those representing the Conservative Party and those from anethnic minority background most often indicated that their authority was ‘fully committed’.
figure L: how committed councillors think their authorities are to priorities in Closer toPeople, England 2006
councils and their constitutions in England
2006No. %
Councils which have chosen the Mayor and Cabinet model 12 2.6Councils which have chosen the Leader and Cabinet model 316 81.4Councils which have chosen the Mayor and Council Manager Model 1 0.3Councils who have chosen alternative arrangements 59 15.2
www.lga.gov.uk (Fact sheets)
According to the Local Government Association’s fact sheet Types and names of local authorities inEngland and Wales, the number of authorities is:
20 National census of local authority councillors in England 2006
Percentages
Fully Partially Not committed
Ensure peoplehave influence
Allow people tohave their say
Help peoplehave input
Provide practicalsupport
Know andunderstand groups
54.9
29.2
5.0
50.6
32.2
5.3
40.3
36.4
9.9
42.5
32.2
11.8
38.5 41
.2
12.8
Number of authorities
type of authorityShire counties 34Shire districts 238Metropolitan districts 36London boroughs 33English Unitaries 47
English regionEast Midlands 45East of England 54North East 25North West 46South East 74South West 51West Midlands 38Yorks. & Humberside 22London 33
All England 388
www.lga.gov.uk/Documents/Briefing/Types.PDF
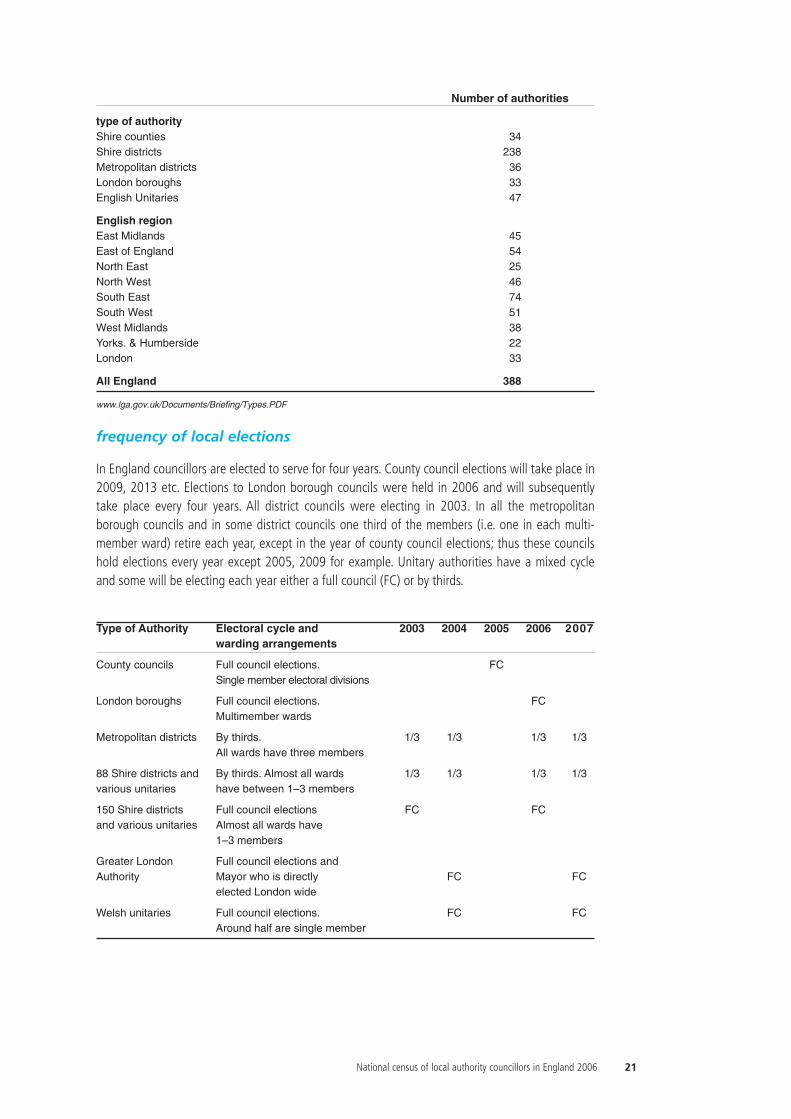
frequency of local elections
In England councillors are elected to serve for four years. County council elections will take place in2009, 2013 etc. Elections to London borough councils were held in 2006 and will subsequentlytake place every four years. All district councils were electing in 2003. In all the metropolitanborough councils and in some district councils one third of the members (i.e. one in each multi-member ward) retire each year, except in the year of county council elections; thus these councilshold elections every year except 2005, 2009 for example. Unitary authorities have a mixed cycleand some will be electing each year either a full council (FC) or by thirds.
Type of Authority Electoral cycle and 2003 2004 2005 2006 2007warding arrangements
County councils Full council elections. FCSingle member electoral divisions
London boroughs Full council elections. FCMultimember wards
Metropolitan districts By thirds. 1/3 1/3 1/3 1/3All wards have three members
88 Shire districts and By thirds. Almost all wards 1/3 1/3 1/3 1/3various unitaries have between 1–3 members
150 Shire districts Full council elections FC FCand various unitaries Almost all wards have
1–3 members
Greater London Full council elections and Authority Mayor who is directly FC FC
elected London wide
Welsh unitaries Full council elections. FC FCAround half are single member
National census of local authority councillors in England 2006 21
annex A
Summary by type of authority and English region
response rate gender average ethnic origin
of councillors male female age white other % % % (years) % %
type of authorityShire counties 44.9% (1019) 71.8 26.5 60.4 98.2 1.9Shire districts 45.7% (4834) 69.1 29.6 59.7 98.1 1.9Metropolitan districts 40.0% (979) 69.3 29.5 56.5 95.5 4.5London boroughs 44.9% (891) 67.9 31.0 51.9 82.3 17.7English unitaries 39.6% (961) 68.7 29.3 57.1 95.5 4.5
English regionEast Midlands 45.5% (916) 72.9 26.2 59.7 97.8 2.2East of England 42.0% (1126) 67.9 30.5 59.0 97.0 3.1North East 48.7% (622) 72.1 26.4 59.4 98.7 1.3North West 47.2% (1231) 69.6 29.2 57.9 97.4 2.6South East 44.3% (1591) 67.8 30.4 58.8 96.5 3.5South West 41.9% (993) 68.5 30.3 59.9 99.1 0.8West Midlands 42.1% (800) 69.3 29.2 59.3 96.4 3.7London 44.9% (891) 67.9 31.0 51.9 82.3 17.7Yorks. & Humberside 40.9% (514) 71.0 27.8 58.2 97.3 2.8
All England 44.4 (8748) 69.3 29.3 58.3 95.9 4.1Note: figures in brackets show number of responses
Analysis to different questions may be based on different groups of respondents
The figures may not total 100% as a result of rounding
% long term % one or employment statusillness/health more % full- % part- % self- % retired
problem/ caring time time employeddisability responsibilities
type of authorityShire counties 10.0 23.9 12.7 11.5 16.5 47.1Shire districts 10.7 23.4 22.8 9.5 17.3 43.8Metropolitan districts 12.8 23.2 25.0 10.6 12.3 37.3London boroughs 8.6 29.1 37.0 11.5 15.0 26.5English unitaries 12.3 24.6 24.5 12.4 14.0 37.5
English regionEast Midlands 13.5 22.2 21.9 10.4 15.5 44.4East of England 8.7 26.4 23.1 10.5 16.0 42.3North East 16.1 21.3 23.0 10.7 10.7 43.0North West 12.8 25.1 24.6 10.6 13.7 40.7South East 8.0 23.6 21.7 10.4 18.5 41.8South West 11.9 22.5 18.6 8.5 19.2 45.1London 8.6 29.1 37.0 11.5 15.0 26.5West Midlands 12.2 23.0 22.4 10.7 14.9 41.8Yorks. & Humberside 9.7 22.2 20.0 11.1 16.5 41.0
All England 10.9 24.2 23.5 10.4 16.0 40.9
22 National census of local authority councillors in England 2006
type of authorityShire counties 7.7 49.9 57.7 57.1 27.2 54.6 11.0Shire districts 8.5 53.2 44.8 30.2 17.8 63.5 13.1Metropolitan districts 8.9 55.0 56.1 24.8 29.3 67.6 8.0London boroughs 6.7 52.0 47.7 33.1 23.2 45.8 8.0English unitaries 8.4 59.5 56.9 35.2 26.6 64.7 10.9
English regionEast Midlands 9.0 55.1 53.1 34.2 19.7 69.0 9.9East of England 7.8 49.2 47.5 35.0 18.6 60.1 13.8North East 9.6 59.3 54.5 28.1 23.6 69.5 8.5North West 8.6 55.4 49.8 29.4 22.9 62.4 11.8South East 7.9 52.7 49.2 33.9 20.7 58.6 13.3South West 8.5 55.1 46.2 39.3 22.3 62.7 13.5London 6.7 52.0 47.7 33.1 23.2 45.8 8.0West Midlands 9.2 53.8 48.8 33.6 23.3 64.2 11.5Yorks. & Humberside 7.9 54.7 52.6 32.1 27.9 66.5 7.3
All England 8.3 53.7 49.5 33.5 21.9 61.3 11.4
National census of local authority councillors in England 2006 23
averagelength ofservice(years)
% holdingone ormore
position ofleadingresp.
% receivesspecial
responsi-bility
allowance
%previously
been acouncillor
averageno. hours/
week(decima-
lised)
stand forre-
election?
%yes
%no
annex B
Breakdown of survey data, England 1997–2006
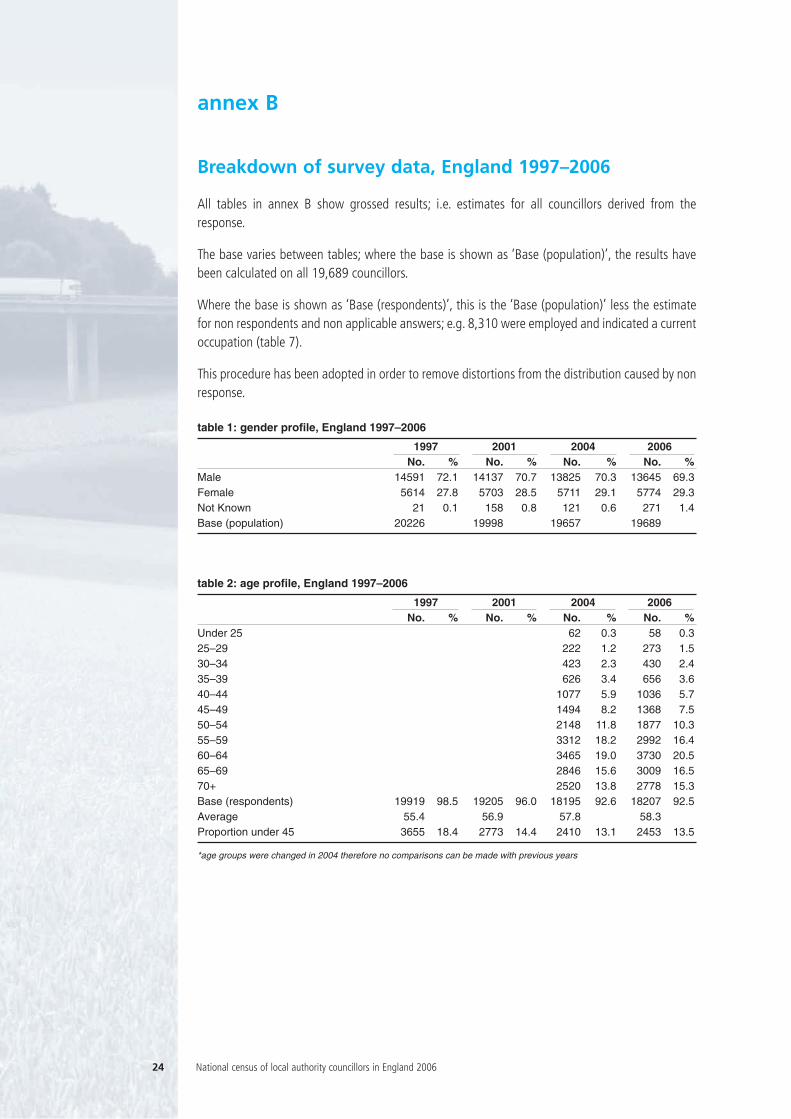
All tables in annex B show grossed results; i.e. estimates for all councillors derived from theresponse.
The base varies between tables; where the base is shown as ‘Base (population)’, the results havebeen calculated on all 19,689 councillors.
Where the base is shown as ‘Base (respondents)’, this is the ‘Base (population)’ less the estimatefor non respondents and non applicable answers; e.g. 8,310 were employed and indicated a currentoccupation (table 7).
This procedure has been adopted in order to remove distortions from the distribution caused by nonresponse.
table 1: gender profile, England 1997–2006
1997 2001 2004 2006No. % No. % No. % No. %
Male 14591 72.1 14137 70.7 13825 70.3 13645 69.3Female 5614 27.8 5703 28.5 5711 29.1 5774 29.3Not Known 21 0.1 158 0.8 121 0.6 271 1.4Base (population) 20226 19998 19657 19689
table 2: age profile, England 1997–2006
1997 2001 2004 2006No. % No. % No. % No. %
Under 25 62 0.3 58 0.325–29 222 1.2 273 1.530–34 423 2.3 430 2.435–39 626 3.4 656 3.640–44 1077 5.9 1036 5.745–49 1494 8.2 1368 7.550–54 2148 11.8 1877 10.355–59 3312 18.2 2992 16.460–64 3465 19.0 3730 20.565–69 2846 15.6 3009 16.570+ 2520 13.8 2778 15.3Base (respondents) 19919 98.5 19205 96.0 18195 92.6 18207 92.5Average 55.4 56.9 57.8 58.3Proportion under 45 3655 18.4 2773 14.4 2410 13.1 2453 13.5
*age groups were changed in 2004 therefore no comparisons can be made with previous years
24 National census of local authority councillors in England 2006
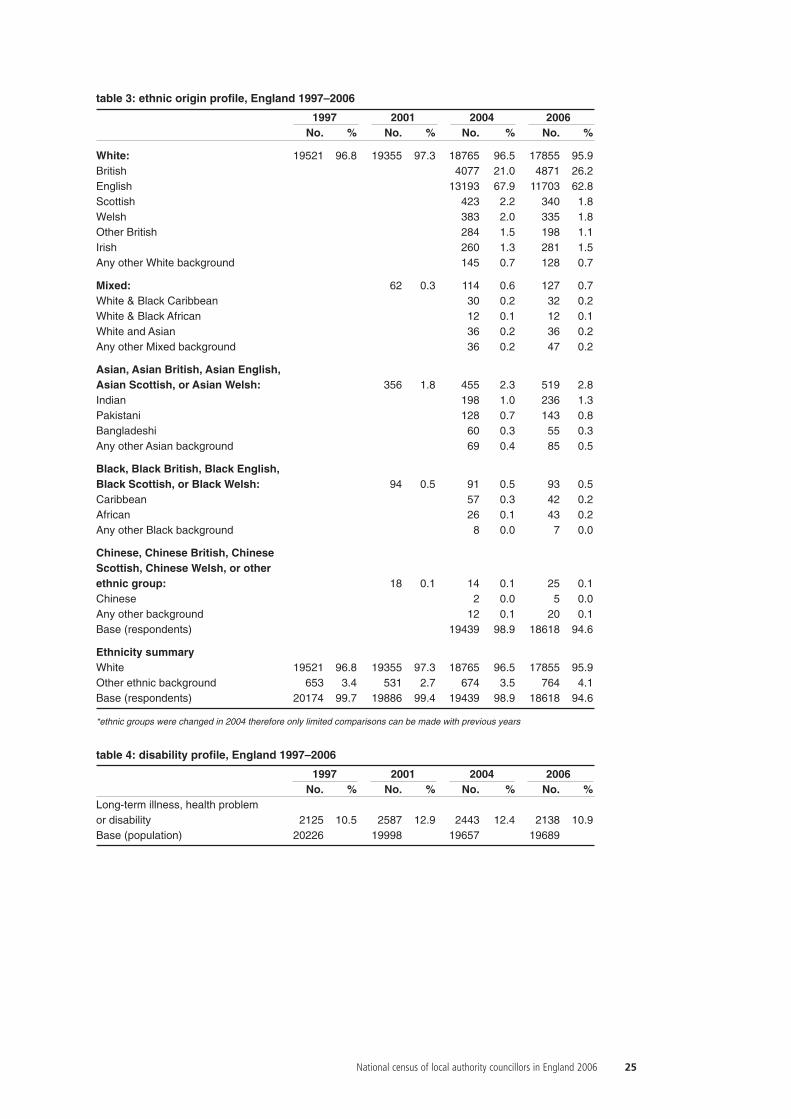
table 3: ethnic origin profile, England 1997–2006
1997 2001 2004 2006No. % No. % No. % No. %
White: 19521 96.8 19355 97.3 18765 96.5 17855 95.9British 4077 21.0 4871 26.2English 13193 67.9 11703 62.8Scottish 423 2.2 340 1.8Welsh 383 2.0 335 1.8Other British 284 1.5 198 1.1Irish 260 1.3 281 1.5Any other White background 145 0.7 128 0.7
Mixed: 62 0.3 114 0.6 127 0.7White & Black Caribbean 30 0.2 32 0.2White & Black African 12 0.1 12 0.1White and Asian 36 0.2 36 0.2Any other Mixed background 36 0.2 47 0.2
Asian, Asian British, Asian English, Asian Scottish, or Asian Welsh: 356 1.8 455 2.3 519 2.8Indian 198 1.0 236 1.3Pakistani 128 0.7 143 0.8Bangladeshi 60 0.3 55 0.3Any other Asian background 69 0.4 85 0.5
Black, Black British, Black English, Black Scottish, or Black Welsh: 94 0.5 91 0.5 93 0.5Caribbean 57 0.3 42 0.2African 26 0.1 43 0.2Any other Black background 8 0.0 7 0.0
Chinese, Chinese British, ChineseScottish, Chinese Welsh, or otherethnic group: 18 0.1 14 0.1 25 0.1Chinese 2 0.0 5 0.0Any other background 12 0.1 20 0.1Base (respondents) 19439 98.9 18618 94.6
Ethnicity summaryWhite 19521 96.8 19355 97.3 18765 96.5 17855 95.9Other ethnic background 653 3.4 531 2.7 674 3.5 764 4.1Base (respondents) 20174 99.7 19886 99.4 19439 98.9 18618 94.6
*ethnic groups were changed in 2004 therefore only limited comparisons can be made with previous years
table 4: disability profile, England 1997–2006
1997 2001 2004 2006No. % No. % No. % No. %
Long-term illness, health problem or disability 2125 10.5 2587 12.9 2443 12.4 2138 10.9Base (population) 20226 19998 19657 19689
National census of local authority councillors in England 2006 25
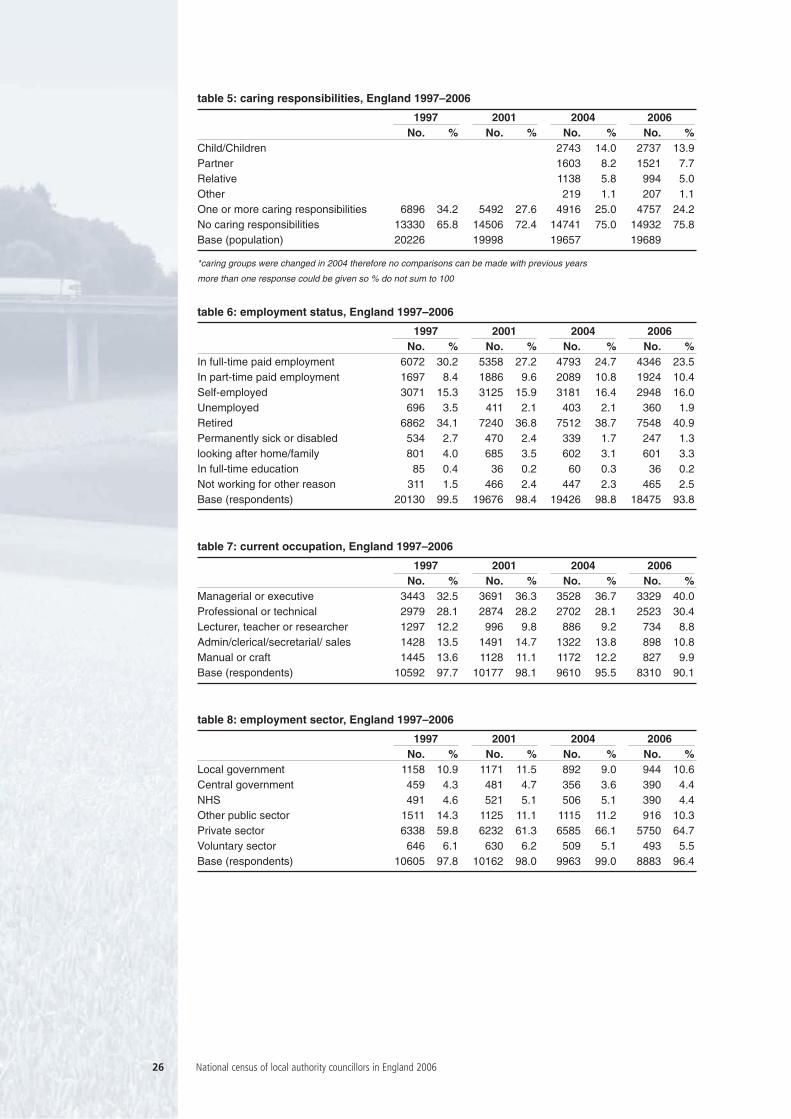
table 5: caring responsibilities, England 1997–2006
1997 2001 2004 2006No. % No. % No. % No. %
Child/Children 2743 14.0 2737 13.9Partner 1603 8.2 1521 7.7Relative 1138 5.8 994 5.0Other 219 1.1 207 1.1One or more caring responsibilities 6896 34.2 5492 27.6 4916 25.0 4757 24.2No caring responsibilities 13330 65.8 14506 72.4 14741 75.0 14932 75.8Base (population) 20226 19998 19657 19689
*caring groups were changed in 2004 therefore no comparisons can be made with previous years
more than one response could be given so % do not sum to 100
table 6: employment status, England 1997–2006
1997 2001 2004 2006No. % No. % No. % No. %
In full-time paid employment 6072 30.2 5358 27.2 4793 24.7 4346 23.5In part-time paid employment 1697 8.4 1886 9.6 2089 10.8 1924 10.4Self-employed 3071 15.3 3125 15.9 3181 16.4 2948 16.0Unemployed 696 3.5 411 2.1 403 2.1 360 1.9Retired 6862 34.1 7240 36.8 7512 38.7 7548 40.9Permanently sick or disabled 534 2.7 470 2.4 339 1.7 247 1.3looking after home/family 801 4.0 685 3.5 602 3.1 601 3.3In full-time education 85 0.4 36 0.2 60 0.3 36 0.2Not working for other reason 311 1.5 466 2.4 447 2.3 465 2.5Base (respondents) 20130 99.5 19676 98.4 19426 98.8 18475 93.8
table 7: current occupation, England 1997–2006
1997 2001 2004 2006No. % No. % No. % No. %
Managerial or executive 3443 32.5 3691 36.3 3528 36.7 3329 40.0Professional or technical 2979 28.1 2874 28.2 2702 28.1 2523 30.4Lecturer, teacher or researcher 1297 12.2 996 9.8 886 9.2 734 8.8Admin/clerical/secretarial/ sales 1428 13.5 1491 14.7 1322 13.8 898 10.8Manual or craft 1445 13.6 1128 11.1 1172 12.2 827 9.9Base (respondents) 10592 97.7 10177 98.1 9610 95.5 8310 90.1
table 8: employment sector, England 1997–2006
1997 2001 2004 2006No. % No. % No. % No. %
Local government 1158 10.9 1171 11.5 892 9.0 944 10.6Central government 459 4.3 481 4.7 356 3.6 390 4.4NHS 491 4.6 521 5.1 506 5.1 390 4.4Other public sector 1511 14.3 1125 11.1 1115 11.2 916 10.3Private sector 6338 59.8 6232 61.3 6585 66.1 5750 64.7Voluntary sector 646 6.1 630 6.2 509 5.1 493 5.5Base (respondents) 10605 97.8 10162 98.0 9963 99.0 8883 96.4
26 National census of local authority councillors in England 2006
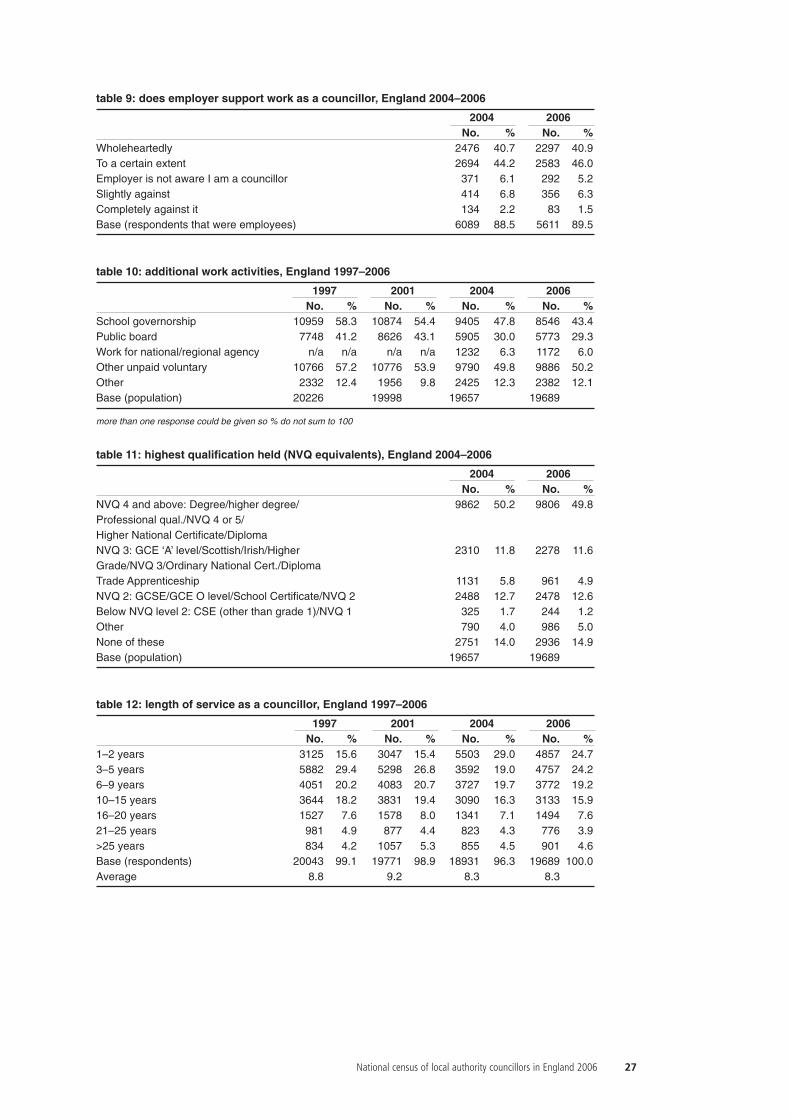
table 9: does employer support work as a councillor, England 2004–2006
2004 2006No. % No. %
Wholeheartedly 2476 40.7 2297 40.9To a certain extent 2694 44.2 2583 46.0Employer is not aware I am a councillor 371 6.1 292 5.2Slightly against 414 6.8 356 6.3Completely against it 134 2.2 83 1.5Base (respondents that were employees) 6089 88.5 5611 89.5
table 10: additional work activities, England 1997–2006
1997 2001 2004 2006No. % No. % No. % No. %
School governorship 10959 58.3 10874 54.4 9405 47.8 8546 43.4Public board 7748 41.2 8626 43.1 5905 30.0 5773 29.3Work for national/regional agency n/a n/a n/a n/a 1232 6.3 1172 6.0Other unpaid voluntary 10766 57.2 10776 53.9 9790 49.8 9886 50.2Other 2332 12.4 1956 9.8 2425 12.3 2382 12.1Base (population) 20226 19998 19657 19689
more than one response could be given so % do not sum to 100
table 11: highest qualification held (NVQ equivalents), England 2004–2006
2004 2006No. % No. %
NVQ 4 and above: Degree/higher degree/ 9862 50.2 9806 49.8Professional qual./NVQ 4 or 5/Higher National Certificate/DiplomaNVQ 3: GCE ‘A’ level/Scottish/Irish/Higher 2310 11.8 2278 11.6Grade/NVQ 3/Ordinary National Cert./DiplomaTrade Apprenticeship 1131 5.8 961 4.9NVQ 2: GCSE/GCE O level/School Certificate/NVQ 2 2488 12.7 2478 12.6Below NVQ level 2: CSE (other than grade 1)/NVQ 1 325 1.7 244 1.2Other 790 4.0 986 5.0None of these 2751 14.0 2936 14.9Base (population) 19657 19689
table 12: length of service as a councillor, England 1997–2006
1997 2001 2004 2006No. % No. % No. % No. %
1–2 years 3125 15.6 3047 15.4 5503 29.0 4857 24.73–5 years 5882 29.4 5298 26.8 3592 19.0 4757 24.26–9 years 4051 20.2 4083 20.7 3727 19.7 3772 19.210–15 years 3644 18.2 3831 19.4 3090 16.3 3133 15.916–20 years 1527 7.6 1578 8.0 1341 7.1 1494 7.621–25 years 981 4.9 877 4.4 823 4.3 776 3.9>25 years 834 4.2 1057 5.3 855 4.5 901 4.6Base (respondents) 20043 99.1 19771 98.9 18931 96.3 19689 100.0Average 8.8 9.2 8.3 8.3
National census of local authority councillors in England 2006 27
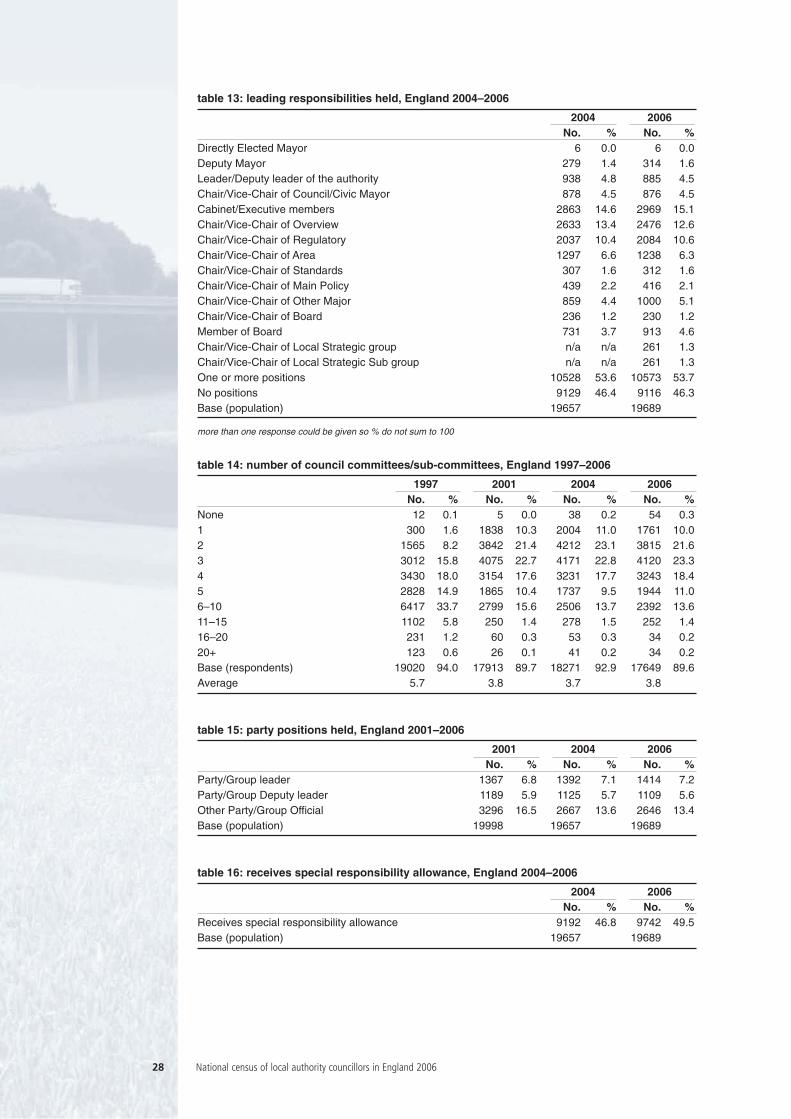
table 13: leading responsibilities held, England 2004–2006
2004 2006No. % No. %
Directly Elected Mayor 6 0.0 6 0.0Deputy Mayor 279 1.4 314 1.6Leader/Deputy leader of the authority 938 4.8 885 4.5Chair/Vice-Chair of Council/Civic Mayor 878 4.5 876 4.5Cabinet/Executive members 2863 14.6 2969 15.1Chair/Vice-Chair of Overview 2633 13.4 2476 12.6Chair/Vice-Chair of Regulatory 2037 10.4 2084 10.6Chair/Vice-Chair of Area 1297 6.6 1238 6.3Chair/Vice-Chair of Standards 307 1.6 312 1.6Chair/Vice-Chair of Main Policy 439 2.2 416 2.1Chair/Vice-Chair of Other Major 859 4.4 1000 5.1Chair/Vice-Chair of Board 236 1.2 230 1.2Member of Board 731 3.7 913 4.6Chair/Vice-Chair of Local Strategic group n/a n/a 261 1.3Chair/Vice-Chair of Local Strategic Sub group n/a n/a 261 1.3One or more positions 10528 53.6 10573 53.7No positions 9129 46.4 9116 46.3Base (population) 19657 19689
more than one response could be given so % do not sum to 100
table 14: number of council committees/sub-committees, England 1997–2006
1997 2001 2004 2006No. % No. % No. % No. %
None 12 0.1 5 0.0 38 0.2 54 0.31 300 1.6 1838 10.3 2004 11.0 1761 10.02 1565 8.2 3842 21.4 4212 23.1 3815 21.63 3012 15.8 4075 22.7 4171 22.8 4120 23.34 3430 18.0 3154 17.6 3231 17.7 3243 18.45 2828 14.9 1865 10.4 1737 9.5 1944 11.06–10 6417 33.7 2799 15.6 2506 13.7 2392 13.611–15 1102 5.8 250 1.4 278 1.5 252 1.416–20 231 1.2 60 0.3 53 0.3 34 0.220+ 123 0.6 26 0.1 41 0.2 34 0.2Base (respondents) 19020 94.0 17913 89.7 18271 92.9 17649 89.6Average 5.7 3.8 3.7 3.8
table 15: party positions held, England 2001–2006
2001 2004 2006No. % No. % No. %
Party/Group leader 1367 6.8 1392 7.1 1414 7.2Party/Group Deputy leader 1189 5.9 1125 5.7 1109 5.6Other Party/Group Official 3296 16.5 2667 13.6 2646 13.4Base (population) 19998 19657 19689
table 16: receives special responsibility allowance, England 2004–2006
2004 2006No. % No. %
Receives special responsibility allowance 9192 46.8 9742 49.5Base (population) 19657 19689
28 National census of local authority councillors in England 2006
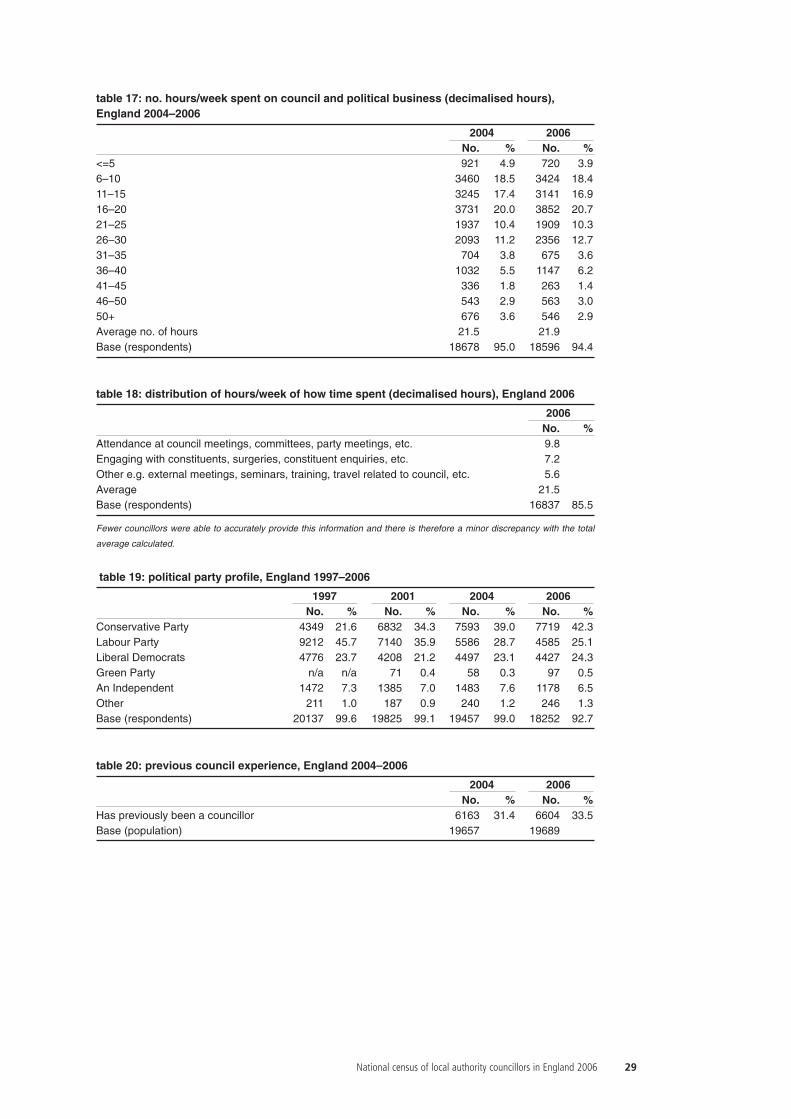
table 17: no. hours/week spent on council and political business (decimalised hours), England 2004–2006
2004 2006No. % No. %
<=5 921 4.9 720 3.96–10 3460 18.5 3424 18.411–15 3245 17.4 3141 16.916–20 3731 20.0 3852 20.721–25 1937 10.4 1909 10.326–30 2093 11.2 2356 12.731–35 704 3.8 675 3.636–40 1032 5.5 1147 6.241–45 336 1.8 263 1.446–50 543 2.9 563 3.050+ 676 3.6 546 2.9Average no. of hours 21.5 21.9Base (respondents) 18678 95.0 18596 94.4
table 18: distribution of hours/week of how time spent (decimalised hours), England 2006
2006No. %
Attendance at council meetings, committees, party meetings, etc. 9.8Engaging with constituents, surgeries, constituent enquiries, etc. 7.2Other e.g. external meetings, seminars, training, travel related to council, etc. 5.6Average 21.5Base (respondents) 16837 85.5
Fewer councillors were able to accurately provide this information and there is therefore a minor discrepancy with the total
average calculated.
table 19: political party profile, England 1997–2006
1997 2001 2004 2006No. % No. % No. % No. %
Conservative Party 4349 21.6 6832 34.3 7593 39.0 7719 42.3Labour Party 9212 45.7 7140 35.9 5586 28.7 4585 25.1Liberal Democrats 4776 23.7 4208 21.2 4497 23.1 4427 24.3Green Party n/a n/a 71 0.4 58 0.3 97 0.5An Independent 1472 7.3 1385 7.0 1483 7.6 1178 6.5Other 211 1.0 187 0.9 240 1.2 246 1.3Base (respondents) 20137 99.6 19825 99.1 19457 99.0 18252 92.7
table 20: previous council experience, England 2004–2006
2004 2006No. % No. %
Has previously been a councillor 6163 31.4 6604 33.5Base (population) 19657 19689
National census of local authority councillors in England 2006 29
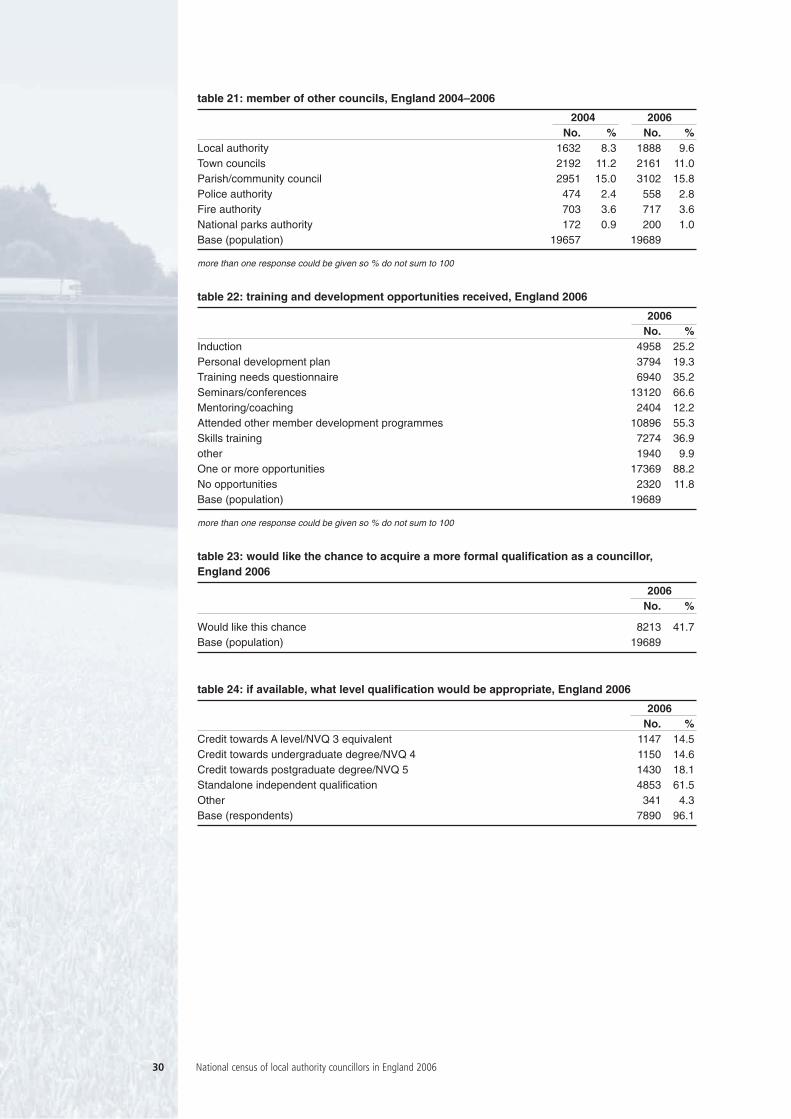
table 21: member of other councils, England 2004–2006
2004 2006No. % No. %
Local authority 1632 8.3 1888 9.6Town councils 2192 11.2 2161 11.0Parish/community council 2951 15.0 3102 15.8Police authority 474 2.4 558 2.8Fire authority 703 3.6 717 3.6National parks authority 172 0.9 200 1.0Base (population) 19657 19689
more than one response could be given so % do not sum to 100
table 22: training and development opportunities received, England 2006
2006No. %
Induction 4958 25.2Personal development plan 3794 19.3Training needs questionnaire 6940 35.2Seminars/conferences 13120 66.6Mentoring/coaching 2404 12.2Attended other member development programmes 10896 55.3Skills training 7274 36.9other 1940 9.9One or more opportunities 17369 88.2No opportunities 2320 11.8Base (population) 19689
more than one response could be given so % do not sum to 100
table 23: would like the chance to acquire a more formal qualification as a councillor,England 2006
2006No. %
Would like this chance 8213 41.7Base (population) 19689
table 24: if available, what level qualification would be appropriate, England 2006
2006No. %
Credit towards A level/NVQ 3 equivalent 1147 14.5Credit towards undergraduate degree/NVQ 4 1150 14.6Credit towards postgraduate degree/NVQ 5 1430 18.1Standalone independent qualification 4853 61.5Other 341 4.3Base (respondents) 7890 96.1
30 National census of local authority councillors in England 2006
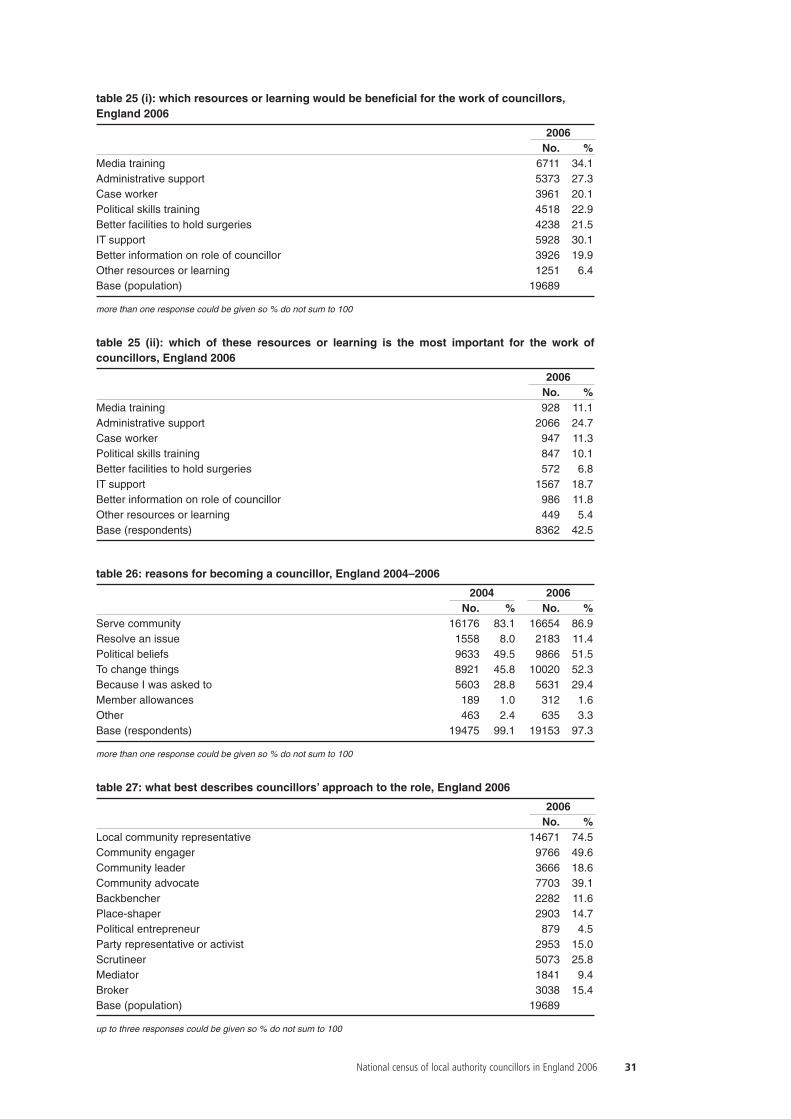
table 25 (i): which resources or learning would be beneficial for the work of councillors, England 2006
2006No. %
Media training 6711 34.1Administrative support 5373 27.3Case worker 3961 20.1Political skills training 4518 22.9Better facilities to hold surgeries 4238 21.5IT support 5928 30.1Better information on role of councillor 3926 19.9Other resources or learning 1251 6.4Base (population) 19689
more than one response could be given so % do not sum to 100
table 25 (ii): which of these resources or learning is the most important for the work ofcouncillors, England 2006
2006No. %
Media training 928 11.1Administrative support 2066 24.7Case worker 947 11.3Political skills training 847 10.1Better facilities to hold surgeries 572 6.8IT support 1567 18.7Better information on role of councillor 986 11.8Other resources or learning 449 5.4Base (respondents) 8362 42.5
table 26: reasons for becoming a councillor, England 2004–2006
2004 2006No. % No. %
Serve community 16176 83.1 16654 86.9Resolve an issue 1558 8.0 2183 11.4Political beliefs 9633 49.5 9866 51.5To change things 8921 45.8 10020 52.3Because I was asked to 5603 28.8 5631 29.4Member allowances 189 1.0 312 1.6Other 463 2.4 635 3.3Base (respondents) 19475 99.1 19153 97.3
more than one response could be given so % do not sum to 100
table 27: what best describes councillors’ approach to the role, England 2006
2006No. %
Local community representative 14671 74.5Community engager 9766 49.6Community leader 3666 18.6Community advocate 7703 39.1Backbencher 2282 11.6Place-shaper 2903 14.7Political entrepreneur 879 4.5Party representative or activist 2953 15.0Scrutineer 5073 25.8Mediator 1841 9.4Broker 3038 15.4Base (population) 19689
up to three responses could be given so % do not sum to 100
National census of local authority councillors in England 2006 31
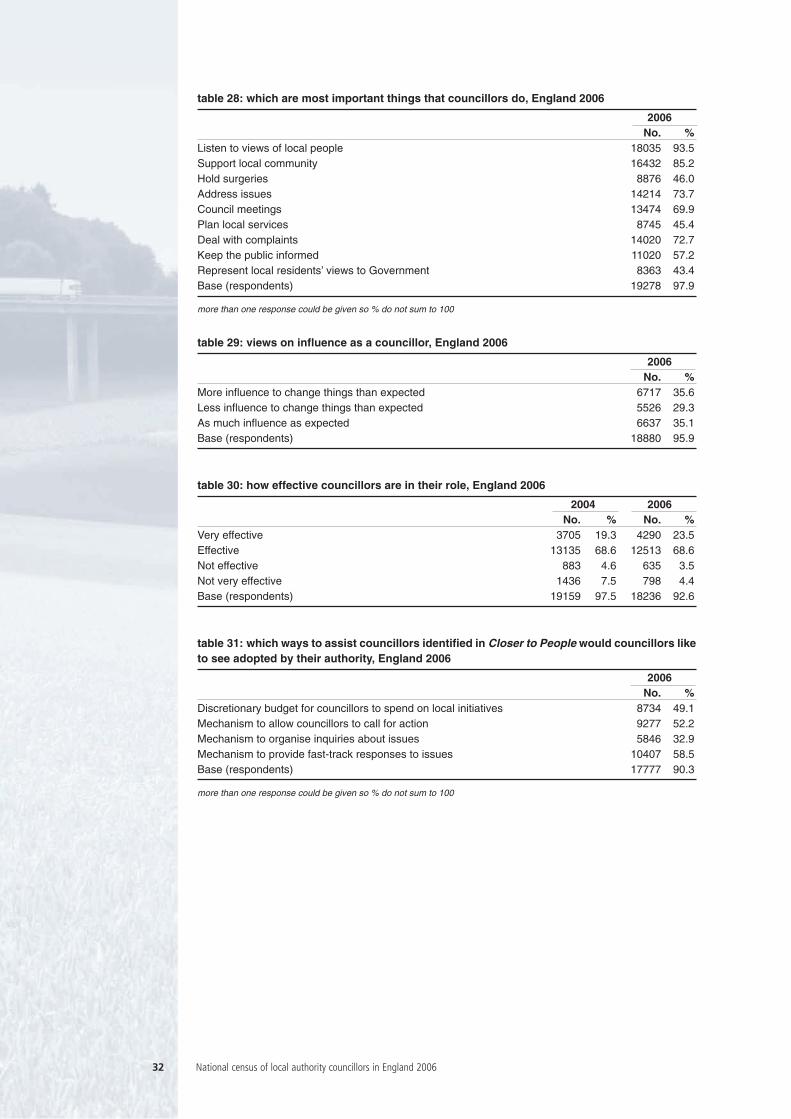
table 28: which are most important things that councillors do, England 2006
2006No. %
Listen to views of local people 18035 93.5Support local community 16432 85.2Hold surgeries 8876 46.0Address issues 14214 73.7Council meetings 13474 69.9Plan local services 8745 45.4Deal with complaints 14020 72.7Keep the public informed 11020 57.2Represent local residents’ views to Government 8363 43.4Base (respondents) 19278 97.9
more than one response could be given so % do not sum to 100
table 29: views on influence as a councillor, England 2006
2006No. %
More influence to change things than expected 6717 35.6Less influence to change things than expected 5526 29.3As much influence as expected 6637 35.1Base (respondents) 18880 95.9
table 30: how effective councillors are in their role, England 2006
2004 2006No. % No. %
Very effective 3705 19.3 4290 23.5Effective 13135 68.6 12513 68.6Not effective 883 4.6 635 3.5Not very effective 1436 7.5 798 4.4Base (respondents) 19159 97.5 18236 92.6
table 31: which ways to assist councillors identified in Closer to People would councillors liketo see adopted by their authority, England 2006
2006No. %
Discretionary budget for councillors to spend on local initiatives 8734 49.1Mechanism to allow councillors to call for action 9277 52.2Mechanism to organise inquiries about issues 5846 32.9Mechanism to provide fast-track responses to issues 10407 58.5Base (respondents) 17777 90.3
more than one response could be given so % do not sum to 100
32 National census of local authority councillors in England 2006
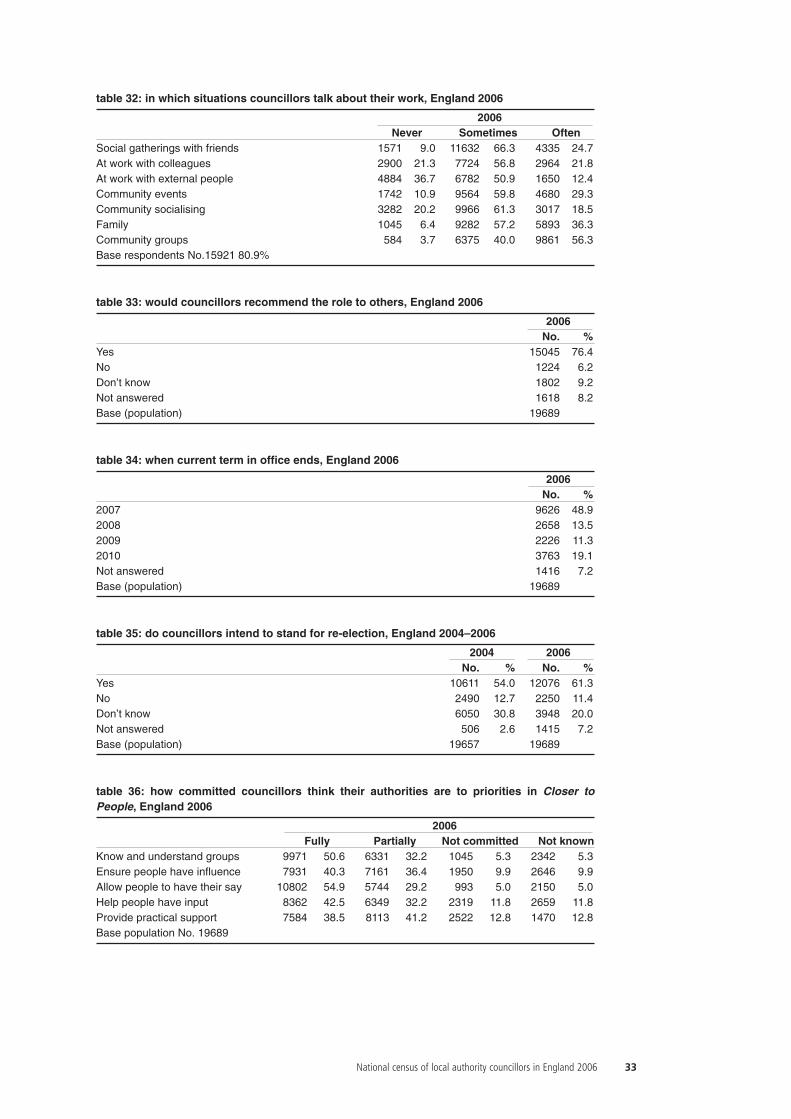
table 32: in which situations councillors talk about their work, England 2006
2006Never Sometimes Often
Social gatherings with friends 1571 9.0 11632 66.3 4335 24.7At work with colleagues 2900 21.3 7724 56.8 2964 21.8At work with external people 4884 36.7 6782 50.9 1650 12.4Community events 1742 10.9 9564 59.8 4680 29.3Community socialising 3282 20.2 9966 61.3 3017 18.5Family 1045 6.4 9282 57.2 5893 36.3Community groups 584 3.7 6375 40.0 9861 56.3Base respondents No.15921 80.9%
table 33: would councillors recommend the role to others, England 2006
2006No. %
Yes 15045 76.4No 1224 6.2Don’t know 1802 9.2Not answered 1618 8.2Base (population) 19689
table 34: when current term in office ends, England 2006
2006No. %
2007 9626 48.92008 2658 13.52009 2226 11.32010 3763 19.1Not answered 1416 7.2Base (population) 19689
table 35: do councillors intend to stand for re-election, England 2004–2006
2004 2006No. % No. %
Yes 10611 54.0 12076 61.3No 2490 12.7 2250 11.4Don’t know 6050 30.8 3948 20.0Not answered 506 2.6 1415 7.2Base (population) 19657 19689
table 36: how committed councillors think their authorities are to priorities in Closer toPeople, England 2006
2006Fully Partially Not committed Not known
Know and understand groups 9971 50.6 6331 32.2 1045 5.3 2342 5.3Ensure people have influence 7931 40.3 7161 36.4 1950 9.9 2646 9.9Allow people to have their say 10802 54.9 5744 29.2 993 5.0 2150 5.0Help people have input 8362 42.5 6349 32.2 2319 11.8 2659 11.8Provide practical support 7584 38.5 8113 41.2 2522 12.8 1470 12.8Base population No. 19689
National census of local authority councillors in England 2006 33
annex C
comparative data
The National Census of Local Authority Councillors has, since 1997, provided information on whoour local authority councillors are and what they do. To enhance the information collected via thesurvey and to make the report more useful to authorities, we have included comparative data fromthe Labour Force Survey.
The Labour Force Survey (LFS) Autumn 2006 quarter (table 37)
The Labour Force Survey (LFS) is one of the government’s major workforce surveys, and the broadestin its topic coverage. It is carried out by the Office for National Statistics (ONS), and runscontinuously. Results are reported for each quarter. The survey method involves carrying outinterviews directly with a sample of all households, either face-to-face or by telephone. Each quarteraround 60,000 households are interviewed (occasionally the sample is boosted to meet particularpurposes). Figures are then grossed to represent the whole population. The following are someextracts from the autumn 2006 quarter for the population over the age of 21 in England and in thenine government office regions.
The proportion of male councillors is at least 20% higher than in the adult population bothnationally and at regional level. Across England nearly 70% of councillors are male and 30%female against the national picture of 48% and 52% respectively.
The age of councillors is considerably higher than the adult population with the age profile ofcouncillors most closely matching the adult population in the 50–54 and 70+ age bands. Only 21%of councillors are under 50 as against a national proportion of 54.4%. The age profile of councillorsis youngest in London where 40.9% of councillors are under 50; the age profile of the adult Londonpopulation is also younger than the country as a whole with 64% under 50. In England the largestproportion of councillors is in the 60–64 age group, representing 20.5% of the total, against anational level of 7.4%.
The proportion of councillors who are white is higher than in the adult population in all regions, mostnotably in London and the West Midlands. The ethnic profile that most closely matches the adultpopulation is in the Asian population of councillors in the South East and in London.
There is a significantly higher proportion of the adult population in full-time employment thancouncillors and conversely a similarly higher proportion of retired councillors than in the adultpopulation. On the other hand the proportion of councillors who are self-employed is almost doublethat of the adult population. Across the country generally the picture regarding part-timeemployment shows a more similar pattern for councillors and the population as a whole. Theemployment profile of councillors that most closely matches the adult population can be found inLondon. Of those councillors who are employed the employment sector is rather similar to the adultpopulation with the exception of ‘other public sector’ and ‘voluntary sector’ where the proportion ofcouncillors is approximately double that of the adult population across all regions.
There is a considerably higher proportion of councillors with a highest level of qualification of NVQ4 equivalent or above than in the adult population and a much lower proportion of councillors withqualifications below NVQ level 2. At the same time there arise a higher proportion of councillorswith no qualifications than in the adult population. The education profile of councillors most closelymatches the adult population in the grouping of those with NVQ level 2 equivalents.
34 National census of local authority councillors in England 2006
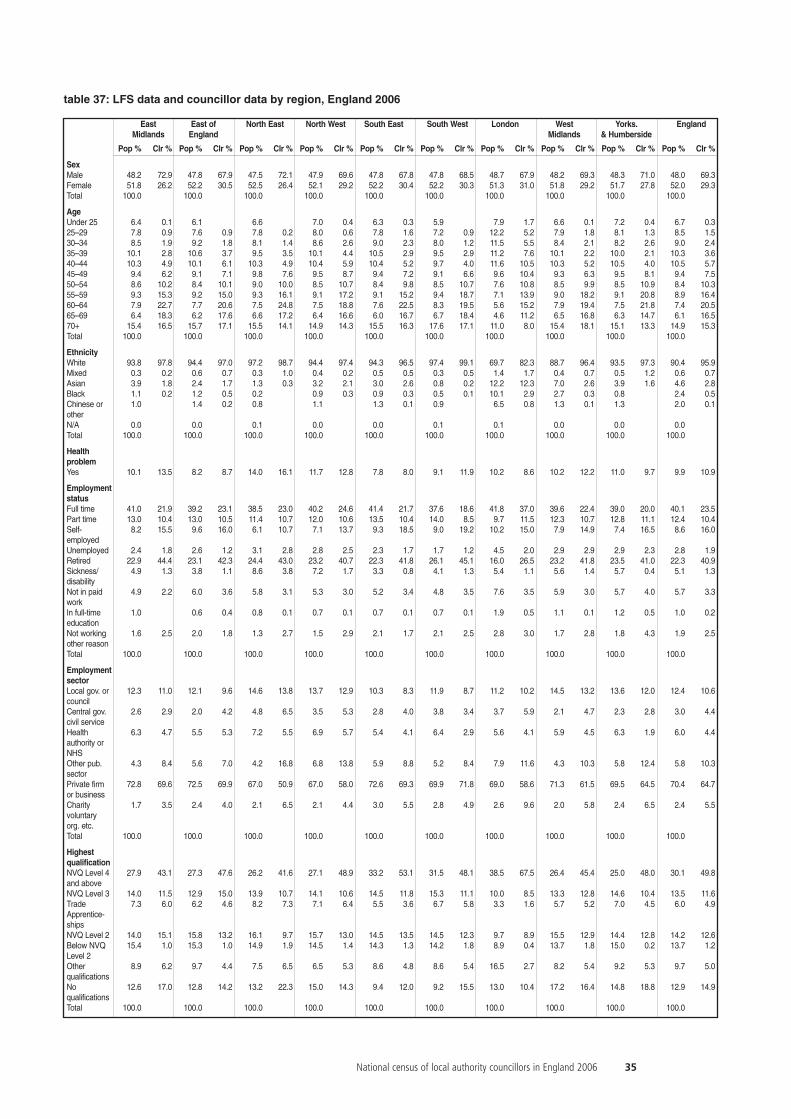
National census of local authority councillors in England 2006 35
East East of North East North West South East South West London West Yorks. EnglandMidlands England Midlands & Humberside
Pop % Clr % Pop % Clr % Pop % Clr % Pop % Clr % Pop % Clr % Pop % Clr % Pop % Clr % Pop % Clr % Pop % Clr % Pop % Clr %
SexMale 48.2 72.9 47.8 67.9 47.5 72.1 47.9 69.6 47.8 67.8 47.8 68.5 48.7 67.9 48.2 69.3 48.3 71.0 48.0 69.3Female 51.8 26.2 52.2 30.5 52.5 26.4 52.1 29.2 52.2 30.4 52.2 30.3 51.3 31.0 51.8 29.2 51.7 27.8 52.0 29.3Total 100.0 100.0 100.0 100.0 100.0 100.0 100.0 100.0 100.0 100.0
AgeUnder 25 6.4 0.1 6.1 6.6 7.0 0.4 6.3 0.3 5.9 7.9 1.7 6.6 0.1 7.2 0.4 6.7 0.325–29 7.8 0.9 7.6 0.9 7.8 0.2 8.0 0.6 7.8 1.6 7.2 0.9 12.2 5.2 7.9 1.8 8.1 1.3 8.5 1.530–34 8.5 1.9 9.2 1.8 8.1 1.4 8.6 2.6 9.0 2.3 8.0 1.2 11.5 5.5 8.4 2.1 8.2 2.6 9.0 2.435–39 10.1 2.8 10.6 3.7 9.5 3.5 10.1 4.4 10.5 2.9 9.5 2.9 11.2 7.6 10.1 2.2 10.0 2.1 10.3 3.640–44 10.3 4.9 10.1 6.1 10.3 4.9 10.4 5.9 10.4 5.2 9.7 4.0 11.6 10.5 10.3 5.2 10.5 4.0 10.5 5.745–49 9.4 6.2 9.1 7.1 9.8 7.6 9.5 8.7 9.4 7.2 9.1 6.6 9.6 10.4 9.3 6.3 9.5 8.1 9.4 7.550–54 8.6 10.2 8.4 10.1 9.0 10.0 8.5 10.7 8.4 9.8 8.5 10.7 7.6 10.8 8.5 9.9 8.5 10.9 8.4 10.355–59 9.3 15.3 9.2 15.0 9.3 16.1 9.1 17.2 9.1 15.2 9.4 18.7 7.1 13.9 9.0 18.2 9.1 20.8 8.9 16.460–64 7.9 22.7 7.7 20.6 7.5 24.8 7.5 18.8 7.6 22.5 8.3 19.5 5.6 15.2 7.9 19.4 7.5 21.8 7.4 20.565–69 6.4 18.3 6.2 17.6 6.6 17.2 6.4 16.6 6.0 16.7 6.7 18.4 4.6 11.2 6.5 16.8 6.3 14.7 6.1 16.570+ 15.4 16.5 15.7 17.1 15.5 14.1 14.9 14.3 15.5 16.3 17.6 17.1 11.0 8.0 15.4 18.1 15.1 13.3 14.9 15.3Total 100.0 100.0 100.0 100.0 100.0 100.0 100.0 100.0 100.0 100.0
EthnicityWhite 93.8 97.8 94.4 97.0 97.2 98.7 94.4 97.4 94.3 96.5 97.4 99.1 69.7 82.3 88.7 96.4 93.5 97.3 90.4 95.9Mixed 0.3 0.2 0.6 0.7 0.3 1.0 0.4 0.2 0.5 0.5 0.3 0.5 1.4 1.7 0.4 0.7 0.5 1.2 0.6 0.7Asian 3.9 1.8 2.4 1.7 1.3 0.3 3.2 2.1 3.0 2.6 0.8 0.2 12.2 12.3 7.0 2.6 3.9 1.6 4.6 2.8Black 1.1 0.2 1.2 0.5 0.2 0.9 0.3 0.9 0.3 0.5 0.1 10.1 2.9 2.7 0.3 0.8 2.4 0.5Chinese or 1.0 1.4 0.2 0.8 1.1 1.3 0.1 0.9 6.5 0.8 1.3 0.1 1.3 2.0 0.1other N/A 0.0 0.0 0.1 0.0 0.0 0.1 0.1 0.0 0.0 0.0Total 100.0 100.0 100.0 100.0 100.0 100.0 100.0 100.0 100.0 100.0
Health problem Yes 10.1 13.5 8.2 8.7 14.0 16.1 11.7 12.8 7.8 8.0 9.1 11.9 10.2 8.6 10.2 12.2 11.0 9.7 9.9 10.9
Employment status Full time 41.0 21.9 39.2 23.1 38.5 23.0 40.2 24.6 41.4 21.7 37.6 18.6 41.8 37.0 39.6 22.4 39.0 20.0 40.1 23.5Part time 13.0 10.4 13.0 10.5 11.4 10.7 12.0 10.6 13.5 10.4 14.0 8.5 9.7 11.5 12.3 10.7 12.8 11.1 12.4 10.4Self- 8.2 15.5 9.6 16.0 6.1 10.7 7.1 13.7 9.3 18.5 9.0 19.2 10.2 15.0 7.9 14.9 7.4 16.5 8.6 16.0employedUnemployed 2.4 1.8 2.6 1.2 3.1 2.8 2.8 2.5 2.3 1.7 1.7 1.2 4.5 2.0 2.9 2.9 2.9 2.3 2.8 1.9Retired 22.9 44.4 23.1 42.3 24.4 43.0 23.2 40.7 22.3 41.8 26.1 45.1 16.0 26.5 23.2 41.8 23.5 41.0 22.3 40.9Sickness/ 4.9 1.3 3.8 1.1 8.6 3.8 7.2 1.7 3.3 0.8 4.1 1.3 5.4 1.1 5.6 1.4 5.7 0.4 5.1 1.3disabilityNot in paid 4.9 2.2 6.0 3.6 5.8 3.1 5.3 3.0 5.2 3.4 4.8 3.5 7.6 3.5 5.9 3.0 5.7 4.0 5.7 3.3workIn full-time 1.0 0.6 0.4 0.8 0.1 0.7 0.1 0.7 0.1 0.7 0.1 1.9 0.5 1.1 0.1 1.2 0.5 1.0 0.2educationNot working 1.6 2.5 2.0 1.8 1.3 2.7 1.5 2.9 2.1 1.7 2.1 2.5 2.8 3.0 1.7 2.8 1.8 4.3 1.9 2.5other reasonTotal 100.0 100.0 100.0 100.0 100.0 100.0 100.0 100.0 100.0 100.0
Employment sector Local gov. or 12.3 11.0 12.1 9.6 14.6 13.8 13.7 12.9 10.3 8.3 11.9 8.7 11.2 10.2 14.5 13.2 13.6 12.0 12.4 10.6council Central gov. 2.6 2.9 2.0 4.2 4.8 6.5 3.5 5.3 2.8 4.0 3.8 3.4 3.7 5.9 2.1 4.7 2.3 2.8 3.0 4.4civil serviceHealth 6.3 4.7 5.5 5.3 7.2 5.5 6.9 5.7 5.4 4.1 6.4 2.9 5.6 4.1 5.9 4.5 6.3 1.9 6.0 4.4authority or NHS Other pub. 4.3 8.4 5.6 7.0 4.2 16.8 6.8 13.8 5.9 8.8 5.2 8.4 7.9 11.6 4.3 10.3 5.8 12.4 5.8 10.3sector Private firm 72.8 69.6 72.5 69.9 67.0 50.9 67.0 58.0 72.6 69.3 69.9 71.8 69.0 58.6 71.3 61.5 69.5 64.5 70.4 64.7or businessCharity 1.7 3.5 2.4 4.0 2.1 6.5 2.1 4.4 3.0 5.5 2.8 4.9 2.6 9.6 2.0 5.8 2.4 6.5 2.4 5.5voluntary org. etc.Total 100.0 100.0 100.0 100.0 100.0 100.0 100.0 100.0 100.0 100.0
Highest qualification NVQ Level 4 27.9 43.1 27.3 47.6 26.2 41.6 27.1 48.9 33.2 53.1 31.5 48.1 38.5 67.5 26.4 45.4 25.0 48.0 30.1 49.8and aboveNVQ Level 3 14.0 11.5 12.9 15.0 13.9 10.7 14.1 10.6 14.5 11.8 15.3 11.1 10.0 8.5 13.3 12.8 14.6 10.4 13.5 11.6Trade 7.3 6.0 6.2 4.6 8.2 7.3 7.1 6.4 5.5 3.6 6.7 5.8 3.3 1.6 5.7 5.2 7.0 4.5 6.0 4.9Apprentice-shipsNVQ Level 2 14.0 15.1 15.8 13.2 16.1 9.7 15.7 13.0 14.5 13.5 14.5 12.3 9.7 8.9 15.5 12.9 14.4 12.8 14.2 12.6Below NVQ 15.4 1.0 15.3 1.0 14.9 1.9 14.5 1.4 14.3 1.3 14.2 1.8 8.9 0.4 13.7 1.8 15.0 0.2 13.7 1.2Level 2Other 8.9 6.2 9.7 4.4 7.5 6.5 6.5 5.3 8.6 4.8 8.6 5.4 16.5 2.7 8.2 5.4 9.2 5.3 9.7 5.0qualificationsNo 12.6 17.0 12.8 14.2 13.2 22.3 15.0 14.3 9.4 12.0 9.2 15.5 13.0 10.4 17.2 16.4 14.8 18.8 12.9 14.9qualificationsTotal 100.0 100.0 100.0 100.0 100.0 100.0 100.0 100.0 100.0 100.0
table 37: LFS data and councillor data by region, England 2006
36 National census of local authority councillors in England 2006
annex D
National census of local authority councillors 2006 –survey form
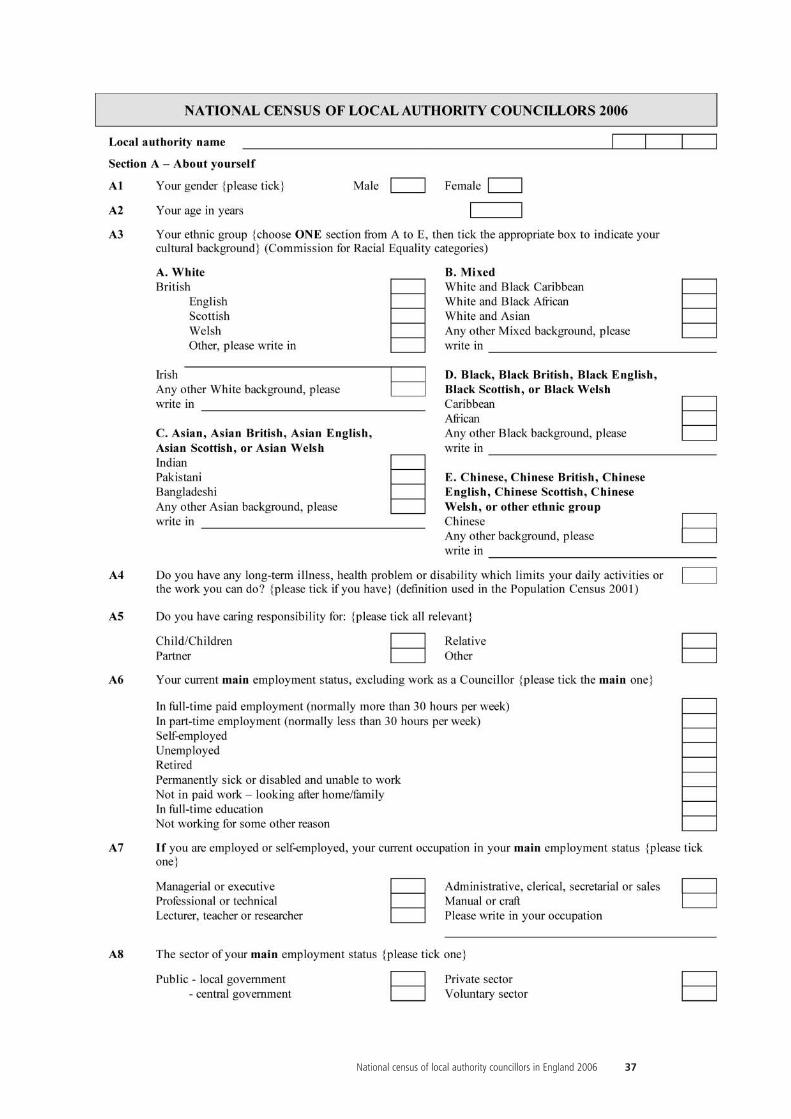
National census of local authority councillors in England 2006 37
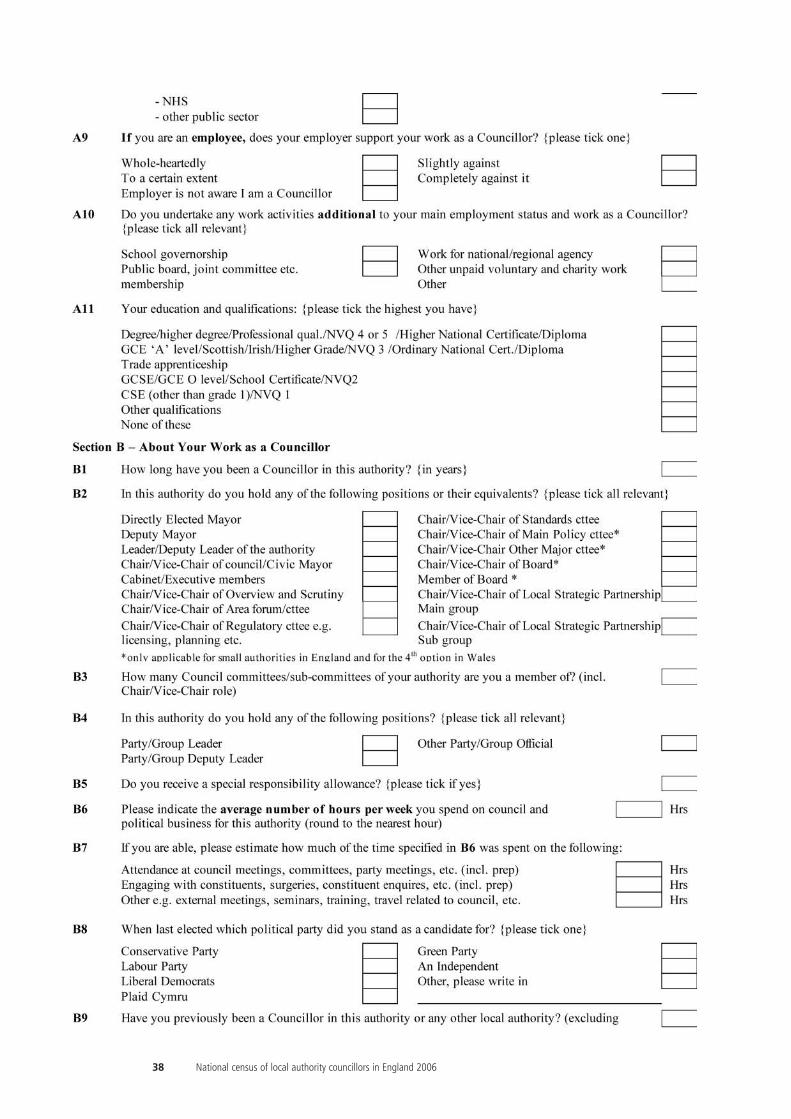
38 National census of local authority councillors in England 2006
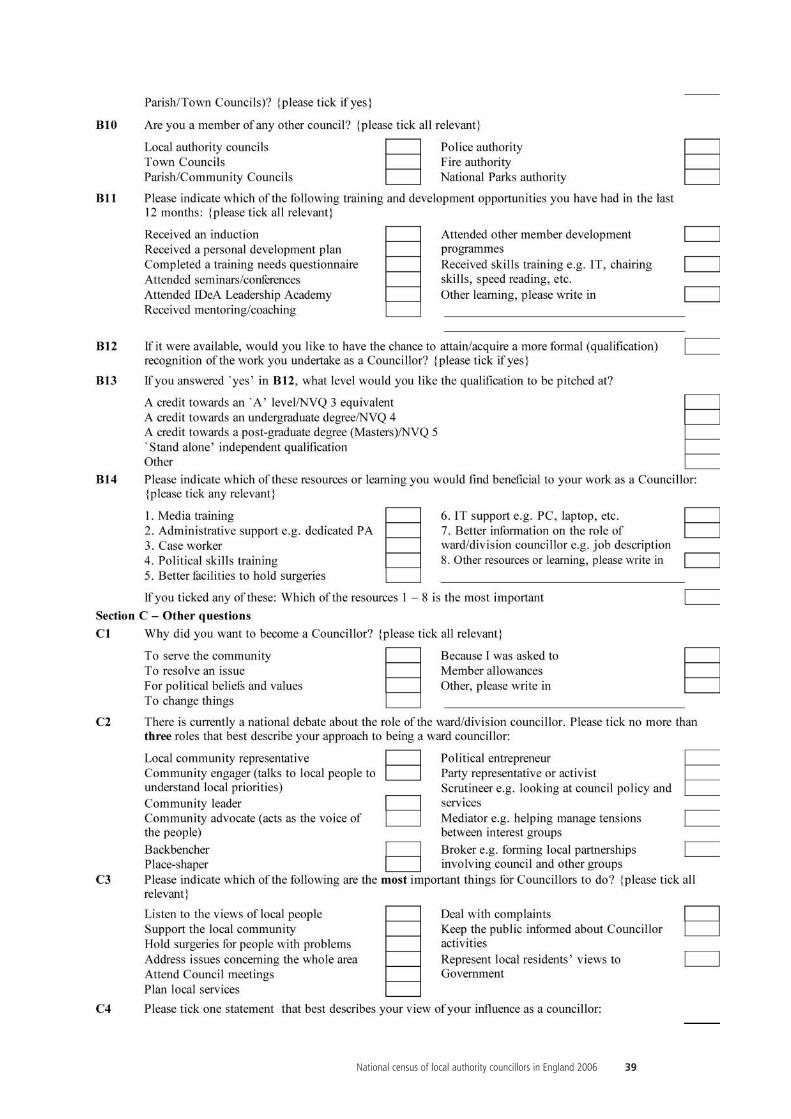
National census of local authority councillors in England 2006 39
40 National census of local authority councillors in England 2006
acknowledgements
The LGAR are grateful to member support officers for their support and advice, and for theirconsiderable help in despatching the questionnaires to all councillors, monitoring and encouragingresponse. We would also like to thank all those councillors who completed and returned aquestionnaire, without whose help the survey could not have been conducted.
National Foundation for Educational Research (NFER) conducted the National Census of LocalAuthority Councillors 2006 on behalf of Local Government Analysis and Research (LGAR).
If you have any queries or would like to discuss this report further, please contact:
Stephen RichardsLocal Government Analysis and ResearchLocal Government House,Smith Square,London SW1P 3HZTelephone 020 7664 3256www.lgar.local.gov.ukEmail: [email protected]
visual impairment
Please call us on 020 7664 3256, to order your copy of this publication as a 16pt plain textdocument.

For further information, please contact:Local Government Analysis & ResearchLocal Government House, Smith SquareLondon SW1P 3HZTelephone 020 7664 3000www.lgar.local.gov.uk
Or telephone LGconnect for all yourlocal government queries on 020 7664 3131Fax 020 7664 3030Email [email protected]
Copyright © 2022 FDOKUMEN

