


Bahasa
Halaman
Hukum


a g r i c u l t u r a l a n d f o r e s t m e t e o r o l o g y 1 4 8 ( 2 0 0 8 ) 7 4 8 – 7 6 0
avai lable at www.sc iencedi rec t .com
journal homepage: www.e lsev ier .com/ locate /agr formet
Multiple site tower flux and remote sensing comparisonsof tropical forest dynamics in Monsoon Asia
A.R. Huete a,c,*, N. Restrepo-Coupe b, P. Ratana d, K. Didan a, S.R. Saleska b,c,K. Ichii e, S. Panuthai f, M. Gamo g
aDepartment of Soil, Water & Environmental Science, University of Arizona, Tucson, AZ 85721, USAbDepartment of Ecology and Evolutionary Biology, University of Arizona, Tucson, AZ 85721, USAc Institute for the Study of Planet Earth, University of Arizona, Tucson, AZ 85721, USAdDepartment of Geotechnology, Khon Kaen University, Khon Kaen, ThailandeSan Jose State University and Ecosystem Science and Technology Branch, NASA Ames Research Center,
Mail Stop 242-4, Moffett Field, CA 94035, USAfNational Park, Wildlife and Plant Conservation Department, Chatuchak, Bangkok 10900, ThailandgNational Institute of Advanced Industrial Science and Technology (AIST), Tsukuba, Ibaraki 305-8569, Japan
a r t i c l e i n f o
Article history:
Received 6 June 2007
Received in revised form
25 December 2007
Accepted 18 January 2008
Keywords:
AsiaFlux
Remote sensing
MODIS EVI
Tropical forests
Phenology
a b s t r a c t
The spatial and temporal dynamics of tropical forest functioning are poorly understood,partly
attributed to a weak seasonality and high tree species diversity at the landscape scale. Recent
neotropical rainforest studies with local tower flux measurements have revealed strong
seasonal carbon fluxes that follow the availability of sunlight in intact forests, while in areas
of forest disturbance, carbon fluxes more closely tracked seasonal water availability. These
studies also showed a strong seasonal correspondence of satellite measures of greenness,
using the Enhanced Vegetation Index (EVI) with ecosystem carbon fluxes in both intact and
disturbed forests, which may enable larger scale extension of tower flux measurements.
In this study, we investigated the seasonal patterns and relationships of local site tower
flux measures of gross primary productivity (Pg) with independent Moderate Resolution
Imaging Spectroradiometer (MODIS) satellite greenness measures across three Monsoon
Asia tropical forest types, encompassing drought-deciduous, dry evergreen, and humid
evergreen secondary tropical forests. In contrast to neotropical forests, the tropical forests
of Monsoon Asia are more extensively degraded and heterogeneous due to intense land use
pressures, and therefore, may exhibit unique seasonal patterns of ecosystem fluxes that are
more likely water-limited and drought-susceptible.
Our results show significant phenologic variability and response to moisture and light con-
trolsacrossthethreetropical forestsitesandattheregionalscale.Thedriertropical forestswere
primarily water-limited, while the wet evergreen secondary forest showed a slight positive
trend with light availability. Satellite EVI greenness observations were generally synchronized
andlinearly relatedwithseasonaland inter-annualtower fluxPg measurementsat themultiple
sites and provided better opportunities for tower extension of carbon fluxes than other satellite
products,suchastheMODISPg product.SatelliteEVI-derivedPg imagesrevealedstrongseasonal
variations in photosynthetic activity throughout the Monsoon Asia tropical region.
* Corresponding author at: Department of Soil, Water & EnvironmentTel.: +1 520 621 3228.
E-mail address: [email protected] (A.R. Huete).
0168-1923/$ – see front matter # 2008 Elsevier B.V. All rights reservedoi:10.1016/j.agrformet.2008.01.012
# 2008 Elsevier B.V. All rights reserved.
al Science, University of Arizona, Tucson, AZ 85721, USA.
d.

a g r i c u l t u r a l a n d f o r e s t m e t e o r o l o g y 1 4 8 ( 2 0 0 8 ) 7 4 8 – 7 6 0 749
1. Introduction
Tropical forests comprise a major and critical component of
the global Earth system through their role in climate and
hydrologic and biogeochemical cycling, and as a principal
reservoir of the planet’s biological diversity. Tropical forest
ecosystems also have social, cultural and economic signifi-
cance as sources of important renewable and non-renewable
resources (Defries et al., 1995; Achard et al., 2002). Despite their
importance, the mechanisms, interactions, and impact of
environmental and human factors on tropical forest function-
ing remain poorly understood. Knowledge of tropical forest
temporal dynamics and spatial heterogeneities at multiple
scales is necessary to understand how of these ecosystems
may respond to or adapt to global change and human
interactions (Schurr et al., 2006; Mahli et al., 1998; Skole and
Tucker, 1993).
Southeast Asia has some of the highest carbon density
regions in the world, however, tropical forest degradation is
prominent and deforestation rates are among the highest on
the planet, induced by the region’s large and growing human
population and the increasing exploitation of forest resources
(Page et al., 2002; Tian et al., 2003). An understanding of the
impact of climate variability and human factors on Monsoon
Asia tropical forest functioning and sustainability becomes
particularly crucial with important consequences to carbon
balance and emissions, fire susceptibility, and resulting air
quality and public health (Achard et al., 2002).
At the landscape level, many climate and productivity
models characterize tropical evergreen rainforests as lacking
seasonal variation in biophysical plant properties such as
greenness, leaf area index (Lai), fraction of photosynthetically
active radiation absorbed ( fpar), and albedo (Lean and
Rowntree, 1993; Sellers et al., 1995). Much of what is known
about tropical ecosystem dynamics and climate–vegetation
interactions comes from coarse resolution, high temporal
frequency satellite measurements, such as the NOAA-
Advanced Very High Resolution Radiometer (AVHRR) time
series data, which also have characterized the phenology of
tropical evergreen forests as seasonally constant (Justice et al.,
1985; Running et al., 1994; Defries et al., 1995; Achard and
Estreguil, 1995; Skole and Qi, 2001; Eva et al., 2004). Phenologic
variations, a characteristic property of ecosystem functioning
and predictor of ecosystem processes, are important to
resolve, as they depict a canopies’ integrated response to
environmental change and influence local biogeochemical
processes, including nutrient dynamics, photosynthesis,
water cycling, soil moisture depletion, and canopy physiology
(Reich and Borchert, 1984).
On the other hand, plot-level and local-scale studies have
shown distinct seasonal changes in tropical forest canopy
characteristics, including flushing and exchange of new
leaves, periods of decreased foliage density, leaf aging,
senescence, and litterfall (Frankie et al., 1974; Wright and
Schaik, 1994). Roberts et al. (1998) found seasonal variations in
canopy optical properties associated with leaf aging, epiphyll
activity in the wet season, and leaf flushing in the dry season
in a dense caatinga tropical forest near Manaus in central
Amazon. Wright and Schaik (1994) found leaf flushing and
flower production at sites across eight different rainforests,
including sites in Borneo and East Java, to closely coincide with
dry season peaks in incident photosynthetic active radiation
(Ipar). Carswell et al. (2002) and Asner et al. (2004) measured
increases in plot-level leaf area index (Lai) in the dry season at
two eastern Amazon evergreen rainforest sites.
More recent, eddy flux tower measurements have also
shown seasonal patterns in canopy photosynthesis that
follow the availability of sunlight in neotropical evergreen
forests in the Amazon (Carswell et al., 2002; Saleska et al., 2003;
da Rocha et al., 2004; Goulden et al., 2004). Seasonal peaks in
evapotranspiration (ET) have been measured in the late dry
season in tropical evergreen forests in northern Thailand and
in Amazon (Shuttleworth, 1988; Tanaka et al., 2004; da Rocha
et al., 2004). These forests showed little evidence of moisture
stress during the dry season with tree roots maintaining
access to deep soil moisture layers (Nepstad et al., 1994;
Tanaka et al., 2003; da Rocha et al., 2004).
One reason for the ambiguity and lack of knowledge of
topical forest seasonality at the landscape scale is their
complexity, where a highly diverse tree species population can
result in a wide variety of phenology responses to the same or
common environmental factors, such as rainfall, temperature,
and photoperiod (Wright and Schaik, 1994; Reich et al., 2004;
Prior et al., 2004; Kushwaha and Singh, 2005). Several
constraints inherent in coarse resolution satellite data may
also contribute to the difficulties in detecting temporal and
spatial variability in tropical forest phenology, including poor
spatial resolution (>4 km), cloud contamination, sensitivity to
seasonally variable atmosphere water vapor and aerosol
conditions, limited spectral content, and low optical depth
of penetration through densely vegetated canopies (Goward
et al., 1991; Skole and Qi, 2001). Kobayashi and Dye (2005)
found cloud and aerosol seasonal influences in AVHRR
normalized difference vegetation index (NDVI) data to mask
the apparent weak tropical forest seasonal signal from the
Amazon.
Finer resolution satellite data (e.g., Landsat) offer more
accurate monitoring and discrimination of tropical forests and
disturbance events, such as deforestation and fire (Cihlar et al.,
1997; Defries et al., 1995; Mayaux and Lambin, 1997; Vieira
et al., 2003; Kalacska et al., 2005). However, it is difficult to
obtain sufficient cloud-free images at the frequencies needed
to define accurate phenology trends. Furthermore, saturation
of the NDVI in tropical forests has been noted in both fine and
coarse resolution satellite data, resulting in a lack of sensitivity
to detect seasonality in forest canopy biophysical and
biochemical properties, discriminate primary from regenerat-
ing forests, and assess phenology characteristics, such as leaf
age (Sader et al., 1989; Skole and Qi, 2001; Huete et al., 2002;
Xiao et al., 2005; Zhang et al., 2005).
Some of the more recent and advanced moderate resolu-
tion satellite sensors, such as SPOT VEGETATION (VGT) and
the Moderate Resolution Imaging Spectroradiometer (MODIS)
have better sensor capabilities for tropical ecosystem studies
with improved calibration and atmosphere correction, nar-
rower spectral bands, and finer resolution observations (250–
1000 m) that facilitate cloud-filtering and noise removal
(Justice et al., 1998). Distinct local- and region-wide phenology
patterns have been observed in Amazon forests with MODIS-
derived leaf area index (Lai) and MODIS and SPOT-VGT
a g r i c u l t u r a l a n d f o r e s t m e t e o r o l o g y 1 4 8 ( 2 0 0 8 ) 7 4 8 – 7 6 0750
enhanced vegetation index (EVI, an index of canopy photo-
synthetic capacity) (Huete et al., 2006; Xiao et al., 2006; Myneni
et al., 2007). Furthermore, a strong seasonal correspondence of
satellite EVI values with tower flux measurements of gross
primary productivity (Pg) was found over intact Amazon
rainforests that followed the availability of sunlight (Xiao
et al., 2005; Huete et al., 2006). In areas of tropical forest
conversion to pasture and agriculture, a reversal in satellite
greenness phenology and tower Pg seasonal fluxes occurred,
with dry season declines in photosynthetic capacity, due to
the replacement of deep-rooted forest trees with shallower
rooting systems that became drought prone to extended dry
periods (Saleska et al., 2003; Huete et al., 2006).
Vegetation with root fractions occupying shallower soil
layers, as in younger secondary forests, are increasingly
susceptible to water stress and show phenologies more
controlled by soil moisture (Tanaka et al., 2004; Huete et al.,
2008). Curran et al. (2004) found that intact rainforests in the
Kalimantan rainforests of Borneo were able to survive ENSO
events, however, disturbed areas became drought-suscepti-
ble, triggering widespread fires and a drastic reduction in the
regenerative capacity of the rainforests. Saleska et al. (2007)
showed the intact rainforests in the Amazon were highly
resilient to periods of water shortage, as in the 2005 intense
drought, and were more productive due to increased sunlight.
Moisture and sunlight controls on tropical forest seasonal
dynamics and productivity vary with climatic and human
drivers, as well as ecological conditions. At regional scales, a
complex mosaic of vegetation function and phenology
patterns may be expected as a result of forest structural
variations, soil properties, topography effects, land use
activities, forest disturbance and conversion, and climate
variability (e.g., duration and intensity of the dry season)
(Asner et al., 2004; Keller et al., 2004).
An accurate representation of the seasonal and spatial
dynamics of tropical forest functioning and phenology is
prerequisite to drive ecosystem productivity models and
predict future inter-annual trends and changes resulting from
climate change and land use impacts (Nemani et al., 2003; Vina
and Henebry, 2005; White et al., 2005). The use of tower flux
measurements in different vegetation types can serve to
calibrate spatially extensive satellite data to improve predic-
tions and modeling of regional carbon fluxes. In this study we
compared simultaneously acquired tower flux and satellite
measurements of vegetation dynamics across three different
Monsoon Asia tropical forest types. Our objectives were to
analyze the spatial and temporal variability in tropical forest
functioning and phenology and assess the potential coupling
of multiple tower sites, each with limited and fairly narrow
spatial scales, with satellite measurements for larger scale
extension of carbon fluxes.
2. Study sites and methods
2.1. Study sites
We analyzed eddy flux tower datasets of carbon and radiation
dynamics across three different tropical forest types that are
part of the AsiaFlux network (www.asiaflux.net), including a
monsoonal drought-deciduous forest, a monsoonal dry ever-
green forest, and a humid evergreen tropical forest (Fig. 1).
Regional differences in tropical forest types can be attributed
to climate regime and soil influences with dry monsoonal
forests occurring in areas with annual precipitation below
2000 mm and with a distinct dry season of 2–6 months (Ishida
et al., 2006). The tropical drought-deciduous forests lose their
leaves under dry conditions, while the tropical evergreen trees
develop deeper roots to maintain leaves and transpiration
through dry conditions (Canadell et al., 1996).
The drought-deciduous tropical forest tower site is located
within the MaeKlong Watershed Research Station in Kan-
chanaburi Province, about 250 km northwest of Bangkok,
Thailand (Table 1). This secondary forest of 30+ years is a
mixed (�50%) deciduous canopy, dominated by Shorea
siamensis, Vitex peduncularis, and Xylia xylocarpa tree species,
forming a multilayer canopy of approximately 20–30 m height
and total Lai of 2–3. Mean annual rainfall is 1650 mm with a dry
season from November to March. The drought-avoiding
deciduous species lose their leaves during the latter half of
the dry season (January–March) and there is a flushing of new
leaves in April, following the onset of rainfall (Ishida et al.,
2006). The soils are classified as Kandiustalfs and are relatively
rich in nutrients (Rundel and Boonpragob, 1995).
The evergreen dry tropical forest tower site is located
within the Sakaerat Environmental Research Station in
Nakhon Ratchasima Province, about 180 km northeast of
Bangkok, Thailand (Table 1). The research station is located on
a table mountain, within the Korat sandstone plateau, ranging
in elevation from 650 to 250 m and dissected by a branch of the
Mekong River. The most dominant tree species, Hopea ferrea
Lanessan is in the Dipterocarpaceae family and makes up the
top canopy layer (Pitman, 1996). Mean annual rainfall is
1240 mm (Ishida et al., 2006) with a dry season similar to that
of the MaeKlong Station (November–March), but there is no
leafless period in the drought-tolerant evergreen species and
overall leaf life span may reach 2 years. The soils are classified
as Tropustults, and are predominantly shallow, sandy loam
texture, acidic, and nutrient poor (Pitman, 1996; Rundel and
Boonpragob, 1995).
The humid evergreen tropical rainforest tower site is
located within Bukit Soeharto Education Forest of Mulawar-
man University within the Bukit Soeharto National Park on the
east coast of East Kalimantan, Indonesia. Forest area has
decreased rapidly on the island of Borneo, which was once
almost completely covered by tropical rainforest. This area
was granted protection status by the government of Indonesia
in 1978 but has experienced large-scale forest fires during the
exceptionally dry years in 1982–1983 and 1997–1998, linked to
particularly strong El Nino events. The present young
successional forest stands consist of semi-natural dipterocarp
forest, together with degraded forest and plantation forest
stands. The dominant species, Macaranga gigantea and related
species, have canopy heights of about 10–20 m, total Lai of 3,
and have regenerated 3–6 years (1998 fire) during the 4 years of
data analyzed here. The coastal lowlands in the central and
southern parts of East Kalimantan have a seasonally weak
drier period from July–August to October, during which
precipitation is 80–150 mm/month, and are at times subject
to periodic droughts.

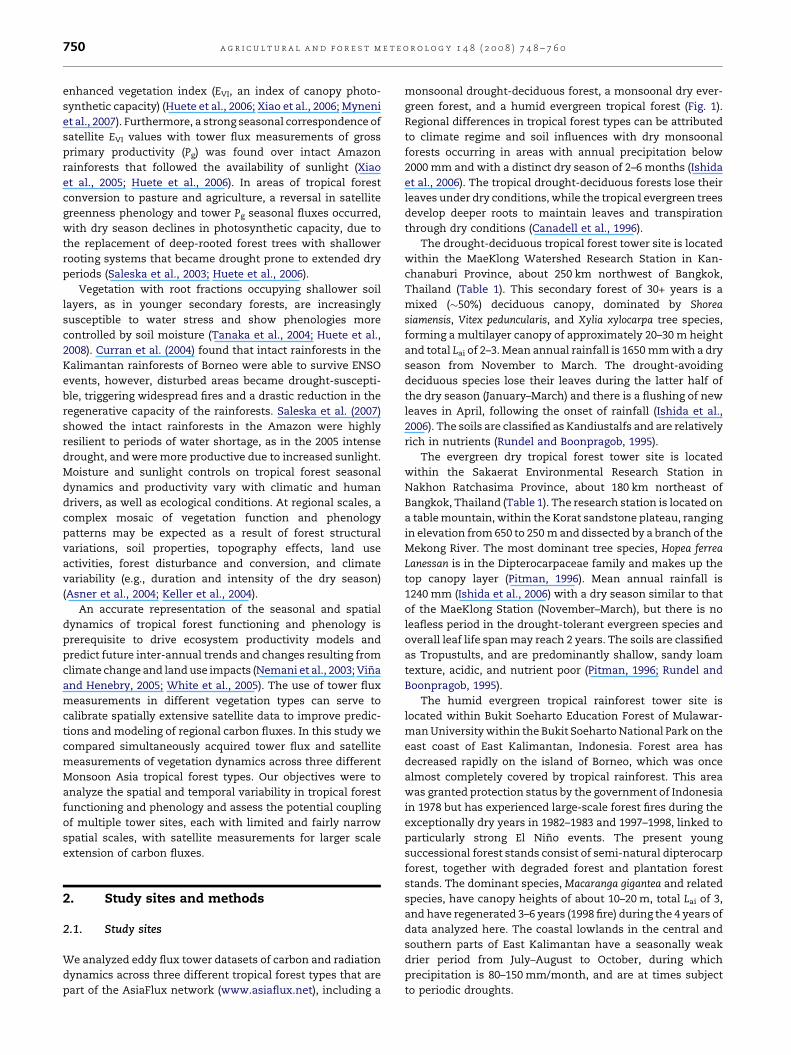
Fig. 1 – Location of three tropical forest study areas overlain onto a MODIS EVI satellite phenology depiction of month of peak
vegetation activity.
a g r i c u l t u r a l a n d f o r e s t m e t e o r o l o g y 1 4 8 ( 2 0 0 8 ) 7 4 8 – 7 6 0 751
2.2. Methods
Tower flux estimates of canopy–atmosphere CO2 gas
exchange, aggregated at half hour intervals, were obtained
by eddy-covariance method (Gamo et al., 2005). Three similar
closed-path eddy-covariance systems are installed at 45, 42,
and 18.4 m heights at Sakaerat, MaeKlong, and Bukit Soeharto
sites, respectively. The standard eddy flux system consists of a
3-axis sonic anemometer (Wind Master, Gill, T-540, Kaijo) and
a closed-path CO2/H2O analyzer (LI-6262, LI-COR) with a
sampling rate of 4 Hz at the Sakaerta and Bukit Soeharto sites
Table 1 – Description and location of the three tropical forest
MaeKIong WatershedResearch Station, Thailand
SaRes
Latitude/longitude 14834.570N 14829
98850.620E 10185
Elevation 160 m 535 m
Vegetation type Tropical seasonal broadleaf
deciduous forest (Shorea siamensis,
Vitex peduncularis, Xylia xylocarpa),
>30 years old
Trop
fores
Canopy height/Lai 20–30 m/2–3 35 m
Mean annual temperature
and rainfall
27.5 8C 26.2 81650 mm 1240
Soils Kandiustalfs, clay loam texture Shall
loam
and 10 Hz at MaeKlong site. All flux and meteorological
datasets were quality checked and outliers and measurements
made during rainy periods removed. Comparisons between
different instruments were also used to discard faulty data.
The gross canopy photosynthetic flux is calculated as
Pg ¼ �ðNe � RecoÞ (1)
where Pg is gross ecosystem production, Ne is net ecosystem
exchange of CO2 between the forest and the atmosphere (with
types analyzed
kaerat Environmentalearch Center, Thailand
Bukit Soeharto,East Kalimantan, Indonesia
.60N 0851.680S
5.320E 11782.680E
20 m
ical dry evergreen broadleaf
t (Hopea ferrea Pierre)
Regenerating tropical rainforest
(Macaranga gigantea) (since 1998)
/3.5–4 >10 m/3
C 28.0 8Cmm 2002 mm
ow Stony Ultisols, sandy
(acidic)
Typic Paleudults (US Soil Taxonomy)

a g r i c u l t u r a l a n d f o r e s t m e t e o r o l o g y 1 4 8 ( 2 0 0 8 ) 7 4 8 – 7 6 0752
fluxes to the atmosphere defined as positive) and Reco is
ecosystem respiration. Note that Eq. (1) defines Pg as a positive
number. Ne is calculated as the sum of CO2 eddy flux at the top
of the tower (Fc) and the rate of change in CO2 in the canopy air
space. Analysis of the relation between Ne and atmospheric
turbulence (as indicated by friction velocity, u*) suggested that
nighttime Ne likely underestimates the true biotic respiration
flux during periods of low turbulence (Goulden et al., 1996;
Saleska et al., 2003). We, therefore, excludedNe measurements
taken when u* fell below the threshold at which underestima-
tion became evident. Our analysis indicated u* thresholds of
0.4 (at Sakaerat), 0.2 (at MaeKlong), and 0.1 m s�1 (at Bukit
Soeharto).
Reco was calculated as the average of nighttime Ne over a 5-
day moving window. If the 5-day window was not sufficient,
after removal of data by u* filtering, to give at least 10 h of
nighttime data, we extended the length of the window (up to
31 days) until at least 10 h of valid nighttime data were
included.
We observed no significant correlation between hourly
nighttime Ne measurements and nighttime air temperature at
any of the 3 sites (probably because nighttime temperature
variation was small), so daytime Reco was assumed equal to
nighttime Reco. This approach is similar to that taken in the
Amazon (Saleska et al., 2003). Because of the temperature
sensitivity of Reco and warmer daytime temperature, this
assumption probably slightly underestimates daytime Reco
(and hence Pg), but it is unlikely to affect the seasonal patterns.
In order to avoid bias in monthly Pg which would likely
result from simply averaging valid hourly Pg data to monthly
levels (because of a fair-weather bias in valid data), we used an
unbiased look-up table approach to fill missing Pg data before
averaging. Missing Pg was modeled with a look-up-table (LUT)
filled with mean observed Pg as a function of both incident
photosynthetically active radiation (Ipar) (bin-width of
200 mmol m�2 s�1) and hour-of-day (2-h wide bins). The Pg
entries in the LUT were calculated from a moving window of
11 days (extended to longer periods, up to 31 days, if necessary
to include at least 16 h of valid daytime data). Hour-of-day bins
capture clear differences between morning and afternoon
light-use-efficiency, seen also in other tropical forests (e.g.,
Goulden et al., 2004; Hutyra et al., 2007), and the moving
window captures differences due to changes in soil moisture
or seasonal patterns. Gaps inside the LUT were filled using a
linear interpolation and the nearest neighbor method was
used when extrapolation was required. Finally, we averaged
the valid observed and filled hourly Pg values to generate
monthly values.
Volumetric soil moisture data were measured at 30 min
temporal resolution with Time Domain Reflectometry (TDR)
sensors at 10 cm soil depth. Ipar at the tower sites was
measured at 30 min resolution with quantum sensors. We
generated monthly values from daily averages of soil water
content and daytime averages of Ipar. Monthly rainfall data
was obtained from the Tropical Rainfall Measuring Mission
(TRMM 3B43-v6) satellite time series at 0.258 � 0.258 resolution
(NASA, 2007). Monthly means of hourly downward surface
solar radiation data at one degree spatial resolution, generated
from the Terra Clouds and the Earth’s Radiant Energy System
(CERES) and Geostationary Operational Environmental Satel-
lite 8 (GOES-8) instruments, was obtained from the Langley
Atmospheric Sciences Data Center (eosweb.larc.nasa.gov/
PRODOCS/ceres/table_ceres.php).
Satellite-derived phenology over the local tower sites and
Southeast Asia region was derived with 4 years (2001–2004) of
MODIS measures of ‘greenness’, using the MOD13A2
Enhanced Vegetation Index (EVI) at 1 km spatial resolution
and MOD13Q1 at 250 m resolution. The MODIS vegetation
index (VI) products are composited to 16-day intervals using
strict quality assurance (QA) criteria to remove residual cloud
and aerosol contamination. The 16-day composites were
aggregated to monthly time steps and only the good QA pixels
within a 3 � 3 pixel window were averaged for comparison
with the tower flux measurements. A 4-year average seasonal
profile was also computed for regional phenology analysis and
an image depicting per pixel peak month in annual EVI values
was derived (Fig. 1). The EVI is an optimized combination of
reflectances in the red and near-infrared (NIR) bands, based on
1st-order Beer’s law application of canopy radiative transfer,
that extends sensitivity in high biomass canopies and removes
greenness biases from differences in soil background,
EVI ¼ 2:5rN � rR
Lþ rN þ C1rR � C2rB; (2)
where EVI is the enhanced vegetation index, rN,R,B are reflec-
tances in the NIR, red, and blue bands, respectively; L is the
canopy background adjustment factor; and C1 and C2 are the
aerosol resistance weights. The coefficients of the MODIS EVI
equation are L = 1; C1 = 6 and C2 = 7.5 (Huete et al., 2002).
We also examined the seasonal vegetation patterns of the
tropical forest sites with the MODIS-derived fraction of
photosynthetically active radiation absorbed ( fpar, MOD15),
gross primary production (Pg, MOD17), and NDVI (MOD13Q1,
MOD13A2) products obtained from the Oak Ridge National
Laboratory (ORNL) MODIS subsets (http://www.daac.ornl.gov/).
The MODIS Pg product is based on a light-use efficiency model
that uses the MODIS fpar product, and large spatial scale
meteorological solar radiation, vapor pressure, and tempera-
ture from the NASA Data Assimilation Office as inputs. For each
product, we used the average of good QA pixels within a
3 km� 3 km window centered at the flux tower and generated
an average seasonal profile from the 4 years of data.
3. Results
3.1. MaeKlong drought-deciduous tropical dry forest
Seasonal and inter-annual trends in tower flux Pg and satellite
EVI greenness measurements were strongly synchronized
with each other across the 4 years at the MaeKlong drought-
deciduous tropical forest site (Fig. 2). There is a distinct
phenology in this mixed drought-deciduous, water-limited
ecosystem with leaf flushing of new leaves commencing with
the onset of the rainy season in May, followed by peak activity
in the middle of the wet season (June–August), and decreasing
vegetation activity (photosynthesis and greenness) through
the second half of the wet season (September–November).
There is a rapid loss of leaves in 2 months into the dry season

Fig. 2 – Inter-annual and seasonal variations in satellite EVI and tower Pg at MaeKlong Watershed Research Station, Thailand
(A) with TRMM-derived precipitation and surface solar radiation measurements (B).
a g r i c u l t u r a l a n d f o r e s t m e t e o r o l o g y 1 4 8 ( 2 0 0 8 ) 7 4 8 – 7 6 0 753
(January–February), resulting in the lowest tower Pg and
satellite EVI values in the late dry season (February–April).
There was still significant activity in the dry season due to the
evergreen species present in this mixed deciduous canopy.
The satellite measure of greenness (EVI) yielded the best
overall relationship (R2 = 0.88) with seasonal tower Pg mea-
surements, compared with other MODIS-derived products of
Pg, fpar, and NDVI (Table 2). The fpar product showed very little
seasonality while the MODIS Pg product exhibited a seasonal
pattern that was partly out of phase with the tower flux
measures of Pg (Fig. 3). Satellite EVI and tower flux Pg both
showed peak vegetation activity in July. MODIS NDVI was also
well correlated with seasonal tower Pg (Table 2).
3.2. Sakaerat evergreen tropical dry forest
Seasonal and inter-annual satellite greenness and tower flux
Pg measurements were also consistent with each other at the
Sakaerat evergreen tropical dry forest site (Fig. 4). As in the
MaeKlong drought-deciduous site, these two measures were
synchronized with the monsoon rainy period with the lowest
values in the late dry season, peak activity in the middle of the
wet season, and browning commencing a few months before
the rainy season ends. The Sakaerat evergreen site exhibited a
Table 2 – Coefficient of determination (R2, linear model), slopemeasurements and MODIS indices, volumetric soil moisture ((W mS2)
MaeKlong tower Pg Sakaerat tower P
R2 a b R2 a b
MODIS EVI 0.88 7481 �1681 0.76 10949 �37
MODIS Pg 0.07 �0.55 3453 0.18 �0.84 41
MODIS fpar 0.01 �2052 4037 0.04 12447 �85
MODIS NDVI 0.53 11300 �7018 0.17 13467 �90
Soil moisture 0.83 10412 �1301 0.32 18133 1
Solar radiation 0.81 �5.01 5567 0.48 �7.51 76
EVI � Ipar 0.11 11.75 �80.1 0.37 13.52 �9
weaker seasonality and showed more inter-annual variability,
particularly in the late dry season, relative to the MaeKlong
site.
MODIS-derived Pg, fpar, and NDVI products yielded either
very little seasonality or showed seasonal profiles not as well
synchronized with tower Pg as the EVI (Table 2; Fig. 5). The
strength of the relationship between the independent satellite
EVI and tower Pg data remained strong, although somewhat
weaker (R2 = 0.76) than at the more deciduous MaeKlong site,
and both satellite and tower flux values peaked in August, in
contrast to the MaeKlong month of peak activity in July.
Cross-site plots of tower Pg and satellite EVI revealed
differences in seasonality at these two tropical dry forest sites,
located in fairly similar climate conditions (Fig. 6). The
seasonal synchrony across the two sites was generally
correlated (R2 = 0.47 for Pg and R2 = 0.40 for EVI), but with
slopes that deviated significantly from the 1:1 line, demon-
strating the lower seasonality at the Sakaerat evergreen site
relative to the MaeKlong drought-deciduous site. During the
dry season period in which the lowest Pg and EVI values occur,
the Sakaerat evergreen site was more productive than the
MaeKlong deciduous site, while during the wet season the
MaeKlong deciduous site was the more productive, showing
the highest Pg and EVI values. Since the peak EVI and Pg values
(a), and intercept (b) between seasonal local tower site Pg
cm3/cm3), surface solar radiation (W mS2), and EVI T Ipar
g Bukit Soeharto tower Pg Combined (3 site) tower Pg
R2 a b R2 a b
27 0.46 7123 �1327 0.74 8282 �2118
12 0.03 �0.22 3197 0.00 �0.09 2594
50 0.16 �3985 5916 0.05 �4405 6161
50 0.00 419 2323 0.01 736 1794
75 0.19 �3723 3745 0.08 1544 1991
65 0.00 �0.38 2832 0.55 �4.91 5664
74.6 0.03 3.43 1962 0.03 3.02 1756

Fig. 3 – Four year averaged seasonal variations in MODIS-
derived Pg, fpar, and EVI products with averaged tower Pg at
MaeKlong Watershed Research Station, Thailand.
Fig. 5 – Four year averaged seasonal variations in MODIS-
derived Pg, fpar, and EVI products with averaged tower Pg at
Sakaerat Environmental Research Center, Thailand.
a g r i c u l t u r a l a n d f o r e s t m e t e o r o l o g y 1 4 8 ( 2 0 0 8 ) 7 4 8 – 7 6 0754
between the 2 sites were 1 month apart, we also included a 1-
month lagged correlation plot (Fig. 6). The 1-month lagged
relationship in the cross-site tower Pg measurements was
improved (R2 from 0.46 to 0.58), however, there was no change
in the satellite EVI relationship. In both datasets the slope of
the relationships did not significantly change.
3.3. Bukit Soeharto humid evergreen tropical forest
Temporal variations in tower Pg and satellite EVI at the Bukit
Soeharto humid evergreen rainforest site, showed weak to
moderate seasonal differences in greenness and productiv-
ity (Fig. 7). This was a particularly difficult site to obtain
good quality satellite data due to a lower seasonality and
heavy cloud cover conditions. Both inter-annual and annual
averaged EVI and tower Pg profiles were generally consistent
with both measures revealing peak activity during the dry
season months (June–August) (Fig. 8). The relationships of
tower Pg with MODIS vegetation products were much
weaker, with the EVI yielding the best overall relationship
(R2 = 0.46). The seasonal amplitudes in tower Pg and satellite
EVI appear to be increasing from 2001 through 2004,
suggesting a dynamic and developing secondary forest
canopy.
Fig. 4 – Inter-annual and seasonal variations in satellite EVI and
Thailand (A) with TRMM-derived precipitation and surface sola
When the 3 tropical forest sites were combined into a single
plot, the cross-site tower Pg–satellite EVI relationship
accounted for nearly 74% of the variance (R2 = 0.74) (Fig. 9).
The local site relationships were not significantly different
from the mean, cross-site relationship, however, the ever-
green dry forest (driest site) had a slightly steeper slope, while
the MaeKlong site had a slope relationship nearly the same as
that of the cross-site relationship.
3.4. Environmental controls on productivity
The tower Pg measures of vegetation productivity and
satellite EVI were positively correlated with soil water status
at the MaeKlong and Sakaerat tropical dry forest sites (Fig. 10).
The drought-avoiding and more water conserving Sakaerat
evergreen forest site had the steepest Pg–soil moisture
relationship (Fig. 10). This site, with its coarse textured soil,
also had distinctly lower soil moisture levels than the other
two sites. The Bukit Soeharto site had the most decoupled Pg
relationship with soil moisture content, with a slight negative
slope. Tower Pg and satellite EVI relationships with soil
moisture were generally consistent with each other at each
site, including the negative relationship at the Bukit Soeharto
site (Fig. 10).
tower Pg at Sakaerat Environmental Research Center,
r radiation measurements (B).

Fig. 6 – Cross-site comparisons of (A) tower Pg and (B)
satellite EVI seasonality between two tropical dry forest
type sites, MaeKlong drought-deciduous forest and
Sakaerat evergreen forest for 1 month lag and no lag cases.
Fig. 8 – Four year averaged seasonal variations in MODIS-
derived Pg, fpar, and EVI products with averaged tower Pg at
Bukit Soeharto Station, Indonesia.
a g r i c u l t u r a l a n d f o r e s t m e t e o r o l o g y 1 4 8 ( 2 0 0 8 ) 7 4 8 – 7 6 0 755
Seasonal tower Pg fluxes yielded negative relationships
with seasonal patterns of surface solar radiation (Table 2).
The drought-deciduous MaeKlong site had the strongest
negative relationship (R2 = 0.81), as higher periods of surface
solar radiation occurred in the dry season when Pg was
lower, and lower solar radiation occurred in the more cloudy
wet season when Pg values were at their highest. The
Sakaerat site had a moderately negative relationship with
Fig. 7 – Inter-annual and seasonal variations in satellite EVI and
TRMM-derived precipitation and surface solar radiation measu
solar radiation and there was no relationship at the Bukit
Soeharto site.
In many ecosystem light-use efficiency (LUE) models, the
satellite-derived vegetation index is normally used as a
canopy state variable of photosynthesis potential or capacity,
according to,
Pg ¼ e fparIpar (3)
fpar ¼ aVI þ b (4)
where e is the LUE, fpar is the fraction of Ipar absorbed by the
canopy, and VI is the vegetation index (normally NDVI), which
is generally considered to be linear (slope a and intercept b)
with fpar (Ruimy et al., 1999; Sims et al., 2006; Jenkins et al.,
2007). Whereas, the NDVI has been shown linearly related with
canopy fpar, Xiao et al. (2004) distinguished between the photo-
synthetically active and non-photosynthetically active com-
ponents of canopy absorbed radiation and reported the EVI to
be more closely related to the chlorophyll component of fpar.
We analyzed whether the inclusion of Ipar data, as EVI � Ipar,
could improve upon the direct relationship of Pg with EVI,
tower Pg at Bukit Soeharto Station, Indonesia (A) with
rements (B).

Fig. 9 – Combined multiple site annual averaged
relationships between tower Pg and satellite EVI. The
shaded lines refer to equivalent relationships encountered
in the Amazon (rainforest + pasture) and Harvard Forest
(temperate forest) sites.
a g r i c u l t u r a l a n d f o r e s t m e t e o r o l o g y 1 4 8 ( 2 0 0 8 ) 7 4 8 – 7 6 0756
however, no site specific nor cross-site improvements were
found (Table 2).
3.5. Phenoregion analyses for regional extension
A phenoregion perspective of seasonal vegetation dynamics
was depicted by the month of annual peak in EVI greenness
activity for each 1 km2 pixel (Fig. 1). The two Thailand tropical
dry forest tower sites are located in upland mountain areas
with greenness peaks in the middle of the rainy wet season,
in July and August. These sites are surrounded by highly
heterogeneous phenology patterns with large differences in
greenness seasonality, related to topography, climate, land
use, soils, and vegetation type. Whereas the 2 tower sites are
located at elevations of 160 and 535 m, the surrounding higher
elevation sites (>1000 m) experience peak greenness activity
in the late dry season and early wet season (May), i.e., the
‘green’ colors near Sakaerat and MaeKlong sites and eastern
Myanmar. This suggests that higher elevation, montane
Fig. 10 – Tower Pg (A) and MODIS EVI (B) relationships with
volumetric soil moisture contents (cm3/cm3) at 10 cm
depth across the three tropical forest sites;
MKL = MaeKlong; SKR = Sakaerat; and BKS = Bukit
Soeharto.
tropical forests may be light-limited, as in the forests of
northern Thailand that were found with transpiration peaks in
the late dry season (Tanaka et al., 2003, 2004).
The drier northeast region of Thailand, which is mostly
cultivated with remnants of deciduous forest, shows peak
satellite greenness activity at the end of the rainy season and
start of the dry season (November–December). Once soil
moisture levels deplete, this area rapidly dries out. The central
region that follows the Chao Praya River is dominated by
irrigated crops and riparian vegetation that is not moisture
stressed and with peak greenness activity in February, the
middle of the dry season. The large heterogeneity within each
subregion may be depicting a variety of land use activities and
human impacted areas, as well as forests at various stages of
regeneration.
By contrast the equatorial region shows a distinctly
different pattern of satellite phenology activity, dominated
by ‘blue’ colors, indicative of peak activity in February and
March, the middle of the wet season at this latitude (Figs. 1 and
7). The region-wide predominant phenology observed, syn-
chronous with the rainy season, suggests that most of this
area becomes water-limited during the short dry season. Thus,
extensive forest disturbance and degradation, through fire and
logging activities, have resulted in most of this region,
including Kalimantan, being transformed to a water-limited
system, despite its abundant rainfall. There are many
distinctive ‘yellow’ areas of peak greenness activity that occur
in the dry season (July), including the protected Bukit Soeharto
site. The mountainous region between Malaysia and Kali-
mantan also has some protected areas with intact forests,
which show peak greenness activity at the end of the dry
season and beginning of the wet season (October–November,
‘purple colors’), suggesting that this remote region may also
exhibit light limitations.
To depict seasonal Pg variations over the tropical Monsoon
Asia region, we applied the general relationship of tower Pg
with satellite EVI, as in Fig. 9, over a wet and dry season period
(Fig. 11). The uncertainty in predicting Pg from only satellite EVI
data is approximately 300 kg C ha�1 mo�1 based on the range
of seasonal Pg values encountered across the 3 sites of this
study. In the January–March period, it is the dry season in the
northern portion of the region (Lat. 10 to 208N) and wet season
in the southern portion (Lat. 5 N to 58S). In the northern part,
the forested areas have Pg values of 2000 kg C ha�1 mo�1, while
the deforested northeast plateau of Thailand and other
cultivated areas of the region have Pg values from 0 to
1000 kg C ha�1 mo�1 (Fig. 11a). In contrast, the southern region
has higher Pg values ranging from 2000 to 3500 kg C ha�1 mo�1.
In the June to August period, it is the wet season in the
northern region and dry season to the south (Fig. 11b). The
region-wide shift to higher Pg values in the north is readily
apparent. The southern region maintains high Pg values in
both wet and dry periods, with slightly lower values occurring
in the dry season. This does not match the results from the
tower site and satellite data within the protected Bukit
Soeharto area, in which higher Pg and EVI were encountered
in the dry season period. As in the northern tower sites, such
protected areas do not adequately represent the range of land
surface conditions of Southeast Asia, particularly the exten-
sive areas of disturbed, degraded, and unprotected forests.

Fig. 11 – Region-wide satellite EVI-derived Pg using general site tower relationship for January to March (JFM) and June to
August (JJA) periods.
a g r i c u l t u r a l a n d f o r e s t m e t e o r o l o g y 1 4 8 ( 2 0 0 8 ) 7 4 8 – 7 6 0 757
4. Discussion and conclusions
In this study, we found significant phenologic variability
across three different tropical forest types, encompassing
evergreen and deciduous canopies over varying climate, soil,
and disturbance conditions. Distinct tropical forest responses
to seasonal drought periods were observed across all forest
types, including drought-avoiding (MaeKlong dry deciduous
site), drought-tolerant (Sakaerat dry evergreen site), and
enhanced productivity (Bukit Soeharto humid evergreen site)
responses. Independent satellite EVI greenness measurements
were generally consistent with the seasonal and inter-annual
patterns observed in the in situ tower Pg measurements.
Seasonal tower Pg and satellite greenness measurements in
the dry evergreen (Sakaerat) and drought-deciduous (MaeK-
long) forests showed photosynthetic activity tightly coupled
with soil water availability and precipitation seasonality. Both
satellite greenness and tower Pg fluxes showed the dry
evergreen tropical forest to have less pronounced seasonality,
higher productivity in the dry season, and lower productivity
in the wet season, relative to the more drought-deciduous
forest site. As noted by Sobrado (1993), the shorter lived leaves
of the drought-avoiding deciduous species were capable of
high carbon gain during the short, wet season in nutrient-rich
soils, while the long-lived leaves of the drought-tolerant
evergreen species were capable of low carbon gain and
conservative water-use over both the wet and dry seasons
in nutrient-poor soils.
The more humid evergreen rainforest site in Indonesia
(Bukit Soeharto), showed the weakest tower Pg–MODIS EVI
relationship (R2 = 0.46), with tower Pg and satellite greenness
temporal patterns that were largely decoupled from seasonal
variations in moisture. The protected Bukit Soeharto humid
evergreen rainforest site was more productive in the middle of
the dry season than in the wet season, despite being a
relatively young, regenerating forest that was completely
burned in the 1997–1998 El Nino event. This suggests some
degree of drought-tolerance and light-limitations in these
young forests and that the more mature and deep-rooted
rainforests of this region would be more drought-tolerant and
light-limited. However, as seen in the satellite-derived
regional Pg estimates (Fig. 11), most of the island of Borneo
appeared moisture-limited rather than light-limited as found
in the protected Bukit Soeharto site. Large scale and frequent
fires and forest degradation have dramatically altered the
productivity and phenology controls of the mostly secondary
forests of Borneo and rendered these areas vulnerable to
moisture limitations, primarily in the shallow-rooted, under-
storey herbaceous vegetation layer, and also in the trees
themselves, depending on their age class and stage of root
development (Curran et al., 2004).
The satellite EVI greenness measure behaved linearly with
tower Pg across the multiple Monsoon Asia tower sites and
range of ecosystems studied here. The tower Pg relationships
with MODIS EVI were also generally consistent with the
relationships found in the Amazon rainforest and temperate
forests (shown in Fig. 9 with shaded lines), with tower
Pg = 6418EVI � 800(R2 = 0.54) at two Amazon tower sites (km
67, primary forest and km 77, pasture-agriculture site) and
tower Pg = 8488EVI � 2223(R2 = 0.79) at the Harvard Forest
temperate site, with units kg C ha�1 mo�1 (Sims et al., 2006;
Rahman et al., 2005; Huete et al., 2006).
Despite the general consistencies encountered, there were
significant differences in the slopes of the tower Pg with
satellite EVI relationships. Rahman et al. (2005) and Sims et al.
(2006) further noted that MODIS EVI was less strongly
correlated with tower Pg over evergreen sites in North America
that displayed less seasonality than their deciduous ecosys-

a g r i c u l t u r a l a n d f o r e s t m e t e o r o l o g y 1 4 8 ( 2 0 0 8 ) 7 4 8 – 7 6 0758
tem counterparts that often go dormant in their cold winter
seasons. Our results similarly showed weaker tower Pg and
satellite greenness relationships with the more evergreen
canopies, however, the relationships encountered were quite
strong, given the lack of a cold or dormant season in the
tropical forests studied here.
Satellite greenness observations and tower flux measure-
ments represent important site-specific and landscape-level
responses to environmental variation and change. The eddy
flux measures are limited in spatial extent, but collect data at
high temporal resolution, while satellite measurements are
extensive and integrate numerous spatial heterogeneities in
vegetation types, soil, topography, and disturbance condition,
however, they are constrained temporally, primarily due to
clouds. In this study, we found seasonal consistencies
between independent satellite EVI and in situ tower Pg
relationships at all sites, as well as in their respective
relationships to environmental controls, such as soil moisture
and solar radiation (Figs. 2, 4, 7 and 10). These consistencies
lend confidence to both datasets and offer opportunities for
more extensive regional scaling of tower fluxes with satellite
data. However, there remain many challenges on how best to
integrate spatially extensive satellite data with local tower
measures from multiple sites for regional scaling, modeling,
and prediction of vegetation growth in response to climate
variability across Monsoon Asia.
High temporal frequency, moderate resolution satellite
data, such as MODIS, are critical to achieve greater sensitivity
to phenological variations, however, such data may be too
coarse, spatially, to adequately define the highly heterogenous
landscapes in Monsoon Asia, associated with disturbance,
land-use classes, and forest fragmentation patterns (Fig. 1).
Furthermore, as in this study, cloud cover greatly restricted
the availability of good quality satellite data to monthly
resolutions in the more humid tropical areas.
Further work is also needed on how best to integrate
satellite data into ecosystem production efficiency models
(Eqs. (3) and (4)). There were difficulties in coupling tower flux
measurements with the MODIS Pg product due to the
additional uncertainties associated with coarser and less
accurate satellite meteorological variables and MODIS fpar,
which exhibited very little seasonality at all three sites. Our
attempt to improve upon the satellite EVI and tower Pg
relationship through the use Ipar was also unsuccessful. As
suggested by Xiao et al. (2004, 2005), there is a need to better
separate Ipar absorbed by a canopy into the photosynthetically
active (chlorophyll) and non-active (senesced vegetation,
woody material, etc.) components. Jenkins et al. (2007)
observed a linear relationship between NDVI and fpar during
greening and a non-linear relationship during seasonal drying
periods, a hysteresis effect that may complicate the remote
sensing use of ecosystem production efficiency models.
As a result of the more complex environments (topography,
soils, land use) in Monsoon Asia tropical forests, relative to the
Amazon, our results are not entirely conclusive as to whether
neotropical and Monsoon Asia tropical ecosystems respond
similarly to light and rainfall controls. Moisture limitations on
the productivity of tropical dry forests in Thailand are
consistent with other studies in the southern, transitional
forests of the Amazon (e.g., Vourlitis et al., 2001) and in the
tropical dry forests of Mexico and Central America (e.g., Reich
and Borchert, 1984). We found some indication of light
limitations at the Indonesia humid evergreen secondary
forest tower site, with peak tower Pg and EVI values in the
dry season. As revealed by regional satellite phenology data
and satellite-derived Pg images, this protected site is sur-
rounded by degraded coastal lowland secondary forests
exhibiting moisture-limiting phenologies (Figs. 1 and 11).
The three tower sites analyzed here were largely confined to
three forest types located in protected areas, and thus
represent a very restrictive range of land surface conditions
found in this region. Eddy flux tower comparisons with
satellite data are needed over a greater range of land surface
conditions, particularly areas of disturbed, degraded, and
unprotected forests, for more effective coupling of satellite
and tower data for regional scaling studies of ecosystem
function and carbon and water cycling.
Acknowledgements
We greatly thank the Oak Ridge National Laboratory Dis-
tributed Active Archive Center (ORNL DAAC) for the avail-
ability of MODIS subsetted land products, Collection 5, for all
three flux tower sites [http://www.daac.ornl.gov/MODIS/mod-
is.html]. This study was supported by NASA MODIS contract
NNG04HZ20C.
r e f e r e n c e s
Achard, F., Estreguil, C., 1995. Forest classification of southeastAsia using NOAA AVHRR data. Remote Sensing ofEnvironment 54 (3), 198–208.
Achard, F., Eva, H.D., Stibig, H.-J, Mayaux, P., Gallego, J.,Richards, T., Malingreau, J.-P., 2002. Determination ofdeforestation rates of the world’s humid tropical forests.Science 297 (0036–8075), 999–1002.
Asner, G.P., Nepstad, D., Cardinot, G., Ray, D., 2004. Droughtstress and carbon uptake in an Amazon forest measuredwith spaceborne imaging spectroscopy. Proceedings of theNational Academy of Science 101 (16), 6039–6044.
Canadell, J., Jackson, R.B., Ehleringer, J.B., Mooney, H.A., Sala,O.E., Schulze, E.-D., 1996. Maximum rooting depth ofvegetation types at the global scale. Oecologia 108 (4),583–595.
Carswell, F.E., Costa, A.L., Palheta, M., Mahli, Y., Meir, P., Costa,J. de P.R., Ruivo, M. de L., Leal, L.do S.M., Costa, J.M.N.,Clement, R.J., Grace, J., 2002. Seasonality in CO2 and H2O fluxat an eastern Amazonian rain forest. Journal of GeophysicalResearch 107 (D 20), 8076.
Cihlar, J., Hung, L., Zhanqing, L., Jing, C., Pokrant, H., Fengting,H., 1997. Multitemporal, multichannel AVHRR data sets forland biosphere studies—artifacts and corrections. RemoteSensing of Environment 60 (1), 35–57.
Curran, L.M., Trigg, S.N., McDonald, A.K., Astiani, D., Hardiono,Y.M., Siregar, P., Caniago, I., Kasischke, E., 2004. Lowlandforest loss in protected areas of Indonesian Borneo. Science303 (5660), 1000–1003, doi:10.1126/science.1091714.
da Rocha, H.R., Goulden, M.L., Miller, S.D., Menton, M.C., Pinto,L.D.V.O., de Freitas, H.C., Figueira, A.M.S., 2004. Seasonalityof water and heat fluxes over a tropical forest in easternAmazonia. Ecological Applications 14 (4), S22–S32.

a g r i c u l t u r a l a n d f o r e s t m e t e o r o l o g y 1 4 8 ( 2 0 0 8 ) 7 4 8 – 7 6 0 759
Defries, R.S., Field, C.B., Fung, I., Justice, C.O., Los, S., Matson,P.A., Matthews, E., Mooney, H.A., Potter, C.S., Prentice, K.,Sellers, P.J., Townshend, J.R.G., Tucker, C.J., Ustin, S.L.,Vitousek, P.M., 1995. Mapping the land surface for globalatmosphere-biosphere models—toward continuousdistributions of vegetations functional properties. Journalof Geophysical Research-Atmospheres 100 (D 10), 20867–20882.
Eva, H.D., Belward, A.S., de Miranda, E.E., Bella, C.M.D., Gond, V.,Huber, O., Jones, S., Sgrenzaroli, M., Fritz, S., 2004. A landcover map of South America. Global Change Biology 10,731–744.
Gamo, M., Panuthai, S., Maeda, T., Toma, T., Ishida, A., Hayashi,M., Warsudi, Dianna, R., Diloksumpun, S., Phanumard, L.,Staporn, D., Ishizuka, M., Saigusa, N., Kondo, H., 2005.Carbon flux observation in the tropical seasonal forests andtropical rain forest. In: Proceedings of the InternationalWorkshop on Advanced Flux Network and Flux Evaluation(AsiaFlux Workshop 2005), Fujiyoshida, Japan, p. 86.
Frankie, G.W., Baker, H.G., Opler, P.A., 1974. Comparativephenological studies of trees in tropical wet and dry forestsin the lowlands of Costa Rica. The Journal of Ecology 62 (3),881–919.
Goulden, M.L., Munger, J.W., Fan, S.-M., Daube, B.C., Wofsy, S.C.,1996. Measurements of carbon sequestration by long-termeddy covariance: methods and a critical evaluation ofaccuracy. Global Change Biology 2, 169–182.
Goulden, M.L., Miller, S.D., da Rocha, H.R., Menton, M.C., deFreitas, H.C., Figueira, A.M.S., Sousa, C.A.D.de., 2004. Dieland seasonal patterns of tropical forest CO2 exchange.Ecological Applications 14, S42–S54.
Goward, S.N., Markham, B., Dye, D.G., Dulaney, W., Yang, J., 1991.Normalized difference vegetation index measurements fromthe advanced very high resolution radiometer. RemoteSensing of Environment 35 (2–3), 257–277.
Huete, A., Didan, K., Miura, T., Rodriguez, E.P., Gao, X., Ferreira,L.G., 2002. Overview of the radiometric and biophysicalperformance of the MODIS vegetation indices. RemoteSensing of Environment 83 (1–2), 195.
Huete, A.R., K.D., Shimabukuro, Y.E., Ratana, P., Saleska, S.R.,Hutyra, L.R., Yang, W., Nemani, R.R., Myneni, R., 2006.Amazon rainforests green-up with sunlight in dry season.Geophysical Research Letters, 33(L06405): doi:10.1029/2005GL025583.
Huete, A.R., Kim, Y., Ratana, P., Didan, K., Shimabukuro, Y.E.,Miura, T., 2008. Assessment of phenologic variability inAmazon tropical rainforests using hyperspectral Hyperionand MODIS satellite data. In: Kalacska, M., Sanchez-Azofeifa, A.G. (Eds.), Hyperspectral Remote Sensing ofTropical and Sub-Tropical Forests. Taylor & Francis Group,LLC, CRC Press, 352 pp.
Hutyra, L.R., Munger, J.W., Saleska, S.R., Gottlieb, E., Daube, B.C.,Dunn, A.L., Amaral, D.F., de Camargo, P.B., Wofsy, S.C.,2007. Seasonal controls on the exchange of carbon andwater in an Amazonian rain forest. Journal of GeophysicalResearch, Biogeosciences 112 (G3) Art. No. G03008.
Ishida, A., Diloksumpun, S., Ladpala, P., Staporn, D., Panuthai,S., Gamo, M., Yazaki, K., Ishizuka, M., Puangchit, L., 2006.Contrasting seasonal leaf habits of canopy trees betweentropical dry-deciduous and evergreen forests in Thailand.Tree Physiology 26 (5), 643–656.
Jenkins, J.P., Richardson, A.D., Braswell, B.H., Ollinger, S.V.,Hollinger, D.Y., Smith, M.-L., 2007. Refining light-useefficiency calculations for a deciduous forest canopy usingsimultaneous tower-based carbon flux and radiometricmeasurements. Agricultural and Forest Meteorology 143(1–2), 64–79.
Justice, C., Hall, D., Salomonson, V.V., Privette, J., Riggs, G.,Strahler, A., Lucht, W., Myneni, R., Knjazihhin, Y., Running,
S., Nemani, R., Vermote, E., Townshend, J., Defries, R., Roy,D., Wan, Z., Huete, A., van Leeuwen, W., Wolfe, R., Giglio, L.,Muller, J.-P., Lewis, P., Barnsley, M., 1998. The ModerateResolution Imaging Spectroradiometer (MODIS): Landremote sensing for global change research. IEEETransactions on Geoscience and Remote Sensing 36,1228–1249.
Justice, C.O., Townshend, J.R.G., Holben, B.N., Tucker, C.J., 1985.Analysis of the phenology of global vegetation usingmeteorological satellite data. International Journal ofRemote Sensing 6 (8), 1271–1318.
Kalacska, M.E.R., Sanchez-Azofeifa, G.A., Calvo-Alvarado, J.C.,Rivard, B., Quesada, M., 2005. Effects of season andsuccessional stage on leaf area index and spectralvegetation indices in three Mesoamerican tropical dryforests. Biotropica 37 (4), 486–496.
Keller, M., Alencar, A., Asner, G.P., Braswell, B., Bustamante, M.,Davidson, E., Feldpausch, T., Fernandes, E., Goulden, M.,Kabat, P., Kruijt, B., Luizao, F., Miller, S., Markewitz, D.,Nobre, A.D., Nobre, C.A., Filho, N.P., da Rocha, H., Dias, P.S.,von Randow, C., Vourlitis, G.L., 2004. Ecological research inthe large-scale biosphere-atmosphere experiment inAmazonia: early results. Ecological Applications 14 (4),S3–S16.
Kobayashi, H., Dye, D.G., 2005. Atmospheric conditions formonitoring the long-term vegetation dynamics in theAmazon using normalized difference vegetation index.Remote Sensing of Environment 97 (4), 519–525.
Kushwaha, C.P., Singh, K.P., 2005. Diversity of leaf phenology ina tropical deciduous forest in India. Journal of TropicalEcology 21 (1), 47–56.
Lean, J., Rowntree, P.R., 1993. A GCM simulation of the impact ofAmazonian deforestation on climate using an improvedcanopy representation. Quarterly Journal of the RoyalMeteorological Society 119 (511), 509–530.
Mahli, Y., Nobre, A.D., Grace, J., Kruijt, B., Pereira, M.G.P., Culf,A., Scott, S., 1998. Carbon dioxide transfer over a CentralAmazonian rain forest. Journal of Geophysical Research 103(D24), 31,593–31,612.
Mayaux, P., Lambin, E.F., 1997. Tropical forest area measuredfrom global land-cover classifications: inverse calibrationmodels based on spatial textures. Remote Sensing ofEnvironment 59 (1), 29–43.
Myneni, R.B., Yang, W., Nemani, R.R., Huete, A.R., Dickinson, R.E.,Knyazikhin, Y., Didan, K., Fu, R., N.J., R.I., Saatchi, S.S.,Hashimoto, H., Ichii, K., Shabanov, N.V., Tan, B., Ratana, P.,Privette, J.L., Morisette, J.T., Vermote, E.F., Roy, D.P., Wolfe,R.E., Friedl, M.A., Running, S.W., Votava, P., El-Saleous, N.,Devadiga, S., Su, Y., Salomonson, V.V., 2007. Large seasonalswings in leaf area of Amazon rainforests. Proceedings of theNational Academy of Science, U.S.A, 20(104(12)): 4820–4823.
NASA, 2007. 3B43: Monthly 0.258 � 0.258 TRMM and othersources rainfall, http://disc.sci.gsfc.nasa.gov/services/opendap/trmm.shtml, NASA Distrib. Active Arch. Cent.,Goddard Space Flight Cent. Earth Sci., Greenbelt, Md.
Nemani, R.R., Keeling, C.D., Hashimoto, H., Jolly, W.M., Piper,S.C., Tucker, C.J., Myneni, R., Running, S.W., 2003. Climate-driven increases in global terrestrial net primary productionfrom 1992 to 1999. Science 300, 1560–1563.
Nepstad, D.C., Carvalho, C.R., Davidson, E.A., Jipp, P.H.,Lefebvre, P.A., Negreiros, G.H., Silva, E.D., Stone, T.A.,Trumbore, S.E., Vieira, S., 1994. The role of deep roots in thehydrological and carbon cycles of Amazonian forests andpastures. Nature 372, 666–669.
Page, S.E., Siegert, F., Rieley, J.O., Boehm, H.D., Jaya, A., Limin, S.,2002. The amount of carbon released from peat and forestfires in Indonesia during 1997. Nature 420 (6911), 29–30.
Pitman, J.I., 1996. Ecophysiology of tropical dry evergreen forest,Thailand: measured and modelled stomatal conductance of

a g r i c u l t u r a l a n d f o r e s t m e t e o r o l o g y 1 4 8 ( 2 0 0 8 ) 7 4 8 – 7 6 0760
Hopea ferrea, a dominant canopy emergent. Journal ofApplied Ecology 33, 1366–1378.
Prior, L.D., Bowman, D.M.J.S., Eamus, D., 2004. Seasonaldifferences in leaf attributes in Australian tropical treespecies: family and habitat comparisons. FunctionalEcology 18 (5), 707–718.
Rahman, A.F., Sims, D.A., Cordova, V.D., El-Masri, B.Z., 2005.Potential of MODIS EVI and surface temperature for directlyestimating per-pixel ecosystem C fluxes. GeophysicalResearch Letters 32 (L19404), doi:10.1029/2005GL024127.
Reich, P.B., Borchert, R., 1984. Water stress and tree phenologyin a tropical dry forest in the lowlands of Costa Rica. Journalof Ecology 72, 61–74.
Reich, P.B., Uhl, C., Walters, M.B., Prugh, L., Ellsworth, D.S., 2004.Leaf demography and phenology in Amazonian rain forest:A census of 40,000 leaves of 23 tree species. EcologicalMonographs 74 (1), 3–23.
Roberts, D.A., Nelson, B.W., Adams, J.B., Palmer, F., 1998.Spectral changes with leaf aging in Amazon caatinga.Trees-Structure and Function 12, 315–325.
Ruimy, A., Kergoat, L., Bondeau, A., Intercomparison,T.P.O.F.T.P.N.M., 1999. Comparing global models ofterrestrial net primary productivity (NPP): analysis ofdifferences in light absorption and light-use efficiency.Global Change Biology 5, 56–64.
Rundel, P.W., Boonpragob, K., 1995. Dry forest ecosystems ofThailand. In: Bullock, S.H., Mooney, H.A., Medina, E.(Eds.), Seasonally Dry Tropical Forests. CambridgeUniversity Press, Cambridge, pp. 93–123.
Running, S.W., Justice, C., Salomonson, V.V., Hall, D., Barker, J.,Kaufman, Y., Strahler, A., Huete, A., Muller, J.P., Vanderbilt,V., Wan, Z.M., Teillet, P., Carneggie, D., 1994. Terrestrialremote sensing science and algorithms planned for EOS/MODIS. International Journal of Remote Sensing 15,3587–3620.
Sader, S.A., Waide, R.B., Lawrence, W.T., Joyce, A.T., 1989.Tropical forest biomass and successional age classrelationships to a vegetation index derived from LandsatTM data. Remote Sensing of Environment 28, 143–156.
Saleska, S.R., Didan, K., Huete, A.R., da Rocha, H.R., 2007.Amazon forests green-up during 2005 drought. Science318, 612.
Saleska, S.R., Miller, S.D., Matross, D.M., Goulden, M.L., Wofsy,S.C., da Rocha, H.R., de Camargo, P.B., Crill, P., Daube, B.C.,de Freitas, H.C., Hutyra, L., Keller, M., Kirchhoff, V., Menton,M., Munger, J.W., Pyle, E.H., Rice, A.H., Silva, H., 2003.Carbon in Amazon forests: unexpected seasonal fluxes anddisturbance-induced losses. Science 302, 1554–1557.
Schurr, U., Walter, A., Rascher, U., 2006. Functional dynamics ofplant growth and photosynthesis - from steady-state todynamics - from homogeneity to heterogeneity. Plant, Cell& Environment 29, 340–352.
Meeson, B.W., Hall, F.G., Asrar, G., Murphy, R.E., Schiffer, R.A.,Bretherton, F.P., Dickinson, R.E., Ellingson, R.G., Field, C.B.,Huemmrich, K.F., Justice, C.O., Melack, J.M., Roulet, N.T.,Schimel, D.S., Try, P.D., Sellers, P.J., 1995. Remote sensing ofthe land surface for studies of global change: models–algorithms–experiments. Remote Sensing of Environment51 (1), 3–26.
Shuttleworth, W.J., 1988. Evaporation from AmazonianRainforest. Proceedings of the Royal Society ofLondon. Series B, Biological Sciences, 233 (1272)321–346.
Sims, D.A., Rahman, A.F., Cordova, V.D., El-Masri, B.Z.,Baldocchi, D.D., Flanagan, L.B., Goldstein, A.H., Hollinger,D.Y., Misson, L., Monson, R.K., Oechel, W.C., Schmid, H.P.,Wofsy, S.C., Xu, L., 2006. On the use of MODIS EVI to assessgross primary productivity of North American ecosystems,
Journal of Geophysical Research, 111, G04015, doi:10.1029/2006JG000162.
Skole, D., Tucker, C., 1993. Tropical deforestation and habitatfragmentation in the Amazon, Satellite data from 1978 to1988. Science 260, 1905–1910.
Skole, D.L., Qi, J., 2001, Optical remote sensing for monitoringforest and biomass change in the context of the KyotoProtocol, CGCEO/RA01-01/w. Michigan State University, EastLansing, Michigan.
Sobrado, M.A., 1993. Trade-off between water transportefficiency and leaf life-span in a tropical dry forest.Oecologia 96 (1), 19–23.
Tanaka, K., Takizawa, H., Kume, T., Xu, J., Tantasirin, C., Suzuki,M., 2004. Impact of rooting depth and soil hydraulicproperties on the transpiration peak of an evergreen forestin northern Thailand in the late dry season, Journal ofGeophysical Research, 109, D23107, doi:10.1029/2004JD004865.
Tanaka, K., Takizawa, H., Tanaka, N., Kosaka, I., Yoshifuji, N.,Tantasirin, C., Piman, S., Suzuki, M., Tangtham, N., 2003.Transpiration peak over a hill evergreen forest in northernThailand in the late dry season: Assessing the seasonalchanges in evapotranspiration using a multilayer model.Journal of Geophysical Research 108 (D17), 4533,doi:10.1029/2002JD003028.
Tian, H., Melillo, J.M., Kicklighter, D.W., Pan, S., Liu, J., McGuire,A.D., Moore III, B., 2003. Regional carbon dynamics inmonsoon Asia and its implications for the global carboncycle. Global and Planetary Change 37 (3–4), 201–217.
Vieira, I.C., Almeida, A.S., Davidson, E.A., Stone, T.A., Carvalho,C.J.R., Guerrero, J.B., 2003. Classifying successional foreststages using Landsat spectral properties and ecologicalcharacteristics in eastern Amazonia. Remote Sensing ofEnvironment 87, 470–481.
Vina, A., Henebry, G.M., 2005. Spatio-temporal change analysisto identify anomalous variation in the vegetated landsurface: ENSO effects in tropical South America.Geophysical Research Letters 32 (21), 1–5.
Vourlitis, G.L., Filho, N.P., Hayashi, M.M.S., Nogueira, J. De S.,Caseiro, F.T., Campelo Jr., J.H., 2001. Seasonal variations inthe net ecosystem CO2 exchange of a mature Amazoniantransitional tropical forest (cerradao). Functional Ecology15, 388–395.
White, M.A., Hoffman, F., Hargrove, W.W., Nemani, R.R., 2005. Aglobal framework for monitoring phenological responses toclimate change, Geophysical Research Letters, 32, L04705,doi:10.1029/2004GL021961.
Wright, S.J., Schaik, C.P., 1994. Light and the phenology oftropical trees. American Naturalist 143, 192–199.
Xiao, X., Hagen, S., Zhang, Q., Keller, M., Moore Iii, B., 2006.Detecting leaf phenology of seasonally moist tropicalforests in South America with multi-temporal MODISimages. Remote Sensing of Environment 103 (4), 465–473.
Xiao, X., Zhang, Q., Braswell, B., Urbanski, S., Boles, S., Wofsy, S.,Moore, B., Ojima, D., 2004. Modeling gross primaryproduction of temperate deciduous broadleaf forest usingsatellite images and climate data. Remote Sensing ofEnvironment 91, 256–270.
Xiao, X., Zhang, Q., Saleska, S., Hutyra, L., De Camargo, P.,Wofsy, S., Frolking, S., Boles, S., Keller, M., Moore III, B.,2005. Satellite-based modeling of gross primary productionin a sesonally moist tropical evergreen forest. RemoteSensing of Environment 94 (1), 105–122.
Zhang, Q., Xiao, X., Braswell, B., Linder, E., Baret, F., Moore III, B.,2005. Estimating light absorption by chlorophyll, leaf andcanopy in a deciduous broadleaf forest using MODIS dataand a radiative transfer model. Remote Sensing ofEnvironment 99 (3), 357.
Top Related
Copyright © 2022 FDOKUMEN

