


Bahasa
Halaman
Hukum


J Math Chem (2009) 46:1050–1059DOI 10.1007/s10910-008-9489-x
ORIGINAL PAPER
Multi-objective simultaneous prediction of waterbornecoating properties
Haitao Zhang · Yuan Zhou · Ping Cheng ·Sunhua Deng · Xuejun Cui · Hongyan Wang
Received: 17 June 2008 / Accepted: 13 October 2008 / Published online: 4 November 2008© Springer Science+Business Media, LLC 2008
Abstract Multi-objective simultaneous prediction of waterborne coating propertieswas studied by the neural network combined with programming. The conditions ofnetwork with one input layer, three hidden layers and one output layer were confirmed.The monomers mass of BA, MMA, St and pigments mass of TiO2 and CaCO3 were usedas input data. Four properties, which were hardness, adhesion, impact resistance andreflectivity, were used as network output. After discussing the hidden layer neurons,learn rate and the number of hidden layers, the best net parameters were confirmed. Theresults of experiment show that multi-hidden layers was advantageous to improve theaccuracy of multi-objective simultaneous prediction. 36 kinds of coating formulationswere used as the training subset and 9 acrylate waterborne coatings were used as testingsubset in order to predict the performance. The forecast error of hardness was 8.02%and reflectivity was 0.16%. Both forecast accuracy of adhesion and impact resistancewere 100%.
Keywords Neural network · Polyacrylate emulsion · Waterborne coating
1 Introduction
Waterborne coating was composed of film former (namely emulsion), pigments, waterand various addition agents. The content of any component might have effect on thewhole coating performance. Therefor the coating system should be carefully designed,
H. Zhang · Y. Zhou · S. Deng · X. Cui · H. Wang (B)College of Chemistry, Jilin University, Changchun 130012, People’s Republic of Chinae-mail: [email protected]
P. ChengUniversity of Alberta, Edmonton, Canada
123
J Math Chem (2009) 46:1050–1059 1051
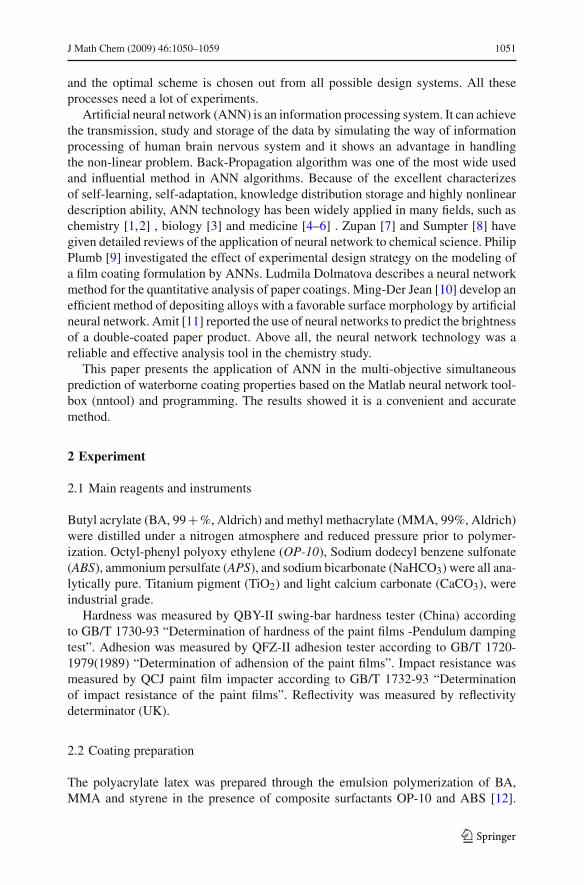
and the optimal scheme is chosen out from all possible design systems. All theseprocesses need a lot of experiments.
Artificial neural network (ANN) is an information processing system. It can achievethe transmission, study and storage of the data by simulating the way of informationprocessing of human brain nervous system and it shows an advantage in handlingthe non-linear problem. Back-Propagation algorithm was one of the most wide usedand influential method in ANN algorithms. Because of the excellent characterizesof self-learning, self-adaptation, knowledge distribution storage and highly nonlineardescription ability, ANN technology has been widely applied in many fields, such aschemistry [1,2] , biology [3] and medicine [4–6] . Zupan [7] and Sumpter [8] havegiven detailed reviews of the application of neural network to chemical science. PhilipPlumb [9] investigated the effect of experimental design strategy on the modeling ofa film coating formulation by ANNs. Ludmila Dolmatova describes a neural networkmethod for the quantitative analysis of paper coatings. Ming-Der Jean [10] develop anefficient method of depositing alloys with a favorable surface morphology by artificialneural network. Amit [11] reported the use of neural networks to predict the brightnessof a double-coated paper product. Above all, the neural network technology was areliable and effective analysis tool in the chemistry study.
This paper presents the application of ANN in the multi-objective simultaneousprediction of waterborne coating properties based on the Matlab neural network tool-box (nntool) and programming. The results showed it is a convenient and accuratemethod.
2 Experiment
2.1 Main reagents and instruments
Butyl acrylate (BA, 99+%, Aldrich) and methyl methacrylate (MMA, 99%, Aldrich)were distilled under a nitrogen atmosphere and reduced pressure prior to polymer-ization. Octyl-phenyl polyoxy ethylene (OP-10), Sodium dodecyl benzene sulfonate(ABS), ammonium persulfate (APS), and sodium bicarbonate (NaHCO3) were all ana-lytically pure. Titanium pigment (TiO2) and light calcium carbonate (CaCO3), wereindustrial grade.
Hardness was measured by QBY-II swing-bar hardness tester (China) accordingto GB/T 1730-93 “Determination of hardness of the paint films -Pendulum dampingtest”. Adhesion was measured by QFZ-II adhesion tester according to GB/T 1720-1979(1989) “Determination of adhension of the paint films”. Impact resistance wasmeasured by QCJ paint film impacter according to GB/T 1732-93 “Determinationof impact resistance of the paint films”. Reflectivity was measured by reflectivitydeterminator (UK).
2.2 Coating preparation
The polyacrylate latex was prepared through the emulsion polymerization of BA,MMA and styrene in the presence of composite surfactants OP-10 and ABS [12].
123

1052 J Math Chem (2009) 46:1050–1059
Table 1 Components content ranges of the latices
Monomers Content (g) Pigments Content (g) Water (g)
BA 15–21 TiO2 15–30 37
MMA 6–16 CaCO3 0–15
St 1–13
Total: 33 30 37
36 different coatings were prepared by a series of different components content which the total amount ofmonomers, pigments and water were controlled at the certain ratio of 33:30:37
36 kinds of coatings were prepared by various latices of different monomer content.The general content can be seen in Table 1.
3 Using neural network in waterborne coating system
Neural network algorithm was different from the general Chemometrics methods,because it only emphasized the inputs and outputs, rather than physical and chemicalprocesses. Therefor the neural network was suitable for accomplish the multi-objectivesimultaneous prediction of waterborne coating properties.
3.1 Design of neural network structure
Neural network was made up of one input layer, one output layer and three hiddenlayers for our sutdy. The contents of BA, MMA, St and TiO2, CaCO3 in the acrylatecoatings system were used as the input nodes (NI = 5) and four coating’s primaryproperties, hardness, adhesion, impact resistance and reflectivity, were used as theoutput node (NO = 4), which can be seen in Table 2. There were 12, 13 and 12 nodesin the three hidden layers respectively.
Figure 1 presented the calculating process of neural network. Figure 1 presentedthe architecture of neural network applied. A three-layers neural network was takenexample for describing the training process detailedly as follows:
(1): All the initial values of weight (w j i , wk j ) and threshold (θ j , θk) were set ran-domly ranging from 0 to 1. (i stands for input layer, j stands for the hiddenlayer and k stands for the output layer.)
Table 2 Input & output data ofnetwork
Net input nodes Net output nodes
I1: Amount of BA (g) O1: Hardness (ratio)
I2: Amount of MMA (g) O2: Adhesion (grade)
I3: Amount of St (g) O3: Impact Resistance (cm)
I4: Amount of TiO2 (g) O4: Reflectivity (%)
I5: Amount of CaCO3 (g)
123

J Math Chem (2009) 46:1050–1059 1053
Fig. 1 Calculating process and architecture of the neural network
(2): The training subset which was made up of 36 samples was provided. The coat-ings raw material of 36 samples were assigned to Xi as input data and theirexperimental results were assigned to Tk as target values.
(3): The output of hidden layer and output layer were calculated:
x j = Fji
(∑i
w j i Xi + θ j
)(hidden layer)
yk = Fkj
⎛⎝∑
j
wk j x j + θk
⎞⎠ (output layer)
(4): Network error E was calculated:
E =√
1
2
∑p
||Tk − yk ||2
If the network error E was smaller than 10−3, the training was completed. If Ebigger than 10−3, the training was continued.
(5): Training error δk and δ j were calculated:
δk = yk(1 − yk)(Tk − yk) (output layer)
δ j = x j (1 − x j )∑
δkwk j (hidden layer)
(6): Weight values and threshold values were revised. η was the learn rate and α
was momentum term in the formulas.
wk j = wk j + η · δk · yk + α · �wk j , θk = θk + ηδk + α�θk
w j i = w j i + η · δ j · x j + α · �w j i , θ j = θ j + ηδ j + α�θ j
The calculation was recurred to step(3) for the recalculating of yk by using therevised w j i , wk j , θ j and θk the until the network error satisfying condition. The whole
123

1054 J Math Chem (2009) 46:1050–1059
calculation was accomplished by programming and by means of MATLAB NeuralNetwork Toolbox (NN Toolbox). There were large numbers of neural network functionin the toolbox written in modular. Tansig function was used as Fji in hidden layersand Purelin function was used as Fkj in output layer. The learn rate η was 0.20 and theepoch was 100, 000 times. The training subset was consisted by 36 measured samples.The testing subset was made up of 9 random samples. Based on the above conditions,neural networks were built to predict the four properties of coatings.
3.2 Evaluation of the prediction accuracy of multi-objective network
Coatings were complicated system, and there were many properties of which neededto be characterized. Some of them were continuous functions, others were discretefunctions. In this study, the hardness and reflectivity were continuous functions, andadhesion and impact resistance were discrete functions. The errors description ofcontinuous functions and discrete functions were different. The errors of continuousfunctions were calculated by using the mean squared error, which was showed inEq. 1a. The errors of discrete functions were calculated by using the proportion ofwrong prediction, which could be seen in Eq. 1b.
Ei = MSE(y′n,i − yn,i ) × 100% (i = 1, 4; n = 1, 2, . . . , 36) (1a)
Ei = 1
36× N(y′
n,i �=yn,i )× 100% (i = 2, 3; n = 1, 2, . . . , 36) (1b)
The prediction accuracies of four properties were calculated by Eqs.1a and b. How-ever it was difficult to judge which network condition was the best one using the fourerrors because their repugnant character. In order to solve this problem, a total eval-uation standard standing for the prediction error was more needed rather than fourproperties errors’. Therefor in this work, we refer to the statistical method of chemo-metrics to put forward a prediction accuracy formula which contain the four errors,see Eq. 2.
Prediction Accuracy (%) = 1 − √MSE(Ei ) =
⎛⎝1 −
√√√√1
4×
4∑i=1
E2i
⎞⎠ × 100% (2)
Function MSE was the mean squared error of the four properties errors. The judg-ment of network performance was given by Matlab NNtool using the errors betweenmeasured and simulated results. It was unreasonable for used in the discrete functions.Prediction accuracy has the same ability for describe the network performance of theANN however it was more suitable for the discrete functions. Therefor the networkwas evaluated by prediction accuracy instead of network performance.
123

J Math Chem (2009) 46:1050–1059 1055
4 Results and discussion
4.1 Transformation of input & output data
The data of training samples, including input value and output value, should be nor-malization processed before used. In this study, five input nodes in coatings systemwere divided into monomers groups, including BA, MMA, St contents, and pigmentsgroup, containing TiO2 and CaCO3 amount. The monomers and pigments group wereconverted by Eqs. 3a and b.
I ′i = Ii
I1 + I2 + I3(i = 1, 2, 3; ) (3a)
I ′i = 0.25 + 0.5 × Ii
I4 + I5(i = 4, 5; ) (3b)
In coatings system, the units of the four outputs were inconsistent. The hardnessand reflectivity were ratio value, the range of which were from 0 to 1. The adhesionwas classified by grade. The measured adhesion of all samples were from Grade I toGrade III. The impact resistance were 40 cm, 45 cm and 50 cm. The different unitswould led to the low accuracy because of the unbalanced error distribution. Thereforeit was necessary to transform the data before they were input the ANN for training.The transformation formula can be seen in Eq. 4.
O ′i = Oi − Omin
i
Omaxi − Omin
i
× 0.25 + 0.5 (i = 1, 2, 3, 4; ) (4)
The prediction accuracies of transfer function Logsig and Tansig were calculatedat different hidden neuron numbers which was showed in Fig. 2. The graph showedthat the prediction accuracies of converted data were much higher than original data.
Fig. 2 Comparison of inputdata transform
4 6 8 10 12 14 0
102030405060708090
100
Pre
dic
tio
n A
ccu
racy
(%
)
Number of Hidden Neurons
Original-Logsig Original-Tansig Trans-Logsig Trans-Tansig
123

1056 J Math Chem (2009) 46:1050–1059
4.2 Neurons number of the first hidden layer
The selection of hidden neurons was so important that it would influence the networkcalculation time and discriminating ability. The optimum neurons number can be foundby placing a different number of neurons in the first hidden layer for the same datasubset by comparing the network errors [13] . Kolmogorov theorem put forward anempirical formula to determine the hidden neurons number which can be seen in Eq. 5.
NH = √NI + NO + 1 + a a = 1 ∼ 10 (5)
where NI was the number of input layer neurons and NO was the number of outputlayer neurons. In the coating system of our researched, NI = 5, NO = 4. Accordingto Eq. 5, the range of hidden neurons number NH was from 4 to 13. The optimumneurons number was found between this range by comparing the prediction accuracy.
Figure 3 was the network model’s prediction accuracy which was calculated atthe different hidden neurons numbers by Eq. 2, (Learning epochs = 100,000; Learn
Fig. 3 Selection of hiddenneurons
4 6 8 10 12 14 86
88
90
92
94
96
98
Pre
dic
tio
n A
ccu
racy
(%
)
Number of Hidden Neurons
Logsig Tansig
Fig. 4 Selection of learn rate
0.0 0.1 0.2 0.3 0.4 86
88
90
92
94
96
98
Pre
dic
tio
n A
ccu
racy
(%
)
Learn Rate
Logsig Tansig
123
J Math Chem (2009) 46:1050–1059 1057
4 6 8 10 12 14 93
94
95
96
97
98
99
100
Acc
ura
cy o
f P
red
icti
on
(%
)
Number of Hidden Neurons
Logsig Tansig
(a) (b)
4 6 8 10 12 14 96
97
98
99
100
Acc
ura
cy o
f P
red
icti
on
(%
)
Number of Hidden Neurons
Logsig Tansig
(c) (d)
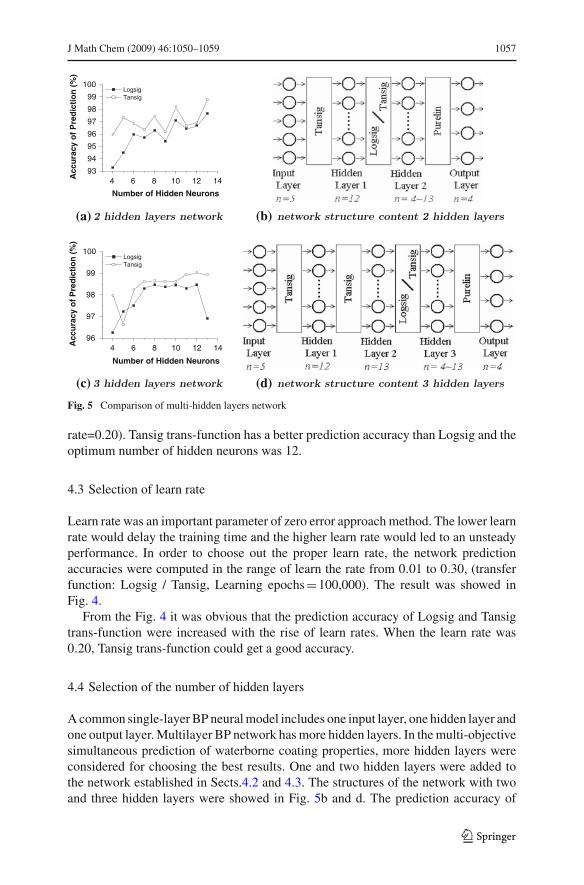
Fig. 5 Comparison of multi-hidden layers network
rate=0.20). Tansig trans-function has a better prediction accuracy than Logsig and theoptimum number of hidden neurons was 12.
4.3 Selection of learn rate
Learn rate was an important parameter of zero error approach method. The lower learnrate would delay the training time and the higher learn rate would led to an unsteadyperformance. In order to choose out the proper learn rate, the network predictionaccuracies were computed in the range of learn the rate from 0.01 to 0.30, (transferfunction: Logsig / Tansig, Learning epochs=100,000). The result was showed inFig. 4.
From the Fig. 4 it was obvious that the prediction accuracy of Logsig and Tansigtrans-function were increased with the rise of learn rates. When the learn rate was0.20, Tansig trans-function could get a good accuracy.
4.4 Selection of the number of hidden layers
A common single-layer BP neural model includes one input layer, one hidden layer andone output layer. Multilayer BP network has more hidden layers. In the multi-objectivesimultaneous prediction of waterborne coating properties, more hidden layers wereconsidered for choosing the best results. One and two hidden layers were added tothe network established in Sects.4.2 and 4.3. The structures of the network with twoand three hidden layers were showed in Fig. 5b and d. The prediction accuracy of
123
1058 J Math Chem (2009) 46:1050–1059
Tabl
e3
Form
ulat
ion
ofco
atin
gan
dm
easu
red/
pred
icte
dpr
oper
ties
and
erro
rca
lcul
atio
n
No.
Form
ulat
ion
ofco
atin
gM
easu
red
prop
ertie
sPr
edic
ted
prop
ertie
sA
bsol
ute
erro
r
BA
MM
ASt
TiO
2C
aCO
3H
AIR
RH
AIR
RE
HE
AE
IRE
R
116
.012
.05.
030
.00.
00.
668
I45
89.0
0.70
9I
4588
.90.
041
TT
−0.0
03
215
.615
.02.
422
.57.
50.
588
I45
90.1
0.63
8I
4590
.00.
050
TT
−0.0
03
315
.010
.47.
630
.00.
00.
707
I40
89.4
0.73
4I
4089
.20.
027
TT
−0.0
09
416
.815
.21.
030
.00.
00.
611
I45
90.8
0.66
0I
4590
.80.
049
TT
0.00
0
514
.812
.26.
015
.015
.00.
604
II45
87.6
0.64
6II
4587
.30.
042
TT
−0.0
15
614
.45.
613
.022
.57.
50.
716
I40
88.7
0.74
9I
4088
.70.
033
TT
−0.0
01
716
.09.
08.
030
.00.
00.
653
I45
90.7
0.69
9I
4590
.60.
046
TT
−0.0
03
815
.010
.08.
030
.00.
00.
687
II40
90.6
0.73
3II
4090
.80.
046
TT
0.01
0
915
.012
.06.
030
.00.
00.
675
III
4091
.30.
715
III
4091
.30.
040
TT
0.00
1
Ave
rage
rela
tive
erro
r(%
):8.
020.
000.
000.
16
Pred
ictio
nac
cura
cy(%
):91
.98
100
100
99.8
4
Tota
lpre
dict
ion
accu
racy
(%):
97.9
6
H,H
ardn
ess
(rat
io);
A,A
dhes
ion
(Gra
de);
IR,I
mpa
ctR
esis
tanc
e(c
m);
R,R
eflec
tivity
(%);
(T,t
rue,
F,f
alse
)
123

J Math Chem (2009) 46:1050–1059 1059
two hidden layers network could be seen in Fig. 5a, and the best performance of twohidden layers network was under the condition of 13 hidden neurons nodes and Tansigtransfer function. The prediction accuracy of three hidden layers network could be seenFig. 5c, the best performance of three hidden layers networks was under the conditionof 12 hidden neurons and Tansig transfer function.
In the studied coating system, the best prediction accuracy of one, two and threehidden layers networks were 96.81, 98.77 and 99.02% respectively. Three hiddenlayers was helpful for the accuracy increasing. Therefore, three hidden layers net-work and the network condition were chosen for the prediction of testing samplesubset.
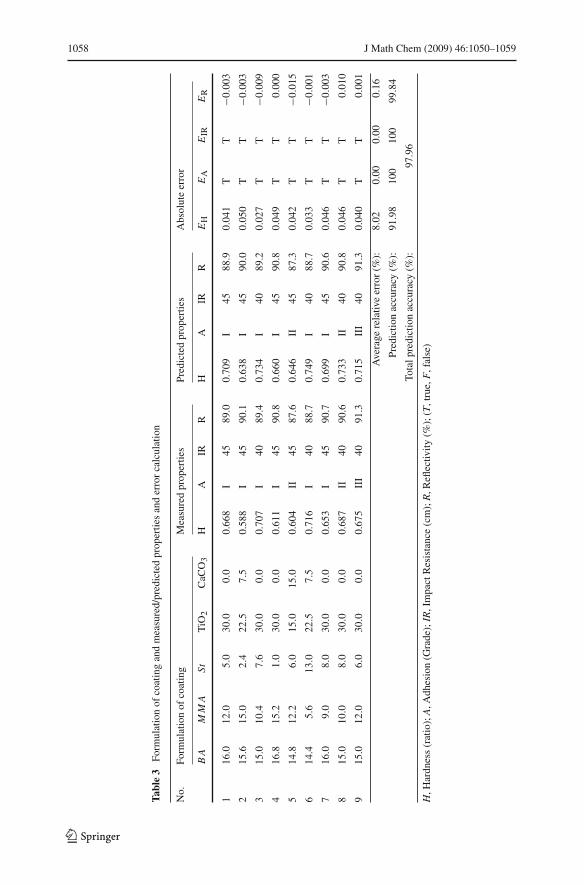
4.5 Prediction of testing sample subset
The properties of 9 coating formulas were measured and simulated using the chosennetwork condition. Table 3 showed the measured and predicted results and the absoluteerrors between them. Average relative errors of the four properties were calculated bythe average of absolute errors.
Table 3 showed the prediction accuracy of hardness and reflectivity were 91.98%and 99.84%. The adhesion and impact resistance were both 100%.
5 Conclusion
By neural network technology combining with chemometrics programming and datatransformation, the multi-objective simultaneous prediction of waterborne coatingsproperties such as hardness, adhesion, impact resistance and reflectivity, were accom-plished. Good prediction results were received. The average relative errors of all testingsamples were about 2%. The method of neural network provided a simple and forth-right way for prediction of the waterborne coatings properties, and it was helpful forthe preparation of coatings.
Acknowledgements The authors acknowledge the National Science Foundation of China (Grant Nos.50573027 and 50673032) for support of this research.
References
1. J.C. Sanders, M.C. Breadmore, Y.C. Kwok, et al. Anal. Chem. 75, 986–994 (2003)2. T. Baczek, A. Bucinski, A.R. Ivanov, et al. Anal. Chem. 76, 1726–1732 (2004)3. S. Bicciato, M. Pandin, G. Didone, et al. Biotechnol. Bioeng. 81, 594–606 (2003)4. M. Murcia-Soler, F. Perez-Gimenez, F.J. Garcia-March, et al. J. Chem. Inf. Comput. Sci. 43, 1688–1702
(2003)5. S. Agatonovic-Kustrin, R. Beresford. J. Pharmaceut. Biomed. 22, 717–727 (2000)6. S. Serhatlioglu, F. Hardalac, I. Guler. J. Med. Syst. 27, 205–214 (2003)7. J. Zupan, J. Gasteiger, Anal. Chim. Acta. 248, 1–30 (1991)8. B.G. Sumpter, C. Gettino, D.W. Noid, Annu. Rev. Phys. Chem. 45, 439–481 (1994)9. A.P. Plumb, R.C. Rowe, P. York, C. Doherty, Eur. J. Pharm. Sci. 16, 281–288 (2002)
10. M.-D. Jeana, C.-D. Liu, J.-T. Wang, Appl. Surf. Sci. 245, 290–303 (2005)11. A. Kumar, V.C. Hand, Ind. Eng. Chem. Res. 39, 4956–4962 (2000)12. Z. Chen, Q. Gu, H. Zou, T. Zhao, H. Wang. J. Polym. Sci. Pol. Phys. 45, 884–891 (2007)13. Y.M. Zhang, S. Yang, J.R.G. Evans. Acta. Mater. 56, 1094–1105 (2008)
123
Top Related
Copyright © 2022 FDOKUMEN

