


Bahasa
Halaman
Hukum


University of Birmingham
Multi-dimensional analysis, text constellations, andinterdisciplinary discourseThompson, Paul; Hunston, Susan; Murakami, Akira; Vajn, Dominik
DOI:10.1075/ijcl.22.2.01tho
License:None: All rights reserved
Document VersionPeer reviewed version
Citation for published version (Harvard):Thompson, P, Hunston, S, Murakami, A & Vajn, D 2017, 'Multi-dimensional analysis, text constellations, andinterdisciplinary discourse', International Journal of Corpus Linguistics, vol. 22, no. 2, pp. 153–186.https://doi.org/10.1075/ijcl.22.2.01tho
Link to publication on Research at Birmingham portal
Publisher Rights Statement:Checked for eligibility 20/06/2017
Thompson, P., Hunston, S., Murakami, A. and Vajn, D., 2017. Multi-dimensional analysis, text constellations, and interdisciplinary discourse.International Journal of Corpus Linguistics, 22(2), pp.153-186.https://doi.org/10.1075/ijcl.22.2.01tho
General rightsUnless a licence is specified above, all rights (including copyright and moral rights) in this document are retained by the authors and/or thecopyright holders. The express permission of the copyright holder must be obtained for any use of this material other than for purposespermitted by law.
•Users may freely distribute the URL that is used to identify this publication.•Users may download and/or print one copy of the publication from the University of Birmingham research portal for the purpose of privatestudy or non-commercial research.•User may use extracts from the document in line with the concept of ‘fair dealing’ under the Copyright, Designs and Patents Act 1988 (?)•Users may not further distribute the material nor use it for the purposes of commercial gain.
Where a licence is displayed above, please note the terms and conditions of the licence govern your use of this document.
When citing, please reference the published version.
Take down policyWhile the University of Birmingham exercises care and attention in making items available there are rare occasions when an item has beenuploaded in error or has been deemed to be commercially or otherwise sensitive.
If you believe that this is the case for this document, please contact [email protected] providing details and we will remove access tothe work immediately and investigate.
Download date: 13. Jul. 2022
1
Multi-dimensional Analysis, Text Constellations, and Interdisciplinary
DiscourseSusan Hunston, Akira Murakami, Paul Thompson and Dominik Vajn
Abstract
Multi-Dimensional Analysis (MDA) has been widely used to explore register variation. This
paper reports on a project that uses MDA in an innovative fashion, in order to explore the
features of interdisciplinary research discourse in a particular broad academic domain. Firstly,
MDA is used to identify dimensions of variation in a corpus of eleven thousand journal
articles in the domain of environmental studies, from a mixture of monodisciplinary and
interdisciplinary journals. We then focus on the texts published in one journal, Global
Environmental Change, in the period 1990-2010. This is an interdisciplinary journal and it
might therefore be expected that the papers within it diverge in terms of disciplinary approach
sufficiently to produce differences that are analogous to register differences. On the other
hand, those ‘registers’ cannot be identified on external criteria, as they do not explicitly state
their disciplinary derivation, so an alternative approach is required: an inductive approach.
Instead of identifying registers on external criteria and comparing them, we use the
dimensional profiles of individual texts to identify clusters of texts, here termed
‘constellations’, that share combinations of features and that might therefore be said to
constitute a distinct ‘register’. Using this methodology, we have derived six constellations of
texts within an interdisciplinary journal, distinguished by their dimensional profile. Analysis
of each of the constellations indicates that they consist of texts that have commonalities in
their approaches to research approaches, based around: the development of predictive
models; quantitative and historical research; discussions of theory and policy; and human-
environment studies that focus on individual voices. The identification of these constellations
could not have been achieved through an a priori categorisation of texts.
1. Introduction
Since its inception in the 1980s (Biber 1988), Multi-Dimensional Analysis (MDA) has been
extensively used to explore register variation. It has two main advantages over other
approaches to the study of variation: it makes no a priori assumptions about how registers
2
will be different from one another, and it can target a large number of features
simultaneously, rather than focusing on a few (often more or less arbitrarily selected)
features. MDA has proven so successful in demonstrating the dimensions of variation
between clearly distinctive registers, such as ‘news reports’ versus ‘telephone conversations’,
that its principles have been adopted to show variation between corpora of texts that might be
expected to vary in a less extreme way, such as research articles, textbooks and essays written
in different academic disciplines (e.g. Biber 2006; Hardy & Römer 2013; Gardner, Biber &
Nesi 2015).
The project reported in this paper uses MDA, and combines the methodology central
to that tradition with substantial innovation. The corpus is unusually, though not uniquely
(see, for example, Friginal & Weigle 2014), broadly homogeneous in topic, comprising
research articles published in eleven journals that focus on environmental concerns. As is
usual in MDA, factor analysis is used to identify dimensions, and the dimensions are used to
compare sub-corpora; in this case, each sub-corpus is one journal. As all the texts are
academic in nature, and are concerned with similar issues, a considerable degree of overlap is
expected between the sub-corpora. Our purpose in using MDA is to ascertain the degrees of
linguistic variation between and within the eleven journals.
The second part of the study overturns the methodological assumption underpinning
previous research using MDA, that registers are identified on external criteria and compared.
The investigation uses the texts published in only one journal: Global Environmental Change.
This is a self-proclaimed interdisciplinary journal and it might therefore be expected that the
papers within it diverge in terms of disciplinary approach sufficiently to produce differences
that are analogous to register differences. On the other hand, those ‘registers’ cannot be
identified on external criteria: for example, most of the papers do not advertise themselves
explicitly as deriving from one discipline or another. Our aim, then, is to use the dimensional
profiles of individual texts to identify clusters of texts, here termed ‘constellations’, that share
combinations of features and that might therefore be said to constitute a distinct ‘register’.
Using this methodology, we have derived constellations of texts within an interdisciplinary
journal, distinguished by their dimensional profile.
The research questions to be addressed in this paper are:
· In a corpus comprising full-length research papers from 11 journals on the topic of
environmental studies, what dimensions of variation are observable?
· On the basis of these dimensions, how distinct is each journal? In particular, are those

3
journals designated ‘interdisciplinary’ demonstrably different from the others?
· When the novel methodology proposed by this paper is applied to the texts in Global
Environmental Change, what constellations of texts can be observed and how can
they be interpreted?
2. Theoretical Background
2.1 Multi-Dimensional Analysis
Register is, as Egbert et al. (2015: 1817) note, ‘one of the most important predictors of
linguistic variation’. It has been defined as ‘variation according to use’ (Halliday & Hasan
1990:41) or ‘situationally defined varieties’ (Biber et al. 2015: 13). Multi-Dimensional
analysis is a method of comparing registers ‘with respect to sets of co-occurring linguistic
features’ (Biber 2006: 178) and is based on the theory that these patterns of co-occurrence co-
vary with the ‘functional dimensions of texts’ (Friginal & Weigle 2014, citing Grieve et al.
2010). It is a bottom-up, data-driven form of analysis, that relies on the outcome of factor
analysis to identify which bundle(s) of features will distinguish between two given registers.
Possibly its most striking insight (Biber 1985; 1988), is that registers appear in different
configurations along different dimensions, so that the distinguishing features of registers are
indeed multi-dimensional.
As noted above, MDA was first used to distinguish between registers that would be
expected to be very different from each other, based on their very different contexts of
production and reception. Subsequently its use has been extended. Of most relevance to this
paper, it has been used extensively to study variation in academic discourse, for example
comparing professional writing in academic disciplines (Biber et al. 1998; Biber 2006;
Kanoksilapatham 2007), sub-disciplinary variation (Gray 2013; 2015), student writing in
different disciplines (Hardy & Römer 2013; Gardner et al. 2015; Hardy & Friginal 2016), and
L2 writing (Friginal & Weigle 2014). These studies use the same methodology as Biber’s
original study to derive ‘new’ dimensions, that is, dimensions that are different from the ones
proposed in Biber (1988) and that depend on the variation identifiable in the given corpus.
For example, Hardy and Römer (2013) identify four dimensions that distinguish between
disciplines represented in the MICUSP corpus (2009). Ten disciplines are compared in

4
relation to these dimensions. The configuration of disciplines is different in each dimension.
It is apparent that MDA may be applied to studies of variation that are more finely-
grained than the original register studies. Gray (2013), for example, distinguishes ‘types’ of
research article (theoretical, qualitative and quantitative) and considers each type a ‘register’,
placing that word in inverted commas: each type is a register in MD terms if not in other
terms. Even further removed from archetypal register variation is Friginal & Weigle’s (2014)
comparison of L2 texts. The key variables in this relatively homogeneous corpus are: the
point in the academic semester at which the texts were written; and the assessment scores that
they were given. Friginal & Weigle identify four dimensions and use them to track student
progress. Dimension 1, for example, distinguishes ‘involved’ and ‘informational’ writing. As
students progress over time, their writing becomes more informational, and the essays with
the higher grades are also more informational than involved.
What all the above studies have in common is that a division between registers is
made prior to the application of MDA. In other words, the methodology relies on comparison
between sub-corpora that have been identified on external criteria. The discipline to which a
research article belongs may be identified by the title of the journal in which it is published,
for example. Where no external criteria are available, substitutes for these criteria are used to
impose sub-corpus divisions. Biber et al. (2015), for example, aiming to produce a ‘corpus-
based taxonomy of web registers’, train readers to assign web texts to register categories, and
the final categories are based on levels of agreement between readers. Gray (2013, 2015)
follows an established ESP (English for Specific Purposes) practice of consulting subject
specialist informants (Huckin & Olsen 1984) when deciding which journals to sample for
each discipline and also how to distinguish the types of research article. As will be described
in more detail below, in designing our research project, we have decided to revise the usual
MDA methodology to a new purpose, in the following way. When applying MDA to the
journal Global Environmental Change we have not taken the prior step of dividing the texts
into groups. We have made an alternative use of MDA to derive constellations of texts in a
‘bottom-up’ way (cf. Biber 1989). This, we believe, is in keeping with the data-driven ethos
that is at the heart of the MD method.
2.2 Disciplinary variation
In addition to the MDA studies mentioned in the previous section, there has been a plethora
5
of corpus-based linguistic studies of disciplinary variation. They have been primarily
motivated by the needs of Languages for Special Purposes teachers (LSP) and materials
developers (particularly in the field of English for Academic Purposes) for more accurate
descriptions of language use in specific discourses.
The increasing availability of texts in digital form, and of corpus analysis tools and
techniques has led to the uptake of corpus linguistic methods for the investigation of
disciplinary variation. While there have been studies of disciplinary variation in spoken
genres (for example, Poos and Simpson 2002 or Csomay 2002)), the bulk of academic corpus
research has focused on written language. Hyland, perhaps most notably, has used a corpus of
240 research articles (1.4 million words) with 30 research papers from each of eight
disciplines in the sciences, engineering, social sciences, and humanities, to investigate a range
of features including: citations (Hyland 2001a), engagement features (Hyland 2001b) and
lexical bundles (Hyland 2008). Other examples of corpus-based disciplinary variation studies
are: Hu and Wang (2014) have also looked at citation practices across disciplines, as well as
first language, in a corpus of 84 research articles; Groom (2005) explored phraseology in
History and Literature reviews and articles; Charles (2006) examined finite reporting clauses
followed by that in a corpus of politics and material science theses. As well as studies which
focus on variation between disciplines, there have been some that have looked at variation
within a discipline, such as McGrath’s (2016) investigation of self-mentions in anthropology
and history research articles.
In these studies, the concept of discipline has generally been assumed rather than
problematised. A rare exception is Mauranen (2006) who observes that disciplines are often
defined on institutional criteria with contestation over the hierarchical structuring of
disciplinary categories and these vary between cultures and over time. Mauranen chooses to
distinguish between two broad disciplinary domains: Natural Sciences & Technology, and
Social Sciences & Humanities. These are by no means the only divisions possible. Other
academic corpus developers divide the scientific cake into:
· Applied Sciences and Professions; Humanities; Social Sciences; Natural/Formal
Sciences (Ackermann and Chen 2013)
· Arts and Humanities; Life Sciences; Physical Sciences; Social Sciences (Alsop &
Nesi 2009)
These competing taxonomies suggest that plotting the disciplinary map is far from
straightforward. It might in fact be more true to say that, just as disciplines as discrete

6
organizational units may be a construct of institutions such as universities, so disciplines as
discrete discourses may be a construct of the comparative linguistic research carried out on
them.
An alternative, inductive approach is taken by Durrant (2015) in his study of four-
word bundles in the BAWE corpus (Alsop & Nesi 2009). Rather than first assigning each text
to a disciplinary category, Durrant quantifies all four-token sequences in 1588 texts, and
calculates the number of sequences shared between each text and the others. He then clusters
the texts according to their similarities and arrives at what he describes as ‘emergent
disciplinary groupings’ (ibid:6). These groupings do resemble traditional divisions into ‘hard’
and ‘soft’ disciplines (Biglan 1973) but they are derived from the data rather than from a
division of the corpus on external criteria. Although we are working with dimensions rather
than n-grams, our work has this in common with Durrant’s, that we identify groups of texts in
a data-driven way.
3. The Birmingham-Elsevier Environment Corpus
The corpus compiled for this project, the Birmingham-Elsevier Environment Corpus,
consists of specialized texts amounting to just over 50 million tokens. It comprises papers
from the journal Global Environmental Change (hereafter, GEC) and from 10 other journals
that relate either to the field of environmental science / environmental studies, or to
disciplines that themselves are often included in environmental studies (life sciences,
economics, social sciences). The journals were selected from those published by our partners
in the project, Elsevier.1 From the perspective of a journal publisher, the high rate of failure
of interdisciplinary journals is perplexing and challenging and so there is a need for a better
understanding of what constitutes success and failure;2 in response to this we selected as the
primary object of our study a journal – GEC – that Elsevier UK identify as successful, as it
has appeared continuously over more than two decades and has maintained its broad,
interdisciplinary appeal. To set this journal in the context of other journals in the same
domain and to facilitate a contrast between mono- and inter-disciplinarity, we then identified
five monodisciplinary journals and five interdisciplinary ones, in addition to GEC.
Typically, as stated in the previous section, corpus studies of disciplinary variation
have selected texts for corpus inclusion by identifying journals that are deemed central to the
‘discipline’, using strategies such as asking specialist informants to identify key journals

7
(Hyland 2000), or looking at impact factor scores in order to identify the most ‘valued’
journals within a discipline (Giannoni 2010). Prior research on disciplines therefore depends
on selectivity to ensure prototypicality in the demarcation of disciplines.
This study breaks with that tradition. Selection appears only on three points: the
choice of journals, the time period, and the exclusion of texts within each volume that did not
constitute a full-length research article. Otherwise we have included all the research papers
published in eleven journals in a given time period (with extra for one journal), in order to
capture variation within the complete array. There is no attempt to achieve a corpus of
prototypical articles.
We did, however, attempt to include both mono- and inter-disciplinary journals, and
here we did use external criteria. To classify and therefore select the journals we used: (i)
normalized subject counts in Scopus3 and (ii) the use of a clustering coefficient on citations.
In the first step, if a journal is assigned to a larger number of subjects than a typical journal in
the same field, it was considered interdisciplinary, while if it belonged to a smaller number of
subjects, it was considered monodisciplinary. For the second step, a map of journals was
created by Elsevier based on citation relationships in Scopus, such that journals not citing
each other are placed further apart than those that do cite each other. On the assumption that
papers tend to cite papers in the same discipline, monodisciplinary journals should have most
of the citation links nearby. Clustering coefficients reveal how well-connected a journal is in
the map and take into account the connections of the other journals to which it is connected.
Journals were considered as monodisciplinary if the coefficients indicate that they are
connected to the journals that are well-connected to one another, and interdisciplinary if they
are connected to journals that are not connected to one another. While these methods are not
watertight, it is important to note that our aim was not to define every journal published by
Elsevier as either monodisciplinary or interdisciplinary, but simply to have a principled
reason for selecting the 10 journals, in addition to GEC, for our corpus. This procedure
resulted in the following journals being selected for the corpus alongside GEC: the
interdisciplinary journals comprise Agriculture, Ecosystems & Environment (AEE),
BioSystems (B), Computers, Environment and Urban Systems (CEUS), Environmental
Pollution (EP), and the Journal of Rural Studies (JRS); the monodisciplinary journals
comprise Advances in Water Resources (AWR), Journal of Strategic Information Systems
(JSIS), Plant Science (PS), Resource and Energy Economics (REE), and Transportation
Research Part D: Transport and Environment (TRTE). GEC has been in publication since
1990, and the other journals have been published since 1996 or earlier.

8
From GEC, the corpus includes all the articles from the first volume (1990/1991) up
to Volume 20 (2010), while from the other journals it includes all the articles from the issues
published between 2001 and 2010. This difference is because articles before 2000 had to be
processed manually (converted from PDF to text using OCR and then checked exhaustively
for conversion errors) and there was scope within the project to carry out this procedure for
only our main target journal. It is possible that the difference in time span could have affected
our results, but given the overall spread of the corpus this is unlikely because the time period
is not that large.
The corpus includes full-length research articles and excludes non-research papers
such as book reviews. Only the main body text is included; other sections of the research
papers such as abstract, footnotes, appendices, tables and figures are excluded. Since
mathematical symbols and equations can cause problems in automated feature extraction,
they have been replaced with the non-word EQSYM. For the sake of reliability in computing
the frequency of linguistic features, it was necessary to exclude those papers whose body
sections are 2000 words or less (Biber, 1990: 261). As a result, 501 papers (4.3%) were
excluded.
Appendix 1 shows the size of the corpus, including the number of papers, the number
of tokens, and the average length of paper in each journal in each year. In total, the corpus
comprises 11,201 papers with a total corpus size of 51.4 million tokens. It is noticeable that
the amount of data varies substantially across journals with an increase over time. In addition
to this numerical data, it is important to note that the texts in the corpus do not share
conventional forms of organization such as the IMRD (Introduction-Methods-Results-
Discussion) model or equivalent – there is considerable variation in the patterns of
organization within the corpus. This made it unfeasible to compare equivalent sections, e.g.
all Methods sections, across the corpus, which would otherwise have been an obvious way to
proceed.
4. Methodology
4.1 Identifying and interpreting dimensions
To perform multidimensional analysis, we first identified the linguistic features to be
included in the analysis. The goal at this stage is to include as many potentially important

9
features as possible (Biber 1985, 1988, 1995; Conrad & Biber 2001). The present study
started with a list of over 150 features. Each linguistic feature was identified and its
frequency counted with the Biber tagger (Biber 1988). The tagger identifies some features
(e.g. demonstrative pronouns) with the aid of part-of-speech tagging, and others (e.g. abstract
nouns) by using vocabulary lists. Many were eliminated because they were at a high level of
generality and overlapped with the more specific features that were retained. Others were
merged to avoid redundancy. A few were eliminated or merged because they did not
distinguish between the texts in our corpus. The result of this elimination and merging of
categories was a list of 53 features; these are shown in Appendix 2, which shows the
normalized frequency (per 1,000 words) and the standard deviation of each feature.
An exploratory factor analysis was then used to identify co-occurrence patterns
among the 53 linguistic features.4. The process works by identifying systematic patterns of
shared variance. The frequency of each linguistic feature varies across texts, so that Feature X
may have a high frequency in a certain text but a low frequency in another. This pattern, or
variance, is more or less shared by other features. If Feature Y shows a similar pattern to
Feature X, the two features have a large shared variance.
This factor analysis was run on the normalized frequency of the linguistic features.
Factors were extracted with principal factor solution, in which the first factor captures the
largest amount of shared variance, the second factor captures the largest shared variance after
the first factor is extracted, and so on. MDA requires the researcher to select the number of
factors to be used. We decided on a six-factor solution based on the scree plot (Figure 1) that
shows the amount of explained variance, communality values that indicate the extent to
which the variance of each feature is captured by the factors, and the factorial structure and
its interpretability. A Promax rotation was applied to facilitate the interpretation of each
factor. Table 1 shows the inter-factor correlation.
Table 1: Inter-factor correlation
Factor1 Factor2 Factor3 Factor4 Factor5Factor2 0.535Factor3 0.311 0.469Factor4 0.290 0.312 0.244Factor5 0.126 0.100 0.242 0.126Factor6 0.200 0.143 0.236 0.105 0.135
Appendix 3 lists the factor loadings for each feature in each factor. Factor loadings are the
10
correlation between each feature and the factor and they indicate the degree to which a
feature is representative of the factor. The factor loading of 0.30 was set as the cut-off point
and a feature was retained in the final factorial model only if its loading was above the
threshold. In common with standard practice in MDA, if a feature loaded over 0.30 in more
than one factor, it was retained only in the factor on which it loaded highest. This practice
ensures that the factors are entirely discrete.
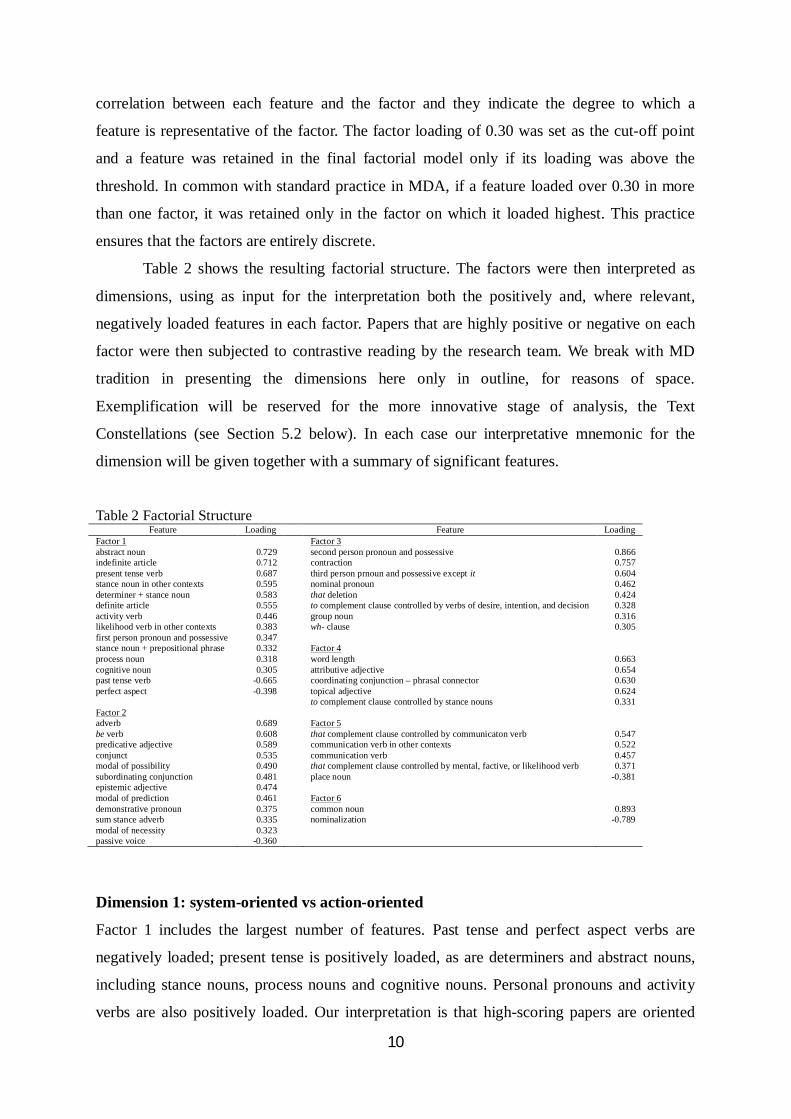
Table 2 shows the resulting factorial structure. The factors were then interpreted as
dimensions, using as input for the interpretation both the positively and, where relevant,
negatively loaded features in each factor. Papers that are highly positive or negative on each
factor were then subjected to contrastive reading by the research team. We break with MD
tradition in presenting the dimensions here only in outline, for reasons of space.
Exemplification will be reserved for the more innovative stage of analysis, the Text
Constellations (see Section 5.2 below). In each case our interpretative mnemonic for the
dimension will be given together with a summary of significant features.
Table 2 Factorial StructureFeature Loading Feature Loading
Factor 1 Factor 3abstract noun 0.729 second person pronoun and possessive 0.866indefinite article 0.712 contraction 0.757present tense verb 0.687 third person prnoun and possessive except it 0.604stance noun in other contexts 0.595 nominal pronoun 0.462determiner + stance noun 0.583 that deletion 0.424definite article 0.555 to complement clause controlled by verbs of desire, intention, and decision 0.328activity verb 0.446 group noun 0.316likelihood verb in other contexts 0.383 wh- clause 0.305first person pronoun and possessive 0.347stance noun + prepositional phrase 0.332 Factor 4process noun 0.318 word length 0.663cognitive noun 0.305 attributive adjective 0.654past tense verb -0.665 coordinating conjunction – phrasal connector 0.630perfect aspect -0.398 topical adjective 0.624
to complement clause controlled by stance nouns 0.331Factor 2adverb 0.689 Factor 5be verb 0.608 that complement clause controlled by communicaton verb 0.547predicative adjective 0.589 communication verb in other contexts 0.522conjunct 0.535 communication verb 0.457modal of possibility 0.490 that complement clause controlled by mental, factive, or likelihood verb 0.371subordinating conjunction 0.481 place noun -0.381epistemic adjective 0.474modal of prediction 0.461 Factor 6demonstrative pronoun 0.375 common noun 0.893sum stance adverb 0.335 nominalization -0.789modal of necessity 0.323passive voice -0.360
Dimension 1: system-oriented vs action-oriented
Factor 1 includes the largest number of features. Past tense and perfect aspect verbs are
negatively loaded; present tense is positively loaded, as are determiners and abstract nouns,
including stance nouns, process nouns and cognitive nouns. Personal pronouns and activity
verbs are also positively loaded. Our interpretation is that high-scoring papers are oriented
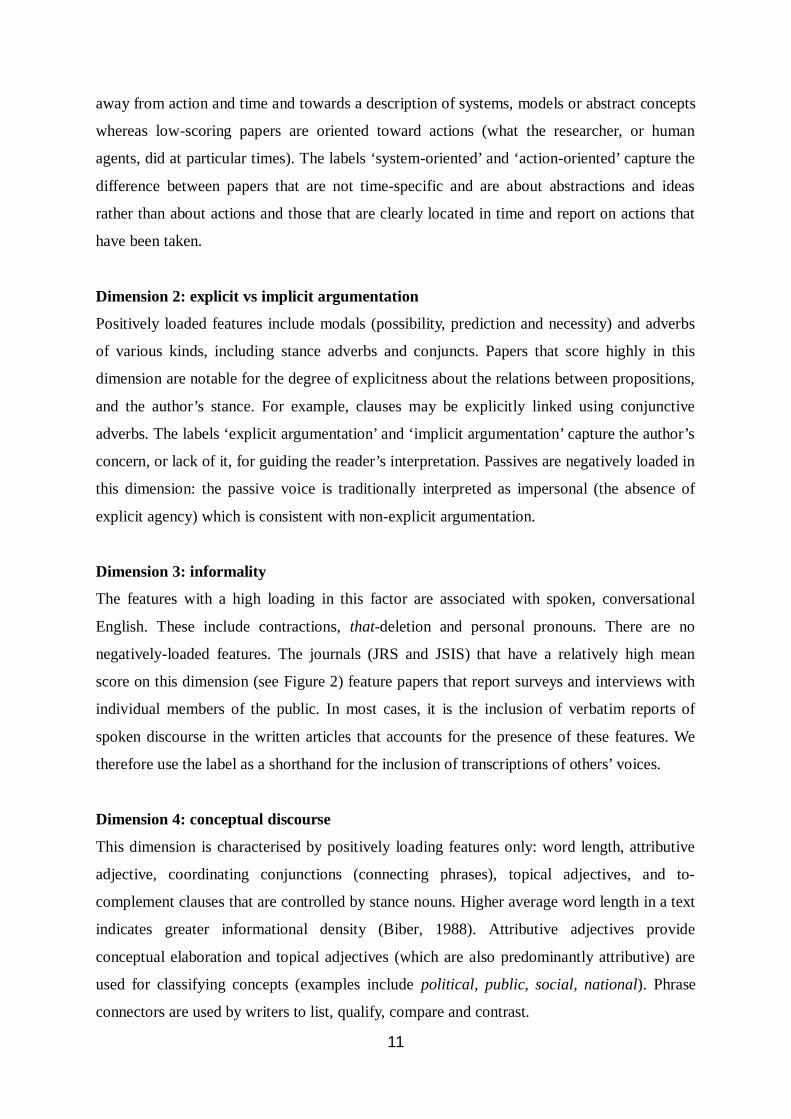
11
away from action and time and towards a description of systems, models or abstract concepts
whereas low-scoring papers are oriented toward actions (what the researcher, or human
agents, did at particular times). The labels ‘system-oriented’ and ‘action-oriented’ capture the
difference between papers that are not time-specific and are about abstractions and ideas
rather than about actions and those that are clearly located in time and report on actions that
have been taken.
Dimension 2: explicit vs implicit argumentation
Positively loaded features include modals (possibility, prediction and necessity) and adverbs
of various kinds, including stance adverbs and conjuncts. Papers that score highly in this
dimension are notable for the degree of explicitness about the relations between propositions,
and the author’s stance. For example, clauses may be explicitly linked using conjunctive
adverbs. The labels ‘explicit argumentation’ and ‘implicit argumentation’ capture the author’s
concern, or lack of it, for guiding the reader’s interpretation. Passives are negatively loaded in
this dimension: the passive voice is traditionally interpreted as impersonal (the absence of
explicit agency) which is consistent with non-explicit argumentation.
Dimension 3: informality
The features with a high loading in this factor are associated with spoken, conversational
English. These include contractions, that-deletion and personal pronouns. There are no
negatively-loaded features. The journals (JRS and JSIS) that have a relatively high mean
score on this dimension (see Figure 2) feature papers that report surveys and interviews with
individual members of the public. In most cases, it is the inclusion of verbatim reports of
spoken discourse in the written articles that accounts for the presence of these features. We
therefore use the label as a shorthand for the inclusion of transcriptions of others’ voices.
Dimension 4: conceptual discourse
This dimension is characterised by positively loading features only: word length, attributive
adjective, coordinating conjunctions (connecting phrases), topical adjectives, and to-
complement clauses that are controlled by stance nouns. Higher average word length in a text
indicates greater informational density (Biber, 1988). Attributive adjectives provide
conceptual elaboration and topical adjectives (which are also predominantly attributive) are
used for classifying concepts (examples include political, public, social, national). Phrase
connectors are used by writers to list, qualify, compare and contrast.
12
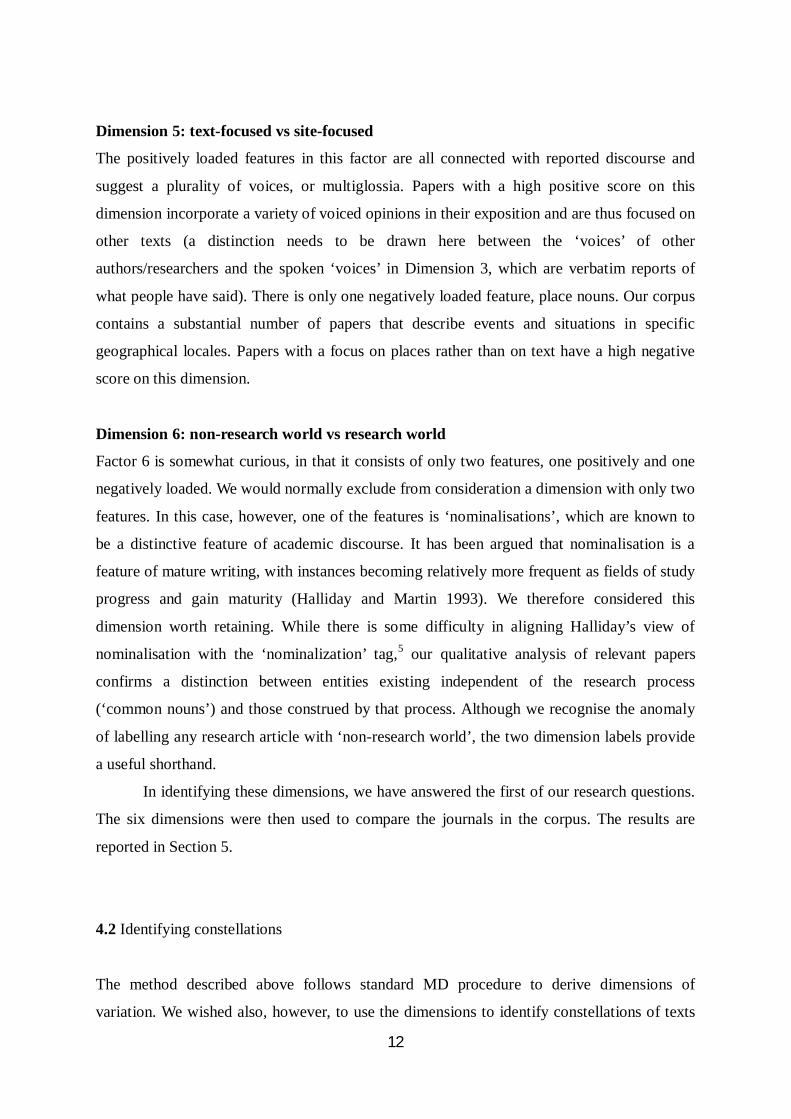
Dimension 5: text-focused vs site-focused
The positively loaded features in this factor are all connected with reported discourse and
suggest a plurality of voices, or multiglossia. Papers with a high positive score on this
dimension incorporate a variety of voiced opinions in their exposition and are thus focused on
other texts (a distinction needs to be drawn here between the ‘voices’ of other
authors/researchers and the spoken ‘voices’ in Dimension 3, which are verbatim reports of
what people have said). There is only one negatively loaded feature, place nouns. Our corpus
contains a substantial number of papers that describe events and situations in specific
geographical locales. Papers with a focus on places rather than on text have a high negative
score on this dimension.
Dimension 6: non-research world vs research world
Factor 6 is somewhat curious, in that it consists of only two features, one positively and one
negatively loaded. We would normally exclude from consideration a dimension with only two
features. In this case, however, one of the features is ‘nominalisations’, which are known to
be a distinctive feature of academic discourse. It has been argued that nominalisation is a
feature of mature writing, with instances becoming relatively more frequent as fields of study
progress and gain maturity (Halliday and Martin 1993). We therefore considered this
dimension worth retaining. While there is some difficulty in aligning Halliday’s view of
nominalisation with the ‘nominalization’ tag,5 our qualitative analysis of relevant papers
confirms a distinction between entities existing independent of the research process
(‘common nouns’) and those construed by that process. Although we recognise the anomaly
of labelling any research article with ‘non-research world’, the two dimension labels provide
a useful shorthand.
In identifying these dimensions, we have answered the first of our research questions.
The six dimensions were then used to compare the journals in the corpus. The results are
reported in Section 5.
4.2 Identifying constellations
The method described above follows standard MD procedure to derive dimensions of
variation. We wished also, however, to use the dimensions to identify constellations of texts

13
that share dimension profiles. Unlike previous studies, where registers are identified in
advance and then compared using the dimensions, our method uses the dimension scores of
each individual text to arrive at the component ‘registers’ or sub-corpora of our corpus. In this
way we can establish, in a data-driven way, the degree and the nature of diversity within that
single interdisciplinary journal, working inductively in a similar fashion to Durrant (2015).
To do this, we clustered individual GEC papers into the groups that share similar
patterns of dimension scores (cf. Biber, 1989). More specifically, we first z-transformed the
dimension scores of GEC papers within each dimension so that the scores were comparable
across dimensions. The normalized frequency of each feature was first standardized to a z-
score, a value with the mean of zero and the standard deviation of one. After computing
these, dimension scores for each paper were calculated by summing the z-scores of the
positive features in the dimension and subtracting the z-scores of the negative features. We
then ran a hierarchical agglomerative cluster analysis with squared Euclidean distance and the
Ward clustering method. The resulting dendrogram (Figure 3) suggests that a range of
numbers of clusters could be supported. Three is the most obviously optimum number but we
wished to have, in the initial stages, at least, a more fine-grained and therefore informative set
of clusters, and so selected six for the investigation (shown with dotted lines). Each cluster
corresponds to a number of papers in GEC that are similar in terms of their dimensional
profile.
To avoid a confusion of terminology, we have appropriated the term ‘text
constellation’ to refer to the groups or clusters of papers thus identified. There are 118 papers
in constellation 1, 169 in constellation 2, 61 in constellation 3, 95 in constellation 4, 35 in
constellation 5 and 146 in constellation 6 (see Figure 4). Each paper in the corpus has been
annotated with its constellation number, allowing us to investigate the constellations as sub-
corpora in Sketch Engine (Kilgarriff et al. 2014). Figure 3 also shows how the constellations
relate to each other. The most distinctive constellation, with the highest tree-branching, is
constellation 1. The constellations with the most similarity are constellations 3 and 6, and
constellations 5 and 4. These four constellations together are distinguished from constellation
2.
Figure 4 shows how the dimensions map on to the identified constellations. Since the
values are standardized, zero represents the grand average and is indicated by dashed lines in
the figure. From Figure 4 we can see that constellation 2 has values that are closest to average
across four of the six dimensions, while constellations 3 and 5 have values that diverge
considerably from the average. Constellation 3 has a fairly narrow range of values along each
14
dimension, suggesting papers that are relatively homogeneous, while constellation 5 has a
broader spread in at least three dimensions, suggesting greater variety between papers. Some
constellations with different average scores in one dimension nonetheless show overlap, such
as constellations 4 and 6 with respect to dimension 6. What Figure 4 enables us to do is to
identify the dimension features of each constellation, and also to visualise the degree of
difference between the constellations.
5. Results and Discussion
5.1 Dimension Scores and the 11 Journals
In Section 4.1 we have addressed the first of our research questions. The second question
asks how distinct each journal is in its dimensional profile, and also whether interdisciplinary
journals are distinct from monodisciplinary ones. To this end, we first applied the dimensions
to the corpus in a conventional way, by comparing the dimensional profiles of the various
sub-corpora. In this part of our study, the papers from each of the 11 journals comprised a
sub-corpus. Comparing the dimension scores of the journals stands as a test of the validity of
the dimensions; each journal might be expected to be distinctive to some extent. It also acts
as a ‘register’ description of each journal, characterising it in terms of its location on each
dimension. This allows us to test the degree of heterogeneity in each journal and to compare
monodisciplinary and interdisciplinary journals.
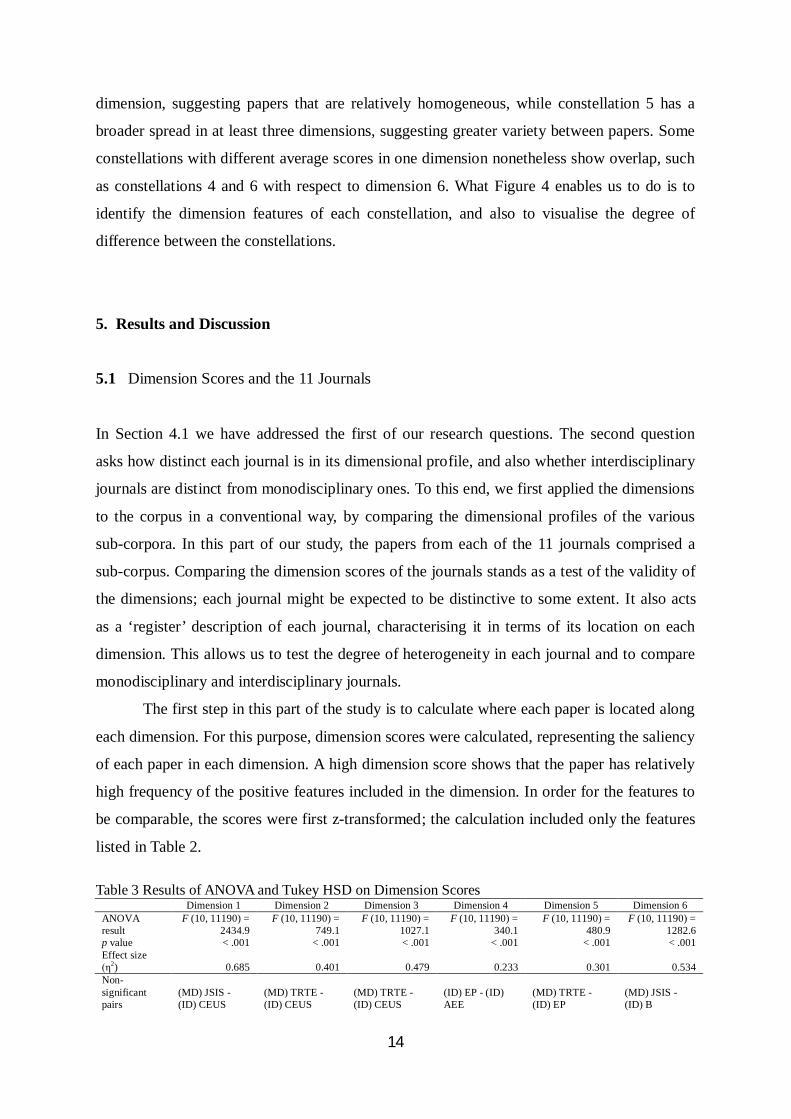
The first step in this part of the study is to calculate where each paper is located along
each dimension. For this purpose, dimension scores were calculated, representing the saliency
of each paper in each dimension. A high dimension score shows that the paper has relatively
high frequency of the positive features included in the dimension. In order for the features to
be comparable, the scores were first z-transformed; the calculation included only the features
listed in Table 2.
Table 3 Results of ANOVA and Tukey HSD on Dimension ScoresDimension 1 Dimension 2 Dimension 3 Dimension 4 Dimension 5 Dimension 6
ANOVAresult
F (10, 11190) =2434.9
F (10, 11190) =749.1
F (10, 11190) =1027.1
F (10, 11190) =340.1
F (10, 11190) =480.9
F (10, 11190) =1282.6
p value < .001 < .001 < .001 < .001 < .001 < .001Effect size(η2) 0.685 0.401 0.479 0.233 0.301 0.534Non-significantpairs
(MD) JSIS -(ID) CEUS
(MD) TRTE -(ID) CEUS
(MD) TRTE -(ID) CEUS
(ID) EP - (ID)AEE
(MD) TRTE -(ID) EP
(MD) JSIS -(ID) B

15
(Tukey HSD)(MD) TRTE -(ID) GEC
(ID) JRS - (ID)GEC
(MD) AWR -(ID) EP
(MD) JSIS - (ID)AEE
(ID) JRS - (ID)GEC
(ID) GEC - (ID)CEUS
(MD) JSIS - (ID)GEC
(MD) PS - (MD)AWR
(MD) TRTE -(ID) AEE
(MD) AWR -(ID) GEC
(MD) REE -(ID) CEUS
(MD) JSIS - (ID)JRS
(MD) JSIS - (ID)B
(MD) TRTE -(ID) GEC
(MD) REE -(ID) EP
(MD) AWR -(ID) CEUS
(MD) AWR -(ID) JRS
(MD) AWR -(ID) GEC
(MD) JSIS - (ID)EP
(MD) TRTE -(ID) JRS
(MD) TRTE -(ID) EP
(MD) TRTE -(MD) AWR
(ID) JRS - (ID)GEC
(MD) PS - (MD)JSIS
(MD) TRTE -(MD) JSIS
The next step is to compute the mean dimension score for each journal. Comparison
of these scores reveals the differences between the journals along each dimension. Figure 2
shows the mean dimension score and the standard deviation of each journal in each
dimension, and Table 3 presents the results of analysis of variance (ANOVA) and post-hoc
Tukey HSD tests. Since in all the dimensions the vast majority of journal pairs turned out to
be significantly different in their mean dimension scores, the table lists only the pairs whose
mean dimension scores were NOT significantly different from each other.
There are 11 journals, meaning that there are 55 pairs of journals altogether. If a
dimension was completely unsuccessful at distinguishing between journals, a list of close to
55 pairs would appear under that dimension in Table 3. If a dimension was completely
successful, then no journal pairs would be listed under that dimension. Table 3 shows that
neither is the case, but also that, given the large number of total possible pairs, all the
dimensions are relatively successful. As can be seen in the table, dimension 1 is the most
successful in distinguishing between journals, as only two pairs are not distinguished by the
dimension. Dimensions 2, 3 and 6 are the next successful. Dimension 4 is the least
successful, with 9 pairs of journals failing to show significant difference and only one journal
(REE) not appearing in any of the pairings. If we follow the fortunes of our target journal,
GEC, it is similar to TRTE in dimensions 1 and 5, to JRS in dimensions 2, 4 and 5, to JSIS in
dimension 2, to AWR in dimensions 5 and 6, and to CEUS in dimension 6. This suggests that
dimension 5 is the least successful in distinguishing this journal from the others (three
pairings involving GEC appear under this dimension) and that dimension 3 is the most
successful.
The corpus design (Section 3 above) specified a distinction between monodisciplinary
and interdisciplinary journals. Previous research has explored differences between disciplines
(Section 2). Although there is much less research on interdisciplinary discourse, we might

16
speculate that interdisciplinary journals on environmental topics will demonstrate some
consistent feature that would distinguish them from monodisciplinary journals on the same
topic. They might, for example, take a distinctive stance towards their mixed readership.
Alternatively, given that the articles in interdisciplinary journals might be supposed to written
in ways appropriate to their own discipline, we might expect more diversity and less
distinctive consistency in interdisciplinary journals than in monodisciplinary ones. Counting
how many pairs each journal enters into, shown in Table 4, there is some variation, from
TRTE (MD) showing a lack of distinction in 11 pairs and PS (MD), B (ID) and REE (MD)
showing a lack of distinction in only 2 pairs each. The results of Multidimensional Analysis,
therefore, do not make a clear division between monodisciplinary and interdisciplinary
journals, as Table 4 shows, where for example, three monodisciplinary journals (TRTE, JSIS
and AWR) show a lack of distinction while two (PS, REE, monodisciplinary) are highly
distinct.
Table 4: Comparison of monodisciplinary and interdisciplinary journals
TRTE GEC JSIS AWR JRS CEUS EP AEE PS B REEMD 11 9 8 2 2ID 10 7 6 6 3 2
The second research question also asks about the degree of heterogeneity within each journal:
that is, the extent to which papers in a journal share similar patterns of the dimensions of
variation identified through MDA. An additional procedure was carried out to determine this,
based on classification and clustering analysis. A machine learning algorithm called ‘random
forests’ (Breiman, 2001) was employed to predict the journal of each paper based on the
dimension profile of the paper. If the model can accurately classify a paper into the journal it
was taken from, it suggests that the paper has a similar dimension profile to that of the journal
as a whole. The random forests algorithm first produces a large number of tree-type
classifiers on bootstrap samples (i.e. a randomly selected sample of original data) by using a
subset of predictors. Each tree models the relationship between dimension profiles of
individual papers and the corresponding journals. Random forests then uses the models to
generate predictions (Kuhn & Johnson, 2013).
The random forests procedure showed that the total out-of-bag prediction accuracy
was 71.9%. This means that in total 71.9% of all the papers were accurately classified into
the journals they were published in. This is significantly above chance (χ2(1) = 3823.42, p
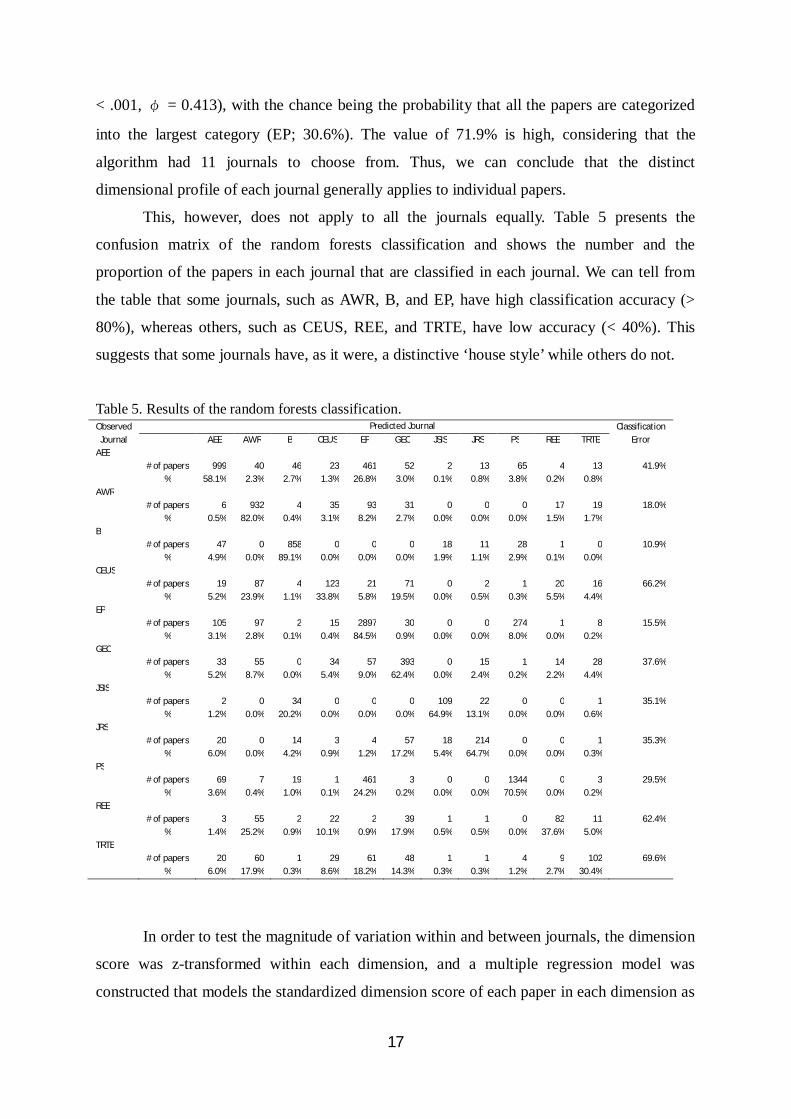
17
< .001, φ = 0.413), with the chance being the probability that all the papers are categorized
into the largest category (EP; 30.6%). The value of 71.9% is high, considering that the
algorithm had 11 journals to choose from. Thus, we can conclude that the distinct
dimensional profile of each journal generally applies to individual papers.
This, however, does not apply to all the journals equally. Table 5 presents the
confusion matrix of the random forests classification and shows the number and the
proportion of the papers in each journal that are classified in each journal. We can tell from
the table that some journals, such as AWR, B, and EP, have high classification accuracy (>
80%), whereas others, such as CEUS, REE, and TRTE, have low accuracy (< 40%). This
suggests that some journals have, as it were, a distinctive ‘house style’ while others do not.
Table 5. Results of the random forests classification.Observed
JournalPredicted Journal Classification
ErrorAEE AWR B CEUS EP GEC JSIS JRS PS REE TRTEAEE
# of papers 999 40 46 23 461 52 2 13 65 4 13 41.9%% 58.1% 2.3% 2.7% 1.3% 26.8% 3.0% 0.1% 0.8% 3.8% 0.2% 0.8%
AWR# of papers 6 932 4 35 93 31 0 0 0 17 19 18.0%
% 0.5% 82.0% 0.4% 3.1% 8.2% 2.7% 0.0% 0.0% 0.0% 1.5% 1.7%B
# of papers 47 0 858 0 0 0 18 11 28 1 0 10.9%% 4.9% 0.0% 89.1% 0.0% 0.0% 0.0% 1.9% 1.1% 2.9% 0.1% 0.0%
CEUS# of papers 19 87 4 123 21 71 0 2 1 20 16 66.2%
% 5.2% 23.9% 1.1% 33.8% 5.8% 19.5% 0.0% 0.5% 0.3% 5.5% 4.4%EP
# of papers 105 97 2 15 2897 30 0 0 274 1 8 15.5%% 3.1% 2.8% 0.1% 0.4% 84.5% 0.9% 0.0% 0.0% 8.0% 0.0% 0.2%
GEC# of papers 33 55 0 34 57 393 0 15 1 14 28 37.6%
% 5.2% 8.7% 0.0% 5.4% 9.0% 62.4% 0.0% 2.4% 0.2% 2.2% 4.4%JSIS
# of papers 2 0 34 0 0 0 109 22 0 0 1 35.1%% 1.2% 0.0% 20.2% 0.0% 0.0% 0.0% 64.9% 13.1% 0.0% 0.0% 0.6%
JRS# of papers 20 0 14 3 4 57 18 214 0 0 1 35.3%
% 6.0% 0.0% 4.2% 0.9% 1.2% 17.2% 5.4% 64.7% 0.0% 0.0% 0.3%PS
# of papers 69 7 19 1 461 3 0 0 1344 0 3 29.5%% 3.6% 0.4% 1.0% 0.1% 24.2% 0.2% 0.0% 0.0% 70.5% 0.0% 0.2%
REE# of papers 3 55 2 22 2 39 1 1 0 82 11 62.4%
% 1.4% 25.2% 0.9% 10.1% 0.9% 17.9% 0.5% 0.5% 0.0% 37.6% 5.0%TRTE
# of papers 20 60 1 29 61 48 1 1 4 9 102 69.6%% 6.0% 17.9% 0.3% 8.6% 18.2% 14.3% 0.3% 0.3% 1.2% 2.7% 30.4%
In order to test the magnitude of variation within and between journals, the dimension
score was z-transformed within each dimension, and a multiple regression model was
constructed that models the standardized dimension score of each paper in each dimension as
18
a function of dimension, the journal the paper was taken from, and their interaction. The
results showed that the model explains 43.8% of the variance (F(65, 67140) = 807.4; p <
0.001; adjusted R2 = 0.438). This suggests that more than half of the total variance is
attributed to within-journal variation. Thus, while journals distinguish dimension scores to a
certain extent, there is considerable variation within each journal as well, which could be
explained by Gray’s (2013; 2015) observations that journals can contain variation not only of
discipline but also of research paradigm (qualitative, quantitative or theoretical).
5.2 The Text Constellations in Global Environmental Change
The second part of our methodology (Section 4.2) addresses the third of our research
questions, by establishing and interpreting what we have called text constellations, that is,
groups of articles in the journal Global Environmental Change that share a dimensional
profile. This section discusses in some detail the characteristics of those constellations. Each
of the constellations should represent a distinctive type of paper in GEC. In practice, because
of the varying degrees of similarity and overlap, it is easiest to demonstrate difference
between the most widely distinguished constellations and then to describe the others in
relation to them. For this reason, we begin with a detailed description of constellations 1, 5
and 3. Figure 4 shows constellations 1 and 5 as being visually the most different from each
other and so the most easily distinguished and contrasted. The figure also shows 5 and 4 as
being similar to each other, and 3 and 6. For this reason, constellation 3 is added to this initial
description as representing a second pair of constellations. We describe these constellations
(1, 3 and 5) first via the dimension profiles in 5.2.1 below, and then via phraseological
evidence in 5.2.2. We then proceed to discuss the other constellations (5.2.3).
5.2.1 Constellations 1, 5 and 3: dimensional profiles
In describing these three constellations we rely for the most part on the features occurring on
the relevant dimensions. For example, references to ‘degree of informality’ reflect an
interpretation of the positively weighted features on dimension 3 (contractions, use of
pronouns, that-deletion and so on). In some cases, however, scrutiny of many papers in a
constellation (by reading the articles that came closest to the mean profile and that could
therefore be said to be prototypical of that constellation) has led to the identification of other
recurring foci that do not appear in any of the dimensions. For example, many of the papers
in constellation 5 articulate an antagonistic stance towards a purely ‘scientific’ approach to
19
studying environmental change. Examples are given below. Similarly, many of the papers in
constellation 1 express concern and pessimism about likely future environmental changes,
and their consequences, in the locations they have studied. Again, examples are given below.
In neither case is this attitudinal information retrievable from the factor/dimension loadings.
The examples given below are taken from a broad diachronic range. These examples
are inevitably selective. The aim is not to demonstrate typicality via the examples; typicality
or representativeness of the features identified has been demonstrated through the
multidimensional analysis and consequent identification of the constellations.
A dimension-led description of each constellation follows.
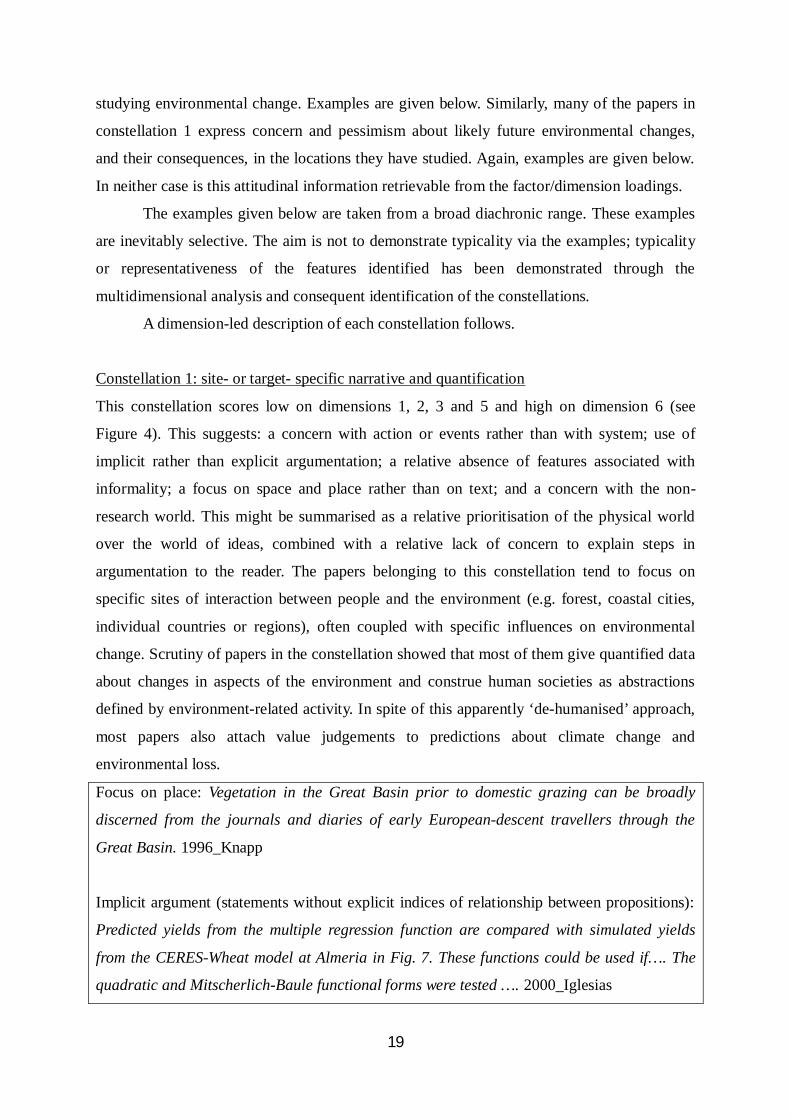
Constellation 1: site- or target- specific narrative and quantification
This constellation scores low on dimensions 1, 2, 3 and 5 and high on dimension 6 (see
Figure 4). This suggests: a concern with action or events rather than with system; use of
implicit rather than explicit argumentation; a relative absence of features associated with
informality; a focus on space and place rather than on text; and a concern with the non-
research world. This might be summarised as a relative prioritisation of the physical world
over the world of ideas, combined with a relative lack of concern to explain steps in
argumentation to the reader. The papers belonging to this constellation tend to focus on
specific sites of interaction between people and the environment (e.g. forest, coastal cities,
individual countries or regions), often coupled with specific influences on environmental
change. Scrutiny of papers in the constellation showed that most of them give quantified data
about changes in aspects of the environment and construe human societies as abstractions
defined by environment-related activity. In spite of this apparently ‘de-humanised’ approach,
most papers also attach value judgements to predictions about climate change and
environmental loss.
Focus on place: Vegetation in the Great Basin prior to domestic grazing can be broadly
discerned from the journals and diaries of early European-descent travellers through the
Great Basin. 1996_Knapp
Implicit argument (statements without explicit indices of relationship between propositions):
Predicted yields from the multiple regression function are compared with simulated yields
from the CERES-Wheat model at Almeria in Fig. 7. These functions could be used if…. The
quadratic and Mitscherlich-Baule functional forms were tested …. 2000_Iglesias
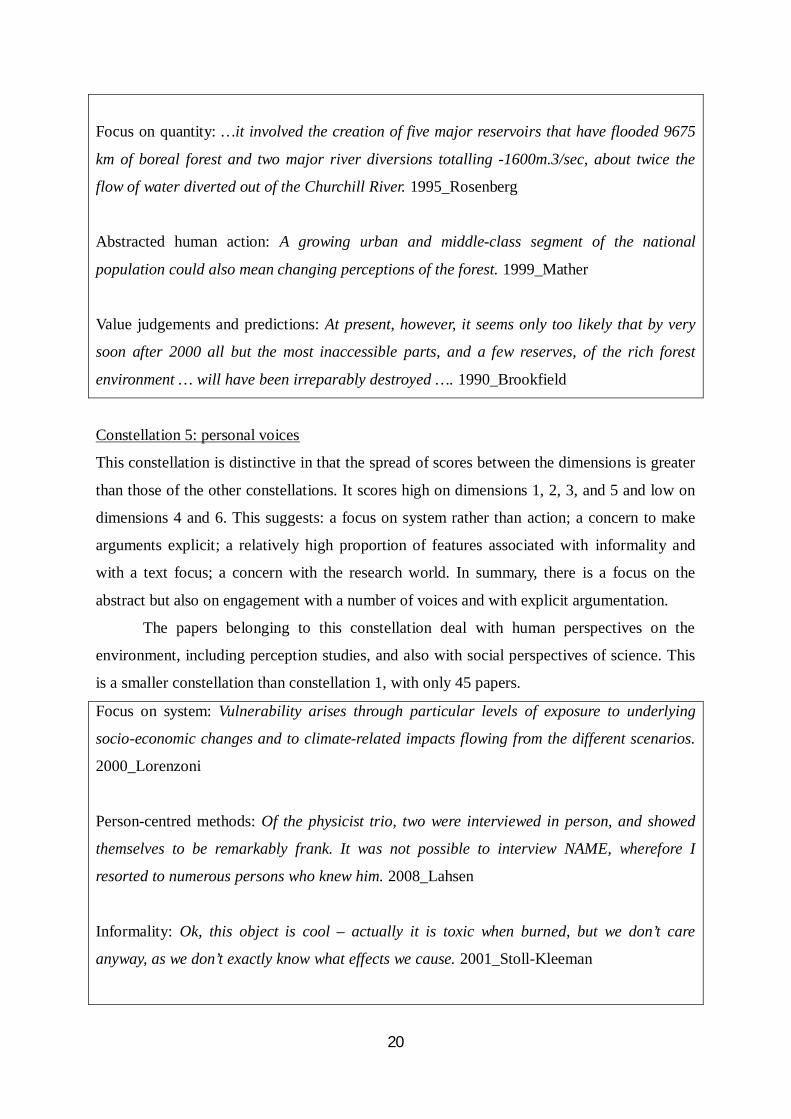
20
Focus on quantity: …it involved the creation of five major reservoirs that have flooded 9675
km of boreal forest and two major river diversions totalling -1600m.3/sec, about twice the
flow of water diverted out of the Churchill River. 1995_Rosenberg
Abstracted human action: A growing urban and middle-class segment of the national
population could also mean changing perceptions of the forest. 1999_Mather
Value judgements and predictions: At present, however, it seems only too likely that by very
soon after 2000 all but the most inaccessible parts, and a few reserves, of the rich forest
environment … will have been irreparably destroyed …. 1990_Brookfield
Constellation 5: personal voices
This constellation is distinctive in that the spread of scores between the dimensions is greater
than those of the other constellations. It scores high on dimensions 1, 2, 3, and 5 and low on
dimensions 4 and 6. This suggests: a focus on system rather than action; a concern to make
arguments explicit; a relatively high proportion of features associated with informality and
with a text focus; a concern with the research world. In summary, there is a focus on the
abstract but also on engagement with a number of voices and with explicit argumentation.
The papers belonging to this constellation deal with human perspectives on the
environment, including perception studies, and also with social perspectives of science. This
is a smaller constellation than constellation 1, with only 45 papers.
Focus on system: Vulnerability arises through particular levels of exposure to underlying
socio-economic changes and to climate-related impacts flowing from the different scenarios.
2000_Lorenzoni
Person-centred methods: Of the physicist trio, two were interviewed in person, and showed
themselves to be remarkably frank. It was not possible to interview NAME, wherefore I
resorted to numerous persons who knew him. 2008_Lahsen
Informality: Ok, this object is cool – actually it is toxic when burned, but we don’t care
anyway, as we don’t exactly know what effects we cause. 2001_Stoll-Kleeman
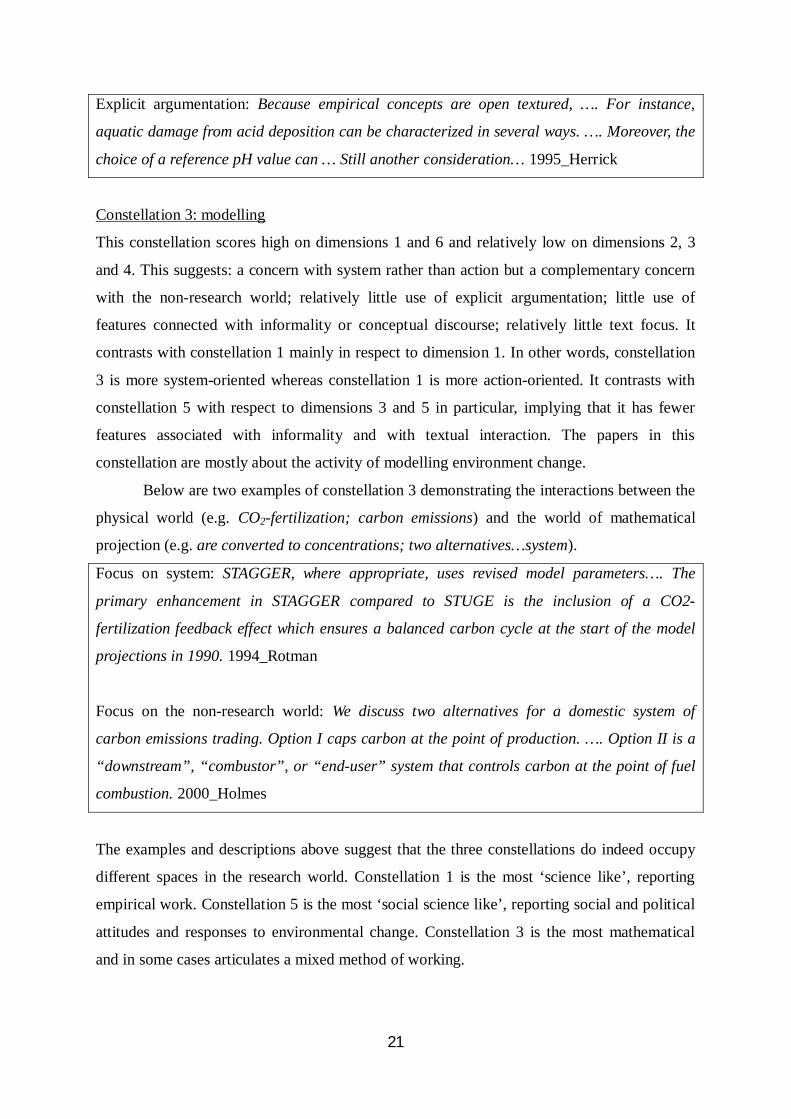
21
Explicit argumentation: Because empirical concepts are open textured, …. For instance,
aquatic damage from acid deposition can be characterized in several ways. …. Moreover, the
choice of a reference pH value can … Still another consideration… 1995_Herrick
Constellation 3: modelling
This constellation scores high on dimensions 1 and 6 and relatively low on dimensions 2, 3
and 4. This suggests: a concern with system rather than action but a complementary concern
with the non-research world; relatively little use of explicit argumentation; little use of
features connected with informality or conceptual discourse; relatively little text focus. It
contrasts with constellation 1 mainly in respect to dimension 1. In other words, constellation
3 is more system-oriented whereas constellation 1 is more action-oriented. It contrasts with
constellation 5 with respect to dimensions 3 and 5 in particular, implying that it has fewer
features associated with informality and with textual interaction. The papers in this
constellation are mostly about the activity of modelling environment change.
Below are two examples of constellation 3 demonstrating the interactions between the
physical world (e.g. CO2-fertilization; carbon emissions) and the world of mathematical
projection (e.g. are converted to concentrations; two alternatives…system).
Focus on system: STAGGER, where appropriate, uses revised model parameters…. The
primary enhancement in STAGGER compared to STUGE is the inclusion of a CO2-
fertilization feedback effect which ensures a balanced carbon cycle at the start of the model
projections in 1990. 1994_Rotman
Focus on the non-research world: We discuss two alternatives for a domestic system of
carbon emissions trading. Option I caps carbon at the point of production. …. Option II is a
“downstream”, “combustor”, or “end-user” system that controls carbon at the point of fuel
combustion. 2000_Holmes
The examples and descriptions above suggest that the three constellations do indeed occupy
different spaces in the research world. Constellation 1 is the most ‘science like’, reporting
empirical work. Constellation 5 is the most ‘social science like’, reporting social and political
attitudes and responses to environmental change. Constellation 3 is the most mathematical
and in some cases articulates a mixed method of working.

22
5.2.2 The other three constellations
As noted above, the greatest similarity measures shown in Figure 4 are for constellations 3
and 6, and for constellations 4 and 5. In this section, constellation 6 will be described in
comparison with 3, constellation 4 in comparison with 5, and constellation 2 will also be
described. These descriptions are carried out in relation to the dimension profiles shown in
Figure 4.
Constellation 6 (‘modelling human beings’) is similar to constellation 3 in terms of
dimensions 1 (high in both) and 4 (low in both). It is also similar to constellation 5 in terms of
dimension 2 (high in both). It contrasts with constellation 1 in all dimensions except 4. The
dimensional profile suggests: a focus on system rather than action; a concern for explicit
argumentation; a focus on text but not on conceptual discourse. Like constellation 3, these
papers explore models and uncertainty, but the models have a more human focus, as shown in
these examples:
Imagine a set of actors, each owning definite quantities of various goods. These actors meet
on a market place, where an auctioneer proposes an arbitrary price scheme for these goods.
1996_Jaeger
Given the technical difficulties and expense of monitoring carbon stock changes at the farm
level, incentives may need to be based on activities rather than upon measured changes in the
soil. Decoupling incentives from carbon accounting would allow for incentive payments to
focus on those practices that have the highest environmental benefits. 2000_Subak
Constellation 4 (‘researching people’), as noted, is somewhat similar to constellation 5. Both
constellations score relatively high on dimensions 3 and 5. Both score low on dimension 4.
They are distinguished in respect of dimension 1 (where constellation 4 scores low and
constellation 5 scores high) and dimension 6 (where constellation 4 scores high and
constellation 5 scores low). This suggests that constellation 4 will be more action-oriented
than is constellation 5 (more concerned with the process of research itself), and more
concerned with the world of things (common nouns) rather than abstractions
(nominalisations). In practice, constellation 4, like constellation 5, focuses on people, and
includes histories of academic and political approaches to issues of environmental change as
well as surveys of public attitude.
The following two examples from this constellation illustrate the focus on action, and
also the interaction with human subjects:

23
A panel of five expert climatologists was selected and assembled to develop future climate
scenarios and their controls. The experts were individually asked to identify and explain each
of the current (1993) climatic controls 1995_Miklas
Respondents were also asked to choose up to three actions, from a list, which they thought
would best tackle climate change. 2008_Pidgeon
The final example shows the reflection upon the history of research into environmental
change:
The scientific community has repeatedly claimed that it will be able to provide more certainty
in future in order to improve the rational basis for policy, but reveals ever more uncertainties
as the timespan needed for reducing them, once proposed for the 1990s, now extends further
into the next century. 1994_Boehmore-Christiansen
Finally, constellation 2 (‘theory’) is the largest constellation in the journal, with 169 papers.
Possibly as a result of the size factor, most of the dimension scores are around the average,
and slightly above the scores in constellation 1. However, the constellation scores relatively
high on dimension 4 and low on dimension 6. This suggests that the constellation will be
action-oriented but will also be discursive, with an emphasis on building an argument around
other researchers’ contributions. Some papers in this constellation construct a history of
research into environmental change, others address theoretical stances taken by various
schools of thought, while others conduct more traditional meta-analyses of existing data.
Focus on action: Just as SCOPE began its activities, UNESCO established its Man and the
Biosphere (MAB) programme in 1971... In some countries, one committee guided research
within both programmes; other countries established a committee for each. 1990_Price
Focus on research paradigms: Proponents of the pluralist paradigm see increasing social
differentiation as the central societal process. By this it is meant that the division of labor
increases as industrialization proceeds and as society becomes more complex.
1995_Sunderlin
Meta-analysis: In a recent application of meta-analysis in the field of land-cover change,
Geist and Lambin (2001) … examined 152 cases of tropical deforestation ...
24
2005_Misselhorn
6. Conclusions
This paper has described the application of MDA to a corpus of eleven thousand journal
articles in the domain of environmental studies. It has identified six dimensions that account
for variation in that corpus and has shown how these dimensions map on to the 11 journals in
the corpus. It has also applied MDA in a novel way, segmenting the holdings of one journal
(GEC) into groups or constellations of texts, identifying sub-corpora on internal rather than
external criteria. The paper has made the argument that the constellations group texts together
that have commonalities in their approaches to research – their concern with developing
predictive models (3 and 6), for example, with discussion of theory and policy (2), or with a
focus on individual voices in human-environment studies (4 and 5).
A set of six dimensions was used in the MDA. It could be argued that the resulting
dimensions were weak, with few distinctive linguistic features (Dimension 6 had only two
features). The corpus of research articles, however, had low degrees of variance compared to
a general corpus of both spoken and written language (as in Biber 1988), and we elected to
use a model that, while low on linguistic features, had potential for a more fine-grained
analysis than would have been possible with, say, a three-dimension model. This choice has
been justified, we propose, by the resulting constellation model that we obtained for GEC,
and the plausibility of the groupings that emerged using this inductive approach.
Gray (2015) identifies three broad research paradigm ‘registers’ and argues
persuasively that discipline is only one factor contributing to variation. The journal that we
have focused on, GEC, is an interdisciplinary journal with contributions from researchers
from different disciplines, working in a range of contexts, and the research papers do not
necessarily fit into neat categories. In our project we have included all the papers, without
filtering, and it may well be that the boundaries between categories are fuzzy. The six
constellations that emerged from the MDA feature, to differing degrees, orientations towards
theory, qualitative and quantitative paradigms, but they also reflect a range of research
approaches to the study of human-environment relationships that differ in their foci and,
interestingly, in attitudes (see 5.2.1 above). The identification of these constellations could
not have been achieved through an a priori categorisation of texts.

25
Endnotes
1 We are grateful to the research department of Elsevier UK, who helped in the planning and
execution of the project, including providing access to all the journals used in our corpus.
2 Personal communication with Andrew Plume, Elsevier UK.
3 http://www.scopus.com/
4 Professor Douglas Biber carried out the tagging process and the exploratory factor
analysis, and advised on the number of factors.
5 Nouns tagged by the Biber tagger as ‘nominalizations’ are identified only by suffixes such
as ‘-tion’. While these do identify genuine nominalisations, there are some false hits and not
all nominalisations are identified by this method.
References
Alsop, S. & Nesi, H. (2009). Issues in the development of the British Academic Written
English (BAWE) corpus. Corpora, 4(1), 71–83.
Biber, D. (1985). Investigating macroscopic textual variation through
multifeature/multidimensional analyses. Linguistics, 23(2), 337–360.
Biber, D. (1988). Variation across speech and writing. Cambridge: Cambridge University
Press.
Biber, D. (1989). A typology of English texts. Linguistics 27, 3-43.
Biber, D. (1990). Methodological issues regarding corpus-based analysis of linguistic
variation. Literary and Linguistic Computing, 5(4), 257–269.
Biber, D. (1995). Dimensions of register variation: A cross-linguistic comparison.
Cambridge: Cambridge University Press.
Biber, D. (2006). University language: A corpus-based study of spoken and written registers.
Amsterdam: John Benjamins.
Biber, D., Conrad, S., & Reppen, R. (1998). Corpus linguistics: Investigating language
structure and use. Cambridge: Cambridge University Press.
Biber, D., & Kurjian, J. (2007). Towards a taxonomy of web registers and text types: A
multidimensional analysis. In M. Hundt, N. Nesselhauf, & C. Biewer (Eds.), Corpus
linguistics and the web (pp. 109–131). Amsterdam: Rodopi.
26
Biber, D., Egbert, J. & Davies, M. (2015). Exploring the composition of the searchable web:
a corpus-based taxonomy of web registers. Corpora 10(1): 11-45.
Biglan, A. (1973).The characteristics of subject matter in academic areas. Journal of Applied
Psychology, 57, 195–203.
Breiman, L. E. O. (2001). Random forests. Machine Learning, 45(1), 5–32.
Charles, M. (2006). The construction of stance in reporting clauses: a cross-disciplinary study
of theses. Applied Linguistics 27(3), 492-518.
Conrad, S., & Biber, D. (2001). Multi-dimensional methodology and the dimensions of
register variation in English. In S. Conrad & D. Biber (Eds.), Variation in English:
Multi-dimensional studies (pp. 13–42). Essex: Pearson Education.
Csomay, E. (2002). Variation in academic lectures: Interactivity and level of instruction. In R.
Reppen, S. Fitzmaurice & D. Biber (eds) Using Corpora to Explore Linguistic Variation
(pp. 203–224). Amsterdam: John Benjamins.
Durrant, P. (2015). Lexical Bundles and Disciplinary Variation in University Students’
Writing: Mapping the Territories Applied Linguistics, 1–30. doi:10.1093/applin/amv011
Egbert, J., Biber, D. & Davies, M. (2015). Developing a bottom-up, user-based method of
web register classification. Journal of the Association for Information Science and
Technology, 66(9), 1817-1831.
Friginal, E. & Weigle, S. (2014). Exploring multiple profiles of L2 writing using multi-
dimensional analysis. Journal of Second Language Writing, 26, 80-95.
Gardner, S., Biber, D. & Nesi, H. (2015). MDA perspectives on discipline and level in the
BAWE corpus. Extended abstract. Biannual Corpus Linguistics Conference Lancaster
University, 21-24 July 2015.
Giannoni, D. (2010) Mapping Academic Values in the Disciplines: A Corpus-based
Approach Bern: Peter Lang.
Gray, B. (2013). More than discipline: uncovering multi-dimensional patterns of variation in
academic research articles. Corpora 8(2), 153-181.
Gray, B. (2015). Linguistic Variation in Research Articles: When Discipline Tells Only Part
of the Story. Amsterdam: John Benjamins.
Grieve, J., Biber, D., Friginal, E. & Nekrasova, T. (2010). Variation among blogs: A multi-
dimensional analysis. In A. Mehler, S. Sharoff, M. Santini (Eds.), Genres on the web:
Corpus studies and computational models (pp. 45–71). Springer-Verlag, New York,
Groom, N. (2005). Pattern and meaning across genres and disciplines: an exploratory study.
Journal of English for Academic Purposes 4(3), 257-277.

27
Halliday, M.A.K. and Hasan, R. (1990). Language, context, and text: aspects of language in
a social-semiotic perspective. Oxford: Oxford University Press.
Halliday, M.A.K. & Martin, J. (1993). Writing science: literacy and discursive power.
Pittsburgh: University of Pittsburgh Press.
Hu, G. & Wang, G. (2014). Disciplinary and ethnolinguistic influences on citation in research
articles. Journal of English for Academic Purposes 14, 14-28.
Hyland, K. (2000). Disciplinary discourses: social interactions in academic writing. Harlow:
Longman.
Hyland, K. (2001a). Bringing in the reader: Addressee features in academic writing. Written
Communication, 18(4), 549-574.
Hyland, K. (2001b). Humble servants of the discipline? Self-mention in research articles.
English for Specific Purposes, 20, 207-226.
Hyland, K. (2008). As can be seen: lexical bundles and disciplinary variation. English for
Specific Purposes. 27(1), 4-21.
Hyland, K. & Bondi, M. (eds.) (2006). Academic Discourse across Disciplines. Bern: Peter
Lang.
Kanoksilapatham, B. (2007). Rhetorical moves in biochemistry research articles. In D. Biber,
U. Connor, & T. A. Upton (Eds.), Discourse on the move: Using corpus analysis to
describe discourse structure (pp. 73–119). Amsterdam: John Benjamins.
Kilgarriff, A., Baisa, V., Bušta, J., Jakubíček, M., Kovář, V., Michelfeit, J., Rychlý, P., &
Suchomel, V. (2014). The Sketch Engine: Ten years on. Lexicography ASIALEX, 1(1),
7-36.
Kuhn, M., & Johnson, K. (2013). Applied predictive modeling. New York, NY: Springer.
Mauranen, A. (2006). Speaking the discipline: Discourse and socialisation in ELF and L1
English. In K. Hyland & M. Bondi (eds) Academic Discourse across Disciplines (pp.
271-294). Bern: Peter Lang.
McGrath, L. (2016). Self-mentions in anthropology and history research articles: Variation
between and within disciplines. Journal of English for Academic Purposes 21, 86–98.
Poos, D. & Simpson, R. (2002). Cross-disciplinary comparisons of hedging: Some findings
from the Michigan Corpus of Spoken Academic English. In R. Reppen, S. Fitzmaurice
& D. Biber (eds) Using Corpora to Explore Linguistic Variation (pp. 3–24).
Amsterdam: John Benjamins.

Appendix 1 Distribution of papers and words across journals and volumes in the Birmingham-Elsevier Environment CorpusJournal 1990-2000 2001 2002 2003 2004 2005 2006 2007 2008 2009 2010 Total(ID) AEE
# of papers NA 100 135 167 128 211 180 195 168 204 230 1,718# of words NA 450,224 552,046 663,835 582,108 878,896 814,139 863,241 734,046 941,407 1,082,516 7,562,458# of words/paper NA 4,502.2 4,089.2 3,975.1 4,547.7 4,165.4 4,523.0 4,426.9 4,369.3 4,614.7 4,706.6 4,401.9
(MD) AWR# of papers NA 60 81 96 88 99 136 171 137 140 129 1,137# of words NA 373,384 561,695 473,464 463,247 530,785 783,637 1,043,230 767,990 816,940 753,378 6,567,750# of words/paper NA 6,223.1 6,934.5 4,931.9 5,264.2 5,361.5 5,762.0 6,100.8 5,605.8 5,835.3 5,840.1 5,776.4
(ID) B# of papers NA 56 71 97 80 92 73 179 126 97 92 963# of words NA 266,989 272,275 473,091 359,780 361,259 348,078 723,932 600,616 475,765 445,618 4,327,403# of words/paper NA 4,767.7 3,834.9 4,877.2 4,497.3 3,926.7 4,768.2 4,044.3 4,766.8 4,904.8 4,843.7 4,493.7
(ID) CEUS# of papers NA 31 27 33 31 33 45 36 39 44 45 364# of words NA 170,584 156,511 176,674 203,589 187,928 272,849 200,025 230,231 262,909 281,975 2,143,275# of words/paper NA 5,502.7 5,796.7 5,353.8 6,567.4 5,694.8 6,063.3 5,556.3 5,903.4 5,975.2 6,266.1 5,888.1
(ID) EP# of papers NA 212 253 241 261 309 410 412 485 423 423 3,429# of words NA 790,382 958,450 935,911 1,027,702 1,228,764 1,612,679 1,625,895 1,913,762 1,695,297 1,724,649 13,513,491# of words/paper NA 3,728.2 3,788.3 3,883.4 3,937.6 3,976.6 3,933.4 3,946.3 3,945.9 4,007.8 4,077.2 3,940.9
(ID) GEC# of papers 223 23 23 25 35 33 35 39 71 49 74 630# of words 1,327,336 142,014 129,388 133,554 201,174 192,181 212,481 257,378 487,880 321,434 503,778 3,908,598# of words/paper 5,952.2 6,174.5 5,625.6 5,342.2 5,747.8 5,823.7 6,070.9 6,599.4 6,871.5 6,559.9 6,807.8 6,204.1
(ID) JRS# of papers NA 31 30 28 31 31 34 32 35 39 40 331# of words NA 272,790 233,709 235,935 262,570 260,924 282,678 279,948 302,590 327,429 342,738 2,801,311# of words/paper NA 8,799.7 7,790.3 8,426.3 8,470.0 8,416.9 8,314.1 8,748.4 8,645.4 8,395.6 8,568.5 8,463.2
(MD) JSIS# of papers NA 16 13 21 17 18 14 18 16 14 21 168# of words NA 106,342 108,322 128,549 129,081 137,405 106,239 142,483 130,959 106,981 168,096 1,264,457# of words/paper NA 6,646.4 8,332.5 6,121.4 7,593.0 7,633.6 7,588.5 7,915.7 8,184.9 7,641.5 8,004.6 7,526.5
(MD) PS# of papers NA 73 201 247 300 293 208 188 140 148 109 1,907# of words NA 230,938 641,962 784,457 996,029 981,897 746,419 702,373 524,547 568,328 439,553 6,616,503# of words/paper NA 3,163.5 3,193.8 3,175.9 3,320.1 3,351.2 3,588.6 3,736.0 3,746.8 3,840.1 4,032.6 3,469.6
(MD) REE# of papers NA 20 18 18 18 19 20 17 30 23 35 218# of words NA 106,778 114,082 106,469 114,232 98,190 115,046 97,932 176,658 126,039 226,084 1,281,510# of words/paper NA 5,338.9 6,337.9 5,914.9 6,346.2 5,167.9 5,752.3 5,760.7 5,888.6 5,480.0 6,459.5 5,878.5
(MD) TRTE# of papers NA 23 24 24 27 27 34 45 42 50 40 336# of words NA 107,707 114,157 116,773 135,696 119,193 145,836 175,004 154,222 203,476 169,419 1,441,483# of words/paper NA 4,682.9 4,756.5 4,865.5 5,025.8 4,414.6 4,289.3 3,889.0 3,672.0 4,069.5 4,235.5 4,290.1
Total# of papers 223 645 876 997 1,016 1,165 1,189 1,332 1,289 1,231 1,238 11,201# of words 1,327,336 3,018,132 3,842,597 4,228,712 4,475,208 4,977,422 5,440,081 6,111,441 6,023,501 5,846,005 6,137,804 51,428,239# of words/paper 5,952.2 4,679.3 4,386.5 4,241.4 4,404.7 4,272.5 4,575.3 4,588.2 4,673.0 4,749.0 4,957.8 4,591.4
Notes. ID = interdisciplinary journal; MD = monodisciplinary journal; AEE = Agriculture, Ecosystems & Environment; AWR =Advances in Water Resources; B = BioSystems; CEUS = Computers, Environment and Urban Systems; EP = Environmental Pollution;GEC = Global Environmental Change; JRS = Journal of Rural Studies; JSIS = Journal of Strategic Information Systems; PS = PlantScience; REE = Resource and Energy Economics; TRTE = Transportation Research Part D: Transport and Environment

Appendix 2: The 53 features used in the multidimensional analysisFeature Example Mean SDword length 5.23 0.20that deletion I think he went to . . . vs. I think that he went to . . . 0.34 0.42contraction isn't, he's 0.11 0.61present tense verb argues, indicates 46.32 18.58second person pronoun and possessive you, your 0.07 0.51demonstrative pronoun This suggests . . . 1.84 1.31first person pronoun and possessive I, our 4.01 4.60be verb is, were 1.19 1.04nominal pronoun someone, everything 0.56 0.59modal of possibility can, may, might, could 5.22 2.57wh- clause I believe what he said. 0.12 0.22preposition in, on 140.36 13.01attributive adjective an interesting finding 68.01 13.91past tense verb examined, demonstrated 30.57 14.93third person pronoun and possessive except it she, his 2.97 3.05perfect aspect The study has shown . . . 4.24 2.22coordinating conjunction – phrasal connector review and test 2.32 1.46nominalization realization, establishment 62.87 38.74adverb very, socially 27.87 6.28modal of prediction will, would, shall 1.59 1.88modal of necessity ought, should, must 0.84 0.95conjunct however, therefore, thus 5.51 2.27predicative adjective The finding is impressive. 5.55 2.11passive voice It was assumed that . . . 25.82 7.14communication verb in other contexts the study informs us of . . . 6.66 4.79likelihood verb in other contexts it appears to be true 4.90 3.39stance noun + prepositional phrase expectation of 2.12 1.35determiner + stance noun the wish 0.83 0.89
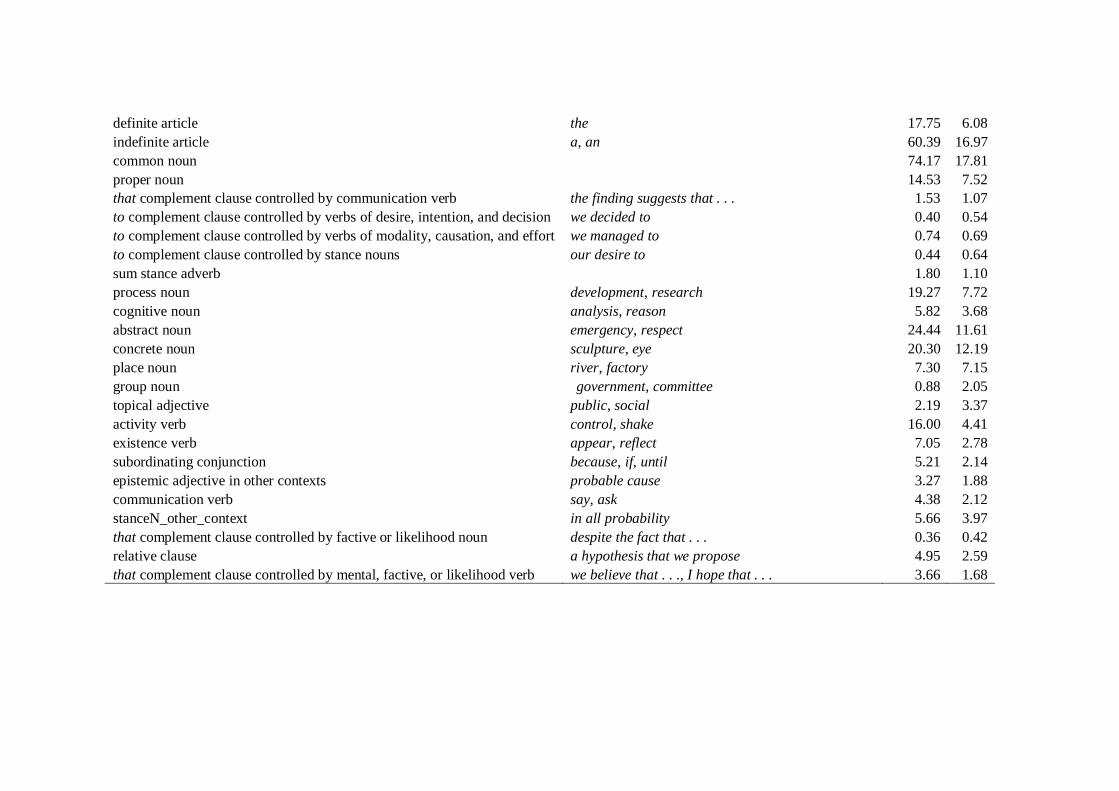
definite article the 17.75 6.08indefinite article a, an 60.39 16.97common noun 74.17 17.81proper noun 14.53 7.52that complement clause controlled by communication verb the finding suggests that . . . 1.53 1.07to complement clause controlled by verbs of desire, intention, and decision we decided to 0.40 0.54to complement clause controlled by verbs of modality, causation, and effort we managed to 0.74 0.69to complement clause controlled by stance nouns our desire to 0.44 0.64sum stance adverb 1.80 1.10process noun development, research 19.27 7.72cognitive noun analysis, reason 5.82 3.68abstract noun emergency, respect 24.44 11.61concrete noun sculpture, eye 20.30 12.19place noun river, factory 7.30 7.15group noun government, committee 0.88 2.05topical adjective public, social 2.19 3.37activity verb control, shake 16.00 4.41existence verb appear, reflect 7.05 2.78subordinating conjunction because, if, until 5.21 2.14epistemic adjective in other contexts probable cause 3.27 1.88communication verb say, ask 4.38 2.12stanceN_other_context in all probability 5.66 3.97that complement clause controlled by factive or likelihood noun despite the fact that . . . 0.36 0.42relative clause a hypothesis that we propose 4.95 2.59that complement clause controlled by mental, factive, or likelihood verb we believe that . . ., I hope that . . . 3.66 1.68
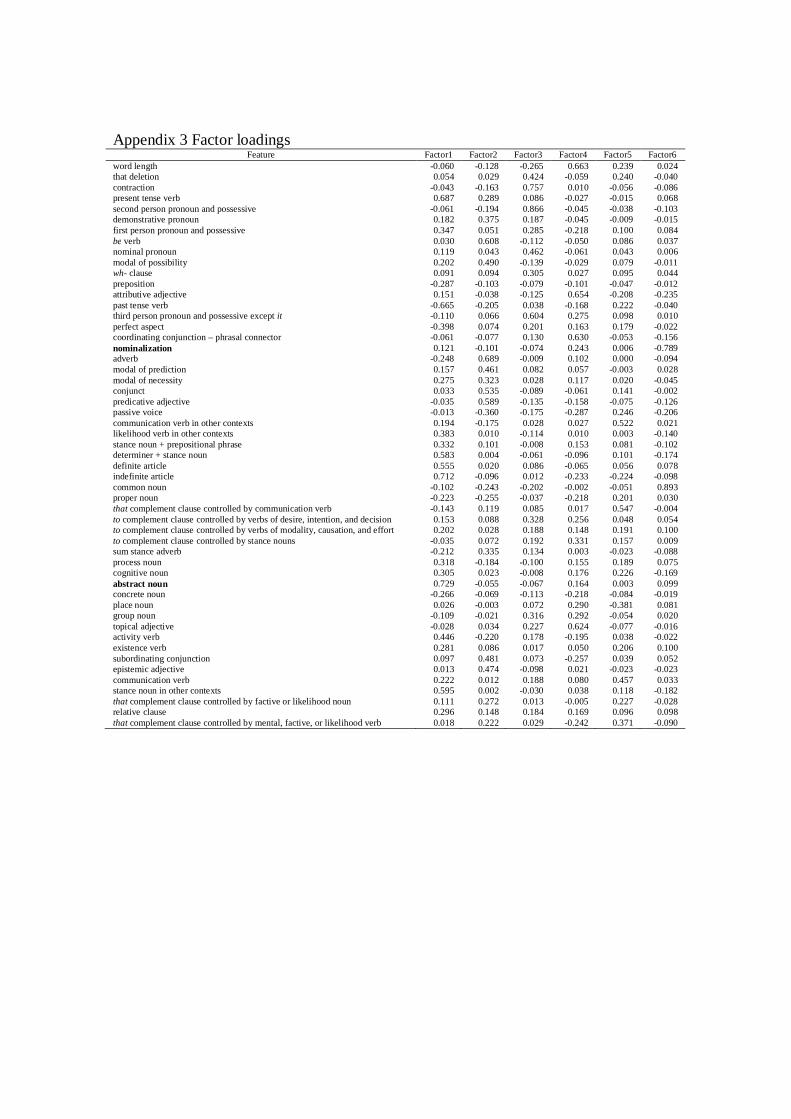
Appendix 3 Factor loadingsFeature Factor1 Factor2 Factor3 Factor4 Factor5 Factor6
word length -0.060 -0.128 -0.265 0.663 0.239 0.024that deletion 0.054 0.029 0.424 -0.059 0.240 -0.040contraction -0.043 -0.163 0.757 0.010 -0.056 -0.086present tense verb 0.687 0.289 0.086 -0.027 -0.015 0.068second person pronoun and possessive -0.061 -0.194 0.866 -0.045 -0.038 -0.103demonstrative pronoun 0.182 0.375 0.187 -0.045 -0.009 -0.015first person pronoun and possessive 0.347 0.051 0.285 -0.218 0.100 0.084be verb 0.030 0.608 -0.112 -0.050 0.086 0.037nominal pronoun 0.119 0.043 0.462 -0.061 0.043 0.006modal of possibility 0.202 0.490 -0.139 -0.029 0.079 -0.011wh- clause 0.091 0.094 0.305 0.027 0.095 0.044preposition -0.287 -0.103 -0.079 -0.101 -0.047 -0.012attributive adjective 0.151 -0.038 -0.125 0.654 -0.208 -0.235past tense verb -0.665 -0.205 0.038 -0.168 0.222 -0.040third person pronoun and possessive except it -0.110 0.066 0.604 0.275 0.098 0.010perfect aspect -0.398 0.074 0.201 0.163 0.179 -0.022coordinating conjunction – phrasal connector -0.061 -0.077 0.130 0.630 -0.053 -0.156nominalization 0.121 -0.101 -0.074 0.243 0.006 -0.789adverb -0.248 0.689 -0.009 0.102 0.000 -0.094modal of prediction 0.157 0.461 0.082 0.057 -0.003 0.028modal of necessity 0.275 0.323 0.028 0.117 0.020 -0.045conjunct 0.033 0.535 -0.089 -0.061 0.141 -0.002predicative adjective -0.035 0.589 -0.135 -0.158 -0.075 -0.126passive voice -0.013 -0.360 -0.175 -0.287 0.246 -0.206communication verb in other contexts 0.194 -0.175 0.028 0.027 0.522 0.021likelihood verb in other contexts 0.383 0.010 -0.114 0.010 0.003 -0.140stance noun + prepositional phrase 0.332 0.101 -0.008 0.153 0.081 -0.102determiner + stance noun 0.583 0.004 -0.061 -0.096 0.101 -0.174definite article 0.555 0.020 0.086 -0.065 0.056 0.078indefinite article 0.712 -0.096 0.012 -0.233 -0.224 -0.098common noun -0.102 -0.243 -0.202 -0.002 -0.051 0.893proper noun -0.223 -0.255 -0.037 -0.218 0.201 0.030that complement clause controlled by communication verb -0.143 0.119 0.085 0.017 0.547 -0.004to complement clause controlled by verbs of desire, intention, and decision 0.153 0.088 0.328 0.256 0.048 0.054to complement clause controlled by verbs of modality, causation, and effort 0.202 0.028 0.188 0.148 0.191 0.100to complement clause controlled by stance nouns -0.035 0.072 0.192 0.331 0.157 0.009sum stance adverb -0.212 0.335 0.134 0.003 -0.023 -0.088process noun 0.318 -0.184 -0.100 0.155 0.189 0.075cognitive noun 0.305 0.023 -0.008 0.176 0.226 -0.169abstract noun 0.729 -0.055 -0.067 0.164 0.003 0.099concrete noun -0.266 -0.069 -0.113 -0.218 -0.084 -0.019place noun 0.026 -0.003 0.072 0.290 -0.381 0.081group noun -0.109 -0.021 0.316 0.292 -0.054 0.020topical adjective -0.028 0.034 0.227 0.624 -0.077 -0.016activity verb 0.446 -0.220 0.178 -0.195 0.038 -0.022existence verb 0.281 0.086 0.017 0.050 0.206 0.100subordinating conjunction 0.097 0.481 0.073 -0.257 0.039 0.052epistemic adjective 0.013 0.474 -0.098 0.021 -0.023 -0.023communication verb 0.222 0.012 0.188 0.080 0.457 0.033stance noun in other contexts 0.595 0.002 -0.030 0.038 0.118 -0.182that complement clause controlled by factive or likelihood noun 0.111 0.272 0.013 -0.005 0.227 -0.028relative clause 0.296 0.148 0.184 0.169 0.096 0.098that complement clause controlled by mental, factive, or likelihood verb 0.018 0.222 0.029 -0.242 0.371 -0.090

Figure 1: Scree plot

Figure 2. Mean Dimension Score and Standard Deviation of Each Journal in Each Dimension.
(ID) AEE (SD = 45.0)
(ID) B (SD = 44.0)(ID) CEUS (SD = 30.8)
(ID) EP (SD = 36.7)
(ID) GEC (SD = 33.1)(ID) JRS (SD = 29.7)
(MD) AWR (SD = 36.3)
(MD) JSIS (SD = 33.4)
(MD) PS (SD = 26.7)
(MD) REE (SD = 34.9)
(MD) TRTE (SD = 39.2)
120
160
200
240
280Dimension 1
(ID) AEE (SD = 13.0)
(ID) B (SD = 18.0)(ID) CEUS (SD = 14.2)
(ID) EP (SD = 13.1)
(ID) GEC (SD = 16.3)(ID) JRS (SD = 12.8)
(MD) AWR (SD = 14.4)
(MD) JSIS (SD = 14.2)
(MD) PS (SD = 12.7)
(MD) REE (SD = 17.9)
(MD) TRTE (SD = 17.8)
20
30
40
50
60
Dimension 2
(ID) AEE (SD = 3.2)(ID) B (SD = 3.4)
(ID) CEUS (SD = 4.4)
(ID) EP (SD = 2.2)
(ID) GEC (SD = 5.9)
(ID) JRS (SD = 12.3)
(MD) AWR (SD = 2.0)
(MD) JSIS (SD = 9.7)
(MD) PS (SD = 1.8)
(MD) REE (SD = 6.1)(MD) TRTE (SD = 7.2)
5
10
15
20
Dimension 3
(ID) AEE (SD = 15.2)
(ID) B (SD = 13.8)
(ID) CEUS (SD = 16.6)
(ID) EP (SD = 13.4)
(ID) GEC (SD = 19.3) (ID) JRS (SD = 20.1)
(MD) AWR (SD = 13.7)
(MD) JSIS (SD = 13.1)
(MD) PS (SD = 13.3)
(MD) REE (SD = 14.1)
(MD) TRTE (SD = 13.9)
70
80
90
100Dimension 4
(ID) AEE (SD = 10.7)
(ID) B (SD = 7.5)
(ID) CEUS (SD = 11.7)
(ID) EP (SD = 7.3)
(ID) GEC (SD = 11.9) (ID) JRS (SD = 10.8)(MD) AWR (SD = 8.2)
(MD) JSIS (SD = 7.3)(MD) PS (SD = 8.8)
(MD) REE (SD = 14.7)
(MD) TRTE (SD = 11.3)
0
5
10
15
Dimension 5
(ID) AEE (SD = 55.9)
(ID) B (SD = 15.1)
(ID) CEUS (SD = 24.0)(ID) EP (SD = 23.7)
(ID) GEC (SD = 21.7)
(ID) JRS (SD = 56.3)
(MD) AWR (SD = 22.6)
(MD) JSIS (SD = 15.8)
(MD) PS (SD = 48.3)
(MD) REE (SD = 23.8)
(MD) TRTE (SD = 22.7)0
50
Dimension 6
Dim
ensi
onSc
ore
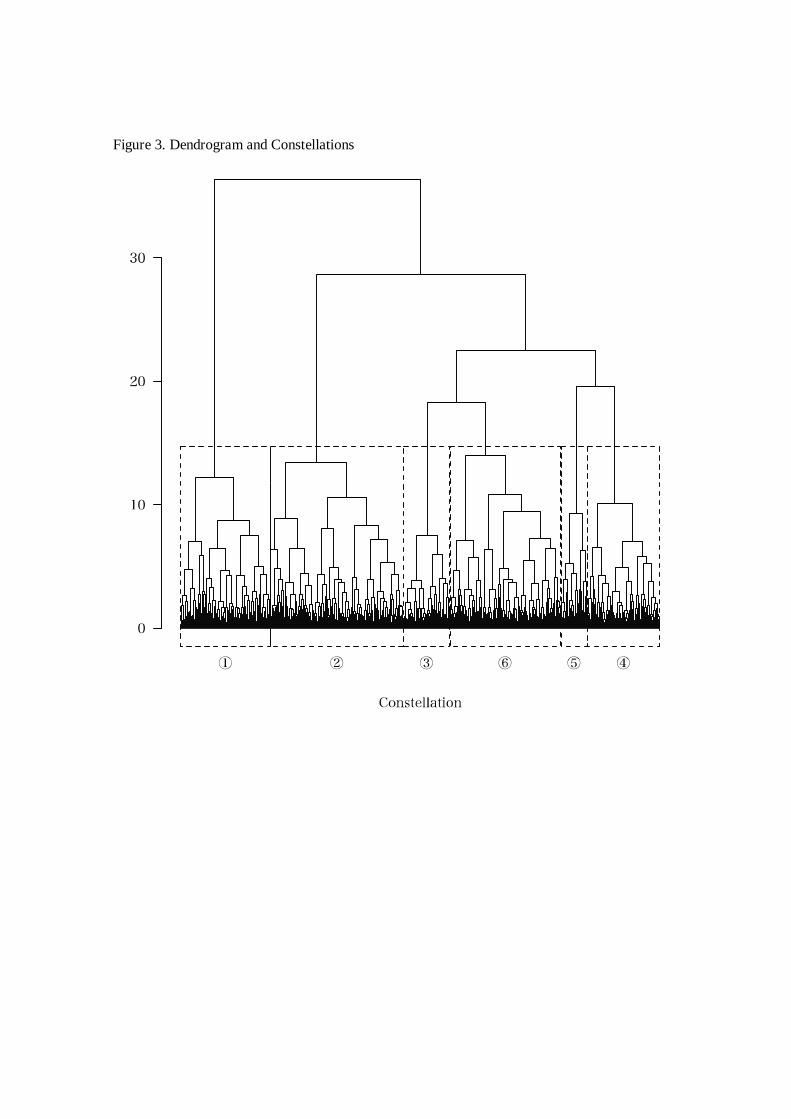
Figure 3. Dendrogram and Constellations
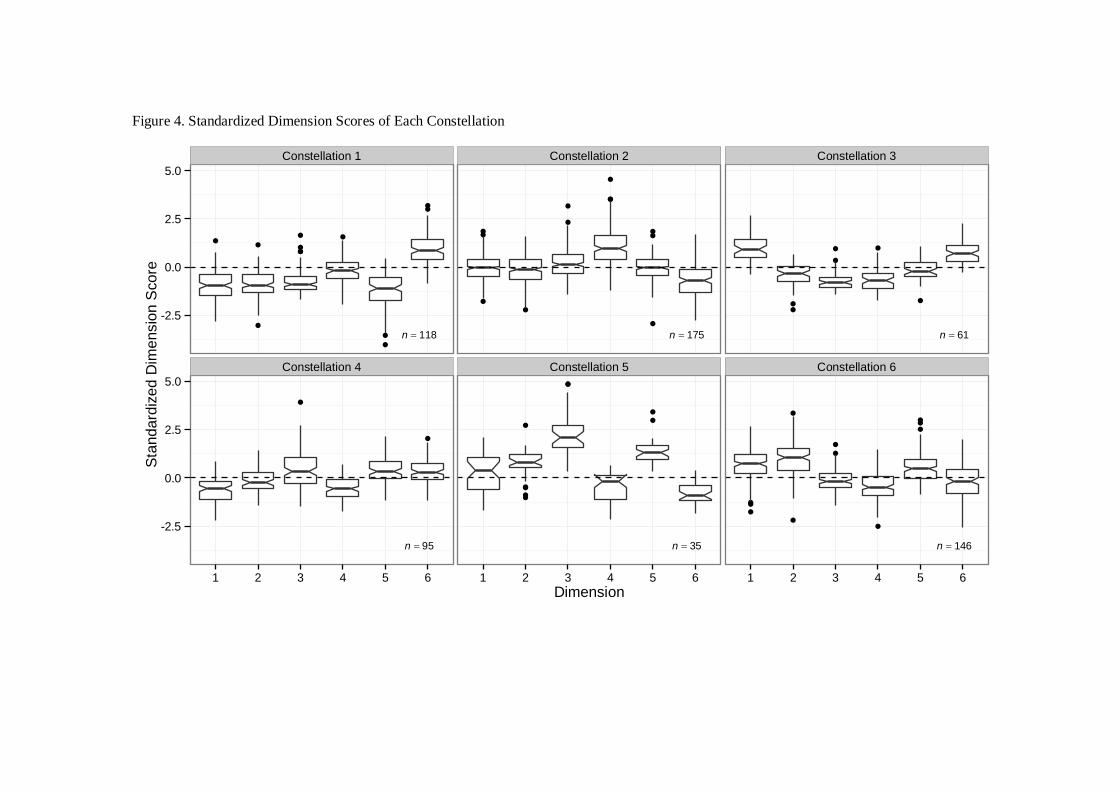
Figure 4. Standardized Dimension Scores of Each Constellation
n = 118 n = 175 n = 61
n = 95 n = 35 n = 146
Constellation 1 Constellation 2 Constellation 3
Constellation 4 Constellation 5 Constellation 6
-2.5
0.0
2.5
5.0
-2.5
0.0
2.5
5.0
1 2 3 4 5 6 1 2 3 4 5 6 1 2 3 4 5 6Dimension
Stan
dard
ized
Dim
ensi
onS
core

Copyright © 2022 FDOKUMEN

