


Bahasa
Halaman
Hukum


M.R.K. INDUSTRIES CR.gj:
M.R.K.Industries, B-398 (b),ih Cross, 1st Stage, Peenya Industrial Estate, Bangalore-560 058
To Whom so ever it may Concern
(])ate:
Date: 16/04/2018
This is to certify that Ms.Shreya R (bearing USN number 1AZ16MBA62), MBA student of Acharya Institute of Technology, Bangalore has completed her "PROJECT WORK" during the period of 15th January 2018 to 24TH March 2018.
The Management of MRK Industries takes this opportunity to register the appreciation for the enthusiasm and punctuality showed by Ms.Shreya.R and wishes her all the best fer her future endeavours.
Thanking you,
For M.R.K.Industries,
t~~~-(R.Krishnamurthy)
B-398(8), 7th Cross, Peenya Industrial Estate, 1st Stage, Bengaluru-560 058 Phone: +91 080 28370747, 28392549, Mob.: 9972372101/4
E-mail : [email protected] Website : www.mrkindustrires.co.in
ACHARYA INSTITUTE OF TECHNOLOGY
~Affiliated to Visvesvaraya Technological Umvers1ty, Belagav1, Approved byAICTE,NewDelhi and Accredited byNBA and NAAC)
Date: 16/05/2018
CERTIFICATE
This is to certify that Ms. Shreya R bearing USN 1AZ16MBA62 is a
bonafide student of Master of Business Administration course of the Institute
2016-18 batch, affiliated to Visvesvaraya Technological University, Belgaum.
Project report on "A Study on Quality of Work Life" at MRK Industries
Bangalore 1s prepared by her under the guidance of
Prof. Bhagyashree G Kasturi, in partial fulfillment of the requirements for
the award of the degree of Master of Business Administration, Visvesvaraya
Technological University, Belgaum, Kamataka.
Signatu e of Internal Guide
~
Signature of HOD Heaa nf thP Department
f\ · · rf MBA "-\c:h~ .. -: . echnr:, · ~otdeva~ · ··· .<# · : .rre-5(,~ , .. ..
~'4)~ Signature ofPrincipal
Pkit-.JCl~i\L ACHARYA INSTITUTE OF TEvnt~OLOG't' <)oldevanahalll Bsngalore-560 107
Acharya Dr Sarvepalli Radhakrishnan Road, Soladevanahalli. Acharya P.O., Bangalore 560107. Karnataka, India • wwwacharya.ac.in/ait/ • Ph: +91-80-225 555 55 Extn. · 2102 • Fax: +91 -80-237 002 42 • E-mail: principalait@acharya .ac.in
..
.. '
DECLARATION
I, Ms. Shreya R hereby declare that the Project report entitled "A STUDY ON QUALITY
OF WORK LIFE AT MRK INDUSTRIES" is prepared by me under the
guidance(Intemal) of Mrs. Bhagyashree G Kasturi, Assistant Professor, Dept. of M.B.A,
Acharya Institute of Technology, Bangalore and guidance (External) by Mr. R Krishna
Murthy, Managing Partner, Bengaluru.
I declare that this Project report is towards the partial fulfilment of the university regulations
for the award of degree of Master of Business Administration by Visvesvaraya Technological
University, Belagavi.
I further declare that this project report is based on the original study undertaken by me and
has not been submitted to any other University/Institution for the award of any
degree/diploma.
Date: '2 <a M ~ 2 0 I ~
Place: Bengaluru
Ms. Shreya R
USN:1AZ16MBA62
ACKNOWLEDGEMENT
I wish to express my sincere thanks to Dr SC Pilli Principal, Dr Mahesha K, Dean
Academics, Acharya Institute of Technology, Bengaluru for their kind cooperation in
completion of the project.
I wish to express my deep sense of gratitude to Prof Dr Nijaguna G, HOD,
Department of MBA Acharya Institute of Technology for his immense help in completion
of the project.
I acknowledge the keen interest shown in my project and constant encouragement
given by my internal guide Mrs. Bhagyashree G Kasturi Assistant Professor, Department
of Management Studies and Research, Acharya Institute of Technology, Bengaluru and
external guide Mr R Krishna Murthy – Managing Partner, Bengaluru.
Finally, I express my sincere thanks to all the staff of MBA department, AIT for
their valuable suggestions in fine tuning the report.
Ms. Shreya R
USN:1AZ16MBA62
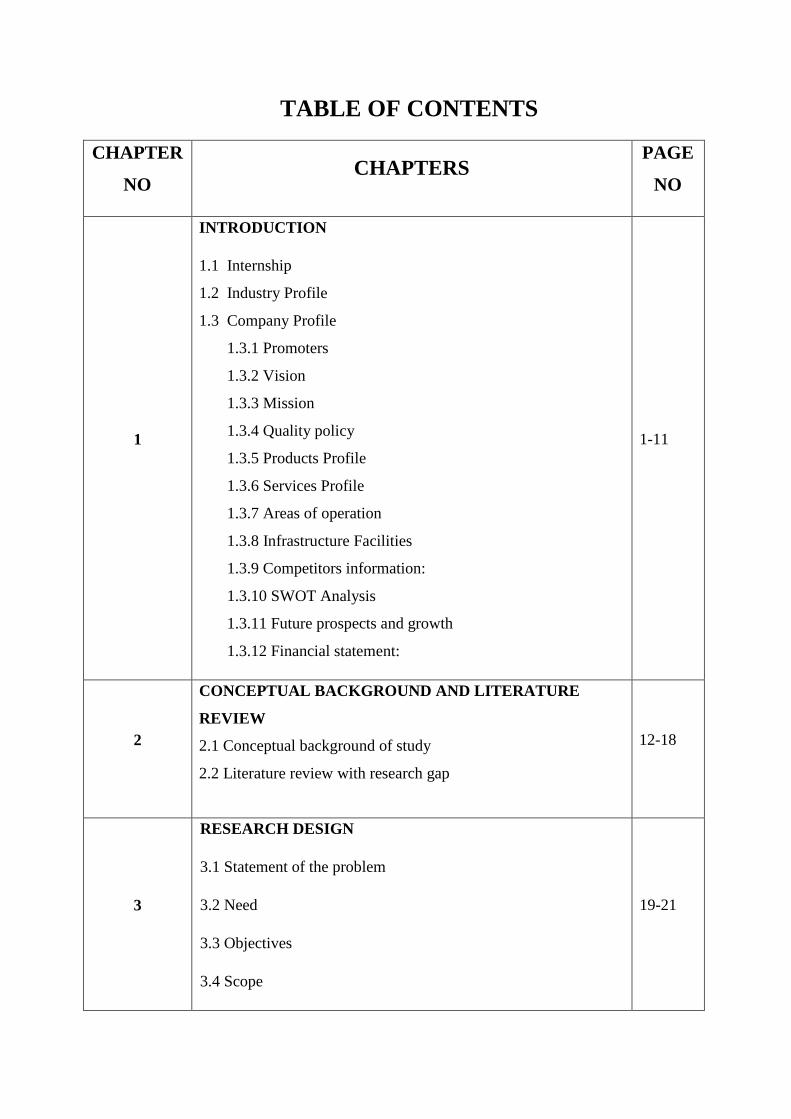
TABLE OF CONTENTS
CHAPTER
NO CHAPTERS
PAGE
NO
1
INTRODUCTION
1.1 Internship
1.2 Industry Profile
1.3 Company Profile
1.3.1 Promoters
1.3.2 Vision
1.3.3 Mission
1.3.4 Quality policy
1.3.5 Products Profile
1.3.6 Services Profile
1.3.7 Areas of operation
1.3.8 Infrastructure Facilities
1.3.9 Competitors information:
1.3.10 SWOT Analysis
1.3.11 Future prospects and growth
1.3.12 Financial statement:
1-11
2
CONCEPTUAL BACKGROUND AND LITERATURE
REVIEW
2.1 Conceptual background of study
2.2 Literature review with research gap
12-18
3
RESEARCH DESIGN
3.1 Statement of the problem
3.2 Need
3.3 Objectives
3.4 Scope
19-21
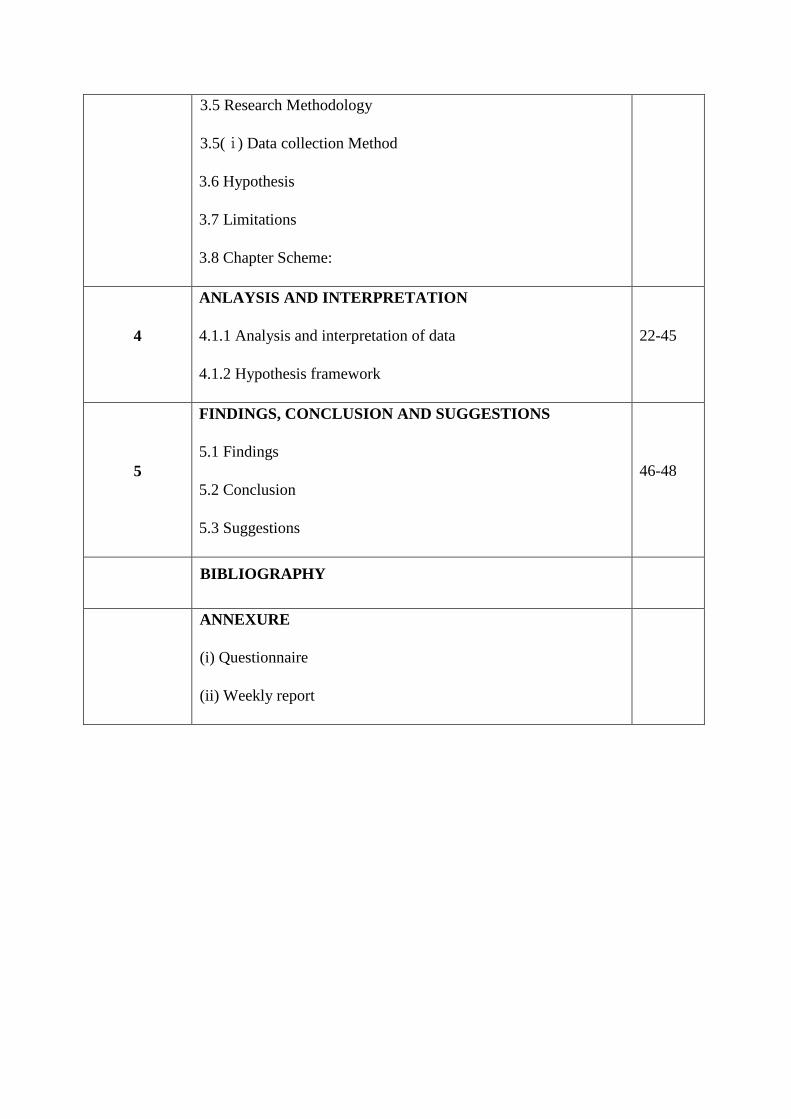
3.5 Research Methodology
3.5(ⅰ) Data collection Method
3.6 Hypothesis
3.7 Limitations
3.8 Chapter Scheme:
4
ANLAYSIS AND INTERPRETATION
4.1.1 Analysis and interpretation of data
4.1.2 Hypothesis framework
22-45
5
FINDINGS, CONCLUSION AND SUGGESTIONS
5.1 Findings
5.2 Conclusion
5.3 Suggestions
46-48
BIBLIOGRAPHY
ANNEXURE
(i) Questionnaire
(ii) Weekly report

LIST OF TABLES
TABLE
NO TITLE OF THE TABLE
PAGE
NO
Table-1.1
Table showing employment information of MRK Industries 3
Table-1.2
Table showing machines for unit expansion 3
Table-1.3
Table shows AC Motor products and its components 5
Table-1.4 Table shows DC Motor products and its components
6
Table-1.5 Table showing services profile
6
Table-1.6 Table shows MRK Industries unit information
7
Table-1.7 Table shows MRK Industries existing machinery
8
Table-1.8 Table shows SWOT Analysis of MRK Industries
9
Table-2.1 Table shows QWL contributing factors
13
Table-4.1 Table shows Respondents’ Age group 22

Table-4.2 Table shows Respondents by Gender
23
Table-4.3 Table shows Respondents based on work experience
24
Table-4.4 Table shows Respondents based on Income
25
Table-4.5 Table shows Communication strategy in MRK Industries
26
Table-4.6 Table shows Freedom to offer suggestions at MRK Industries
27
Table-4.7 Table shows Leadership style practiced at MRK Industries
28
Table-4.8 Table shows Satisfaction with the current job at MRK Industries
29
Table-4.9 Table shows Job security provisions at MRK Industries.
30
Table-4.10
Table shows Management involves employees in the decision-
making process 31
Table-4.11
Table shows Employee satisfactions with grievance cell at MRK
Industries 32
Table-4.12
Table shows Employee satisfactions with health and medical care
facilities at MRK Industries 33
Table-4.13
Table shows Organization utilizes employees’ knowledge, skill and
abilities to the optimally at MRK Industries 34

Table-4.14
Table shows Employees satisfaction with training and development
(T and D) programmes at MRK Industries 35
Table-4.15
Table shows MRK Industries’ merit and performance-based
appraisal 36
Table-4.16 Table shows Job roles at MRK Industries
37
Table-4.17 Table shows Stress levels at MRK Industries
38
Table-4.18 Table shows Quality of Work Life is good
39
Table-4.19 Table shows opinion on Quality of work life
40
Table-4.20
Table shows Satisfaction with MRK Industries’ long working
hours 41
Table-4.21 Table shows Organization motivates to increase productivity
42
Table-4.22
Table 4.22 Most motivating factors to the employees at MRK
Industries 43
Table-4.23 Table shows Freedom to perform duties at MRK Industries
44
Table-4.1.2 Table shows results obtained from the hypothesis
45
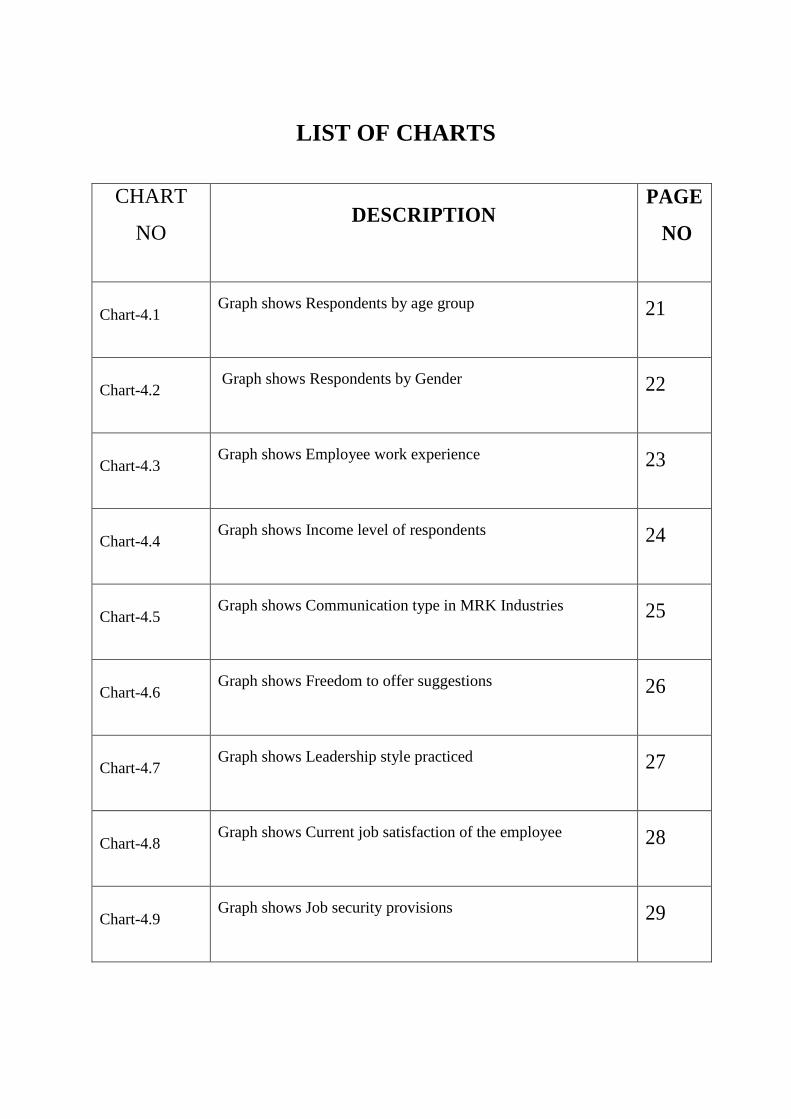
LIST OF CHARTS
CHART
NO DESCRIPTION
PAGE
NO
Chart-4.1 Graph shows Respondents by age group 21
Chart-4.2 Graph shows Respondents by Gender 22
Chart-4.3 Graph shows Employee work experience 23
Chart-4.4 Graph shows Income level of respondents 24
Chart-4.5 Graph shows Communication type in MRK Industries 25
Chart-4.6 Graph shows Freedom to offer suggestions 26
Chart-4.7 Graph shows Leadership style practiced 27
Chart-4.8 Graph shows Current job satisfaction of the employee 28
Chart-4.9 Graph shows Job security provisions 29

Chart-4.10 Graph shows Employees involvement in decision making 30
Chart-4.11 Graph shows Employee satisfaction with grievance cell 31
Chart-4.12
Graph shows Employee satisfaction with health and medical
facilities 32
Chart-4.13 Graph shows KSA optimum utilization 33
Chart-4.14
Graph shows Employee satisfaction with training and
development (T and D) programmes 34
Chart-4.15 Graph shows Merit and performance-based appraisal system 35
Chart-4.16 Graph shows Clear job roles in MRK Industries 36
Chart-4.17 Graph shows Stress levels of the respondents 37
Chart-.18 Graph shows Respondents’ good quality of work life 38
Chart-4.19 Graph shows Respondents opinion on quality of work life 39
Chart-4.20
Graph shows Employee satisfaction with the long working
hours 40
Chart-4.21 Graph shows Organization’s motivation to increase productivity 41

Chart-4.22 Graph shows Employees most motivating factor 42
Chart-4.23 Graph shows Employees freedom to perform duties 43

Executive summary:
MRK Industries is an automotive manufacturing and servicing organization. The primary
products for business are Alternate Current and Direct Current motors while auxiliary
business is servicing and repairs for small, medium and large-scale industries. MRK
Industries is a private limited company established by Mr Krishna Murthy in 1994. The
company received authorisation for servicing of motors from Kirloskar Electric Company. It
is planning on export projects for Alternate Current and Direct Current motors
Quality of life leads to well-being, holistic growth of employees in organization. High
Quality of work life ensures effective production and performance by employees. Parameters
in work life are stress, job satisfaction, future career prospects, flexible working hours,
motivation and well-being, working conditions, job security
The Quality of work life at MRK Industries is good and employees are satisfied with their
current job positions, health and medical facilities, training and development programmes in
the organization.
However, it was found that the employees might perform better when work place stress levels
are reduced. They also work efficiently when they are rewarded with incentives, promotions
for their performance. The management needs to involve employees in the decision making
as it helps create a sense of belongingness, encourages participation while reducing employee
dissatisfaction. Employees are the organizations assets and resources and when they are
satisfied it leads to growth and development of the business.
The internship project provided a learning platform and an opportunity to acquire information
and experience from trained professionals.
Key words:
QWL - Quality of Work Life
HR- Human Resource
1
1.1 Introduction
Internship is a period of supervised training where students can gain experience and training.
There are numerous benefits from internship programs. Some of the advantages are:
Gaining knowledge about industry
Guidance from company experts
Networking
Exposure to real world problems
Cultivates adaptability
Smooth transitioning into work environment.
Internship provides a practical learning platform for students. Internship can be paid or
unpaid in nature. Students can learn about the company and the industry first hand through
internship training program.
Internship helps students in networking with the professional experts and receive training
under their guidance. Internship provides exposure to students about real life scenarios and
prepares them before stepping into the work environment.
Students learn about the organization culture and cultivates adaptability to cope with the
challenges of the professional life.
My internship training was done for a period of ten weeks at MRK Industries: A partnership
firm by Mr Krishna Murthy.
1.2 Industry profile
In India, the auto industry contributes for 7.1% of Gross Domestic Product and 22% to
manufacturing GDP and it is one of the largest in the world. Electric motors are integral part
of Electric equipment industry in India.
Agriculture and Industrial sectors consume more than 75% of the motor industry in India as it
is primarily used for irrigation. The Government of India has launched various initiatives to
increase and maintain the automotive trend.
These motors have high market value as they are vastly used in multiple manufacture
industries like cement, steel, paper, sugar manufacturing along with irrigation and traction
applications. India is one of the major players in auto motor industry.
2
The Narendra Modi Government launched Make in India campaign to be self-sufficient while
reducing import to increase the country’s economy. This initiative provides opportunity for
millions of jobs while developing overall status of nation and standard of living.
1.3 Company profile
MRK Industries started in the year 1994. MRK Industries is a partnership firm started by Sri
R Krishnamurthy, Smt Rajeshwari Krishnamurthy and Smt Mangala Gowramma.
Mr. R Krishnamurthy is the managing partner of MRK industries.
Mr Krishna Murthy is a mechanical engineer who worked at Kirloskar electric company for
15 years before becoming an entrepreneur and starting MRK Industries. R Krishnamurthy is a
mechanical engineer from Vishweshwariah Technological University and worked at New
Government Electrical Factory (NGEF) for 3 years before setting up MRK industries. Mr
Krishna Murthy being an engineer has vast knowledge and experience in motor
manufacturing and servicing. Mr Krishna Murthy is also a social worker and is an executive
member of Peenya Industries Association and Karnataka Small Scale Industrial Association.
MRK Industries manufactures Direct Current motors to Kirloskar Electric Company. The
company received authorisation for servicing of motors from Kirloskar Electric Company. It
also involves in servicing of Alternate Current and Direct Current motors for Kirloskar
Electric Company throughout India. It also provides servicing and repair of industrial motors
to the neighbourhood small scale manufacturing industries.
MRK Industries undertakes projects of rewinding of Alternate Current and Direct Current
motors. DC motors are widely used in automotive and industrial applications.
MRK industries initially started with an investment of 5,00,000 INR and currently has a
turnover of 25,00,000 INR per annum. Initially it started with assembly of small motor
machinery parts. The office is located on a ¾ acre of land in the Peenya Industrial layout,
Bengaluru. MRK Industries is widely recognised for manufacture and service provider of DC
motors and has received numerous accolades, awards for their works.
MRK industries is planning on export projects for Alternate Current and Direct Current
motors. There is a huge demand for these motors in cement, steel, paper, sugar manufacturing
along with irrigation and traction applications. The existing MRK unit is financed by
Karnataka bank with future prospects of unit expansion.

3
This unit is issued authorization for servicing Alternate Current and Direct Current motors
from 1 HP to 1500 HP and manufacturing range is 1 HP to 75 HP. The current turnover of the
company is 2 crores INR with profits of 45 lakh INR per annum. MRK Industries
manufactures various kinds of Alternate Current and Direct Current motors.
MRK Industries though is involved in manufacture of AC and DC motors it also takes up
repair and servicing of motors from the neighbourhood small scale industries.
1.3(ⅰ) Employment information
Employment
Skilled employees – 80
Unskilled employees – 40
Supervisors – 8
Managers – 2
1.1 Table showing employment information of MRK Industries
1.3(ⅱ) Machines for unit expansion
Machine required for unit expansion
Land 2 Acres- 80,000 sq. feet
Building – 3,00,000 sq. feet
1.2 Table showing machines for unit expansion
4
1.3.1 Promoters:
The primary promoters of the company are its partners Sri R Krishnamurthy, Smt
Rajeshwari Krishnamurthy and Smt Mangala Gowramma. Mr. R Krishnamurthy is the
managing partner of MRK industries.
1.3.2 Vision:
To reach the highest standard in production and servicing of motors.
1.3.3 Mission:
To provide high standard service, rewinding and repair solutions of Alternate Current and
Direct Current motors to local industries- MICRO, small, medium and large-scale industries.
1.3.4 Quality policy:
‘We, at M.R.K. Industries, Bangalore are committed, to supply the quality Electrical Motors
and its services by practicing.
1. Enhancing Customer Satisfaction
2. Leadership
3. Involving all concerned people of the organization
4. Continual Improvement of Quality Management System
5. Mutually beneficial supplier relationships

5
1.3.5 Products Profile:
1.3.5(i) AC Motor products
AC Motor Products
AC Motor
Commutator Machine
Transformer Bobbin
Commutator
Commutator Segment
Electric Motors
Field Coil
Gear Parts
Motor Stampings
Stators
Laminated Yoke
AC Motor additional parts
Terminal Box
Drive Shaft
Stator Winding
Rotor Winding
Cooling fan
1.3 Table showing AC Motor products and its components

6
1.3.5(ii) DC Motor products
DC Motor Products
DC Motors
Brush Cover
Rotor Assembly
Motor Brush Assembly
Motor Front Cover
Motor Pulley
Motor Bearing
Motor Brush Holder
DC Motor additional parts
Rotor Coil
Motor Shaft
Magnetic Motor Stator
Electric Motor Brush
1.4 Table showing DC Motor products and its components
1.3.6 Services Profile:
Generator Repairing Service
AC Motors Repairing Service
DC Motors Repairing Service
Generator Rewinding Service
1.5 Table showing services profile
7
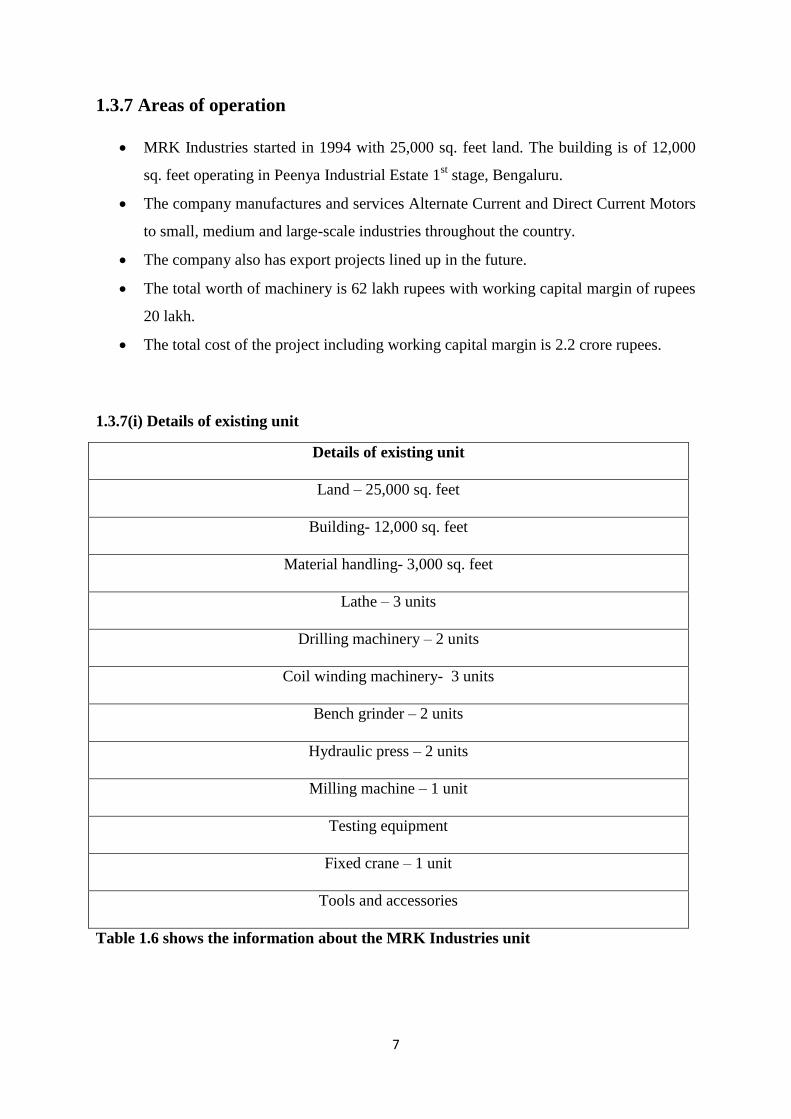
1.3.7 Areas of operation
MRK Industries started in 1994 with 25,000 sq. feet land. The building is of 12,000
sq. feet operating in Peenya Industrial Estate 1st stage, Bengaluru.
The company manufactures and services Alternate Current and Direct Current Motors
to small, medium and large-scale industries throughout the country.
The company also has export projects lined up in the future.
The total worth of machinery is 62 lakh rupees with working capital margin of rupees
20 lakh.
The total cost of the project including working capital margin is 2.2 crore rupees.
1.3.7(i) Details of existing unit
Details of existing unit
Land – 25,000 sq. feet
Building- 12,000 sq. feet
Material handling- 3,000 sq. feet
Lathe – 3 units
Drilling machinery – 2 units
Coil winding machinery- 3 units
Bench grinder – 2 units
Hydraulic press – 2 units
Milling machine – 1 unit
Testing equipment
Fixed crane – 1 unit
Tools and accessories
Table 1.6 shows the information about the MRK Industries unit

8
1.3.7(ii) Information about existing machinery
Existing machinery
Lathe – 4 units
Drilling machine – 2 units
Hydraulic press – 2 units
Balancing machine – 2 units
Oven – 2 units
Testing equipment
Band saw – 1 unit
Milling Machinery – 1 unit
Rolling mill- 1 unit
Coil winding machinery – 3 units
Electrical furnace – 1 unit
Table 1.7 shows the information of the existing machinery in MRK Industries
1.3.8 Infrastructure Facilities:
MRK Industries is facilitated by an advance infrastructure for undertaking various
business activities.
The infrastructure facilities of latest technologies enable to meet the demands of the
customer effectively and efficiently.
The advanced equipment provides best quality products and services.
1.3.9 Competitors information:
There are various Alternate Current and Direct Current Motor manufacturing companies
that provide motors at competitive prices.
However, the companies that pose a competition to MRK products are Siemens,
Crompton Greaves, Brushless DC Motors.

9
1.3 .10 SWOT Analysis
SWOT Analysis contain the Strengths, Weakness, Opportunity and Threats of MRK
Industries.
1.3.10(i) SWOT Analysis of MRK Industries
Strengths:
Experienced personnel in the
organisation
Technical management expertise
Service provider to small scale
industries
Efficient in repairs and rewinding of
DC and AC motors
Weakness:
To reduce the repair and servicing
time duration of machinery
Labour costs of skilled employees
Opportunities:
Export projects in the pipeline
Expansion, development of existing
unit
Threats:
Government tax laws
Competitors technology
Table 1.8 showing SWOT Analysis of MRK Industries
Strengths:
MRK Industries has experienced personnel in technical and management departments
who coordinate and work together to meet the organisation needs and demands.
MRK Industries provides service for DC motors small scale industries to meet the
arising needs.
MRK Industries are efficient in repairs and rewinding of DC and AC motors
Weakness:
MRK Industries is attempting practices of effective recruitment and hiring to reduce
the labour costs of skilled employees.
10
MRK Industries is developing effective ways to reduce the time taken to repair and
service motors.
Opportunities:
MRK Industries has numerous exports projects in the pipeline to be undertaken in the
next 3 years.
MRK Industries is also focusing on expansion of the existing land from 25,000 sq.
feet to 80,000 sq. feet.
MRK Industries is also investing in the expansion of the building from 12,000 sq.
feet to 3,00,000 sq. feet.
With the unit expansion, there is also a need for recruitment and selection of eligible
candidates providing employment opportunities.
Threats:
Threats being external to the organization are uncontrollable in nature- Increase in
Government tax rates pose a threat to the organisation.
The competitors’ technological advancement and progress is a threat to the
organization.
1.3.11 Future prospects and growth
MRK Industries has numerous exports projects in the pipeline to be undertaken in the
next 3 years.
MRK Industries is also focusing on expansion of the existing land from 25,000 sq.
feet to 80,000 sq. feet.
MRK Industries is also investing in the expansion of the building from 12,000 sq. feet
to 3,00,000 sq. feet.
With the unit expansion, there is also a need for recruitment and selection of eligible
candidates providing employment opportunities.

11
1.3.12 Financial statement:
Financial statement consists of profit/loss statements, balance statement of accounting
year.
Accounting year usually begins from 1st April to 31
st March of the consecutive year.
MRK Industries is a private limited company and financial statements are not disclosed to
the public.

12
2.1 Theoretical background
Quality of work life focusses on the holistic well-being of an employee. Employees are the
resources of an organization and they should not just be considered for their contribution to
work.
The overall health and well-being of the employees is essential because it can be associated
with productivity and performance. A good work life balance has to be maintained which
motivates the employees while protecting the economic interests of the organisation.
The ways to achieve Quality of work life differs with each organisation however, some of the
important aspects are:
Job Security – The organisation has to provide job security and assurance to the
employees so they can perform to the best of their abilities without constantly worrying
about their position in the organisation.
Work timings- The flexible work hours provides opportunity to schedule and maintain a
balance between professional and personal life.
Communication- Good communication channels must be established in the organisation.
Rewards and recognition- When employees are recognised and rewarded for their
performance it encourages them to perform better.
Employee participation- When employees participate in discussions, strategies and
feedback it contributes to quality of work life.
Job enrichment- Employees must be given challenging work to reduce monotony and
provide learning platforms.
Career growth- Career growth and development of the employees must be considered by
the employers.
Quality of Work Life focuses on employees’ overall well-being. Fredrick Winslow Taylor is
considered the father of Scientific Management and focused on improving the employees’
productivity. F W Taylor framed the principles of scientific management. In the Scientific
Management principles importance is given to employees’ supervision, management
principles and hierarchy. Various researchers have conducted studies over the years to
improve job satisfaction hoping to achieve high production rates.
13
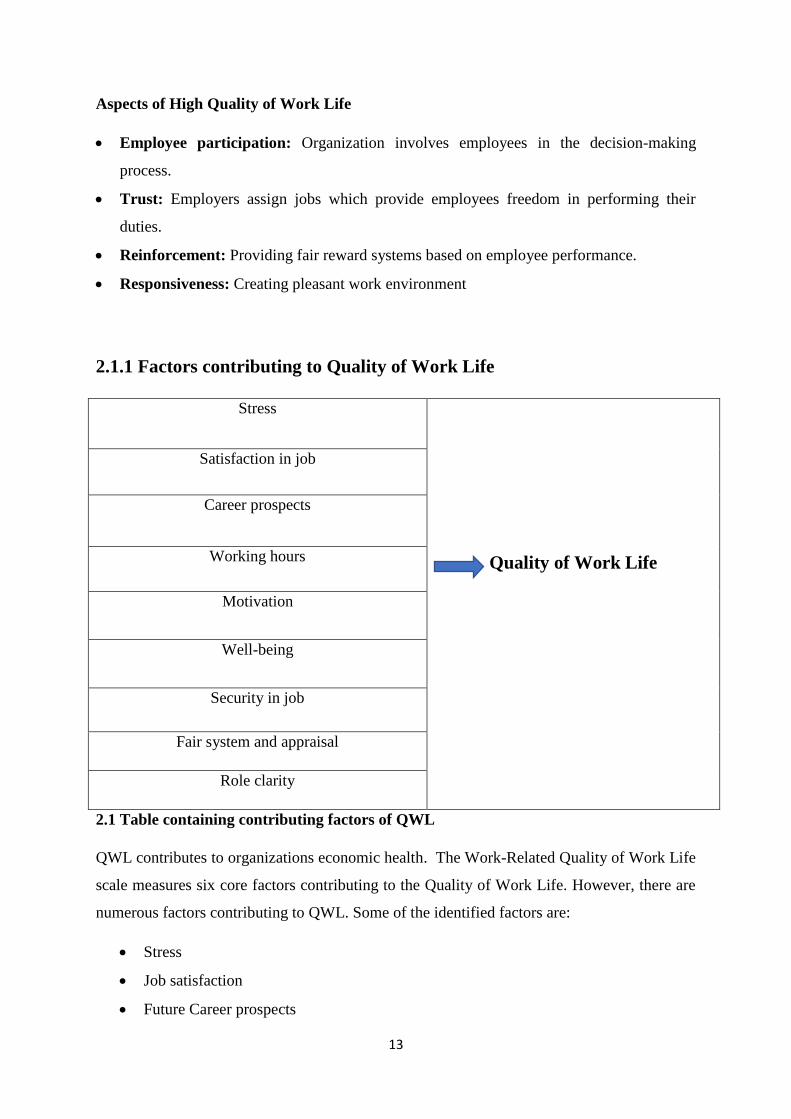
Aspects of High Quality of Work Life
Employee participation: Organization involves employees in the decision-making
process.
Trust: Employers assign jobs which provide employees freedom in performing their
duties.
Reinforcement: Providing fair reward systems based on employee performance.
Responsiveness: Creating pleasant work environment
2.1.1 Factors contributing to Quality of Work Life
Stress
Quality of Work Life
Satisfaction in job
Career prospects
Working hours
Motivation
Well-being
Security in job
Fair system and appraisal
Role clarity
2.1 Table containing contributing factors of QWL
QWL contributes to organizations economic health. The Work-Related Quality of Work Life
scale measures six core factors contributing to the Quality of Work Life. However, there are
numerous factors contributing to QWL. Some of the identified factors are:
Stress
Job satisfaction
Future Career prospects
14
Working hours
Motivation
Well being
Job security
Communication systems
Fair system of appraisal
Role clarity
Home Work interface
Pay and compensation
Stress: Occupational stress is a primary factor that contributes to QWL. Lesser the stress at
the work place higher will be the QWL.
Job Satisfaction: Satisfaction includes employee content towards the nature of work,
flexibility of work life, career advancement, compensation and working conditions.
Motivation and well-being: Employees general well-being is also a factor to Quality of
Work Life. Motivation can be intrinsic or extrinsic in nature. Intrinsic motivation is the
individual’s desire to perform task in a certain way because it fulfils the individual’s desire.
In Intrinsic motivation, the stimulus is internal to the individual. Extrinsic motivation is
external and the stimulus is from the outside environment. In Extrinsic motivation, there are
rewards and appreciation from the external sources. Money, bonus, awards, benefit packages
are different forms of extrinsic motivation.
Job security: High levels of security in job indicates high Quality of work life. When the
employees are not worried or anxious about their positions in the organization they perform
better.
Working hours: Flexible working hours and favourable working conditions help the
employees perform better. It also results in high employee morale and coordination between
employees and employers. Providing convenient work hours encourage employees to develop
self-discipline and control
Results of High Quality of Work life
High morale

15
High productivity
Increased employee involvement
Smooth Industrial Relations
High employee satisfaction
Decreases employee turn over
Lessens absenteeism
Increases quality of life of employees
Efficiency and effectiveness of the employees in the organization
2.2 Literature review
Avjeet Kaur, 2016. Quality of Work Life includes balance between professional and
personal life and effective utilizations of human resources. Various factors contribute
to employees QWL. Study shows that QWL has to be achieved through balancing
employees professional and personal lives.
Shyam Singh, 2013. In this study problem solving and partnership between employee
and employers are done to observe the quality of work patterns. There are various
methods adopted by management to increase employees QWL levels. Flexible work
hours, involvement in management decisions, security in job, development in career,
stable pay contribute to high QWL.
T S Nanjundeswaraswamy, DR Swamy, 2013. The study shows that for retaining
workers high QWL is essential. For encouraging employees to continue in
organization quality of work life is essential. Study was done to know perception of
employees about their QWL in organization.
S Padma Priya, 2012. In the thesis employees experience towards stress, co-worker
relationships, work life balance, work load, work pressure are explored. By improving
supervision, training, rewarding, providing challenging jobs employees perform better
in the organization. This also improves industrial relations along with QWL.
Mohi Adden and Hussein Harrim, 2011. The importance of QWL is studied in both
employee and organization capacities. Quality of work life plays an important role in
employees lives. Factors like physical wellness, mental health, emotional stability,
socialness contributes to overall QWL of organization employees.

16
P Argentero, M Miglioretti, C Angilletta, 2007. The study shows that to increase
QWL employee satisfaction, employee wellness plays a significant role. Life of
Italian health workers is researched in this study. Relationships in the organization,
growth contribute to high QWL. The respondents’ satisfaction towards their jobs were
obtained through interviews. The study was done on health service workers from
Italy.
Shane P Desselle, 2005. The study uses cross sectional descriptive design. Here work
characteristics, attitudes, personal characteristics of respondents are studied. Efforts to
increase QWL was undertaken as it benefits both employees and organization in long
run. Study also considered factors like individual employee differences while
researching.
Razali M Zin, 2004. An empirical research done on Engineers in Malaysia to identify
the relation between and organizational commitment. QWL of engineers was studied.
Test had seven factors for the analysis. Some of the factors are work environment,
supervision, growth, development.
Linda Johnsrud, 2002.The reasons for decline in quality of work life, reasons for it
and measures to overcome are found in this research paper. Quality of life of faculties
and administrators are studied. Increasing quality of work life helps employees
perform better at their jobs and preserving employees
B Davis and Thorburn, 1999. The strategies to reduce stress are analysed which
leads to better quality of work life. Stress levels reduces employees QWL. By
adopting structured management programmes performance and response of nurses in
St. John’s hospital was enhanced. Professional support network was also set up
improve QWL of nurses’ life.
Donald J, 1999.The journal article states that the co-workers, their behaviours
contribute to quality of work. Team work, decision making and assigned work load
leads to the quality of daily work. OR nurses play a crucial role at hospitals. Many
factors like decision making, multi-tasking, locus of control is influenced by QWL.
By increasing QWL the employees’ efficiency at the work place increases.
Tanmay Dutta, 1999. This paper covers three aspects of QWL which are human
values approach, subjective observation and ways to improve QWL. QWL is studied
by an HR perspective in this study. QWL plays a vital role in the as employees spend
considerable time in the organization.
17
Patrick McHugh, 1999- The survey was conducted on pharmacists to study the
quality of their work life. Job satisfaction, attitude, career satisfaction, commitment to
the organization is studied. Pharmacists attitudes regarding quality of work life is
studied. The pharmacists’ response was obtained through written survey.
Stephen Havlovic,1991. Test hypotheses on absenteeism, grievances are studied in
industrial relations determine the human resource outcome. Factors that influence
QWL was taken up in his study. Pre and Post QWL measures were taken to study
impact of QWL on human resources.
Kaisa Kauppinen, Elina Mannila and Irja Kandolin, 1989. For the study
segregation was done by sex to observe the effects of Quality of Work Life. Effect of
segregation is studied to determine QWL of men and women in the organization.
Previous researches showed work of women was more monotonous, restrictive, less
autonomous than that of men.
James W, T Mitchell, W. Fields, 1987. Study shows impact of organization’s QWL
efforts on perceptions of union. The study was done to study potential result in
management and union issues.
J.T, Seyfarth & Bost, 1986. The relationship between teacher turnover and various
work life categories is undertaken. By providing job security, safe work environment,
fair compensation, growth and utilisation of human capacities QWL can be increased.
The results showed that employees were loyal to the organization when organization
cared for the employees.
Michael Maccoby, 1984. Michael Maccoby was a consultant for the American
Telephone and Telegraph Co. The Quality of Work program was conducted on 40,000
Bell employees over a period of three years. A large majority of the employees
participated in this research. Management should be provided help in setting up QWL.
David Nadler and Edward Lawler, 1983. The factors that contribute To QWL is
assessed and delineated. Three factors associated with QWL must be increased to
achieve. Management behaviour, management systems and development at different
levels lead to increase in QWL.
Rob Cooke, 1982. The issues of teachers in association with Work Life is
undertaken. QWL of teachers is studied for research. Teachers were randomly chosen
in this study. If QWL decreases teachers feared losing jobs and experienced more

18
problems at the work place. Increasing levels of QWL leads to satisfaction in job and
helps in attrition rates.
Barry Macy ,1980. This journal article was conducted to increase the quality of work
life by increasing job security, financial security and improvised working conditions.
Organization can adopt principles that mutually benefit employees and employers.
This leads to harmony and co-ordination in organization increasing employees’ QWL.
To increase effectiveness, efficiency and wellbeing of employees QWL plays a major
role.
Stephen H Fuller, 1980. Understanding the concept of QWL and its implications are
studied. The quality of work life projects was conducted in General Motors.
Edward Glaser, 1979. This article speaks about improving the QWL to significantly
increase productivity. Productivity rates can be achieved by increasing the QWL of
employees. Numerous factors like participation, redesigning of job are done to
improve QWL.
EE Lawler, JA Drexler, 1978 – To increase the QWL; union management problems,
effectiveness of the organization is studied. This project was started to reduce
conflicts in organization, increase effectiveness contributing to quality in work.
Communication and co-operation between employee, employer leads to better
functioning in the organization.

19
3.1 Statement of the problem:
To study the degree of Quality of Work Life at MRK Industries
3.2 Need for the study:
QWL affects the employees’ productivity.
Productivity, stability and work life balance is determined by QWL
3.3 Objectives:
To find the various factors of QWL in the organisation.
To find the difference between QWL and motivation
To find the evaluation and association between long working hours and stress.
3.4 Scope:
The study aims to analyse the Human Resource problems associated with Quality of Work
Life.
The study is expected to provide insight into problems associated with Quality of Work Life
and job satisfaction.
3.5 Research Methodology:
Research design: Descriptive research
Sample method: Simple Random Sampling
Sample unit: 120
Sample size:100 Employees of MRK Industries
Statistical test applied: Karl Pearson correlation has been applied for the analysis
3.5(ⅰ) Data collection Method:
Primary data: Structured Employee Questionnaire (open and close ended questions)
Secondary data: MRK Industries profile, books, journals, articles and websites.
3.6 Hypothesis:
Ho: There is no relation between Quality of Work Life and Stress
Ha: There is relation between Quality of Work Life and Stress

20
3.7 Limitations:
The data obtained may not be 100% accurate due to human errors.
Employees might not give honest responses due to various reasons.
Gravitating towards selecting a neutral response is also observed.
The respondents might not have expressed negative feelings leading to data error.
3.8 Chapter Scheme:
The study has been organized into five chapters. The chapters one to five consists of
introduction, review of literature, research methodology, presentation and analysis and
summary, conclusion and recommendation. The contents of each of the chapter are briefly
mentioned here:
Chapter I: Introduction
Chapter one contains the introduction of the study. It includes Background of the study,
Background of the Industry, and Background of the Company: Promoters, Vision and
Mission, Competitors information, SWOT analysis, Future Growth and Organization of the
study.
Chapter II: Review of Literature
Chapter two includes conceptual framework and review of the literature. The conceptual
consideration and review or related literature conducted provides a framework which helps to
accomplish the study. It avoids needless duplication of research effort.
Chapter III: Research Design
Chapter three describes Statement of the Problem, Objectives of the Study, Importance of the
Study, Limitation of the study, Hypothesis, Research Methodology the various research
methods i.e. research design, population and sample, nature and sources of data, data
collection procedure, data analysis tools and techniques. Descriptive as well as analytical
research methodology is being used to carry out this study.
Chapter IV: Data Presentation and analysis
21
Chapter four consists of presentation and analysis of data. It presents and analyses the
information by using various statistical tools in specific form to meet the stated objective of
the study. All collected relevant data are analysed and interpreted.
Chapter V: Summary, Conclusion and Recommendation
Chapter five consists of summary of the study, conclusion and recommendation and on the
basis of the study which is based on the result through data analysis. It provides important
recommendation to the concerned organization for better improvement.
22
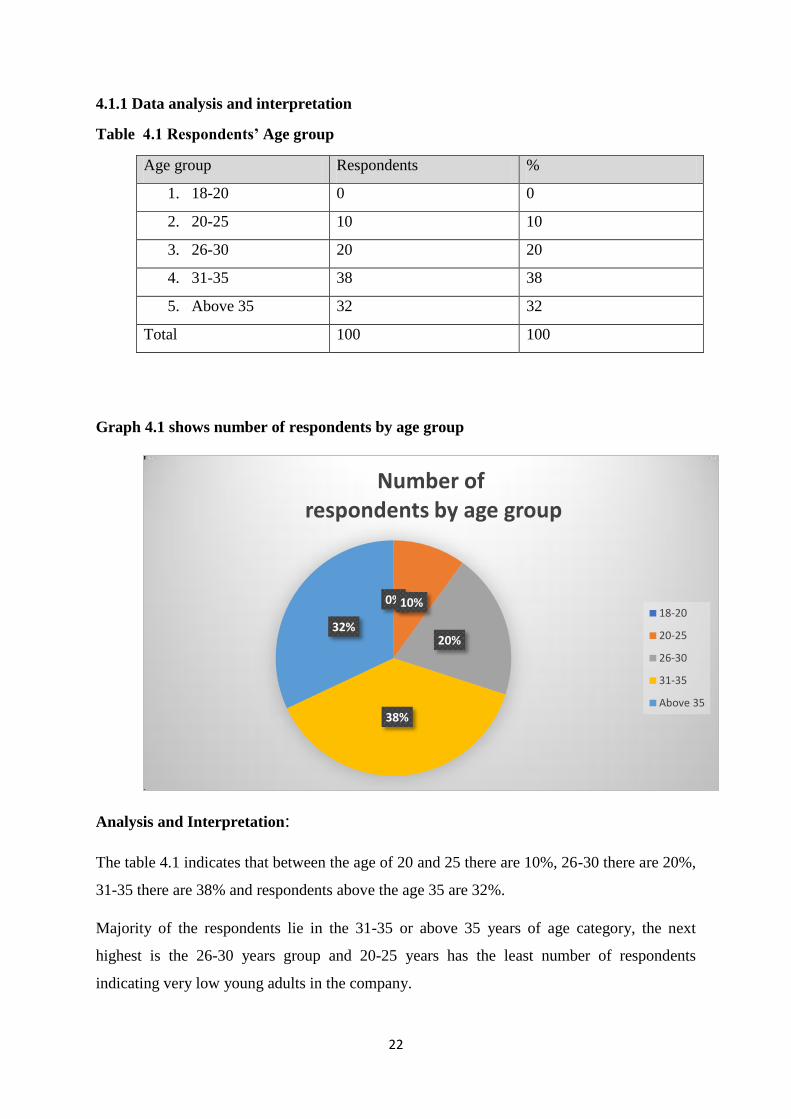
4.1.1 Data analysis and interpretation
Table 4.1 Respondents’ Age group
Age group Respondents %
1. 18-20 0 0
2. 20-25 10 10
3. 26-30 20 20
4. 31-35 38 38
5. Above 35 32 32
Total 100 100
Graph 4.1 shows number of respondents by age group
Analysis and Interpretation:
The table 4.1 indicates that between the age of 20 and 25 there are 10%, 26-30 there are 20%,
31-35 there are 38% and respondents above the age 35 are 32%.
Majority of the respondents lie in the 31-35 or above 35 years of age category, the next
highest is the 26-30 years group and 20-25 years has the least number of respondents
indicating very low young adults in the company.
0% 10%
20%
38%
32%
Number of respondents by age group
18-20
20-25
26-30
31-35
Above 35

23
4.2 Respondents by Gender
Gender Respondents %
1 Male 62 62
2 Female 38 38
Total 100 100
Graph 4.2 shows the distribution of Respondents by Gender
Analysis and Interpretation:
The table shows employees 62% male employees and 38% female employees. Majority of
employees are male and indicates male dominated work environment.
62%
38%
Gender
Male
Female

24
4.3 Respondents based on Work experience
Work experience Respondents %
1 Up to 5 years 24 24
2 5-10 years 32 32
3 10-15 years 12 12
4 Above 15 years 32 32
Total 100 100
Graph 4.3 showing employees based on Work experience
Analysis and Interpretation:
Table 4.3 shows that both in the 5-10 years and above 15 years category there are 32%
respondents. And there are 24% respondents with experience up to 5 years in the company
and 12% of employees in the company have 10 to 15 years’ experience. Majority of the
employees that is 76% have more than 5 years of experience in the company and they provide
on the job training to newly recruited employees or trainees.
24%
32% 12%
32%
Work experience
0-5 years
5-10 years
10-15 years
Above 15years

25
4.4 Respondents based on Income
Income group (in INR) Respondents %
1. 10,000- 20,000 6 6
2. 20,001- 30,000 20 20
3. 30,001- 40,000 30 30
4. 40,001- 50,000 28 28
5. Above 50,000 16 16
Total 100 100
Graph 4.4 shows income level
Analysis and Interpretation:
The table 4.4 shows that 30% of the employees receive 30,001-40,000 compensations, 28%
receive 40,001-50,000, 20% receive 20,001-30,000, 16% earn more than 50,000 salaries
while 6% receive 10,000-20,000.
Majority of employees receive above 20,000 remunerations in the organization based on their
qualifications, experience and performance.
6
20
30
28
16
Income (in INR)
10,000-20,000
20,001-30,000
30,001-40,000
40,001-50,0000
Above 50,000
26
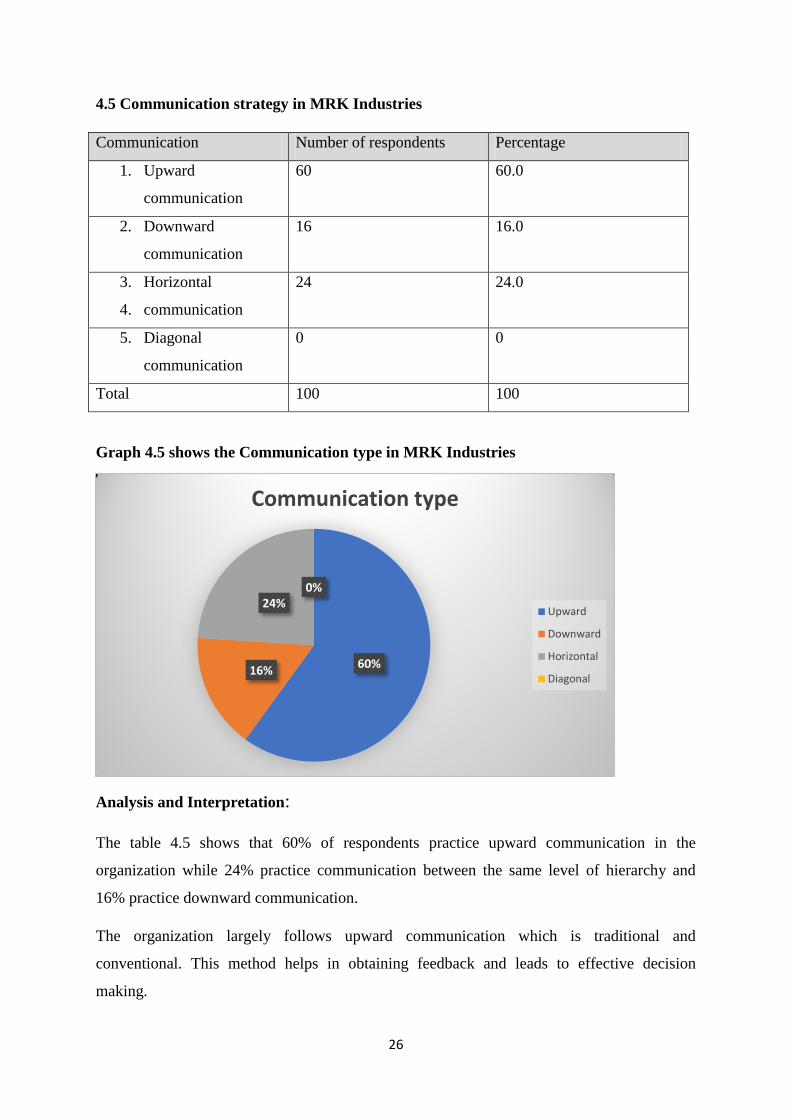
4.5 Communication strategy in MRK Industries
Communication Number of respondents Percentage
1. Upward
communication
60 60.0
2. Downward
communication
16 16.0
3. Horizontal
4. communication
24 24.0
5. Diagonal
communication
0 0
Total 100 100
Graph 4.5 shows the Communication type in MRK Industries
Analysis and Interpretation:
The table 4.5 shows that 60% of respondents practice upward communication in the
organization while 24% practice communication between the same level of hierarchy and
16% practice downward communication.
The organization largely follows upward communication which is traditional and
conventional. This method helps in obtaining feedback and leads to effective decision
making.
60% 16%
24% 0%
Communication type
Upward
Downward
Horizontal
Diagonal

27
4.6 Freedom to offer suggestions at MRK Industries.
Freedom to offer suggestions Respondents %
1. Yes 66 66
2. No 34 34
Total 100 100
Graph4.6 shows freedom to offer suggestions
Analysis and Interpretation:
Table 4.6 shows that 66% respondents have freedom to offer suggestions while 34%
employees feel they are not comfortable to offer suggestions in the work place. The
management should encourage employees’ freedom to offer suggestions.
66%
34%
FREEDOM TO OFFER SUGGESTIONS
Yes No

28
4.7 Leadership style practiced at MRK Industries
Leadership style Respondents %
1. Autocratic 4 4
2. Supportive 48 48
3. Democratic 28 28
4. Participative 20 20
Total 100 100
Graph 4.7 shows the leadership style practiced
Analysis and Interpretation:
Table 4.7 shows that 48% employees agree that supportive type of leadership style is
practiced in MRK Industries. 28% employees said democratic leadership is observed where
in employees are involved in making decisions of the organization. 20% employees agreed
that participative leadership is practiced while 4% believed autocratic leadership was
observed.
4%
48%
28%
20%
LEADER SHIP STYLE
Autocratic Supportive Democratic Participative
29
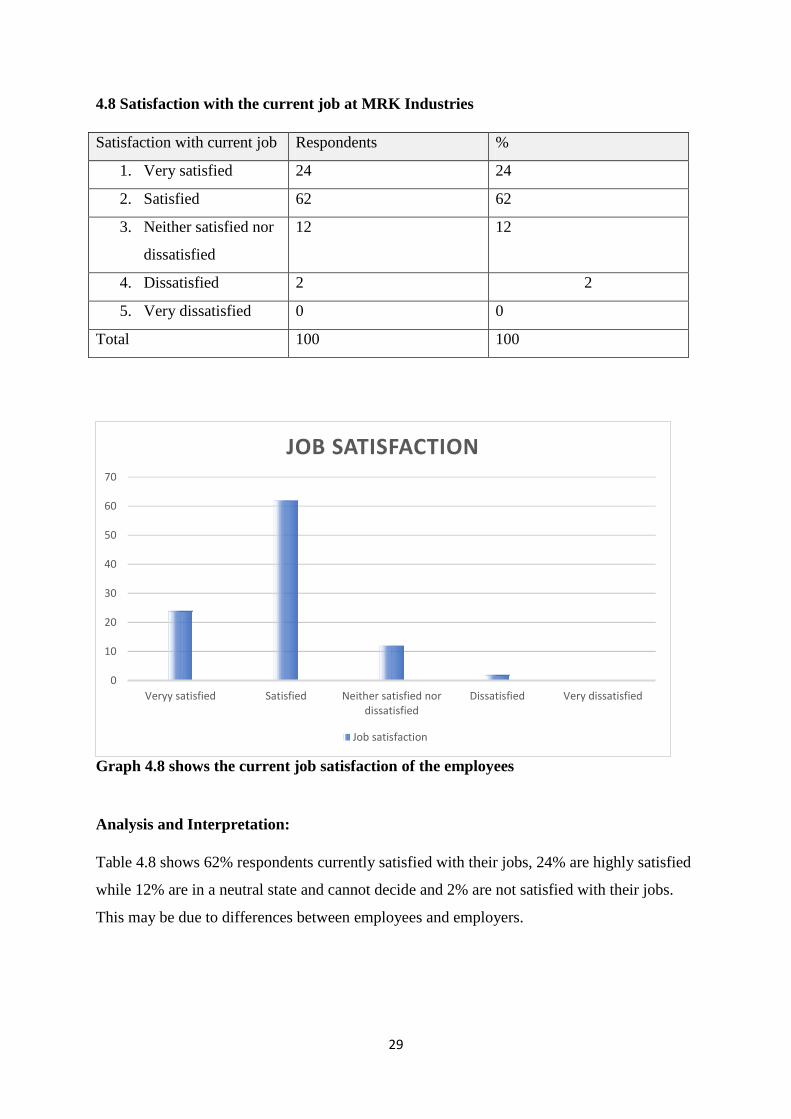
4.8 Satisfaction with the current job at MRK Industries
Satisfaction with current job Respondents %
1. Very satisfied 24 24
2. Satisfied 62 62
3. Neither satisfied nor
dissatisfied
12 12
4. Dissatisfied 2 2
5. Very dissatisfied 0 0
Total 100 100
Graph 4.8 shows the current job satisfaction of the employees
Analysis and Interpretation:
Table 4.8 shows 62% respondents currently satisfied with their jobs, 24% are highly satisfied
while 12% are in a neutral state and cannot decide and 2% are not satisfied with their jobs.
This may be due to differences between employees and employers.
Veryy satisfied Satisfied Neither satisfied nordissatisfied
Dissatisfied Very dissatisfied
0
10
20
30
40
50
60
70
JOB SATISFACTION
Job satisfaction

30
4.9 Job security provisions at MRK Industries.
Job security Respondents %
1. Strongly agree 44 44
2. Agree 52 52
3. Neither agree nor
disagree
4 4
4. Disagree 0 0
5. Strongly disagree 0 0
Total 100 100
Graph 4.9 shows job security provisions
Analysis and Interpretation:
Table 4.9 shows that 52% of the employees show content with job security provided in the
company and 44% strongly agree with the job security provisions while 4% are neutral
towards this.
44
52
2 0 0 0
10
20
30
40
50
60
Strongly agree Agree Neither agree nordisagree
Disagree Strongly disagree
Job security
Job security
31
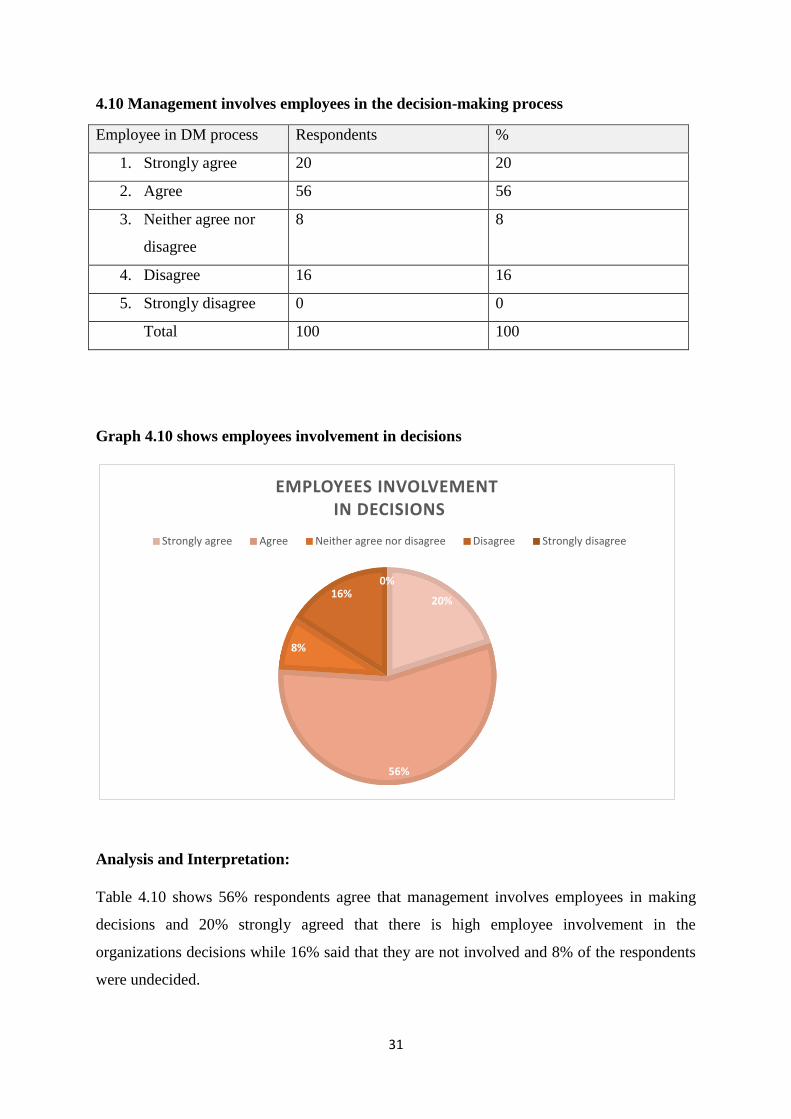
4.10 Management involves employees in the decision-making process
Employee in DM process Respondents %
1. Strongly agree 20 20
2. Agree 56 56
3. Neither agree nor
disagree
8 8
4. Disagree 16 16
5. Strongly disagree 0 0
Total 100 100
Graph 4.10 shows employees involvement in decisions
Analysis and Interpretation:
Table 4.10 shows 56% respondents agree that management involves employees in making
decisions and 20% strongly agreed that there is high employee involvement in the
organizations decisions while 16% said that they are not involved and 8% of the respondents
were undecided.
20%
56%
8%
16% 0%
EMPLOYEES INVOLVEMENT IN DECISIONS
Strongly agree Agree Neither agree nor disagree Disagree Strongly disagree
32
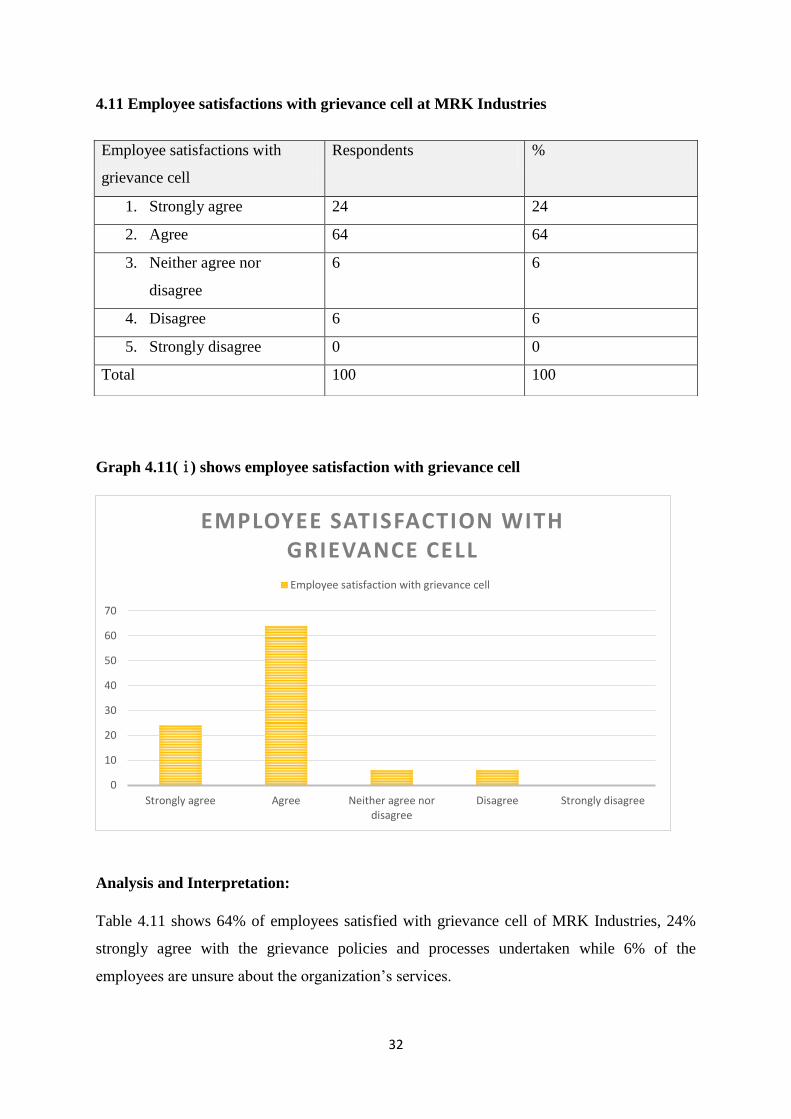
4.11 Employee satisfactions with grievance cell at MRK Industries
Graph 4.11(ⅰ) shows employee satisfaction with grievance cell
Analysis and Interpretation:
Table 4.11 shows 64% of employees satisfied with grievance cell of MRK Industries, 24%
strongly agree with the grievance policies and processes undertaken while 6% of the
employees are unsure about the organization’s services.
Strongly agree Agree Neither agree nordisagree
Disagree Strongly disagree
0
10
20
30
40
50
60
70
EMPLOYEE SATISFACTION WITH GRIEVANCE CELL
Employee satisfaction with grievance cell
Employee satisfactions with
grievance cell
Respondents %
1. Strongly agree 24 24
2. Agree 64 64
3. Neither agree nor
disagree
6 6
4. Disagree 6 6
5. Strongly disagree 0 0
Total 100 100
33
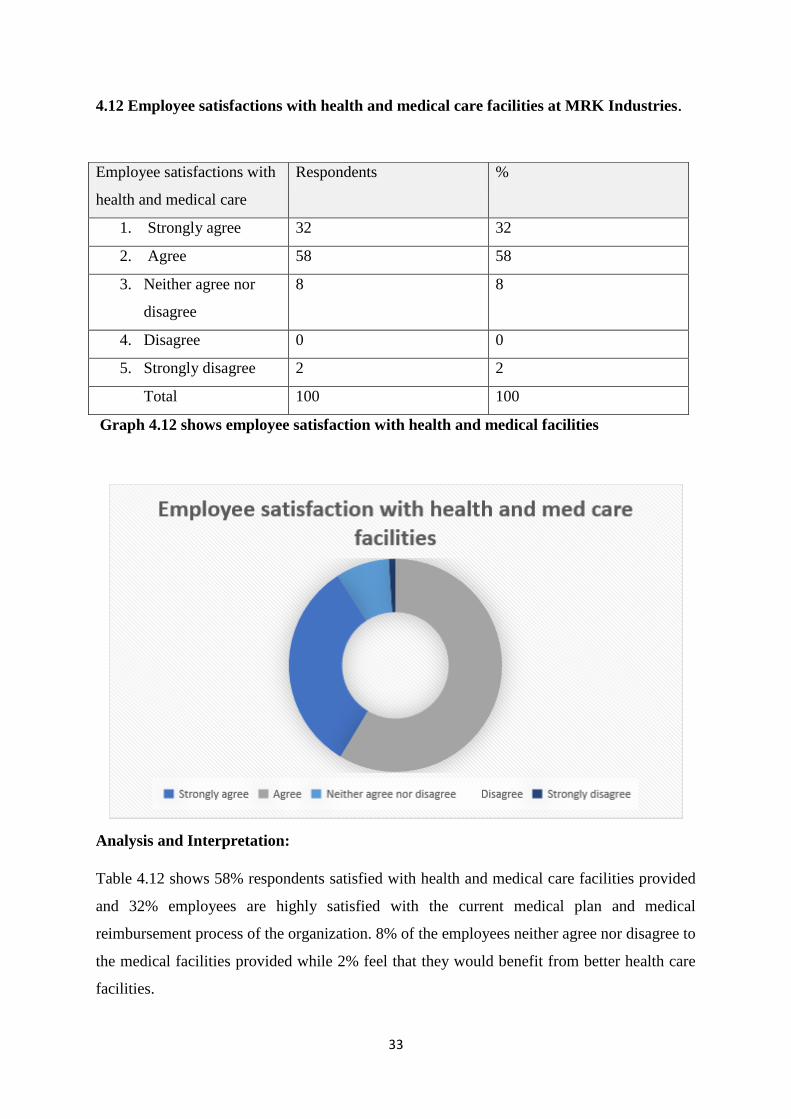
4.12 Employee satisfactions with health and medical care facilities at MRK Industries.
Graph 4.12 shows employee satisfaction with health and medical facilities
Analysis and Interpretation:
Table 4.12 shows 58% respondents satisfied with health and medical care facilities provided
and 32% employees are highly satisfied with the current medical plan and medical
reimbursement process of the organization. 8% of the employees neither agree nor disagree to
the medical facilities provided while 2% feel that they would benefit from better health care
facilities.
Employee satisfactions with
health and medical care
Respondents %
1. Strongly agree 32 32
2. Agree 58 58
3. Neither agree nor
disagree
8 8
4. Disagree 0 0
5. Strongly disagree 2 2
Total 100 100
34
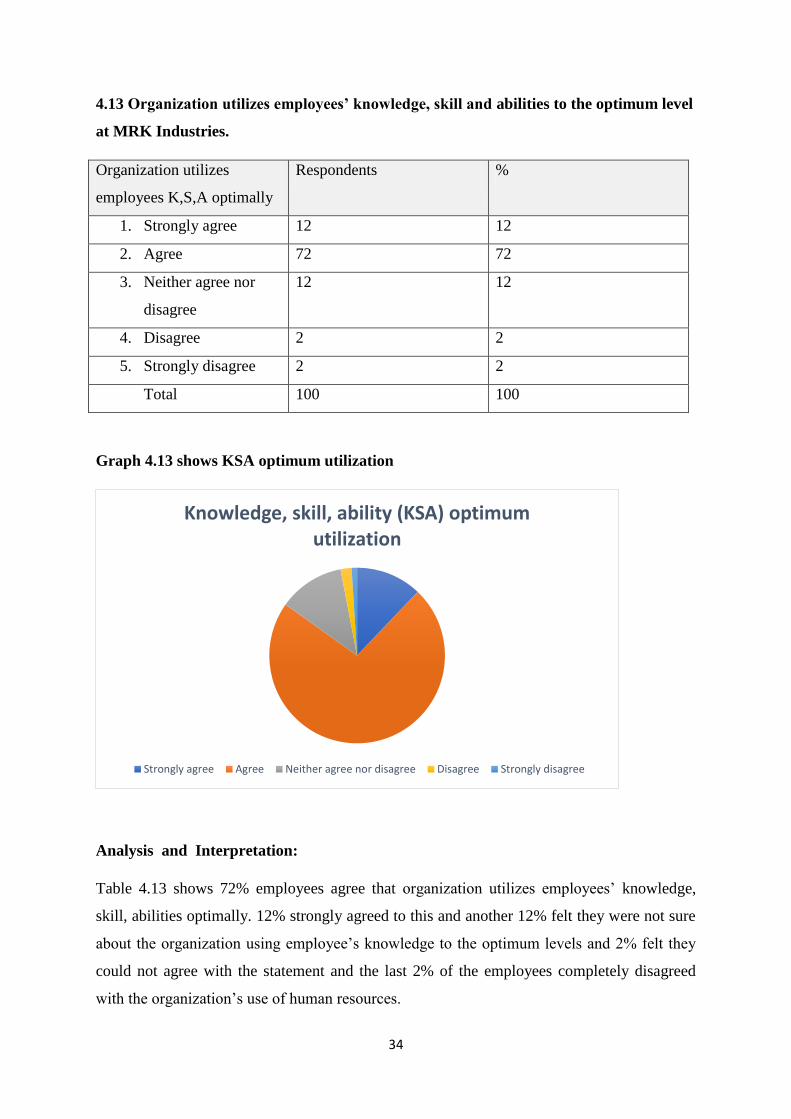
4.13 Organization utilizes employees’ knowledge, skill and abilities to the optimum level
at MRK Industries.
Organization utilizes
employees K,S,A optimally
Respondents %
1. Strongly agree 12 12
2. Agree 72 72
3. Neither agree nor
disagree
12 12
4. Disagree 2 2
5. Strongly disagree 2 2
Total 100 100
Graph 4.13 shows KSA optimum utilization
Analysis and Interpretation:
Table 4.13 shows 72% employees agree that organization utilizes employees’ knowledge,
skill, abilities optimally. 12% strongly agreed to this and another 12% felt they were not sure
about the organization using employee’s knowledge to the optimum levels and 2% felt they
could not agree with the statement and the last 2% of the employees completely disagreed
with the organization’s use of human resources.
Knowledge, skill, ability (KSA) optimum utilization
Strongly agree Agree Neither agree nor disagree Disagree Strongly disagree

35
4.14 Employees are satisfied with training and development (T and D) programmes at
MRK Industries
Employees are satisfied with
training and development
Respondents %
1. Strongly agree 20 20
2. Agree 64 64
3. Neither agree nor
disagree
12 12
4. Disagree 2 2
5. Strongly disagree 2 2
Total 100 100
Graph 4.14 shows employee satisfaction with training and development (T and D)
programmes
Analysis and Interpretation:
Table 4.14 interprets that a majority of 64% are satisfied with the training and development
programs of the company. 20% strongly agreed and felt that the organization provides more
than adequate training to the employees. 12% said that they are uncertain and are undecided
about this while minority of 4% of the employees felt that the training was not effective.
20%
64%
12%
2% 2%
EMPLOYEE SATISFACTION WITH TRAINING AND DEVELOPMENT (T AND D) PROGRAMMES
Strongly agree Agree Neither agree nor disagree Disagree Strongly disagree

36
4.15 MRK Industries practices appraisal based on employees’ merit and performance.
Appraisal based on
employees’ merit and
performance
Respondents %
1. Strongly agree 60 60
2. Agree 32 32
3. Neither agree nor
disagree
4 4
4. Disagree 4 4
5. Strongly disagree 0 0
Total 100 100
Graph 4.15 shows merit and performance-based appraisal system
Analysis and Interpretation:
Table 4.15 shows 52% respondents agree to appraisal based on merit and performance in
MRK Industries. 40% strongly agreed resulting in majority of the employees in agreement
with the organization’s merit-based appraisal while 8% of the employees could not decide as
they were uncertain with the appraisal process.
40%
52%
8% 0% 0%
Performance appraisal based on merit, performance
Strongly agree Agree Neither agree nor disagree Disagree Strongly disagree
37
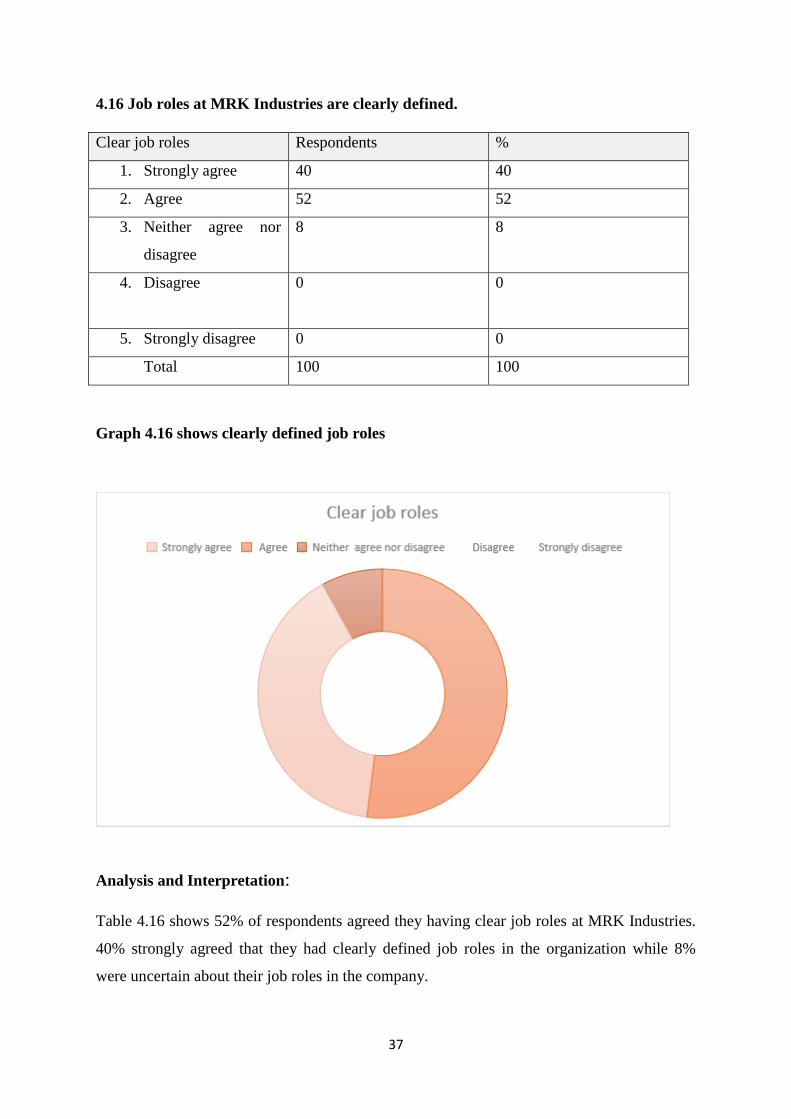
4.16 Job roles at MRK Industries are clearly defined.
Clear job roles Respondents %
1. Strongly agree 40 40
2. Agree 52 52
3. Neither agree nor
disagree
8 8
4. Disagree 0
0
5. Strongly disagree 0 0
Total 100 100
Graph 4.16 shows clearly defined job roles
Analysis and Interpretation:
Table 4.16 shows 52% of respondents agreed they having clear job roles at MRK Industries.
40% strongly agreed that they had clearly defined job roles in the organization while 8%
were uncertain about their job roles in the company.
38
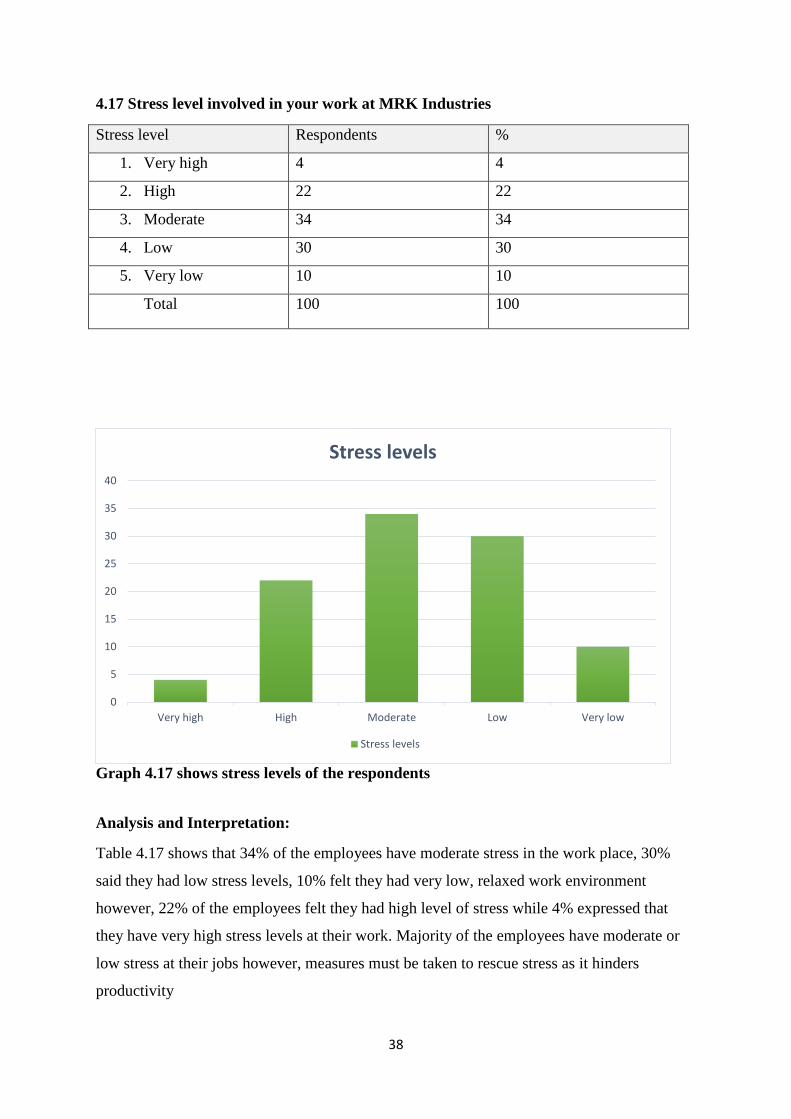
4.17 Stress level involved in your work at MRK Industries
Stress level Respondents %
1. Very high 4 4
2. High 22 22
3. Moderate 34 34
4. Low 30 30
5. Very low 10 10
Total 100 100
Graph 4.17 shows stress levels of the respondents
Analysis and Interpretation:
Table 4.17 shows that 34% of the employees have moderate stress in the work place, 30%
said they had low stress levels, 10% felt they had very low, relaxed work environment
however, 22% of the employees felt they had high level of stress while 4% expressed that
they have very high stress levels at their work. Majority of the employees have moderate or
low stress at their jobs however, measures must be taken to rescue stress as it hinders
productivity
Very high High Moderate Low Very low
0
5
10
15
20
25
30
35
40
Stress levels
Stress levels

39
4.18 Quality of Work Life is good at MRK Industries
Good Quality of Work Life Respondents %
1. Strongly agree 18 18
2. Agree 74 74
3. Neither agree nor
disagree
6 6
4. Disagree 2 2
5. Strongly disagree 0 0
Total 100 100
Graph 4.18 shows respondents’ good quality of work life
Analysis and Interpretation:
Table 4.18 shows 74% of employees have good quality of work life at MRK Industries. 18%
strongly agreed with the quality of work life while 6% could neither agree nor disagree and
2% disagreed with work life quality.
18%
75%
6% 1% 0%
Good Quality of Work Life
Strongly agree
Agree
Neither agree nor disagree
Disagree
Strongly disagree

40
4.19 Quality of work life in your opinion
Quality of work life Respondents %
1. Friendly work environment 52 52
2. Welfare measures and
benefits
24 24
3. Social recognition 14 14
4. Career development and
opportunities
6 6
5. High standard of living 4 4
Total 100 100
Graph 4.19 shows respondents opinion of quality of work life
Analysis and Interpretation:
Table 4.19 shows that half the respondents that is 52% feel friendly work environment
determines QWL. 24% respondents appreciated the welfare measures and benefits, 14% said
social recognition determines QWL while 6% of employees said career development and
future opportunities and 4% said that high standard of living determined high Quality of work
life.
52%
24%
14%
6% 4%
QUALITY OF WORK LIFE
Friendly work environment Welfare measures and benefits
Social recognition Career development and benefits
High satndard of living

41
4.20 Satisfaction with MRK Industries’ long working hours
Satisfied with long working
hours
Respondents %
1. Very satisfied 18 18
2. Satisfied 76 76
3. Neither Satisfied nor
dissatisfied
6 6
4. Dissatisfied 0 0
5. Very dissatisfied 0 0
Total 100 100
Graph 4.20 shows employee satisfaction with the long working hours
Analysis and Interpretation:
Table 4.20 shows 76% employees satisfied with working hours of MRK Industries. 18% of
the employees said they are highly satisfied with the working hours while 6% expressed
uncertainty and could not decide.
18%
76%
6% 0% 0%
Satisfaction with long working hours
Very satisfied Satisfied Neither satisfied nor dissatisfied Dissatisfied Very dissatisfied

42
4.21 Organization motivates to increase productivity
Motivation to increase
productivity
Respondents %
1 Yes 96 96
2 No 4 4
Total 100 100
Graph 4.21 shows organization’s motivation to increase productivity
Analysis and Interpretation:
Table 4.21 shows that 96% of the employees have motivation to increase productivity while
4% expressed that they organization does not provide enough motivation to increase
performance and production rates. The organization can provide the right type of motivation
depending the employees’ choice and accommodate accordingly
96%
4%
MOTIVATION TO INCREASE PRODUCTIVITY
Yes No
43
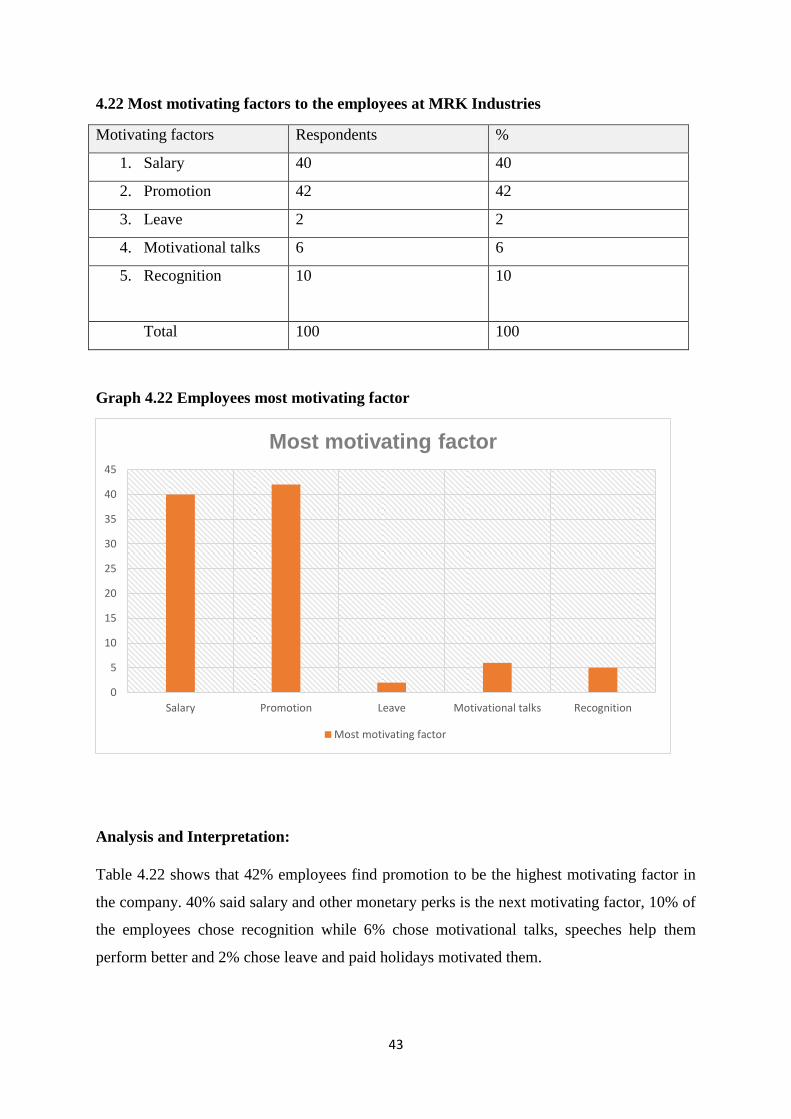
4.22 Most motivating factors to the employees at MRK Industries
Motivating factors Respondents %
1. Salary 40 40
2. Promotion 42 42
3. Leave 2 2
4. Motivational talks 6 6
5. Recognition 10 10
Total 100 100
Graph 4.22 Employees most motivating factor
Analysis and Interpretation:
Table 4.22 shows that 42% employees find promotion to be the highest motivating factor in
the company. 40% said salary and other monetary perks is the next motivating factor, 10% of
the employees chose recognition while 6% chose motivational talks, speeches help them
perform better and 2% chose leave and paid holidays motivated them.
0
5
10
15
20
25
30
35
40
45
Salary Promotion Leave Motivational talks Recognition
Most motivating factor
Most motivating factor
44
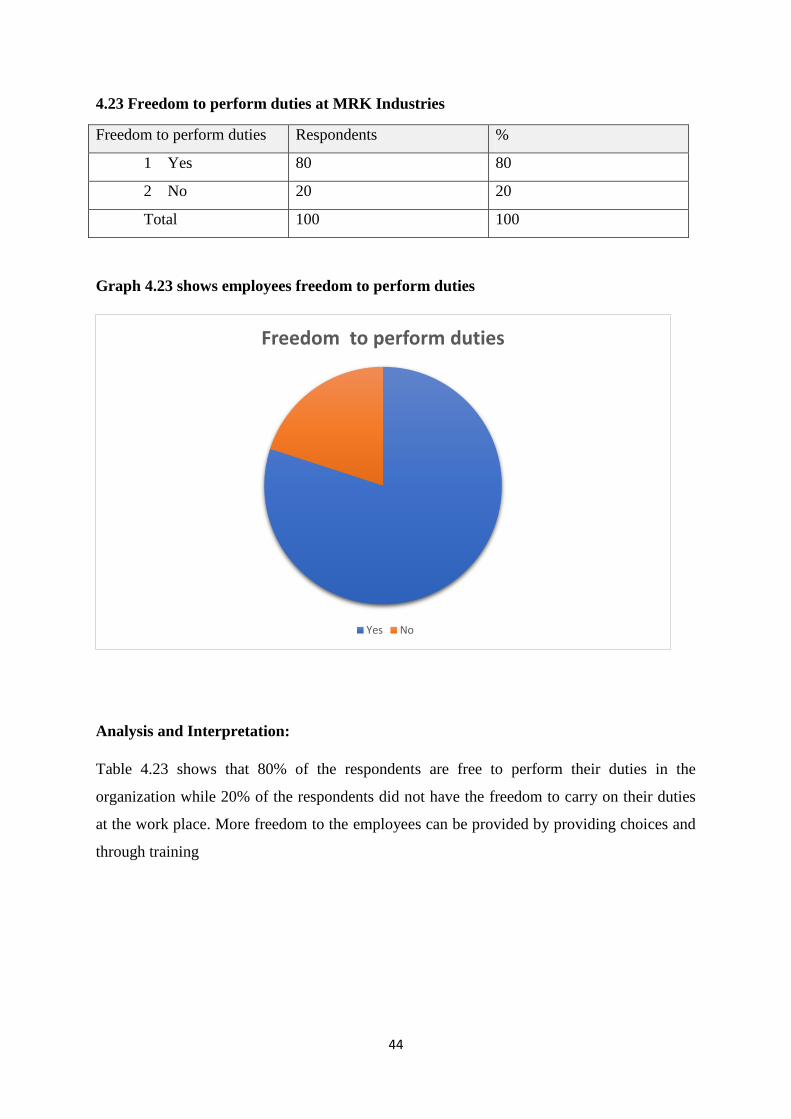
4.23 Freedom to perform duties at MRK Industries
Freedom to perform duties Respondents %
1 Yes 80 80
2 No 20 20
Total 100 100
Graph 4.23 shows employees freedom to perform duties
Analysis and Interpretation:
Table 4.23 shows that 80% of the respondents are free to perform their duties in the
organization while 20% of the respondents did not have the freedom to carry on their duties
at the work place. More freedom to the employees can be provided by providing choices and
through training
Freedom to perform duties
Yes No

45
4.1.2 Hypothesis:
Ho: There is no relation between Quality of Work Life and Stress
Ha: There is relation between Quality of Work Life and Stress
Results obtained:
Correlations
Stress level
involved in
your work at
MRK
Industries
Quality of
Work Life
(QWL) is
good at MRK
Industries
Stress level involved in
your work at MRK
Industries
Pearson-
Correlation 1 -.117
Sig. (2-tailed) .004
N 50 49
Quality of Work Life
(QWL) is good at MRK
Industries
Pearson
Correlation -.117 1
Sig. (2-tailed) .004
N 49 49
Table 4.1.2 shows hypothesis results obtained
Interpretation:
There is inverse and significant relation between quality of work life and stress with
significant value 0.004 which is less than 0.05. Implicating that as stress level increases, the
quality of work life decreases. Stress level should decrease to achieve quality in work life to
all employees.
46
5.1 Findings:
Nearly half respondents (38%) belong to age group of 31-35 years
More than half of the respondents (60%) practiced upward communication type in the
organization.
More than half of respondents (66%) agreed they have freedom to offer suggestions in
the organization.
Nearly half respondents (48%) agreed that supportive leadership type is practiced.
More than half of respondents (62%) are satisfied with their current job positions.
Nearly half of respondents (52%) are satisfied with job security provisions.
More than half of respondents (56%) participated in the decision-making process.
More than half of respondents (64%) are satisfied with organization’s grievance cell
provided.
More than half of respondents (72%) agreed their knowledge, skill and abilities are
optimally utilized.
More than half of respondents (74%) agreed that quality of work life is good.
Vast majority (96%) agreed that the organization motivates the employees to increase
productivity.

47
5.2 Conclusion:
From the study, it is evident that Quality of Work Life of MRK Industries employees is good.
However, small gaps in employee satisfaction towards the company was found.
MRK industries can provide salary hikes and promotion to motivate employees to increase
efficiency and productivity. QWL can be improved by encouraging employees to participate
in decision making, grievance cell provisions, optimum utilization of knowledge, skill and
abilities of employees, effective training and development programmes, merit-based
appraisal. is also determined by employee stress levels must be decreased as it contributes to
Quality of Work Life. Employees must be given freedom to offer suggestions in the
organization as it decreases communication barriers and helps understand the employees’
perspective.
Employees’ need friendly work environment, welfare measures and monetary benefits along
with freedom to perform duties in the organization to increase the Quality of Work Life at
MRK Industries. Employees are important customers in the organization and they must be
satisfied for the survival and growth of the organization. Employees are valuable resources
and should be provided with adequate benefits and facilities. The management and its
employees are mutually dependent on one another and balanced contribution leads to an
effectively working organization.
48
5.3 Suggestions:
Improvements in bonus, salary at operational level to employees.
Communication barriers can be reduced by two-way communication systems and
through appropriate guidance and instructions to the employees.
Improvements in medical care, reimbursement facilities to employees can be
undertaken.
Increase in orientation and training provided to employees. Measures to reduce stress
can be done by regular training and orientation.
Increase in promotions, salary to the employees.
Opportunities for higher education can be increased as it mutually benefits employee
and organization.
49
Bibliography:
Books:
Human Resource and Personnel Management by Aswathappa K
Research Methodology: Methods and Techniques by C.R. Kothari
Websites:
http://www.scholargoogle.com
www.wikipedia.com
www.scribd.com
www.rroji.com
www.businessmanagementideas.com
https://www.researchgate.net
www.academia.edu
www.sciencedirect.com
www.emeraldinsight.com
Reference:
Avjeet Kaur, 2016. Quality of work life, International journal of engineering in
2016.
B Davis, Thorburn, 1999- Quality of nurses’ work life, Canadian journal of
nursing 12(4), 11-15
Barry Macy, 1980- Quality of work life, Monthly Labor Review 103(7), 41-43
Donald J, 1999- What makes your day? A study of Quality of work life of OR
nurses, Canadian operating room nursing journal 17(4), 17-27
Edward Lawler, John Drexler, 1978- Dynamics of establishing cooperative
quality of work life projects, Monthly Lab. Rev. 101, 23
James W, Thacker Mitchell, W Fields, 1987- Union Involvement in Quality of
work life, Personnel Psychology 40 (1), 97-111
Linda Johnsrud, 2002- Measuring quality of faculty work life, Research in higher
education, 43(3), 379-395
Michael Maccoby, 1984- Helping labour and management set up Quality of work
life, Monthly Labor Review 107 (3), 28-32
Mohi Adden, Hussein Harrim, 2011- Quality of work life human well-being

50
linkage, International journal of business 6 (8), 193
P Argentro, M Miglioretti, C Angiletta, 2007- Quality of work life in Italian
workers, G Ital Med Lav Ergon 29 (1 Suppl A), A50-4
Patrick McHugh, 1999- Quality of work life on pharmacists, Journal of American
Pharmaceutical Association, 39 (5), 667-676
Shyam Singh, 2013- Quality of work life, Canadian Academic Publishing
Stephen H Fuller, 1980- Quality of work life projects for General Motors,
Monthly Labor Review 103(7), 37-39
Stephen Havlovic, 1991- Quality of work life and human resource outcomes,
Industrial Relations: A journal of Economy and Society 30 (3), 469-479
Tanmay Dutta, 1999- Quality of work life: A human relations approach, Journal
of Human Values 5(2), 135-145
T S Nanjundeswaraswamy, 2013- Quality of work life of employees,
International journal for quality research 7 (3), 2013

51
Annexure:
Quality of Work Life.
Here are few questions for a study carefully read them and respond accordingly. Put a tick
mark in the box provided. The data will be kept confidential. Please respond honestly.
1. Age
□20-25 □26-30 □31-35 □Above 35
2. Gender
□ Male □ Female
3. Work experience
□0-5 years □5-10 years □10-15 years □ Above 15 years
4. Income level
□ 10,000-20,000 □ 20,001-30,000 □ 30,001-40,000 □ 40,001-50,000 □ Above 50,000
5. Communication strategy present in MRK Industries.
□Upward communication □Downward communication □Horizontal communication
□Diagonal communication
6. Freedom to offer suggestions and comments at MRK Industries
□ Yes □ No □
7. Leadership style practiced at MRK Industries.
□ Autocratic □ Supportive □ Democratic □ Participative

52
8. Satisfaction with your current job at MRK Industries.
□Strongly agree □Agree □Neither agree nor disagree □Disagree □Strongly disagree
Respond with a tick mark in the space provided.
Strongly
agree
Agree Neither
agree nor
disagree
Disagree Strongly
disagree
9. Job security provisions
10. Management involves
employees in the decision-
making process
11. Employees satisfactions
with grievance cell
12. Employees satisfaction
with health and medical
care facilities.
13. Organisation utilises
employee’s knowledge and
skills to the optimum level.
14. Employees are satisfied
with the training and
development programmes
15. MRK Industries
practices appraisal based
on employees’ merit and
performance.
16. Job roles at MRK
Industries are clearly
defined.

53
17. Stress level involved in your work at MRK Industries
□ Very high □ High □ Moderate □ Low □ Very low
18. Quality of Work Life is good at MRK Industries.
□ Strongly agree □ Agree □ Neither agree nor disagree □ Disagree □ Strongly disagree
19. Quality of work life according to you
□ Friendly work environment □ Required welfare measures and benefits
□ Social recognition □ Career development and opportunities □ High standard of living
20. Satisfaction with MRK Industries long working hours
□ Highly Satisfied □ Satisfied □ Neither satisfied nor dissatisfied □ Dissatisfied
□ Highly dissatisfied
21. Organisation motivates to increase productivity
□ Yes □ No
22. Most motivating factor at MRK Industries
□ Salary □ Promotion □ Leave □ Motivational talk □ Recognition
23. Freedom to perform duties at MRK Industries.
□ Yes □ No
24. How are the career prospects in the organisation?
_____
25. Suggestions for the organisation to improve the quality of work life
____
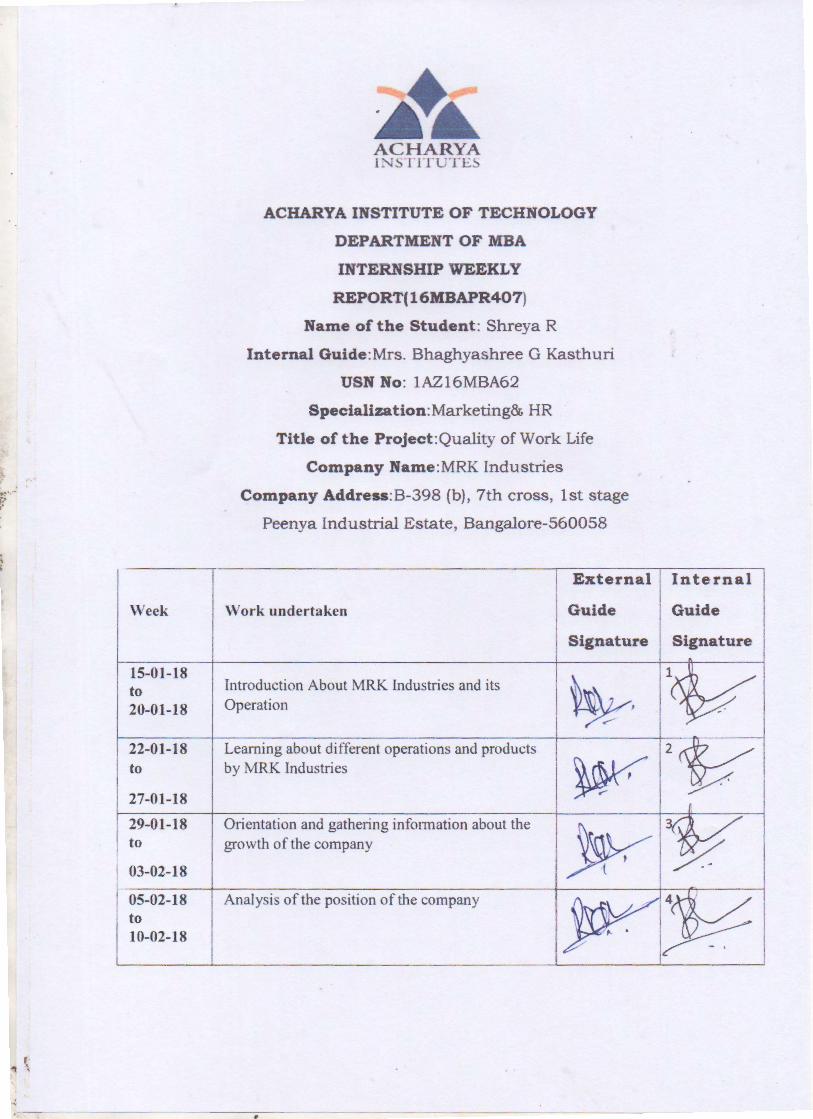
Week
15-01-18 to 20-01-18
22-01-18 to
27-01-18
29-01-18 to
03-02-18
05-02-18 to 10-02-18
~+a.. ACHARYA 1).1~ 11 n.JTE~
ACHARYA INSTITUTE OF TECHNOLOGY
DEPARTMENT OF MBA
INTERNSHIP WEEKLY
REPORT(16MBAPR407)
Name of the Student: Shreya R
Internal Guide:Mrs . Bhaghyashree G Kasthuri
USN No: 1AZ16MBA62
Specialization:Marketing& HR
Title of the Project:Quality of Work Life
Company Name:MRK Industries
Company Address:B-398 (b), 7th cross, 1st stage
Peenya Industrial Estate, Bangalore-560058
External Internal
\Vork undertaken
Introduction About MRK Industries and its Operation
Learning about different operations and products by MRK Industries
Orientation and gathering information about the growth of the company
Analysis of the position of the company
Guide Guide
Signature Signature

12-02-18 to
17-02-18
19-02-18 to
24-02-18
26-02-18 to 03-03-18
04-03-18 to
10-03-18
12-03-18 to 17-03-18
Research Problem Identification
Population of the Research instrument for data collection
Theoretical background of the study
Data collection and Data analysis
Interpretation of data gathered during the survey
~5·,=/
~61};/
~ ~
19-03-18 to
Final report preparation and submission
24-03-18 t ~ I ._ . _ __j__
HOD
~-M . Heati of Me-e:nt Dep.g·: 1:l· · ~ •• t MBA
~\\Ch!lr)'& ;: ,~nrj_.. J of Technolof SOidgvanahff~ li~lore-560 1
!"
!l,
Copyright © 2022 FDOKUMEN

