


Bahasa
Halaman
Hukum

INTERNATIONAL JOURNAL OF CLIMATOLOGYInt. J. Climatol. 29: 1415–1429 (2009)Published online 3 December 2008 in Wiley InterScience(www.interscience.wiley.com) DOI: 10.1002/joc.1780
Monthly precipitation trends on the Mediterranean fringeof the Iberian Peninsula during the second-half of the
twentieth century (1951–2000)
Jose Carlos Gonzalez-Hidalgo,a* Joan-Albert Lopez-Bustins,b Petr Stepanek,c
Javier Martin-Videb and Martin de Luisa
a Department of Geography, University of Saragossa, Saragossa 50009, Spainb Group of Climatology, University of Barcelona, Barcelona, Spain
c Czech Hydrometeorological Institute, Brno, Czech Republic
ABSTRACT: We analysed monthly precipitation trends on the eastern Mediterranean fringe of the Iberian Peninsula (IP)by means of a new monthly precipitation database [Monthly Precipitation Dataset, Mediterranean Spain (MOPREDAMES)].This database was created following an exhaustive quality control of the archives from the Meteorological Agency of Spain(Instituto Nacional de Meteorologıa, INM), and comprises 1113 complete and homogeneous monthly precipitation series(1951–2000), covering 180 000 km2 (one-third of IP area). The new data set currently offers the highest spatial densityof stations on the IP and around the Mediterranean Sea (1 station/150–200 km2), and includes available information at1500 m asl.
The analyses of monthly precipitation trends indicate high spatial and temporal variability. No global trend in the studyarea was found, except for March, when significant negative trends affect the whole study area. Trends for winter months(December–January–February) are dominated by an East–West gradient with a latitudinal temporal shift. Positive trendsare mainly located in coastland areas and negatives ones predominate inland. April shows a North-positive South-negativegradient, and the reverse is true for June and September. Negative trends are dominant in October over most of the studyarea, except for the Pyrenees area. July and August show the most complex spatial distribution pattern, with well-delimitedareas of positive trends to the south and northwest. We generally detected no significant trends in May and November.
In order to analyse the nature of rainfall variability in the study area, we also studied the synchronous influenceof different low-variability modes [the North Atlantic Oscillation (NAO), the Mediterranean Oscillation (MO) and theWestern Mediterranean Oscillation (WeMO)]. On the Mediterranean fringe of the IP precipitation is mainly related tonegative phases of the three low-frequency variability patterns analysed, and the MO and the WeMO emerge as predominantteleconnection patterns. These results suggest that monthly variations in rainfall may result from the simultaneous effectsof different atmospheric modes of low variability, especially those linked to the Mediterranean region.
Studies making use of high-density precipitation databases, as is the case in this paper, are useful for a betterunderstanding of precipitation behaviour in a complex area like the Mediterranean fringe of the IP. The results alsoprovide valuable information for downscaling and hydrological management. Copyright 2008 Royal MeteorologicalSociety
KEY WORDS precipitation database; rainfall trends; teleconnection patterns; Spain; Western Mediterranean
Received 5 June 2007; Revised 10 March 2008; Accepted 23 September 2008
1. Introduction
It has recently been suggested that the modificationof hydrological cycles by global warming might affectprecipitation, this impact being greater than the warmingprocess itself (Trenberth, 1999; Allen and Ingram, 2002).Nevertheless, analyses of precipitation patterns haveshown high spatial and temporal variability at global(New et al., 2001), regional (Lawrimore et al., 2001;Klein-Tank et al., 2002) and subregional scales (DeLuis et al., 2000; Brunetti et al., 2006; Norrant and
* Correspondence to: Jose Carlos Gonzalez-Hidalgo, Department ofGeography, University of Saragossa, Saragossa 50009, Spain.E-mail: [email protected]
Douguedroit, 2006), suggesting that global projectionsare therefore not useful at local scale or for detailedspatial analysis. Thus, there is a need for regional andsubregional analyses, which should make use of a dataset of high-density observations.
The Iberian Peninsula (IP) has frequently been pro-posed as a suitable site for study of precipitation andassessment of climate projections (Esteban-Parra et al.,1998; Romero et al., 1999; Gonzalez-Rouco et al., 2001;Sumner et al., 2001). The IP is located in a subtropi-cal latitudinal transition and thus it is considered to be aclimatic ecotone (Goodess and Palutikof, 1998; Lavorelet al., 1998), a fact which has hindered detailed spa-tial analysis of precipitation (Lana and Burgueno, 2000;
Copyright 2008 Royal Meteorological Society
1416 J. C. GONZALEZ-HIDALGO ET AL.
Goodess and Jones, 2002). The IP is confined betweentwo very different water masses, which endows the pre-cipitation patterns with highly contrasting characteristics(Sumner et al., 2001; Goodess and Jones, 2002; Martin-Vide, 2004). Furthermore, the orientation of the moun-tain ranges affects the spatial influence of low-variabilityatmospheric modes.
In general terms, global analyses have identified threemain pluviometric areas: the North, the central-southernarea and the Mediterranean fringe (Esteban-Parra et al.,1998; Rodrıguez-Puebla et al., 1998; Serrano et al.,1999a; Munoz-Dıaz and Rodrigo, 2004; Morata et al.,2006). However, there is not a global consensus amongthe aforementioned climatologists, and the pluviometricareas are therefore not very precise. Moreover, subre-gional analyses have detected a high degree of spatialand temporal variability in each sector, particularly onthe Mediterranean fringe (Fernandez-Mills et al., 1994;Serra de Larrocha et al.,1999; Gonzalez-Hidalgo et al.,2001).
Analysis of IP precipitation throughout the twen-tieth century does not present any clear significanttrend (Esteban-Parra et al., 1998; Serrano et al., 1999b;Gonzalez-Rouco et al., 2001, etc.). Analyses for thesecond-half of the twentieth century, mainly 1961–1990,do not show any clear signal, either, and reflect highvariability at both temporal and spatial resolution insome cases (Mosmann et al., 2004; Rodrigo and Trigo,2007). Finally, subregional analyses usually involve ahigh spatial density of observation points but do notdetect any global spatial pattern of trends throughout thewhole Mediterranean coast (Romero et al., 1998; Gui-jarro, 2002), the North–East and Catalonia (Lana andBurgueno, 2000; Saladie et al., 2002, 2004), the north-ern inland plateau (Labajo and Piorno, 2001; del Rıoet al., 2005) or the southwestern area (Garcıa-Barronet al., 2002). Thus, to allow for the detection of trendsin precipitation over the last century, there is a need fora high-density data set covering a large area.
The Mediterranean fringe of the IP constitutes a veryinteresting site for precipitation analyses. Precipitationis highly variable throughout the area, with very pro-nounced North–South and East–West gradients resultingfrom the different mechanisms and atmospheric patternscontrolling precipitation (see the global explanation bySumner et al. (2001)). However, these patterns are verycrude and mask many irregularities and variations at localscale, due to the fact that precipitation is highly affectedby local factors, especially in summer (Fernandez-Mills,1995; Romero et al., 1998; Munoz-Dıaz and Rodrigo,2004; Morata et al., 2006). Finally, the precipitation pro-cess in the coastal areas is dominated by an easterly flow(Goodess and Jones, 2002), linked with a subregionalteleconnection pattern (Martın-Vide and Lopez-Bustins,2006), while the NAO has a weak influence.
There are many other arguments for detailed analysisof precipitation in these areas, mainly socioeconomicones (Sumner et al., 2001). Since 1950, the populationhas increased by 86.2% in the whole study area, but
has increased by 107.3% in the coastal provinces. Hence,the demand for water resources steadily increased duringthe second-half of the twentieth century throughout thewhole study area, despite the different pluviometricregimes existing in each region. Moreover, the whole areahas been subjected to very intense sociopolitical debatebecause of the National Water Plan, which proposedtransferring water from the inland North to the South(from the Ebro catchment to the Jucar and Segurabasins).
The generalized decreasing trend of precipitationaround the Mediterranean Sea is not easy to ver-ify in Spain because no study as yet provides suf-ficient spatial density of observation points (De Cas-tro et al., 2005). Thus, in this paper we analysemonthly precipitation trends along the whole Mediter-ranean fringe of the IP during the 1951–2000 period,with the use of a new monthly precipitation database[Monthly Precipitation Dataset, Mediterranean Spain(MOPREDAMES)], following an exhaustive quality con-trol of the archives from the Spanish MeteorologicalOffice (INM). The main aims are to analyse monthlyrainfall trends and their spatial distribution patterns, andto test, by way of an hypothesis of the source of precipi-tation variability, the simultaneous influence of differentatmospheric patterns spatially overlapping in the studyarea.
2. Study area
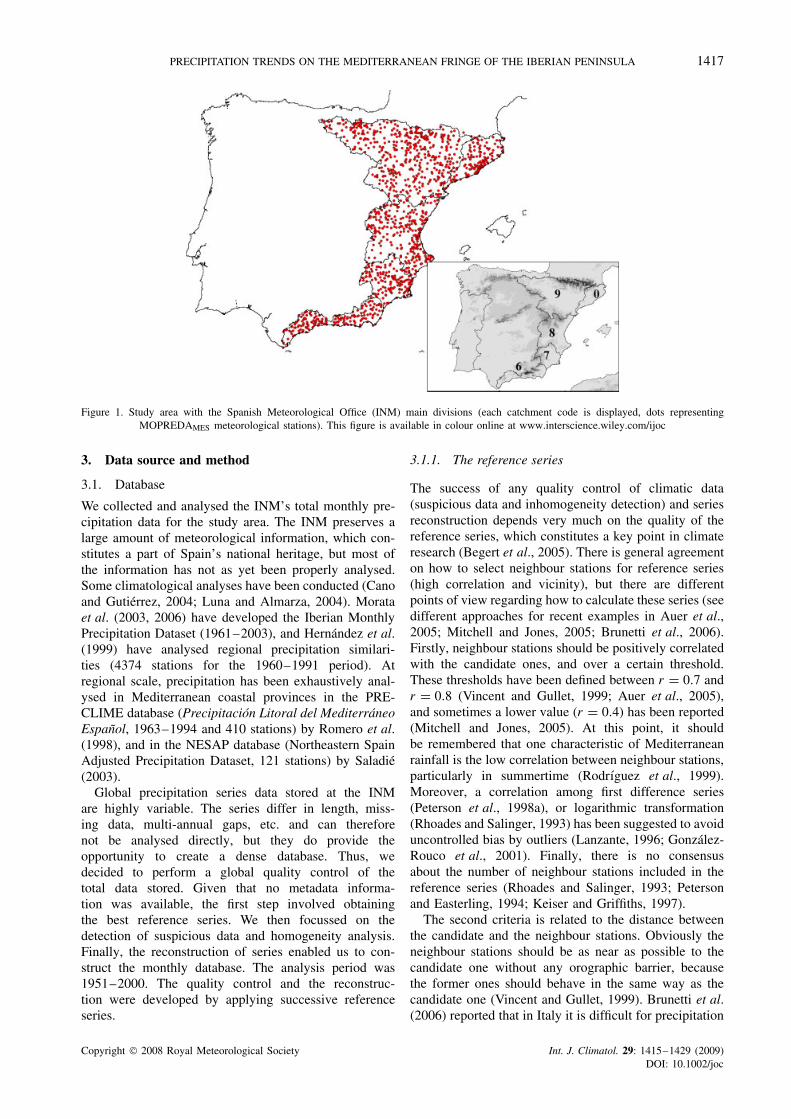
The Mediterranean side of the IP ranges from north-ern to southern Spain and comprises five hydrologi-cal divisions that are drained into the MediterraneanSea: the Eastern Pyrenees (0), the river Ebro (9), theriver Jucar (8), the river Segura (7) and Eastern Andalu-sia (6) (Figure 1). The total area is about 182 000 km2,i.e. 36.6% of conterminous Spain (c. 1/3 IP). TheEbro catchment constitutes a transition area from north-ern Atlantic to eastern Mediterranean conditions, as aresult of its inland Northwest–Southeast orientation. Theother divisions are distributed from North to Southalong the coast, and are therefore directly affectedby the Mediterranean Sea. The whole area is con-fined between the Mediterranean Sea (East), the IberianChain (West), the Pyrenees (North) and the Betic ranges(South).
The Mediterranean coastal fringe might constitute thebest-known area of the IP from the point of view of pre-cipitation, at both global (Martin-Vide, 1982; Romeroet al., 1998, 1999; Sumner et al., 2001) and subre-gional scales (Periago et al., 1991, 1998; Fernandez-Mills et al., 1994; De Luis et al., 2000; Gonzalez-Hidalgo et al., 2001; Penarocha et al., 2002; Azorın-Molina and Lopez-Bustins, 2004). Notwithstanding, theMediterranean fringe of the IP has not been analysed inits entirety to date due to the fact that the whole Ebrobasin was not usually included in the aforementionedpapers.
Copyright 2008 Royal Meteorological Society Int. J. Climatol. 29: 1415–1429 (2009)DOI: 10.1002/joc
PRECIPITATION TRENDS ON THE MEDITERRANEAN FRINGE OF THE IBERIAN PENINSULA 1417
Figure 1. Study area with the Spanish Meteorological Office (INM) main divisions (each catchment code is displayed, dots representingMOPREDAMES meteorological stations). This figure is available in colour online at www.interscience.wiley.com/ijoc
3. Data source and method
3.1. Database
We collected and analysed the INM’s total monthly pre-cipitation data for the study area. The INM preserves alarge amount of meteorological information, which con-stitutes a part of Spain’s national heritage, but most ofthe information has not as yet been properly analysed.Some climatological analyses have been conducted (Canoand Gutierrez, 2004; Luna and Almarza, 2004). Morataet al. (2003, 2006) have developed the Iberian MonthlyPrecipitation Dataset (1961–2003), and Hernandez et al.(1999) have analysed regional precipitation similari-ties (4374 stations for the 1960–1991 period). Atregional scale, precipitation has been exhaustively anal-ysed in Mediterranean coastal provinces in the PRE-CLIME database (Precipitacion Litoral del MediterraneoEspanol, 1963–1994 and 410 stations) by Romero et al.(1998), and in the NESAP database (Northeastern SpainAdjusted Precipitation Dataset, 121 stations) by Saladie(2003).
Global precipitation series data stored at the INMare highly variable. The series differ in length, miss-ing data, multi-annual gaps, etc. and can thereforenot be analysed directly, but they do provide theopportunity to create a dense database. Thus, wedecided to perform a global quality control of thetotal data stored. Given that no metadata informa-tion was available, the first step involved obtainingthe best reference series. We then focussed on thedetection of suspicious data and homogeneity analysis.Finally, the reconstruction of series enabled us to con-struct the monthly database. The analysis period was1951–2000. The quality control and the reconstruc-tion were developed by applying successive referenceseries.
3.1.1. The reference series
The success of any quality control of climatic data(suspicious data and inhomogeneity detection) and seriesreconstruction depends very much on the quality of thereference series, which constitutes a key point in climateresearch (Begert et al., 2005). There is general agreementon how to select neighbour stations for reference series(high correlation and vicinity), but there are differentpoints of view regarding how to calculate these series (seedifferent approaches for recent examples in Auer et al.,2005; Mitchell and Jones, 2005; Brunetti et al., 2006).Firstly, neighbour stations should be positively correlatedwith the candidate ones, and over a certain threshold.These thresholds have been defined between r = 0.7 andr = 0.8 (Vincent and Gullet, 1999; Auer et al., 2005),and sometimes a lower value (r = 0.4) has been reported(Mitchell and Jones, 2005). At this point, it shouldbe remembered that one characteristic of Mediterraneanrainfall is the low correlation between neighbour stations,particularly in summertime (Rodrıguez et al., 1999).Moreover, a correlation among first difference series(Peterson et al., 1998a), or logarithmic transformation(Rhoades and Salinger, 1993) has been suggested to avoiduncontrolled bias by outliers (Lanzante, 1996; Gonzalez-Rouco et al., 2001). Finally, there is no consensusabout the number of neighbour stations included in thereference series (Rhoades and Salinger, 1993; Petersonand Easterling, 1994; Keiser and Griffiths, 1997).
The second criteria is related to the distance betweenthe candidate and the neighbour stations. Obviously theneighbour stations should be as near as possible to thecandidate one without any orographic barrier, becausethe former ones should behave in the same way as thecandidate one (Vincent and Gullet, 1999). Brunetti et al.(2006) reported that in Italy it is difficult for precipitation
Copyright 2008 Royal Meteorological Society Int. J. Climatol. 29: 1415–1429 (2009)DOI: 10.1002/joc
1418 J. C. GONZALEZ-HIDALGO ET AL.
to have more than 50% of common variance for distancesgreater than 100 km, and Auer et al. (2005) presentsimilar results for Alpine regions.
The final point in the reference series is the algorithm.Usually a reference series is calculated by weight meanof neighbour stations, using as weighting factor thecorrelation coefficient, or the distance (Alexandersson,1986; Peterson and Easterling, 1994; Peterson et al.,1998a, b).
In our case, we adopted the following procedure toselect neighbour stations for the references series. Firstlywe calculated the 12 monthly correlation matrix betweenall stations, and then we discarded all pairs of correla-tions with less than 10 years in common (overlapping).After that, we discarded pairs of correlations when atleast one month correlated negatively. We also discardedpositive monthly correlations whenever the mean corre-lation of all the months was less than r = 0.5. Finally,using a refined correlation matrix we calculated the ref-erence series at <25, <50 and <75 km (see below). At<25 km many reference stations failed or included manygaps. Furthermore, the monthly correlation between thecandidate and reference stations at <75 km was belowthat correlation at <50 km. Consequently, we selectedneighbour stations at a maximum distance of 50 km, adistance within the limits suggested by Brunetti et al.(2006) and Auer et al. (2005). In short, in our database,reference series were calculated including all the neigh-bour stations that overlapped during at least 10 years.The neighbour series correlated positively in all monthswith the candidate series, the mean correlation of allthe months being >0.50. These neighbour stations areat a maximum distance of 50 km from the candidateseries.
The above-mentioned method enabled us to make useof the whole INM database and to obtain reference seriesfor all the original series. Nevertheless, the referenceseries frequently have different neighbours throughoutthe period. In order to avoid the uncontrolled biasintroduced by different numbers of neighbour series in thereference series, we transformed each neighbour stationto provide it with the same mean as the candidate seriesthroughout their common period. To this end, we appliedthe correction factor (candidate mean/neighbour mean)to the neighbour station. Finally, each reference serieswas calculated by means of a weighted average of (1/d2)where d is the distance in kilometres.
3.1.2. Detection of suspicious data
Anomalous data detection has recently been shownto constitute a key to climate database development(Gonzalez-Rouco et al., 2001; Auer et al., 2005). Fur-thermore, anomalous data can affect inhomogeneitydetection (Gonzalez-Hidalgo et al., 2006b). In the detec-tion of anomalous data, we established two objectives;the first one involved ensuring the highest possible qual-ity in the reference series, and the second one refiningthe original data. On the IP, precipitation values can
be high and also show a high degree of spatial vari-ability. Both of these considerations led us to adapt thecommon procedures employed for detecting suspiciousdata to our database (i.e. identification by some kind ofstandard deviation). To be more precise, our approachfor detecting anomalous data combined two criteria: theratio method and the interquartile distance. In the firstcase, the ratio value informed us, in each single ‘month-year-data’, of the difference in magnitude between thecandidate and the reference precipitation value. More-over, the interquartile distance applied to the ratio seriesprovided information on the temporal context of each‘monthly-year-ratio-value’ between the candidate and thereference.
Furthermore, because the minimum precipitation valueis 0, we calculated series of direct ratios (C/R), andinverse ones (R/C), between candidate (C) and referenceseries (R). In the first case, the series of ratios wereused to identify possible anomalous data resulting fromexcesses in the candidate series in comparison withits reference (i.e. 1000/10), and in the second one,we detected possible anomalous data by default (i.e.10/1000). In order to avoid the effects of a 0 value onratio, and the effect of low magnitude (the same ratio10/1 and 1000/100, but a different significance) a constantvalue was applied to all the data. We selected 30 mm asthe constant value, as this represents the limit betweendry-moist months in many climate classifications (seeKoppen classification for example).
In each ratio series, we calculated the interquartilerange excess between each individual ratio and thefollowing formula: (q75 + ((q75 − q25)∗3)), where q75is the third quartile, q25 the first one, and 3 a coefficient(Gonzalez-Rouco et al., 2001).
Finally, in order to identify a value as suspicious,we combined different ratio thresholds and interquar-tile excess coefficients. The ratio thresholds representincreases above 150% in intervals of 50. The thresh-olds of the interquartile distances represent increases of2.5 times the interquartile distance above quartile 3. Theinterpretation of the thresholds is the following: a lowratio value (i.e. 2.5) when it coincides with a high devi-ation above quartile 3 is considered to be anomalous.On the contrary, a high ratio value (i.e. 4) when it coin-cides with a moderate deviation value above quartile 3 isconsidered to be anomalous.
Data exceeding the established combined thresholdvalues were removed from the database, and referenceseries were calculated again following the same proce-dure. This iterative process was repeated until no valuesexceeding the threshold were detected (ten times wereneeded). At this point, these reference series were pro-visionally considered to be the best-available referenceseries.
Finally, these last reference series were contrasted withthe total original data to perform the final detection of allsuspicious data. Thus, a total of 7182 monthly data wasfinally eliminated, which is less than 1% of the total data.
Copyright 2008 Royal Meteorological Society Int. J. Climatol. 29: 1415–1429 (2009)DOI: 10.1002/joc

PRECIPITATION TRENDS ON THE MEDITERRANEAN FRINGE OF THE IBERIAN PENINSULA 1419
Globally the processes are conservative, and we acceptthat anomalous data remain in the database. Notwith-standing, we believe that all suspicious data finallydetected must be discarded.
3.1.3. Homogeneity analysis
The second step of the quality control process involved ahomogeneity analysis. Using refined data, we calculateda new set of reference series and applied the standardnormal homogeneity test (SNHT) (Alexandersson, 1986).This test is based on the assumption that the amount ofprecipitation at the station being tested (candidate) andthe reference series are mutually proportional. Alexander-sson (1986), Keiser and Griffiths (1997) and Gonzalez-Rouco et al. (2001) present a clear explanation of thetest, which involves forming a sequence of ratios (forprecipitation) denoted q(i) in Equation (1):
q(i) = C(i)/R(i) (1 ≤ i ≤ n) (1)
where C(i) is the candidate and R(i) the reference sta-tion. Thus, the ratio series is standardized in Equation (2):
z(i) = [q(i) − q]/s (1 ≤ i ≤ n) (2)
where q is the mean of q(i), the ratio series, and ‘s’ isthe standard deviation of the complete ratio series. Thus,two series of means z1 and z2 are then calculated. Finally,these two series are combined into a series of T (v) valuesin Equation (3):
T (v) = v(z1)2 + (n − v)(z2)
2 (1 ≤ v ≤ n) (3)
where v varies again and n is the total number of stan-dardized values in the ratio series. The test statistic is themaximum T (v) value and indicates the largest inhomo-geneity in the series compared with the critical thresh-old (see complete table values in Khaliq and Ouarda,2007). The test detected statistical inhomogeneities, and
to accept an inhomogeneity we therefore used movingwindows and temporal accumulation procedures.
Once a series had been identified as inhomogeneous,the data before the break detected were corrected by mul-tiplying them by (qa/qb), qa and qb being the mean valuesof q(i) after (1) and before (2) inhomogeneity. After thisfirst run, a new set of reference series was calculated andwe applied the SNHT once again to previously correcteddata. Finally, a total of 202 series was corrected duringthe two-run inhomogeneity detection process.
The last step in the database procedure involved thereconstruction of the final series. We performed thisprocess with the new set of reference series using theprevious homogeneous data. The final reconstruction wasapplied by using a new reference series (<10 km ofdistance) and subsequently a second one (at 25 km) tofill gaps. The final selection of reconstructed series wasbased upon the percentage of original data during the1951–2000 period, the percentage of data from referenceseries at 10 km and the percentage of missing values thatwere filled in at 25 km. The procedure, together withexamples, can be found in detail in Gonzalez-Hidalgoet al. (2006a). The overall procedure produced over40 000 reference series throughout the different steps,and was performed with specific software developedfor climate analyses (AnClim and ProclimDB software,Stepanek, 2006a, b). Table I shows a summary of theprocedures described.
3.2. Data analysis
We applied the Spearman’s rank test (Yue et al., 2002)for monthly detection of precipitation trends followingEquation (4)
rs = 1 −6
n∑
i=1
(yi − i)2
n(n2 − 1)(4)
where n is the number of data items in the series and i
the order of the elements in the original series (rank). The
Table I. The main characteristics of the quality control process and the global MOPREDAMES database descriptor.
Number of original stations 3 891Number of stations analysed (>10 years) 2 669Total reference series calculated 37 366√
For anomalous detection (2669 × 10 iterations) 26 690√For inhomogeneity detection (2 669 × 2 runs) 5 338√For reconstruction (maximum distance 10 km) 2 669√For filling gaps (maximum distance 25 km) 2 669
Total monthly data analysed 964 173Suspicious data discarded 7 182Percentage of suspicious data 0.75%Series detected as inhomogeneous and corrected 202Percentage of series detected as inhomogeneous 7%Final reconstructed series 1 113√
Series with over 75% of original data 583√Series with over 50% of original data or those with over 75% between original data and 53010-km neighbours
Copyright 2008 Royal Meteorological Society Int. J. Climatol. 29: 1415–1429 (2009)DOI: 10.1002/joc

1420 J. C. GONZALEZ-HIDALGO ET AL.
test was applied after smoothing the original data with alow-pass Gaussian filter with an input wavelength periodof 9 years. The significant threshold value selected wasp < 0.05.
Finally, the relationship between the teleconnectionpatterns and precipitation was studied by means of thePearson’s correlation coefficient. The selected telecon-nection patterns were the most prominent at continentalscale for Western Europe, the NAO, and two Mediter-ranean patterns: the MO and the WeMO. The NorthAtlantic Oscillation index (NAOI) values are from theGibraltar – Iceland dipole (Jones et al., 1997). The MOindex (MOI) values (Climatic Research Unit website)are defined by the dipole Gibraltar – Lod Airport (Israel)(Palutikof, 2003). Lastly, the WeMO has recently beensuggested for the IP (Martin-Vide and Lopez-Bustins,2006) using the dipole San Fernando (Cadiz) – Padua,with two clearly defined areas under its influence: theMediterranean coastland and the NW Ebro catchment.
A schematic spatial structure of the three indices isshown in Figure 2. In their dipoles, the three indices sharethe values of Gibraltar or the surrounding areas, whichmight imply patterned behaviour. The three indices arecalculated using normalized sea level pressure (SLP).
The monthly correlation between the teleconnectionindices and the precipitation series was calculated byusing monthly series of standardized precipitation fol-lowing Equation (5)
SPA = xi − x
σ(5)
where SPA is the standardized precipitation, xi pre-cipitation in a particular month, x long-term monthlymean precipitation and σ standard deviation of the data(1951–2000).
4. Results
4.1. Precipitation database
We reconstructed a total amount of 1113 monthly precip-itation series for the 1951–2000 period, with an overalldensity of 1 station/150–200 km2. This spatial densityis currently the highest available one on the IP andin the Mediterranean basin, and constitutes a new toolfor detailed spatial analyses, downscaling, model valida-tion, etc.
In Spain, global studies of precipitation, model calibra-tion and validation, along with climatological research,have used the well-known ‘First-Order MeteorologicalStations’. All these stations provide high-quality data andresult from a highly controlled record (Almarza et al.,1996; Garrido et al., 1996), but very little information isavailable for high altitudes. In conterminous Spain, sixstations are located at over 1000 m asl, and only 14 atover 750 m asl from the total amount of 65 First-OrderMeteorological Stations (Aupı, 2005), whereas 57% ofnational conterminous land is over 600 m and almost19% over 1000 m (De Castro et al., 2005). Table IIshows the spatial distribution of First-Order Meteoro-logical Stations and the new database based on altitudeintervals; spatial distribution by altitudinal intervals isalso shown. The new database for the Mediterraneanfringe includes new information, particularly with regardto altitude (750–1500 m asl), and clearly improves spa-tial density at lower altitudes.
The approach applied for the construction of thedatabase is based on exhaustive detection and discard-ing of anomalous data prior to homogeneity controland reconstruction processes. Thus, discarding anomalousdata eliminates unknown effects upon the reference seriesand also upon homogeneity analysis. In general terms,these effects can be evaluated as follows: SNHT analysis
Figure 2. North Atlantic Oscillation Index (NAOI), Mediterranean Oscillation Index (MOI) and Western Mediterranean Oscillation Index (WeMOI)teleconnection dipoles.
Copyright 2008 Royal Meteorological Society Int. J. Climatol. 29: 1415–1429 (2009)DOI: 10.1002/joc
PRECIPITATION TRENDS ON THE MEDITERRANEAN FRINGE OF THE IBERIAN PENINSULA 1421
Table II. Altitudinal distribution of Spanish First-Order Meteorological Stations (A) and the MOPREDAMES database (B).
Altitude(m) <250 250–500 500–750 750–1000 1000–1500 1500–1750 >1750 Area (km2)
Stations (A) 33 8 10 8 6 – – 492 000Percentage of territory 13.0 20.7 23.6 23.6 15.6 2.0 1.5Stations (B) 292 255 227 189 137 9 4 182 000Percentage of territory 14.0 21.0 21.9 19.7 18.4 2.5 2.7
The percentage of territory by altitudinal intervals is shown.
Table III. Monthly precipitation trends in the MOPREDAMES database.
Jan Feb Mar Apr May Jun Jul Aug Sep Oct Nov Dec
Positive 640 410 130 645 583 224 545 659 442 272 608 267% Over total 57.5 36.8 11.7 58.0 52.4 20.1 49.0 59.2 39.7 24.4 54.6 24.0Sig (+) (%) 16.3 18.7 2.8 24.8 12.2 4.4 20.8 19.3 13.7 3.0 5.1 2.9Negative 473 703 983 468 530 889 568 454 671 841 505 846% Over total 42.5 63.2 88.3 42.0 47.6 79.9 51.0 40.8 60.3 75.6 45.4 76.0Sig. (−) in% 7.7 36.1 72.4 20.5 6.2 42.6 25.2 9.0 19.6 34.3 6.2 18.6
Total number of stations in database with a positive and negative trend, percentages over total, and percentages of stations with a significanttrend (p < 0.05).
applied to original series detected 2984 monthly inhomo-geneities affecting 1966 series. After discarding anoma-lous data and calculating the reference series with refineddata, the total amount of statistical inhomogeneities wasreduced to 1795 months, affecting 1125 series (Gonzalez-Hidalgo et al., 2006b).
4.2. Monthly precipitation trends
In spite of the significance level, the number of stationswith a positive or negative trend (1951–2000) is more orless equal during January, April, May, July, August andNovember, whereas in February, March, June, Septem-ber, October and December, negative trends predominate(Table III). Month by month, approximately 50% of thestations present no significant trend, except for March,when 806 stations show a negative and significant trend(72.4% of 1113). Around 50% of the stations show asignificant trend (positive or negative) during February,June, July and April (Table III).
A positive and significant trend is detected in April inapproximately a quarter of the stations (24.8% of 1113),during the summertime – July and August (1/5 of thestations), and wintertime – February and January (18.7and 16.3% of 1113 stations, respectively). Precipitationmainly shows a significant decrease in March, June,February and October in about one-third of the stations.About one-fifth of all the stations shows a negativesignificant trend in April, July, September and December(Table III). Subsequently, the inter-monthly behaviourtrend is highly variable.
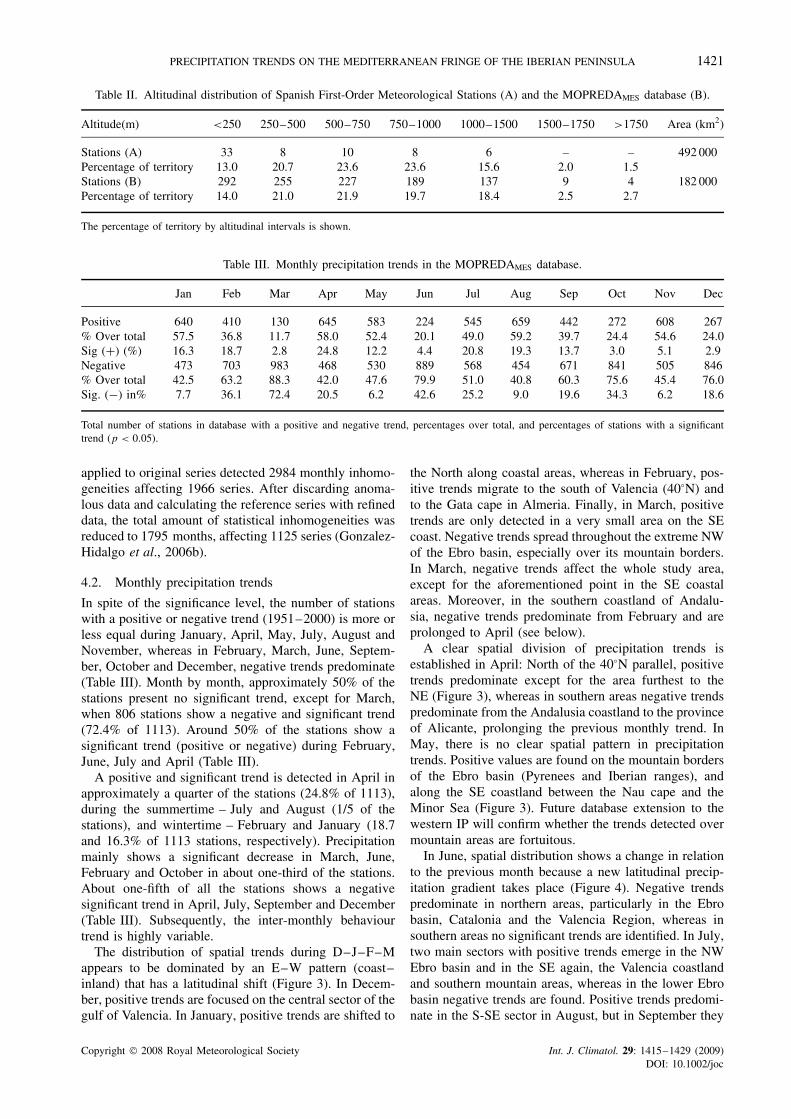
The distribution of spatial trends during D–J–F–Mappears to be dominated by an E–W pattern (coast–inland) that has a latitudinal shift (Figure 3). In Decem-ber, positive trends are focused on the central sector of thegulf of Valencia. In January, positive trends are shifted to
the North along coastal areas, whereas in February, pos-itive trends migrate to the south of Valencia (40°N) andto the Gata cape in Almeria. Finally, in March, positivetrends are only detected in a very small area on the SEcoast. Negative trends spread throughout the extreme NWof the Ebro basin, especially over its mountain borders.In March, negative trends affect the whole study area,except for the aforementioned point in the SE coastalareas. Moreover, in the southern coastland of Andalu-sia, negative trends predominate from February and areprolonged to April (see below).
A clear spatial division of precipitation trends isestablished in April: North of the 40°N parallel, positivetrends predominate except for the area furthest to theNE (Figure 3), whereas in southern areas negative trendspredominate from the Andalusia coastland to the provinceof Alicante, prolonging the previous monthly trend. InMay, there is no clear spatial pattern in precipitationtrends. Positive values are found on the mountain bordersof the Ebro basin (Pyrenees and Iberian ranges), andalong the SE coastland between the Nau cape and theMinor Sea (Figure 3). Future database extension to thewestern IP will confirm whether the trends detected overmountain areas are fortuitous.
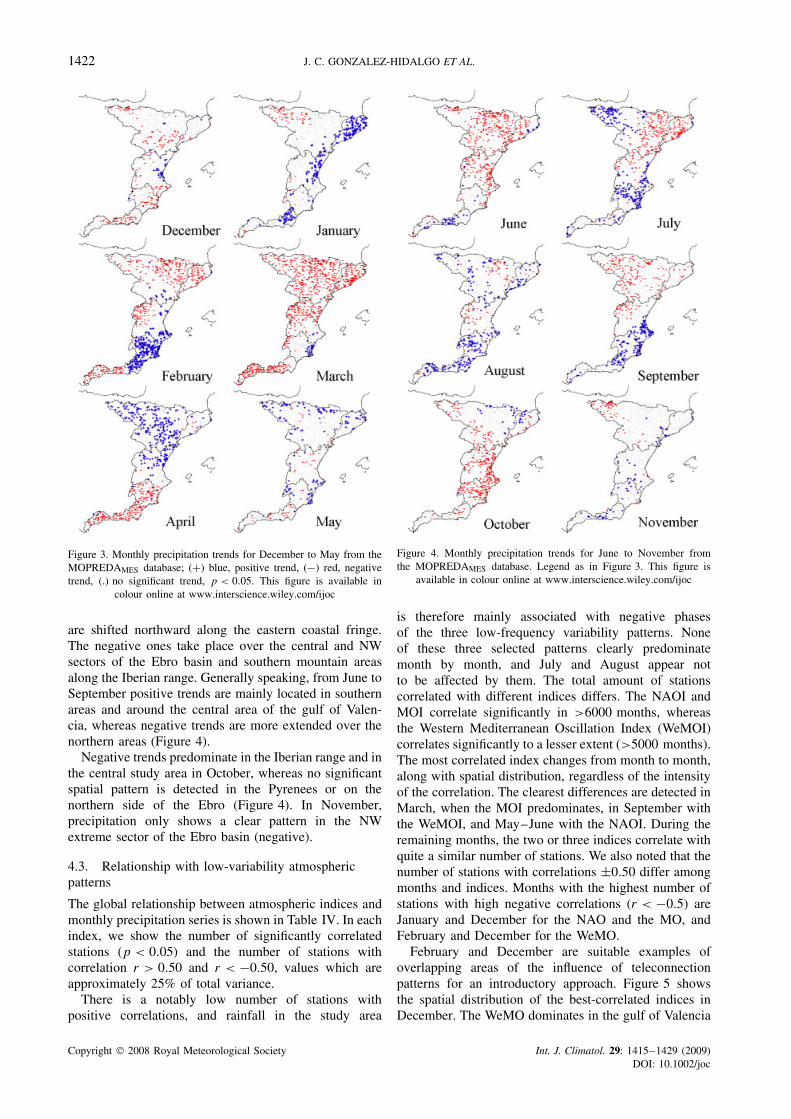
In June, spatial distribution shows a change in relationto the previous month because a new latitudinal precip-itation gradient takes place (Figure 4). Negative trendspredominate in northern areas, particularly in the Ebrobasin, Catalonia and the Valencia Region, whereas insouthern areas no significant trends are identified. In July,two main sectors with positive trends emerge in the NWEbro basin and in the SE again, the Valencia coastlandand southern mountain areas, whereas in the lower Ebrobasin negative trends are found. Positive trends predomi-nate in the S-SE sector in August, but in September they
Copyright 2008 Royal Meteorological Society Int. J. Climatol. 29: 1415–1429 (2009)DOI: 10.1002/joc
1422 J. C. GONZALEZ-HIDALGO ET AL.
Figure 3. Monthly precipitation trends for December to May from theMOPREDAMES database; (+) blue, positive trend, (−) red, negativetrend, (.) no significant trend, p < 0.05. This figure is available in
colour online at www.interscience.wiley.com/ijoc
are shifted northward along the eastern coastal fringe.The negative ones take place over the central and NWsectors of the Ebro basin and southern mountain areasalong the Iberian range. Generally speaking, from June toSeptember positive trends are mainly located in southernareas and around the central area of the gulf of Valen-cia, whereas negative trends are more extended over thenorthern areas (Figure 4).
Negative trends predominate in the Iberian range and inthe central study area in October, whereas no significantspatial pattern is detected in the Pyrenees or on thenorthern side of the Ebro (Figure 4). In November,precipitation only shows a clear pattern in the NWextreme sector of the Ebro basin (negative).
4.3. Relationship with low-variability atmosphericpatterns
The global relationship between atmospheric indices andmonthly precipitation series is shown in Table IV. In eachindex, we show the number of significantly correlatedstations (p < 0.05) and the number of stations withcorrelation r > 0.50 and r < −0.50, values which areapproximately 25% of total variance.
There is a notably low number of stations withpositive correlations, and rainfall in the study area
Figure 4. Monthly precipitation trends for June to November fromthe MOPREDAMES database. Legend as in Figure 3. This figure is
available in colour online at www.interscience.wiley.com/ijoc
is therefore mainly associated with negative phasesof the three low-frequency variability patterns. Noneof these three selected patterns clearly predominatemonth by month, and July and August appear notto be affected by them. The total amount of stationscorrelated with different indices differs. The NAOI andMOI correlate significantly in >6000 months, whereasthe Western Mediterranean Oscillation Index (WeMOI)correlates significantly to a lesser extent (>5000 months).The most correlated index changes from month to month,along with spatial distribution, regardless of the intensityof the correlation. The clearest differences are detected inMarch, when the MOI predominates, in September withthe WeMOI, and May–June with the NAOI. During theremaining months, the two or three indices correlate withquite a similar number of stations. We also noted that thenumber of stations with correlations ±0.50 differ amongmonths and indices. Months with the highest number ofstations with high negative correlations (r < −0.5) areJanuary and December for the NAO and the MO, andFebruary and December for the WeMO.
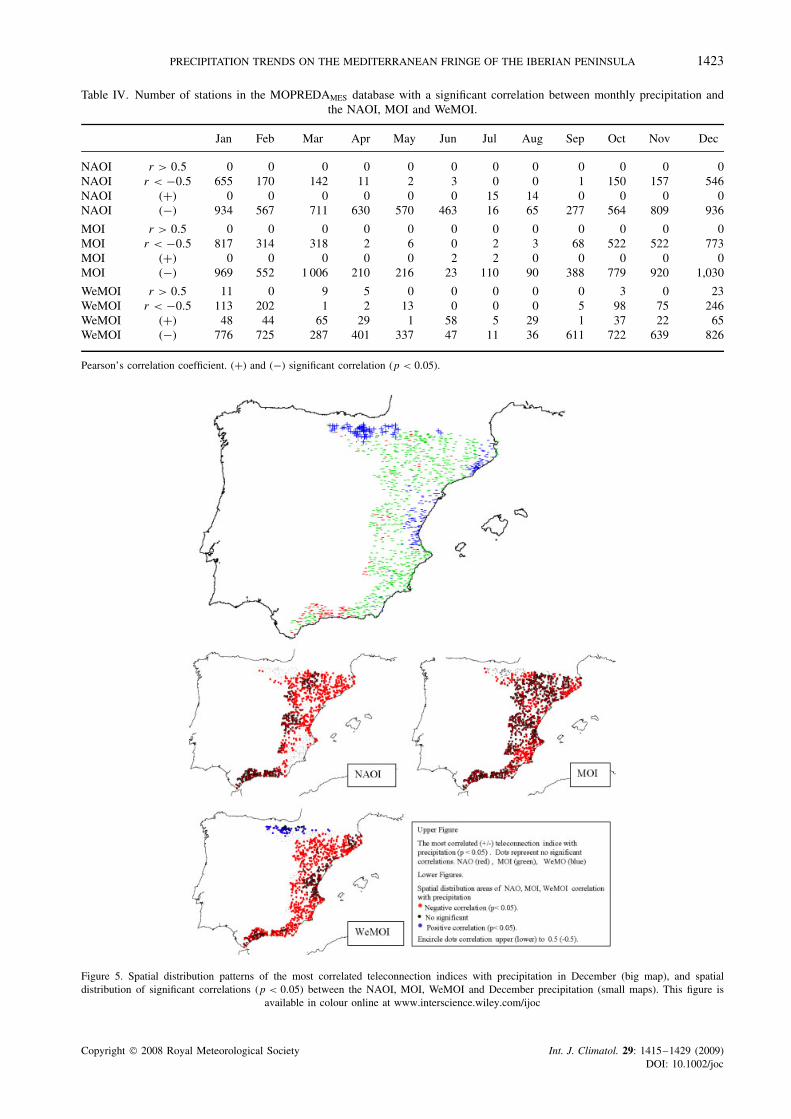
February and December are suitable examples ofoverlapping areas of the influence of teleconnectionpatterns for an introductory approach. Figure 5 showsthe spatial distribution of the best-correlated indices inDecember. The WeMO dominates in the gulf of Valencia
Copyright 2008 Royal Meteorological Society Int. J. Climatol. 29: 1415–1429 (2009)DOI: 10.1002/joc
PRECIPITATION TRENDS ON THE MEDITERRANEAN FRINGE OF THE IBERIAN PENINSULA 1423
Table IV. Number of stations in the MOPREDAMES database with a significant correlation between monthly precipitation andthe NAOI, MOI and WeMOI.
Jan Feb Mar Apr May Jun Jul Aug Sep Oct Nov Dec
NAOI r > 0.5 0 0 0 0 0 0 0 0 0 0 0 0NAOI r < −0.5 655 170 142 11 2 3 0 0 1 150 157 546NAOI (+) 0 0 0 0 0 0 15 14 0 0 0 0NAOI (−) 934 567 711 630 570 463 16 65 277 564 809 936
MOI r > 0.5 0 0 0 0 0 0 0 0 0 0 0 0MOI r < −0.5 817 314 318 2 6 0 2 3 68 522 522 773MOI (+) 0 0 0 0 0 2 2 0 0 0 0 0MOI (−) 969 552 1 006 210 216 23 110 90 388 779 920 1,030
WeMOI r > 0.5 11 0 9 5 0 0 0 0 0 3 0 23WeMOI r < −0.5 113 202 1 2 13 0 0 0 5 98 75 246WeMOI (+) 48 44 65 29 1 58 5 29 1 37 22 65WeMOI (−) 776 725 287 401 337 47 11 36 611 722 639 826
Pearson’s correlation coefficient. (+) and (−) significant correlation (p < 0.05).
Figure 5. Spatial distribution patterns of the most correlated teleconnection indices with precipitation in December (big map), and spatialdistribution of significant correlations (p < 0.05) between the NAOI, MOI, WeMOI and December precipitation (small maps). This figure is
available in colour online at www.interscience.wiley.com/ijoc
Copyright 2008 Royal Meteorological Society Int. J. Climatol. 29: 1415–1429 (2009)DOI: 10.1002/joc
1424 J. C. GONZALEZ-HIDALGO ET AL.
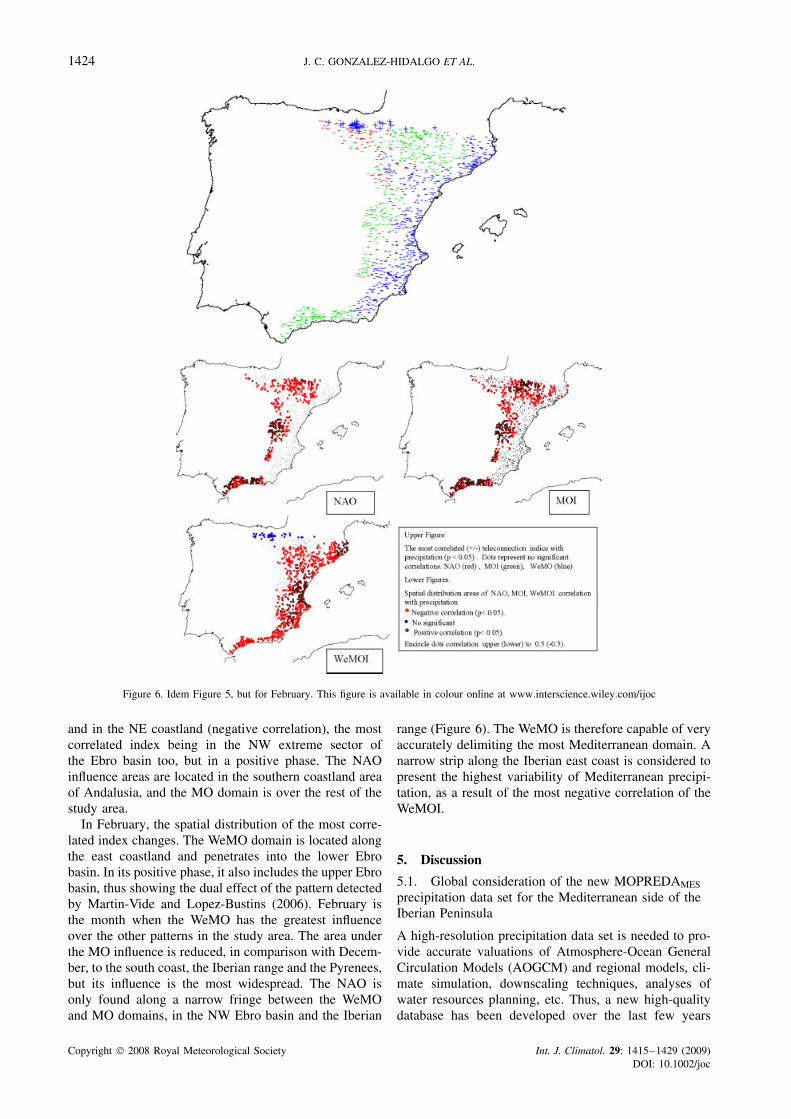
Figure 6. Idem Figure 5, but for February. This figure is available in colour online at www.interscience.wiley.com/ijoc
and in the NE coastland (negative correlation), the mostcorrelated index being in the NW extreme sector ofthe Ebro basin too, but in a positive phase. The NAOinfluence areas are located in the southern coastland areaof Andalusia, and the MO domain is over the rest of thestudy area.
In February, the spatial distribution of the most corre-lated index changes. The WeMO domain is located alongthe east coastland and penetrates into the lower Ebrobasin. In its positive phase, it also includes the upper Ebrobasin, thus showing the dual effect of the pattern detectedby Martin-Vide and Lopez-Bustins (2006). February isthe month when the WeMO has the greatest influenceover the other patterns in the study area. The area underthe MO influence is reduced, in comparison with Decem-ber, to the south coast, the Iberian range and the Pyrenees,but its influence is the most widespread. The NAO isonly found along a narrow fringe between the WeMOand MO domains, in the NW Ebro basin and the Iberian
range (Figure 6). The WeMO is therefore capable of veryaccurately delimiting the most Mediterranean domain. Anarrow strip along the Iberian east coast is considered topresent the highest variability of Mediterranean precipi-tation, as a result of the most negative correlation of theWeMOI.
5. Discussion
5.1. Global consideration of the new MOPREDAMES
precipitation data set for the Mediterranean side of theIberian Peninsula
A high-resolution precipitation data set is needed to pro-vide accurate valuations of Atmosphere-Ocean GeneralCirculation Models (AOGCM) and regional models, cli-mate simulation, downscaling techniques, analyses ofwater resources planning, etc. Thus, a new high-qualitydatabase has been developed over the last few years
Copyright 2008 Royal Meteorological Society Int. J. Climatol. 29: 1415–1429 (2009)DOI: 10.1002/joc
PRECIPITATION TRENDS ON THE MEDITERRANEAN FRINGE OF THE IBERIAN PENINSULA 1425
at global and regional (Klein-Tank et al., 2002; Wijn-gaard et al., 2003; Mitchell and Jones, 2005), subregional(Gonzalez-Rouco et al., 2001; Auer et al., 2005) andnational scales (Feng et al., 2004; Begert et al., 2005;Brunetti et al., 2006). In such a context, there is a needto evaluate the new database presented in this paper, asit attempts to deal with the previous deficiency detectedby De Castro et al. (2005) on the IP. In particular, thisnew database includes information at high altitudes. Weare currently beginning to develop a complete Span-ish monthly precipitation database following the samemethodological procedure. The new data set is obviouslynot error free, and further refinement might improve theresults, but for the moment, the coherency manifested bythe spatial patterns validates the existing information.
5.2. Monthly precipitation trends on the easternIberian Peninsula
Global studies around the Mediterranean basin indicatethat winter and spring precipitation increased duringthe second-half of the twentieth century and decreasedduring summer (Bradley et al., 1987; Maheras, 1988;Dıaz et al., 1989). An annual decrease was reported inregional analyses in eastern (Giuffrida and Conte, 1989;Maheras and Kolyva-Machera, 1990; Amanatidis et al.,1993; Kutiel et al., 1996; Feidas et al., 2007), central(Piervitali et al., 1998; Delitala et al., 2000; Brunettiet al., 2001a,b) and western areas of the Mediterraneanbasin (Esteban-Parra et al., 1998; De Luıs et al., 2000).Notwithstanding, the aforementioned research projectsdid not tend to include the 1951–2000 global period,and the average spatial density of observations is low,thus spatial variability might therefore not be correctlyidentified. Furthermore, the most recent global revisionover the whole Mediterranean basin did not detect anyclear spatial pattern of precipitation trends during the1951–2000 period (Norrant and Douguedroit, 2006),although monthly concentration appears to have increased(Sumner et al., 2001). Precipitation trend analyses arecommonly presented as seasonal, annual or as somekind of monthly aggregation and in few cases referto monthly scale. We consider that this analysis mightbe of great interest from ecological, socioeconomic andenvironmental planning points of view, among manyothers, but for climate analyses such artefacts might maskthe reality of the change and of the results of monthlyanalysis that need to be made.
Monthly trends do not show any global spatial patternin the study area, except for March. This result fits withthose trends observed in Castilla-Leon (del Rıo et al.,2005), western Andalusia (Aguilar et al., 2006), Portugaland central areas of the IP (Trigo and DaCamara, 2000;Lopez-Bustins, 2006; Paredes et al., 2006), the wholeIP during 1921–1995 (Serrano et al., 1999a), and thewhole Mediterranean basin during the 1951–2000 period(Norrant and Douguedroit, 2006). The decrease in springprecipitation (albeit not significant) detected over thesouthern and central plateau of the IP (Galan et al., 1999)and in the NE (Saladie et al., 2002, 2004, 2006) is related
to the significant decrease in the March trend. Thus,from a climatic point of view, our analysis suggests thatthe classical approach to seasonal precipitation regimes(winter = D–J–F, etc.) might differ depending on theconsecutive months considered (see March and its effectson spring trends). Our results also prove that precipitationincreased in eastern Iberian coastal areas in winter (fromDecember to February) during the second-half of thetwentieth century. This result is certainly different fromthose provided by previous analyses (Romero et al.,1998).
Although the significant increase in precipitation fromJune to September in different areas does not conform acontinuous pattern, it fits with those observed by Mos-mann et al. (2004) and del Rıo et al. (2005) inlandof the IP. This rainfall increase has been related toincreases in convective processes resulting from globalwarming (Mosmann et al., 2004). Convective processesalone, however, cannot be generalized. For instance, wesimultaneously detected positive and negative precipita-tion trends in the Ebro basin, and positive trends in theSE coastland. A global scheme of this spatial variabilitymay synchronically include the aforementioned convec-tive processes, the increased anticyclone activity detectedover the inland IP (Fernandez and Martin-Vide, 2004) andthe increased activity in the low of Argel resulting fromwarming in the Mediterranean Sea (Millan et al., 1995;Guijarro, 1999). Effects of local factors are suggested,these being predominant in summer months due to theabsence of a clear spatial pattern of trends.
The global overview of monthly trends indicates thatdifferent atmospheric mechanisms are capable of pro-ducing spatial variation from E–W (particularly duringwintertime) and N–S (from mid-spring to autumn), andvary throughout the year with regard to their effects, coin-ciding with general spatial patterns throughout the wholeMediterranean basin (Harding, 2007).
5.3. Relationship between monthly precipitationand teleconnection indices
On the IP, several significant correlations betweenmonthly-seasonal precipitation and teleconnection indiceshave been identified. The most prominent and extendedpattern is the NAO (Rodo et al., 1997; Martın et al.,1999; Serrano et al., 1999a; Luna et al., 2001; Vazquez,2001; Munoz-Dıaz and Rodrigo, 2003; Martın et al.,2004; Rodrigo and Trigo, 2007); but the East Atlanticpattern (Rodrıguez-Puebla et al., 1998; Martın et al.,2004), the Eurasian pattern (Vazquez, 2001), the MO pat-tern (Dunkeloh and Jacobeit, 2003), the WeMO pattern(Martin-Vide and Lopez-Bustins, 2006) and the El NinoSouthern Oscillation pattern (Rodo et al., 1997; Rocha,1999; Knippertz et al., 2003; Munoz-Dıaz and Rodrigo,2005) have also been detected. The relationship indicatedin these papers is usually established by means of spa-tial distribution of Empirical Orthogonal Functions, andit is therefore difficult to accurately determine the lim-its of their influence and the overlapping areas. The highspatial density of stations in the new database provides
Copyright 2008 Royal Meteorological Society Int. J. Climatol. 29: 1415–1429 (2009)DOI: 10.1002/joc
1426 J. C. GONZALEZ-HIDALGO ET AL.
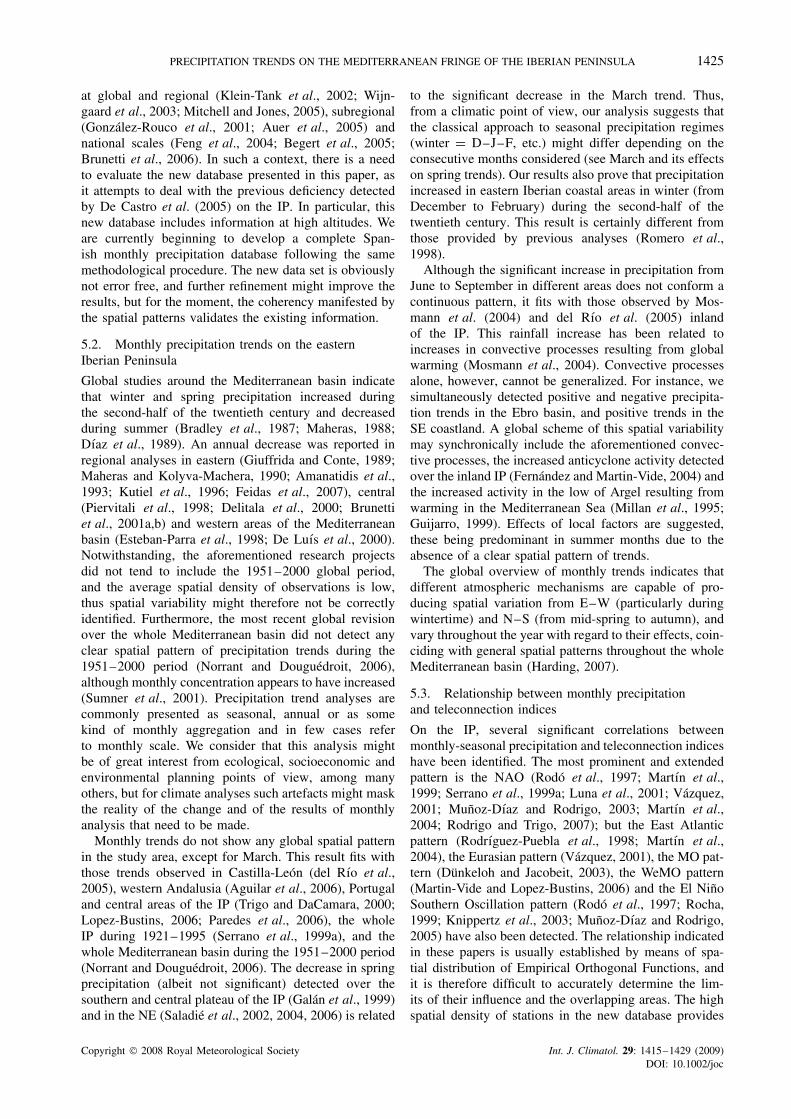
Table V. Monthly correlation between selected teleconnection indices (Pearson’s correlation coefficient).
Jan Feb Mar Apr May Jun Jul Aug Sep Oct Nov Dec n
MOI–NAOI 0.876 0.812 0.727 0.570 0.399 0.374 0.258 0.322 0.650 0.728 0.838 0.873 43MOI–WeMOI 0.553 0.339 0.428 0.636 0.466 0.492 0.127 0.195 0.319 0.482 0.534 0.636 43WeMOI–NAOI 0.361 0.178 0.174 0.351 0.171 0.010 −0.239 −0.059 0.067 0.189 0.224 0.481 50
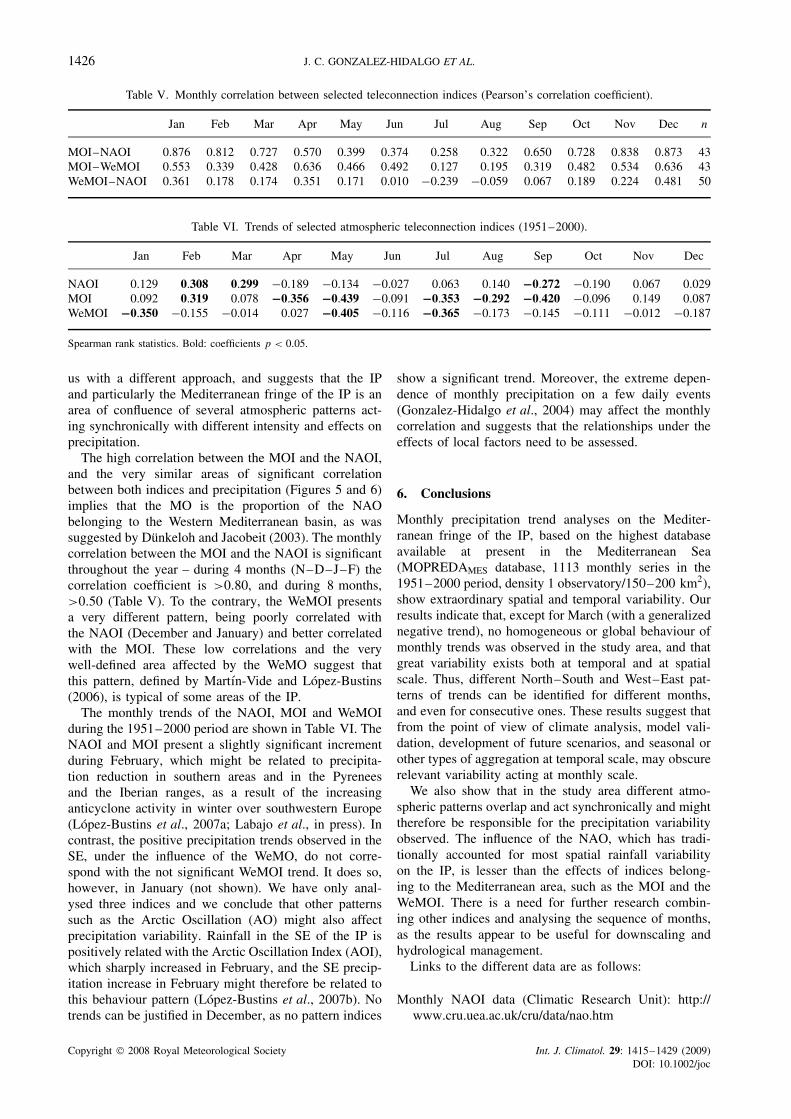
Table VI. Trends of selected atmospheric teleconnection indices (1951–2000).
Jan Feb Mar Apr May Jun Jul Aug Sep Oct Nov Dec
NAOI 0.129 0.308 0.299 −0.189 −0.134 −0.027 0.063 0.140 −0.272 −0.190 0.067 0.029MOI 0.092 0.319 0.078 −0.356 −0.439 −0.091 −0.353 −0.292 −0.420 −0.096 0.149 0.087WeMOI −0.350 −0.155 −0.014 0.027 −0.405 −0.116 −0.365 −0.173 −0.145 −0.111 −0.012 −0.187
Spearman rank statistics. Bold: coefficients p < 0.05.
us with a different approach, and suggests that the IPand particularly the Mediterranean fringe of the IP is anarea of confluence of several atmospheric patterns act-ing synchronically with different intensity and effects onprecipitation.
The high correlation between the MOI and the NAOI,and the very similar areas of significant correlationbetween both indices and precipitation (Figures 5 and 6)implies that the MO is the proportion of the NAObelonging to the Western Mediterranean basin, as wassuggested by Dunkeloh and Jacobeit (2003). The monthlycorrelation between the MOI and the NAOI is significantthroughout the year – during 4 months (N–D–J–F) thecorrelation coefficient is >0.80, and during 8 months,>0.50 (Table V). To the contrary, the WeMOI presentsa very different pattern, being poorly correlated withthe NAOI (December and January) and better correlatedwith the MOI. These low correlations and the verywell-defined area affected by the WeMO suggest thatthis pattern, defined by Martın-Vide and Lopez-Bustins(2006), is typical of some areas of the IP.
The monthly trends of the NAOI, MOI and WeMOIduring the 1951–2000 period are shown in Table VI. TheNAOI and MOI present a slightly significant incrementduring February, which might be related to precipita-tion reduction in southern areas and in the Pyreneesand the Iberian ranges, as a result of the increasinganticyclone activity in winter over southwestern Europe(Lopez-Bustins et al., 2007a; Labajo et al., in press). Incontrast, the positive precipitation trends observed in theSE, under the influence of the WeMO, do not corre-spond with the not significant WeMOI trend. It does so,however, in January (not shown). We have only anal-ysed three indices and we conclude that other patternssuch as the Arctic Oscillation (AO) might also affectprecipitation variability. Rainfall in the SE of the IP ispositively related with the Arctic Oscillation Index (AOI),which sharply increased in February, and the SE precip-itation increase in February might therefore be related tothis behaviour pattern (Lopez-Bustins et al., 2007b). Notrends can be justified in December, as no pattern indices
show a significant trend. Moreover, the extreme depen-dence of monthly precipitation on a few daily events(Gonzalez-Hidalgo et al., 2004) may affect the monthlycorrelation and suggests that the relationships under theeffects of local factors need to be assessed.
6. Conclusions
Monthly precipitation trend analyses on the Mediter-ranean fringe of the IP, based on the highest databaseavailable at present in the Mediterranean Sea(MOPREDAMES database, 1113 monthly series in the1951–2000 period, density 1 observatory/150–200 km2),show extraordinary spatial and temporal variability. Ourresults indicate that, except for March (with a generalizednegative trend), no homogeneous or global behaviour ofmonthly trends was observed in the study area, and thatgreat variability exists both at temporal and at spatialscale. Thus, different North–South and West–East pat-terns of trends can be identified for different months,and even for consecutive ones. These results suggest thatfrom the point of view of climate analysis, model vali-dation, development of future scenarios, and seasonal orother types of aggregation at temporal scale, may obscurerelevant variability acting at monthly scale.
We also show that in the study area different atmo-spheric patterns overlap and act synchronically and mighttherefore be responsible for the precipitation variabilityobserved. The influence of the NAO, which has tradi-tionally accounted for most spatial rainfall variabilityon the IP, is lesser than the effects of indices belong-ing to the Mediterranean area, such as the MOI and theWeMOI. There is a need for further research combin-ing other indices and analysing the sequence of months,as the results appear to be useful for downscaling andhydrological management.
Links to the different data are as follows:
Monthly NAOI data (Climatic Research Unit): http://www.cru.uea.ac.uk/cru/data/nao.htm
Copyright 2008 Royal Meteorological Society Int. J. Climatol. 29: 1415–1429 (2009)DOI: 10.1002/joc
PRECIPITATION TRENDS ON THE MEDITERRANEAN FRINGE OF THE IBERIAN PENINSULA 1427
Monthly MOI data (Climatic Research Unit): http://www.cru.uea.ac.uk/∼andrewh/moi.html
Monthly WeMOI data (Group of Climatology): http://www.ub.es/gc/English/wemo.htm
Acknowledgements
Spanish Government, Contract Grant Sponsor CGL2005-4270 and CGL2007-65315-CO3-01 DGA, GobiernoRegional de Aragon, Grupo de Investigacion Consolidado“Clima. Agua, Cambio Global y Sistemas Naturales”(BOA 69, 11-06-2007). This research was also conductedwith in the frame work of the Spanish IPIBEX ProjectCGL2005-07664-C02-01/CLI and the Group of Clima-tology of the University of Barcelona (2005SGR-01034,Catalonia Regional Govt.). We thank INM (NacionalMeteorological Agency of Spain) for providing originalprecipitation data. We also thank two anonymous review-ers for their useful comments.
References
Aguilar M, Sanchez-Rodrıguez E, Pita MF. 2006. Tendencia de lasprecipitaciones de marzo en el sur de la Penınsula Iberica. ClimaSociedad y Medio Ambiente. Asociacion Espanola de Climatologıa:Zaragoza; 41–51.
Alexandersson H. 1986. A homogeneity test applied to precipitationdata. Journal of Climatology 6: 661–675.
Allen MR, Ingram WJ. 2002. Constraints on future changes in climateand the hydrological cycle. Nature 419: 224–232.
Almarza C, Lopez JA, Flores C. 1996. Homogeneidad y variabilidadde los registros historicos de precipitacion de Espana. TechnicalReport A-143, Instituto Nacional de Meteorologıa: Madrid.
Amanatidis GT, Paliatsos AG, Repapis CC, Bartzis JG. 1993. Decreas-ing precipitation trend in the Marathon area, Greece. InternationalJournal of Climatology 13: 191–201.
Auer I, Bohm R, Jurkovic A, Orlik A, Potzmann R, Schoner W,Ungersbock M, Brunetti M, Nanni T, Maugeri M, Briffa K, Jones P,Efthymiadis D, Mestre O, Moisselin JM, Begert M, Brazdil R,Bochnicek O, Cegnar T, Gajic-Capkaj M, Zaninovic K, Majs-torovic Z, Szalai S, Szentimrey T, Mercalli L. 2005. A new instru-mental precipitation dataset for greater Alpine region for the period1800–2002. International Journal of Climatology 25: 139–166.
Aupı V. 2005. Guıa del clima de Espana. Omega: Barcelona.Azorın-Molina C, Lopez-Bustins JA. 2004. Catalogo sinoptico manual
y causas atmosfericas de la precipitacion en la provincia de Alicante.Boletın de la AGE 38: 279–310.
Begert M, Schlegel T, Kirchhofer W. 2005. Homogeneous temperatureand precipitation series of Switzerland from 1864 to 2000.International Journal of Climatology 25: 65–80.
Bradley RS, Diaz HF, Eischeid JK, Jones PD, Kelly PM, Good-ess CM. 1987. Precipitation fluctuations over Northern Hemisphereland areas since the mid-19th century. Science 237: 171–175.
Brunetti M, Buffoni L, Maugeri M, Nanni T. 2006. Temperature andprecipitation variability in Italy in the last two centuries fromhomogenised instrumental time series. International Journal ofClimatology 26: 345–381.
Brunetti M, Colacino M, Maugeri M, Nanni T. 2001a. Trends inthe daily intensity of precipitation in Italy from 1951–1996.International Journal of Climatology 21: 299–316.
Brunetti M, Maugeri M, Nanni T. 2001b. Changes in total precipita-tion, rainy days and extreme events in northeastern Italy. Interna-tional Journal of Climatology 21: 861–871.
Cano R, Gutierrez JM. 2004. Relleno de lagunas y homogeneizacionde series de precipitacion en redes densas a escala diaria. El ClimaEntre el mar y la Montana. Asociacion Espanola de Climatologıa:Santander; 431–440.
De Castro M, Martın-Vide J, Alonso S. 2005. El clima de Espana:pasado, presente y escenarios de clima para el siglo XXI. Impactosdel Cambio Climatico en Espana. Ministerio Medio Ambiente:Madrid.
De Luis M, Raventos J, Gonzalez Hidalgo JC, Sanchez JR, Cortina J.2000. Spatial analysis of rainfall trends: a case study in ValenciaRegion (E Spain). International Journal of Climatology 20:1451–1469.
del Rıo S, Penas A, Fraile R. 2005. Analysis of recent climaticvariations in Castile and Leon (Spain). Atmospheric Research 73:69–85.
Delitala A, Cesari D, Chesa P, Ward M. 2000. Precipitation overSardinia (Italy) during the 1946–1993 rainy seasons and associatedlarge-scale climatic variations. International Journal of Climatology20: 519–541.
Dıaz HF, Bradley RS, Eischeid JK. 1989. Precipitation fluctuationsover global land areas since the late 1800s. Journal of GeophysicalResearch 94: 1195–1210.
Dunkeloh A, Jacobeit J. 2003. Circulation dynamics of Mediterraneanprecipitation variability 1948–1998. International Journal ofClimatology 23: 1843–1866.
Esteban-Parra M, Rodrigo F, Castro Y. 1998. Spatial and temporalpatterns of precipitation in Spain for the period 1880–1992.International Journal of Climatology 18: 1557–1574.
Feidas H, Noulopoulou C, Makrogiannis T, Bora-Senta E. 2007. Trendanalysis of precipitation time series in Greece and their relationshipwith circulation using surface and satellite data: 1955–2001.Theoretical and Applied Climatology 87: 155–177.
Feng S, Hu Q, Qian WH. 2004. Quality control of daily meteorologicaldata in China, 1951–2000: A new dataset. International Journal ofClimatology 24: 853–870.
Fernandez AJ, Martın-Vide J. 2004. Tendencias de los patrones decirculacion estivales en Europa en la segunda mitad del siglo XX.Precipitaciones asociadas en la Penınsula Iberica. El Clima Entre elmar y la Montana. Asociacion Espanola de Climatologıa: Santander;273–282.
Fernandez-Mills GF. 1995. Principal Component Analysis of precipi-tation and rainfall regionalization in Spain. Theoretical and AppliedClimatology 50: 169–183.
Fernandez-Mills GF, Lana X, Serra C. 1994. Catalonian precipitationpatterns – Principal Component Analysis and automated regionaliza-tion. Theoretical and Applied Climatology 49: 201–212.
Galan E, Canada R, Rasilla D, Fernandez F, Cervera B. 1999.Evolucion de las precipitaciones anuales en la Meseta Meridionaldurante el siglo XX. La climatologıa en Espana en los alboresdel siglo XXI. Asociacion Espanola de Climatologıa: Barcelona;169–180.
Garcıa-Barron L, Gonzalez M, Garcıa P, Sousa A. 2002. Evolucionpluviometrica en el suroeste peninsular: variabilidad y disparidad.El Clima entre el mar y la montana. Asociacion Espanola deClimatologıa: Santander; 283–290.
Garrido J, Garcıa JA, Mateos VL. 1996. Homogeneidad y variabilidadnatural de series largas de precipitacion. Anales de Fısica 92: 19–31.
Giuffrida A, Conte M. 1989. Long term evolution of the Italianclimate outlined by using the Standardized Anomaly Index (SAI).In Proceeding of the Conference on Climate and Water, (I), Helsinki,197–208.
Gonzalez-Hidalgo JC, De Luis M, Raventos J, Sanchez JR. 2001.Spatial distribution of seasonal rainfall trends in a westernmediterranean area. International Journal of Climatology 21:843–860.
Gonzalez-Hidalgo JC, De Luis M, Vicente S. 2004. Analisis compar-ativo del comportamiento de los maximos diarios mensuales deprecipitacion en el sector central de la depresion del Ebro y en el Piri-neo (1931–2000). Geografıa Fısica de Aragon. Aspectos Generalesy Tematicos. Universidad de Zaragoza-IFC: Zaragoza; 231–242.
Gonzalez-Hidalgo JC, de Luis Arrillaga M, Stepanek P, Lanjeri S.2006a. Quality Control of monthly precipitation data fromMediterranean areas of Spain. 5th Seminar for Homogenization ofSurface Climatic Data. WMO – Hungarian Meterological Service:Budapest.
Gonzalez-Hidalgo JC, de Luis Arrillaga M, Stepanek P, Lanjeri S.2006b. Propuesta metodologica para realizar un control de calidadde precipitaciones mensuales en la vertiente mediterranea de laPenınsula Iberica. Clima Sociedad y Medio Ambiente. AsociacionEspanola de Climatologıa: Zaragoza; 591–409.
Gonzalez-Rouco JF, Jimenez JL, Quesada V, Valero F. 2001. Qualitycontrol and homogeneity of precipitation data in Southwest ofEurope. International Journal of Climatology 14: 964–978.
Goodess CM, Jones PD. 2002. Links between circulation and changesin the characteristics of Iberian rainfall. International Journal ofClimatology 22: 1593–1615.
Copyright 2008 Royal Meteorological Society Int. J. Climatol. 29: 1415–1429 (2009)DOI: 10.1002/joc
1428 J. C. GONZALEZ-HIDALGO ET AL.
Goodess CM, Palutikof JP. 1998. Development of daily rainfallscenarios for southeast Spain using a circulation-type approach todownscaling. International Journal of Climatology 18: 1051–1083.
Guijarro JA. 1999. Teleconexiones climaticas y precipitacion en laEspana mediterranea. La Climatologıa en Espana en los alboresdel siglo XXI. Asociacion Espanola de Climatologıa: Barcelona;243–254.
Guijarro JA. 2002. Tendencias de la precipitacion en el litoralmediterraneo espanol. El Agua y el Clima. Asociacion Espanola deClimatologıa: Palma de Mallorca; 237–246.
Harding AE. 2007. Changes in Mediterranean Climate Extremes:Patterns, Causes, and Impacts of Change. PhD, University of EastAnglia, Norwich.
Hernandez A, Quesada V, Valero F. 1999. Mapas de autosimilaridadde la precipitacion en Espana en baja frecuencia. La climatologıaen Espana en los albores del siglo XXI. Asociacion Espanola deClimatologıa: Barcelona; 253–258.
Jones PD, Jonsson T, Wheeler D. 1997. Extension to the NorthAtlantic Oscillation using early instrumental pressure observationsfrom Gibraltar and south-west Iceland. International Journal ofClimatology 17: 1433–1450.
Keiser D, Griffiths J. 1997. Problems associated with homogeneitytesting in climate variations study: a case study of temperature inthe northern Great Plains USA. International Journal of Climatology17: 497–510.
Khaliq MN, Ouarda T. 2007. On the critical values of thestandard normal homogeneity test (SNHT). International Journal ofClimatology 27: 681–687.
Klein-Tank AM, Winjgaard JB, Konnen GP, Bohm R, Demaree G,Gocheva A, Mileta M, Pashiardis S, Hejkrlik L, Kern-Hansen C,Heino R, Bessemoulin P, Muller-Westermeier G, Tzanakou M, Sza-lai S, Palsdottir T, Fitzgerald D, Rubin S, Capaldo M, Maugeri M,Leitass A, Bukantis A, Aberfeld R, Van Engelen AFV, Forland E,Mietus M, Coelho F, Mares C, Razuvaev V, Nieplova E, Ceg-nar T, Lopez JA, Dahlstrom B, Moberg A, Kirchhofer W, Cey-lan A, Pachaliuk O, Alexander LV, Petrovic P. 2002. Daily datasetof 20th-century surface air temperature and precipitation series forthe European Climate Assessment. International Journal of Clima-tology 22: 1441–1453.
Knippertz P, Ulbrich U, Marques F, Corte-Real J. 2003. Decadalchanges in the link between El Nino and springtime North Atlanticoscillation and European-North African rainfall. InternationalJournal of Climatology 23: 1293–1311.
Kutiel H, Maheras P, Guika S. 1996. Circulation and extreme rainfallconditions in the eastern Mediterranean during the last century.International Journal of Climatology 16: 73–92.
Labajo JL, Martın Q, Labajo AL, Piorno A, Ortega M, Morales C.2008. Recent trends in the frequencies of extreme values of dailymaximum atmospheric pressure at ground level in the central zoneof the Iberian Peninsula. International Journal of Climatology 28:1227–1238.
Labajo JL, Piorno A. 2001. Regionalization of precipitation in Castillaand Leon (Spain). Analysis of its temporal behaviour. Detecting andModelling Regional Climate Change. Springer: Berlin; 163–173.
Lana X, Burgueno A. 2000. Some statistical characteristics of monthlyand annual pluviometric irregularity for the Spanish Mediterraneancoast. Theoretical and Applied Climatology 65: 79–97.
Lanzante LR. 1996. Resistant, robust and non-parametric techniquesfor the analysis of climate data: theory and examples includingapplications to historical radiosonde station data. InternationalJournal of Climatology 16: 1197–1226.
Lavorel S, Canadell J, Rambal S, Terradas J. 1998. Mediterraneanterrestrial ecosystems: research priorities on global change effect.Global Ecology and Biogeography Letters 7: 157–166.
Lawrimore JH, Halpert MS, Bell GD, et al. 2001. Climate assessmentfor 2000. Bulletin of the American Meteorological Society 82: 1–39.
Lopez-Bustins JA. 2006. Temperatura de la estratosfera polar yprecipitacion de la Penınsula Iberica en marzo (1958–2000). Clima,Sociedad y Medio Ambiente. Asociacion Espanola de Climatologıa:Zaragoza; 175–189.
Lopez-Bustins JA, Esteban P, Labitzke K, Langematz U. 2007b. Therole of the stratosphere in Iberian Peninsula rainfall: A preliminaryapproach in February. Journal of Atmospheric and Solar-TerrestrialPhysics 69: 1471–1484.
Lopez-Bustins JA, Martin-Vide J, Sanchez-Lorenzo A. 2007a. Iberiawinter rainfall trends based upon changes in teleconnection andcirculation patterns. Global and Planetary Change 69: 1471–1484DOI:10.1016/j.gloplacha.2007.09.002.
Luna MY, Almarza C. 2004. Interpolation of 1961–2002 daily climaticdata in Spain. In Proceedings of International Meeting on SpatialInterpolation in Climatology and Meteorology, Budapest.
Luna MY, Martın ML, Valero F, Gonzalez-Rouco F. 2001. WintertimeIberian Peninsula precipitation variability and its relation to NorthAtlantic Atmospheric Circulation. Detecting and Modelling RegionalClimate Change. Springer; Berlin 369–376.
Maheras P. 1988. Changes in precipitation conditions in the WesternMediterranean over the last century. Journal of Climate 8: 179–189.
Maheras P, Kolyva-Machera F. 1990. Temporal and spatial charac-teristics of annual precipitation over the Balkans in the TwentiethCentury. International Journal of Climatology 10: 495–504.
Martın ML, Luna Y, Valero F. 1999. Modos principales de oscilacionde la precipitacion peninsular. La Climatologıa en Espana enlos Albores del Siglo XXI. Asociacion Espanola de Climatologıa:Barcelona; 307–314.
Martın ML, Luna MY, Morata A, Valero F. 2004. North atlanticteleconnection patterns of low-frequency variability and theirlinks with springtime precipitation in the western Mediterranean.International Journal of Climatology 24: 213–230.
Martin-Vide J. 1982. Caracterısticas climatologicas de la precipitacionen la franja costera mediterranea de la Penınsula Iberica, Tesisdoctoral, Departaments de Geografia Universitat de Barcelona.
Martin-Vide J. 2004. Spatial distribution of a daily precipitationconcentration index in peninsular Spain. International Journal ofClimatology 24: 959–971.
Martin-Vide J, Lopez-Bustins JA. 2006. The western Mediterraneanoscillation and rainfall in the Iberian Peninsula. International Journalof Climatology 26: 1455–1475.
Millan M, Estrela MJ, Caselles V. 1995. Torrential precipitations onthe Spanish east-coast – the role of the Mediterranean-sea surface-temperature. Atmospheric Research 36: 1–16.
Mitchell TD, Jones PD. 2005. An improved method of constructinga database of monthly climate observations and associated high-resolution grids. International Journal of Climatology 25: 693–712.
Morata A, Martın ML, Luna MY, Valero F. 2006. Self-similaritypatterns of precipitation in the Iberian Peninsula. Theoretical andApplied Climatology 85: 41–59.
Morata L, Serrano A, Garcia JA. 2003. Detecting quasi-oscillations inthe monthly precipitation regimes of the Iberian Peninsula. AnnalesGeophysicae 21: 819–832.
Mosmann V, Castro A, Fraile R, Dessens J, Sanchez JL. 2004.Detection of statistically significant trends in the summerprecipitation of mainland Spain. Atmospheric Research 70: 43–53.
Munoz-Dıaz D, Rodrigo FS. 2003. Effects of the North Atlanticoscillation on the probability for climatic categories of local monthlyrainfall in southern Spain. International Journal of Climatology 23:381–397.
Munoz-Dıaz D, Rodrigo FS. 2004. Spatio-temporal patterns ofseasonal rainfall in Spain (1912–2000) using cluster andprincipal component analysis: comparison. Annales Geophysicae 22:1435–1448.
Munoz-Dıaz D, Rodrigo FS. 2005. Influence of the El Nino-SouthernOscillation on the probability of dry and wet seasons in Spain.Climate Research 30: 1–12.
New M, Todd M, Hulme M, Jones P. 2001. Precipitation measure-ments and trends in the twentieth century. International Journal ofClimatology 21: 1899–1922.
Norrant C, Douguedroit A. 2006. Monthly and daily precipitationtrends in the Mediterranean (1950–2000). Theoretical and AppliedClimatology 83: 89–106.
Palutikof JP. 2003. Analysis of Mediterranean climate data: measuredand modelled. Mediterranean Climate: Variability and Trends.Springer-Verlag: Berlin.
Paredes D, Trigo RM, Garcıa-Herrera R, Trigo IF. 2006. Understand-ing precipitation changes in Iberia in early spring: Weather typ-ing and storm-tracking approaches. Journal of Hydrometeorology 7:101–113.
Penarocha D, Estrela MJ, Millan M. 2002. Classification of dailyrainfall patterns in a Mediterranean area with extreme intensitylevels: the Valencia Region. International Journal of Climatology22: 677–695.
Periago M, Lana X, Fernandez-Mills G, Serra C. 1998. Optimisationof the pluviometric network of Catalonia (North-East Spain) forclimatological studies. International Journal of Climatology 18:183–198.
Periago M, Lana X, Serra C, Mills GF. 1991. Precipitation regional-ization – an application using a meteorological network in Catalonia(NE Spain). International Journal of Climatology 11: 529–543.
Copyright 2008 Royal Meteorological Society Int. J. Climatol. 29: 1415–1429 (2009)DOI: 10.1002/joc
PRECIPITATION TRENDS ON THE MEDITERRANEAN FRINGE OF THE IBERIAN PENINSULA 1429
Peterson T, Easterling D. 1994. Creation of homogeneous compositeclimatological reference series. International Journal of Climatology14: 671–679.
Peterson T, Easterling D, Karl T, Groisman P, Nicholls N, Plum-mer N, Torok S, Auer I, Boehm R, Gullett D, Vincent L, Heino R,Tuomenvirta H, Mestre O, Szentimrey T, Salinger J, Forland EJ,Hanssen-Bauer I, Alexandersson H, Jones P, Parker D. 1998a.Homogeneity adjustments of in situ atmospheric climate data: areview. International Journal of Climatology 18: 1493–1517.
Peterson T, Vose R, Schmoyer R, Razuvaev V. 1998b. Globalhistorical climatology network (GHCN) quality control of monthlytemperature data. International Journal of Climatology 18:1169–1179.
Piervitali E, Colacino M, Conte M. 1998. Rainfall over the Central-Western Mediterranean basin in the period 1951–1995. Part I:Precipitation trends. Nuovo Cimento Della Societa Italiana Di FisicaC-Geophysics And Space Physics 21: 331–344.
Rhoades D, Salinger M. 1993. Adjustment of temperature and rainfallrecords for site change. International Journal of Climatology 13:899–913.
Rocha A. 1999. Low-frecquency variability of seasonal rainfallover the Iberian Peninsula and ENSO. International Journal ofClimatology 19: 889–901.
Rodo X, Baert E, Comin FA. 1997. Variations in seasonal rainfall insouthern Europe during the present century: Relationships with theNorth Atlantic Oscillation and the El Nino Southern Oscillation.Climate Dynamics 13: 275–284.
Rodrigo FS, Trigo RM. 2007. Trends in daily rainfall in the IberianPeninsula from 1951–2002. International Journal of Climatology 27:513–529.
Rodrıguez R, Llasat MC, Wheeler D. 1999. Analysis of the Barcelonaprecipitation series 1850–1991. International Journal of Climatology19: 787–801.
Rodrıguez-Puebla C, Encinas AH, Nieto S, Garmendia J. 1998. Spatialand temporal patterns of annual precipitation variability overthe Iberian Peninsula. International Journal of Climatology 18:299–316.
Romero R, Guijarro JA, Alonso S. 1998. A 30-year (1964–1993)daily rainfall data base for the Spanish Mediterranean regions:First exploratory study. International Journal of Climatology 18:541–560.
Romero R, Sumner G, Ramis C, Genoves A. 1999. A classificationof the atmospheric circulation patterns producing significant dailyrainfall in the Spanish Mediterranean area. International Journal ofClimatology 19: 765–785.
Saladie O. 2003. Variaciones y tendencia secular de la precipitacionen el sector Nororiental de la Penınsula Iberica (1850–2000), TesisDoctorado, Universidad de Barcelona.
Saladie O, Brunet M, Aguilar E, Sigro J, Lopez D. 2002. Evolucionde la precipitacion en el sector suroriental de la depresion del
Ebro durante la segunda mitad del siglo XX. El Agua y el Clima.Asociacion Espanola de Climatologıa: Palma de Mallorca; 335–346.
Saladie O, Brunet M, Aguilar E, Sigro J, Lopez D. 2004. Variacionesy tendencia secular de la precipitacion en el sistema Mediterraneocatalan (1901–2000). El Clima, Entre el mar y la Montana.Asociacion Espanola de Climatologıa: Santander; 399–408.
Saladie O, Brunet M, Aguilar E, Sigro J, Lopez D. 2006. Analisis dela tendencia de la precipitacion de primavera en la cuenca delPirineo Oriental durante el periodo 1896–2003. Clima Sociedad yMedio Ambiente. Asociacion Espanola de Climatologıa: Zaragoza;475–485.
Serra de Larrocha C, Fernandez-Mills G, Lana X. 1999.Regionalizacion pluviometrica del NE de la Penınsula Ibericamediante analisis factorial y analisis espectral de los observatoriosprincipales. La Climatologıa en Espana en los Albores delsiglo XXI. Asociacion Espanola de Climatologıa: Barcelona;521–528.
Serrano A, Garcıa JA, Mateos VL, Cancillo ML, Garrido J. 1999a.Monthly modes of variation of precipitation over the Iberianpeninsula. Journal of Climate 12: 2894–2919.
Serrano A, Mateos VL, Garcia JA. 1999b. Trend analysis of monthlyprecipitation over the Iberian Peninsula for the period 1921–1995.Physics and Chemistry of the Earth Part B-Hydrology Oceans andAtmosphere 24: 85–90.
Stepanek P. 2006a. AnClim – software for time series analysis (forWindows 95/NT), Department of Geography, Fac. of NaturalSciences, MU, Brno, 1.47 MB.
Stepanek P. 2006b. ProClimDB – software for processing climatologi-cal datasets, CHMI, regional office Brno.
Sumner S, Homar V, Ramis C. 2001. Precipitation seasonality ineastern and southern coastal Spain. International Journal ofClimatology 21: 219–247.
Trenberth KE. 1999. The extreme weather events of 1997 and 1998.Consequences 5: 3–15.
Trigo RM, DaCamara C. 2000. Circulation weather types and theirinfluence on the precipitation regime in Portugal. InternationalJournal of Climatology 20: 1599–1581.
Vazquez LA. 2001. Circulacion atmosferica euroatlantica y precip-itacion en la Penınsula Iberica: conexion donwscaling y tipificacioninvernal. El tiempo del clima. Asociacion Espanola de Climatologıa:Valencia; 245–254.
Vincent L, Gullet D. 1999. Canadian historical and homogeneoustemperature datasets for climate changes analyses. InternationalJournal of Climatology 9: 1375–1388.
Wijngaard JB, Klein-Tank AM, Konnen GP. 2003. Homogeneity of20th century european daily temperature and precipitation series.International Journal of Climatology 23: 679–692.
Yue S, Pilon PP, Cavadias G. 2002. Power of the Mann-Kendall andSpearman’s rho test for detecting monotonic trends in hydrologicalseries. Journal of Hydrology 259: 254–271.
Copyright 2008 Royal Meteorological Society Int. J. Climatol. 29: 1415–1429 (2009)DOI: 10.1002/joc
Top Related
Copyright © 2022 FDOKUMEN

